Butterfat’s up 5.3% this year—that’s $20 extra per cow monthly if you’re paying attention.
EXECUTIVE SUMMARY: Here’s what caught my eye in the latest numbers. Milk production jumped 3.3% in June, but the real money maker is butterfat and protein climbing nearly 5%—we’re talking an extra $15-20 per cow each month for operations hitting these targets. Kansas and South Dakota are absolutely crushing it with strategic genomic selection and precision feeding programs. Meanwhile, Argentina’s ramping up 12% while Europe pulls back 5%, which means export opportunities are shifting our way. The farms winning this game aren’t just pumping more milk—they’re getting smarter about components, feed efficiency, and risk management. You should seriously look at your component premiums and feeding program if you haven’t already.
KEY TAKEAWAYS
Push your butterfat above 4.0% through better ration balancing—that 5% bump translates to roughly $1800 extra monthly income per 100 cows. Start by tweaking your forage-to-concentrate ratios.
Lock in 60-70% of your feed costs now while corn’s sitting at $4.05/bushel—this simple hedge can save you $100+ per cow annually when markets get volatile.
Use genomic testing on your replacement heifers—operations doing this right see 10-15% better lifetime production and components. It’s not just about milk volume anymore.
Get Dairy Revenue Protection coverage with premiums as low as 20-30 cents per hundredweight—when margins can swing $2-3, that’s cheap insurance for your milk checks.
I’ve been watching these numbers for a while, and the latest USDA report really got me thinking. This isn’t just about making more milk—it’s about the industry pivoting beneath the surface.
According to USDA-NASS, milk production in the major states reached 18.5 billion pounds in June 2025, a 3.3% increase from the same month a year ago. Kansas led with a 19% jump in April, producing 382 million pounds and swelling its herd by 9.25% to 189,000 cows. Meanwhile, data from the South Dakota Agricultural Office show that the state’s dairy herd has doubled in the last decade, now numbering around 215,000 cows.
What’s behind this surge? Smart investments. Cheese plants, such as Bel Brands and Valley Queen, are expanding, positioning these regions as new dairy powerhouses.
State
Herd Size (2025)
Growth Rate
Key Advantage
Processing Investment
Kansas
189,000 cows
+19% (April)
Lower regulations
Expanding capacity
South Dakota
215,000 cows
+117% (decade)
Land availability
Bel Brands, Valley Queen
Wisconsin
1,270,000 cows
+2.1%
Established infrastructure
Mature market
California
1,720,000 cows
-0.8%
Scale & technology
Market saturation
Components Drive the Real Value
But it’s not just volume—it’s quality too. Butterfat shot up 5.3% and protein climbed near 5%. Producers are pushing butterfat over 4.0% and protein around 3.4%, which matters when you consider Chicago Mercantile Exchange data showing butter at $2.47 per pound and Class III futures near $17.23 per hundredweight.
Feed prices ease somewhat—corn hovers around $4.05 per bushel, December futures near $4.30. Producers locking in 60-70% of feed volume early, a strategy backed by University of Wisconsin Extension research, are managing risk effectively.
Technology and Risk Management Take Center Stage
Risk management is ramping up across the board. Dairy Revenue Protection is becoming standard, offering premium coverage ranging from $0.05 to $0.40 per hundredweight, according to USDA Risk Management Agency data.
Technology advances also play a role. Precision feeding systems, especially on farms with more than 400 cows, deliver returns that often paying back in two years with proper data use. Cornell University research highlights these efficiency gains.
Globally, shifts continue—European production dips by 5%, while Argentina’s grows by 12%, restructuring the competitive landscape.
What Winning Producers Focus On
Here’s what the most successful operations prioritize:
Component optimization—genetics, nutrition, and culling strategies for improved butterfat and protein yields
Strategic feed cost management—hedging decisions and bulk purchasing timing
Thoughtful technology adoption—matching tools like genomic testing and precision feeding to operational scale
Building strong processing partnerships—aligning with facilities’ expanding capacity and market reach
The Bottom Line
The industry is becoming increasingly data-driven and geographically diverse, with quality now taking precedence. Those who adapt quickly and strategically will thrive.
These trends speak to a new era—one where management precision, quality focus, and risk mitigation define success. The bottom line? Volume’s nice, but quality pays the bills in 2025. Time to think like a business, not just a production unit.
Stay alert and nimble. The market’s evolving fast, and the winners will be those who move first.
Analysis based on data from USDA-NASS, Kansas Livestock Association, South Dakota Agricultural Office, Chicago Mercantile Exchange, University of Wisconsin Extension, Cornell University, and USDA Risk Management Agency.
Learn More:
The Ultimate Guide To Increasing Butterfat & Protein – This article provides practical strategies for ration balancing and feed management. It demonstrates how to fine-tune your nutrition program to maximize component premiums, directly supporting this article’s focus on profitability beyond just milk volume.
Dairy Herd Expansion: To Grow or Not To Grow – For producers inspired by the growth in Kansas and South Dakota, this piece explores the critical financial and operational questions behind expansion. It provides a framework for making smart, strategic decisions before investing in new facilities or cows.
Genomic Selection: The Genetic Advantage That Goes Beyond Production – Move beyond the basics of precision feeding and discover how to leverage genomics for long-term value. This article reveals methods for selecting health, fertility, and feed efficiency traits to build a more resilient and profitable herd for the future.
The Sunday Read Dairy Professionals Don’t Skip.
Every week, thousands of producers, breeders, and industry insiders open Bullvine Weekly for genetics insights, market shifts, and profit strategies they won’t find anywhere else. One email. Five minutes. Smarter decisions all week.
June milk production jumped 3.4% while feed costs dropped — here’s how smart farms are cashing in on both trends.
EXECUTIVE SUMMARY: June numbers came in hot — 3.4% production jump to 18.5 billion pounds, and here’s the kicker… it’s not about pumping more milk anymore, it’s about making better milk. Operations focusing on components are seeing butterfat hit 4.23% and protein at 3.29%, which translates to an extra $15-20 per cow monthly. That’s $120,000+ annually for a 500-cow operation just from optimizing what’s already in the tank. Feed costs finally dropped too — corn’s forecast at $4.20/bushel, giving smart producers breathing room to upgrade their protein programs.The Canadians and Europeans are already ahead of us on this component game, and frankly… we’re playing catch-up. You need to start thinking genomics and precision feeding now, not next year.
KEY TAKEAWAYS
Component premiums are printing money — Farms averaging 4.5% butterfat and 3.4% protein are banking an extra $0.75-$0.90 per hundredweight. Start genomic testing your replacement heifers today and breed for components, not just volume.
Feed cost relief creates opportunity — With corn at $4.20/bushel, reinvest those savings into bypass proteins and amino acid programs. Operations doing this right are cutting total ration costs 15% while boosting milk quality.
Robot adoption is hitting breakeven faster — Early adopters are seeing 22-month paybacks at current milk prices, plus 23% labor cost reductions. If you’re milking 200+ cows and struggling with labor, run the numbers now.
Regional positioning matters more than ever — Texas and Kansas operations are locking in processing contracts while traditional dairy regions scramble. Secure your milk marketing agreements before capacity fills up.
Technology + genetics = competitive advantage — Farms combining genomic selection with precision feeding are outperforming volume-focused operations by $180,000 annually per 1,000 cows. The gap’s only getting wider in 2025.
We all felt it before the USDA numbers hit. June was… different. Tanks were fuller, checks looked better, and suddenly everyone’s talking about this 3.4% year-over-year production jump like it came out of nowhere. But here’s the thing—this wasn’t some fluke weather event or lucky break. This was years of strategic moves finally paying off, and if you missed it, you’d better understand why your neighbors are starting to pull ahead.
I was at a processor meeting last week, and the room went quiet when someone mentioned their June intake numbers. Dead quiet. Because everybody knew what those numbers meant—some farms are playing a completely different game now.
The Numbers That Actually Tell the Story
Indicator
June 2024
June 2025
Δ % YoY
24-state milk output
17.90 billion lb
18.50 billion lb
+3.4%
U.S. dairy cow herd
9.33 million hd
9.46 million hd
+1.4%
Milk per cow (24 states)
2,045 lb
2,110 lb
+3.2%
2025 Q2 output (U.S.)
58.6 billion lb
60.0 billion lb
+2.4%
The official USDA Milk Production report for June 2025 confirmed what we were feeling: 18.5 billion pounds of milk in the 24 major states, a 3.4% increase from the 17.9 billion pounds in June 2024. Production per cow hit a record 2,045 pounds, up 30 pounds from the same month last year.
The milk cow herd in the 24 major states was 9.03 million head, representing an increase of 151,000 head from June 2024. This expansion comes even as replacement heifer prices hold at record levels—and that’s telling you something about confidence in the fundamentals.
What’s really fascinating is how this played out regionally. Take the Central Valley—I know operations that are still struggling with H5N1 recovery from last fall. Some herds are still down 8% from pre-outbreak levels, but they are now seeing consistent monthly improvements.
Meanwhile, their neighbors—same feed, same climate, different management approach—posted double-digit jumps over last June. This isn’t just anecdotal. University extension specialists I’ve spoken with confirm this trend, noting that operations recovering from disruption are implementing comprehensive system upgrades, not just replacing what they lost.
What’s interesting is how this trend mirrors what we’re seeing globally. European producers have been dealing with their own production volatility, and New Zealand’s producers are facing similar challenges with weather patterns and input costs. The difference? U.S. producers who adapted early are actually gaining competitive ground internationally.
When you’re seeing fresh cows trade for $2,600-plus and operations are still expanding, what’s the outlook? That tells you where smart money sees profitability heading.
Feed Economics: The Game-Changer Nobody Saw Coming
Here’s where things get really interesting, and honestly, where I think some producers are going to get left behind if they don’t pay attention.
Feed costs. That elephant that’s been stomping around the room for what, three years now? But this spring changed everything. According to the latest USDA World Agricultural Supply and Demand Estimates (WASDE) report, corn is forecast at $4.20 per bushel for the ’25/’26 season. Soybean meal is projected to cost around $310 per short ton, which isn’t cheap, but it’s manageable when your energy costs drop.
Metric
June WASDE (May 12)
Revised June 24 Actual
Variance
Comments
2025 milk, calendar-yr
227.8 billion lb
Tracking 228.3 billion lb annualised
+0.5 billion lb
USDA lifted its forecast 500 million lb in July on herd growth
All-milk price (’25)
$21.95/cwt
Spot forecast $21.60/cwt
-$0.35
Higher supply offsets butter price strength
Class III (’25 avg.)
$18.65/cwt
Futures $18.40
-$0.25
Cheese inventories +4% YoY
Class IV (’25 avg.)
$18.85/cwt
Futures $19.05
+$0.20
Butterfat demand still robust
This created what I’m calling the “feed relief rally.” Suddenly, operations that were white-knuckling through $5+ corn could breathe again. But here’s the catch—and there’s always a catch, right? While corn prices became more favorable, protein costs remained stubborn.
This is the “barbell economy” in action: low-cost energy inputs on one side (like corn) and high-cost, high-value inputs on the other (like specific amino acids and bypass proteins).
Let me break this down with some real numbers. A 1,000-cow operation that was spending $180,000 monthly on feed last year might be looking at $165,000 now—if they strategically reinvested their corn savings into a more efficient protein program. That’s $180,000 annually back in their pocket, which could cover a robot payment, facility upgrades, or just straight profit.
I was speaking with a nutritionist who works with approximately 40 farms across the Upper Midwest. He told me something that really stuck:
“The farms that are crushing it right now aren’t the ones who just dumped more corn in the TMR when prices dropped. They’re the ones who used the corn savings to upgrade their protein program and push butterfat numbers.”
Dairy nutrition experts emphasize that corn cost savings should be reinvested in protein program optimization—something the industry has been preaching for years but now finally has the margin room to implement. The farms that figured this out early are the ones posting those eye-popping June numbers.
The Technology Revolution (Finally Paying Off)
What’s particularly noteworthy is how technology adoption is finally showing real ROI. Robotic milking systems are gaining significant traction across operations of all sizes, but the farms that use them strategically are seeing returns that make the rest of us take notice.
This development is fascinating because it’s not just about the U.S. anymore. Canadian producers have been ahead of us in adoption rates—about 8.7% of their cows are milked by robots, compared to our numbers—and they’re sharing data that’s helping to accelerate learning curves here.
Let me tell you about a Michigan producer I’ve been following—runs multiple robots on about 240 fresh cows, added another unit in March. His labor situation went from crisis to competitive advantage almost overnight.
Not because robots eliminate labor (they don’t), but because they let you deploy people where they actually add value instead of just standing in a parlor twice a day.
The investment’s substantial—we’re talking significant capital depending on the brand, features, and necessary facility retrofits—but this producer’s projecting a sub-24-month payback, based on current milk prices and redeploying labor units. Here’s his math: at $23.50/cwt milk and saving 1.5 FTE positions at $45,000 each, plus production gains of about 8 pounds per cow daily… the numbers work.
He said something that really hit me:
“I’m not just buying equipment, I’m buying the ability to scale without scaling my biggest headache.”
But here’s what nobody talks about enough… the learning curve is steep. Really steep. I am aware of another operation that installed robots last year and spent six months dealing with cow traffic issues because they hadn’t properly redesigned their facility. They’re finally hitting their stride now, but those first six months were brutal.
Robotic milking specialists indicate that facility design accounts for the majority of system success. You can’t just drop advanced technology into an existing setup and expect miracles.
Butterfat Numbers Don’t Lie (And Neither Do Paychecks)
This is where genetics finally started paying real dividends. We’ve been hearing about genomic selection for years, but 2025 is when you can actually see it in the tank and on your milk check.
According to a Q2 2025 analysis from CoBank’s Knowledge Exchange, national butterfat levels hit 4.23% in 2024, and early 2025 data suggests we’re not backing off that trend. Protein is averaging 3.29% across the Federal Milk Marketing Order system, which means your component checks are carrying more weight than ever.
The farms that figured this out early? They’re not just making more milk; they’re making more valuable milk. And in a multiple-component pricing world, that’s everything.
What strikes me about this shift is how it’s creating entirely different business models. Traditional volume-focused operations are finding themselves competing against component-optimized farms that might produce less total milk but generate higher revenue per hundredweight.
I know operations—particularly in Pennsylvania and the Northeast—that have been laser-focused on components for three years. They’re averaging well above 4.5% butterfat and pushing 3.4% protein. Their June component premiums alone were worth an extra $0.75-$0.90 per hundredweight over regional averages. With decent production per cow, that’s serious money—sometimes $15-20 per cow per month straight to the bottom line.
Pennsylvania dairy producers focusing on components report significant premium advantages that compound month after month. As one told me recently, “Every genetic decision, every feeding tweak, every management choice gets measured against components first, volume second.”
Here’s the math that’ll get your attention: a 500-cow operation averaging 70 pounds per cow daily with a $0.80/cwt component premium is looking at an extra $10,080 monthly. That’s $120,960 annually just from optimizing what’s already in the tank.
Regional Reality Check: Winners and Losers Emerge
Region
Stand-out States
YoY Δ %
Contributing Factors
Southwest
Texas
+9%
45,000-cow expansion, new panhandle cheese capacity
High Plains
Kansas
+16%
16,000-cow build-out; three large green-field barns filled
21,000 more cows, genetic gains in fat % and protein %
Northwest Coast
Washington
-3%
Lingering HPAI culls, heat-stress spike mid-month
Here’s what’s happening in the real world, away from the national averages, and this is where it gets uncomfortable for some folks.
The expansion states—Texas, parts of Kansas, South Dakota—they’re building fresh capacity and filling it with good genetics and modern management. Meanwhile, some traditional dairy regions are watching this shift and wondering if they missed the boat.
Take Texas… they’ve been aggressive about new greenfield operations near those big cheese plants in the Panhandle. I heard from contractors working on multiple 4,000-cow facilities that’ll be online before Christmas. That’s not just growth; that’s strategic positioning, with $10 billion in new processing assets coming online throughout the U.S. through 2027.
Metric
Jan–Jun 2024
Jan–Jun 2025
Δ %
Driver
U.S. cheese exports
497 million lb
540 million lb
+8.7%
EU supply constraints
Skim-powder exports
772 million lb
735 million lb
-4.8%
China demand lull
Butter-fat exports
52 million lb
74 million lb
+42.3%
MENA bakery demand
This pattern of strategic positioning around processing hubs isn’t unique to the U.S.; it reflects consolidation trends we’re seeing internationally. Australia has been consolidating its operations for years, and European producers are facing similar pressure to scale or specialize. The difference is that our expansion states still have access to land and water that much of the world lacks.
California’s recovery from H5N1 has been slower than anyone had hoped, but the operations that came back strong implemented biosecurity measures that should’ve been standard practice years ago. It’s expensive—around $12,000 per 1,000-cow facility from what I’m hearing—but the alternative is watching your herd get wiped out.
Here’s the thing, though… some of the traditional dairy regions are fighting back smarter than expected. I know operations in New York and Wisconsin that are leveraging their location advantages—being closer to population centers, having better infrastructure, and established relationships—to compete on service and quality, rather than just scale.
Agricultural economists observe that location advantages, combined with management expertise, create a competitive positioning that’s hard to replicate through size alone.
The Management Revolution Behind Those Numbers
What strikes me most about June’s numbers isn’t the production increase—it’s the management sophistication that made it possible. Precision feeding, genetic optimization, and facility design… these are no longer buzzwords. They’re the difference between farms that thrive and farms that just survive.
The operations killing it right now have figured out that success isn’t about any single technology or practice. It’s about systems thinking.
Feed management that optimizes for components, not just pounds. Genetics programs that target profitable traits. Facility design that works in harmony with cow behavior, rather than against it.
I was on a farm in Ohio last month—approximately 450 cows, but every system was perfectly dialed in. The owner walked me through their feeding program, and I swear, he knew the exact cost per pound of every ingredient and how it impacted milk composition. His feed efficiency was running 1.38 pounds of milk per pound of dry matter—that’s exceptional territory.
That level of precision… it’s evident in the numbers. And honestly? A lot of farms are still fighting the last war—optimizing for milk volume when the money’s in milk value.
This trend suggests we’re moving into an era where data literacy becomes as important as animal husbandry skills. The operations that can merge traditional stockmanship with modern analytics are building sustainable competitive advantages.
Risk Factors Nobody Wants to Discuss
Here’s where we need to get real for a minute, because this success story has some warning signs attached.
Weather dependency is huge. June’s favorable conditions helped, but we’re heading into August heat with climate patterns that, to be honest, are unpredictable. The operations that have invested in cooling systems and heat stress management are likely to have a significant advantage if another scorching year like 2023 is on the horizon.
Current global weather patterns are exhibiting concerning similarities to 2012—the last time we experienced a particularly devastating drought. European producers are already facing water restrictions in some regions, which is creating ripple effects in global feed markets.
Processing capacity constraints are building. Those big cheese plants everyone’s building to supply? They’re already running at 85-90% capacity. When they hit their limits, spot milk pricing will become volatile—and not in a way that favors producers without solid contracts.
Labor quality and availability continue to deteriorate in most regions. Technology can help, but it can’t fix everything. The farms that are succeeding aren’t just investing in automation, they’re investing in training their people to work with advanced systems.
Water availability is the sleeper issue. For producers in the West and Southwest, securing long-term water rights is becoming as critical as securing a feed contract. The new facilities in Texas are being built with water strategy as a primary concern, a risk factor that can no longer be ignored.
There’s also a global factor we don’t discuss enough—currency fluctuations affecting export competitiveness. When the dollar strengthens, our exports get more expensive, and that matters more now that we’re producing component-rich milk that commands premium prices internationally.
Forward-Looking: What This Means for Your Operation
Looking ahead, the fundamentals that drove June’s success remain in place, but the competitive landscape is shifting rapidly. Feed costs appear manageable through harvest, and processor demand remains solid. The farms that invested in the right infrastructure are well-positioned to continue capitalizing.
However, here’s the uncomfortable truth: a storm cloud is building that nobody wants to discuss. What happens when everyone catches up? The competitive advantage of being early to automation, early to component optimization, early to precision management—that advantage erodes as more farms make these moves.
The question isn’t whether your operation should modernize. The question is whether you can afford to wait while your neighbors build advantages that’ll be hard to overcome.
I was talking to a banker who specializes in dairy financing, and he put it perfectly:
“The farms that are borrowing money for technology and genetics right now are going to be the ones buying their neighbors’ cows in three years.”
June’s numbers weren’t just about good weather and cheaper corn. They were about an industry finally reaching its stride after years of changes. The farms that understood this early are reaping the rewards. The ones still figuring it out? They better move fast, because this train’s picking up speed.
What’s happening globally reinforces this urgency. Producers in other major dairy regions are making similar transitions, and the competitive landscape is becoming increasingly sophisticated. The margin for error is shrinking, and the rewards for getting it right are growing.
The result is undeniable: we’re creating two different dairy industries. One that’s profitable, efficient, and sustainable. And one that’s just trying to hang on.
The question is, which one are you building?
What’s your best ROI technology investment of 2025? Share your experience in the comments below—your insights could help a fellow producer make the right call.
Complete references and supporting documentation are available upon request by contacting the editorial team at editor@thebullvine.com.
Learn More:
The Butterfat Revolution: 5 Strategies to Maximize Your Component Premiums – This article provides the tactical “how-to” behind the main story’s component theme, offering five actionable feeding and management strategies you can implement immediately to boost butterfat production and capture higher premiums on every shipment.
Beyond the Robot: How AI is Creating the ‘Smart’ Dairy Barn – If robotics is today’s revolution, AI is tomorrow’s. This piece explores the next frontier of dairy tech, demonstrating how artificial intelligence is being used to integrate data, predict health events, and find efficiencies you never knew existed.
The Sunday Read Dairy Professionals Don’t Skip.
Every week, thousands of producers, breeders, and industry insiders open Bullvine Weekly for genetics insights, market shifts, and profit strategies they won’t find anywhere else. One email. Five minutes. Smarter decisions all week.
5% component-adjusted growth while markets tanked? Something’s broken in how we’re thinking about milk production.
EXECUTIVE SUMMARY: You know that feeling when good news hits like bad news? That’s exactly what happened with June’s milk production report. We hit 19.23 billion pounds nationally—up 3.3% year-over-year—but markets sold off hard anyway. The real story isn’t the volume; it’s that component-adjusted production surged 5% while geographic production is completely reshuffling. Kansas jumped 19.1% thanks to new processing capacity while Wisconsin barely moved at 0.3%. Meanwhile, butterfat climbed to 4.18% and protein hit 3.25%—those improvements alone are worth serious money per hundredweight. European competitors are struggling with environmental constraints, creating export opportunities, but domestic demand challenges aren’t going away. Here’s the thing: if you’re still thinking volume-first instead of components-plus-location strategy, you’re already behind where this industry’s heading.
KEY TAKEAWAYS
Component premiums are the new profit center – With butterfat up 2% and protein up 1.5% year-over-year, focus on genetics and nutrition programs that boost components rather than just volume. That 5% component-adjusted growth versus 3.3% base growth represents real dollars on every milk check.
Geography is destiny in 2025 – Plains states with new processing capacity are seeing explosive growth (Kansas +19.1%, Texas +9.5%) while traditional regions stagnate. If you’re planning expansion, secure processing agreements first—capacity constraints are creating 18-24 month margin pressure cycles.
Feed cost advantages won’t last forever – Current milk-to-feed ratios around 1.8 are workable, but smart producers are locking grain prices now. Weather, trade issues, or energy costs could flip the equation overnight, so build flexibility into your feed program.
Export opportunities exist but don’t count on them – U.S. cheese exports are strong while Europe struggles with environmental limits, but building your whole strategy around international demand is risky. Domestic foodservice demand remains weak, so diversify revenue streams through beef-on-dairy programs.
Strategic thinking beats volume obsession – Cornell analysis suggests 75-85% probability of continued margin pressure through early 2026. Winners will be operations that read market signals, optimize for components over volume, and adapt quickly when conditions change.
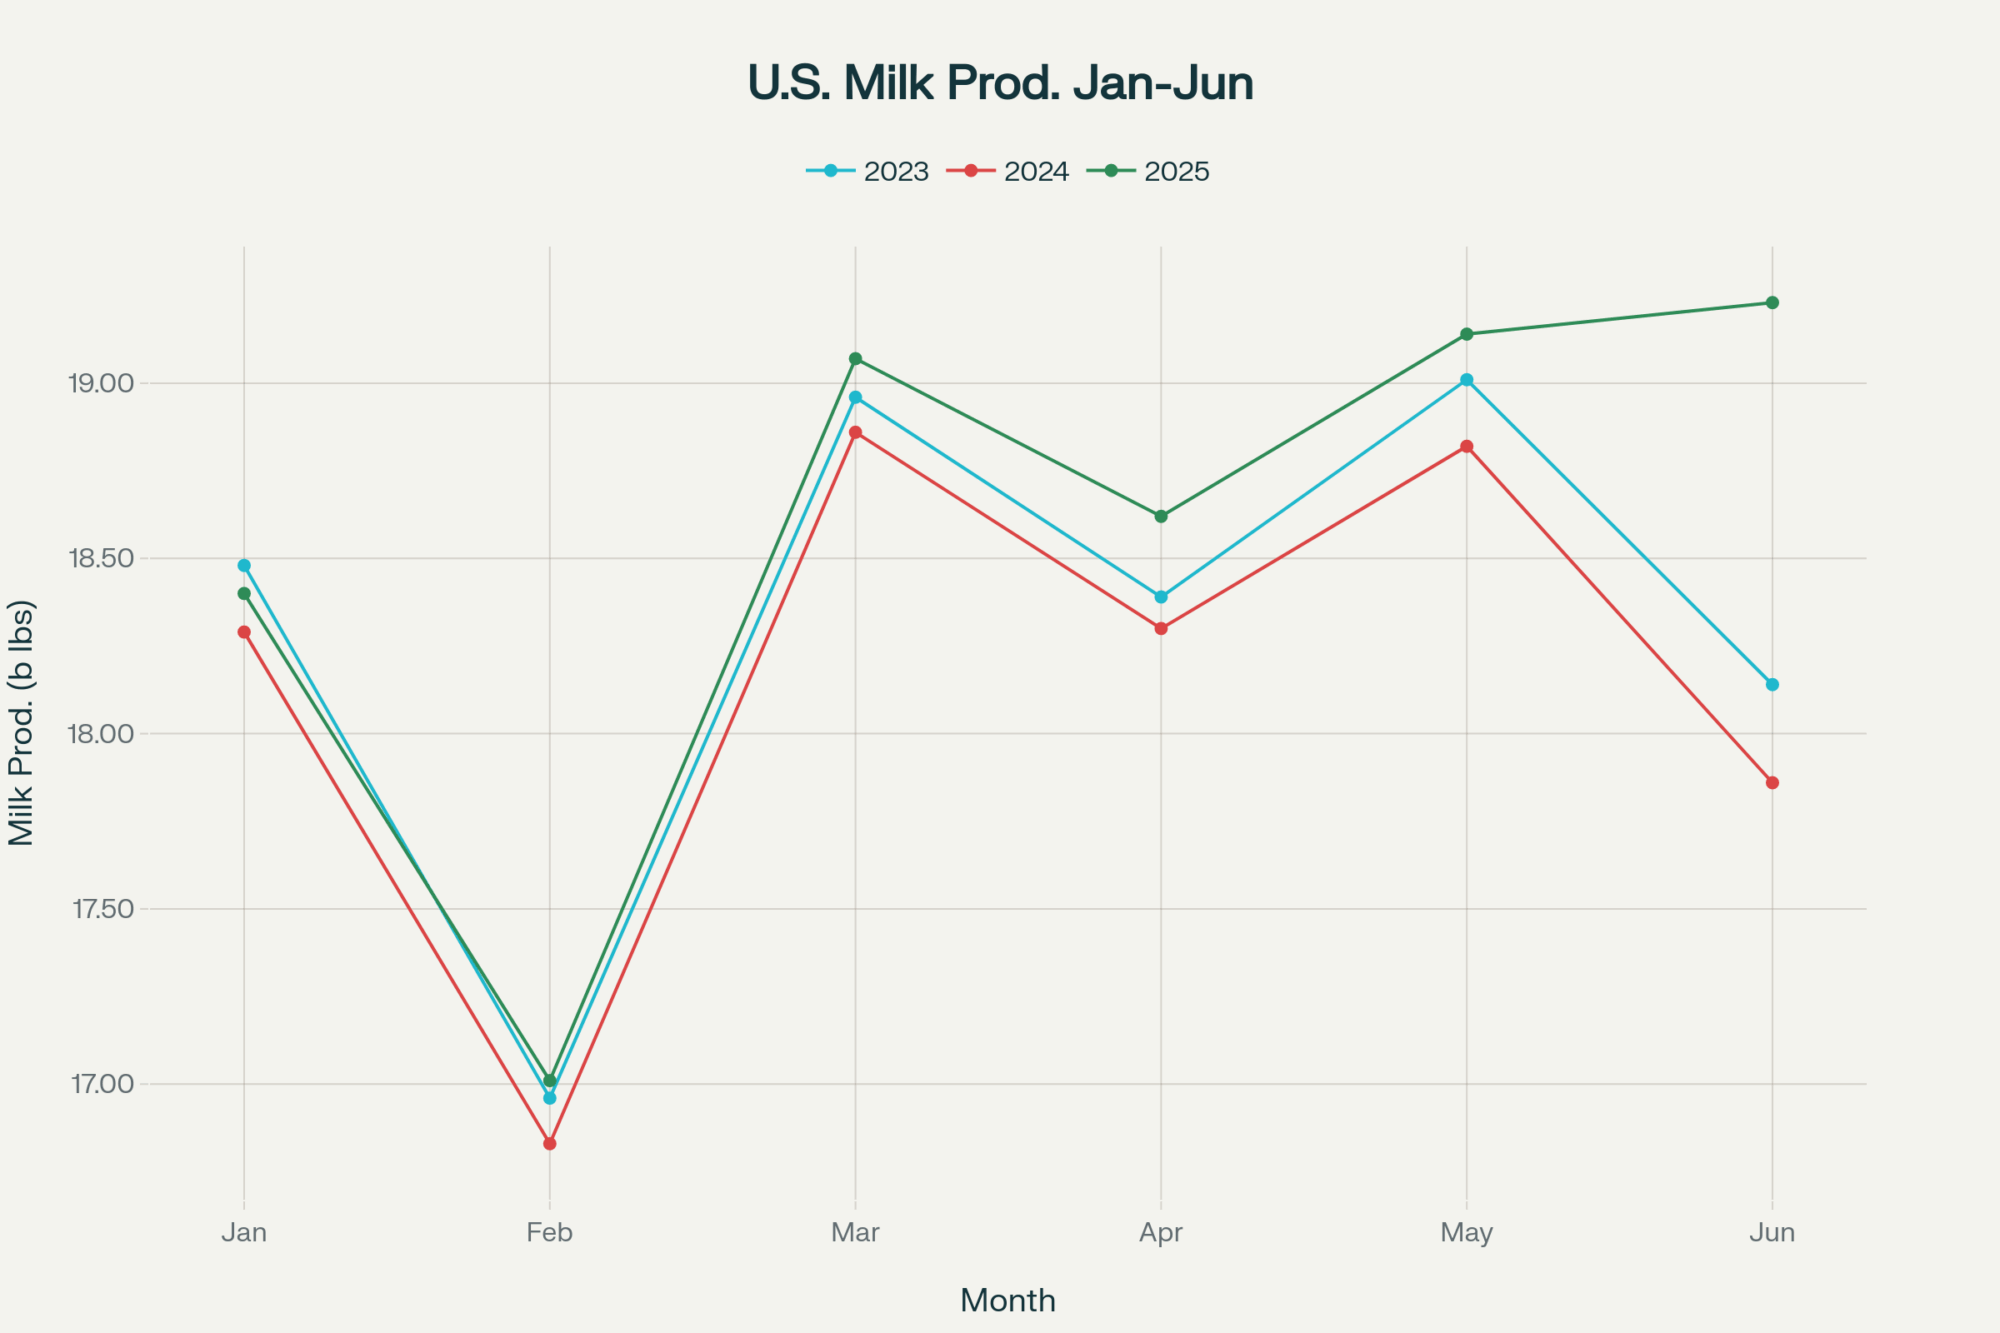
You know that pit-in-your-stomach feeling when production reports should make you smile, but instead your phone starts buzzing with panicked calls from concerned producers? That’s exactly where we landed when June’s milk numbers dropped. The raw data—19.23 billion pounds nationally, up a whopping 3.3% from last year—should’ve had us popping champagne. Instead, markets sold off sharply, and honestly, that disconnect is telling us everything we need to know about where this industry’s headed.
Monthly U.S. Milk Production Trend for January–June, 2023–2025
When Crushing Expectations Becomes the Market’s Nightmare
What strikes me about June’s numbers is how they caught absolutely everyone off guard. According to the latest StoneX analysis¹, the report was “bearish compared to expectations”—and that’s coming from analysts who eat, sleep, and breathe these numbers.
We didn’t just meet projections… we obliterated them. Most folks were penciling in maybe 2% growth, but here we are staring at production that jumped 3.3% year-over-year. What really gets my attention, though, is how the component story amplifies everything. Our butterfat content increased to 4.18% (up from 4.10% last year), while protein levels rose to 3.25%(up from 3.20%). When you factor in those improvements—and this is crucial for understanding the real market impact—we’re looking at component-adjusted production that surged 5% year-over-year.
Five percent! The last time we saw growth like that? May 2021, right when everything was still bouncing back from pandemic disruptions.
What really caught my attention was the 2,031 pounds per head in June, up 1.7% from the previous year. Now, before anyone gets too carried away, remember that we’re comparing this to a brutal June 2024 when H5N1 absolutely hammered production numbers across key regions. The StoneX folks note we were “lapping over a 1.7% drop last year due to bird flu,” so there’s definitely some recovery built into that figure.
However, here’s the thing that should make everyone pause—we’ve added 114,000 head since December (that’s equivalent to adding several good-sized dairies every month), and we’re still seeing these kinds of individual animal improvements. Mark Stephenson from Wisconsin’s dairy markets program has been tracking these patterns for decades, and as he pointed out in his recent university brief, “when you see both scale and efficiency gains happening together, producers are clearly responding to sustained positive signals… but markets don’t always interpret additional supply as welcome news.”
The Geographic Revolution That’s Rewriting Our Industry Map
What’s happening regionally is what really gets my blood pumping about this data. Producers are “culling fewer dairy cows” because margins have been workable, but that’s just scratching the surface.
Year-over-Year Milk Production Change by State, June 2024-2025
Look at these Plains states numbers and tell me we’re not watching a fundamental restructuring:
Texas: jumped 9.5% to 1.503 billion pounds
Kansas: posted a jaw-dropping 19.1% increase to 400 million pounds
South Dakota: surged 11.5% to 255 million pounds
Meanwhile, traditional regions are struggling:
Washington: dropped 9.3% to 475 million pounds
California: managed only 2.7% growth despite adding cows
Wisconsin: barely budged at 0.3%
Milk Production Composition by Top States in 2025
That Kansas number isn’t some statistical fluke. That’s the new Hilmar cheese facility in Dodge City pulling milk like a powerful magnet. I was talking to a producer near there recently—he’s been shipping to that region for about eighteen months now—and he said the local milk market dynamics have completely changed. Premium pickups, shorter hauls, predictable demand… it’s exactly what every operation wants.
Here’s the thing, though, and this is where it gets uncomfortable for those of us in traditional dairy country. Industry investment exceeding $10 billion is flowing toward areas where operations can actually pencil out profitably. Smart money follows processing capacity, and that capacity is definitely heading south and west.
Brian Gould from UW-Madison doesn’t mince words about this trend; he pointed out that “we’re witnessing the most significant geographic restructuring of U.S. dairy production since the 1970s, but this time it’s being driven by regulatory environment and processing economics, not just feed costs.” That’s a sobering assessment from someone who’s tracked these patterns longer than most of us have been in the business.
The Market Reality Nobody Wants to Face
Now, here’s where the story gets really uncomfortable —and why those market reactions weren’t just traders having a rough day. Despite these impressive production numbers, we face some fundamental demand challenges that are unlikely to be resolved anytime soon.
Restaurant traffic still hasn’t bounced back to where we need it. When you consider that over half of America’s food dollars get spent outside the home, weak foodservice demand creates problems that more milk simply can’t solve. Major restaurant chains have been reporting declining traffic in recent quarters, and that ripple effect is felt in cheese demand faster than most people realize.
The Processing Bottleneck That’s Coming for All of Us
What really concerns me—and I’m hearing this from plant managers across multiple regions—is that some facilities are already approaching capacity limits, while others are having to implement milk dumping protocols when volumes exceed what they can handle. We’re seeing this with current production levels, not the higher volumes everyone’s projecting for the rest of .
Recent analysis from Cornell’s Program on Dairy Markets and Policy suggests this kind of regional capacity mismatch typically pressures milk prices for 18 to 24 months until infrastructure catches up or production adjusts. When analysis from sources like Cornell suggests a 75-85% probability of continued margin pressure through early 2026 based on current supply trajectories, that timeline isn’t exactly encouraging news if you’re planning expansions.
Feed Costs Keep Things Manageable… For Now
The one bright spot that’s keeping margins workable? Feed costs haven’t gone completely sideways on us. We’re seeing corn futures trading in the low-four-dollar range, and while protein feeds aren’t cheap, they’re not breaking operations either. That’s maintaining milk-to-feed ratios around 1.8, which most producers can work with.
I was just talking to a guy running 850 cows in central Wisconsin who locked corn back in May when planting conditions looked sketchy. Smart move. He’s feeling pretty good about that decision while watching grain markets bounce around this summer.
But here’s what worries me… feed cost advantages can disappear faster than a fresh cow’s peak production drops off. Weather patterns, trade disruptions, energy costs—any of these could flip the equation pretty quickly.
What This Actually Means for Your Bottom Line
Looking ahead—and this is where three decades in this business starts showing—I don’t think this greater than 3% growth rate continues much longer. The StoneX analysis confirms what most agricultural economists are projecting: we’ll moderate toward 2% growth as we face tougher year-ago comparisons and seasonal heat stress hits those expanding Plains herds.
If you’re operating in traditional dairy regions, Focus on efficiency gains over cow numbers. This geographic shift is real, and trying to counter it by simply adding more animals might not be the most effective approach. The data shows Wisconsin barely growing while Kansas explodes—that should tell you something about where competitive advantages lie.
If you’re in one of those growth regions, Be strategic about it. Just because you can expand doesn’t mean you should do so without first locking in processing agreements. When forward-looking models show a 60-70% probability of regional capacity mismatches continuing through 2026, securing those relationships becomes critical.
Regardless of where you are, Start taking component premiums seriously if you haven’t already. Those butterfat and protein numbers aren’t just statistics on your milk check—they’re becoming the difference between profit and loss. When component-adjusted production is growing at 5% while base volume grows at 3.3%, that spread represents significant financial gains.
What’s interesting about the export picture is that U.S. cheese exports have been hitting strong levels recently while European production struggles with environmental constraints. When your competitors can’t produce, opportunities definitely emerge. But counting on exports to bail us out of domestic oversupply? That’s a risky way to build a business model.
It’s essential to remember that export markets can shift more rapidly than domestic production can adjust. Building a business model that depends entirely on international demand is like farming without crop insurance—it might work until it doesn’t.
The Bottom Line: Strategic Thinking Beats Volume Every Time
If you’re making production decisions for the next 18 months, here’s what I’m telling producers: forget about filling every stall or pushing every cow to maximum output. The operations I see thriving aren’t just focused on making more milk—they’re making smarter milk.
Key strategic moves that separate successful operations:
Prioritize components over volume (those 2% butterfat and 1.5% protein gains matter more than total pounds)
Secure solid processing relationships before expanding (capacity constraints are real)
Diversify revenue streams (beef-on-dairy programs have become essential, not optional)
Build financial flexibility to weather market volatility (18-24 month margin pressure cycles are becoming the norm)
What I’ve learned over the years is that producers who understand market signals, position themselves strategically, and build operations that can adapt when conditions change—and they always do—those are the ones that remain standing when the dust settles.
This June report confirms that we have the technical ability to produce milk like never before. The real question facing our industry is whether we’ve got the wisdom to produce it profitably in a market that’s sending us some pretty clear signals about supply, demand, and where we’re headed.
Honestly? I think that’s the conversation we should be having, rather than just celebrating production records. Because right now, with component-adjusted production up 5% and markets selling off anyway, the story being told is one we might not want to hear… but we’d better start listening.
Complete references and supporting documentation are available upon request by contacting the editorial team at editor@thebullvine.com.
Learn More:
Unlocking Component Gold: Are You Feeding for Fat and Protein, or Just Volume? – This tactical guide moves beyond why you need higher components to how you achieve them. It offers practical feeding and management strategies for immediately boosting butterfat and protein, directly impacting your milk check and profitability.
The Dairy Industry’s New Math: Are You Ready For The Change? – With the main article forecasting margin pressure and geographic shifts, this piece provides the strategic financial playbook you need. It details the key performance indicators (KPIs) that top herds use to build resilience and weather market volatility.
Beef on Dairy: A Trend That’s Here to Stay – The main article flags beef-on-dairy as essential. This piece breaks down the economics of this strategy, revealing how to leverage terminal genetics and market knowledge to transform your calf program from a cost center into a significant revenue stream.
The Sunday Read Dairy Professionals Don’t Skip.
Every week, thousands of producers, breeders, and industry insiders open Bullvine Weekly for genetics insights, market shifts, and profit strategies they won’t find anywhere else. One email. Five minutes. Smarter decisions all week.
That July report just flipped the script—but here’s what most producers are missing about what comes next.
You know that feeling when you’re scrolling through your phone over morning coffee and suddenly stop mid-sip? That’s exactly what happened when the USDA’s July 2025 WASDE report hit my desk last week. After months of producers bracing for financial pain, milk prices got a significant boost that should have every dairy operation rethinking their entire strategy.
Here’s the thing, though—and I’ve been mulling this over since the numbers dropped—while everyone’s celebrating the all-milk price forecast jumping to $22.00 per hundredweight for 2025 (up from those dire earlier projections), most folks are missing the real story. Sure, 2026 forecasts at $21.65 per hundredweight look decent too, but what strikes me about this latest data is how perfectly it demonstrates the kind of market whiplash that’s become our new normal.
Just think about it… months ago, producers across Wisconsin and Iowa were making contingency plans for $19-20 milk. Now we’re looking at $22+ projections. For your typical 500-cow operation, that’s not just numbers on a spreadsheet—that’s the difference between scraping by and actually having room to breathe.
But here’s what’s got me both excited and concerned: the USDA raised milk production forecasts for both 2025 and 2026 based on higher cow inventories and increased milk per cow. According to recent analysis from the University of Wisconsin’s dairy markets program, this kind of supply response to improved pricing often sets us up for the next volatility cycle. The industry learns to respond to good news… sometimes a little too well.
What’s particularly fascinating—and this might surprise you—is that these price improvements actually reinforce why building what I call “financial fortresses” has become more critical than ever. The operations that will thrive aren’t just those riding the good news cycles; they’re the ones using this window to build systems that can handle whatever volatility comes next.
Because let’s be honest—if markets can swing from pessimistic to optimistic this fast, they can swing back just as quickly.
What’s Really Driving These Numbers
The thing about the July WASDE report is that it tells a story that’s both encouraging and complex, and frankly, most of the trade press is missing some crucial details that could impact your decision-making over the next 18 months.
The Milk Price Reality Check
The latest WASDE data shows some genuinely positive developments. That $22.00 per hundredweight forecast for 2025 represents a meaningful improvement, but here’s what’s particularly interesting—and this is where my conversations with dairy economists get really valuable—the breakdown across different classes tells us where the real strength is coming from.
Dr. Mark Stephenson from Wisconsin’s Program on Dairy Markets and Policy recently pointed out in his monthly outlook that the Class IV price increase is being driven by higher butter and nonfat dry milk prices, while Class III actually got lowered due to cheese price adjustments. For 2026, butter, NDM, and whey prices are all projected higher, suggesting strength in component markets that smart producers can leverage.
What’s really exciting—and I’ll admit, I get a bit nerdy about export data—is that commercial dairy exports are being raised for both 2025 and 2026 on both fat and skim-solids basis. According to the USDA’s Foreign Agricultural Service, this indicates stronger international demand that’s supporting domestic pricing. This export strength provides some foundation for optimism that goes beyond just domestic supply-demand dynamics.
But here’s where it gets interesting… and a little concerning. Recent research from Cornell’s dairy program suggests that rapid price improvements often coincide with production expansions that can create oversupply situations down the road. We’re seeing exactly that pattern in the current forecasts.
Feed Costs: The Other Half of the Equation
While everyone’s celebrating milk prices, the feed cost story is equally important—and honestly, it might be even better news for your bottom line. The July report shows corn production forecast at 15.705 billion bushels for 2025/26, down 115 million bushels from June projections due to lower planted and harvested area.
Now, you might think lower corn production means higher feed costs, but here’s the interesting part: the season-average farm price for corn is staying put at $4.20 per bushel. Feed and residual use was actually cut by 50 million bushels based on lower supplies, which suggests we’re looking at relatively stable input costs for the immediate future.
What’s got me particularly optimistic is how soybean meal prices were lowered $20 to $290 per short ton. For dairy operations—especially those in the Midwest, where transportation costs are lower—this combination of stable corn and cheaper soybean meal could improve feed cost margins by $0.30-0.50 per hundredweight when combined with the higher milk price forecasts.
I was talking with a nutritionist friend in Ohio last week (this is becoming more common in our industry), and she mentioned that operations implementing precision feeding systems are seeing even better results when input costs stabilize like this. The technology works best when you’re not constantly adjusting for wild price swings.
Market Volatility: The New Constant
Here’s what really gets me thinking… the rapid shift from pessimistic to optimistic forecasts demonstrates exactly why resilient planning systems have become essential. Markets that can swing from concern to optimism within a few months—well, they’re going to swing back eventually.
Current milk production forecasts are being raised based on higher cow inventories and increased milk productivity per cow. Industry experts I’ve spoken with suggest that this reflects improved margins, encouraging expansion, but it also means we could be setting ourselves up for oversupply situations if demand doesn’t keep pace.
According to recent work from UC Davis’s dairy economics group, this pattern of supply response to price improvements has historically led to market corrections within 18-24 months. Not trying to be a pessimist here, but the data suggests we should use this favorable window strategically.
Building Financial Resilience: What Smart Producers Are Doing Now
The improved price outlook creates opportunities, but the producers I know who’ve survived multiple market cycles aren’t just celebrating—they’re using this period to strengthen their operations for whatever comes next.
USDA Dairy Margin Coverage program performance showing the dramatic swing from record highs in late 2024 to projected compression in 2025
Government Programs: Strategic Leverage
The Dairy Margin Coverage program becomes even more valuable as a strategic tool when markets are improving. Brian Gould from Wisconsin’s dairy markets program recently noted that with current price forecasts showing stronger margins, this is actually the optimal time to evaluate whether your coverage levels are positioned for the new market reality.
Here’s what’s interesting about the Dairy Revenue Protection program—it offers quarterly revenue protection that becomes particularly valuable when you’re operating with higher baseline revenues. I’ve been talking with producers who are using this combination to provide both margin protection and revenue stability, which honestly has become essential regardless of whether markets are moving up or down.
What many producers don’t realize—and this came up in a conversation with a risk management consultant in Minnesota—is that strong market periods are actually the best time to implement protective strategies. When cash flows are better, operations have more flexibility to invest in systems that will protect them when markets inevitably turn challenging again.
Advanced Risk Management: Capitalizing on Opportunity
The improved price outlook creates opportunities for more sophisticated hedging strategies. With milk prices at $22.00 per hundredweight for 2025, operations can consider forward contracting strategies that lock in profitable margins while maintaining exposure to potential upside.
Options trading becomes particularly attractive in improving markets because it allows producers to maintain upside potential while protecting against downside risk. Recent analysis from the Chicago Mercantile Exchange shows that current price environments provide opportunities to implement protective strategies at relatively attractive premium costs.
What’s working in practice—and I’ve seen this across operations in different regions—is using the improved market outlook to implement blended strategies. Smart producers are contracting maybe 40% of production to guarantee profitable margins while leaving exposure to capture additional gains if markets continue strengthening.
Operational Excellence: The Foundation
You can’t hedge your way to long-term success without operational excellence, and improving markets provide the cash flow flexibility to invest in productivity improvements that create enduring value.
Feed Efficiency in the Current Environment
With corn prices stable at $4.20 per bushel and soybean meal costs declining to $290 per short ton, precision feeding systems can deliver enhanced returns. Research from Penn State’s dairy nutrition program shows that operations implementing advanced feed management systems can potentially save $0.75-1.25 per hundredweight in production costs while optimizing milk components.
I visited a 1,200-cow operation near Lancaster last month that’s been running precision feeding for about 18 months. “The ROI is real,” the manager told me, “but the consistency is what really matters. We’re hitting our butterfat targets every month now, not just when everything goes right.”
The combination of stable feed costs and improved milk prices creates favorable conditions for these investments. Operations that implement precision ration formulation during this period can build sustainable advantages that serve them well, regardless of future market conditions.
Component Optimization Strategy
Current market conditions show particular strength in butter and NDM prices, making component optimization especially valuable. Each 0.1% increase in butterfat content can add $0.15-0.20 per hundredweight to milk checks, and the current price environment may provide even better returns.
Here’s what’s working: I know a 350-cow operation in Vermont that worked systematically with their nutritionist to optimize components while maintaining overall production efficiency. They adjusted their TMR formulation, modified their breeding program to emphasize component traits, and invested in better feed storage. The result? Their average butterfat increased from 3.65% to 3.82% over 18 months, adding approximately $0.34 per hundredweight to their milk check.
Operations that focus on component optimization during favorable market periods often maintain those advantages even when overall market conditions become more challenging.
Climate Adaptation: Building for the Long Haul
Comparison of annual return on investment per cow for different climate adaptation and efficiency strategies
Improved market conditions provide the financial flexibility to invest in climate resilience, positioning operations for sustained success regardless of weather challenges. And frankly, with the summers we’ve been having…
Heat Stress Management: The Numbers Don’t Lie
Current price forecasts make cooling system investments even more attractive from an ROI perspective. With milk prices at $22.00 per hundredweight, the revenue maintained through effective heat stress management becomes more valuable.
Research from the University of Florida shows that properly designed cooling systems typically pay for themselves within 18-24 months through maintained milk production, but higher milk prices accelerate these payback periods. I know operations investing in these systems during favorable market periods that are seeing payback in 12-18 months while creating enduring operational advantages.
A 500-cow operation in Texas that I worked with last year invested $125,000 in a comprehensive cooling system. The manager told me, “We wish we’d done this five years ago. Summer milk production increased by 8%, breeding efficiency improved by 15%, and our vet costs dropped by 20%. The investment paid for itself in less than two years.”
Genetic Selection: The Long Game
The integration of heat tolerance into breeding programs becomes more attractive when cash flows support long-term investments. Holstein Association USA’s genomic evaluations for heat tolerance allow producers to select for climate resilience without sacrificing production traits.
What’s particularly interesting—and this comes from recent research at the University of Georgia—is how heat tolerance traits are being incorporated without sacrificing production or component quality. The SLICK gene, which creates a short, sleek hair coat that enhances heat dissipation, is being used in crossbreeding programs across the South with impressive results.
Current market conditions provide the financial stability to implement breeding programs focused on long-term sustainability rather than just immediate production gains. These investments pay dividends over multiple market cycles.
Technology Integration: Investing for the Future
Favorable market conditions create opportunities to implement technology solutions that provide persistent operational benefits. But here’s the thing—not all technology investments are created equal.
Precision Agriculture: What’s Actually Working
The current price environment makes precision agriculture investments more attractive from a cash flow perspective. Wearable sensors, automated monitoring systems, and precision feeding technologies require initial investments but deliver ongoing advantages.
According to recent surveys from Progressive Dairy, operations implementing precision agriculture during favorable market periods can develop systems that enhance efficiency and reduce costs, regardless of future market conditions. The key is selecting technologies that address specific operational challenges, rather than pursuing technology for its own sake.
I’ve been tracking adoption rates across different regions, and what’s fascinating is how the Midwest and Northeast are seeing faster uptake due to labor constraints, while Western operations are focusing more on resource efficiency technologies. Current milk price forecasts provide the financial flexibility to invest in integrated systems that combine multiple technologies for maximum operational benefit.
Data Analytics: Making Sense of Information
Improved cash flows enable investments in data analytics platforms that track production trends and identify opportunities for efficiency. The most successful systems integrate seamlessly with existing management practices, providing valuable insights that support informed decision-making.
An 800-cow operation in Michigan that I know implemented a comprehensive herd management system integrating feed management, reproduction, and financial tracking. “The system helped us identify patterns we never would have seen otherwise,” the manager explained. “We discovered that our reproduction efficiency was directly correlated with feed delivery timing—something we’d never connected before.”
Regional Strategies: Adapting to Local Realities
The improved national price outlook affects different regions differently, and understanding these regional variations is crucial for effective strategy development. Because let’s face it—dairy farming in Wisconsin is different from dairy farming in California.
Midwest Opportunities
Midwest operations benefit from both improved milk prices and relatively stable feed costs. The combination of $22.00 per hundredweight milk prices and $4.20 per bushel corn creates favorable margins for efficiency improvements and technology investments.
Regional feed cost advantages in the Midwest become more pronounced when national milk prices improve. I recently spoke with an operator in Iowa who is leveraging these advantages to invest in productivity improvements that capitalize on their natural cost benefits. Corn costs typically run $0.25-0.50 per bushel below national averages, while soybean meal costs are often $15-25 per ton lower.
The weather volatility is real, though. Spring flooding and summer droughts are becoming more frequent, making feed storage and climate adaptation investments increasingly important. Operations that have invested in climate-controlled storage and comprehensive drainage systems are maintaining more consistent performance.
Western Adaptation
Western operations face unique challenges, including water costs and extreme climate conditions, but improved milk prices provide better margins to invest in solutions. The higher price environment makes water-efficient technologies and advanced cooling systems more economically attractive.
Scale advantages in Western operations become more pronounced during favorable market periods. Operations with 1,000+ cows can justify technology investments that smaller operations can’t, including robotic milking systems, precision feeding, and comprehensive environmental monitoring.
Water costs and availability create unique constraints, though. In California, water costs can add $0.15-$ 0.25 per hundredweight to production costs, making water-efficient technologies and management practices essential.
Northeast Premium Markets
Northeast operations benefit from both improved national pricing and continued opportunities for premium pricing through direct marketing channels. The combination creates opportunities for value-added processing and direct sales that capture additional margins beyond commodity pricing.
Direct marketing opportunities are particularly strong in the Northeast. Operations with access to metropolitan markets can often capture premiums of $3 to $ 5 per hundredweight through direct sales to processors serving premium retail channels.
The key is balancing these opportunities with risk management. Higher costs mean less margin for error, making programs like DMC and DRP particularly valuable for smaller operations that can’t absorb major market swings.
Implementation: Making It Work in Practice
Improved market conditions create opportunities, but successful implementation requires systematic approaches that build on favorable conditions rather than simply hoping they continue. Here’s what I’m seeing work across different types of operations…
Quick Wins in a Stronger Market
DMC and DRP Optimization: This is something you can tackle this month. Review and optimize coverage levels based on current price forecasts and margin projections. Higher baseline prices may justify different coverage strategies than were appropriate during lower price periods.
The key is analyzing your actual feed costs and production levels to determine optimal coverage. Operations with lower feed costs (typically Midwest) often benefit from higher coverage levels, while operations with higher feed costs might optimize at lower coverage levels with supplemental private insurance.
Component Premium Analysis: Evaluate component premiums across multiple buyers to capture the full benefit of current market strength in butter and NDM pricing. Market improvements often create premium opportunities that weren’t available during weaker periods.
I know this sounds basic, but premium differences of $0.30-0.50 per hundredweight for the same milk in the same region are more common than you might think. It’s worth a few phone calls to make sure you’re getting paid fairly for what you’re producing.
Feed Efficiency Quick Wins: With stable corn prices and lower soybean meal costs, implement feeding improvements that deliver immediate returns while establishing long-term efficiency gains. Working with your nutritionist to evaluate current feeding practices often identifies immediate opportunities.
Simple changes like improving TMR mixing consistency, adjusting feeding schedules, or optimizing bunk management can deliver returns of $0.25-0.50 per hundredweight within 30-60 days.
Medium-Term Strategic Investments
Technology Integration: Use improved cash flows to implement precision agriculture and automation systems that provide enduring operational benefits. Current market conditions make these investments more attractive from both cash flow and ROI perspectives.
The most successful implementations I’ve seen start with specific problems—such as improving reproduction efficiency, reducing feed waste, or optimizing component levels—and then select technologies that address those problems. Operations that try to implement everything at once typically struggle with integration and training challenges.
Current implementation costs vary significantly by technology and operation size. Precision feeding systems typically run $15-25 per cow for smaller operations (under 500 cows) and $8-12 per cow for larger operations. Wearable monitoring systems cost $40-60 per cow initially, with ongoing costs of $8-12 per cow annually.
Infrastructure Development: Invest in climate adaptation systems, feed storage improvements, and facility upgrades that address multiple operational challenges while market conditions support capital investments.
The key is prioritizing investments that address multiple challenges simultaneously. A climate-controlled feed storage facility addresses feed quality, waste reduction, and weather resilience. Comprehensive cooling systems enhance animal comfort, improve milk quality, and increase reproduction efficiency.
Market Diversification: Explore direct marketing opportunities and value-added processing options that can provide revenue stability and premium pricing beyond commodity markets.
The key is to start small and build based on market response and operational capacity. Many successful diversification efforts begin with 10-15% of production and expand based on demonstrated success.
Long-Term Competitive Positioning
Genetic Improvement Programs: Implement breeding strategies focused on climate tolerance, feed efficiency, and component quality that deliver advantages across multiple market cycles.
The most successful programs integrate heat tolerance with production traits and component quality. Current genetic evaluation tools make it possible to select for multiple traits simultaneously without sacrificing overall performance.
Research from various land-grant universities suggests that operations selecting for heat tolerance genetics are seeing 10-15% better summer performance compared to conventional genetics, with some programs reporting even better results during extreme heat events.
Operational Scaling: Evaluate expansion opportunities or efficiency improvements that leverage improved market conditions while establishing long-term competitive positioning.
Whether expanding or optimizing existing facilities, scaling decisions require a comprehensive analysis of market conditions, financing, and management capacity. The most successful expansions I’ve seen are those that maintain focus on operational excellence while growing.
Where the Industry Goes from Here
The improved milk price forecasts in the July WASDE report provide welcome relief for dairy producers, but they also reinforce the importance of building operations that can thrive regardless of market conditions. And honestly, that’s what separates the survivors from the thrivers in this business.
Success Patterns in Volatile Markets
The most successful operations treat improved market conditions as opportunities to invest in systems that provide advantages during both good times and challenging periods. They’re not just celebrating better prices—they’re using the improved cash flows to create sustainable operational benefits.
What’s particularly interesting is how these operations approach market improvement. They recognize that favorable conditions are temporary and use them strategically to strengthen their foundations for whatever comes next. According to research from several dairy economics programs, operations that invest during favorable periods consistently outperform those that simply ride the cycles.
I’ve been tracking patterns across different regions and operation sizes, and the farms that consistently perform well share several characteristics: they treat risk management as a core business function, invest in people and systems that can adapt to changing conditions, maintain focus on operational excellence while implementing new strategies, and build relationships with service providers who understand their specific challenges.
Building Sustainable Advantages
The dairy operations that will thrive over the long term are those that use favorable market periods to invest in operational excellence, technology adoption, and protective systems that provide advantages regardless of market conditions.
Current price improvements create opportunities, but smart producers are using this period to build resilient operations that can handle whatever volatility the future brings. Because if there’s one thing we know for certain about dairy markets, it’s that they’ll keep changing.
Your Strategic Decision Point
The question isn’t whether to celebrate the improved milk price forecasts—it’s whether you’ll use this opportunity to create enduring operational advantages or simply hope that favorable conditions continue. And frankly, hope isn’t much of a business strategy.
The July WASDE report shows all-milk prices at $22.00 per hundredweight for 2025, providing improved margins that create strategic opportunities. But markets that can swing from pessimistic to optimistic forecasts within months will inevitably swing back, and the operations that prepare for that reality will be the ones that thrive long-term.
Here’s what I keep coming back to in conversations with producers across the country: the tools, strategies, and support systems exist today to build resilient, profitable operations that can prosper in any market environment. The question is whether you’ll implement these strategies while market conditions provide the cash flow flexibility to do so effectively.
Current market improvements provide a window of opportunity to build operational resilience, but that window won’t stay open indefinitely. The operations that recognize this reality and act strategically now will be positioned to thrive regardless of what market conditions emerge next.
Are you building operational resilience with the improved resources these market conditions provide, or are you simply hoping that good times continue? The choice is yours, but the opportunity to create sustainable advantages may not present itself again soon.
Because at the end of the day, the producers who build financial fortresses during good times are the ones who sleep well during bad times. And in this business, that peace of mind is worth more than any short-term price improvement.
Strategic Action Guide for Current Market Conditions
Immediate Opportunities (Next 30 Days): Start by optimizing your DMC and DRP coverage based on that $22.00 per hundredweight baseline pricing. Take a hard look at component premium capture with current butter and NDM strength—you might be surprised what you find. Implement feed efficiency improvements while corn costs are stable, and honestly assess technology investment opportunities now that cash flow has improved.
Strategic Investments (Next 3-6 Months): This is the time to develop those integrated protection systems we’ve been talking about. Build climate adaptation infrastructure that’ll serve you for decades. Integrate precision agriculture technology that addresses your specific challenges, not just the latest gadgets. Evaluate market diversification opportunities that make sense for your operation and region.
Long-Term Competitive Positioning (6-24 Months): Establish genetic selection programs for climate resilience and efficiency—this is a marathon, not a sprint. Complete operational scaling or efficiency optimization projects while financing is favorable. Implement advanced automation and data analytics that’ll give you an edge for years to come. Develop sustainable operational advantages that’ll serve you through multiple market cycles.
Key Performance Metrics: Monitor margin stability across market cycles, track operational efficiency improvements, measure component optimization progress, and evaluate technology ROI achievement. But remember—the best metrics are the ones that help you make better decisions, not just track what happened.
KEY TAKEAWAYS
Lock in profitable margins while you can: With DMC and DRP programs, you can optimize coverage levels based on $22/cwt baseline pricing—higher baseline prices justify different strategies than what worked during $19-20 milk, potentially saving thousands in premium costs while improving protection
Feed efficiency pays double right now: Precision ration formulation delivers $0.75-1.25/cwt savings when corn’s stable at $4.20/bushel and soybean meal dropped $20 to $290/ton—implement these systems during favorable cash flow periods for 18-24 month paybacks that compound over time
Component optimization hits different in this market: Butter and NDM strength means each 0.1% butterfat increase adds $0.15-0.20/cwt to milk checks—work with your nutritionist now to capture these premiums while markets support the investment in better genetics and feeding programs
Climate adaptation ROI accelerates with higher milk prices: Cooling systems that normally pay for themselves in 18-24 months are hitting 12-18 month paybacks when milk revenue per cow increases—invest in heat stress management while cash flows support the capital expenditure
Regional advantages compound during price improvements: Midwest operations with $0.25-0.50/bushel corn advantages and Northeast farms capturing $3-5/cwt direct marketing premiums should leverage these natural benefits to implement technology and infrastructure that smaller margins couldn’t justify
EXECUTIVE SUMMARY
Look, I get it—seeing $22.00 per hundredweight for 2025 milk prices feels pretty good after the doom and gloom we’ve been hearing. But here’s the thing most producers are missing: the smart money isn’t celebrating these WASDE numbers, they’re using this window to build operations that can handle whatever volatility comes next. We’re talking about precision feeding systems that can save you $0.75-1.25 per hundredweight while corn sits stable at $4.20 per bushel, and component optimization strategies that add $0.15-0.20 per hundredweight for every 0.1% butterfat increase. The global dairy markets are showing us that what goes up comes down fast—just look at how we swung from pessimistic to optimistic forecasts in months. European producers learned this lesson the hard way after milk quotas ended, and the ones who survived built fortress operations during good times, not bad ones. You’ve got maybe 18 months of favorable conditions to implement the risk management systems, climate adaptation, and operational improvements that’ll keep you profitable when markets inevitably swing back—don’t waste it hoping good times continue.
Complete references and supporting documentation are available upon request by contacting the editorial team at editor@thebullvine.com.
Every week, thousands of producers, breeders, and industry insiders open Bullvine Weekly for genetics insights, market shifts, and profit strategies they won’t find anywhere else. One email. Five minutes. Smarter decisions all week.
Processors’ allocation blindness costs dairy farmers 40% butter premiums while missing exploding APAC demand—110-year inventory records prove it
EXECUTIVE SUMMARY: Dairy processors have systematically failed at basic milk allocation decisions, costing producers 40% potential butter premiums while chasing low-margin cheese volumes. New USDA data exposes butter inventories at their lowest April level since 1915—just 337,352 thousand pounds—while cheese stocks remain relatively comfortable at 1.4 billion pounds, down only 2% year-over-year. This isn’t market volatility; it’s strategic incompetence that’s left money on the table while global butter demand explodes across Asian markets. With U.S. milk production declining 1.1% and the dairy herd contracting 0.8%, every allocation decision now carries amplified consequences that processors continue to botch. European competitors are already capturing premium Far East markets with specialized butter formats while American processors remain stuck in 1990s thinking. The math is brutal: butter’s record scarcity has created premium pricing opportunities that could reshape dairy profitability overnight, but only for producers smart enough to exploit processor failures. Stop following the herd toward mediocrity—these allocation disasters represent the biggest profit opportunity in modern dairy history.
KEY TAKEAWAYS
Capture 40% butter premiums immediately: With inventories at 110-year lows and processors still prioritizing cheese volume over butter value, producers can renegotiate milk pricing contracts to exploit this artificial scarcity and secure premium differentials that could boost annual revenue by $15,000-25,000 per 100-cow operation.
Exploit global market misalignment: While U.S. processors fumble domestic allocation, exploding Asian demand for premium butter formats (sheets, dishes, sticks) offers direct-market opportunities worth 25-30% price premiums over traditional commodity pricing—European exporters are already capitalizing on Singapore, Malaysia, and China markets.
Leverage production flexibility advantage: With milk production declining 1.1% year-over-year, producers with the ability to adjust component profiles toward butter-optimized milk (higher butterfat percentages through strategic breeding and nutrition) can command premium pricing from desperate processors seeking to rebuild depleted inventories.
Position for inevitable market correction: Historic butter shortages alongside stable cheese supplies prove systematic processor misallocation—smart producers building butter-focused relationships now will benefit when the industry inevitably corrects these strategic failures, potentially capturing 15-20% sustained margin improvements.
Implement risk management strategies: Record-low buffer stocks mean any production hiccup triggers disproportionate price movements—producers should secure import sourcing relationships and develop contingency pricing mechanisms to protect against volatile input costs while maximizing upside capture during supply disruptions.
April 2025 inventory data reveals butter stocks at a 110-year low while cheese remains stable, exposing fundamental processing misallocation that smart producers can exploit for maximum profitability
Every dairy producer must face the uncomfortable truth: U.S. butter inventories just crashed to their lowest April level since 1915, while cheese stocks remain relatively comfortable. This isn’t market volatility—it’s a systematic failure by dairy processors who’ve played the wrong game for years.
The numbers paint a devastating picture. Butter stocks plummeted to just 337,352 thousand pounds as of April 30, 2025—a crushing 7% drop from last year’s 362,089 thousand pounds. Meanwhile, cheese inventories managed only a modest 2% decline to 1.4 billion pounds.
This divergence exposes what should terrify every producer: processors have been systematically undervaluing butter production while chasing volume over value in cheese.
The Reality Check: An Industry in Denial
Let’s cut through the processing sector’s collective delusion. When butter hits record lows while cheese stays stable, it reveals a strategic blind spot that’s costing producers millions in lost premiums.
The data from the USDA’s Cold Storage Report doesn’t lie. Butter stocks increased just 4% from March, but that pathetic monthly gain couldn’t touch the massive year-over-year deficit. Compare that to cheese, which managed relative stability despite export pressures.
This isn’t a coincidence—it’s the consequence of flawed allocation strategies that prioritize familiar markets over emerging opportunities. The industry context makes this even more damning: national milk production fell 1.1% compared to last year, with the dairy herd contracting 0.8% year-over-year. Yet processors kept feeding the cheese machine while starving butter production.
What Global Markets Are Screaming
While U.S. processors fumble basic allocation decisions, global markets send clear signals about where the money lies.
Rising global demand for premium butter is exploding across APAC markets—Singapore, Malaysia, Thailand, Indonesia, Hong Kong, and China all represent massive opportunities. High-end bakery trends driving butter sheet demand globally create premium pricing opportunities that dwarf traditional cheese margins.
Here’s the kicker: European producers are already capitalizing on these trends while U.S. processors remain stuck in 1990s thinking. British dairy exporters report that butter formats—butter sheets, butter dishes, butter sticks—represent the fastest-growing segment in Far East and Middle East markets.
Meanwhile, our domestic processors are doubling down on cheese exports to Mexico, completely missing the higher-margin butter opportunities that global competitors are seizing.
The Strategic Blindness Exposed
Since comprehensive records began in December 1915, we’ve never seen April butter inventories this scarce. The previous record low was 1,082 thousand pounds back in 1916. Current levels represent roughly half the 1992 peak of 678,673 thousand pounds.
This isn’t a temporary market blip—it’s the inevitable result of decades of strategic myopia. While processors chase the illusion of cheese profitability, they’ve created artificial scarcity in the higher-value butter segment.
Regional cheese data exposes the dysfunction deeper. Mountain region American cheese stocks surged 35% year-over-year, while West South Central plummeted 34%. This geographic chaos proves that distribution networks are as broken as production priorities.
What Smart Producers Must Do Now
Stop waiting for processors to figure this out. Here’s your immediate action plan:
Next 30 Days:
Renegotiate milk pricing contracts to capture butter premium differentials
Evaluate direct-market butter opportunities, bypassing traditional processors
Establish import relationships before global supply tightens further
Next 90 Days:
Assess milk component profiles that optimize butter production potential
Investigate co-op partnerships, prioritizing butter manufacturing over volume cheese
Develop risk management strategies for volatile input costs driven by artificial scarcity
Next 12 Months:
Consider vertical integration opportunities in specialty butter processing
Build relationships with premium butter markets commanding 40% higher margins
Position for the inevitable correction when processors wake up to their allocation mistakes
The Uncomfortable Truth About Processor Psychology
This crisis didn’t happen overnight. The industry ignored early warning signals because they conflicted with established infrastructure investments and comfortable marketing relationships. Cheese plants are expensive to retool. Export contracts take effort to renegotiate. Change requires admitting mistakes.
But comfort is the enemy of profit in agriculture. While competitors cling to outdated models, forward-thinking producers can exploit this systematic blindness.
Public warehouse stocks account for 319,916 thousand pounds of total butter inventory—the vast majority of commercially available supplies. This concentration amplifies both market vulnerability and opportunity for those positioned correctly.
The broader context makes this even more critical: with milk production declining 1.1% year-over-year and the dairy herd contracting, every allocation decision carries amplified consequences.
The Global Competition Reality
Here’s what should wake up every U.S. dairy producer: while we’re creating artificial butter shortages through poor allocation, international competitors are capturing premium global markets.
European dairy exporters report a growing middle-class appetite for premium dairy products across Asia and the Middle East. They’re developing high-fat, low-moisture butter and cultured butters in formats specifically designed for emerging market opportunities.
The U.S. is competing with Europe in Far East markets, but we’re handicapping ourselves with domestic allocation failures that create supply constraints exactly when global demand explodes.
The Bottom Line
U.S. butter inventories have reached their lowest April level in 110 years, exposing systematic allocation failures that smart producers must exploit before processors correct their mistakes. While cheese stocks show relative stability, the butter shortage represents modern dairy history’s most significant profit opportunity.
This isn’t about inventory management but recognizing when entire industries make systematic strategic errors. The processors who created this mess through poor allocation will eventually wake up, but not before early movers capture disproportionate value from their incompetence.
The math is brutal and beautiful: butter’s record scarcity has created premium pricing opportunities that could reshape dairy profitability models overnight. With global demand exploding and domestic supplies at 110-year lows, the question isn’t whether butter premiums will expand—it’s whether you’ll position yourself to capture them.
Stop following the herd toward mediocrity. In distorted markets, leadership comes from recognizing opportunities where others see only problems.
The data is clear. The opportunity is unprecedented. The choice is yours.
5 Technologies That Will Make or Break Your Dairy Farm in 2025 – Provides essential technology adoption strategies for managing the volatility and margin pressures highlighted in today’s market report, including robotic systems that deliver 20% yield increases and AI analytics that optimize the component production driving premium pricing.
The Sunday Read Dairy Professionals Don’t Skip.
Every week, thousands of producers, breeders, and industry insiders open Bullvine Weekly for genetics insights, market shifts, and profit strategies they won’t find anywhere else. One email. Five minutes. Smarter decisions all week.
Don’t believe dairy “experts” anymore. The 1.6% increase in production in May shows that Kansas is beating California. Geographic shifts + tech adoption = survival.
EXECUTIVE SUMMARY: The May 2025 milk production data just exposed a major forecasting failure, and it’s reshaping who wins and loses in American agriculture. While USDA experts predicted production constraints, Kansas delivered a mind-blowing 15.7% increase and Texas posted 8.9% growth, proving that geographic positioning now trumps traditional dairy strongholds like California (down 1.8%). The margin explosion to $11.55 per cwt drove strategic producers to expand aggressively while others waited for “official confirmation” – a $83,220 annual difference for a 500-cow operation facing future margin compression. Stephen Mast’s technology integration generated $32,611 ROI with 6-pound milk increases per cow, while robotic systems deliver 7-year payback versus 15+ years for conventional parlor upgrades. Component optimization using Total Productive Index scoring and genomic testing for fat/protein yields is capturing premium value as markets bifurcate between volume and quality. International competitors face production declines (EU down 0.2%) and climate constraints, creating export opportunities for strategically positioned U.S. operations. The brutal reality: operations lacking scale advantages ($42.70 per cwt for small farms vs. $19.14 for large), technology adoption, and geographic positioning are facing accelerated consolidation as the industry’s DNA fundamentally reshapes itself.
KEY TAKEAWAYS
Geographic Disruption Creates 15.7% Production Advantages: Kansas and emerging dairy regions with modern processing infrastructure are capturing market share from traditional strongholds, while California’s 1.8% decline despite larger herds proves legacy advantages are dead – evaluate your processor relationships and shipping distances immediately.
Technology ROI Becomes Survival-Critical: Robotic milking systems achieve 7-year payback periods with 15-20% production increases versus 15+ years for conventional upgrades, while automated systems like Stephen Mast’s generated $32,611 annual returns – labor costs at 25% of operating expenses make automation a competitive necessity, not luxury.
Component Value Optimization Captures Premium Markets: Total Productive Index breeding programs focusing on butterfat percentage and protein content outperform volume-focused genetics as markets increasingly differentiate product values – operations optimizing for 3.5% fat and 3.2% protein versus 3.2% fat and 3.0% protein capture higher revenue per pound.
Scale Economics Accelerate Consolidation: Cost differentials of $23.56 per hundredweight between small and large operations ($42.70 vs. $19.14) combined with projected margin compression to $8.00 per cwt create $83,220 annual viability gaps – strategic positioning decisions in the next 90 days determine decade-long competitive advantages.
Global Production Constraints Create Export Windows: EU’s 0.2% production decline due to environmental regulations and China’s reduced import needs shift international trade flows, favoring efficiently positioned U.S. operations with superior cost structures and modern technology platforms over traditional regions clinging to outdated competitive assumptions.
What happens when an entire industry of forecasters, analysts, and government experts all point in one direction – and the market does the complete opposite? May 2025’s milk production data just delivered a major reality check the U.S. dairy sector, and the implications for your operation are massive.
This analysis is specifically designed for strategic planners in dairy operations who need to understand and respond to fundamental market shifts that will define competitive positioning for the next decade.
The numbers don’t lie, but the experts sure did. While USDA consistently slashed production forecasts from 228.0 billion pounds in December 2024 down to 226.9 billion pounds by February 2025, American dairy farmers delivered a stunning 1.6% production surge that exposed a fundamental disconnect between official predictions and on-farm reality.
Here’s what should really keep you awake tonight: this isn’t just about forecasting failures. This production explosion is fundamentally reshaping the geographic DNA of American dairy, creating massive winners and devastating losers. Are you positioned on the right side of the biggest structural shift we’ve seen in decades, or are you about to get steamrolled by forces you didn’t see coming?
The Great Forecasting Failure: When Academic Models Meet Farm Economics
Let’s challenge the conventional wisdom that drove these catastrophically wrong predictions. The forecasting establishment relied heavily on historical production constraints and disease impact models, completely missing the most powerful force in agriculture: producer response to economic incentives.
According to verified USDA data, total U.S. milk production hit 19.9 billion pounds in May 2025, marking a robust 1.6% increase from May 2024. The 24 major dairy-producing states contributed 19.1 billion pounds, showing an even stronger 1.7% year-over-year growth. This wasn’t a statistical anomaly but a systematic failure of traditional forecasting methods.
The Economic Reality Check
The answer lies in challenging the conventional approach to dairy market analysis. Traditional models overweight historical constraints while underweighting current economic incentives. When March 2025 all-milk prices averaged $22.00 per cwt (up $1.30 year-over-year) while feed costs declined by $0.60 per cwt, the Dairy Margin Coverage farm margin shot to $11.55 per cwt – a stunning $1.90 increase from March 2024.
Strategic Planning Insight for Operations
If the experts got basic production trends this wrong using conventional forecasting methods, what other “established wisdom” might lead your strategic planning astray? The most successful operations are those that trust their economic fundamentals over official projections.
Think of it like this: if you’re managing a 500-cow herd averaging 80 pounds per cow daily, this production surge is equivalent to adding eight more cows to your milking string without increasing your overhead. The forecasters missed the economic signals that were screaming “expand” to producers who understood their income-over-feed cost margins.
The Geographic Revolution: Challenging the “Traditional Dairy Region” Myth
Here’s where we must demolish another piece of conventional wisdom: established dairy regions hold sustainable competitive advantages. The May 2025 data exposes this as dangerous thinking for strategic planners.
The New Powerhouses Disrupting Everything
According to verified USDA data, Kansas posted a mind-blowing 15.7% production increase in May, following a 15.5% surge in April. Texas delivered 8.9% growth, while South Dakota jumped 9.5%. These aren’t traditional dairy strongholds – they’re the new centers of gravity and growing at rates that make traditional regions look stagnant.
Strategic Geographic Analysis
To put Kansas’s growth in perspective: a typical 1,000-cow operation producing 75 pounds per cow daily would need to add 157 cows to achieve that same 15.7% increase. Kansas farmers aren’t just adding cows – they’re building entirely new production systems optimized for efficiency and scale.
Case Study: Stephen Mast’s Technology-Driven Success
A real-world example of strategic positioning comes from Stephen Mast’s operation, which demonstrates the power of technology integration. Mast’s implementation of CowManager technology resulted in:
$32,611 total annual return on investment
50% reduction in labor needed for finding cows in heat
20% fewer mastitis cases, 15% less lameness
6-pound increase in milk production per cow
$668,000 in added revenue from performance benefits
This case study illustrates how strategic technology adoption enables operations to capture the productivity gains driving geographic shifts.
Traditional Regions: The Decline Nobody Wants to Discuss
California saw a 1.8% decrease despite remaining the largest producer. Illinois dropped 4.0%, Oregon fell 2.3%, and Washington declined 3.3%. This isn’t temporary – it’s a structural decline masked by regional pride and reluctance to acknowledge changing competitive dynamics.
Herd Expansion: The Numbers Tell the Story
May 2025 saw 9.45 million dairy cows, an increase of 114,000 head from May 2024 and the largest U.S. dairy herd since 2021. Production per cow remained modest at 2,110 pounds in May, just 7 pounds above May 2024.
Strategic Decision Framework: Technology Adoption for Competitive Advantage
Labor costs represent approximately 25% of total dairy farm operating costs, yet the dairy industry has been slower to adopt automation compared to other agricultural sectors. This conservative approach is becoming a competitive death sentence for operations lacking strategic vision.
The Robotic Milking Market Reality
According to Cowsmo, the global milking robot market is expected to reach USD $2.61 billion by 2025, with an 11.8% CAGR. More importantly for strategic planners: Cowsmo reports that robotic systems boost milk production because “cows get milked when and as often as they want.”
Strategic Technology Implementation Timeline
Based on verified industry data, here’s your strategic technology adoption framework:
Phase 1: Strategic Assessment (Month 1)
Evaluate current labor costs (averaging $0.25-$1.00 per hundredweight for conventional parlors)
Calculate ROI potential: Systems typically achieve payback in 7 years vs. 15+ years for conventional parlor upgrades
Assess facility requirements for optimal implementation
Phase 2: Investment Analysis (Month 2)
Budget allocation: Systems typically cost $200,000-$300,000 per robotic unit
Labor efficiency gains: Target 2.2 million pounds per full-time worker vs. 1.5 million pounds in conventional parlors
Production increase potential: 15-20% increase compared to conventional milking
Phase 3: Implementation Strategy (Month 3)
Integration with existing management systems
Training protocols for transition management
Performance monitoring systems establishment
Strategic Competitive Positioning Assessment Tool
Use this framework to evaluate your operation’s competitive positioning:
Immediate Strategic Assessment Checklist
Cost Structure Analysis: □ Current cost per hundredweight vs. industry benchmark ($19.14 for large operations) □ Labor efficiency: pounds of milk per full-time worker equivalent □ Technology adoption level compared to regional competitors
Market Position Evaluation: □ Geographic advantages: distance to processing facilities □ Component production focus: butterfat and protein optimization □ Quality metrics: current SCC levels vs. target <200,000
Future Readiness Indicators: □ Capital investment capacity for technology upgrades □ Management systems integration capability □ Strategic partnerships with processors and suppliers
Strategic Decision Matrix
Factor
Current Position
Target Position
Action Required
Timeline
Cost/cwt
$ ___
$19.14 benchmark
Technology/scale
12-24 months
Labor efficiency
___ lbs/worker
2.2M lbs/worker
Automation
6-18 months
SCC levels
___
<200,000
Management/genetics
3-12 months
Geographic position
Miles to processor: ___
<50 miles optimal
Evaluate alternatives
Immediate
Market Dynamics: Component Value Revolution with Global Context
The May 2025 market reaction revealed sophisticated pricing dynamics that reward strategic thinking over simple production maximization. Consumer demand for all kinds of dairy products is up, creating opportunities for strategically positioned operations.
The Bifurcated Market Reality
The market is increasingly differentiating between products, with butter, cheese, NDM, and whey price forecasts raised on recent prices and increased export demand. This bifurcation creates clear strategic opportunities for operations that optimize for component production rather than volume.
Global Competitive Context for Strategic Planning
EU milk production is forecast to decline by 0.2% to 149.4 million metric tons in 2025, driven by environmental regulations. This creates export opportunities for efficiently positioned U.S. operations.
Labor Crisis: The Strategic Imperative for Automation
Half of dairy farm workers are immigrants; without them, retail milk prices would double while one in four dairy farms would shut down. This isn’t just a labor issue – it’s a strategic competitive factor.
Strategic Response Framework
Adopting strategic automation, progressive operations leverage the labor crisis as a competitive advantage. Technology can help farmers in many aspects on the farm, and the farmers who can capitalize on the value of the data will have a competitive advantage in the future.
The Scale Economics Reality: Strategic Positioning Requirements
According to verified USDA Economic Research Service data, average total cost per 100 pounds of milk is $42.70 for herds under 50 cows versus $19.14 for farms with 2,000+ cows. This isn’t just about size – it’s about strategic positioning for long-term viability.
Strategic Response Options for Different Operation Sizes
Based on verified performance data, operations have three viable strategic paths:
Scale-Up Strategy: Dramatic expansion through consolidation or partnerships
Premium Market Strategy: Specialization in high-value market segments
Strategic Exit: Timely divestiture while asset values remain strong
Global Market Strategic Context
EU cheese production is forecast to remain the primary output goal, supported by solid domestic consumption and export demand. This creates specific opportunities for U.S. operations positioned to compete in cheese markets.
Strategic International Positioning
Understanding global production constraints enables strategic positioning:
EU production decline creates export opportunities
New Zealand’s focus on efficiency over volume models strategic approaches
China’s reduced import needs shift global trade flows
The Bottom Line: Strategic Positioning for the New Dairy Reality
The May 2025 production surge isn’t just about higher milk output – it’s proof that dairy markets respond faster and more dramatically to economic incentives than conventional wisdom suggests. For strategic planners, this reveals fundamental truths about competitive positioning.
The Four Strategic Imperatives
First, economic fundamentals drive expansion decisions. When margins hit $11.55 per cwt, producers expand regardless of expert predictions. Strategic planners must build decision frameworks based on economic indicators, not forecasts.
Second, geographic positioning determines long-term viability. The states showing explosive growth have modern infrastructure, favorable regulations, and strategic processing investments. Regional loyalty won’t overcome structural economic disadvantages.
Third, technology adoption with measurable ROI is becoming survival-critical. With documented 7-year payback periods for robotic systems versus 15+ years for conventional upgrades, automation transforms from efficiency gain to competitive necessity.
Fourth, component optimization drives premium capture. Operations using Total Productive Index (TPI)-guided breeding programs for butterfat and protein content will outperform volume-focused approaches.
Your Strategic Action Framework
Here’s your immediate 90-day strategic positioning framework:
Month 1: Competitive Intelligence
Benchmark your cost per hundredweight against the $19.14 target for efficient operations
Assess current SCC levels with a target below 200,000 for premium positioning
Evaluate technology adoption levels versus regional competitors
Month 2: Strategic Investment Analysis
Calculate ROI for automation technologies with 7-year payback targets
Assess processing plant relationships and geographic positioning
Evaluate component production optimization potential
Month 3: Implementation Planning
Develop a technology integration timeline with specific performance targets
Establish strategic partnerships for scale or specialization advantages
Create monitoring systems for continuous competitive assessment
Strategic Decision Point
The dairy industry just proved that conventional wisdom can be spectacularly wrong about fundamental market dynamics. Strategic planners who understand this reality and position accordingly will capture market share from those clinging to outdated assumptions.
The question isn’t whether change is coming – May’s production data proves it’s already here. The question is whether your strategic planning framework is prepared to capitalize on the opportunities this transformation creates while others struggle to adapt.
Your Next Strategic Move
Implement this assessment framework immediately: Evaluate your operation against the top quartile in your region on cost per hundredweight, technology adoption, and component optimization. If you’re not competitive on at least two of these strategic factors, develop repositioning plans within 60 days.
The geographic and technological shifts we’ve analyzed aren’t slowing down – they’re accelerating. Strategic planners who act on verified economic signals rather than conventional forecasting wisdom will define the winners and losers in American dairy’s next chapter.
Complete references and supporting documentation are available upon request by contacting the editorial team at editor@thebullvine.com.
Learn More:
5 Technologies That Will Make or Break Your Dairy Farm in 2025 – Demonstrates how smart calf sensors, robotic milkers, and AI-driven analytics deliver measurable ROI within 7 months while addressing labor shortages and efficiency challenges facing modern dairy operations.
Every week, thousands of producers, breeders, and industry insiders open Bullvine Weekly for genetics insights, market shifts, and profit strategies they won’t find anywhere else. One email. Five minutes. Smarter decisions all week.
Texas herds surge 10.6% as US milk production hits 3-year high. Component-adjusted output up 3% – what it means for dairy margins.
EXECUTIVE SUMMARY: April 2025 saw U.S. milk production jump 1.5% year-over-year – the largest gain since 2022 – driven by a 89,000-cow herd expansion and rising yields. Texas dominated growth with a 10.6% output surge, while Idaho’s 4.2% rise faced emerging H5N1 risks. Component-adjusted production soared 3%, amplifying manufacturing potential despite California’s lingering avian flu challenges. Markets reacted bearishly as Class III futures dropped 20¢, signaling concerns about sustained oversupply. The data reveals a geographic shift, with Southern Plains states outpacing traditional dairy regions.
KEY TAKEAWAYS:
Historic expansion: 102K cows added in 10 months, pushing herds to 9.4M head – highest since mid-2021.
Texas powerhouse: 50K new cows + 55 lb/cow yield gain = 10.6% production spike.
Component revolution: 4.31% fat (+1.7%) and 3.34% protein (+1.2%) created 3% manufacturing value surge.
Regional realignment: Kansas (+11.4%) and South Dakota (+9.2%) boom as Washington (-4.5%) and Florida (-3.7%) contract.
Market warning: Bearish price reactions signal oversupply risks if demand doesn’t match 2%+ component-adjusted growth.
April 2025’s milk production statistics aren’t just another monthly data point—they’re the smoking gun confirming a fundamental restructuring of America’s dairy landscape. The 1.5% production surge (3.0% on a component basis) reveals how rapidly production power is shifting south and west, creating winners and losers in an industry transformation many producers aren’t prepared to acknowledge, much less address. USDA’s latest data confirms that the production center is shifting dramatically away from traditional dairy states toward regions that many “experts” dismissed as unsustainable just a decade ago.
The Numbers That Shatter Conventional Wisdom
Let’s be brutally honest about what April’s milk production report tells us. The nationwide 1.5% production increase compared to April 2024 doesn’t just mark the fourth consecutive month of rising output—it represents the most substantial year-over-year percentage gain since August 2022, according to USDA data released May 21, 2025.
What should make you sit up straight is the component-adjusted production increase of 3.0% that vastly outpaced the raw volume growth. This isn’t just more milk—it’s dramatically more valuable milk, with fat content reaching 4.31% (up 1.7% from last year) and protein climbing to 3.34% (up 1.2%).
When was the last time anyone in your cooperative meeting mentioned that component-adjusted production was growing at double the volume rate? It’s like celebrating a 200-bushel corn crop while ignoring that the test weight jumped from 56 to 58 pounds per bushel. The manufacturing value of America’s milk supply is expanding at a rate that’s reshaping processing economics in ways many industry observers seem determined to ignore.
This wasn’t supposed to happen. Market analysts had predicted a modest 1.2% growth. Instead, producers delivered an expansion that sent Class III futures and cheese prices tumbling approximately 20 cents in nearby months. When the market pundits and economists consistently underestimate production growth for four consecutive months, it’s not just a miscalculation—it’s a failure to recognize fundamental structural changes in the industry.
The Triple-Threat Expansion That Nobody Saw Coming
The April data exposes an industry expanding through three simultaneous vectors, creating a multiplier effect that catches even experienced market watchers flat-footed.
Heifers Stay Home: The Return of National Herd Expansion
For years, conventional wisdom claimed that the national dairy herd would remain flat, or contract as consolidated operations focused on efficiency rather than cow numbers. That narrative just collided head-on with reality. According to USDA’s National Agricultural Statistics Service, the April milking herd reached 9.425 million head, up 89,000 compared to April 2024 and adding 5,000 just since March.
This isn’t a statistical anomaly. U.S. dairy farmers have added 102,000 cows to the national herd in just 10 months—a 1.1% increase that has brought the milking population to its highest level since mid-2021, with the exception of that single month in March 2023.
What makes this expansion truly remarkable is its timing. Producers are actively growing herds despite cull cow prices that would typically have them backing up the trailer to the freestall barn every time a cow shows the slightest sign of trouble. When dairy producers choose milk production over $1,500+ cull checks, it signals they’ve run the numbers and see substantially more long-term value in keeping those animals in the parlor than in the beef supply chain.
We should ask whether this herd growth is driven by confidence in dairy fundamentals or by producers chasing more substantial cash flow in regions where cowside margins remain artificially inflated by unsustainable subsidies or environmental regulatory forbearance? The geographic distribution of this growth suggests the latter may be more significant than industry cheerleaders care to admit.
From Good to Great: Yield Climbs Despite Dilutive Factors
As the national herd grows, individual cow productivity isn’t reduced by first-lactation heifers and held-over cull candidates. It’s improving. USDA reports milk per cow averaged 2,055 pounds in April, 11 pounds more than April 2024, representing a 0.6% increase.
This yield improvement is particularly telling because it’s happening simultaneously with herd expansion. The industry’s conventional wisdom holds that you can grow aggressively or improve per-cow production, not simultaneously. The USDA data directly contradicts this assumption.
Typically, rapid herd growth involves bringing in younger, first-lactation animals and retaining older cows longer, which drag down average productivity. Yet national yields are still climbing, suggesting that the genetic advancement curve is steepening rather than flattening, despite widespread complaints about genetic diversity constraints. The annual rate of genetic improvement appears to be outpacing the dilutive effects of herd expansion—a phenomenon that undermines decades of dairy management assumptions.
The Component Revolution Nobody’s Talking About
Perhaps the most significant trend in the April data—and the one getting the least industry attention—is the continued improvement in milk components. Analysis shows fat content reached 4.31% (up 1.7% from last year) while protein rose to 3.34% (up 1.2%).
This component boost is why the true expansion of U.S. milk production is double what the fluid numbers suggest. While raw volume increased 1.5%, component-adjusted production surged 3.0%. This means processors receive substantially more manufacturing material from each tanker, dramatically expanding the dairy solids available for cheese, butter, and powder production.
For farmers in Federal Orders with component pricing, this represents a significant revenue multiplier beyond simple volume growth. For processors, it means substantially improved manufacturing efficiency. Yet how many producer meetings have you attended where the focus was entirely on hundredweight volume rather than component yield? The industry’s fixation on fluid metrics is increasingly disconnected from the economic reality of modern milk production.
MYTH BUSTER: The Expansion/Efficiency Trade-Off Is Dead
Dairy advisors and economists have repeated the same mantra for decades: “Rapid herd expansion inevitably dilutes per-cow productivity.” The April data completely demolishes this long-held belief. Despite adding 89,000 cows nationally and expanding the dairy herd at the fastest rate in years, milk per cow still increased 0.6% year-over-year, according to the USDA’s official report.
This wasn’t supposed to happen. The traditional wisdom suggests that when operations add significant numbers of younger animals and retain marginal older cows longer, average production should decline or at best remain flat. But the evidence is clear—we’re simultaneously experiencing both quantity (more cows) AND quality (more milk per cow) expansion.
What changed? And why aren’t industry advisors acknowledging this new reality? The data suggests genetic advancement is accelerating faster than previously recognized. Modern genetic selection tools, genomic testing, and AI-driven breeding decisions deliver productivity gains that outpace the natural dilutive effects of herd turnover.
This has profound implications for dairy business planning. Suppose you’re still operating on the old assumption that you must choose between expansion and efficiency. In that case, you’re using an outdated playbook that places your operation at a significant competitive disadvantage against producers who recognize and leverage this new reality.
America’s Dairy Geography Revolution: The New Powerhouses Emerge
The national production increase masks the most important story in the April data: a fundamental geographic restructuring of America’s dairy industry happening faster than most industry veterans believed possible.
Texas: The Undeniably New Dairy Capital
If you’re still thinking of Wisconsin as America’s Dairyland, it’s time to update your mental map. According to USDA figures, Texas’s milk production surged an astonishing 10.6% year-over-year in April, reaching 1.511 billion pounds. This extraordinary expansion wasn’t just incremental growth but a seismic shift in production capacity.
Texas added 50,000 cows to its dairy herd in just 12 months, growing from 640,000 to 690,000 head. That single-state expansion accounts for 56% of the entire national herd growth, as verified by the USDA’s state-level data. Even more impressively, milk per cow jumped from 2,135 to 2,190 pounds, demonstrating that Texas isn’t just adding cows—it’s continuously improving productivity.
Let’s put this in perspective: Texas alone accounted for more than half of America’s net dairy herd expansion. The state is no longer merely an emerging dairy power; it has established itself as the epicenter of U.S. dairy growth with a production model that combines aggressive expansion with improving efficiency.
This rapid growth raises uncomfortable questions about resource allocation. When a single state adds more cows in one year than many traditional dairy states’ milks, how sustainable is the resulting concentration of animals, manure nutrients, and water demand? Texas’s growth model depends on groundwater from the rapidly depleting Ogallala Aquifer and cheap feed grain production subsidized by federal crop programs. Is this the sustainable future of American dairying, or are we witnessing a resource bubble that will eventually burst with devastating consequences?
Idaho: Growth Despite Disease Shadows
According to the USDA’s April report, Idaho posted a robust 4.2% milk production increase in April, reaching 1.471 billion pounds. Unlike Texas, however, Idaho’s growth came entirely from herd expansion. The state added 28,000 cows year-over-year while milk per cow remained flat at 2,110 pounds.
This reliance on herd growth rather than productivity improvement creates potential vulnerability, particularly as The Bullvine reports new cases of H5N1 avian influenza have begun to emerge in Idaho. While the impact was described as “limited” in April, this development warrants close attention. Have we learned nothing from California’s experience with H5N1? When an industry builds growth projections entirely on herd expansion without concurrent productivity improvements, it’s creating a house of cards that can collapse with the first strong biological headwind.
Idaho’s production model—focusing on cow numbers rather than cow efficiency—resembles a crop farmer expanding acreage without improving yield. When margins tighten or disease challenges emerge, operations without productivity improvements to buffer against herd reductions become disproportionately vulnerable. Is Idaho making the same strategic error that cost California its production dominance?
California: Beyond Bird Flu
California, America’s largest milk-producing state, continued to feel the effects of H5N1 with April production falling 1.4% year-over-year to 3.480 billion pounds, according to USDA data. However, analysts note this represents improvement from March’s 2.7% decline and outperformed their forecast of a 1.7% reduction.
Interestingly, California’s struggles stem primarily from reduced productivity rather than herd contraction. The state’s cow numbers increased slightly by 1,000 head year-over-year, but milk per cow fell by 30 pounds. This suggests H5N1’s primary impact has been on cow health and productivity rather than triggering widespread culling—an object lesson in the differential effect of disease on production parameters versus herd demographics.
The recovery trend in California and the stronger-than-expected performance elsewhere create a dichotomy of negative milk production in California and strong recovery in the rest of the country. This divergence has significant implications for regional milk pricing and product flows that FMMO reform advocates have yet to address adequately.
The Reshuffling of America’s Dairy Map
Beyond these major players, USDA’s state-level data revealed several other states posted dramatic production shifts that further illustrate the geographic redistribution of U.S. dairy capacity:
Kansas: +11.4% (emerging as another major growth center)
South Dakota: +9.2% (continuing its multi-year expansion trend)
Georgia: +7.2% (showing surprising strength in a traditionally shrinking region)
Washington: -4.5% (accelerating contraction in the Pacific Northwest)
Florida: -3.7% (continuing its long-term decline)
Wisconsin: +0.1% (essentially flat production from America’s traditional dairy heartland)
This pattern reveals a fundamental restructuring of U.S. dairy geography that’s happening regardless of whether industry leaders choose to acknowledge it. The traditional Upper Midwest and Pacific Northwest regions show minimal growth or outright contraction, while the Southern Plains and certain parts of the Southeast are experiencing explosive expansion.
Regional Production Shifts Reshaping the U.S. Dairy Landscape
State
April 2025 Production (million lbs)
YoY Change
Key Drivers
Future Implications
Texas
1,511
+10.6%
+50,000 cows, +55 lbs/cow
Emerging dominant production center requiring massive processing expansion
Idaho
1,471
+4.2%
+28,000 cows, flat yield
Growth is vulnerable to the emerging H5N1 situation
California
3,480
-1.4%
+1,000 cows, -30 lbs/cow
Gradual recovery from H5N1 impact, primarily yield-driven
Wisconsin
2,713
+0.1%
+7,000 cows, +15 lbs/cow
The traditional dairy heartland is showing minimal growth
Kansas
382
+11.4%
+16,000 cows, +40 lbs/cow
Emerging as a significant growth center in the Central Plains
South Dakota
440
+9.2%
+16,000 cows, +30 lbs/cow
Sustained multi-year expansion continuing
This geographic shift has profound implications for processing capacity, transportation logistics, and regional price relationships that industry planners seem determined to ignore. The industry’s infrastructure was built around historical production centers, but milk is increasingly produced in regions lacking adequate processing capacity.
Who’s asking the tough questions about this mismatch? When milk production growth is concentrated in regions without proportional processing expansion, the result is inefficient transportation, pressure on class prices, and increased vulnerability to market disruptions. Is anyone planning for a dairy industry where Texas and Kansas collectively produce more milk than Wisconsin? Because that’s the trajectory we’re on, according to the multi-year trend in USDA production data.
H5N1: Managing Through Rather Than Solving
The emergence of H5N1 avian influenza in dairy herds created significant uncertainty for the industry over the past year. While still a concern, the April data suggests producers are developing effective management strategies to limit its impact on production, managing through rather than solving the underlying problem.
California, which was hit hardest by H5N1, is showing signs of recovery with the production decline rate moderating from -2.7% in March to -1.4% in April. This improvement, coupled with the slight increase in California’s cow numbers, indicates farmers are adapting to manage through the challenge rather than reducing herd size.
Analysts note that “most H5N1 cases in dairy cattle are being reported as subclinical, and many affected producers have not reported a decline in milk production on the farm.” But let’s be clear: ‘subclinical’ doesn’t mean ‘inconsequential.’ Subclinical infections can still compromise long-term health, reproduction, and lifetime productivity. The industry’s apparent satisfaction with “managing through” rather than solving the H5N1 challenge reflects a troubling pattern of addressing symptoms rather than root causes.
Are we witnessing another example of the dairy industry adapting to a new normal rather than solving a fundamental problem? Just as we’ve collectively accepted declining reproductive performance, shortened productive life, and escalating transition cow challenges as “normal,” the industry appears to be normalizing endemic H5N1 as just another management variable rather than a solvable problem.
Market Implications: Reality Check Coming
The April production report triggered immediate bearish reactions in dairy markets. Class III milk and cheese prices dropped approximately 20 cents soon after release. Market volatility was evident, as “at one point Class III was limit up (+75 cents) after the spot session” before settling lower.
What makes this production boom particularly significant is that it’s being driven by multiple simultaneous factors: expanding herd size, improving yields, and rising component levels. This multi-pronged expansion creates sustained upward pressure on supply that could continue through mid-2025, potentially crushing producer margins if demand doesn’t keep pace.
Analysts project that “component-adjusted growth could remain above 2% through June” if current trends persist. This suggests the supply pressure in the market could intensify in the coming months.
The embedded momentum in the system—102,000 additional cows added in just 10 months, according to USDA—creates production inertia that will continue even if expansion decisions slow. These newly added cows will continue contributing to the milk supply for multiple lactation cycles, maintaining elevated production levels even if farmers pause further expansion.
Is the industry headed for another self-inflicted oversupply crisis? When milk production substantially outpaces domestic consumption growth and exports fail to absorb the difference, the result is predictable: inventory buildups, price pressure, and eventual margin compression that forces painful contractions. Have we learned nothing from the cyclical boom-bust patterns of the past two decades?
Your Strategic Response: Five Critical Adjustments
How should dairy farmers respond to this rapidly changing production landscape? Here are key considerations for producers looking to maintain profitability in this environment:
1. Make Components Your Production North Star
With component-adjusted production growing at double the rate of fluid volume (3.0% vs 1.5%), the economic return on component improvement has never been clearer. Stop fixating on tank volume and start obsessing over component yield. Evaluate your feeding program, genetic selection, and management practices focusing on fat and protein optimization.
DHIA records can be invaluable for identifying your highest component producers for breeding decisions. Consider strategic culling based not just on volume but on component production efficiency. A 65-pound cow producing 4.5% butterfat and 3.6% protein might be more profitable than an 85-pound cow with 3.5% fat and 3.0% protein, especially in component-based payment systems.
When did you last sort your herd list by fat and protein pounds rather than milk volume? If you’re still selecting primarily for milk volume in your breeding program, you’re fighting yesterday’s economic battle while your competitors focus on today’s profit drivers.
Have you honestly assessed whether your region is a long-term winner or loser in this geographic redistribution? If you’re in a contracting region, what competitive advantages can you leverage to overcome the structural headwinds? If you’re in an expansion area, are you prepared for the inevitable infrastructure constraints and environmental scrutiny that follow rapid growth?
Areas to critically evaluate include:
Local processing capacity trends and expansion plans
Regional feed cost and availability projections
Water access guarantees and regulatory trajectory
Labor market stability and cost escalation
Land base constraints and nutrient management limits
These factors are increasingly divergent across regions and will determine which areas can sustainably support continued growth. Many producers are making long-term capital investments based on outdated assumptions about regional competitiveness that the April USDA data directly contradicts.
3. Prepare for Price Pressure Now, Not Later
The sustained production expansion, particularly on a component-adjusted basis, creates the potential for inventory buildups and price pressure if demand doesn’t keep pace. Strategic risk management isn’t optional in this environment—it’s essential for survival.
Consider:
Forward contracting opportunities through your co-op or private buyers
Options strategies to protect downside risk
Building financial reserves while margins remain positive
Stress-testing your operation against potential Class III and component value scenarios
Are you budgeting based on the current milk price or the cost when your newest heifer group enters the milking string? The Federal Order system’s classified pricing means different producers will experience this market pressure differently. Understanding how your milk is utilized and priced becomes increasingly critical in this environment of growing supply.
4. Rethink Your Culling Strategy
The trend of slowed culling rates suggests that many producers retain older cows longer than usual due to favorable margins. While this maximizes short-term production, it could create vulnerability if margins tighten.
Are you keeping unprofitable cows in your herd because they’re still producing milk? Evaluate your culling decisions based on:
Individual cow profitability accounting for component production
Reproductive status and projected productive life
Current beef market opportunities (cull cow prices remain historically strong)
Replacement availability and costs
A clear culling strategy—rather than simply retaining all cows—will provide flexibility if market conditions change rapidly. This is the dairy equivalent of a crop farmer’s harvest strategy—knowing when to take profits rather than hoping for ever-higher yields.
5. Plan for H5N1 as Endemic, Not Temporary
While H5N1’s impact appears moderate, its continued presence creates ongoing risk. The experience in California shows how quickly production can be affected when disease challenges emerge.
Hoping H5N1 will simply disappear is not a strategy. Instead, develop comprehensive management protocols:
Early detection systems and regular surveillance testing
Staff training on disease identification and management
Contingency plans for potential outbreaks, including segregation strategies
Have you calculated the economic impact of a 2% drop in herd productivity from subclinical H5N1 infection? For most operations, this “invisible” loss would significantly erode profitability. Yet, few have quantified this risk or developed specific mitigation strategies, despite the numerous cases documented by the USDA and reported in agricultural publications like The Bullvine.
The Bottom Line: Adapt or Be Left Behind
April’s milk production data from the USDA reveals an industry fundamentally transforming itself through geographic redistribution, component enhancement, and overall expansion. The 1.5% increase in raw volume—amplified to a 3.0% boost in component-adjusted terms—signals strengthening supply pressure that will challenge milk prices in the coming months.
The regional divergence in production performance—from Texas’s 10.6% surge to California’s ongoing struggles—highlights how local conditions increasingly determine dairy success. Producers must recognize that geography, processing capacity, and biological resilience now play outsized roles in determining competitive position.
The U.S. dairy landscape is evolving rapidly, with the dramatic growth in Texas and other Plains states shifting the center of gravity for American milk production. Traditional dairy regions like Wisconsin and the Pacific Northwest see their relative influence diminish as the Southern Plains emerges as the new growth engine.
For dairy farmers, now is the time to honestly reassess your strategic position in this changing environment:
Are you optimizing for components or still chasing volume?
Does your region have the infrastructure to support profitable dairy production in the long term?
Are you prepared for the price pressure inevitably following this supply expansion?
Have you developed a reproductive program to maintain herd size without retaining unprofitable cows?
Is your operation structured to withstand the biological challenges that appear increasingly endemic?
The winners in this new environment won’t necessarily be the largest producers, but rather those who best align their operations with the emerging realities of America’s restructured dairy map. The geographic revolution beneath the surface of these production numbers will reshape competitive dynamics for years to come.
Take a hard look at where your operation fits in this changing landscape. Are you positioned in a growth region with the right cows producing the right components for your market? Or are you holding onto outdated production models in regions facing structural decline?
The April production report isn’t just another data point—it’s a roadmap to the industry’s future. Those who read it correctly and adjust accordingly will thrive. Those who dismiss it as just another monthly fluctuation may wonder why their business model no longer works in an industry that’s moved on without them.
What specific change will you implement this month to align your operation with these emerging realities? Your answer to this question may determine whether you’re leading this transformation or being left behind by it.
Learn more:
Behind The Numbers of April’s Milk Production Report: This article provides context from the previous month’s (March 2025) production report, highlighting early signs of herd expansion, component value outpacing volume, and the initial impacts of HPAI, setting the stage for the April surge.
Discover How U.S. Cows Are Shattering Milk Production Records: This article delves into the historical context of U.S. milk production efficiency, explaining the factors like genetics, technology, and management practices that have led to significant increases in per-cow output and butterfat levels over the decades, providing background to the current productivity gains.
The Sunday Read Dairy Professionals Don’t Skip.
Every week, thousands of producers, breeders, and industry insiders open Bullvine Weekly for genetics insights, market shifts, and profit strategies they won’t find anywhere else. One email. Five minutes. Smarter decisions all week.
DMC extended to 2031: Modernized coverage + higher limits shield your dairy. Act before Congress votes.
EXECUTIVE SUMMARY: The House Agriculture Committee’s proposal extends the Dairy Margin Coverage (DMC) program through 2031, overhauling outdated policies to better protect modern dairy operations. Key upgrades include using 2021-2023 production data for coverage calculations, raising Tier 1 protection to 6 million pounds, and offering 25% premium discounts for long-term enrollment. These changes align risk management with current farm sizes, boost financial stability, and empower strategic planning. However, the provisions face hurdles in a divided Congress due to contentious SNAP cuts. Dairy producers must prepare now to maximize benefits if the bill passes.
KEY TAKEAWAYS:
Modernized Production History: Base coverage on 2021-2023 data instead of outdated 2011-2013 figures, protecting your actual output.
Expanded Tier 1 Coverage: Protect up to 6 million pounds (previously 5M) at lower premiums, saving mid-sized farms thousands annually.
Decade-Long Stability: Plan investments confidently with DMC locked in through 2031-critical for herd expansions or tech upgrades.
Legislative Risks: Bill faces steep opposition over $290B SNAP cuts; industry advocacy is crucial to save dairy provisions.
Mandatory Data Surveys: New USDA processing cost studies aim to future-proof milk pricing and policy decisions.
AT LAST! After years of dairy farmers shackled to decade-old production figures, the House Ag Committee delivers game-changing DMC program extensions through 2031 with modernized production history calculations using 2021-2023 figures. This isn’t just a policy tweak for growing operations – it’s transforming financial survival.
For years, you’ve been telling anyone who would listen that the DMC program’s reliance on ancient 2011-2013 production history was like trying to protect today’s farm with yesterday’s insurance policy. Well, someone in Washington finally got the message! The House Agriculture Committee dropped what might be the most transformative dairy policy proposal in a decade, extending the critical Dairy Margin Coverage program through 2031 and fundamentally overhauling how your production history gets calculated.
YOUR ACTUAL HERD SIZE FINALLY MATTERS: DMC CATCHES UP TO REALITY
Let’s cut straight to what matters most for your operation – that outdated production history calculation that’s driven you crazy for years? Gone. Finished. History.
Under this proposal, you’ll establish your DMC production history using your highest milk marketings from 2021, 2022, or 2023 – figures that reflect your CURRENT operation, not what you were milking a decade ago. This isn’t some minor regulatory adjustment; it’s the difference between meaningful protection and a safety net full of holes.
Why This Matters to Your Bottom Line:
If you’ve grown since 2013 (and who hasn’t?), your DMC payments would finally match your actual risk exposure when margins collapse
You’re no longer penalized for modernizing your operations or transitioning to the next generation
Every drop of eligible milk gets the protection it deserves, not just what you were producing in the Obama era
Think about what this means in real numbers. Suppose your farm produced 4 million pounds annually in 2013 but has since grown to 6 million pounds, under the current system. In that case, you’ve effectively had 2 million pounds of milk production hanging out completely unprotected when margins squeeze. That’s not just unfair – it’s financially dangerous. The National Milk Producers Federation has been hammering this point for years, arguing that farms have effectively “lost protection through the program” because their coverage was frozen while their operations kept evolving.
MORE MILK PROTECTED AT LOWER RATES: TIER 1 EXPANSION IS A GAME-CHANGER
Here’s another bombshell that’ll directly impact your wallet: the proposal increases the Tier 1 coverage threshold from 5 million to 6 million pounds annually. This means you can protect an additional MILLION pounds of production at the substantially more affordable Tier 1 premium rates.
What This Means for Your Operation:
Mid-sized operations approaching or just over the 5-million-pound mark gain immediate relief
Lower per-hundredweight costs for comprehensive coverage on a larger production volume
More milk is eligible for the maximum $9.50/cwt protection level (versus the $8.00 cap on Tier 2)
The significance here cannot be overstated. The premium rate differences between Tier 1 and Tier 2 are substantial, especially at higher coverage levels. This change effectively lowers your cost of protection across a larger portion of your production, making comprehensive coverage more affordable exactly where you need it most.
PLAN WITH CONFIDENCE: UNPRECEDENTED DECADE OF STABILITY
Forget the typical five-year farm bill rollercoaster – this proposal extends DMC authorization through 2031, providing dairy producers with planning certainty that’s completely unprecedented in federal agricultural policy.
For those of you making major business decisions – facility upgrades, succession planning, herd expansions – this long-term extension fundamentally changes your risk management landscape. These aren’t decisions you make based on next year’s outlook, but 5–10-year horizons. Your primary risk management tool for that new rotary parlor or robotic milking system will be there throughout the entire payback period.
Your New DMC Game Plan:
Lock in your coverage elections for 2026-2031 to receive a substantial 25% premium discount
Use the extended certainty to plan major capital investments confidently
Budget with greater precision, knowing your safety net parameters won’t change for years
The historical performance shows exactly why these matters: DMC triggered payments in 38 months between 2019 and 2024 for producers at maximum coverage levels. Total payouts reached a staggering $3.3 billion during this period, with $1.2 billion paid in 2023 alone, when payments triggered in 11 of 12 months. For perspective, the program has issued payments in approximately two-thirds of all months since inception, delivering a net benefit averaging $1.35 per hundredweight after accounting for premium costs. That’s real money that saved countless operations during catastrophic margin collapses.
BETTER DATA FOR SMARTER POLICY: MANDATORY SURVEYS COMING
While less immediately flashy than the production history update, the proposal’s funding for mandatory USDA dairy processing plant cost surveys every two years could reshape future policy debates in your favor.
These surveys will provide crucial data for discussions about making allowances – that portion of classified milk prices intended to cover processors’ manufacturing costs. Make allowance adjustments directly impact your farmgate milk price, and having current, accurate data ensures these critical decisions aren’t based on outdated or cherry-picked information.
Why This Matters Long-Term:
Evidence-based decision-making rather than reliance on voluntary, potentially biased data
Better understanding of actual processing cost structures across different plant types and regions
More transparency is a critical component of your milk check calculation
For too long, allowance debates have suffered from information asymmetry – processors have better data about their costs than farmers. This provision helps level that playing field, ensuring your voice is backed by hard numbers in future Federal Milk Marketing Order discussions.
THE BATTLE ISN’T OVER: POLITICAL OBSTACLES AHEAD
Before celebrating these game-changing improvements, understand that significant political hurdles remain. These DMC enhancements are embedded in a highly controversial budget reconciliation package that faces an uncertain future.
The House Agriculture Committee approved the bill on a narrow party-line vote of 29-25, with the proposal’s deep cuts to SNAP funding generating fierce opposition. Representative Angie Craig, the Ranking Member of the House Agriculture Committee, warned that the bill “shatters the farm bill coalition” – the bipartisan cooperation traditionally essential for passing agricultural legislation.
Even more concerning: while the House proposal reportedly includes over $290 billion in SNAP cuts, the Senate’s approach contemplates only about $1 billion in SNAP reductions. This enormous gulf suggests potential deadlock ahead, endangering the entire package, including these vital DMC improvements.
What Smart Dairy Producers Should Do Now:
Start identifying your highest production year from 2021 to 2023 to prepare for potential enrollment
Connect with your industry associations to voice support for these DMC provisions specifically
Begin evaluating how updated DMC coverage would integrate with your overall risk management strategy
Watch legislative developments closely, as the reconciliation package faces a challenging path forward
THE BOTTOM LINE: TRANSFORMATIVE CHANGES WORTH FIGHTING FOR
After years of watching DMC protection slowly become misaligned with your operation, these proposed changes finally address the program’s fundamental flaws. The update to recent production history, expanded Tier 1 coverage limits, and unprecedented long-term extension would transform DMC from a partial safety net with growing holes into a comprehensive risk management foundation that matches your current enterprise.
For dairy producers navigating increasingly volatile global markets, securing these changes means the difference between a risk management system that feels increasingly irrelevant versus one that provides genuine financial security when margins collapse. These updates could unlock expansion opportunities if you’ve hesitated to grow because additional production wouldn’t be covered under DMC. If your farm has been handed down to the next generation but protection hasn’t kept pace, this proposal finally recognizes your current reality.
As President and CEO of NMPF, Gregg Doud emphatically stated, “Whether it’s risk management or tax issues, the stakes are enormous for Congress to get the policy right in this legislation.” For once, it appears they actually might – if only the broader political battles don’t derail these crucial dairy provisions before they finish.
Every week, thousands of producers, breeders, and industry insiders open Bullvine Weekly for genetics insights, market shifts, and profit strategies they won’t find anywhere else. One email. Five minutes. Smarter decisions all week.
Corn and soybeans are set for record-breaking harvests, but bullish demand and a U.S.-China tariff truce could shake up global feed prices and dairy margins.
EXECUTIVE SUMMARY: The USDA’s latest WASDE report forecasts record U.S. corn and soybean crops for 2025-26, with corn output expected to hit 15.8 billion bushels and soybean crush reaching new highs. Despite this bin-busting supply, the agency surprised markets by projecting stronger-than-expected export demand and tighter ending stocks, especially for soybeans. A 90-day U.S.-China tariff détente adds a temporary boost to export prospects, though South American competition remains fierce. For dairy producers, these developments signal potential relief on corn-based feed costs but continued firmness in protein prices. The outlook remains volatile, hinging on weather, global trade, and policy shifts. Smart risk management will be crucial as markets digest these mixed signals and prepare for the months ahead.
KEY TAKEAWAYS:
USDA projects record U.S. corn and soybean crops for 2025-26, with corn at 15.8 billion bushels.
Stronger-than-expected export demand tightens ending stocks, especially for soybeans.
A 90-day U.S.-China tariff truce temporarily boosts export prospects but competition from South America stays strong.
Dairy producers may see lower corn feed costs but steady protein prices due to record soybean crush.
Volatile markets ahead: weather, trade policy, and global competition will shape feed prices and margins.
The latest USDA World Agricultural Supply and Demand Estimates (WASDE) report has shaken grain markets with projections of monster crops paired with surprisingly robust demand figures. Released on May 12, the report adds a bullish twist to what many traders expected to be a bearish outlook, while a temporary U.S.-China trade détente injects additional market optimism. These developments could reshape feed cost trajectories for dairy producers for the coming year.
Record-Breaking Corn Production Meets Strong Export Demand
USDA economists shocked the market with their first comprehensive look at the 2025-26 corn outlook, projecting an unprecedented 15.8 billion bushel harvest that would smash previous records by 3.1%. This mammoth production forecast stems from a perfect storm of expanded acreage and exceptional yield potential. Farmers have planted 95.3 million acres of corn, the highest level in 12 years, while yields are expected to reach 181 bushels per acre.
Despite this tsunami of production, the market rallied on news that the USDA expects much stronger demand than private analysts had anticipated. The agency forecasts corn exports to reach a five-year high of 2.675 billion bushels for 2025-26, up from 2.6 billion in the current marketing year. This optimistic export projection caught traders off guard, as many had braced for significantly higher ending stocks.
“Market reaction to the immediate response to what we saw on the balance sheet with old and new crops was a little bit friendly. That’s the best you could phrase that, especially in the corn and beans,” said Jacob Burks with AgMarket.Net.
Even with record production and robust total use, USDA projects 2025-26 ending stocks at 1.8 billion bushels – historically substantial but notably lower than the pre-report average trade guess of 2.044 billion bushels. Despite the projected record supplies, this surprising twist gave corn futures an unexpected boost.
The season-average farm price for corn is forecast at $4.20 per bushel, down 15 cents from the current year. While this price decline reflects the weight of record supplies, it’s less severe than many had feared, offering a glimmer of hope for dairy producers concerned about their income-over-feed-cost margins.
Soybeans: Tight Stocks and Record Crush Drive Bullish Sentiment
The soybean outlook delivered an even bigger surprise, with USDA projecting dramatically tighter stocks than analysts expected. For 2025-26, ending stocks are forecast at a relatively slim 295 million bushels, well below trade expectations of 351 million. This represents a 16% drop from the revised 2024-25 estimate of 350 million bushels.
This bullish stocks figure comes despite a slight production decrease to 4.34 billion bushels, down marginally from 4.366 billion in 2024-25. The key factor tightening the balance sheet is domestic crush, projected to reach an unprecedented 2.49 billion bushels, marking the fifth consecutive season of record-setting processing volume.
Ending U.S. soybean stocks for 2025-26 were pegged at 295 million bushels, a 16% drop from 2024-25 and well below the average analyst estimate at about 375 million bushels. The lower stocks figure reflects expectations for a smaller U.S. crop and outlook for a 3% increase in crushing, USDA said,” reports Farm Progress.
The crush boom is primarily driven by strong demand for soybean meal in livestock feed and the continued expansion of soybean oil use for biofuel production. USDA projects 13.9 billion pounds of soybean oil will go toward biofuel production in 2025-26, up from 13.1 billion in the current marketing year.
Global Production: South American Powerhouses Continue Dominance
While U.S. production numbers grabbed headlines, the global picture remains dominated by South American output. Brazil’s soybean crop is projected to reach a mind-boggling 175 million metric tons (MMT) in 2025-26, up 3.6% from the current year’s 169 MMT. Brazil’s corn production is forecast at 131 MMT, slightly higher than the 130 MMT estimated for 2024-25.
Argentina’s corn production is expected to jump to 53 MMT from 50 MMT, while its soybean crop is forecast at 48.5 MMT, slightly below the current year’s 49 MMT. These massive South American harvests will continue to compete fiercely for U.S. exports in global markets.
“Exports of major South American soybean-producing countries (Brazil, Argentina, Paraguay, and Uruguay) are expected to rise 8.5 million tons, more than offsetting lower U.S. exports,” according to the WASDE report details. This competitive pressure may limit potential price rallies despite the tighter U.S. balance sheets.
Adding fuel to the market rally, the U.S. and China announced a 90-day tariff truce on May 12, coinciding with the WASDE release. Under this agreement, U.S. tariffs on Chinese goods will drop from 145% to 30%, while China’s tariffs on U.S. imports will fall from 125% to 10%.
“The executive director of Farmers for Free Trade is encouraged by the U.S. and China agreeing to roll back tariffs drastically. Brian Kuehl calls Monday’s announcement a step in the right direction,” reports Brownfield Ag News.
The timing is significant, as the 90-day window will extend through mid-August, just before the U.S. harvest begins. During this period, officials from both countries will negotiate toward potentially longer-term trade policies. For grain markets, particularly soybeans, this provides a temporary but meaningful opportunity to move more product to the world’s largest importer.
However, industry experts caution against overexcitement about the trade news. “This agreement brings U.S. tariffs down to 30 percent and China’s tariffs down to 10 percent,” notes Arlan Suderman with Stone X Group, who believes markets are overreacting. “It’s always good when the two sides are talking… But it’s not expected to change the supply-demand balance sheet materially.”
Suderman points out that even with reduced tariffs, “Brazil soybeans at port in China are still 70 cents a bushel cheaper than those coming from the U.S. Gulf, before any retaliatory tariffs are applied.” This highlights the ongoing competitive challenges faced by U.S. exporters.
Implications for Dairy Producers: Feed Outlook and Risk Management
These developments create a mixed but generally favorable feed cost outlook for dairy producers. The projected record corn production and price reduction to $4.20 per bushel should provide some relief on the energy side of the ration. However, the tighter soybean stocks and continued strength in crush demand may keep protein costs firm, with soybean meal prices potentially rising from current levels.
The 90-day trade détente with China creates a window of opportunity that could support export sales, but its temporary nature means producers should remain cautious about longer-term price assumptions. The agreement expires as the 2025 harvest begins, potentially creating renewed uncertainty during a critical marketing period.
Smart dairy operators will use any price rallies in the coming months as opportunities to lock in feed needs for the remainder of 2025 and early 2026. With record production projected but surprisingly strong demand components, markets could remain volatile as weather developments and trade negotiations continue to evolve.
Looking Ahead: Weather and Policy Will Drive Markets
The WASDE projections assume normal growing conditions throughout the summer, making weather the critical wild card that could dramatically alter these forecasts. Any significant production shortfalls would quickly tighten balance sheets and drive prices higher, particularly given the stronger-than-expected demand outlook.
On the policy front, biofuel mandates continue to reshape demand patterns, especially for soybeans. The projected increase in soybean oil use for biofuel production to 13.9 billion pounds represents a structural shift that supports crush margins and overall soybean values.
The aggressive USDA export projections will face scrutiny as the marketing year unfolds. “We thought they (USDA) could have increased it to 100 million bushels. They came in and increased it 50 million bushels, which I thought was a pretty aggressive approach,” notes Jacob Burks regarding the corn export forecast.
For dairy producers, the key takeaway is cautious optimism on feed costs, with corn potentially offering better value while protein costs remain firm. The heightened uncertainty around trade policy suggests implementing risk management strategies while favorable opportunities present themselves, rather than betting on sustained market direction in either direction.
Conclusion: Navigate Carefully Through Market Contradictions
The May WASDE report presents a fascinating contradiction – record production forecasts alongside surprisingly robust demand projections that tightened balance sheets beyond trade expectations. Add the wild card of a temporary trade truce with China, and markets face significant crosscurrents in the months ahead.
These market dynamics demand careful attention to feed procurement strategies for dairy producers. The projected record corn supplies suggest favorable energy feed costs, while strong crush demand signals potential firmness in protein costs. The temporary nature of the U.S.-China trade détente adds another layer of complexity to an already nuanced market outlook.
As planting progresses and summer weather patterns emerge, these initial WASDE projections will evolve. Smart dairy operators will stay engaged with markets and implement flexible risk management plans that protect against adverse price movements while maintaining the ability to capitalize on favorable opportunities.
Every week, thousands of producers, breeders, and industry insiders open Bullvine Weekly for genetics insights, market shifts, and profit strategies they won’t find anywhere else. One email. Five minutes. Smarter decisions all week.
Despite adding thousands of cows, America’s dairies struggled to boost production. What’s really happening in your milk check?
EXECUTIVE SUMMARY: The USDA’s March 2025 Milk Production report reveals a dairy sector caught in transition, with national output rising just 0.9% year-over-year despite farmers adding 9,000 more cows between February and March. This modest volume growth masks a remarkable 2.7% surge in component-adjusted production as fat and protein levels significantly outpace fluid metrics. Regional performance varies dramatically – from Texas’s explosive 9.4% growth to California’s continued HPAI recovery (-2.1%) and Washington’s steep 4.3% decline amid low milk prices forcing farm exits. The persistent paradox of expanding herds (+72,000 head YoY) paired with stagnant productivity (just +0.2% per cow) signals deeper structural challenges that aren’t solved by simply milking more cows. Meanwhile, new HPAI cases in Idaho and emerging viral strains in Nevada and Arizona demonstrate the disease threat remains very real heading into summer.
KEY TAKEAWAYS
Component value now trumps volume metrics – With component-adjusted production (2.7%) nearly tripling volume growth (0.9%), farms focusing solely on milk quantity are missing significant profit opportunities in butterfat ($2.62/lb) and protein ($2.46/lb).
Geography determines your dairy’s destiny – The stark performance gap between states (Texas +9.4% vs. Washington -4.3%) shows local market conditions and disease pressures create fundamentally different operating environments that require region-specific strategies.
Biosecurity isn’t a choice, it’s survival insurance – New HPAI cases in Idaho (9 in 30 days) and emerging viral strains prove this disease isn’t going away; operations with robust protocols gain resilience against both current and future biological threats.
The productivity paradox demands fresh thinking – Despite adding 72,000 more cows (+0.8%) YoY, productivity per cow remains nearly flat (+0.2%), signaling deeply rooted efficiency challenges that expansion alone can’t solve.
Strategic agility beats raw production capacity – In today’s complex market, success depends on your ability to adapt to contradictory signals and position your operation at the intersection of component optimization, disease prevention, and regional advantage.
Automatic milking carousel modern dairy farm facility. Modern parlour interior. Unknown managers livestock shed workers check inspect automatic line process. Holstein cows at milk production factory.
Let’s cut to the chase: USDA’s March 2025 milk production report reveals a growing sector but not exactly firing on all cylinders. Production is up 0.9% year-over-year, lagging the 1.2% analysts expected. So, what’s going on under the hood?
We’re Adding Cows, but Where’s The Milk?
You’ve heard the puzzle – more cows should mean more milk, right? Well, the March data tells a different story. Farmers added 9,000 cows between February and March, pushing the national herd up 72,000 head (+0.8%) from last year. But here’s the kicker: production per cow barely budged, climbing just 0.2% from March 2024.
What gives? Despite adding all these cows, we’re seeing production outside California grow only 1.5% – well below the 2.0% experts predicted. Haven’t we been taught that expanding herds drives production growth?
Let’s face it – something’s holding back these cows from reaching their potential. The lingering effects of HPAI certainly play a role, but there’s more to this story than just bird flu.
California’s Long Road Back
California’s still feeling the sting from HPAI, with production down 2.1% year-over-year. But don’t miss the silver lining – that’s better than February’s 2.7% decline. The Golden State’s recovery is happening, just not overnight.
Nearly 80% of California’s infected herds have been virus-free for at least 30 days, with only eight new infections in the past month. That’s progress you can’t ignore.
But have you noticed how dramatically different the story is across state lines? While California limps toward recovery, Texas is crushing it with a 9.4% production jump. They’re milking 25,000 more cows than last year! Meanwhile, Washington’s farmers are heading for the exits, with production plummeting 4.3% as rock-bottom milk checks force tough decisions.
Bird Flu: The Unwelcome Guest That Won’t Leave
Think we’ve seen the last of avian influenza? Think again. While we’re not seeing the explosive spread from last year, this virus isn’t done with us yet. New cases are popping up in Idaho – 9 in the previous month alone – and a new genotype called D1.1 has emerged in Nevada and Arizona.
When HPAI hits a herd, it’s not just a minor inconvenience. We’re talking milk production drops of 15-25% in affected cows. That’s a massive hit to your bottom line, not to mention the increased culling many operations face due to persistent issues post-infection.
Haven’t we learned enough about biosecurity in the past year? You’d think so, but this virus keeps finding ways to surprise us. The question isn’t if your operation will face a disease challenge – it’s when and how prepared you’ll be.
Component Values: The Hidden Goldmine
Here’s where things get interesting. While volume growth disappointed at just 1.0%, component-adjusted production surged by 2.7%. That’s not just good news – it’s a fundamental shift in measuring success in dairy.
Your cows aren’t just producing more milk solids and delivering substantially higher economic value. March butterfat prices hit $2.6242 per pound, with protein at $2.4606. Those aren’t just numbers – they’re profit opportunities for farms focusing on components.
Are you still chasing volume when you should be optimizing for components? Let’s face it: the gap between volume metrics and component value is widening, and smart producers are already shifting their strategies.
What’s Driving the Numbers?
Ever wonder why adding more cows doesn’t translate to proportional milk increases? Several factors are at play here. HPAI’s lingering effects are dragging down productivity in recovering herds. Meanwhile, tight replacement heifer supplies and sky-high costs force many of you to keep older, less productive cows in the herd longer than you’d like.
The result? Despite improved genetics, an aging national herd naturally produces less milk per cow. Add variable feed quality and cautious feeding strategies amid economic uncertainty, and you have a recipe for stalled productivity.
Isn’t it ironic that we’re simultaneously growing the herd while watching per-cow output struggle? This contradiction raises serious questions about future productivity if these older cows eventually leave without sufficient replacements in the pipeline.
Mixed Signals for Markets
The markets have been recovering recently, but don’t get too comfortable. This bounce has more to do with easing trade tensions than fundamental supply shifts.
Have you noticed how wildly the USDA’s forecasts have swung lately? In March, they slashed the 2025 all-milk price forecast by a whole dollar to $21.60/cwt. Then April’s reports cut it to .10/cwt while raising production forecasts! If the experts can’t decide, how are you supposed to plan?
We’re still in expansion mode, and year-over-year growth numbers should improve as the herd grows, and we lap last year’s bird flu outbreaks. But don’t miss the forest for the trees – this expansion faces significant headwinds that could limit its potential.
What This Means for Your Operation
If you’re still focusing solely on milk volume, you’re fighting yesterday’s battle. The real opportunity lies in components as the gap between volume and component-adjusted value widens. Isn’t it time to evaluate your genetic selection, nutrition programs, and management practices to enhance fat and protein production?
Biosecurity investments aren’t just expenses – they’re insurance. With HPAI showing remarkable persistence and evolving strains, robust disease protocols protect against current and future threats. Can you afford to cut corners here?
Don’t ignore the stark performance differences between states. Local market conditions, processing capacity, and disease pressure create varying operating environments. What works in Texas might sink you in Washington.
The U.S. dairy sector is expanding, but the path forward isn’t straightforward. Those who understand the complex interplay of herd demographics, component values, regional dynamics, and disease pressures will navigate this landscape more successfully than those still operating by old rules.
In today’s environment, strategic agility trumps raw production capacity every time. The future belongs to producers who can adapt to these complex, sometimes contradictory signals and position their operations accordingly. Isn’t it time you took a fresh look at your strategy?
Join over 30,000 successful dairy professionals who rely on Bullvine Daily for their competitive edge. Delivered directly to your inbox each week, our exclusive industry insights help you make smarter decisions while saving precious hours every week. Never miss critical updates on milk production trends, breakthrough technologies, and profit-boosting strategies that top producers are already implementing. Subscribe now to transform your dairy operation’s efficiency and profitability—your future success is just one click away.
Trade war turmoil slashes soybean prices—discover how dairy farmers can cut feed costs now!
EXECUTIVE SUMMARY: The April 2025 WASDE report tightened U.S. corn stocks but revealed a hidden opportunity for dairy producers as soybean meal prices dropped $10/ton amid escalating U.S.-China tariffs. While corn exports rose, soybean demand remains shackled by China’s retaliatory 125% tariffs, creating volatility that masks potential feed cost savings. USDA held South American crop estimates steady despite weather risks, but trade tensions overshadow fundamental data. Dairy operations could save thousands annually by locking in cheaper soybean meal—if they act before Brazil’s harvest or tariff shifts upend markets.
KEY TAKEAWAYS:
Corn stocks drop 75M bushels as exports offset weak feed demand, stabilizing prices at $4.35/bu.
Soybean meal prices fall to $300/ton despite higher U.S. crush volume—a $7,500 annual saving for 500-cow herds.
China’s 125% tariffs on U.S. goods risk soybean market collapse but offer dairy farms rare feed cost relief.
South America’s crop stability (169M tons Brazil soybeans) hinges on recent rains compensating for early drought.
Act now: Lock in SBM contracts, optimize rations, and monitor trade talks to capitalize on short-term price dips.
The April 2025 WASDE report just dropped, and buried in all those government numbers is a potential profit bomb for your dairy operation. While corn stocks tightened more than the market gurus expected and this trade war with China has hit fever pitch, there’s good news hiding in plain sight – soybean meal prices are heading down, creating a real opportunity to slash your feed costs. This seemingly dull USDA report contains signals that could make or break your bottom line in the months ahead.
Despite this tightening, USDA kept the average farm price at $4.35 per bushel. While supplies shrink, that price stability suggests there’s still enough corn to go around, even with the shifts in who’s buying it.
Category
Previous Estimate
Current Estimate (2024-25)
Change
Production
14.87 billion bu
14.87 billion bu
0
Feed & Residual Use
5.225 billion bu
5.200 billion bu
-25 million bu
Exports
2.100 billion bu
2.200 billion bu
+100 million bu
Ending Stocks
1.540 billion bu
1.465 billion bu
-75 million bu
Season-Avg Price
$4.35/bu
$4.35/bu
0
Soybean Meal: The Hidden Opportunity
Here’s where dairy folks need to pay attention – USDA just knocked $10 per ton off the projected soybean meal price, now forecasting $300 per ton. This price cut comes even as they project more beans to crushers (up to 10 million bushels), which means more meal production (57.3 million tons).
Let’s put that in real terms for your operation: If you’re running 500 cows and using about 1.5 tons of soybean meal per cow yearly, this price drop means $7,500 straight to your bottom line. That’s not chump change when milk prices are squeezing margins.
Category
Previous Estimate
Current Estimate (2024-25)
Change
Soybean Production
4.37 billion bu
4.37 billion bu
0
Crush Volume
2.300 billion bu
2.310 billion bu
+10 million bu
SBM Production
57.2 million tons
57.3 million tons
+0.1 million tons
SBM Ending Stocks
450,000 tons
450,000 tons
0
SBM Price
$310/ton
$300/ton
-$10/ton
Trade War Explodes: What It Means for Your Feed Costs
Unprecedented Tariff Escalation
The backdrop to all this is the trade war that’s gone nuclear. Today (April 11, 2025), China jacked up tariffs on American imports from 84% to 125%. This comes after Trump cranked U.S. tariffs on Chinese goods to 145%. It’s a full-blown economic shootout.
Soybean Market in Turmoil
The American Soybean Association says U.S. soybean growers could lose $5.9 billion annually from these tariffs. Despite this mess, China is expected to import about 3 million tons of U.S. soybeans from April to May.
According to Reuters, over 30 shipments (about 2 million tons) are heading to China in the coming weeks and will get hit with the initial 10% tariff. Another 15 vessels carrying about 800,000 tons are expected to be hammered after May 13, and a 44% tariff will be applied.
South American Production: The Other Wild Card
Weather Recovery in Brazil and Argentina
The April WASDE kept corn and soybean production estimates steady for Argentina and Brazil. USDA says “recent rains have eased concerns” about the dry weather that hit early in the growing season.
Brazil’s soybean production stays at 169 million metric tons, while Argentina’s is at 49 million metric tons. These numbers look stable on paper, but there’s still plenty of uncertainty about whether those recent rains were enough to compensate for the early-season drought stress.
Country
Crop
USDA Estimate (million metric tons)
Key Risk Factor
Brazil
Soybeans
169.0
Delayed rainfall recovery
Brazil
Corn
126.0
Safrinha crop vulnerability
Argentina
Soybeans
49.0
Persistent soil moisture deficits
Argentina
Corn
50.0
Late-season frost potential
Dairy Producer Action Plan: Capitalize Now
Feed Cost Management Strategies
Lock in Soybean Meal Needs Now: With SBM prices dropping, it’s time to secure some of your protein needs. If you’re running 500 cows, locking in even 40% of your annual needs at today’s prices could save you $3,000+ compared to last year.
Get Your Nutritionist on the Phone: The price relationship between corn (holding steady) and soybean meal (dropping) means it’s time to revisit your rations. Have your nutritionist run the numbers on tweaking your protein sources and energy-to-protein ratios based on these new prices.
Tighten Up Your Feeding Program: Remember, for every percentage-point increase in NDF digestibility, your cows produce about half a pound more milk daily. Now’s the time to focus on feed efficiency – test your forages regularly, watch those refusals, and ensure your grouping strategy lets you target feed to different production levels.
Dairy Feed Cost Impact Table
Herd Size
Annual SBM Use (tons)
Cost Savings ($10/ton)
100 cows
150
$1,500
500 cows
750
$7,500
1,000 cows
1,500
$15,000
Assumes 1.5 tons/cow/year usage
The Dairy Market Context
Milk Price Forecasts
All this grain market drama is happening while dairy prices are shifting, too. USDA just cut the 2025 all-milk price forecast to $21.60/cwt, down a whole dollar from February’s projection and $1.01 below last year. For a 500-cow dairy pumping out 25,000 pounds per cow annually, that’s about $125,000 in lost revenue.
But here’s the silver lining – the FAO Food Price Index for March shows dairy prices running nearly 20% higher than last year while feed costs have dropped 2.6%. That’s creating a sweet spot where butter prices have jumped 3.9% even as cheese saw its first decline in nine months.
Market Outlook: What Smart Dairy Producers Are Watching
For soybeans, it’s all about the trade fight with China. Until that gets sorted out, trade tensions will keep driving soybean prices more than any supply and demand report.
Key Watchpoints for Dairy Producers
If you’re running a dairy, keep your eyes on:
Any breaking news on US-China trade talks or new tariff announcements
Weather patterns and harvest reports coming out of South America
Export sales and shipment pace for both corn and soybeans
Early signs about this year’s U.S. planting season (how many acres, early weather issues)
The Bottom Line for Dairy Producers
The April WASDE report and all this trade drama create a profit opportunity through lower feed costs. While the trade war with China has the grain markets bouncing everywhere, the resulting pressure on soybean meal prices is good news for your feed bill – if you act on it.
Combining potentially cheaper feed and stronger dairy prices (especially for butterfat) creates a chance to improve your margins through innovative feed management and focusing your breeding program on high-component cows.
Don’t wait for more “market clarity” – the smart operators are now moving to lock in these feed cost advantages. You can’t control the markets, but you can control how you respond to them. In today’s crazy environment, that means moving quickly and strategically to capture feed cost savings while others are distracted by trade war headlines.
Join over 30,000 successful dairy professionals who rely on Bullvine Daily for their competitive edge. Delivered directly to your inbox each week, our exclusive industry insights help you make smarter decisions while saving precious hours every week. Never miss critical updates on milk production trends, breakthrough technologies, and profit-boosting strategies that top producers are already implementing. Subscribe now to transform your dairy operation’s efficiency and profitability—your future success is just one click away.
USDA warns of 2025 dairy profit meltdown: Milk prices crash $1.95/cwt in 4 months. Discover survival tactics for the coming storm.
EXECUTIVE SUMMARY: The April 2025 WASDE report reveals a perfect storm for U.S. dairy: Milk production surges 0.7B lbs as cow herds expand and yields rise, while retaliatory tariffs (China’s 84% duty) crush exports. Prices collapse across commodities – butter (-7¢), cheese (-2¢), NDM (-3.5¢) – with the all-milk forecast plummeting $1.95/cwt since January. Feed costs squeeze margins as EU production declines to create export opportunities. The article outlines five survival strategies to navigate supply-driven crises, including aggressive herd culling and strategic hedging strategies.
KEY TAKEAWAYS:
Production tsunami: 226.9B lbs forecast (+0.7B from March) from expanding herds and higher yields
Price freefall: All-milk price collapses $1.95/cwt since Jan 2025 – fastest decline since 2018 trade wars
Global disconnect: U.S. herds grow 1.2% as EU production drops 1.2B lbs from regulations/disease
Action required: Immediate herd culling, feed contracts, and export market pivots critical for survival
The April 2025 WASDE report has blown the lid off what’s happening in the U.S. dairy market – and it’s not pretty for producers. Just released yesterday, April 10th, the report reveals a perfect storm of expanding milk production, plummeting prices, and trade policy chaos that threatens stability. The milk primarily price forecast has been $1.95 per cwt in just four months, creating the steepest price erosion since the 2018 trade war meltdown.
“We’re culling 20% of our herd—this report confirms our worst fears,” says Wisconsin dairy manager Carl Mueller. “When forecasts drop $2 in just four months, you know we’re facing a serious market correction.”
Supply Explosion: The Numbers Behind the Crash
The USDA has dramatically reversed course on milk production expectations. After forecasting reduced supplies in March, they’ve now jacked up the 2025 project to 226.9 billion pounds – a massive 0.7-billion-pound increase from last month’s estimate of 226.2 billion pounds. A dangerous combination of factors is driving this supply surge. Despite clear warning signs of market weakness, producers are inexplicably adding cows to their operations. The USDA specifically cites “larger cow inventories,” citing explicitly the increase in production.
“Some large-scale operators argue expansion hedges against feed cost volatility—but this is ‘2022 thinking’ in today’s market,” explains Idaho co-op CEO Marissa Lopez. “We’re renegotiating feed contracts today based on this report.”
Productivity Surge at the Worst Possible Time Adding fuel to the fire, the USDA now projects “slightly higher milk per cow” yields. This marks a complete reversal from March’s forecast, which had anticipated lower output per cow. Combining more cows AND more milk per cow creates the textbook definition of a market-crushing supply tsunami.
Production Forecast Evolution: The $1.95 Freefall
Month
All-Milk Price Forecast
Change
January 2025
$23.05 per cwt
Initial forecast
February 2025
$22.60 per cwt
-$0.45
March 2025
$21.60 per cwt
-$1.00
April 2025
$21.10 per cwt
-$0.50
Calculate Your Exposure: For every 1M lb surplus = 3.2¢/lb butter price drop. For a 500-cow herd? Expect a $16,000 quarterly hit.
This represents a crushing $1.95 per cwt decline in just four months – translating to a $243,750 annual income loss for a 500-cow dairy producing 25,000 pounds per cow. The rapid deterioration from January’s optimistic “better milk prices and reduced supplies” to April’s grim reality of increased production and lower prices shows how quickly market expectations can implode.
Import Restrictions: Double-Edged Sword Imports of dairy products into the U.S. are projected lower on both fat and skim-solids basis due to “additional duties placed on imported dairy products,” with impact on “imports of butter fats and milk protein products.” While this might seem like good news by reducing competition, it’s also driving up input costs for U.S. food manufacturers who rely on specific imported dairy components.
Export Whiplash: While butter shipments surge 145%, whey faces a China-sized wall with 84% tariffs. This divergent export performance creates winners and losers across the dairy complex.
EU vs. U.S. 2025 Milk Outlook
Metric
The U.S.
EU
Production
▲ 0.7B lbs
▼ 1.2B lbs
Herd Size
▲ 1.2%
▼ 3.8%
Tariff Impact
84% (China)
20% (U.S.)
China’s 84% Tariff Bomb As of March 10th, China implemented retaliatory tariffs on U.S. farm products, which escalated to 84% yesterday, April 10th. This trade policy sledgehammer will particularly crush whey exports, which have traditionally been a significant U.S. export to the Chinese market. Yet remarkably, CME spot markets surged yesterday despite this bearish news, with cheddar blocks jumping 3.25¢ to $1.7400/lb and butter gaining 2.00¢ to $2.3325/lb.
Price Collapse: The Numbers Don’t Lie
The April WASDE report slashed price forecasts, with the steepest cuts hitting butter and NDM. Here’s the brutal reality:
Commodity Price Bloodbath
Butter: Hammered down 7¢ to $2.445/lb (-2.8%)
Cheese: Slashed to $1.790/lb (-1.1%)
Nonfat Dry Milk: Crushed to $1.220/lb (-2.8%)
Whey: Dropped to $0.510/lb (-2.9%)
These aren’t minor adjustments – they’re market-crushing reductions that will squeeze producer margins to the breaking point. The butter price collapse is particularly shocking given the projected increase in butter exports, showing how the domestic supply tsunami is overwhelming even positive export trends.
Milk Check Massacre
Class III: Slashed to $17.60/cwt (-1.9%)
Class IV: Crushed to $18.20/cwt (-3.2%)
All-Milk Price: Hammered down to $21.10/cwt (-2.3%)
The Class IV price is getting hit harder than Class III, reflecting the steeper declines in butter and NDM compared to cheese and whey. This creates a geographic disadvantage for producers in regions heavily weighted toward Class IV utilization.
Profitability Vise: Feed Costs Tighten the Squeeze
While milk prices plummet, feed costs are creating additional margin pressure. Recent CME trading shows May Corn settling at $4.8250/bushel and May Soybean Meal at $297.60/ton. The milk-feed ratio sat at 2.10 in February, well below the five-year average of 2.45 and the 2.25 needed for a 5% profit margin.
“Feed costs up 8%. Milk checks down 2.3%. The profitability vise tightens as 62% of operations now face negative cash flow,” warns Pennsylvania nutritionist Dr. Sarah Williams.
Expanded based on January’s optimistic price forecasts
Lack of effective risk management strategies
Operate with feed efficiency below industry benchmarks
Have high debt-to-asset ratios
Global Market Disconnect: EU Production Decline Creates Opportunity
While U.S. milk production is forecast to increase, the European Union faces a different trajectory. EU milk production in 2025 is projected to decline due to:
Europe’s Regulatory Noose Tightens
Dropping cow numbers
Tight dairy farmer margins
Environmental regulations
Disease outbreaks among major producers
Southern Hemisphere Production Gambits Despite production limitations, cheese remains the primary output goal of the EU dairy processing industry, supported by solid domestic consumption and continued export demand.
The divergence between expanding U.S. production and contracting EU output creates potential export opportunities for U.S. producers, particularly in butter markets where U.S. prices are increasingly competitive globally.
5 SURVIVAL TACTICS FOR DAIRY PRODUCERS
The April WASDE report paints a challenging picture, but strategic producers can still navigate these turbulent waters. Here are five battle-tested approaches to protect your operation:
Lock Feed Contracts Before June Futures Spike With May corn already at $4.8250/bushel, secure at least 50% of your Q2 corn needs at current levels. Historical patterns show summer weather concerns typically drive a 5-8% price increase by mid-June.
Dump Low-Genomic Stock Immediately With cow numbers expanding nationally despite price signals, cull the bottom 10% of your herd based on genetic merit and production efficiency. This improves your herd average and reduces your exposure to the price downturn.
Exploit Tariff Loopholes in Butter Exports While China’s 84% tariff grabs headlines, butter exports remain bright. Connect with export-focused processors to capture premiums available in markets still open to U.S. dairy products.
Pre-book Processing Capacity for Q3 Glut With production increasing nationally, processing capacity will tighten. Secure commitments from your processor now to avoid getting shut out during peak production periods.
Hedge 50% of Production via CME Options: The disconnect between spot market strength and bearish fundamentals creates a perfect hedging opportunity. Consider a split strategy: 40% six-month contracts, 30% three-month contracts, and 30% cash market exposure.
Futures trading involves risk—consult licensed advisors before hedging.
The Bottom Line
The April 2025 WASDE report reveals a fundamental shift in U.S. dairy market dynamics toward a supply-driven price collapse. The substantial downward revision in price forecasts across all major dairy commodities signals a challenging environment ahead for producers.
While reduced imports due to tariffs might provide some buffer against global supplies, the overall increase in domestic production appears to be the dominant factor driving prices lower. Export markets offer varied opportunities, with butter emerging as a relative bright spot against ongoing challenges for skim milk powders and whey.
This dramatic shift from January’s optimistic outlook to April’s grim reality highlights the dairy industry’s vulnerability to rapid market adjustments. The producers who will survive this downturn act decisively now to cut costs, improve efficiency, and implement sophisticated risk management strategies.
The question isn’t whether your operation will feel the impact of this market shift – it’s whether you’ll be among the survivors who emerge stronger when prices eventually recover.
Join over 30,000 successful dairy professionals who rely on Bullvine Daily for their competitive edge. Delivered directly to your inbox each week, our exclusive industry insights help you make smarter decisions while saving precious hours every week. Never miss critical updates on milk production trends, breakthrough technologies, and profit-boosting strategies that top producers are already implementing. Subscribe now to transform your dairy operation’s efficiency and profitability—your future success is just one click away.
Butterfat booms as cheese falters! USDA data reveals component gold rush amid powder glut and herd consolidation. Can your dairy survive 2025’s chaos?
EXECUTIVE SUMMARY: The February 2025 USDA Dairy Products Report reveals a market at odds with itself: butter production surged 2.6% YoY while cheese fell 2.2%, signaling a decisive shift toward component-driven profitability. Skyrocketing NFDM inventories (+57% YoY) threaten skim milk values, while dry whey’s unexpected domestic demand offers limited relief. Structural pressures intensify as mega-dairies (1,000+ cows) now control 66% of U.S. milk sales.
KEY TAKEAWAYS:
Component warfare pays: Butterfat-focused operations gain 6.3% price advantage as processors redirect milk components
Consolidation accelerates: 82K new cows added since June 2024, with large herds dominating 2/3 of market share
Survival playbook: Lock feed costs, hedge 40-60% of Q2 milk, and adopt Texas’ 4.5% BF nutrition strategies
Biosecurity imperative: 40% of HPAI-hit herds recover only with strict protocols as new variants spread
The February 2025 USDA Dairy Products Report presents a complex picture for dairy farmers, with production statistics showing mixed trends that directly impact farm profitability, future planning, and market strategy. Let’s dive into what these numbers really mean for your operation and how to position yourself for success.
February 2025 Key Metrics Summary
Product
Production
YoY Δ
Stocks
YoY Stock Δ
Cheese
1,115M lbs
-2.2%
N/A
N/A
Butter
203M lbs
+2.6%
N/A
N/A
NFDM
147M lbs
-0.3%
329M lbs
+57%
Dry Whey
60M lbs
-16.7%
62.7M lbs
-13.9%
The Butterfat Bonanza: Why Cheese’s Loss is Your Milk Check’s Gain
Why should you care? Because the market is sending a clear signal: butterfat is king. The report notes that “weaker cheese, ice cream and sour cream production freed up some fat for butter,” showing how processors are actively reallocating components to their highest-value use. For your operation, this means:
Component pricing will continue to favor high butterfat production
The Jersey and crossbreeding strategies gaining popularity in Texas mega-dairies are paying off
Your nutrition program should prioritize fat-boosting additives NOW
Historical Component Growth vs Milk Volume
Metric (Annual Growth)
2016-2024 Avg
2025 Forecast
Milk Production
0.9%
0.5%
Butterfat Production
2.2%
2.3%
Protein Production
1.5%
1.5%
Powder Glut: Is Your Protein Check About to Crash?
The powder segment presents alarming inventory dynamics that could hit your milk check hard. NFDM stocks held by manufacturers hit 329 million pounds, a staggering 57% increase from February 2024. This massive inventory buildup, combined with “weak exports,” signals serious downward pressure on skim milk values.
Dry whey production surprised analysts by coming in 9 million pounds under forecast and down 16.7% year-over-year. However, whey stocks were lower than expected, suggesting “domestic buyers stepped up as prices were coming down”.
Think the export market will save us? Think again. With Canada’s tariff pause expiring March 4 and Mexico threatening to target $1.13 billion in cheese imports, international markets look increasingly unstable. Smart producers are already pivoting toward Southeast Asian markets, where demand has grown 9% despite global challenges.
Herd Math: Can Small Farms Survive the 1,000+ Cow Takeover?
The dairy industry faces significant structural challenges. Large operations with 1,000+ cows now account for 66% of all US milk sales, up from 57% in 2017. Meanwhile, the national dairy herd continues expanding, with producers adding another 15,000 head in February, bringing total recovery to 82,000 head since June 2024.
For smaller and mid-sized producers, these trends create an urgent need to:
Find differentiated markets or premium opportunities
Consider cooperative structures that strengthen producer position
Evaluate whether expansion is viable against market realities
Ontario Dairy Efficiency Comparison (1966 vs 2024)
Metric
1966
2024
Change
Farms
40,420
3,187
-92.1%
Cows/Farm
22
100
+354%
Milk/Cow (liters)
3,415
9,946
+191%
Total Production (B L)
3.08
3.18
+3.2%
Component Warfare: Your Farm’s Survival Strategy
With the USDA’s 2025 dairy forecast showing the all-milk price revised upward to $22.75 per cwt despite production challenges, the message is clear: farms focusing on butterfat and protein components will capture premium returns. This aligns with the February production report’s emphasis on strong component production despite lower-than-expected finished product volume.
Forget “average” milk—your farm’s future depends on butterfat warfare. Here’s the 3-supplement stack Texas mega-dairies use to crush 4.5% BF tests:
Strategic rumen-protected fat supplementation
Precision forage management focusing on digestible fiber
Component-targeted genetics selection
USDA 2025 Milk Production Forecast
Metric
2024 Actual
2025 Forecast
Change
All-Milk Price ($/cwt)
$22.40
$22.75
+1.6%
Milk Production (B lbs)
225.6
226.9
+0.5%
Dairy Herd Size (M head)
9.347
9.369
+0.4%
Butterfat Growth Rate
2.1%
2.3%
+0.2 pts
Protein Growth Rate
1.4%
1.5%
+0.1 pts
Market Volatility and External Pressures
Recent tariff implementations have added uncertainty to an already volatile dairy market. The clock’s ticking on Canada’s tariff pause, which expires March 4—and Mexico’s threatening to nuke $1.13B in cheese buys. Got a Plan B?
The current environment features:
Downward pressure on feed prices, potentially improving margins (down 10.1% to $62.4 billion in 2025)
Labor costs surging upward by 3.6% to a record $53.5 billion
Butter prices at their lowest since 2023
Production “running strong” on the supply side
HPAI Crisis: Is Your Biosecurity Ready?
California’s HPAI crisis has slashed the state’s production by 5.7%, far worse than the forecasted 3.0% drop. With 747 herds affected and two variants (B3.13 and D1.1) circulating, biosecurity isn’t optional—it’s survival. The good news? About 40% of affected herds recover within 60 days, but only with proper protocols in place.
Strategic Action Plan for 2025
With China’s demand collapsing (-7% imports) and Argentina’s production surging (+5.6%), now is the time to:
Lock in feed costs while grain markets remain favorable
Hedge 40-60% of Q2 milk via futures to protect against spring flush price drops
Slash labor costs through strategic automation—robotic milking systems are showing 3-year ROI in high-wage regions
Diversify export relationships beyond traditional markets—Vietnam’s dairy imports just spiked 22%
The Bottom Line: Adapt or Perish
The February 2025 USDA Dairy Products Report provides dairy farmers with valuable data for operational decision-making in an increasingly complex market. The divergence between strong component production and lower-than-expected product volumes sends mixed signals about market strength. However, the continued premium for components, particularly butterfat, suggests farmers should maintain focus on component optimization.
External factors including tariffs, industry consolidation, and consumer demands for sustainability create additional challenges. In this environment, successful dairy farmers will need to balance component-focused production strategies with cost management, market awareness, and operational flexibility.
The clock’s ticking: Will you ride the butterfat wave or drown in the whey glut? The producers who adapt fastest to these market signals will be the ones still standing when the dust settles.
Join over 30,000 successful dairy professionals who rely on Bullvine Daily for their competitive edge. Delivered directly to your inbox each week, our exclusive industry insights help you make smarter decisions while saving precious hours every week. Never miss critical updates on milk production trends, breakthrough technologies, and profit-boosting strategies that top producers are already implementing. Subscribe now to transform your dairy operation’s efficiency and profitability—your future success is just one click away.
US milk surges 1.0% YoY as herds expand by 82,000 head since June! Component-adjusted output is up a massive 3.5% while California struggles with HPAI recovery.
Executive Summary:
The February 2025 US milk production report reveals more substantial than anticipated growth of 1.0% year-over-year (after leap year adjustments), significantly exceeding analyst expectations of 0.6% and indicating robust supply as the industry enters peak season. When factoring in milk components, the adjusted production increase reaches an impressive 3.5% year-over-year—the most vigorous growth since mid-2021—highlighting substantial improvements in valuable milk solids content. The national dairy herd continues to expand, with producers adding another 15,000 head in February, bringing total recovery to 82,000 head since June 2024, while regional disparities show California struggling with avian flu impacts (-3.7%) as the rest of the country demonstrates robust growth (+2.0%). This production surge amid weakening demand creates potential price pressure heading into spring flush, suggesting producers may need to emphasize component optimization and risk management strategies to navigate a challenging price environment in the coming months.
Key Takeaways:
National milk production grew 1.0% YoY in February (leap-year adjusted), but the component-adjusted increase of 3.5% reveals producers are strategically maximizing valuable milk solids.
Herd expansion continues, with 15,000 heads added in February. The herd has recovered 82,000 heads since June 2024, indicating producer confidence despite market challenges.
Regional disparities remain significant—California’s avian flu recovery lags expectations (-3.7% vs. forecasted -3.0%) while other states show strong growth (+2.0% vs. forecasted +1.4%).
Expanding production and stagnant demand could create downward price pressure, potentially similar to May 2023, when Class III prices fell sharply by $2.41.
Producers should consider risk management strategies similar to those used in early 2023 when DMC payments became crucial for enrolled operations as margins tightened.
The February 2025 U.S. Milk Production Report reveals stronger than anticipated growth, with production increasing 1.0% year-over-year after adjusting for the leap year. This exceeded analyst expectations of 0.6% growth and suggests robust supply as the industry enters peak production season. After adjusting for components, production showed an impressive 3.5% year-over-year increase, marking the most substantial growth since mid-2021. Meanwhile, the national dairy herd continues its expansion trajectory, with significant regional variations in production patterns.
National Production Overview and Herd Dynamics
February 2025 milk production exceeded expectations with a 1.0% year-over-year increase after leap year adjustments, significantly surpassing the forecasted 0.6%. The January 2025 production figures received an upward revision from an initial report of 0.1% growth to 0.5% growth, accompanied by a substantial adjustment in the January herd size numbers, which increased by 25,000 head.
The national dairy herd continued its expansion in February, with producers adding another 15,000 head during the month. This brings the total herd recovery to 82,000 heads since June 2024, demonstrating a significant rebuilding period after previous contractions. This expansion pattern resembles trends in early 2023, when the February Milk Production report showed an increase of 0.8%, with cow numbers up 37,000 from the previous year and 12,000 head from the last month.
Production per cow in February 2025 aligned with forecasts, indicating that increased total production stems primarily from larger herd size rather than productivity gains. This represents a shift from historical patterns where productivity improvements often contributed more significantly to production growth. When factoring in the component composition of milk, the adjusted production increase of 3.5% highlights significant improvements in milk solids content.
Regional Production Disparities
The February data reveals substantial regional variations in milk production patterns nationwide. California continues to recover from avian flu impacts but at a slower pace than anticipated, showing a 3.7% decrease compared to February 2024. This decline exceeded the forecasted 3.0% decrease, suggesting extended recovery challenges for the nation’s largest milk-producing state.
In contrast, the rest of the country demonstrated robust growth, with production up 2.0% compared to the forecasted 1.4%. This strong performance outside California effectively counterbalanced the Golden State’s slower recovery, resulting in an overall 1.0% national increase.
Historical data from March 2023 shows that regional production patterns often vary significantly, with states like Texas (+4.7%), Idaho (+3.1%), New York (+2.1%), and Michigan (+2.9%) showing strong growth while Wisconsin experienced more modest increases (+0.4%). This regional diversification has become increasingly important to national production stability, particularly when central-producing states face challenges.
Top States Production Trends
Looking at the historical context helps understand current regional patterns. In early 2023, the top six dairy states (Wisconsin, Texas, Idaho, New York, California, and Michigan) accounted for 52% of total U.S. production. Texas and Idaho led growth rates then, with Texas adding 22,000 cows and Idaho adding 15,000 cows between February 2022 and February 2023.
The 2025 regional distribution reflects the continuation of these trends and new developments, with California’s avian flu situation creating a significant divergence from historical patterns. If California’s recovery accelerates to -0.5% growth by April while the rest of the country maintains approximately 1.9% growth, national headline production could get 1.4% year-over-year growth before component adjustments.
Component Analysis and Production Value
A particularly noteworthy aspect of the February 2025 report is the significant difference between the headline production increase (1.0%) and the component-adjusted increase (3.5%). This 2.5 percentage point differential indicates substantial improvements in milk composition, reflecting higher concentrations of valuable milk solids like protein and butterfat.
Historically, component prices have significantly impacted producer returns. In early 2023, the protein was valued at around $2.40 per pound, butterfat at approximately $2.73 per pound, and other solids at about $0.23 per pound. The current component-rich production likely reflects producer adaptations to pricing structures that reward milk composition rather than just volume.
This shift toward component-focused production represents a strategic response by dairy producers to maximize returns in challenging market conditions. The significant increase in component-adjusted production suggests that even if fluid volume growth moderates, milk solids entering the market could continue increasing substantially, with implications for manufacturing capacity and product mix.
Market Implications and Pricing Outlook
The strong production growth indicated in the February report enters a market characterized by stagnant to weakening demand, potentially creating price pressure as we move deeper into the spring flush season. While the report is likely already priced into current markets, continued strong growth through spring could create additional downward price pressure if production outpaces demand.
Historical patterns provide context for potential market impacts. In May 2023, the Class III price fell sharply by $2.41 from April, reaching $16.11, $9.10 lower than the previous year’s record high. Similar price pressures could emerge if the current production trends continue without corresponding demand growth.
Risk Management Considerations
When margins tightened in early 2023, Dairy Margin Coverage (DMC) payments became significant for enrolled producers. In April 2023, producers enrolled at the $9.50 coverage level received indemnity payments of $3.66/cwt, equating to $2,735.38 for each million pounds after sequestration. For March 2023, producers with the same coverage realized payments of $2,551.48 per million pounds enrolled.
The current production environment, with strong growth amid potentially weaker demand, could create similar margin challenges for producers in 2025, making risk management strategies increasingly vital as the year progresses.
Production Outlook and Seasonal Expectations
The industry appears positioned for continued strong growth through the spring months. If California improves to a -0.5% growth rate by April while the rest of the country maintains approximately 1.9% growth, national production could reach 1.4% year-over-year growth before component adjustments.
The report suggests that producers are overcoming previously limited growth issues, potentially setting the stage for even more substantial production numbers during the peak spring flush. This timing raises concerns about market balance, as increased production typically coincides with seasonal demand patterns that may not absorb the additional supply without price concessions.
Conclusion
The February 2025 U.S. Milk Production Report reveals more substantial than expected growth in milk production, with significant increases in herd size and component-adjusted output. The 1.0% year-over-year increase in headline production and the remarkable 3.5% increase in component-adjusted output suggest robust supply conditions as the industry enters the spring flush period.
Regional disparities remain significant, with California’s slower recovery from avian flu dampening overall growth while the rest demonstrates substantial production increases. The continued expansion of the national dairy herd, which has recovered 82,000 head since June 2024, indicates producer confidence despite potential market challenges ahead.
As production is projected to remain strong through spring 2025, the industry may face downward price pressure if demand does not increase. Producers may need to focus on efficiency, component optimization, and risk management strategies to navigate what could be a challenging price environment in the coming months.
Join over 30,000 successful dairy professionals who rely on Bullvine Daily for their competitive edge. Delivered directly to your inbox each week, our exclusive industry insights help you make smarter decisions while saving precious hours every week. Never miss critical updates on milk production trends, breakthrough technologies, and profit-boosting strategies that top producers are already implementing. Subscribe now to transform your dairy operation’s efficiency and profitability—your future success is just one click away.
USDA claims more cows but less milk in latest forecast bombshell, slashing milk price to $21.60. Is Washington playing games with your dairy business?
EXECUTIVE SUMMARY: The USDA’s March WASDE report has reduced the 2025 all-milk price forecast by a full dollar to $21.60 per cwt, creating significant financial implications for dairy operations nationwide while raising serious questions about forecasting methodology. The report contains a puzzling contradiction—predicting higher cow numbers but lower productivity per cow—leading industry experts from the National Milk Producers Federation and CoBank to question the underlying assumptions. With cheese, butter, nonfat dry milk, and whey prices all facing downward revisions, producers now confront a challenging economic environment requiring immediate strategic responses. The upcoming April 10th WASDE report will prove critical in determining whether these reduced projections represent a new baseline or if further adjustments are forthcoming. Successful producers will need to implement targeted component optimization strategies based on their specific milk utilization patterns while closely monitoring market signals beyond government forecasts.
KEY TAKEAWAYS
USDA has cut the 2025 all-milk price forecast to $21.60 per cwt, down $1.00 from February, with reductions across cheese, butter, nonfat dry milk, and whey prices.
The contradiction between expanded cow numbers and lower productivity per cow raises significant questions about USDA’s forecasting methodology and reliability.
Different operation types require specific strategies: smaller farms should focus on feed efficiency and component optimization, while larger operations should leverage economies of scale and advanced analytics.
Component optimization is increasingly crucial, with butterfat focus recommended for Class IV utilization and protein enhancement for Class III utilization.
Mark April 10th at 12:00 PM ET on your calendar for the next WASDE report, which will indicate whether March’s downward adjustments represent a new baseline or a temporary shift.
The USDA delivered concerning news for dairy producers in its March 2025 World Agricultural Supply and Demand Estimates (WASDE) report released on March 11. The all-milk price forecast for 2025 has been slashed by a whole dollar to $21.60 per hundredweight (cwt), signaling potentially tighter margins for dairy operations nationwide.
This substantial reduction comes alongside lowered projections for cheese, butter, nonfat dry milk, and whey prices, creating ripple effects throughout the dairy supply chain. While cow numbers are slightly higher than previously estimated, the USDA claims productivity per cow has declined enough to more than offset this increase—a contradiction raising questions about the agency’s forecasting approach.
“The all-milk price forecast for 2025 has been slashed by a full dollar to $21.60 per cwt, creating tangible economic consequences for dairy operations nationwide.”
Production Puzzle: More Cows but Less Milk?
According to the March WASDE report, the 2025 milk production forecast now stands at 226.2 billion pounds, representing a substantial 700 million-pound reduction from February’s estimate. The USDA explicitly attributes this significant adjustment to “lower expected milk output per cow more than offsetting slightly higher cow inventories.”
This creates a puzzling situation where producers are maintaining or slightly expanding herd sizes—investing capital based partly on earlier projections—only to be told expected returns will be lower than previously forecast. Why would milk per cow suddenly decline when producers invest in genetic improvements and management strategies designed to increase efficiency?
March 2025 forecast (Down 700 million from February)
For context, the 2024 production estimate remains unchanged at 225.9 billion pounds, which would be 400 million pounds less than the 2023 total of 226.3 billion pounds. Despite the reduction in the 2025 forecast, production is projected to increase slightly from 2024.
However, the substantial downward revision raises essential questions about the reliability of these projections for farm planning purposes.
The production forecast reduction will likely create tighter supply conditions than anticipated, particularly for processors dependent on specific volumes to fulfill commitments. This adjustment represents approximately 0.3% of expected annual production—enough to potentially alter market dynamics and pricing structures throughout the supply chain.
Your 2025 Milk Check: Lower Prices Across All Classes
The price forecasts in the March WASDE report directly impact dairy farm profitability. The all-milk price is now projected at just $21.60 per hundredweight (cwt), a dollar below February’s estimate.
For perspective, the 2024 all-milk price estimate stands at $22.61 per cwt according to the USDA’s latest figures—meaning 2025 is now projected to deliver lower returns than the current year. Is this the beginning of a longer downward trend or a temporary adjustment?
Category
February 2025
March 2025
Change
All-Milk (per cwt)
$22.60
$21.60
-$1.00
Class III (per cwt)
N/A
$17.95
N/A
Class IV (per cwt)
N/A
$18.80
N/A
“USDA has lowered cheese, butter, nonfat dry milk, and whey price forecasts based on recent market trends, with direct implications for Class III and Class IV milk values.”
The Class III price has been reduced to $17.95 per hundredweight, down from the 2024 estimate of $18.89. The Class IV price is now expected to average just $18.80, compared to the 2024 estimate of $20.75. These aren’t minor adjustments—they represent substantial reductions directly impacting producer revenues.
Dr. Peter Vitaliano, Chief Economist at the National Milk Producers Federation, has expressed concern about the continuous forecast adjustments: “These significant downward revisions create planning challenges for dairy producers who rely on consistent projections for business decisions. The contradiction between expanding cow numbers and reduced productivity expectations raises questions about underlying methodological assumptions.”
The USDA attributes these price reductions to “recent prices” for cheese, butter, nonfat dry milk, and whey—all of which have been lowered in the forecast. However, the report provides minimal explanation for why these commodity prices have weakened significantly in recent weeks, leaving producers to speculate about underlying market dynamics.
Michael Johnson, Vice President of Supply Chain at Great Lakes Dairy Processing, notes: “These forecast changes create significant planning challenges for processors as well. We base capacity planning and inventory decisions on USDA projections, so frequent revisions force us to readjust our operations constantly. The mixed signals about production volume and component values make it exceptionally difficult to optimize our product mix.”
WASDE 101: Why These Reports Matter To Your Bottom Line
For dairy producers who may be new to government reporting, the World Agricultural Supply and Demand Estimates (WASDE) are released monthly by the World Agricultural Outlook Board (WAOB). These reports provide annual forecasts for agricultural commodities, including U.S. supply and use of milk and dairy products.
The reports are developed by Interagency Commodity Estimates Committees (ICECs), which include analysts from multiple USDA agencies who compile and interpret information from domestic and foreign sources. This makes WASDE reports particularly influential in markets and pricing decisions throughout the supply chain.
When a WASDE report adjusts price projections, as the March report has done for dairy, these changes often influence processor behavior, futures markets, and, ultimately, the prices farmers receive. The hundredweight (cwt) measure—equal to 100 pounds of milk—is the standard pricing unit, making the $1 reduction in the all-milk price equivalent to a penny per pound reduction in expected milk value.
What’s Really Behind the Numbers?
The March WASDE report raises fundamental questions about how USDA forecasts are developed and what factors drive their frequent revisions. While official explanations focus on productivity adjustments, several market analysts suggest other factors may be at play.
Tanner Ehmke, lead economist at CoBank’s Knowledge Exchange division, notes a pattern in government forecasting: “We often see a tendency toward optimism in early forecasts that gets tempered by market realities as the year progresses. The key question is whether these adjustments reflect genuine changes in market dynamics or simply correcting initially overstated projections.”
Particularly striking is the timing of these downward revisions, coming amid heightened concerns about agricultural sector profitability in general. Are these forecast changes connected to broader economic policy considerations beyond dairy-specific factors? The USDA provides little transparency into the specific data points driving each month’s adjustments.
Sarah Williams, dairy futures analyst at Central States Commodities, observes: “The futures markets have reacted strongly to this forecast revision. We’re seeing significant repositioning in Class III and Class IV contracts, with traders pricing for further downward revisions in the coming months. The lack of clarity around what’s driving these changes creates additional market volatility.”
Furthermore, the methodology behind per-cow productivity projections deserves scrutiny. The contradiction between expanding herd sizes and reduced output expectations suggests either a significant shift in herd demographics or potential flaws in assessing productivity trends. Either way, producers deserve a more precise explanation of these consistent downward adjustments.
Mark Your Calendar: Critical Upcoming WASDE Dates
The following WASDE report is scheduled for release on April 10, 2025, at noon ET. For dairy producers navigating these uncertain projections, this upcoming report will provide critical insights into whether March’s downward adjustments represent a new baseline or if further revisions are forthcoming.
Month
Release Date
Time
April
April 10
12:00 PM ET
May
May 12
12:00 PM ET
June
June 12
12:00 PM ET
July
July 11
12:00 PM ET
Source: USDA Office of Chief Economist, 2025
The consistent schedule of these reports—released between the 10th and 12th of each month—provides a predictable timeline for market information. Innovative producers integrate these release dates into their business planning calendars, recognizing how these projections influence short-term cash flow and longer-term investment decisions.
The March WASDE report necessitates strategic reassessment for dairy producers. With the all-milk price now projected at $21.60 per cwt—substantially below earlier expectations—profit margins face increased pressure across many operations.
This environment elevates the importance of component-focused production strategies, as price trends across dairy commodities may create opportunities for farms that can optimize butterfat and protein levels.
“With the all-milk price now projected at $21.60 per cwt, dairy producers face a critical need to reassess operational efficiency and component optimization strategies.”
The reduced price projections demand a renewed focus on operational efficiency and cost management strategies. Farms operating on slim margins based on more optimistic price forecasts must now evaluate their cost structures and identify potential efficiencies.
Strategies for Different Operation Types
Small to mid-sized operations (under 500 cows) should prioritize these actions:
Evaluate feed efficiency programs with greater urgency, as feed costs typically represent 50-70% of production expenses
Consider component optimization through strategic breeding and nutrition adjustments
Explore direct marketing or specialty product arrangements that may offer premium pricing
Large operations (500+ cows) should focus on:
Leveraging economies of scale through negotiated input pricing for volume purchases
Evaluating component premiums across multiple processor options
Implementing advanced data analytics to identify efficiency opportunities across the operation
Component Optimization in Today’s Market
With the current price structure, component optimization becomes increasingly critical. The significant gap between Class III ($17.95) and Class IV ($18.80) prices highlights the importance of understanding your milk utilization:
Focus on butterfat optimization if your milk primarily goes to Class IV utilization
For operations with predominantly Class III utilization, protein enhancement should be prioritized
Review current milk checks to understand component premium structures specific to your processor
According to dairy nutrition specialists at major land-grant universities, targeted nutrition strategies focusing on specific fatty acid profiles can enhance butterfat production by 0.1-0.3 percentage points—potentially offsetting a significant portion of the price reduction for producers effectively implementing such programs.
Tom Wilson, owner of Wilsonview Dairy in Wisconsin, has successfully navigated previous price volatility through component management: “When we saw forecast changes last year, we immediately reviewed our nutrition program with our consultant and made targeted adjustments to enhance butterfat. By focusing on rumen health and using specific feed additives, we increased components enough to offset nearly half the price reduction. You can’t control USDA forecasts but can control how you respond to them.”
Beyond The Numbers: What Every Dairy Producer Should Know
The March 2025 WASDE report represents more than just another data point—it signals potentially challenging market conditions requiring proactive management. The $1 reduction in milk price projections creates tangible economic consequences for dairy operations nationwide. This development comes as producers face rising input costs and continuing labor challenges.
What makes this forecast particularly significant is the contradiction between expanding herd sizes and reduced productivity expectations. This unusual pattern suggests fundamental changes in national herd performance or potential issues with the forecasting methodology.
As dairy producers navigate these challenging waters, staying informed about market developments becomes increasingly crucial. The April 10th WASDE report will provide the next official update, potentially confirming or adjusting the projections.
Until then, prudent producers will approach the current forecast with appropriate caution, developing contingency plans for the possibility of continued price pressure throughout 2025.
Your farm’s resilience depends on understanding these market signals and responding strategically. While government forecasts provide valuable perspectives, successful producers complement these projections with diverse information sources and flexible management approaches. Question the assumptions behind these projections, adapt your strategies accordingly, and remember that your operation’s specific efficiencies matter more than general market forecasts. What will you change in your operation based on this latest forecast?
Join over 30,000 successful dairy professionals who rely on Bullvine Daily for their competitive edge. Delivered directly to your inbox each week, our exclusive industry insights help you make smarter decisions while saving precious hours every week. Never miss critical updates on milk production trends, breakthrough technologies, and profit-boosting strategies that top producers are already implementing. Subscribe now to transform your dairy operation’s efficiency and profitability—your future success is just one click away.
USDA’s 2025 dairy forecast reveals tight milk supplies, evolving prices, and strategic opportunities. Are you ready to adapt and thrive?
Executive Summary
The USDA’s 2025 dairy forecast highlights a year of both challenges and opportunities for producers. Milk production is projected at 226.9 billion pounds, reflecting consistent downward revisions due to fewer cows and slower growth in milk per cow. Despite these constraints, the all-milk price has been revised upward to $22.75 per cwt, driven by strong demand for cheese and export opportunities for butter. However, weaker nonfat dry milk and whey markets create a mixed outlook. Farmers who prioritize component optimization, align with strategic processors, and implement cost management strategies will be best positioned to succeed. With supply tightening and market dynamics shifting, adaptability will be key to navigating the evolving landscape.
Key Takeaways
Milk Production Forecast: USDA projects 226.9 billion pounds of milk production for 2025, down 1.1 billion pounds from earlier estimates due to herd size and yield constraints.
All-Milk Price Outlook: Revised upward to $22.75 per cwt, reflecting strong demand for cheese and export competitiveness for butter.
Component Optimization: Cheese prices are strengthening; farms focusing on butterfat and protein components may capture premium returns.
Export Dynamics: U.S. butter and cheese exports are expected to grow due to competitive pricing, while dry whey and nonfat dry milk exports face challenges.
Strategic Positioning: Aligning with processors, managing costs, and staying informed on market trends will be critical for profitability in 2025.
The latest USDA forecasts signal significant shifts for dairy producers in 2025, with revised estimates pointing to tighter supplies and evolving price dynamics across dairy categories. According to the most recent data released on March 6, 2025, the all-milk price forecast has been increased to $22.75 per hundredweight (cwt), up $0.25 from the previous month’s estimate. This adjustment comes amid continued downward revisions to milk production forecasts, creating a complex market environment that demands nationwide strategic positioning from dairy operations. This comprehensive analysis breaks down the latest USDA projections, their implications for your farm, and actionable strategies to navigate the evolving dairy landscape.
Production Constraints Creating Price Support: The Numbers Behind 2025’s Tightening Supply
The USDA has consistently revised its milk production projections downward over recent months, revealing a pattern that signals potential price support for producers. The February forecast reduced milk production by 300 million pounds to 226.9 billion pounds, following a January adjustment that had already lowered projections by 800 million pounds.
This consistent pattern of downward revisions reflects compounding factors affecting dairy production capacity. The primary drivers include smaller-than-expected dairy herd size and reduced milk yield per cow. According to USDA data, while the national dairy herd was initially projected to average 9.390 million head in 2025, more recent forecasts suggest continued constraints on herd expansion.
Production per cow has also been revised downward, with the forecast reduced by 85 pounds to 24,200 pounds per cow. This adjustment reflects lower-than-expected performance in late 2024 and changing expectations about productivity gains in 2025. Interestingly, the USDA notes that “the growth in milk components will likely balance out the lower-than-average growth per cow,” suggesting a shift toward quality over quantity in production metrics.
These production constraints differ from earlier projections that anticipated more robust growth. In December 2024, USDA forecast 2025 milk production at 228 billion pounds. By January, this was reduced to 227.2 billion pounds, and February brought a further reduction to 226.9 billion pounds. This cumulative 1.1 billion-pound reduction represents a significant adjustment in expected supply.
Divergent Price Trajectories: Why Component Values Matter More Than Ever
The most recent price forecasts reveal a fascinating divergence across dairy product categories that creates both challenges and opportunities for strategically positioned producers:
Table 1: Evolution of USDA Dairy Product Price Forecasts for 2025
Dairy Product
February 2025 Forecast
January 2025 Forecast
Change
Cheese
$1.880 per pound
$1.8650 per pound
+$0.0150
Butter
$2.645 per pound
$2.6950 per pound
-$0.0500
Nonfat Dry Milk
$1.295 per pound
$1.3400 per pound
-$0.0450
Dry Whey
60.5 cents per pound
64.0 cents per pound
-3.5 cents
This divergence is particularly significant because cheese prices continue to strengthen while other product categories face downward pressure. The February forecast raised cheese prices to $1.8800 per pound, citing “recent prices and tight inventories from 2024 that are expected to carry into 2025”. This positive cheese outlook contrasts the downward revisions for butter, nonfat dry milk, and dry whey.
These product-specific price projections translate directly into milk class prices, with notable implications for producer revenues:
Table 2: USDA Milk Class Price Forecasts for 2025 ($/cwt)
Milk Class
February 2025 Forecast
January 2025 Forecast
Change
Class III
$19.10
$19.70
-$0.60
Class IV
$19.70
$20.80
-$1.10
All Milk
$22.60
$23.05
-$0.45
The most recent March 6th adjustment further revised the all-milk price forecast upward to $22.75 per cwt, up $0.25 from the previous month’s estimate. This latest adjustment suggests continued evolution in USDA’s outlook based on emerging market data.
The disparate movements between cheese prices and other dairy commodities create a market environment where component optimization becomes increasingly valuable. Farms that can align their milk component profiles with cheese manufacturing requirements may capture premium opportunities despite the broader adjustments in milk price forecasts.
Production Forecast Revisions: Understanding the Trend
Table 3: USDA Milk Production Forecast Revisions for 2025
Forecast Element
February 2025 Forecast
January 2025 Forecast
December 2024 Forecast
Total Production
226.9 billion pounds
227.2 billion pounds
228.0 billion pounds
Change from Previous
-0.3 billion pounds
-0.8 billion pounds
N/A
Cumulative Adjustment
-1.1 billion pounds
-0.8 billion pounds
N/A
The consistent pattern of downward revisions to production forecasts has significant implications for market balance. The cumulative 1.1 billion pound reduction from December to February represents approximately 0.5% of expected annual production—enough to influence price dynamics throughout 2025 potentially.
This production constraint reflects several underlying factors. The dairy herd size was initially expected to expand, but recent data suggests more limited growth potential. Meanwhile, milk per cow projections have been reduced by 85 pounds to 24,200 pounds, reflecting recent performance trends and adjusted expectations about productivity gains.
Most significantly, these production adjustments come when domestic and export demand show potential strength. This creates a more balanced market dynamic than many had initially anticipated for 2025, with supply constraints potentially offsetting any demand weakness.
Strategic Positioning for 2025’s Market Realities
With the latest USDA forecasts pointing to a complex but potentially favorable market environment, strategic positioning becomes essential for maximizing profitability in 2025. Several key approaches warrant consideration:
1. Optimize Component Production
The price divergence between cheese and other dairy products creates a clear signal for component focus. With cheese prices strengthening while other products face challenges, milk component profiles that align with cheese manufacturing requirements may generate premium returns.
The USDA notes that “growth in milk components will likely balance out the lower-than-average growth per cow,” highlighting the increasing importance of component quality relative to simple volume metrics. This suggests breeding and feeding programs focused on components rather than volume may deliver superior financial results in 2025’s market environment.
2. Align with Strategic Processors
Understanding your local processing landscape becomes increasingly valuable in a market with divergent product price trajectories. Farms supplying processors focused on cheese production may benefit from more favorable pricing than those tied to butter or powder-focused facilities.
The consistent downward revision of production forecasts suggests processors may face increasing competition for milk supplies as the year progresses. This potential milk shortage creates leverage opportunities for producers, particularly in regions with processing capacity growth.
3. Monitor Export Opportunities
The latest USDA data suggests strengthening export potential for specific dairy categories. Following the January forecast, dairy exports on a fat basis were projected higher for 2025 “based on recent trade data and higher expected shipments of butter and cheese due to the US price competitiveness.”
However, exports on a skim-solids basis were lowered “on recent trade data and less competitive US nonfat dry milk and dry whey.” This divergent export outlook reinforces the importance of understanding your operation’s exposure to different product categories and their respective export potential.
4. Implement Cost Management Strategies
The March 6th revision suggests an all-milk price of $22.75 per cwt, a moderate increase from previous estimates but still indicating challenging margins for many producers. In this environment, cost management remains essential for maintaining profitability.
The forecasted production constraints suggest that operations focusing on efficiency rather than maximum volume may achieve superior financial results. With input and operational expenses continuing to pressure margins, systematic cost analysis and management programs provide essential protection against price volatility.
5. Develop Market Intelligence Capabilities
The frequent revisions to USDA forecasts highlight the fluid nature of dairy markets and the importance of staying informed about emerging trends. Investing in market intelligence capabilities—whether through consultants, industry publications, or internal analysis—provides critical decision support for strategic planning.
Farms with superior market intelligence will make better-informed decisions about culling, expansion, contracting, and capital investment in 2025’s evolving market environment.
Conclusion: Navigating 2025’s Dairy Landscape
The latest USDA forecasts paint a picture of a dairy market in transition—facing production constraints but potentially benefiting from price support and strategic opportunities. The March 6th revision raising the all-milk price forecast to $22.75 per cwt suggests cautious optimism despite earlier adjustments.
The consistent downward revision of milk production forecasts—from 228.0 billion pounds in December to 226.9 billion pounds in February—signals persistent challenges in production growth. However, these constraints may provide price support, particularly in categories with strong demand fundamentals like cheese.
The divergent price trajectories across product categories—cheese strengthening while butter, nonfat dry milk, and dry whey face pressure—create a market environment where component optimization and product mix exposure significantly impact revenue potential. This divergence encourages strategic thinking about milk component profiles and processor relationships.
For individual dairy producers, success in 2025 will likely come from combining tactical excellence in production management with strategic positioning aligned with emerging market signals. Component optimization, processing alignment, financial flexibility, and operational adaptability represent the core competencies needed to profitably navigate this complex market landscape.
The dairy operations that thrive in 2025 will recognize these market dynamics and position themselves accordingly—focusing on efficiency rather than maximum volume, optimizing components rather than simply producing more milk, and maintaining the financial flexibility to adapt to continuing market evolution.
Join over 30,000 successful dairy professionals who rely on Bullvine Daily for their competitive edge. Delivered directly to your inbox each week, our exclusive industry insights help you make smarter decisions while saving precious hours every week. Never miss critical updates on milk production trends, breakthrough technologies, and profit-boosting strategies that top producers are already implementing. Subscribe now to transform your dairy operation’s efficiency and profitability—your future success is just one click away.
Powder inventories surged 41%, while processors accelerated production despite looming trade wars. The January dairy products report exposes alarming disconnects between market signals and manufacturing decisions, threatening processor and farm profitability as spring production increases.
EXECUTIVE SUMMARY: The January 2025 Dairy Products report reveals troubling production misalignments that demand immediate attention. NFDM production jumped 11% despite inventories already 41% above last year, while cheese and butter showed minimal growth despite increased milk supply. Italian cheese varieties (+2.2%) outperformed American types (+0.2%), suggesting shifting market preferences. Meanwhile, processors appear to redirect components toward consumer packaged goods like ice cream (+20.1%) and cream cottage cheese (+18.0%) while neglecting export-oriented products just as trade tensions escalate with Mexico. These patterns create significant price risks as spring flush approaches and raise questions about long-term strategic planning throughout the supply chain.
KEY TAKEAWAYS:
NFDM production surged 11% to 154 million pounds while inventories climbed to 299.3 million pounds, up 41% year-over-year, creating a dangerous market imbalance
Italian cheese varieties outperformed American types, with mozzarella production up 3.6% while cheddar continued its 15-month decline.
Butter production increased merely 0.5% despite high component availability, as processors shifted cream to ice cream (+20.1%) and cultured products.
Whey protein concentrate production fell 10.4% while whey protein isolate jumped 19.9%, indicating a strategic shift toward higher-value proteins.
Regional production patterns show Western processors focused heavily on NFDM (+15.2%) while Central region facilities led in cheese (+1.8%)
Steam billows from dryers running at full capacity across America’s heartland, transforming rivers of milk into mountains of powder that increasingly threaten to overwhelm warehouse capacity. The USDA’s January 2025 Dairy Products report, released yesterday, exposes troubling misalignments between processor decisions and market realities. Manufacturers appear to be doubling down on precisely the wrong products while ignoring clear warning signals from domestic and international markets.
Cheese Production Reveals Contradictory Strategies
January cheese production data unveils a strategic repositioning that demands closer scrutiny from processors and farmers. Total cheese output reached 1.21 billion pounds, inching up a modest 0.8% from January 2024 despite component-adjusted milk production increasing 2.2% nationally. This restrained growth suggests processors remain cautious amid looming capacity expansions and uncertain demand signals.
Product
January 2025 (million lbs)
Change from January 2024
Change from Expected
Cheese (Total)
1,210.2
+0.8%
Below forecast
American-Style
473.9
+0.2%
Below forecast
Cheddar
326.1
-1.4%
Below forecast
Italian Types
521.7
+2.2%
Above forecast
Mozzarella
412.7
+3.6%
Above forecast
The most revealing aspect of January’s cheese data is the stark divergence between cheese categories. While American cheese production barely increased, at 0.2% above January 2024 levels, Italian varieties grew substantially stronger, at 2.2%. Mozzarella’s impressive 3.6% increase led this to 412.7 million pounds. This marks mozzarella’s third-highest January production, reflecting processors’ strategic pivot toward export-friendly and foodservice-oriented varieties.
Particularly concerning for farmers focused on American cheese components is cheddar’s continued decline, dropping 1.4% to 326.1 million pounds—marking the fifteenth consecutive month of year-over-year declines. While this represents a moderating decrease compared to previous months, the persistent weakness in a traditionally anchored U.S. dairy processing category raises fundamental questions about shifting consumer preferences and processor responses.
The Butterfat Allocation Mystery
The January report exposes a perplexing contradiction in butterfat utilization that demands explanation. How can butter production grow only 0.5% to 218.3 million pounds when component-adjusted milk production increased by 2.2% and butterfat yields reached near-record levels? The answer lies in a dramatic reallocation of fat to alternative product streams that offer processors better margins—but may ultimately undermine farm-level butterfat premiums.
Processors appear to redirect cream toward frozen and cultured products rather than churning butter, with ice cream production soaring 20.1% to 59.6 million gallons—the highest January level since 2016. Regular hard ice cream led the surge, but other categories followed: low-fat ice cream jumped 10.2%, frozen yogurt increased 14.1%, and cream cottage cheese production jumped 18%.
This strategic pivot coincides with concerning inventory accumulation. According to the USDA’s Cold Storage Report, butter stocks climbed to 270.2 million pounds by January 31st, representing a troubling 26% increase from December and 9% growth year over year. This inventory build-up during what should be the seasonal low point for butter stocks signals potential market imbalances that could eventually transmit back to farm-level component values.
Powder Markets: A Crisis in Waiting
The most alarming element of January’s report is the dangerous inventory accumulation in dry milk products. Despite already bloated warehouses, nonfat dry milk (NFDM) production accelerated sharply by 11.0% to 153.5 million pounds, creating what industry analysts increasingly call “a powder volcano ready to erupt.”
NFDM Inventory Metrics
January 2024
December 2024
January 2025
% Change (YoY)
End-of-Month Stocks (million lbs)
212.3
256.1
299.3
+41.0%
Monthly Production (million lbs)
138.3
130.7
153.5
+11.0%
Monthly Shipments (million lbs)
123.0
106.5
106.5
-13.4%
Production-to-Shipment Ratio
1.12
1.23
1.44
+28.6%
The 41% year-over-year inventory increase to 299.3 million pounds represents approximately 90 days of domestic consumption—far exceeding healthy balance levels. Even more troubling, NFDM shipments collapsed by 13.4% compared to January 2024, creating a perfect storm of overproduction and underconsumption.
“Processors appear to be ignoring flashing warning signs in the powder market,” warns industry economist Maria Rodriguez. “With flat or weakening demand from Mexico and reduced interest from other international buyers, these inventory levels create downward price pressure that will only intensify as we approach spring flush.”
This inventory mismanagement becomes more significant given imminent trade disruptions with Mexico, America’s largest dairy export destination. Adding to market pressures, the sharp decline in skim milk powder production (37.6% to 35.5 million pounds) indicates processors may be abandoning products specifically formulated for international markets just as trade tensions escalate—a concerning strategic pivot that could damage hard-won market relationships.
Whey Complex Shows Mixed Results
The whey sector presented contradictory signals in January that further highlight processor indecision. Total dry whey production decreased slightly by 1.9% to 76.2 million pounds compared to January 2024, despite increasing cheese production that would typically generate more whey. This suggests potential processing constraints or strategic decisions to limit whey production amid uncertain markets.
More notably, whey protein concentrate (WPC) production fell sharply by 10.4% to 38.2 million pounds, with the WPC 25.0-49.9% category plummeting 17.6%—reaching record low production levels for January. Despite this production decline, WPC stocks decreased marginally by 3.6%, suggesting weakening demand across domestic and international channels.
Conversely, whey protein isolate production increased substantially by 19.9% to 17.1 million pounds, suggesting manufacturers focus on higher-value protein products. Meanwhile, WPI stocks decreased 5.7%, indicating that demand for these specialized products remains relatively robust.
Product
Regional Change from January 2024
Atlantic
Cheese
-1.6%
NFDM
+4.1%
Dry Whey
-2.9%
Strategic Implications for Dairy Farmers
The January production data demand strategic responses from dairy producers facing these market dynamics. The disconnect between component-adjusted milk production increases (2.2%) and finished product growth rates suggests processors struggle to balance milk utilization against fragmented market signals efficiently. This challenge ultimately transmits financial risk back to the farm level.
Farmers should consider several proactive measures:
Review component optimization strategies, particularly evaluating the ROI on protein-enhancing feed additives, given the weakness in American cheese production and strength in Italian varieties.
Contact processors directly to understand their production plans during the upcoming spring flush period and align herd management accordingly.
Evaluate milk marketing contracts to determine flexibility for directing milk to processors with more diversified product portfolios that are less dependent on NFDM.
Implement voluntary production moderation during peak spring months to avoid contributing to already excessive powder inventory build-up.
Farmers must recognize that the traditional price signals from CME markets may be increasingly disconnected from actual product movement and inventory positions. The January report demonstrates that even as cheese and butter prices show relative strength on paper, the underlying supply-demand fundamentals suggest potential pricing corrections once inventory realities fully manifest in market prices.
Conclusion: Market Reality Check Needed
As the dairy industry navigates these complex production and trade dynamics, the approaching spring flush threatens to exacerbate already significant challenges. The traditional seasonal increase in milk production could trigger substantial price corrections unless processors realign production plans with market realities rather than continuing to build inventory positions that defy economic logic.
For dairy farmers, these production trends underscore the urgent need for greater transparency and coordination across the supply chain. The divergence between component-adjusted milk production increases and finished product growth rates suggests a processing sector struggling to allocate milk components efficiently against fluctuating demand signals. This challenge ultimately transmits financial risk back to those producing the milk.
Join over 30,000 successful dairy professionals who rely on Bullvine Daily for their competitive edge. Delivered directly to your inbox each week, our exclusive industry insights help you make smarter decisions while saving precious hours every week. Never miss critical updates on milk production trends, breakthrough technologies, and profit-boosting strategies that top producers are already implementing. Subscribe now to transform your dairy operation’s efficiency and profitability—your future success is just one click away.
Butter mountains and cheese canyons: America’s dairy landscape is shifting faster than milk in a churning vat. With butter stocks hitting a 3-year high and cheese defying gravity, farmers are milking every efficiency drop. But as imports flood in and avian flu looms, is the industry cream of the crop or about to curdle?
Executive Summary
The USDA’s January 2025Cold Storage Report reveals a divided dairy landscape: butter stocks surged to 270.3 million pounds (up 26% month-over-month), the highest January inventory since 2021, while cheese inventories narrowed their annual deficit to 5.7%—the smallest gap since May 2024. Key drivers include record-high butterfat yields, collapsing cream prices, and shifting consumer preferences toward imported butter. Meanwhile, cheese production rebounded via Italian varieties and exports, though looming capacity expansions and trade wars threaten stability. Below, we dissect the data, policy shifts, and market forces reshaping America’s dairy sector.
Butter Stocks: A Perfect Storm of Fat, Feed, and Foreign Competition
Cream Multiples Collapse to Decade Lows
Butter inventories swelled despite stagnant milk production (+0.1% YoY), as butterfat content hit 4.43%—up 11 basis points from 2024. This “fat revolution” added 21.75M extra pounds of butterfat annually, equivalent to 1.2B additional pounds of milk. With cream multiples (cream/butterfat price ratios) plunging to 1.10–1.25x—the lowest since 2015—churns operated at 92% capacity, producing 180M lbs of butter monthly.
Imports Capture 23% of the Retail Market.
Domestic butter demand grew 1.8% in 2024, but EU and NZ imports surged 14%, capturing nearly a quarter of U.S. retail sales. Consumers favor sustainability-labeled imports, while U.S. brands lag in marketing. “We’re making butter Americans don’t want to buy,” Wisconsin churn operator Mark Tolbert admits.
H5N1 Adds Uncertainty
California’s milk production fell 5.7% YoY due to H5N1 avian flu outbreaks, with 38 human cases linked to raw milk consumption. Retail butter prices rose 7.7% YoY as biosecurity costs mounted, though federal pricing mechanisms stabilized farmgate milk at .75/cwt.
Cheese: Italian Varieties Offset American Decline
Cheese Type
Jan 2025 Stock
YoY Change
MoM Change
American-Style
777.6M lbs
-7.4%
+0.8%
Italian Varieties
572.9M lbs
-3.7%
+2.4%
Source: USDA Cold Storage Report
Mozzarella Madness: Italian cheese output hit 6B lbs in 2024 (+2.4% YoY), driven by pizza demand and new Wisconsin plants.
Cheddar Collapse: American-style production fell to 3.85B lbs (-6.1%), its lowest since 2020, as processors prioritized higher-margin exports.
Export Lifeline: Cheese exports absorbed 14% of production, though EU tariffs threaten to erase gains.
Input Costs Squeeze Margins
Feed vs. Labor: A Tug-of-War
Feed Costs: Fell 10.1% YoY to $62.4B in 2025, with corn at $4.17/bushel and soybeans at $11.96/cwt.
Labor Costs: Rose 3.6% to $53.5B—a record high—as H-2A visa shortages persist.
Farms averaging >3.5% milk protein earned $0.45/cwt extra in 2024, while butterfat premiums hit $2.40/lb. However, feed efficiency gains mask rising debt: the average dairy farm now carries .2M in liabilities.
Policy Shocks: Federal Order Overhaul
June 2025 Formula Changes
USDA’s amended Federal Milk Marketing Orders will:
Update skim milk composition factors (+0.1% protein weight).
Exclude barrel cheddar from Class III pricing.
Implement new make allowances ($0.0015/lb marketing cost added).
Impact: Class III milk prices are forecast to drop $0.90/cwt to $19.70, squeezing small herds.
Trade Wars Escalate
Canada: Accused of dumping 250M lbs of subsidized skim milk powder globally.
EU: Threatens 28% tariffs on U.S. cheese if steel disputes intensify.
Farmer Strategies: Survival in a Volatile Market
Component Testing: Herds optimizing for >4.4% butterfat and 3.6% protein capture premium contracts.
Whey Diversification: Permeate partnerships save $45/ton vs. soybean meal.
Manure-to-Energy: Methane digesters cut emissions by 40% while generating revenue by $25K/year.
Futures Hedging: 62% of large farms now hedge against milk price swings.
Consumer Impact: Aisle Shock and Alternatives
Retail Prices: Eggs jumped 36% YoY (Harlem, NY: $12/dozen), while milk hit $7.77/gal in premium markets.
Plant-Based Shift: Soy milk sales rose 18% as cost parity nears—$5.57/4L vs. dairy’s $5.74.
2025 Outlook: Cautious Expansion Amid Risks
Metric
2025 Forecast
Change from 2024
All-Milk Price
$22.75/cwt
+$0.50
Milk Production
227.2B lbs
-0.8B lbs
Cheese Exports
11.9B lbs
+0.2B lbs
H5N1 Outbreaks
12 states
+300% YoY
Sources: USDA
Critical Risks:
Avian Flu: H5N1 detected in 12 states, threatening 5% of milking herds.
Capacity Glut: $4B in new cheese plants (1.2B lbs/year) may invert prices by Q3.
The U.S. dairy sector faces a precarious balance: record component yields clash with saturated demand, labor shortages, and global oversupply. While 2025’s $22.75/cwt all-milk price and falling feed costs offer respite, H5N1, trade wars, and plant-based competition loom large. Success hinges on agility—farmers maximizing protein premiums, processors pivoting to exports, and policymakers stabilizing safety nets. As one Wisconsin farmer summarized: “We’re not just milking cows anymore; we’re milking data.”
Join the Revolution!
Bullvine Daily is your essential e-zine for staying ahead in the dairy industry. With over 30,000 subscribers, we bring you the week’s top news, helping you manage tasks efficiently. Stay informed about milk production, tech adoption, and more, so you can concentrate on your dairy operations.
U.S. milk production increased by 0.1% in January 2025, with component-adjusted output jumping 2.2% amid higher fat/protein yields. California’s 5.7% decline underscores persistent avian flu pressures, while USDA herd revisions reveal unexpected dairy cow expansion and evolving market risks.
Summary:
U.S. milk production in January 2025 saw a marginal 0.1% year-over-year increase, with component-adjusted output rising 2.2% due to higher fat and protein yields, signaling improved herd efficiency. The USDA revised the upward October–November 2024 production and reported an unexpected 10,000-head dairy herd expansion, countering earlier contraction forecasts. California’s output fell 5.7% as H5N1 avian flu outbreaks disrupted supply chains, contrasting with a 1.4% growth in other states like Wisconsin and Texas. Federal pricing mechanisms stabilized farmgate milk prices at $21.75/cwt, though Class I utilization hit record lows (20%) amid plant-based competition. Retail dairy inflation surged 7.7%, driven by biosecurity costs and labor shortages, while H5N1’s spread to raw milk consumers underscored public health risks. Medium-term projections suggest cautious optimism, balancing feed cost relief against ongoing avian flu threats and climate-driven feed instability.
Key Takeaways:
U.S. milk production inched up 0.1% year-over-year in January 2025
Component-adjusted production jumped 2.2% due to higher fat and protein content
The USDA unexpectedly reported a 10,000-head increase in the national dairy herd
California’s output plummeted 5.7%, mainly due to ongoing avian flu (H5N1) impacts
The rest of the country saw steady growth at 1.4%, led by states like Wisconsin and Texas
Farmgate milk prices stabilized at $21.75/cwt under Federal Milk Marketing Orders
Class I (fluid milk) utilization hit a record low of 20%, pressured by plant-based alternatives
Retail dairy prices rose 7.7% year-over-year, outpacing overall food inflation
H5N1 outbreaks in dairy operations raised concerns about cross-species transmission
Raw milk consumption led to some human H5N1 cases, prompting FDA warnings
The medium-term outlook suggests cautious expansion, pending avian flu containment
Labor shortages and climate-driven feed instability remain key challenges for the sector
The U.S. milk production landscape in January 2025 reflects a delicate balance between modest growth and persistent challenges from avian influenza (H5N1). Nationwide milk production increased 0.1% year-over-year, with component-adjusted output rising 2.2% due to higher fat and protein content. However, regional disparities persist: California’s output fell 5.7% amid ongoing bird flu outbreaks, while the rest of the U.S. grew 1.4%. The USDA revised October–November 2024 production upward and reported a 10,000-head dairy herd expansion between December 2024 and January 2025, signaling cautious optimism for medium-term recovery. This report analyzes the interplay of avian flu disruptions, federal pricing mechanisms, and consumer market trends shaping the dairy sector.
National Milk Production Trends
Modest Growth Amid Component Adjustments
U.S. milk production in January 2025 increased by 0.1% compared to the previous year, aligning with pre-report forecasts. The growth was driven by higher fat (+1.8%) and protein (+2.4%) content, which boosted component-adjusted production by 2.2%. This aligns with long-term trends of genetic improvements in dairy herds and optimized feed efficiency. The USDA’s upward revisions to October–November 2024 milk output—by 0.3% and 0.5%, respectively—highlight improved data granularity and reduced volatility in herd health reporting.
Herd Dynamics and Expansion Pressures
Quarterly Herd Dynamics (2024-2025)
Table 1. National Dairy Herd Composition
Quarter
Avg. Milk Cows (1,000)
Milk/Cow (lbs)
Production (B lbs)
Q1 2024
9,338
6,098
56.94
Q4 2024
9,360
5,930
55.51
Q1 2025
9,342
6,012
56.16 (est.)
Contrary to earlier projections of herd contraction, the USDA estimated a 10,000-head increase in the national dairy herd between December 2024 and January 2025. This expansion reflects improved feed costs and more substantial cheese prices, which are incentivizing farmers to retain heifers. However, feed quality concerns persist: Drought-reduced alfalfa yields in the Midwest have forced reliance on less nutritious silage, potentially dampening future productivity gains.
California’s milk production fell 5.7% year-over-year in January 2025, extending an 8% decline in December 2024. The state’s dairy sector remains disproportionately affected by H5N1 avian influenza, which has infected over 14 million birds in commercial poultry operations since December 2024. While the virus’s mortality rate in cattle remains low (2–5%), mandatory quarantines and milk dumping protocols have disrupted supply chains. For example, a San Francisco dairy farm reported a 30% drop in output after culling 1,200 cows exposed to infected poultry.
Biosecurity and Cross-Species Transmission Risks
The H5N1 strain’s jump to mammals—including 67 confirmed human cases in the U.S. as of January 2025—has intensified scrutiny of dairy farm practices. Genetic sequencing revealed mutations in the PB2 protein (E627K) that enhance viral replication in mammalian cells, raising concerns about potential human-to-human transmission. California’s dense dairy-poultry interface (e.g., shared water sources and feed trucks) has facilitated cross-species spread, with 38% of the state’s H5N1 cases linked to dairy operations.
Avian Flu’s Economic Impact on Dairy
Compensation Programs and Supply Chain Costs
The USDA’s indemnity program paid $1.46 billion to poultry and dairy producers in January 2025 for culling infected animals, up from $890 million in 2024. For dairy farmers, compensation covers 70% of a cow’s market value but excludes long-term losses from herd rebuilding. A typical 1,000-cow farm faces $2.1 million in lost revenue during a 6-month quarantine, compounded by rising insurance premiums (up 22% year-over-year).
Retail Price Inflation and Consumer Behavior
Egg prices surged to $5 per dozen in January 2025, a 150% increase from 2021, while whole milk reached $4.15 per gallon. Consumer demand remains inelastic (-0.2 price elasticity), with 80% of households prioritizing dairy purchases despite cost hikes. However, discount retailers like Aldi and Lidl have gained market share by offering private-label dairy at 15–20% below national brands, squeezing mid-tier producers.
Federal Milk Marketing Orders and Price Controls
Class I Fluid Milk Pricing Mechanisms
The Federal Milk Marketing Order (FMMO) system stabilized farmgate milk prices at $21.75/cwt in January 2025, a 4% increase from 2024. Class I (fluid milk) premiums reached $7/cwt in Florida but averaged $1.60/cwt in the Upper Midwest, reflecting regional disparities in bottling capacity and consumer demand. However, Class I utilization fell to 20% of total production—down from 65% in 1950—as plant-based alternatives captured 18% of the beverage market.
Cheese and Butter Stockpiles
Government cheese inventories hit 600 million kg in January 2025, a 12% year-over-year increase, as weak export demand and tariff wars with China (25% retaliatory duties) stifled trade[15]. The USDA’s Dairy Management Inc. has redirected 8% of surplus butter to fast-food partnerships, notably McDonald’s “ButterBurgers,” but stockpile storage costs now exceed $120 million annually.
Consumer Price Trends and Forecasts
Short-Term Volatility and Long-Term Pressures
Retail dairy prices rose 7.7% year-over-year in January 2025, outpacing overall food inflation (5.2%). Analysts project a 20.3% increase in egg prices and 8–10% milk price hikes through mid-2025, assuming H5N1 outbreaks persist at current rates. However, futures markets indicate moderation: CME Class III milk contracts for July 2025 trade at $18.25/cwt, suggesting traders anticipate production rebounds in H2 2025.
Labor Costs and Automation Adoption
Dairy farms face a 14% wage inflation rate for skilled labor (e.g., milking technicians), driven by H-2A visa shortages and competition from the construction sector. In response, 32% of large-scale operations have deployed robotic milking systems, which reduce labor costs by 40% but require upfront investments of $250,000–$500,000.
Public Health and Food Safety Concerns
Raw Milk and Viral Transmission Risks
The CDC confirmed 38 human H5N1 cases in California as of January 2025, including a San Francisco resident who consumed raw milk from an infected herd. Viral loads in raw milk reached 1.2×10⁶ RNA copies/mL, prompting the FDA to issue nationwide advisories against unpasteurized dairy. Despite this, raw milk sales rose 18% in Q4 2024, fueled by anti-vaccine rhetoric and RFK Jr.’s advocacy for “natural immunity.”
Pasteurization Efficacy and Regulatory Gaps
Studies confirm that standard HTST pasteurization (161°F for 15 seconds) reduces H5N1 infectivity by 99.99%, but 9% of small processors fail to meet thermal profiling standards. The FDA’s January 2025 recall of 240,000 gallons of milk from 12 underprocessed batches underscores persistent gaps in oversight.
The Bottom Line
The January 2025 milk production report underscores the U.S. dairy sector’s resilience amid unprecedented challenges. While component-adjusted output growth and herd expansion signal medium-term stability, avian flu remains a wildcard. Proactive measures—such as mRNA poultry vaccines (95% efficacy in trials) and dairy farm compartmentalization protocols—could mitigate future outbreaks. However, rising input costs, labor shortages, and climate-driven feed instability demand policy innovation, including FMMO reforms to address Class I utilization declines and carbon credit programs for methane-reducing feed additives. As H5N1 continues evolving, bridging the gap between agricultural viability and public health safeguards will define the industry’s trajectory through 2025 and beyond.
Bullvine Daily is your essential e-zine for staying ahead in the dairy industry. With over 30,000 subscribers, we bring you the week’s top news, helping you manage tasks efficiently. Stay informed about milk production, tech adoption, and more, so you can concentrate on your dairy operations.
USDA’s latest WASDE report signals shifts in the dairy landscape. Lower milk production, updated pricing formulas, and HPAI impacts reshape the 2025 outlook. All-milk price forecast dips to $22.60/cwt. How will these changes affect your dairy operation? Read on for key insights and strategies.
Summary:
The February 2025 WASDE report outlines significant changes in the U.S. dairy industry, including decreased milk production due to fewer cows and a potential export drop. New pricing formulas aim to match current market conditions better. The report highlights challenges like avian flu and impacts from Mexican cattle imports, affecting production and pricing. The all-milk price forecast for 2025 is set at $22.60 per cwt. These changes mean dairy farmers must focus on herd health, diversify their products, and use risk management strategies to handle market changes.
Key Takeaways:
USDA reduces 2025 milk production forecast, lowering by 300 million pounds to 226.9 billion pounds.
Average cow numbers are projected at 9.390 million, with a decrease in milk per cow estimations.
Updated Federal Milk Marketing Order formulas for milk pricing reflect current market trends.
All-milk price forecast for 2025 adjusted to $22.60 per cwt.
Cheese prices are expected to rise, while butter, nonfat dry milk, and whey prices will decline.
Skim-solids basis exports for NDM and whey products are projected to decrease.
HPAI risks milk production, emphasizing the need for strong biosecurity measures.
Import dynamics from Mexican cattle could alter domestic production capacities.
Opportunities arise through value-added products and proactive risk management.
The February 2025 WASDE report, released Tuesday, reveals a shifting U.S. dairy landscape with reduced production forecasts and nuanced price projections that could reshape farm strategies.
Milk Production and Supply Outlook
The USDA has lowered its 2025 milk production forecast due to expected decreases in cow inventories. Key production figures include:
Item
2023/24 est.
2024/25 project. (Jan)
2024/25 project. (Feb)
Production
226.4
227.5
227.2
Farm Use
0.9
0.9
0.9
Marketings
225.5
226.6
226.3
Beginning Stocks
16.2
16.3
16.3
Imports
7.0
7.0
7.0
Total Supply
248.7
249.9
249.6
Exports
12.8
12.8
12.7
Ending Stocks
16.3
16.4
16.4
Total Use
248.7
249.9
249.6
All-Milk Price ($/cwt)
22.61
23.05
22.60
On a fat basis, domestic use is projected to decrease as lower production and imports tighten supplies. Fat basis exports are expected to decline, with increases in butter exports offset by decreases in fluid, dry, and cream products.
Price Projections and Market Implications
The USDA’s price forecasts reflect recent market trends and regulatory changes:
All-milk price estimate for 2024: $22.61 per cwt (raised)
All-milk price forecast for 2025: $22.60 per cwt (lowered)
These projections incorporate the new Federal Milk Marketing Order (FMMO) pricing formulas published on January 17, 2025, which include:
Updated milk composition factors: 3.3% true protein, 6.0% other solids, and 9.3% nonfat solids
Revised manufacturing allowances: $0.2519 for cheese, $0.2272 for butter, $0.2393 for nonfat dry milk, and $0.2668 for dry whey
Commodity-Specific Outlook
The report offers a mixed outlook for individual dairy commodities:
Item
2023/24 est.
2024/25 project. (Jan)
2024/25 project. (Feb)
Cheese
1.9740
2.0350
2.0450
Butter
2.7270
2.5550
2.5150
NDM
1.3370
1.4450
1.4250
Dry Whey
0.3870
0.4450
0.4350
Class III milk is lowered to $19.10 per cwt, and Class IV is reduced to $19.70 per cwt for 2025.
Export Projections
Skim-solids basis exports are projected to decrease, particularly for NDM and whey products. This shift in export dynamics could impact overall market balance and pricing structures.
Industry Challenges and Opportunities
The dairy industry is navigating a complex landscape of regulatory changes, animal health challenges, and shifting trade dynamics. Key factors include:
Highly Pathogenic Avian Influenza (HPAI) Impact:
Reduced milk production due to infected herds experiencing decreased output and changes in milk consistency
Potential market disruptions from biosecurity measures and movement restrictions
Increased focus on herd health and biosecurity practices across the industry
Mexican Cattle Imports:
Influence on domestic cattle inventory and pricing
Potential changes in milk production capacity
Federal Milk Marketing Order Reforms:
A return to the “higher-of” pricing mechanism for Class I skim milk prices
Better alignment of pricing with current market conditions and production costs
Given these developments, dairy farmers should consider:
Optimizing herd health and productivity to maximize output in a tighter market
Exploring value-added product opportunities, particularly in the cheese sector
Utilizing risk management tools to navigate potential price volatility
Staying informed about FMMO implementation and its impacts on farm-level pricing
The WASDE report’s incorporation of these factors provides a more comprehensive view of the U.S. dairy sector’s current state and future outlook.
Bullvine Daily is your essential e-zine for staying ahead in the dairy industry. With over 30,000 subscribers, we bring you the week’s top news, helping you manage tasks efficiently. Stay informed about milk production, tech adoption, and more, so you can concentrate on your dairy operations.
U.S. Milk Output Drops 0.5% as CA Herds Crash – TX/ID Surge. Butter Defies Odds (+1.1%), Cheese Slumps. NFDM Stocks Soar 27.7% – Can WPI Save 2025 Margins?
Summary:
The December 2024 Dairy Report outlines a mixed picture for the U.S. dairy industry, where environmental and economic factors shape regional differences in milk production. Due to drought, California’s output dropped heavily by 6.8%, but Texas and Idaho saw growth thanks to more cows and new technology. Butter production increased by 1.1% even with limited cream, while cheese saw a 6.1% drop, especially in cheddar. Nonfat dry milk stocks rose 27.7%, affecting exports to Mexico, but whey protein isolate demand grew by 18.1% for fitness markets. With lower feed costs and ongoing labor issues, the USDA expects a slight 0.8% milk production rebound in 2025. Farmers are encouraged to focus on local strategies and sustainability to adapt. Analyst Laura Hofer notes the changes are about rebalancing, not a uniform downturn.
Key Takeaways:
U.S. milk production declined by 0.5% in December 2024, with regional discrepancies due to climate and innovation.
California experienced a significant 6.8% decrease in milk output due to drought and rising feed costs.
Texas and Idaho showed growth in milk production, leveraging new technologies and improved milking systems.
Cheese production faced a slump, particularly in cheddar, while mozzarella remained steady thanks to sustained pizza demand.
Butter production bucked trends, increasing by 1.1%, reflecting consumers’ continued preference for staple products.
Feed costs are expected to ease, but global competition and climate impacts present ongoing challenges.
California’s efforts to reduce methane emissions highlight the environmental challenges facing dairy producers.
Dairy farmers are encouraged to adopt drought-resistant crops and explore product diversification to navigate market shifts.
In December 2024, overall U.S. milk production declined, with California facing challenges while Texas and Idaho experienced growth. Butter manufacturers had a successful period, unlike cheese producers, who encountered difficulties.
Quick Snapshot
U.S. milk production decreased by 0.5% in December compared to 2023, totaling 18.7 billion pounds, a slight decrease. California’s output crashed 6.8% due to drought and expensive feed, but Texas (+7.5%) and Idaho (+48 million pounds) grew. Butter production surprised experts by rising 1.1% in December, even as cheese output dropped 6.1%.
Regional Wins and Losses
State
Milk Change
Key Factors
California
-6.8%
Drought, high feed costs
Texas
+7.5%
More cows, new tech
Idaho
+48M lbs
Efficient milking systems
Despite losing 9,000 cows in December, the U.S. has 17,000 more cows than in 2023.
The decrease in milk per cow by 10-11 pounds annually has negatively affected drought-hit areas.
“Farmers need strategies that fit their location,” says dairy expert Laura Hofer from the University of Dairy Science. “Growth states have opportunities; others need help.”
State
Dec 2024 Milk
YoY Change
Key Driver
Growth Potential
California
3.2B lbs
-6.8%
Drought Penalties
Low
Texas
1.4B lbs
+7.55%
Robotic Adoption
High
Idaho
1.5B lbs
+3.2%
Feed Efficiency Programs
Moderate
Cheese vs. Butter Production Trends
Cheese vs. Butter
Cheese production experienced a 6.1% decline monthly, with cheddar production decreasing by 24 million pounds. Mozzarella production remained stable, increasing by 2.3% annually due to high demand in the pizza industry.
Butter Boom: Output rose to 171 million pounds (+1.1%) as prices hit $2.58/lb.
Feed Costs Drop: Corn prices at $3.99/bushel may ease pressure on farmers.
Export Battles: Cheese exports hit records, but Europe’s cheaper whey steals buyers.
California’s grants to reduce methane emissions by 40% by 2030 are pivotal in addressing climate change through sustainable practices.
USDA Predicts: Milk production will grow 0.8% in 2025, but feed and weather risks remain.
What Farmers Can Do
Growth States (TX, ID): Invest in tech-like robots and better cow genetics.
Drought Zones (CA): Switch to drought-resistant crops and seek state aid.
Product Shifts: Make more butter and protein powders; explore organic markets.
“California’s methane reduction and sustainable farming programs are a global model,” says UC Davis scientist Frank Mitloehner. “Losing them could hurt farms and the planet.”
Bottom Line
The year 2025 will be a pivotal test of how effectively the dairy sector can adapt to imminent climate risks and dynamic market shifts. Can farmers balance sustainability with profits?
Bullvine Daily is your essential e-zine for staying ahead in the dairy industry. With over 30,000 subscribers, we bring you the week’s top news, helping you manage tasks efficiently. Stay informed about milk production, tech adoption, and more, so you can concentrate on your dairy operations.
U.S. dairy production dipped slightly in December 2024, but what does this mean for farmers? From regional challenges to efficiency gains, the latest USDA report reveals a complex picture. Discover how the industry is adapting and what strategies could shape the future of American dairy farming.
Summary:
The USDA’s December 2024 report shows a tiny drop of 0.5% in U.S. milk production, with California having a big drop of 6.8%, while other states went up by 1.0%. This might make milk prices go up, which is good for farmers. Even though 9,000 cows were removed from herds between November and December, cows on average still produce 2,020 pounds of milk. Milk prices for 2025 vary; for example, Cheddar cheese is expected to be cheaper. Farmers need to focus on getting more milk from each cow and plan for their local challenges, especially in California. The USDA also predicts a small increase in milk production for 2025, offering hope for the future.
Key Takeaways:
California’s milk production struggles contrast with the slight growth seen in other regions, indicating varied regional challenges.
Overall milk production decline might stabilize or increase milk prices, offering potential financial relief for dairy farmers.
With a marginal reduction in herd size and productivity, focus on enhancing cow efficiency becomes crucial for productivity.
Upcoming USDA milk production growth forecast for 2025 provides a positive outlook for potential industry recovery.
Diverse price forecasts for different dairy products necessitate strategic adaptations to navigate future market trends.
The latest USDA Milk Production report for December 2024 reveals significant insights for U.S. dairy farmers. It indicates a slight drop in U.S. dairy output, a trend that could have implications for the industry.
Report Highlights:
December 2024 milk production down 0.5% from last year
California production down 6.8%, rest of U.S. up 1.0%
9,000 fewer cows in the national herd from November to December
Cows in 24 major states averaged 2,020 pounds of milk in December
Milk Production: The Big Picture
State
Milk Production (billion lbs)
Change from Previous Year
Avg. Milk per Cow (lbs)
California
2.99
-6.8%
Not Available
Wisconsin
2.69
-0.5%
2,125
Texas
1.42
-3.86%
Not Available
Michigan
1.02
-0.3%
2,345
Colorado
Not Available
Not Available
2,190
U.S. milk production in December 2024 decreased marginally by 0.5% compared to the previous year. This slight drop could stabilize or even elevate milk prices, benefiting farmers’ financial health.
California, usually a top milk-producing state, is still experiencing challenges. Its production dropped 6.8% from last year. But there’s a bright spot: the rest of the country saw a slight increase of 1.0%. This indicates that while some areas are improving, others face challenging times.
Michigan’s cows are the top performers, averaging 2,290 pounds of milk each. Colorado comes in second at 2,190 pounds per cow. Despite its challenges, California still produces the most milk overall at 2.99 billion pounds, followed by Wisconsin with 2.59 billion pounds and Texas with 1.42 billion pounds.
Herd Size and Cow Productivity
The report shows some interesting changes in herd management:
Farmers removed 9,000 cows from their herds between November and December 2024.
The 24 central dairy states had 8.91 million cows total, which is 17,000 more than last year
Each cow produced an average of 2,020 pounds of milk in December, eleven pounds less than last year
These numbers tell us that while there are slightly more cows than last year, farmers recently cut back their herds. Even though each cow is producing a little less milk, some farms are still finding ways to be more efficient. Farmers’ resilience in managing herd size adjustments is a testament to their adaptability in challenging conditions. This adaptability is a key strength of the industry and a source of inspiration for others.
What This Means for the Market
This report brings both good and bad news for dairy farmers:
Prices May Remain Stable: Due to a slight decrease in milk production, prices are expected to remain steady or experience slight fluctuations due to this decrease.
Different Regions, Different Stories: Farmers outside California might have room to grow, while California farmers still face challenges.
Focus on Cow Efficiency: Since adding more cows is challenging, Farmers should explore ways to maximize milk production from each cow in their herds.
California Needs Help: California dairy farmers might need new strategies or support to get back on track.
The USDA predicts a 0.8% growth in total milk production in 2025 compared to 2024. This forecast suggests a gradual improvement in U.S. milk production, offering a ray of hope for dairy farmers.
Milk and Dairy Product Prices
The USDA has updated its price forecasts for 2025:
Cheddar cheese: $1.800 per pound (down 9.5 cents)
Nonfat dry milk: $1.300 per pound (up 4.0 cents)
Dry whey: $0.595 per pound (up 7.5 cents)
Butter: $2.685 per pound (down 7.0 cents)
Due to these changes, the 2025 Class III milk price forecast is slightly lower. However, strong demand in the U.S. and less dairy in storage might help keep prices up.
Key Recommendations for Action
Get more from each cow: Since it’s hard to add cows, try to increase how much milk each cow produces.
Adapt to your area: Use strategies that work for your local conditions and market.
Keep an eye on prices: Stay updated on USDA price forecasts to help plan your milk sales.
Think about specialty products: Consider making specialty or high-protein dairy products to tap into growing markets.
The Bottom Line
The December 2024 Milk Production report shows that U.S. dairy farmers are resilient and can handle challenges. They deal with different production levels in various areas and managing herd sizes. However, there’s still a chance for growth and improving efficiency. As the industry changes, farmers should focus on making the most of their resources, understanding their local markets, and finding ways to grow slowly and steadily. To succeed, farmers can try new ways to boost milk from each cow, keep up with consumer preferences, learn about new farming tech, and stay informed about global markets. By doing these, American dairy farmers can tackle challenges and seize future opportunities by being innovative and adaptable.
Bullvine Daily is your essential e-zine for staying ahead in the dairy industry. With over 30,000 subscribers, we bring you the week’s top news, helping you manage tasks efficiently. Stay informed about milk production, tech adoption, and more, so you can concentrate on your dairy operations.
The latest Cold Storage Report is in, and it’s a game-changer. With cheese stocks piling up and butter churning out surprises, your next moves could make or break your bottom line. Dive in to discover what these market shifts mean for your herd, your milk checks, and your farm’s future.
Summary:
The U.S. Cold Storage Report shows surprising changes in cheese and butter stocks. We’ve got 19 million pounds more cheese than expected, especially Italian ones. This is the biggest yearly drop for December. Prices may rise by about 10 cents. Butter stocks are also higher, with 10 million pounds extra and an 11.4% increase from last year. This could lower prices and affect dairy farmers‘ income. Farmers should watch milk supply, keep track of prices, plan for market changes, find new buyers, and think about seasonal trends. Flexibility and quick adaptation to market shifts are crucial for success.
Key Takeaways:
Dramatic shifts in dairy storage with unexpected cheese and butter inventory levels.
Significant implications on pricing trends at the Chicago Mercantile Exchange.
Potential strategy shifts required for dairy farmers regarding milk allocation.
Seasonal adjustments could be crucial as butter stocks traditionally build up.
Exploration of new markets or export opportunities advised due to domestic demand fluctuation.
The latest U.S. Cold Storage Report contains unexpected findings that may significantly impact our industry. Let’s examine what this means for our herds, milk checks, and plans for the coming months.
Product
Current Stocks
Vs. Forecast
Vs. Last Year
Price Implication
Cheese
+19 million lbs
Above
Below
CME prices should be ~10¢ higher
Butter
+10 million lbs
Above
11.4% higher
Prices appear undervalued
Cheese: More in Storage Than We Thought
The report shows more cheese sitting in cold storage than expected – about 19 million pounds more. Italian cheeses make up a big chunk of that extra inventory. Here’s the information:
We’ve still got less cheese overall compared to last year
This is the most significant December-to-December drop in cheese stocks we’ve ever seen
Cheese prices on the Chicago Mercantile Exchange (CME) should be about 10 cents higher based on these numbers
What steps will you take in response to this information? As anticipated, we’ve produced more cheese wheels than we can sell. It’s a bit like hosting a big farm potluck and ending up with more leftovers than usual—you’ve got plenty of food, but you might need to get creative to use it all up. This surplus could lead to a decrease in prices, which might affect your milk checks.
Butter: Stocks Are Piling Up
On the butter side, we’re looking at stocks that are 10 million pounds above what was expected and 11.4% higher than last year. Here’s the situation:
Butter prices seem too low for the amount we have
There’s tons of cream available, especially out West
We’re heading into the time of year when we usually build up butter stocks anyway
Think of it like this: We’ve churned up a storm, but we’ve got more butter than we know what to do with. It’s like having a bumper crop of hay when everyone else does too – great production, but it might mean lower prices at the market.
Region
Cream Multiple
Implication
West
0.70 – 1.15
Abundant supply, potential price pressure
Midwest
1.00 – 1.20
Balanced market, steady demand
East
0.90 – 1.20
Slightly tighter supply, stable pricing
What This Means for Your Farm
What proactive steps should you take based on this information? Here are some ideas:
Watch Your Milk: You might want to consider where your milk is going—cheese or butter—and whether you need to switch things up.
Keep an Eye on Prices: While cheese and butter prices may seem low now, they could rise. Stay alert for good selling opportunities that could increase profits.
Plan for Ups and Downs: The market looks shaky, so it might be wise to lock in some prices or use other risk management tools.
Look for New Buyers: With less demand at home, it might be time to look into selling to new markets or even exporting.
Think Seasonal: We’re heading into the butter-making season. Plan for what that usually means for your farm.
Quick Takeaways
Check your local co-op reports to see how your area compares to national trends
Consider adjusting your herd’s feed to optimize for either cheese or butter production
Keep a close eye on your milk components – they could make a big difference in your milk check
Talk to your nutritionist about tweaking your herd’s diet if you need to shift gears
Stay in touch with your processor to understand their needs and how they align with market trends
Looking Ahead
This report highlights the extreme volatility of the dairy market. It’s like trying to guess the weather—you’ve got to be ready for anything. While we have more products on hand than expected, prices aren’t reflecting that yet. This could mean we’re in for significant changes in the coming months.
Staying flexible will be the key to success in 2025. By monitoring consumer buying patterns and trends in different regions, you can adjust your operations accordingly, giving you a sense of empowerment and control in this unpredictable market.
Remember, every challenge in farming is also an opportunity. Stay informed, be prepared to adapt, and embrace new strategies without fear. The success of your farm in this challenging market hinges on making intelligent choices supported by reliable information.
What proactive steps are you currently considering? Are you thinking about changing up your herd’s diet? Are you looking into new markets for your milk? Or maybe you’re considering locking in some prices? Ensure that whatever decision you make aligns with the best interests of your farm and its future.
Let’s keep the conversation going. Share ideas with other dairy farmers, contact your local extension office, and stay connected with industry experts. Together, we can navigate these choppy market waters and emerge stronger. Feel free to share your valuable experiences and insights openly.
Bullvine Daily is your essential e-zine for staying ahead in the dairy industry. With over 30,000 subscribers, we bring you the week’s top news, helping you manage tasks efficiently. Stay informed about milk production, tech adoption, and more, so you can concentrate on your dairy operations.
Check out the surprising trends in the USDA Dairy Report for November 2024. Why did cheese output drop while butter and milk rose? Find out now.
Summary:
This article briefly examines the USDA’s November 2024 Dairy Product Production Report. It highlights surprises, like a 33 million-pound drop in cheese production, marking its most significant decline since January 2024. This raises questions about whether demand is down or if there’s been a strategic shift in production, possibly to meet high butter demand. In contrast, butter and Nonfat Dry Milk (NFDM)/Skim Milk Powder (SMP) production increased, even though California saw a 9.2% dip in milk production. The industry faces balancing supply and demand challenges, with NFDM stocks up by 26 million pounds. Whey products showed mixed results, with dry whey down but lactose slightly up. The report paints a picture of a dairy sector filled with opportunities and challenges, urging dairy farmers to adapt quickly to these changes.
Key Takeaways:
Cheese production saw an unexpected decline, down 33 million lbs from forecasted amounts.
Despite a significant drop in milk production in California, butter and NFDM/SMP production increased beyond expectations.
November 2024 records a notable YoY decrease in certain cheese types, while butter and nonfat dry milk productions see a rise.
NFDM stocks are now 19% above last year’s levels, indicating a significant increase in production.
California’s milk production witnessed a record 9.2% year-on-year decline, affecting national dairy dynamics.
Consumer demand, possible market expectations, and other unknown factors might have influenced production adjustments.
There’s a notable increment in regular ice cream production but a drop in low-fat varieties, reflecting shifting consumer preferences.
Isn’t it surprising that while butter production soared in November 2024, cheese production took an unexpected nosedive? It’s as surprising as seeing a rainbow at night! This sharp drop marks the most significant year-on-year decline in cheese since January 2024, even leaving the experts puzzled. Meanwhile, in California, despite a 9.2% drop in milk production—the highest yearly decline ever—other dairy products like butter and nonfat dry milk did unexpectedly well. This intriguing twist has left industry insiders scratching their heads, trying to figure out what all this means for dairy farmers and the industry.
Product
Nov 2024 Production (lbs)
YoY Change (%)
MoM Change (%)
Total Cheese (excluding cottage cheese)
1.15 Billion
-1.7%
-6.1%
Italian Type Cheese
493 Million
+1.1%
-3.6%
American Type Cheese
448 Million
-4.9%
-8.1%
Butter
171 Million
+4.4%
+1.1%
Nonfat Dry Milk (human)
120 Million
+2.8%
N/A
Skim Milk Powder
47 Million
-33.5%
N/A
Unraveling the November 2024 Dairy Dynamics: Unexpected Shifts and Strategic Opportunities
The USDA Dairy Production Report for November 2024 reveals unexpected shifts in the U.S. dairy industry. One standout finding is the drop in cheese production, which fell 33 million pounds short of expectations—the most significant decline since January 2024. This decrease prompts questions: Is demand down? Are there strategic production cuts? Did butter demand siphon milk away from cheese production? The last option seems unlikely, with cream supplies abundant in November.
Despite the cheese dip, butter, and Nonfat Dry Milk (NFDM)/Skim Milk Powder (SMP) production rose. This happened even though California, which usually supplies 32% of the nation’s butter and 50% of its NFDM/SMP, saw a 9.2% drop in milk production. The state’s output increase hints at market shifts redirecting milk to more profitable products. However, NFDM stocks were 26 million pounds higher than expected, suggesting supply-demand balancing challenges. Whey stocks also rose slightly, yet they’re still 18.8% below last year, highlighting product inconsistencies.
The report shows a dynamic dairy sector facing both opportunities and hurdles. While butter and NFDM/SMP productions are up, the cheese production slump may reveal changes in consumer habits. These trends could lead to revamped production tactics, forecasting adjustments, and supply chain strategies to match consumer behavior and global market changes.
Cheese Production: A Twisting Tale of Detours and Discoveries
Turning our gaze to the complex world of cheese production, November 2024 surprised us all with a dip in output. Cheese lovers and producers were left puzzled. Why was there a decrease when milk production outside California was up? Intriguing. Let’s dig deeper. Some say it was a drop in demand. If cheesemakers thought fewer folks wanted gouda or cheddar, wouldn’t they cut back on production? It seems logical, but is it that straightforward?
Another angle points to major players predicting new production capacities in November. They could have reduced production to prevent a surplus, but this could have sparked shortages. Was this a smart move or an oversight? It’s something to think about, right?
The idea is that butter’s growing popularity might’ve taken milk away from cheese production. But with plentiful cream supplies, this theory doesn’t quite fit. Could butter’s demand have affected cheese production anyway? Food for thought!
Thoroughly analyzing the data demands meticulous consideration of multiple factors. November’s cheese drop might be a blip in the bigger picture. Follow the dairy story to spot the clues in the churn!
Butter and NFDM/SMP Production Surge: A Testament to Tactical Tinkering and Demand Dynamics
The rise in Nonfat Dry Milk (NFDM) and butter production in November 2024 came as a surprise, especially with milk production in California dropping by 9.2%. You’d expect less milk to mean less butter and NFDM/SMP, but we saw them increase. What gives?
Producers shifted gears during the holiday season. Other states likely picked up the slack despite California’s milk dip, maybe using surplus or optimizing their supply chains. Technological advances could’ve helped, making it easier to do more with less. Plus, higher export prices could’ve encouraged more production.
The shift towards increased NFDM/SMP and butter production presents both an opportunity and a challenge for dairy farmers. New strategies are needed with NFDM/SMP and butter driving the market. With more products, prices might level out or swing around, requiring quick action from everyone involved. This situation highlights a change in how the dairy sector handles resources, showcasing resilience and adaptability.
California’s Milk Production Plunge: Unveiling the Ripple Effects on a National Scale
The 9.2% drop in California’s milk production significantly impacts the dairy production scene. California is a major player, providing about 32% of U.S. butter, half of the nonfat dry milk (NFDM), and skim milk powder (SMP). This drop in output emphasizes the stability of this sector.
This shortfall may lead to a shift in milk use towards high-demand products like butter and NFDM/SMP. Surprisingly, California maintained firm butter and NFDM/SMP production levels, suggesting a strategic response to meet demands by using stored stocks or enhancing efficiency.
However, this extends beyond California, prompting considerations about the supply chain’s resilience and the ability of other states to manage the production gap. Will we see changes in dairy prices and availability across the nation? California’s role as a trendsetter might even affect global dairy trade plans.
California’s dairy sector might need fresh ideas, like improving feed efficiency and using water-saving tech to keep up. This calls for industry action to handle current impacts and prepare for future challenges.
November 2024’s Dairy Insights
Cheese Production: The data from November 2024 reveals distinct variations among different types of cheese. With 493 million pounds, Italian cheese grew by 1.1% from November 2023 but dropped 3.6% from October 2024. Conversely, American cheese production dropped to 448 million pounds, a decline of 4.9% from last year and 8.1% from last month.
Butter Production: Even with less milk, butter production stayed strong at 171 million pounds. That’s a 4.4% increase from November 2023 and 1.1% more than October 2024. This might mean that milk was mainly used for butter because of what the market needed.
Dry Milk Products: Some interesting notes here. Nonfat dry milk (NFDM) increased to 120 million pounds, 2.8% more than last year, showing strong demand or stockpiling. On the other hand, skim milk powder dropped significantly, down 33.5% to 47 million pounds.
Whey Products: Whey products show different trends. Dry whey was 66.2 million pounds, down 3.5% from last year. Lactose increased a bit by 0.8% to 84.7 million pounds. But whey protein concentrate fell 4.6%, totaling 39.4 million pounds.
Frozen Products: The frozen goods category had mixed results. Regular ice cream increased to 51.6 million gallons, a solid growth of 6.4%. In contrast, low-fat ice cream fell 7.2%, reaching 25.9 million gallons. Sherbet dropped 4.2% to 1.31 million gallons. On a brighter note, frozen yogurt grew by 7.6% to 2.61 million gallons.
Deciphering Dairy Dynamics: Navigating Through Consumer Demand, Trade Policies, and Economic Shifts
Emphasizing essential factors such as consumer demand is crucial to comprehending the fluctuations in market dynamics influencing dairy production. As diets shift between traditional and plant-based options, dairy producers must innovate. But how much does changing consumer taste impact production? Trade policies also play a significant role. Tariffs and trade rules can block or boost exports, affecting production and profits. Are you prepared for potential changes in international demand amidst global tensions, or are you heavily dependent on existing markets?
Economic conditions like inflation and currency changes influence buying habits and industry health. Does this make you wonder how these economic shifts are affecting your operations? Reflect on how ready your strategies are for sudden demand increases. These market dynamics are not remote; they are the lifeblood capable of reshaping your dairy business. Use these insights to explore new paths for your operations.
The Bottom Line
Wrapping up our look at November 2024’s dairy production, it’s clear the industry is at a crossroads. The drop in cheese production and the rise in butter and NFDM/SMP show how unpredictable the market can be. With California driving these changes, understanding the ripple effects is key for everyone in the industry. This report highlights the need to stay flexible with changing consumer demands, trade policies, and economic trends. These factors will shape strategies, possibly leading to new solutions and partnerships. So, what does this mean for you? As a dairy pro, it’s a great time to dig into these trends, connect with others, and share ideas. Consider using these insights in your strategic plans to boost efficiency, sustainability, and profits. Your proactive engagement can guide the industry through these transformative changes. Stay informed, stay connected, and lead the way in our industry.
Bullvine Daily is your essential e-zine for staying ahead in the dairy industry. With over 30,000 subscribers, we bring you the week’s top news, helping you manage tasks efficiently. Stay informed about milk production, tech adoption, and more, so you can concentrate on your dairy operations.
To provide the best experiences, we use technologies like cookies to store and/or access device information. Consenting to these technologies will allow us to process data such as browsing behavior or unique IDs on this site. Not consenting or withdrawing consent, may adversely affect certain features and functions.
Functional
Always active
The technical storage or access is strictly necessary for the legitimate purpose of enabling the use of a specific service explicitly requested by the subscriber or user, or for the sole purpose of carrying out the transmission of a communication over an electronic communications network.
Preferences
The technical storage or access is necessary for the legitimate purpose of storing preferences that are not requested by the subscriber or user.
Statistics
The technical storage or access that is used exclusively for statistical purposes.The technical storage or access that is used exclusively for anonymous statistical purposes. Without a subpoena, voluntary compliance on the part of your Internet Service Provider, or additional records from a third party, information stored or retrieved for this purpose alone cannot usually be used to identify you.
Marketing
The technical storage or access is required to create user profiles to send advertising, or to track the user on a website or across several websites for similar marketing purposes.
To provide the best experiences, we and our partners use technologies like cookies to store and/or access device information. Consenting to these technologies will allow us and our partners to process personal data such as browsing behavior or unique IDs on this site and show (non-) personalized ads. Not consenting or withdrawing consent, may adversely affect certain features and functions.
Click below to consent to the above or make granular choices. Your choices will be applied to this site only. You can change your settings at any time, including withdrawing your consent, by using the toggles on the Cookie Policy, or by clicking on the manage consent button at the bottom of the screen.
Functional
Always active
The technical storage or access is strictly necessary for the legitimate purpose of enabling the use of a specific service explicitly requested by the subscriber or user, or for the sole purpose of carrying out the transmission of a communication over an electronic communications network.
Preferences
The technical storage or access is necessary for the legitimate purpose of storing preferences that are not requested by the subscriber or user.
Statistics
The technical storage or access that is used exclusively for statistical purposes.The technical storage or access that is used exclusively for anonymous statistical purposes. Without a subpoena, voluntary compliance on the part of your Internet Service Provider, or additional records from a third party, information stored or retrieved for this purpose alone cannot usually be used to identify you.
Marketing
The technical storage or access is required to create user profiles to send advertising, or to track the user on a website or across several websites for similar marketing purposes.


 The Sunday Read Dairy Professionals Don’t Skip.