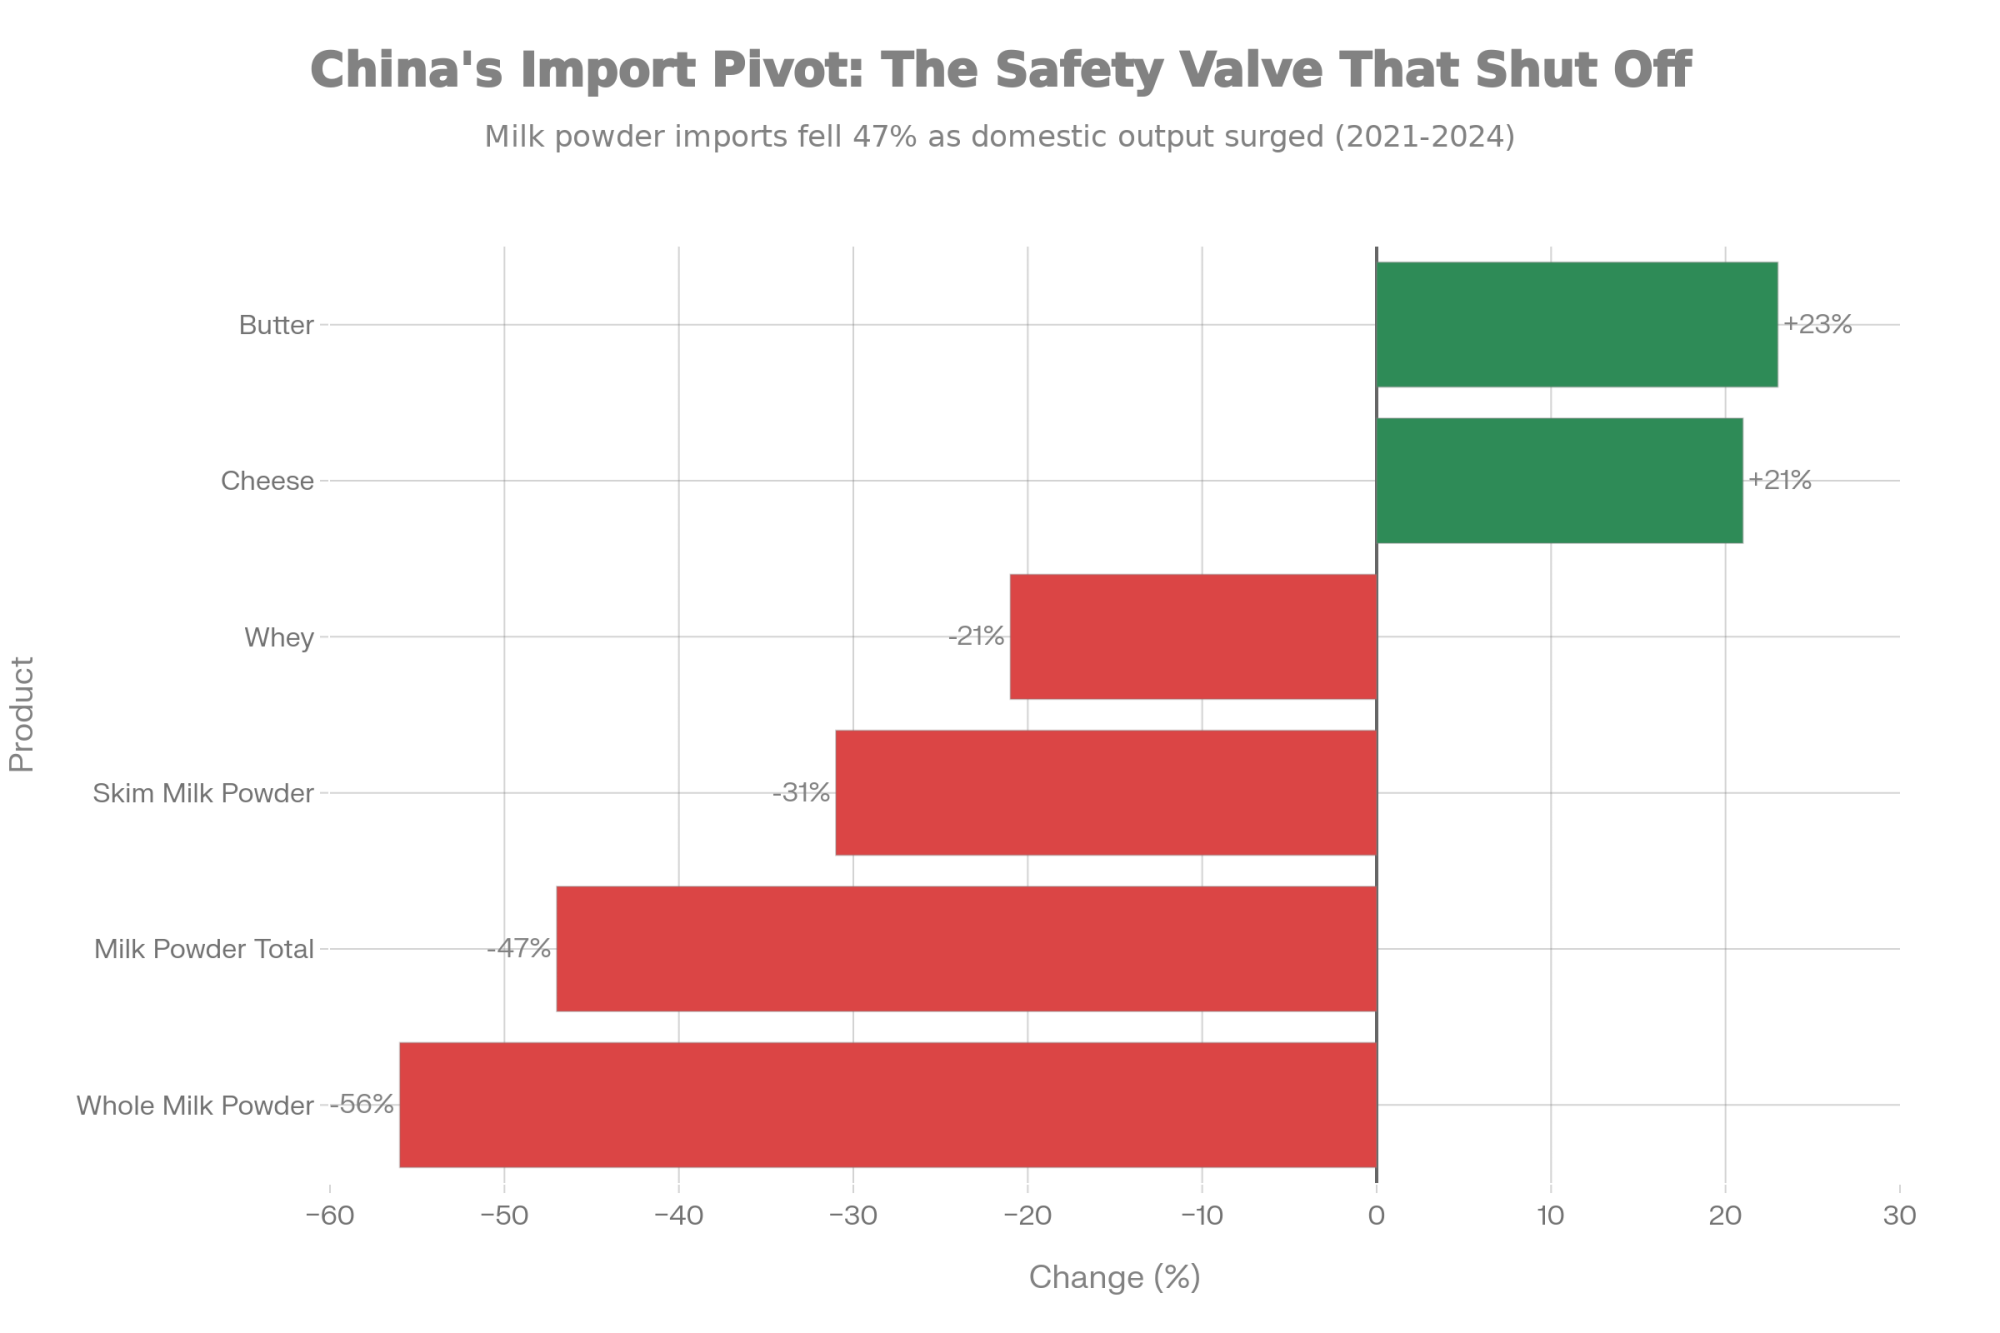
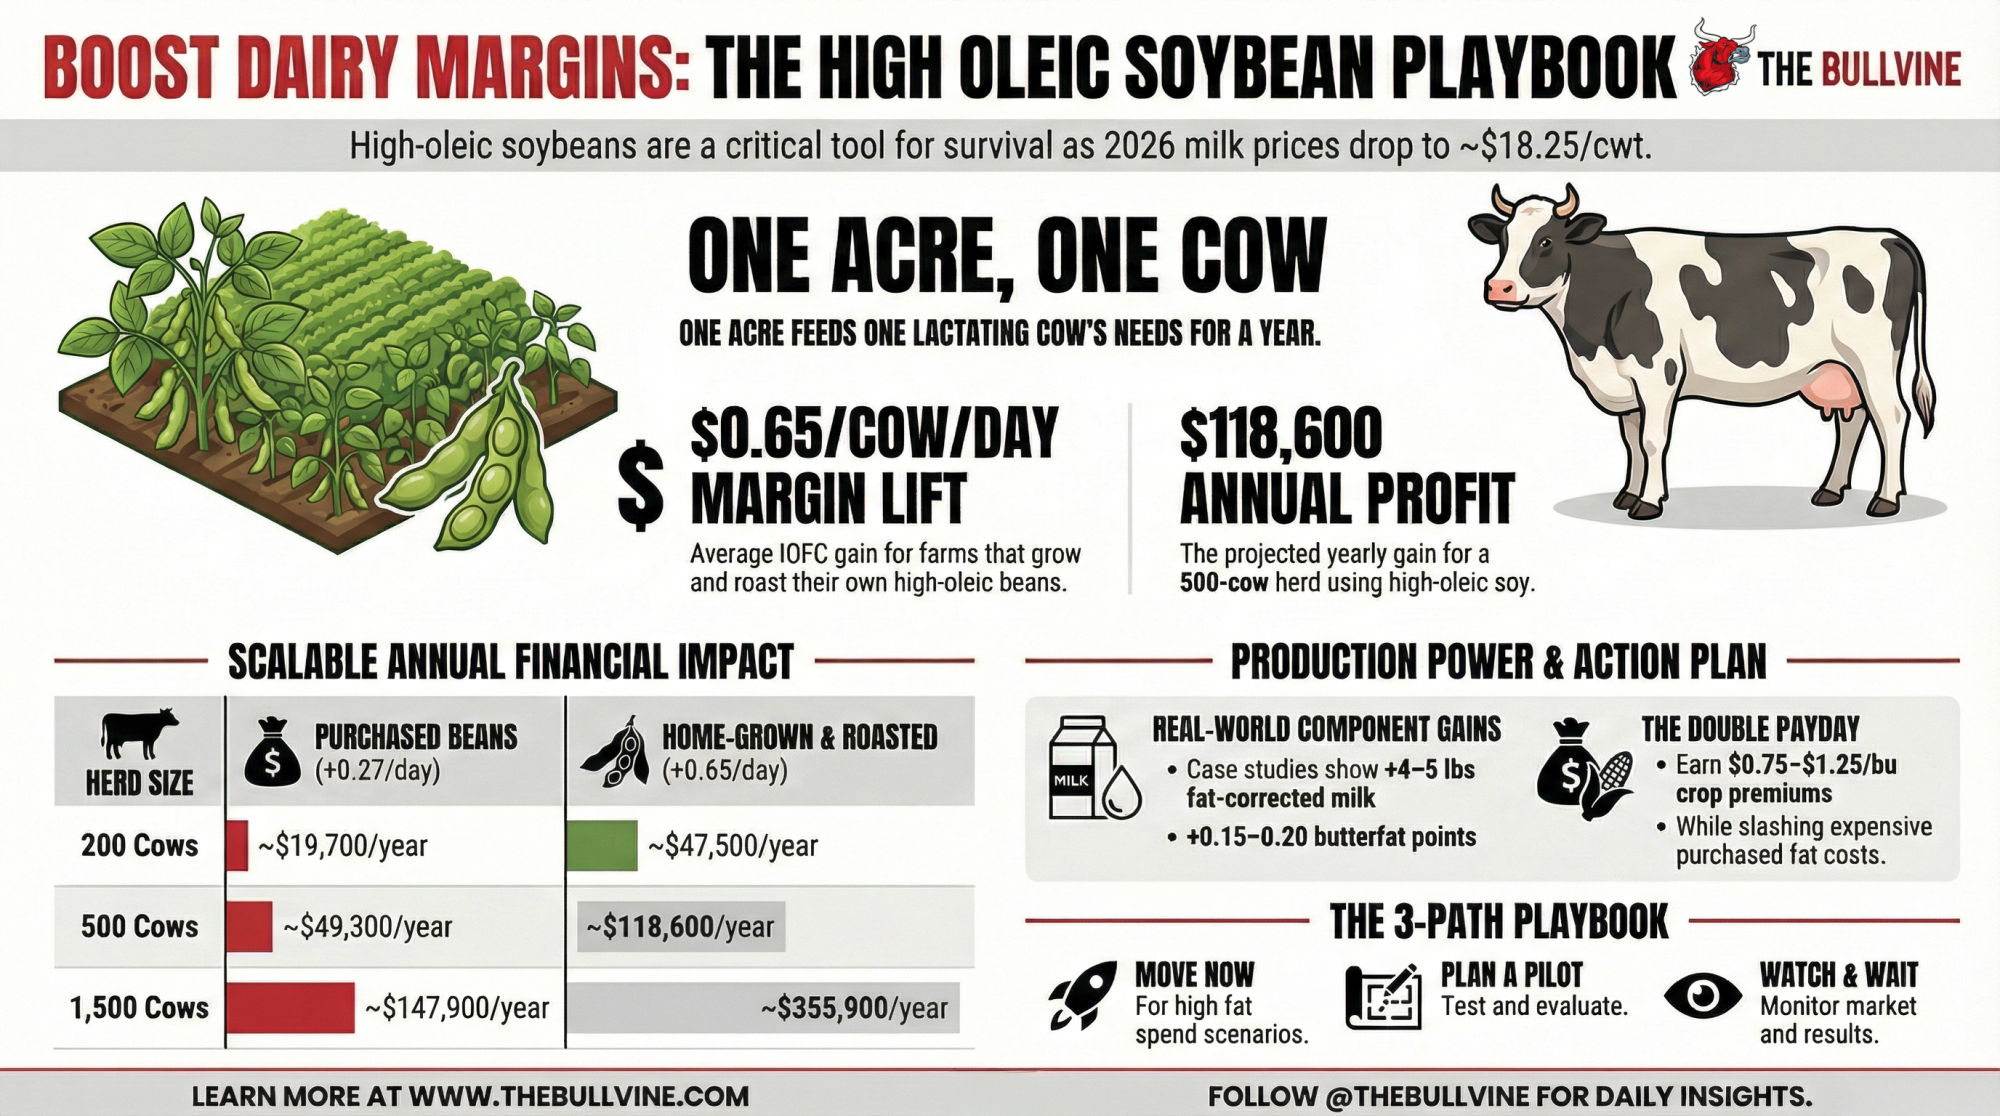
$18 milk in 2026. T&H Dairy hit $0.65/cow/day with high-oleic soy—$118K/year on 500 cows. One acre feeds one cow. How does your fat spend compare?
Executive Summary: USDA’s January 2026 outlook drops the U.S. all‑milk price forecast to about $18.25/cwt, which makes every extra $0.30–$0.60/cow/day in margin a survival number, not a bonus. New Michigan State University research shows high‑oleic soybeans can deliver that kind of lift, with modeled IOFC gains of $0.27/cow/day when purchased roasted and about $0.65/cow/day when farms grow and roast their own beans, and roughly one acre of high‑oleic soy feeding one lactating cow for a year. T&H Dairy in Michigan is already seeing 4–5 pounds more fat‑corrected milk, 0.15–0.20 points more butterfat, and about $0.65/cow/day in IOFC at 7.5–8 pounds of roasted beans, which works out to around $118,600 a year on 500 cows and well into six figures on larger herds. United Soybean Board data adds crop‑side upside, with high‑oleic contracts across 16 states paying $0.75–$1.25/bu (and in some cases around $2.20/bu) over commodity beans—roughly $40–70/acre extra at typical yields before those beans ever hit the bunk. The article makes the case that high‑oleic soybeans are a serious 2026 fat tool—not a magic bullet—and walks owners and managers through a three‑path playbook (move now, plan a pilot, or watch and wait) plus a simple checklist to decide whether their acres, bins, and fat bill justify turning high‑oleic into part of their long‑term margin strategy.
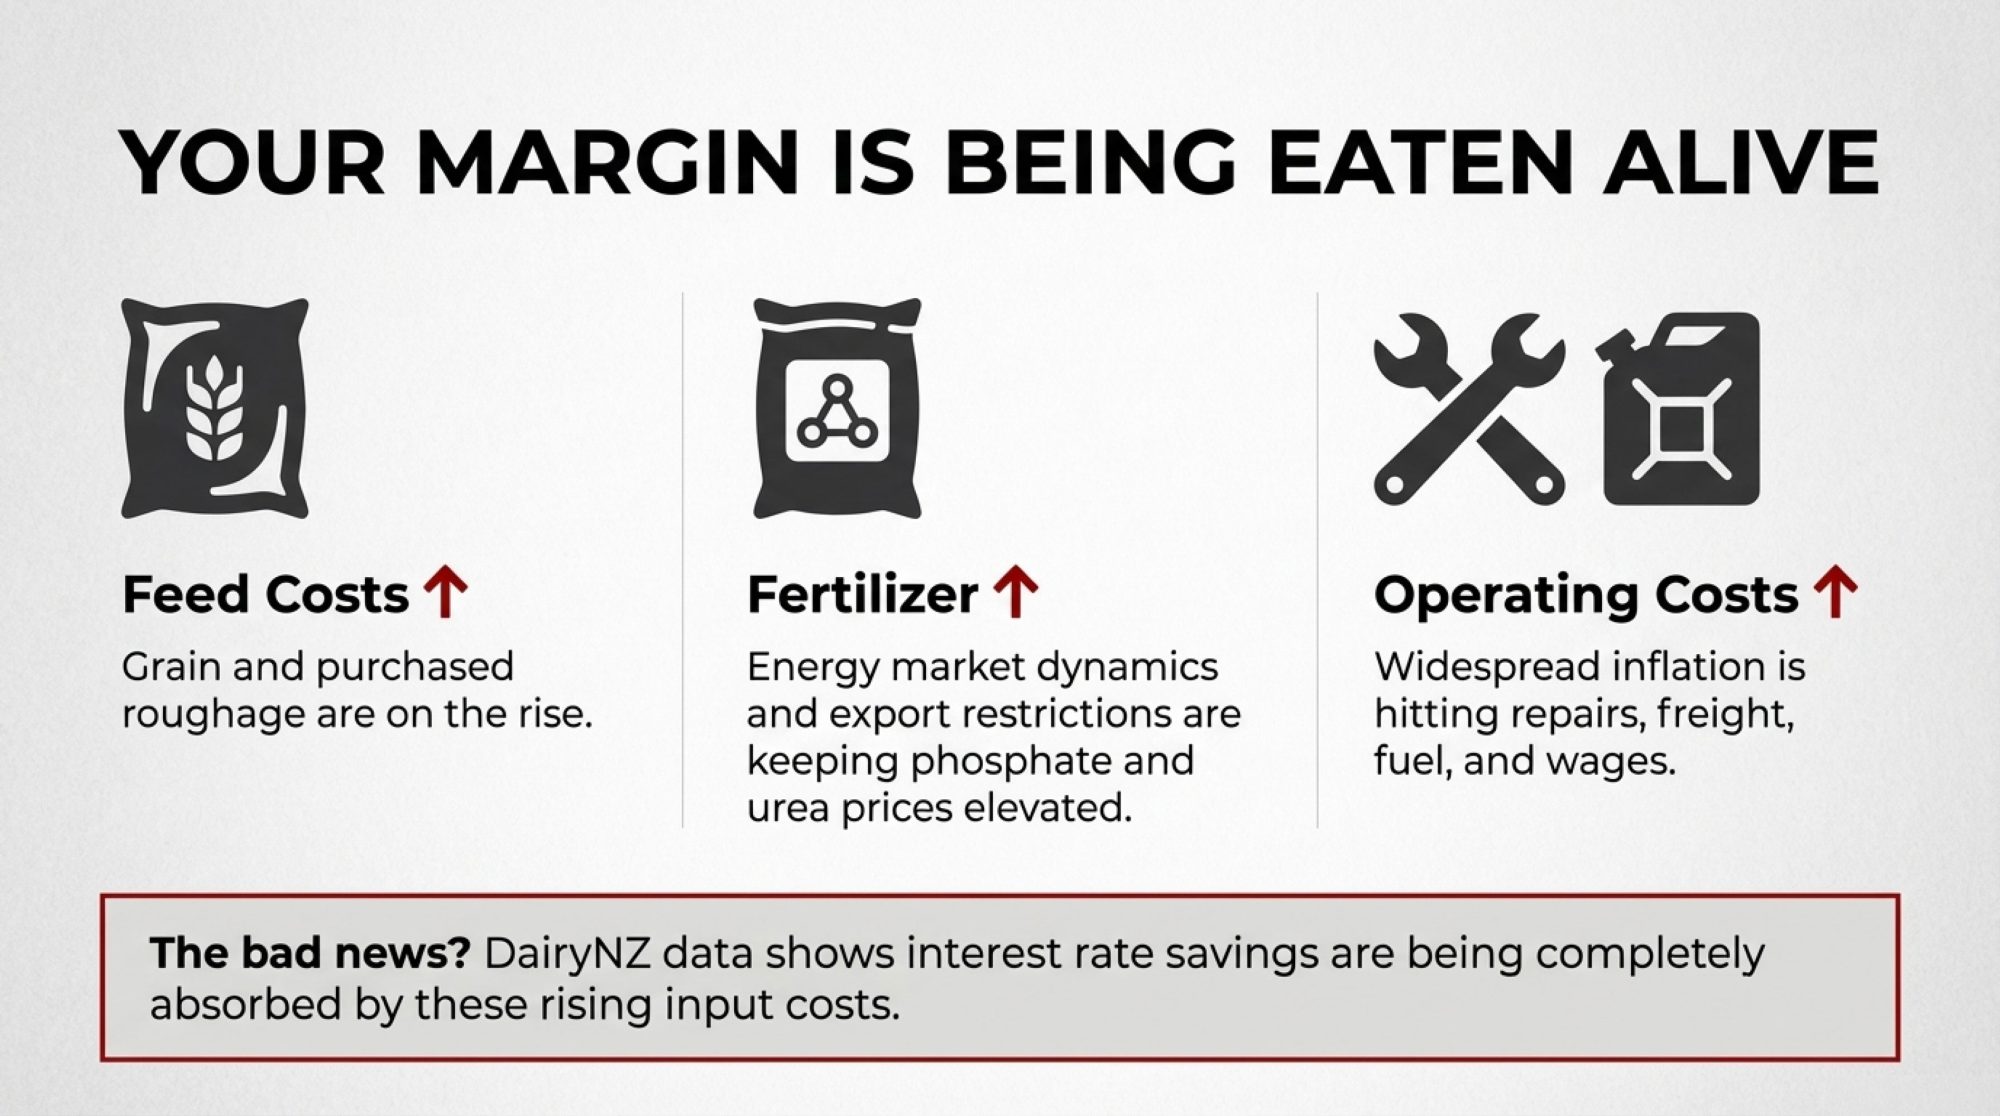
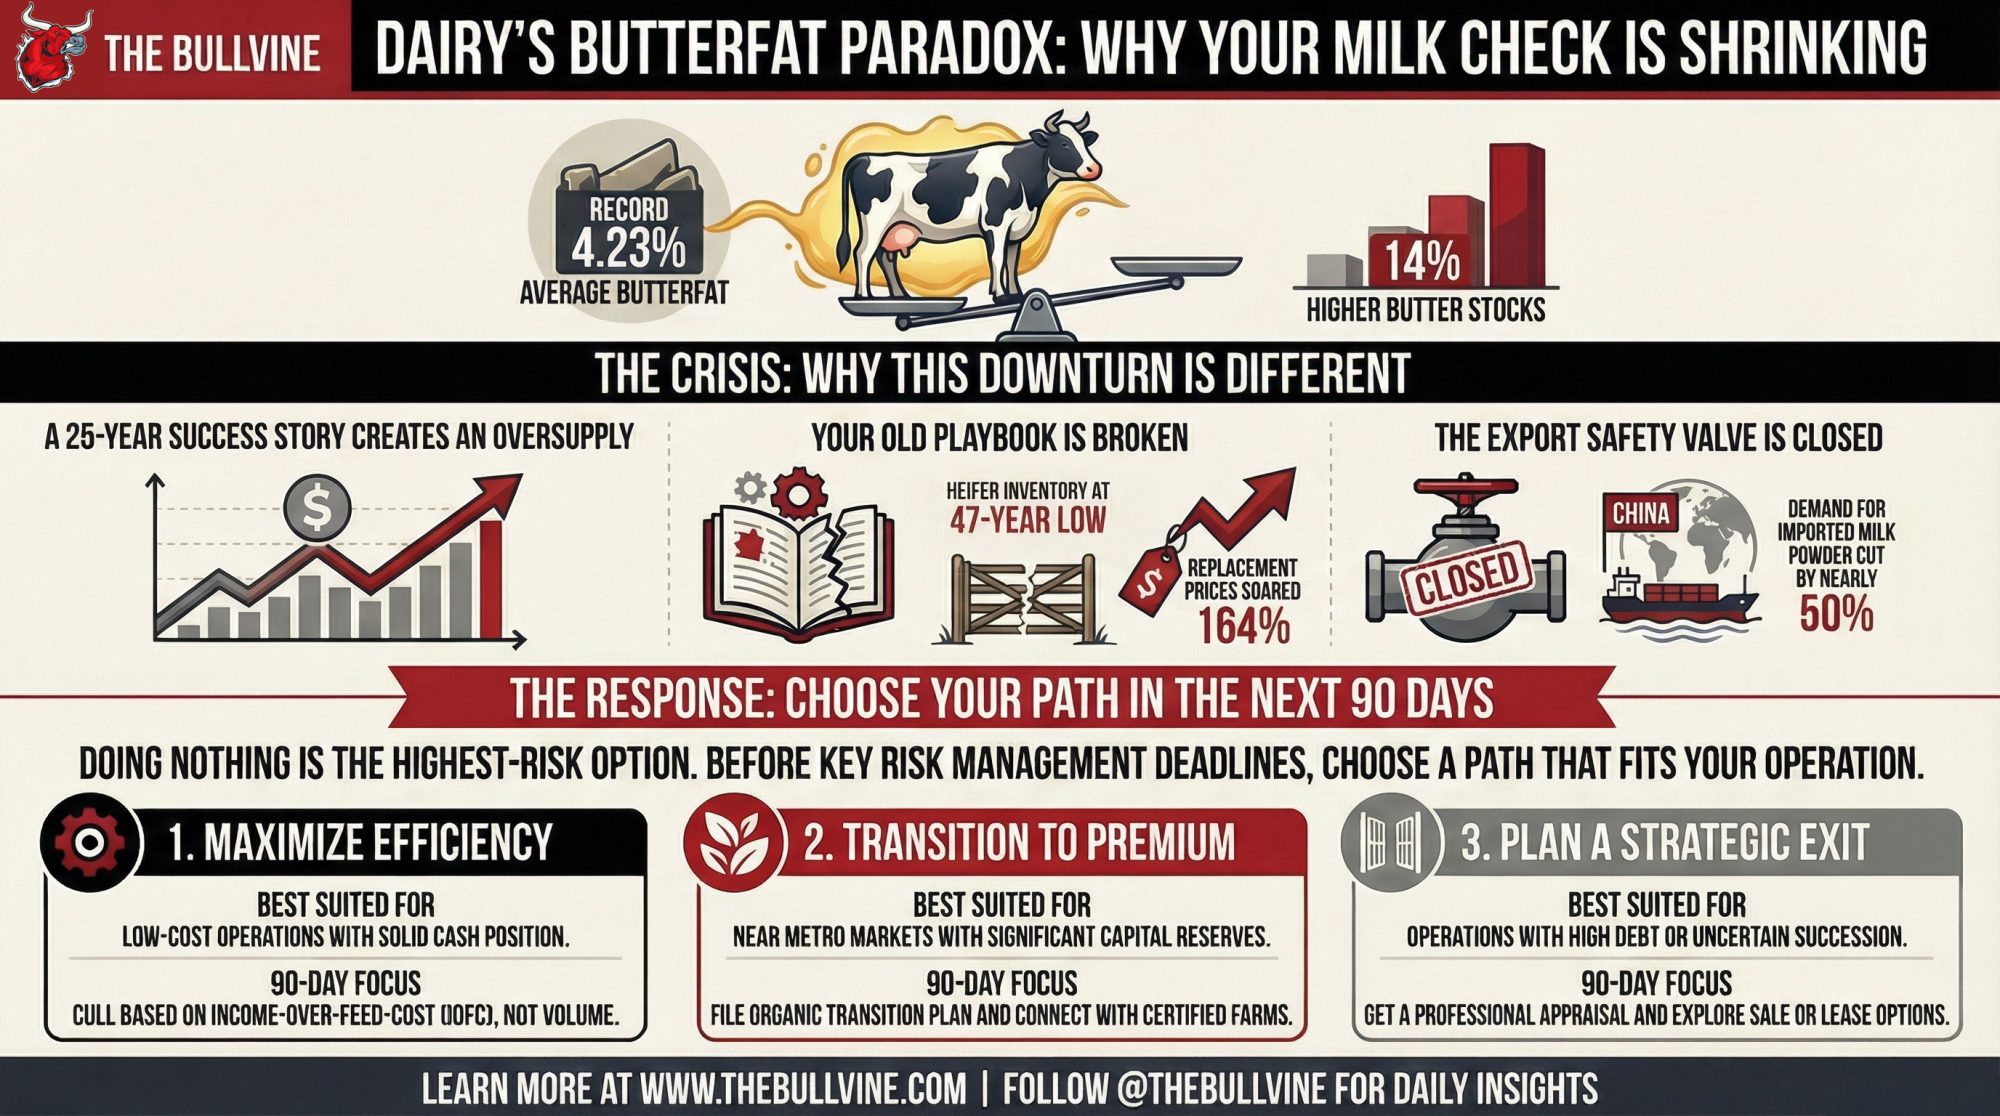
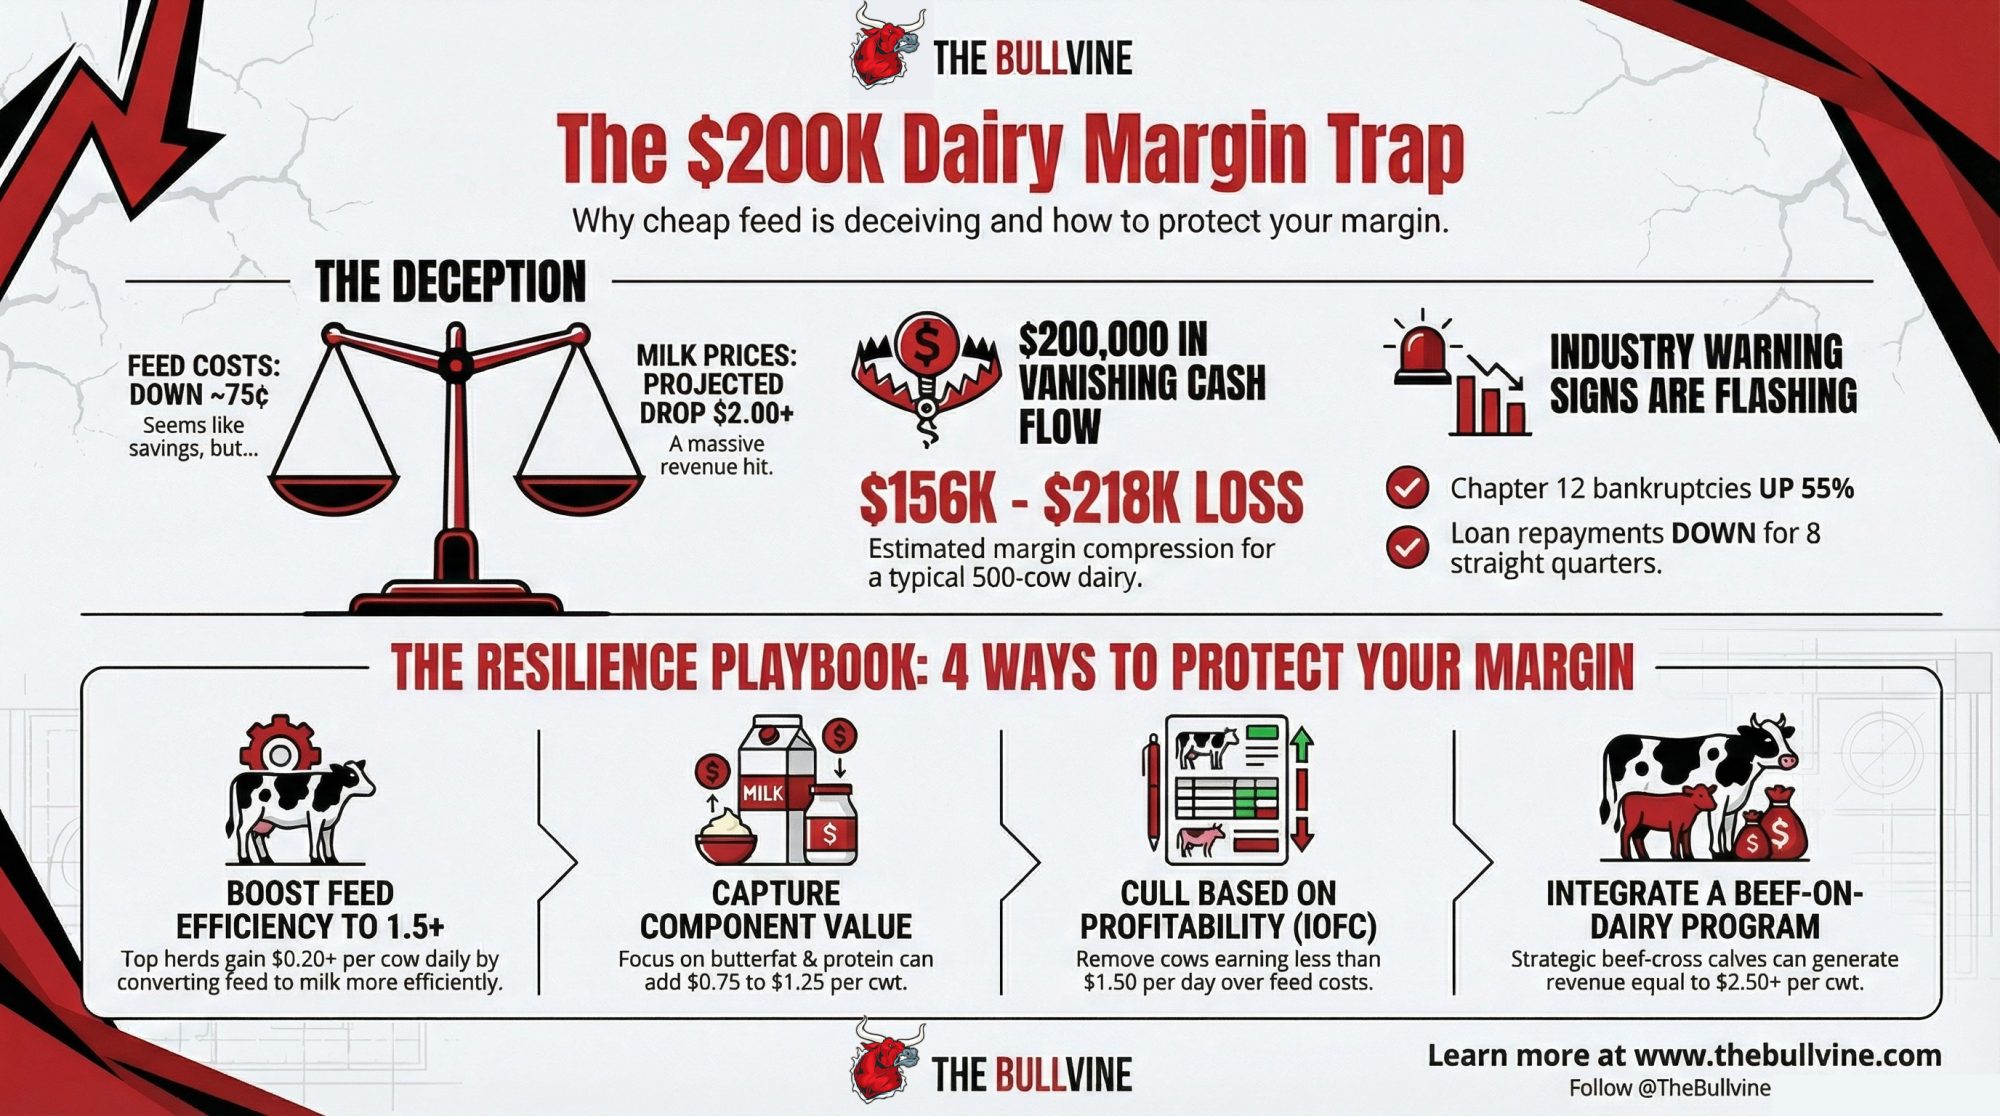
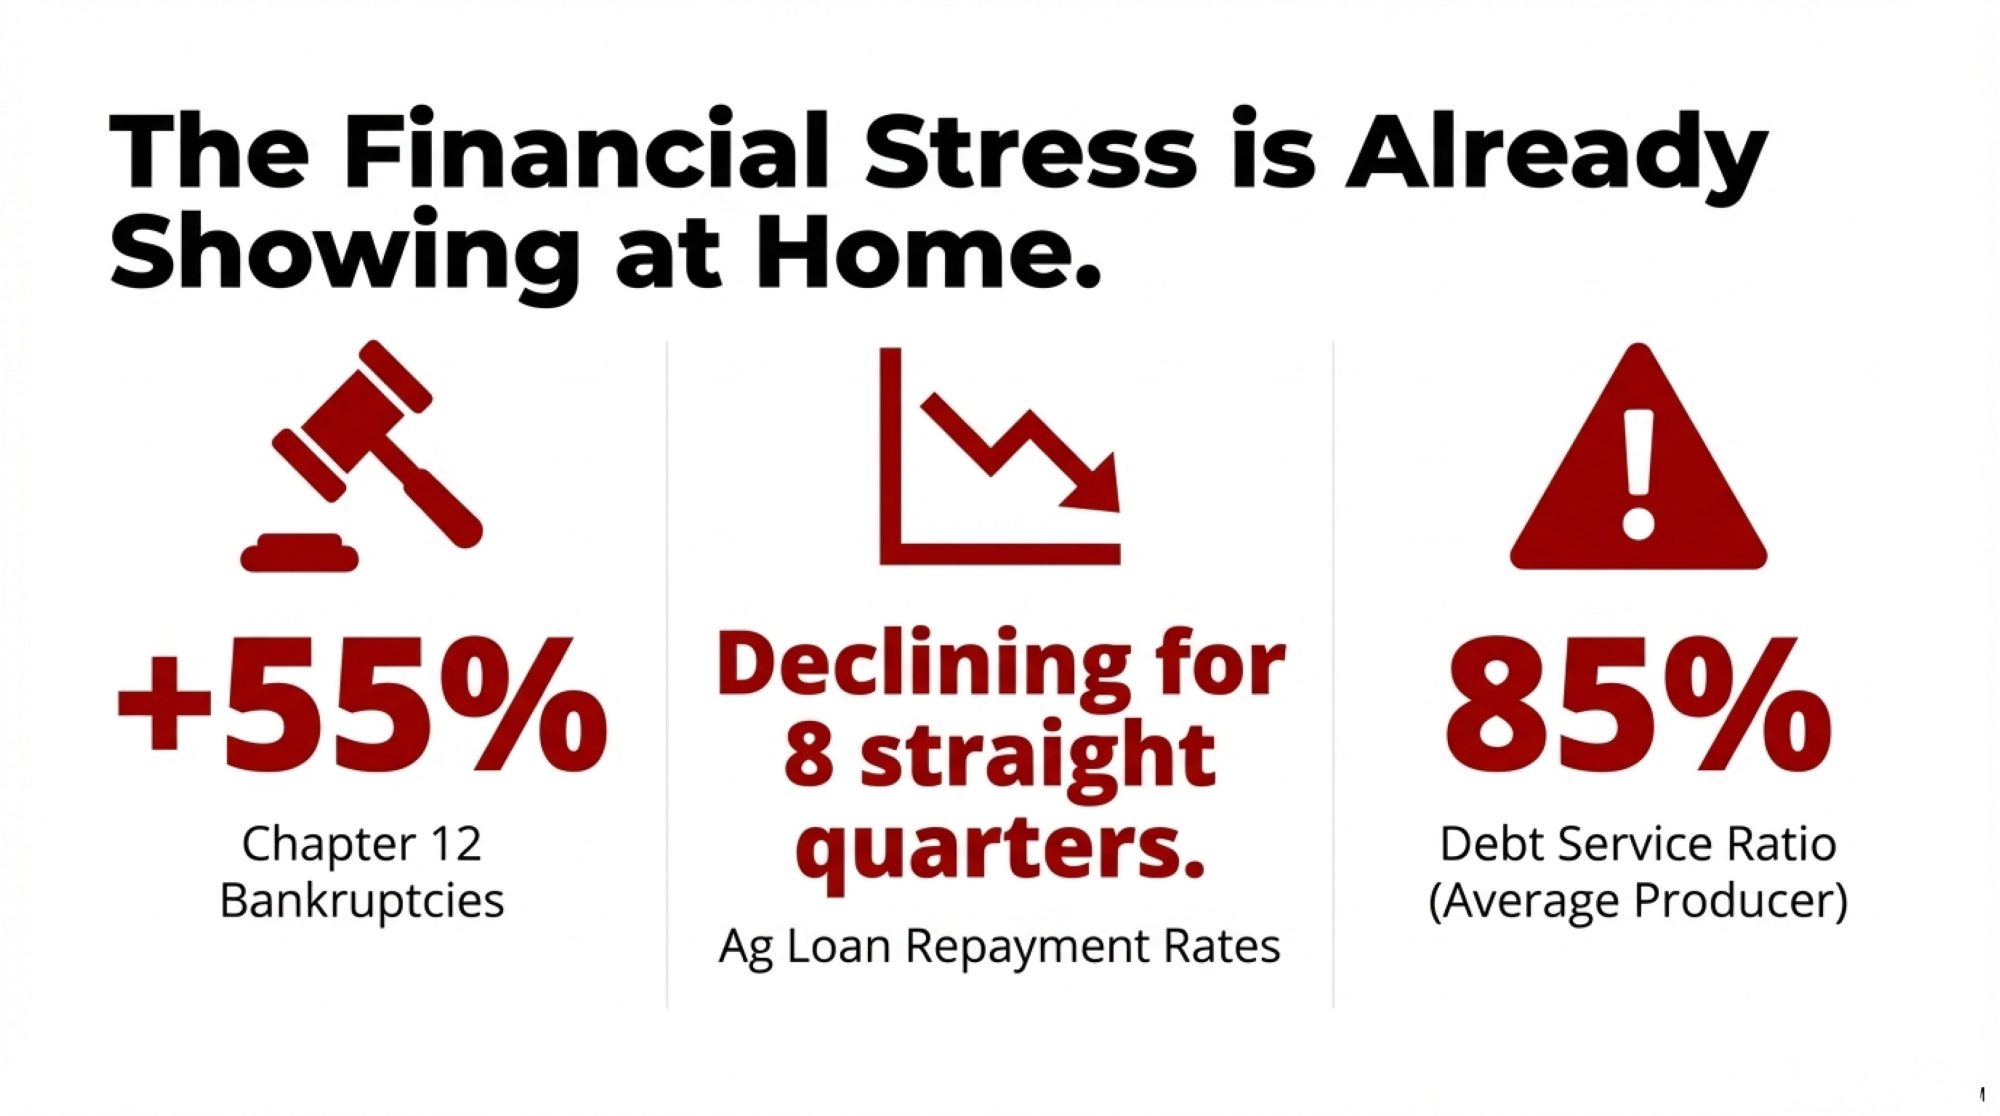
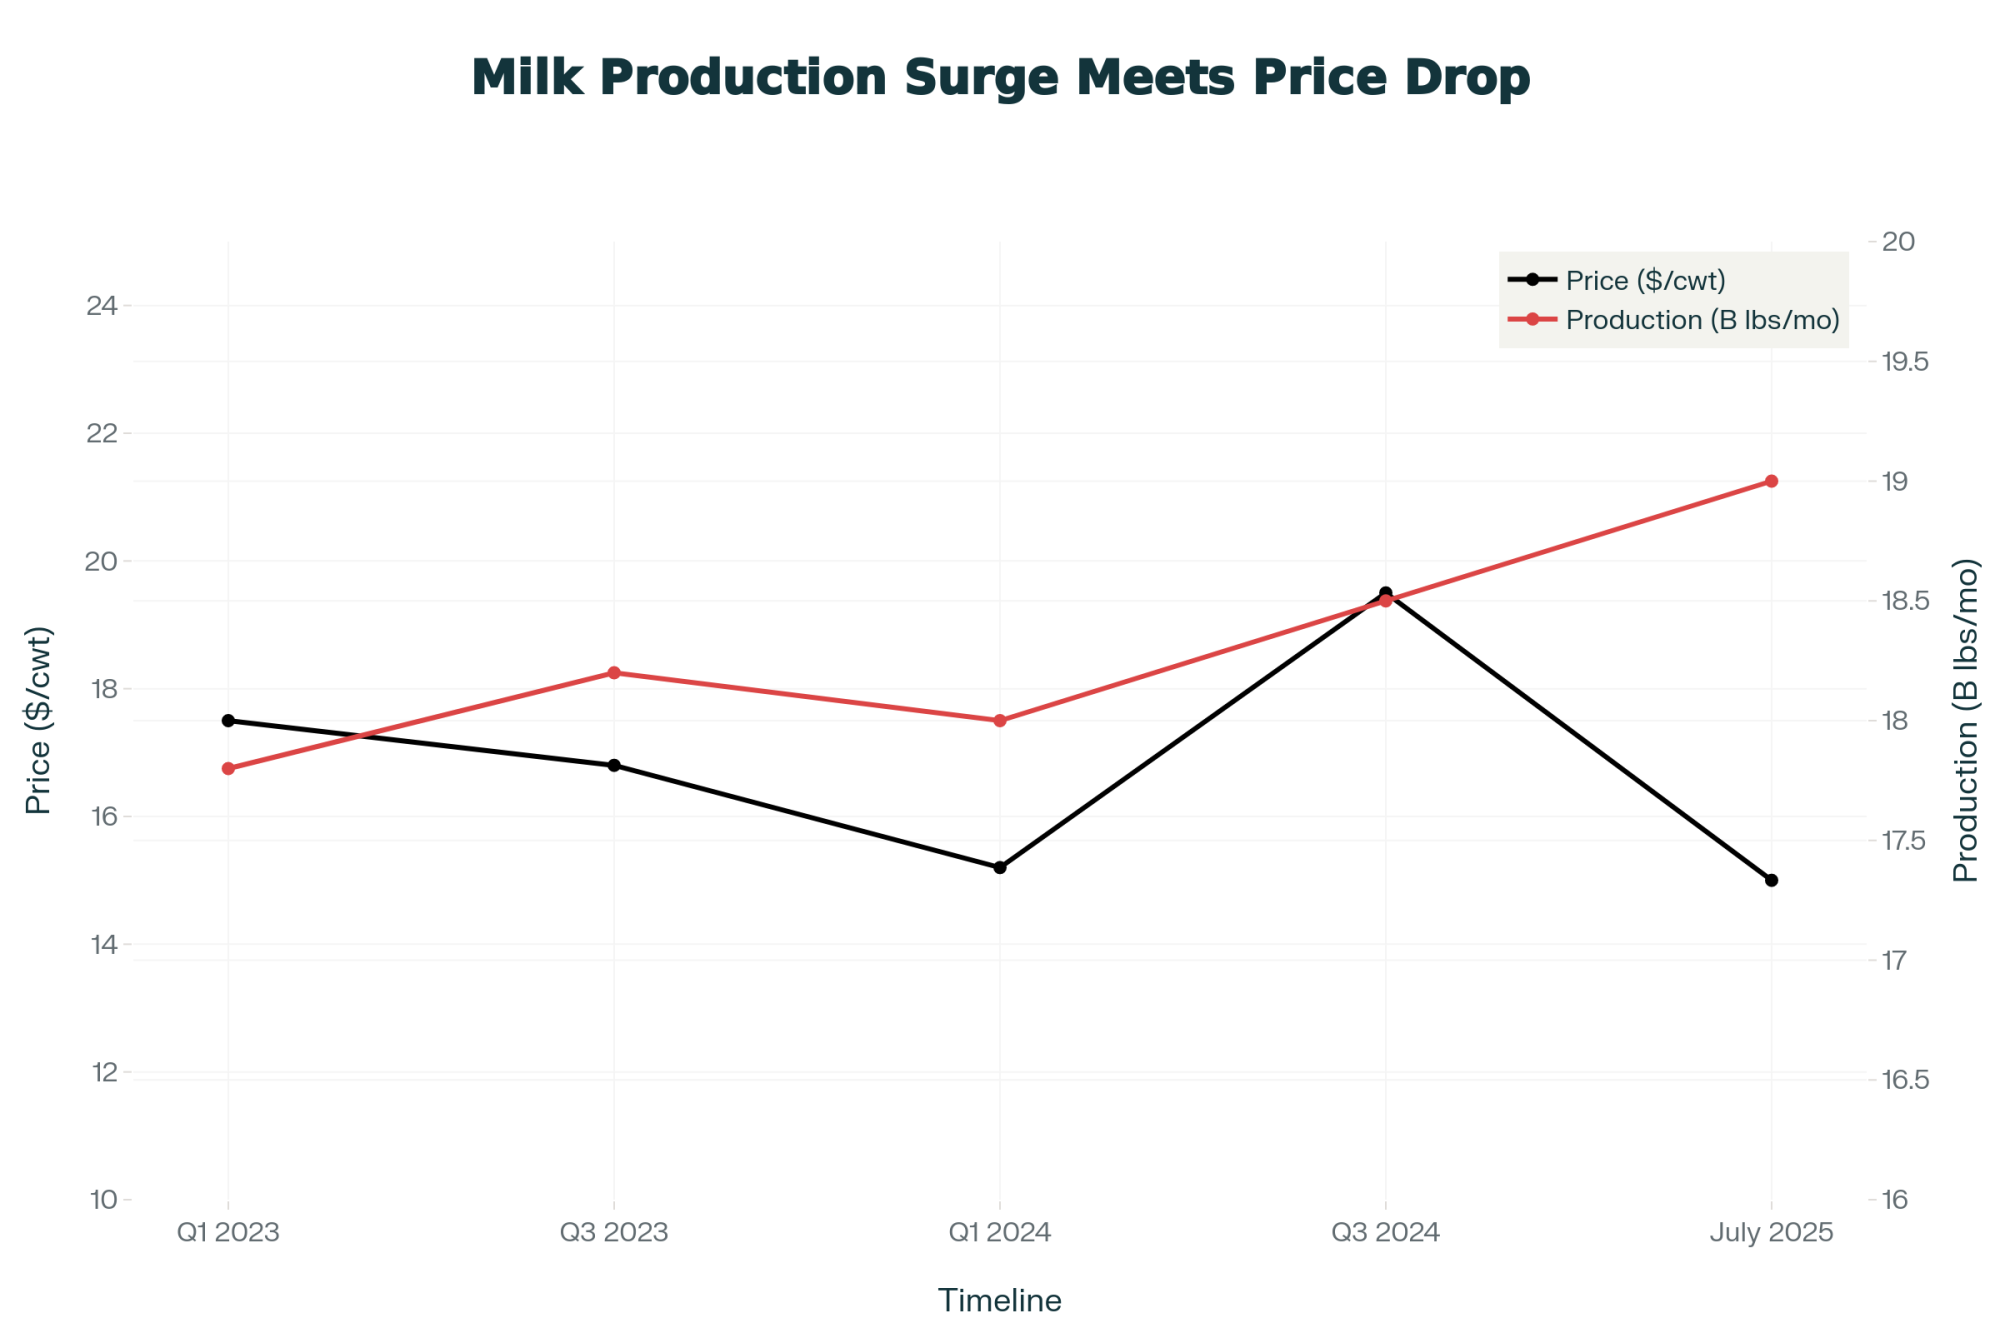
Here’s what’s really going on. USDA’s January 2026 Livestock, Dairy, and Poultry Outlook pegs the 2026 U.S. all‑milk price at about $18.25 per hundredweight, down from a forecast of over $21 for 2025. At the same time, Class III futures are sitting down in the mid‑$16s, which is exactly the gap The Bullvine flagged earlier this month as a $150,000‑plus budgeting problem for a 300‑cow herd if you bet on the wrong number.

On paper, that 2026 downgrade doesn’t look dramatic. In the real world—spread across 200, 500, or 1,500 cows—it’s the difference between sleeping at night and explaining to your lender why your cash flow projections missed by six figures.
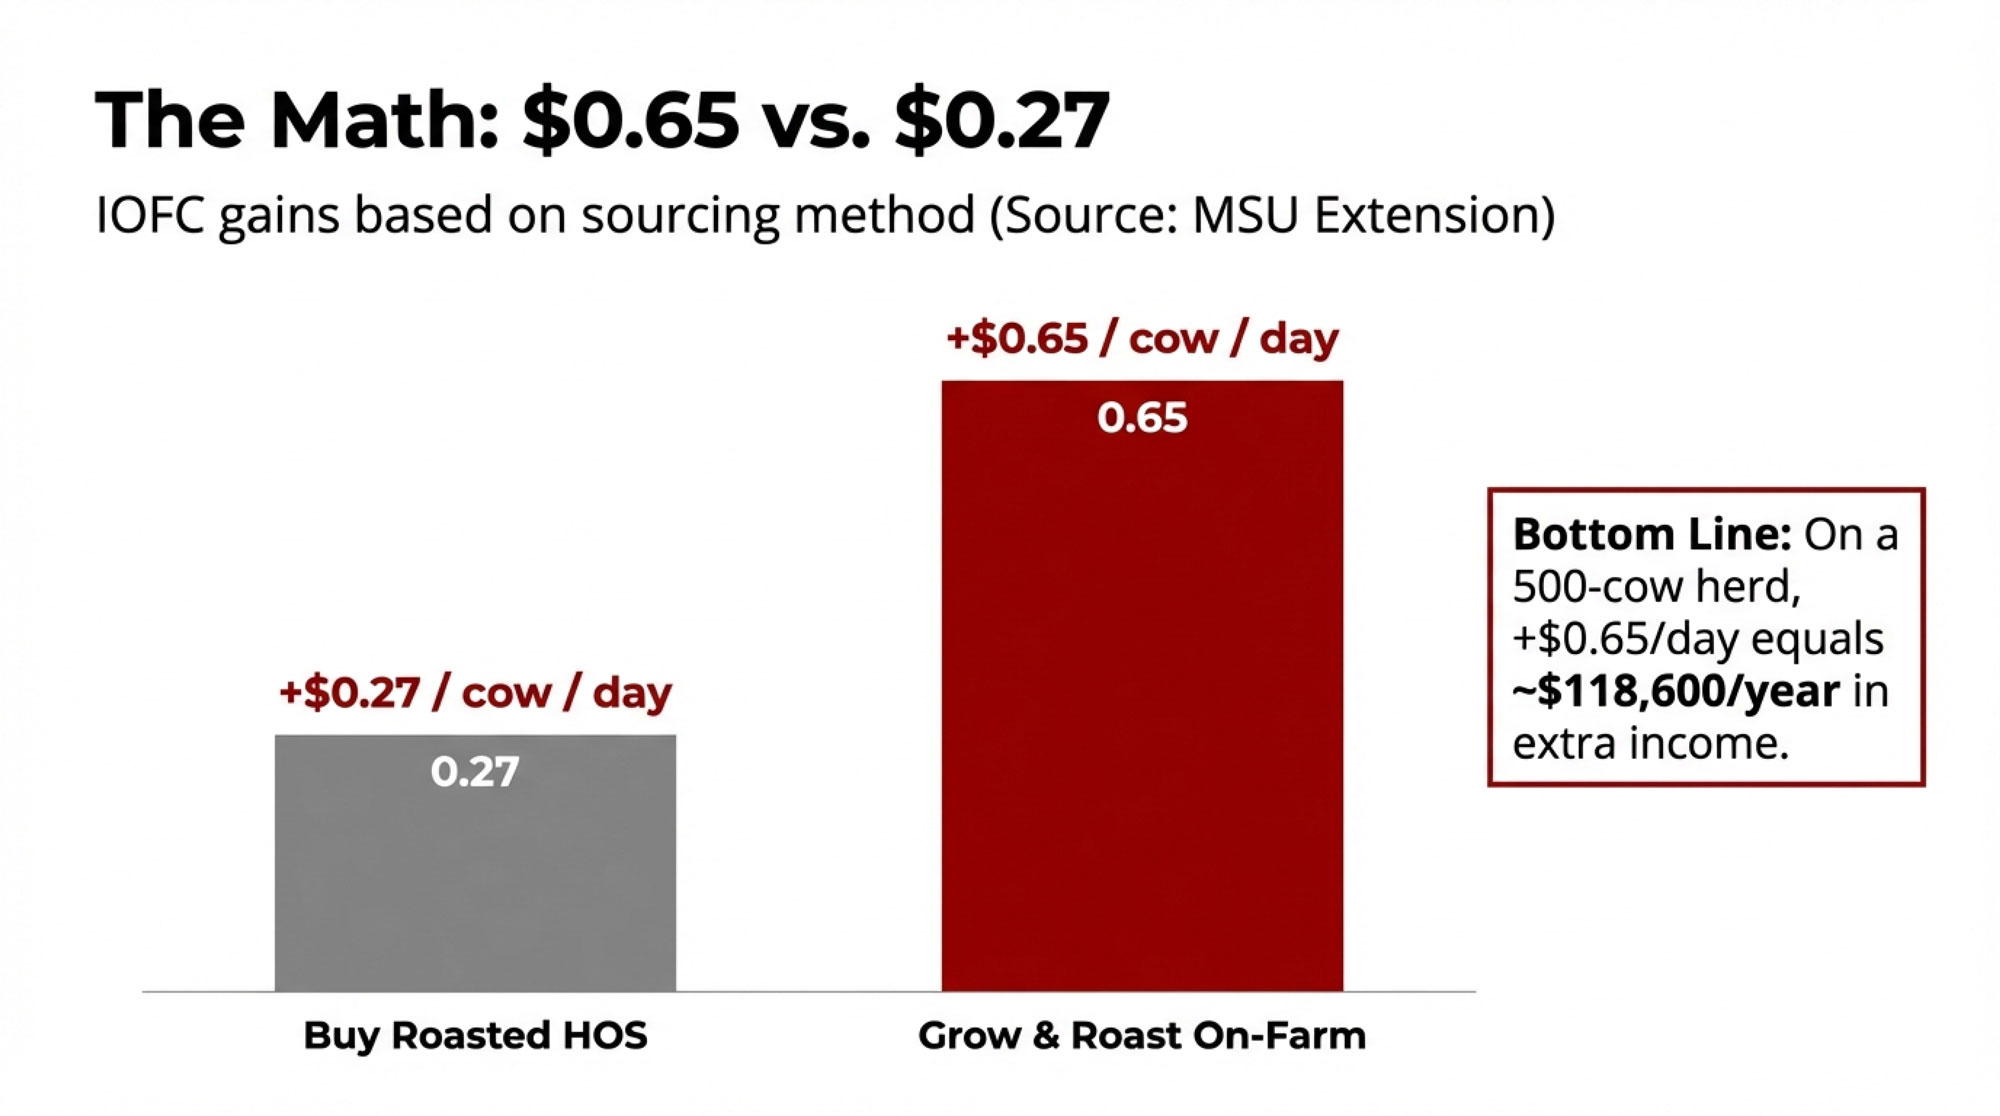
What’s interesting right now is that Michigan State University’s work with high‑oleic soybeans says farms that grow and roast their own beans are seeing about $0.65 per cow per day in extra income over feed cost, while farms buying roasted beans are still picking up around $0.27 per cow per day. At the feeding rates MSU is using, one acre of high‑oleic soybeans can cover one lactating cow’s needs for a full year, which suddenly makes your soybean acres feel a lot closer to your milk cheque than they did five years ago.
The real question isn’t “Are high‑oleic soybeans magic?” It’s whether your acres, your ration, and your infrastructure give you a realistic shot at turning this into repeatable dollars instead of one more “great idea” that never quite pencils out on your farm.
Looking at This Trend: What’s Actually Different in the Fat?
Let’s start where your nutritionist will start: the fat profile.
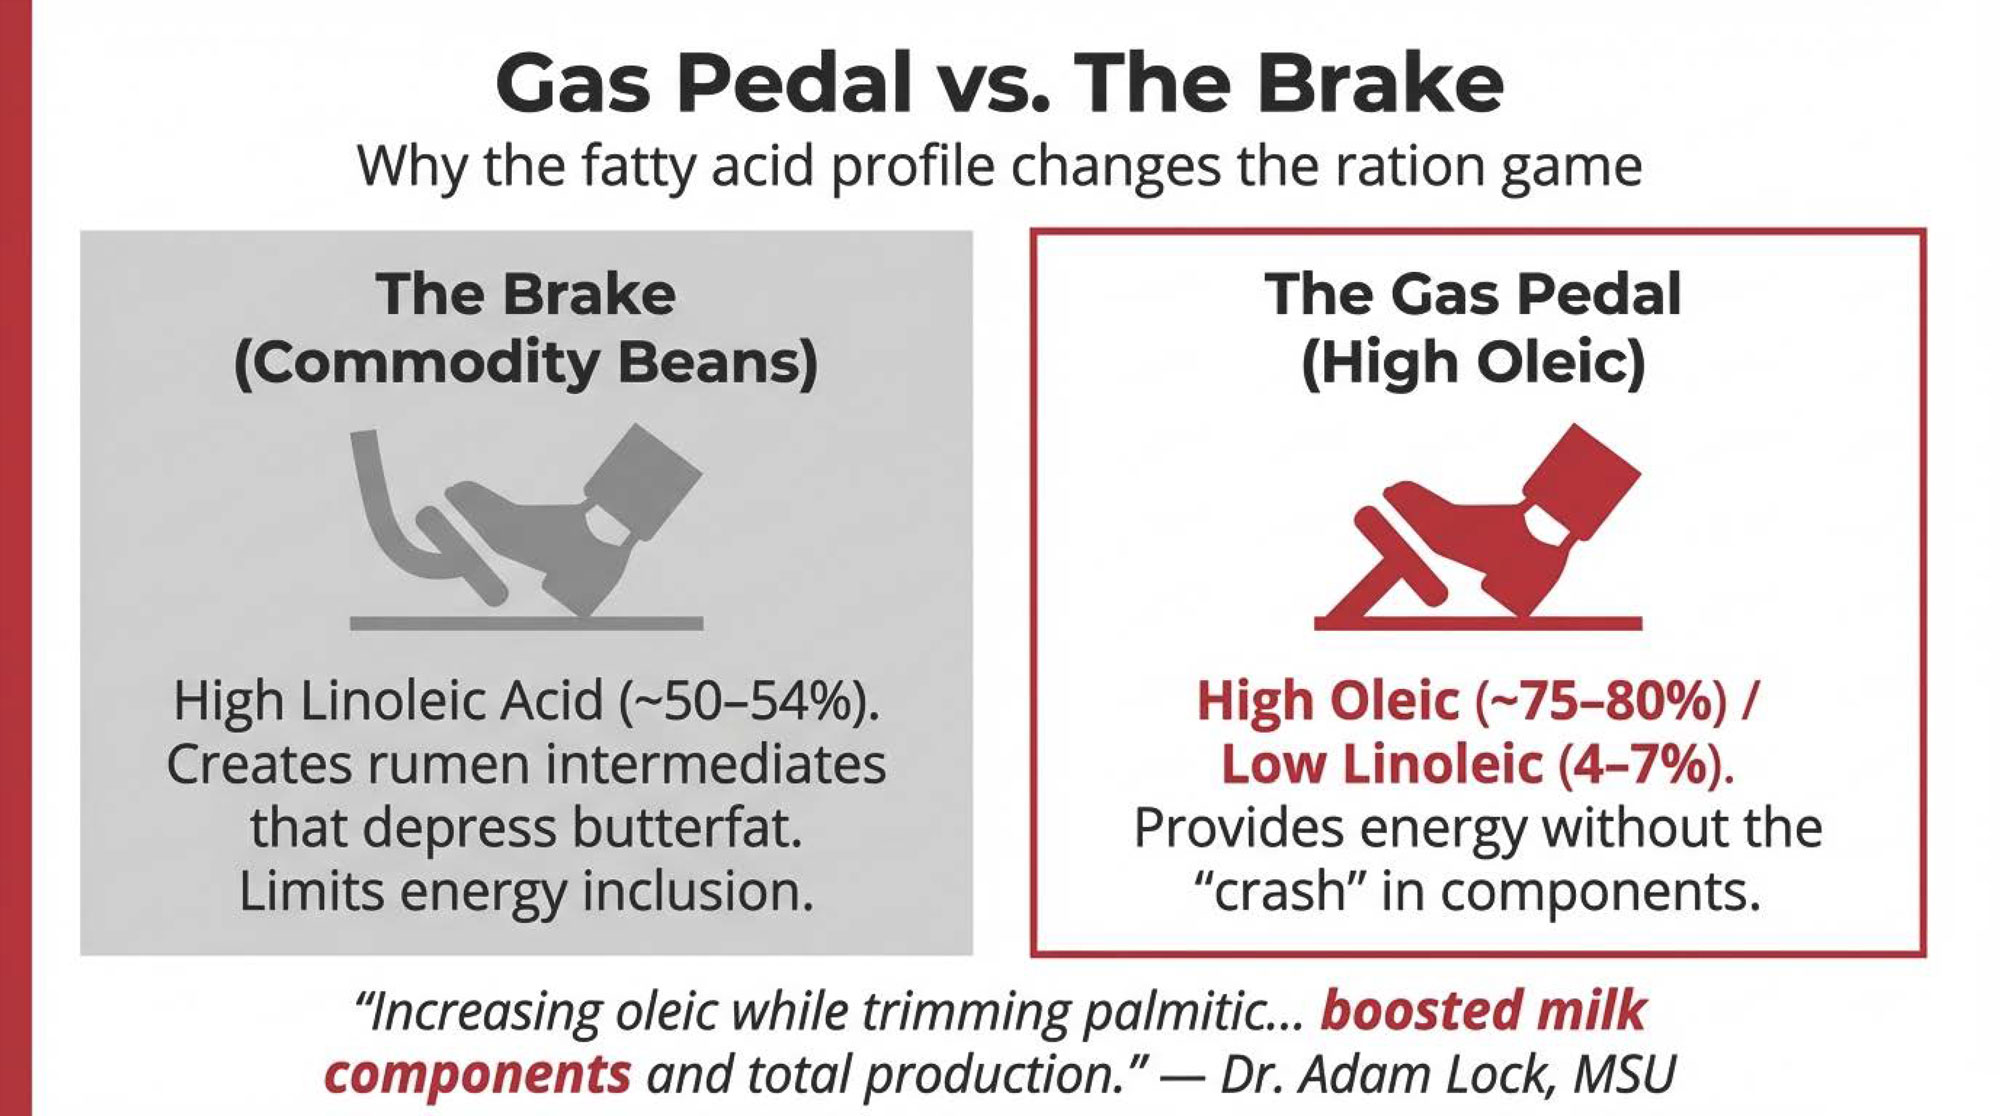
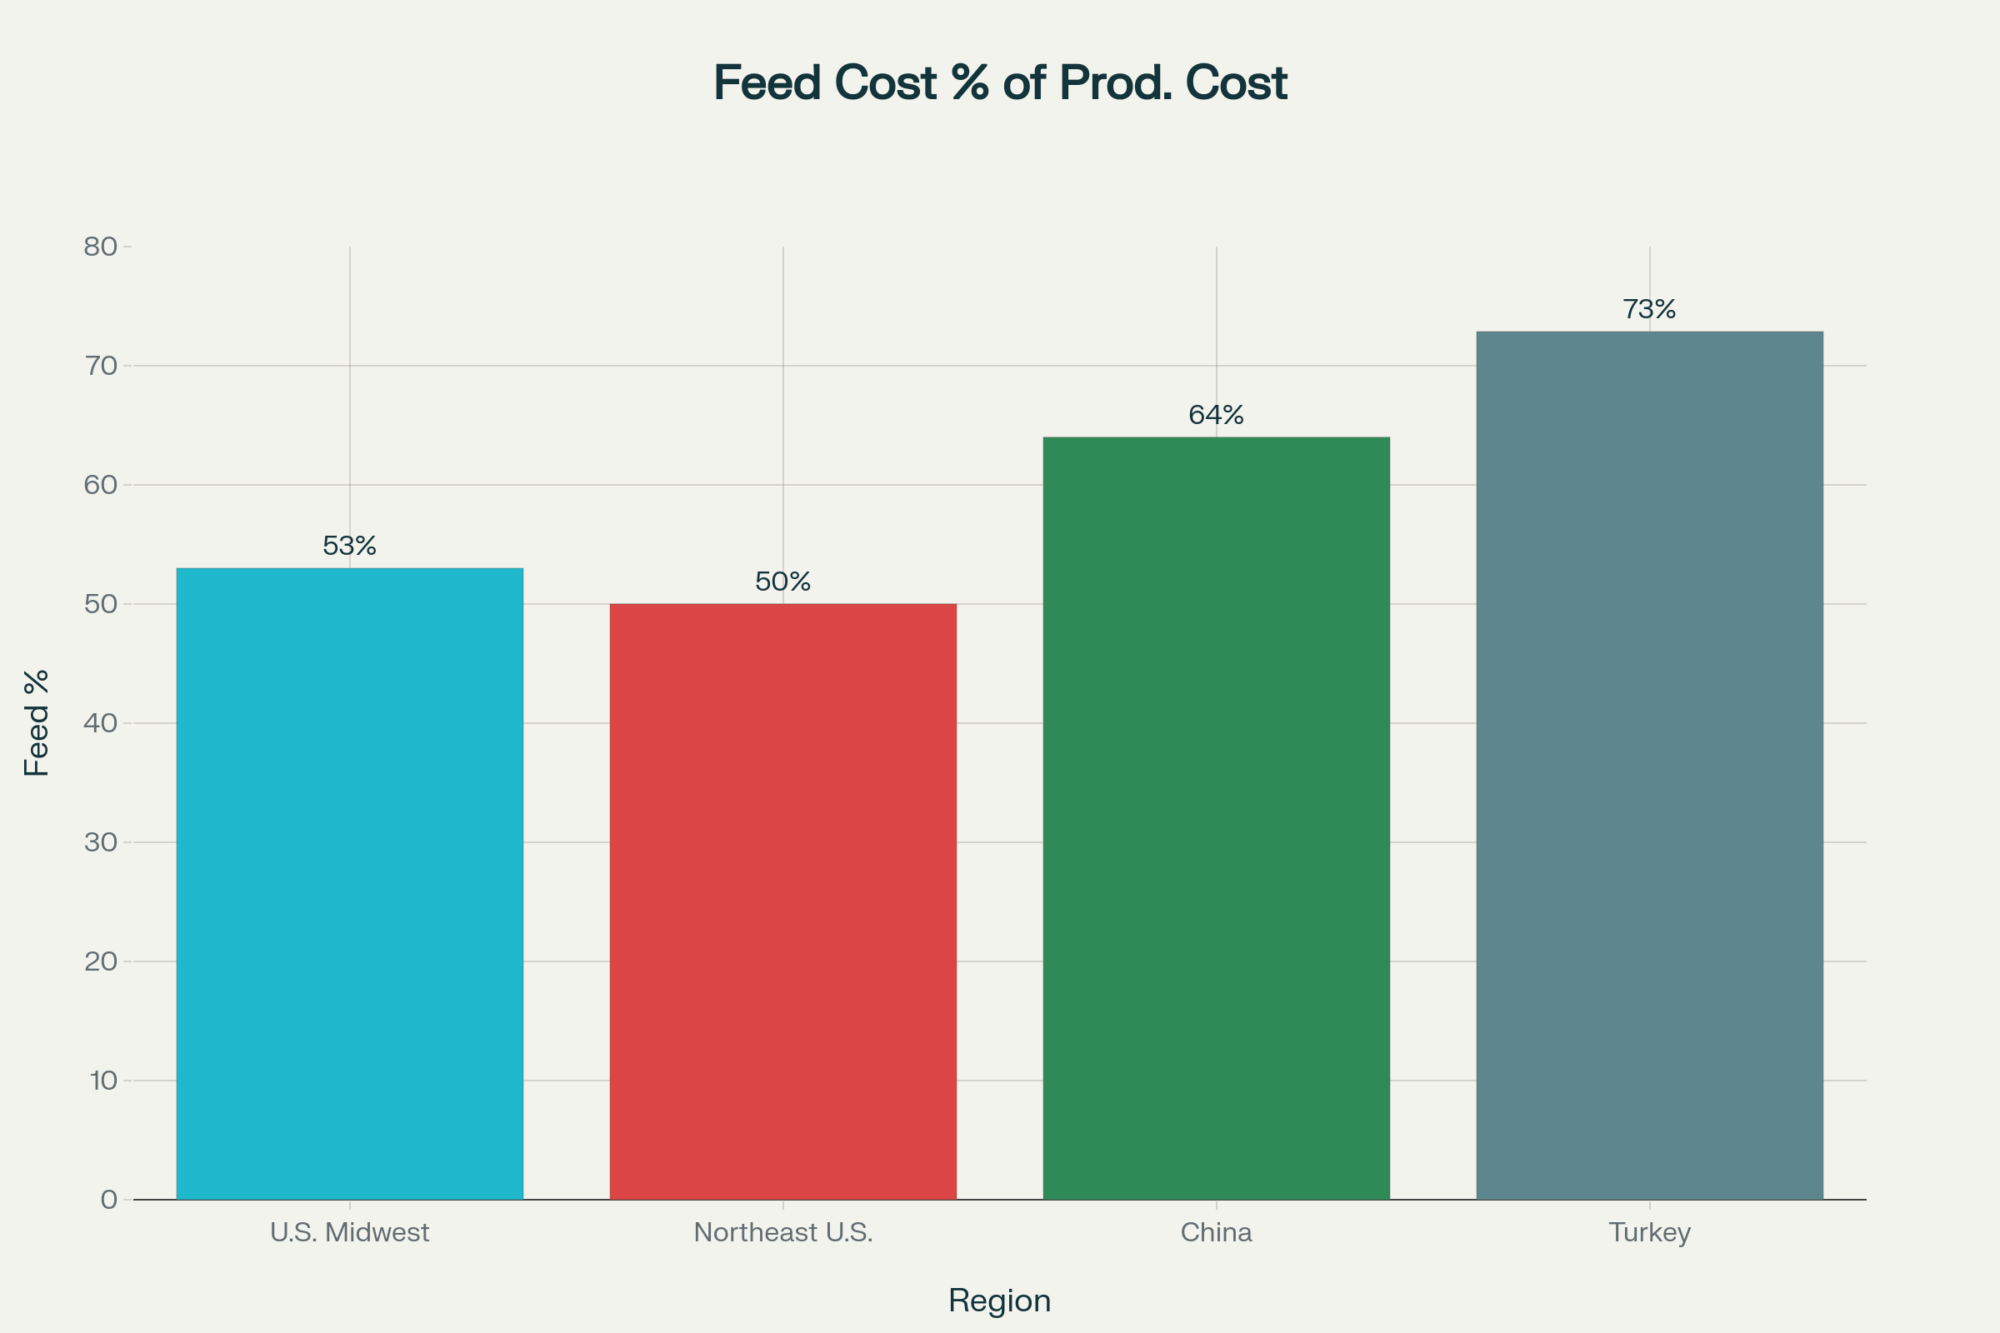
According to Michigan State University Extension’s 2025 “High‑oleic, high reward” analysis, typical commodity soybean oil is about 23% oleic acid and 50–54% linoleic acid. That big linoleic fraction is exactly why most nutritionists start putting on the brakes when they see a lot of whole beans show up in the diet—linoleic is more prone to producing rumen biohydrogenation intermediates that can chip away at butterfat performance when you push too hard.
| Fatty Acid Component | Commodity Soybeans (%) | Plenish® High-Oleic (%) | SOYLEIC® Non-GMO (%) |
| Oleic Acid | 23 | 75–80 | 78–84 |
| Linoleic Acid | 50–54 | 4–7 | 6–8 |
| Crude Fat (approx.) | ~20 | ~21 | ~20–21 |
| Crude Protein (approx.) | ~38 | ~38–39 | ~38–39 |
High‑oleic soybeans flip that around. MSU Extension reports that Plenish® high‑oleic soybeans usually test about 75–80% oleic acid and only 4–7% linoleic acid, while non‑GMO SOYLEIC® lines often run 78–84% oleic and 6–8% linoleic. The crude fat and protein values still look like soybean values. What’s changed is the fatty acid mix.
That shift matters because it changes how the cow sees the ration. With more oleic and less linoleic in the diet, you can bring more energy in through soybeans without taking the same butterfat punch you’d expect from piling on commodity beans or other high‑linoleic fats—if you actually rebalance starch and fiber instead of just “adding a little more.”
Dr. Adam Lock, professor of dairy nutrition at MSU and head of the Dairy Lipids Nutrition Program, has spent much of his career looking at how different fatty acids—palmitic, oleic, and others—shift milk yield, component percentages, body condition, and income over feed cost. A 2025 summary of his high‑oleic work noted that increasing oleic while trimming palmitic in fat supplements boosted milk components and total production, especially in high‑producing cows, when the rest of the ration was in good shape.
Penn State research led by Dr. Alexander Hristov found that feeding Plenish high‑oleic soybeans and extruded high‑oleic soybean meal increased milk fat percentage by about 0.2 points with minimal change in milk volume or dry matter intake. MSU’s more recent trials with roasted high‑oleic soybeans, highlighted by Extension in 2025, saw milk yield climb at inclusion rates around 16% of ration dry matter while holding milk fat steady—as long as starch and fiber were managed sensibly.
From a fresh cow and whole‑herd ration standpoint, that’s a very different lever than just writing another cheque for bypass fat and hoping your butterfat hangs on.
Inside MSU’s New Dairy: Where the Big Questions Are Being Tested
Looking at this trend from the research side, MSU didn’t just tweak a few diets on a small research herd and call it a day. They built a full‑scale commercial‑style test dairy to figure out what happens when you really lean into high‑oleic and related changes.
The new MSU Dairy Cattle Teaching and Research Center is a roughly $70 million facility, with about 40% of that funding provided by the State of Michigan. The barn is set up to house about 680–688 cows—more than triple the old MSU dairy—and uses tunnel‑ventilated freestall housing that looks a lot like the modern freestall and dry lot systems you see across the Upper Midwest.
Dr. Barry Bradford, Chair of Dairy Management at MSU, has been pretty blunt about the main question they’re chasing: if more of your diet’s energy comes from high‑oleic soybeans and other targeted fats, what does that do to the “right” level of starch that many herds locked in 15–20 years ago in the corn‑silage‑plus‑commodity‑co‑products era? In a January 2026 Brownfield interview, he talked about going back to first principles on starch levels instead of assuming yesterday’s numbers automatically fit tomorrow’s fatty acid profiles.
To do that, MSU invested about $1 million in individual robotic feeding stations that record dry matter intake cow‑by‑cow, rather than relying on pen averages. The new dairy and its connected greenhouse complex are expected to host around 10,000 visitors a year—students, industry, and consumers—so people can see what a data‑heavy, commercially styled research herd actually looks like.
Producers tend to trust research more when the barn in the photos looks like theirs. In this case, we’re not talking about 40 cows in tie‑stalls; we’re talking hundreds of cows in group housing on rations that wouldn’t look out of place on a 500‑ or 1,500‑cow operation. That makes MSU’s high‑oleic work a lot easier to take seriously when you’re sitting down with your own feed sheets.
What Producers Are Actually Seeing: From “Trial” to “System” on a Michigan Dairy
Research is great. Cash flow is better. Let’s talk about what’s happening on the ground.
T&H Dairy: Turning Beans into Butterfat and IOFC
T&H Dairy, run by Mike Halfman and his family near Fowler, Michigan, milks roughly 1,600 cows and farms about 4,400 acres of corn, alfalfa, wheat, and soybeans. For a long time, soybeans were just another cash crop disappearing into the commodity stream.
In 2024, they changed gears. T&H planted about 900 acres of high‑oleic soybeans and contracted another 300 acreswith a neighbour, with the specific goal of roasting the beans and feeding them to their high‑producing cows. According to MSU Extension’s 2025 profile, they started cautiously at around 3 pounds of roasted high‑oleic soybeans per cow per day. At that level, they saw 2–3 pounds more milk per cow per day, but butterfat percentage stayed pretty flat.
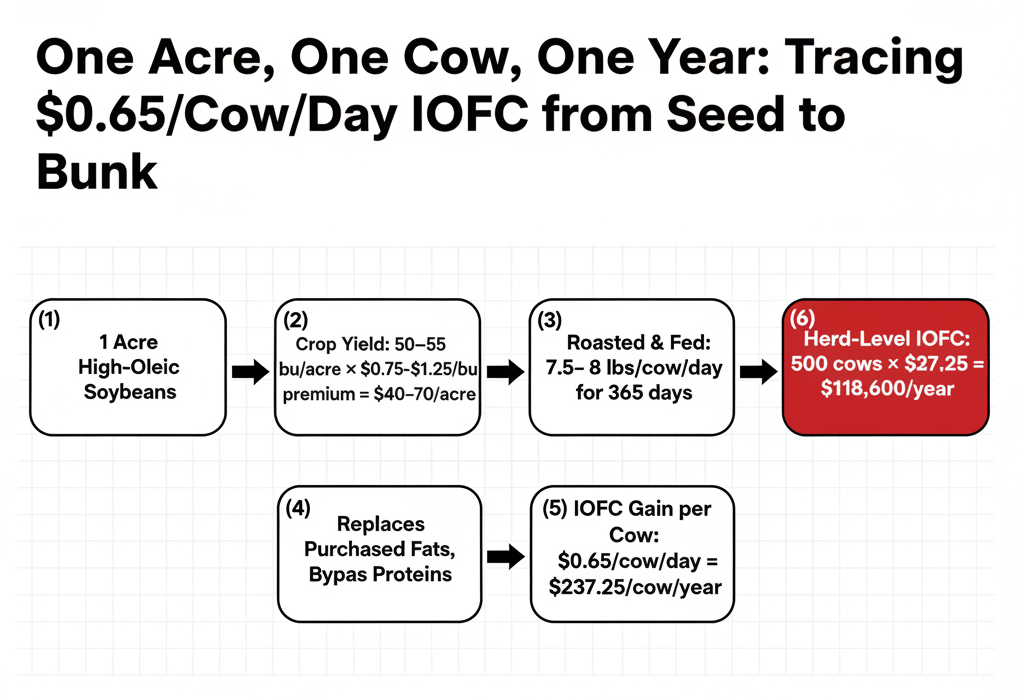
Once they installed on‑farm roasting and pushed inclusion to roughly 7.5–8 pounds of roasted high‑oleic soybeans per cow per day in their top groups, the response shifted. Halfman reports that fat‑corrected milk jumped by more than 4–5 pounds per cow per day, and butterfat percentage improved by around 0.15–0.20 points. That lines up almost exactly with the 0.2‑point milk fat increase Hristov documented at Penn State with high‑oleic diets.
On the economics, MSU’s modeling across several case farms—including operations like T&H—found that dairies producing and roasting their own high‑oleic soybeans saw an average income‑over‑feed‑cost (IOFC) advantage of about $0.65 per cow per day. Farms that didn’t grow beans but bought roasted high‑oleic product still saw modeled IOFC advantages around $0.27 per cow per day.
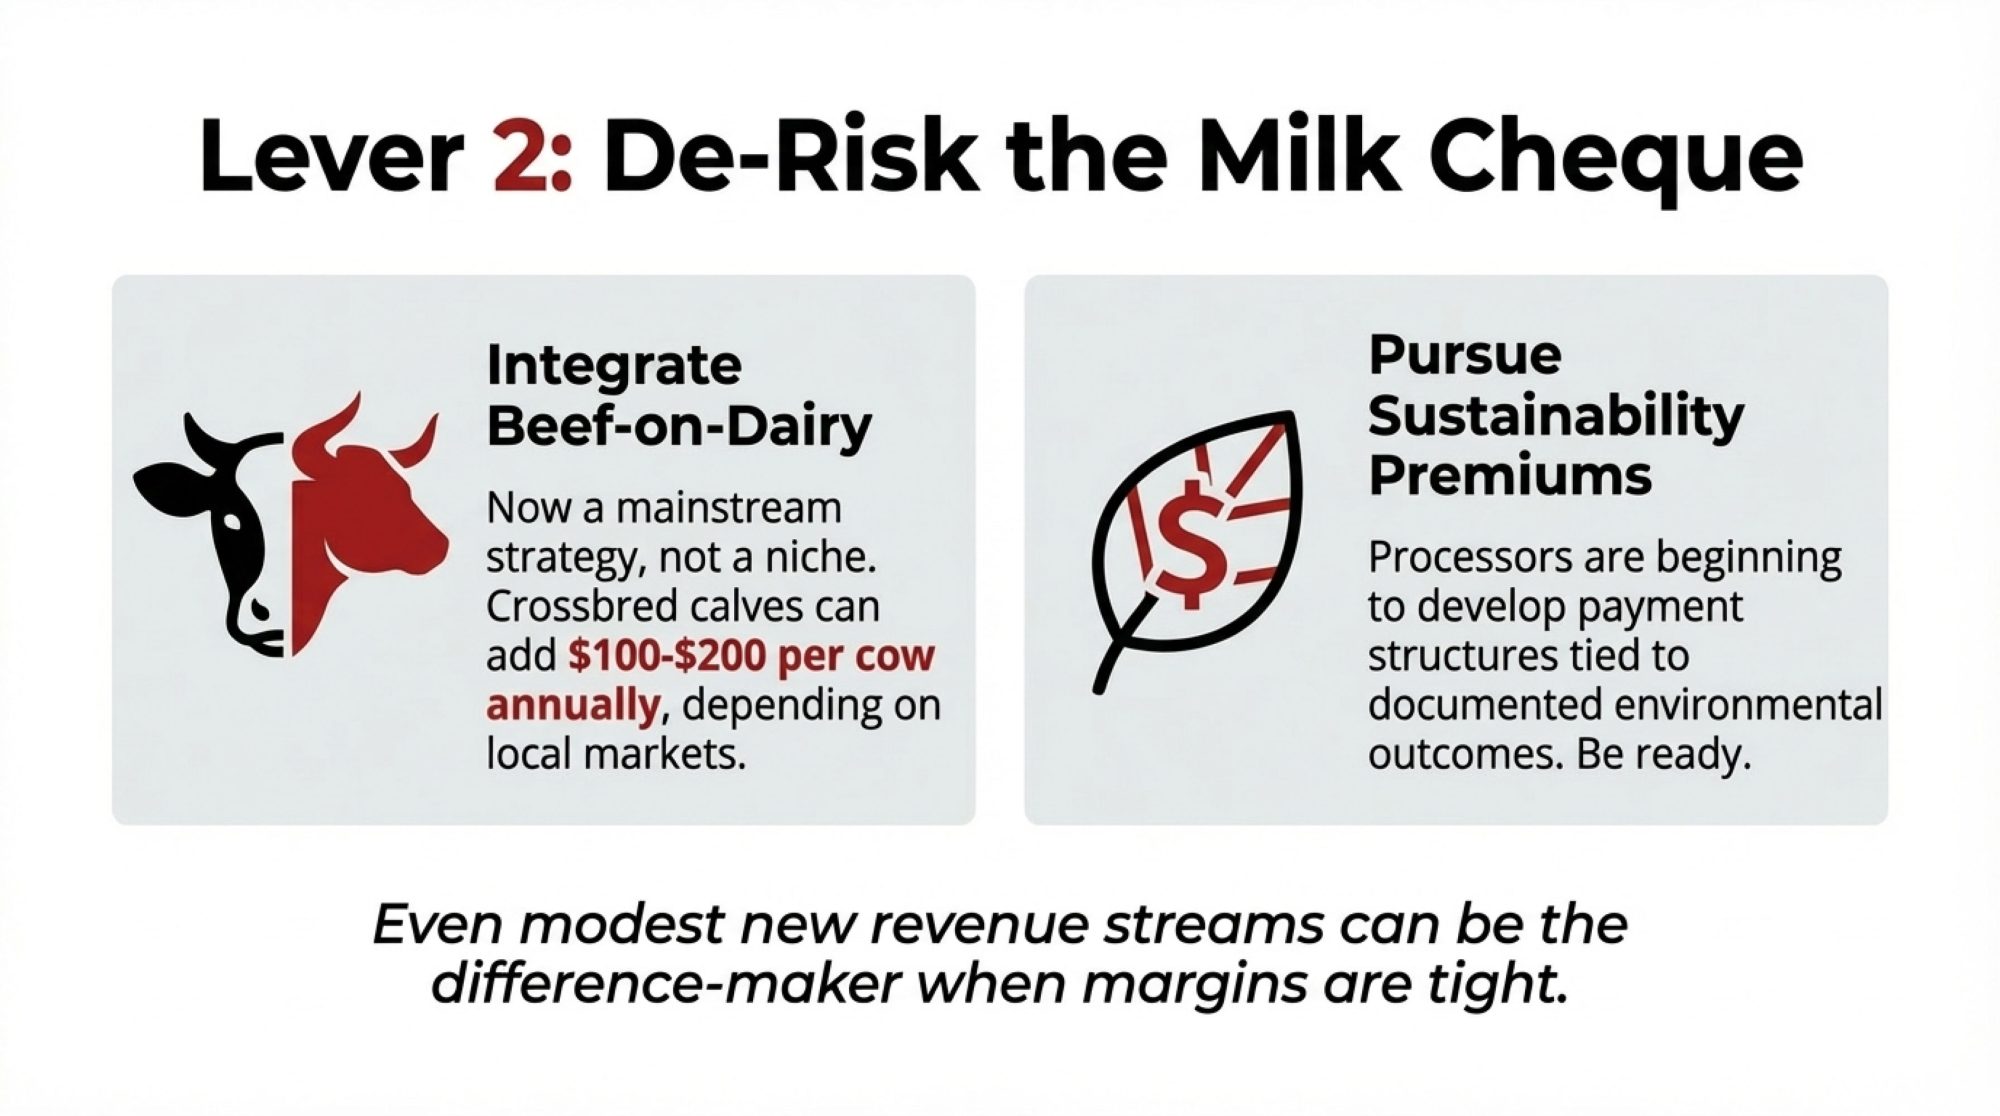
The Michigan Alliance for Animal Agriculture (M‑AAA), which is co‑funding this work, points to a southwest Michigan dairy that pulled out expensive bypass fats and proteins as they ramped up high‑oleic beans and ended up north of $1.00–1.20 per cow per day in IOFC improvement. One of the owners told MSU that they normally celebrate 5–6 cents per cow per day, so they called this “a once‑in‑a‑generation change.”
Let’s be honest: not every herd is going to hit $1.20. But when multiple well‑documented farms consistently land in the $0.27–$0.65 range—and a few blow past that when they really redesign the ration—that’s not just coffee‑shop talk anymore.
Where the Acres and Premiums Actually Are
All that IOFC talk falls apart if the crop piece doesn’t hold.
The United Soybean Board’s May 2025 high‑oleic briefing reports that farmers in 16 U.S. states planted more than 1.1 million acres of high‑oleic soybeans in 2023 and around 800,000 acres in 2024. That 2024 drop wasn’t because crushers lost interest; USB and MSU both point to seed availability and contracting capacity as the main bottlenecks.
USB notes that in 2024, growers had access to 21 high‑oleic varieties across the Plenish® and SOYLEIC® programs, covering maturity groups 1.9-4.8. That covers a big chunk of the traditional soybean belt, with new maturities being developed for shorter‑season northern regions.
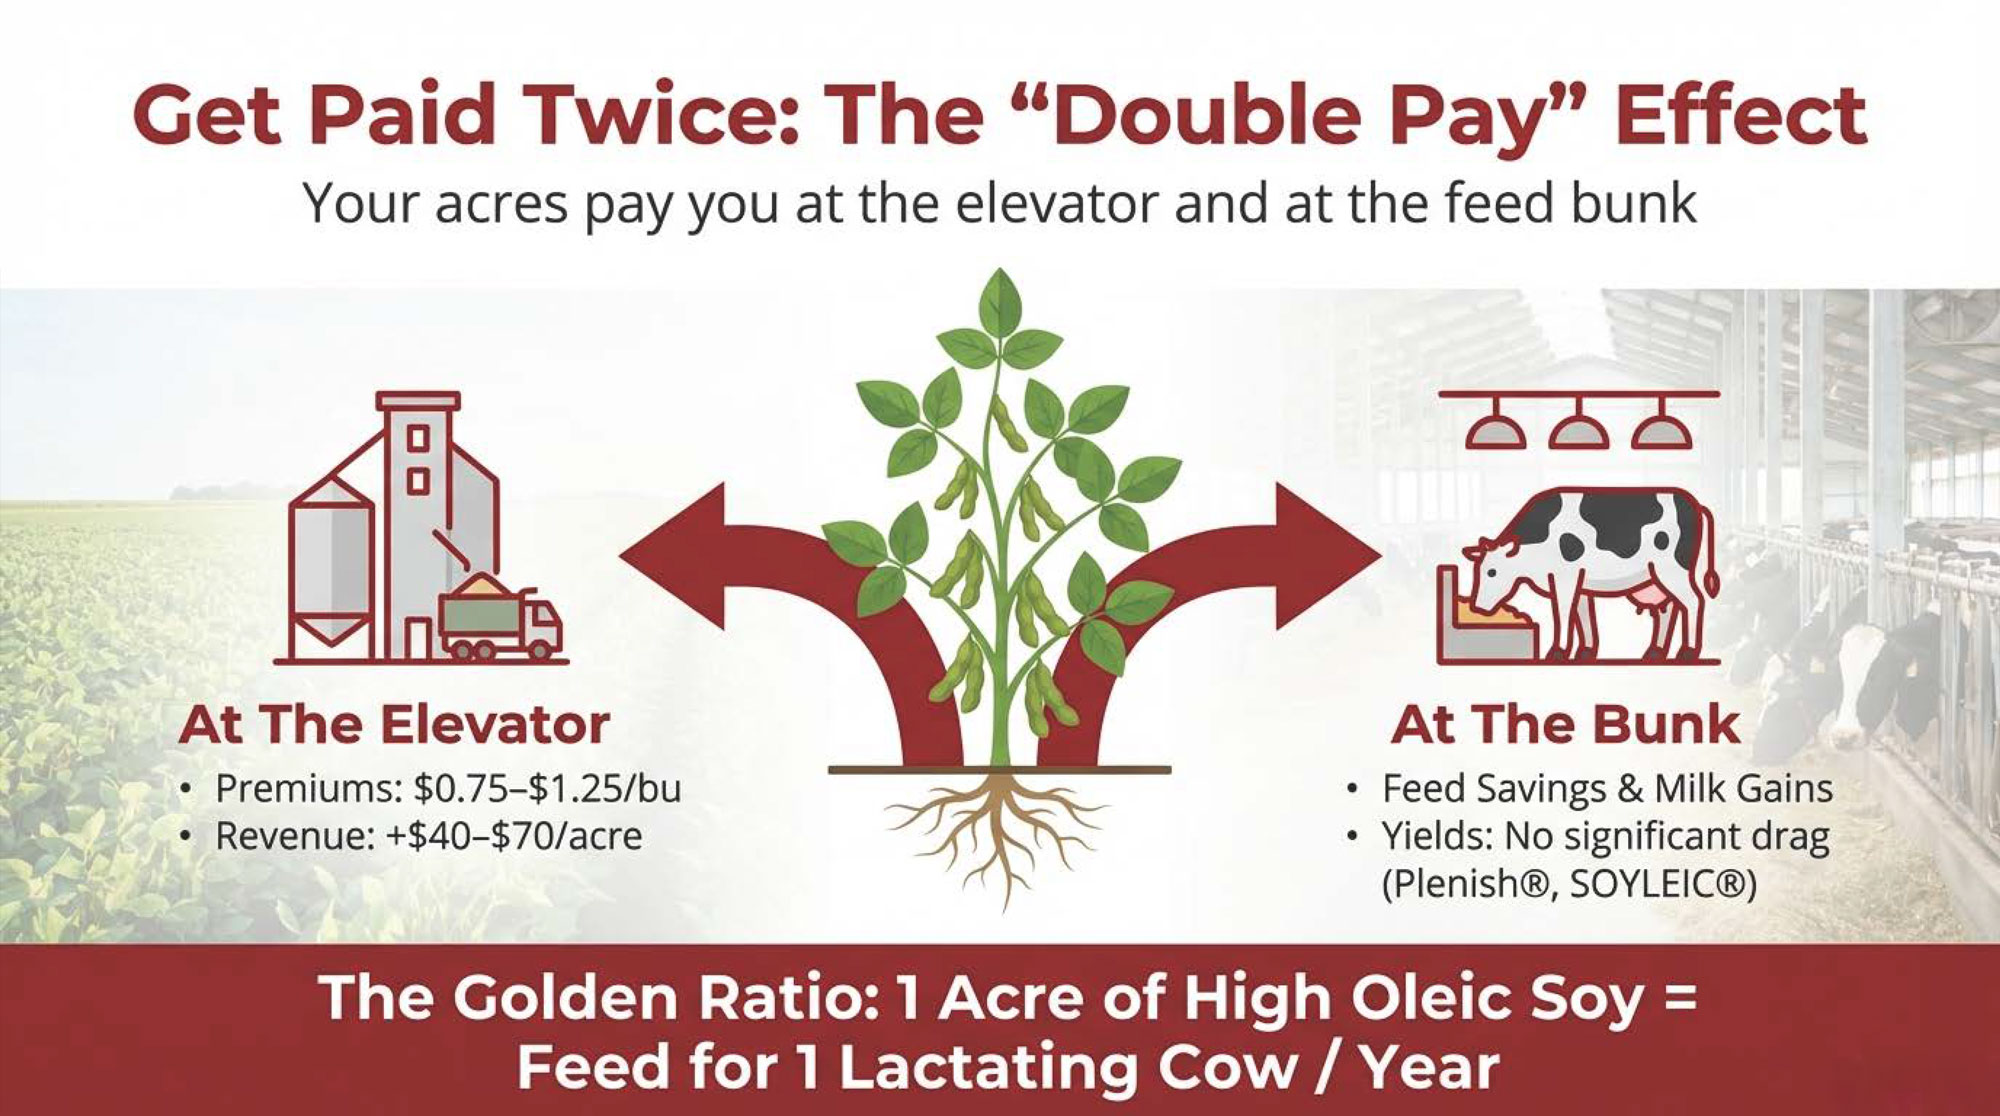
On pricing, USB says high‑oleic growers typically earn premiums of $0.75–1.25 per bushel over commodity beans, depending on contract and delivery terms. Brownfield Ag News and USB farmer‑leaders have highlighted cases like Indiana farmer Kevin Wilson, a USB director, who’s reported cash premiums around $2.20 per bushel on his high‑oleic contracts with ADM for recent crops.
If you match those premiums with USDA‑reported average U.S. soybean yields around 50–55 bushels per acre, you’re realistically talking about $40–70 per acre in extra crop revenue before you feed anything. Then, if those beans roll through your roaster and displace purchased fats and proteins in the ration at a profit, that same acre is effectively getting paid twice: once at the elevator and once at the bunk.
Brownfield’s 2025 coverage quoted USB treasurer Matt Gast saying roughly 35% of high‑oleic beans are now heading into dairy rations, about 60% into food, and the remaining 5% into industrial uses. So dairy isn’t an afterthought in this market. We’re a major end user.
Agronomics and Defensive Traits: Are You Sacrificing Yield?
Whenever somebody says “specialty crop,” most growers quietly translate that to “yield drag” unless they see evidence otherwise.
USB and partner organizations have been clear that high‑oleic traits are being stacked on elite yield and defensive backgrounds, not on leftover genetics. Corteva’s Plenish® beans, for example, commonly carry soybean cyst nematode resistance, Phytophthora tolerance, and the Enlist E3 herbicide trait, giving you access to modern weed control and disease packages you’d expect from top‑end commercial beans. On the non‑GMO side, SOYLEIC® varieties developed by Missouri Soybeans and programs in states like Georgia are being stacked with resistance to SCN, root‑knot nematode, and frogeye leaf spot.
MSU Extension points out that from an agronomy standpoint, the day‑to‑day management of high‑oleic beans looks a whole lot like conventional soybeans, aside from the identity‑preserved handling and any herbicide restrictions tied to specific trait packages. You still have to match maturity, disease package, and herbicide system to your fields—the same homework you should already be doing with commodity beans.
From yield reports and field experience shared through USB and state soybean groups, high‑oleic beans can run with strong commodity lines when you put them on appropriate ground and treat them like serious production varieties rather than side projects. Are there weak performers out there? Of course. But “high‑oleic” does not automatically mean “yield anchor”.
The Catch: Identity Preservation and the Work Between the Drill and the Roaster
Here’s the part that looks great on slides and then blows up in the yard if you’re not careful: identity preservation.
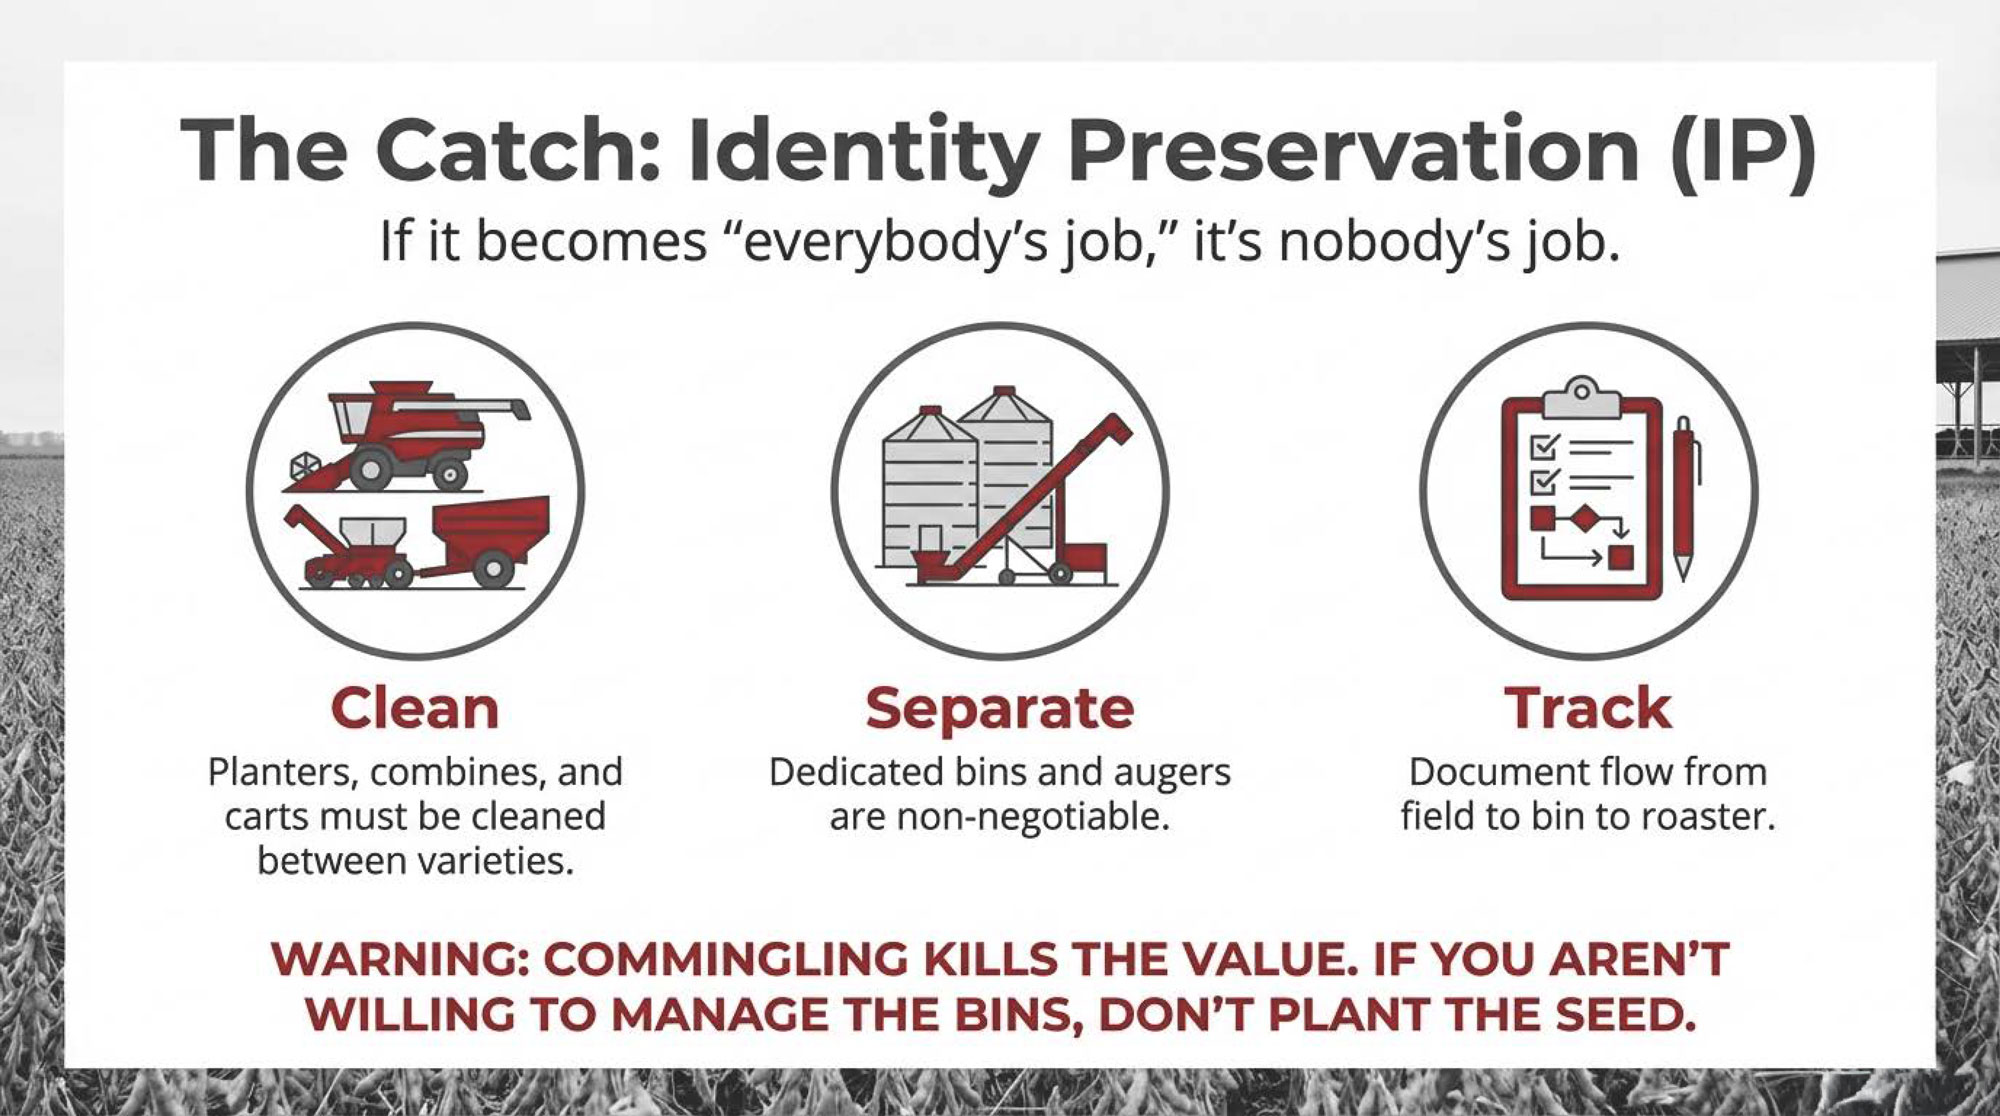
High‑oleic beans are almost always grown under identity‑preserved (IP) contracts, because crushers and end users have to know they’re actually getting the fatty acid profile they’re paying for, not a blend of whatever fell into the bin. That makes your planting, harvesting, hauling, and storage plan part of the value chain, not an afterthought.
USSEC’s High Oleic Sourcing Guide lays out the basics: clean planters, combines, grain carts, augers, and bins thoroughly when you switch between commodity and high‑oleic beans; keep high‑oleic lots segregated; and track beans from field to bin to delivery. Soy Canada’s identity preservation resources add the same themes—clear bin labeling, separate handling lines, and documented flows—based on decades of non‑GMO and food‑grade experience.
Wisconsin Extension adds a very practical farm‑gate layer: mark high‑oleic fields clearly, make sure custom operators know which fields are IP and what herbicide system they’re in, and don’t send a combine into those fields with commodity beans still in the hopper from yesterday’s job.
If your plan is to “sprinkle on a few beans” and call it good, you’re not going to see MSU‑level responses. If nobody on your team owns the IP details—bins, augers, cleaning, record‑keeping—high‑oleic will be a headache long before it becomes a margin tool.
On the flip side, if you’re already handling non‑GMO or food‑grade grain streams, most of this will feel like structured discipline you already understand, with a different premium and trait stack attached. Even if your primary goal is feeding your own cows, commingling still matters. If your nutritionist is formulating around high‑oleic fatty acid profiles but the bin is half commodity beans, you can’t expect butterfat performance or IOFC to match the research.
The High‑Oleic Math: From Acres to Cows to IOFC
Now for the part you can actually plug into your budget.
MSU’s 2025 Extension work, supported by the Michigan Alliance for Animal Agriculture, modeled two main scenarios using real farm performance data and realistic feed costs:
- Farms producing and roasting their own high‑oleic soybeans saw an average IOFC advantage of about $0.65 per cow per day.
- Farms purchasing roasted high‑oleic soybeans saw an average IOFC advantage of about $0.27 per cow per day.
At the inclusion rates and yields MSU is working with, one acre of high‑oleic soybeans can supply enough beans to feed one lactating cow for a full year, assuming on‑farm roasting and feeding patterns similar to the case farms.
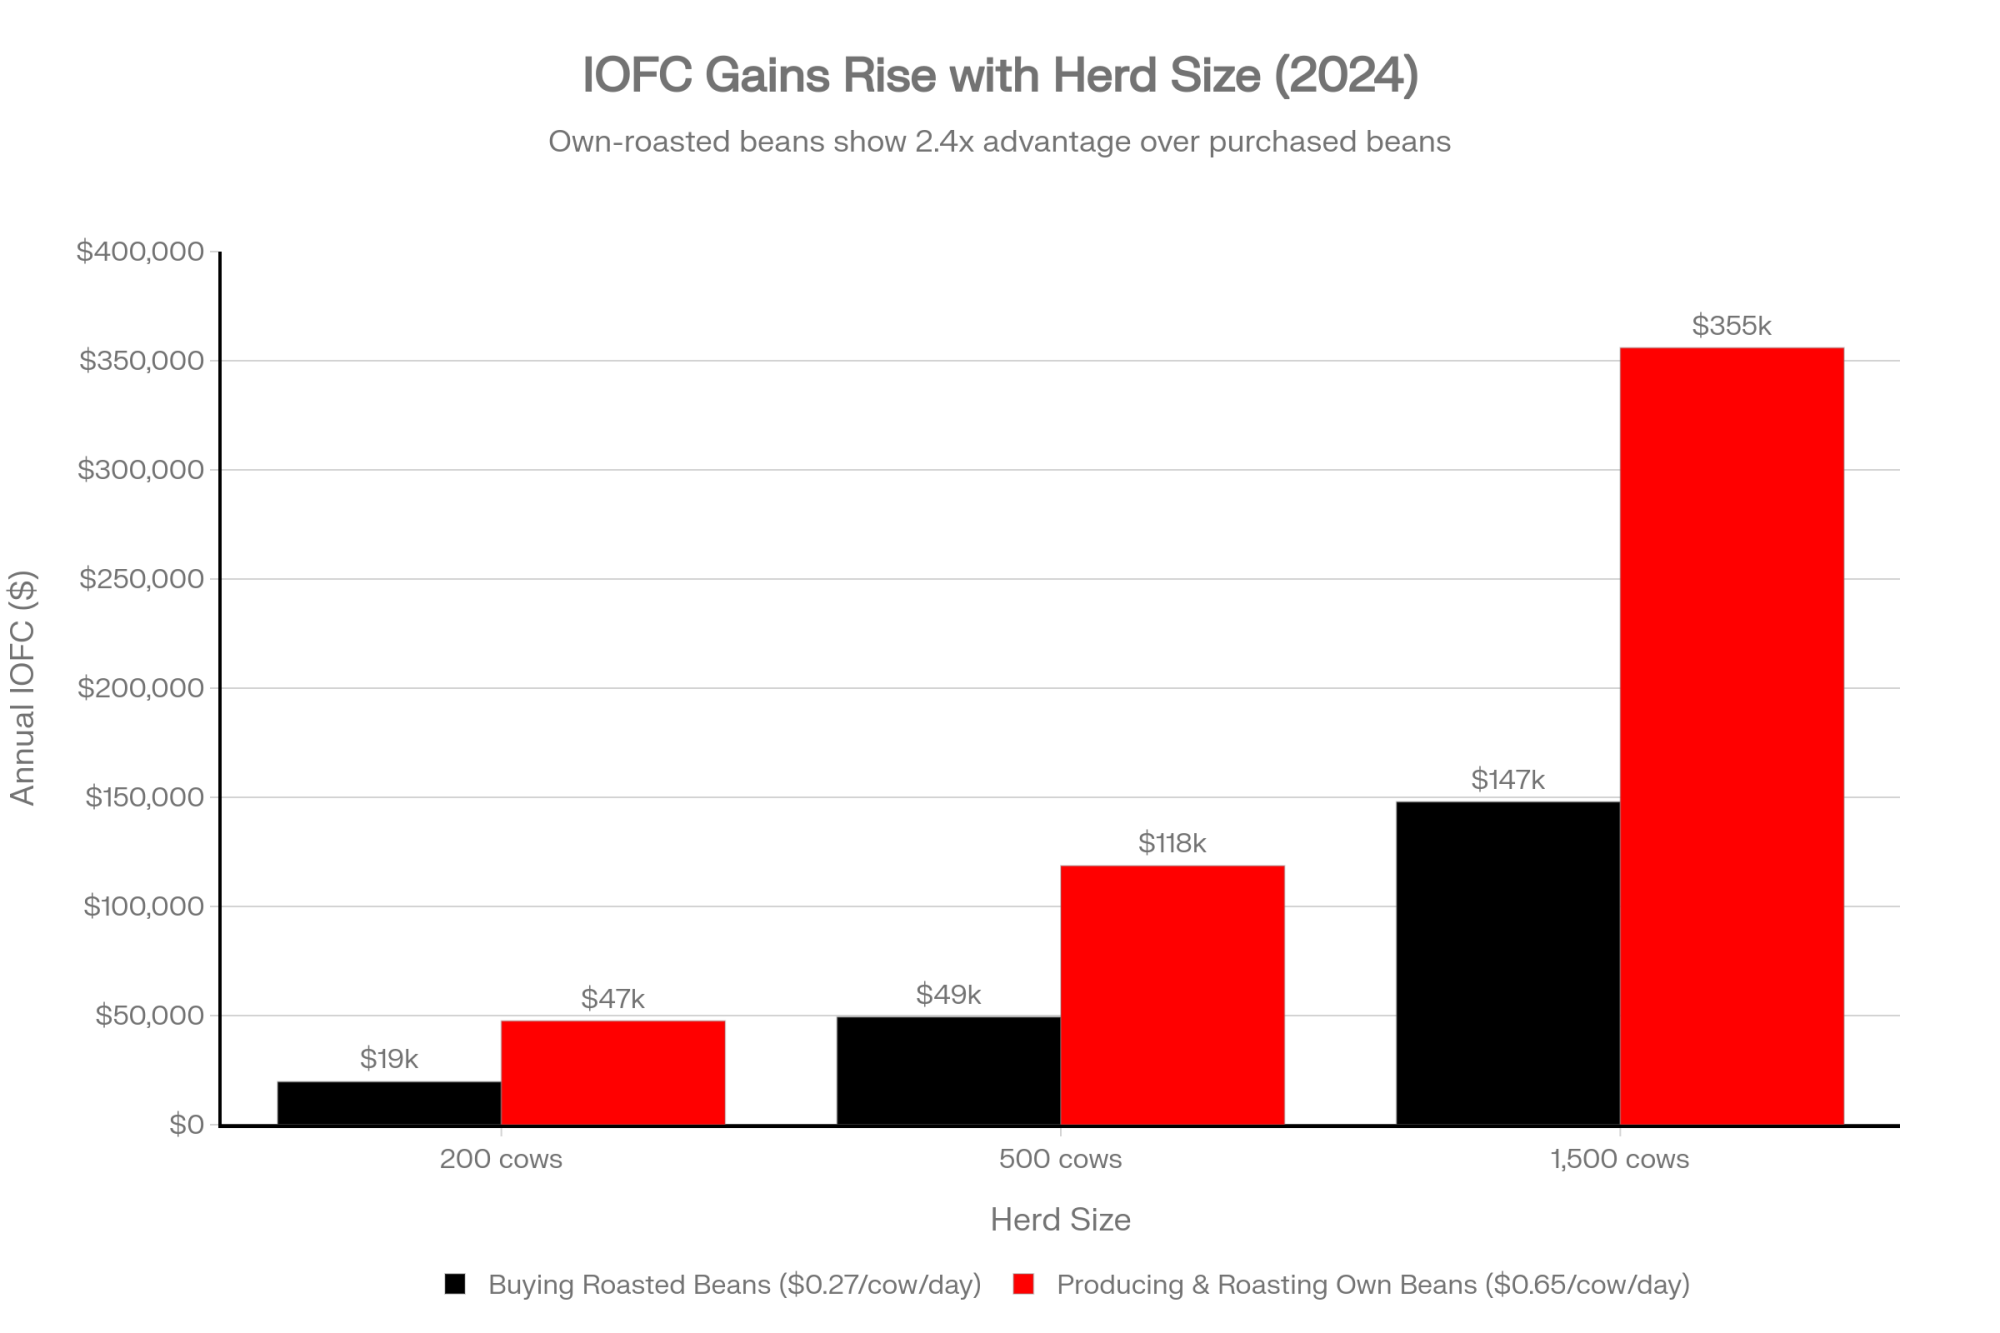
Here’s how that IOFC advantage plays out across different herd sizes:
| Herd size | IOFC +$0.27/cow/day | IOFC +$0.65/cow/day |
| 200 cows | ≈ $19,700/year | ≈ $47,500/year |
| 500 cows | ≈ $49,300/year | ≈ $118,600/year |
| 1,500 cows | ≈ $147,900/year | ≈ $355,900/year |
Those are straight annualizations of MSU’s IOFC averages, not “best barn at the meeting” numbers.
On the crop side, USB’s premium range of $0.75–1.25 per bushel, combined with 50–55 bushel per acre yields, points to around $40–70 per acre extra crop revenue before you feed anything. In some contracts, like the ADM deals highlighted by Brownfield and USB farmer‑leaders, premiums up near $2.20 per bushel have been reported, which pushes those crop‑side gains higher when conditions line up.
What producers are finding is that the biggest wins show up when:
- High‑oleic acres are reasonably close to the dairy, keeping transport sane.
- The ration has a meaningful purchased fat and “fancy ingredient” line item that you can actually replace.
- There are enough cows to spread roasting and IP overhead, so it doesn’t feel like a science fair project.
If your purchased fat and specialty ingredient line is already north of about $0.40 per cow per day, and you can realistically commit 0.5–1 acre of soybeans per cow into high‑oleic over the next couple of years, you’re in the zone where this deserves serious, numbers‑on‑paper attention.
Three Paths: Move Now, Plan a Pilot, or Watch and Wait
| Decision Factor | Move Now Farms | Plan & Pilot Farms | Watch & Wait Farms |
|---|---|---|---|
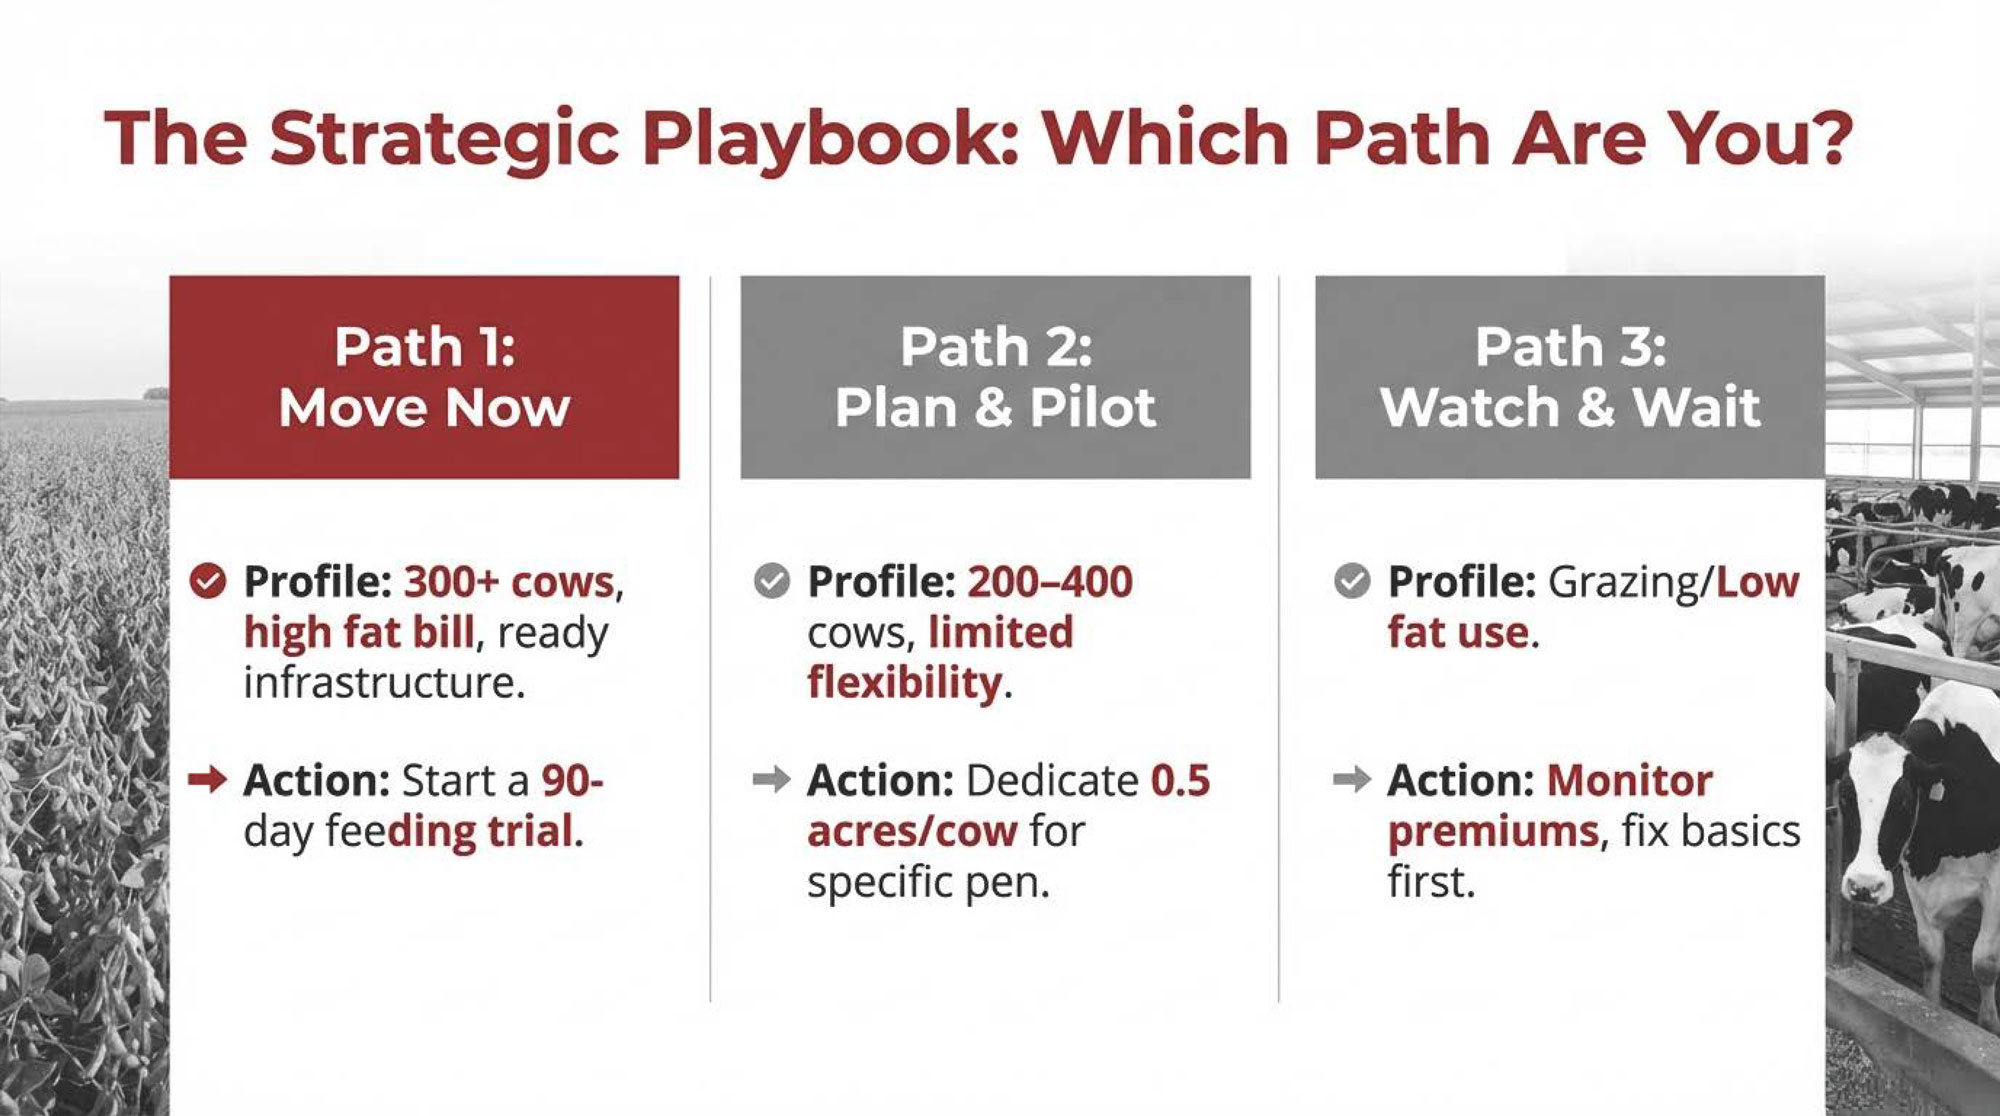
| Herd Size | 300+ cows, or 200+ with flexibility | 200–400 cows, moderate flexibility | <200 cows, or grazing-dominant systems |
| Soybean Acreage & Fat Spend | Grow soybeans; >$0.40/cow/day purchased fat spend | Some soybean acres; modest fat spend | Little to no soybean acres; minimal purchased fat |
| Infrastructure | Bins, augers for IP handling; access to roaster | Bins/augers with planning; may need upgrades | No grain infrastructure or not scalable for IP |
| 2026 Action | Sit with nutritionist on IOFC scenarios; contract high-oleic; pilot 90 days | Commit 0.3–0.5 acres/cow to pilot; run “what-if” scenarios; track pilot results | Monitor university work, regional Extension updates, co-op messaging; revisit in 2027–2028 |
| Expected IOFC Gain | $0.27–$0.65/cow/day (basis: buy vs. produce) | $0.15–$0.50/cow/day (conservative, pilot-stage) | Deferred; focus on other margin levers now |
| Next Step | Schedule call with nutritionist + elevator; list candidate fats to displace | Design a small-group pilot on fresh pen or high group; define tracking metrics | Assess forage, fresh cow transition, SCC; revisit high-oleic in 2027 |
Looking at this trend with both optimism and a bit of healthy skepticism, most herds fall into one of three buckets.
1. “Move in the Next 12 Months” Farms
You’re probably in this group if:
- You milk 300+ cows and already grow soybeans, or could easily partner to hit 0.5–1 acre per cow in high‑oleic.
- Your ration includes purchased bypass fat, palm fat, or other high‑priced energy sources you’d love to cut back on.
- You have—or could add—storage and handling to keep an identity‑preserved stream separate.
- You either have reliable access to a custom roaster or can justify investing in on‑farm roasting equipment.
For you, the next moves aren’t “order some seed and see what happens.” They’re:
- Sit down with your nutritionist and list exactly which fats and supplements you’d pull at 3–4 pounds and then at 7–8 pounds of roasted high‑oleic soybeans per cow per day.
- Have them show you IOFC projections on paper using MSU’s $0.27 and $0.65 per cow per day ranges as bookends, plugged into your component prices and ingredient costs.
- Call your elevators or processors and get specific: which high‑oleic contracts exist, their maturities, premiums, delivery windows, and the penalties if loads miss specs.
- Walk your grain system and decide which bins and augers will actually carry the high‑oleic stream, who cleans them, and who signs off.
If your nutritionist can’t show you, in numbers, how high‑oleic beans would displace existing fats and supplements in a way that adds up, you’re not ready to shift acres. If they can, you’re a strong candidate for a 90‑day high‑oleic feeding trial as soon as beans and roasting are lined up.
2. “Plan and Pilot” Farms
You’re in this lane if:
- You milk 200–400 cows and have some soybean acres, but you don’t have endless flexibility.
- Your ration uses some supplemental fat, but you’re not chasing 100‑lb tanks.
- You have bins and handling that could manage an IP stream, but only with planning and maybe a couple of modest upgrades.
For you, 2026–2027 probably looks like:
- Committing a modest amount of high‑oleic acres—say 0.3–0.5 acres per cow—aimed at a specific high group or fresh pen, rather than the whole herd.
- Using MSU’s IOFC estimates as realistic boundaries: $0.27 per cow per day if you’re buying roasted product, $0.65 if you end up producing and roasting your own.
- Running “what‑if” scenarios with your advisor: what happens if butterfat price softens from today’s levels? What if you only capture half the modeled IOFC bump, or if premiums slide toward the low end of USB’s range?
- Treating year one as a structured pilot with defined rations, groups, and tracking, not a casual “we tried some beans one month and didn’t see anything dramatic.”
Your goal isn’t to redesign your entire feed system overnight. It’s to get your own data—on your cows, your acres, and your premiums—so if margins tighten more, you’re making decisions with real numbers instead of guesses.
3. “Watch and Wait” Farms
You’re probably here if:
- You run a grazing‑dominant or seasonal system with relatively low concentrate feeding.
- You don’t grow soybeans and don’t have bins or grain handling set up for IP crops.
- Your current ration uses little to no purchased fat, so there’s not much displacement value to capture.
For you, the smartest move may be to stay informed rather than jump in. That can look like:
- Keeping an eye on MSU and other university work on fatty acids and high‑oleic, plus your regional Extension updates on feed costs and butterfat premiums.
- Hammering out lower‑cost wins closer to home—fresh cow transitions, forage quality, milking routine, SCC—before you commit to a specialty ingredient with IP requirements.
- Watching how your co‑op or processors evolve component pricing and whether they start hinting at “diet‑friendly” fat programs or call out high‑oleic in their own messaging.
- Re‑evaluating high‑oleic in a couple of years, when seed availability, contract options, and case studies will all be deeper.
You don’t lose ground by waiting thoughtfully if your system doesn’t have the acres, bins, or fat spend to make this pay right now.
A Quick “What This Means for Your Operation” Checklist
Before you sign anything—or blow it off—run through this with your team:
- Crops: How many acres can we realistically move into high‑oleic without starving our corn silage and forage program?
- Fat spend: What did we actually spend last year on bypass fats, palm products, and other specialty energy sources on a $/cow/day basis?
- Contracts: What specific high‑oleic contracts exist in our trucking radius—premiums, maturities, delivery windows, quality specs, and penalties if we miss them?
- Infrastructure: Do we have bins and augers that can be dedicated to an identity‑preserved stream, and what would it cost—in time and money—to properly clean and separate?
- Ownership: Who on our team is going to “own” the high‑oleic/IP system day‑to‑day so it doesn’t become everybody’s job and therefore nobody’s job?
If you can’t answer those questions yet, that’s your next step. Not ordering seed. Not pricing roasters. Clarity.
Stepping Back: A New Fat Tool in a Tough 2026 World
Stepping back from all the charts and quotes, high‑oleic soybeans are best viewed as a new fat tool, not a magic button. They give you a way to bring more energy—and a more butterfat‑friendly fatty acid profile—into the ration from your own acres, especially if you’re already cutting big cheques for purchased fats.
The combination of:
- USDA’s 2026 price outlook is pointing to tighter margins,
- MSU’s full‑scale dairy research with individual intake data,
- USB’s long‑term investment in high‑oleic traits and premiums,
- And real‑farm experience from herds like T&H and other Michigan dairies,
means this is not just a shiny idea in a conference slide deck.
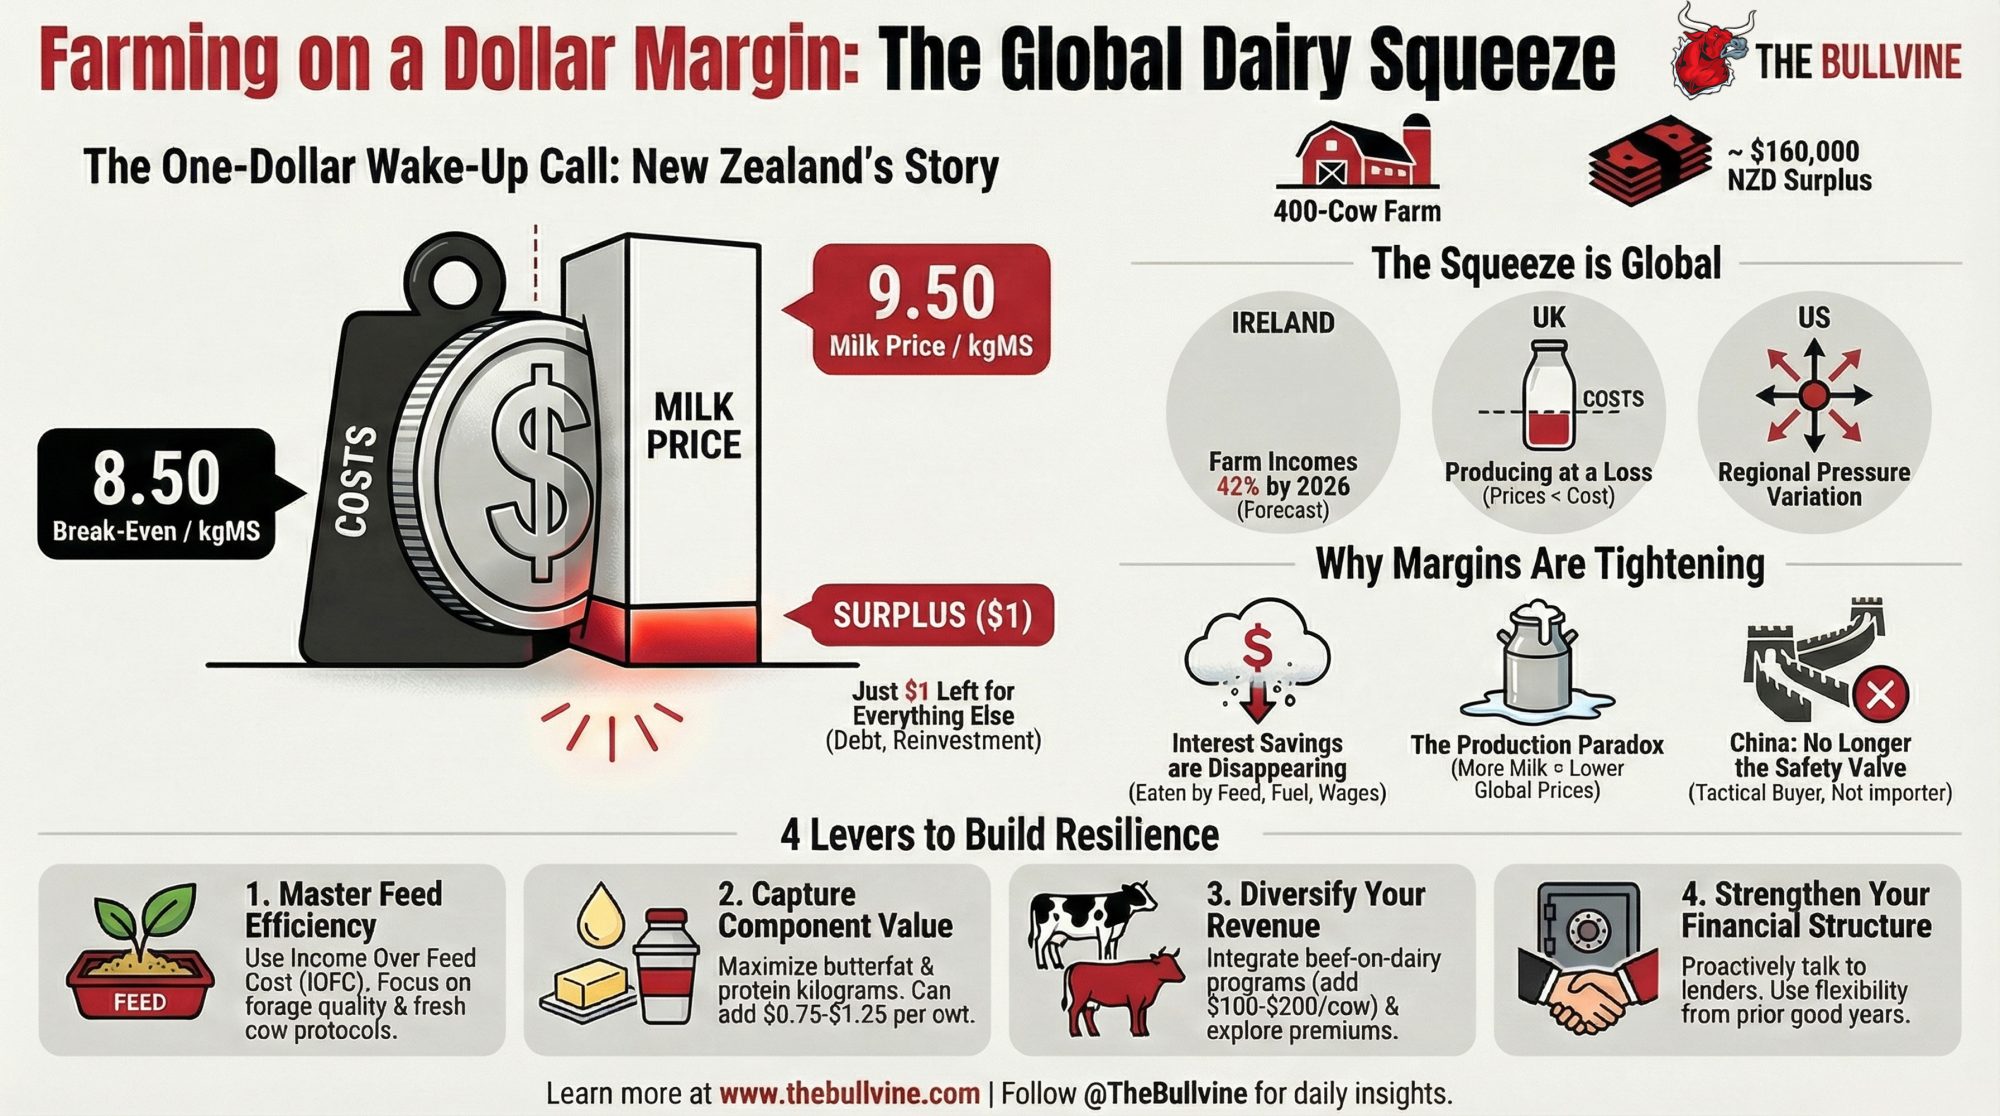
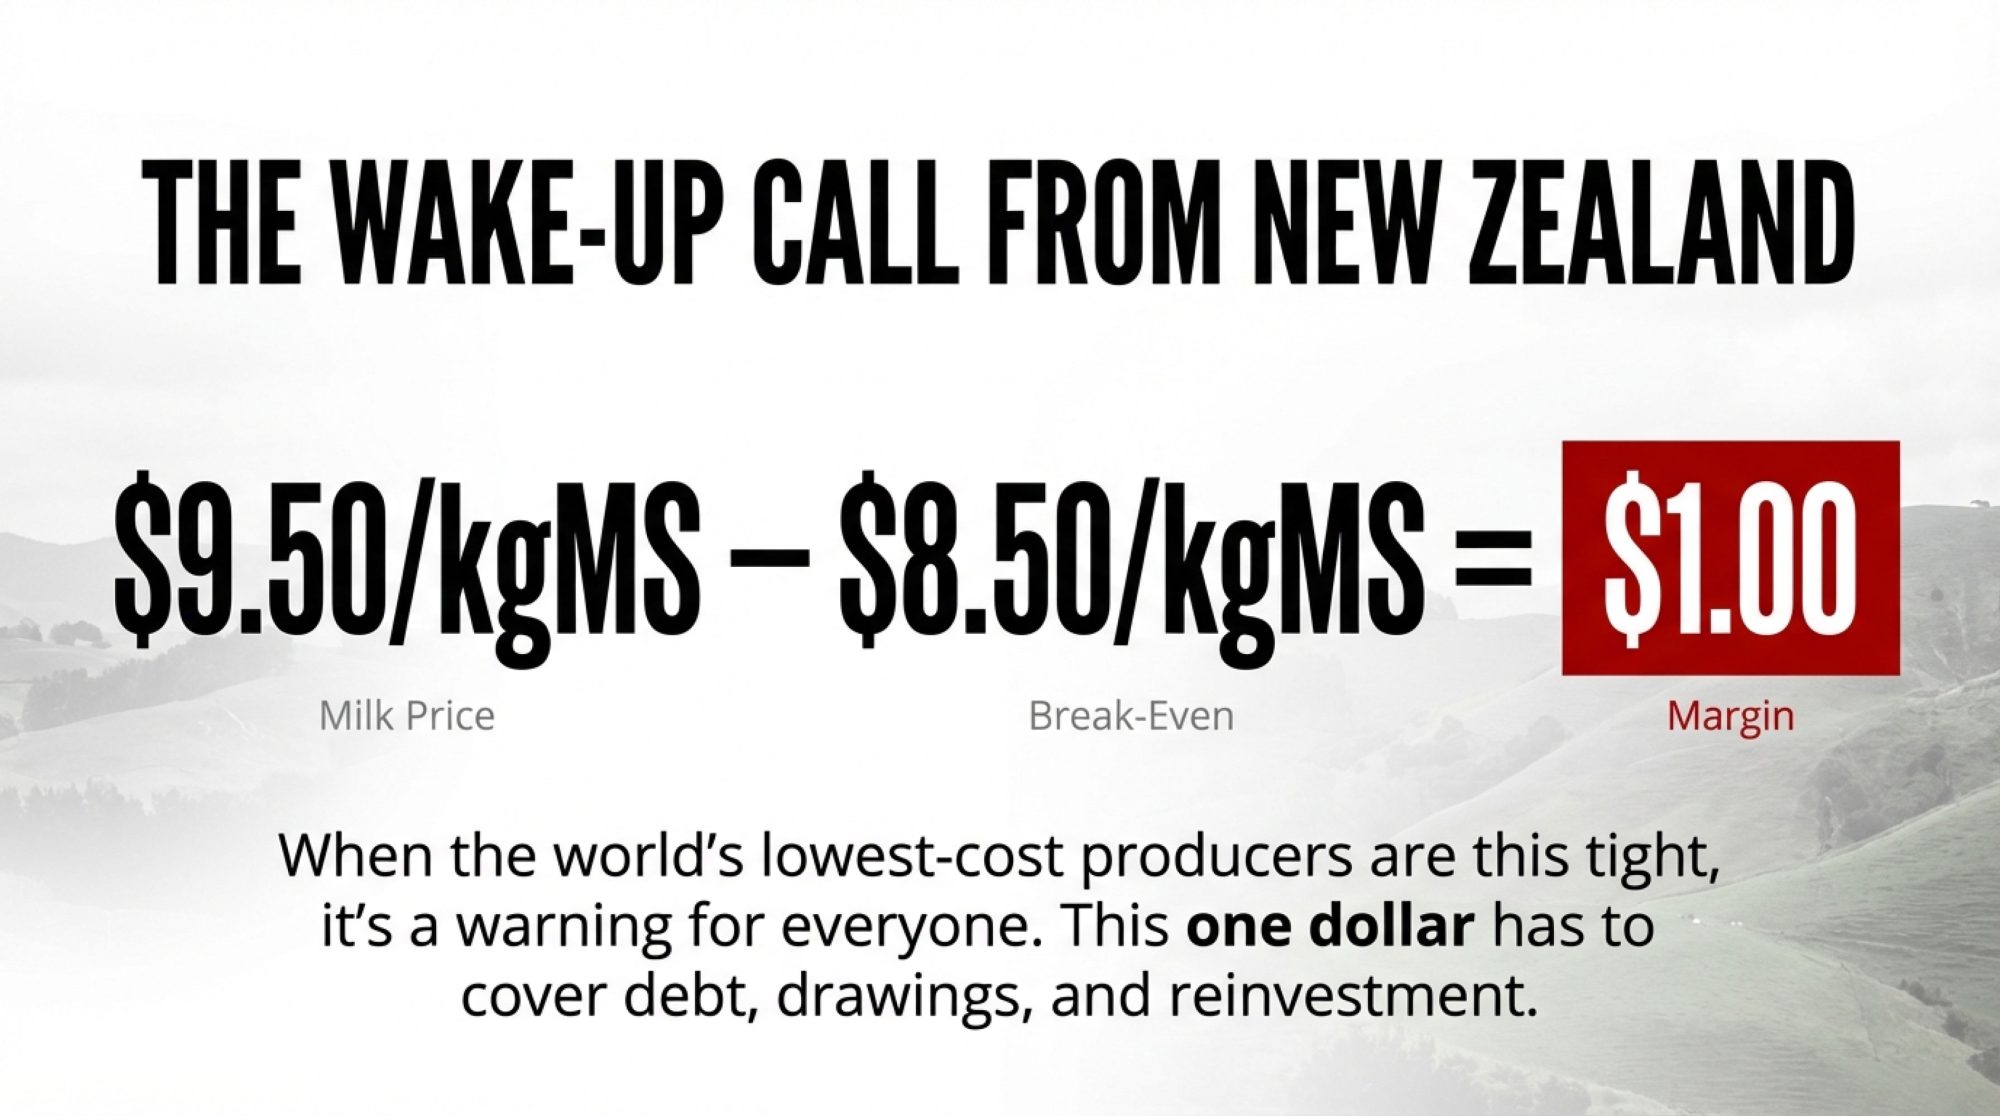
At the same time, the IP discipline, seed and contract access, storage needs, and scale realities mean high‑oleic beans won’t be the right play for every operation in 2026. Canadian quota and butterfat pool rules, EU Green Deal pressures, and pasture‑based systems in places like New Zealand all shape different price signals and contract structures, even if the underlying IOFC and fatty acid logic stay the same.
So what should you actually do with this?
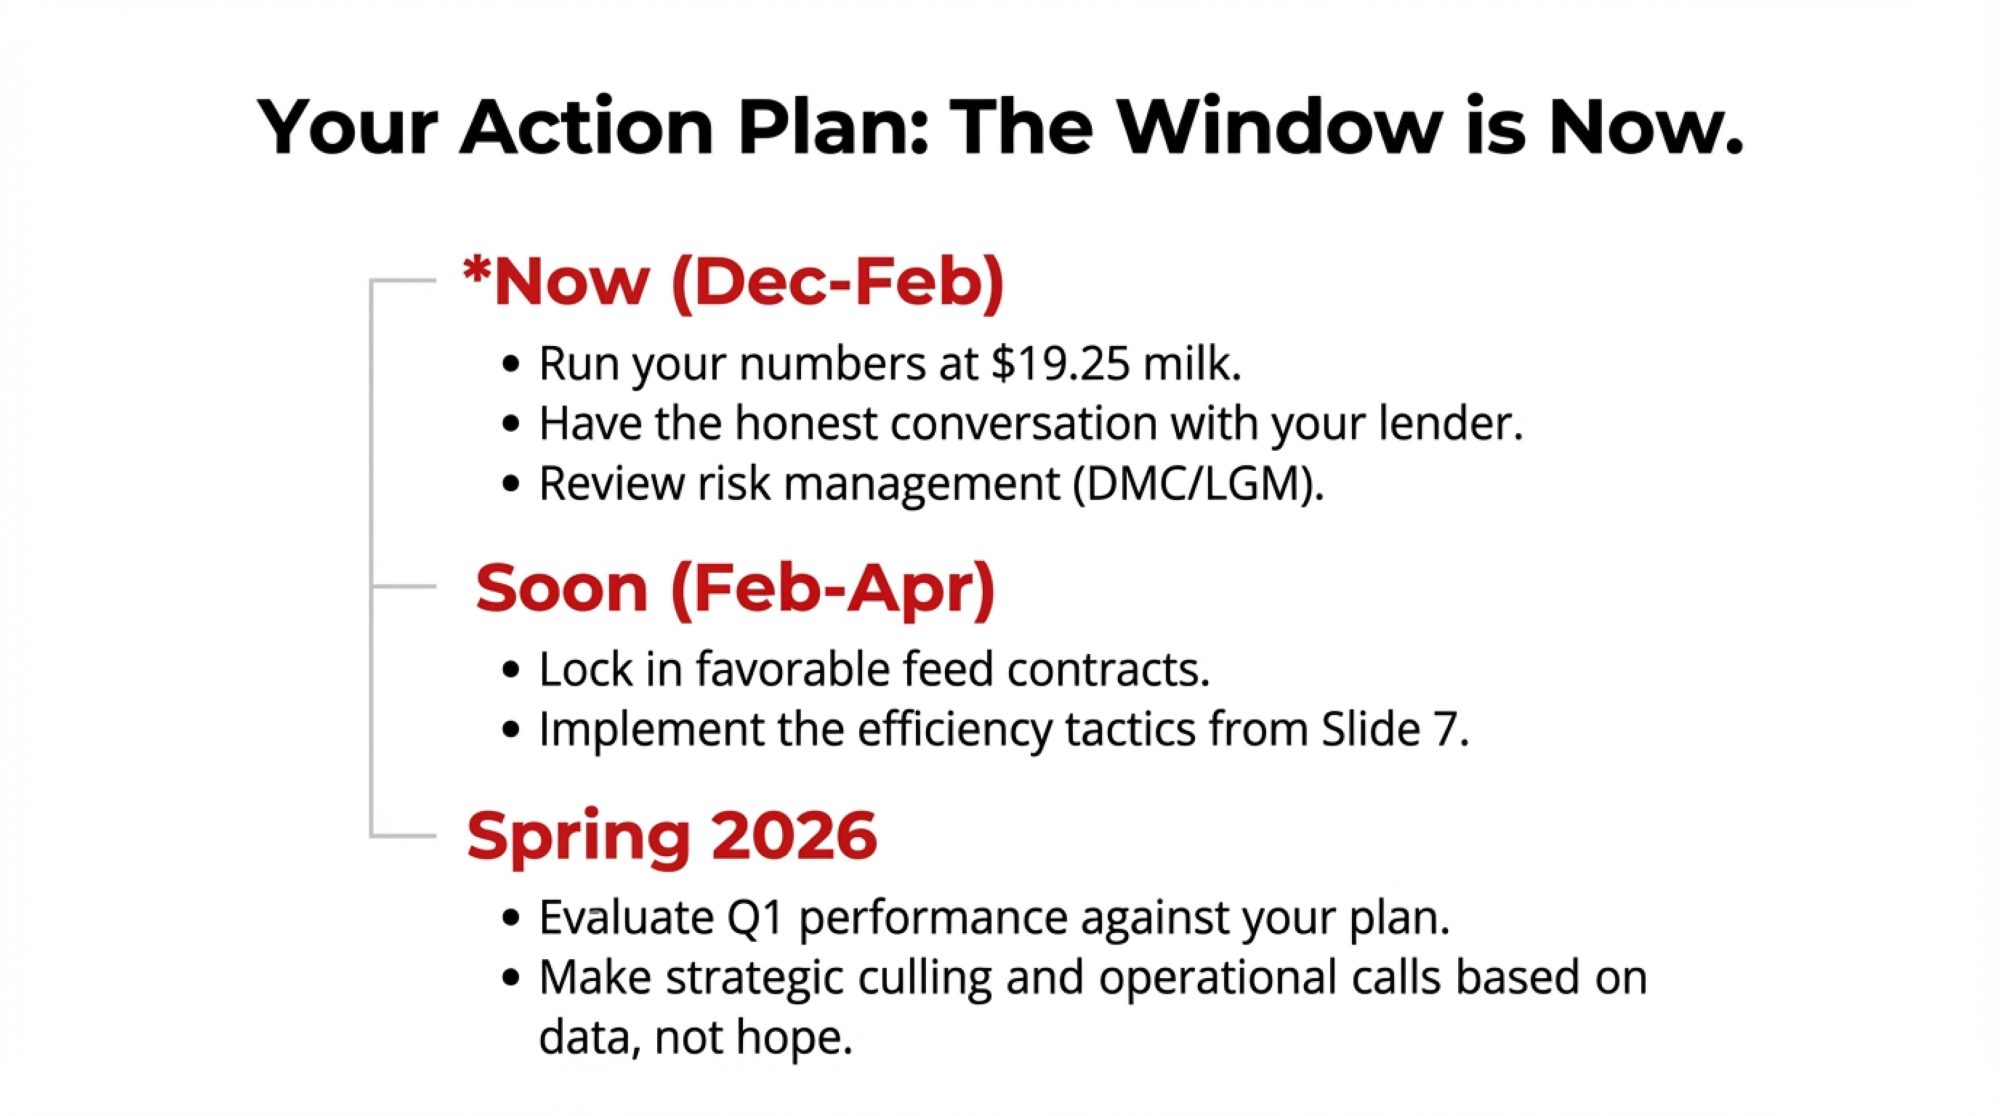
- First, pull last year’s fat and supplement bills and run the IOFC scenarios—$0.27 and $0.65 per cow per day—on your actual herd size.
- Second, ask your nutritionist to design a 90‑day high‑oleic trial that truly replaces purchased fats and proteins, not just sprinkles beans on top of an unchanged ration.
- Third, talk to your elevator or processor about real, not hypothetical, high‑oleic contracts—what’s on offer, what they expect, and how they fit with your harvest and storage realities.
You don’t have to chase every new trait or every new feed idea that shows up in a slide deck. But if your acres, ration, and fat bill line up with what MSU and USB are seeing, ignoring high‑oleic soybeans completely could mean leaving serious five‑ or even six‑figure money on the table every year. In a world where USDA is talking $18‑milk, and some regional Class III projections are hovering near $16, that’s not a side note. That’s a strategic decision.
Key Takeaways
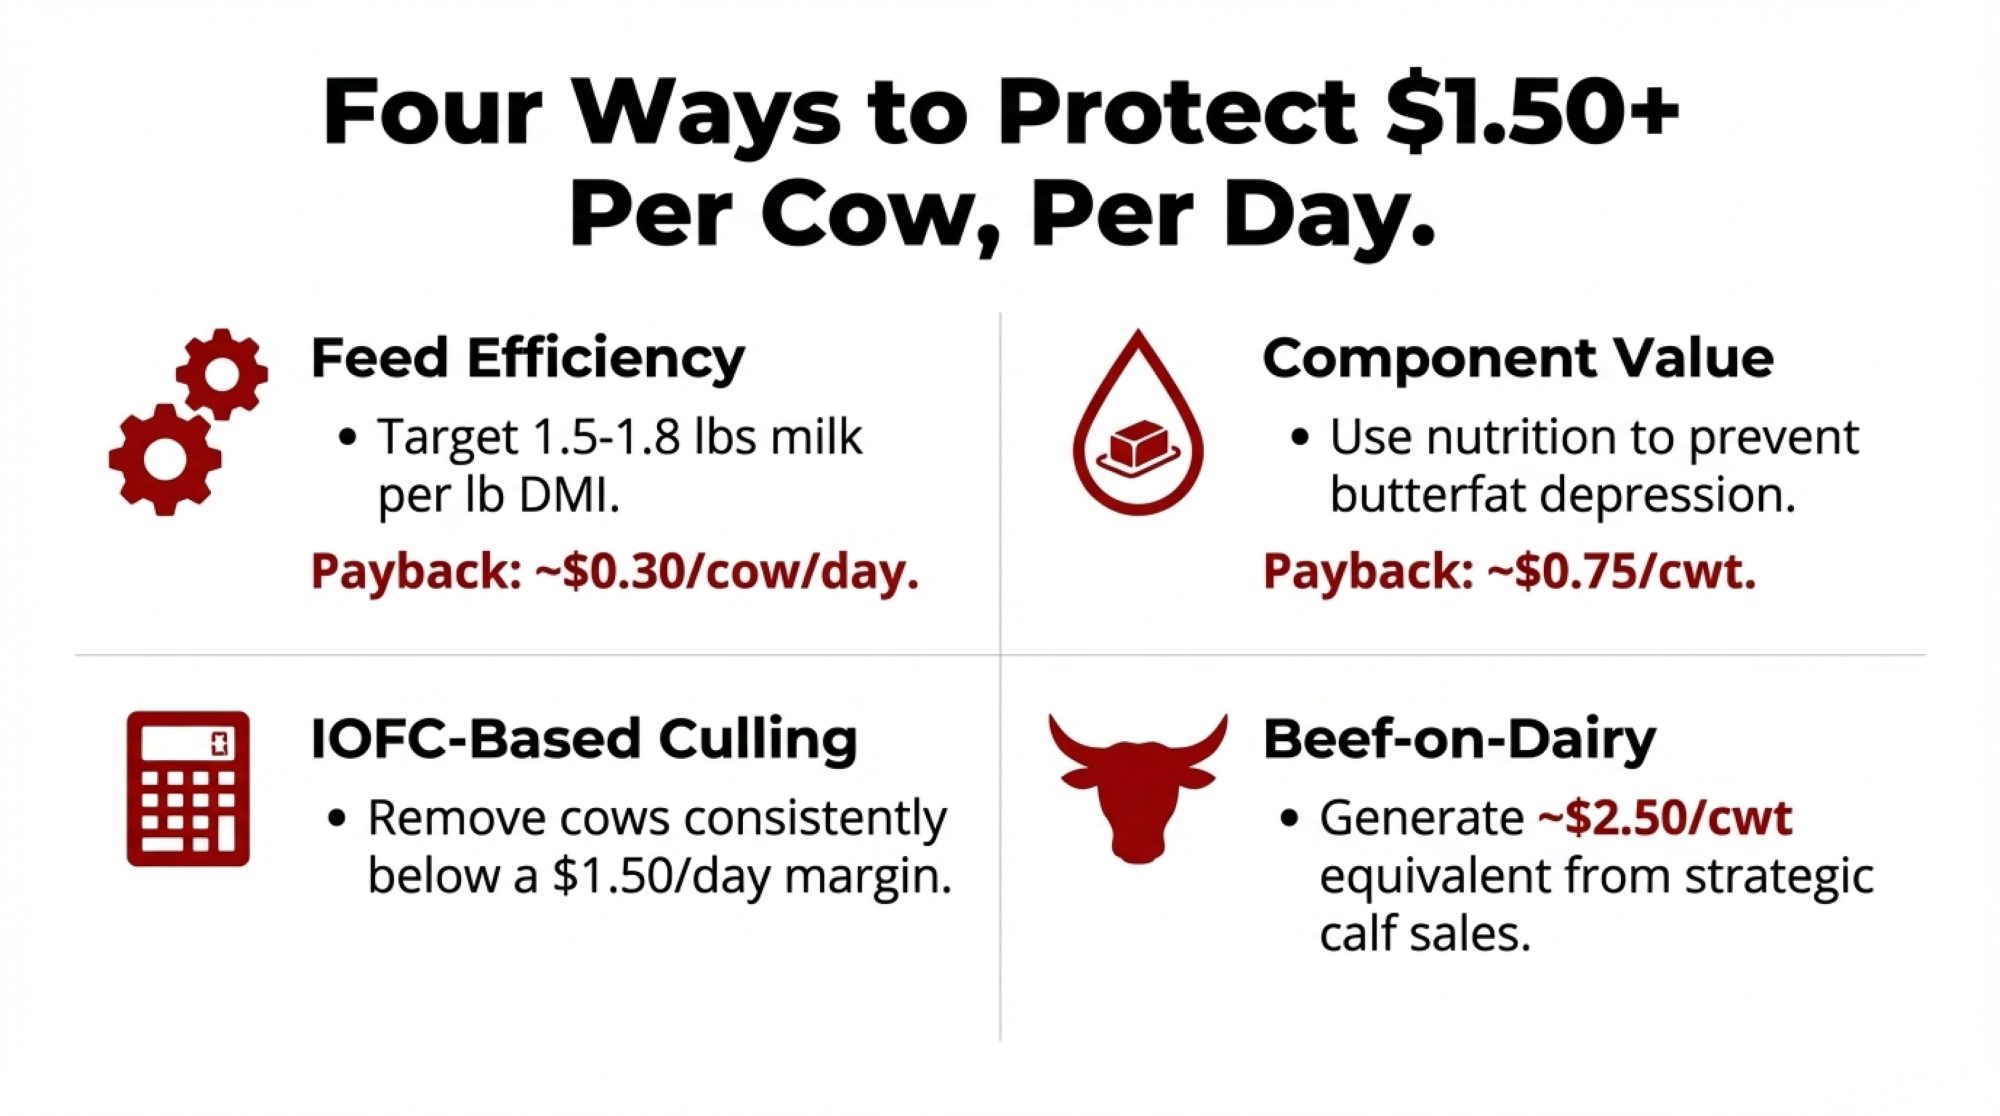
- 2026 margins leave no room for fluff. USDA’s $18.25/cwt all-milk forecast means a $0.30–$0.65/cow/day IOFC gain isn’t a bonus—it’s survival math.
- One acre of high-oleic soy feeds one cow for a year. MSU’s modeling shows $0.65/cow/day IOFC gains for farms that grow and roast their own beans—roughly $118,600/year on 500 cows.
- T&H Dairy in Michigan is already banking results: 4–5 lbs more fat-corrected milk and 0.15–0.20 points higher butterfat at 7.5–8 lbs of roasted high-oleic beans per cow per day.
- Your soybean acres can pay you twice. High-oleic contracts add $0.75–$1.25/bu over commodity beans ($40–70/acre extra at typical yields)—then those same beans boost IOFC in the bunk.
- High-oleic is a system, not a sprinkle. It only works with IP handling, dedicated bins, roasting, and real ration changes. The article’s three-path playbook (move now, plan a pilot, or watch and wait) helps you decide if your farm is ready.
Complete references and supporting documentation are available upon request by contacting the editorial team at editor@thebullvine.com.
Learn More
- The $20,000 Fresh Cow Feeding Mistake Most Dairies Make (And How Michigan State’s Research Can Fix It)– Gain a streamlined fresh-cow protocol that stops supplement waste and protects $20,000 in annual margin. Reveals MSU’s findings on biological “processing ceilings,” ensuring you only pay for fat that actually reaches the tank.
- More Milk, Fewer Farms, $250K at Risk: The 2026 Numbers Every Dairy Needs to Run – Exposes the dangerous gap between USDA’s high-milk forecasts and the $17-futures reality of 2026. Delivers a high-stakes playbook for stress-testing your cash flow and positioning your dairy before the market reset hits.
- Your Cheese Plant’s New Bacteria Can Run 56% Faster – Why This Technology Decides Which Processors (and Farms) Survive 2030 – Reveals how disruptive bio-tech is accelerating cheese production by 56%, fundamentally shifting which processors survive. Arms you with the foresight to align your herd with the high-efficiency supply chains of the next decade.
 The Sunday Read Dairy Professionals Don’t Skip.
 The Sunday Read Dairy Professionals Don’t Skip.
Every week, thousands of producers, breeders, and industry insiders open Bullvine Weekly for genetics insights, market shifts, and profit strategies they won’t find anywhere else. One email. Five minutes. Smarter decisions all week.