A plywood calf hutch panel, a combo silage bucket, and a kid‑safe bale opener just beat the catalog. Three Farmer‑Made fixes that saved calves, feed, and fingers — and might be hiding in your shop too.
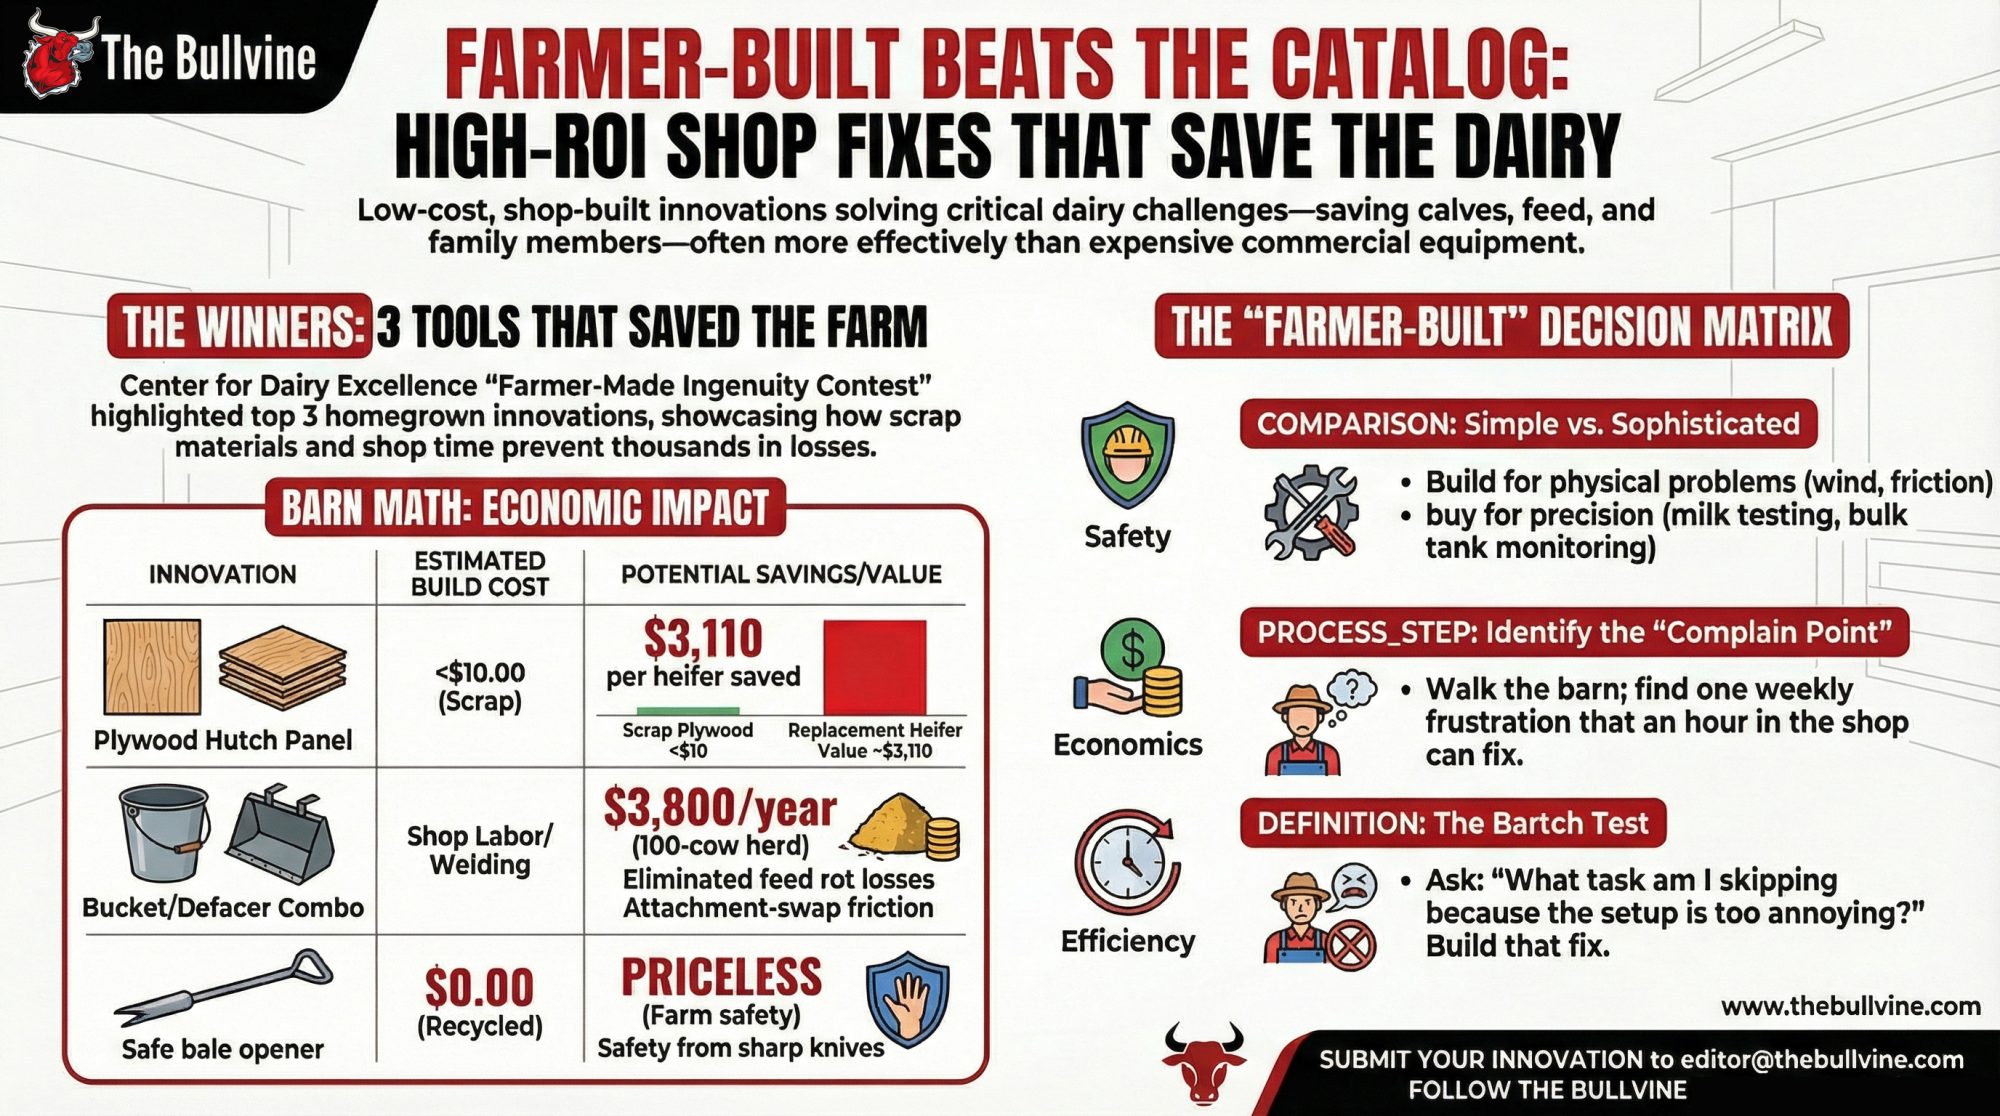
Executive Summary: The Center for Dairy Excellence’s first Farmer-Made Ingenuity Contest showed how far barn-made fixes can go when three dairy families beat the catalog with what was already in their shop. Palmyra Farm’s Mary Creek won $1,000 using a 30×30-inch plywood panel on her calf hutches — a scrap-wood windbreak that can pay for itself thousands of times over if it saves even one replacement heifer now worth about $3,000. In Pennsylvania, Donny Bartch welded his silage defacer onto the bucket so he never has to swap attachments, a simple change that lines up with UW Extension data showing better face management can keep roughly $3,800 of feed a year from rotting on the bunk in a 100‑cow herd. At Love Haven Farm, Susan Spadaro’s homemade bale opener let 4‑H kids cut twine without carrying knives, a small safety upgrade in a sector where at least 33 children are seriously hurt on farms every day. The pattern is clear: when the problem is simple, the risk is low, and the materials are already lying around, building your own solution can save calves, feed, and fingers faster than waiting on a sales rep. If you’re reading this, your 30‑day job is to walk your barn, find one thing you complain about every week, and ask whether an hour in the shop could turn it into your own Farmer‑Built fix.
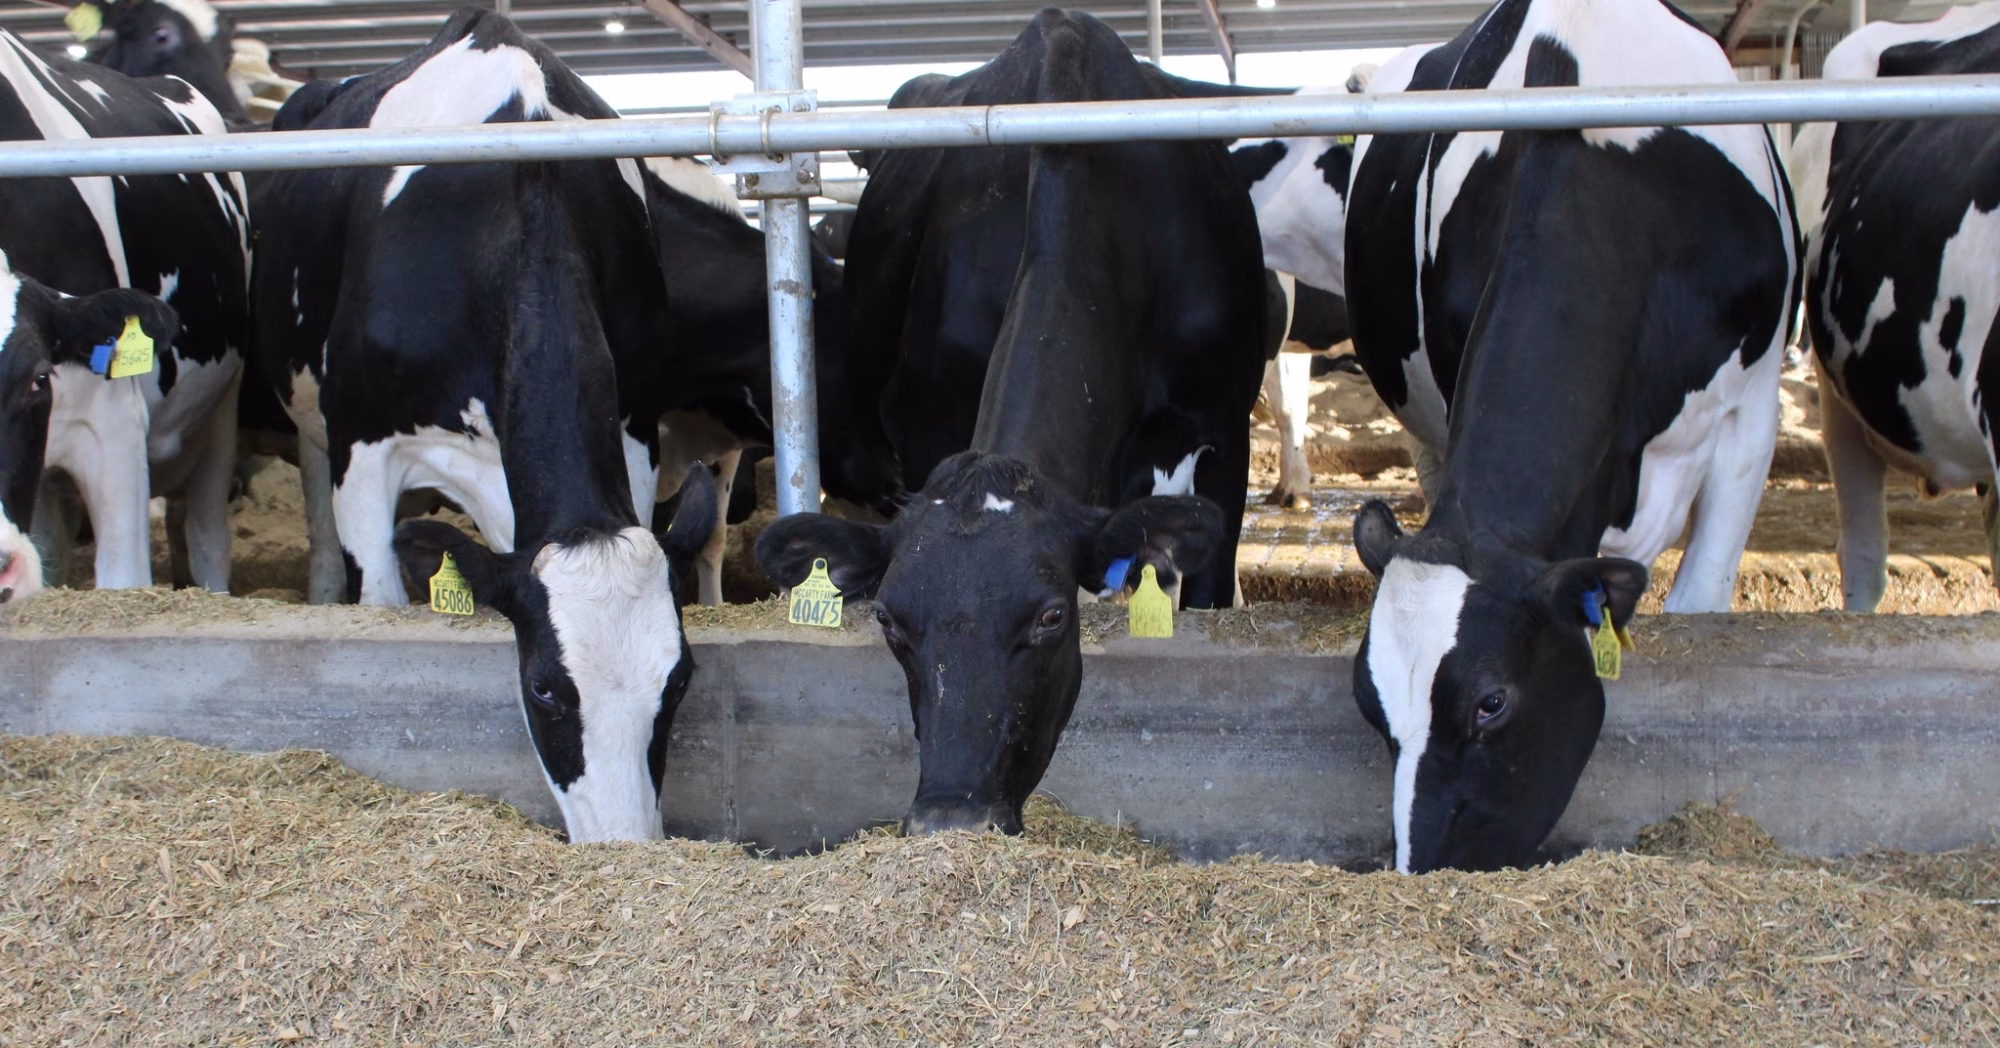
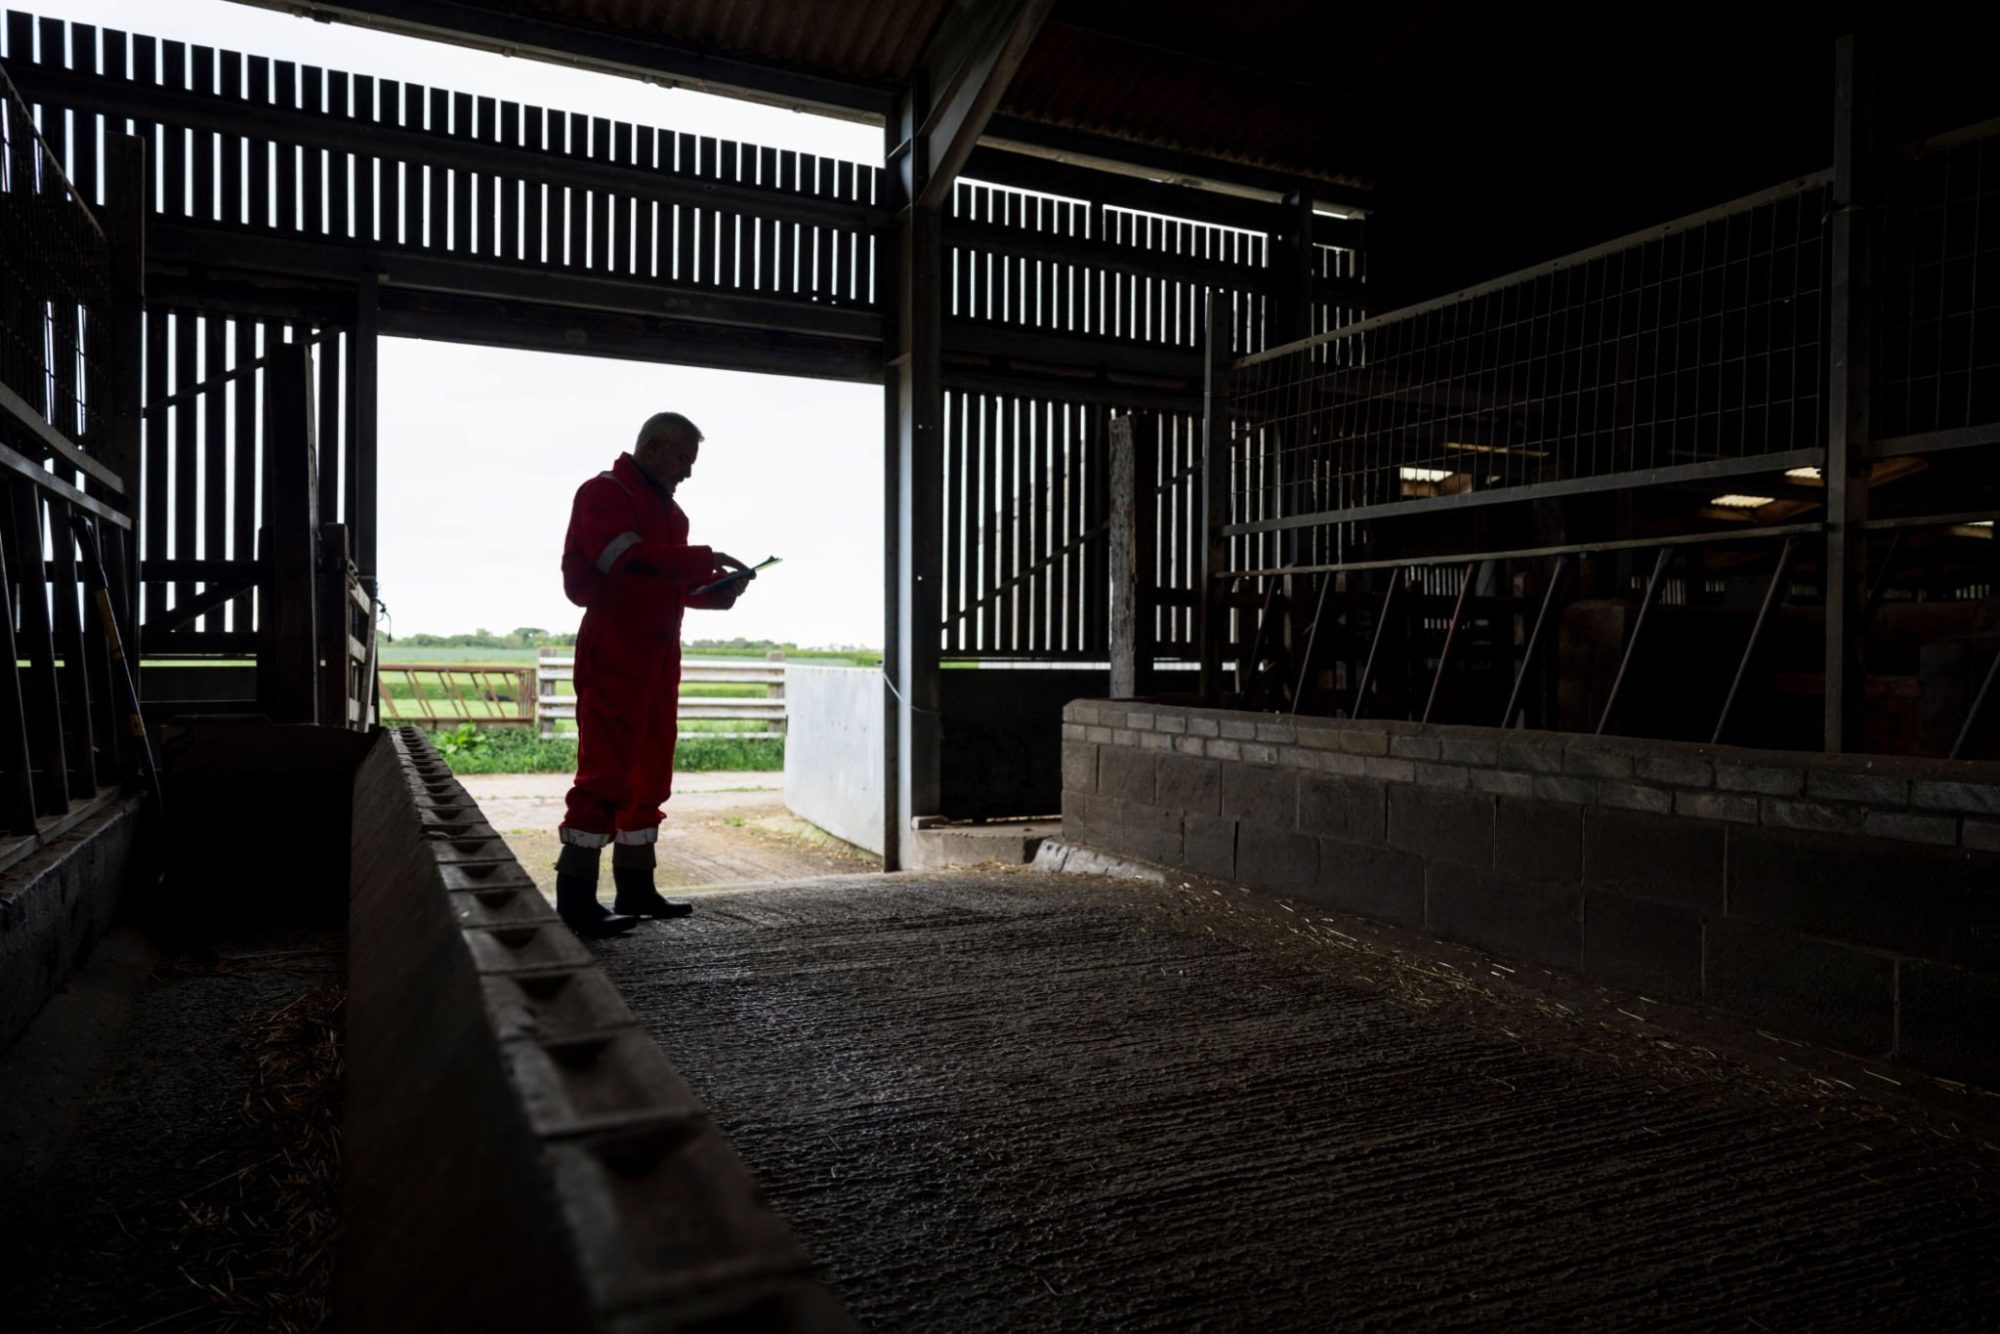
Mary Creek pushes up hay at Palmyra Farm in Hagerstown, Maryland — the same five-generation Ayrshire operation where a 30×30-inch piece of plywood just won $1,000 for keeping newborn calves alive through winter.
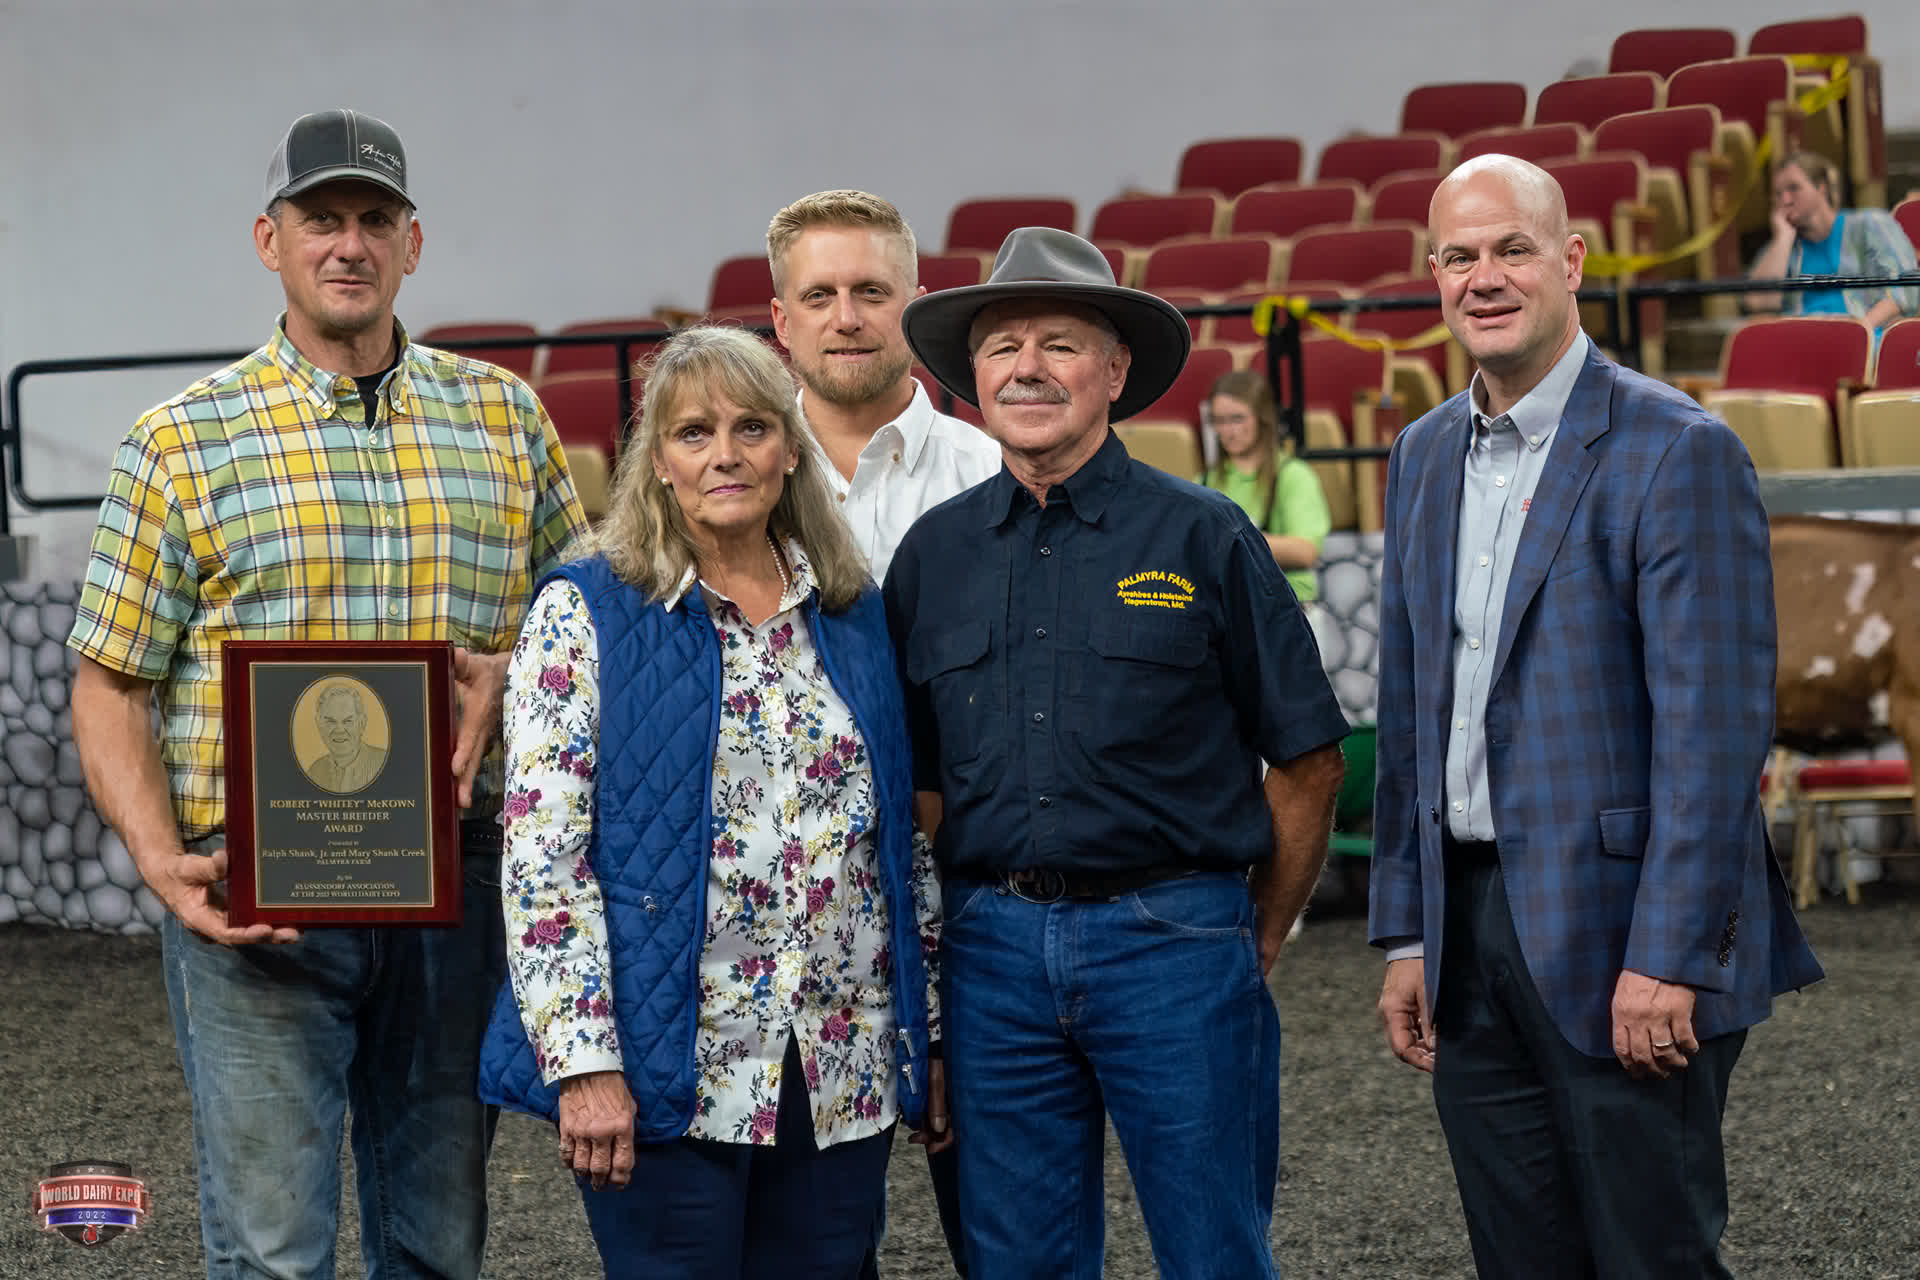
Mary Shank Creek has spent her life building one of the most accomplished Ayrshire breeding programs in the country. Palmyra Farm — the five-generation family operation she runs with her brother Ralph Shank Jr. in Hagerstown, Maryland — has produced over 150 cows with lifetime production exceeding 100,000 pounds of milk, exported embryos to 10 foreign countries, and was the first U.S. operation to utilize embryo transfer in the Ayrshire breed. That work earned them the 2022 Robert “Whitey” McKown Master Breeder Award at World Dairy Expo. Three years earlier, Creek and Shank received the National Dairy Shrine’s Distinguished Dairy Cattle Breeder Award.
So when the Center for Dairy Excellence launched its first-ever Farmer-Made Ingenuity Contest and asked dairy farmers across the mid-Atlantic to submit their best homegrown innovations, you’d expect Creek to show up with something sophisticated.
She submitted a piece of plywood.
A 30-by-30-inch piece of plywood, rigged as a calf hutch accessory to block wind and hold warmth for newborns during the winter months. That plywood panel — simple, easy to construct, easy to move — won first place and $1,000. It tells you everything about the gap between what the equipment catalog sells and what actually works when a newborn calf needs to survive a winter night.
11 Entries, Five States, More Than 500 Votes
The contest was open to dairy producers and employees in Pennsylvania, Maryland, Delaware, New Jersey, and West Virginia. The Center collected 11 submissions, then opened a digital public vote. More than 500 people weighed in. Winners were spotlighted at the PA Dairy Summit in February.
Three took home cash prizes: $1,000 for first, $500 for second, and $250 for third. But the Center published all 11 innovations in a digital library at centerfordairyexcellence.org/farmer-made-library, making every submission available to any farmer looking for ideas.
“We were so impressed by the ingenuity of our dairy farmers,” said Jayne Sebright, Executive Director of the Center for Dairy Excellence. “We’ve already heard from other producers who are saying, ‘Hey, I could do this on my farm’ when they see some of the ideas. That’s what makes this type of idea-sharing so special. We learn the most from one another.”
The three winners tell very different stories about what farmer innovation looks like — and each one is specific enough to steal.
Creek’s Calf Hutch Fix: When Less Is More
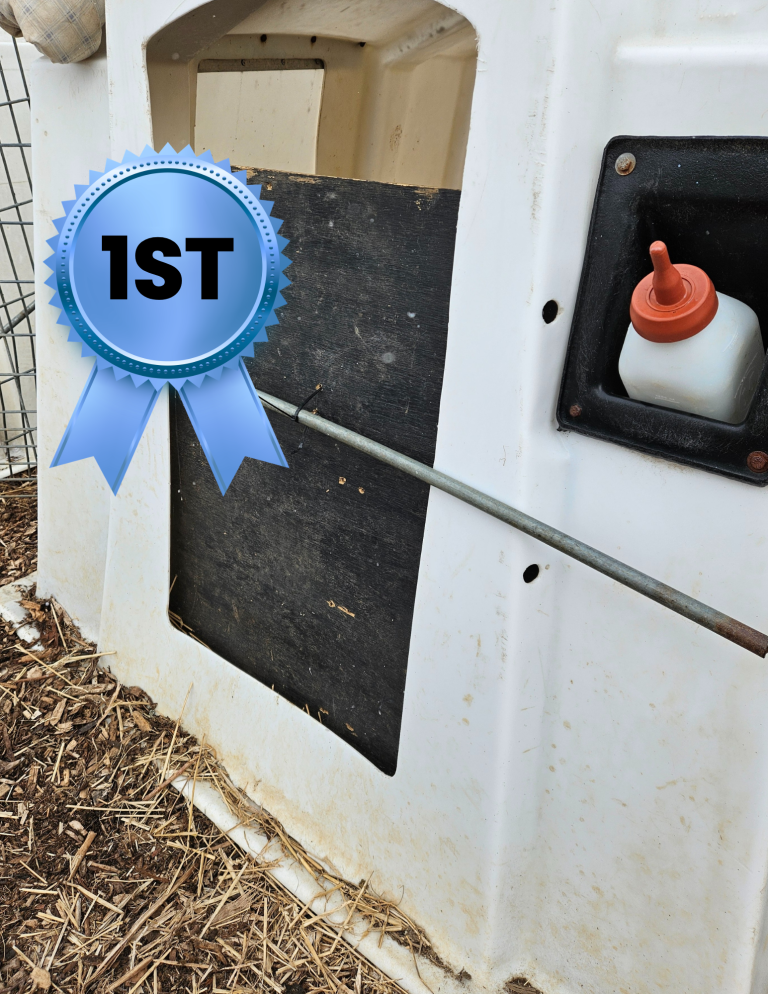
The $1,000 winner: Creek’s plywood panel held in place by two zip ties and a metal hutch pole — sized to block wind while leaving 3–6 inches of ventilation gap on each side. It started with a preemie calf they were afraid they’d lose. (Photo: Center for Dairy Excellence / Farmer-Made Ingenuity Contest)
Creek’s first-place innovation solves one of the most fundamental problems in calf management: keeping newborn calves warm in winter hutches without suffocating them.
“We used a piece of plywood approximately 30 inches by 30 inches,” Creek explained. “We use it to cover the opening in our calf hutches to keep calves warmer until they are ready to face the winter temperatures, but allow reasonable ventilation. The sizing allows air to move through the hutch but reduces the exposure for the first few days of the calf’s life.”
The design is intentionally minimal. Block the wind. Retain body heat during the most vulnerable window. Remove it when temperatures allow. That’s it.
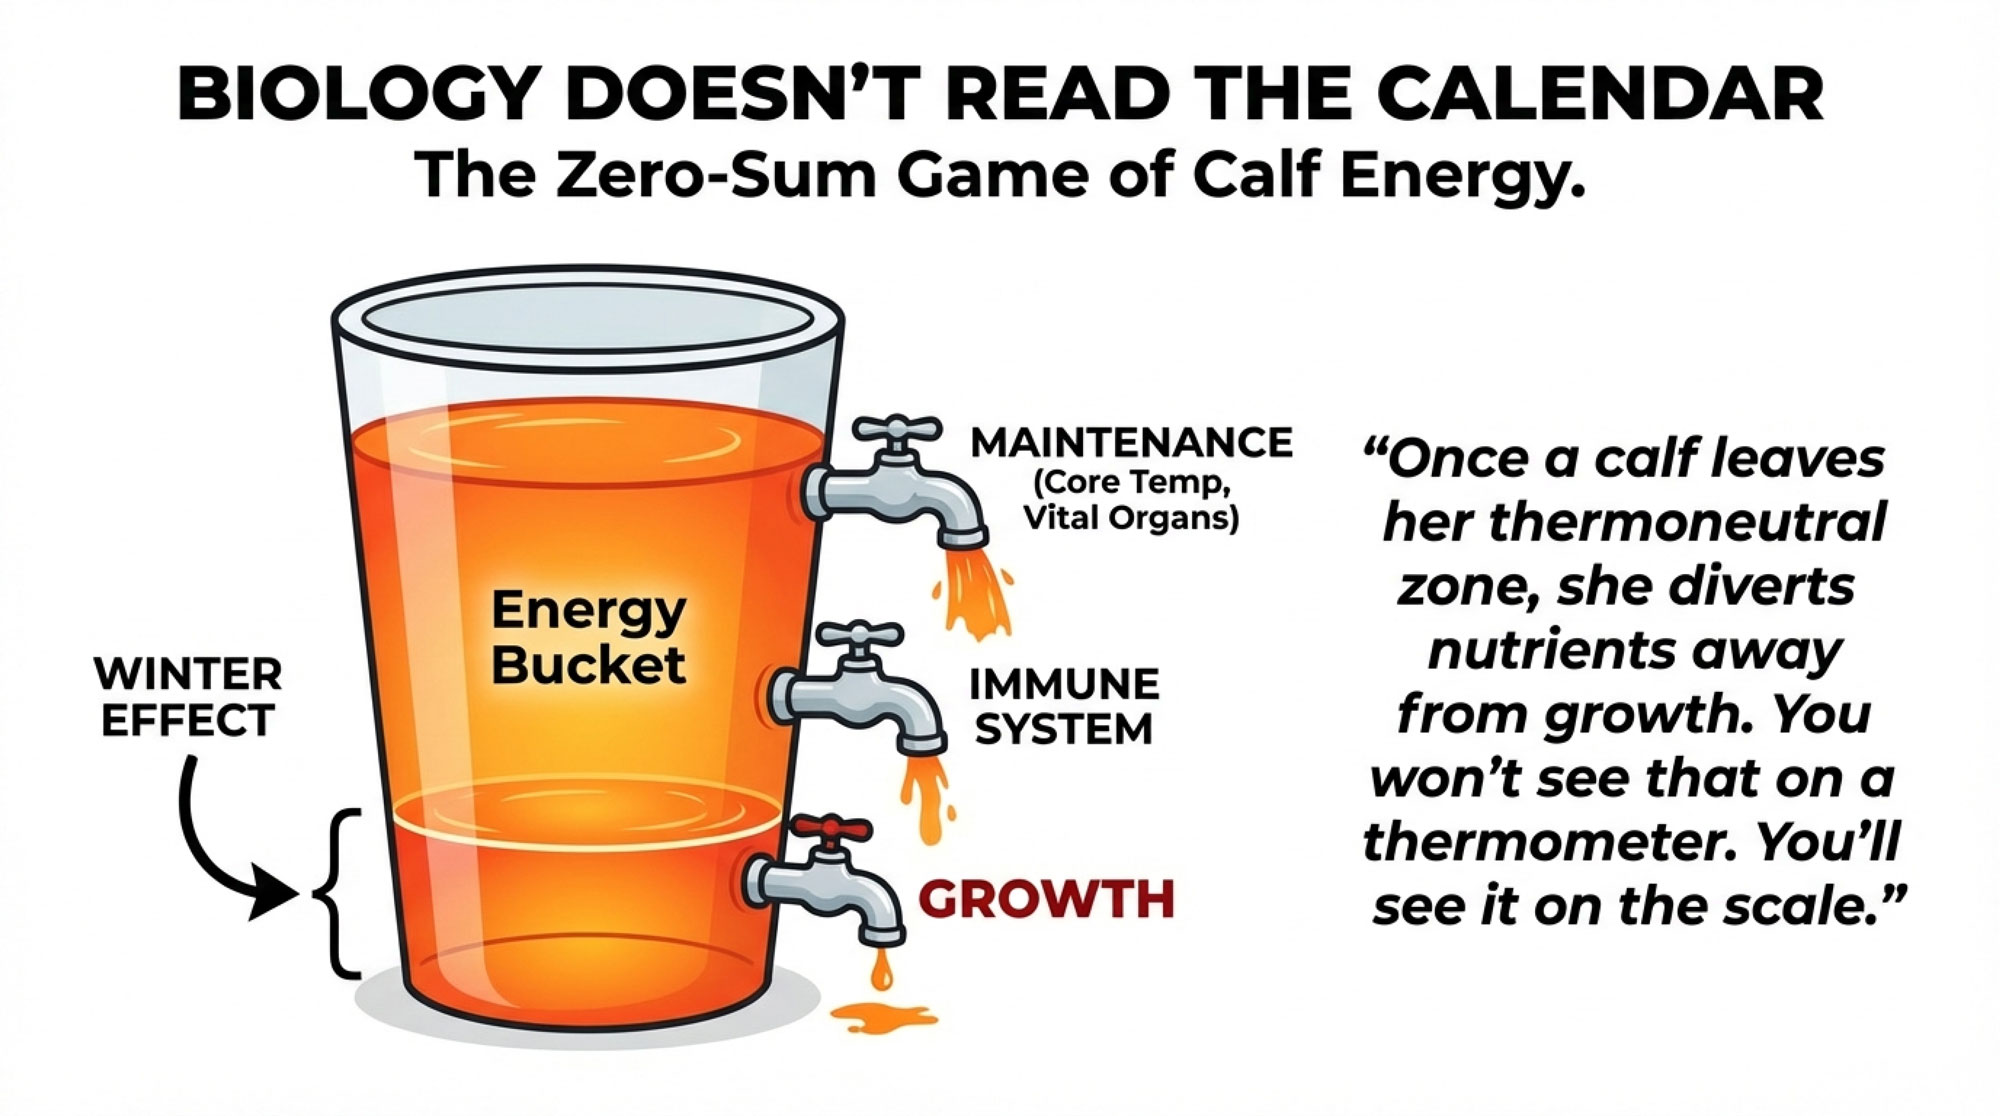
“It keeps them warm early in their lives and promotes healthy growth so they can use more of their ration for growth and less for maintaining body heat,” Creek said. “It is simple, easy to construct, move, and store. It has saved calves.”
THE BUILD SPECS
What Creek described: One piece of plywood, approximately 30×30 inches. Covers the hutch opening to block wind exposure while leaving enough gap around the edges for ventilation. Goes in at night, comes out during the day when temperatures allow. Stays in full-time during the calf’s first few days.
What you need: A single piece of exterior-grade plywood (a quarter-sheet of standard 4×8 will yield two panels). A saw. Five minutes.
Fastening and fit: Creek’s submission describes the panel as covering the hutch opening but doesn’t specify the attachment method—whether it leans, clips, or straps to the frame. If you’re adapting this for your hutches, the principle matters more than the method: size the panel smaller than the opening so air moves around the edges, blocking direct wind on the calf while allowing enough exchange to prevent moisture buildup and respiratory problems. The 30×30-inch dimensions suggest standard poly hutch openings in the 36-to-42-inch range, providing 3–6 inches of ventilation gap per side. Bungee cords work. So does a wire hook, or just leaning the panel against the opening. Try what fits your hutch brand.
That last sentence — “It has saved calves” — matters a lot more when you run the numbers.
The Barn Math on a Piece of Plywood
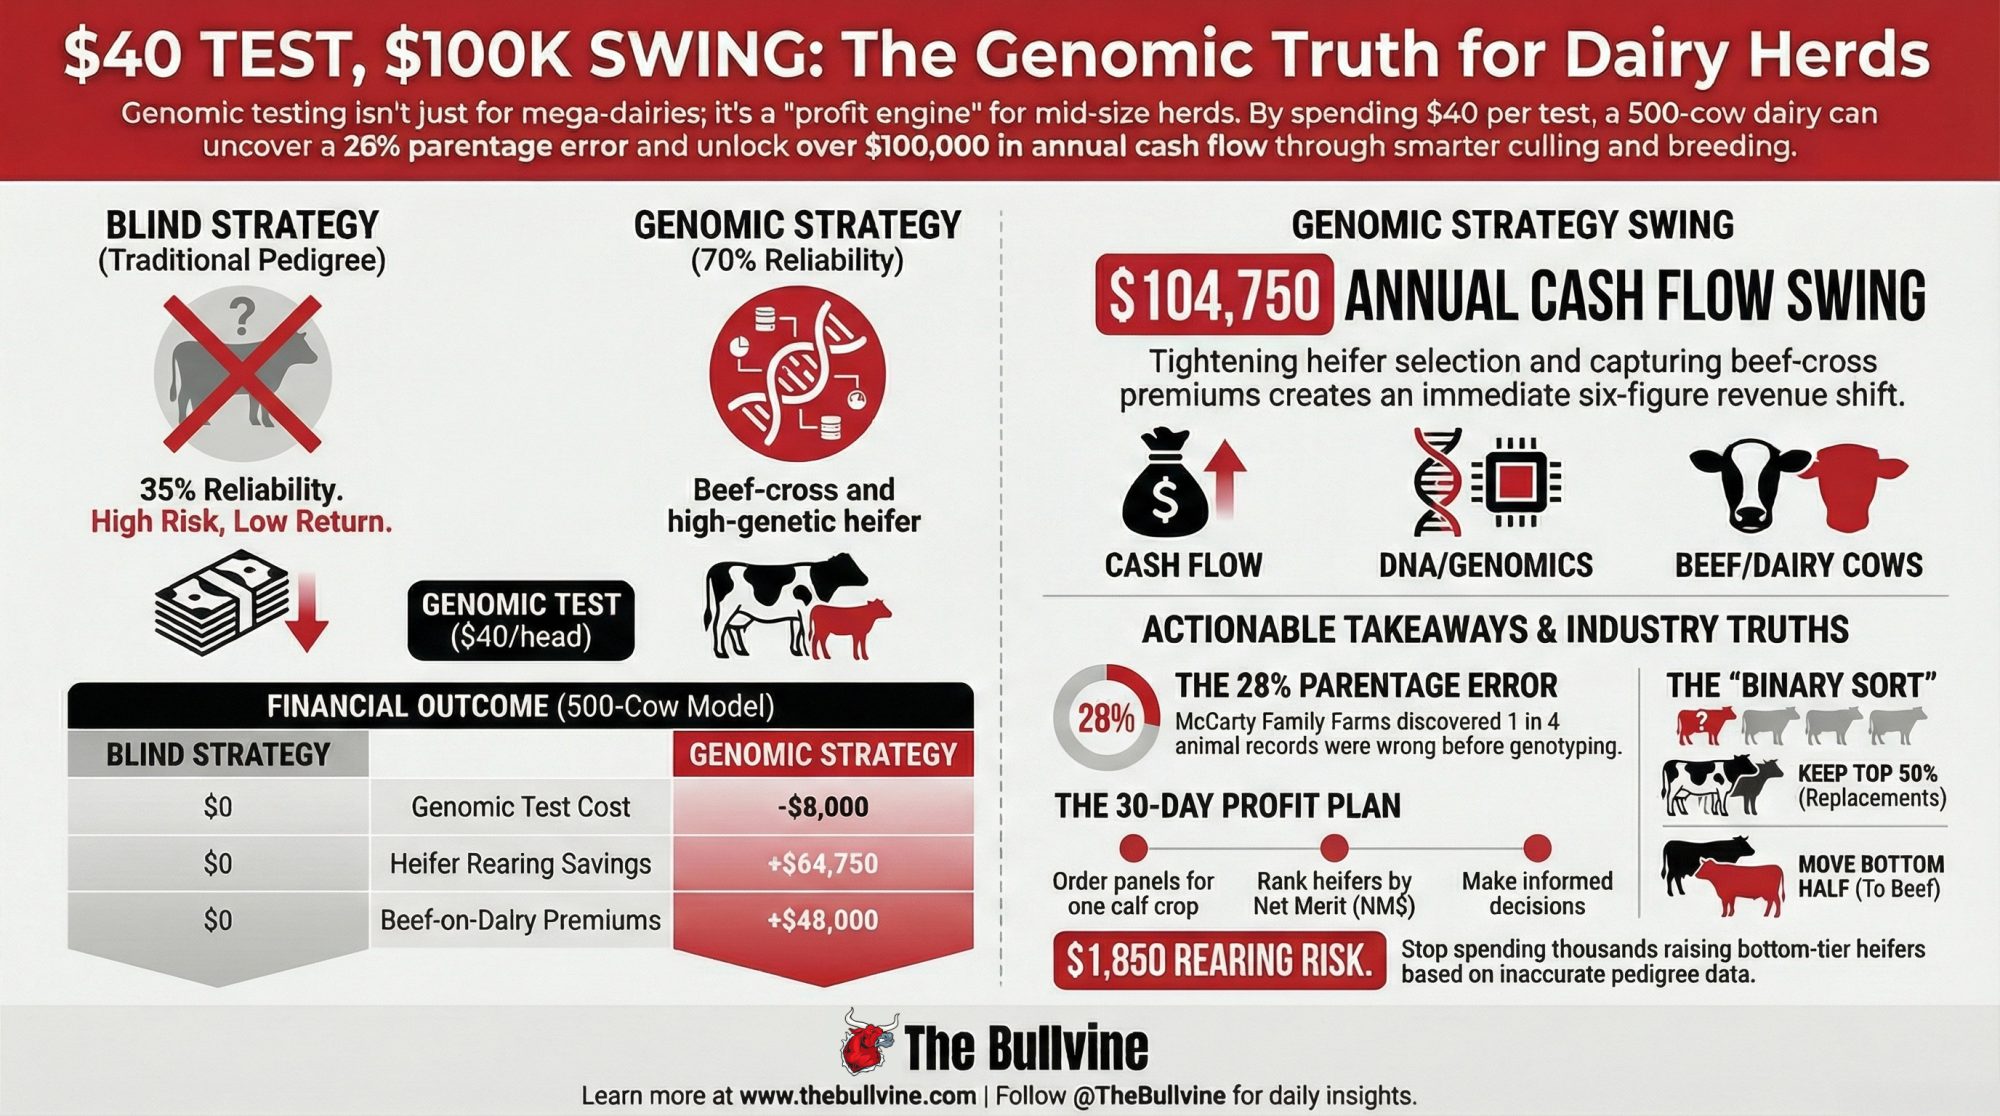
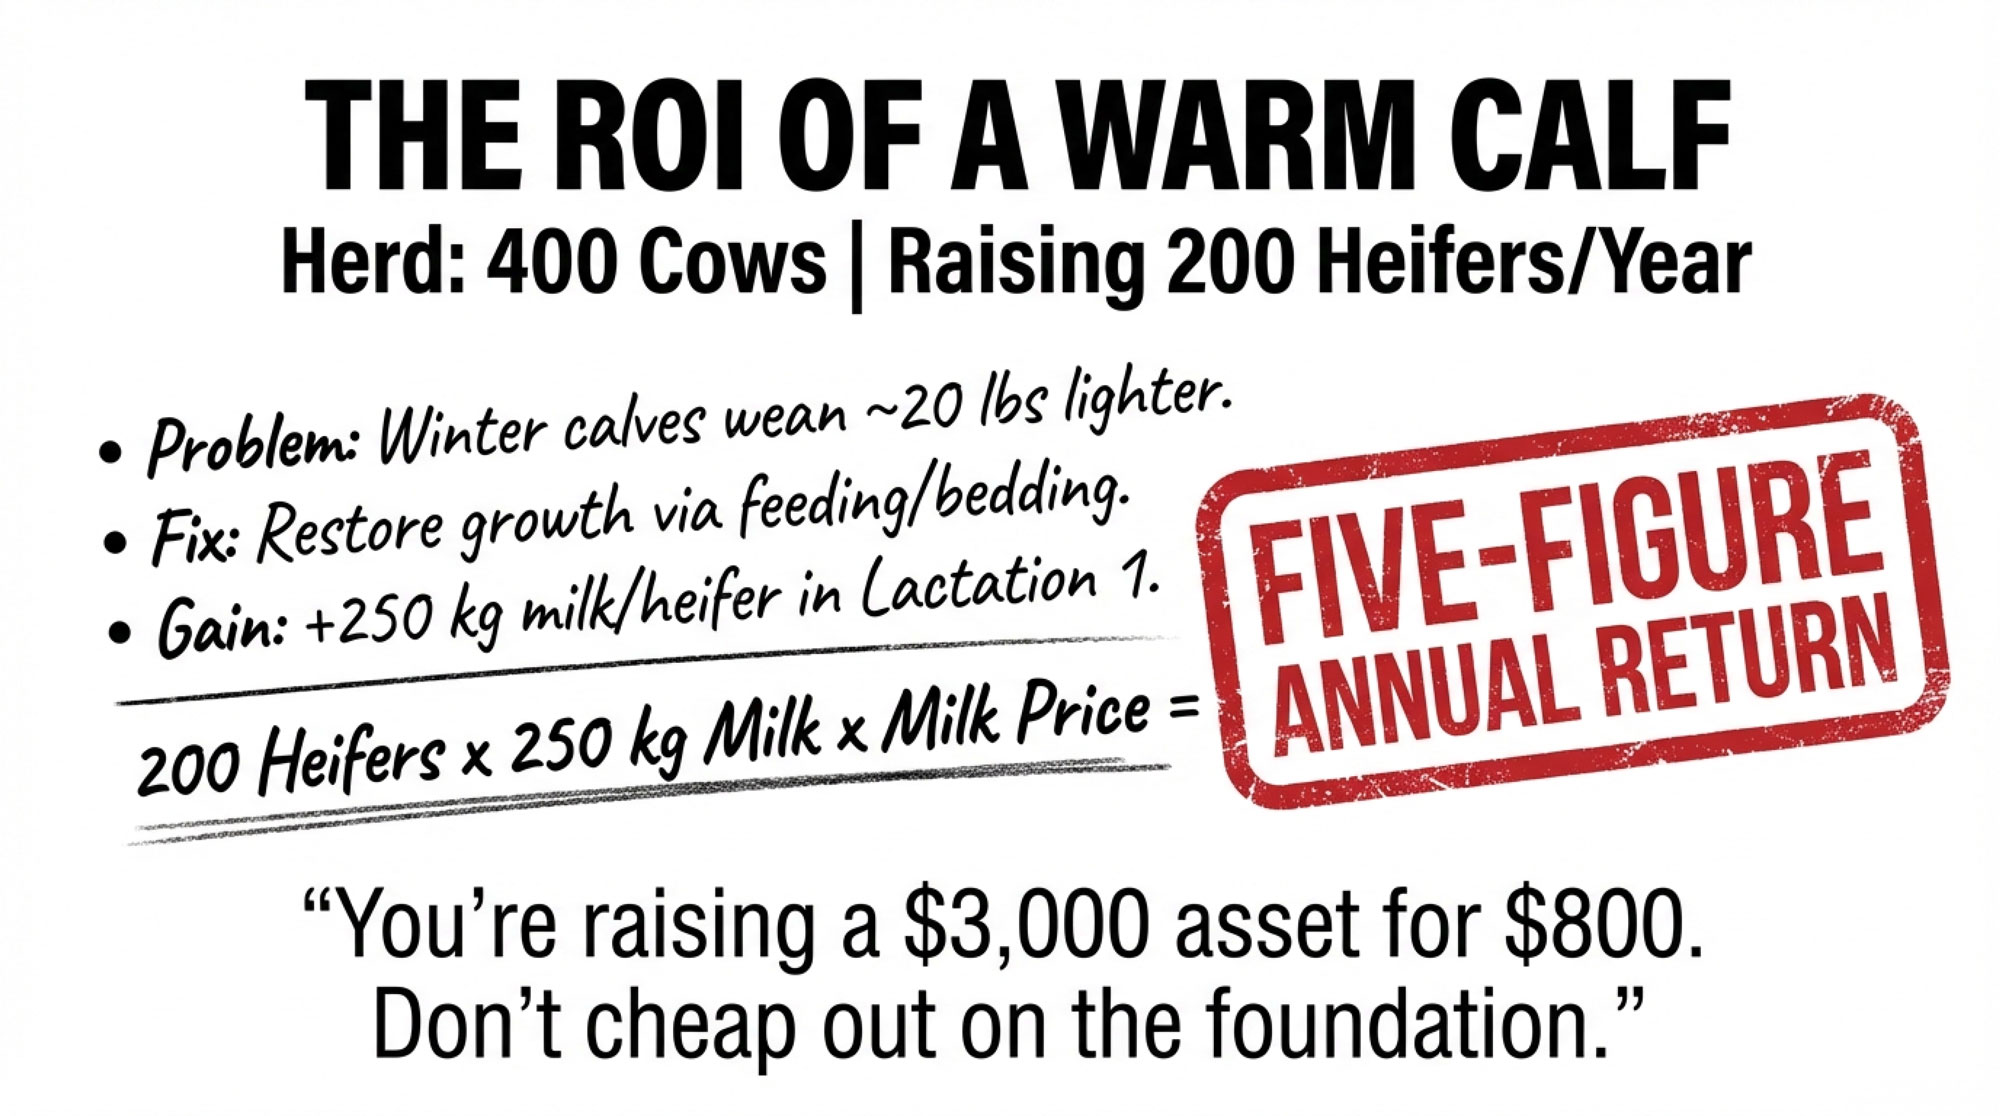
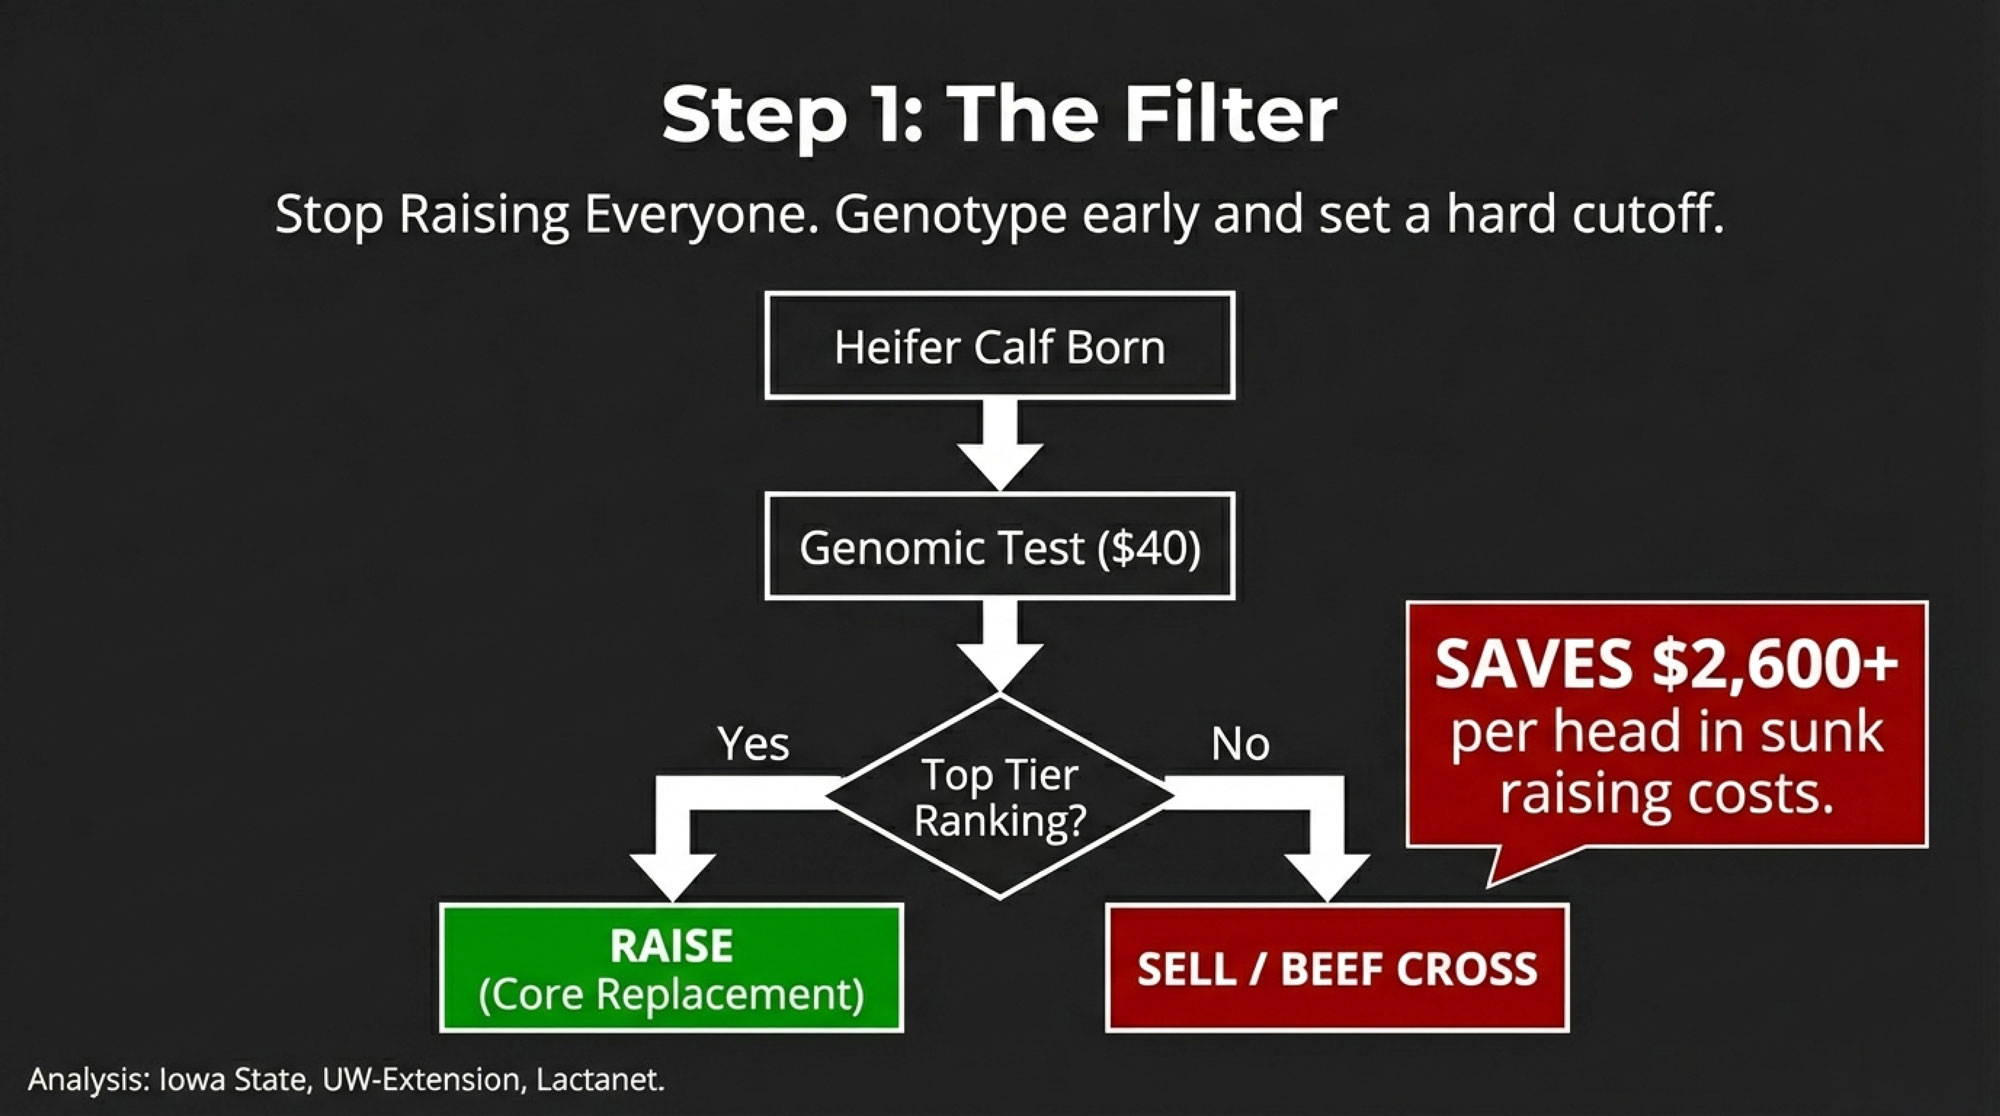
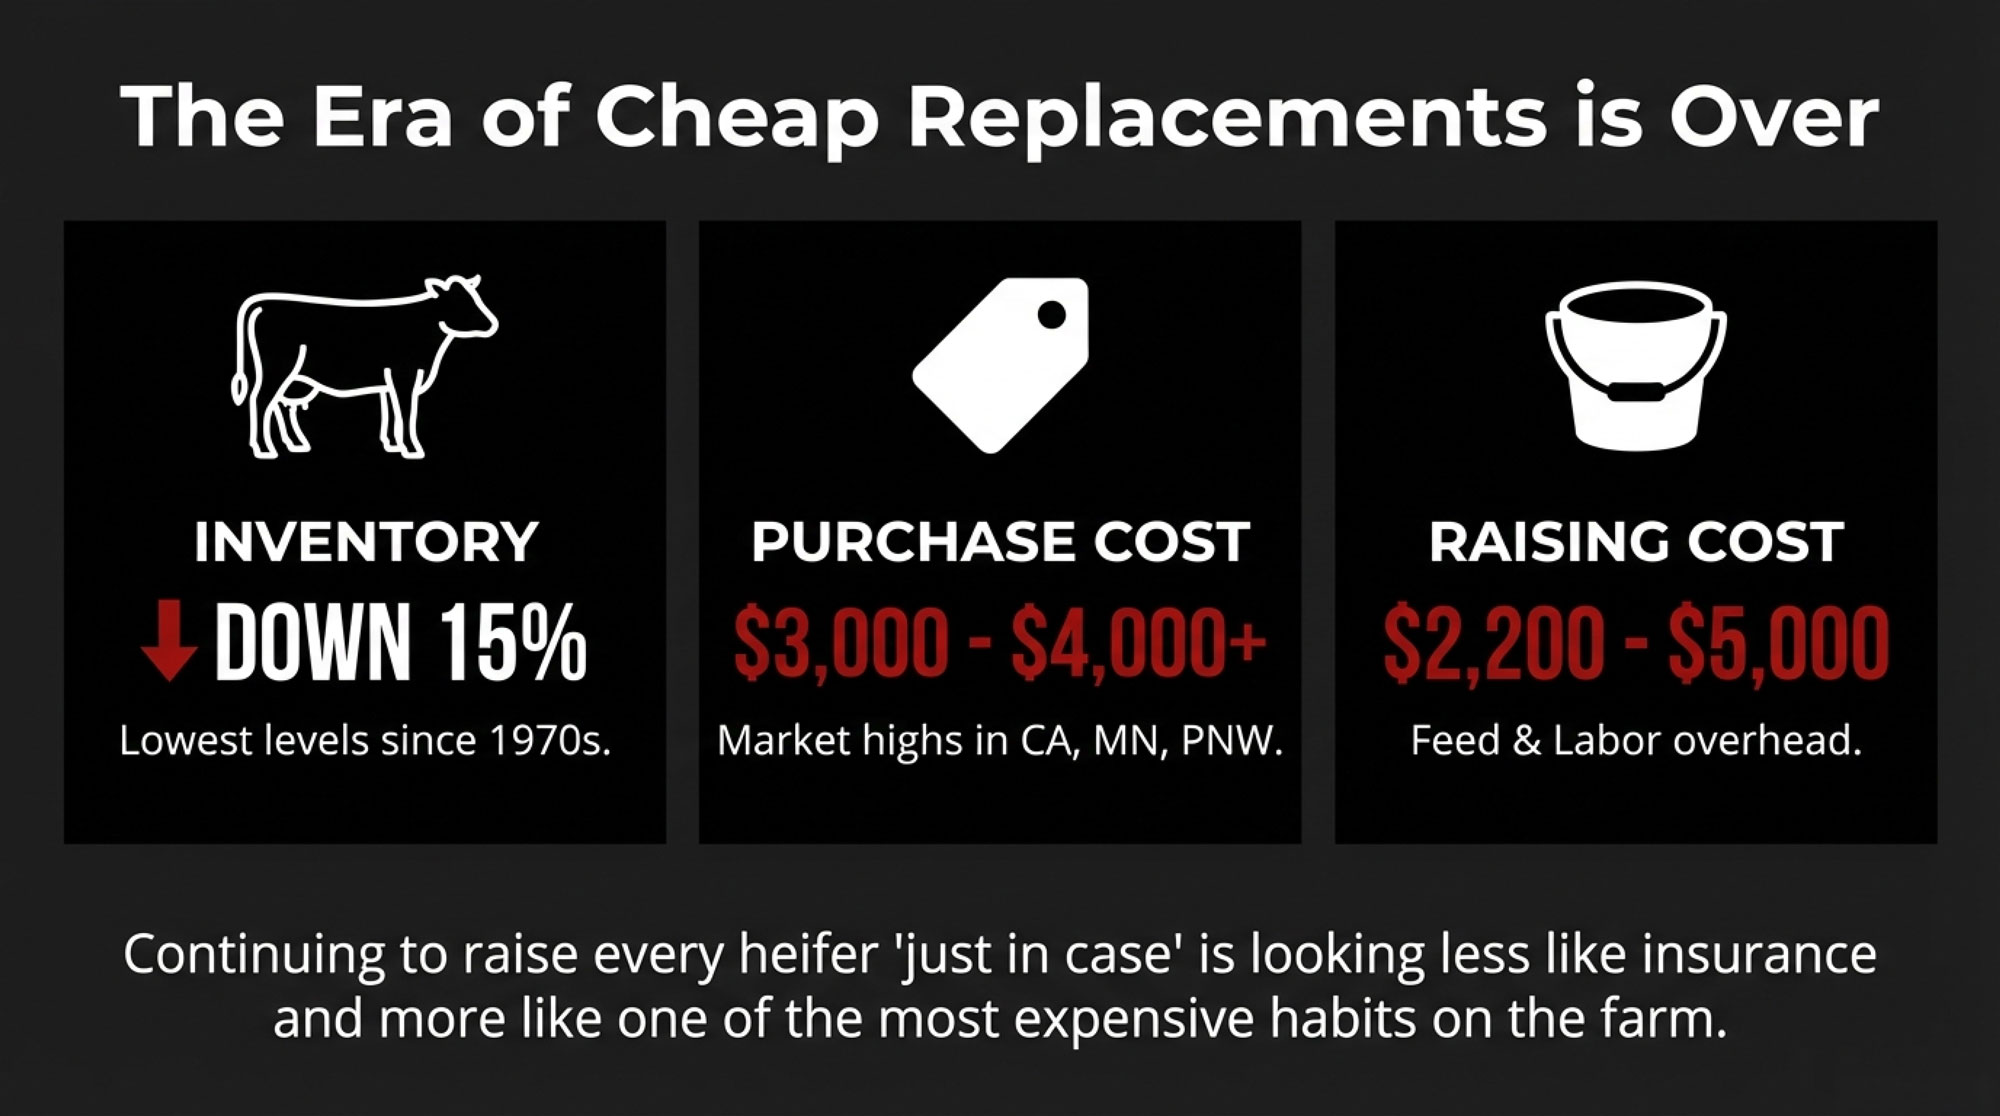
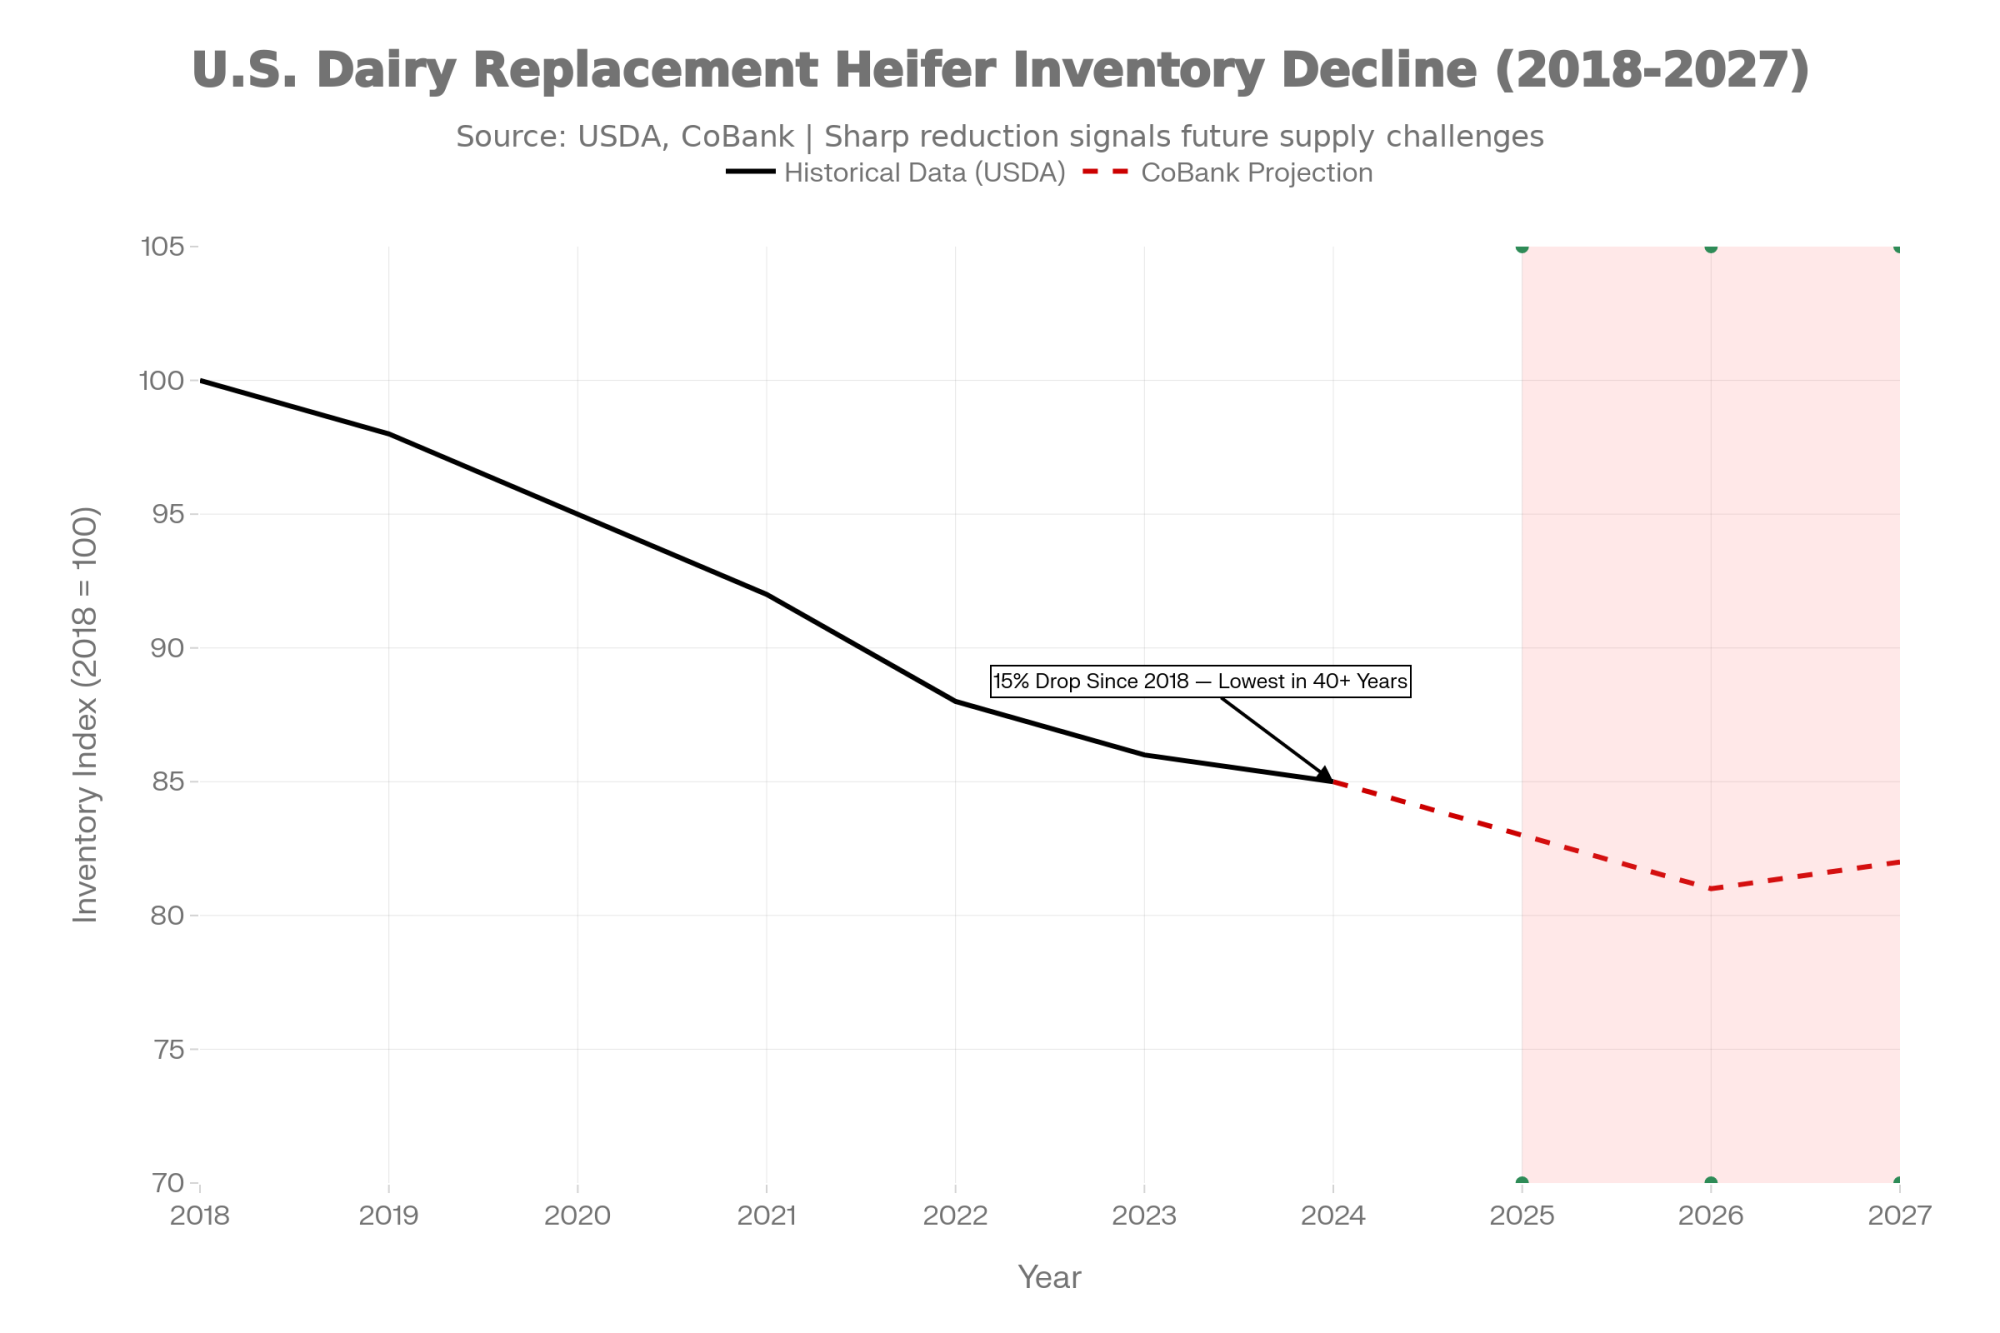
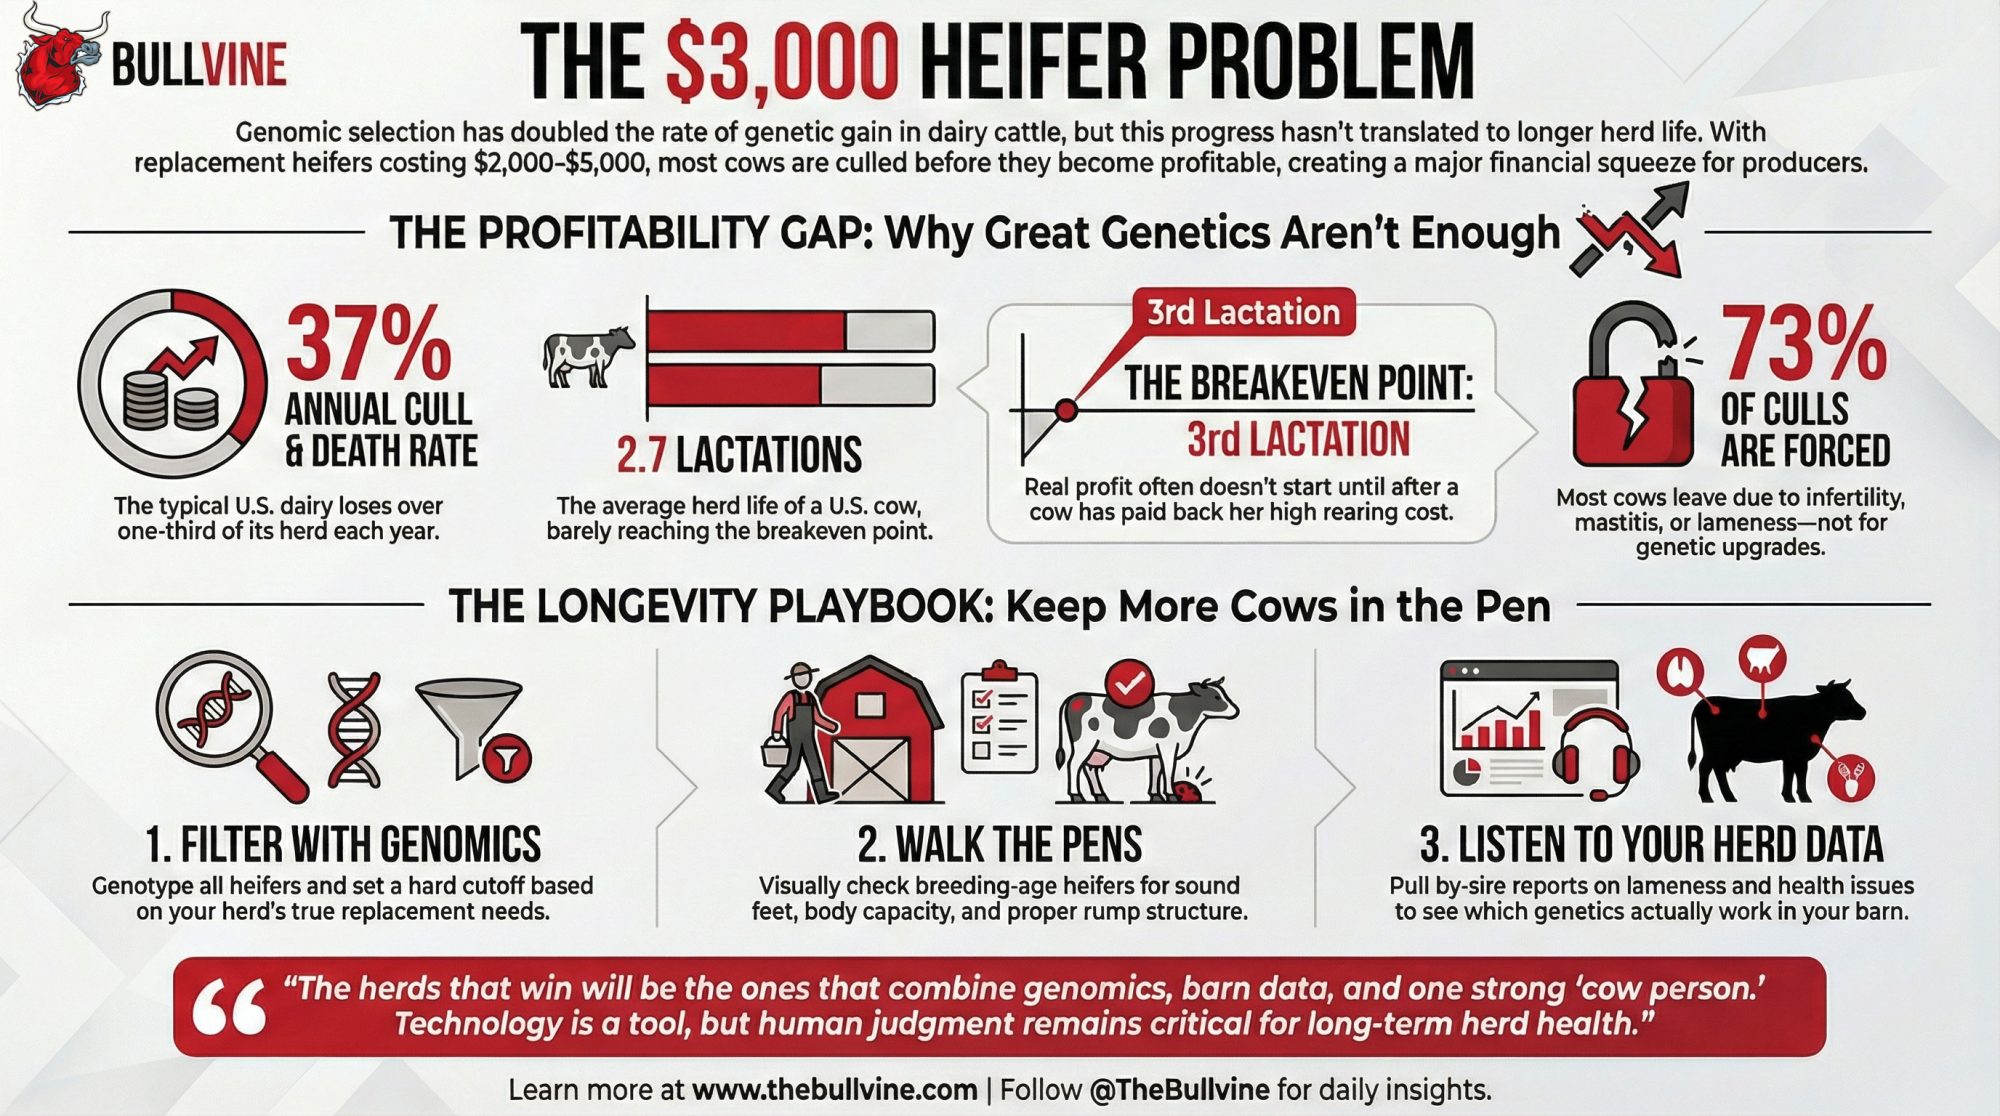
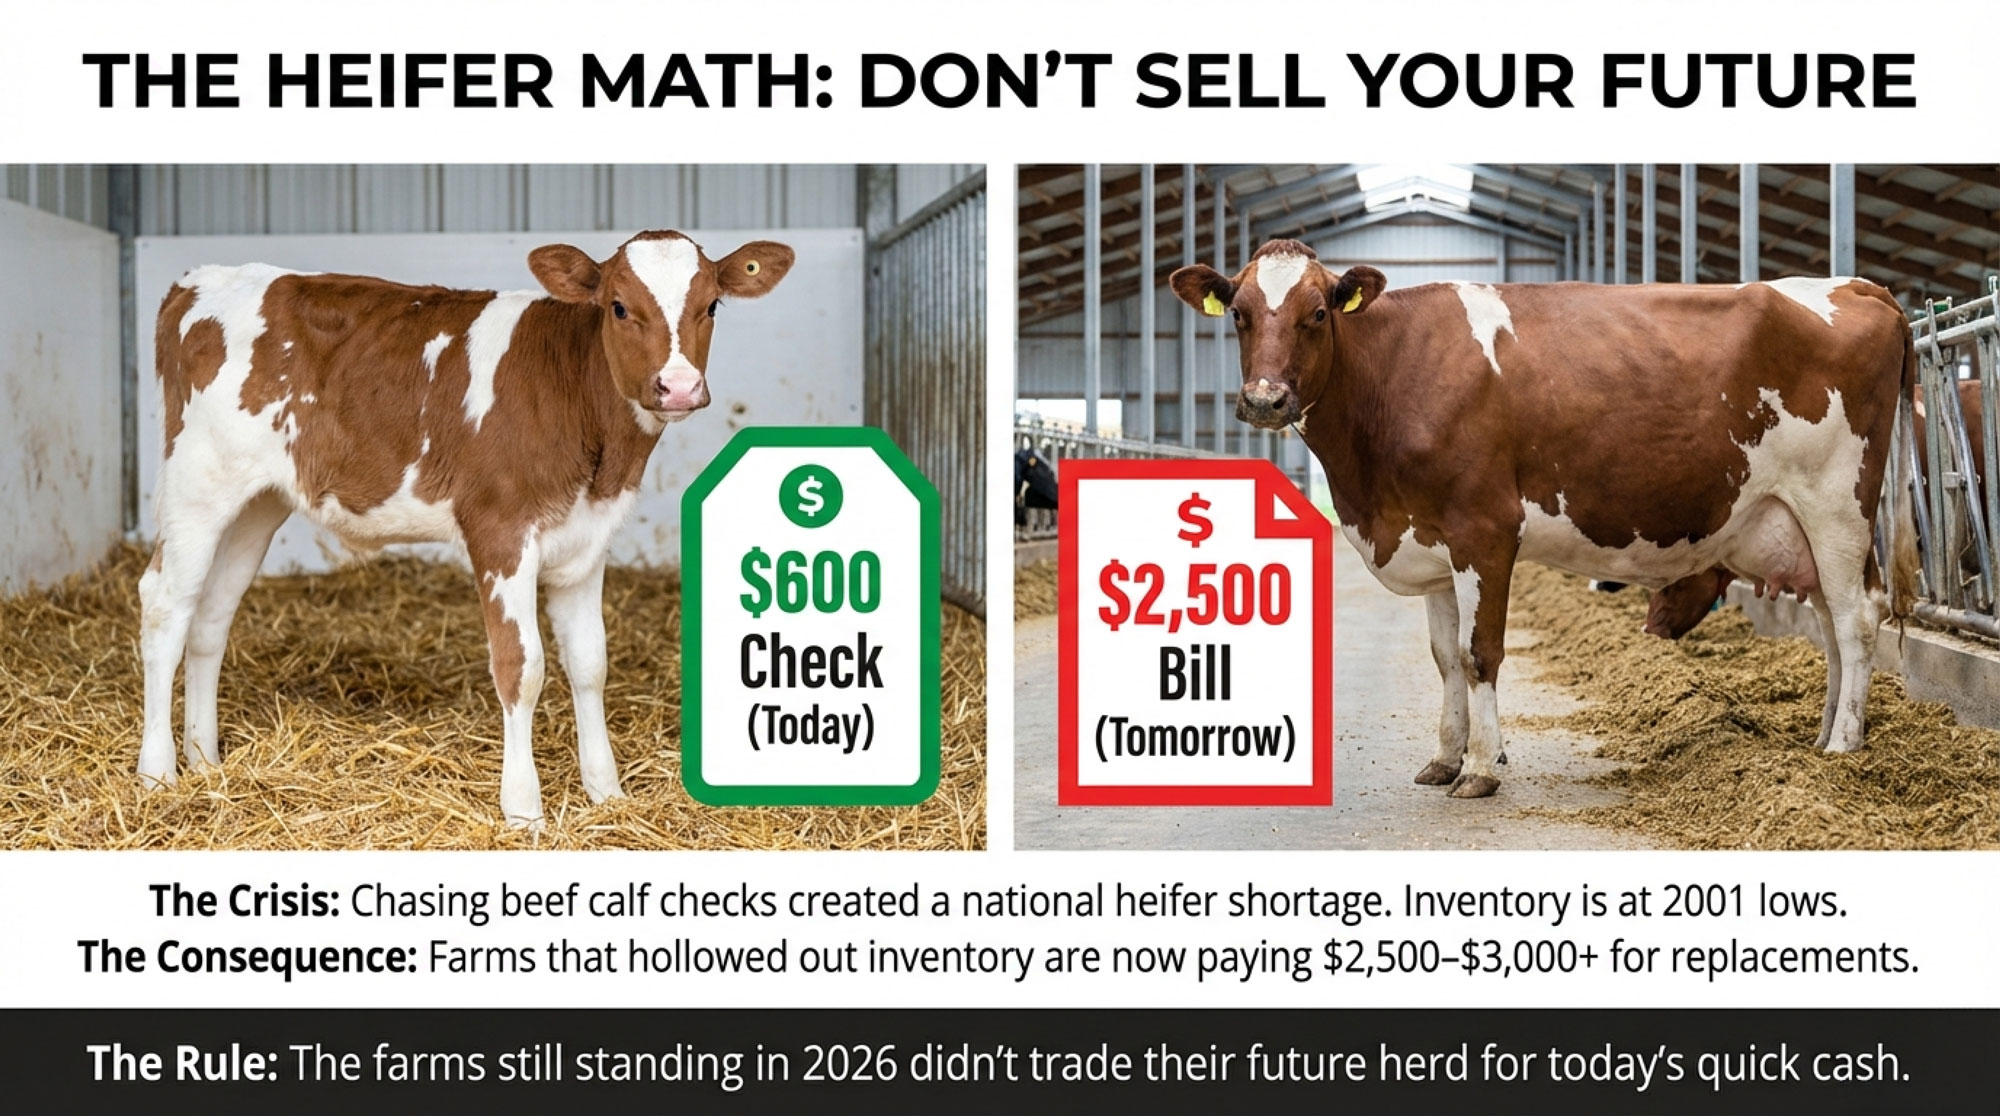
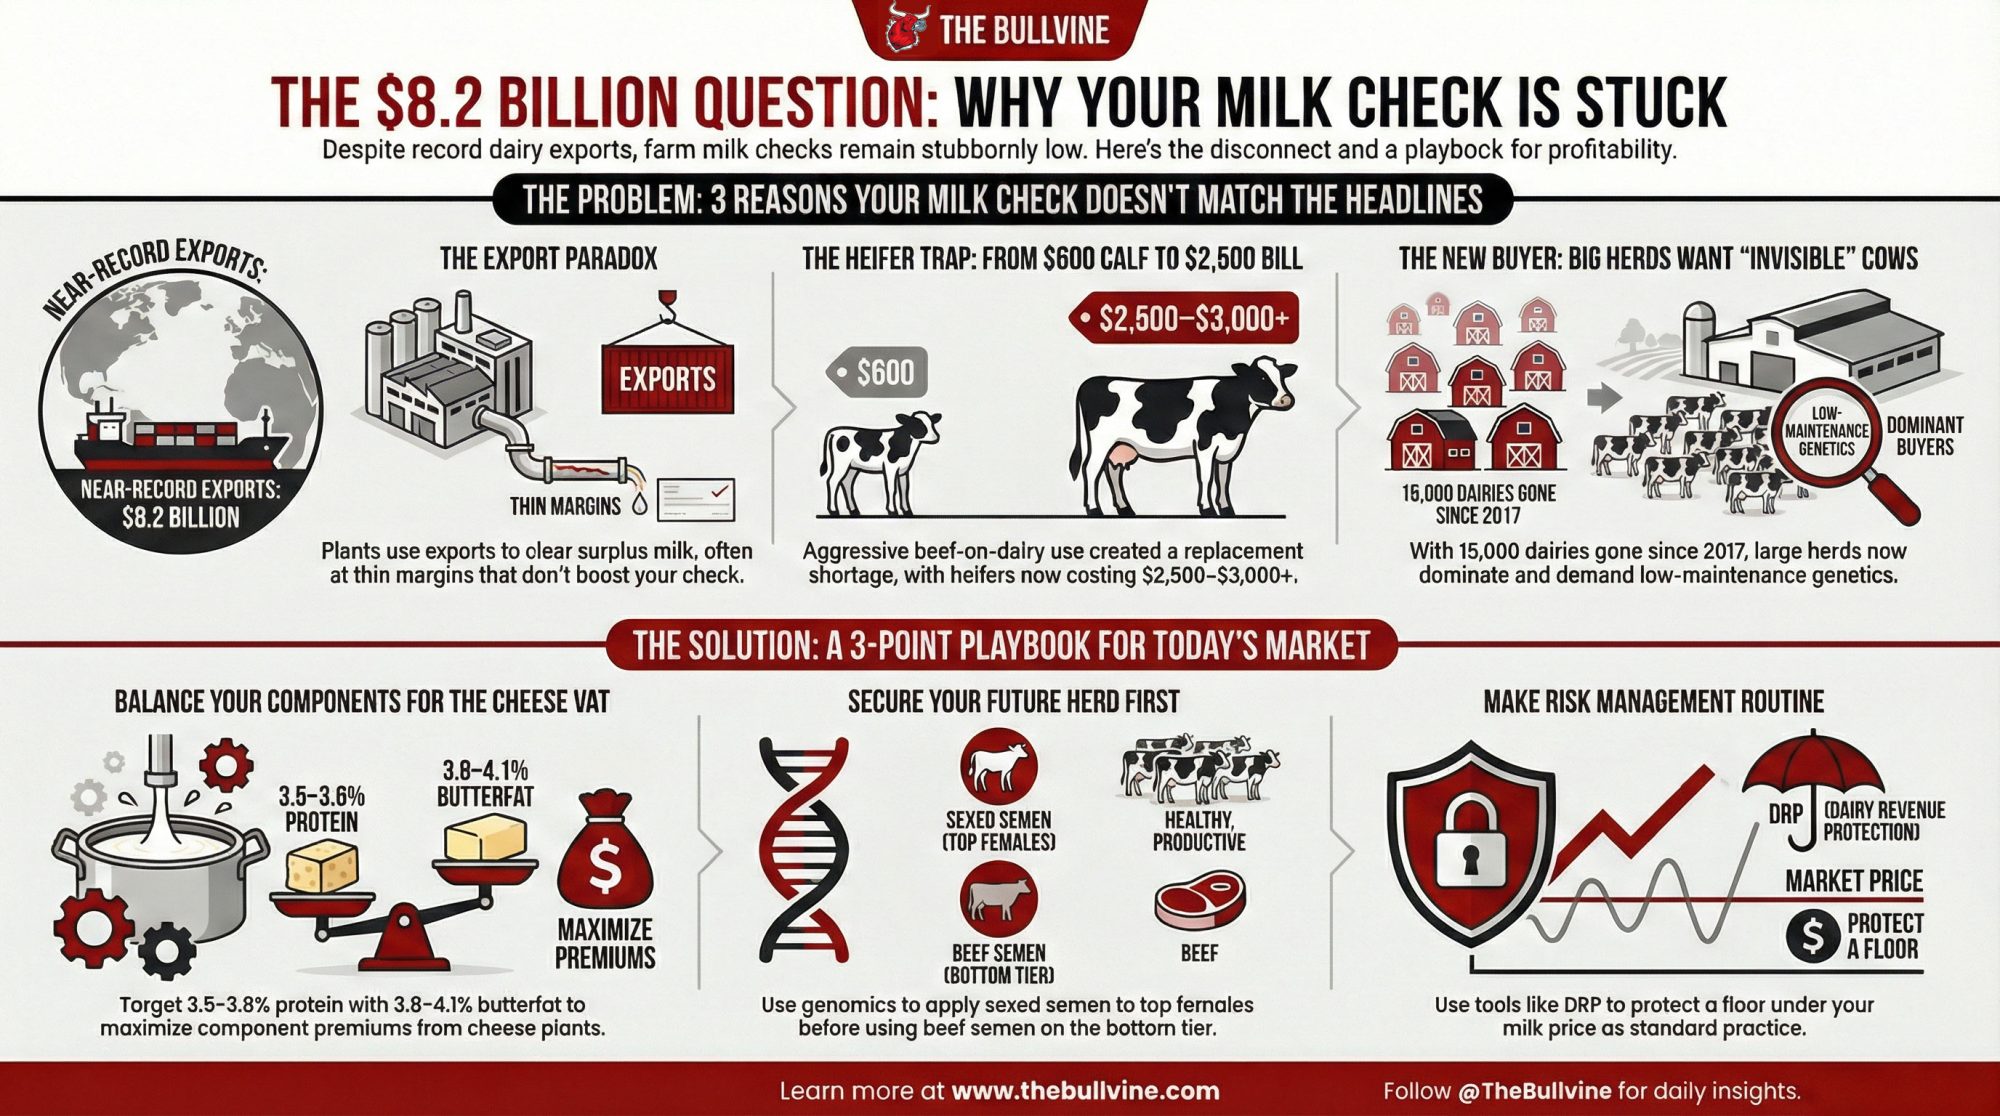
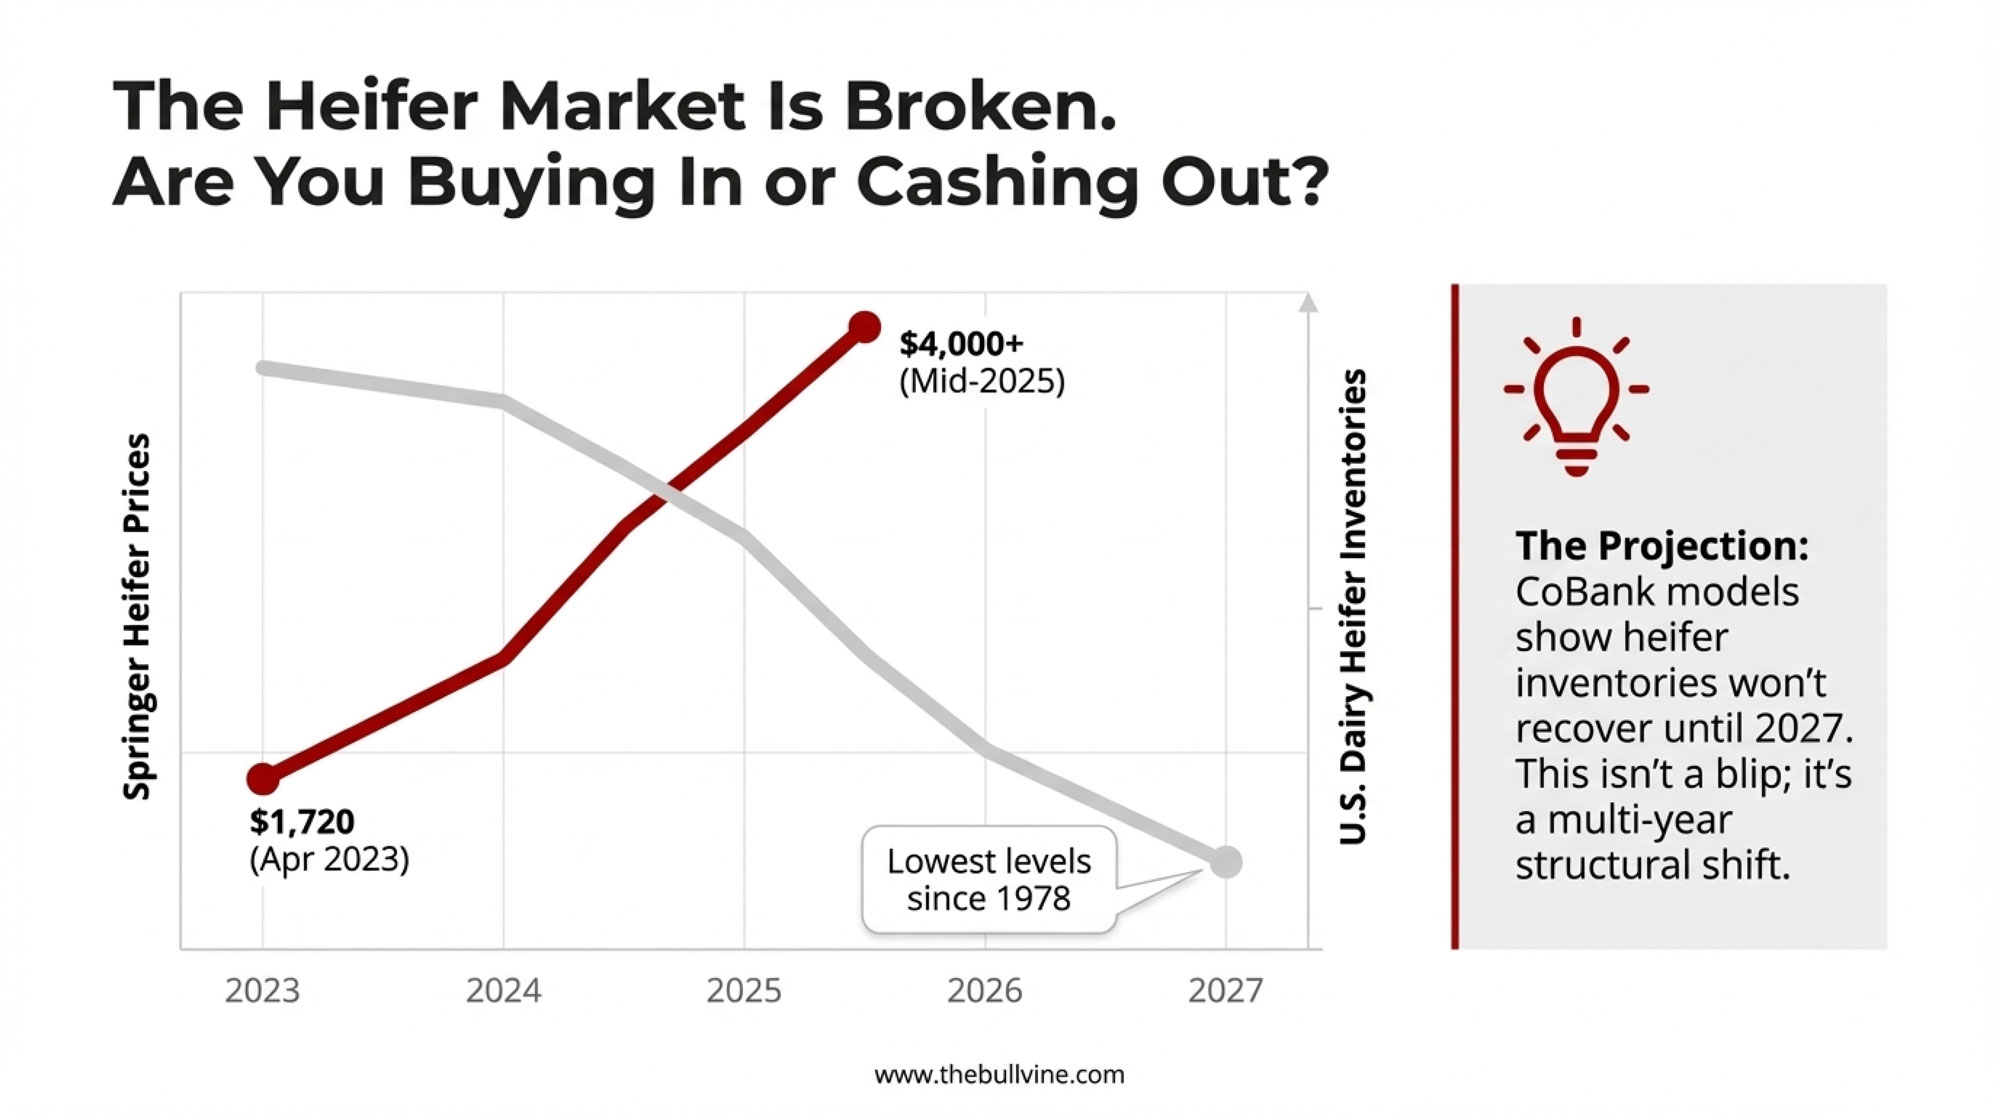
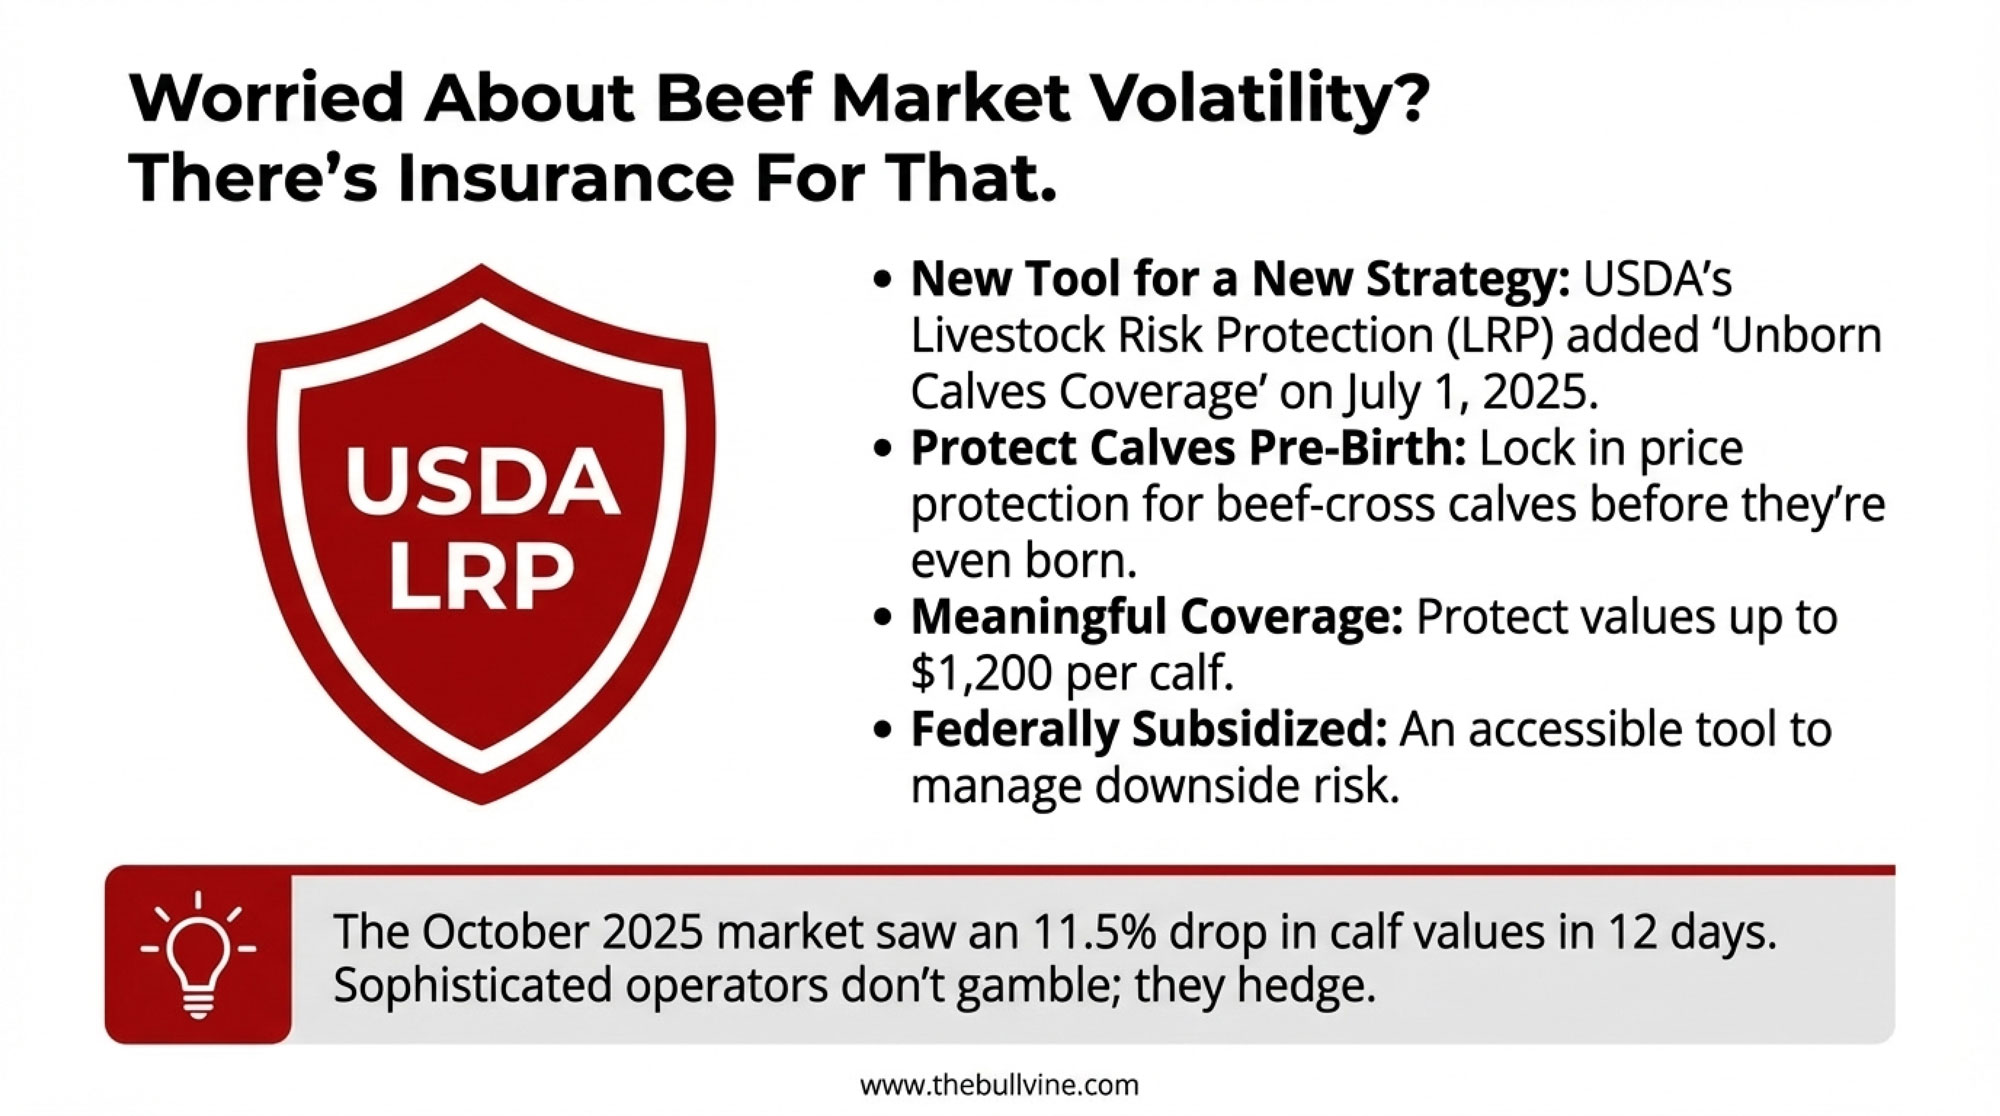
USDA pegged average dairy replacement heifer prices at $3,010 per head in July 2025 — a 164% jump from $1,140 in April 2019. By October 2025, that number climbed to a record $3,110 per head. Heifer inventory has dropped to a 47-year low, sitting at 3.92 million head — 18% below 2018 levels. Premium heifers at auction have been clearing north of $4,000.
A 30×30-inch piece of plywood costs less than a trip through a drive-through. If Creek’s modification prevents even oneheifer calf death per winter, the return is north of $3,000 on materials you could buy with pocket change. Prevent two, and you’re over $6,000 — from scrap plywood.
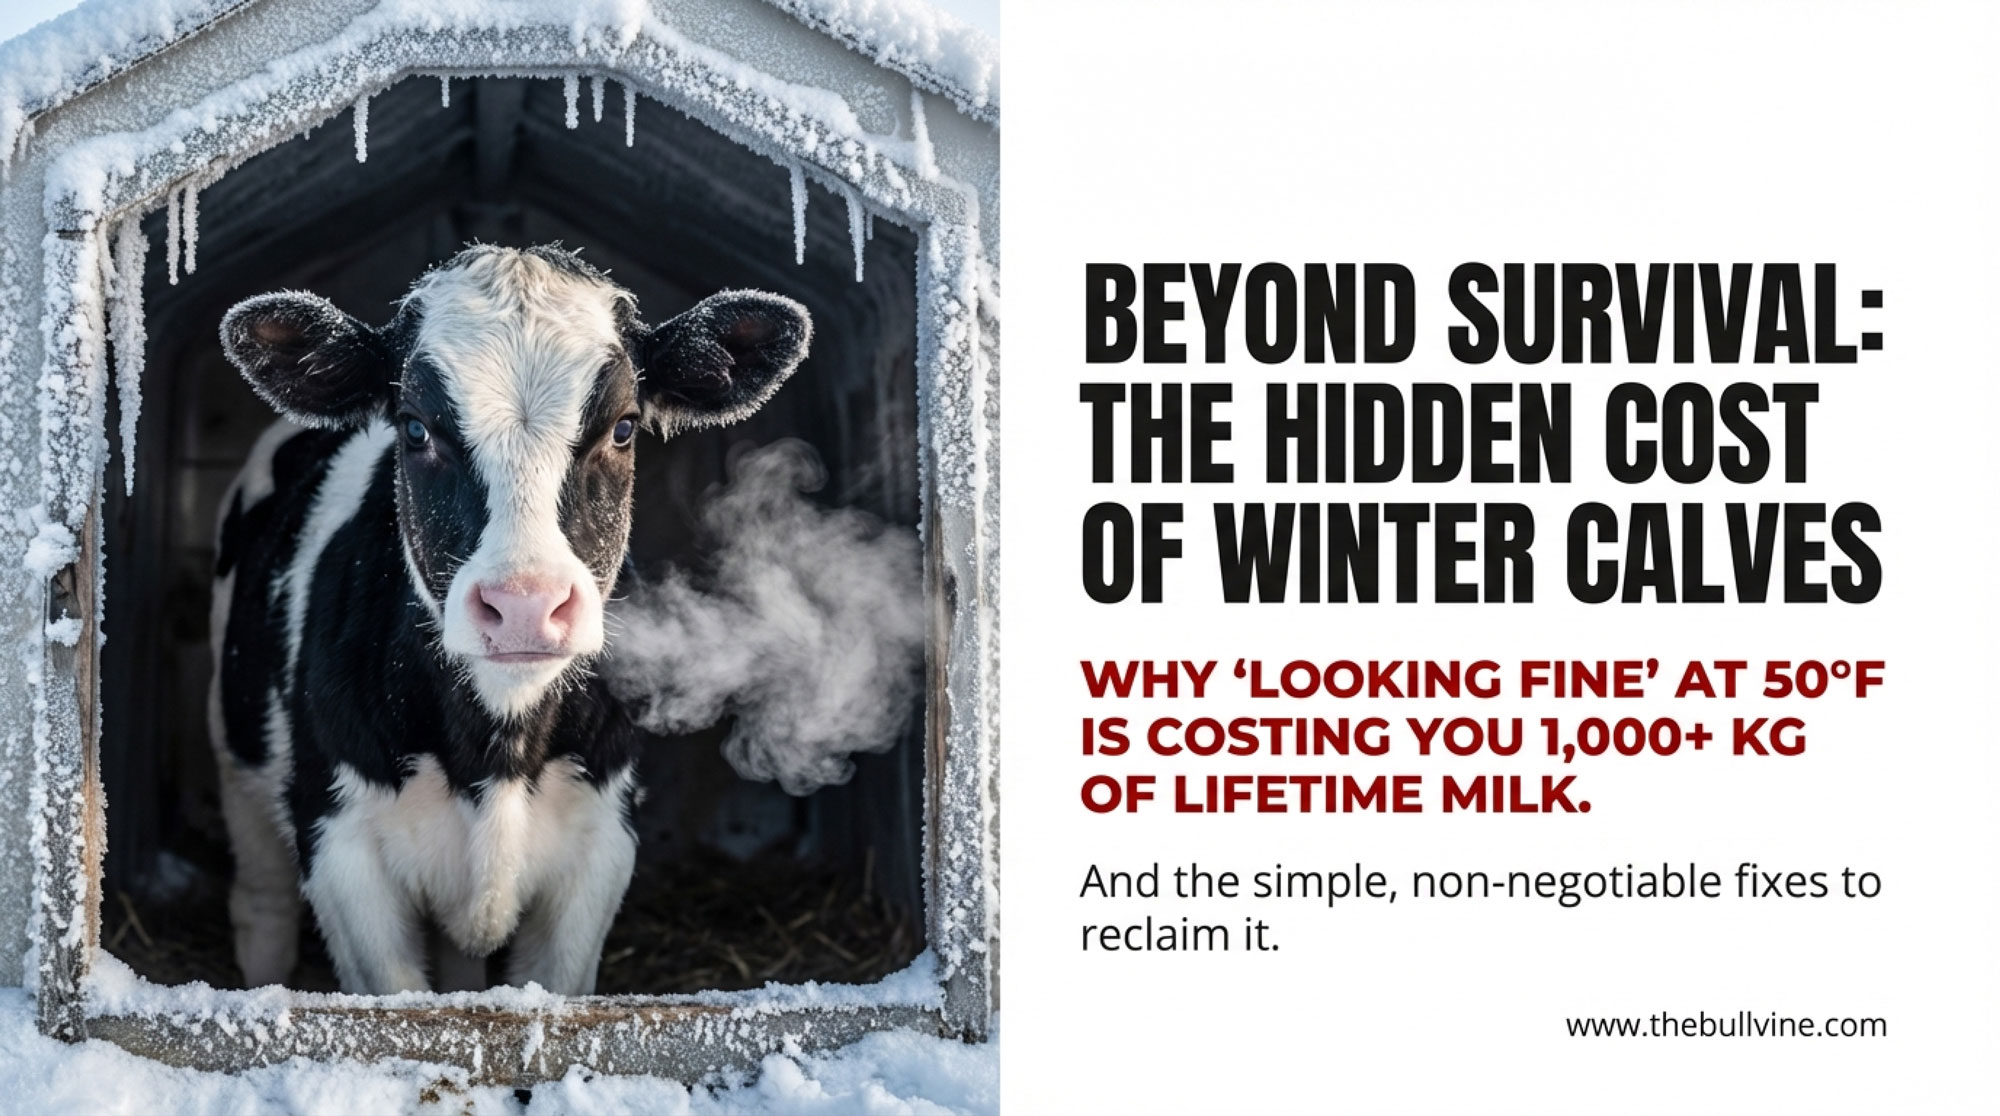
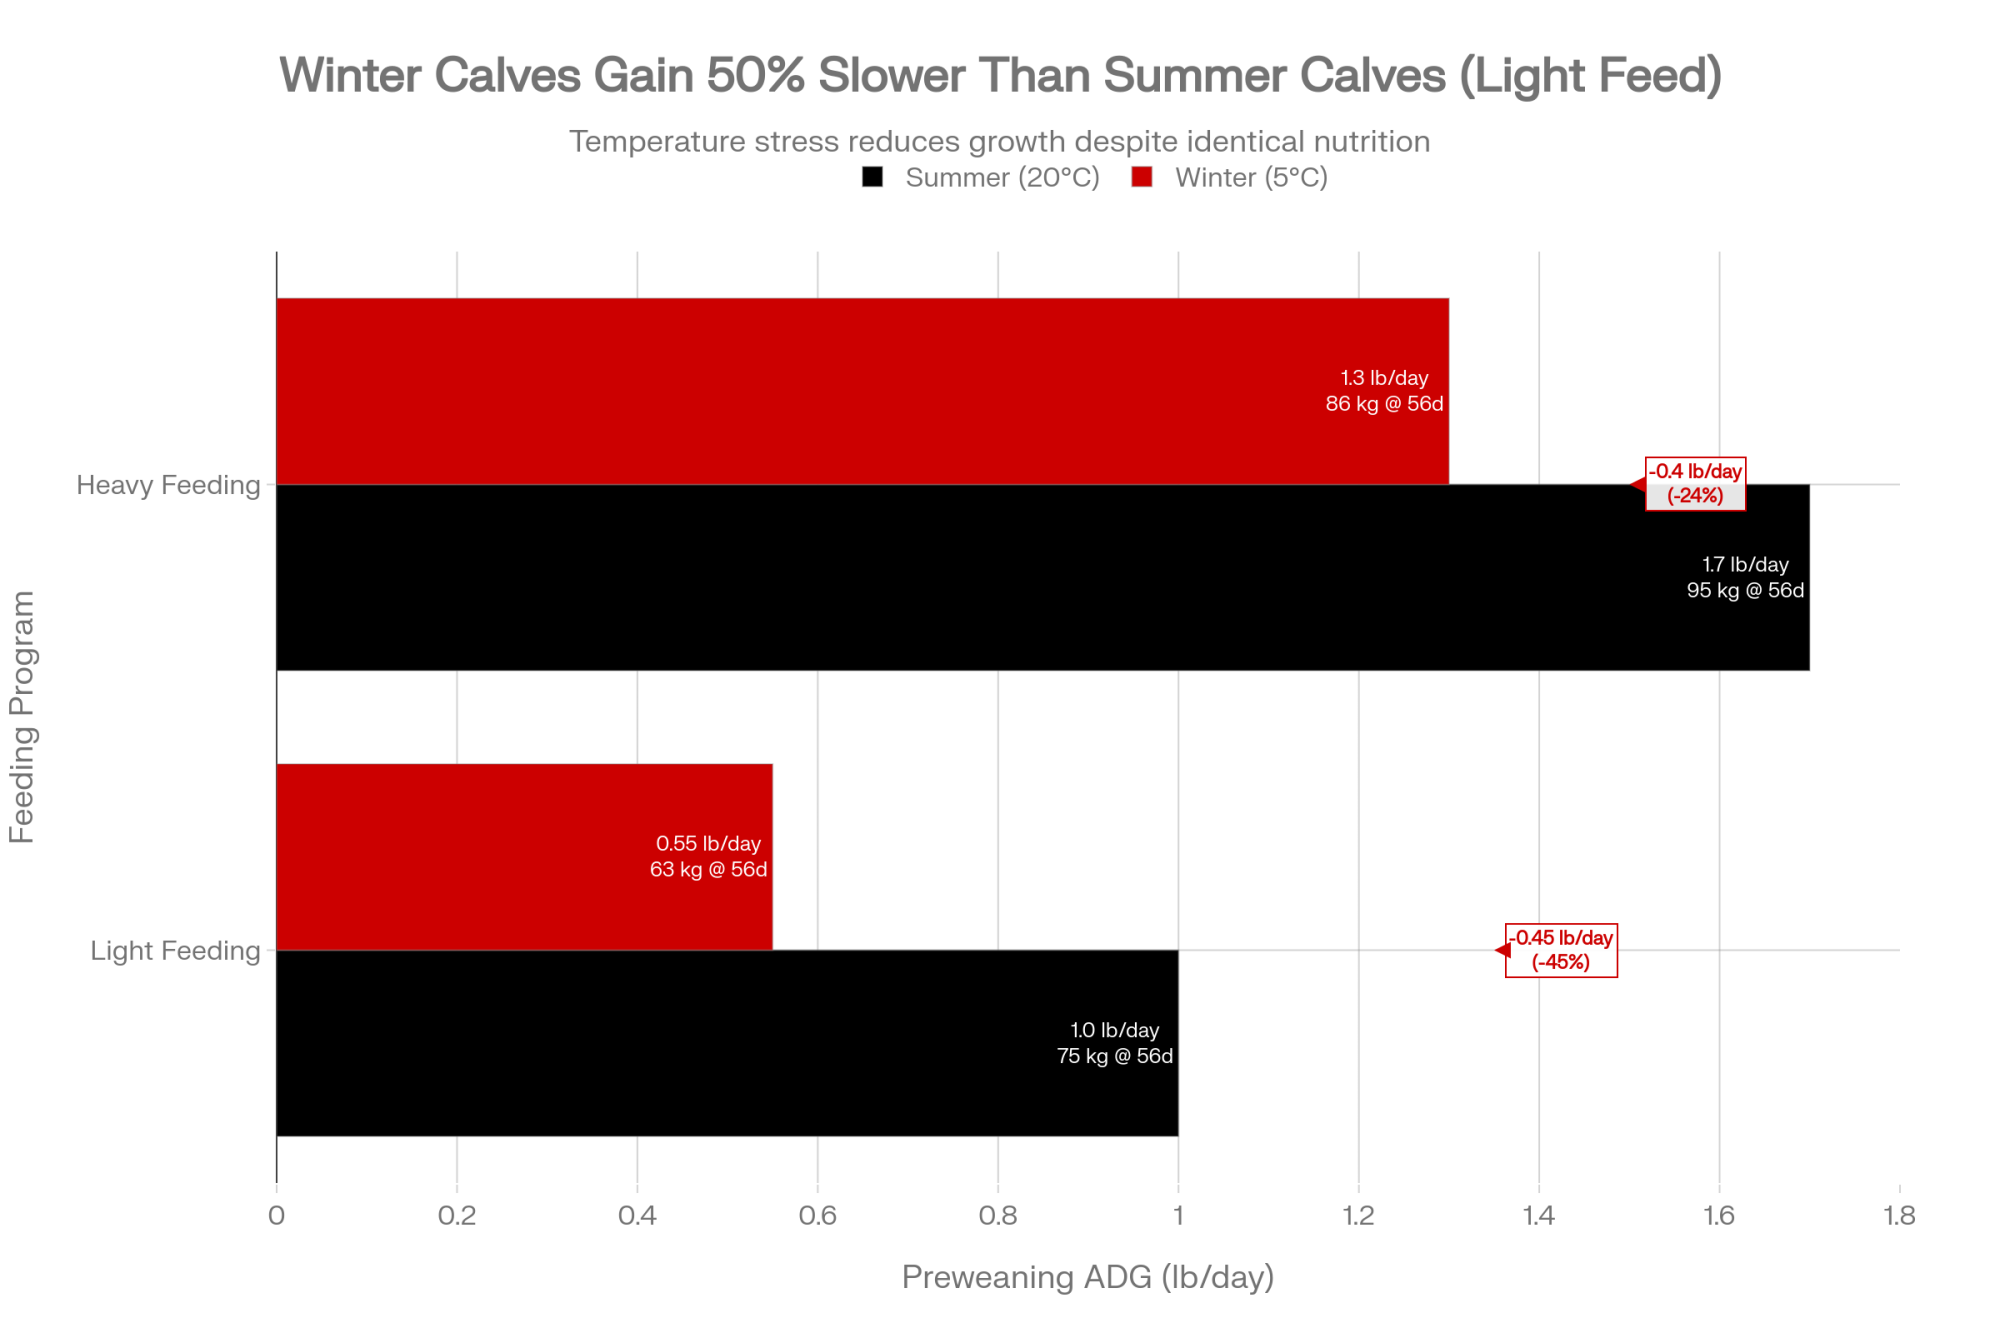
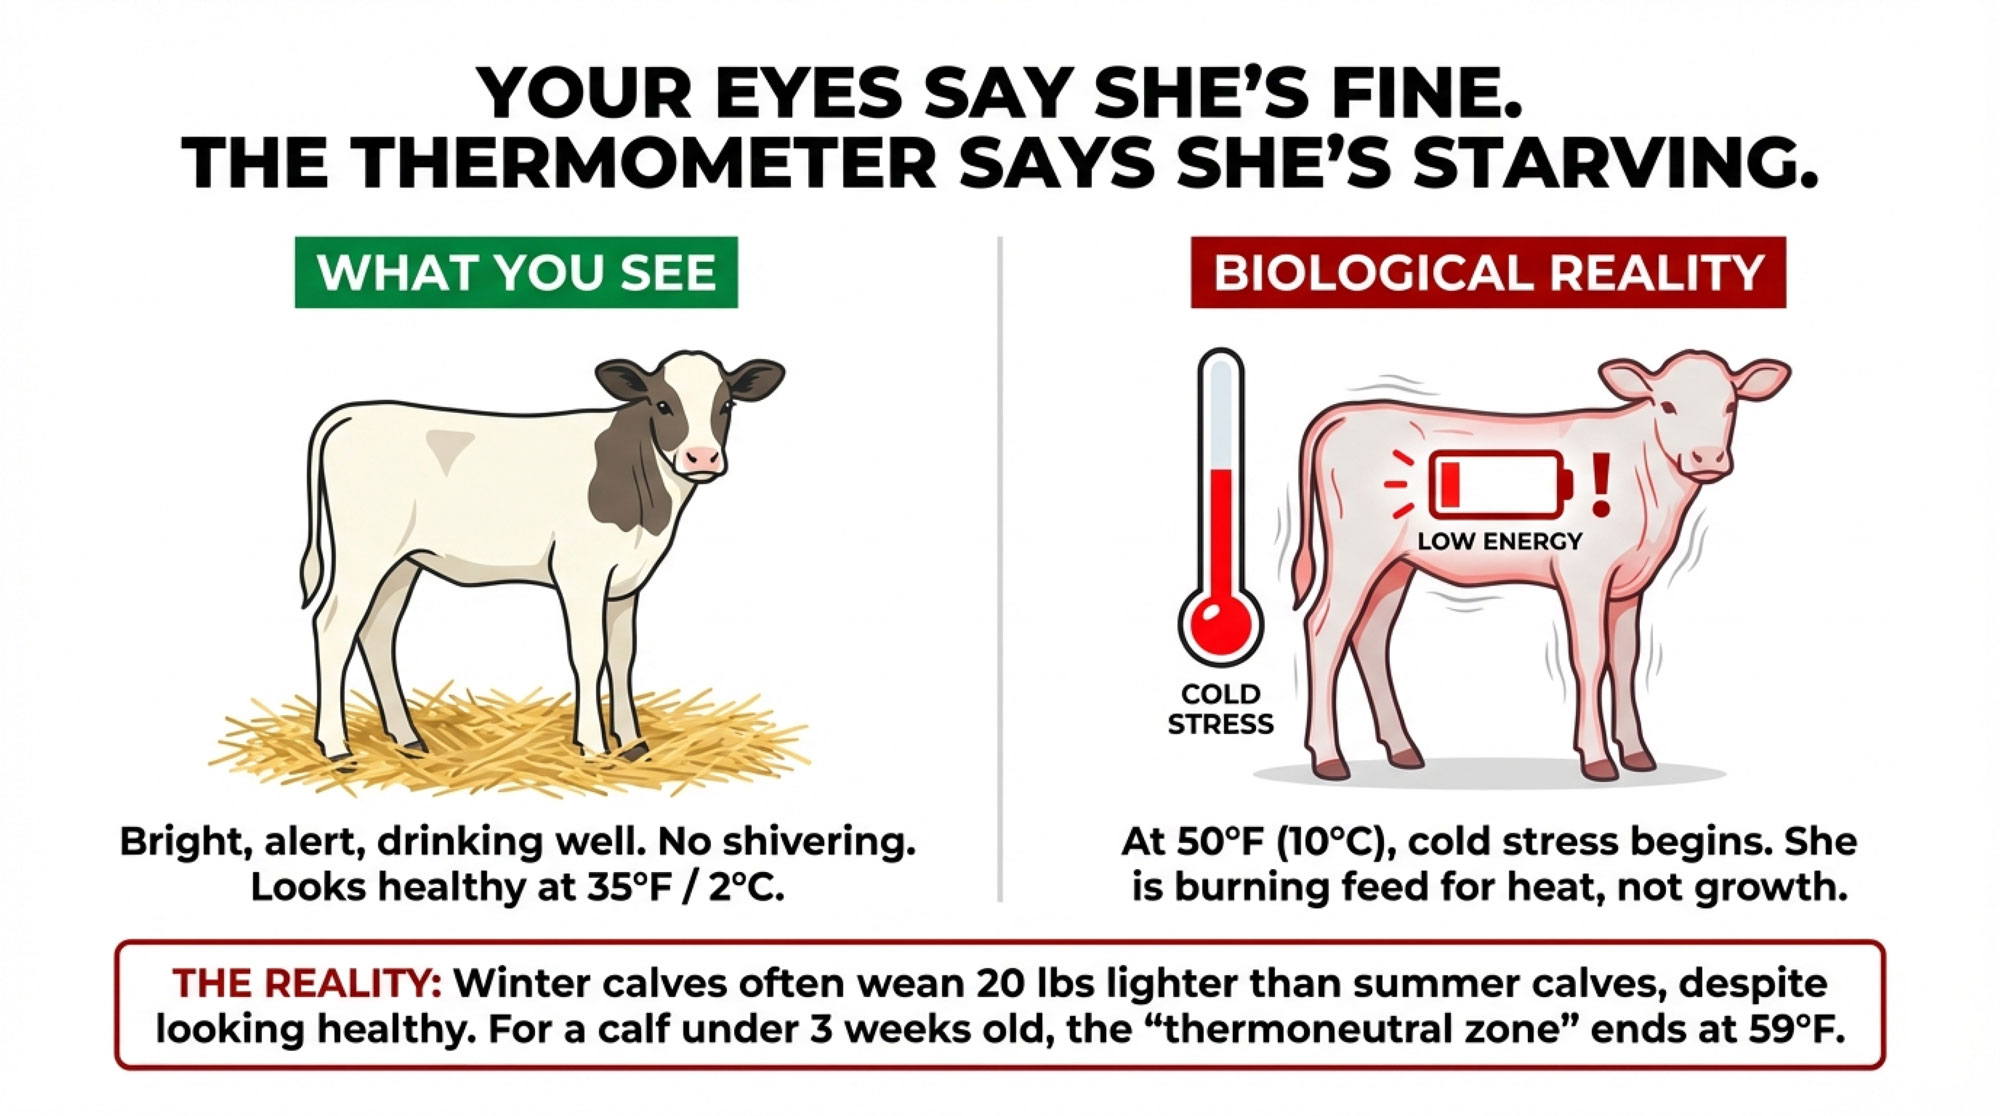
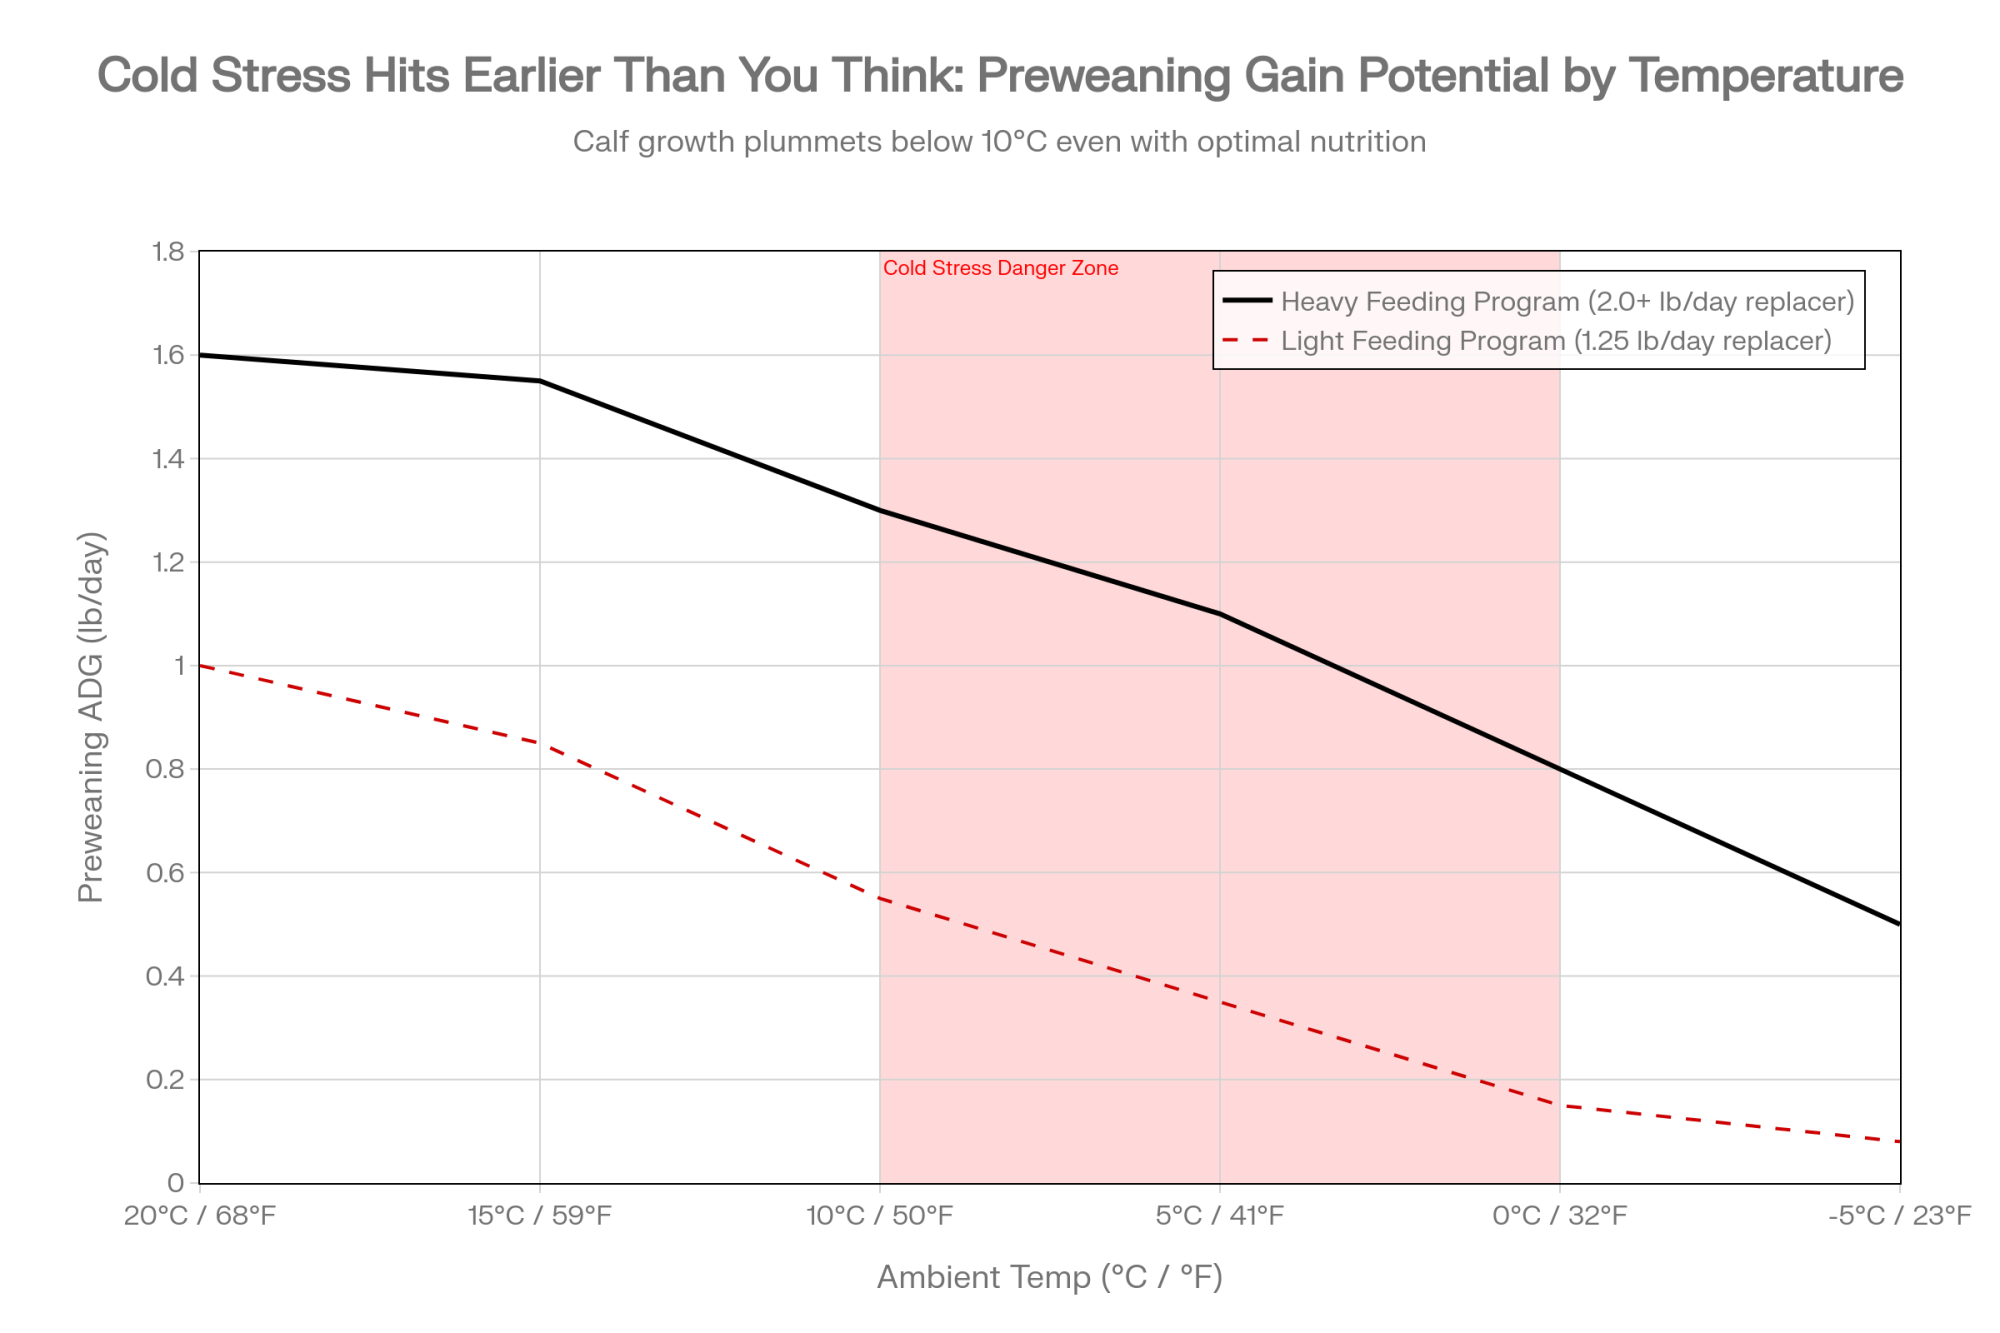
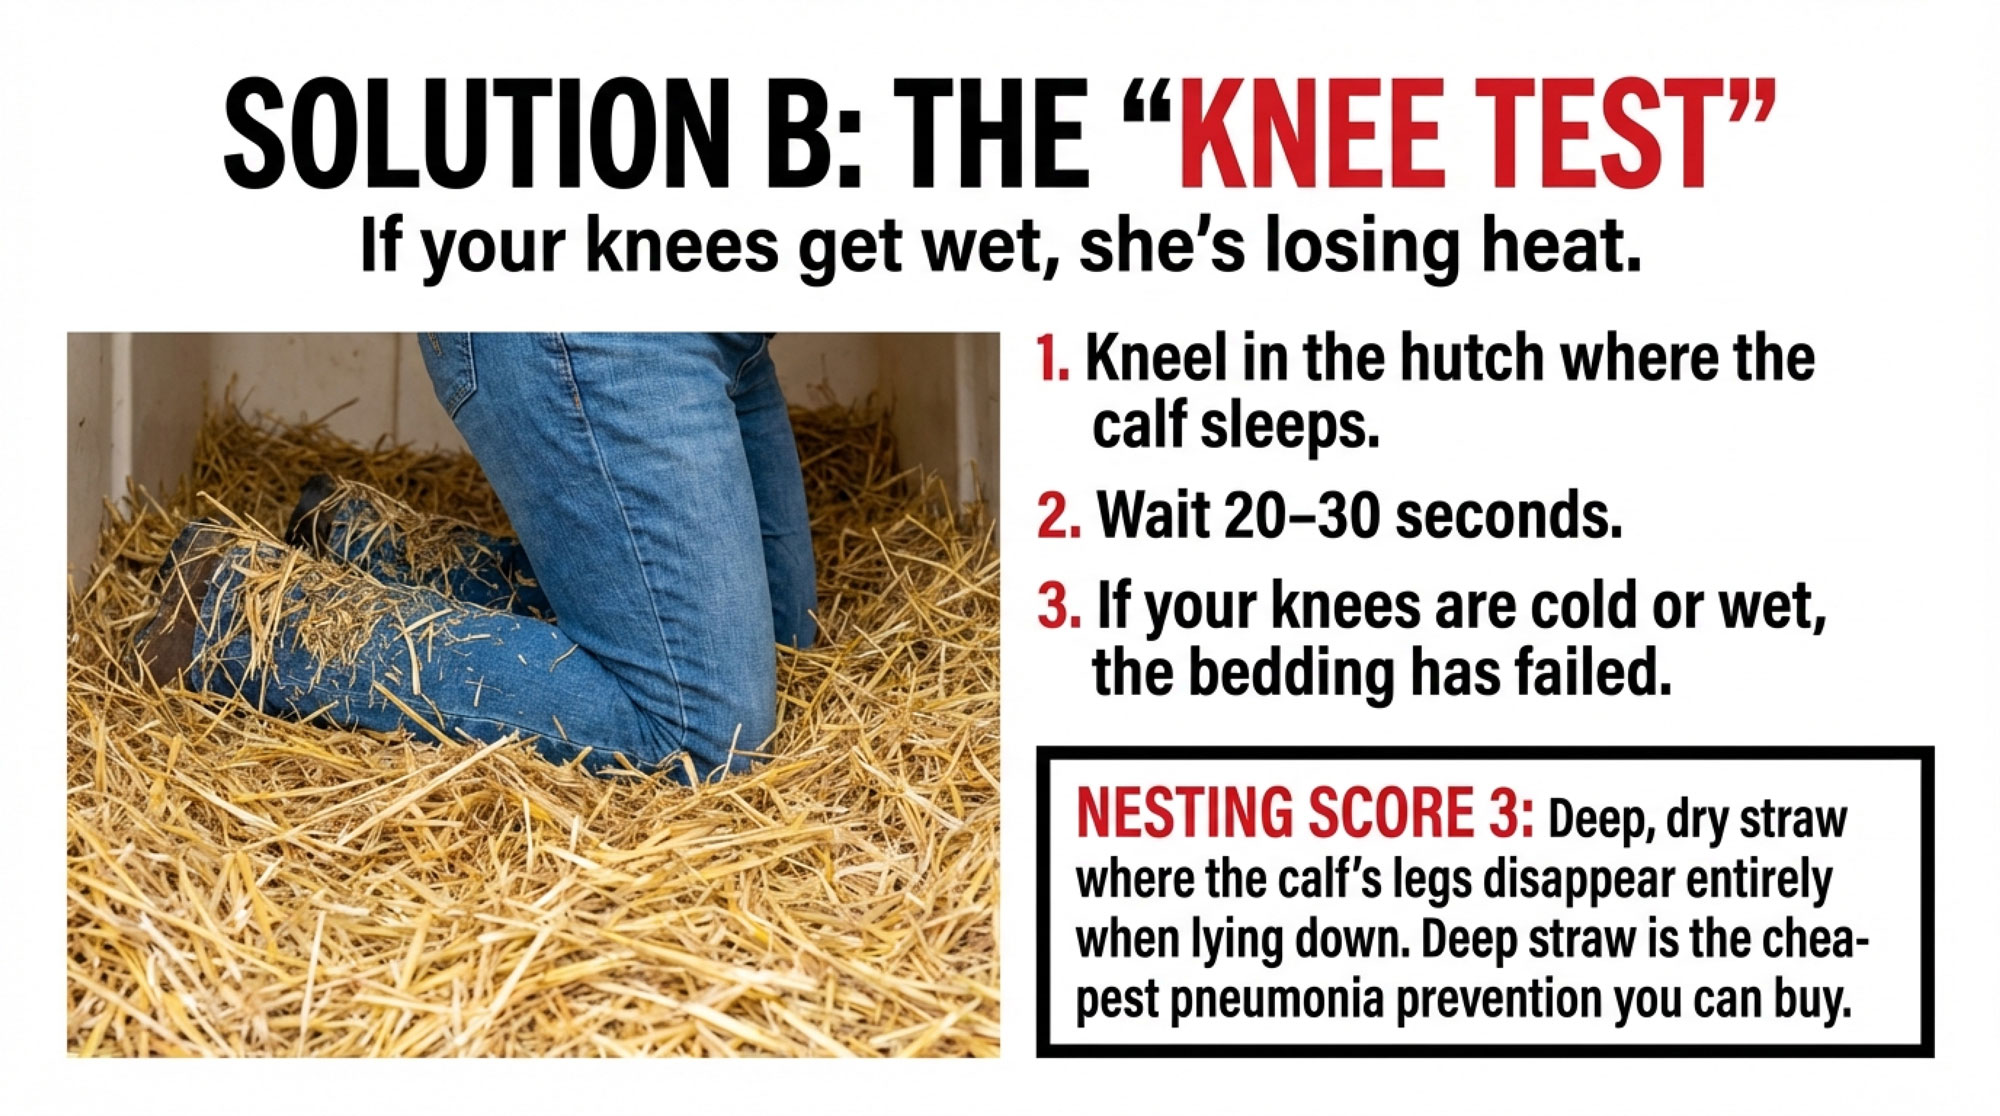
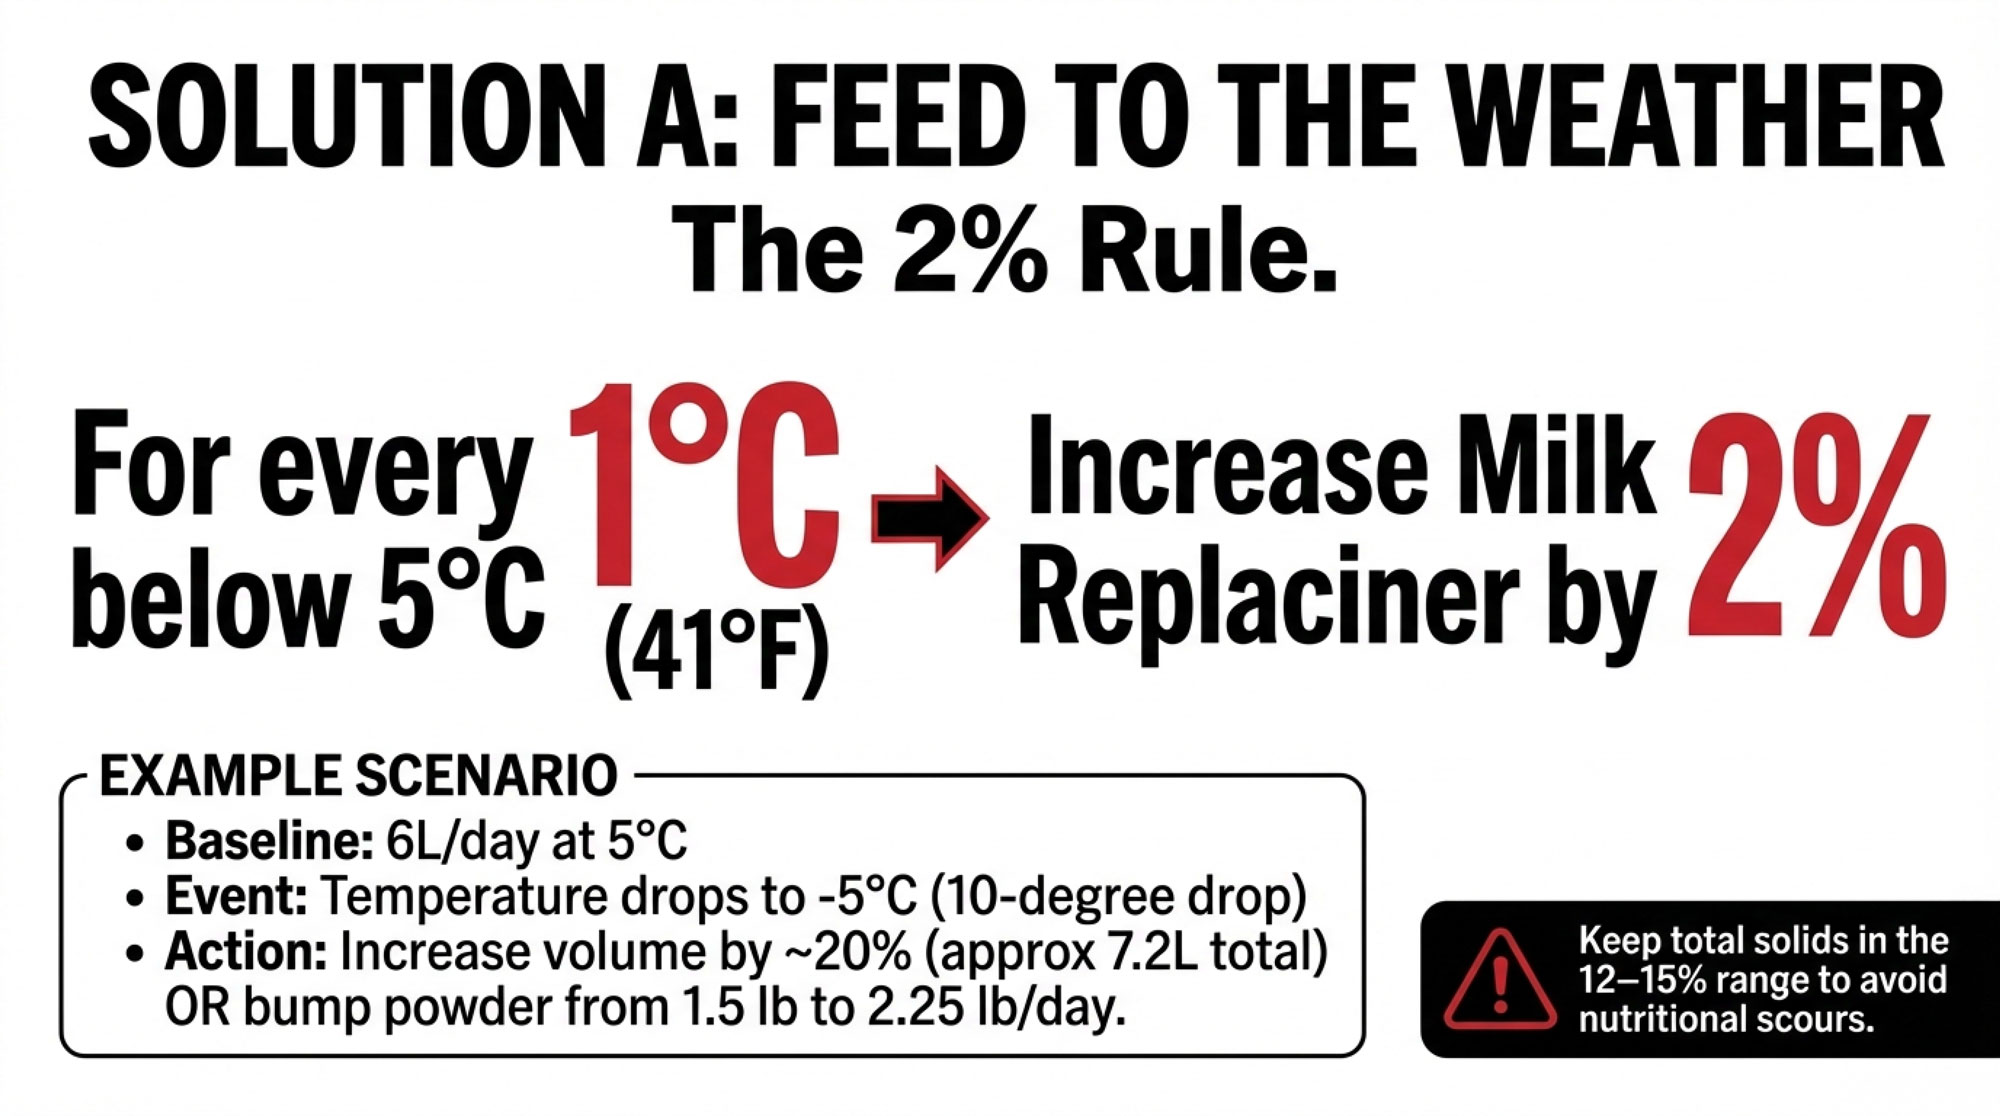
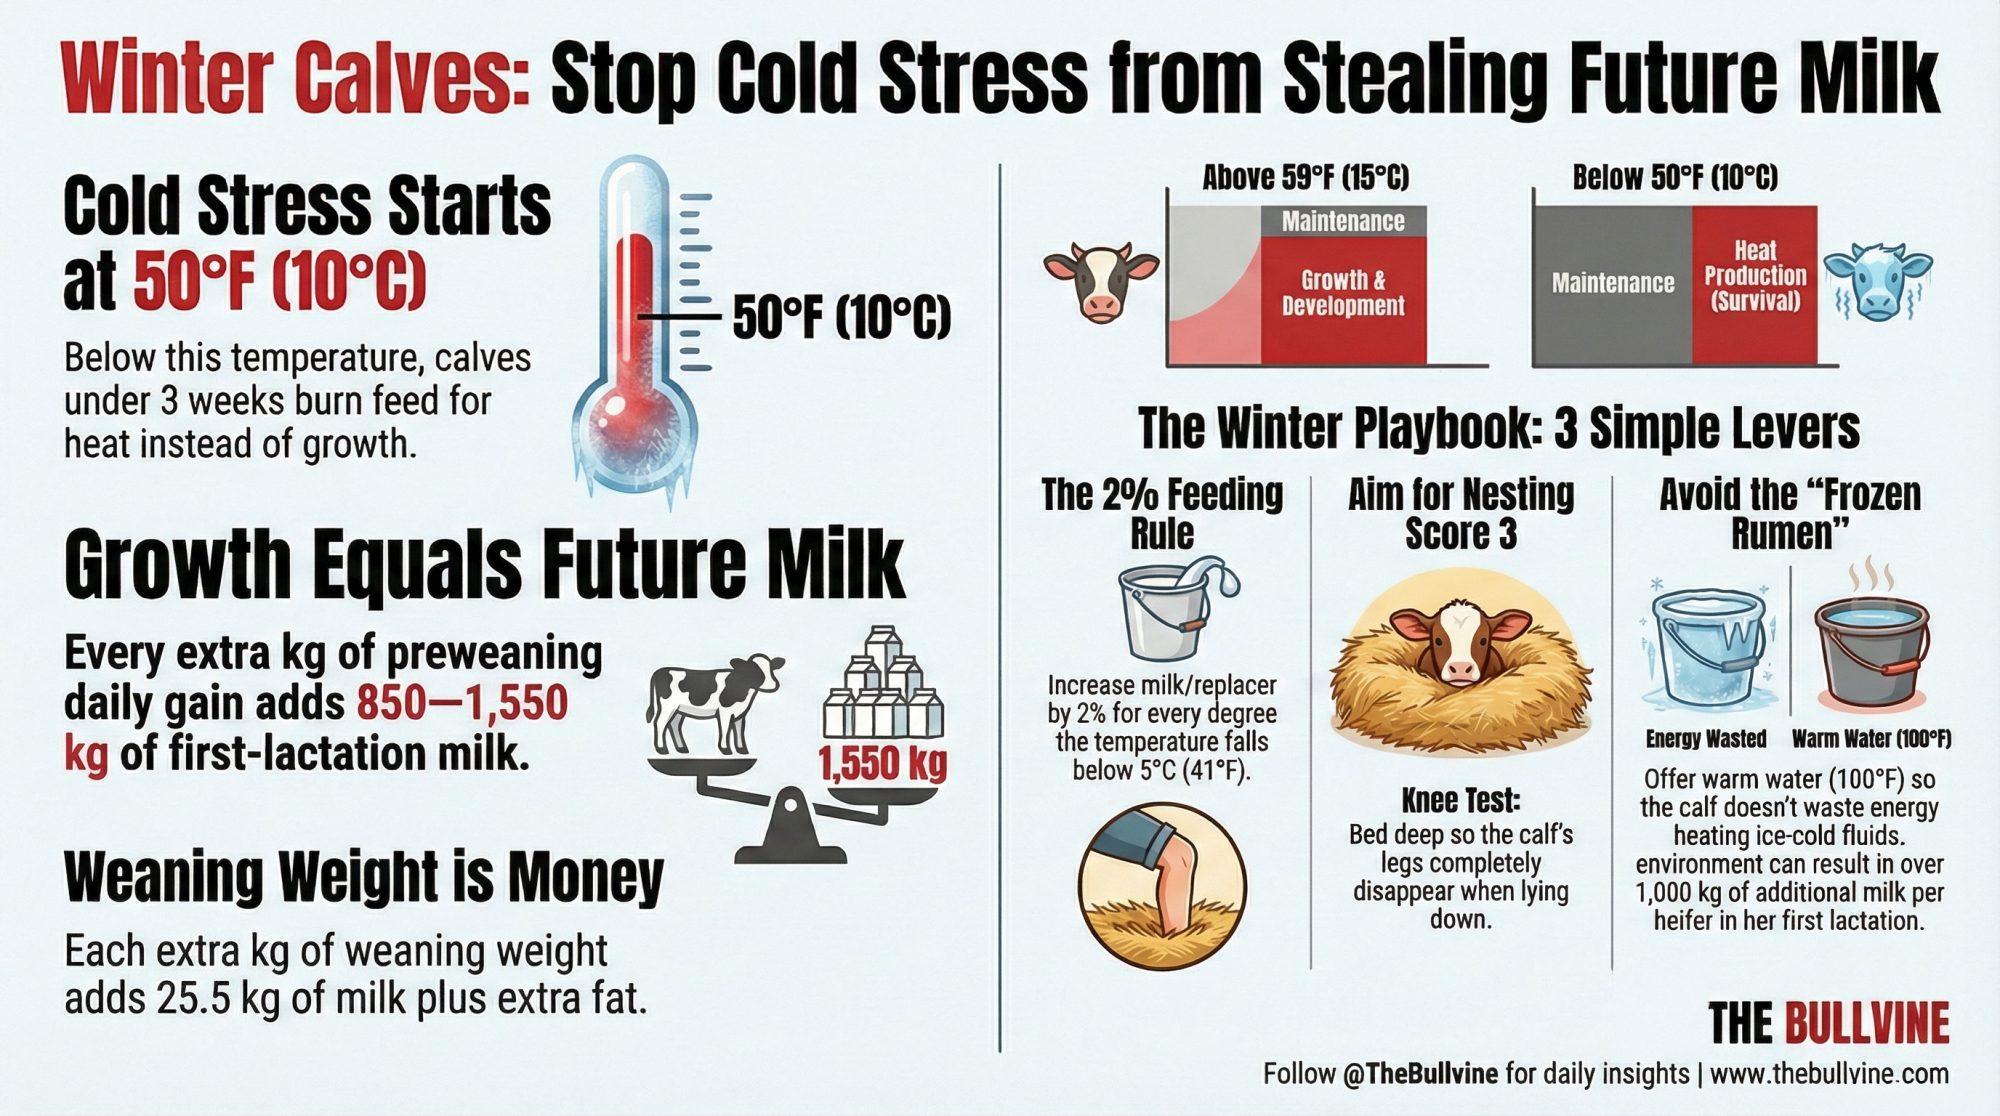
Cold stress starts earlier than most people think, too. Calves have a lower critical temperature near 50°F — meaning they’re already burning feed for heat instead of growth when the barn thermometer reads what feels like a mild autumn night. That’s energy diverted from frame, organs, and early mammary development. Creek’s plywood panel addresses exactly that gap: the first few days when a calf is most vulnerable and least able to thermoregulate on its own.
Creek didn’t engineer a heated, insulated, sensor-equipped hutch modification. They cut a piece of plywood. And they did it from a farm that has produced over 150 cows with lifetime production exceeding 100,000 pounds of milk — including five with over 200,000 pounds. Palmyra Farm has the knowledge, the resources, and the breeding expertise to buy anything in the catalog. That tells you something about what experienced producers actually trust.
For a deeper look at how cold stress costs compound before you see them on a vet bill: → Winter Calves, Hidden Losses: Feed, Bedding, and Cold Stress That Can Cost You 1,000 kg of Milk per Lactation
Bartch’s Defacer Combo: Solving a Human Problem, Not an Equipment Problem
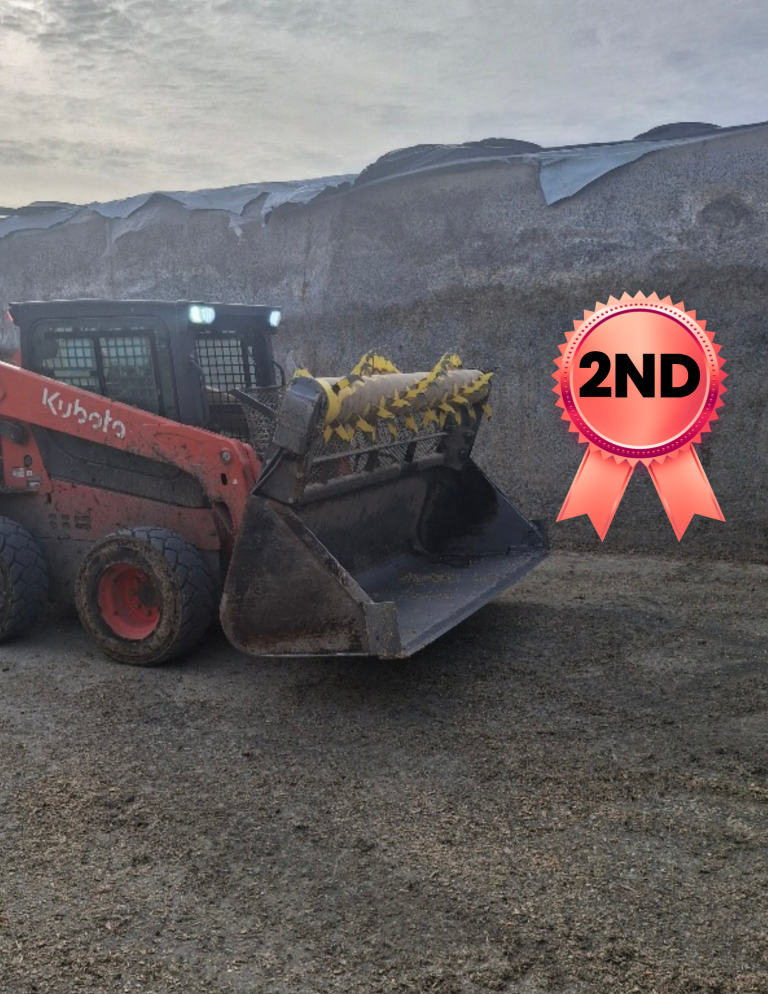
Bartch’s second-place combo at the bunker face: a silage defacer welded on top of a standard bucket, mounted on a Kubota skid steer at Merrimart Farms in Loysville, Pennsylvania. One attachment, no swapping, no excuse to skip defacing — a behavioral fix that UW Extension research suggests could save a 100-cow operation roughly $3,800 a year in feed losses. (Photo: Center for Dairy Excellence / Farmer-Made Ingenuity Contest)
Donny Bartch’s second-place innovation at Merrimart Farms in Loysville, Pennsylvania, is a different kind of fix. Where Creek solved a calf welfare problem, Bartch solved a behavior problem — his own.
“We combined two pieces of equipment into one,” Bartch explained. “We took a silage bucket and mounted a silage defacer on top of it. We wanted to maintain the quality of the silage face with the defacer without having to hook and unhook hydraulic hoses and buckets all the time.”
You know the routine if you feed from a bunker silo. Pull silage out, then deface the exposed surface afterward — scrape it smooth and tight to minimize oxygen penetration, heat buildup, and spoilage. Research from Penn State Cooperative Extension’s Dr. Ken Griswold found that the top third of a bunker silo — where density is lowest and air penetration greatest — loses 11.7% of dry matter, compared to just 5.6% in the lower third. Dr. Brian Holmes at UW Extension recommends silage density above 15 pounds of dry matter per cubic foot to minimize that shrinkage.
But when defacing means unhooking one attachment, hooking up another, and spending extra time in weather you’d rather not be standing in — people skip it. Bartch built the excuse out of the equation.
“No more bucking into face with a bucket for 500 more pounds or having 500 extra pounds lying on the concrete until the next feeding,” Bartch said. “No matter if it’s raining, snowing, or even extremely hot, you can stay in the cab to deface and load all the silage needed.”
He didn’t build a better defacer. He eliminated the reason he wasn’t using the one he had.
The Napkin Math on Skipping the Deface
UW Extension research, reported in Progressive Dairy, put real dollars on silage face management: on a 500-cow dairy feeding 75 lbs of silage per cow per day, reducing dry matter losses by 3–4 percentage points through better face management saved more than 250 tons of silage — over $19,000 per year.
Scale that down. On a 100-cow operation, the proportional math works out to roughly 50 tons and $3,800 per year in feed that’s rotting on your bunk face instead of going through a cow.
Creek’s plywood saves $3,000 in one catastrophic moment — a dead calf. Bartch’s combo saves $3,800 in invisible daily losses you never see on a single bill. Different math, same lesson: the fix that costs almost nothing beats the problem you’ve learned to ignore.
For the full economics of what bunker mismanagement costs across a year: → Is Your Feed Storage Destroying Your Dairy Profits?
Spadaro’s Bale Opener: A Tool That Outlasted the Herd
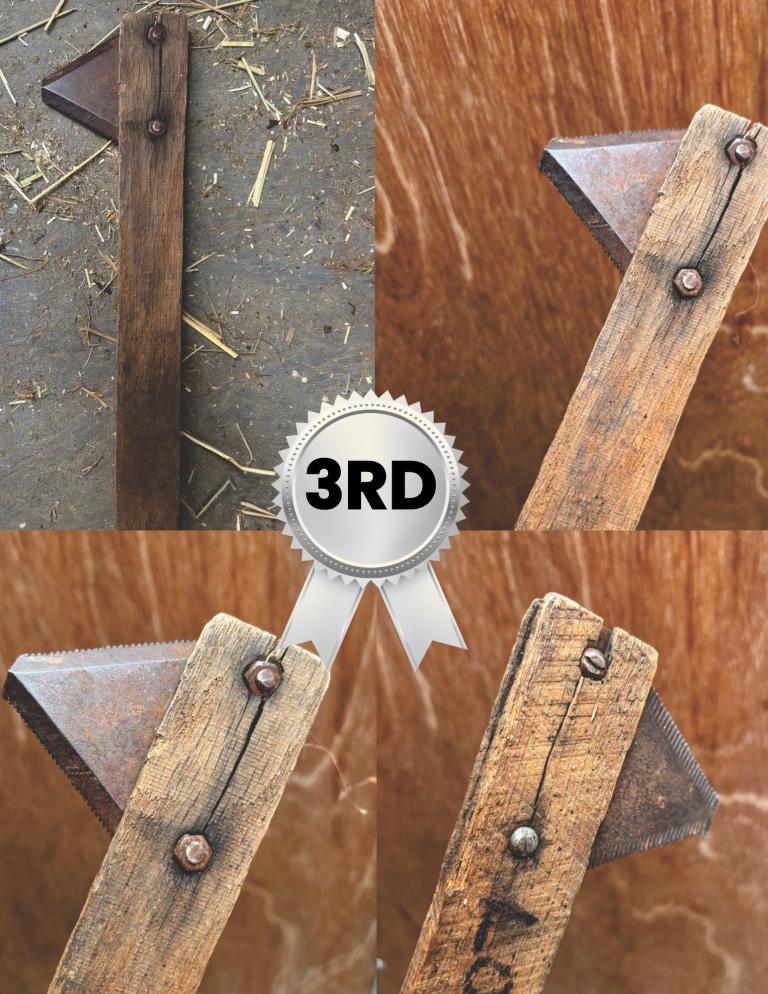
Spadaro’s third-place bale opener up close: an old haybine section screwed to a wooden handle — two screws, no moving parts. Her dad built the first one so she could open bales at the fair without carrying a knife. Her kids used the same tool through their 4-H careers. The cattle were auctioned in 2023. The tool’s still in the showbox. (Photo: Center for Dairy Excellence / Farmer-Made Ingenuity Contest)
Susan Spadaro’s third-place entry from Love Haven Farm in Scottdale, Pennsylvania, is the quietest of the three winners. It’s also the one that sticks with you.
Love Haven Farm has been in the Miller-Love family since 1902 — five generations in East Huntingdon Township, Westmoreland County, as profiled by TribLive when the family held its dispersal auction in 2023. Susan’s father named it Love Haven after marrying Sharon in 1971. The family raised and showed Brown Swiss and Ayrshire cattle for decades. Susan’s children, Grace and Anthony, carried on the tradition at the All-American Dairy Show.
In 2023, the family auctioned 100 Brown Swiss and 25 Ayrshires. But the tool Susan submitted to the contest is still in use.
“I created a simple bale opener that makes cutting baler twine quick and easy,” Spadaro said. “The tool is made from a small wooden handle with an old haybine section screwed to it. This design allows you to strike the baler twine, and the sharp edge slices it cleanly without needing a knife.”
Simple enough. What makes this one land differently is why she built it.
“It eliminated the need for young kids to carry knives, making the process safer and easier,” she said. “When I was showing cattle, it gave me independence. Later, my children used the same tool throughout their 4-H careers, and it became a go-to item for other kids as well.”
The safety angle is bigger than it might seem at first glance. According to the NCCRAHS 2022 Childhood Agricultural Injuries Fact Sheet — the most recent available — each day, at least 33 children are seriously injured in U.S. agricultural incidents. About every three days, a child dies. Between 2001 and 2015, 48% of all fatal occupational injuries to young workers occurred in agriculture — youth worker fatalities in agriculture exceed all other industries combined. A tool that lets a 10-year-old open bales without carrying a knife around livestock isn’t just a convenience. It’s a safety decision.
And then there’s this, from Spadaro: “It has become more than just a practical fix — it’s a piece of family history that connects generations through hard work, creativity, and tradition.”
A wooden handle. An old haybine section is headed for the scrap pile. The cattle are gone now, auctioned in 2023. But the tool Susan submitted to the contest outlasted the herd — built from scrap, used by her children, and passed to other kids along the way. That’s a farm that’s been in the family since Teddy Roosevelt was president.
If you’ve raised kids on a dairy farm, you know exactly why that resonates. For more on what farm kids learn before they’re old enough to appreciate it: → When 5:30 AM Chores Matter More Than the NHL Draft: The Martin Family’s Extraordinary Lesson in Raising Dairy Kids
When Should You Build Instead of Buy?
The three winning innovations share a trait worth noticing. None required specialized skills or expensive materials. Plywood. A welder and existing equipment. A wooden handle and a discarded haybine section. The shop inventory was the R&D budget.
Creek’s hutch mod works whether you’re running 40 head or 400 — the physics of wind exposure and calf thermoregulation don’t change with herd size. But “farmer-built” isn’t always the right answer. Commercial solutions exist because they solve real problems at scale, consistently, and sometimes with safety or regulatory considerations that a shop project can’t match.
The question isn’t whether homemade is always better. It’s whether the problem you’re solving actually requires a commercial-grade solution — or just a trip to the shop with whatever’s on hand.
How to Decide
If the problem is simple and the materials are already there, build it. Creek’s plywood panel is the poster child. Wind exposure on newborn calves didn’t need electronics, sensors, or precision engineering. It needed to block a hole. Same-day build with scrap lumber. Your 30-day action: walk your barn this Saturday and identify one simple physical problem you’ve been living with instead of fixing. If the materials are already in your shop, block out two hours and build the fix.
Bartch’s innovation targets a different kind of problem — behavioral friction. He didn’t need a better defacer. He needed to stop having a reason to skip the step. Walk through your own feeding routine this week: where are you skipping something because the setup takes too long or requires an extra attachment swap? That friction point is your build project.
Spadaro’s innovation matters for a different reason entirely — safety. A dedicated tool beats a workaround whenever kids or new workers are involved. Her bale opener prevented a knife from falling into the hands of children working around livestock. That math doesn’t need calculating.
Where commercial earns its price: precision, compliance, and data logging, don’t homebrew your milk quality testing or your bulk tank monitoring. The cost of getting those wrong exceeds the cost of buying right. For a sharp look at when commercial equipment earns its price tag — and when it doesn’t: → The Robot Metric Dealers Don’t Emphasize — And Why It Predicts Your Payback
And for a reality check on how the “do-it-yourself” math works in a different context — building your own on-farm creamery versus shipping bulk: → The 143-Hour Week at Clark Farms: The Real Math of On-Farm Creamery ROI and Your Time
Key Takeaways
- If your calf hutches are open-faced in winter and you’re losing calves to cold stress, Creek’s 30×30-inch plywood panel is a same-day build. With dairy replacement heifers hitting a record $3,110 per head in October 2025, even one calf saved per winter pays for the modification thousands of times over.
- If you’re feeding from a bunker and your silage face management is inconsistent, audit your routine for the attachment-swap step you keep skipping. UW Extension research found that on a 500-cow dairy, reducing DM losses by 3–4 percentage points through better face management saved over $19,000 per year. On 100 cows, that’s roughly $3,800 in feed rotting rather than being produced.
- If young workers or family members handle bales with knives around livestock, build a dedicated tool this weekend. Youth ag fatalities exceed all other industries combined. A bale opener made from shop scrap is a safety upgrade you can finish Saturday morning.
- Before you open the equipment catalog, check your shop. All three winning innovations used materials already on the farm. The Bartch test: ask yourself what you’re skipping because the setup is too annoying. That’s your build project.
The Bottom Line
The Center for Dairy Excellence reopens the Farmer-Made Ingenuity Contest for new submissions in November 2026. Dairy producers and employees in Pennsylvania, Maryland, Delaware, New Jersey, and West Virginia are eligible. Questions? Contact Emily Barge at CDE: ebarge@centerfordairyexcellence.org or 717-346-0849.
Learn More
- 155 Pounds More Milk Per Heifer: The Calf Feeding Discovery That’s Changing Everything – Capture an 18% weight gain boost with this tactical deep-dive that arms you with the management protocols needed to hit growth targets. It reveals how shifting to three-times-daily feeding delivers 155 pounds more milk per heifer.
- 438,000 Missing Heifers. $4,100 Price Tags. Beef-on-Dairy’s Reckoning Has Arrived. – Navigate the structural heifer deficit with this analysis that exposes the economic shifts currently reshaping the industry. It delivers a 2026-2027 survival playbook, helping you recalibrate breeding mixes to protect equity against record-high replacement costs.
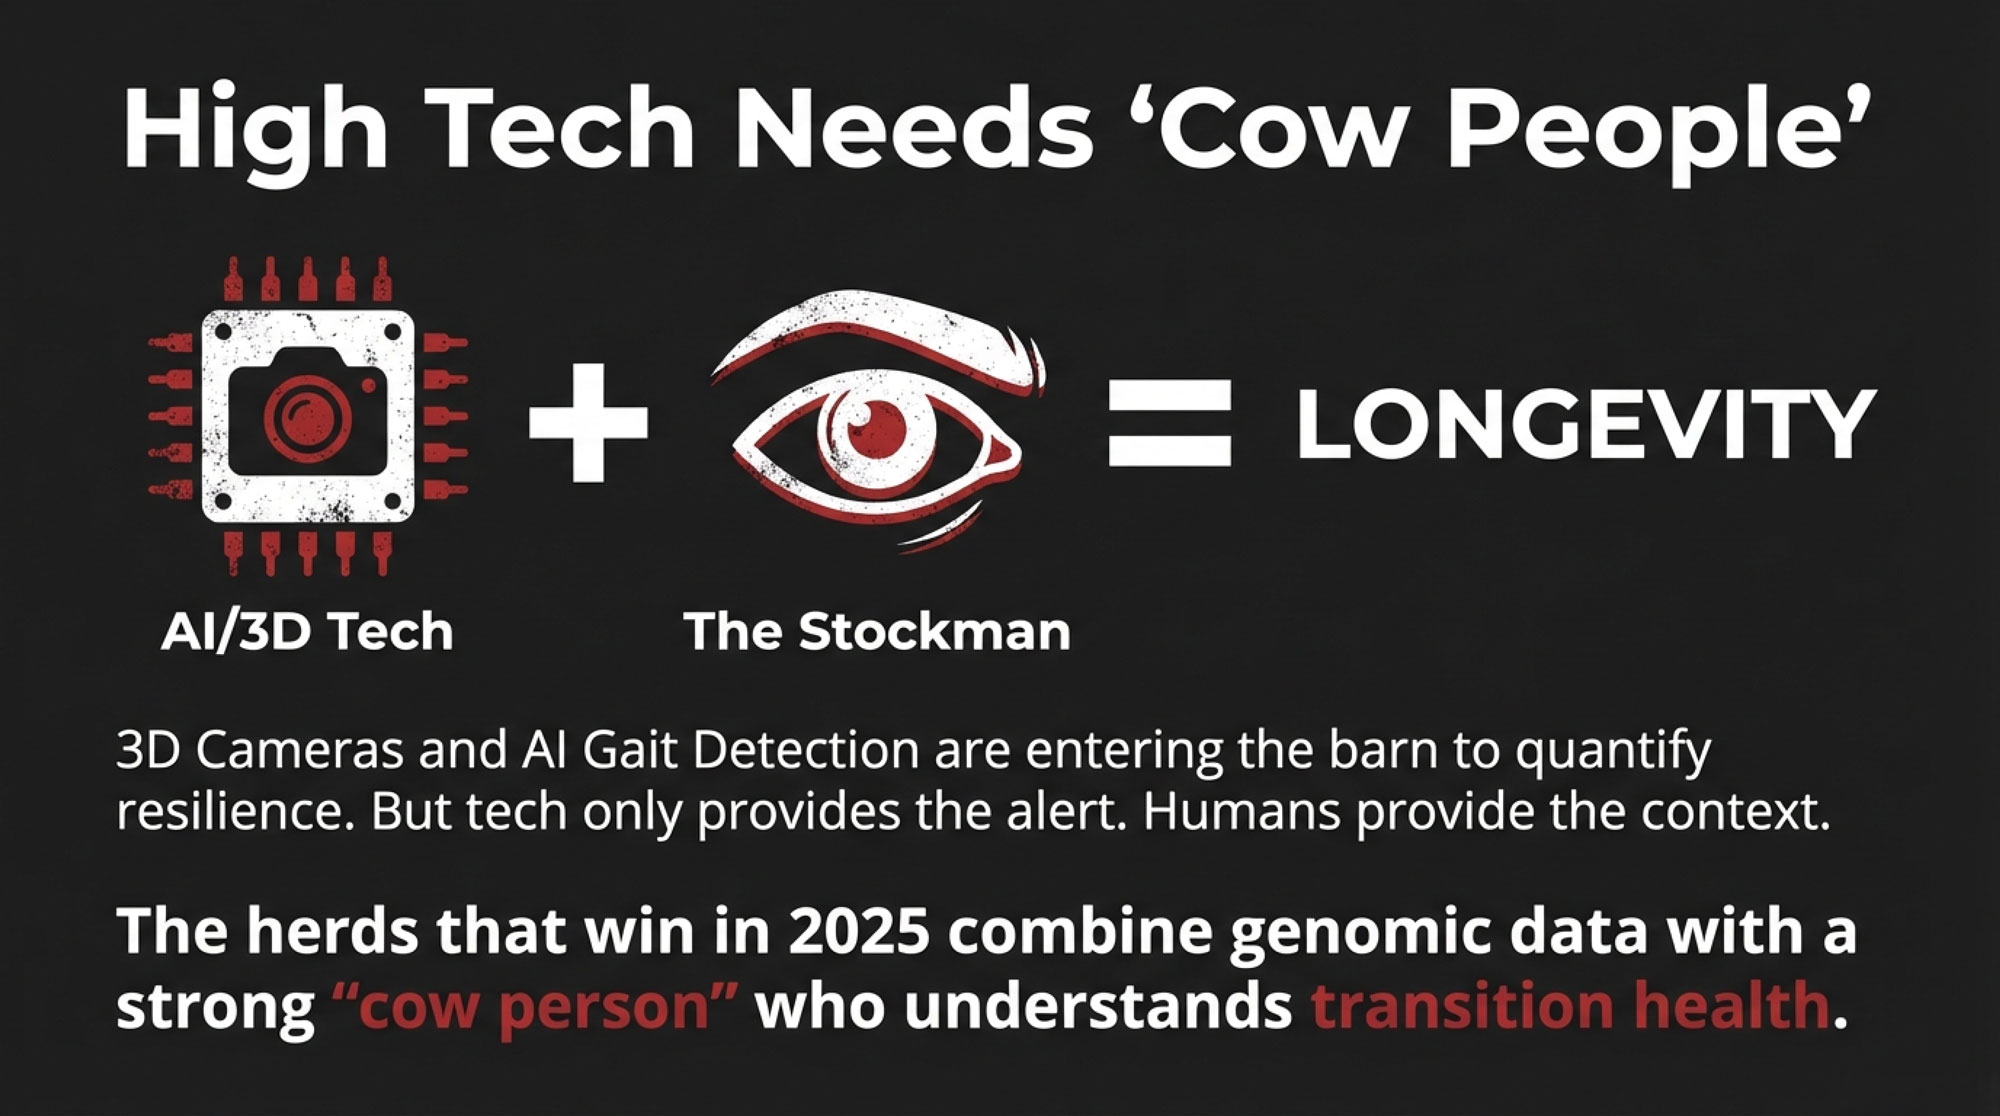
- 5 Technologies That Will Make or Break Your Dairy Farm in 2025 – Harness the power of AI-driven sensors with this foresight piece that breaks down systems moving from “high-tech toy” to “operational necessity.” It reveals how youngstock monitoring and precision feeding can finally automate the 24/7 observation your calves require.
 The Sunday Read Dairy Professionals Don’t Skip.
 The Sunday Read Dairy Professionals Don’t Skip.
Every week, thousands of producers, breeders, and industry insiders open Bullvine Weekly for genetics insights, market shifts, and profit strategies they won’t find anywhere else. One email. Five minutes. Smarter decisions all week.