


New Mexico can track every cow that left Woodcrest Dairy. It can’t tell you which bottle their milk ended up in. That gap is your problem too.
Sometime in 2025, roughly 2,000 dairy cows left Woodcrest Dairy near Roswell, New Mexico — not to be confused with the New York breeding operation of the same name, known for Select Sires’ Woodcrest King DOC. Livestock records reviewed by KOB-TV show that those Roswell animals were sold to Harry Dewit of Westland Dairy in Clovis. KOB-TV reported that the sale occurred shortly before the release of an undercover video from the facility. There is no public evidence indicating Dewit was aware of the pending investigation at the time of the transaction. Federal business filings list Dewit — a past Innovative Dairy Farmer of the Year honoree who milks 4,400 cows at High Plains Dairy in Texas — as CEO of Blue Sky Farms and as a director and treasurer of Select Milk Producers, the cooperative that helped launch the Fairlife milk brand before Coca-Cola acquired full ownership in 2020. Dewit has not been named as a defendant in the federal welfare lawsuit, and no public allegations of wrongdoing have been made against him personally.
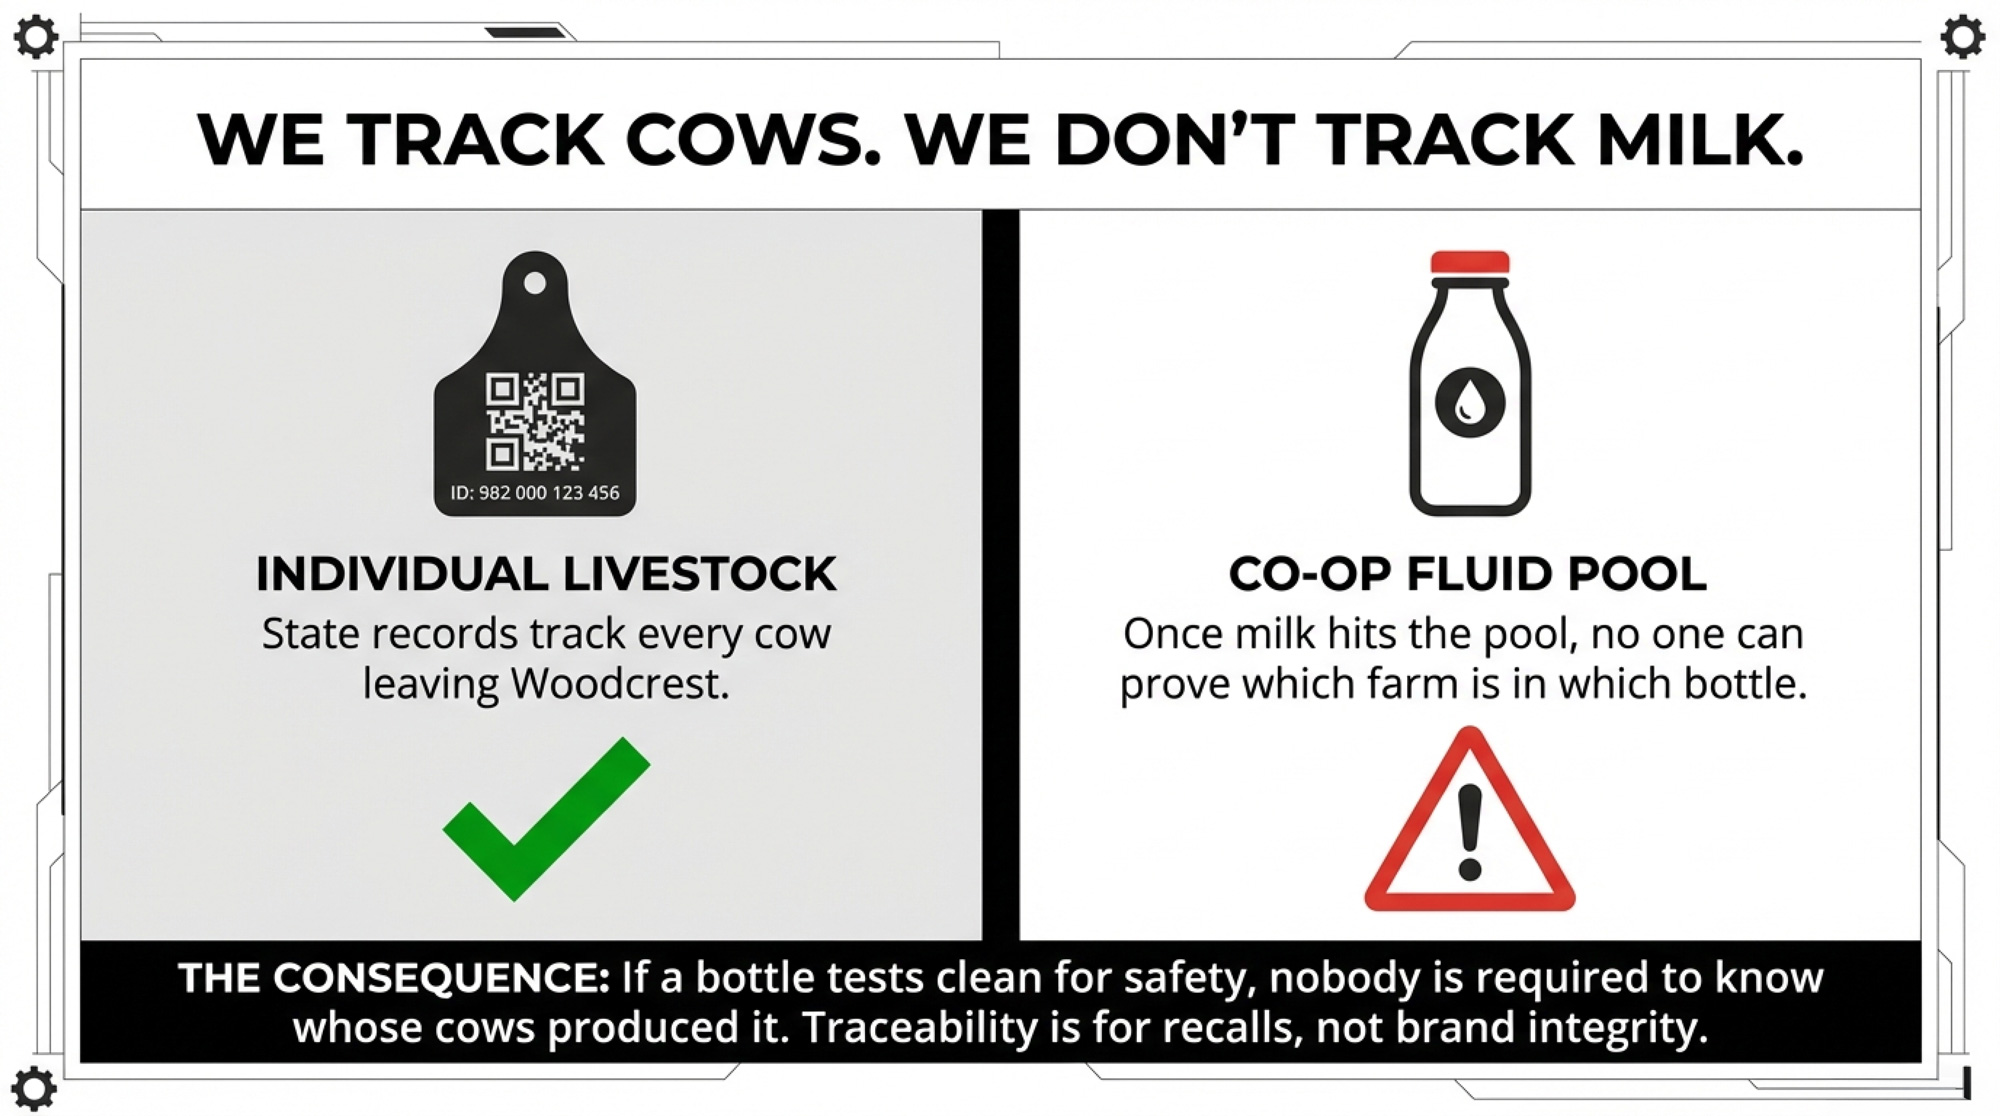
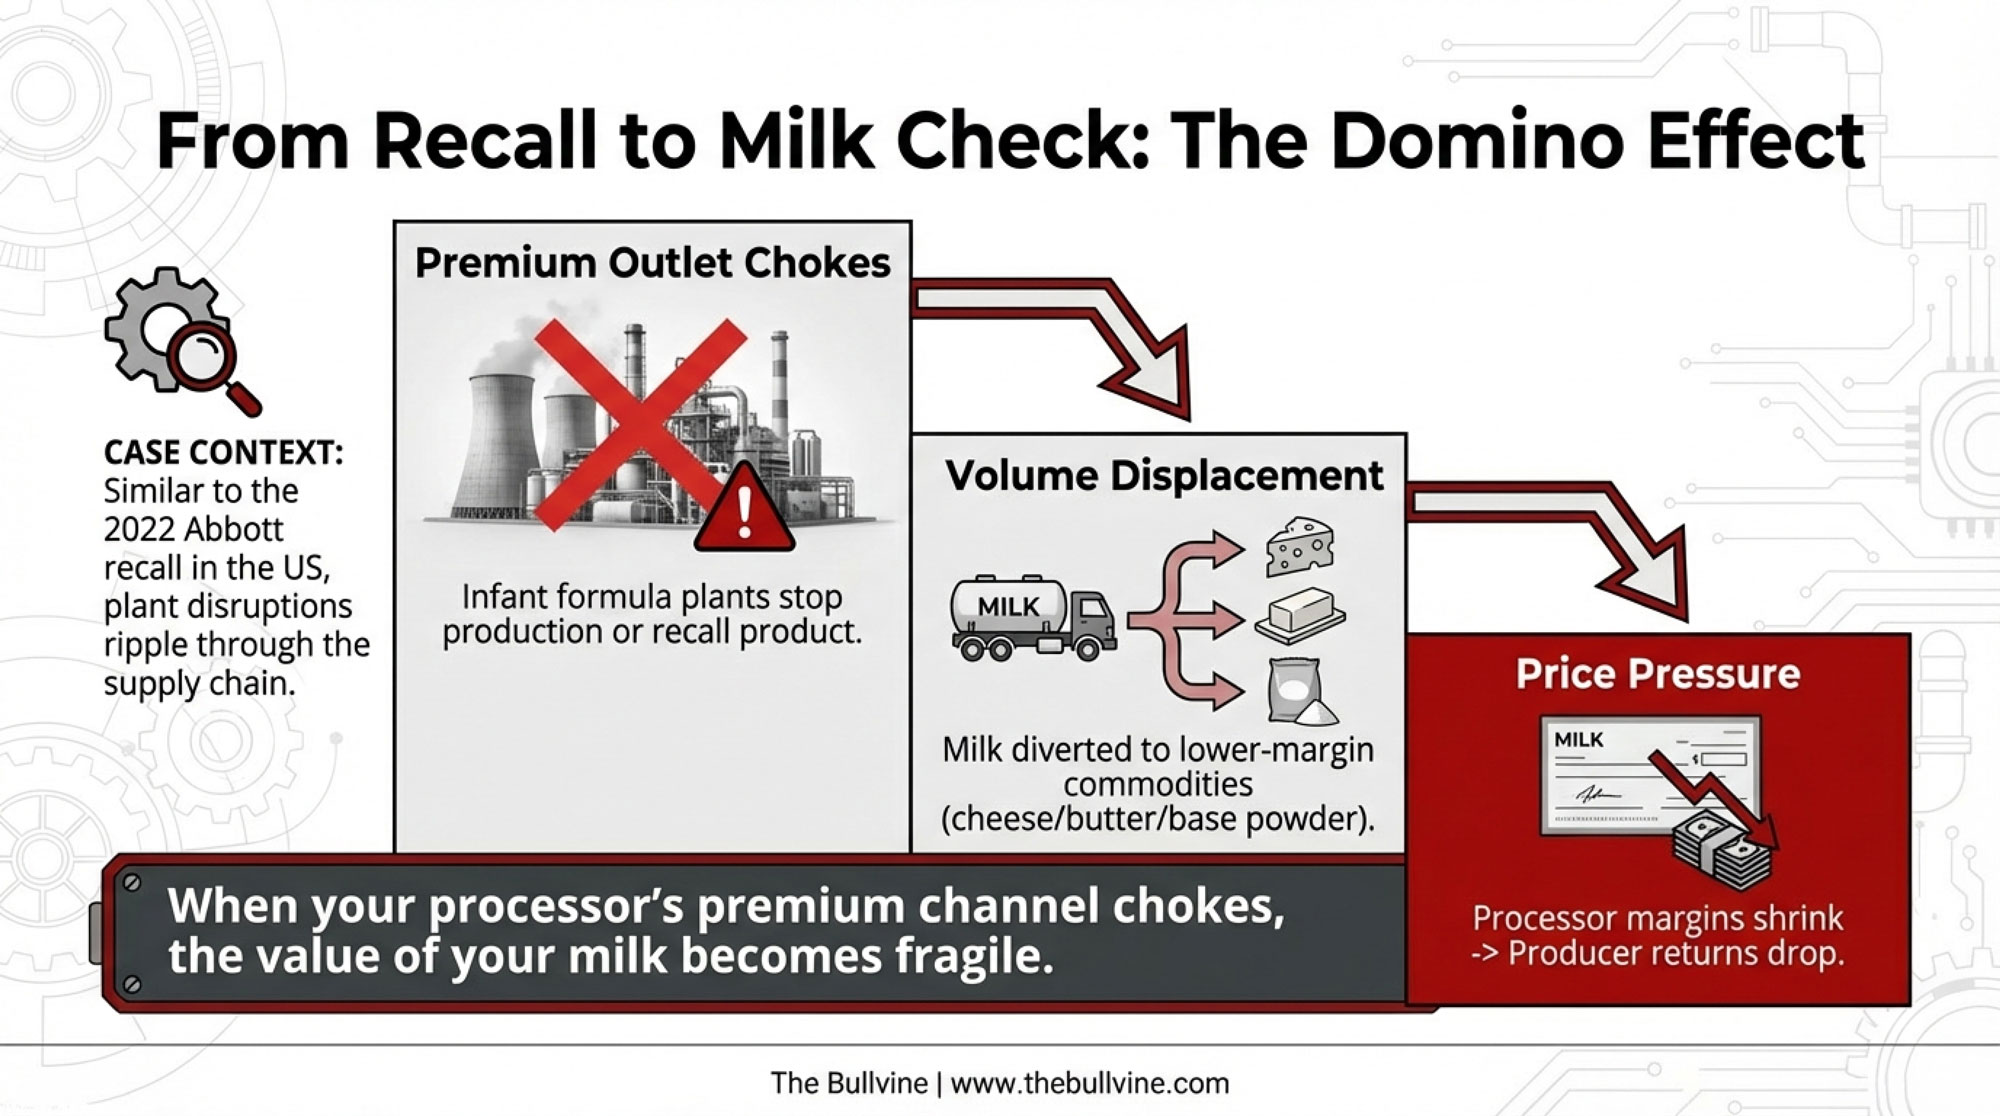
Here’s the problem that should keep every co-op member awake tonight: New Mexico has no system for tracking which dairy’s milk ends up in which branded bottle on which store shelf. That’s not a welfare story. That’s a supply chain story. And it has direct implications for every producer whose milk moves through a cooperative network.
The $21 Million Promise
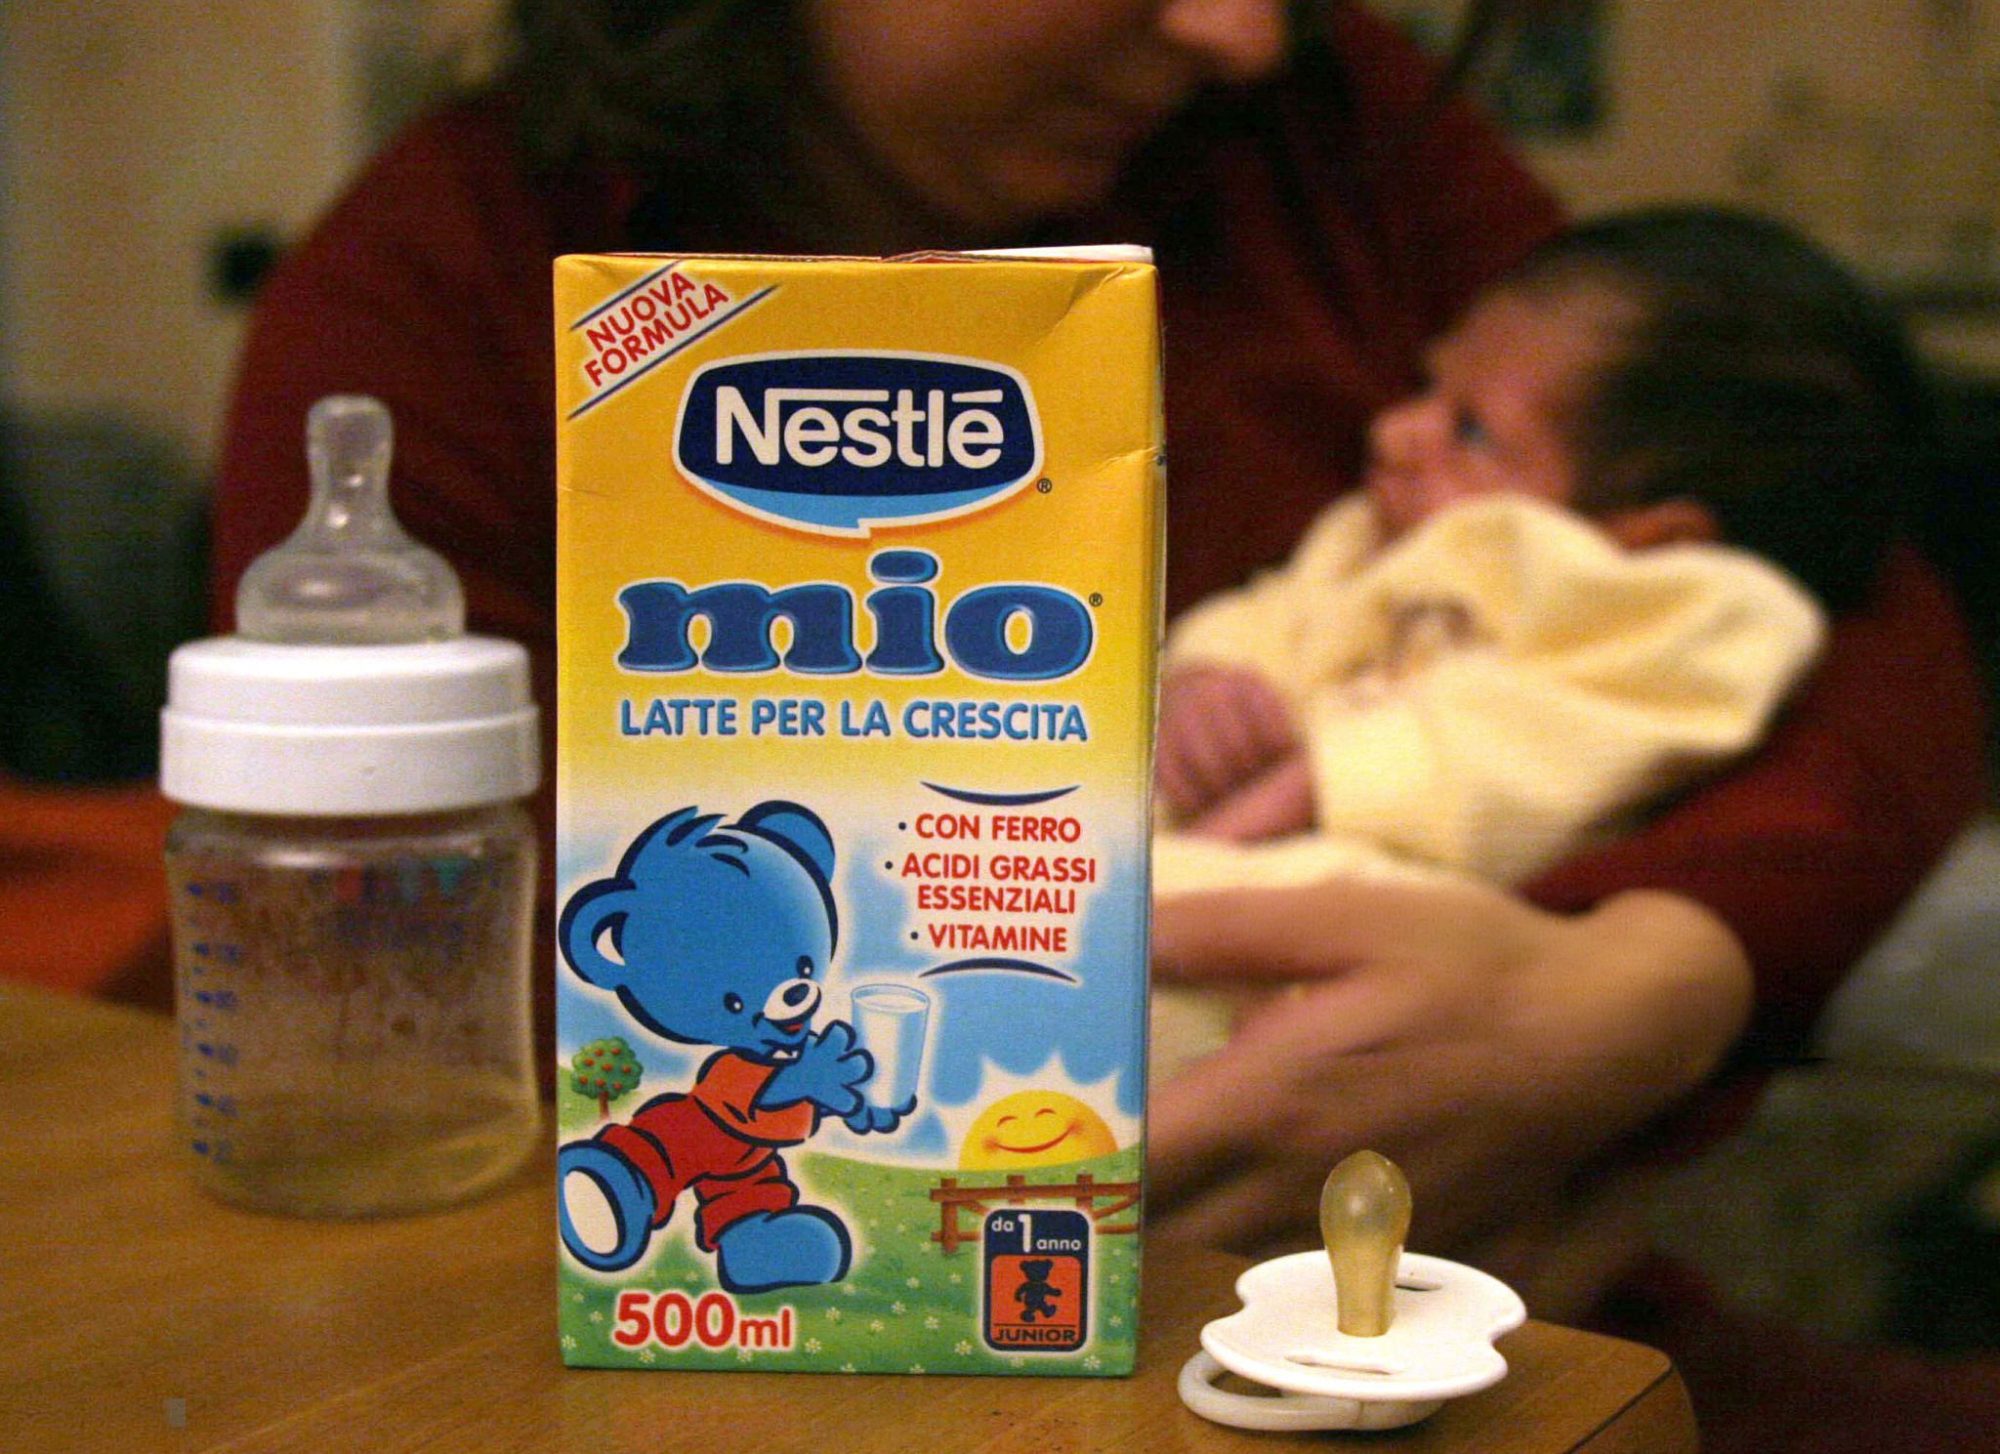
In 2022, Fairlife and Coca-Cola paid $21 million to settle a class-action lawsuit accusing the company of misleading consumers with marketing that suggested cows received “extraordinary care and comfort.” The companies denied wrongdoing but agreed to implement animal welfare standards and third-party audits as part of the court-approved settlement.
Animal Recovery Mission says those reforms didn’t work. ARM alleges its operative — hired as a milker at Woodcrest and later promoted to the birthing and medical units — recorded footage from December 2024 through approximately March 2025 that ARM describes as showing workers striking cows with shovels and wrenches, forcing metal rods down animals’ throats, and dragging calves through dirt. These allegations, first reported publicly by ARM and subsequently by KOB-TV (February 22, 2026), are now part of a federal lawsuit proceeding in the Central District of California. The Bullvine has not independently verified them, and no criminal charges have been filed as of publication. ARM presented its findings to six agencies — the Chaves County Sheriff’s Department, the New Mexico Livestock Board, the FDA, the New Mexico Department of Agriculture, the USDA, and the FSIS — in May 2025, before going public. ARM says it has investigated other dairies linked to Fairlife in the past.
Fairlife says Woodcrest was not a supplier during 2024 or 2025. ARM’s investigation claims Woodcrest was “directly tied to Coca-Cola’s bottling operations in Dexter, NM, with frequent raw milk pickups by Ruan Trucking.” Those two claims are difficult to reconcile — and the federal lawsuit will likely examine exactly how Fairlife defines “supplier” and whether the cooperative pooling structure creates connections the company’s statement doesn’t acknowledge.
Where Did the Cows Go?
This is where the welfare story becomes a supply chain story — and where The Bullvine’s angle diverges from every other outlet covering this.
KOB-TV’s investigation traced the roughly 2,000 cows from Woodcrest to Westland Dairy, which operates within the Select Milk Producers network. NM Livestock Board investigative records show that by early summer 2025, Woodcrest’s pens were empty, and remaining animals were set to be sold within weeks. Cows from that redistribution remain within the broader Select Milk cooperative framework. But here’s the gap: New Mexico doesn’t track milk from individual dairies to retail brands. The state can trace cows — livestock records document the transfers. What it can’t trace is the milk those cows produce once it enters the cooperative pipeline.
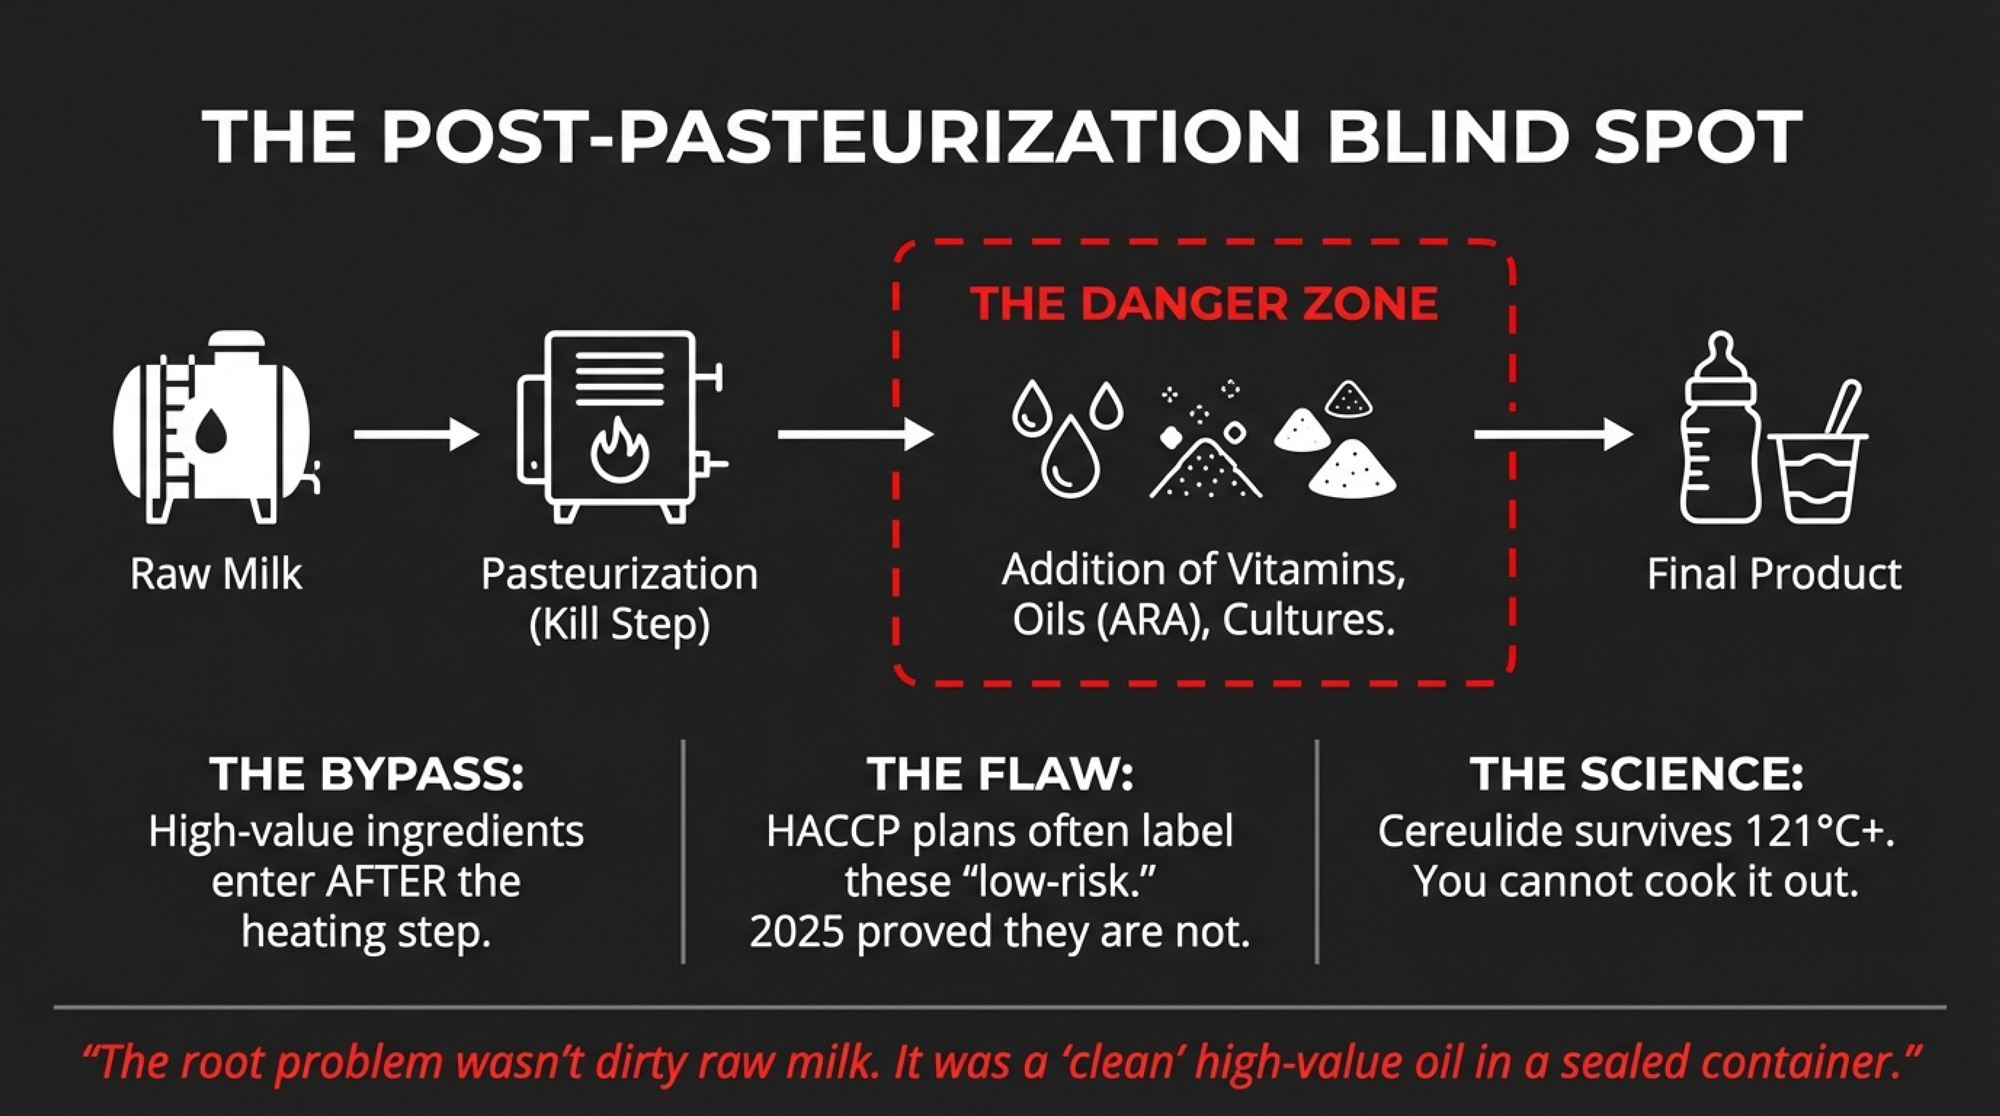
Translation: if a Fairlife bottle tests clean for safety, nobody is required to know whose cows produced it. That’s a food safety system, not a brand integrity system.
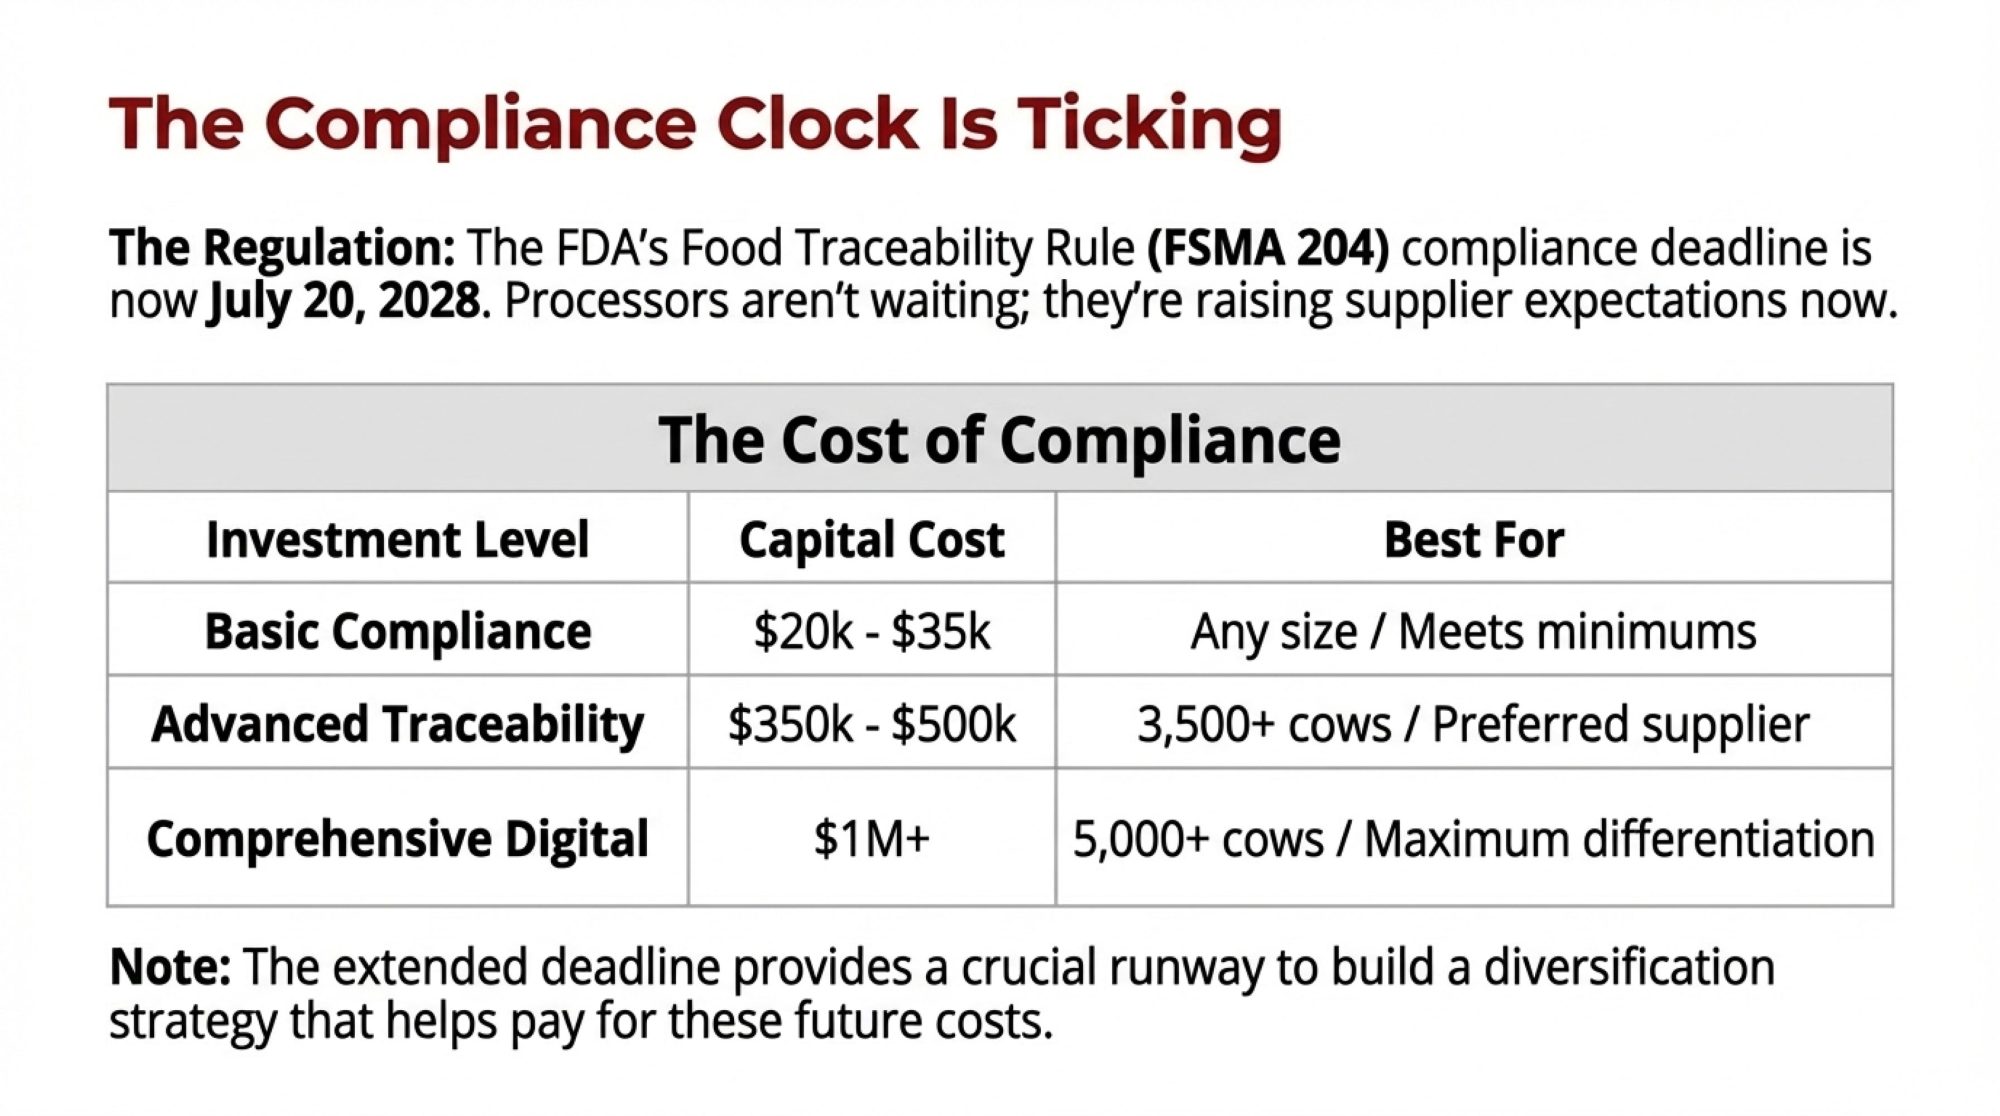
The FDA’s FSMA Food Traceability Rule, which took effect January 20, 2026, addresses traceability for high-risk foods — but fluid milk isn’t on the Food Traceability List. Ultra-filtered products like Fairlife’s fall into a regulatory gap: the Pasteurized Milk Ordinance addresses safety, but farm-to-brand sourcing remains voluntary and processor-controlled. The industry’s Innovation Center for U.S. Dairy has built traceability infrastructure, but it’s designed for processor-lot tracking and recall response — not for answering the question “which farm’s milk is in this bottle?”
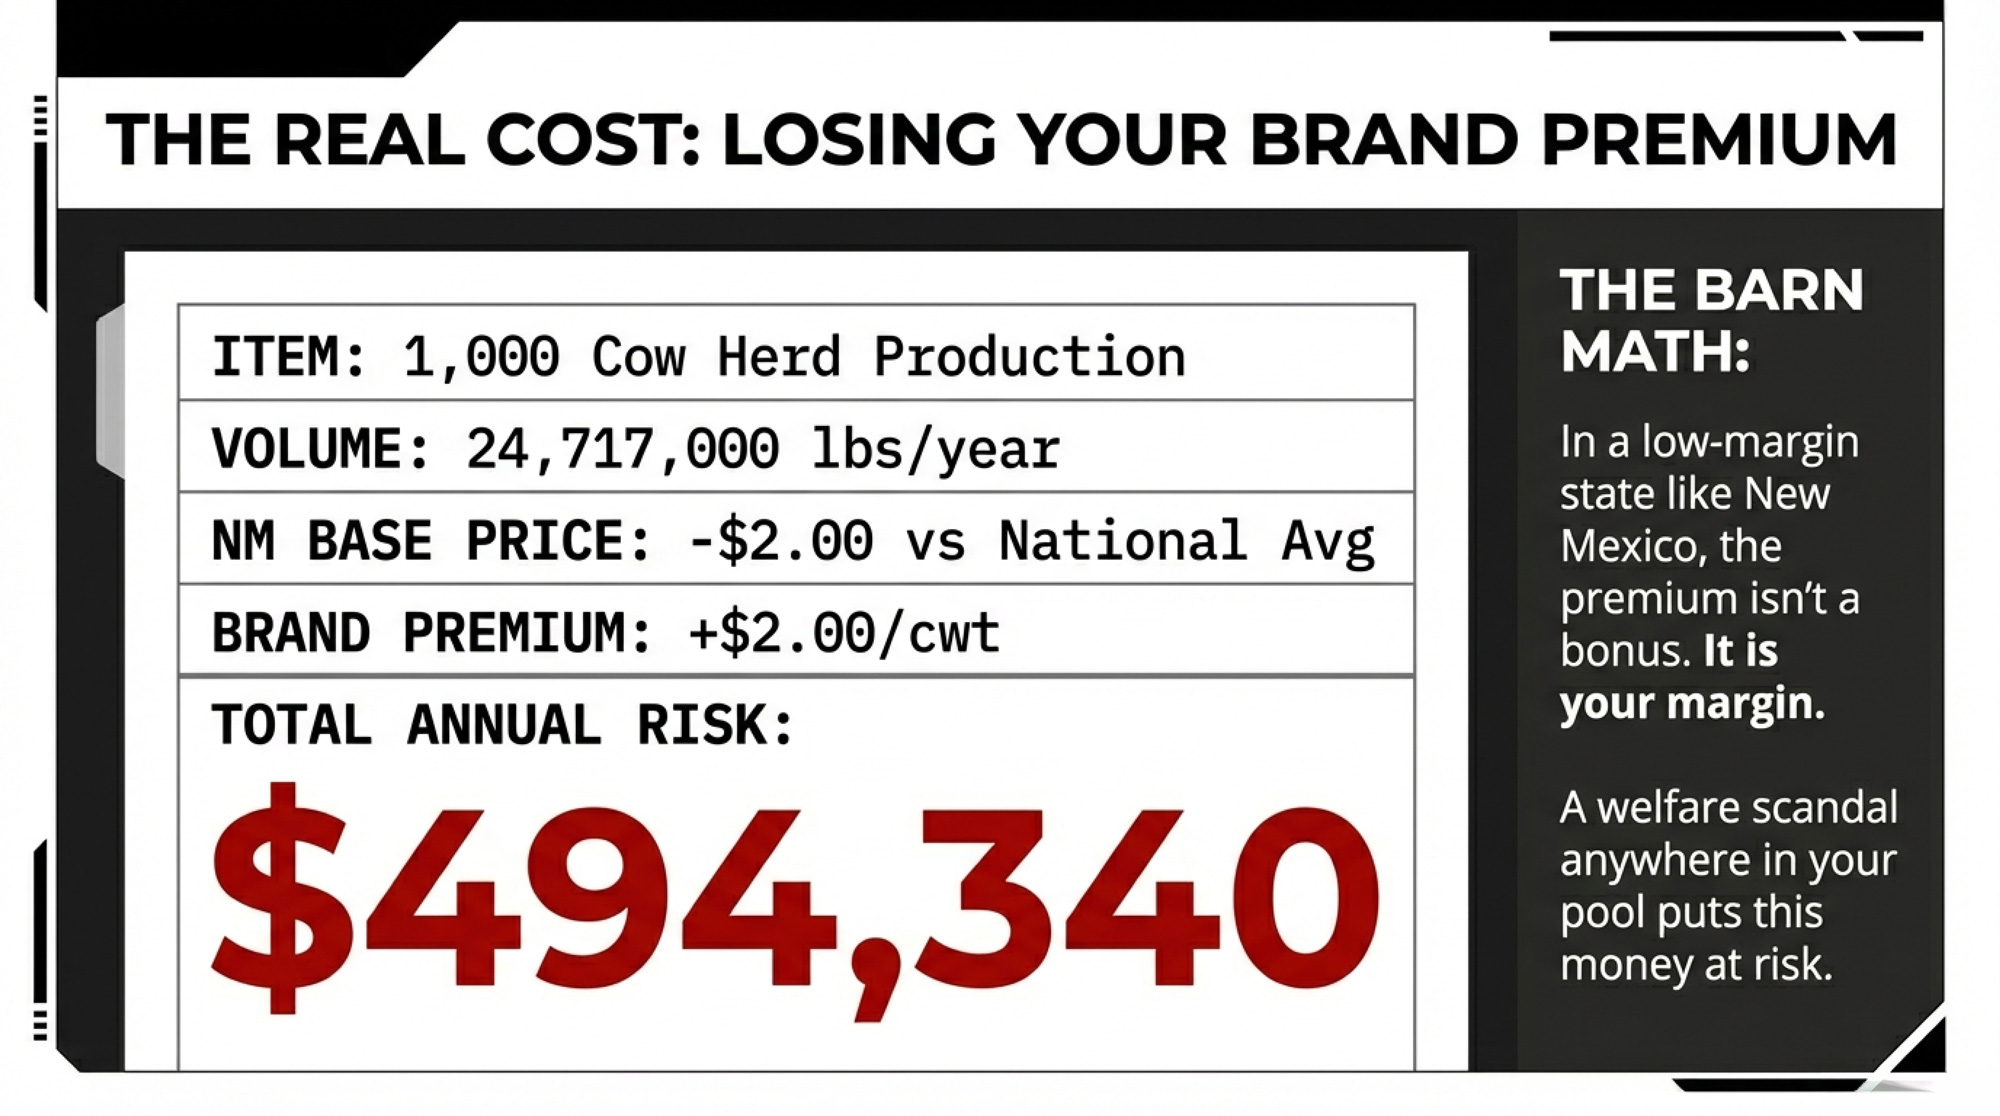
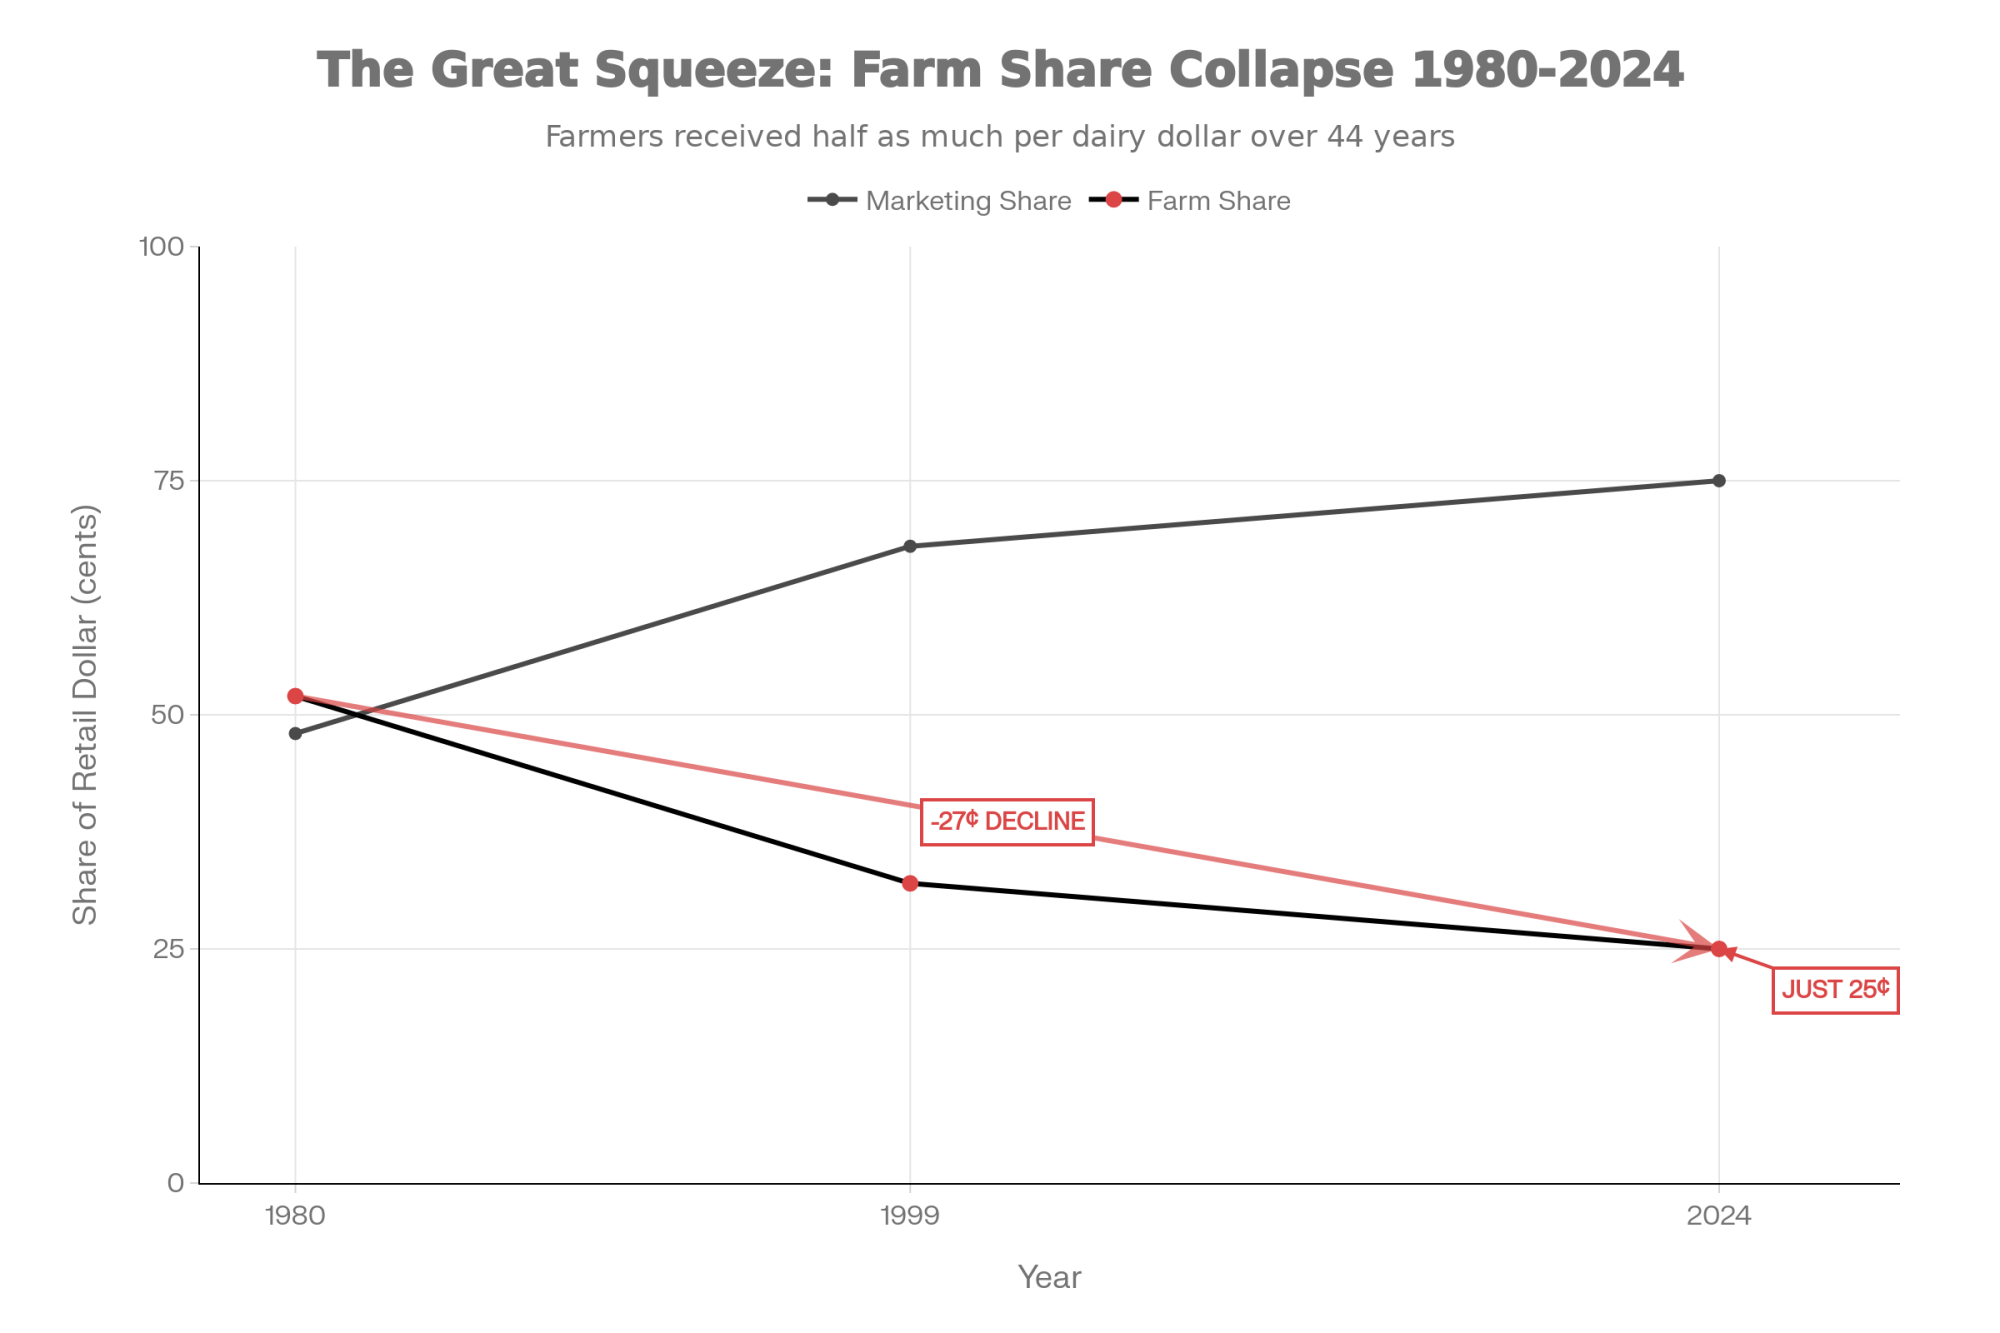
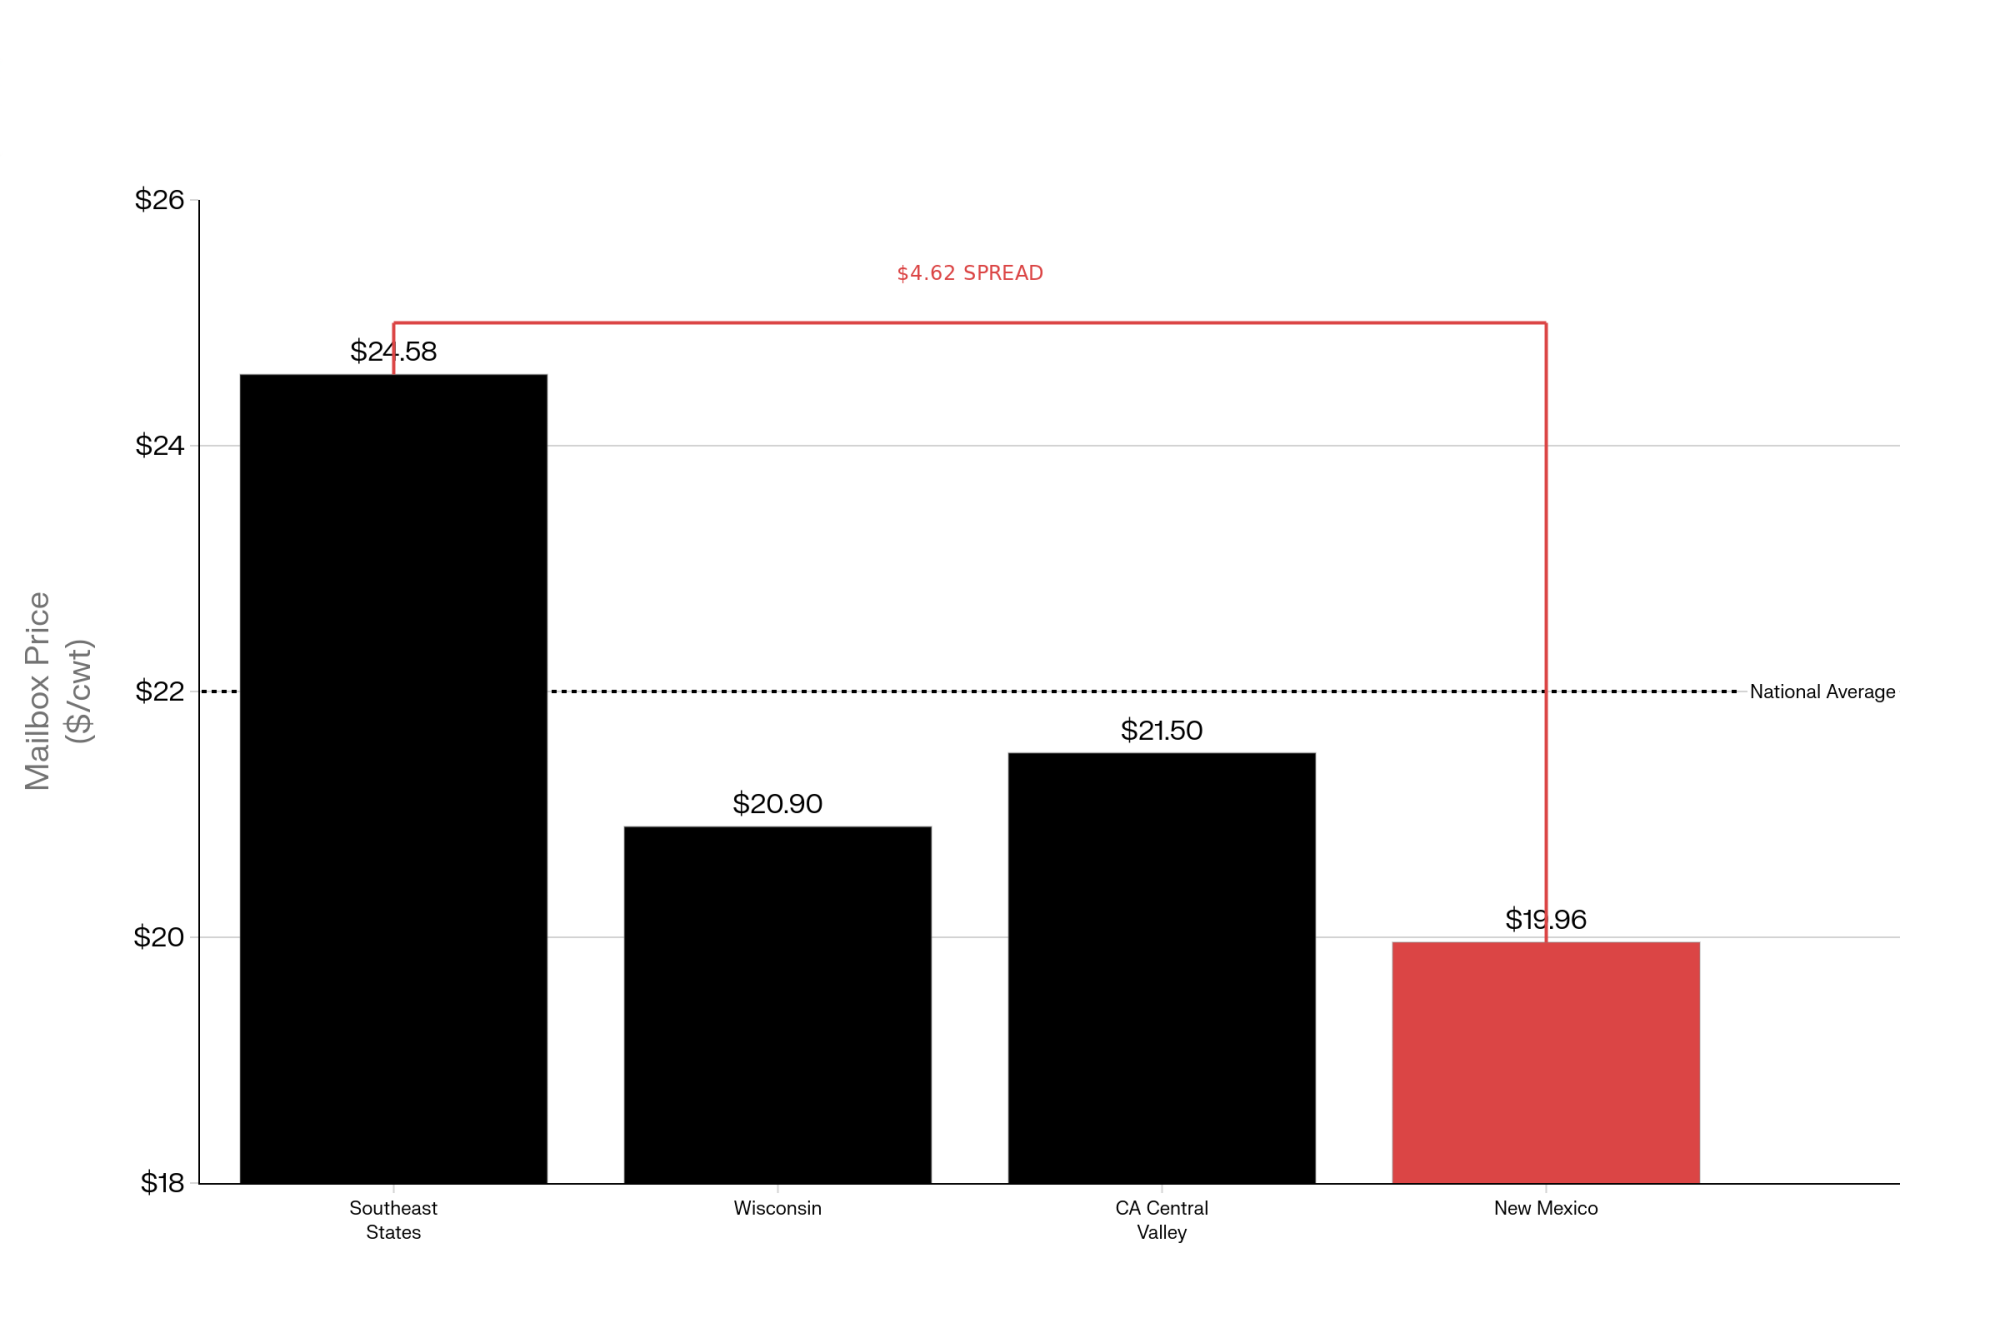
New Mexico runs roughly 95 dairy operations milking approximately 240,000 cows as of 2024, down from 150 farms a decade ago — a 37% decline even as the state’s cow numbers fell 26% from 323,000 (USDA 2025). Average herd size exceeds 2,500 — among the largest in the nation. These are big operations where co-op relationships and brand supply chains matter enormously to the bottom line. And New Mexico’s mailbox milk prices already run roughly $2.00/cwt below the national average — among the lowest in the country, according to USDA data. When your base price is already that thin, the brand premium isn’t a bonus. It’s your margin.
| Metric | New Mexico | U.S. National Average |
| Mailbox Price Disadvantage | $2.00/cwt BELOW national avg | — |
| Operating Dairies (2014→2024) | 150 → 95 farms (−37%) | −26% nationally |
| Cow Inventory (2014→2024) | 323K → 240K (−26%) | Slight increase nationally |
| Average Herd Size | 2,500+ cows (among largest in U.S.) | ~350 cows |
Can Your Co-op Prove Your Milk Is Clean?
That’s the question this story forces into the open. And the honest answer, for most co-op members, is probably not.
Select Milk Producers — a cooperative of 99 family dairy farm members based in Texas and New Mexico — said in a statement to KOB-TV: “Select Milk Producers is committed to the highest standards of animal care.” In court filings, Select argues that plaintiffs have not shown Woodcrest was supplying milk to Fairlife at the time of the alleged abuse. Fairlife has similarly stated that Woodcrest was not a supplier during 2024 or 2025 and said its supplying farms are subject to animal welfare standards and third-party audits.
The structural problem remains: when cows transfer between operations within the same cooperative network — as 2,000 did from Woodcrest — and when state regulators can’t trace milk to brands, the burden of proving supply chain integrity falls on the processor’s word. Not on verifiable records. Not on independent audit trails.
The owner of Woodcrest declined to comment on camera to KOB-TV and distanced himself from Fairlife, directing questions to his former co-op, Select Milk Producers. According to KOB-TV’s reporting, Select Milk did not respond to specific questions about Dewit’s business affiliations or the co-op’s role in the sale of the cows.
If you’re a co-op member — in New Mexico or anywhere — this matters to you even if your operation has never been within 1,000 miles of Roswell. The question isn’t whether you treat your cows right. The question is whether your co-op can prove, with documentation, that the milk carrying a premium brand label actually came from farms that met that brand’s welfare standards. The Woodcrest situation raises the question of whether most can.
Double Legal Exposure in the Same District
The welfare lawsuit isn’t the only legal problem facing Select Milk Producers in federal court in New Mexico.
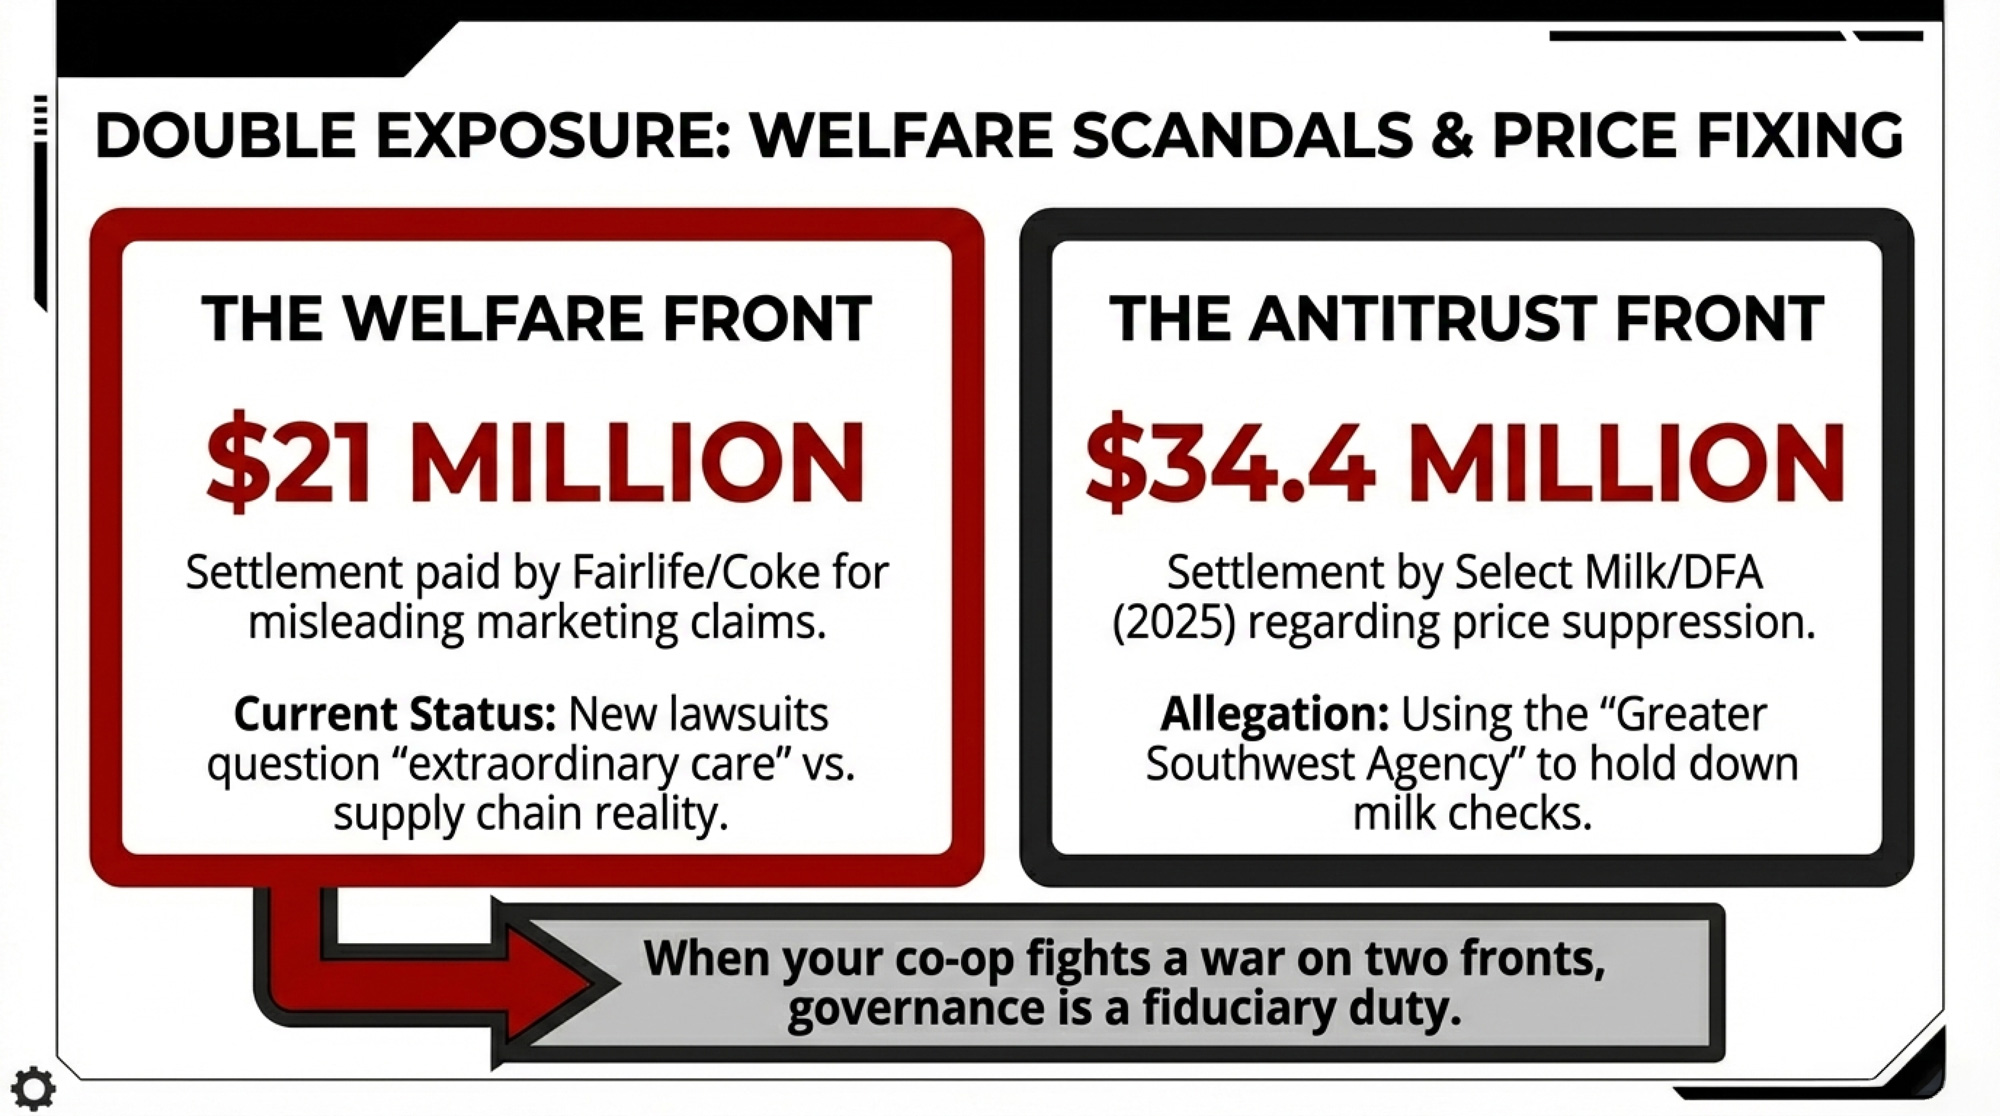
In a separate case (Othart Dairy Farms LLC et al v. DFA Inc. et al, No. 2:22-cv-00251, filed April 2022), dairy farmers including Othart Dairy Farms of Veguita, New Mexico, along with Pareo Farm, Desertland Dairy of Vado, Del Oro Dairy of Mesquite, Bright Star Dairy, and Sunset Dairy alleged that DFA and Select Milk conspired through their Greater Southwest Agency to suppress milk prices paid to producers in New Mexico and portions of Texas, Arizona, Kansas, and Oklahoma from January 2015 through at least June 2025. Judge Margaret Strickland ruled the case could proceed in March 2024. A $34.4 million settlement — $24.5 million from DFA and $9.9 million from Select Milk — received preliminary judicial approval in the summer of 2025. Neither cooperative admitted liability. The complaint alleged that DFA and Select controlled at least 75% of all raw Grade A milk in the Southwest, and that more than 85% of the region’s milk moves through cooperatives.
Beyond the settlement payments, both co-ops agreed to dissolve Greater Southwest Agency — the joint marketing entity the lawsuit alleged was the main vehicle for the conspiracy — and to implement antitrust training for marketing staff and better pay transparency for members (August 2025). DFA has a history of antitrust litigation. The cooperative paid $140 million to settle a price-fixing suit in the Southeast in 2013 (without admitting liability) and $50 million in the Northeast in 2015 (also without admission). Combined with the Southwest settlement, DFA’s total antitrust settlement obligations across three regions now exceed $225 million.
Two federal lawsuits in the same district, involving the same cooperative network — one alleging welfare failures in the supply chain, the other alleging price suppression. Whether that’s a coincidence or something more structural is a question Select Milk’s members deserve to ask. The Bullvine explored the real math behind who controls your milk check in “The American Dairy Heist: Who Really Owns Your Milk Check.”
The Barn Math
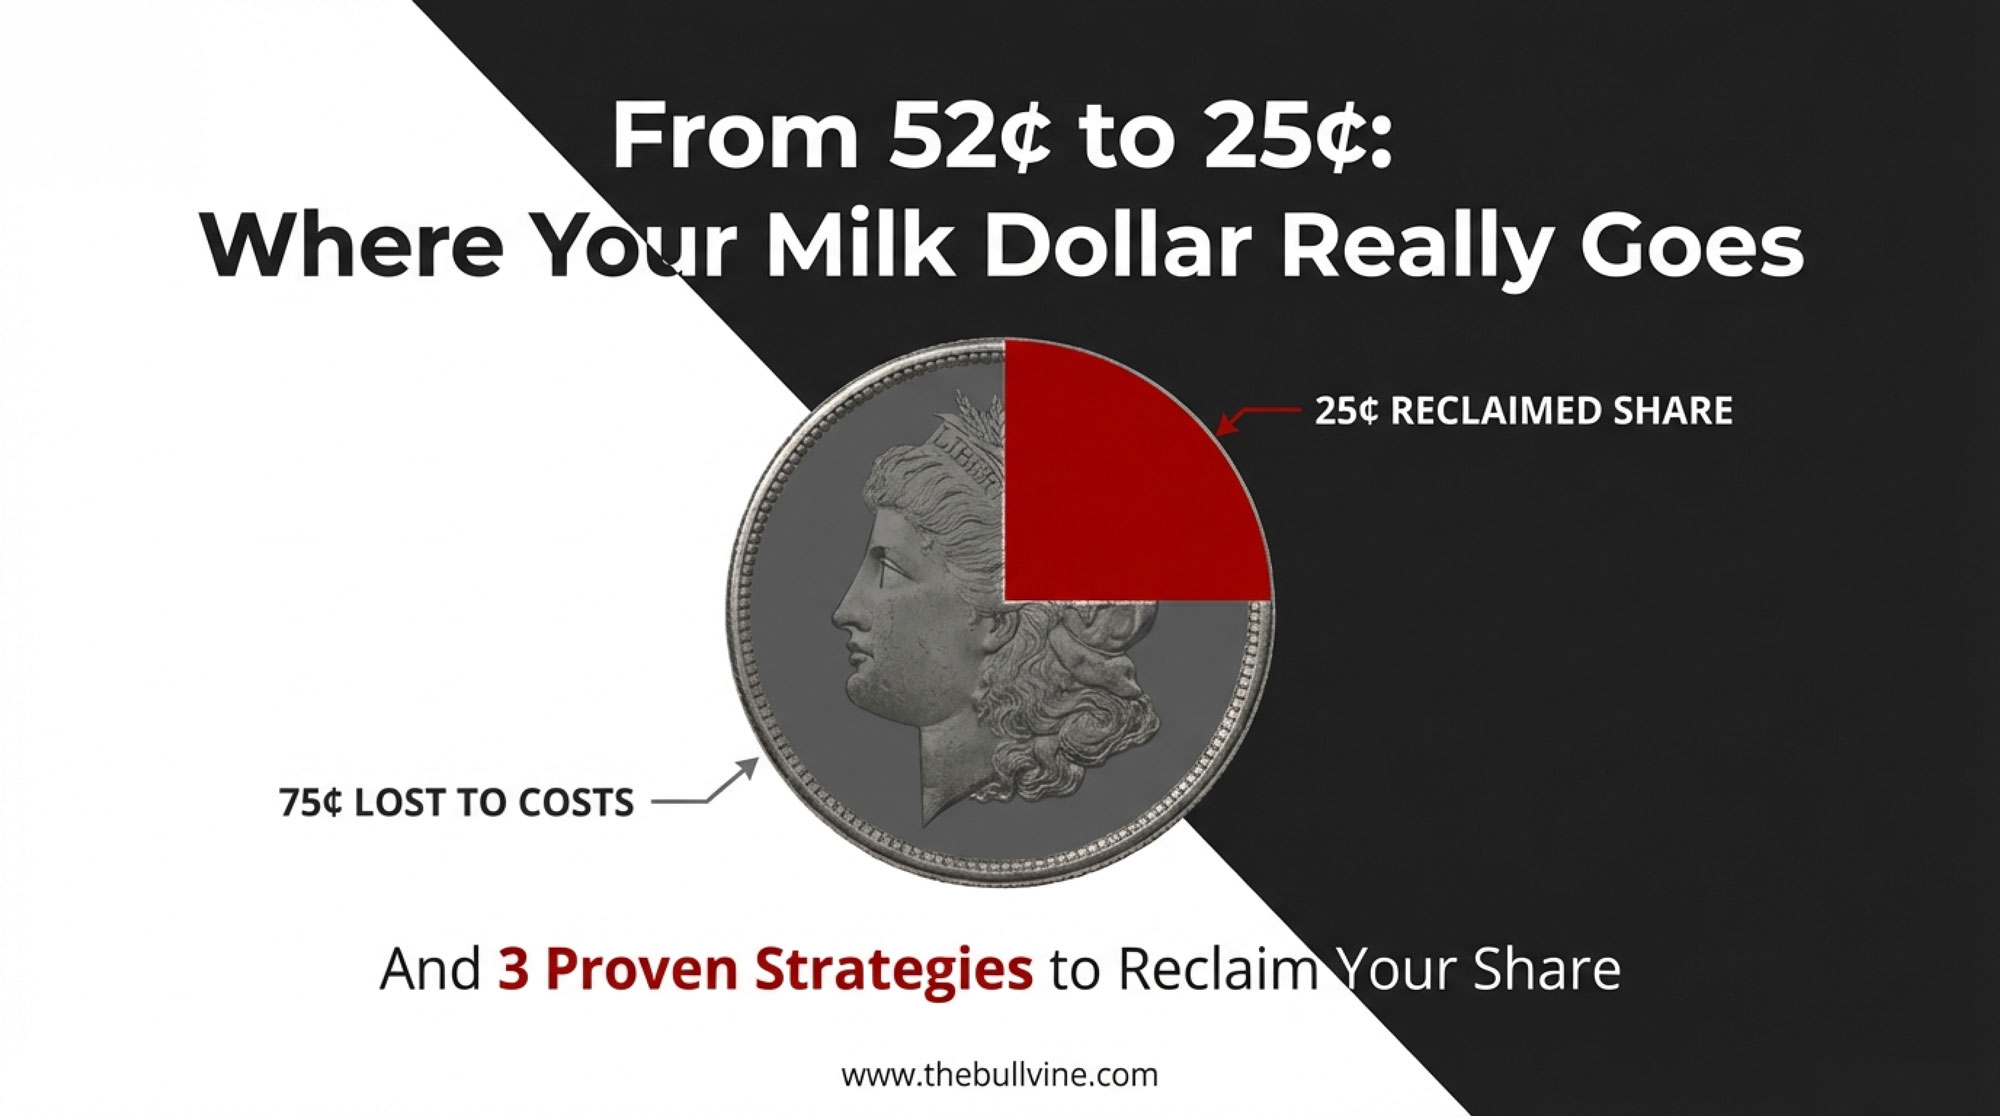
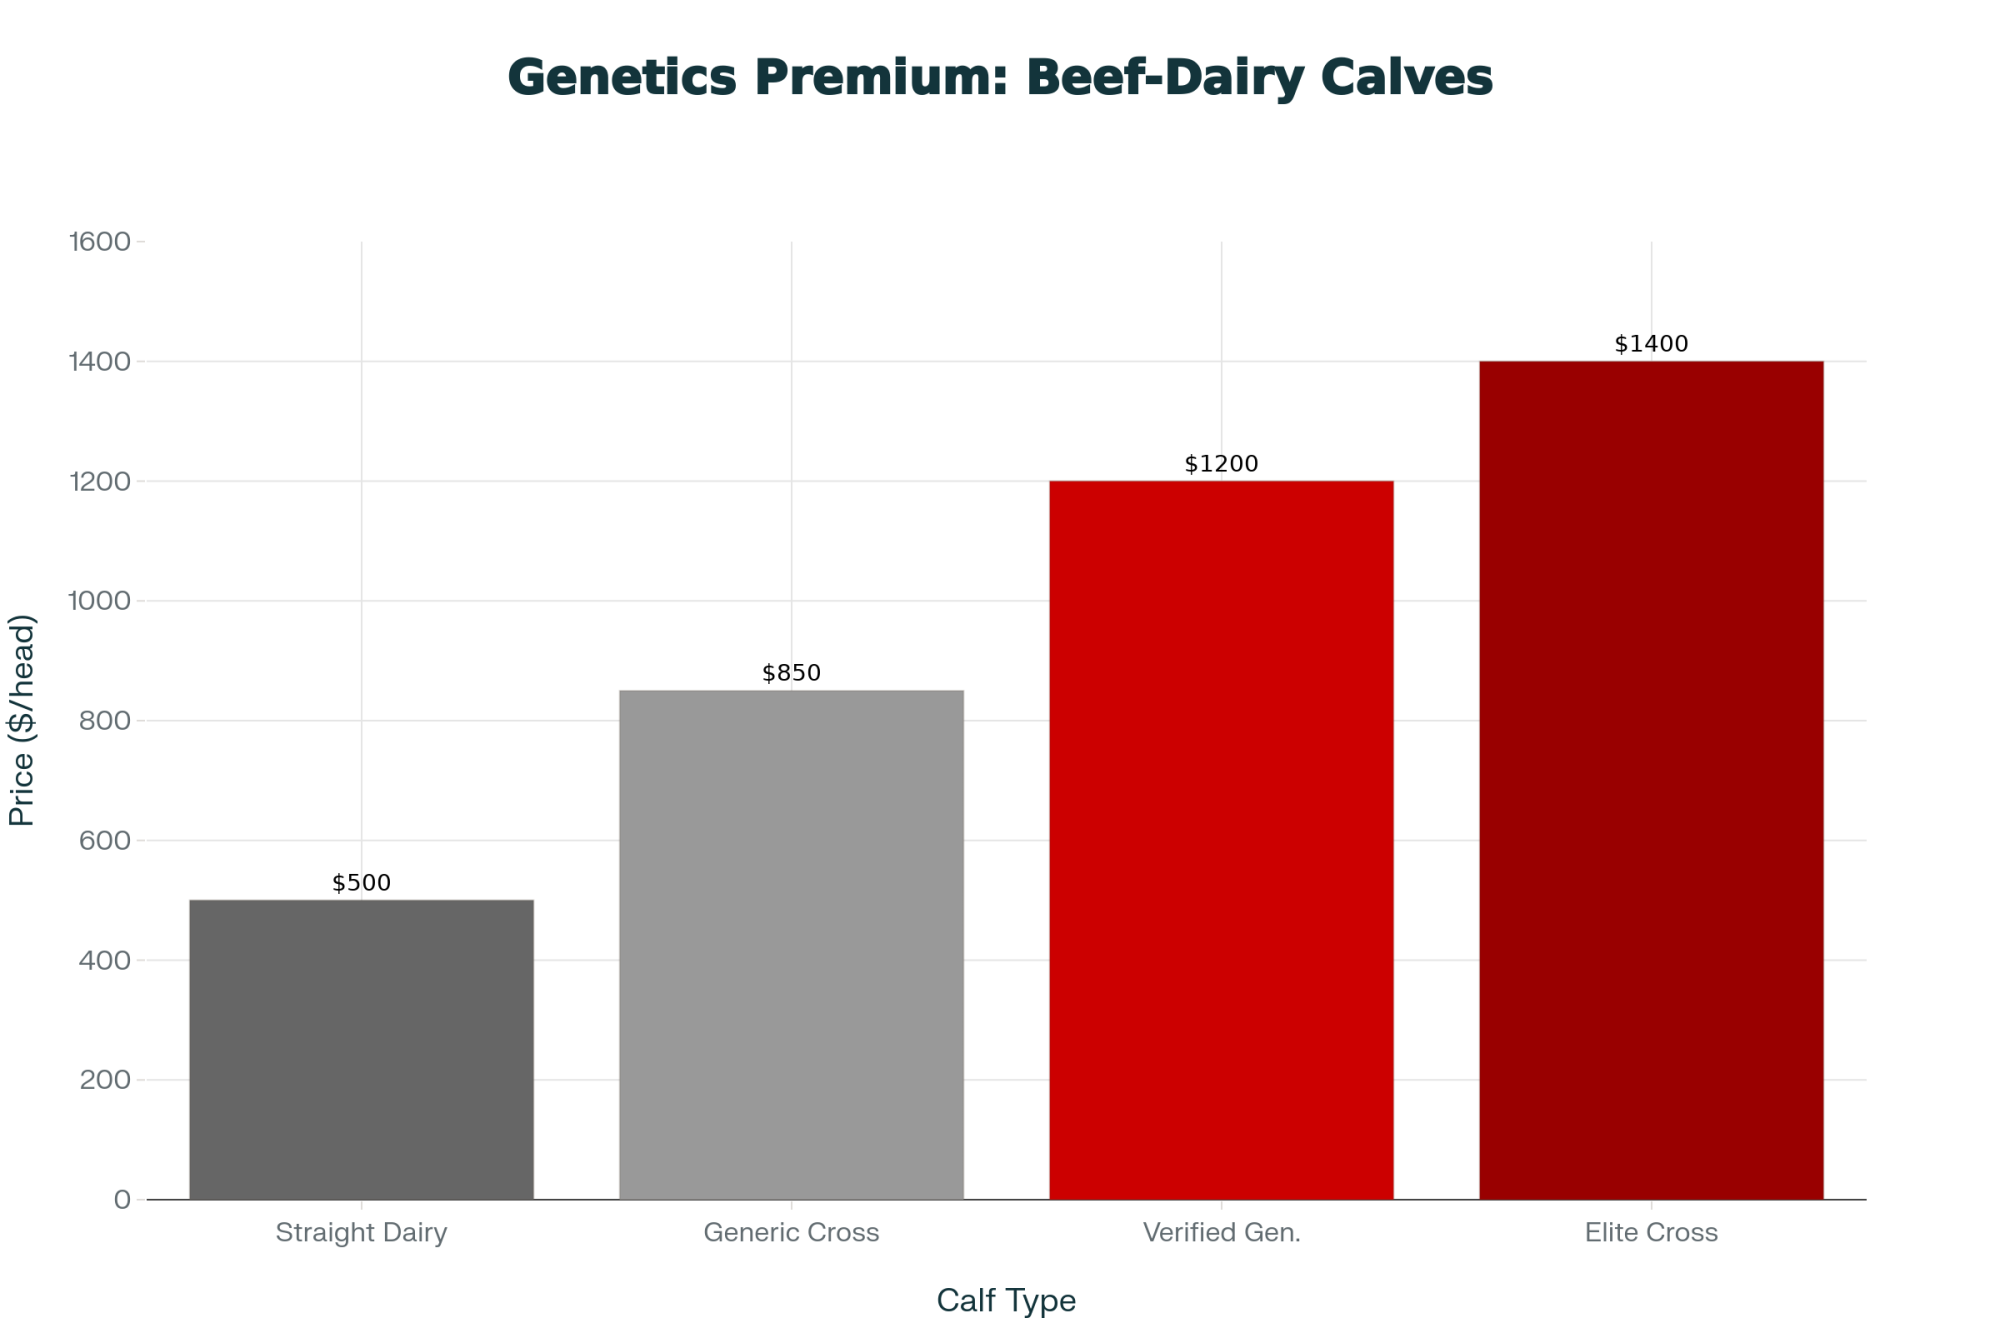
Here’s where this gets personal for your operation. Brand-premium milk programs — Fairlife included — typically command $1.50 to $2.50/cwt above commodity pricing for qualifying farms (exact premiums vary by contract and aren’t publicly disclosed). On a 1,000-cow herd producing at New Mexico’s state average of 24,717 lbs/cow/year, a $2.00/cwt premium works out to roughly $494,000 per year.
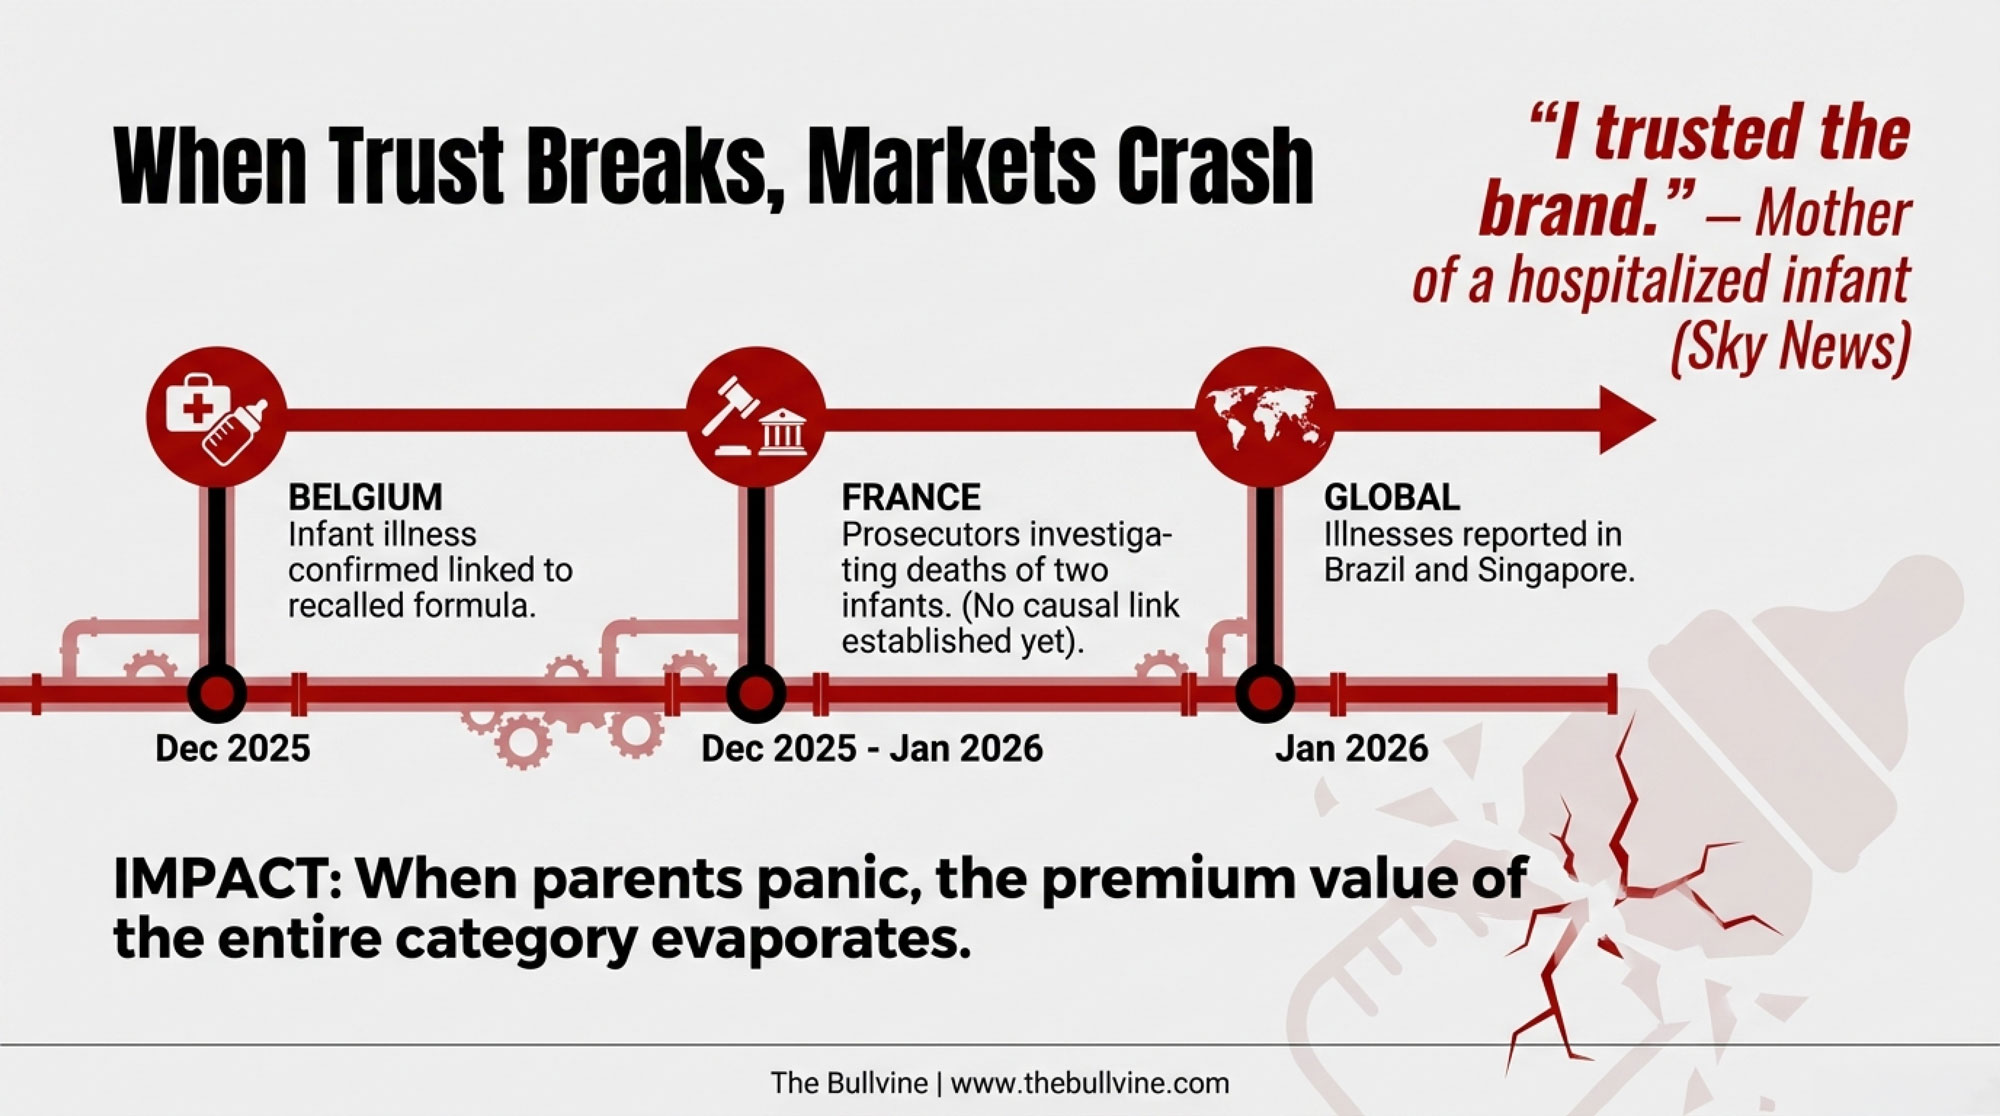
That premium exists because consumers pay more for a brand that promises higher welfare standards. A welfare investigation — at your farm, your co-op partner’s farm, or anywhere in your cooperative’s supply chain — puts the brand at risk. And when that happens, the premium is what evaporates. Not the base milk price. The premium. In a state where mailbox prices already sit $2.00/cwt below the national average, that premium isn’t extra income — it’s the difference between positive margins and red ink. The question isn’t whether you can afford traceability — it’s whether you can afford not to have it. (For more on how management alone can’t close the gap when structural economics shift, read “Exposing Dairy’s Biggest Lie: Management Can’t Save You.”)
| Herd Size | Annual Production (lbs) | Premium Value ($2.00/cwt) | Potential Loss |
| 500 Cows | 12,358,500 | $247,170 | A New Tractor |
| 1,000 Cows | 24,717,000 | $494,340 | A New Parlor Wing |
| 2,500 Cows | 61,792,500 | $1,235,850 | The Entire Margin |
And here’s the other number worth sitting with: that $34.4 million price-fixing settlement — in which, again, neither cooperative admitted liability — covers roughly 8,000 producers who marketed milk during the affected timeframe (per the settlement class definition). That works out to approximately $4,300 per farm before legal fees. The potential brand-premium loss from a welfare scandal dwarfs that. Unlike a one-time settlement, premium erosion compounds every month the brand stays damaged.
What Corporate Statements Actually Tell You
Fairlife’s position, stated to KOB-TV and multiple other outlets: “Woodcrest Dairy in New Mexico is not a supplier to fairlife” during the period in question, and the company has “zero tolerance for animal abuse.” Select Milk Producers maintains it is “committed to the highest standards of animal care.”
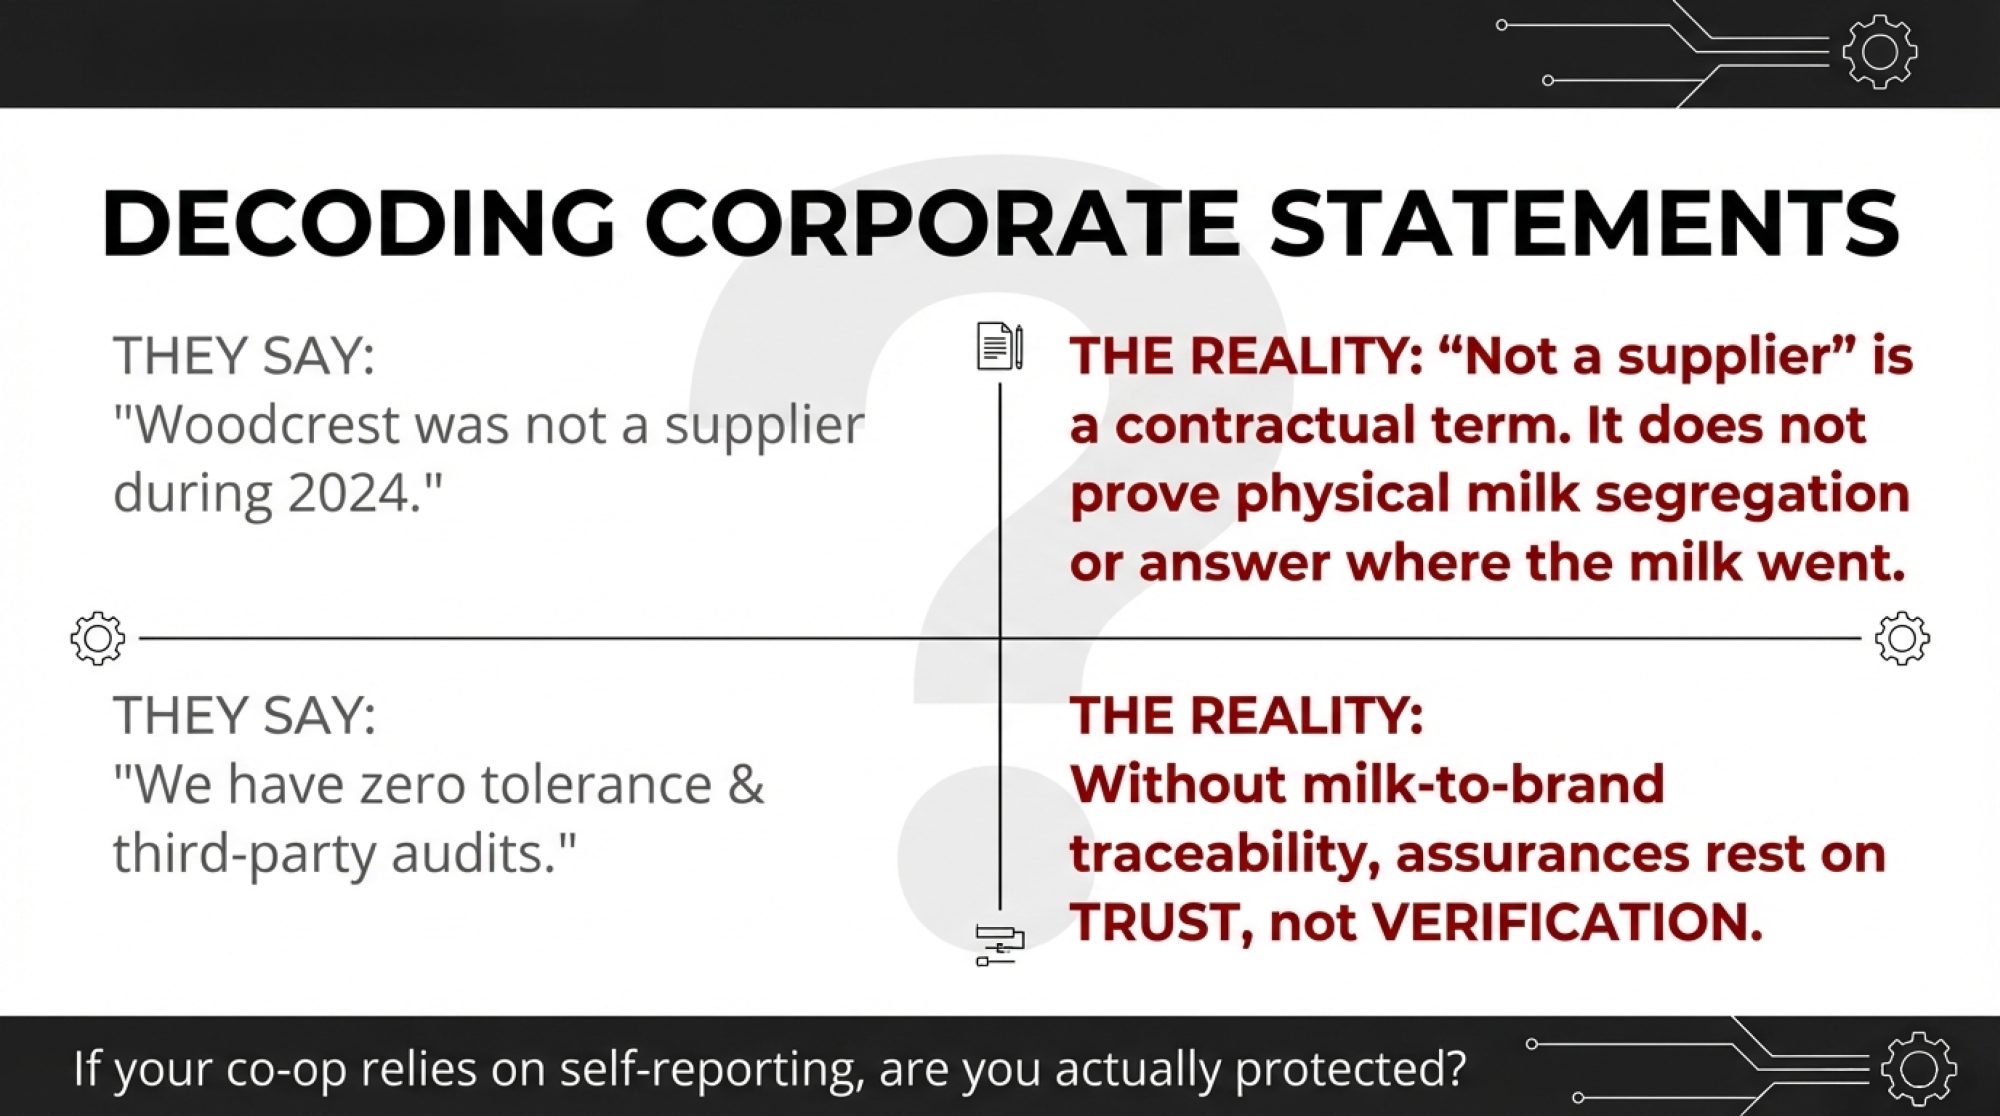
These are the corporate statements as provided. But note what they don’t address: the structural traceability gap. Saying Woodcrest “is not a supplier” is a claim about a business relationship. And in an industry where “not a supplier” can have multiple contractual meanings — not a direct supplier, not during a specific period, not under a particular agreement — the precision of the language deserves closer scrutiny than the reassurance it may offer. That traceability gap isn’t Fairlife’s creation — it’s a structural feature of how cooperative milk marketing works in most states. But it does mean that corporate assurances about supply chain integrity rest on voluntary self-reporting rather than on independently verifiable records.
The judge overseeing the welfare case recently dismissed certain claims against Coca-Cola and Select Milk but allowed others tied to Fairlife’s branding and consumer assurances to proceed. Plaintiffs have been given time to amend their complaint. On the state level, KOB-TV confirmed the Livestock Board has an active investigation — spokesperson Belinda Garland told the station, “The Woodcrest Dairy is an ongoing investigation in this agency,” adding, “We’ll hold them accountable if we feel that we have probable cause and the evidence to support it.” Garland noted that proving extreme animal cruelty can be difficult, particularly when allegations surface after the fact. The Chaves County Sheriff’s Office referred the matter to the NM Livestock Board. Woodcrest Dairy itself has since shut down — pens empty, cows dispersed across the network.
For a deeper look at how the dairy industry’s darkest moments expose structural weak spots, read “Locked From the Inside: Dairy’s Darkest Crimes and the Weak Spots They Exploited.”
Options and Trade-Offs for Your Operation
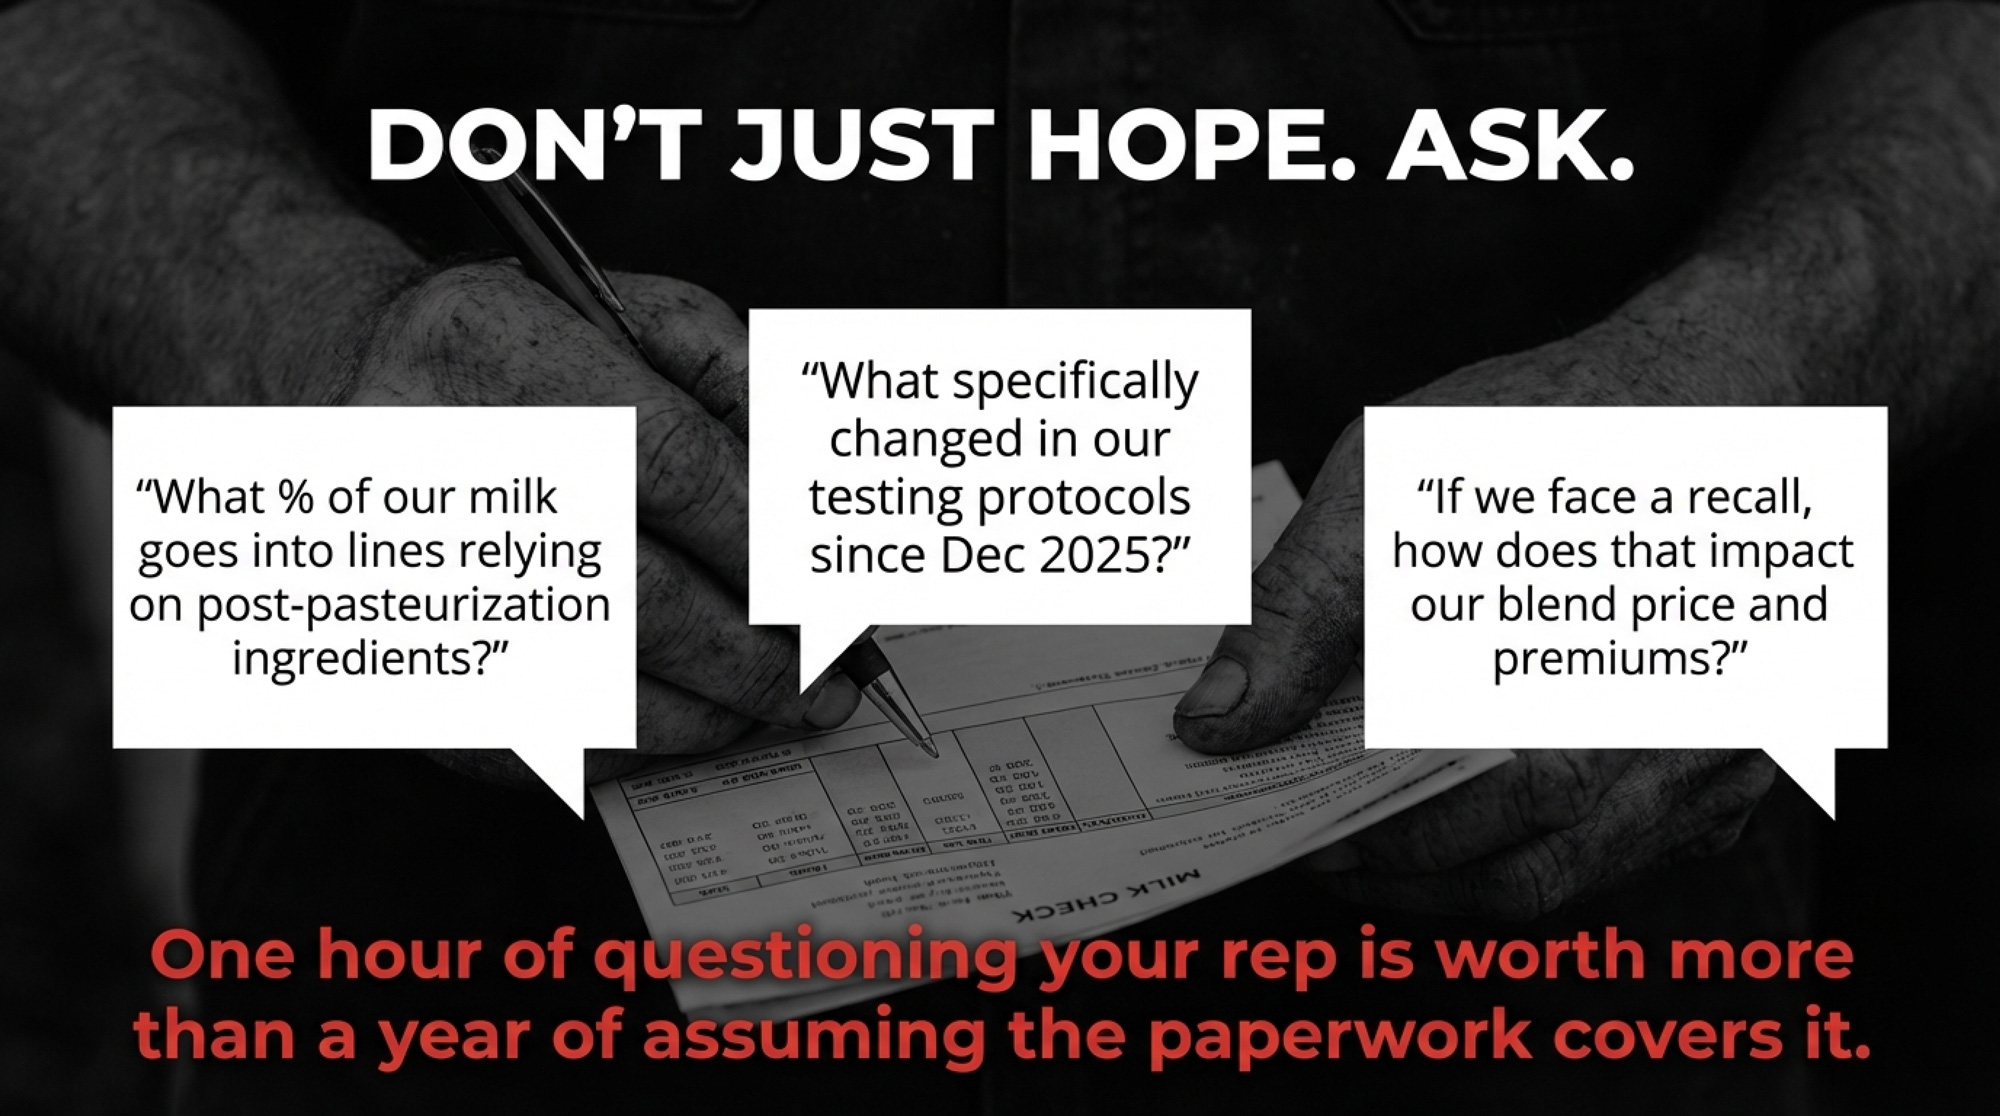
Within 30 days: Audit your own audit. Call your cooperative and ask three questions: Who selects your third-party welfare auditor? How often are audits conducted? Can you get the most recent audit summary for every farm in your pool? Get the answers in writing. If your co-op can’t or won’t answer, that tells you something.
| Audit Question | Why This Matters | Red Flag Answer |
| Who selects your third-party welfare auditor? | If the co-op picks its own auditor, independence is compromised. Best practice: member-elected oversight board selects auditor. | “Management handles that” or “We don’t know” |
| How often are member farms audited? | Annual audits are industry standard for premium brands. Less frequent = gaps where problems can develop undetected. | “Every 2-3 years” or “Only problem farms get audited” |
| Can you access audit summaries for every farm in your pool? | If you can’t see audit results, you can’t verify supply chain integrity. Transparency = accountability. | “That’s confidential” or “Only management sees those” |
| Does your marketing agreement address brand-contamination risk from other member farms? | Without explicit clauses, you carry exposure from other farms’ welfare failures but have no legal recourse for lost premiums. | “We don’t have specific language on that” or “Never thought about it” |
Within 90 days: Review your marketing agreement. Look for brand-contamination clauses — language that addresses what happens to your premiums if another member farm in your supply chain gets investigated. If that language doesn’t exist, you’re carrying risk you haven’t priced. Talk to your ag attorney.
Within 12 months: Push for traceability infrastructure. This is the harder conversation, and it costs money. Canada’s DairyTrace program, launched in 2021, tracks individual animals from birth to disposal — it’s a livestock traceability system, not a milk-to-brand system — and it’s further than what most U.S. cooperatives have built. The real gap is at the processor level: can your co-op’s system document which farms’ milk went into which branded product on which date? The Woodcrest situation raises that question for every cooperative in the country. That gap is a business risk that will only grow as consumers, regulators, and plaintiffs’ attorneys get more sophisticated about dairy supply chain questions. If you’re rethinking your operation’s positioning in that environment, “Transform Your Dairy Before Consolidation Decides for You” maps out the decision framework.
The trade-off is real. Better traceability protects premiums but adds cost. Voluntary industry programs are cheaper to implement but harder to defend in court. And waiting for regulators to mandate traceability means you’re letting someone else set the terms.
Key Takeaways
- If your co-op can’t tell you who audits its member farms or when, your premium is built on trust, not verification. That’s fine until it isn’t.
- If your milk marketing agreement doesn’t address brand-contamination risk from other member farms, you’re exposed. The Woodcrest situation shows how one operation’s investigation can call into question the entire cooperative network’s brand relationships.
- The traceability gap is real and unregulated. Most states — including New Mexico — can’t trace milk from individual farms to retail brands. That means the burden of proving “clean” supply chains rests entirely on processor self-reporting. Ask yourself: Is that enough?
- Two federal lawsuits in the same cooperative network raise questions that Select Milk’s members deserve to ask. When your co-op is simultaneously settling antitrust claims and facing welfare allegations, governance isn’t optional — it’s fiduciary.
The Gap Nobody’s Closing
The dairy industry spent decades building a system optimized for food safety and efficient pooling. That system works — it moves milk safely from farm to shelf on an enormous scale. But it wasn’t built to answer the question premium branding now requires: whose milk is this, and can you prove the cows that produced it were treated as the label promises?
Woodcrest Dairy is shut down. The cows are dispersed across the Select Milk network. The lawsuits are proceeding in narrowed form after some claims were dismissed and others allowed to continue. And somewhere between Roswell and a Fairlife bottle on a grocery store shelf, there’s a traceability gap that no settlement check, no third-party audit, and no corporate press statement has closed.
Your operation might never make national news. But your co-op’s ability to prove where your milk went — and that it came from farms meeting the standards your brand premiums depend on — is now a question with a dollar sign attached. Can yours?
Executive Summary:
A New Mexico welfare investigation at Woodcrest Dairy has exposed a deeper problem: once 2,000 cows were sold out of that herd, nobody could clearly trace which branded products their milk now supplies. Fairlife and Coca-Cola previously paid $21 million to settle animal welfare marketing claims and now say Woodcrest wasn’t a supplier in 2024–25, while ARM’s undercover footage and new federal filings paint a murkier picture of what “supplier” actually means in this system. At the same time, Select Milk Producers is dealing with a separate $34.4 million price-fixing settlement it reached with DFA in the Southwest, without admitting liability, after farmers accused it of using a joint agency to hold down milk checks. For you, the real risk isn’t the courtroom drama — it’s what happens to brand premiums that can be worth around $494,000 a year on a 1,000-cow New Mexico herd if a welfare scandal hits your co-op’s supply chain. Because New Mexico can trace cattle movements but not milk from farm to brand, most co-op members still can’t independently prove where their milk went or whether every supplying farm actually met a premium label’s welfare standards. This piece breaks down that traceability gap and gives you concrete moves — from grilling your co-op on audit practices in the next 30 days to stress-testing your marketing agreement for brand-contamination clauses — so you’re not finding out about your exposure when the premium disappears.
Update, 25/02/2026: Fairlife responded to The Bullvine’s request for comment. A Fairlife spokesperson stated: “Woodcrest Dairy is not a supplier to fairlife, which means no milk from this dairy is received by fairlife for fairlife products.” Fairlife did not address questions regarding the transfer of approximately 2,000 Woodcrest cows to Westland Dairy, milk-to-brand traceability within cooperative pools, Harry Dewit’s role within Select Milk Producers, or the company’s welfare verification process.
This article is based on published reporting by KOB-TV (February 22, 2026), federal court filings, USDA data, and other public sources cited throughout. Fairlife’s and Select Milk Producers’ positions are presented as stated to KOB-TV and in court filings. Harry Dewit has not been named as a defendant in the federal welfare lawsuit.
Learn More
- Exposing Dairy’s Biggest Lie: Management Can’t Save You – Stop chasing marginal efficiencies while your foundation crumbles. This breakdown reveals why “perfect” management fails when structural economics shift—and arms you with the strategy to pivot before the market forces the move for you.
- The American Dairy Heist: Who Really Owns Your Milk Check? – How much of your check is lost to cooperative “pooling” and marketing fees you never approved? This deep dive exposes opacity in your payout and delivers the leverage needed to challenge your board’s status quo.
- The 143-Hour Week at Clark Farms: The Real Math of On-Farm Creamery ROI and Your Time – Owning the brand solves the traceability gap, but at what cost? This case study delivers the brutal labor and capital math required to cut out the middleman and reclaim your farm’s identity and premiums.
 The Sunday Read Dairy Professionals Don’t Skip.
 The Sunday Read Dairy Professionals Don’t Skip.
Every week, thousands of producers, breeders, and industry insiders open Bullvine Weekly for genetics insights, market shifts, and profit strategies they won’t find anywhere else. One email. Five minutes. Smarter decisions all week.


![Generate SEO elements for this The Bullvine article targeting dairy industry professionals:
ANALYSIS REQUIREMENTS:
Identify the article's primary topic and target audience (dairy farmers, industry professionals, agricultural specialists)
Focus on practical, implementation-oriented keywords that dairy professionals would search for
Consider both technical dairy terminology and business/profitability terms
DELIVERABLES:
1. SEO Keywords (5 keywords):
Create a comma-separated list of relevant keywords mixing:
Primary dairy industry terms (dairy farming, milk production, herd management, etc.)
Technology/innovation terms if applicable (precision agriculture, automated milking, genomic testing, etc.)
Business/economic terms (dairy profitability, farm efficiency, ROI, cost reduction, etc.)
Geographic terms if relevant (dairy industry trends, global dairy, etc.)
2. Focus Keyphrase:
Develop a 2-4 word primary keyphrase that captures the article's core topic and would be commonly searched by dairy professionals seeking this information.
3. Meta Description (under 160 characters):
Write a compelling meta description that:
Summarizes the article's main value proposition
Naturally incorporates the focus keyphrase and 1-2 keywords
Appeals to dairy industry professionals
Includes a benefit or outcome (cost savings, efficiency gains, profit increases, etc.)
Uses action-oriented language that encourages clicks
4. Category Recommendation:
Suggest the most fitting category from The Bullvine website (e.g., Dairy Industry, Genetics, Management, Technology, A.I. Industry, Dairy Markets, Nutrition, Robotic Milking, etc.) where this article should be published for maximum relevance and engagement.
FORMAT REQUIREMENTS: Present results in this exact format:
SEO Keywords: [keyword1, keyword2, keyword3, keyword4, keyword5]
Focus Keyphrase: [primary keyphrase]
Meta Description: [compelling description under 160 characters with natural keyword integration]
Category Recommendation: [Best-fit category from The Bullvine’s options]
DAIRY INDUSTRY CONTEXT: Ensure all elements appeal to dairy farmers, agricultural specialists, and industry professionals seeking practical, profitable solutions for their operations.](https://www.thebullvine.com/wp-content/uploads/2025/09/Google_AI_Studio_2025-09-08T17_37_41.620Z.png)


USDA Proposes Return to ‘Higher-Of’ Method for Fluid Milk Pricing: What It Means for Dairy Farmers
Learn how USDA’s plan to bring back the ‘higher-of’ method for milk pricing might affect farmers. Will this change help dairy producers? Find out more.
The USDA plans to bring back the ‘higher-of’ pricing method for fluid milk, a move intended to modernize federal dairy policy based on a comprehensive 49-day hearing that evaluated numerous industry proposals. This method picks the higher price between Class III (cheese) and Class IV (butter and powder) milk, which could signify a notable shift for the dairy industry. Previously, the 2018 Farm Bill had replaced the ‘higher-of’ system with an ‘average-of’ pricing formula, averaging Class III and IV prices with an additional 74 cents. While switching back might benefit farmers, it also introduces risks like negative producer price differentials in 2020 and 2021. The USDA’s proposal seeks to mitigate these challenges and provide farmers financial gains amidst modern dairy economics’ complexities.
Understanding the Federal Milk Marketing Order (FMMO) System
The Federal Milk Marketing Order (FMMO) system, established in 1937, plays a crucial role in ensuring fair and competitive dairy pricing. It mandates minimum milk prices based on end use, providing price stability for dairy farmers and processors across the U.S. Each FMMO represents a distinct marketing area, coordinating pricing and sales practices.
The ‘higher-of’ pricing method for Class I (fluid) milk has long been integral to this system. It sets the Class I price using the higher Class III (cheese) or Class IV (butter and powder) price, offering a financial safeguard against market volatility. This method ensures dairy producers receive a fair price despite market fluctuations.
However, the 2018 Farm Bill introduced an ‘average-of’ formula, using the average of Class III and IV prices plus 74 cents. While aimed at modernizing milk pricing, this change exposed farmers to greater risk and reduced earnings in volatile periods like 2020 and 2021.
A Marathon Analysis: Unraveling Modern Dairy Policy over 49 Days in Indiana
The marathon hearing in Indiana highlighted the complexities of modern dairy policy. Spanning 49 days, from Aug. 23, 2023, to Jan. 30, it reviewed nearly two dozen industry proposals. This intensive process reflected the sophisticated and multifaceted Federal Milk Marketing Order system as stakeholders debated diverse views and intricate data to influence future milk pricing.
Decoding Dairy Dilemmas: The “Higher-Of” vs. “Average-Of” Pricing Methods
The “higher-of” and “average-of” pricing methods are central to understanding their impact on farmers’ incomes. The “higher-of” process, which uses the greater of the Class III (cheese) price or Class IV (butter and powder) price, has historically provided a safety net against dairy market fluctuations. This method ensured farmers got a better price, potentially safeguarding their income during volatile times. Yet, it increased the risk of negative producer price differentials, which reduced earnings in 2020 and 2021.
On the other hand, the “average-of” method, introduced by the 2018 Farm Bill, calculates the price as the average of Class III and IV prices plus 74 cents. While this seems balanced and predictable, it often fails to deliver the highest financial return when either Class III or IV prices exceed expectations. Farmers have noted that this method might not reflect their costs and economic challenges in volatile markets.
The “higher-of” method often offers better financial outcomes during favorable market conditions but brings increased uncertainty during unstable periods. Conversely, the “average-of” method offers stability but may miss optimal pricing opportunities. This debate within the dairy industry over the best formula to support farmers’ livelihoods continues. Thus, the USDA’s proposal to revert to the “higher-of” method invites mixed feelings among farmers, whose earnings and economic stability are closely tied to these pricing mechanisms.
Examining the Potential Implications of the USDA’s Return to the ‘Higher-Of’ Pricing Method
The USDA’s return to the ‘higher-of’ pricing method, while potentially beneficial, also presents some challenges that the industry needs to be aware of. This approach, favoring the higher Class III (cheese) or Class IV (butter and powder) prices, seems more beneficial than the ‘average-of’ formula. However, deeper insights indicate potential challenges that need to be carefully considered.
The ‘higher-of’ method usually leads to higher fluid milk prices but poses the risk of negative producer price differentials (PPDs). When the Class I price far exceeds the average of the underlying class prices, PPDs can become negative, as seen during the harsh economic times of 2020 and 2021, exacerbated by the COVID-19 pandemic.
Negative PPDs can hit farmers’ financial stability, making it harder to predict income and manage cash flows. This reflects the delicate balance between gaining higher milk prices now and ensuring long-term financial reliability.
The 24-month rolling adjuster for extended-shelf-life milk introduces further uncertainty. Its effect on milk pricing needs to be clarified, potentially causing fluctuating incomes for farmers in this segment.
In conclusion, while the ‘higher-of’ pricing method may offer immediate benefits, risks like negative PPDs and uncertain impacts on extended-shelf-life milk pricing demand careful consideration. Farmers must balance these factors with their financial strategies and long-term sustainability plans.
New Horizons for ESL Milk: Navigating the 24-Month Rolling Adjuster Amidst Market Uncertainties
Under the USDA’s new proposal, regular fluid milk will revert to the ‘higher-of’ pricing. In contrast, extended-shelf-life (ESL) milk will follow a different path. The plan introduces a 24-month rolling adjuster for ESL milk to stabilize prices for these longer-lasting products.
Yet, this change brings uncertainties. Laurie Fischer, CEO of the American Dairy Coalition, questions the impact on farmers. The 24-month adjuster is untested, making it difficult to foresee its effects amid fluctuating market conditions. ESL milk’s unique production and logistics further complicate predictions.
Critics warn that the lack of historical data makes it hard to judge whether this method will help or hurt farmers. There’s concern that it could create more price disparity between regular and ESL milk, potentially straining producers reliant on ESL products. While USDA aims to tailor pricing better, its success will hinge on adapting to real-world market dynamics.
Make Allowance Controversy: Balancing Processor Profitability and Farmer Finances
The USDA also plans to increase the make allowance, a credit to dairy processors to cover rising manufacturing costs. This adjustment aims to ensure processors are adequately compensated to sustain profitability and operational efficiency, which is expected to benefit the entire dairy supply chain.
However, this proposal has drawn substantial criticism. Laurie Fischer, CEO of the American Dairy Coalition, argues that the increased make allowance effectively reduces farmers’ milk checks, disadvantaging them financially.
Pivotal Adjustments and Economic Realignment in Dairy Pricing Formulas
The USDA’s proposal adjusts pricing formulas to match advancements in milk component production since 2000. This update ensures that farmers receive fair compensation for their contributions.
The proposal also revises Class I differential values for all counties to reflect current economic realities. This is essential for maintaining fair compensation for the higher costs of serving the fluid milk market. By reevaluating these differentials, the USDA aims to align the Federal Milk Marketing Order system with today’s economic landscape.
Recalibrating Cheese Pricing: Transition to 40-pound Cheddar Blocks Only
Another critical change in USDA’s proposal is the shift in the cheese pricing system. Monthly average cheese prices will now be based solely on 40-pound cheddar blocks instead of including 500-pound cheddar barrels. This aims to streamline the process and more accurately reflect market values, impacting various stakeholders in the dairy industry.
Initial Reactions from Industry Leaders: Balancing Optimism with Key Concerns
Initial reactions from crucial industry organizations reveal a mix of cautious optimism and significant concerns. The National Milk Producers Federation (NMPF) showed preliminary approval, noting that USDA’s proposal incorporates many of their requested changes. On the other hand, Laurie Fischer, CEO of the American Dairy Coalition, raised concerns about the make allowance updates and the impact of extended-shelf-life milk pricing, fearing it might hurt farmers’ earnings.
Structured Engagement: Navigating the 60-Day Comment Period and Ensuing Voting Procedure
To advance its proposal, USDA will open a 60-day public comment period, allowing stakeholders and the public to share insights, concerns, and support. This process ensures that diverse voices within the dairy industry are heard and considered. Once the comment period ends, USDA will review the feedback to gain a comprehensive understanding of industry perspectives, informing the finalization of the proposal.
Afterward, the USDA will decide based on the collected data and input. However, the process continues with a voting procedure where farmers pooled under each Federal Milk Marketing Order (FMMO) cast votes to approve or reject the proposed amendments. Each Federal Order, representing different regions, will vote individually.
This voting process is crucial, as it directly determines the outcome of the proposed changes. For adoption, a two-thirds majority approval within each Federal Order is required. Suppose a Federal Order fails to meet this threshold. In that case, USDA may terminate the order, leading to significant changes in how milk pricing is managed in that region. This democratic approach ensures that the final policies reflect majority support within the dairy farming community, aiming for fair and sustainable outcomes.
Regional Impacts: Navigating the Complex Landscape of FMMO System Changes
The proposed changes to the Federal Milk Marketing Order (FMMO) system are bound to impact various regions differently, given each Federal Order’s unique economic landscape. Federal Order 1, covering most New England, eastern New York, New Jersey, Delaware, southeastern Pennsylvania, and most of Maryland, may benefit from more favorable fluid milk pricing due to the higher-of method. With significant urban markets, this region could see advantages from updated Class I differential values addressing the increased costs of serving these areas.
On the other hand, Federal Order 33—encompassing western Pennsylvania, Ohio, Michigan, and Indiana—might witness mixed outcomes. This area has substantial dairy manufacturing, especially in cheese and butter production, which could gain from the new cheese pricing method focusing on 40-pound cheddar blocks. However, the higher make allowance might stir controversy, potentially cutting farmers’ earnings despite adjustments for rising manufacturing costs.
The future remains uncertain for western New York and most of Pennsylvania’s mountain counties, which any Federal Order does not cover. These areas could feel indirect effects from the new proposals, particularly the revised pricing formulas and allowances, which could impact local milk processing and producer price differentials.
While the higher-of-pricing method may benefit farmers by securing better fluid milk prices, the regional impacts will hinge on each Federal Order’s specific economic activities and market structures. Stakeholders must examine the proposed changes closely to gauge their potential benefits and drawbacks.
The Bottom Line
The USDA’s push to reinstate the ‘higher-of’ pricing method for fluid milk marks a decisive moment for the dairy industry. The 49-day hearing in Indiana underscored the complexity of the Federal Milk Marketing Order (FMMO) System. Key aspects include reverting to the ‘higher-of’ pricing from the 2018 ‘average-of’ formula, new pricing for extended-shelf-life milk, and the debate over increased make allowances. Significant updates to pricing formulas and cheese pricing methodologies were also discussed.
The forthcoming vote on these changes is critical. With the power to reshape financial outcomes for dairy farmers and processors, each Federal Order needs two-thirds approval to implement these changes. Balancing modern dairy policy advancements with fair profits for all stakeholders is at the heart of this discourse.
Ultimately, these decisions will affect dairy practices’ economic landscape and sustainability nationwide. This vote is a pivotal moment in the evolution of the American dairy industry, demanding informed participation from all involved.
Key Takeaways:
Summary:
The USDA plans to reintroduce the ‘higher-of’ pricing method for fluid milk, a move aimed at modernizing federal dairy policy. This method, which selects the higher price between Class III and Class IV milk, could be a significant shift for the dairy industry. The 2018 Farm Bill replaced the ‘higher-of’ system with an ‘average-of’ formula, averaging Class III and IV prices plus an additional 74 cents. This change could benefit farmers but also introduce risks like negative producer price differentials (PPDs). The Federal Milk Marketing Order (FMMO) system ensures fair and competitive dairy pricing, and the ‘higher-of’ method usually leads to higher fluid milk prices but also poses the risk of negative producer price differentials (PPDs). Negative PPDs can impact farmers’ financial stability, making it harder to predict income and manage cash flows. The 24-month rolling adjuster for extended-shelf-life milk introduces further uncertainty, potentially causing fluctuating incomes for farmers. The USDA’s proposal to increase the make allowance, a credit to dairy processors, has been met with criticism from industry leaders. The USDA will open a 60-day public comment period to advance its proposal. The proposed changes to the FMMO system will impact various regions differently due to each Federal Order’s unique economic landscape.
Learn more: