The tank’s back. Your SPC is still 0.5 higher. That’s H5N1’s second bill—it shows up 90 days after you think you’re done. Most herds miss it.
Executive Summary: H5N1’s first bill is the milk crash everyone sees. The second bill—services per conception jumping 0.3–0.5 above baseline—shows up 90 days later, after you think you’re done. Cornell research on a 3,900-cow Ohio herd shows why: 89% of cows seroconverted, but 76% never looked sick. Their immune response still damaged the eggs maturing during the outbreak—the same eggs you breed weeks later. Texas A&M’s preliminary data confirms the pattern: heifer SPC climbing from 1.5 to 2.0 and holding into 2025. For a 1,000-cow herd, that hidden jump can mean $7,500–$10,000 per quarter in extra semen, labor, and days open. Your real ‘all clear’ isn’t when the tank recovers—it’s when your rolling SPC returns to your 12-month baseline, and you should be managing breeding decisions around that 90-day window until it does.
When H5N1 hits your dairy, everybody watches the tank. Milk drops hard, cows look rough, and for a few weeks, it’s all about getting through the crash. Two months later, the bulk tank creeps back, the hospital pen thins out, and it’s tempting to say you’re “through it.”
You might not be. Early U.S. herd data suggest one of the easiest costs to miss from H5N1 shows up 60–90 days later, when services per conception climb by roughly 0.3–0.5 above your own 12-month baseline and stay there. For a 1,000-cow herd, that kind of fertility drag adds up fast once you factor in extra semen, extra days open, and extra labor. The example further down walks through what that 0.5 SPC bump can mean when you plug in your own prices.
This is a playbook for treating H5N1 as both a 60-day milk event and a 90-day fertility-and-economics event.
From Milk Crash to Fertility Drag: What Changed After 2024
Once H5N1 jumped into U.S. dairy cattle in 2024, the early focus was all about sick cows and lost milk. A Cornell-led investigation of a large freestall herd in Ohio—about 3,900 milking cows during a 2024 outbreak window—put numbers to what many herds felt.
- About 20% of adult cows showed clear clinical disease: off feed, reduced rumination, thick colostrum-like milk.
- Those clinically affected cows lost roughly 900 kg of milk per cow over 60 days—about a full metric ton per cow.
- Serology showed 89.4% of cows had neutralizing antibodies to H5N1, and 76.1% of seropositive cows had never shown clinical signs.
For every obviously sick cow you were treating, several more were fighting the virus under the radar.
| Metric | Total Herd | Clinically Affected | Subclinical (Silent) | Key Takeaway |
| Cows in study | 3,900 | ~780 (20%) | ~2,965 (76% of seropositive) | Most infected cows never looked sick |
| Seroconverted | 89.4% | 100% (by definition) | 76.1% of seropositive showed no signs | You bred their damaged eggs weeks later |
| Milk loss per cow | Variable | ~900 kg over 60 days | Unknown, likely moderate | The visible cost everyone saw |
| Fertility impact | Emerging data | Likely high | Likely high—same immune response | The hidden cost most herds missed |
Federal and state responses framed the risk for U.S. dairies in 2024–2025:
- In cattle, H5N1 is milk-centric. Virus levels are highest in milk and mammary tissue, not in the lungs.
- The milking parlor is a primary within-herd engine: clusters, gloves, sleeves, floors, and drains get coated in milk from infected cows.
- A USDA Federal Order effective April 29, 2024, requires testing of lactating dairy cows before interstate movement, a 30-day hold and re-test on positives, and reporting of results.
- In December 2024, USDA began rolling out a National Milk Testing Strategy, using plant silo and bulk tank samples to detect H5N1 and help define each state’s herd status.
That’s the disease-control picture. The fertility story is quieter but just as expensive over time.
In the Ohio herd, almost nine out of ten cows were infected, but most never looked sick. Their immune systems are still switched on. Their ovaries and developing eggs remained in an inflammatory environment for a period of time. If you only track the milk crash, you miss the 90-day fertility hit that shows up later on your repro report.
The Repro Signal: When SPC Jumps and Doesn’t Come Back Down
We don’t yet have a shelf full of peer-reviewed H5N1 fertility papers. But enough is coming out of Texas A&M and other projects to treat this as a real risk, not just a bad-luck year.
In a January 2026 episode of The Dairy Podcast Show, Dr. Jennifer Spencer and Dr. Juan Piñeiro from Texas A&M AgriLife walked through preliminary results from a USDA-funded project on H5N1 and reproduction. They’re analyzing herd records from 2021 onward for multiple Western and South-Central U.S. dairies, comparing pre-outbreak, outbreak, and post-outbreak periods.
For one South-Central herd, they discussed:
Heifers
- Conception rate dropped by about 5 percentage points between March and December 2024—the herd’s outbreak window.
- Services per conception climbed from around 1.5 up to roughly 2.0 in that same period, and those higher SPC levels still appeared in 2025.
Cows
- Conception rates declined across parities during the outbreak.
- First-lactation and 3rd-plus cows appeared to recover toward pre-outbreak levels in 2025, but second-lactation cows lagged—likely because those cows were heifers during the outbreak.
Spencer’s been clear that this is retrospective data with lots of moving parts—semen strategy, heat-detection tools, breeding crew, heat stress, ration tweaks. No one’s saying H5N1 is the only cause. The point is that the pattern—especially that 0.5 SPC jump that doesn’t fall back quickly—lines up with what we know about inflammation and oocyte development.
Treat these herd-level patterns as early warning signals, not final verdicts. But if your heifer SPC goes from 1.7 to 2.2 and sits there for a quarter, you don’t need a PhD to know that’s expensive. The real decision is whether you write it off as “one of those years” or treat it as a risk you plan for.
Why the Real Damage Shows Up 60–90 Days Later
The lag between the outbreak and the fertility hit makes sense once you consider how much fuel the immune system burns—and what inflammation does within a follicle.
Inflammation Burns Glucose and Pushes Repro Down the Priority List
An activated immune system is a glucose hog. In a controlled endotoxin challenge, researchers showed that an acutely stimulated immune system in lactating Holsteins can burn more than 1 kg of glucose in 12 hours. That’s glucose that doesn’t go into milk synthesis, hormone production in the ovary, or oocyte and embryo development.
Years of transition-cow work tell the same story. Cows with high NEFA, elevated ketones, and higher inflammatory markers around calving have more trouble cycling, more uterine disease, and lower conception rates. H5N1 drags that biology into mid-lactation instead of just the fresh pen.
Inside the Follicle: Eggs That Look Fine but Were Never Right
Follicles aren’t sealed tanks. Granulosa and theca cells in the follicle express Toll-like receptor 4 (TLR4), so they respond to inflammatory stimuli by producing cytokines directly into the follicular fluid.
In bovine oocyte models in which researchers add LPS or simulate inflammation, they observe abnormal meiotic spindles and misaligned chromosomes, fewer oocytes completing normal nuclear maturation, disrupted cortical granule distribution, and increased oxidative stress and apoptosis.
In plain English: you can have an egg that ovulates on time, in a heat that looks great, that never really had a chance.
The cow’s reproductive system doesn’t automatically weed out that egg. Dominant follicles are selected for estradiol output and hormone responsiveness, not some deep quality-control inspection of the egg’s chromosomes. So yes—sometimes the “junk egg” is the one you breed.
Timing: Today’s Outbreak, Next Month’s Open Cows
Oocyte development is slow. An egg spends roughly 60–80 days progressing from early growth to readiness to ovulate.
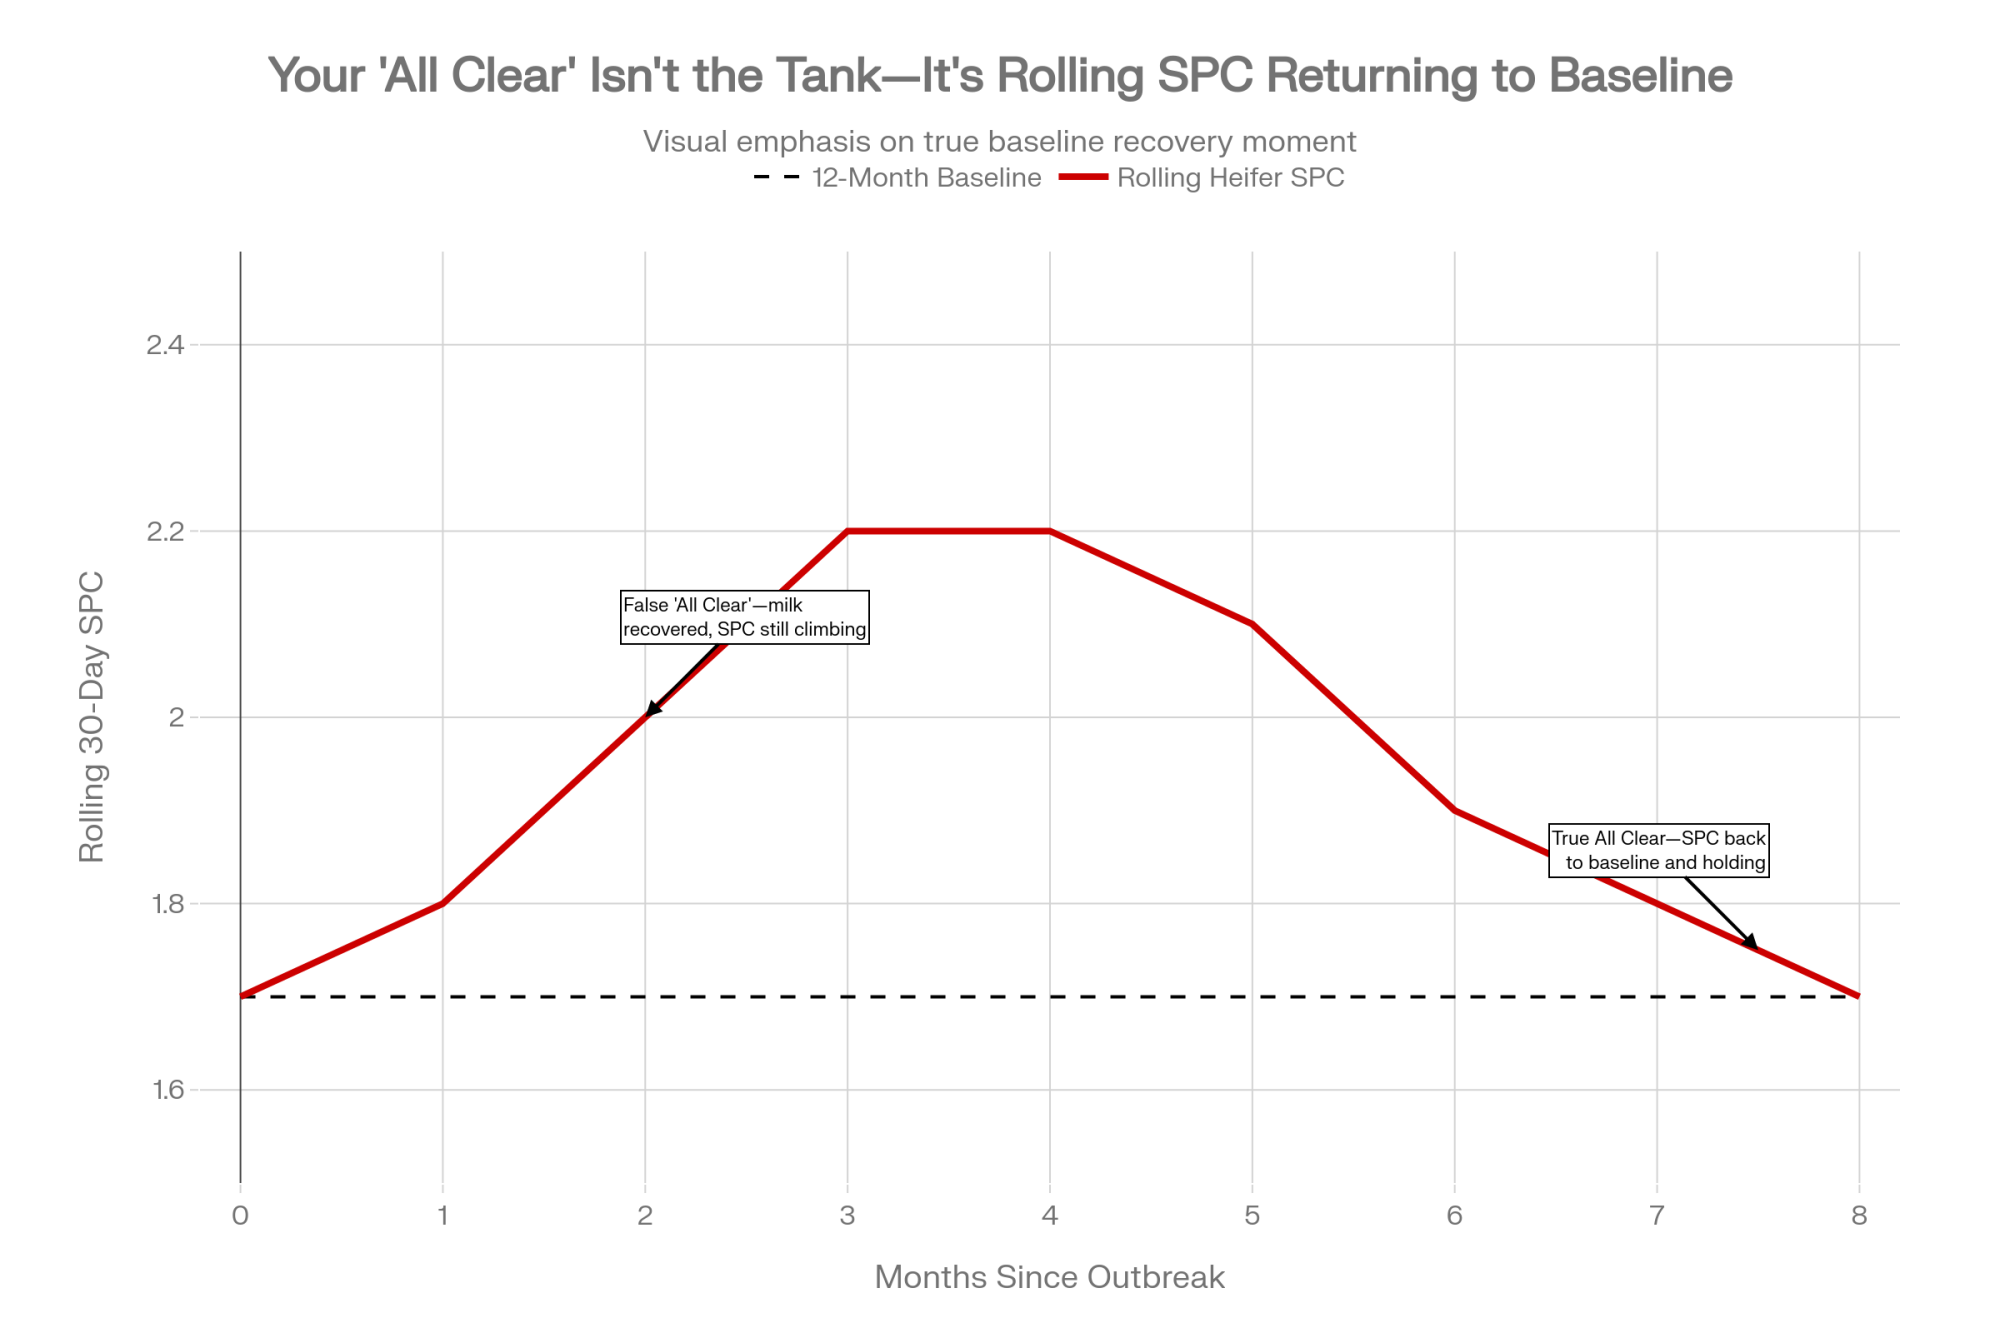
So when your herd goes through a big inflammatory hit like H5N1, the eggs you’re breeding two to three cycles later were maturing during that outbreak. That’s when SPC rises, and early embryo loss shows up, even though the tank and the hospital pen look much better.
That’s the same kind of lag Spencer’s team is seeing in the records: outbreak in 2024, repro performance dipping during it, and higher SPC persisting into 2025 for at least one heifer cohort. On paper, it just looks like a rough year. On your bank statement, it’s a hidden fertility bill that shows up long after the milk recovers.
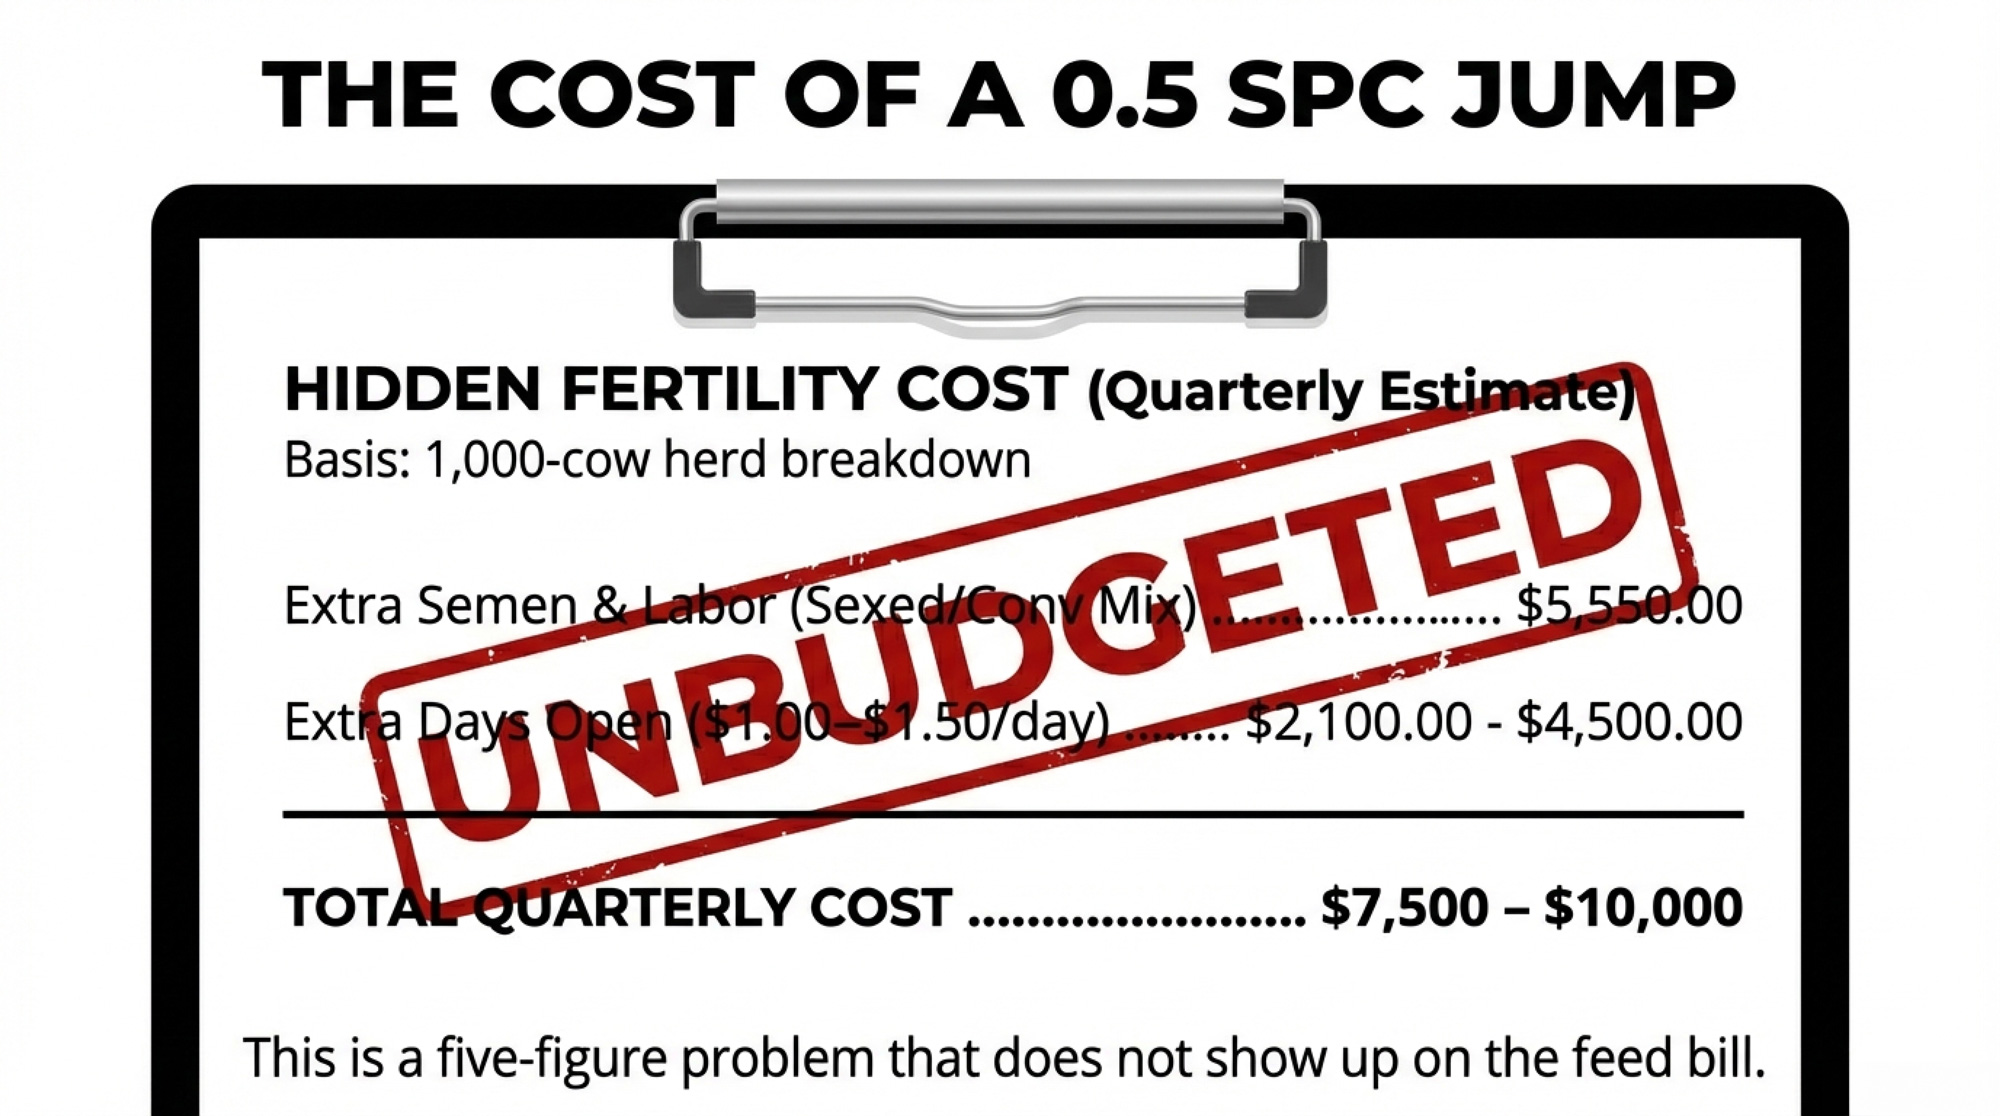
What a 0.5 SPC Jump Really Costs
Let’s put some structure around the math.
Picture a 1,000-cow U.S. herd with about 450 milking cows eligible to breed over a three-month window, baseline heifer SPC around 1.7, and cow SPC around 2.5, and a confirmed H5N1 outbreak in April. By June, milk looks close to normal.
By August, your repro report shows heifer SPC up from 1.7 to 2.2, second-lactation SPC up from 2.5 to 3.0, and that patternis holding for at least three months.
That 0.5 SPC increase means you’re using about half an insemination more per pregnancy in those groups.
Recent work from the University of Kentucky uses a decision-support dashboard to model the cost of extra days open under different herd conditions. With their default assumptions, they report cost per day open ranging from about $0.31 to $1.51 across lactations. They also point out that the old rule of thumb—$3–5 per day open—can easily overshoot or undershoot the true cost for a specific herd.
On the semen side, economic simulation work on beef and dairy semen strategies often uses semen prices of about $15 per conventional or beef dose and $35 per Holstein sex-sorted dose, with labor cost around $10 per insemination. That puts per-service cost in the roughly $25–45 range, depending on semen type.
Illustrative Example: 300 Pregnancies in a Post-Outbreak Window
Plug in your own prices and cow counts.
| Input | Value |
| Group size | 200 heifers + 200 second-lactation cows |
| Baseline SPC | 1.7 (heifers), 2.5 (2nd-lactation) |
| Post-H5N1 SPC | 2.2 (heifers), 3.0 (2nd-lactation) |
| Pregnancies targeted | 300 |
| Cost Category | Calculation | Low Estimate | High Estimate |
| Extra services needed | 0.5 SPC × 300 pregnancies | 150 services | 150 services |
| Sexed semen (60%) | 90 services × ($35 + $10 labor) | $4,050 | $4,050 |
| Conventional (40%) | 60 services × ($15 + $10 labor) | $1,500 | $1,500 |
| Total semen + labor | — | $5,550 | $5,550 |
| Extra days open | 300 pregnancies × 7–10 days | 2,100 days | 3,000 days |
| Days open cost | At $1.00–$1.50/day | $2,100 | $4,500 |
| TOTAL added cost (90 days) | — | $7,650 | $10,050 |
| Annualized (4 quarters) | — | ~$30,600 | ~$40,200 |
Your real number could be lower or higher depending on how much SPC actually moved, your semen mix, and your milk price, feed costs, and replacement value.
The point isn’t to argue over the exact dollar. It’s to get a handle on what your last H5N1 event might already have taken out of your repro program—and whether you want to go into the next one without a plan.
Turn H5N1 into a 90-Day Fertility Project
You can’t control when H5N1 shows up in your neighborhood. You can control whether you treat it as a one-time milk wreck or as a 90-day reproduction and cash-flow problem with a plan behind it.
Map Your Outbreak Window and Your 90-Day “Egg Window.”
Start by pinning down when the herd was actually sick, not just when you got a lab result.

Use milk and rumination deviations to mark when cows started to fall off their norms. Layer in clinical logs and any rapid test positives from the parlor or hospital pen.
From there, define a 90-day “high-risk egg” period starting at the heart of that outbreak window. For cows and heifers on the farm during that time, assume the eggs you’re breeding in those 90 days were maturing during the inflammatory event.
That’s the window where you treat breeding differently.
Tighten Breeding Eligibility and Semen Use
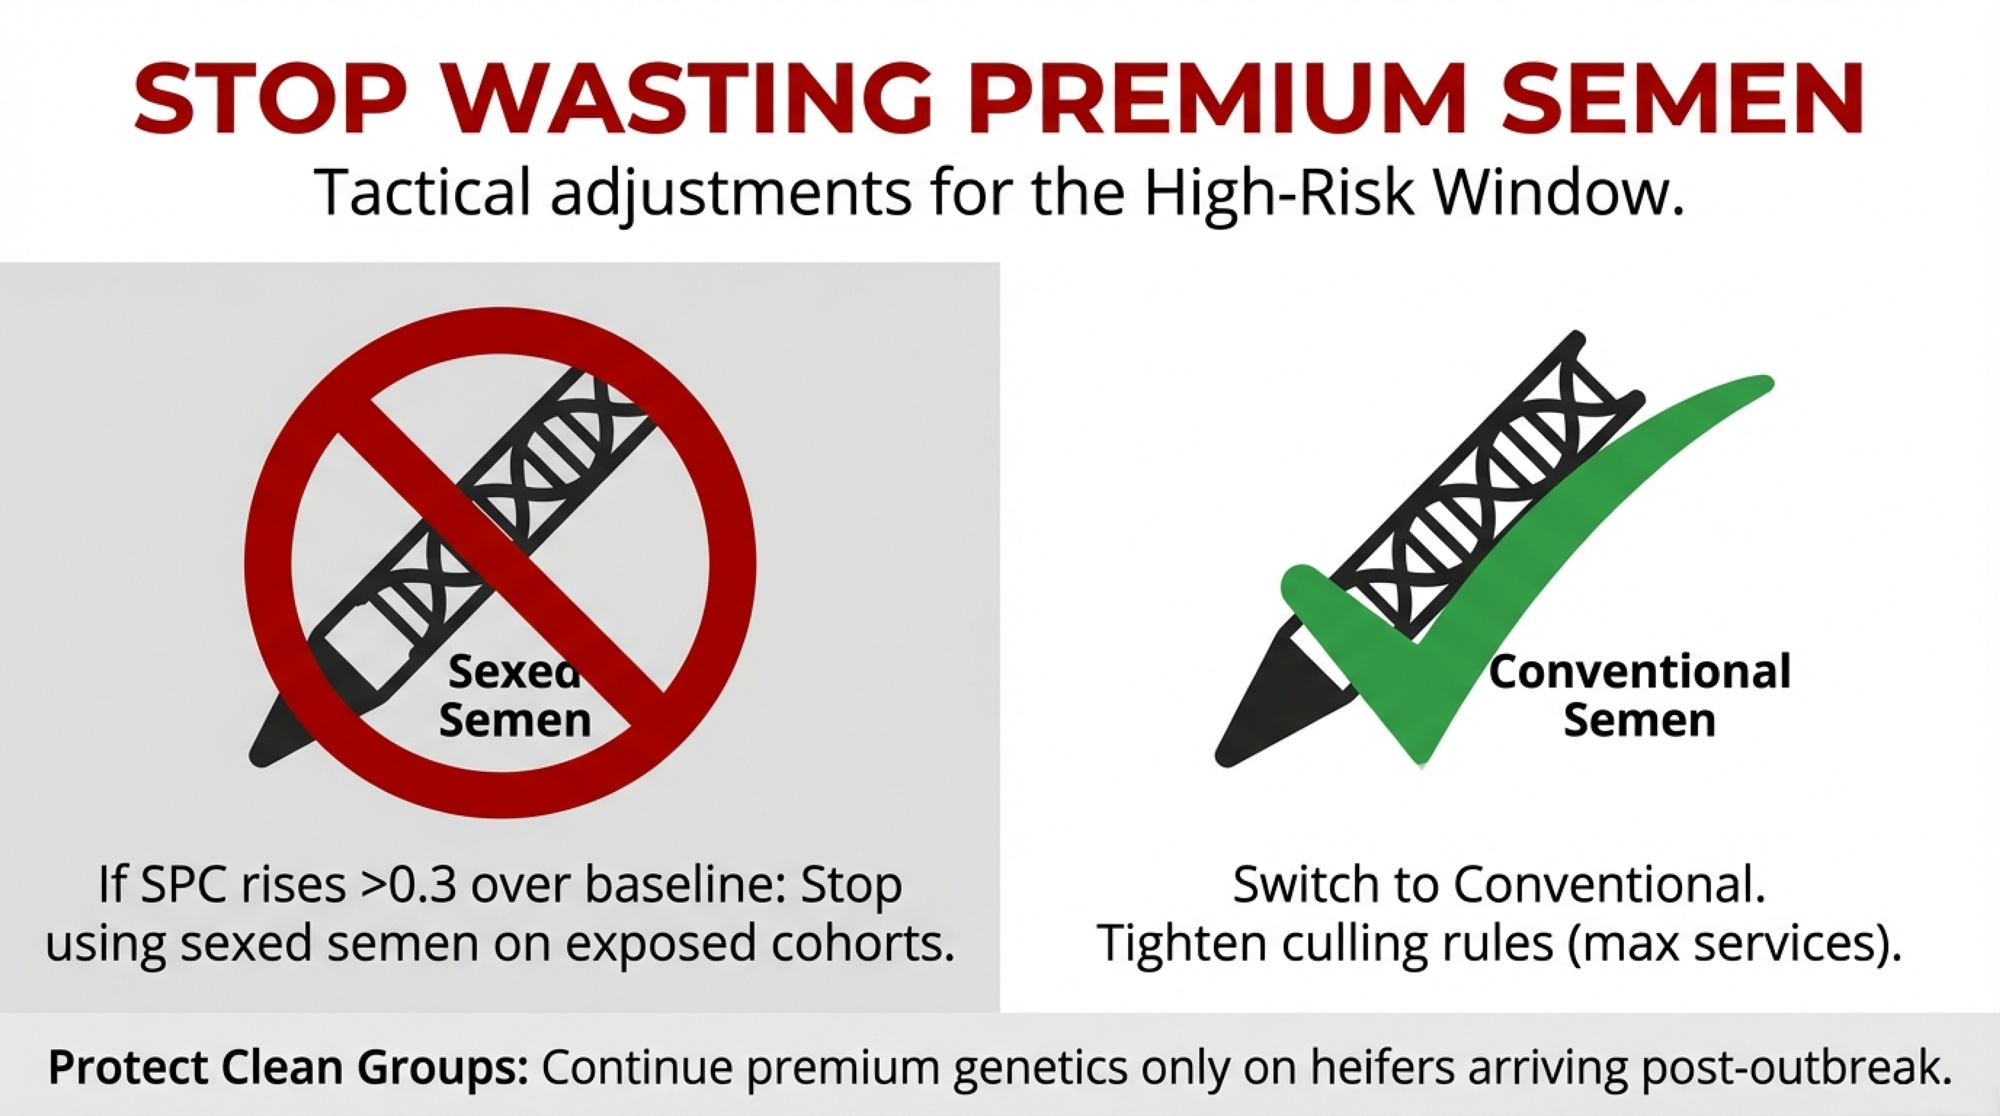
| Breeding Decision | Exposed Cohorts (On-Farm During Outbreak) | Clean Cohorts (Arrived After Outbreak) |
| Eligibility | Only strong heats or well-managed timed AI; skip thin, lame, or recently sick cows | Standard breeding eligibility |
| Semen strategy (heifers) | Switch to conventional when SPC >1.8 | Continue sexed semen (baseline SPC 1.5–1.7) |
| Semen strategy (cows) | Switch to conventional when SPC >2.8 | Continue herd protocol (sexed on 1st/2nd service) |
| Max services before culling decision | Heifers: 3–4 max; Cows: 3 max | Standard herd protocol (typically 4–5) |
| Monitoring frequency | Weekly SPC by group; flag if >0.3 above baseline | Monthly standard repro reports |
| Protocol duration | 90 days from outbreak peak, or until rolling SPC returns to baseline | Ongoing baseline protocol |
During that 90-day window, you’ve got three levers: who you breed, what semen you use, and how many chances each animal gets.
- Who gets bred: Don’t breed thin, lame, or recently sick cows unless you’ve got a strong reason. Focus on strong, clear heats, or cows on well-designed timed AI programs where you’re confident in ovulation timing.
- What semen you use: For exposed heifers and first-/second-lactation cows, a practical trigger to rethink semen strategy is when SPC in that group rises about 0.3 or more above your own 12-month baseline, or first-service conception drops several points below that baseline. Once you cross either threshold, it’s reasonable to move those exposed cohorts from sexed to conventional semen for the rest of the 90-day window. Keep using sexed semen on your “cleaner” cohorts—heifers that arrived after the outbreak, or groups whose SPC hasn’t budged.
- How long you keep trying: Set parity-specific limits for maximum services—say three or four for heifers and three for older cows—and stick to them. After that, those cows become replacement and cash-flow decisions, not just repro projects.
You gain tighter control over semen and days-open costs in that high-risk window. You give up some flexibility and some genetic progress in exposed cohorts. That’s the trade-off.
Your “All Clear” Is in Your Rolling SPC
Because most H5N1 infections are subclinical, you’ll never pick out every exposed cow by eye. Your best early warning lives in your group-level repro trends.
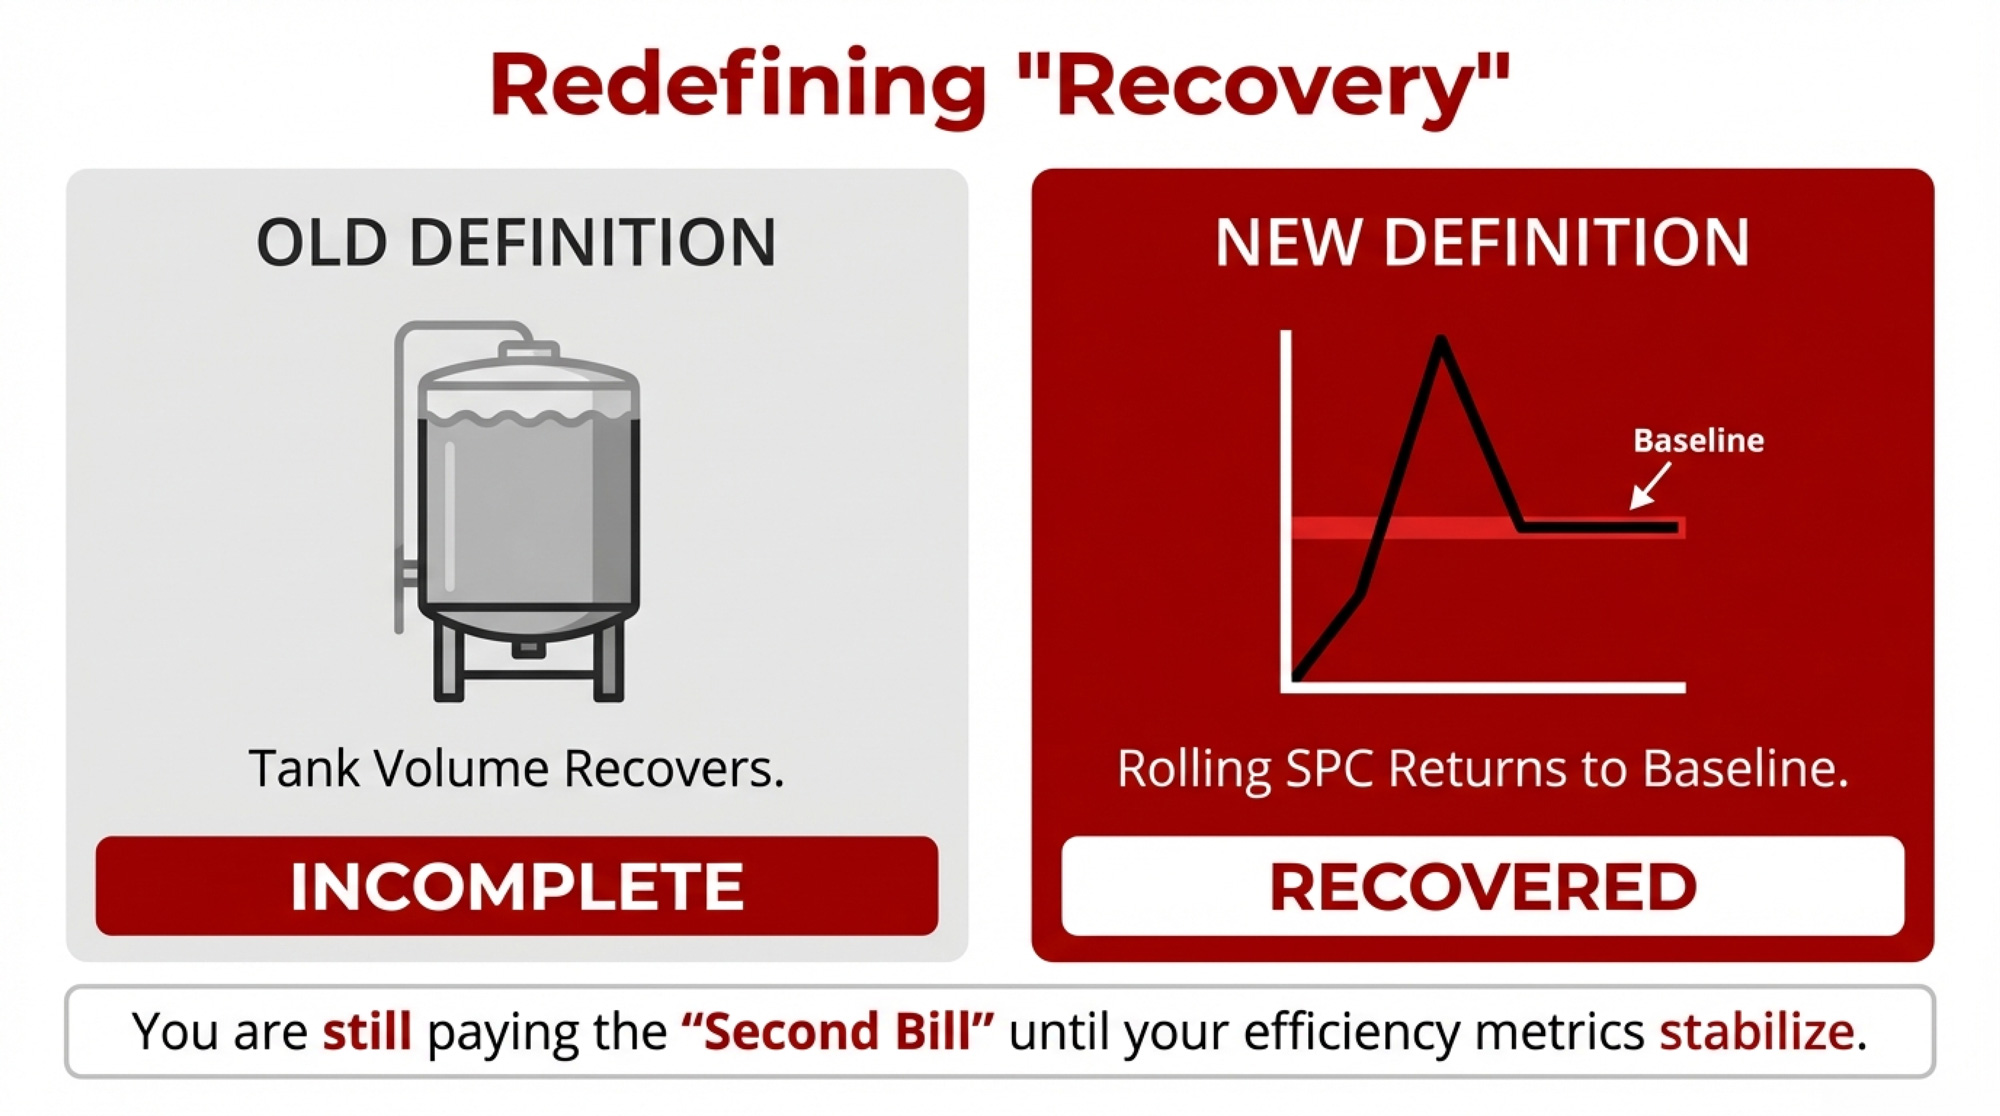
By heifers and each parity group, track services per conception, 21-day pregnancy rate, and first-service conception rate.
A practical way to flag potential H5N1 fertility risk: watch for SPC in any group rising about 0.3–0.5 above your own 12-month baseline. See if that pattern sticks around for at least three months. Pay special attention if it starts roughly 60–90 days after an H5N1 outbreak window.
Here’s the important part: your “All Clear” isn’t when the cows look better, or the tank recovers. For practical management, it’s when your rolling SPC average for that group comes back to its 12-month baseline and holds there for a sustained period. Until that happens, you should assume you’re still paying some level of fertility cost from that earlier inflammatory hit.
If the timing and pattern look H5N1-related, turn on your 90-day breeding rules for exposed cohorts, reallocate sexed semen away from those groups, and revisit max services and culling thresholds with your vet and your lender.
Make Parlor Biosecurity Part of Your Cost of Production
Multiple investigations have found H5N1 viral RNA on milking-related surfaces—equipment, floors, drains—and in milk samples from affected dairies. That’s why USDA, AVMA, and others keep coming back to the parlor as a major within-herd driver.
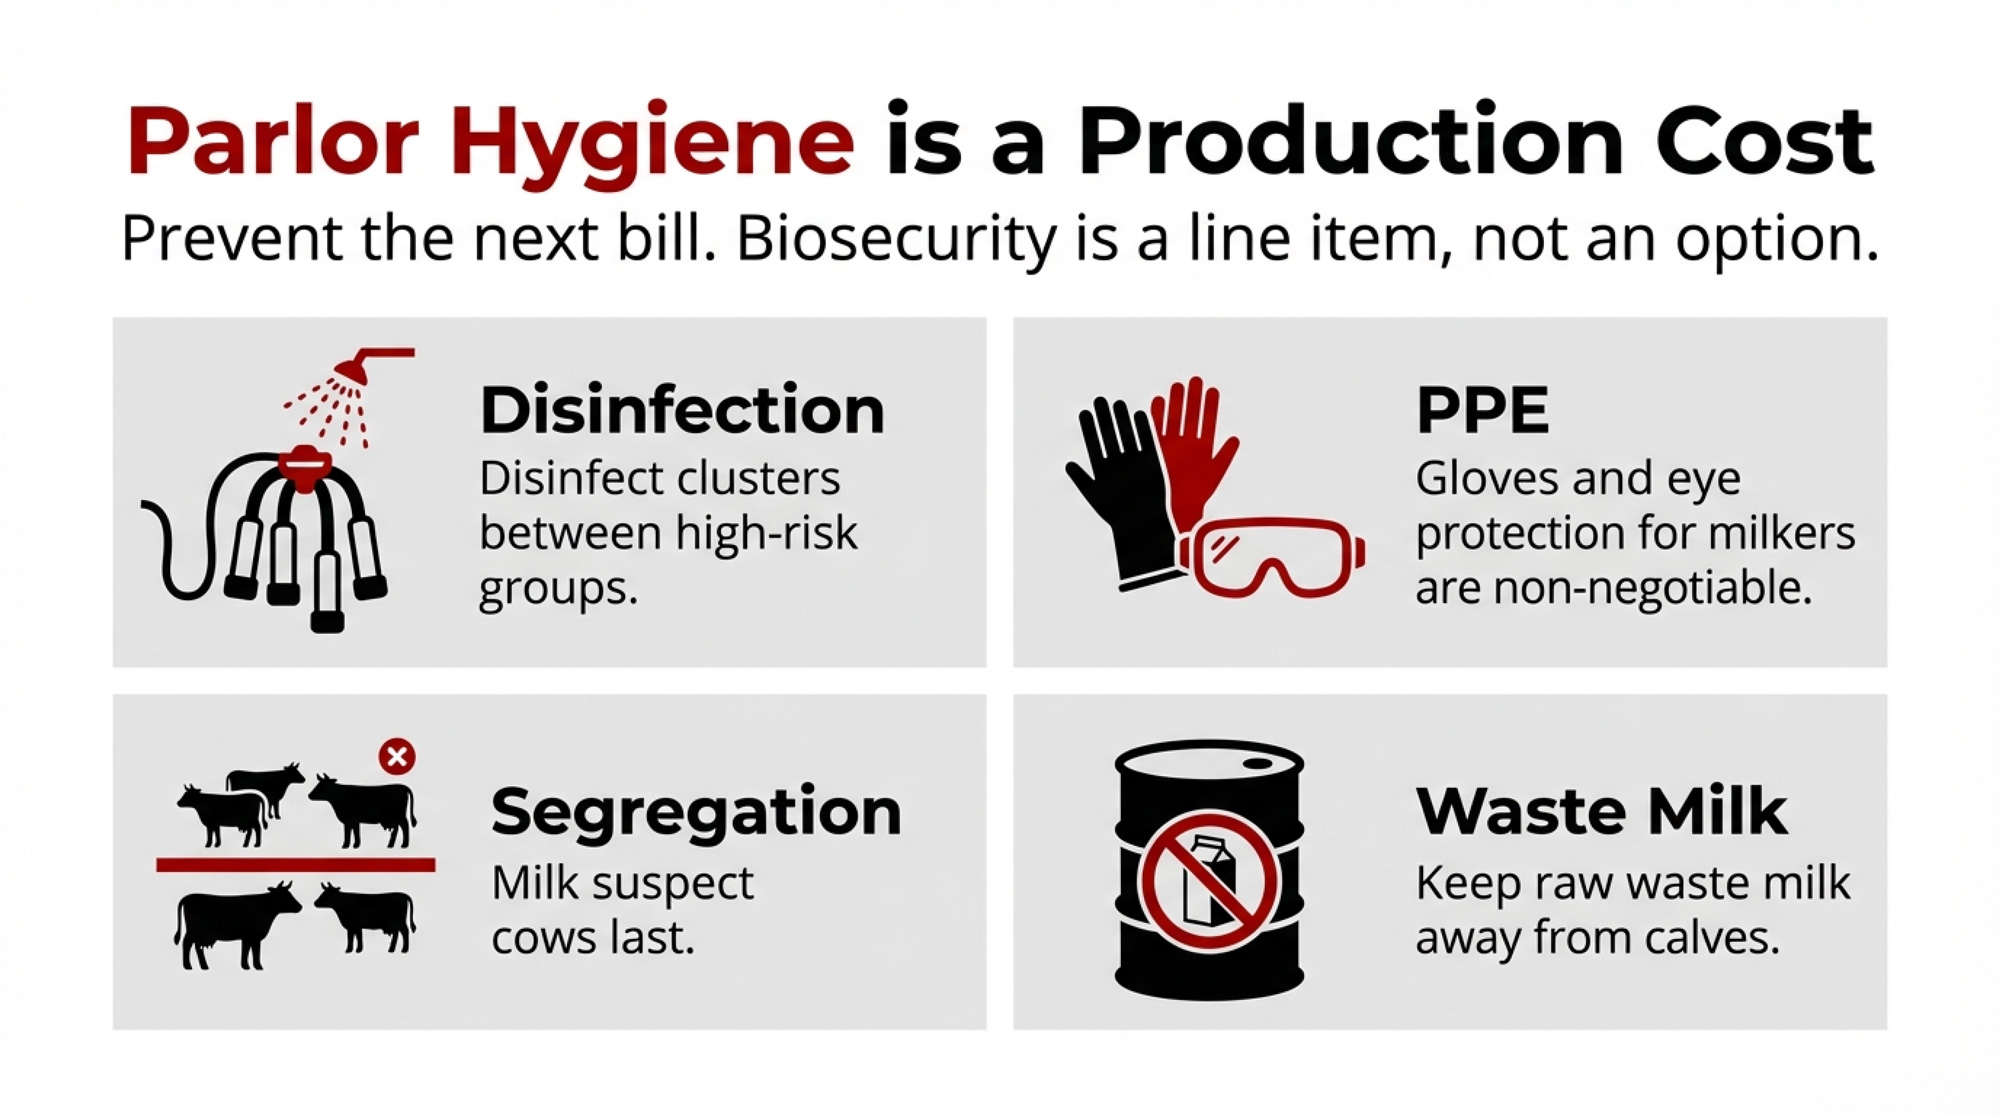
If you’ve had one event or you move cows between states, parlor biosecurity is no longer optional. It’s part of your production costs in an H5N1 world.
Milking order and grouping: Milk suspect or confirmed-positive cows last, as a separate group. Where possible, dedicate equipment to that group, or run a full hot wash and disinfection before returning it to the main herd.
Cluster and glove hygiene: Disinfect clusters with a proven virucidal product between high-risk cows or groups, not just a quick rinse. Make gloves standard and change them when you move between hospital/suspect cows and the main herd.
Waste milk handling: Keep raw waste milk out of calf diets and away from other livestock; the FDA, CDC, and USDA have all flagged this as a risk. Dispose of or treat waste milk so birds, boots, and tires don’t carry it across your facility.
Milker safety: Protect milkers’ eyes and airways from milk splashes around suspect cows. At least one U.S. dairy worker developed eye symptoms after exposure to infected cattle, and researchers are still studying exactly how those exposures occur. Build eye protection and basic respiratory protection into your standard parlor PPE whenever you’re milking suspect or confirmed cows—treat this as part of the same biosecurity package, not an afterthought.
Here, you trade some extra labor, disinfectant, PPE, and training against the odds of another outbreak—with both a milk crash and a 90-day repro hit attached.
Use Testing and Herd Status as Business Tools
USDA’s Federal Orders and the National Milk Testing Strategy aren’t just regulatory headaches. They shape your risk profile and your market access.
National Milk Testing Strategy (NMTS): Uses plant silo and bulk tank testing to detect H5N1 in milk and trace positives back to source herds.
Federal Orders for H5N1 in Livestock: Require pre-movement testing for lactating dairy cows that cross state lines. Mandate reporting of positive herds and enable enhanced surveillance in affected states.
In parallel, industry and animal-health groups are exploring formal herd-status concepts that link regular testing to a “low-risk” or “unaffected” designation. There isn’t a single national label yet, but the idea is becoming more common as milk testing expands.
From a business angle: if you sell replacements or move cows regularly, investing in testing and a documented herd status can be a marketing edge and a risk-management tool, not just a regulatory cost. If you’re buying, you’ll increasingly want some kind of herd-status information so you’re not importing another farm’s H5N1 and fertility problems.
In practice, you’re choosing between paying for tests and coordination up front, or accepting a higher chance of paying for another outbreak and another 90-day fertility hangover.
Peer-reviewed fertility papers are still in the pipeline—but the early signals are consistent enough to act on
Signals to Watch in 2026
Looking out over the next couple of years, a few signals will tell you how big a line item H5N1 becomes in your repro budget.
High exposure, quiet infection. The Ohio herd’s almost 90% seroprevalence and 76.1% subclinical rate show how fast the virus can move through a herd once it gets in.
Tight replacement pool, steady flow of naïve heifers. U.S. inventory data in 2023–24 showed fewer cull cows going to slaughter and pressure on replacement supplies as producers tried to maintain cow numbers. That means a constant stream of young, naïve animals entering herds that may still pose an environmental H5N1 risk.
Economics lens widening. The first wave of coverage focused on per-cow milk loss during outbreaks. More recent analyses focus on the long-term production costs, replacement needs, and regional competitiveness if H5N1 becomes an ongoing risk rather than a one-off scare.
No one can tell you exactly how long H5N1 stays in the dairy picture. But ongoing detections and expanded milk testing make it realistic to treat it as a continuing risk factor in 2025–26, not just a bad spring in 2024.
The herds that end up ahead are likely to be the ones that fold H5N1 into their repro strategy, parlor routines, and movement decisions now—rather than hoping 2023 conditions come back.
What This Means for Your Operation
Here’s how to turn all of this into specific checks and decisions on your own place.
Pull 18–24 months of repro data by group. For heifers, 1st-, 2nd-, and 3rd+-lactation cows, chart services per conception, 21-day pregnancy rate, and first-service conception rate. Mark the likely H5N1 outbreak window based on milk/rumination dips and any test positives.
Look for the 0.3–0.5 SPC jump 60–90 days later. If SPC in a group rises about 0.3–0.5 above your 12-month baseline and holds there for three months, starting 60–90 days after that outbreak window, don’t write it off as noise. Treat it as a signal to dig into causes, including H5N1.
Define your “All Clear” using rolling SPC. Commit to using your rolling SPC average—not just how the cows look or how the tank reads—as your real “All Clear.” For each group, you’re not truly back to normal until the rolling SPC returns to the 12-month baseline and stays there.
Write down your 90-day breeding rules now. With your vet and repro advisor, decide ahead of time which animals stay eligible to breed in that high-risk 90-day window, when exposed cohorts switch from sexed to conventional semen, and how many services each parity gets before you turn that cow into a culling and replacements discussion.
Run your own example math. Take the example structure above and plug in your SPC change by group, your number of pregnancies in the window, your actual semen and breeding labor costs, and a day-open range that fits your milk price and feed cost assumptions. That gives you a real dollar range for what H5N1-linked repro shifts may already be costing.
Walk your parlor like the virus is watching. Do one focused walkthrough with nothing on the agenda except milk contact surfaces, people flow, waste-milk handling, and milker PPE. Pick two or three biosecurity and safety steps you’ll keep in place all the time, not just during an obvious outbreak.
Decide where testing and herd status fit your cash-flow plan. If your business relies on selling replacements, buying cows, or crossing state lines, talk with your state vet, co-op, or processor about how NMTS and herd-status ideas apply to you, and what it would take to be viewed as a lower-risk supplier.
The Bottom Line
H5N1 is a 60-day milk event and a 90-day fertility event. You’re not really “through it” until SPC and pregnancy rates come back to your 12-month baseline, especially for heifers and second-lactation cows.
Subclinical cows still cost you. In the Ohio herd, most infected cows never appeared sick, yet they still seroconverted and likely experienced inflammatory stress that can damage developing eggs.
A 0.3–0.5 SPC rise is a management trigger, not background noise. When that bump shows up 60–90 days after an H5N1 outbreak and sticks for a few months, it’s time to tighten the breeding strategy and run the economic math.
Your real “All Clear” is in your rolling SPC. The visual recovery is nice, but the economic recovery starts when your rolling SPC averages return to baseline and hold there.
Parlor biosecurity, milker safety, and herd status are now part of your cost of production. You can pay for protocols and testing up front, or you can pay later in milk loss, fertility hits, replacement holes, and market-access risk.
Here’s the hard truth: for herds that have already been through an outbreak, H5N1 effectively becomes a line item in both your milk sheet and your repro budget. You can either put some planning, testing, and parlor discipline behind that 90-day fertility window, or you can keep paying for H5N1 in hidden fertility and replacement costs long after your bulk tank looks “normal” again.
Next time you pull up your repro report, take a hard look at your heifer and second-lactation SPC curves. Are they telling you that your last “finished” outbreak is still quietly on the books?
Key Takeaways
- H5N1’s second bill arrives 90 days late. SPC climbs 0.3–0.5 above baseline after the milk recovers—and stays elevated. Most herds miss it.
- Subclinical cows still cost you. In the Ohio herd, 76% of infected cows never looked sick. You bred their damaged eggs weeks later.
- That 0.5 SPC jump? Roughly $7,500–$10,000/quarter for a 1,000-cow herd in extra semen, labor, and days open. Plug in your own numbers.
- Your “all clear” is rolling SPC, not the bulk tank. Manage exposed heifers and second-lactation cows differently until SPC returns to your 12-month baseline and holds.
- Biosecurity and testing now pay for themselves. The alternative: another outbreak, another milk crash, another 90-day fertility bill.
Complete references and supporting documentation are available upon request by contacting the editorial team at editor@thebullvine.com.
Learn More
- 700+ Herds Infected, Export Markets Watching: The Biosecurity Math Every Dairy Should Run – Arms you with a tactical 90-day audit preparation strategy that secures export market access. You’ll gain a concrete compliance budget and specific parlor protocols that prioritize long-term profitability over the 2-5x cost of a clinical outbreak.
- Biology Repriced Dairy: $4,000 Heifers Created a 90-Day Window When You Have Leverage, Not Processors– Exposes the structural shift in replacement heifer inventory that will dictate dairy margins through 2027. This strategy reveals how to leverage current biological scarcity to negotiate better processor contracts and protect your operation’s future equity.
- The H5N1 Bailout Problem: Why Some Farms Keep Getting Hit While Others Pay the Price – Delivers an aggressive look at turning federal disaster relief into upgrade capital for disruptive sensor technologies. It breaks down how maverick producers are using real-time rumen alerts and laser deterrents to outpace a system that rewards vulnerability.
 Join the Revolution!
 Join the Revolution!
Join over 30,000 successful dairy professionals who rely on Bullvine Weekly for their competitive edge. Delivered directly to your inbox each week, our exclusive industry insights help you make smarter decisions while saving precious hours every week. Never miss critical updates on milk production trends, breakthrough technologies, and profit-boosting strategies that top producers are already implementing. Subscribe now to transform your dairy operation’s efficiency and profitability—your future success is just one click away.