15,000 dairies by 2035. Under 10,000 by 2050. The Bullvine Dairy Curve shows exactly who survives that curve—and who gets priced out.
By 2035, roughly 15,000–16,000 U.S. dairies will be doing the work that nearly 30,000 did a generation ago—and the line between 5,000 and 15,000 herds by 2050 is being drawn right now in cost structure, technology, and succession decisions. What’s interesting is that you don’t have to buy into worst‑case doom to see it; you just have to follow the numbers we already have.
Almost 40% of U.S. dairies disappeared between the 2017 and 2022 Census of Agriculture, even as total milk output increased, and Canadian Agriculture and Agri‑Food Canada (AAFC) data show a similar “fewer farms, more milk” trend under supply management. Using those official data as the foundation, the Bullvine Dairy Curve points to three structural paths:
A business‑as‑usual path where U.S. herd numbers decline around 4% per year and land in the 15,000–16,000 range by 2035 and well under 10,000—typically 8,000–9,000—by 2050; Canada tracks toward 6,500–7,000 by 2035 and 4,000–5,000 by 2050 under quota.
A faster consolidation path where tighter labour, higher compliance costs, and alternative products push U.S. farms closer to 5,000 herds and Canadian herds into the 3,500–4,000 range by 2050.
A managed transition path where better use of margin tools, disciplined capital decisions, and deliberate succession planning slow effective exit rates, keeping the U.S. closer to 15,000 herds and Canada around 6,500 by mid‑century.
Path
U.S. Herds 2035
U.S. Herds 2050
Canada Herds 2035
Canada Herds 2050
Key Drivers
Business-as-usual
15,000–16,000
8,000–9,000
6,500–7,000
4,000–5,000
~4% U.S. decline, 2–3% Canada under quota
Faster consolidation
~12,000
~5,000
~5,500
3,500–4,000
Labour, compliance, alt products, weak margins
Managed transition
~15,000
~15,000
~6,500
~6,500
Margin tools, disciplined capex, succession
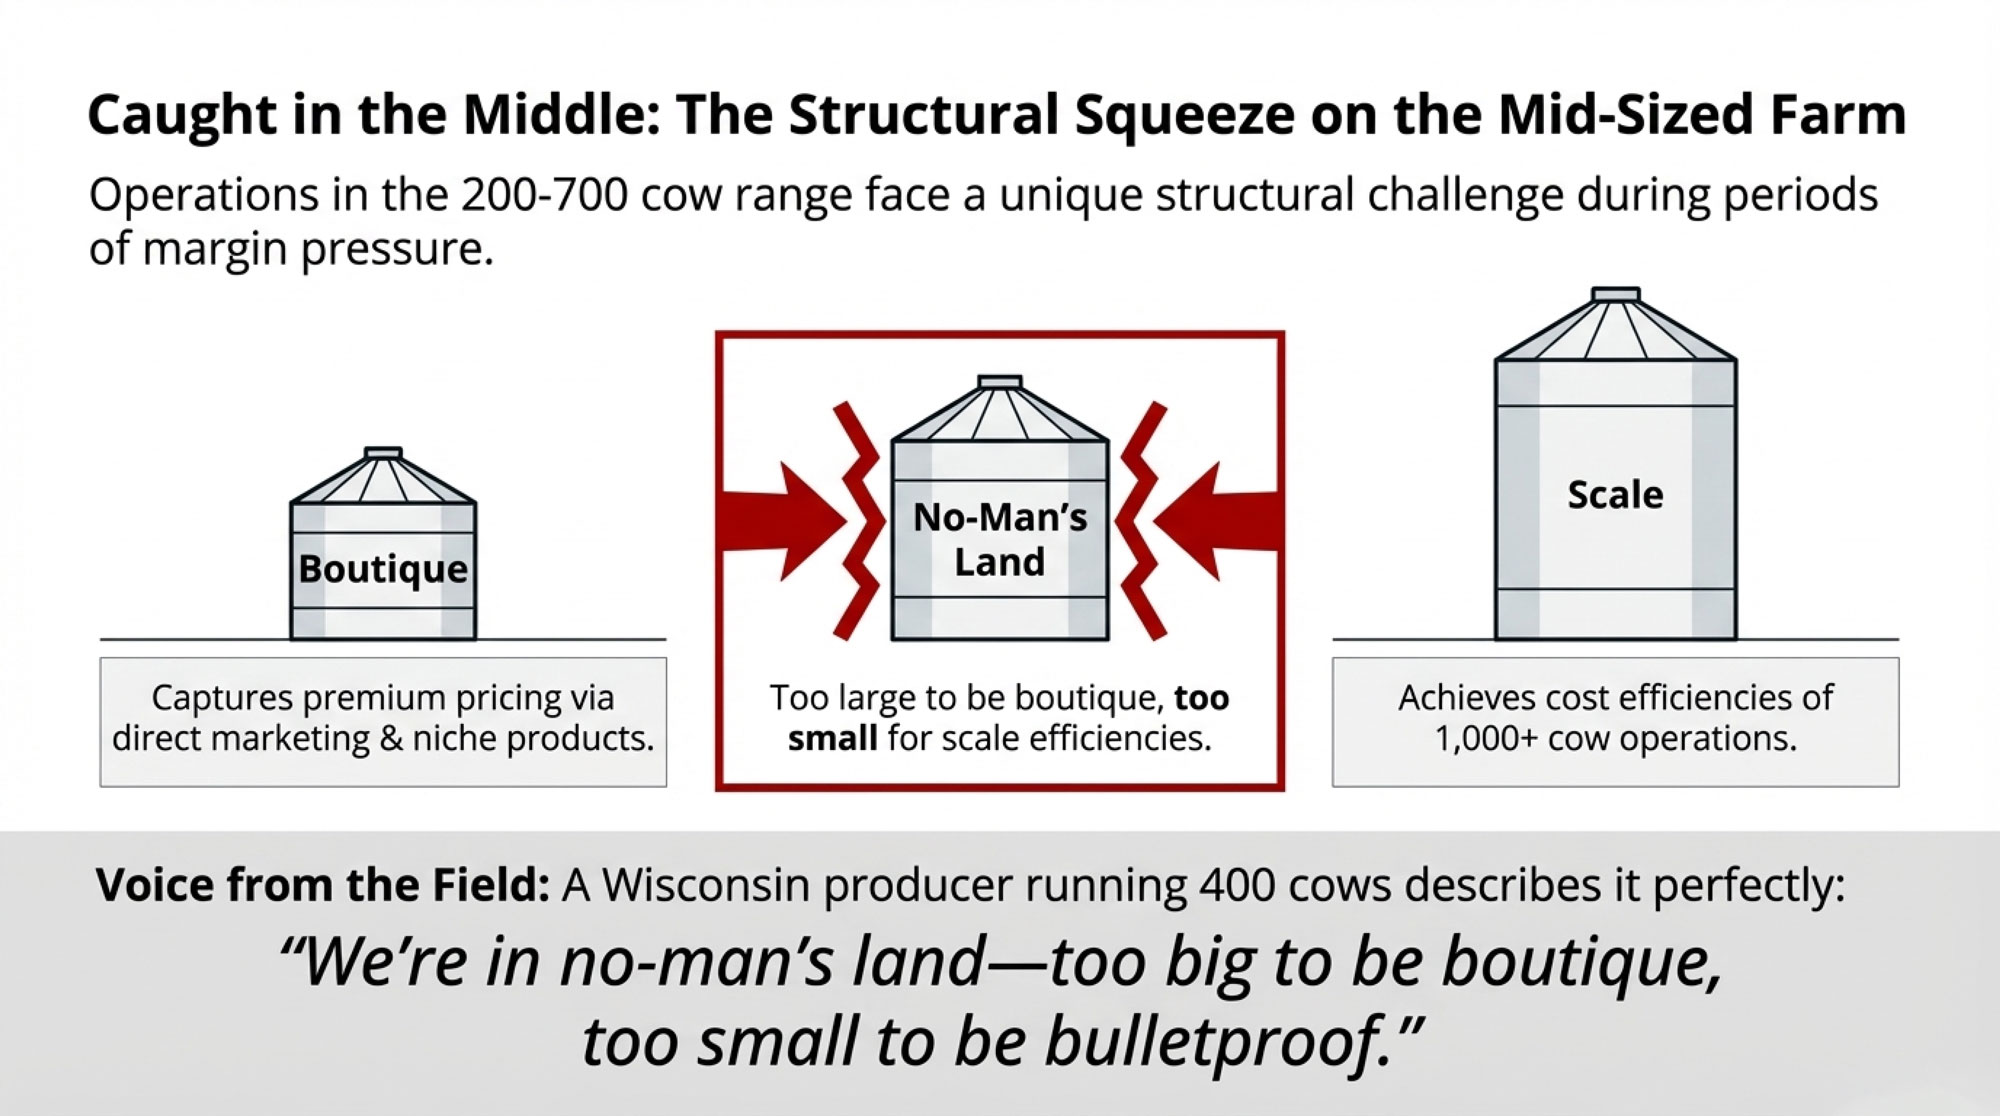
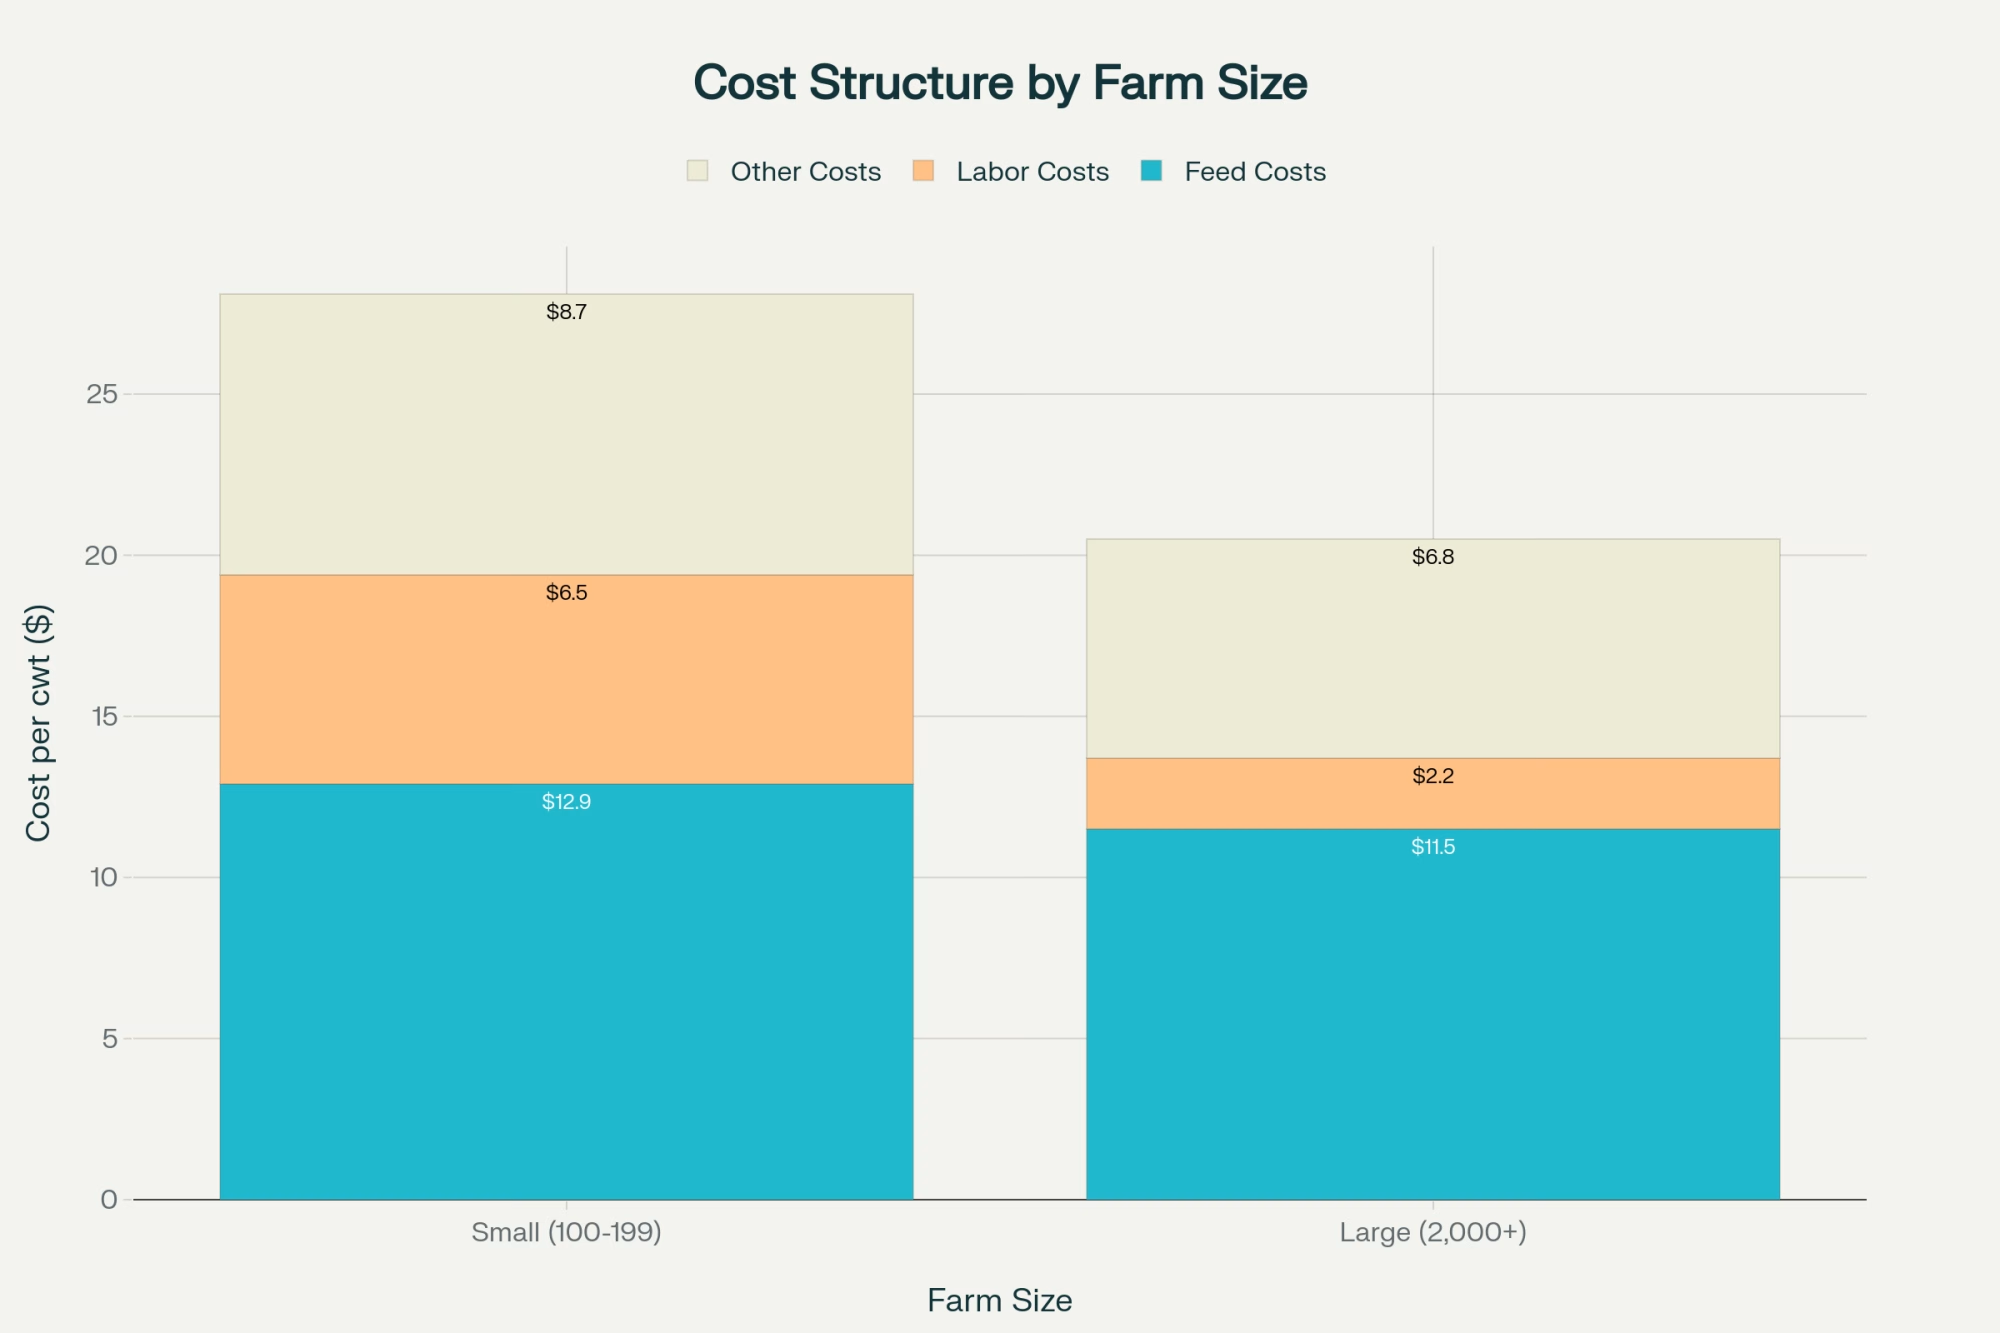
In all three paths, the litres don’t disappear—they concentrate. The largest freestall and dry‑lot systems steadily capture a larger share of the milk pool as economies of scale and processor preferences reward low‑cost, high‑volume suppliers. In that world, 150–500 cow herds that sit “average” on cost and are fully exposed to commodity pricing are often bleeding $75,000–$100,000 per year in structural losses once full labour and capital costs are factored in. That forces a three‑way choice: scale toward 1,000+ cows, pivot into premium/value‑add markets, or cash out while equity is still intact.
The rest of this article lays out the Bullvine Curve in plain language: what the official numbers say, how Bullvine’s forecasts connect the dots out to 2035 and 2050, and a barn‑level playbook to decide whether your operation is building to survive that structure—or quietly betting against it.
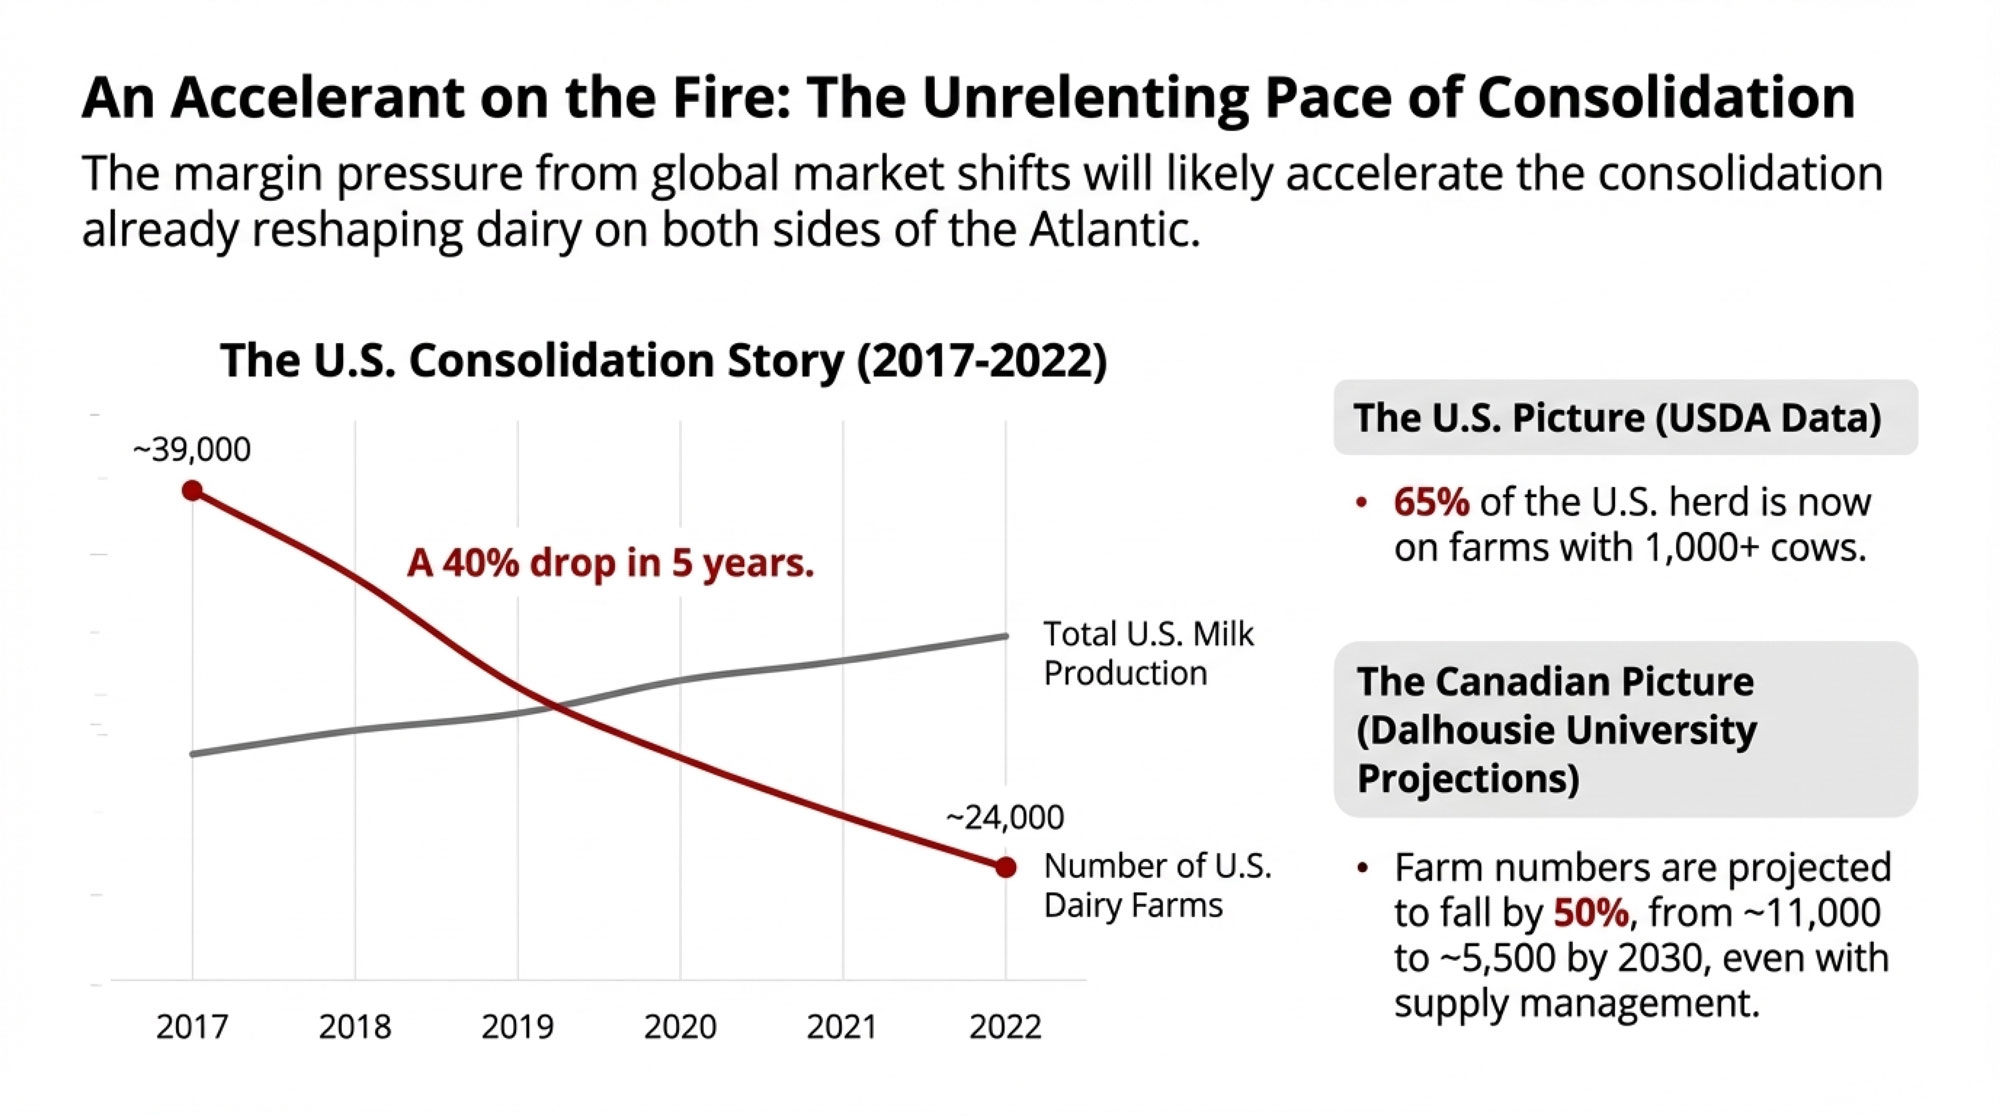
Where we’re actually standing today
You don’t need a chart to know things have changed; you see it in auction bills and quiet parlours. The 2017 Census of Agriculture recorded 39,303 U.S. farms that sold milk from cows; by 2022, that number had dropped to 24,094, a decline of almost 40% in just five years, even as total U.S. milk production nudged about 5% higher on roughly the same total number of cows. USDA’s Economic Research Service found the longer‑run trend is the same: between 2002 and 2019, licensed U.S. dairy herds fell by more than half while national output increased, with the rate of decline accelerating in 2018–2019 and production shifting toward larger herds with higher yields per cow.
In Canada, AAFC’s Dairy Sector Profile shows farm numbers falling from 12,007 in 2014 to 9,256 in 2024—an average decline of about 2.6% per year—while milk production rose from roughly 78.3 to 96.6 million hectolitresand average farm milk prices increased from just over $82 per hectolitre to more than $97. So on both sides of the border, the story is the same: fewer herds, more milk, with the U.S. consolidating faster and Canada sliding more slowly under quota.
That’s the data the Bullvine Dairy Curve starts from: official census and ERS/AAFC work, but extended into structural scenarios that ask a more practical question—which herds are still milking in 2035 and 2050, and what do they look like?
The Bullvine Dairy Curve: 15,000 by 2035, <10,000 by 2050
ERS’s Consolidation in U.S. Dairy Farming gives the cleanest long‑term U.S. baseline: herd numbers down about 55% from 2002–2019, roughly a 4% annual decline, while national production increased and midpoint herd size kept rising. When you extend that 4% curve from today’s roughly 25,000 U.S. herds and overlay it with the 2017–2022 cliff—where the only U.S. size class that actually grew was herds with 2,500+ cows—you land in the same band Bullvine’s early consolidation work described.
U.S. baseline band: about 15,000–16,000 licensed herds by 2035, with 8,000–9,000 by 2050 if that structural rate holds.
Canadian baseline band: a slower but steady slide toward 6,500–7,000 farms by 2035 and 4,000–5,000 by 2050, consistent with 2–3% annual attrition under supply management.
Since those first Bullvine forecasts, the signals have only sharpened. Follow‑up Bullvine work has documented that U.S. closures have effectively been running closer to 4–8 farms per day, and that about half of U.S. farms vanished between 2013 and 2025, with another 50% reduction projected by 2035 if current pressures persist—implying the industry could land in the lower half of that 15,000–16,000 band. In Canada, commentary that the country is “on track to lose nearly half of its remaining dairy farms by 2030,” with production concentrating in Quebec and Ontario, aligns with the 6,500/4,000–5,000 Bullvine bands.
Path
U.S. Herds 2035
U.S. Herds 2050
Canada Herds 2035
Canada Herds 2050
Key Drivers
Business-as-usual
15,000-16,000
8,000-9,000
6,500-7,000
4,000-5,000
~4% U.S. decline, 2-3% Canada under quota
Accelerated consolidation
~12,000
~5,000
~5,500
3,500-4,000
Labor, compliance, alt products, weak margins
Managed transition
~15,000
~15,000
~6,500
~6,500
Margin tools, disciplined capex, succession
The exact number isn’t the point. The curve is. The Bullvine Dairy Curve says: plan for an industry with far fewer farms, more concentrated milk, and a structure where being “average” in the middle is the riskiest place to stand.
How the curve hits different herd sizes and regions
Under ~150 cows: small, but only if it’s specialized
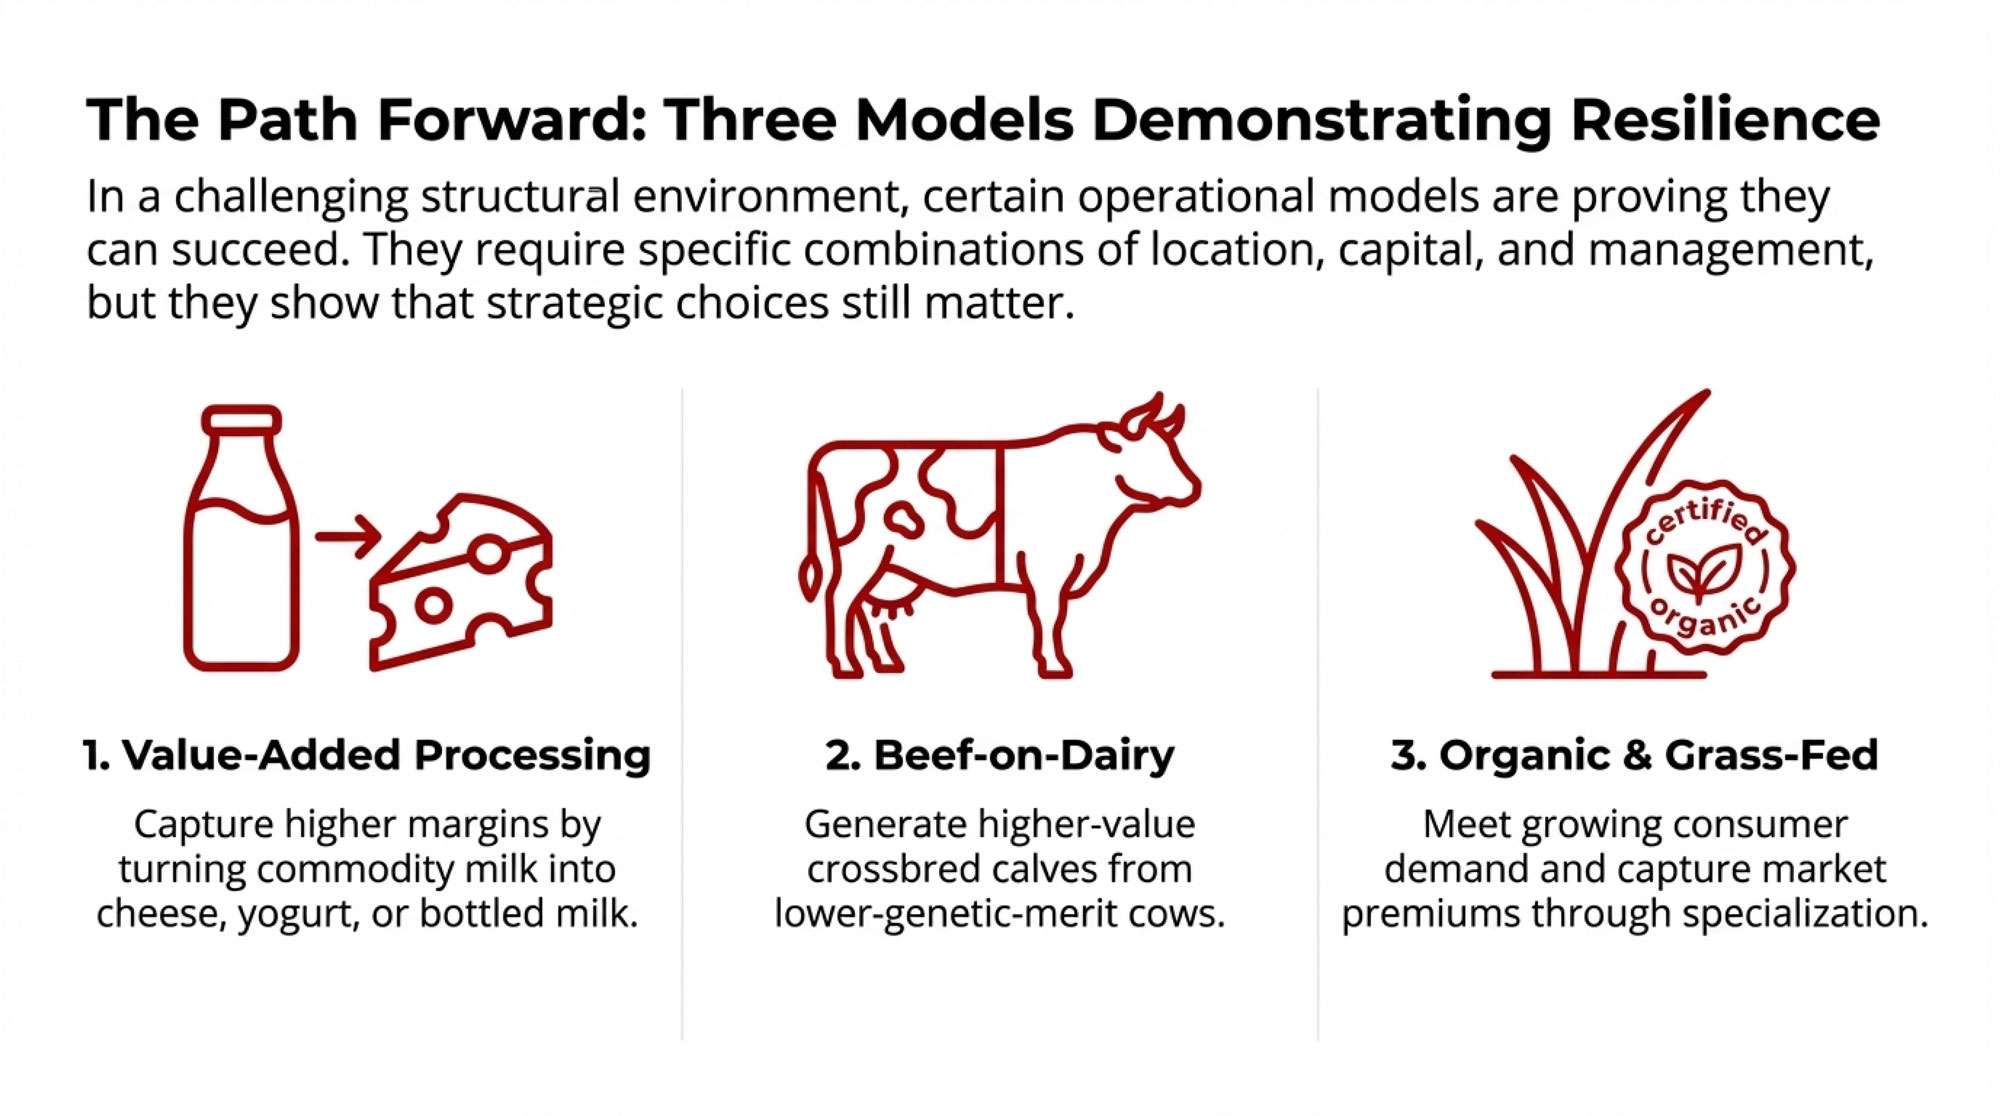
Cost‑of‑production work and intensification studies consistently show that small conventional herds carry higher costs per cwt unless they combine very low debt, strong home‑grown forage, and heavy reliance on family labour. The small herds that are thriving as the curve plays out almost all made a deliberate move away from being “average” commodity suppliers—into organic, grass‑based, A2, on‑farm processing, or other premium systems where margin comes from price, not just volume.
This development suggests that “staying small” only works when you’re deliberately un‑average—either in cost or in the milk cheque you’re targeting. A 60‑cow tie‑stall under quota with direct‑marketed fluid milk or value‑added cheese lives on a different part of the curve than a 60‑cow conventional herd shipping into a generic pool.
150–500 cows: the middle that the math squeezes first
Bullvine’s early projections already highlighted structural pressure on 250–400 cow freestalls: too big to be niche without a clear premium plan, too small to spread fixed costs like a 1,500‑cow system. Updated census and case work show that:
Over 15,200 U.S. dairy farms vanished between 2017 and 2022, with a big share in the 100–499 and 500–999brackets.
Many 250–400 cow herds running “average” cost structures and fully exposed to commodity pricing are carrying $75,000–$100,000 in structural losses per year once full labour and capital costs are accounted for.
Herd Size
Cows
Annual Milk (cwt)
Structural Gap ($/cwt)
Annual Loss (approx.)
Small mid
200
96,000
$0.80
$76,800
Core mid
300
144,000
$0.70
$100,800
Large mid
400
192,000
$0.60
$115,200
One Upper Midwest producer told us their 320-cow herd looked profitable on their milk cheque—until they ran a full-cost analysis with realistic family labour and depreciation. The gap? About $0.72 per cwt, which worked out to roughly $95,000 a year, they’d been quietly losing without realizing it. That’s not a bad year; that’s structure.
That’s why the Bullvine Curve is so blunt about this band: in a 15,000‑farm, <10,000‑farm future, the conventional middle either deliberately scales, specializes, or exits; drifting is the expensive option.
Honestly, what jumps out is how many 300‑cow herds are still trying to play yesterday’s game—commodity milk, average cost, no clearly defined premium hook—in a structure that’s already priced that strategy out for a lot of regions.
1,000+ cows: where the early assumptions became reality
From the beginning, the structural projections assumed economies of scale and lower total cost per cwt would keep pulling volume into larger herds, with a significant share of U.S. milk concentrated in herds of 2,000–2,500 cows by 2050. ERS follow‑up work and Bullvine’s Great Consolidation analysis confirm that:
Net returns for 1,000+ cow herds have outpaced smaller herds in most years studied.
Only the 2,500+ cow herd class actually grew in number between 2017 and 2022, and those herds now account for a very large share of U.S. milk sold.
Farm Size
Annual Exit Rate
10-Year Survival
Risk Level
10-49 cows
12%
28%
CRITICAL
50-99 cows
8%
43%
HIGH
100-199 cows
7%
48%
HIGH
200-499 cows
5%
60%
MODERATE
500-999 cows
3%
74%
LOW
1,000+ cows
2%
82%
STABLE
In Canada, the curve is flatter, but the logic is similar: fewer farms, more quota concentrated in larger herds, and a national structure where roughly 90% of farms are now clustered in a few provinces, especially Quebec and Ontario.
What’s interesting here is that the “big herds win on cost” assumption from 10–15 years ago has largely become a day‑to‑day reality—but with it comes a different risk profile tied to environmental regulation, export dependence, water, and labour, especially in dry‑lot systems.
Regional reality: the curve isn’t smooth everywhere
The Bullvine Curve was never “every region looks the same.” The shape is similar; the slopes and pain points aren’t.
In the Upper Midwest and Northeast, exits are concentrated among smaller and mid‑size tie‑stalls and older freestalls, with modest growth in 1,000–2,000 cow herds and strong but concentrated production in states like Wisconsin and New York.
In the Southwest and High Plains, a relatively small number of very large freestall and dry‑lot systems supply big cheese and powder plants, with water, heat, and environmental rules acting as both risk and gatekeeper.
In Canada, AAFC data and quota policy mean the curve is slower and more managed, but the direction is the same: fewer farms, more litres per herd, and more of that production anchored in Quebec and Ontario, with smaller operations in the Atlantic and Prairies under more pressure.
I’ve noticed that when producers really “get” the curve, it’s often after they plot themselves against regional realities: haul distance, processor options, land prices, and labour pool, not just cow numbers.
From forecast to milk‑house: the Bullvine playbook
Forecasts only matter if they change decisions. The Bullvine Dairy Curve is built to drive a handful of blunt, barn‑level questions rather than just scare charts.
1. Which lane are you actually in?
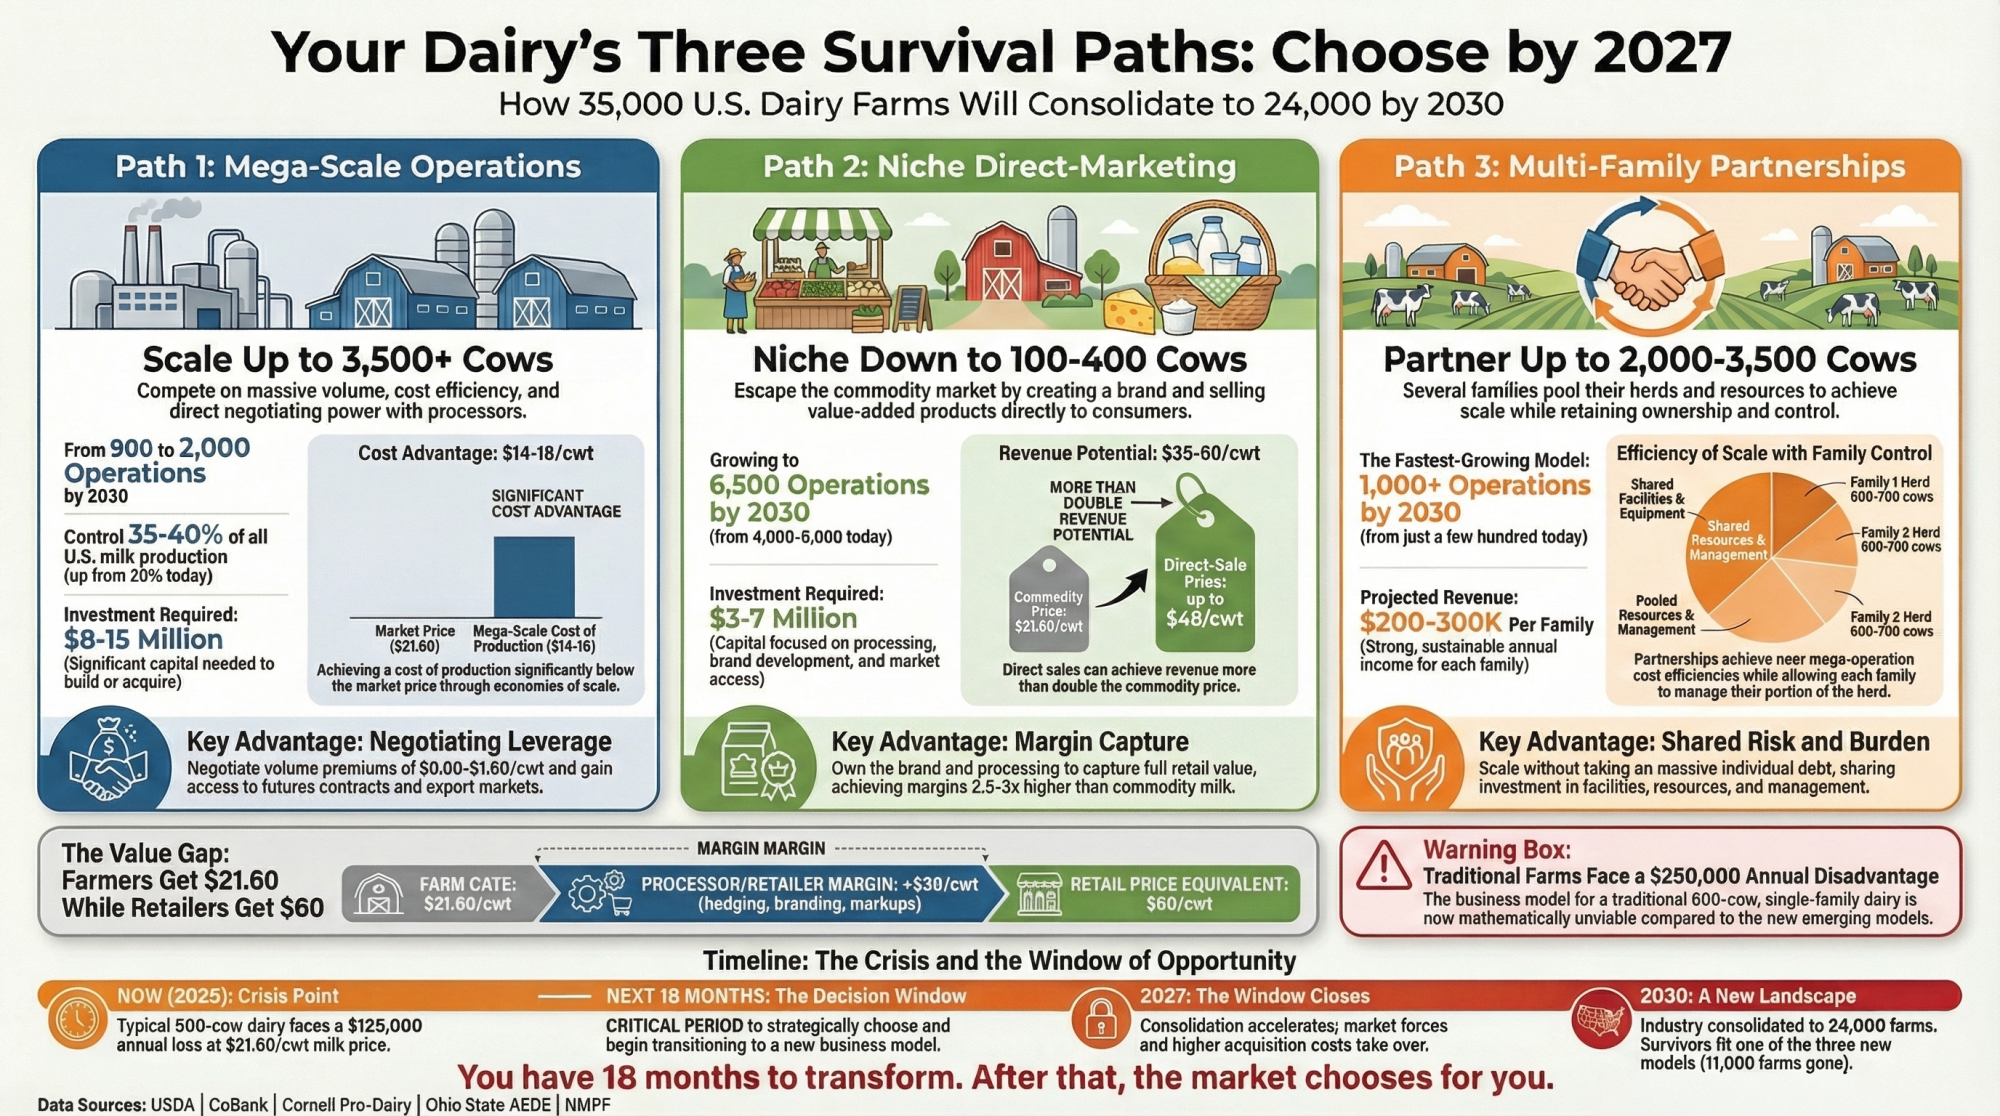
In a 15,000‑farm, <10,000‑farm world, most herds that stay in the game long‑term are choosing one of three lanes:
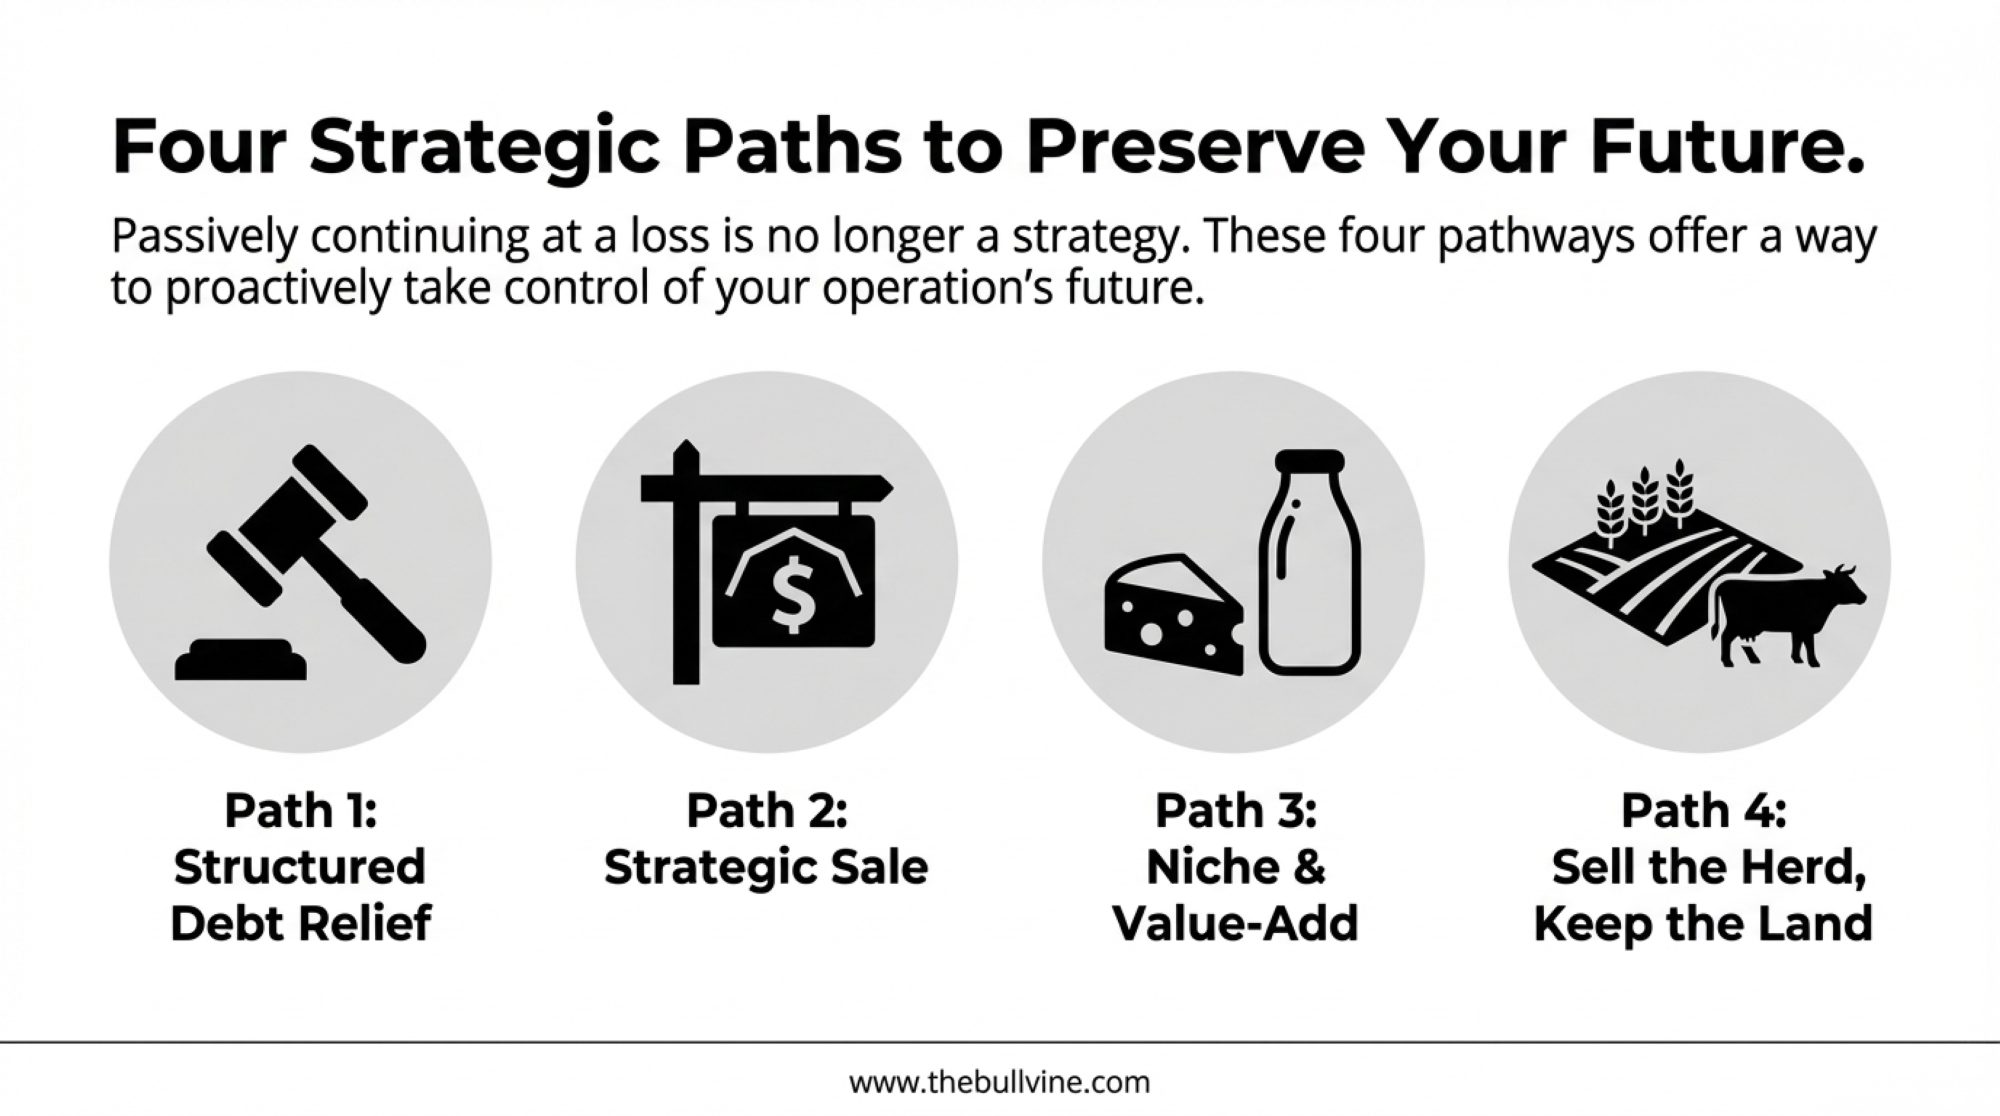
Scale: Build toward 1,000+ cows with a cost structure that genuinely competes per cwt, understanding the capital, labour, and concentration risk.
Specialize: Stay smaller or mid‑size but sell into markets that pay on margin—organic, grass‑based, A2, on‑farm processing, or tightly integrated supply contracts.
Strategic exit: Use the forecast window to sell or transition on your terms while equity is intact, especially where succession isn’t clear.
Not choosing is still a choice; it just lets the curve choose for you. What farmers are finding is that being vague—“we’ll see how it goes”—is often the costliest option.
2. What is your true cost per cwt and “danger zone”?
ERS cost‑of‑production data and extension tools show that, on average, larger herds have lower total economic costs per hundredweight, but there’s a wide spread inside every size class. The farms that navigate the curve best usually:
Know their full cost per cwt with realistic values for family labour and capital.
Have a clear milk‑feed ratio “danger zone” where they tighten capital, sharpen feed, and check in with lenders more often.
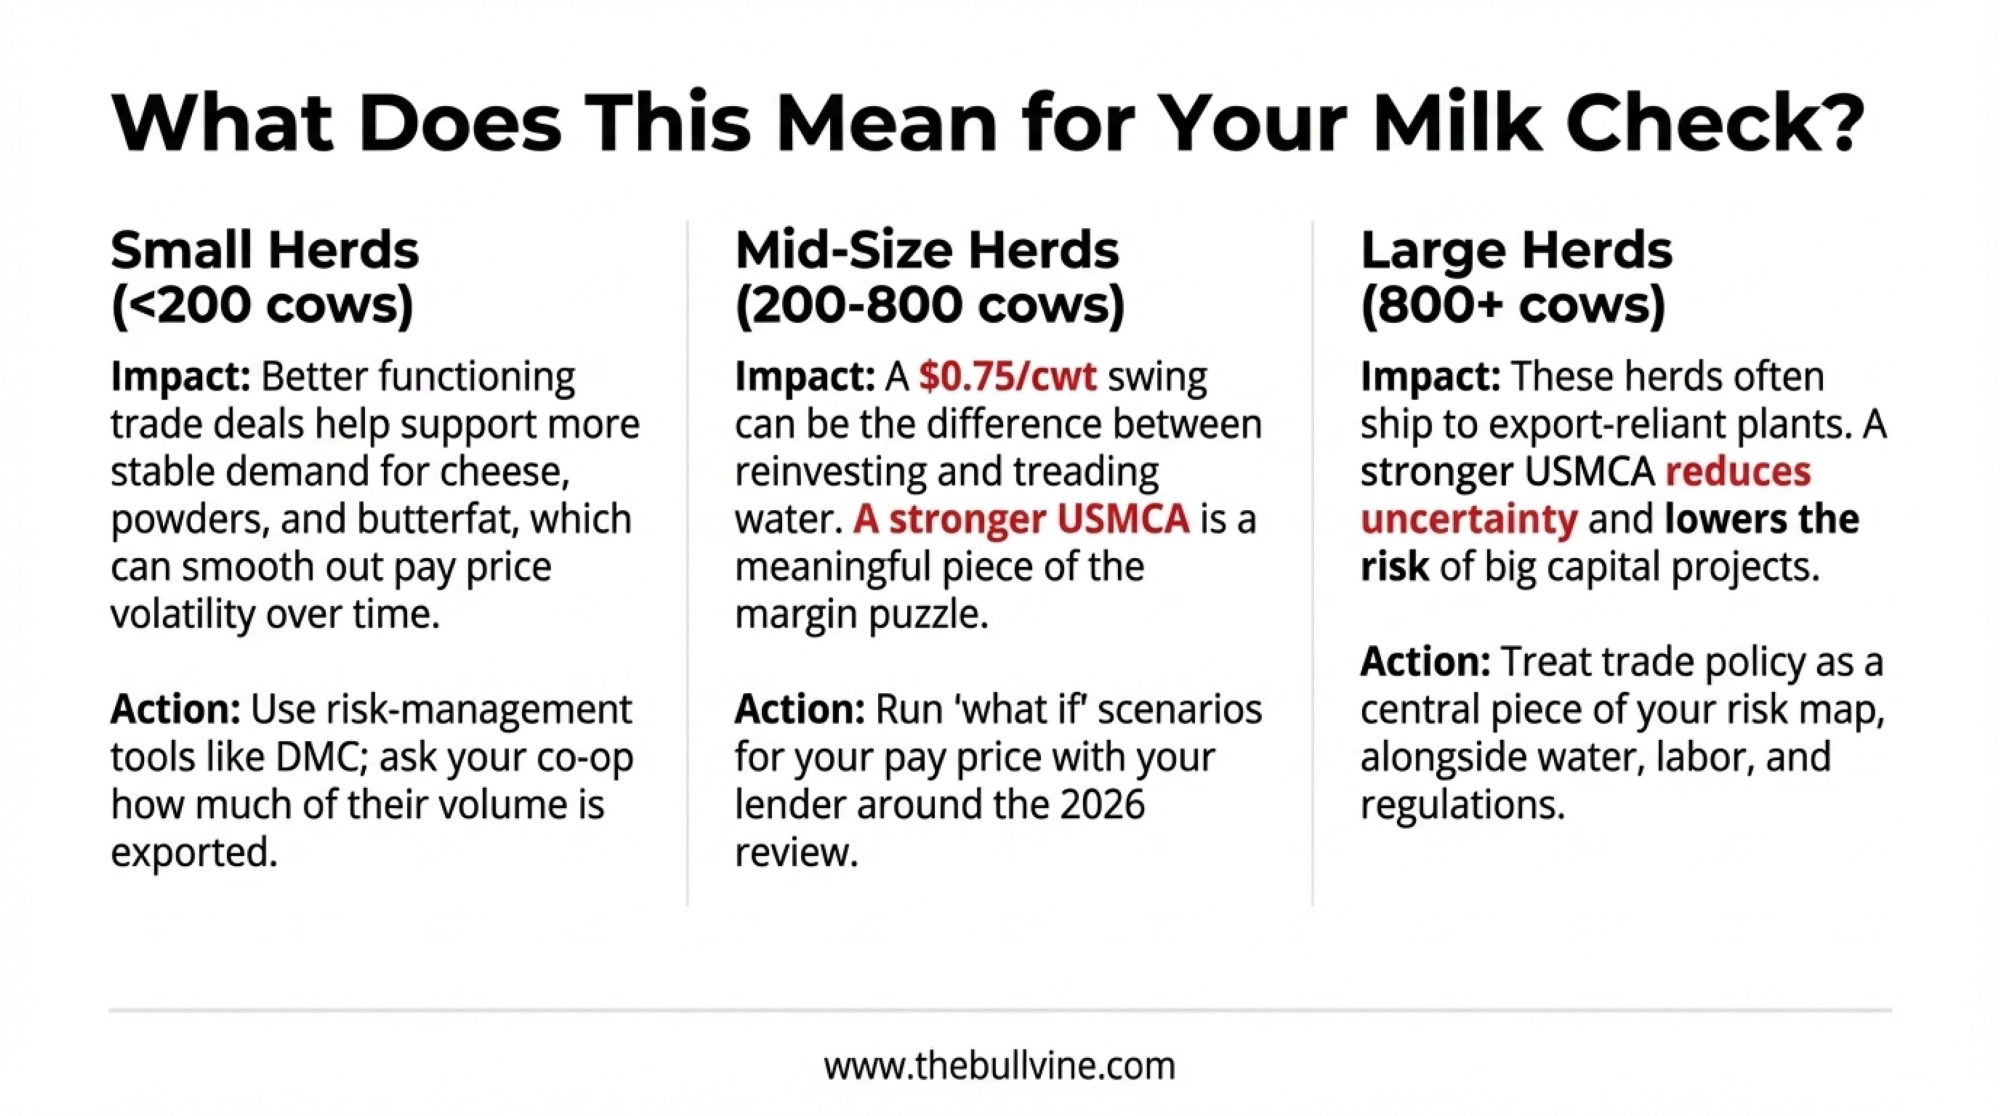
In a 200‑cow herd shipping 8,000 cwt a month, a 50‑cent swing in margin is roughly $4,000 a month or $48,000 a year—almost exactly the gap between treading water and investing in the next needed project. That’s the kind of math that quietly decides whether you can upgrade a parlour or add stalls to lift butterfat performance and fresh cow comfort.
3. Is your next dollar going into scale, comfort, or robots—and why?
The curve doesn’t say “robots good, parlours bad,” it says “robots amplify whatever is already in your numbers.” While Automated Milking Systems (AMS) solve the immediate headache of labor availability, they fundamentally shift your balance sheet. You are trading variable labor costs for high fixed capital costs. In a “commodity milk” lane, this move pushes you further into the “efficiency required” lane: because your fixed costs per hundredweight are now higher, your margin for error on milk production and components disappears.
On smaller herds under ~100–120 cows, AMS often struggles to pencil out unless there’s a premium market, off‑farm income, or a clear growth plan.
In the 150–250 cow band, robots can work where labour is genuinely tight, and management is strong, but they typically need $400–500 per cow per year in a mix of labour savings and extra milk to carry their weight over a typical financing term.
Larger freestall/dry‑lot systems treat robots, high‑throughput parlours, sort gates, and sensors as part of broader cow‑flow and labour strategy, not silver bullets.
The Robot Reality Check: If your herd isn’t already hitting top-tier production and health metrics, a robot won’t fix the margin—it will just automate the loss at a higher interest rate.
The Bullvine playbook is simple: if you can’t show on paper where the extra dollars per cow per year come from, ask whether stalls, feed storage, or transition pens would move your position on the curve more. In other words, don’t let fatigue drive a million‑dollar robot decision if fresh cow management and housing are still your biggest bottlenecks.
4. Who actually wants to be milking here in 2035?
Succession is the quiet driver you don’t see on the milk cheque, but it shows up in the forecast. National surveys by lenders and advisory firms consistently find that only a minority of producers have formal written succession plans, even when an adult child is active. Research on exits also shows that age and the presence of an identified successor are strong predictors of whether a farm continues to operate 10–15 years later, even after controlling for herd size and profitability.
In practice, that means a financially solid 65‑year‑old with no successor is more likely to be on the “exiting half” of the Bullvine Curve than a somewhat smaller or slightly less efficient herd where a 35‑year‑old is already leading breeding, facilities, and lender meetings. Putting a basic timeline and ownership plan on paper is one of the simplest ways to move your operation onto the “still milking by choice” side of the 2035/2050 lines.
I’ve seen more than one herd where the real turning point wasn’t a bad milk price year—it was the moment the family admitted no one under 40 actually wanted night checks and bank meetings for the next 20 years.
The “Strategic Exit”: Harvesting Equity, Not Admitting Defeat
One of the hardest parts of the Bullvine Dairy Curve is the “Exit” conversation. We need to change the vocabulary around leaving the industry. In every other sector of the global economy, “exiting” at the top of a market or when equity is strongest is called a successful business cycle.
If the curve shows that your regional processor access is shrinking or your cost structure is hitting a structural ceiling, executing a Strategic Exit is an act of leadership. It allows you to:
Protect Generational Wealth: Cash out while land and quota values are high, rather than “burning the house for warmth” by eroding equity during years of structural losses.
Define Your Legacy: Transitioning the land to its next best use—whether that’s cash crops, beef, or development—on your timeline, not the bank’s.
A strategic exit isn’t a failure; it’s a calculated decision to stop milking cows so you can start protecting the family’s future.
5. Does your regional strategy match the curve you’re actually in?
Processor access, hauling distance, water rules, land markets, and labour conditions shape how the curve feels locally. A 200‑cow freestall near several plants in southern Ontario lives in a different structural world than a 200‑cow herd in northern Vermont or a 3,000‑cow dry lot in west Texas.
The Bullvine Curve is a map, not a script; the job is to locate your farm on that map honestly—by size, cost, region, and succession—and then build a plan that fits the structure you’re heading into, not the one you remember.
The Bullvine Bottom Line: forecasts as a tool, not a headline
The consolidation trend itself isn’t up for debate anymore; the 2022 Census of Agriculture, USDA ERS work, and AAFC’s Dairy Sector Profile all tell the same story of fewer herds, more milk, and more of that milk coming from larger operations. What the Bullvine Dairy Curve adds is a clear, named set of paths—15,000–16,000 vs <10,000 U.S. herds, 6,500–7,000 vs 4,000–5,000 Canadian herds—and a practical way to turn those numbers into decisions about cost structure, technology, and succession while there’s still time to move.
The data strongly suggest there will be fewer dairy farms in 2050 than there are today; they do not say which farms those will be. That part is still being written—day by day, barn by barn—and the whole point of the Bullvine forecast is to help you write your own line on the curve instead of letting the averages write it for you.
KEY TAKEAWAYS
15,000 U.S. farms by 2035. Under 10,000 by 2050. Where do you land? The Bullvine Dairy Curve extends the 4% annual decline documented by the USDA from 2002 to 2019. Canada tracks toward 6,500–7,000 farms by 2035 and 4,000–5,000 by 2050. These aren’t worst-case guesses—they’re the middle of the road.
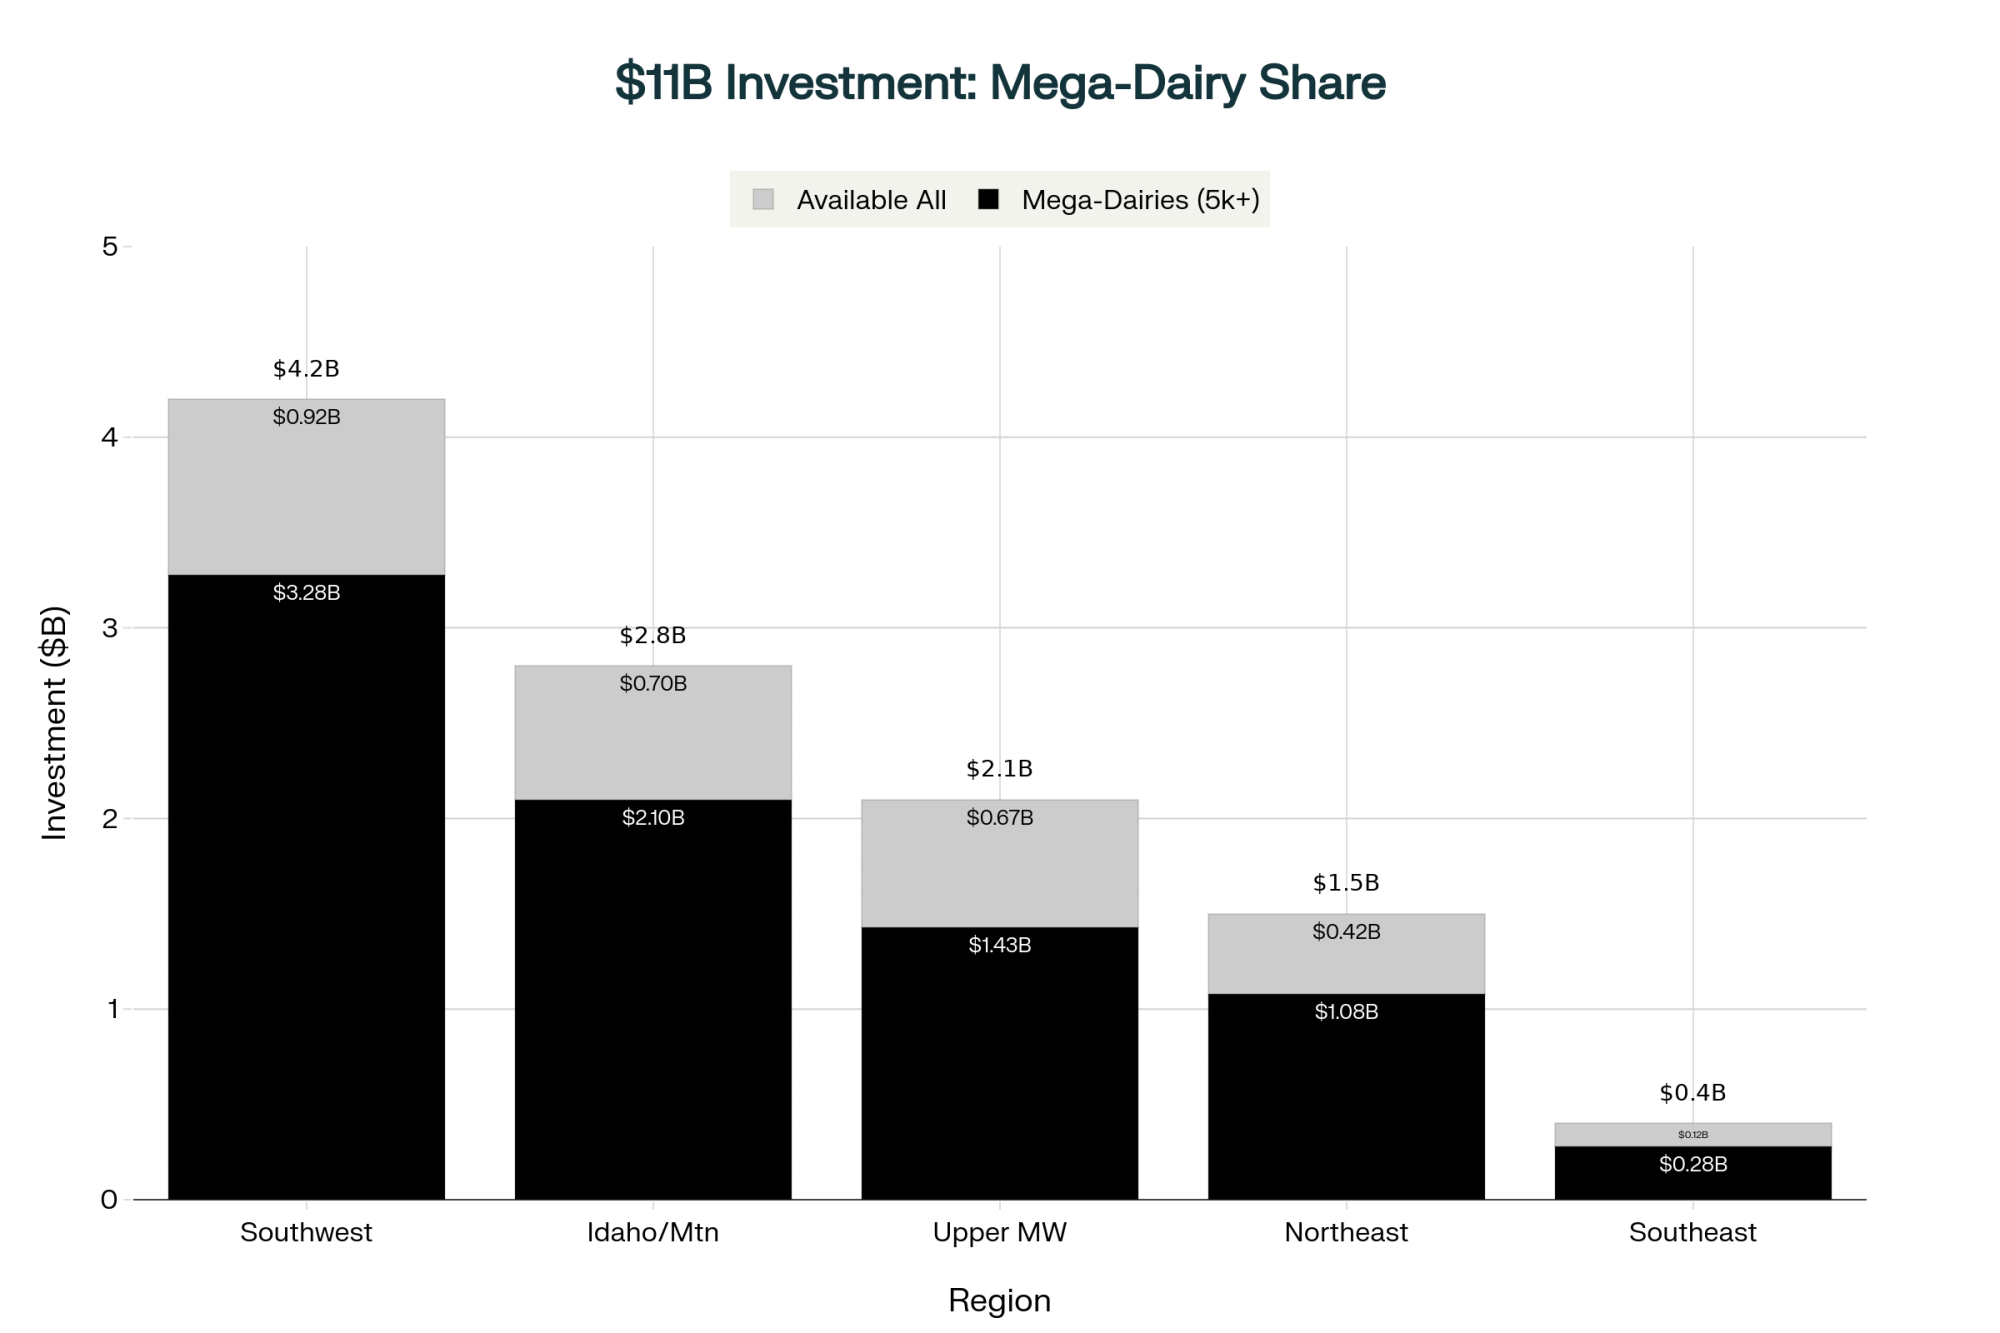
Milk isn’t disappearing—it’s moving into bigger barns. The 2,500+ cow herd class is the only one that grew between 2017 and 2022. Processors are building $11B in new capacity around these mega-suppliers, not 300-cow herds.
The $100k squeeze hits mid-size hardest. Many 150–500 cow commodity herds running “average” costs incur $75,000–$100,000 in structural losses per year. Stay average, and you’re betting against the curve.
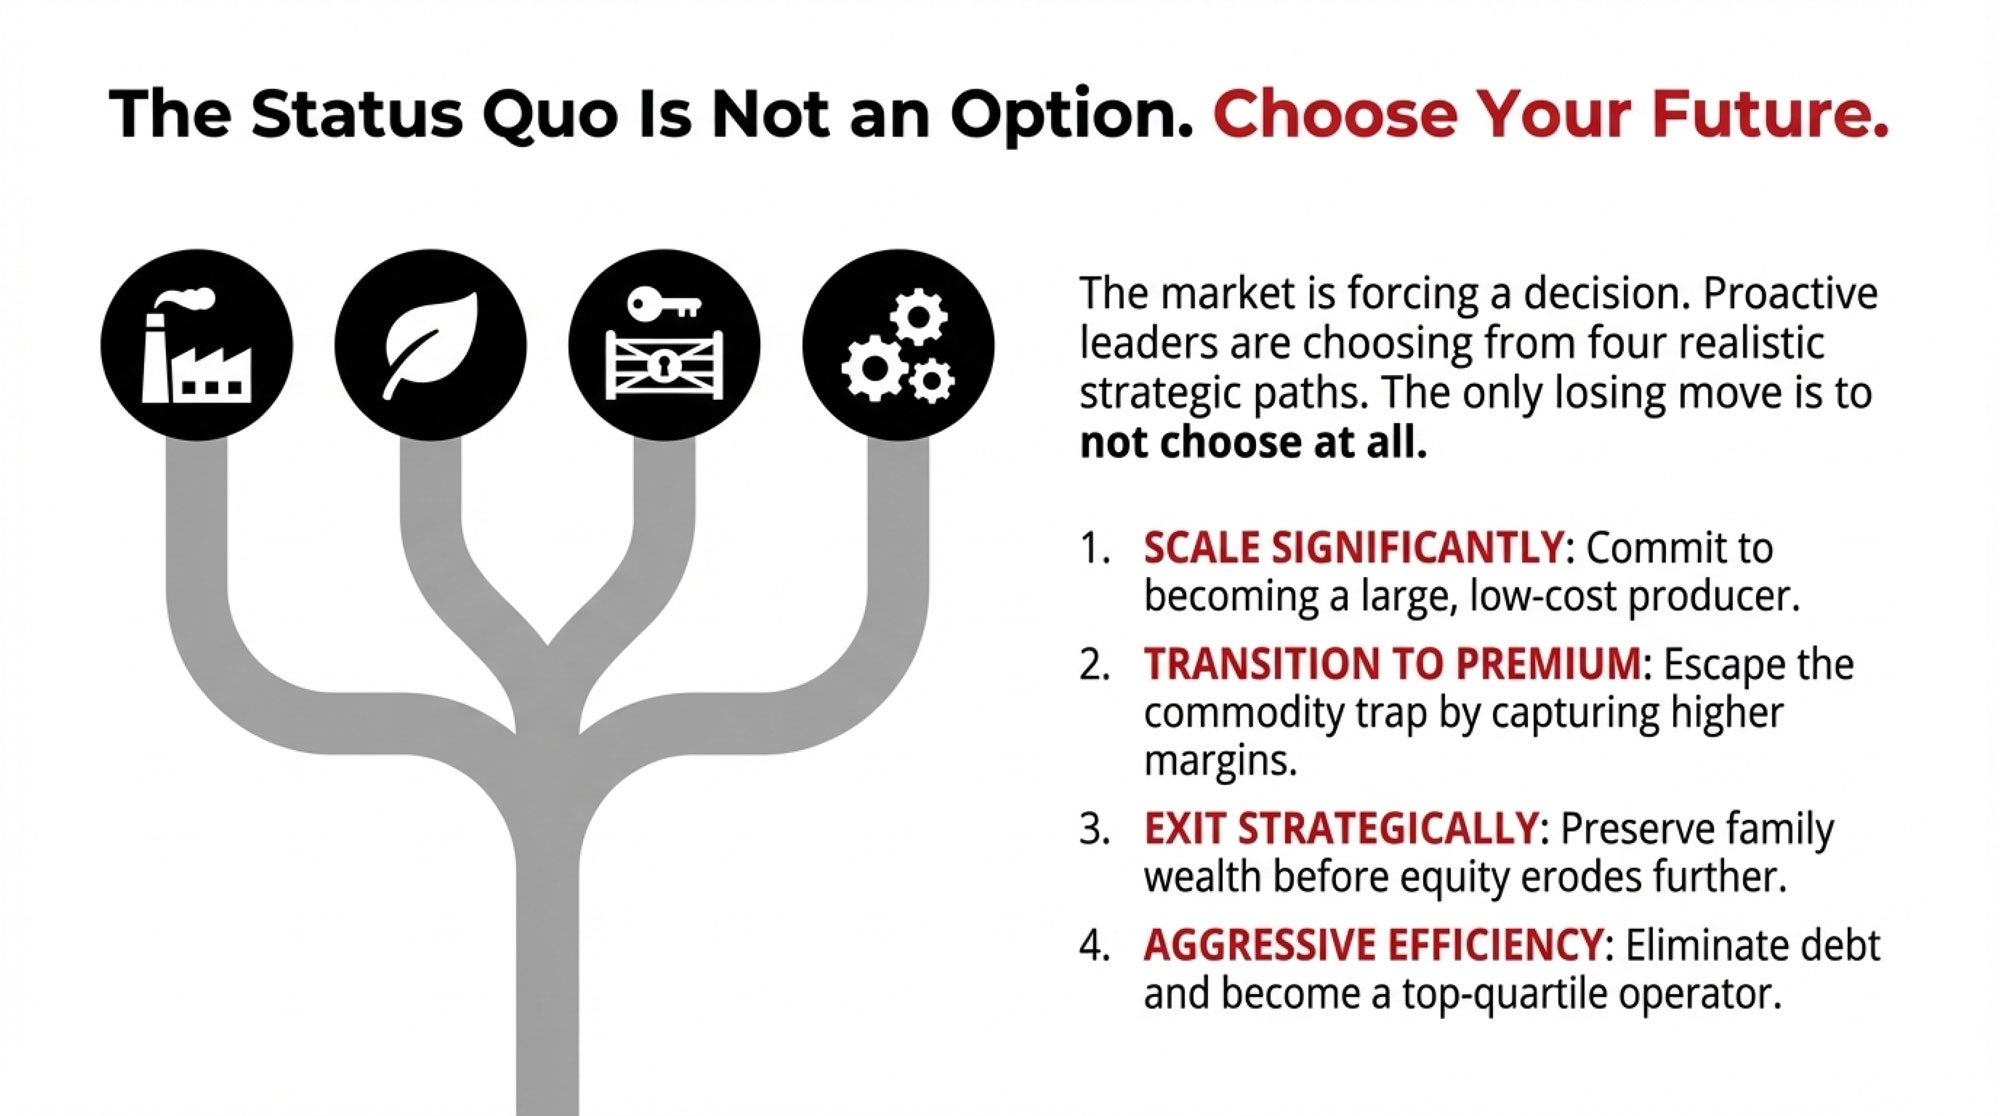
Three paths remain—pick one. Scale toward 1,000+ cows with genuinely competitive cost per cwt, specialize into premium markets that pay on margin, or execute a strategic exit while equity is intact. Not choosing lets the curve choose for you.
Succession decides who’s still milking in 2035. A 65-year-old with no successor is more likely to exit than a smaller herd where a 35-year-old already leads. Put the timeline on paper now—”someday” isn’t a plan.
Executive Summary:
By 2035, the Bullvine Dairy Curve has U.S. dairy farms shrinking from roughly 25,000 herds today to 15,000–16,000, and to well under 10,000 by 2050. That’s what happens if the long‑run 4% annual decline identified by USDA’s Economic Research Service continues. In Canada, AAFC’s Dairy Sector Profile and Bullvine’s modelling show a slower but similar slide from 12,007 farms in 2014 to 9,256 in 2024, heading toward roughly 6,500–7,000 farms by 2035 and 4,000–5,000 by 2050—even as national milk output climbed about 23%, from 78.3 to 96.6 million hectolitres. Across all three paths—business‑as‑usual, a faster shakeout, or a more managed transition—the litres don’t disappear; they concentrate into larger freestall and dry‑lot systems as processors, and lenders channel more volume to 1,000‑plus‑cow herds with lower cost per cwt. That structural shift leaves many 150–500 cow commodity herds that sit “average” on cost and fully exposed to commodity pricing, facing $75,000–$100,000 a year in structural losses, unless they either scale, specialize into premium/value‑add markets, or plan a strategic exit while equity is still strong. This article turns the Bullvine Dairy Curve into a five‑question barn‑level playbook—covering lane choice, true cost per cwt, tech and barn investments, succession, and regional realities—so you can decide whether your operation will be one of the 15,000 still milking by choice in 2035 and beyond, or one of the herds the curve quietly averages out.
About the Bullvine Dairy Curve Model
The Bullvine Dairy Curve is an analytical framework—not an official government forecast—built by extending documented historical trends into scenario-based projections. The U.S. baseline draws on USDA’s 2017 and 2022 Census of Agriculture (39,303 farms → 24,094 farms) and USDA Economic Research Service report ERR-274, Consolidation in U.S. Dairy Farming, which documented a roughly 4% annual decline in licensed herds from 2002–2019 alongside rising national production and increasing concentration in larger operations. The Canadian baseline uses Agriculture and Agri-Food Canada’s Dairy Sector Profile, which tracks farm numbers from 12,007 in 2014 to 9,256 in 2024 (approximately 2.6% annual decline) under supply management. Rather than a single-point prediction, the Bullvine Dairy Curve presents three scenario paths: a business-as-usual path that extends historical decline rates, a faster consolidation path that accounts for accelerating pressures (labor constraints, compliance costs, alternative proteins, and margin compression), and a managed transition path where disciplined use of margin tools, capital decisions, and succession planning slow effective exit rates. All projections assume continued structural concentration—consistent with Census data showing the 2,500+ cow herd class as the only size category that grew between 2017 and 2022—and are intended as planning tools for producers, lenders, and advisors rather than definitive forecasts.
Complete references and supporting documentation are available upon request by contacting the editorial team at editor@thebullvine.com.
Learn More
Profit and Planning: 5 Key Trends Shaping Dairy Farms in 2025 – Arms you with critical benchmarks—like the 1.4 feed efficiency ratio—to stop cash flow leaks today. You’ll gain a tactical roadmap for cleaning balance sheets and securing contracts before the next market recalibration shifts the goalposts.
Cheap Milk Is Breaking the Farm: What’s Really Hollowing Out Dairy’s Middle Class – Reveals the structural vise squeezing mid-size dairies and explains why traditional efficiency isn’t enough to survive. You’ll gain a clear-eyed analysis of the business models available for those caught between niche premiums and massive scale.
Join over 30,000 successful dairy professionals who rely on Bullvine Weekly for their competitive edge. Delivered directly to your inbox each week, our exclusive industry insights help you make smarter decisions while saving precious hours every week. Never miss critical updates on milk production trends, breakthrough technologies, and profit-boosting strategies that top producers are already implementing. Subscribe now to transform your dairy operation’s efficiency and profitability—your future success is just one click away.
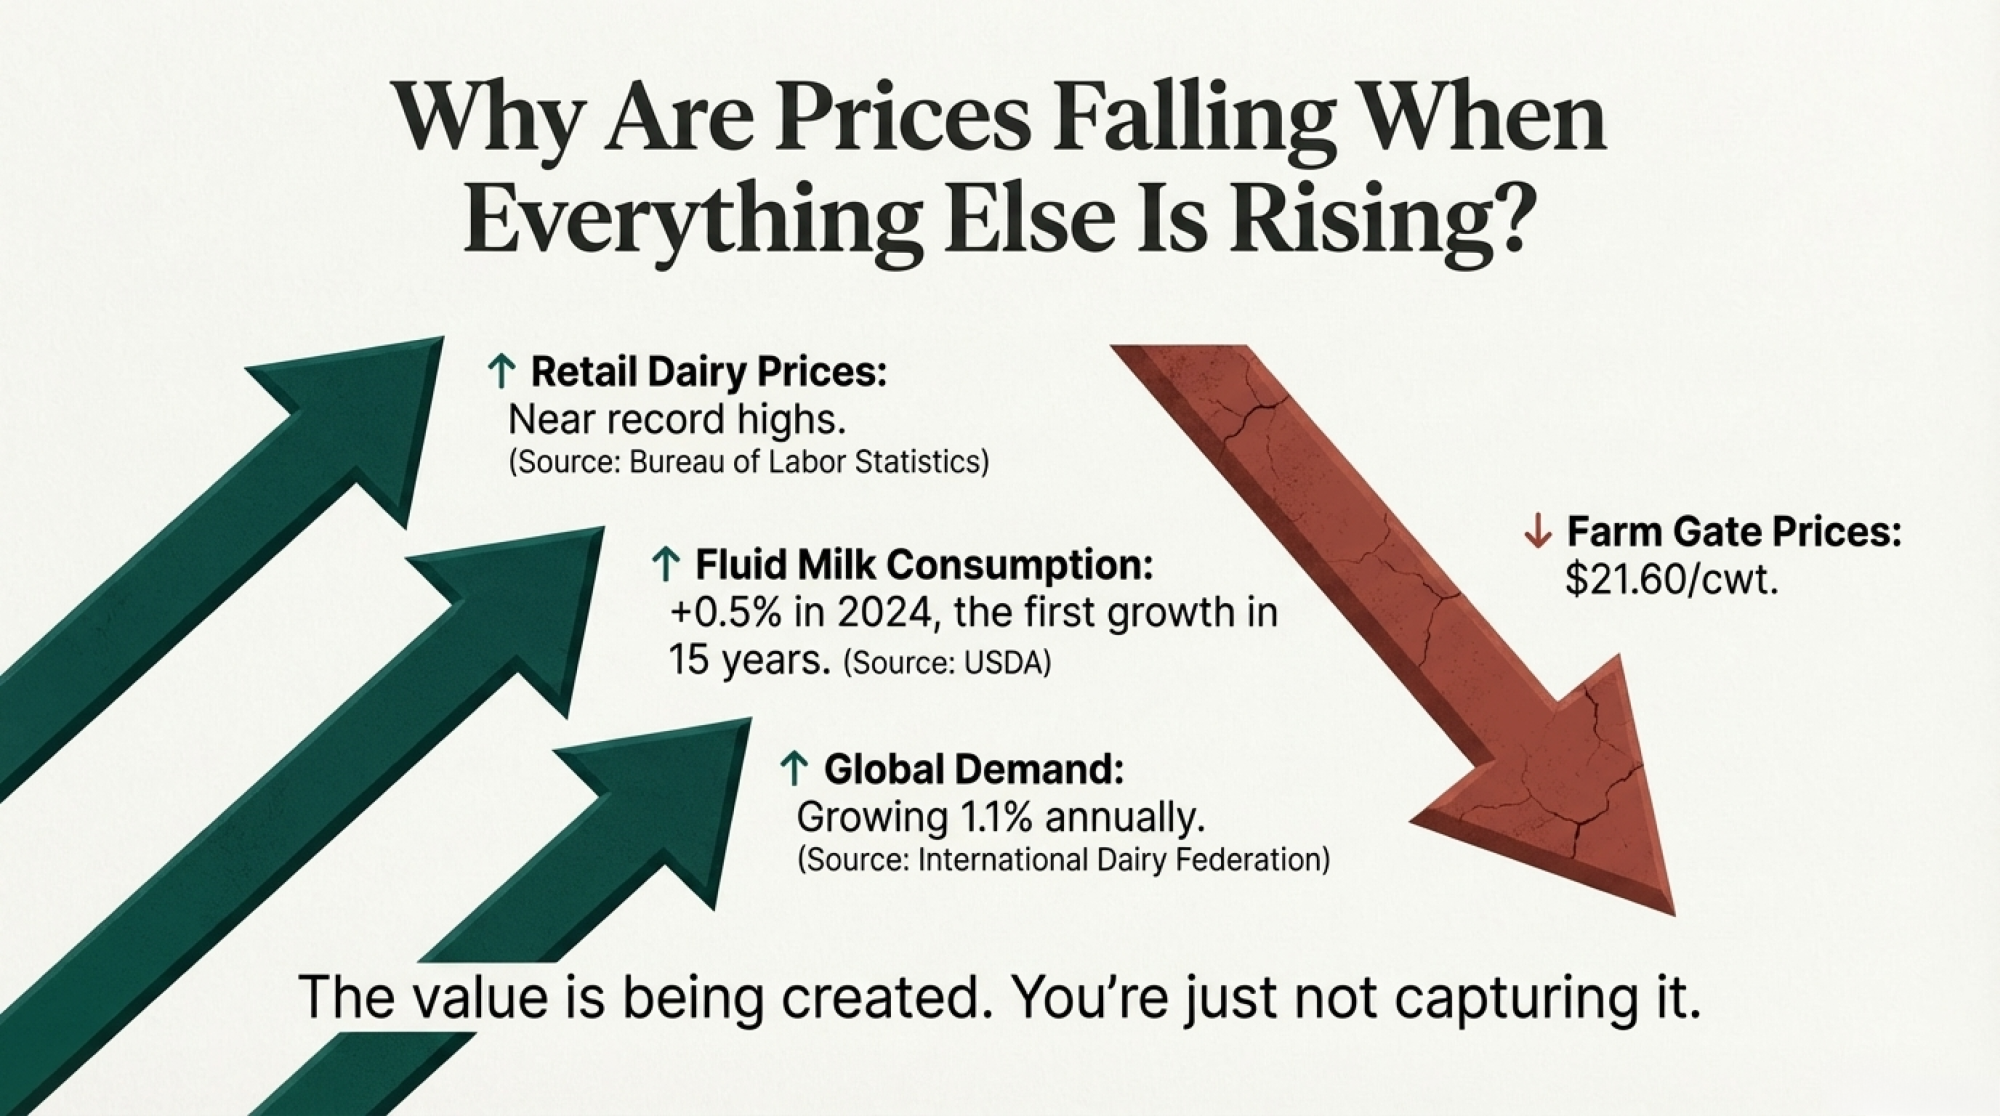
39% fewer farms. Record milk. If your strategy is ‘wait for the next good cycle,’ this article is your reality check.
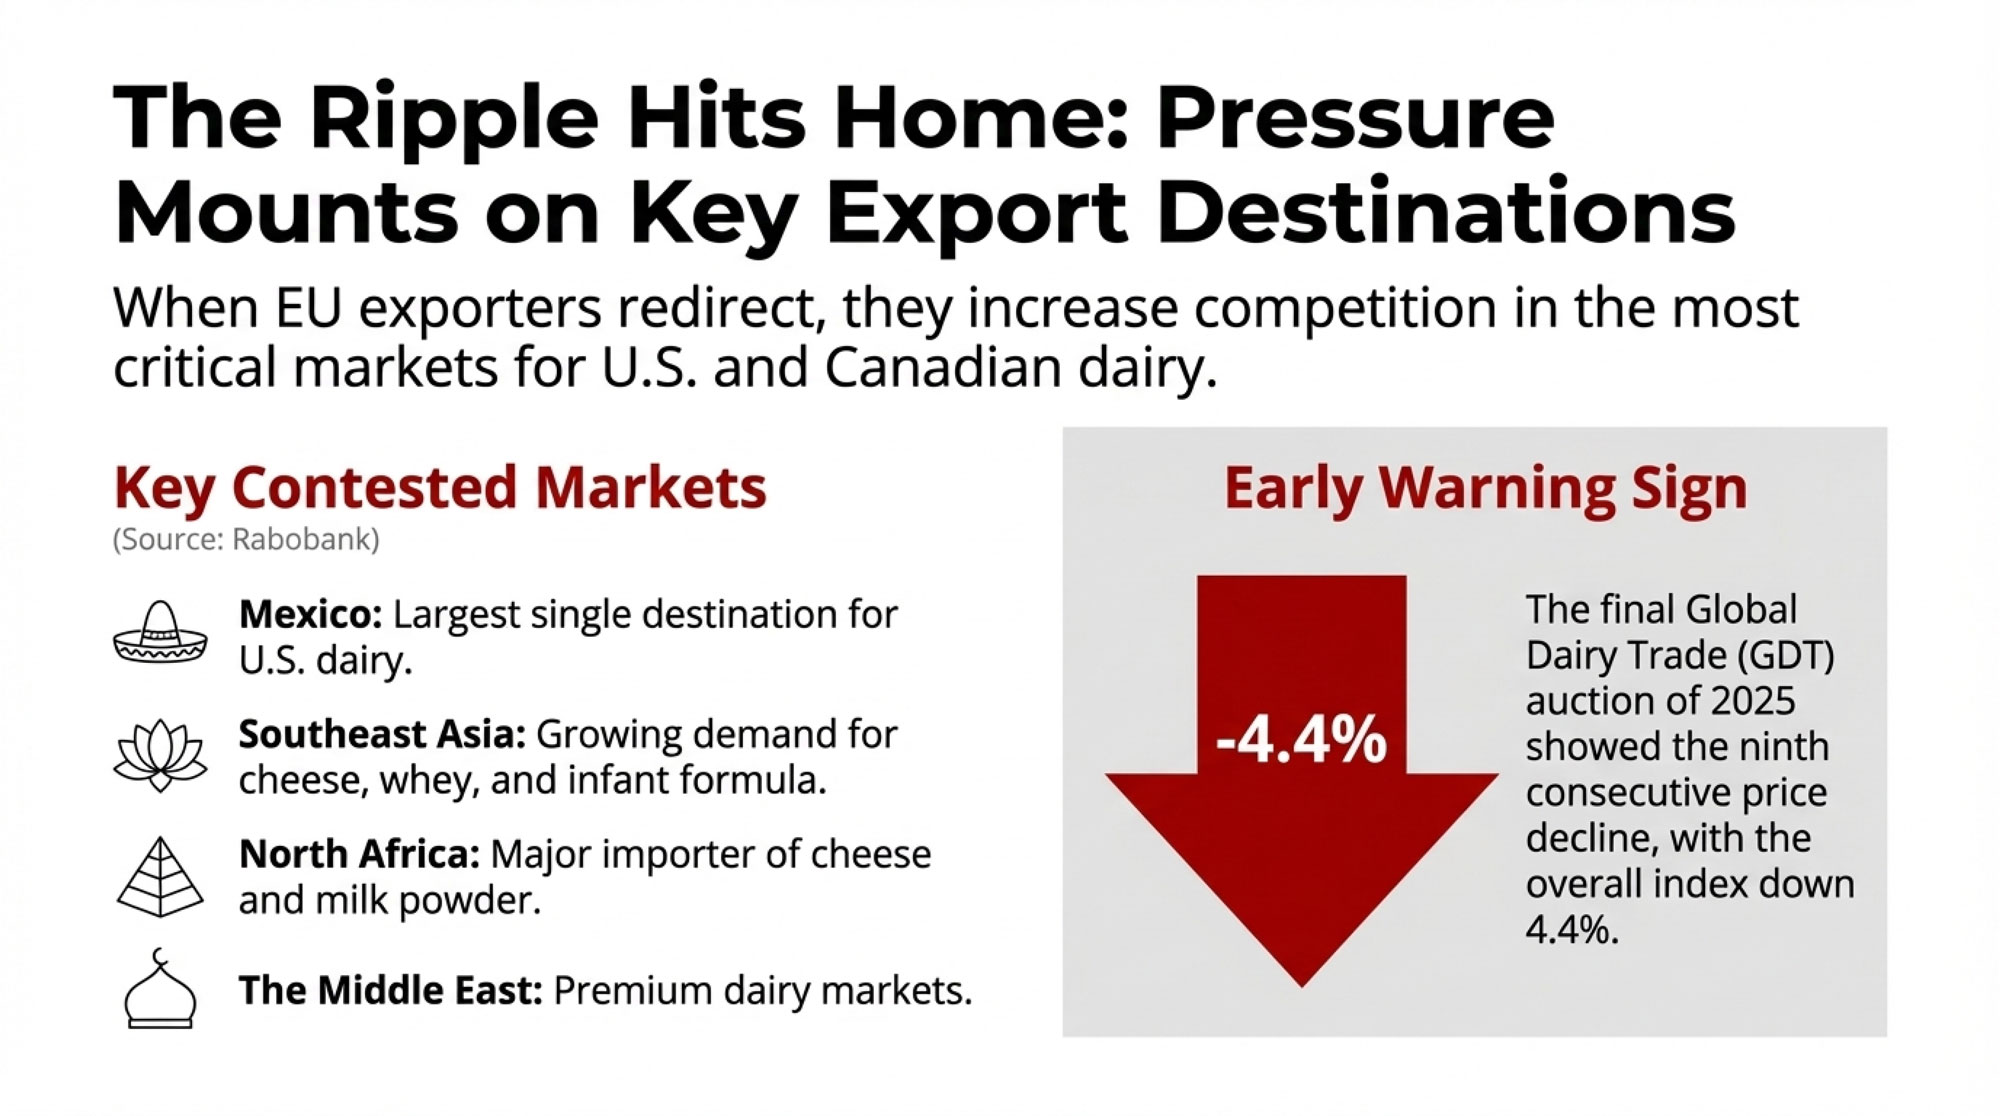
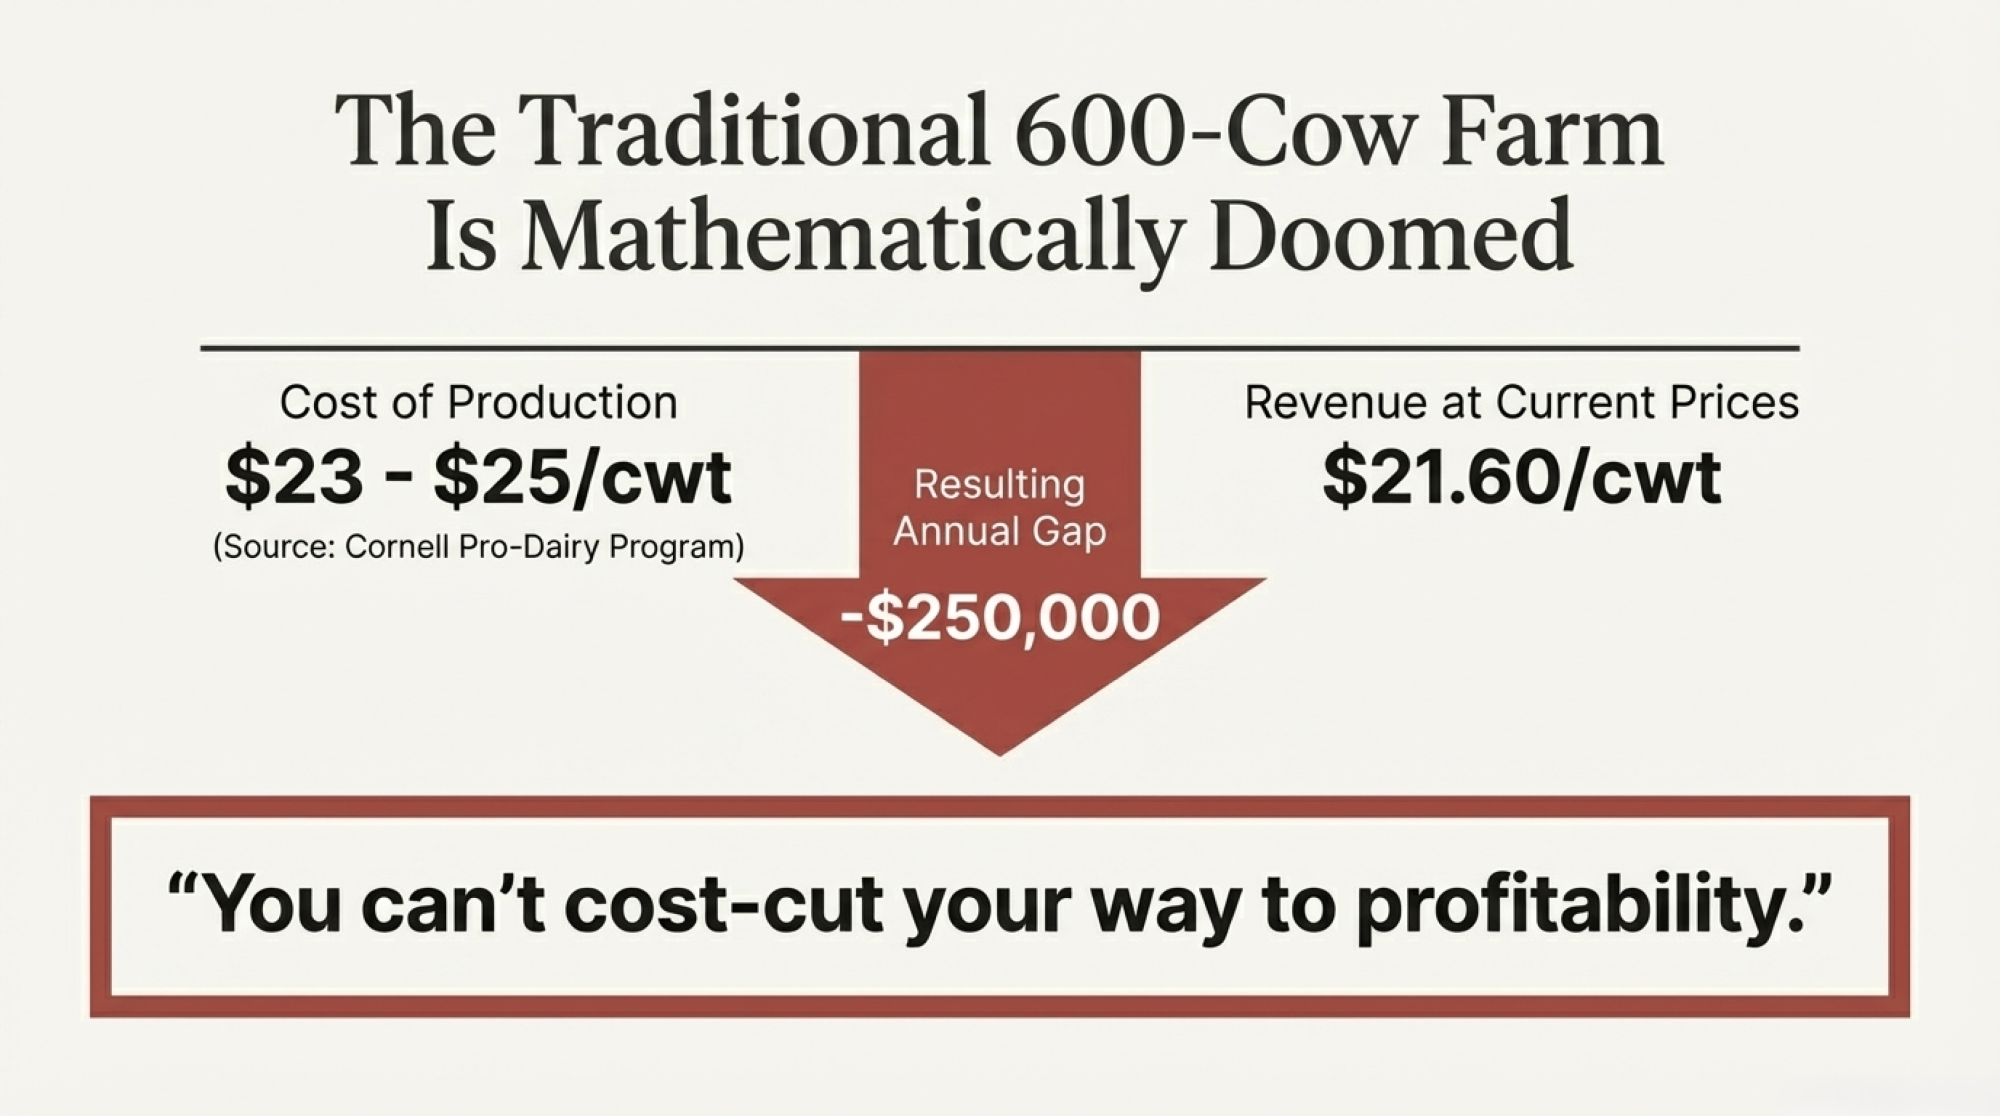
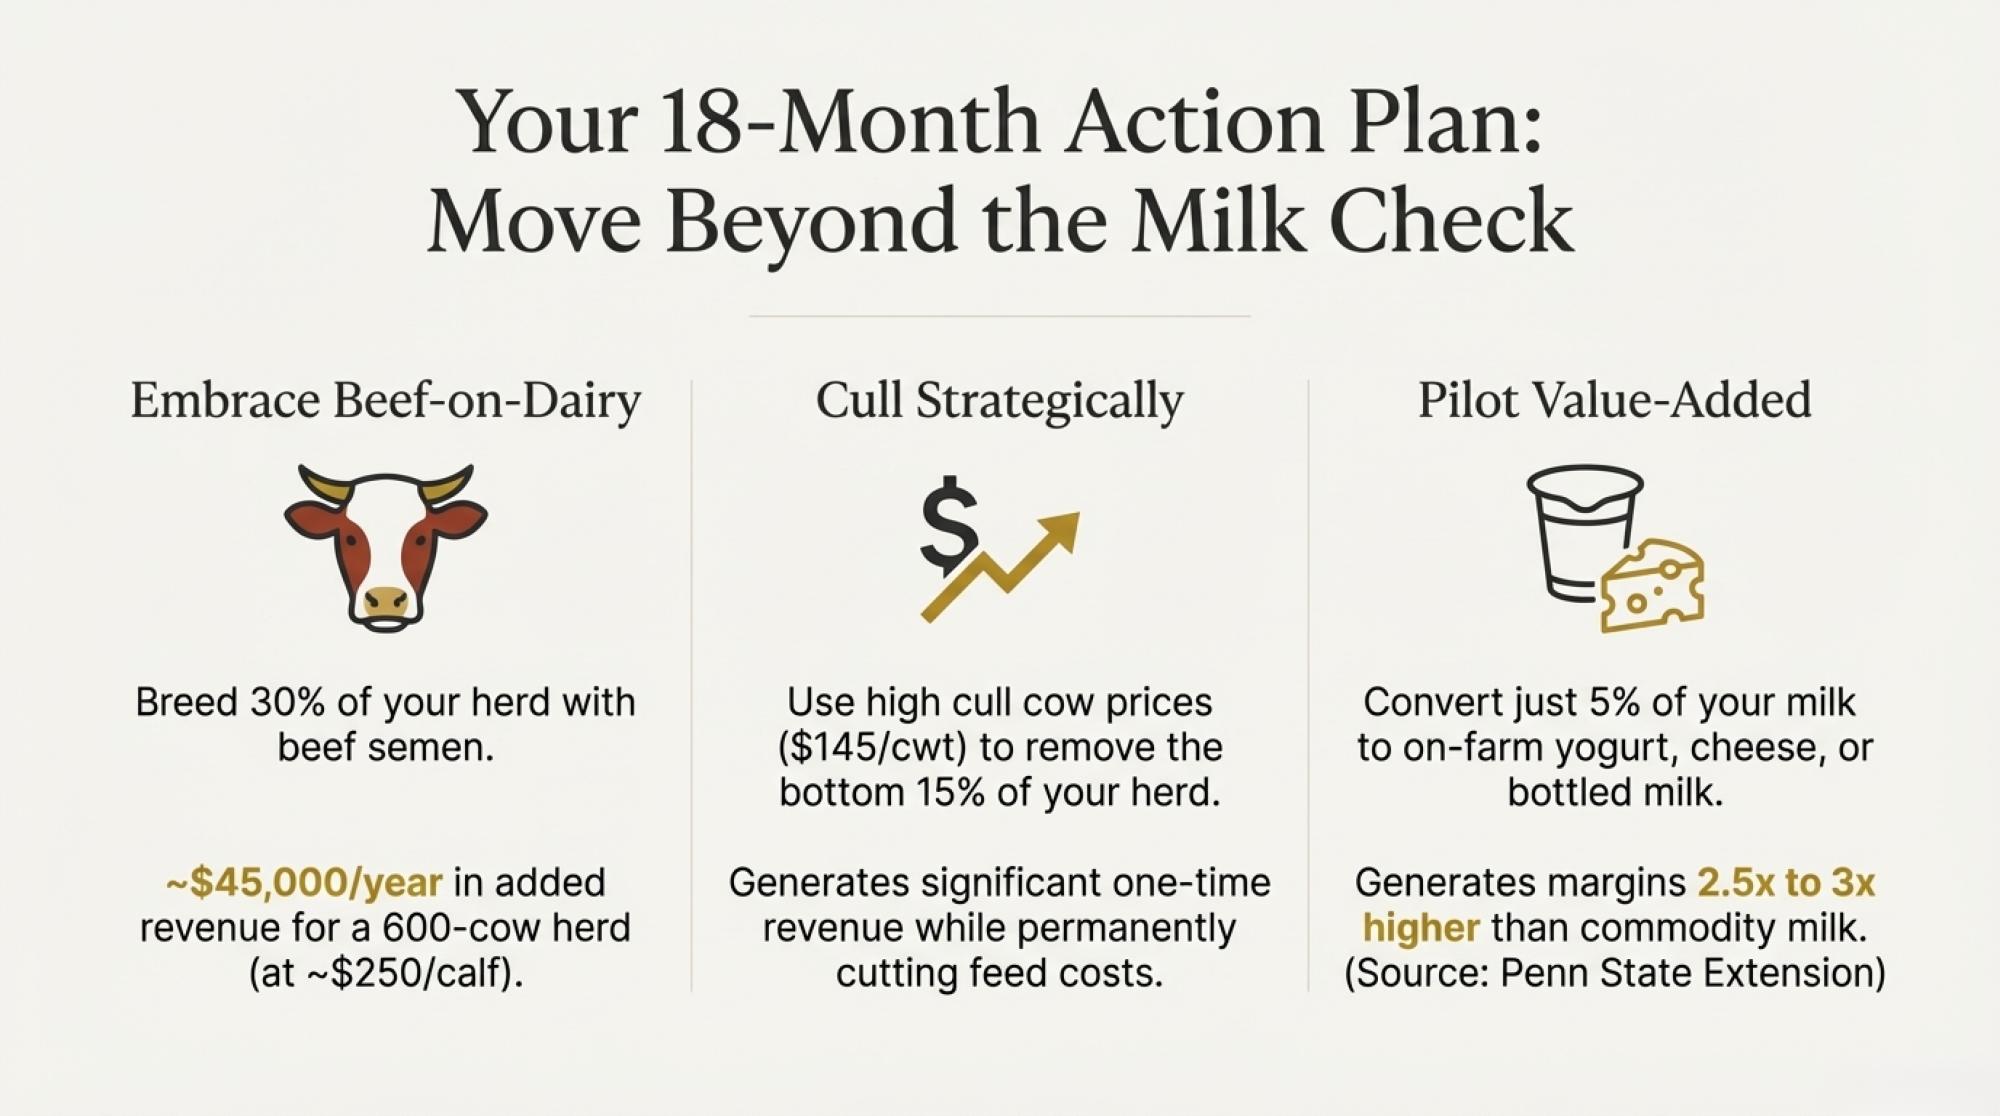
Executive Summary: Dairy isn’t just in a rough patch—it’s in a structural reset where exits don’t automatically tighten supply anymore. USDA’s 2022 Census shows a 39% drop in farms selling milk between 2017 and 2022, yet total production still climbed to about 226 billion pounds from roughly 9.4 million cows, backing Rabobank’s finding that nearly 70% of U.S. milk now comes from herds with 1,000+ cows. At the same time, CoBank reports that replacement heifer inventories are at a 20‑year low and could shrink by another 800,000 head even as processors pour about $10 billion into new plants that will need more reliable, high‑volume milk supplies. High cull values, record heifer prices, and strong beef‑on‑dairy calf markets are reshaping net replacement costs and culling strategy, while regional realities—from Darigold’s $4/cwt Pasco deduction in the Pacific Northwest to stronger Class I returns in the Southeast and thin‑margin “deadly middle” herds in the Upper Midwest—are making geography as important as genetics. This feature gives producers an 18‑month playbook: clean out chronic problem cows while beef is still strong, treat a 0.1 gain in feed efficiency as a $35–55/cow/year opportunity, and sit down with processors and lenders before they end up making the big decisions for the farm. The aim isn’t to preach a single “right” model, but to put the math, regional context, and survival questions on the table so every herd—from 200‑cow grazing outfits to 4,000‑cow dry‑lot systems—can decide whether to grow, pivot, or exit on its own terms.
Most of us have ridden out more than one down cycle. You know the pattern: prices drop, some herds sell out, milk supply tightens, and eventually things come back around.
Back in the 2000s, Cooperatives Working Together (CWT) ran 10 herd retirement rounds between 2003 and 2010 that removed 506,921 cows and an estimated 9.672 billion pounds of milk, according to CWT program reports and University of Missouri economic analysis cited in both Progressive Dairy coverage and academic case studies on U.S. dairy market power. Those removals were designed to pull milk off the market and did help support farmer milk prices during the 2009 crash, based on those evaluations. The playbook then was pretty straightforward: enough cows and herds left the industry, and the market eventually corrected.
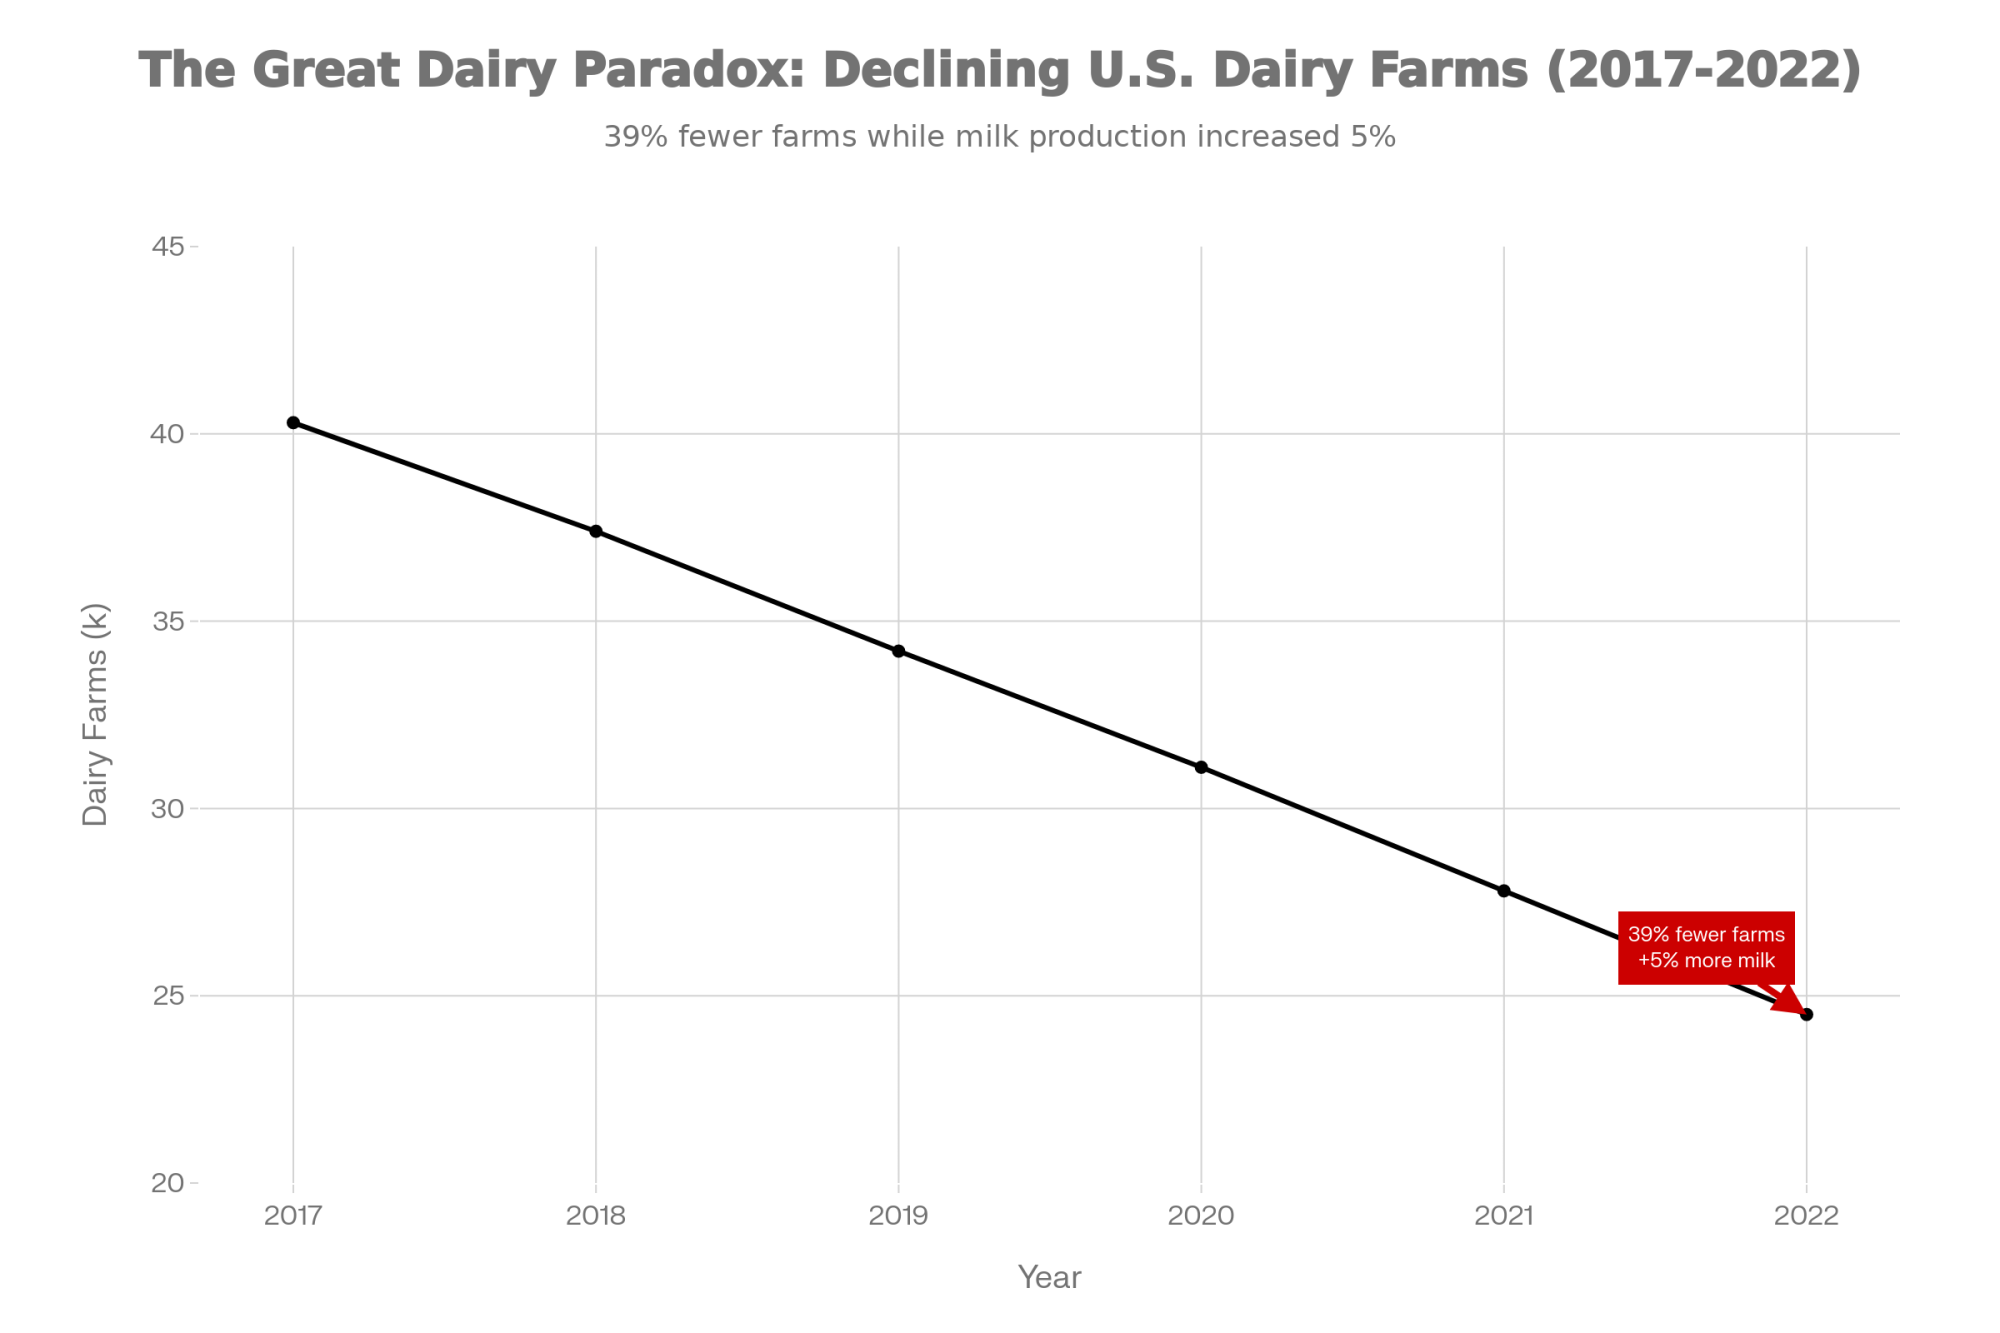
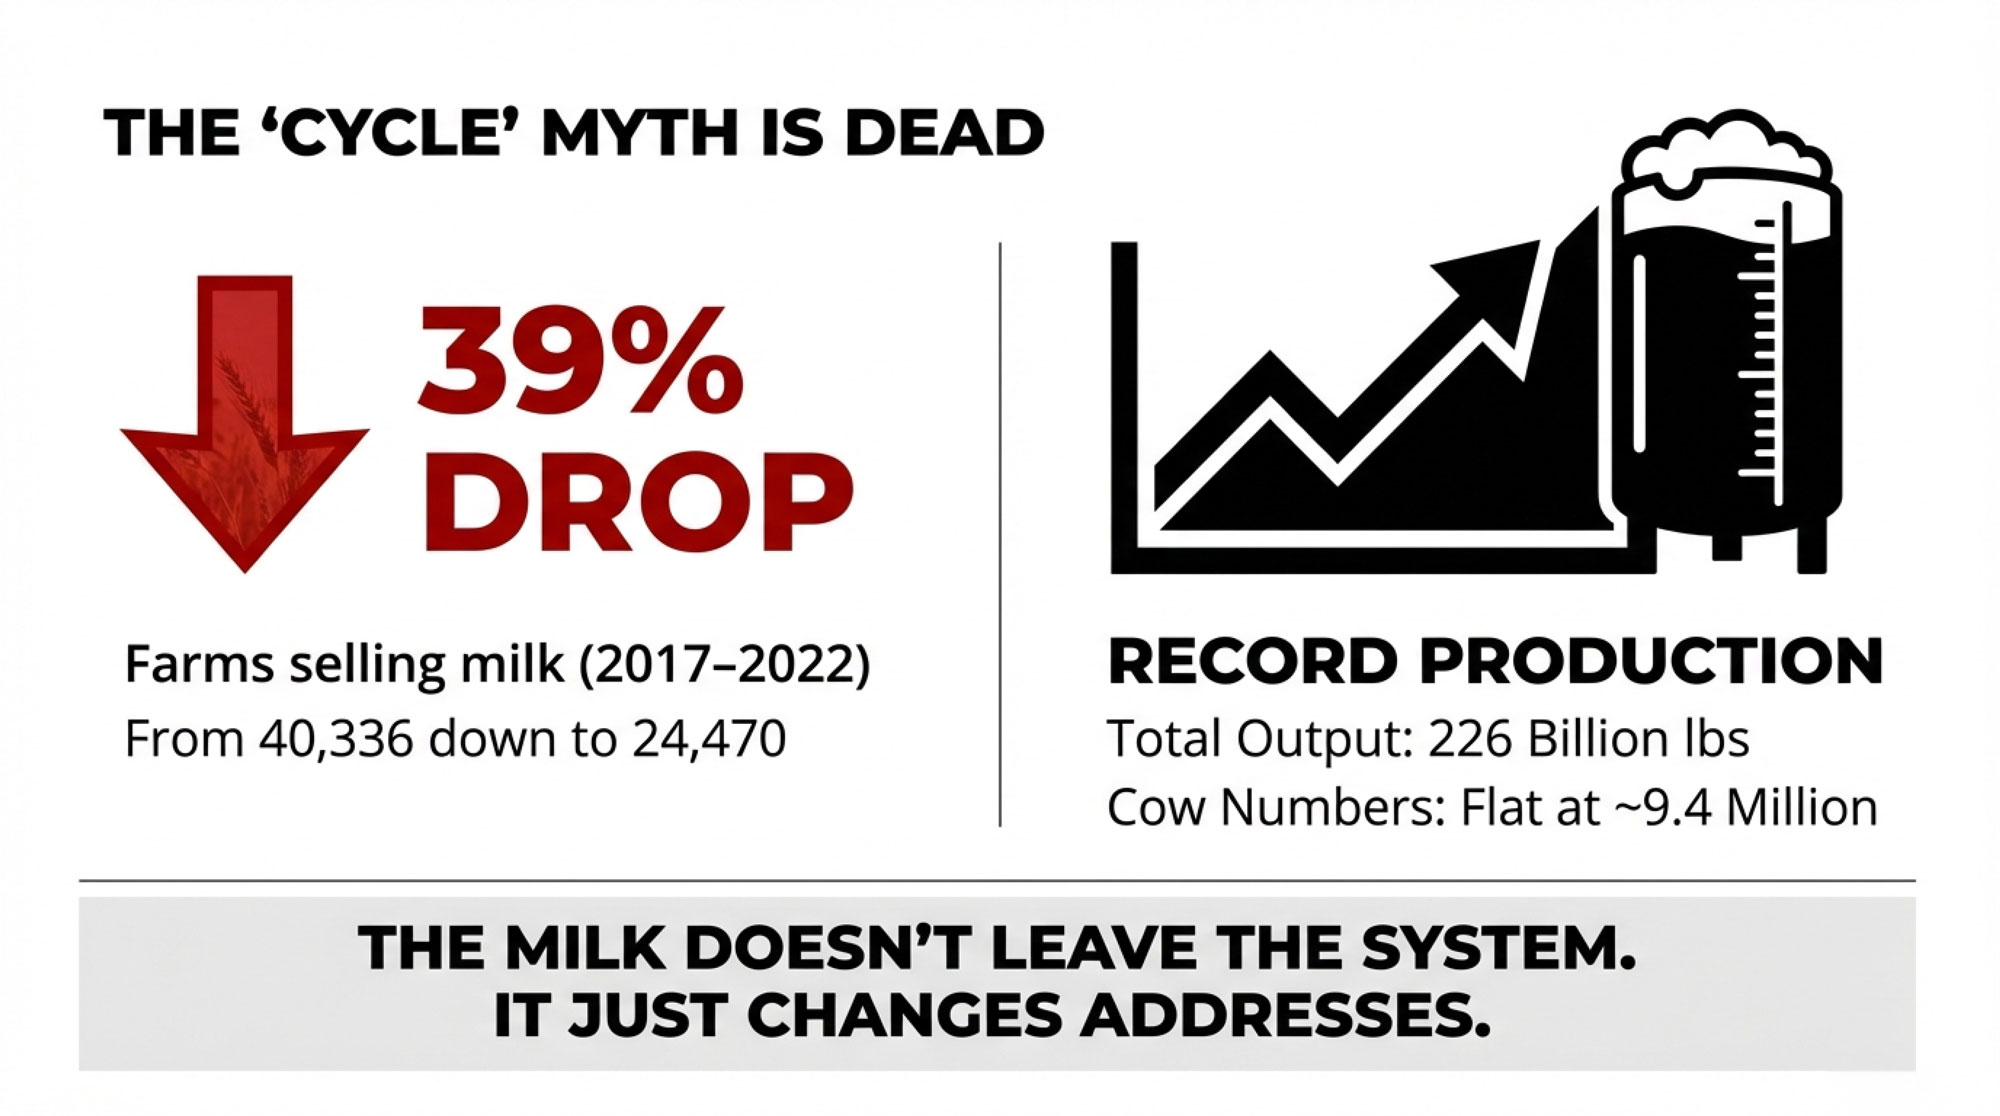
What’s interesting now is that we’re seeing plenty of exits again—but the milk isn’t disappearing the way it used to. USDA’s 2022 Census of Agriculture and milk-production summaries show that while farms with sales of milk from cows dropped from 40,336 in 2017 to 24,470 in 2022—a decline of about 39%—national milk output still climbed to around 226 billion pounds in 2022 with about 9.4 million milk cows, essentially steady cow numbers compared to prior years. Industry outlets covering the same census data have underscored that almost 4 in 10 dairy farms disappeared over those 5 years, yet total U.S. milk sales rose about 5%.
The Great Dairy Paradox: Between 2017 and 2022, U.S. dairy farms dropped 39% while national milk production increased 5% – proving the old “herd retirement tightens supply” playbook is broken
So the quiet question a lot of folks are asking—over coffee at winter meetings or in the parlor office—is: if this isn’t just another cycle, what exactly are we dealing with?
And honestly, if you’re still betting the next round of sellouts will rescue your milk price, you’re betting against the numbers.
Let’s walk through what the data says, how it’s playing out in different regions, and the kinds of decisions that seem to matter most over the next 18 months.
Looking at This Trend: Old Playbook vs. New Reality
Looking at this trend over time, it’s pretty clear that the industry’s default settings have changed. The tools that worked from roughly 2000 through the mid‑2010s just don’t behave the same way anymore.
The Structural Reset
Metric
Old Playbook (2000–2015)
New Playbook (2026+)
Supply control
Herd retirements and voluntary supply cuts through programs like CWT
On-farm culling targeted at performance, health, and butterfat; exits absorbed by larger herds
Growth strategy
Adding more stalls and more cows
Maximizing energy-corrected milk per cow and per pound of dry matter; feed efficiency as the primary lever
Primary income
Almost entirely from the milk check
Milk check plus stronger beef value from beef-on-dairy calves and high cull prices; some herds adding niche or premium markets
Heifer strategy
Raising nearly every dairy heifer born into the herd
Sexed dairy semen on top cows, beef semen on lower-end cows; raising or buying fewer, higher-value replacements
The old mindset assumed that enough CWT rounds or herd sales would tighten supply and lift prices. The data suggest something different: larger herds with lower costs per hundredweight are ready to step in when neighbors exit, blunting the supply‑tightening effect of those departures. University of Illinois economists looking at the 2022 Census noted that herds with 2,500 cows or more actually increased their share of the national milk supply even as total farm numbers dropped, confirming what many of us have seen anecdotally.
That’s a big shift in how risk and opportunity line up.
What the Census Is Really Telling You
The 2022 snapshot gets pretty eye‑opening when you dig into it. USDA’s dairy census highlights show that farms with sales of milk from cows fell from 40,336 in 2017 to 24,470 in 2022, a 39% drop in just five years. Over that same period, NASS milk‑production data show total U.S. milk production at roughly 226 billion pounds in 2022, with an average of 9.4 million cows—almost the same number of cows producing more milk.
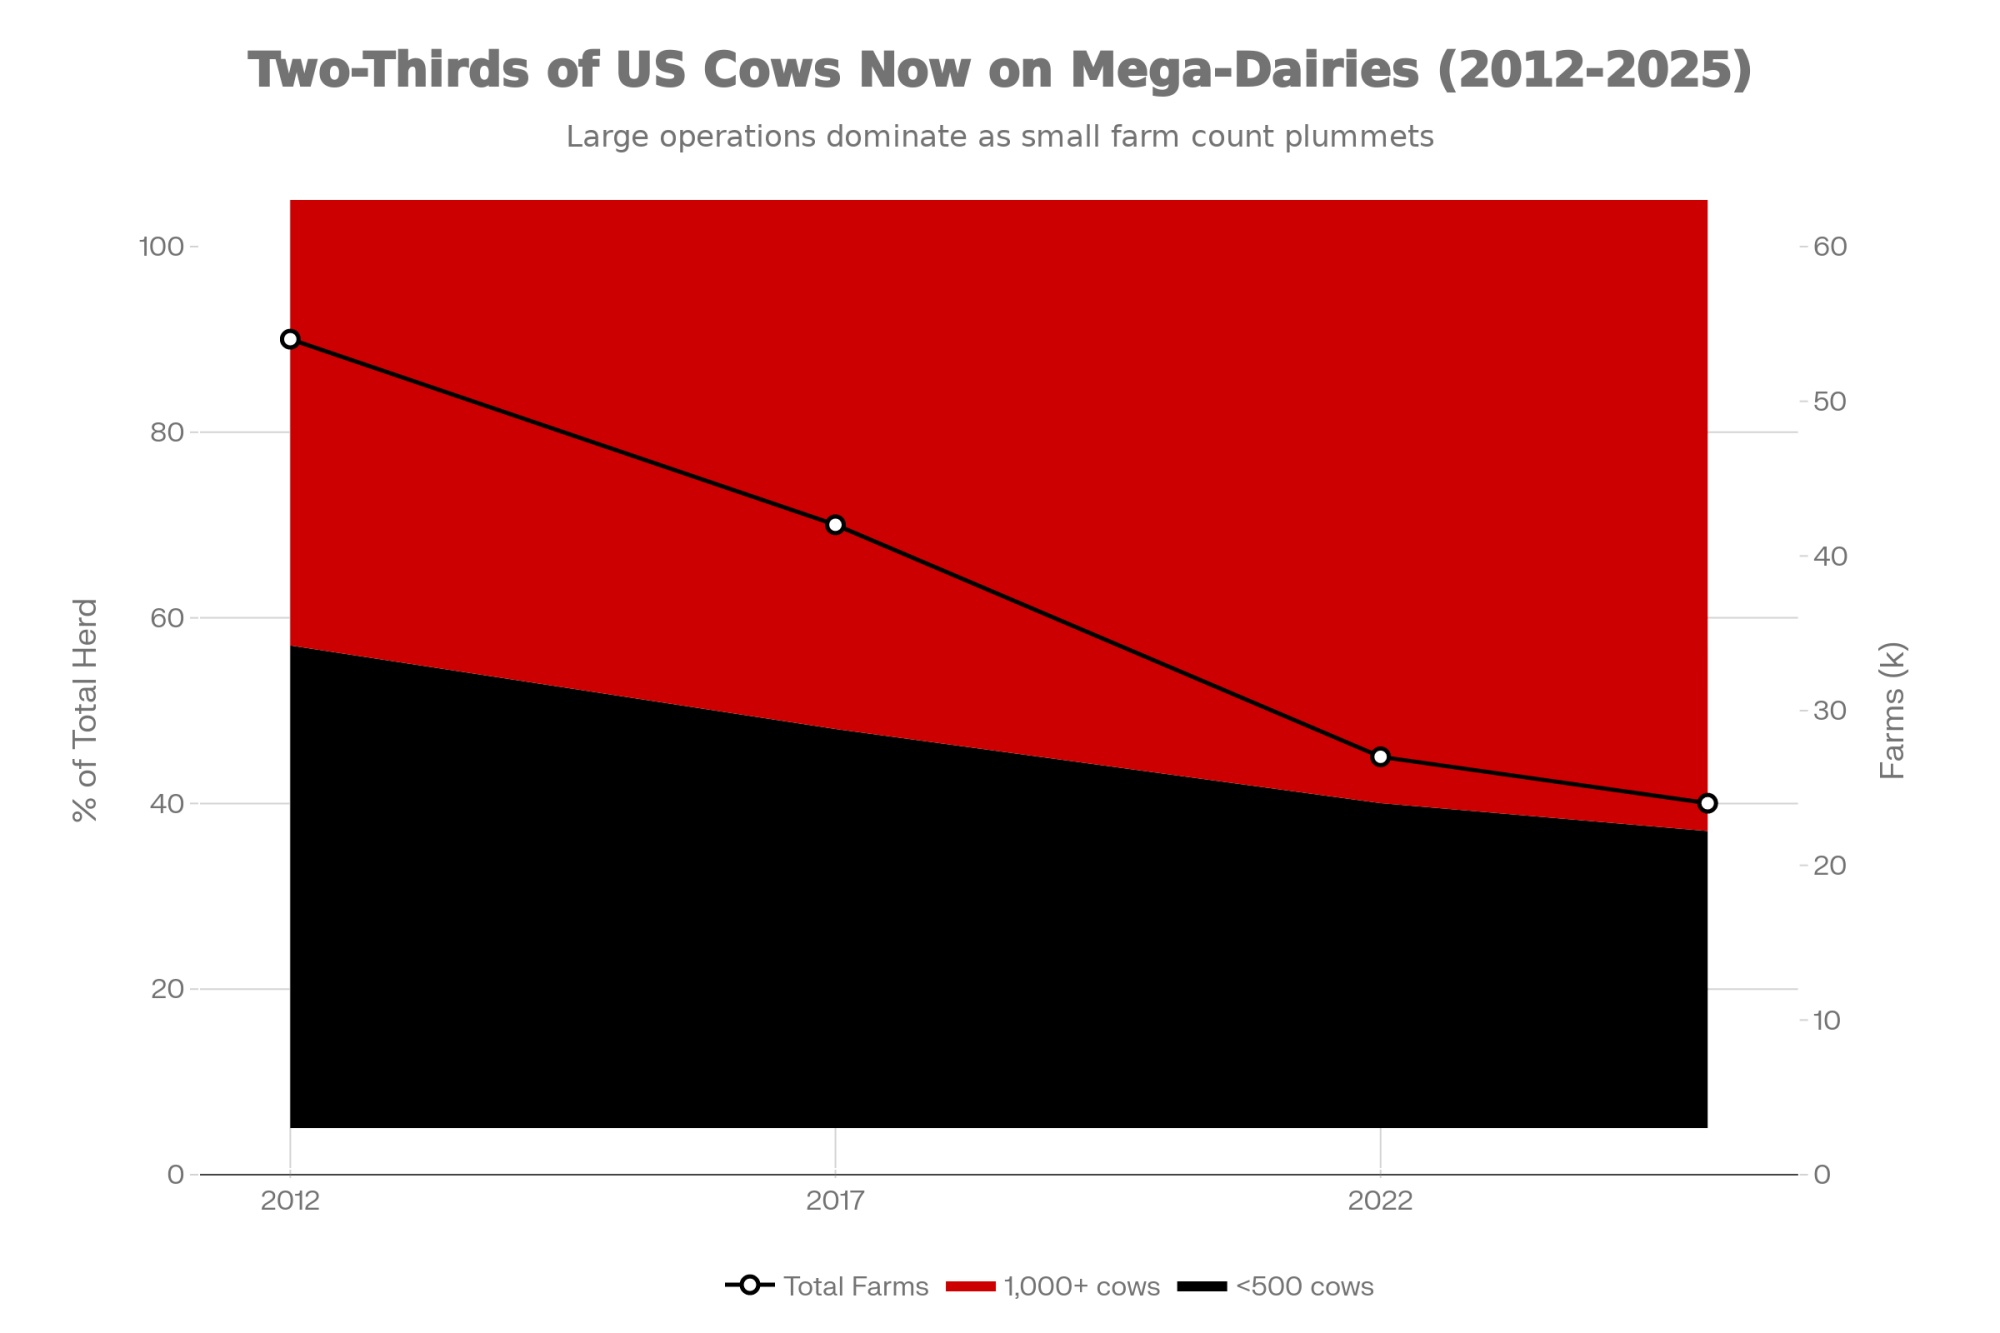
Rabobank’s consolidation analysis provides more detail. Senior dairy analyst Lucas Fuess points out that about 67–68% of U.S. milk is now produced on farms with 1,000 or more cows, even though those herds account for only a small single‑digit share of total operations. Summary of the same work notes that farms with more than 1,000 head produced 67% of U.S. milk in 2022, up from 60% in 2017.
So what many of us have seen on the ground—the milk concentrating on fewer, larger farms—is exactly what the national numbers are telling us.
You probably know this pattern already if you’ve watched what happens when a neighbor exits. Many larger operations in Wisconsin, the West, and the Plains report absorbing cows from exiting neighbors—keeping the best animals, tightening up their fresh cow management and transition period, and culling more sharply for poor butterfat performance, health, and reproduction. The net result is that the milk doesn’t really leave the system. As one producer put it at a recent regional meeting, when a herd sells out, “the milk just changes addresses.”
That’s why one of the old assumptions—“enough farms sell out, and prices will snap back”—just isn’t as reliable as it used to be. The supply side has become much more resistant to exits because large herds, often with strong genetics and efficient systems, are ready and able to absorb the volume.
Regional Darwinism: Why Geography Is Now Destiny
What farmers are finding is that national averages hide a lot. Your region—and quite often your processor mix—now matters almost as much as your butterfat and protein levels when it comes to long‑term viability.
Region
Structural Tailwinds
Structural Headwinds
Class I Utilization
2025 Outlook
Pacific Northwest
Export-oriented processing capacity (Pasco plant)
$4/cwt co-op deduction, low Class I (~20%), environmental scrutiny
~20–22%
High risk: Co-op capital costs hitting checks directly
Southeast
High Class I demand, restored “higher-of” pricing, dense population
Limited land for expansion, summer heat stress
~28–32%
Favorable: Policy and demographics working together
Upper Midwest
Strong processing base, established supply chains, agronomic fit
Massive scale, sophisticated genetics, year-round production
High land/labor costs, strict environmental regs, water constraints
~21–24%
Stable consolidation: Fewer, larger, more efficient herds
Pacific Northwest: When Headwinds Stack Up
In the Pacific Northwest, especially Washington and Oregon, producers are facing several headwinds at once.
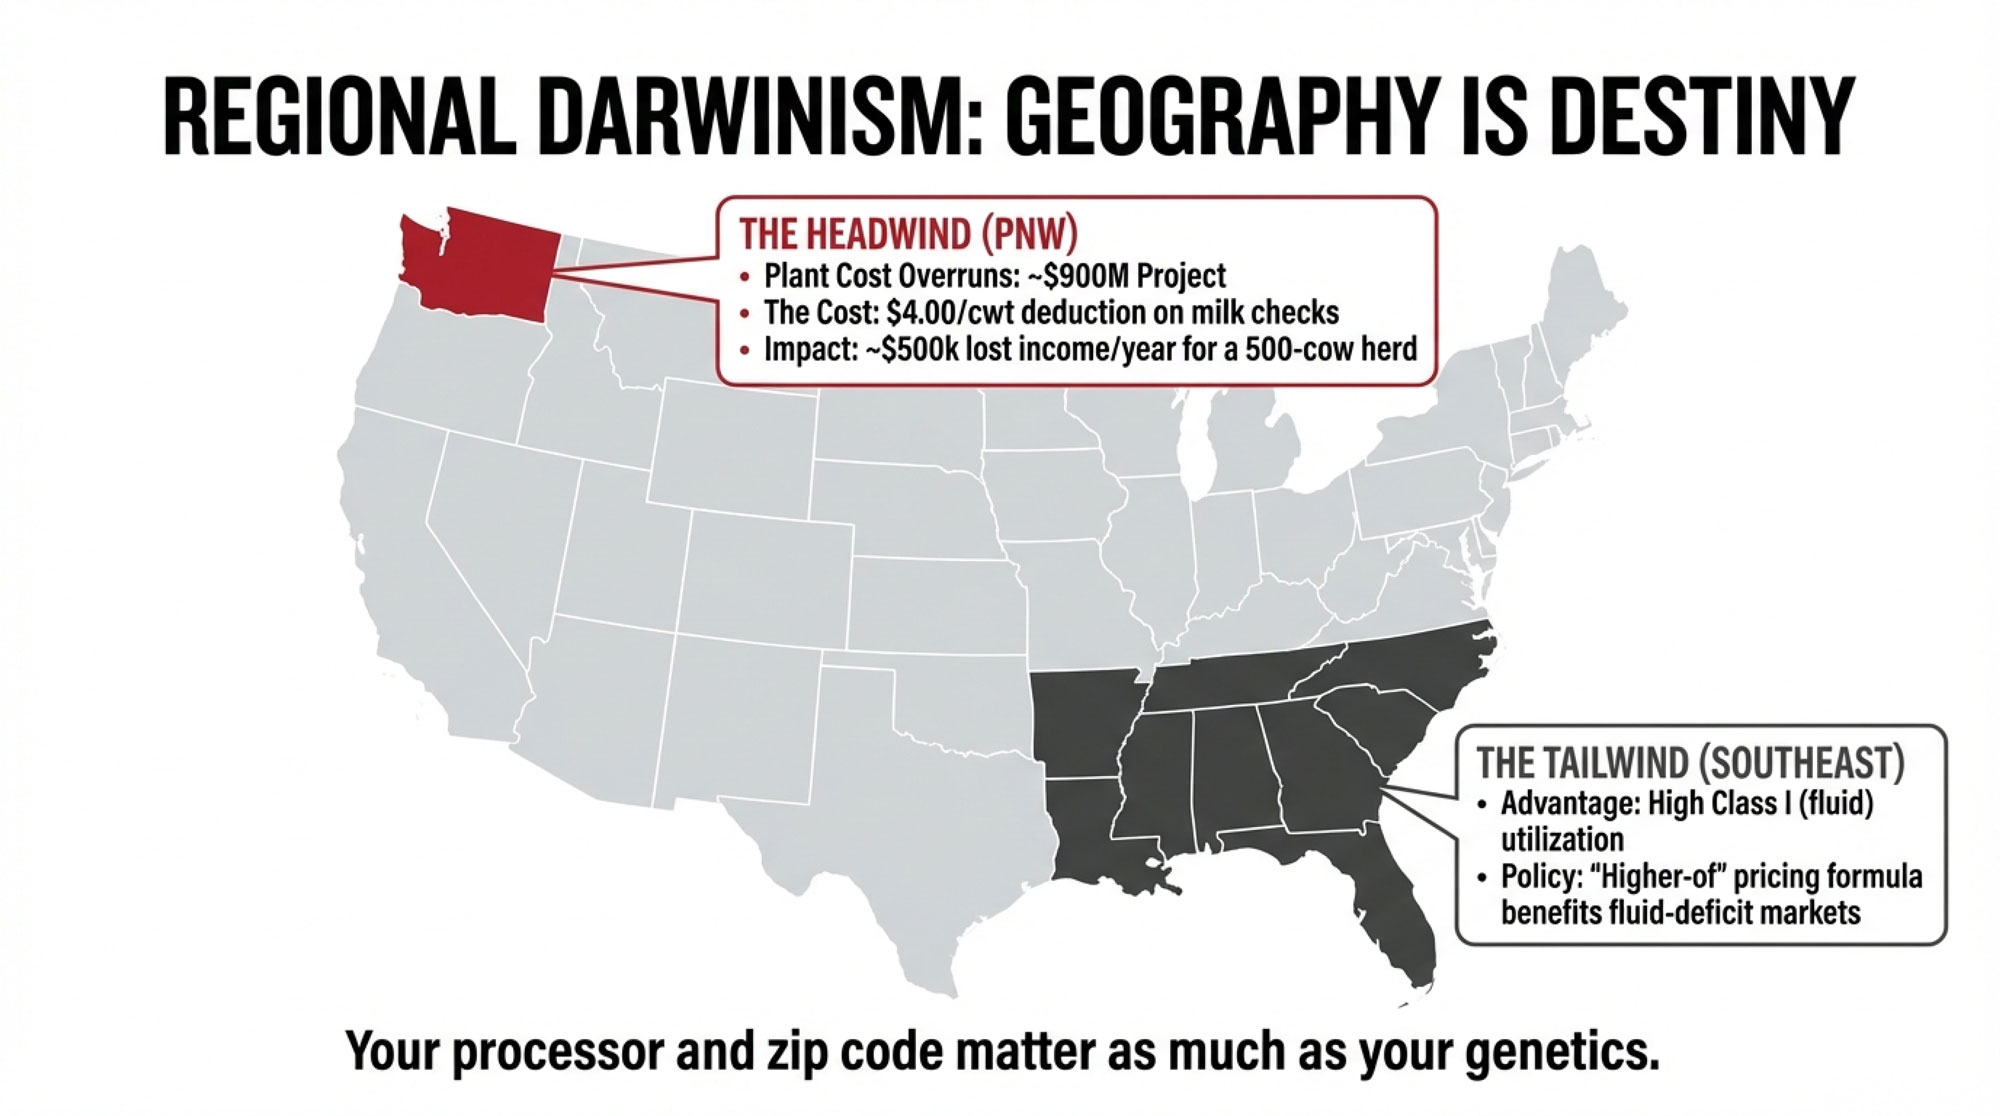
The one everyone’s talking about is Darigold’s new plant at Pasco, Washington. Darigold announced and broke ground on a $600‑million production facility at the Port of Pasco in 2022, designed to handle milk for butter and powder and serve export markets, according to cooperative announcements and Bullvine coverage. By May 2025, Capital Press was reporting that the plant was about $300 million over budget, based on people familiar with the project, pushing total costs toward $900 million. Follow‑up coverage has described the Pasco facility as the largest dairy plant in the Northwest, coming online at a much higher price tag than originally forecast.
To help cover those overruns and broader financial strain, Darigold’s board approved a $4‑per‑hundredweight deduction on member milk checks for at least several months, with $2.50 of that earmarked explicitly for Pasco construction costs, according to a mid‑April member letter. The $4/cwt reduction hit member pay prices in mid‑2025. For a 500‑cow herd shipping 125,000 cwt a year, that’s roughly $500,000 less milk income across 12 months—before you even talk about feed, labor, or interest.
Darigold’s Pasco plant ballooned from $600M to $900M, triggering a $4/cwt member deduction that costs a typical 500-cow operation roughly $500,000 annually
Several Washington producers shipping to Darigold have told reporters at Dairy Herd Management and local papers that the $4/cwt reduction, stacked on top of regular cooperative deductions, made it very hard to cash flow their operations. Those are the kinds of numbers that separate “tight” from “unworkable.”
Then there’s the federal order piece. USDA federal order data shows Class I (fluid) utilization in the Pacific Northwest order hovering around 20–22% in recent years, while “All Markets Combined” Class I utilization nationally is typically in the mid‑ to upper‑20% range. That gap matters because it means more milk in that region gets priced into lower‑valued Class III and IV pools rather than the Class I fluid market.
Regulation adds another layer. In Washington’s Yakima Valley, nitrate contamination concerns have led to consent decrees and added oversight of several large dairies, with some operations closing or restructuring under pressure from regulators and environmental groups, as described by Capital Press and Washington State Dairy Federation representatives. So producers there are trying to operate under below‑average Class I utilization, substantial environmental scrutiny, and a major co‑op project that’s gone significantly over budget.
The Pasco Lesson: When Co‑op Projects Become Producer Risk
The Darigold Pasco story has become a cautionary lesson about how cooperative‑led capital projects can shift risk back onto member farms.
Initial plan: A $600‑million, world‑class plant to process up to 8 million pounds of milk per day and export butter and powder to more than 30 countries.
Updated reality: Cost overruns pushing total investment toward $900 million, plus a $4/cwt deduction on member milk checks, with $2.50 directly tied to the plant and the remainder covering other financial shortfalls.
What this development suggests isn’t that co‑ops shouldn’t invest. It’s that:
The scale and risk of major projects need to be clearly communicated to members at the farm level.
There should be a realistic plan for what happens if budgets slip or markets change.
Producers need to know how much of their milk check might be diverted to debt service if things don’t go according to plan.
In plain terms, Pasco is a reminder of what co‑op membership really means: you’re not just selling milk—you’re partnering in capital decisions. That kind of surprise bill would hurt any operation, no matter how well run.
Southeast: Structural Tailwinds and Careful Optimism
Now slide across the map to the Southeast—Florida, Georgia, the Carolinas, parts of the lower Appalachians—and the structural picture looks very different.
USDA federal order summaries consistently show higher Class I utilization in Southeast‑oriented orders because of dense population and strong fluid‑milk demand. That built‑in demand has always mattered, but recent policy changes have made it even more important.
USDA’s federal order modernization decision restored the “higher‑of” Class I skim pricing formula and updated Class I differentials. Analysis found that these changes tend to increase Class I values more in fluid‑deficit markets in the East and Southeast than in regions dominated by manufacturing. Progressive Dairy and Dairy Herd coverage of the 2024–2025 seasons described many Southeastern producers as having one of their better financial years in a while, with improved Class I pricing, decent overall milk prices, and somewhat softer feed costs lining up in their favor.
So if you take two 500‑cow herds—similar genetics, comparable butterfat performance, similar feed efficiency—and put one in a strong Southeast Class I market and the other in a Western market with lower Class I utilization, it’s common for the Southeast herd to see significantly higher gross revenue at the same production level. That’s geography and policy working together, not just management.
Upper Midwest: The “Deadly Middle” in America’s Dairy Heartland
In Wisconsin and Minnesota, the story is familiar but still evolving. This region still feels like the heart of U.S. dairying, but a certain band of herds is under real structural pressure.
USDA and state data show licensed dairy herds in Wisconsin falling from more than 10,000 in the early 2010s to under 7,000 by 2022, even as total state milk production stays near or at record highs. Farmdoc’s national work highlights the same pattern: sharp drops in herd numbers, modest changes in total cow numbers, and higher milk production overall.
Zisk Analytics’ profitability maps, featured regularly in Dairy Herd and other farm media, often show the Southeast and parts of the Southwest near the top for projected profit per cow, with many Upper Midwest herds—especially smaller and mid‑size ones—clustered in thinner‑margin categories. Plenty of Midwest producers say they’re still “making it work,” but they also admit there isn’t much cushion left if something goes sideways.
The 400–600 Cow Squeeze: Dairy’s “Deadly Middle”
This is the segment that’s really stuck in the middle.
Typical profile of the 400–600 cow “no‑man’s land” herd:
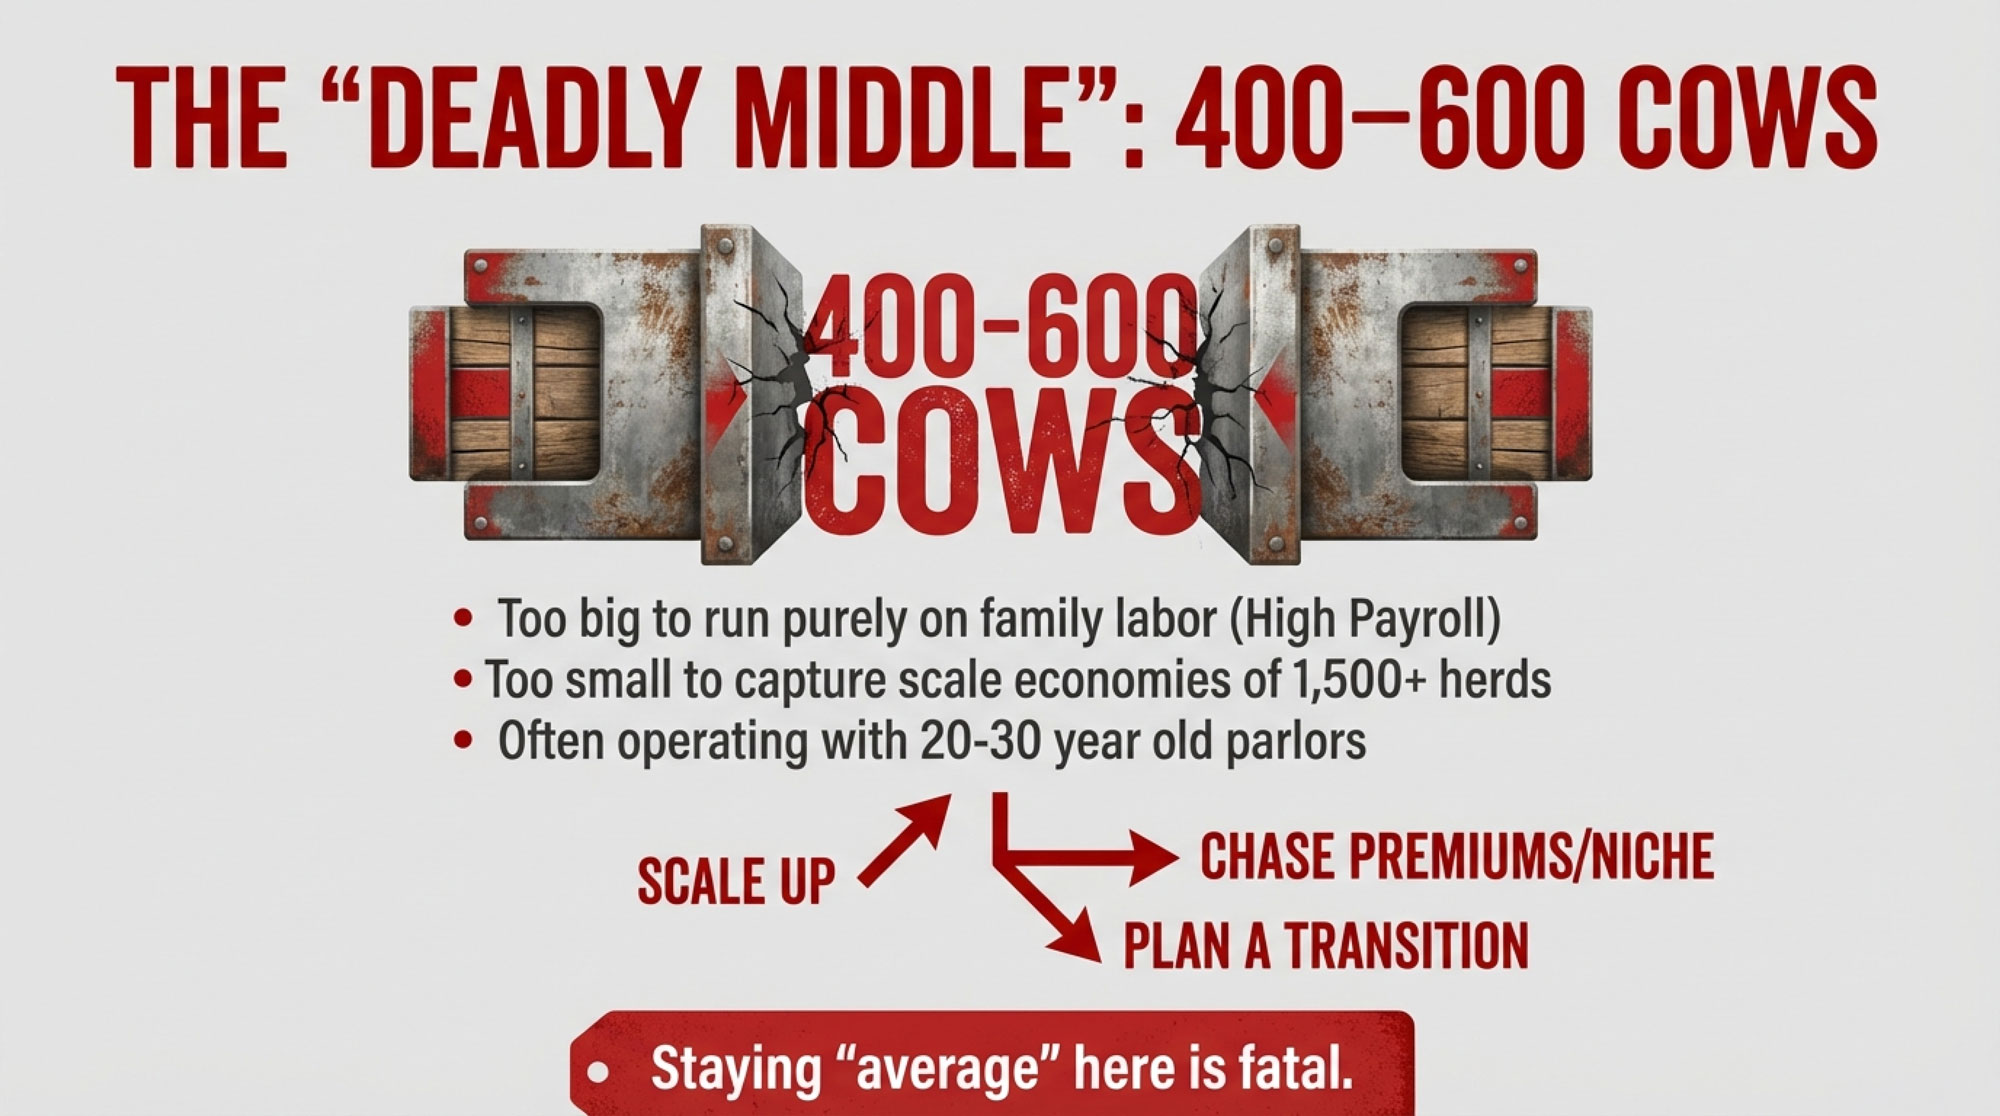
400–600 Holsteins, often in 20‑ to 30‑year‑old parlors or older freestalls
Solid, but not elite, feed efficiency and components
Bulk milk is sold into commodity pools, with limited premiums
Mix of family and hired labor, with real payroll costs
Some debt, but not extreme
Too big to run purely on family labor. Too small to fully capture the per‑cow cost advantages that 1,500‑ or 3,000‑cow herds can achieve. Not differentiated enough to earn strong value‑added premiums consistently. That picture lines up with Rabobank’s census‑based finding that farms with 100–499 cows have lost share of U.S. milk output while 1,000‑plus cow units gained share.
In many Wisconsin operations and across the Upper Midwest, what I’ve noticed is that these herds often feel boxed in. They can’t easily cut costs without hurting cow comfort or fresh cow management. They can’t easily scale without major capital. And they’re not always well‑positioned for organic, grass‑based, or on‑farm processing.
If you’re in that 400–600 cow band, the uncomfortable reality is that staying “average” has become a very risky strategy. Hoping your way out of structural math isn’t a plan—it’s a gamble. That doesn’t mean you’re out of options. It does mean this group needs especially clear decisions: whether to pursue scale, chase premiums, partner with neighbors, or plan a well‑timed transition. Just waiting for the next “good cycle” is a much bigger bet than it used to be.
California: Big, Efficient, and Still Under Pressure
We can’t talk about U.S. dairy without mentioning California. The state still has more dairy cows than any other and remains a powerhouse for cheese, butter, and milk powder.
Reports from the California Department of Food and Agriculture and USDA’s milk production summaries show that California’s dairy cow numbers have leveled off or edged down slightly in recent years, while per‑cow production remains among the highest in the country. Many of those cows are in large freestall and drylot systems with strong genetics, sophisticated feeding programs, and very deliberate fresh-cow management.
At the same time, California herds are navigating:
Groundwater and surface‑water regulations that shape where and how dairies can operate
Air quality and manure‑management rules that add cost and complexity
High land and labor costs relative to many other regions
A competitive but sometimes volatile processing environment
Analysts generally expect California to remain a major milk state, but to continue consolidating toward fewer, larger herds—similar to broader trends in the West. Some operations will double down on scale and efficiency, while others are leaning into value‑added products or multi‑state footprints to spread risk.
What Farmers Are Finding About Feed Efficiency
What farmers are finding, as they dig into their numbers with nutritionists and Extension, is that feed efficiency may be one of the most powerful levers they still fully control.
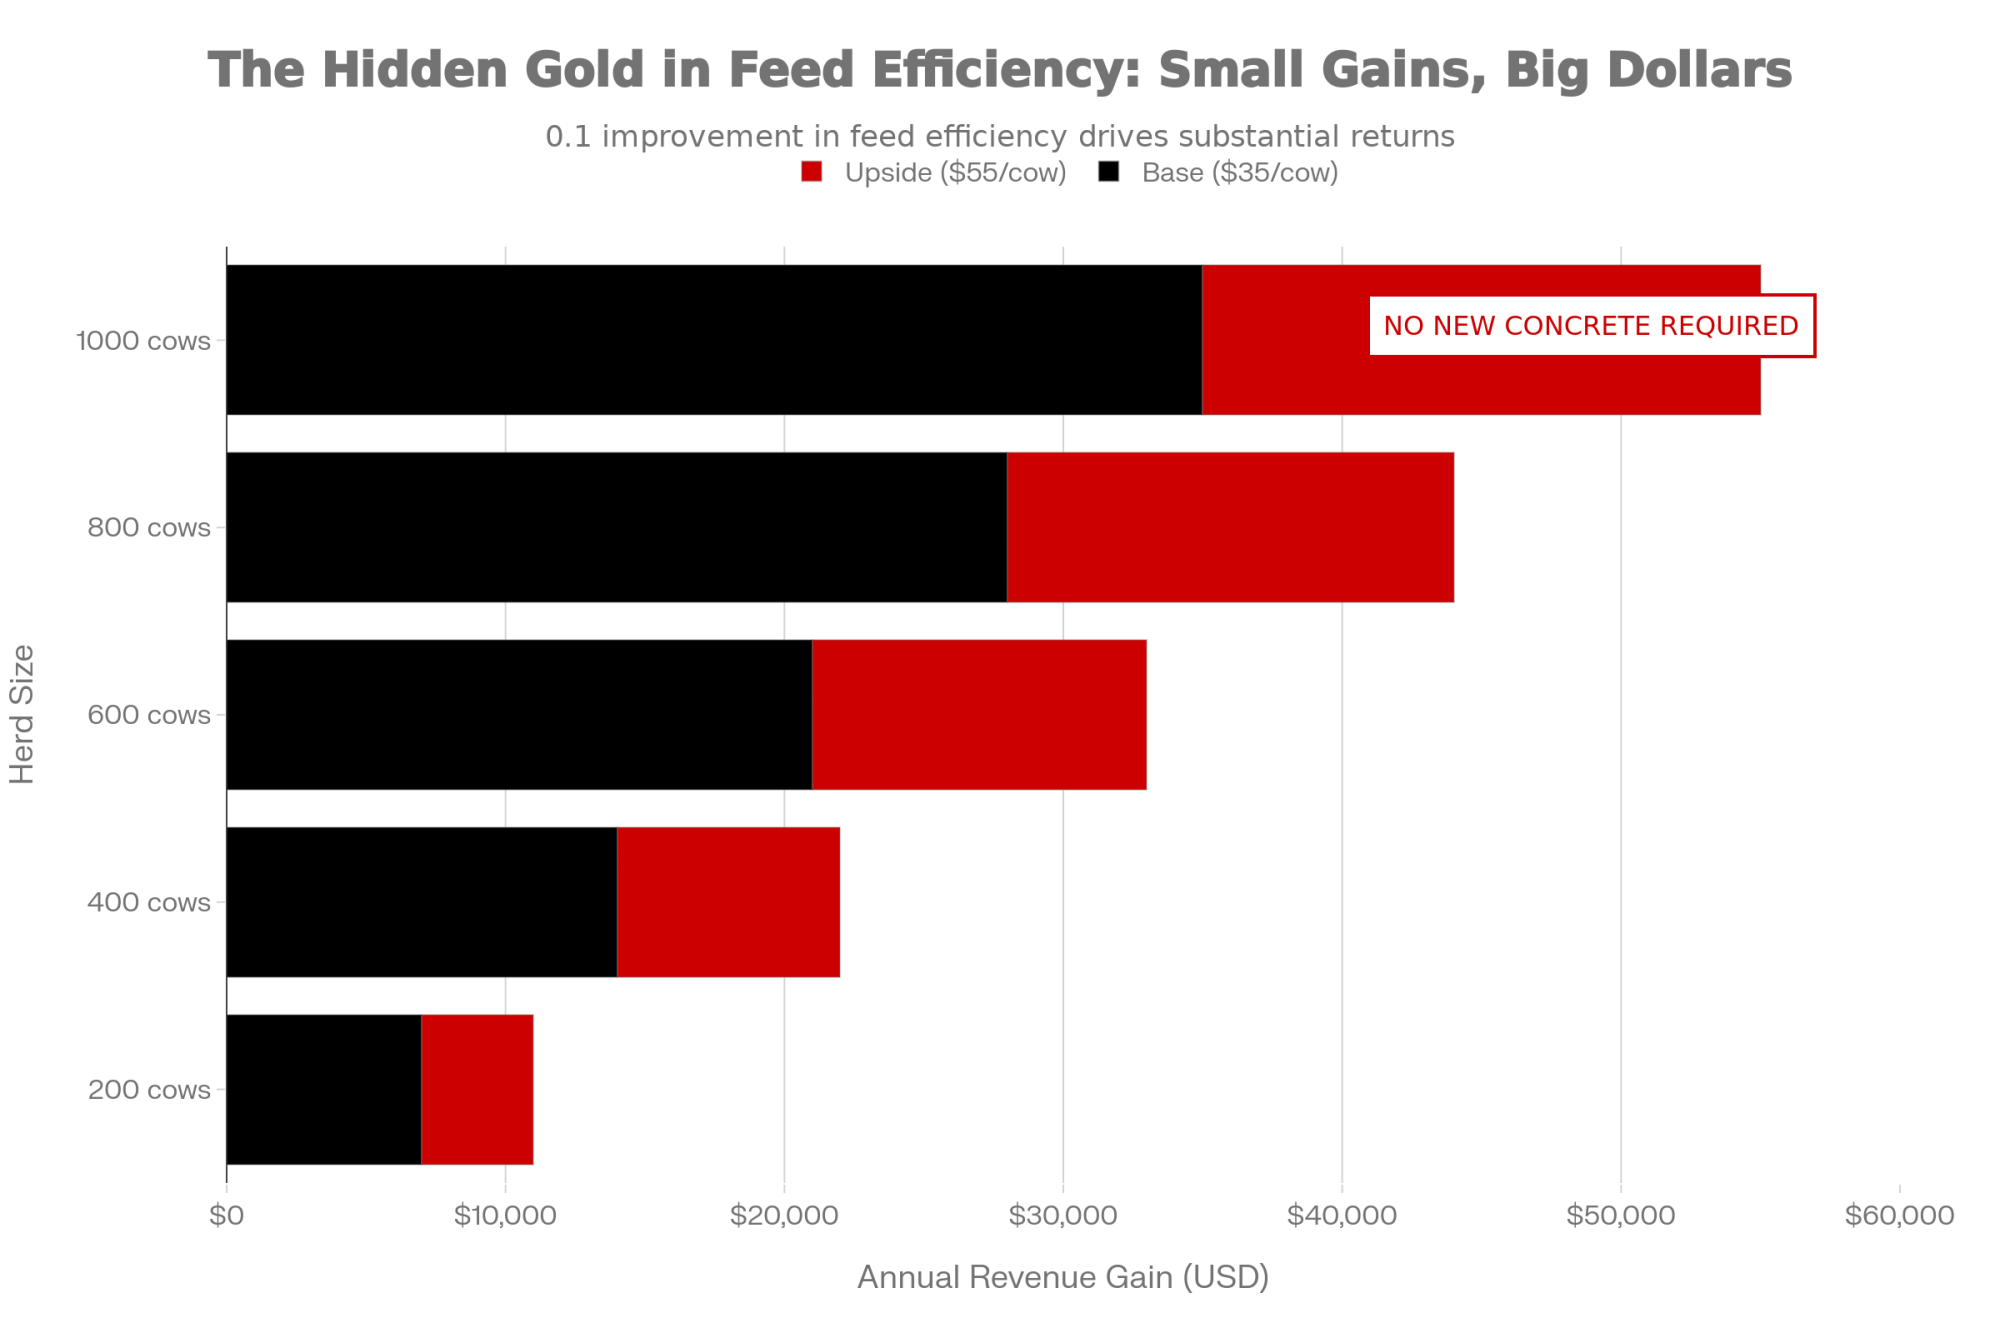
A national dairy Extension article on feed efficiency describes energy‑corrected milk per pound of dry matter as one of the strongest and most overlooked tools on many dairies. As a guideline, that article notes that for each improvement of 0.1 unit in feed efficiency—say, from 1.4 to 1.5—the increase in income can range from 15 to 22 cents per cow per day, assuming typical milk and feed prices. University economists and consultants have shown similar numbers, with Mike Hutjens demonstrating that feed efficiency improvements can quickly add tens of cents per cow per day to margins when feed costs are 15 cents per pound of dry matter.
To stay conservative, many advisors suggest budgeting 10–15 cents per cow per day for a 0.1 improvement. Over a full year, that’s about $35–55 per cow. On a 500‑cow herd, that’s roughly $18,000–27,500 a year from one modest bump in efficiency.
Feed efficiency improvements offer $35-55 per cow annually with no capital investment – on a 600-cow herd, that’s up to $33,000 from better forage allocation and transition management
Herd Size
Low Estimate ($35/cow)
High Estimate ($55/cow)
Total Range
200 cows
$7,000
$11,000
$7K–$11K
400 cows
$14,000
$22,000
$14K–$22K
600 cows
$21,000
$33,000
$21K–$33K
800 cows
$28,000
$44,000
$28K–$44K
1,000 cows
$35,000
$55,000
$35K–$55K
Peer‑reviewed work and Extension surveys on transition health and disease keep reinforcing that connection. A 2021 study of dairy herds in the journal Pathogens and subsequent reviews in Animals and other journals documented that mastitis and other health events increase treatment costs, reduce milk yield, and increase culling risk. Reviews of cow longevity and economic performance show that herds with fewer transition‑period problems and better reproductive performance can improve both animal welfare and profitability by extending productive lifespans.
On real farms, the herds that are squeezing more milk out of each pound of dry matter tend to share a few habits:
Forage testing and smart allocation. Forage analyses—NDF digestibility, starch, protein—are actually used, not just filed. The highest‑quality forages go to fresh and high‑producing cows, with lower‑quality lots assigned to late‑lactation cows and heifers. Extension specialists and industry nutritionists consistently show how differences in forage quality drive both butterfat performance and overall feed efficiency.
Transition period as a non‑negotiable. Comfortable close‑up and fresh pens, consistent DCAD and energy strategies, and careful monitoring of fresh cow intakes and health are built into daily routines. Field work and research keep showing that fewer fresh‑cow disorders mean higher peaks, better reproduction, and more efficient use of feed over a cow’s life.
Bunk management discipline. Feeding times are consistent, loading errors are minimized, refusals are checked, and feed is pushed up often enough that cows can access it throughout the day. Economists and nutritionists have pointed out how inconsistency—especially in timing and mix accuracy—can quietly erode both feed efficiency and component yields.
What’s encouraging is that most of these improvements don’t require new concrete. They require better measurement, clear targets, and consistent habits. In a year where margins are tight and interest isn’t cheap, that’s where a lot of the hidden money is.
Replacement Heifers, Beef‑on‑Dairy, and the New Culling Math
Category
Typical 2025 Range (USD)
Annual Impact (500-cow herd, 35% cull rate)
Replacement heifer (national avg)
$2,400 – $2,900
+$420,000 – $507,500 (175 replacements)
Western springer (top end)
$3,500 – $4,000
+$612,500 – $700,000 (if sourcing West)
Beef-on-dairy calf(weaned/feeder)
$1,000 – $1,400
+$50,000 – $70,000 (50 calves)
Day-old beef-cross calf
$600 – $750
+$30,000 – $37,500 (50 calves)
Cull cow (sound, 1,400 lb)
$1,700 – $1,800
+$297,500 – $315,000 (175 culls)
Net replacement cost (heifer – cull)
$800 – $1,300 per head
+$140,000 – $227,500 annual
Cost per CWT across tank
$0.50 – $0.75/cwt
Spread across 125,000 cwt shipped
Cull price risk (20% decline)
–$340 – $360 per cull
–$59,500 – $63,000 if you wait
To understand why culling decisions feel so different now, you’ve got to look at heifers and calves.
A 2025 report from CoBank’s Knowledge Exchange, highlighted that U.S. dairy replacement heifer inventories have fallen to a roughly 20‑year low. CoBank’s modeling suggests heifer inventories could shrink by another 800,000 headover the next two years before beginning to rebound around 2027, based on predictions of breeding practice changes and herd demographics. That’s coming from sexed dairy semen being used more strategically on the top end of the herd, beef semen on the rest, and more disciplined replacement strategies.
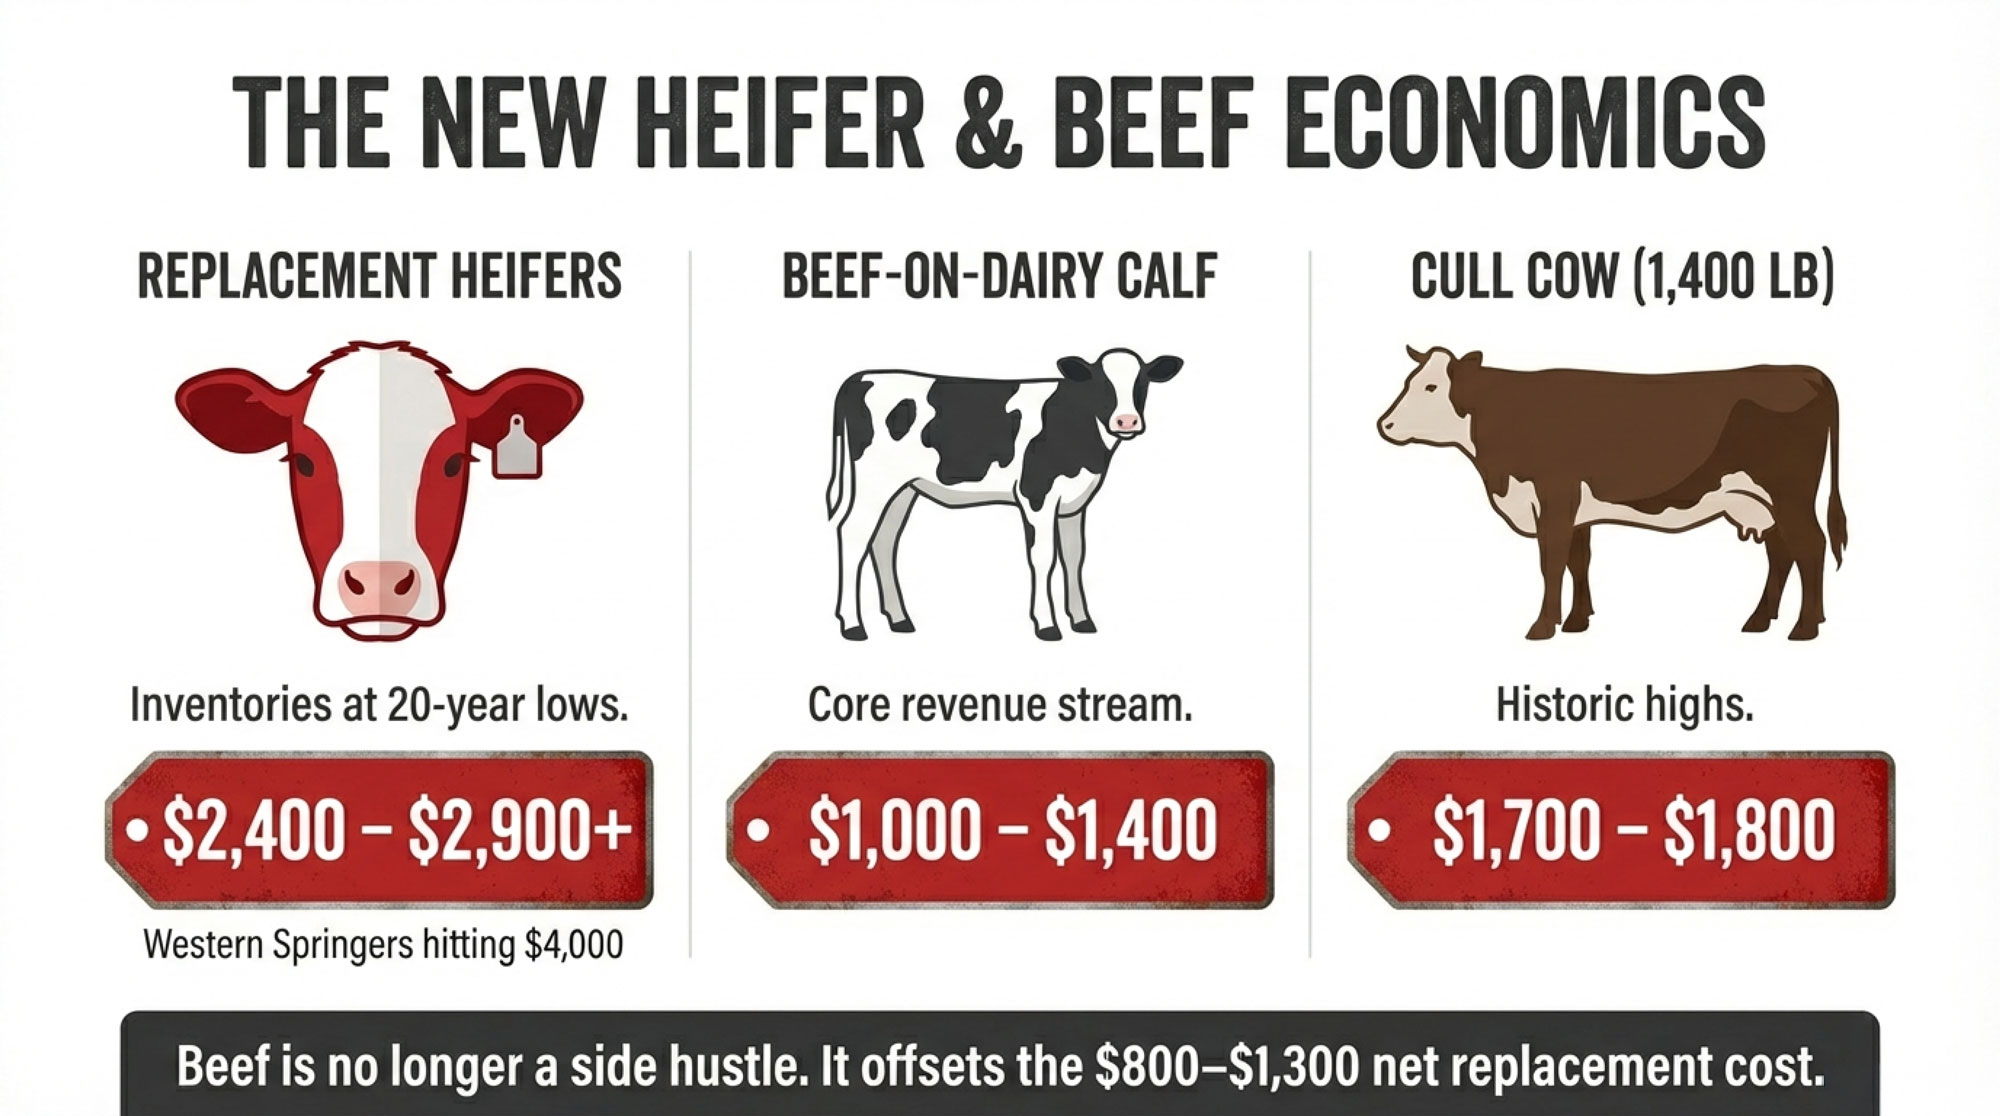
USDA’s Agricultural Prices reports show average replacement dairy heifer values moving into the mid‑$2,000s nationally, with some states seeing averages in the high‑$2,000s. In Wisconsin, the average replacement heifer prices jumped from about $1,990 to roughly $2,850 year over year—about a 69% increase—as the beef‑on‑dairy trend curtailed dairy heifer supply. Reports also show Western Holstein springers bringing $4,000 or more at the top end.
On the beef side, allied beef‑on‑dairy programs have documented how crossbred calves that might have brought $600–700 a few years ago are now often selling for $1,000–1,400 in many markets, depending on weight and timing, and how reports of day‑old beef‑cross calves at $600–750 in some Midwest and Plains auctions have become more common. Straight Holstein bull calves, as most of you unfortunately know from the checks, still trade at much lower levels.
In CoBank’s 2025 outlook, Corey Geiger, lead dairy economist at CoBank, emphasized that beef is contributing a larger share of total dairy revenue every year and that beef‑on‑dairy breeding has moved a significant portion of calves out of replacement pipelines and into beef streams.
Heifer & Beef‑on‑Dairy Economics at a Glance
Category
Typical 2025 Range
Replacement heifer (national avg)
$2,400–$2,900+
Western springer (top end)
$3,500–$4,000+
Beef‑on‑dairy calf (weaned/feeder)
$1,000–$1,400
Day‑old beef‑cross calf
$600–$750
Cull cow (sound, 1,400 lb)
$1,700–$1,800
Net replacement cost
$800–$1,300/head
Spread across the tank, that net replacement cost can quickly add 50–75 cents per cwt to your true cost of production, depending on cull rate and herd size. When you add in the fact that the transition period is still the highest‑risk phase of a cow’s life for disease, culling, and reproductive failure—something documented repeatedly in herd‑health research and field data—you can see why many herds are taking a closer look at which cows they ship and which they keep.
What I’ve noticed, talking with producers from the Upper Midwest to California’s Central Valley, is that many herds are shifting in three ways:
Using culling to clean up truly chronic problems first: repeated mastitis or high SCC, cows that don’t breed back after multiple services, recurring lameness, and persistently low fat‑protein corrected milk.
Being more thoughtful about longevity: hanging on to efficient, healthy fourth‑ or fifth‑lactation cows if they’re still producing well and breeding back, instead of automatically moving them just because of age. Recent work on cow longevity and economic performance from European and North American studies supports the idea that well‑managed, longer‑lived cows can improve both welfare and profit.
Raising or buying fewer replacement heifers overall, but putting more emphasis on genetics, calf and heifer management, and a smooth transition into the milking herd for those they do keep.
Three Decisions That Matter in the Next 90 Days
Given all this—consolidation, regional differences, heifer inventories, processor investment—three near‑term decision areas keep coming up in conversations with producers, nutritionists, and lenders.
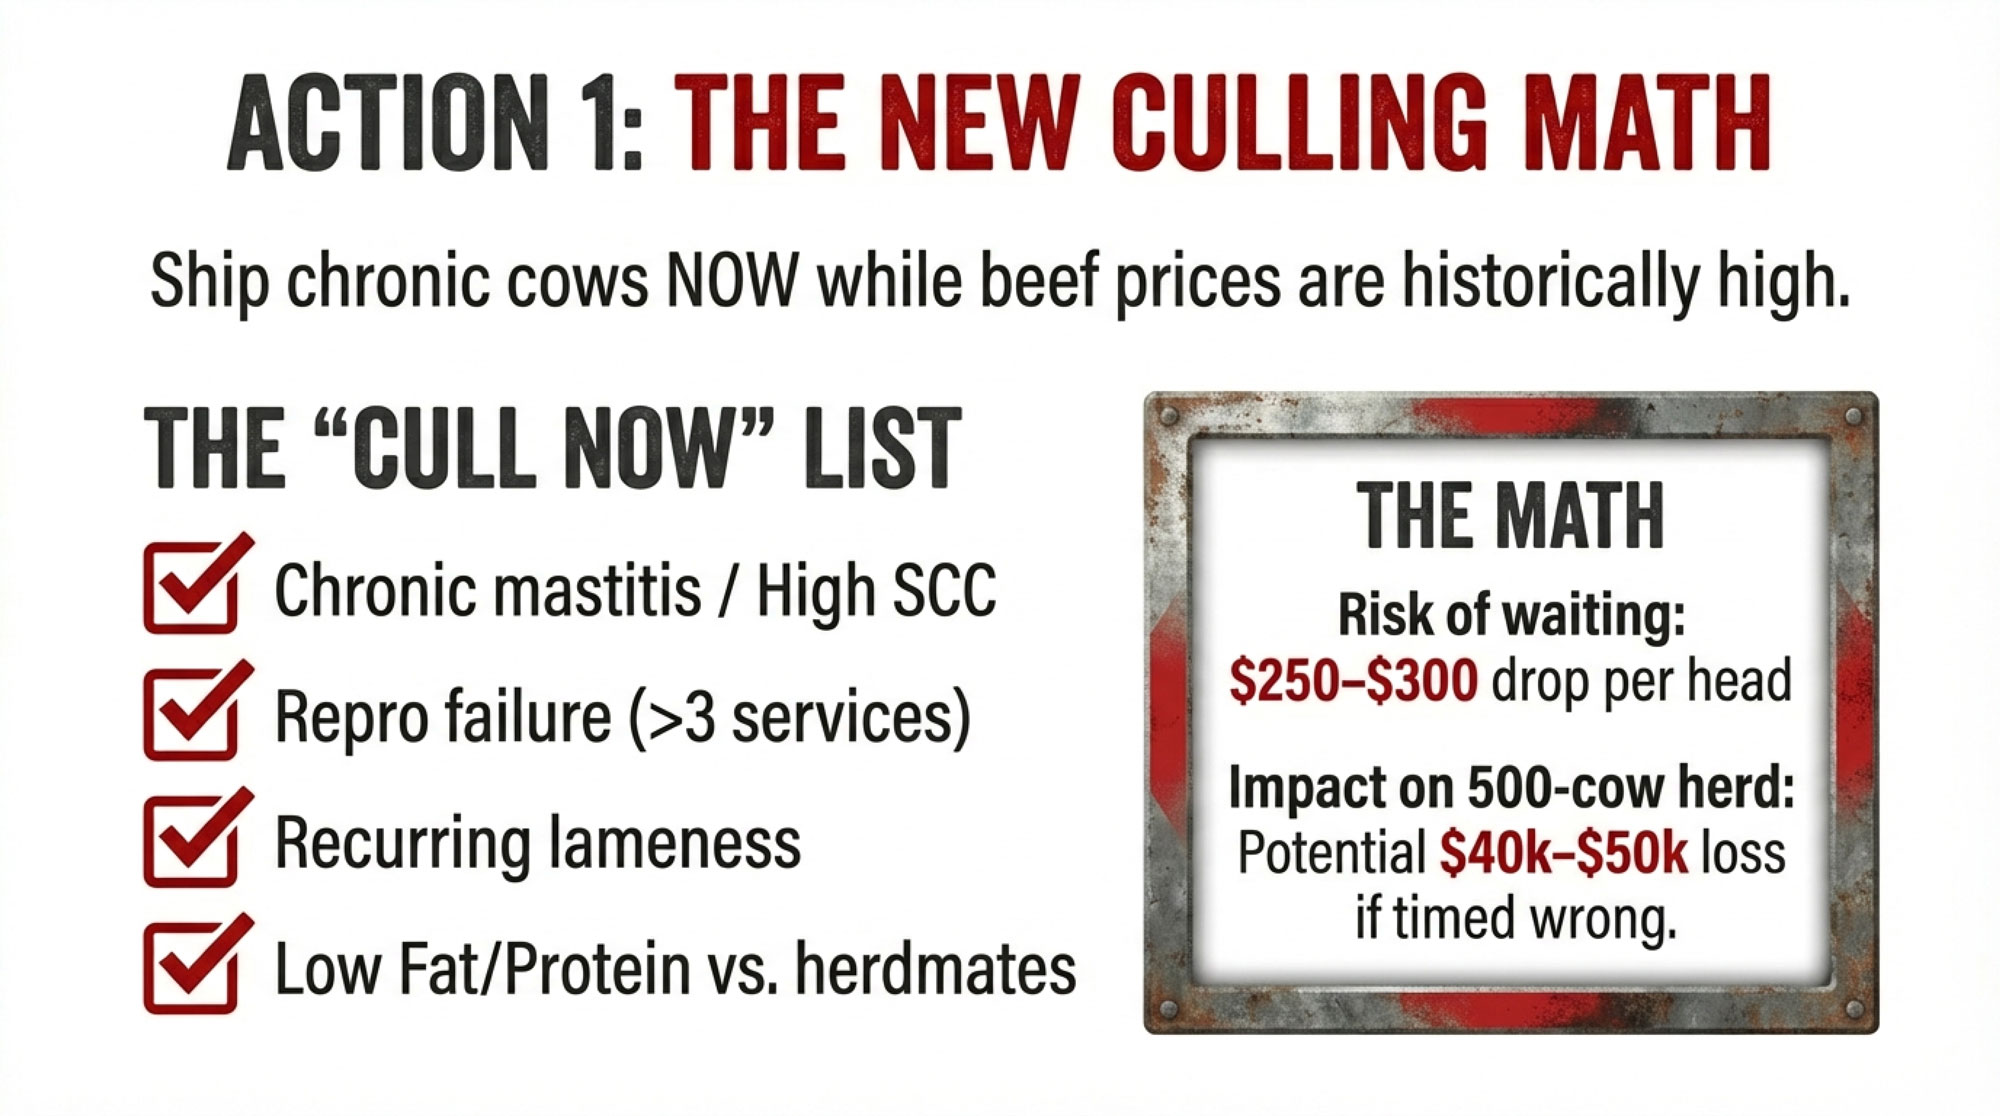
1. Culling While Beef Prices Are Still Favorable
Right now, cull cow values are historically strong in many regions. USDA market reports and industry summaries show sound cull cows bringing high prices relative to long‑term averages, supported by a tight national beef supply after heavy beef‑cow liquidation. Beef‑market outlooks in USDA’s Livestock, Dairy, and Poultry Outlook and land‑grant analyses note that as the U.S. beef cow herd slowly rebuilds from very low levels, cull prices could soften over the next couple of years, especially if slaughter numbers ease.
For a 1,400‑pound cow, that’s easily a $250–300 swing per head between today’s strong prices and a softer market. For a 500‑cow herd with a 35% cull rate, that’s $40,000–50,000 across the year. So if you’ve got cows that are clearly on your “watch list”—chronic mastitis, repeated reproductive failures, recurring lameness that never fully resolves, consistently poor butterfat performance—the timing matters.
A simple cull checklist that many herds are using with their vets and consultants looks like this:
Chronic mastitis or consistently high SCC despite treatment
More than two or three unsuccessful breedings this lactation
Recurring hoof problems affecting production or mobility
Persistently low fat‑protein corrected milk compared with pen mates
At a recent Extension meeting in the Upper Midwest, a herd manager described sitting down with their vet and nutritionist, flagging about 60 cows that met those criteria, and prioritizing shipping them over several weeks while beef prices stayed strong. The cull income went straight to reducing their operating line and funding upgrades in their fresh‑cow area. Examples like that are showing up more often in Extension case studies and farm financial workshops.
If cull prices are 20% lower next year, are there cows you’ll wish you’d moved sooner? That’s the kind of question this window forces you to ask.
2. Treating Feed Efficiency as a Standing Agenda Item
We’ve already walked through the economics: a 0.1 bump in feed efficiency can reasonably be worth $35–55 per cow per year, or $18,000–27,500 on a 500‑cow herd, using conservative values drawn from Extension and economic analysis.
What farmers are finding is that the herds capturing that value aren’t necessarily spending more—they’re just managing more intentionally. A practical way to bake feed efficiency into your routine is to treat it as a standing agenda item at your regular herd meetings.
Here’s a simple framework to work from:
This month: forage and ration review
Are all current forages tested for NDF digestibility, starch, and protein?
Are the highest‑quality forages being targeted to fresh and high‑producing groups?
Are ration changes reflected in updated dry‑matter intake targets for each group?
This quarter: transition and fresh cow focus
Are close‑up and fresh pens overcrowded or short on bunk space?
Are fresh cows being checked daily for intakes, temperature, and behavior during the first 10–14 days in milk?
Are DA, ketosis, metritis, and early culling rates tracked and reviewed with your vet and nutritionist?
Every week: bunk management habits
Are feeding times consistent from day to day?
Are refusals checked and recorded, not just guessed at?
Are feed push‑ups happening often enough to keep feed in reach between feedings?
From Wisconsin freestalls to Texas dry lot systems to Northeastern tie‑stalls, I’ve noticed the same pattern: the herds that treat feed efficiency as a core KPI—not just a once‑a‑year number—tend to be the ones that stay more resilient when margins tighten.
3. Getting Ahead of Liquidity and Risk Management
Class III futures and industry outlooks remain volatile for 2026, with projections shifting as feed costs, export demand, and herd size estimates change. USDA’s 2025 dairy outlooks highlight a wide range of possible milk‑price outcomes depending on those factors, rather than a single clear price path. For herds with low cost of production and strong efficiency, most reasonable price scenarios can still work. For those needing $18–19 just to break even—including full debt service and family living—it’s worth paying very close attention.
Farm financial advisors—from land‑grant universities to private consultants—keep coming back to a few core moves:
Use today’s strong beef and calf checks to build working capital. Paying down the operating line or building cash reserves when beef and beef‑cross calf prices are high gives you more room to maneuver if milk prices under‑perform. With interest costs where they are, every dollar you take off your line is worth more than it used to be.
Sit down with your lender early, not late. Bringing updated cost‑of‑production numbers, your culling and heifer plan, and your feed‑efficiency priorities to the table changes the tone: you’re managing risk, not just reacting to it. University Extension finance specialists make the same point in their 2024–2025 dairy profitability guides.
Match your risk tools to your comfort level. That might mean Dairy Margin Coverage for smaller herds, Dairy Revenue Protection or LGM for others, and selective use of forward contracting on milk or feed. The goal isn’t to hit the top of the market every time; it’s to keep the worst‑case scenarios off the table.
As one Wisconsin‑based advisor told a group at a recent meeting, you don’t want your first serious talk with the bank to be when you’re already in trouble. You want it to be when you still have options.
Why Processors Are Still Building While Farms Are Closing
A question that comes up a lot right now is: if producers are under this much pressure, why are processors pouring billions into new plants?
CoBank’s Knowledge Exchange team tackled that in a 2025 report. They estimate that the U.S. is undergoing a historic $10‑billion investment in new dairy‑processing capacity, expected to come online through 2027, much of it in large cheese, powder, and extended‑shelf‑life beverage plants in Texas, the Southwest, the Midwest, and the Northeast. Darigold’s Pasco facility is one example of these large investments in the Northwest.
Rabobank’s consolidation reports reinforce the big picture: processors see long‑term domestic and export demand for dairy proteins and fats, but expect that demand to be met by fewer, larger, more efficient herds with lower per‑unit costs. Modern plants designed to process 5–8 million pounds of milk per day require high utilization and a consistent supply to remain profitable.
Those plants aren’t being built for a world with more small herds. They’re being built assuming fewer, bigger suppliers who can hit volume and quality specs every day.
When you talk with processor representatives at meetings and plant tours, what often comes through is that they’re laser‑focused on reliability. They want suppliers who can hit volume, component, and food‑safety targets day in and day out. It’s simply easier to do that with a smaller group of large herds than with hundreds of small ones.
That doesn’t mean smaller and mid‑size farms are written out of the story. But it does mean they’re more likely to thrive if:
They’re among the most efficient herds in their region.
They supply processors that value specific quality traits—such as components, traceability, animal care, or local branding.
They focus on premium or niche markets where volume isn’t the only metric that matters.
So Where Does This Go—and What Can You Do?
USDA’s long‑term baseline projections, combined with outlooks from CoBank and Rabobank, point in a broadly similar direction:
Fewer dairy farms overall, but national cow numbers are hovering around 9–9.5 million in the medium term.
A growing share of milk is coming from herds with 1,000 or more cows, continuing the trend already highlighted by the 2022 Census and consolidation analyses.
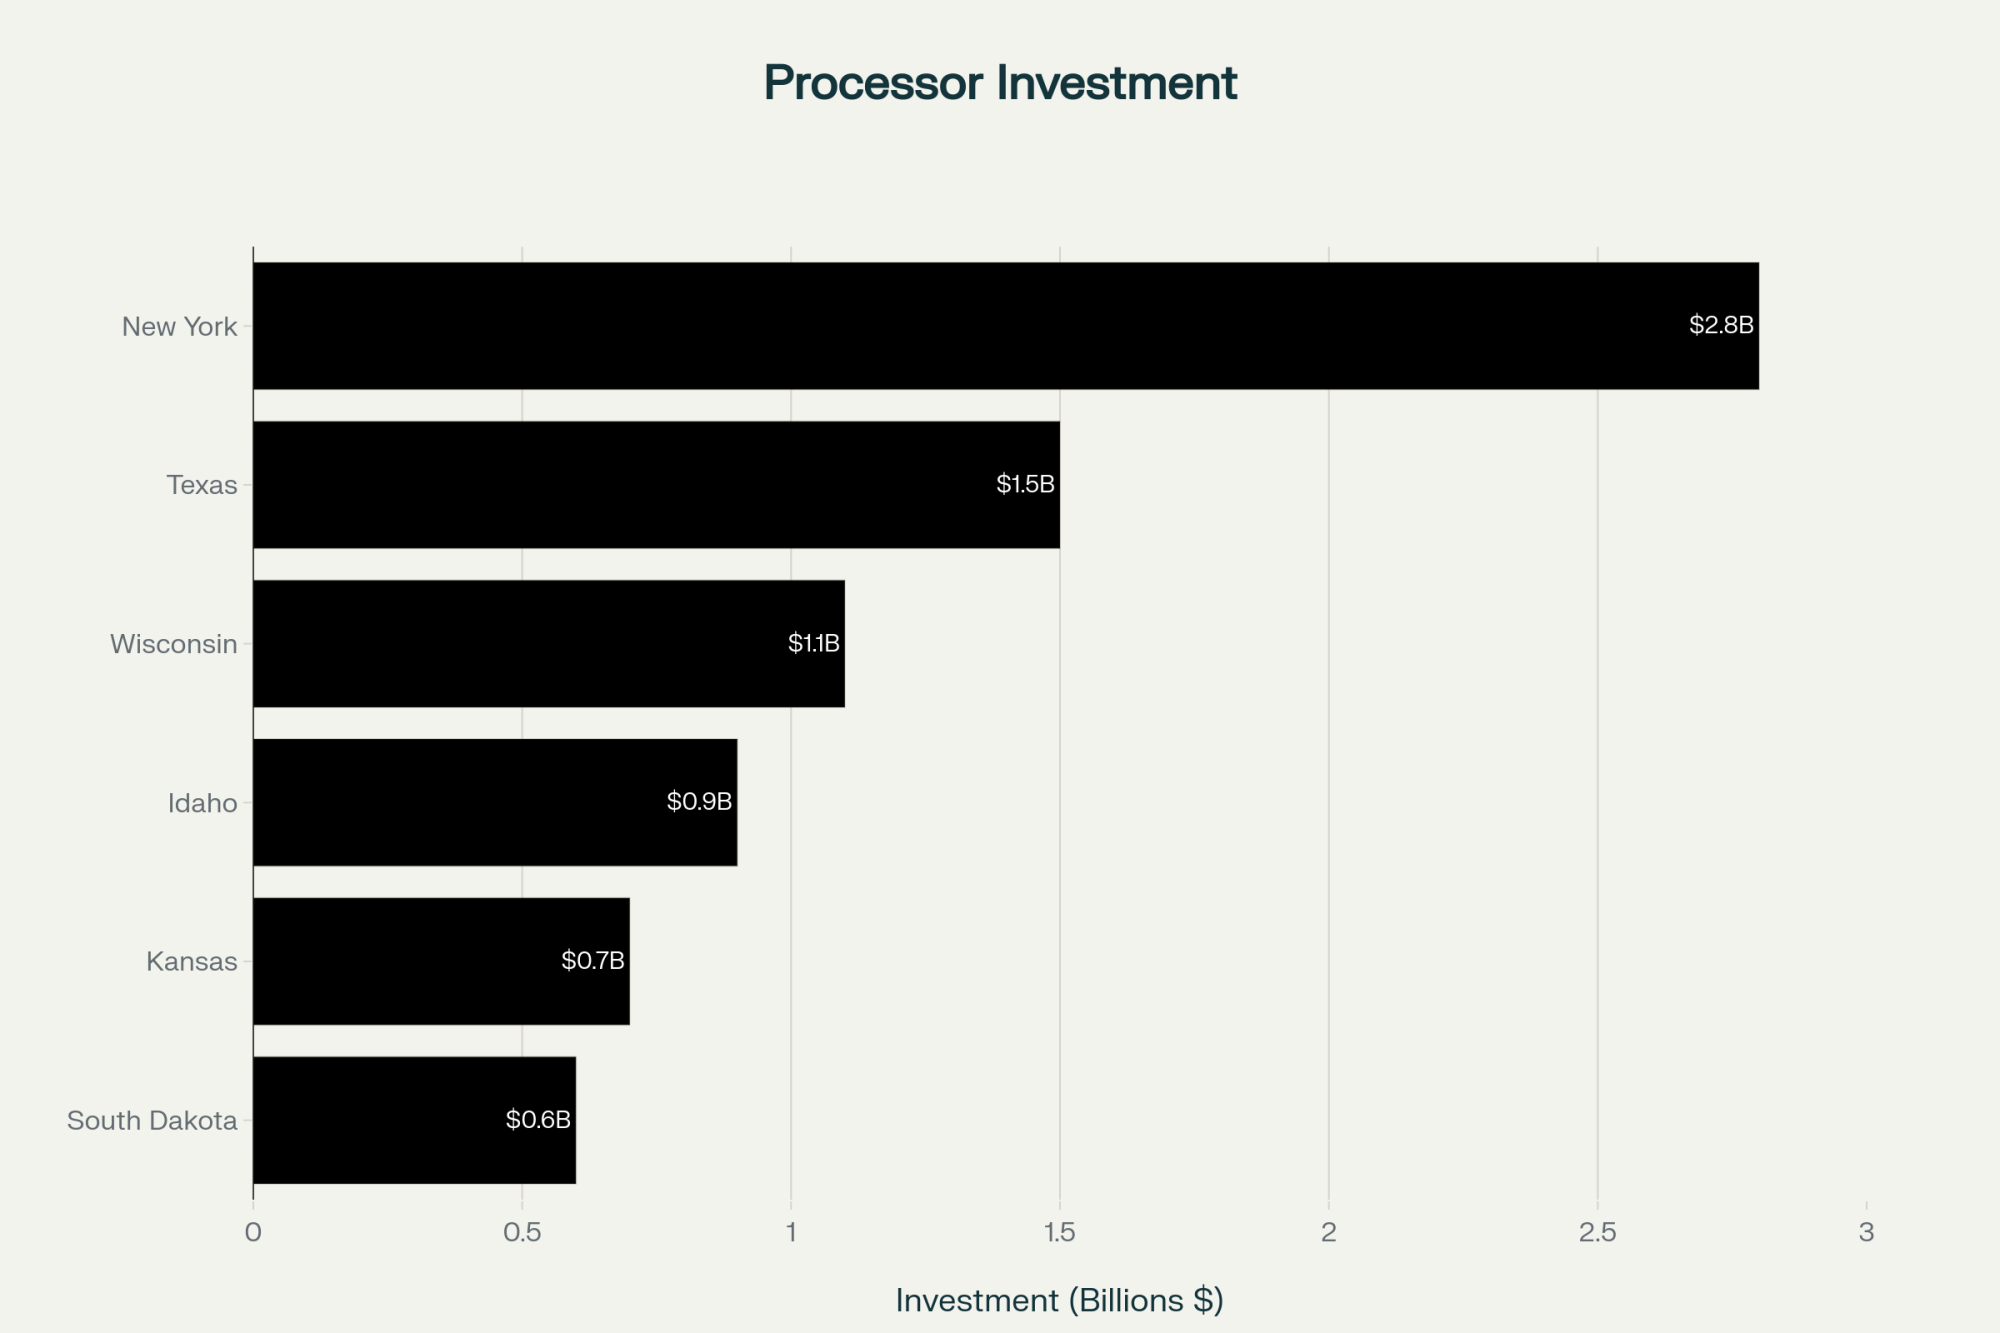
Continued growth in regions like Texas, New Mexico, Idaho, South Dakota, and parts of the Southeast, with slower growth or contraction in higher‑cost or heavily regulated areas such as parts of the PNW and California.
Ongoing processor consolidation and large‑scale plant investments, including dry lot and freestall‑based supply clusters in the Plains and Southwest.
Nobody can promise exactly what the five‑year average milk price will be. But the structural forces—consolidation, plant expansion, heifer shortages, beef‑on‑dairy, Class I reform—are not hypothetical. They’re visible in USDA data, industry reports, and the checks you’re cashing.
Different operations will respond differently. A 4,000‑cow dry lot in west Texas, a 1,600‑cow freestall in California’s Central Valley, a 600‑cow parlor dairy in Wisconsin, and a 200‑cow grazing herd in Vermont all have different strengths, constraints, and family goals.
What’s encouraging is that some of the most important questions are the same for all of them:
Where’s our real edge—cost of production, components, quality, location, niche market, or some combination?
Are we measuring feed efficiency, fresh cow performance, and butterfat and protein yields clearly enough to guide decisions?
Does our region and processor mix support the kind of operation we want to be five to ten years from now?
If not, what realistic paths do we have—scaling up, shifting markets, partnering with neighbors, or planning a dignified exit or transition?
The Bottom Line: Three Moves for the Next 18 Months
If you boil this down, here’s the hard truth: hoping the next “good cycle” will fix structural math is a much riskier bet than it used to be. In the next 18 months, most herds will be better off if they:
Ship chronic problem cows while beef is still strong and replacement math still pencils, rather than waiting for cull prices to soften.
Put a real dollar figure on a 0.1 feed‑efficiency gain for their own herd and pick one or two habits to move that number, using Extension benchmarks and their own records.
Look their processor and region in the eye—on paper—and decide whether they’re doubling down, diversifying, or slowly pivoting, given the $10‑billion processing build‑out and the consolidation patterns already underway.
The “18‑month window” isn’t a countdown clock to disaster. It’s a realistic horizon in which most herds still have meaningful choices—about culling, feed efficiency, liquidity, and long‑term direction. Those choices are a lot easier to make while you still have room to maneuver than when your bank, your cooperative, or your cash flow is making them for you.
What I’ve noticed, talking with producers from British Columbia to Florida and from California to New York, is that the farms that come through tough stretches in good shape usually aren’t the ones with the fanciest barns. They’re the ones that combine solid cow sense with uncomfortable honesty about their numbers, their region, and their options—and then act before circumstances force their hand.
There’s still time to be one of those herds. The real opportunity in this next 18‑month stretch is to quietly, deliberately tilt the odds in your favor for whatever dairy looks like in 2030 and beyond.
Key Takeaways
Farm exits no longer fix milk prices. USDA’s 2022 Census shows 39% fewer dairy farms since 2017, yet total U.S. milk still climbed to 226 billion pounds—large herds absorb the volume, and the old “sellouts tighten supply” assumption no longer holds.
Heifer inventories are at a 20-year low—and still falling. CoBank projects another 800,000-head decline before a 2027 rebound, pushing replacements into the mid-$2,000s nationally and past $4,000 for top Western springers.
Geography now rivals genetics for survival. Darigold’s $4/cwt Pasco deduction, below-average Class I utilization in Western orders, and stronger fluid returns in the Southeast are making your region and processor mix as important as your herd’s butterfat.
Feed efficiency is hidden cash you already control. A 0.1 improvement can add $35–55 per cow per year—up to $27,500 on a 500-cow herd—without new buildings or equipment.
The next 18 months are a decision window, not a waiting room. Cull chronic cows while beef checks are strong, put a real dollar target on efficiency gains, and sit down with your lender while you still have options—not after your cash flow decides for you.
Complete references and supporting documentation are available upon request by contacting the editorial team at editor@thebullvine.com.
Learn More
Feed Smart: Cutting Costs Without Compromising Cows in 2025 – Grab the blueprint to shave $470 per cow off your annual feed bill. This guide delivers precise procurement tactics for 2025’s volatile markets, arming you with the forage analysis and ration discipline needed to thrive.
Decide or Decline: 2025 and the Future of Mid-Size Dairies – Face the hard truth about surviving the ‘deadly middle’ of dairy’s structural shift. This analysis breaks down five-year positioning for 500-head herds, unpacking the exact moves needed to protect your equity before regional processor leverage shifts entirely.
Beef-on-Dairy’s $6,215 Secret: Why 72% of Herds Are Playing It Wrong – Stop leaking profit by treating beef-on-dairy like a side hustle. This deep dive exposes the genomic multipliers and reproductive benchmarks that separate elite operators from the 72% of herds currently playing the game wrong.
Join the Revolution!
Join over 30,000 successful dairy professionals who rely on Bullvine Weekly for their competitive edge. Delivered directly to your inbox each week, our exclusive industry insights help you make smarter decisions while saving precious hours every week. Never miss critical updates on milk production trends, breakthrough technologies, and profit-boosting strategies that top producers are already implementing. Subscribe now to transform your dairy operation’s efficiency and profitability—your future success is just one click away.
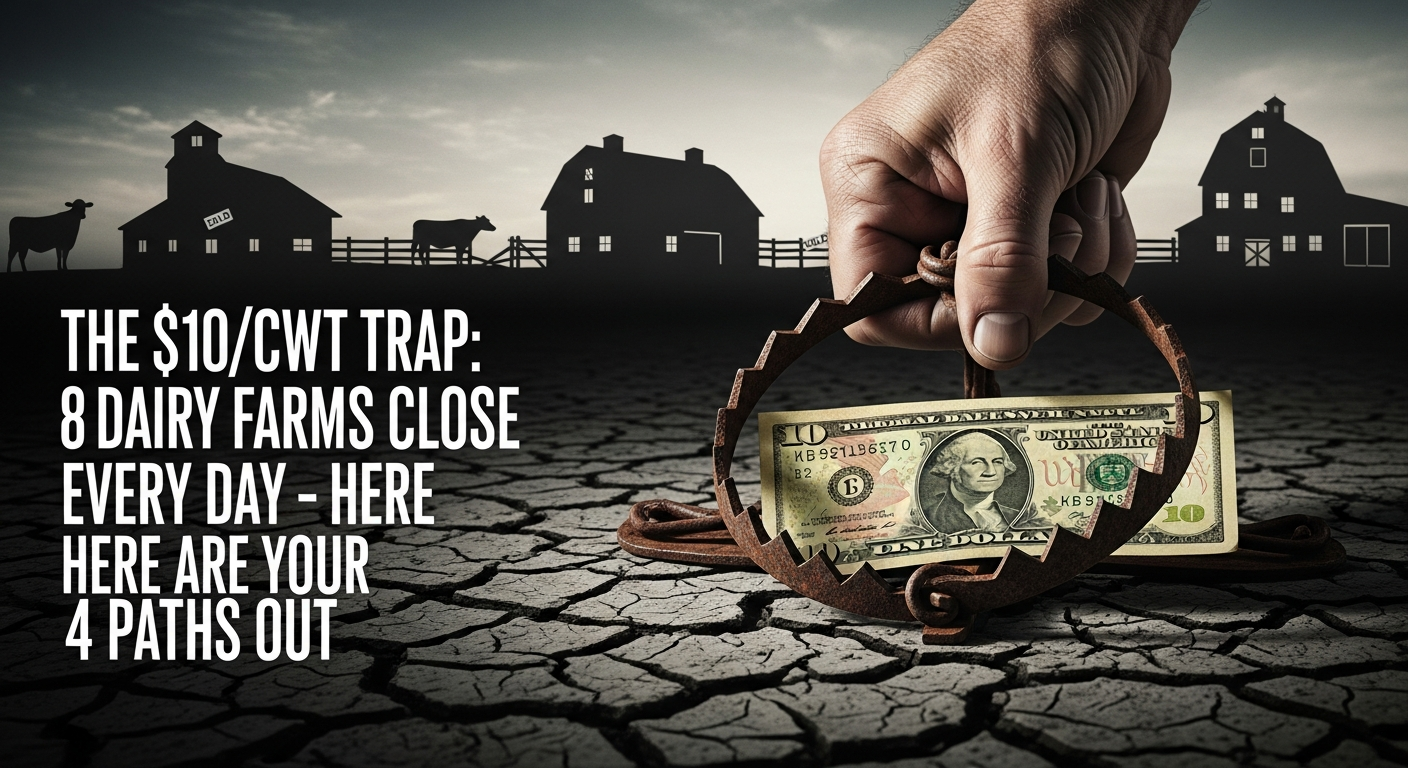
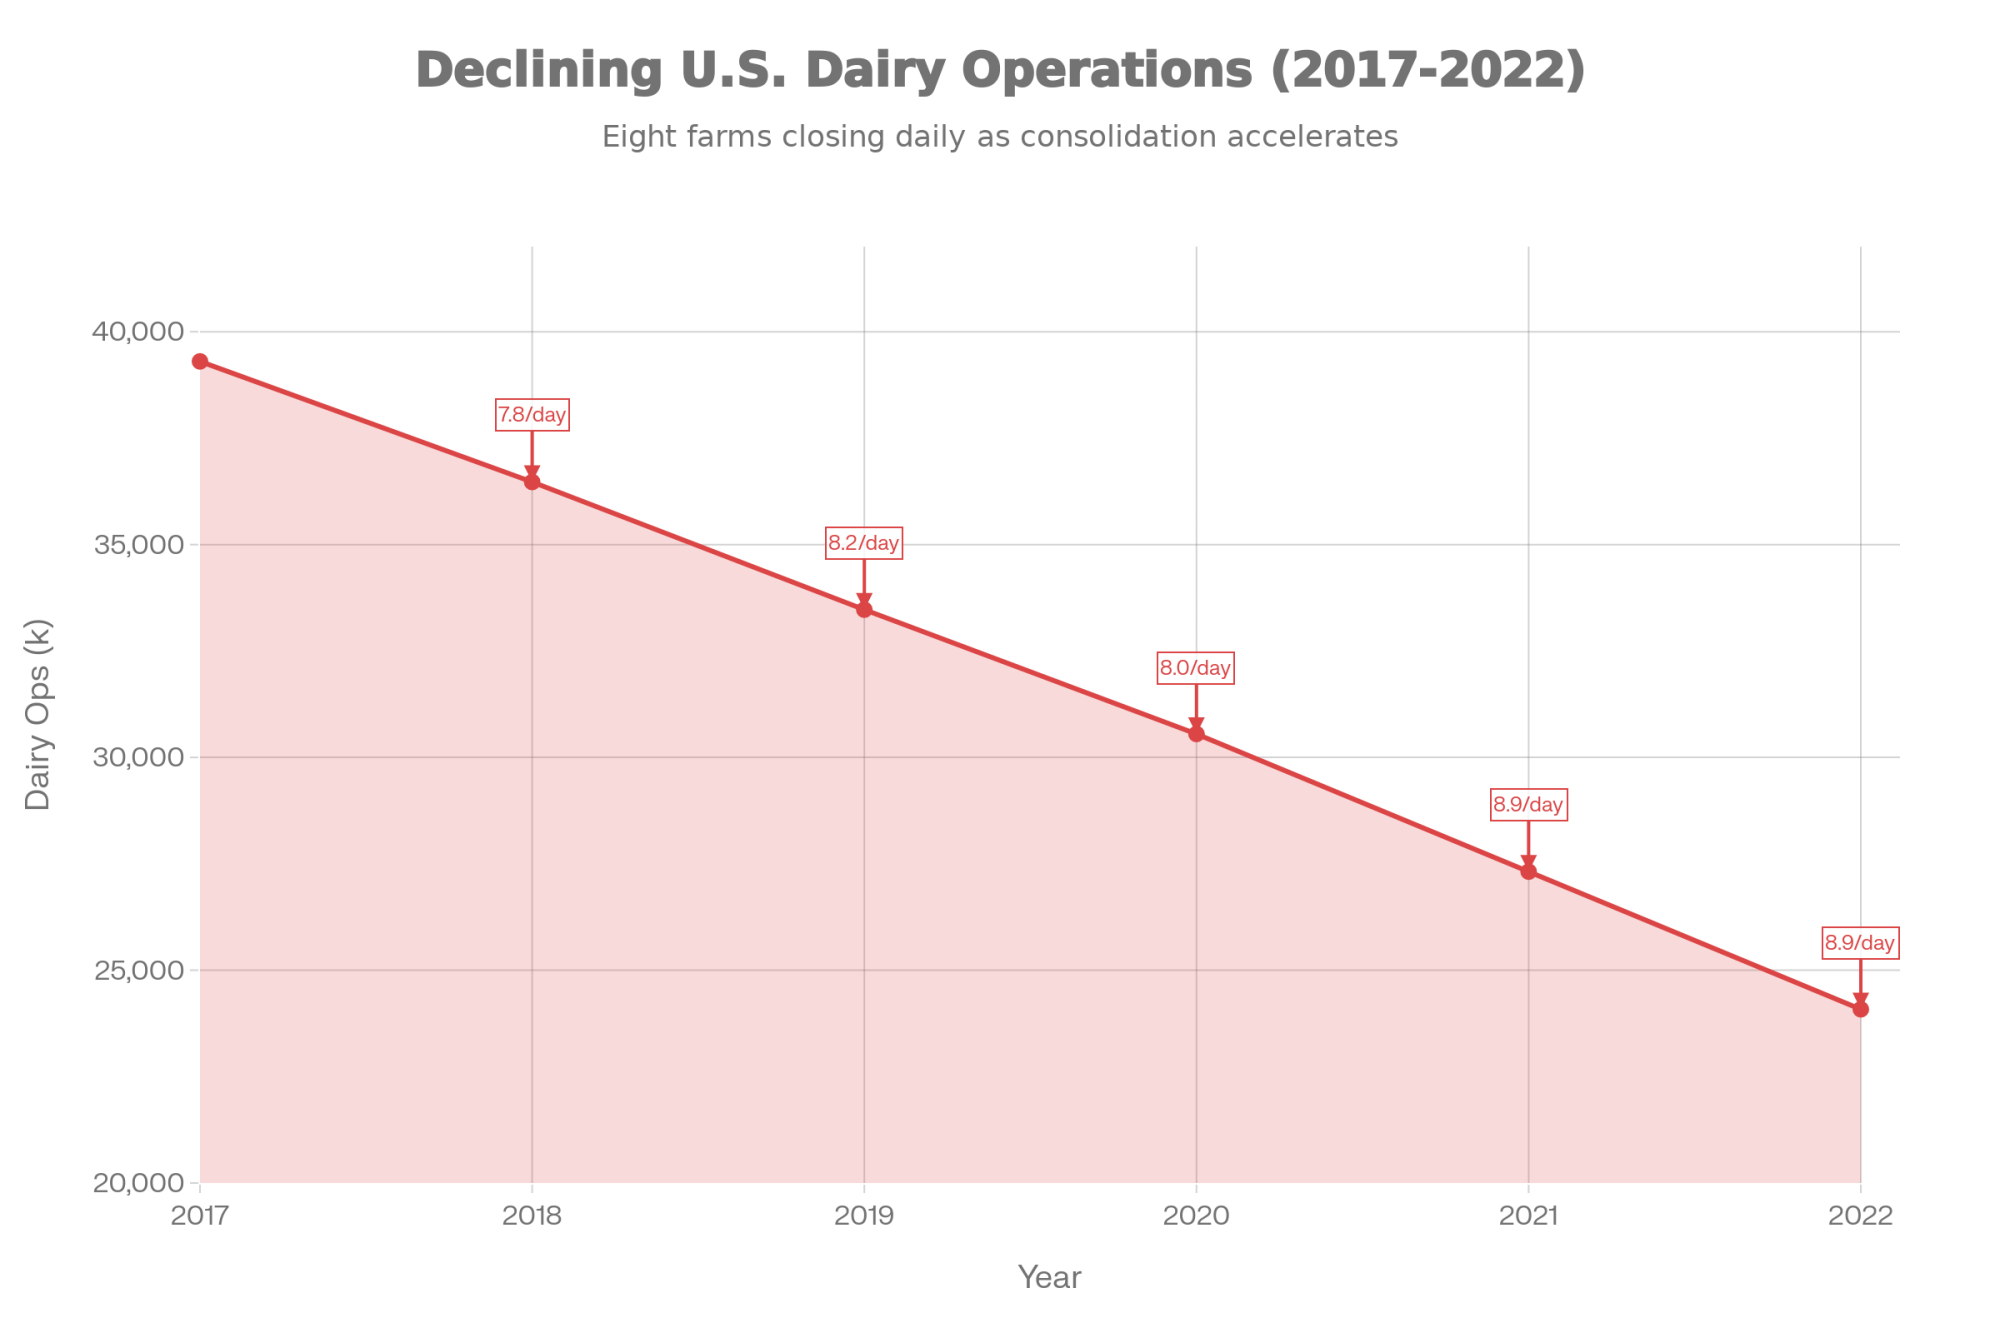
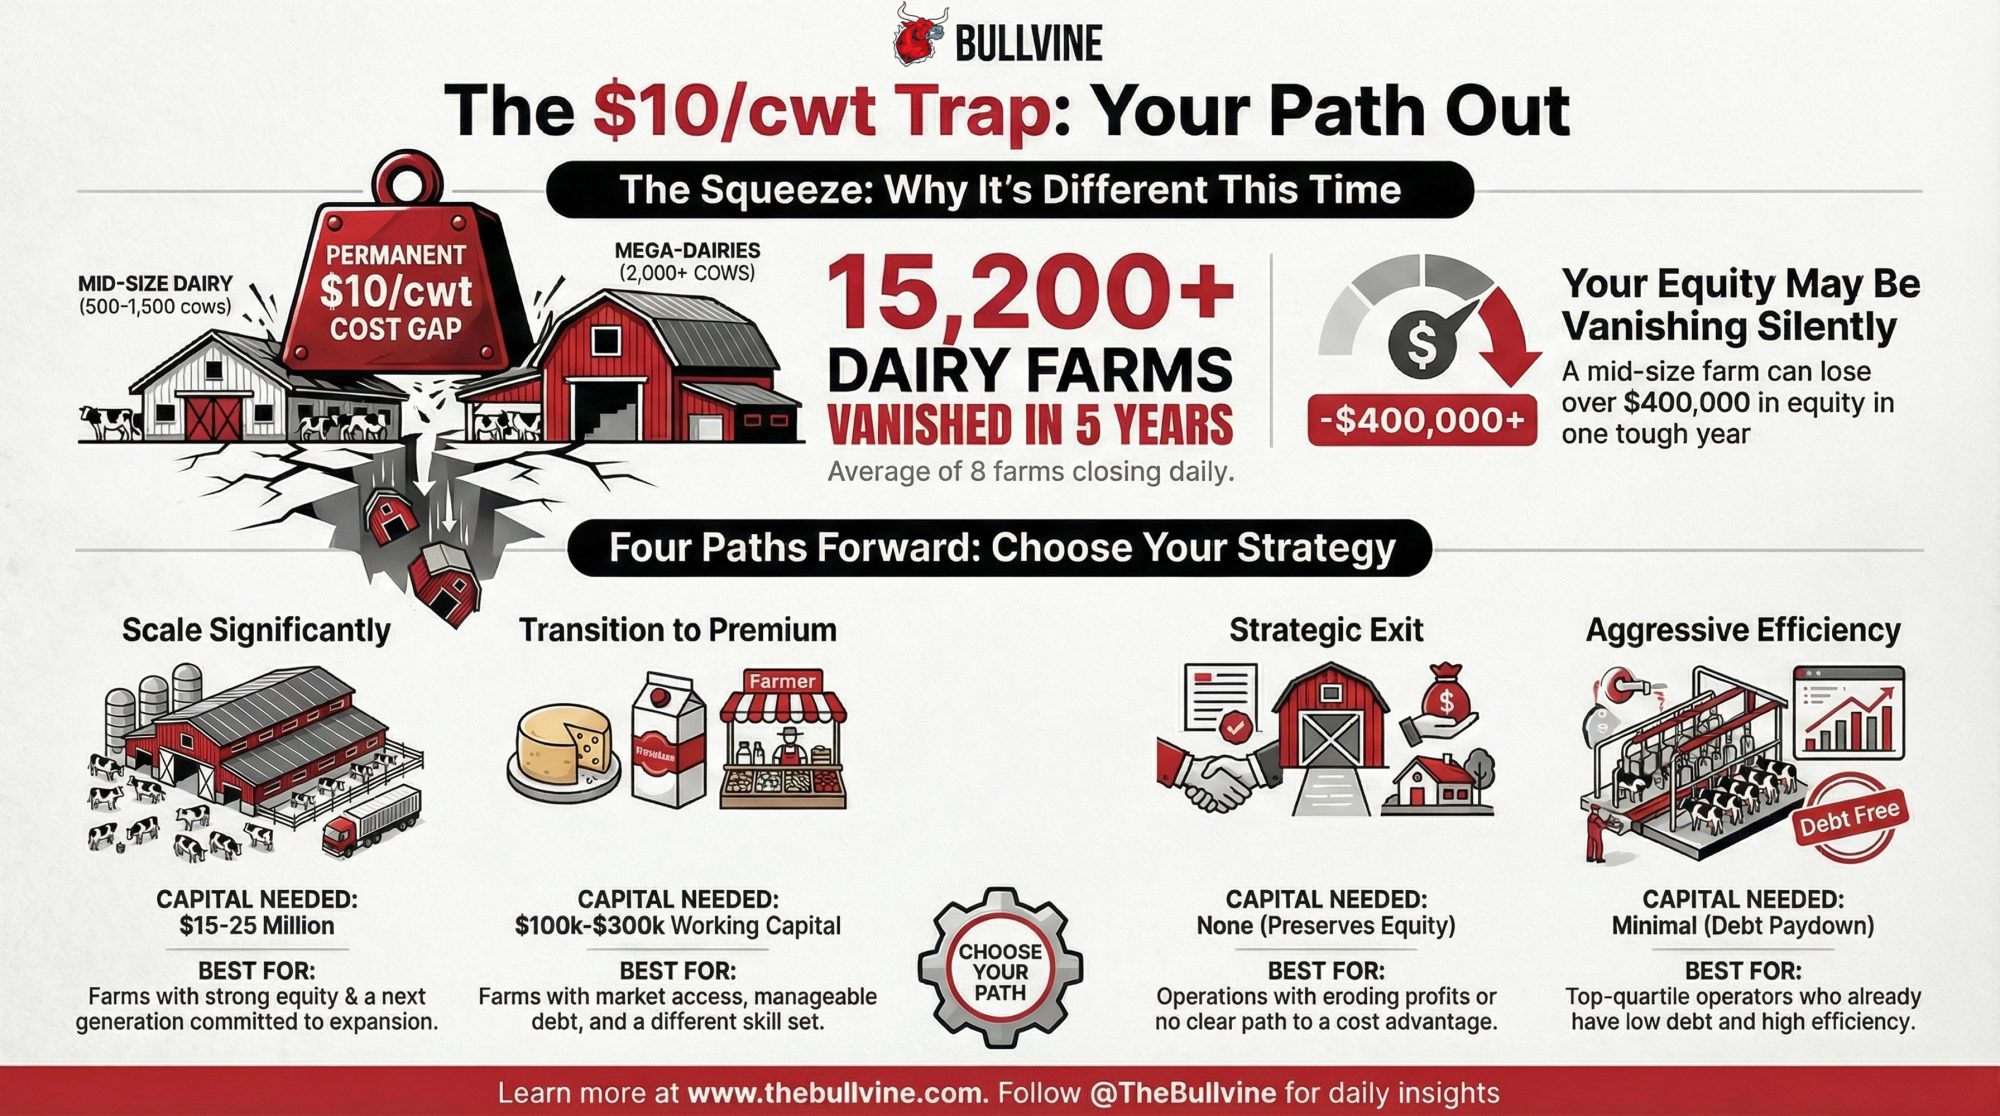
Eight dairy farms close every single day in America. Understanding what’s driving this consolidation—and your options for navigating it—has never been more important.
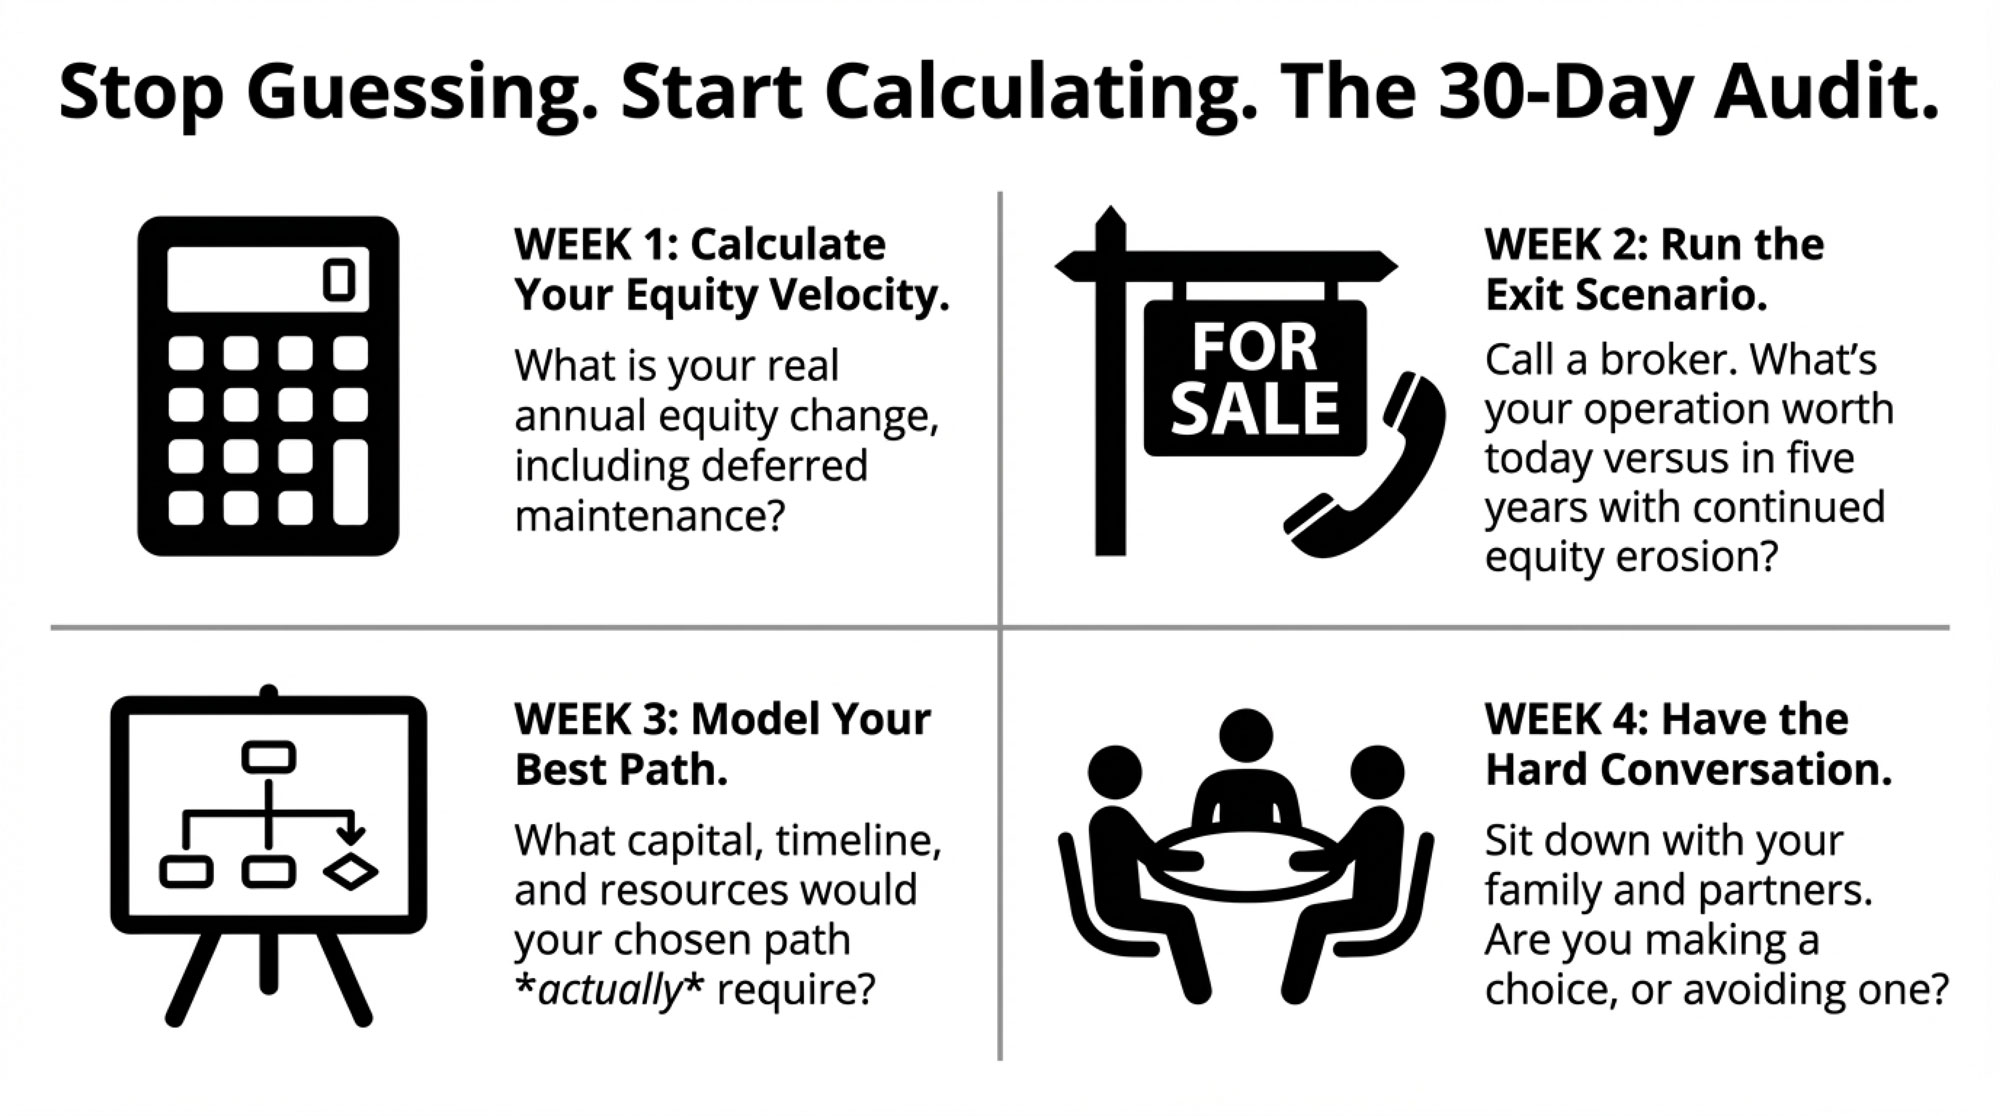
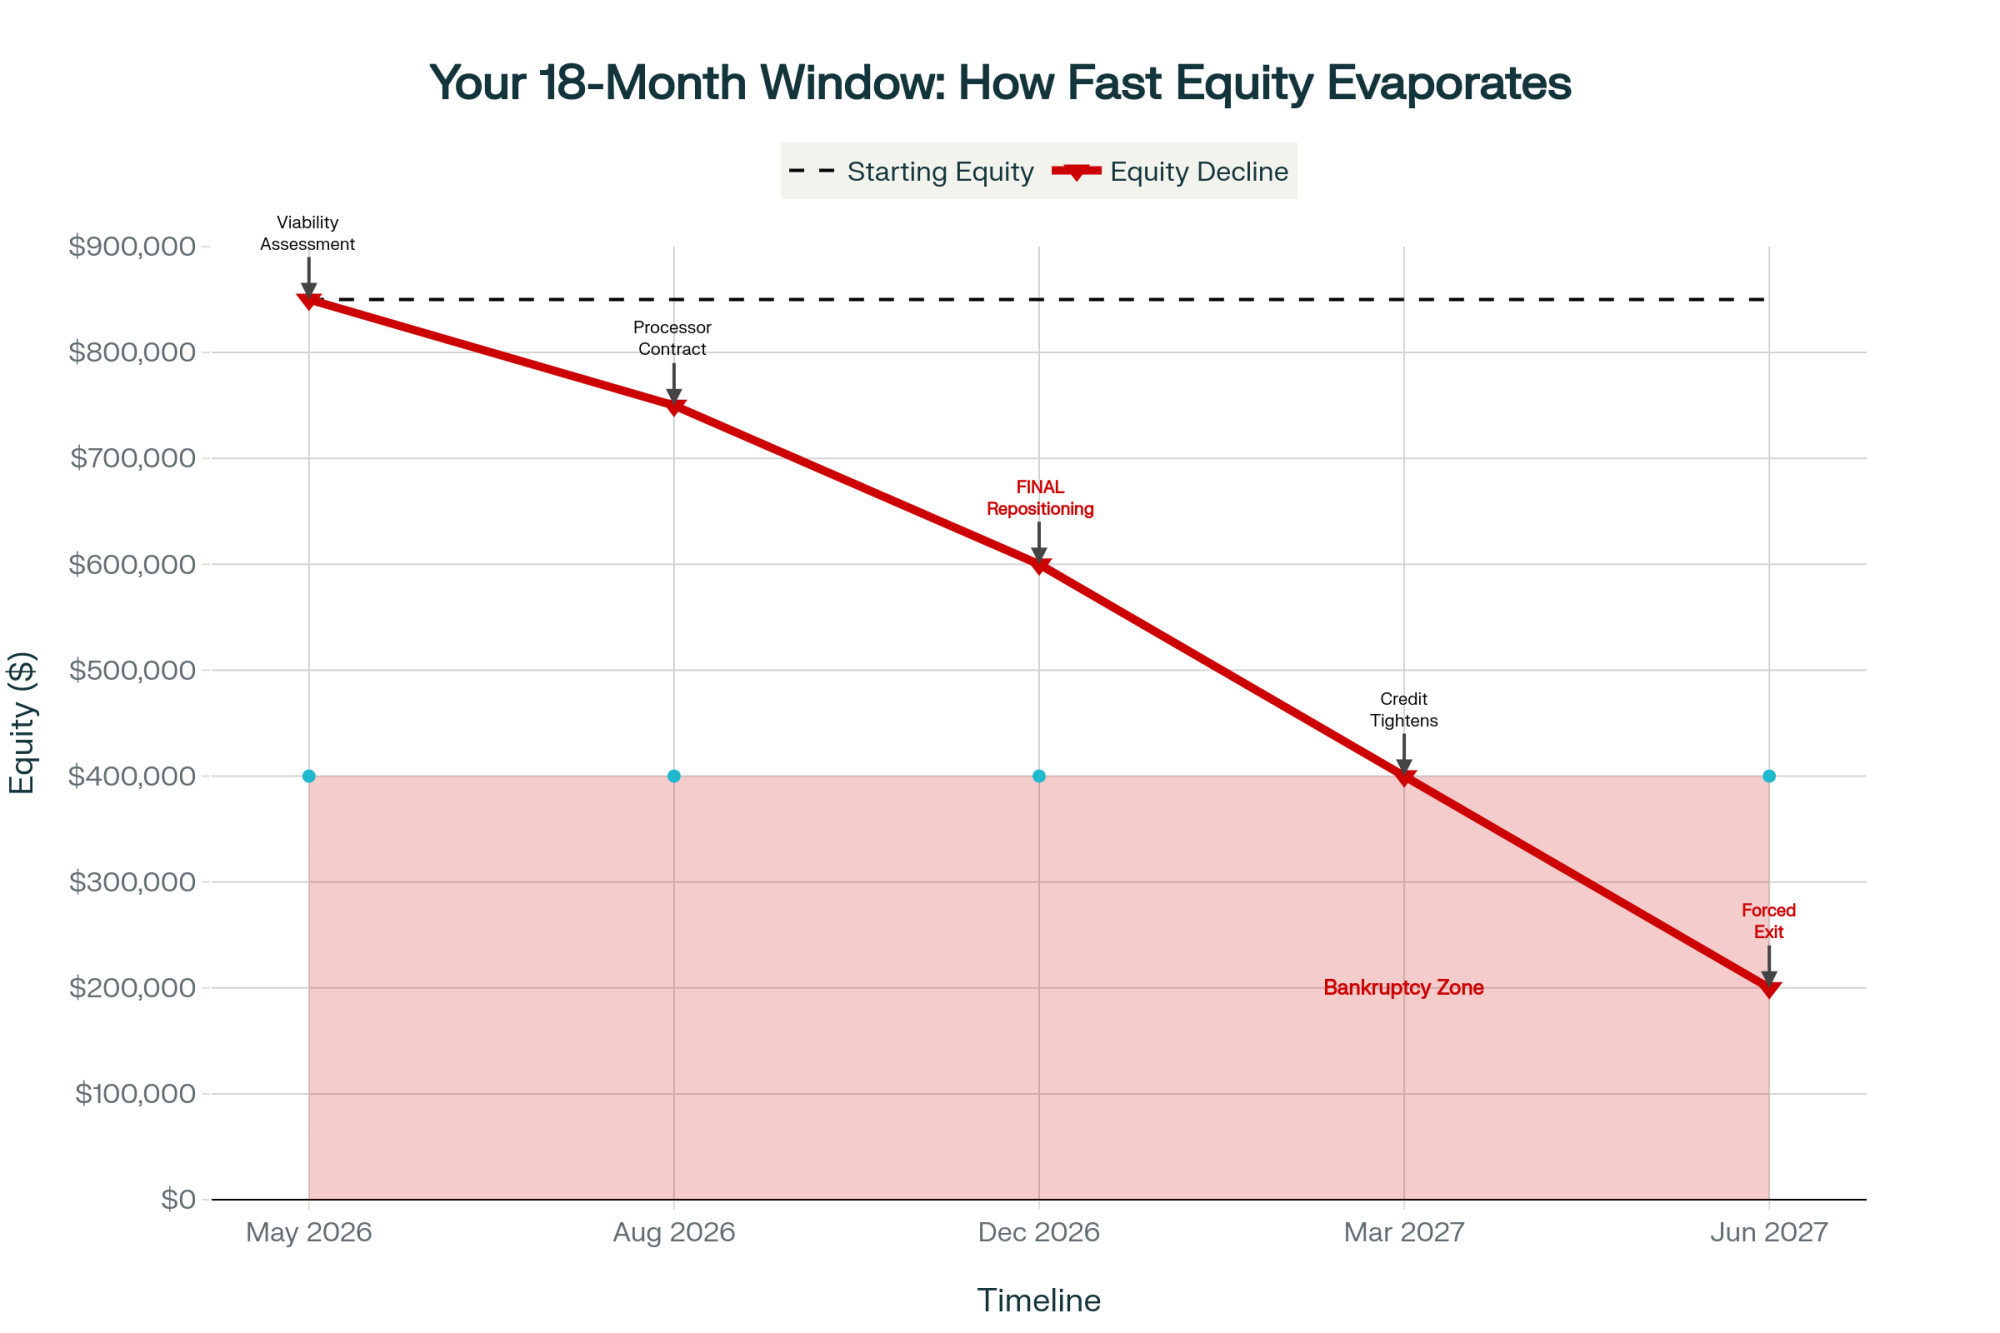
Executive Summary: Eight dairy farms close every single day in America—and mid-size operations (500-1,500 cows) are taking the hardest hit. USDA Census data shows over 15,200 farms vanished between 2017 and 2022, driven by a $10/cwt cost gap that gives 2,000+ cow operations a decisive structural advantage. This isn’t a price cycle to wait out; it’s a permanent industry transformation, and silence is a losing strategy. This analysis breaks down four realistic paths forward—scale significantly, transition to premium, exit strategically, or pursue aggressive efficiency—with specific capital requirements, timelines, and success factors for each. The essential first move: calculate your “equity velocity” to determine if you’re silently bleeding $400,000+ annually while your balance sheet looks stable. Take the 30-Day Financial Audit Challenge and choose your path before the market chooses it for you.
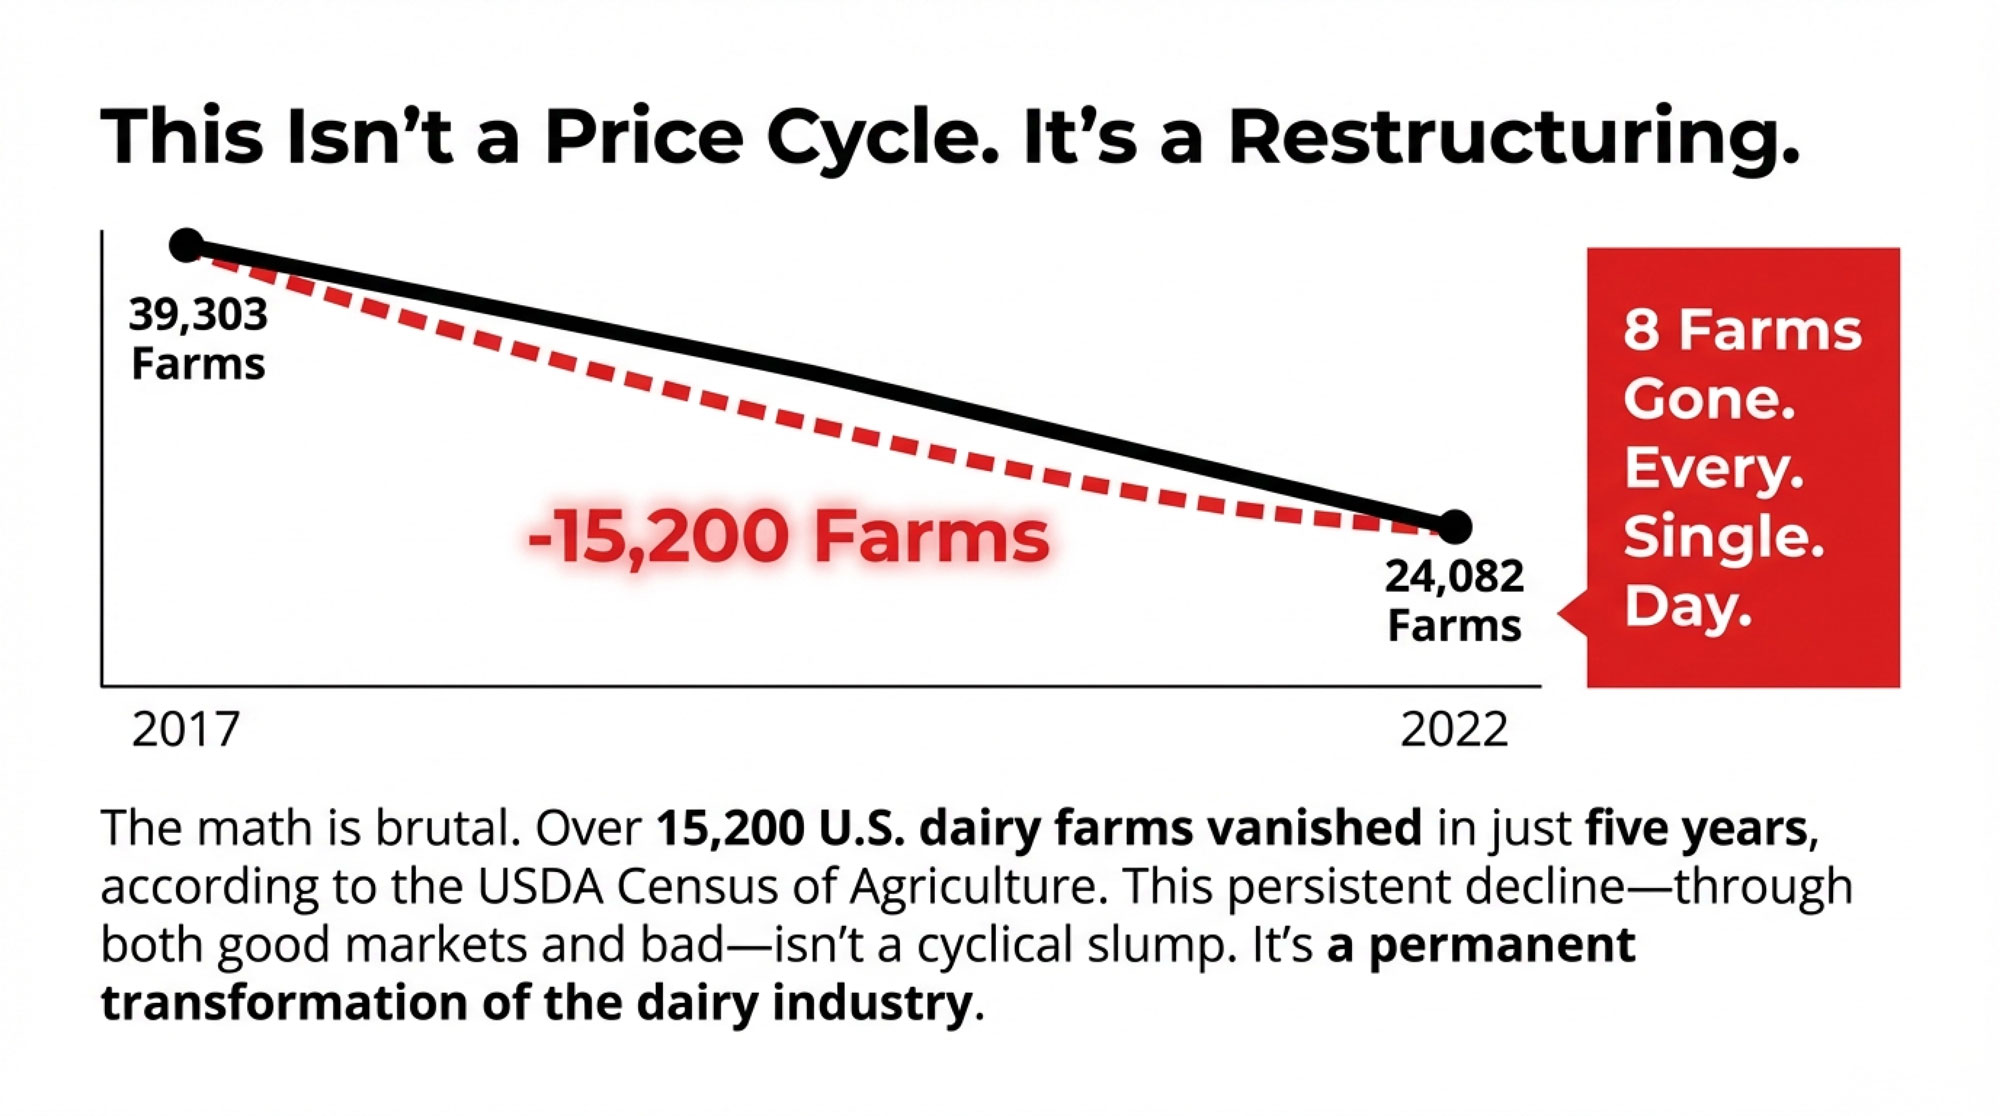
That number stopped me cold when I first calculated it. Eight farms. Every day. For five years straight.
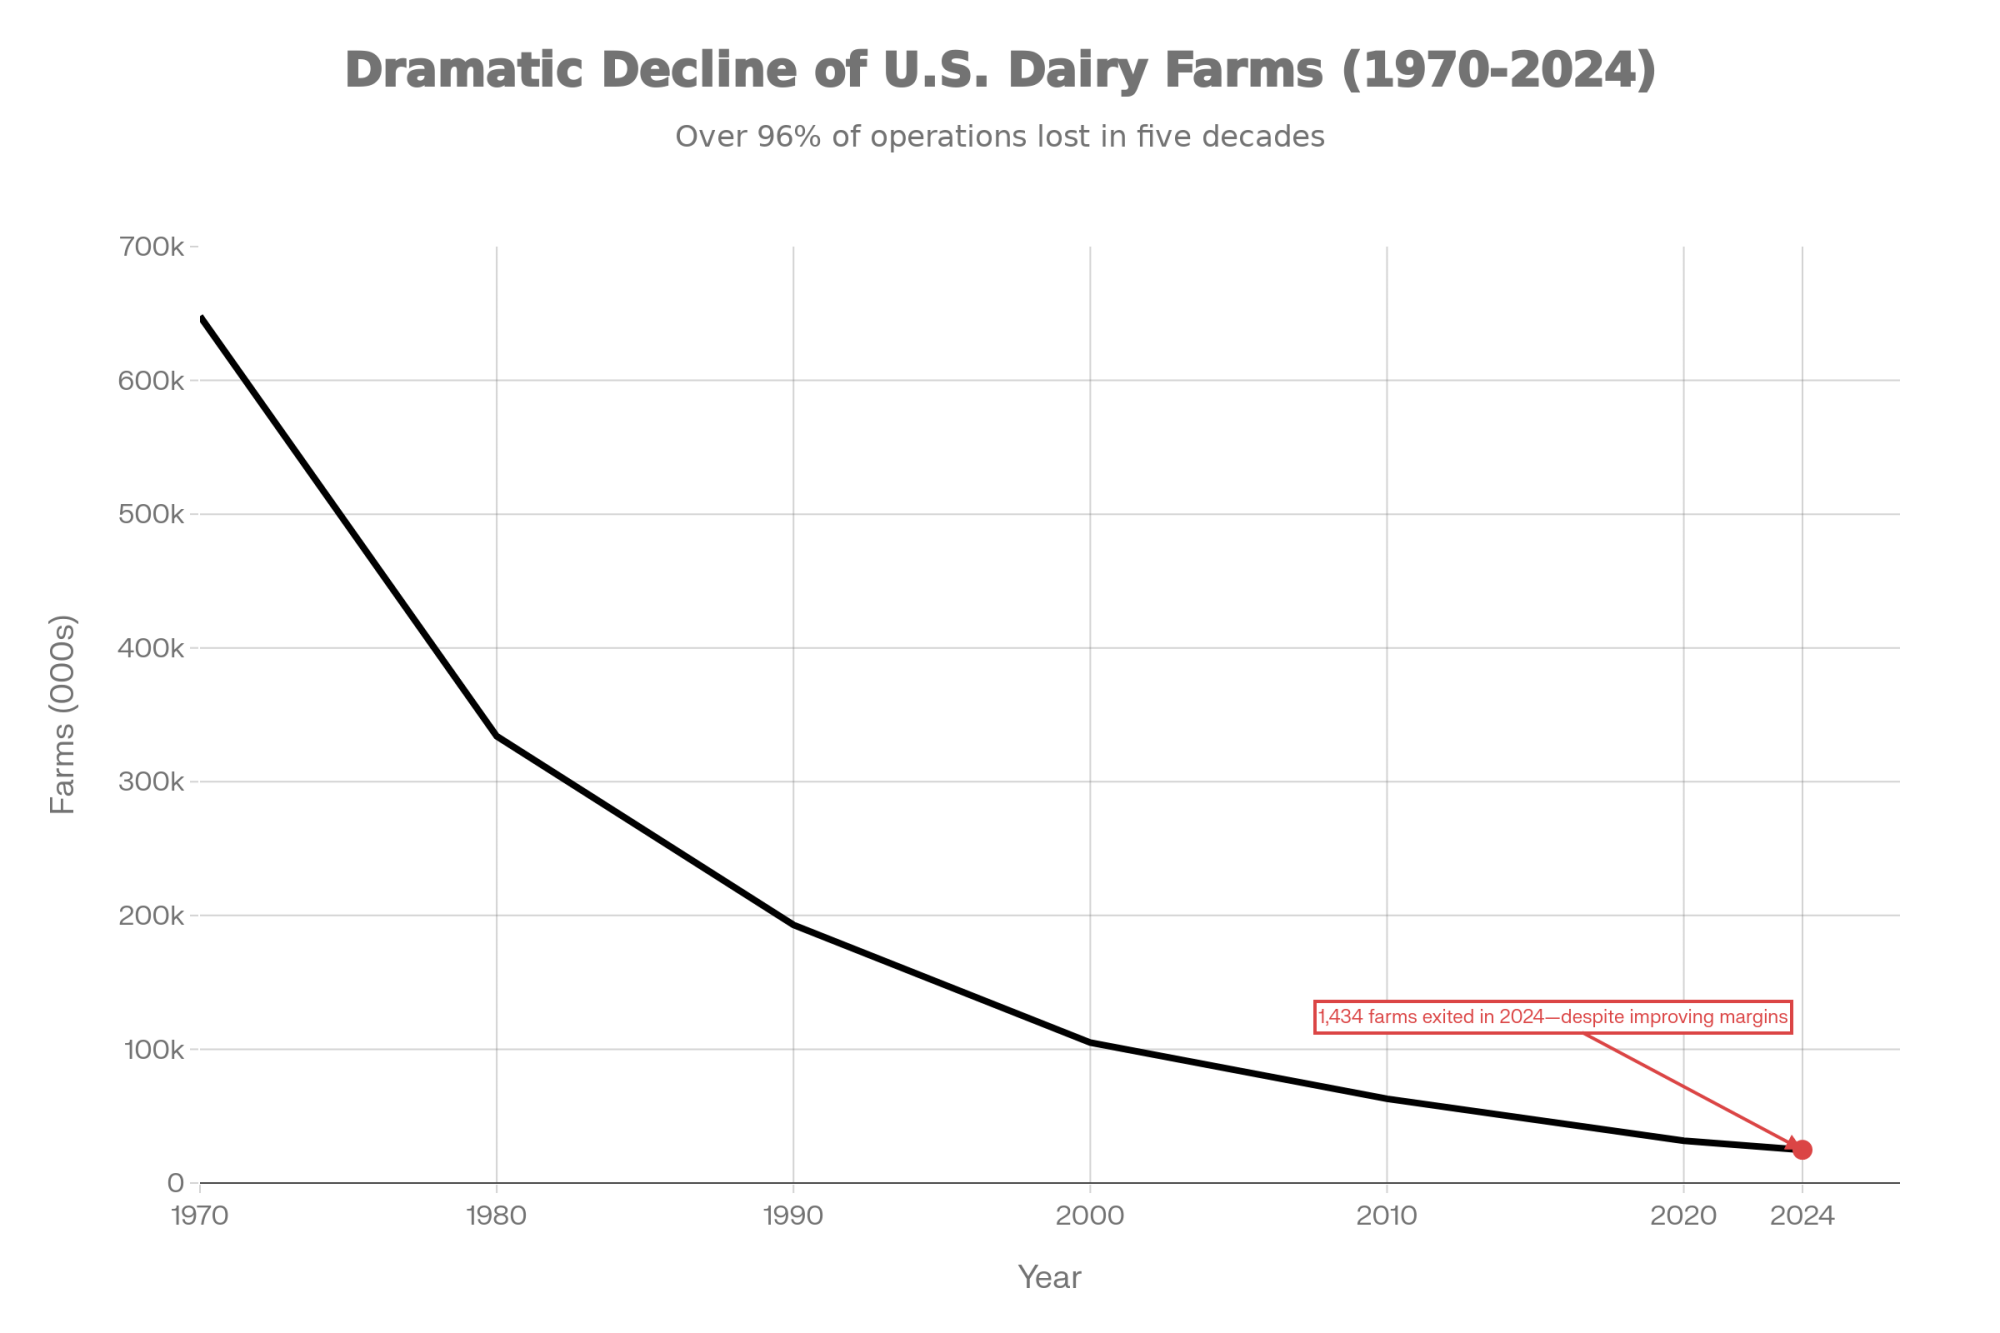
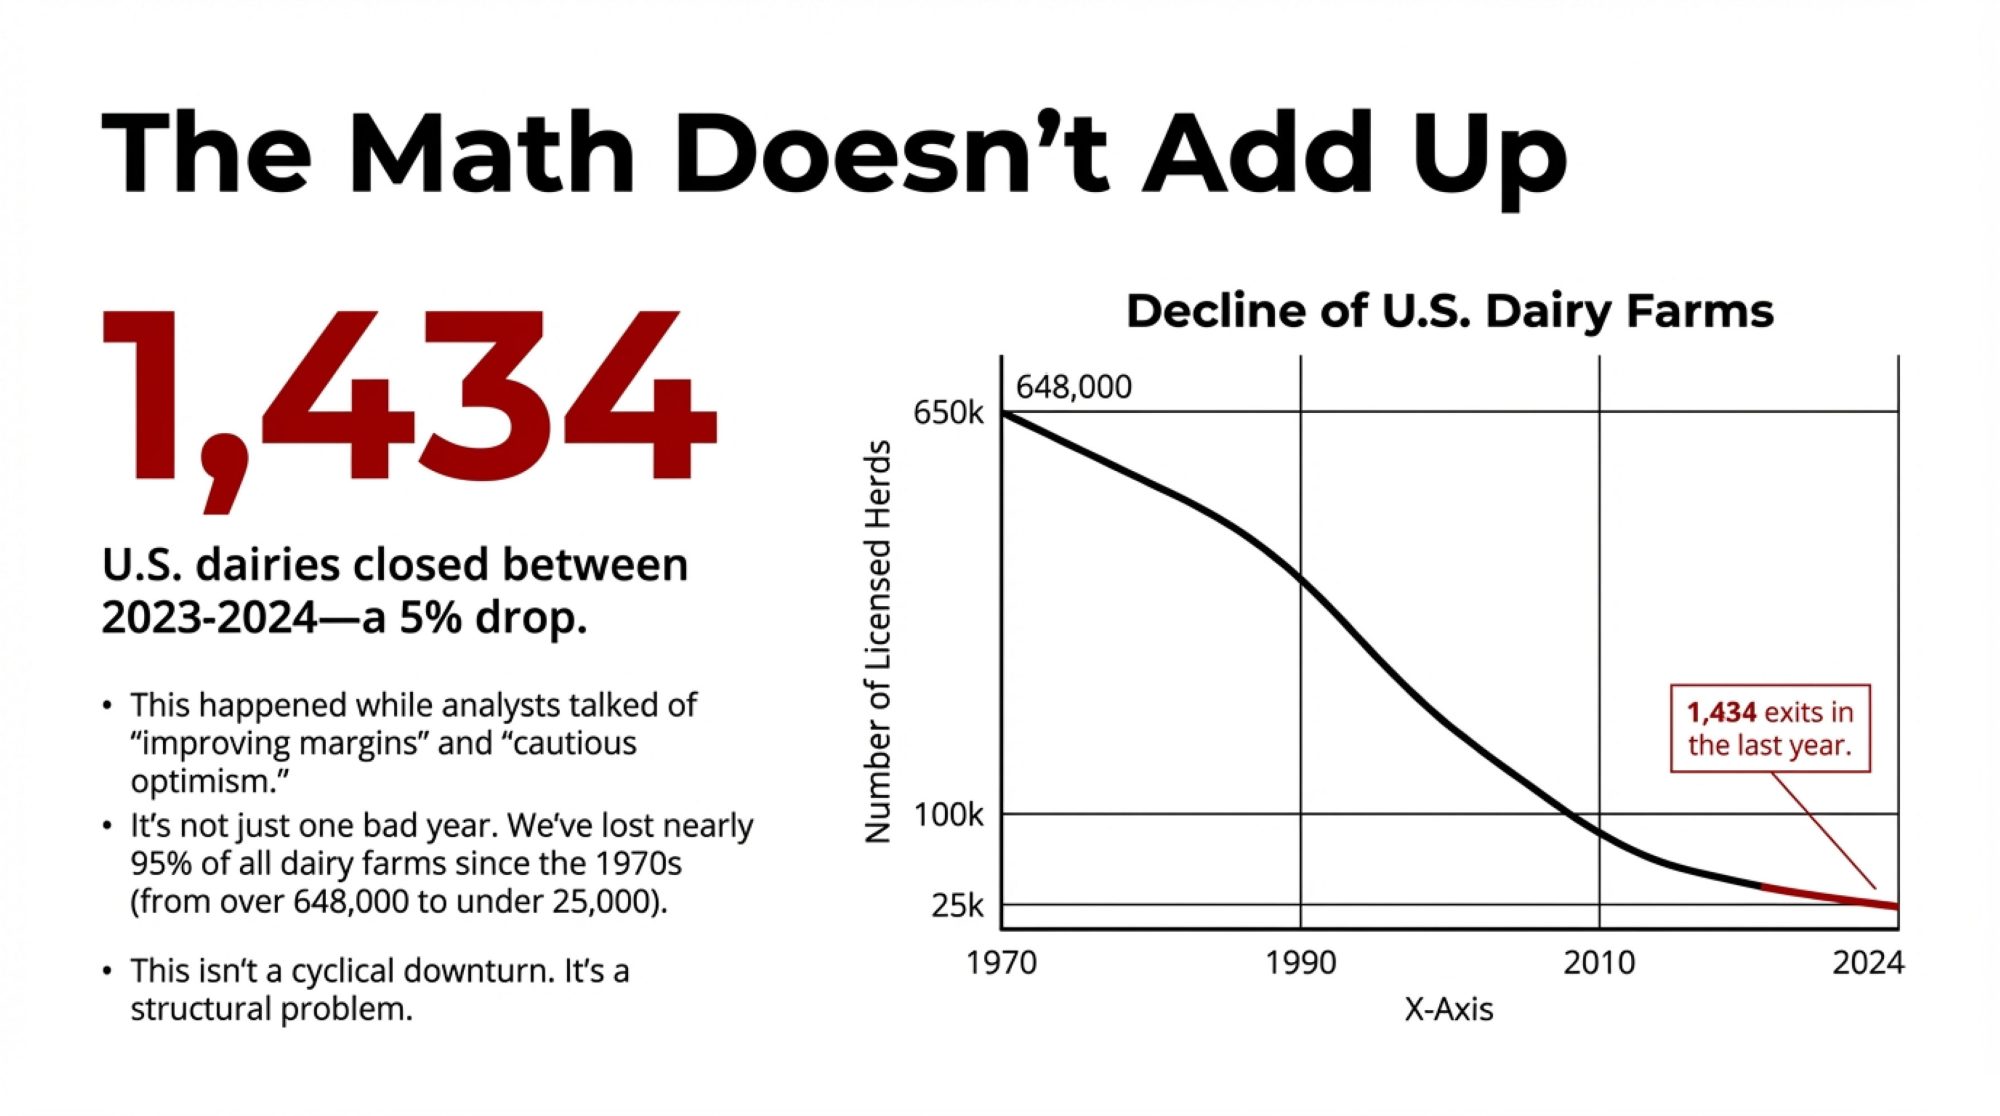
USDA’s 2022 Census of Agriculture documents the math clearly: U.S. dairy operations dropped from 39,303 in 2017 to 24,082 in 2022—more than 15,200 farms gone in half a decade. The closures slow down during high-price periods, but they never actually stop. And that persistence through both good markets and bad tells us something important: we’re not watching a normal price cycle play out. This is a structural change.
USDA Census data reveals 15,221 dairy farms vanished between 2017-2022—an average of 8.2 operations closing every single day for five years straight, with no slowdown during high-price periods
What’s driving it? Part of the answer showed up in some Canadian grocery pricing data I was reviewing recently. During the period when farm input costs were climbing sharply, food retailer margins expanded rather than compressed. Much of the additional money consumers were paying didn’t flow back to producers. It accumulated in other parts of the supply chain.
Now, I want to be fair here—retailers face their own cost pressures and competitive dynamics. But the pattern illustrates something Dr. Michael Boehlje has written about extensively. He’s a Distinguished Professor Emeritus in Agricultural Economics at Purdue who’s studied farm and agribusiness management for decades, and his analysis suggests that commodity supply chains tend to extract value from the farm level when one segment has more pricing power than another. That’s not an accusation. It’s just how these systems often work.
The question for dairy producers isn’t whether this structural shift is happening—the data makes that clear. The question is what to do about it.
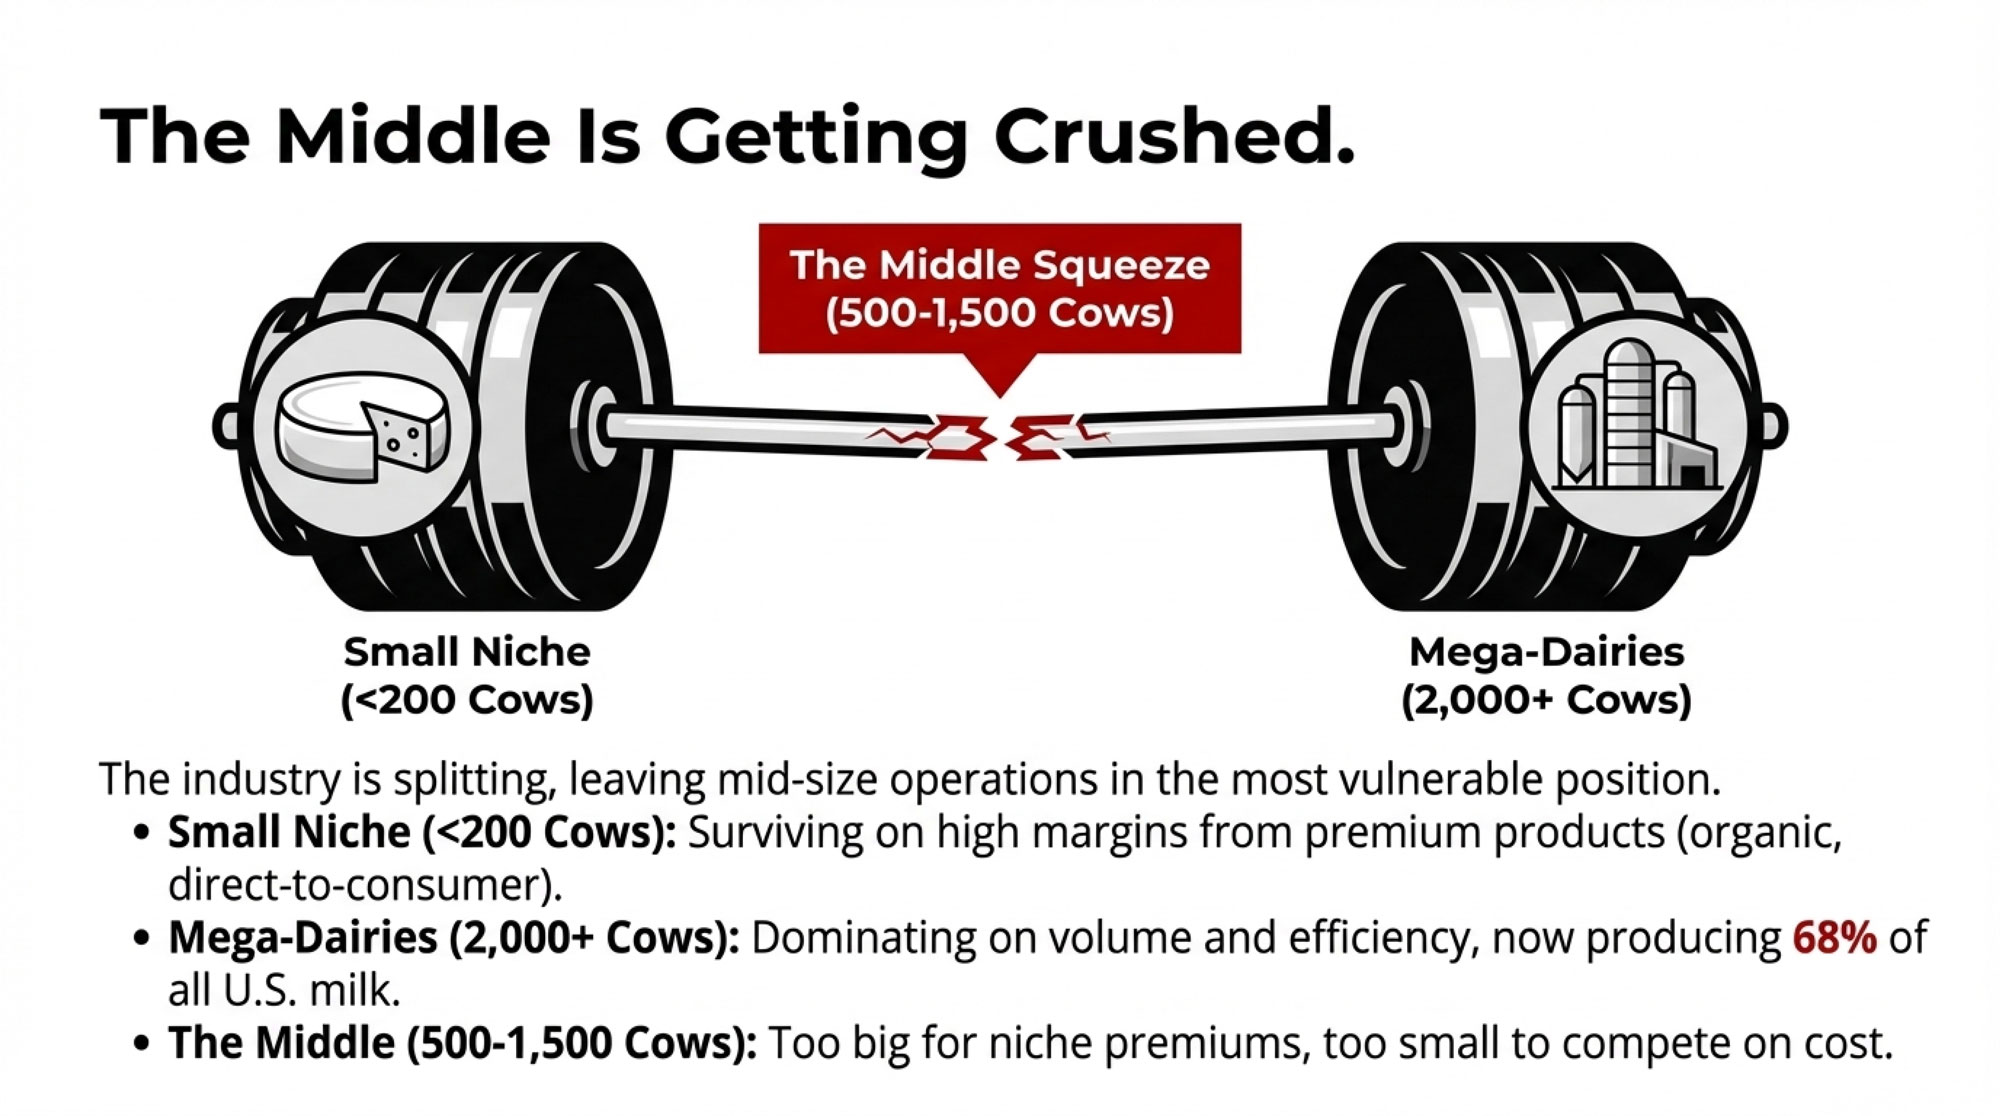
The Barbell Effect: Where the Industry Is Headed
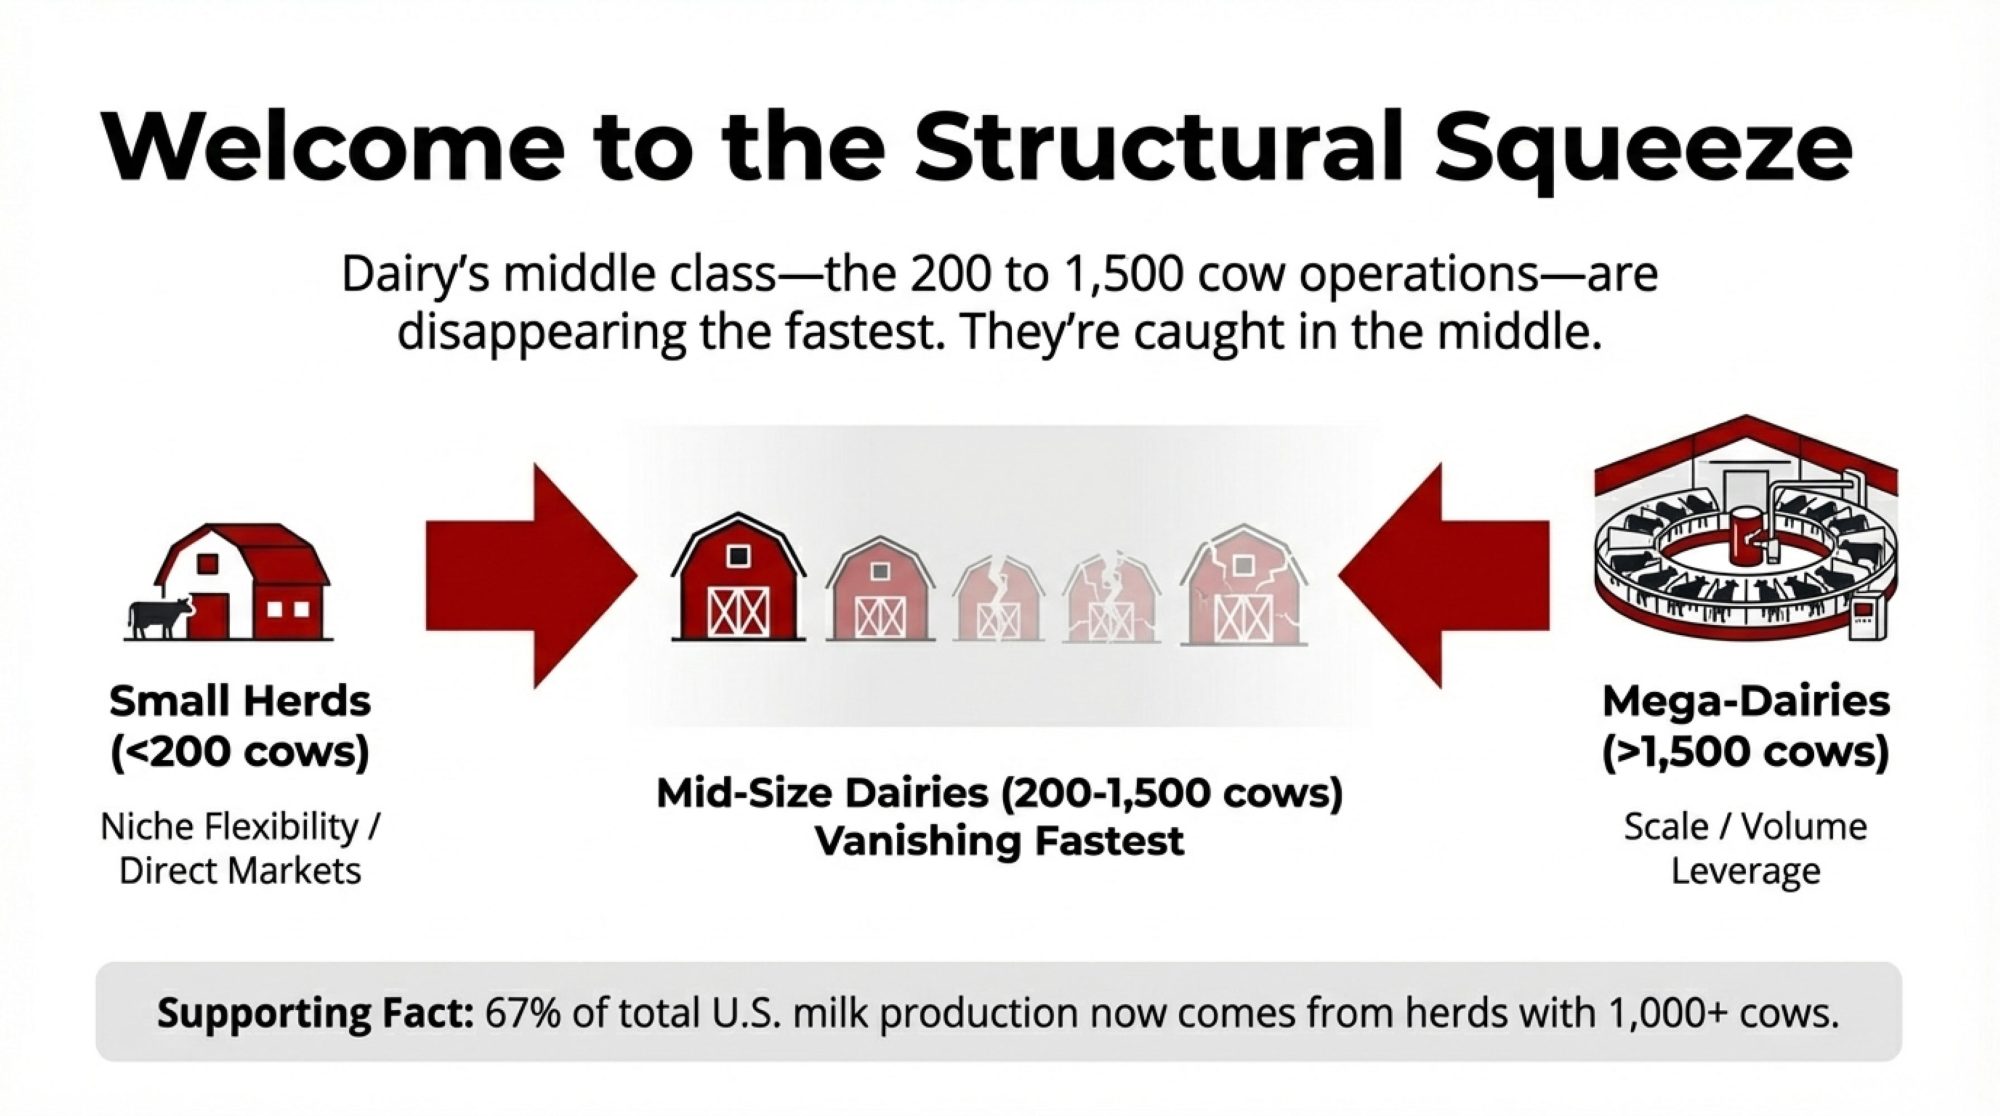
What we’re witnessing isn’t random attrition. It’s a fundamental reshaping of the industry into what economists call a “barbell” structure—growth at both extremes while the middle gets squeezed out.
On one end: Small operations under 200 cows that have carved out premium niches—organic, grass-fed, farmstead cheese, direct-to-consumer sales. They survive on margins, not volume.
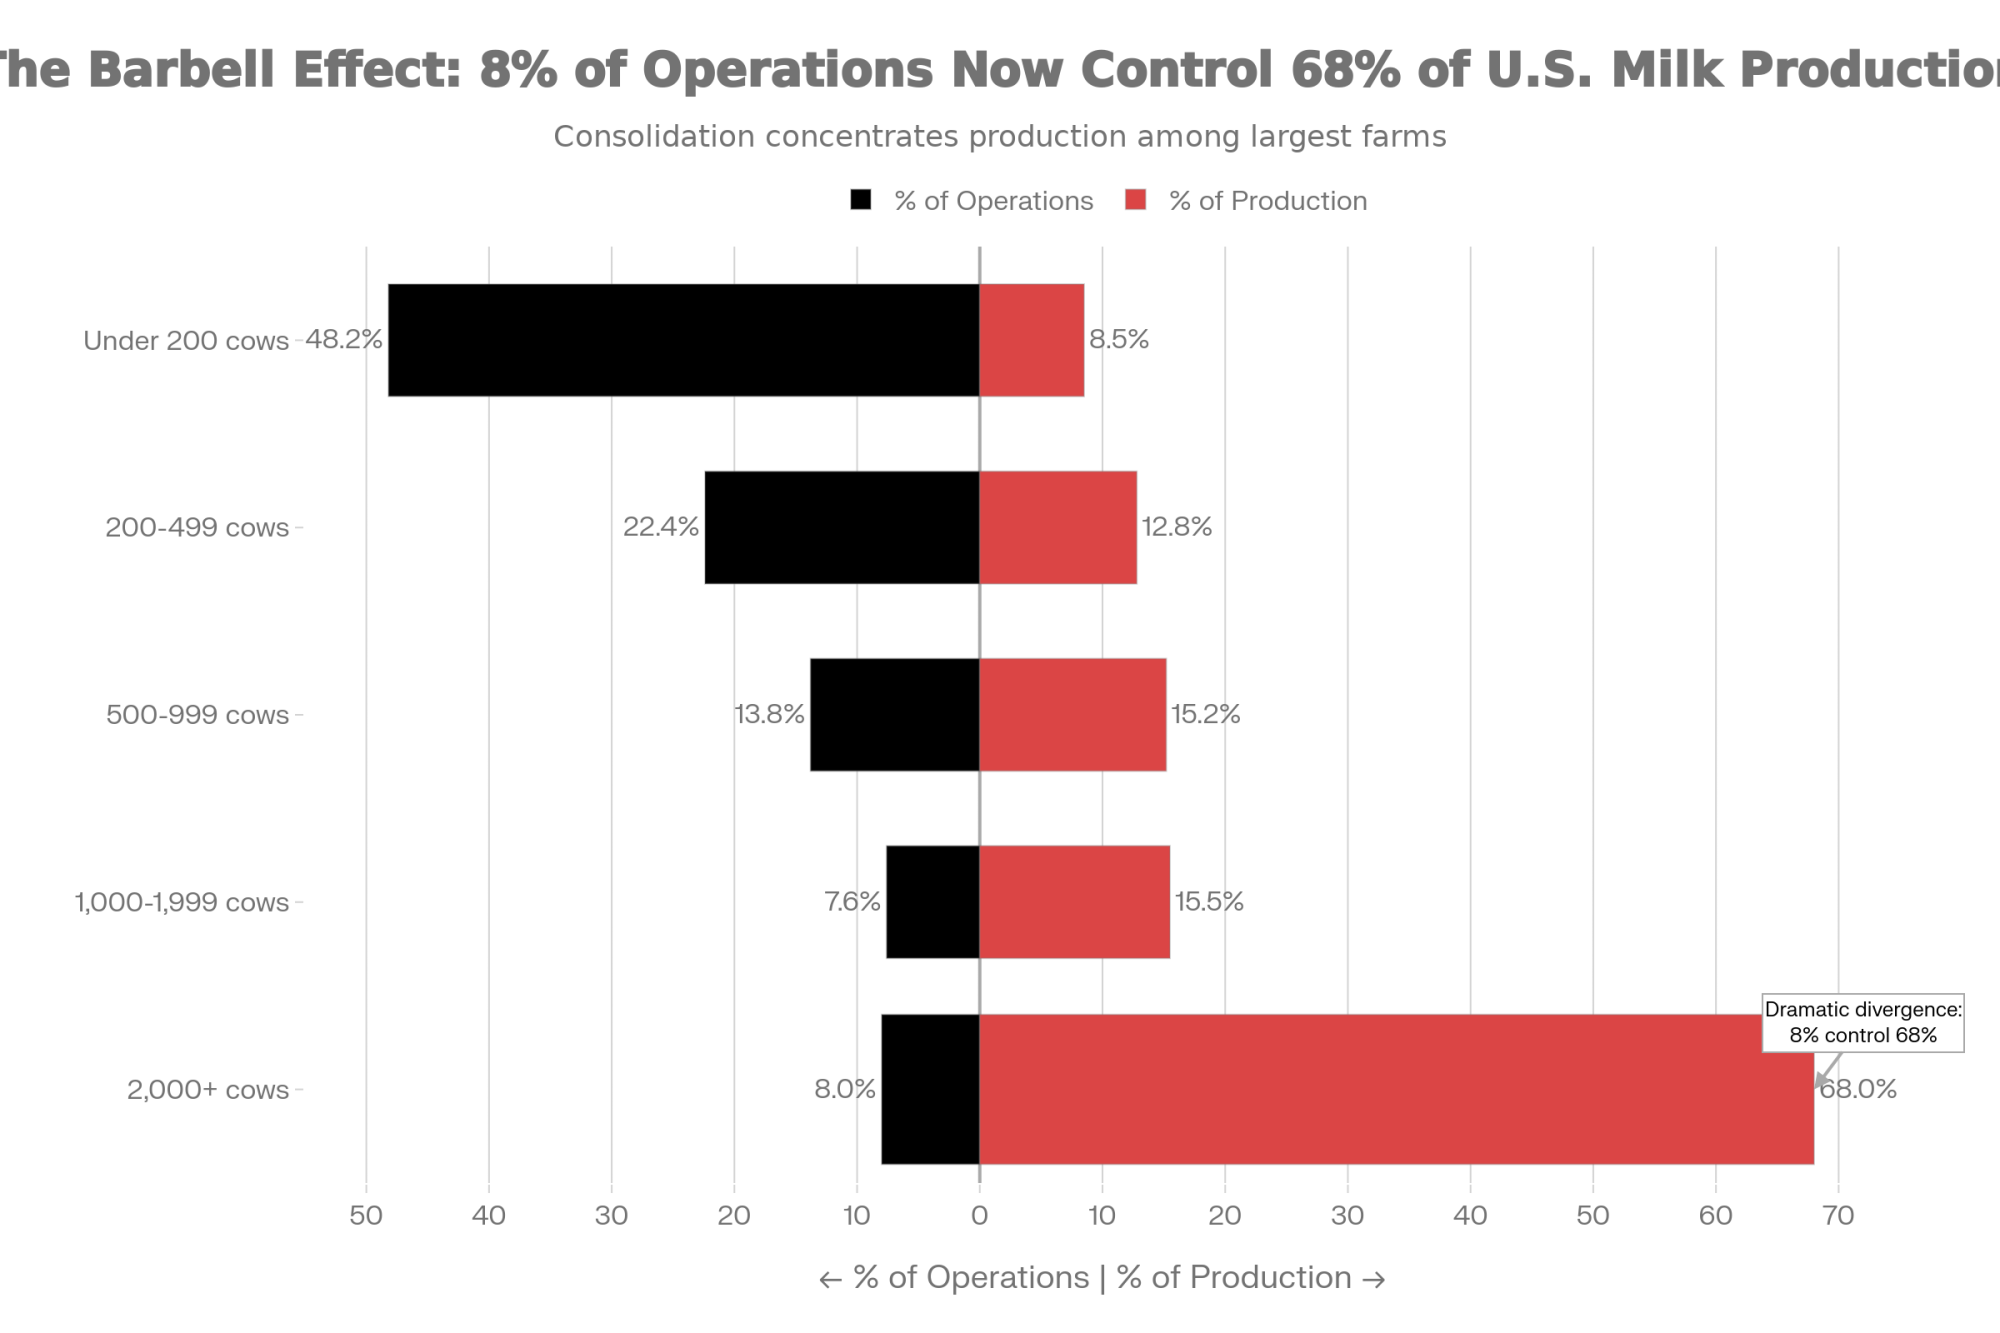
On the other end: Large operations running 2,000+ cows with aggressive automation, professional management teams, and cost structures that commodity markets actually support. Rabobank data shows these large operations now account for roughly 68% of U.S. milk production.
In the middle: Operations running 500-1,500 cows that are too big to capture premium pricing but too small to achieve the cost efficiencies of mega-dairies. This is where the structural pressure is most intense—and where farm losses are concentrated.
Operation Size
% of Operations
% of Milk Production
Under 200 cows
48.2%
8.5%
200-499 cows
22.4%
12.8%
500-999 cows
13.8%
15.2%
1,000-1,999 cows
7.6%
15.5%
2,000+ cows
8.0%
68.0%
The Consolidation Numbers Tell a Consistent Story
The trajectory has been remarkably steady across regions and time periods, which is what makes it feel structural rather than cyclical.
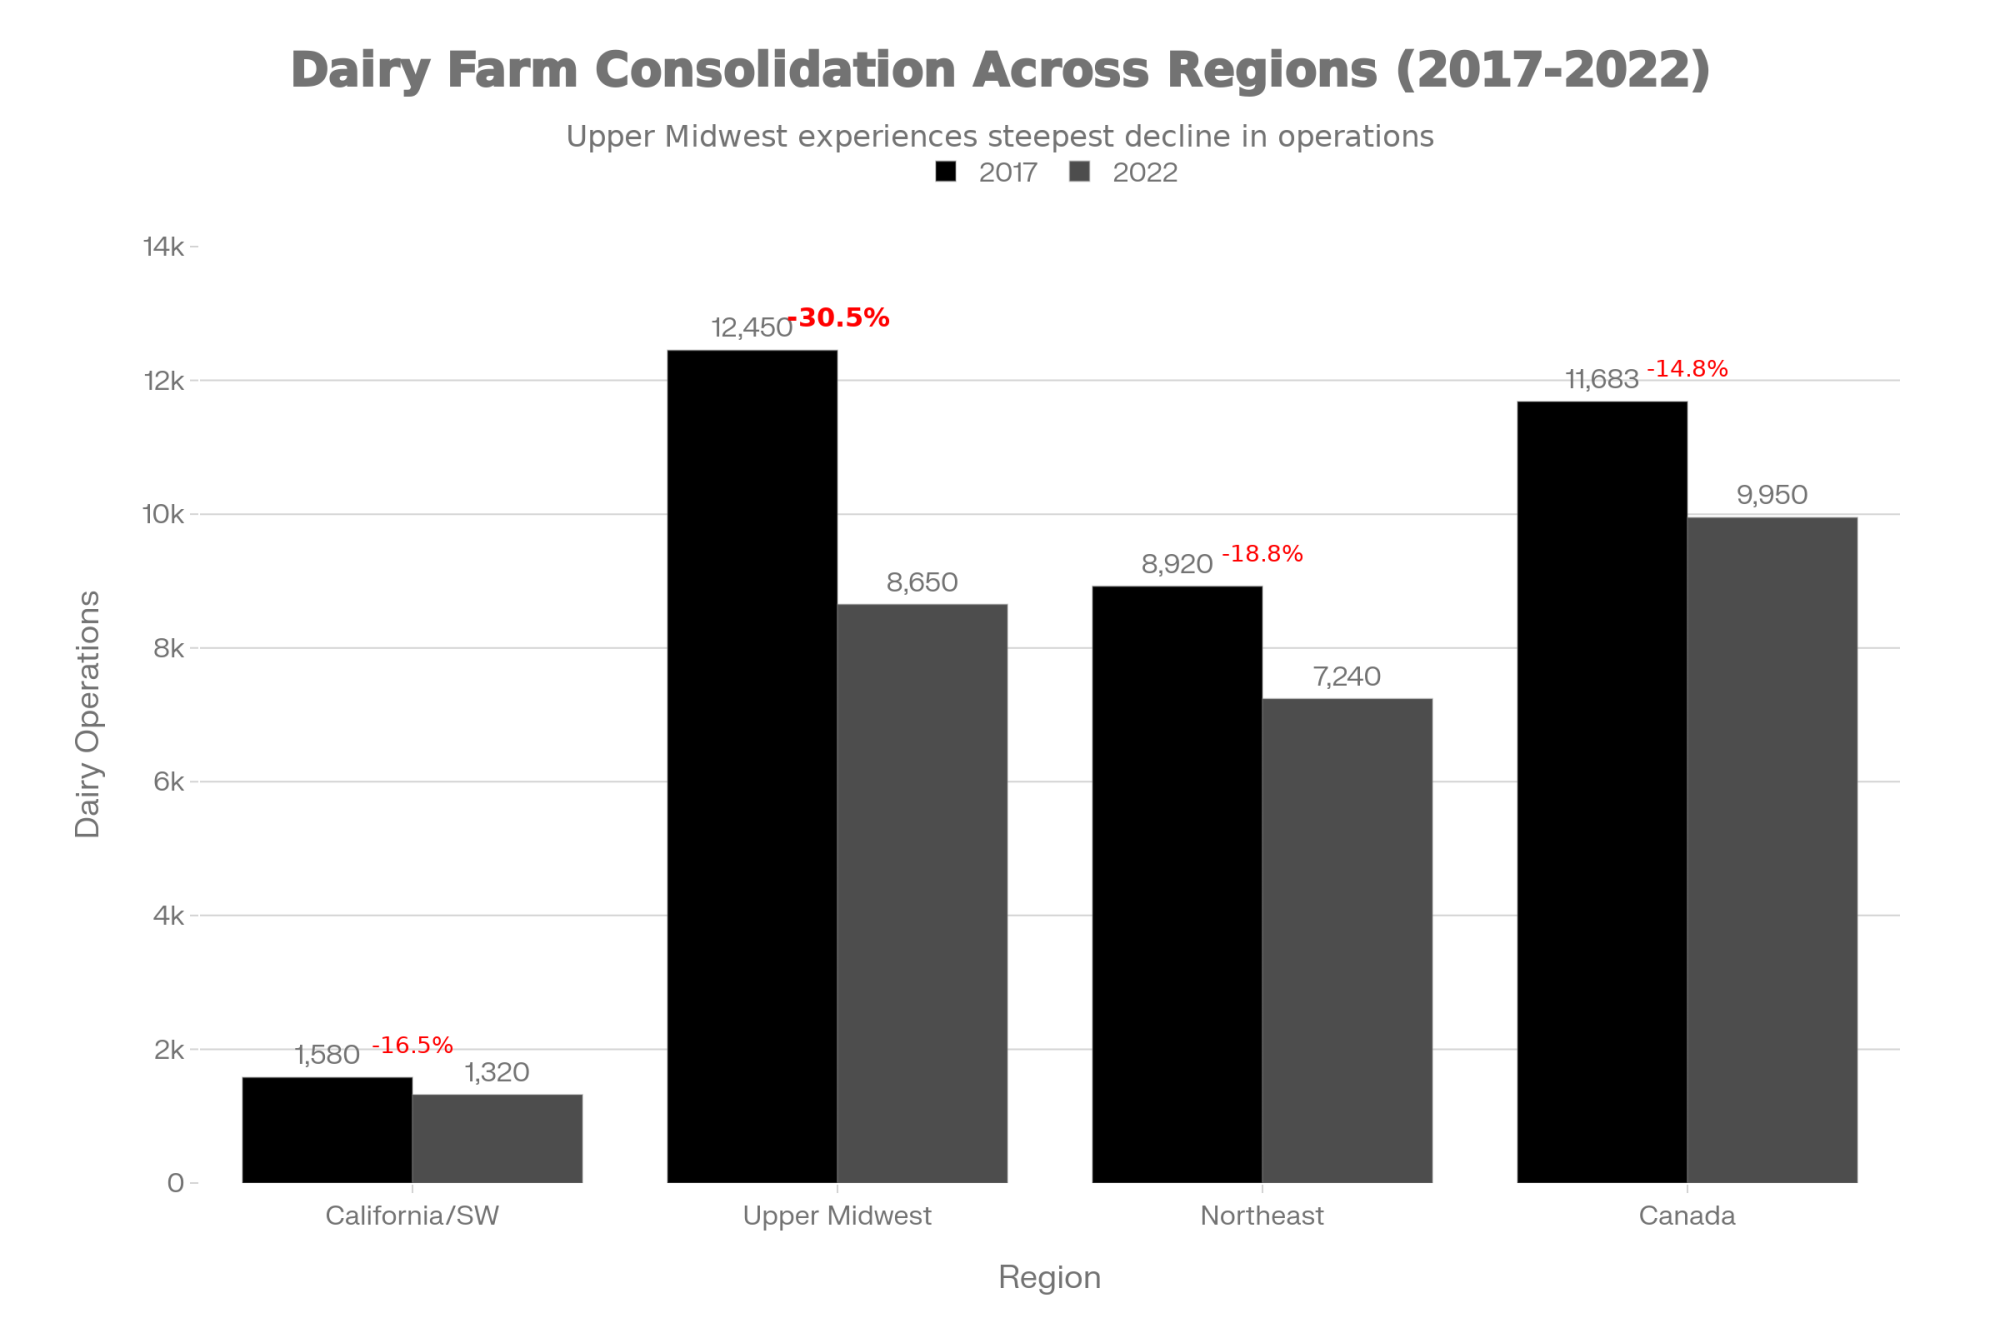
The Upper Midwest lost 3,800 dairy operations in five years—a 30.5% collapse that’s double California’s rate, where consolidation has largely stabilized after shifting to mega-dairies decades ago
Wisconsin DATCP licensing data shows the state lost 818 dairy farms in 2019, another 455 in 2023, and roughly 400 more in 2024. Add up the losses since 2019, and you’re past 1,500 operations—gone from a state that still thinks of itself as America’s Dairyland. Minnesota shows similar patterns. So does New York.
What surprised me when I dug into the regional data is how differently this plays out depending on where you’re farming.
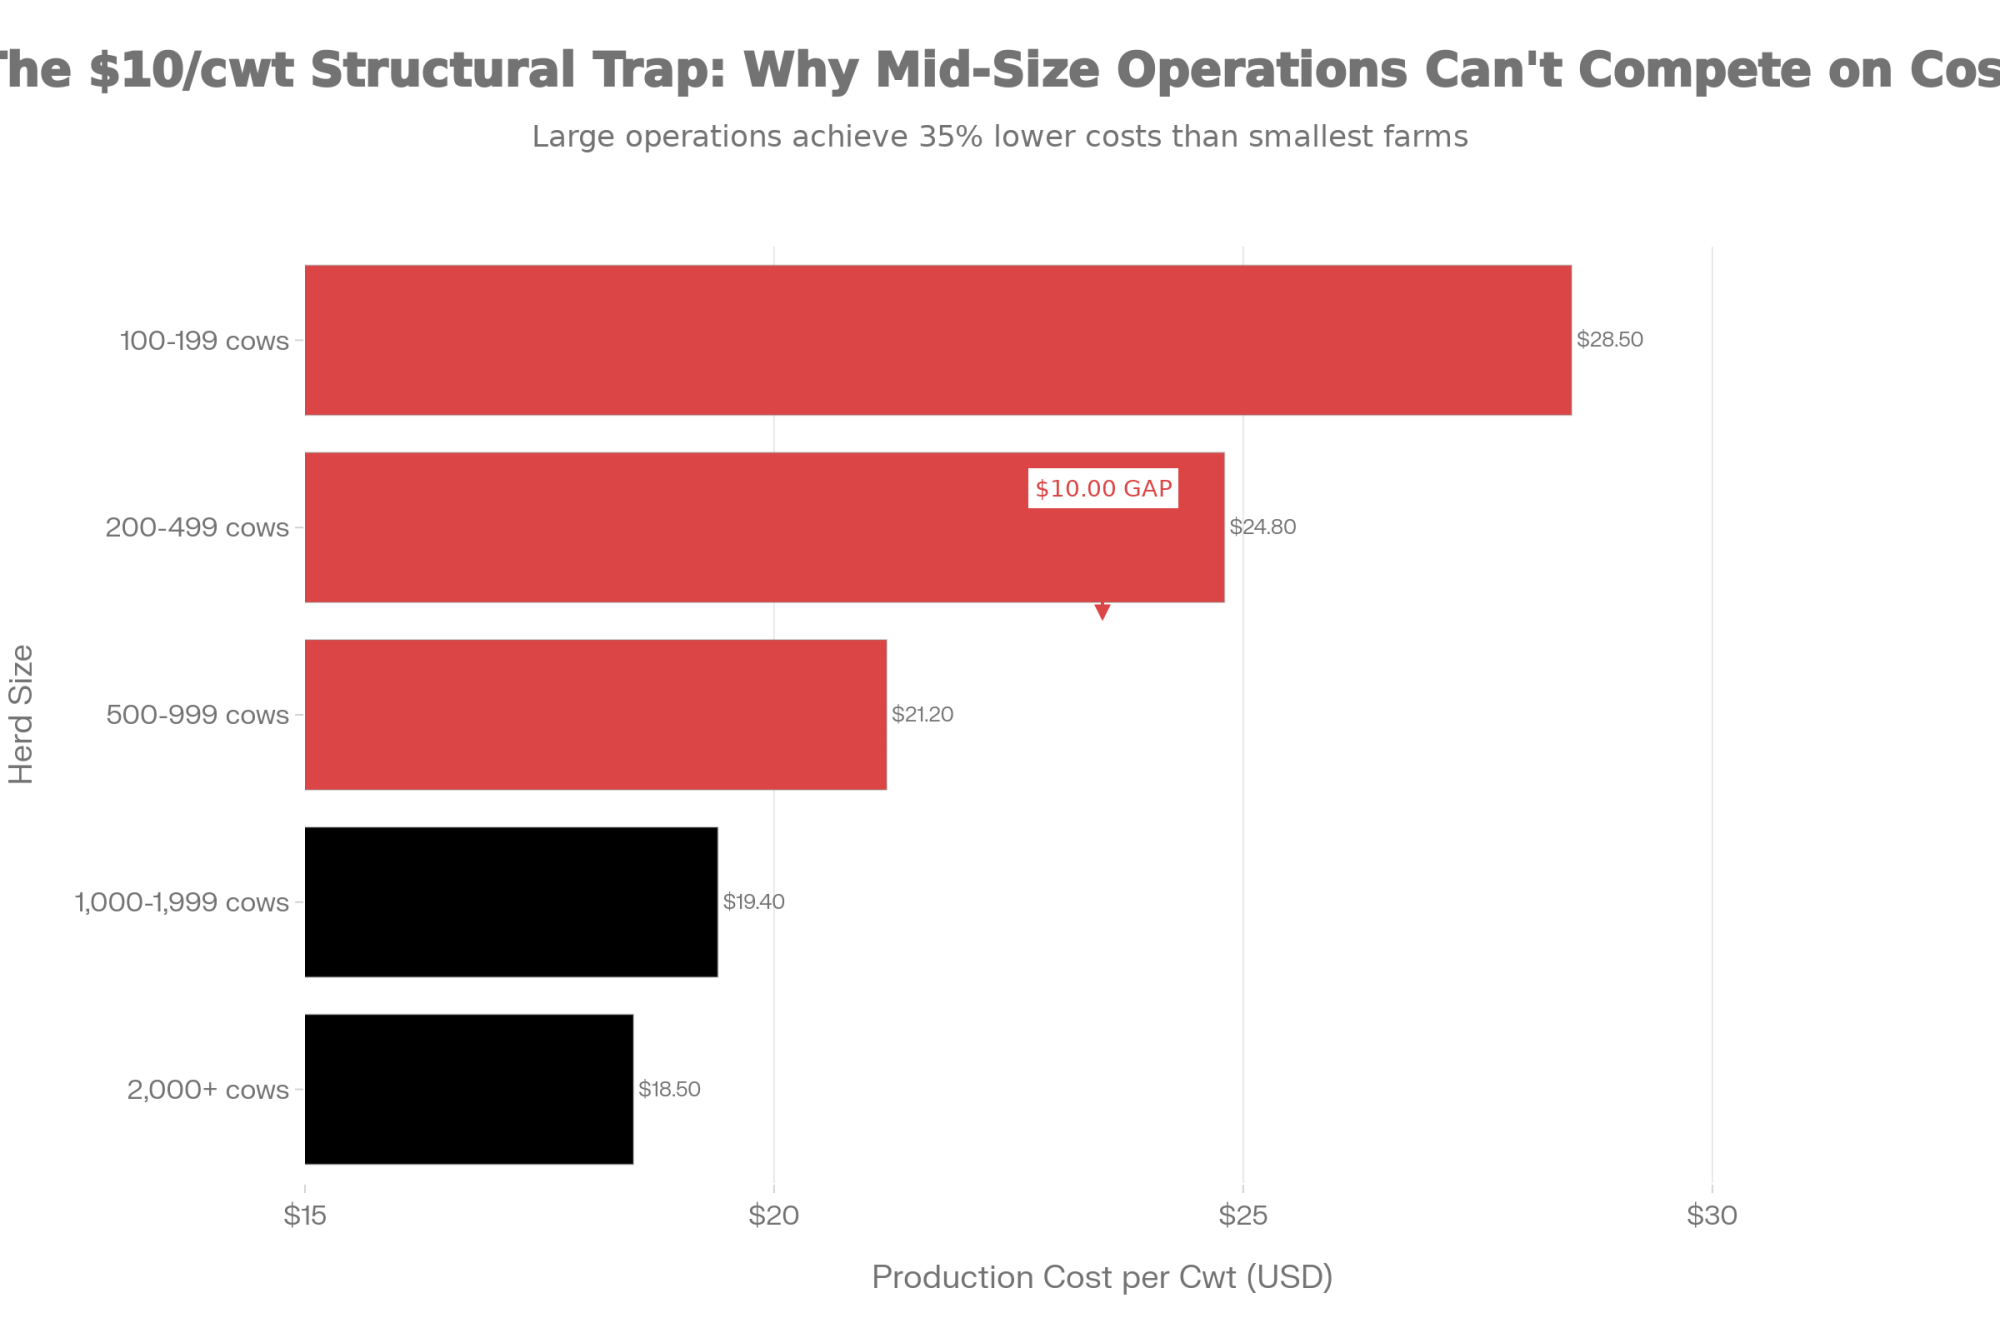
Rabobank data shows 2,000+ cow operations produce milk at $18.50/cwt while 500-cow dairies struggle at $21.20/cwt—a $2.70 permanent structural disadvantage that bleeds $270,000 annually on 10 million pounds of production
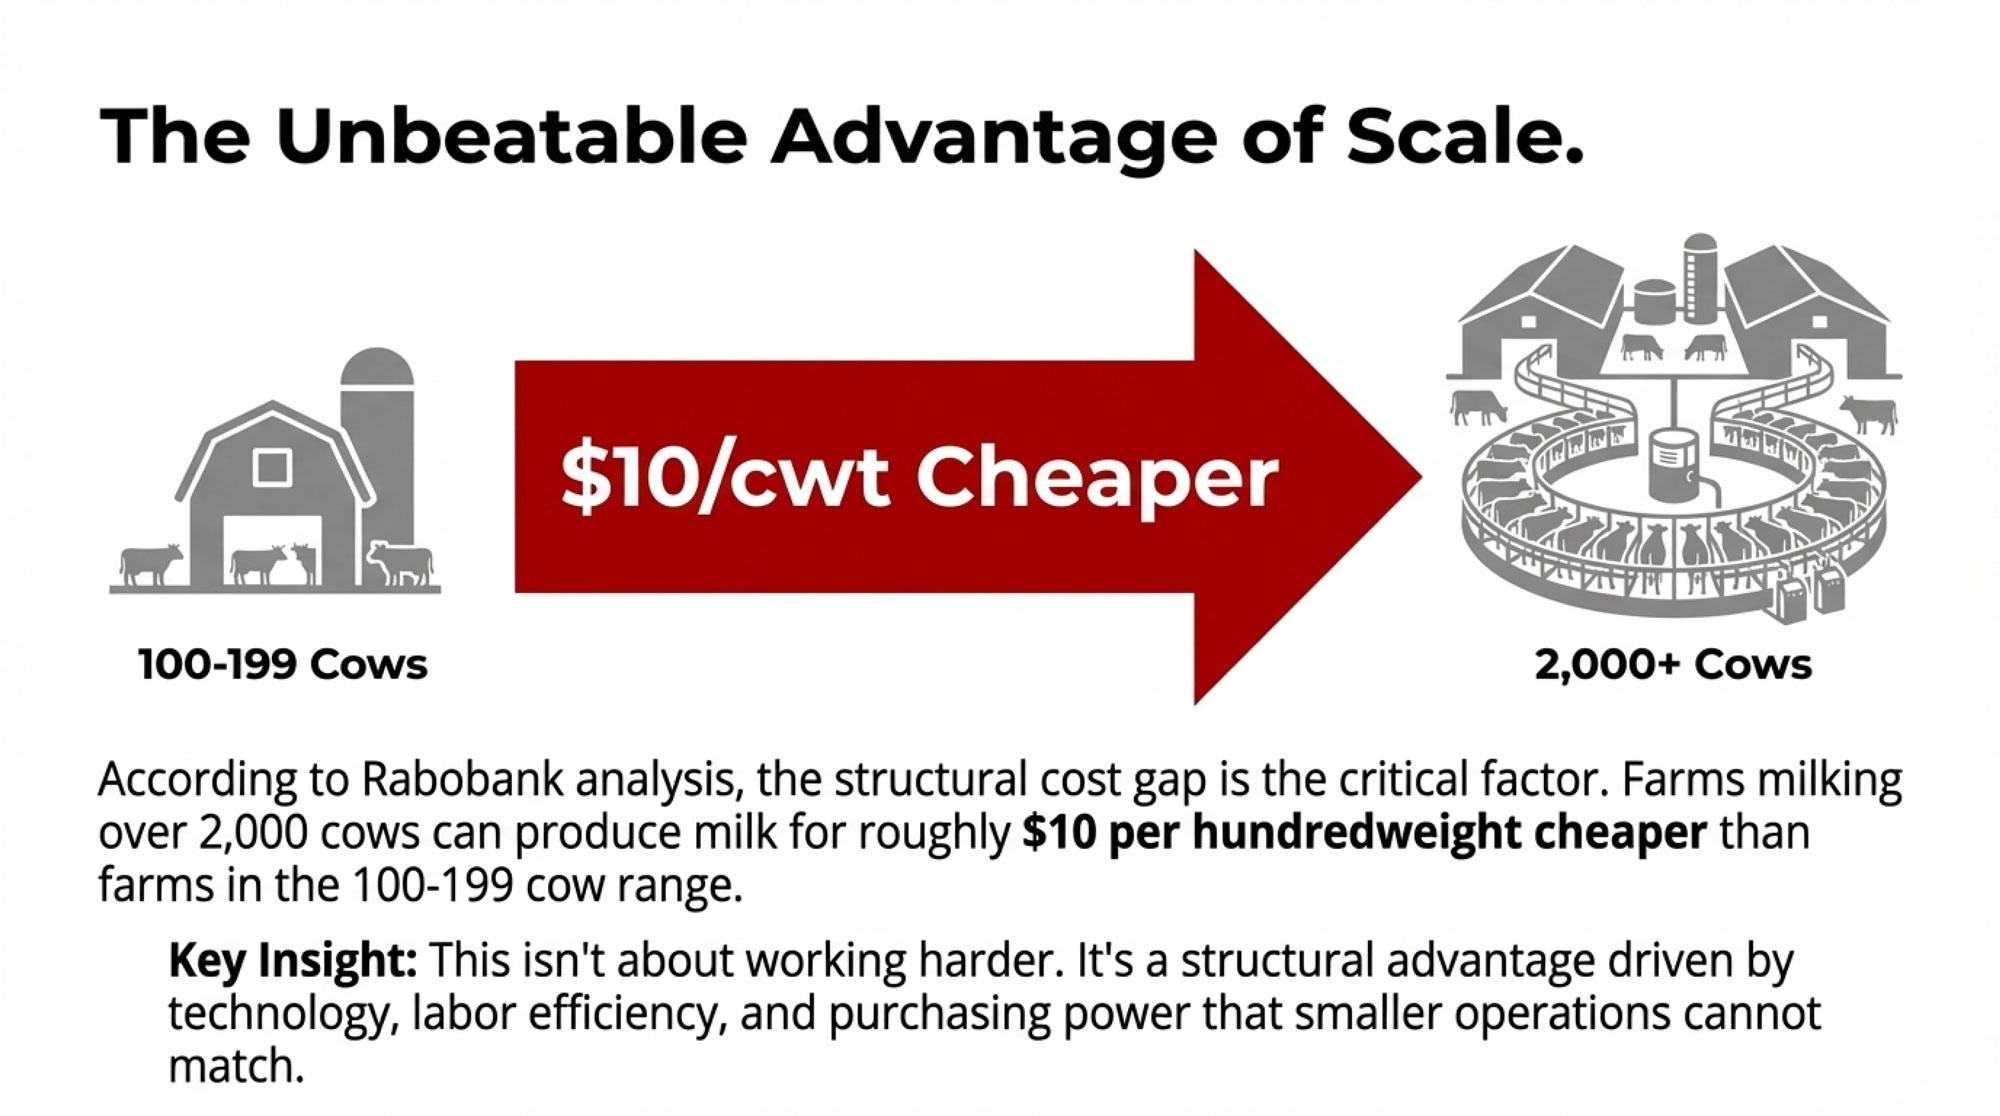
In California’s Central Valley and the Southwest—Texas, New Mexico, Arizona—consolidation has largely run its course. These regions now operate predominantly with very large dairies, many running drylot systems suited to arid climates, that have achieved cost structures that smaller operations struggle to match. Lucas Fuess, a senior dairy analyst at Rabobank, has noted that farms milking more than 2,000 cows can produce milk about $10 per hundredweight cheaper than farms running 100-199 cows. That’s not a small advantage. Over a year of production, that gap becomes the difference between building equity and burning through it.
The Upper Midwest presents a more complicated picture. You still find significant numbers of 200-800 cow operations in Wisconsin and Minnesota, but the economics are getting harder. The survivors tend to fall into two camps: those scaling toward 1,500+ cows to capture efficiency gains, and those capturing specialty premiums through organic certification, grass-fed programs, or artisan cheese partnerships. The middle ground between those strategies has gotten thin.
The Northeast faces high land costs and increasingly complex environmental regulations—such as nutrient management plans, CAFO permitting requirements, and setback rules that vary from county to county. But proximity to premium urban markets creates opportunities that don’t exist in rural South Dakota. I’ve talked with Vermont and New York producers who’ve built genuinely sustainable businesses through direct sales and value-added products. It requires different skills than commodity production, but the path exists.
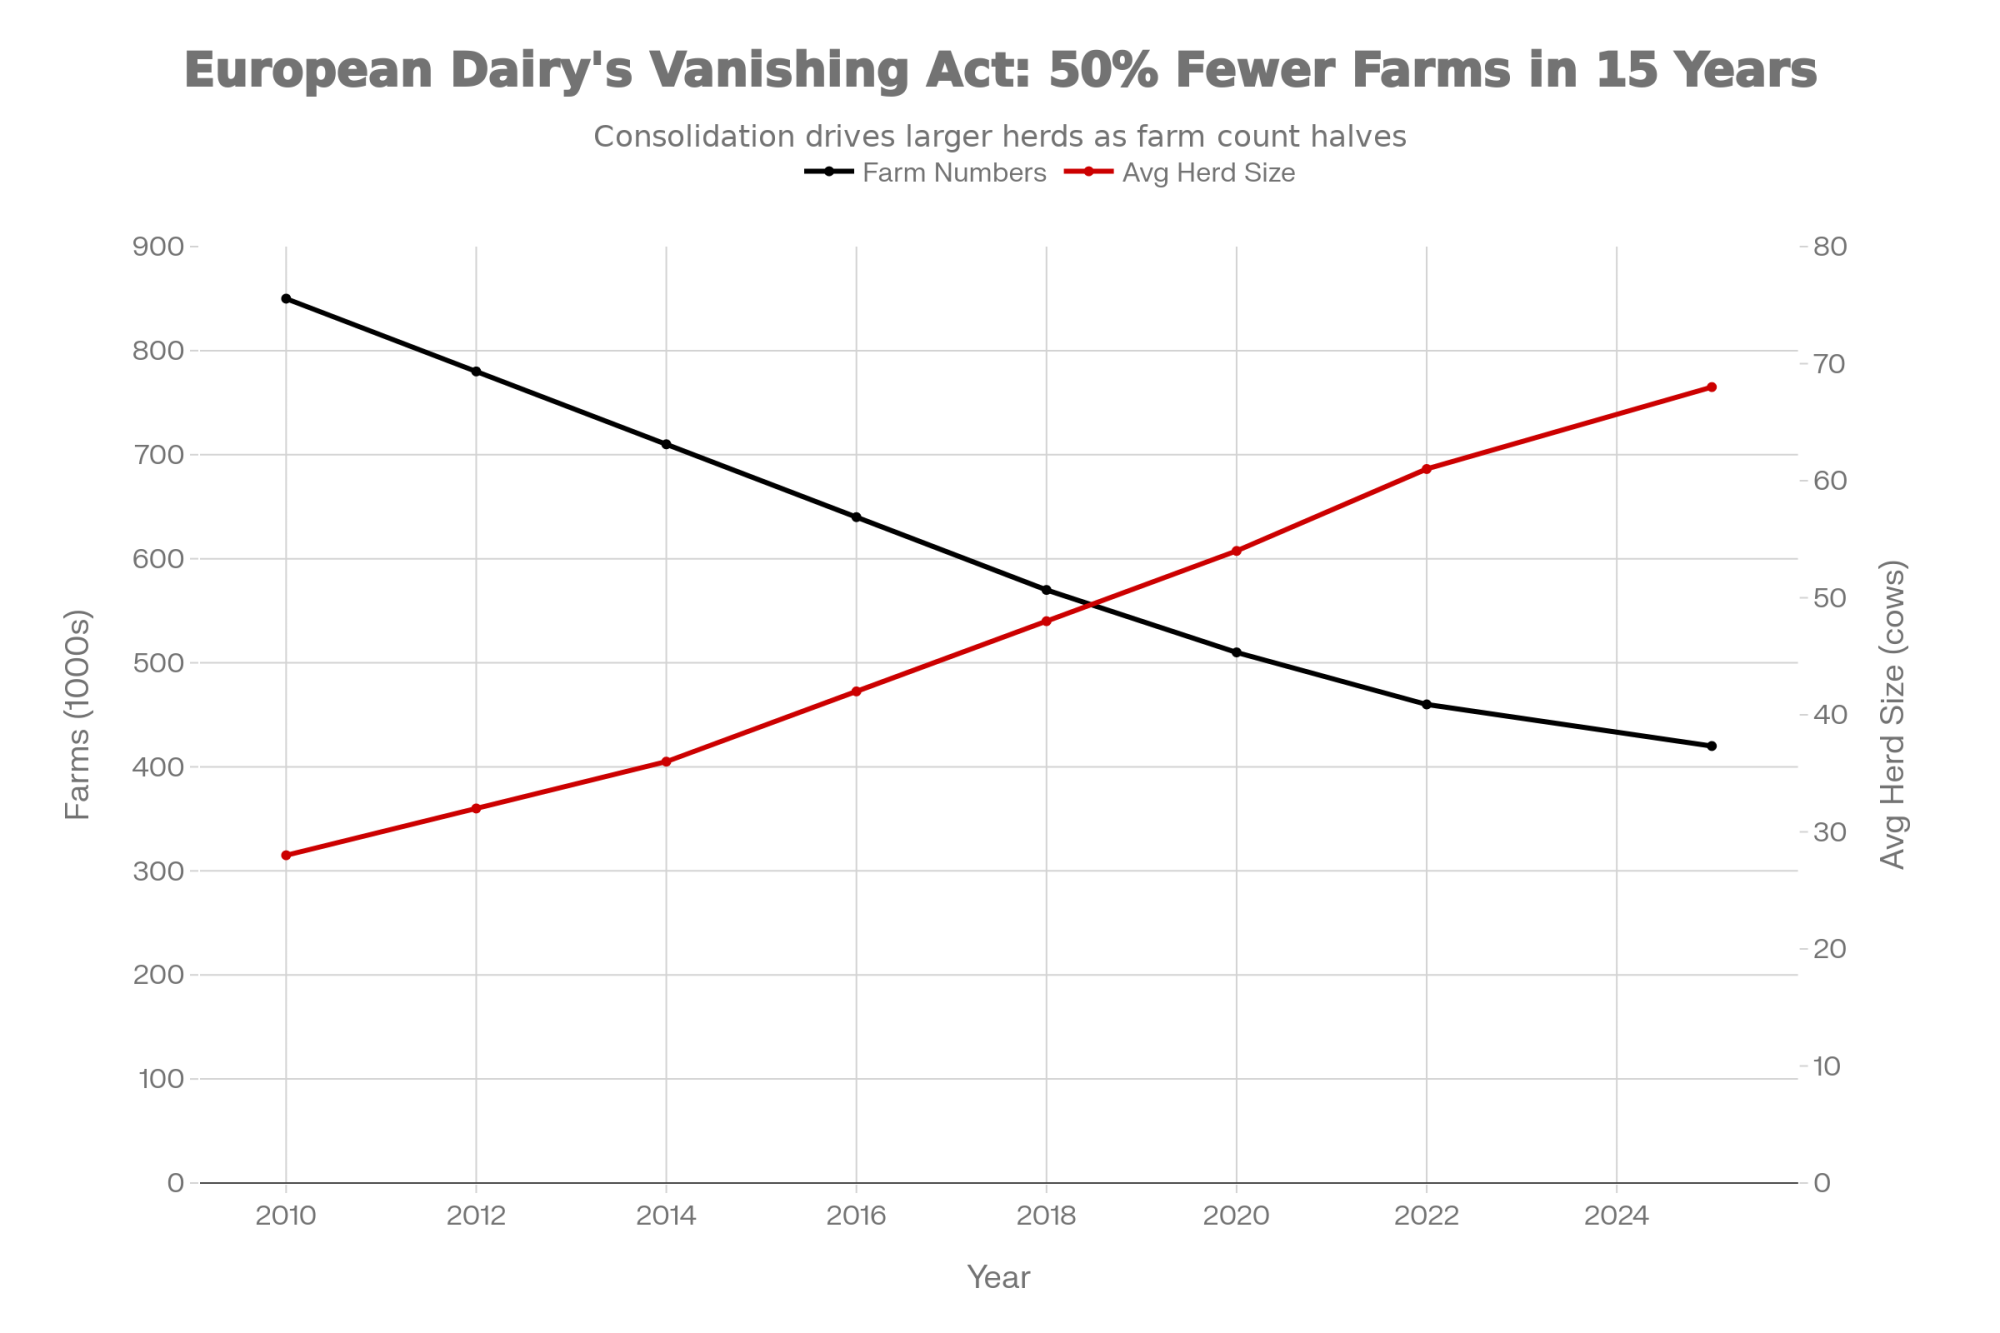
Canadian producers operate under supply management, which provides price stability that U.S. farmers can only dream about. But even that hasn’t stopped consolidation entirely. A peer-reviewed study in the Canadian Veterinary Journal documented that Canadian dairy farms decreased by nearly 62% between 1991 and 2011—from over 39,000 operations down to fewer than 15,000. Current government data shows the decline continuing, with farm numbers dropping from about 12,000 in 2014 to roughly 9,250 in 2024.
Several industry analysts—including teams at Rabo AgriFinance and various land-grant universities—have projected that if current attrition rates continue, total U.S. dairy operations could fall into the 8,000 to 12,000 range by the mid-2030s. That’s not a formal USDA forecast, just an extrapolation. But the math isn’t complicated.
Technology and Labor: The Accelerating Factors
Two forces are speeding up the consolidation timeline in ways worth understanding.
Precision dairy technology—robotic milking systems, automated feeding, sensor-based health monitoring—requires significant capital investment but dramatically reduces labor needs per cow. A 2,000-cow operation with modern automation might run with 12-15 employees. Try running 500 cows with proportionally fewer workers, and you’ll find the per-cow labor costs much harder to manage. The technology favors scale in ways that weren’t true twenty years ago.
And then there’s the labor market itself. Finding reliable dairy workers has become genuinely difficult across most regions. The work is demanding, the hours are long, and competition from other industries has intensified. Larger operations can offer better wages, benefits, and more predictable schedules. Smaller operations often rely heavily on family labor—which works until the next generation makes different choices. Larger farms don’t just have more employees; they have HR systems. A 500-cow dairy often lacks the scale to hire an HR manager but is too big for the owner to handle all personnel issues personally. This adds to the “middle squeeze.
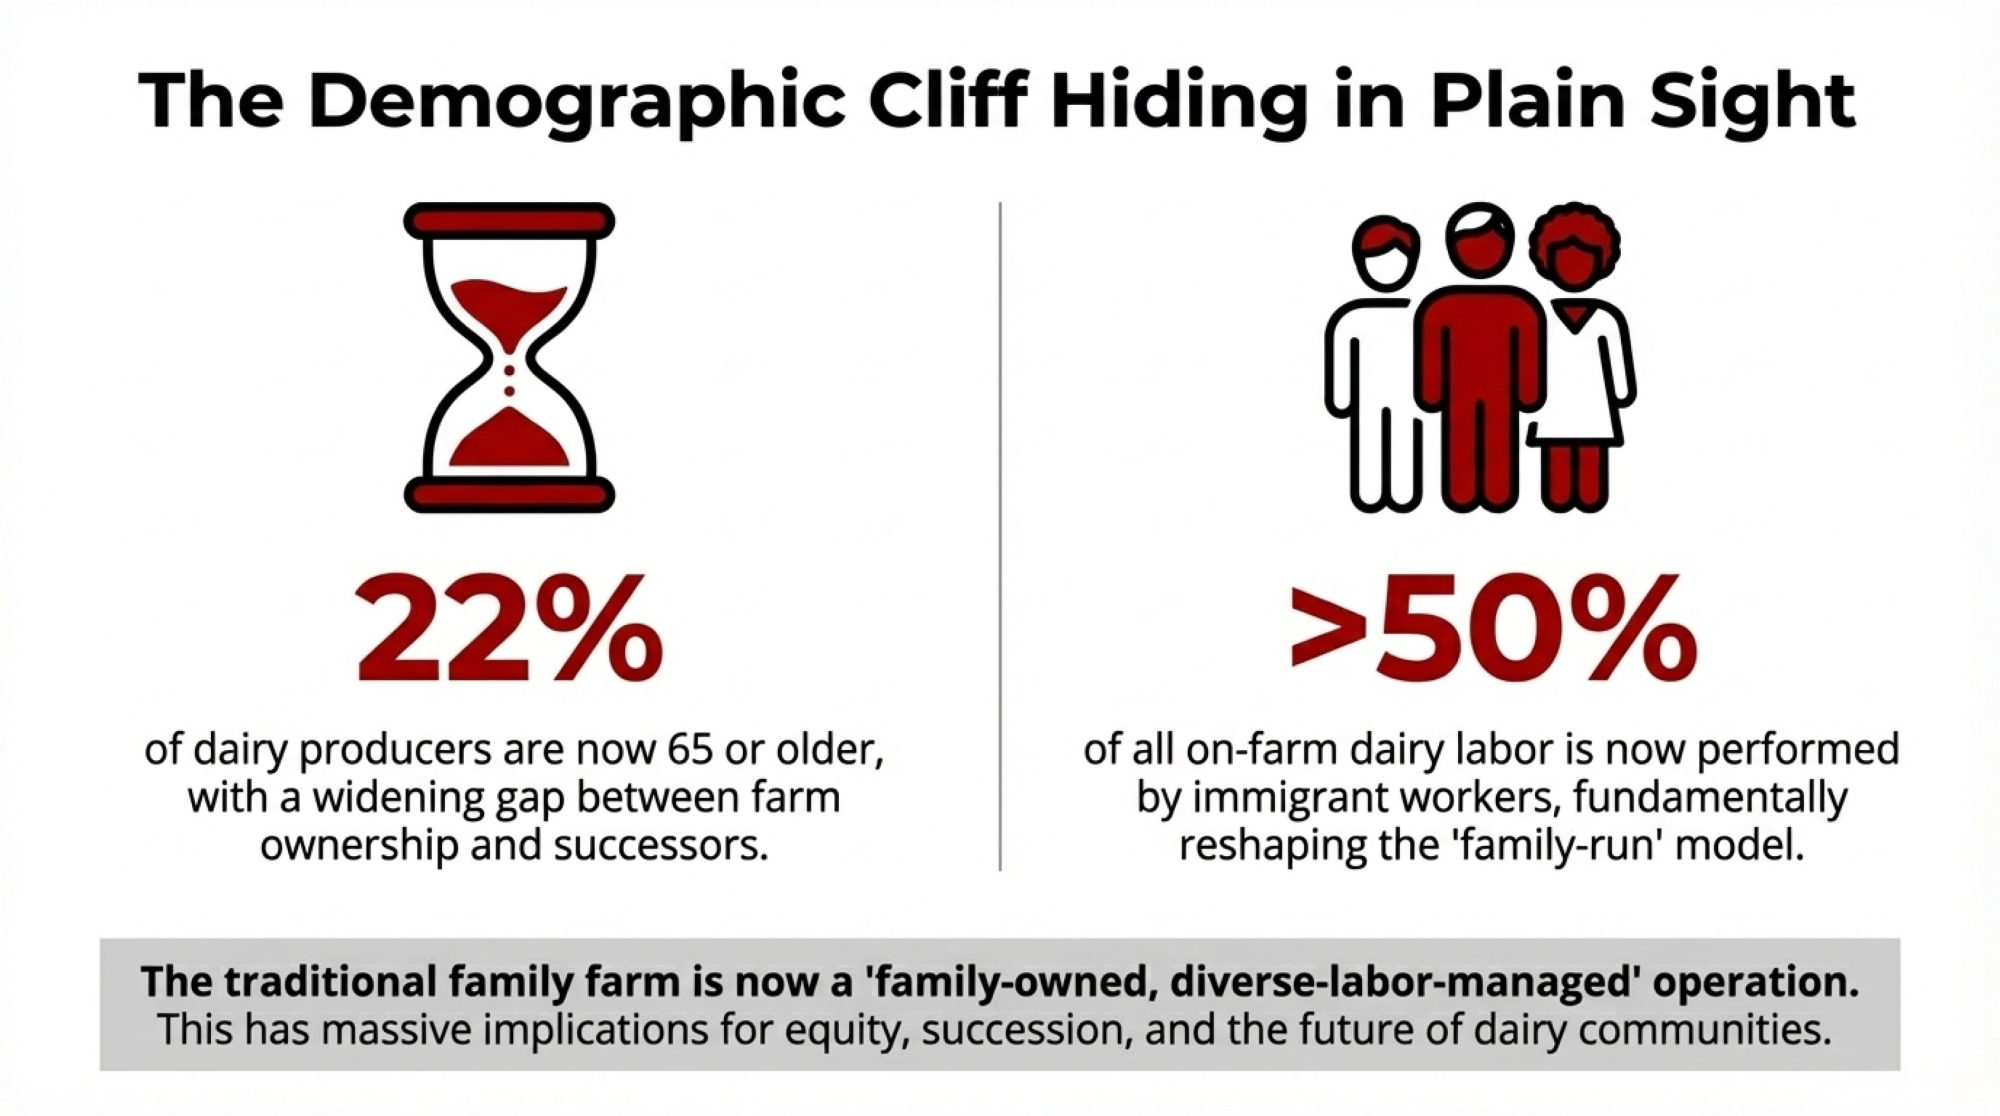
That generational piece matters more than we sometimes acknowledge. USDA data consistently shows the average age of farm operators climbing—it’s now 58.1 years for primary operators nationally, according to the 2022 Census. The same Census found that producers aged 65 and older now outnumber those under 35 by more than 4 to 1. And when the current generation steps back, many of those farms won’t continue as dairies, regardless of market conditions.
The Equity Question: What’s Really Happening to Your Balance Sheet
This is the piece I think deserves more attention, because it changes how you think about timing.
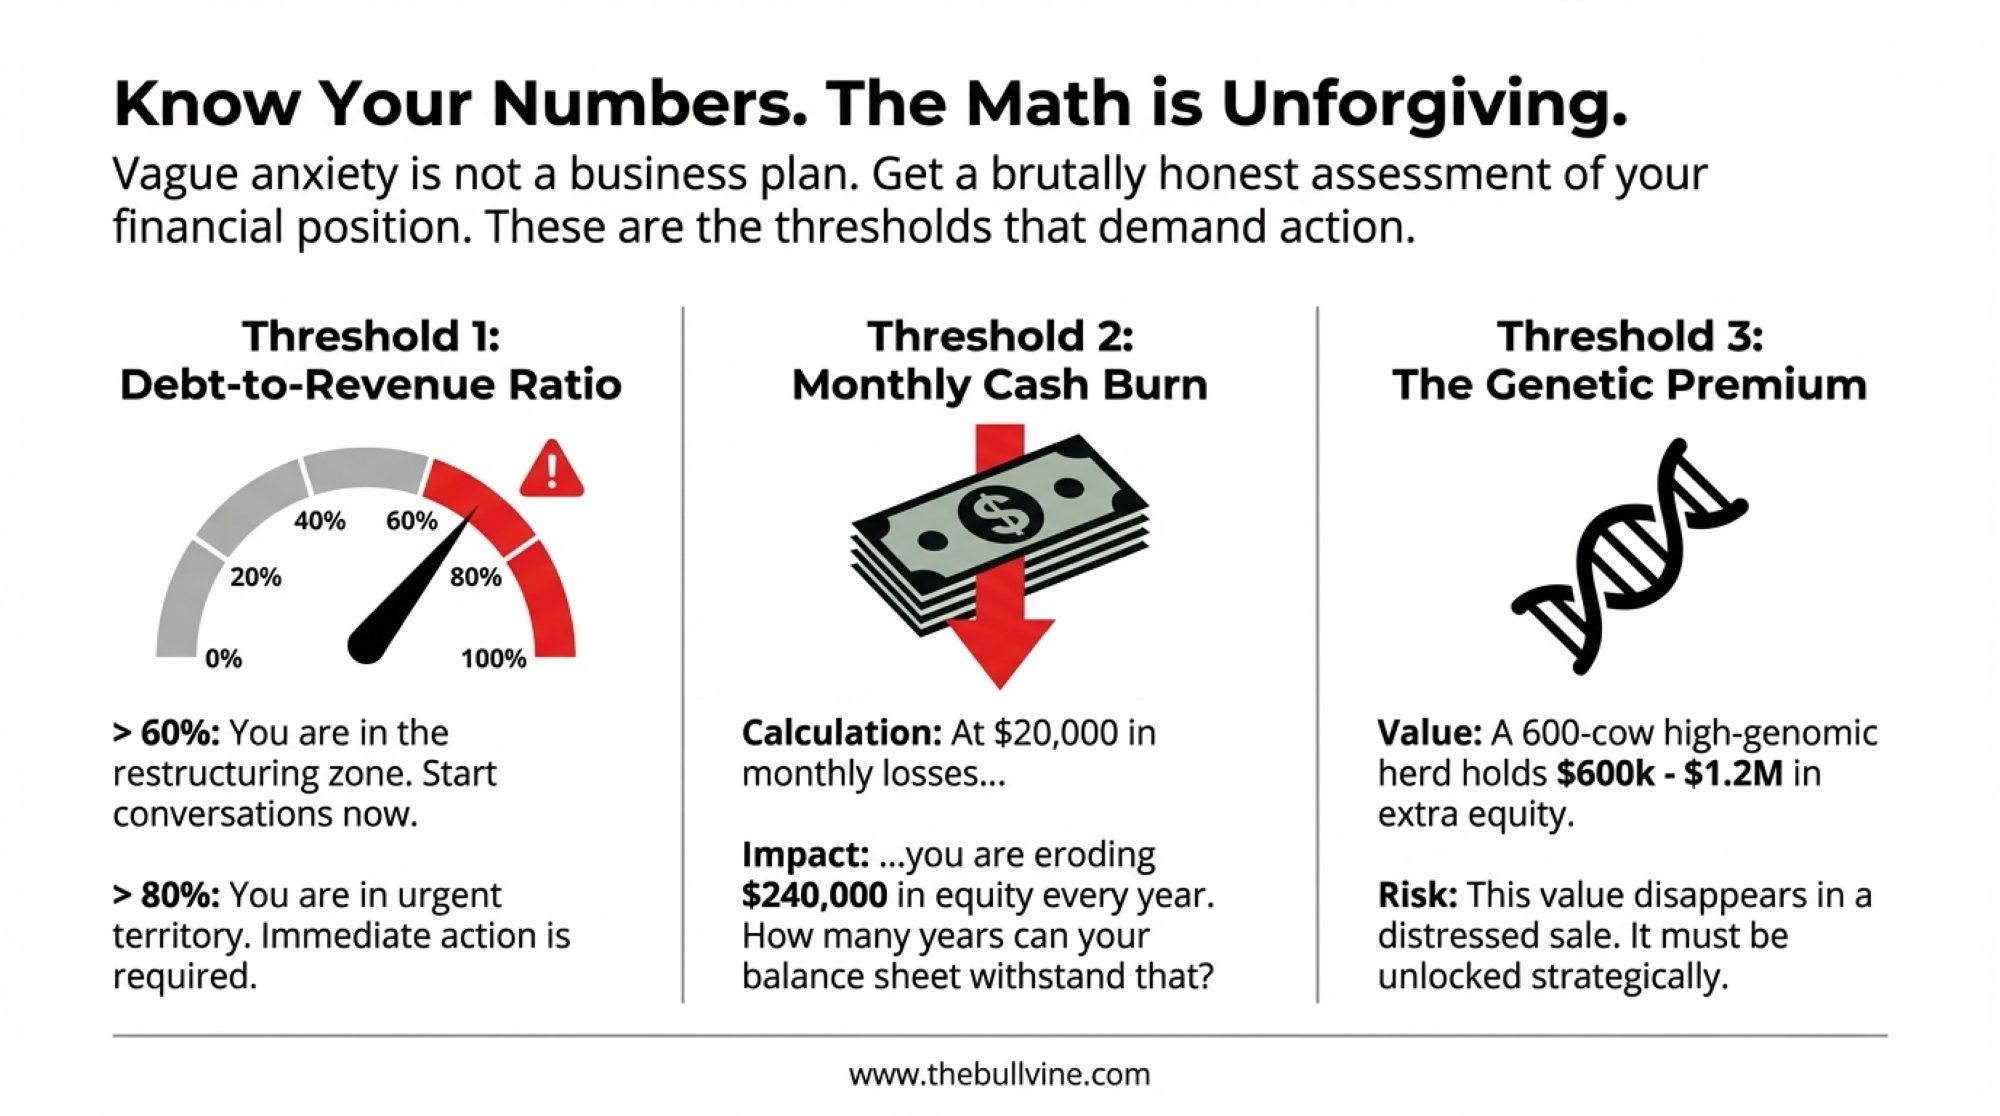
Many operations show strong balance sheets on paper. Land values appreciated significantly from 2010-2022. Multi-generational farms often carry substantial equity. But when you calculate what I’ve started calling “equity velocity”—the rate at which that equity is actually changing when you account for everything—the picture sometimes shifts dramatically.
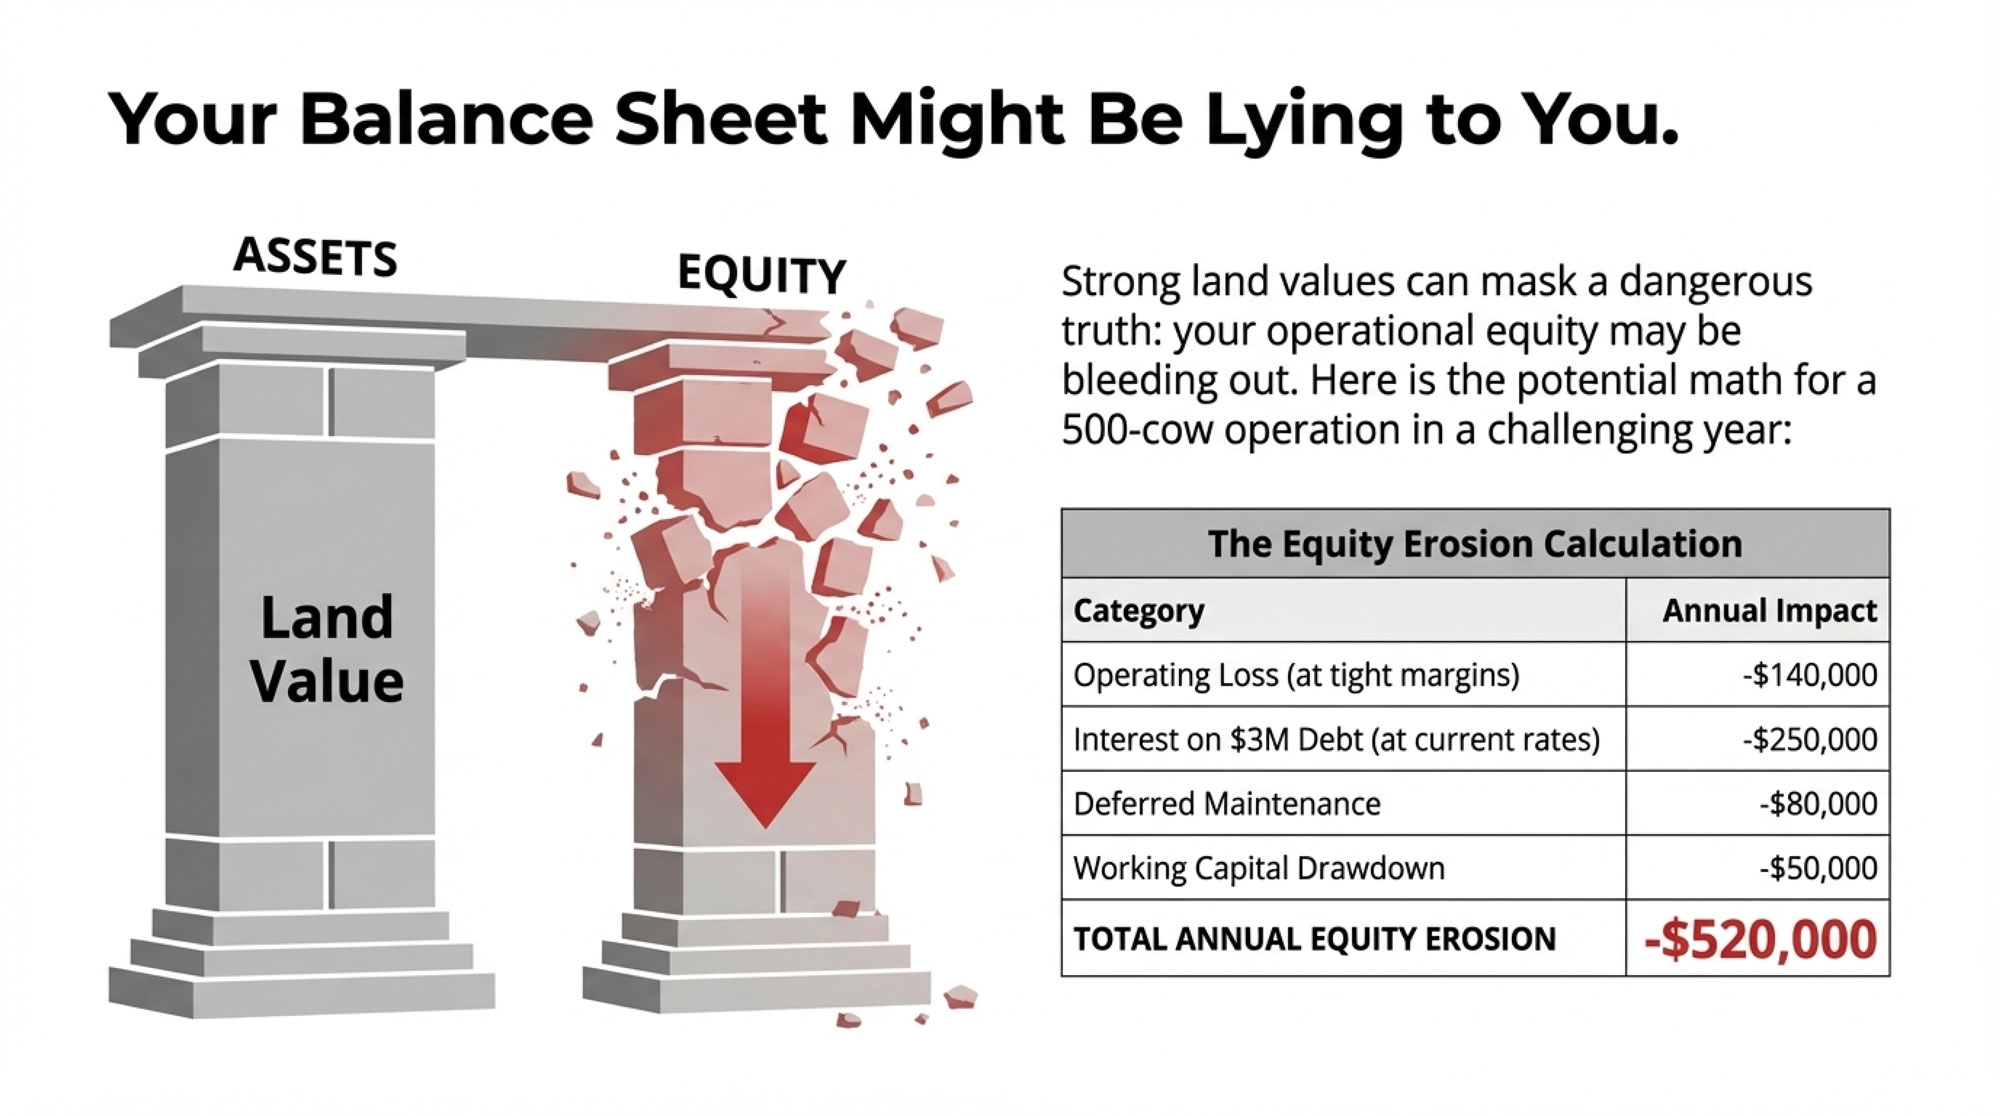
Here’s a concrete example. Say you’re running a 500-cow operation with $5 million in starting equity. Not unusual for an established family dairy in Wisconsin or Minnesota.
THE EQUITY EROSION CALCULATION
In a challenging year, here’s what the math might actually look like:
Category
Annual Impact
Notes
Operating loss at negative margins
-$140,000
Assumes $1.50-2.00/cwt below breakeven
Interest on $3M debt at current rates
-$200,000 to -$250,000
6.5-8.5% rates vs. 3-4% in 2019-2021
Deferred maintenance
-$60,000 to -$80,000
Mixer wagon, parlor equipment, facility repairs pushed to “next year”
Working capital drawdown
-$30,000 to -$50,000
Feed inventory, supplies, cash reserves declining
TOTAL ANNUAL EQUITY EROSION
-$430,000 to -$520,000
Before major breakdowns, herd health crises, or feed quality issues
That’s potentially half a million dollars gone in a single difficult year. Before any major breakdowns. Before any herd health crises during the transition period with your fresh cows. Before a mycotoxin problem shows up in your feed.
Strong milk price years can reverse the trend. Some operations manage costs far better than others. But if you haven’t run this calculation for your own operation recently, you’re flying blind.
Mark Stephenson at UW-Madison—he’s the Director of Dairy Policy Analysis and received the Distinguished Service to Wisconsin Agriculture award in 2024—has made an observation that stuck with me. Farmers often think of equity as their safety net, he’s noted, but the erosion can happen gradually enough that it’s not obvious until a lender review reveals how much the picture has changed.
What One Producer Learned
I recently talked with a Wisconsin dairy farmer who exited in 2023 after 28 years running a 650-cow operation. He asked that I not use his name—these decisions still carry emotional weight in our communities—but his perspective is worth hearing.
“I had $4.2 million in equity on paper,” he told me. “But when I really calculated the trajectory—the interest costs, the maintenance I kept deferring, my wife’s off-farm income basically subsidizing everything—I could see where things were headed if conditions didn’t improve substantially.”
He sold in early 2023, netting $3.8 million after paying off all debt, and now consults with other operations facing similar decisions.
“The hardest part was telling my dad, who’s 84 and started the place in 1968. But he said something I think about a lot: ‘I built this to take care of the family, not the other way around.'”
That’s not the only path forward, obviously. But it’s one that more operations are considering seriously.
A Different Story: Making the Middle Work
Not every mid-size operation is struggling, though. I spoke with a 400-cow dairy in central Wisconsin—they asked me not to identify them specifically—that’s been consistently profitable through the recent volatility.
Their formula:
Aggressive cost tracking (feed costs monitored weekly, not monthly)
Premium processor relationship (specialty cheese buyer paying for high-component milk)
Zero debt (paid off expansion fifteen years ago)
Professional management (next-gen operator returned with agribusiness career experience)
“We’re not getting rich,” the father told me, “but we’re not burning equity either. The key was getting our debt to zero before the interest rate spike. That changed everything.”
Their butterfat runs consistently above 4.2%, which helps with their processor relationship. They’ve invested in cow comfort—good ventilation, proper stall sizing, well-maintained freestall surfaces—and their herd health metrics show it. Fresh cow management is tight. Their transition protocol catches problems early. Nothing fancy, really. Just solid fundamentals executed consistently.
The lesson: The middle isn’t completely dead—but survival requires hitting a specific combination of factors that not every operation can replicate.
Understanding the Macro Picture: Headwinds and Tailwinds
Here’s where the broader farm economy context matters.
USDA’s Economic Research Service projected net farm income around $180 billion for 2025, second only to 2022 in nominal terms. The September 2025 forecast put it at $179.8 billion.
Sounds encouraging, right? The catch is that roughly $40.5 billion of that comes from government payments rather than market returns. And aggregate farm income numbers don’t tell you much about dairy specifically, or about operations of particular sizes in particular regions.
Current Forces Shaping Dairy Economics
HEADWINDS (Working Against You):
Interest rates remain elevated compared to the 2010-2021 era—debt service costs have doubled or tripled for many operations
Labor availability continues tightening with no relief in sight
Input cost volatility (feed, fuel, fertilizer) shows no signs of stabilizing
Consolidation momentum means your competitors keep getting more efficient
Generational transfer challenges—fewer successors, more complexity
TAILWINDS (Working For You):
Strong domestic demand for dairy products remains stable
Export market growth has created new outlets (though with added volatility)
Premium market expansion—organic, grass-fed, and local continue growing
Technology improvements can boost efficiency (if you can afford the capital)
Land values remain strong in most dairy regions (supporting equity—for now)
The net effect: Volatility has increased. The spread between good years and bad years has widened. For operations carrying significant debt, that volatility translates directly into financial stress—strong years barely rebuild what weak years destroy.
A Balanced Look at Cooperatives
The cooperative question comes up constantly, and it deserves careful treatment because the reality is more complicated than either critics or defenders usually acknowledge.
Agricultural cooperatives exist to give farmers collective bargaining power—that’s the core purpose behind the 1922 Capper-Volstead Act’s antitrust exemptions. Many cooperatives serve that function well. Organic Valley maintains transparent pricing, ties board compensation to member outcomes, and operates with governance that gives members a meaningful voice.
At the same time, a 2020 federal antitrust lawsuit raised questions about coordination between Dairy Farmers of America and Dean Foods. The case settled without disclosed terms, so we don’t have a definitive legal finding. But asking questions about how large cooperative structures balance processing business interests against member price maximization seems reasonable.
The honest answer: It depends on the cooperative. Smaller regional organizations where members know board members personally tend to maintain strong accountability. Massive organizations representing thousands of farms across multiple states face different structural dynamics.
Questions to ask about your cooperative:
How transparent are the pricing formulas in practice?
What’s the actual balance between member returns and retained earnings?
How are board members compensated, and for what outcomes?
When did you last attend a member meeting or vote?
Realistic Strategic Options
For farms in that 500-2,000 cow range—the segment facing the most significant structural questions—here’s how I’d frame the realistic choices. I want to be honest about both the potential and the requirements.
Path
Capital Needed
Realistic Assessment
Timeline
Best Fit
Scale significantly
$15-25 million (industry estimates)
Achievable for some; requires specific conditions
7-12 years
Strong equity, favorable location, committed next generation
Transition to premium
$100-300k working capital + transition period
Works in the right circumstances
4-6 years
Market access, suitable land, manageable debt
Strategic exit
None (preserves existing)
Often, the financially optimal choice
6-18 months
Approaching transition, eroding position, no clear cost advantage
Aggressive efficiency
Minimal (debt paydown)
Requires already being in the top quartile
Ongoing
Already efficient, moderate debt, family aligned
The Scaling Path
Expanding to 3,000-5,000+ cows can achieve competitive cost structures. But the requirements are substantial: major capital, strong existing equity, location with expansion capacity (land, water, permits, labor), willingness to shift from hands-on farming to managing a 20+ person team, and committed next-generation leadership.
The Dykman Dairy situation in British Columbia offers a cautionary lesson. According to CBC reporting on BC Supreme Court filings from November 2024, the Bank of Nova Scotia sought creditor protection for an operation that had accumulated $75 million in debt. Court documents showed monthly interest payments had climbed to $463,000—a level that became impossible to sustain when conditions tightened.
The underlying economics may have been strained for years. Favorable interest rates just masked the problem until they weren’t favorable anymore.
The Premium Market Path
Current organic milk pay prices range from approximately $33/cwt to $50/cwt, depending on certification and buyer, according to NODPA market reports. Grass-fed certified operations often command $36-50/cwt. Compare that to conventional prices in the high-teens to low-twenties, and the appeal is obvious.
The challenge is the three-year transition period: you’re operating under organic protocols—organic feed costs, pasture requirements, different herd health approaches—while still receiving conventional prices. Feed costs run 40-60% higher during transition. University extension budgets suggest you might need $100,000-300,000 in working capital just to bridge that gap.
Geography matters too. Direct marketing works within 50-100 miles of population centers with consumers willing to pay premiums. If you’re in rural central Wisconsin, your customer base for farmstead products may simply not exist.
The Exit Path
For operations where the next generation has other plans, where structural cost disadvantages can’t realistically be overcome, or where operators are approaching retirement anyway, preserving equity through a well-planned exit often represents the best outcome for family wealth.
The timing math matters enormously. If equity erosion runs $200,000-$400,000 annually, each year of delay reduces the amount the family preserves. Exiting with $4 million is substantially different from exiting with $2 million five years later.
The Efficiency Path
Some operations can position themselves for survival through aggressive cost management and debt elimination. The Wisconsin family I mentioned earlier is proof that it can work.
But this path requires already operating at high efficiency. It leaves essentially no margin for error—one bad year, one major equipment failure, one significant herd health challenge can change the math entirely. And it depends on milk prices eventually improving enough to reward your persistence.
If you’re pursuing this approach, establish clear decision triggers in advance: “If we haven’t reduced our debt-to-asset ratio to X by 2028, we execute Plan B.” Having predetermined benchmarks prevents the gradual slide that happens when hope substitutes for honest assessment.
A Note for Canadian Producers
Supply management provides price stability—Canadian prices typically work out to the low- to mid-$20s per cwt in U.S. dollar terms, notably higher than U.S. commodity prices most years. That matters for planning.
But supply management doesn’t eliminate structural pressures. It changes how they manifest. Quota values represent real equity but have become significant entry barriers for anyone without family connections—you’re looking at millions just for the right to ship milk before buying your first cow.
Trade agreements keep nibbling at the system. USMCA created new access for U.S. dairy products. The federal government announced $1.75 billion CAD over eight years to compensate producers for trade concessions under CETA and CPTPP back in August 2019—an acknowledgment of real economic impacts.
The fundamental questions about financial trajectory, generational transition, and long-term positioning apply north of the border, too. The specific numbers just differ.
The Bullvine 30-Day Financial Audit Challenge
I’m not going to end this piece by suggesting you bookmark some websites. I’m going to challenge you to do something harder.
In the next 30 days, complete this financial audit:
Week 1: Calculate Your True Equity Velocity
Pull your last three years of financial records. Calculate your actual equity change—not the balance sheet snapshot, but the trend. Include operating results, interest costs, deferred maintenance (be honest), and working capital movement. Write down the annual number. If it’s negative, how many years until you hit zero?
Week 2: Run the Exit Scenario
Call a farm real estate broker. Get a realistic market value for your operation—land, quota (if Canadian), livestock, equipment. Subtract all debt. That’s your exit number today. Now subtract your annual equity erosion multiplied by five. That’s your exit number if you wait until 2031. Expect this call to be uncomfortable. A real estate broker’s job is to give you a market truth, not a sentimental one.
Week 3: Model Your Best-Case Path
Pick the strategic option from the table above that fits your situation. What would it actually take to execute? Capital required? Timeline? Success probability based on your honest assessment of your advantages and disadvantages? Write it down.
Week 4: Have the Conversation
Sit down with your spouse, your kids if they’re involved, and your business partner. Share what you learned in weeks 1-3. Ask the question directly: “Are we making a strategic choice, or are we just avoiding making one?”
Resources for Your Audit
USDA ERS Farm Income and Wealth Statistics: ers.usda.gov/topics/farm-economy
Your state’s land-grant university extension: Search for dairy enterprise budgets specific to your region
Farm Credit System: farmcreditnetwork.com for confidential financial assessment
Agricultural mediation programs: Available in most states and provinces for transition planning help
Canadian Dairy Commission: cdc-ccl.gc.ca for supply management data and producer resources
The Bottom Line
The dairy industry has always demanded resilience. What makes this period different is the structural nature of the transformation underway.
In the 2026 dairy economy, silence is a strategy—usually a losing one.
The farmers I’ve watched navigate these transitions successfully are the ones who did the math, had the hard conversations, and made deliberate choices while they still had good options. The ones who waited until the crisis forced their hand? They walked away with less. Every time.
Choose your path before the market chooses it for you.
KEY TAKEAWAYS
The math is brutal: 8 dairy farms close every single day—and mid-size operations (500-1,500 cows) are hit hardest, trapped between premium markets they can’t access and scale economics they can’t achieve
The $10/cwt gap is permanent: Large operations (2,000+ cows) now produce 68% of U.S. milk at structurally lower costs—this isn’t a cycle to wait out
Your equity may be vanishing: Factor in $3M debt at current rates, deferred maintenance, and negative margins, and you could be bleeding $400,000-$500,000 annually while your balance sheet looks stable
Four paths exist—each with a price tag: Scale to 3,000+ cows ($15-25M), transition to premium ($100-300K + 3-year runway), exit strategically while equity holds, or eliminate all debt and operate top-quartile
Choose now, or the market chooses for you: Producers who preserved wealth decided early; those who waited walked away with less—every time
Complete references and supporting documentation are available upon request by contacting the editorial team at editor@thebullvine.com.
Learn More
The Four Numbers Every Dairy Producer Needs to Calculate This Week – This tactical framework arms you with four critical metrics—including your actual liquidity runway—needed to stop the financial guesswork. It breaks down exactly how to audit your survival odds before Monday’s first milking.
The Next Frontier: What’s Really Coming for Dairy Cattle Breeding (2025-2030) – Gene editing and AI-powered breeding are no longer science fiction—they are active profit drivers. This guide reveals how emerging CRISPR technology and predictive sensors can generate an additional $5,000 in annual revenue per cow.
Join the Revolution!
Join over 30,000 successful dairy professionals who rely on Bullvine Weekly for their competitive edge. Delivered directly to your inbox each week, our exclusive industry insights help you make smarter decisions while saving precious hours every week. Never miss critical updates on milk production trends, breakthrough technologies, and profit-boosting strategies that top producers are already implementing. Subscribe now to transform your dairy operation’s efficiency and profitability—your future success is just one click away.
Six workers dead in a manure pit. A $75M dairy bankrupt. A cow sells for $1M. One industry. One year. Ten lessons you can’t afford to skip.
What farmers need to know: The year 2025 brought record-breaking highs and gut-wrenching lows to dairy operations across North America. From a single cow selling for $1 million at the International Intrigue Sale to six workers dying in a Colorado manure pit, this year exposed the stark divide between those thriving and those struggling to survive. North Dakota’s collapse from 1,810 dairy farms in 1987 to just 24 today offers a sobering preview of what’s coming for operations that fail to adapt. Whether you’re milking 100 cows or 5,000, this analysis breaks down the 10 stories that shaped our industry—and what they mean for your operation heading into 2026.
A Year That Demanded Answers
Look, I’ve been covering this industry for a while, and I can’t remember a year quite like this one. The headlines of 2025 felt like they were written by someone with a cruel sense of irony—one day we’re celebrating million-dollar genetics, the next we’re mourning families torn apart by preventable tragedies.
What’s interesting here is how interconnected these stories actually are. The financial pressures driving consolidation in North Dakota aren’t separate from the safety lapses in Colorado or the infrastructure failures in Quebec. They’re all threads in the same fabric. When margins tighten, something gives. Sometimes it’s a maintenance schedule. Sometimes it’s a safety protocol. Sometimes it’s a family’s entire future.
Here’s something the industry doesn’t want to admit: our obsession with scale is killing us. Literally. The pressure to grow bigger, milk more cows, and cut more costs has created conditions in which safety equipment becomes “optional,” and electrical inspections are pushed to “next quarter.” We saw the consequences play out in real time this year.
These aren’t just news items to scroll past. They’re lessons—expensive ones paid for by our neighbors—that every dairy professional needs to internalize before the calendar flips to 2026.
The Countdown: What 2025 Taught Us
#10. External Threats: The Lancaster County Livestock Shootings
Here’s something that shouldn’t happen in America: dairy farmers waking up to find their cows shot dead in their barns.
In a coordinated pre-dawn attack on March 15, shooters targeted multiple dairy farms in Lancaster County, Pennsylvania, killing productive Holstein cows and injuring a horse. Pennsylvania State Police confirmed the attacks hit operations in both Colerain Township and Sadsbury Township within hours of each other.
The economic impact goes way beyond what most people realize. Each slain cow didn’t just represent her $2,000-2,500 replacement cost—she represented up to $92,000 in lifetime milk production potential. Years of careful breeding decisions. Gone in seconds.
What really struck me about this story was the community response. Within days, local farmers had organized a GiveSendGo fundraiser for the affected families, demonstrating what agricultural solidarity actually looks like when the chips are down.
The uncomfortable truth? Rural security can’t be an afterthought anymore. Isolated locations and limited law enforcement presence make dairy operations uniquely vulnerable. If you haven’t evaluated your surveillance systems and community alert networks lately, this is your wake-up call.
#9. Infrastructure Risk: The Buckland Holsteins Barn Fire
On June 26, a seven-generation dairy operation near Coaticook, Quebec, went up in flames. Over 160 Holstein cattle—including approximately 100 milking cows and 65 bred heifers—perished in the early-morning blaze at Buckland Holsteins.
Angus MacKinnon, owner and seventh-generation operator of Buckland Holsteins, told reporters the family’s electrical monitoring system detected a spike at 1:35 AM—nearly 30 minutes before anyone noticed the fire. By the time his brother alerted him just after 2:00 AM, “the building was entirely consumed. There was nothing we could do.”
This development suggests a troubling aspect of our industry’s approach to risk management. The MacKinnon family had monitoring equipment in place. They were doing things right. But detection without automated response only gets you so far.
The financial losses are staggering. Based on current Holstein replacement costs of $1,500-2,000 per head, the livestock losses alone represent $240,000-320,000 (The Bullvine, June 26, 2025). But that’s just the cows. A concrete silo containing 400 tons of silage continues to smolder and is expected to burn for approximately 6 months due to its inaccessibility—another $100,000-plus in losses.
Here’s what farmers are finding: when financial margins tighten, infrastructure investment gets deferred. Electrical systems in livestock facilities are constantly exposed to humid, corrosive atmospheres that accelerate degradation. And only five U.S. states mandate agricultural fire protection (National Fire Protection Association data, 2024). That gap between what we should be doing and what we can afford to do? That’s where catastrophes happen.
On March 5, 2025, the dairy community lost Reed Hostetler—a 31-year-old Ohio dairy farmer, husband, and father of three young children—in a farm accident at his family’s operation in Marshallville.
According to news reports, Reed drowned in a manure pit after the tractor he was operating tipped over. His two brothers acted immediately to try to save him, but the lagoon proved impossible to navigate in time.
What makes this loss especially heartbreaking isn’t just the statistics—though they’re damning enough. It’s who Reed was. He had hiked the entire Appalachian Trail. Rode bulls. Did mission work in Thailand. He was co-owner of L&R Dairy Farm and, by all accounts, one of those people who made everyone around him better.
He leaves behind his wife, Abby, and their children: Baer (4), Claire (2), and Axe (1).
I’ve noticed that we tend to talk about farm safety in abstract terms—statistics, protocols, equipment recommendations. But behind every number is a family like the Hostetlers. The Marshallville community rallied around them, organizing support and holding Reed’s funeral service right there on the family dairy. That’s beautiful. It’s also a reminder that these aren’t distant tragedies. They’re our neighbors.
#7. Financial Peril: Dykman Dairy’s $75 Million Collapse
When one of British Columbia’s largest dairy operations buckled under $75 million in debt, it sent shockwaves through an industry already grappling with rising interest rates and tightening margins.
In late 2024, a B.C. Supreme Court judge placed Dykman Dairy into creditor protection following a default application from the Bank of Nova Scotia (CBC News, December 10, 2024). By early 2025, the case had become a cautionary tale studied across the industry.
The numbers tell a story of ambition outpacing discipline. For decades, the farm’s debt increased by approximately $800,000 annually as it expanded facilities and acquired quota. When interest rates climbed from 2% to 7%, monthly interest payments soared to $465,000, against income from 27,000 liters of daily milk production that couldn’t keep pace (The Bullvine, January 3, 2025).
Then came the 2021 floods. The Sumas Lake disaster added unexpected costs to an already stretched operation, exposing just how thin the margins had become.
The case ignited fierce debate about lender responsibility. Critics argued Scotiabank engaged in over-lending that enabled the farm’s precarious expansion (The Bullvine Industry Analysis, January 2025). But here’s the thing: pointing fingers doesn’t fix broken balance sheets. What Dykman’s collapse really demonstrates is how quickly aggressive growth strategies can unravel when external conditions shift.
This is the microeconomic reality behind the consolidation trend. When the average producer sees mega-dairies struggling with debt loads like this, it raises uncomfortable questions about scale itself.
#6. Genetic Gold Rush: Million-Dollar Madness at International Intrigue
And then there’s the other side of the coin.
On July 2, the International Intrigue Sale at Butlerview Farm in Chebanse, Illinois, shattered expectations when 173 live lots sold for a combined $4.3 million—an average of over $25,000 per animal.
But the real headline came after the catalog closed. Olortine Avenger Design VG-89-CAN 2yr., an Ontario-bred senior three-year-old who had already won Grand Champion at Western Dairy Expo 2025, the All-Canadian Winter Two-Year-Old in 2024, and Intermediate Champion at the Royal Agricultural Winter Fair, received a substantial post-sale offer from GenoSource. Rather than accept privately, her owners opened bidding to the room.
GenoSource’s $1 million bid held. Just like that, Design became the newest million-dollar cow—and a symbol of the extreme polarization defining today’s dairy market.
What this tells us is pretty straightforward: the demand for elite, high-performance genetics has never been stronger. While operations like Dykman Dairy collapse under debt, buyers are writing seven-figure checks for animals with exceptional type scores and show-ring pedigrees.
The second-highest seller reinforced the point even more dramatically for genomics-focused buyers. Jacobs Lambda Baz commanded $320,000—and her appeal went far beyond the ring. Sired by the genomic powerhouse Farnear Delta-Lambda-ET (+753M, GTPI +2909), Lambda Baz represents everything today’s component-focused market demands: her production record of 128 pounds with 5.1% fat and 3.9% protein demonstrates the butterfat and protein premiums that drive modern milk checks (The Bullvine, July 2, 2025).
Two economies. Same industry. Pick which one you’re competing in.
#5. Strategic Success: What the USDA Study Revealed
When Farm Futures released their “Best Places to Farm” analysis—a comprehensive 20-year study examining financial performance across 3,056 U.S. counties—the results challenged some long-held assumptions about what makes agricultural regions successful.
The methodology was rigorous: counties were ranked by average weighted scores for return on assets, profit margins, and asset turnover, using USDA Census of Agriculture data from 2002 through 2022.
The winner? Kershaw County, South Carolina.
Not Iowa. Not Wisconsin. South Carolina.
Here’s why that matters: Kershaw County’s average farm size is just 175 acres, and fewer than one in five operations earns more than $100,000 annually. By conventional wisdom, that profile shouldn’t produce top financial performance.
But Kershaw’s farmers figured something out. Poultry accounts for 97% of the county’s agricultural sales, allowing operators to achieve remarkable returns on assets and superior profit margins through high turnover and lower land costs. They’ve insulated themselves from weather volatility and commodity price swings by specializing in exactly the right enterprise for their conditions.
The contrast with traditional Corn Belt regions is instructive. High land prices and weather exposure continue to pressure crop-focused counties, while Southeast operations excelling in cost-effective poultry and integrated livestock systems consistently outperform.
This isn’t an argument against dairy. It’s an argument for strategic adaptation—understanding your specific geographic, economic, and market context and optimizing accordingly rather than chasing scale for its own sake.
#4. Systemic Shock: The FDA’s Milk Testing Suspension
On April 21, 2025, just days after the NCIMS Conference concluded, the FDA abruptly suspended its Grade A milk proficiency testing program—and most state regulators learned about it from media reports.
The program doesn’t test individual farms’ milk directly. Instead, it ensures that the hundreds of laboratories analyzing dairy samples across the country produce consistent, accurate results. It’s the federal quality assurance check that keeps the entire system calibrated.
An internal FDA email obtained by Reuters explained the suspension: the agency’s Moffett Center Proficiency Testing Laboratory “is no longer able to provide laboratory support for proficiency testing and data analysis” following workforce reductions at the Department of Health and Human Services that eliminated roughly 20,000 positions.
The timing couldn’t have been worse. Labs had already tested the 2025 annual proficiency samples—results were due April 11—but there was suddenly no capacity to analyze or validate them.
To be clear: milk remains safe. Jim Mulhern, President and CEO of the National Milk Producers Federation, issued a statement emphasizing that rigorous testing continues at state and processor levels. The International Dairy Foods Association echoed this assurance. But the lab oversight gap creates real risk. Without federal proficiency verification, laboratories may struggle to maintain accreditation, testing consistency could erode, and consumer confidence—hard-won over decades—could be damaged.
Here’s what the industry PR statements won’t tell you: we got lucky. If this suspension had coincided with another avian influenza outbreak in dairy herds, the confidence gap could have become a full-blown crisis. The H5N1 detections in dairy cattle throughout 2024-2025 prompted consumers to ask questions about milk safety (USDA APHIS, 2025). Removing the federal testing backstop at exactly that moment was playing with fire.
What this episode exposed is systemic vulnerability. Even well-managed farms that follow best practices are exposed when the regulatory infrastructure protecting the entire industry is dismantled. Some things you can control. Federal budget priorities aren’t one of them.
In a year defined by crisis and loss, Brady Martin’s story offered something different: a reminder of why farming still matters.
The 18-year-old from Elmira, Ontario, was projected as a first-round pick in the 2025 NHL Draft. Scouts raved about his combination of skill and “farm strength”—natural power developed through years of physical labor rather than gym training. NHL Central Scouting ranked him 11th among North American skaters.
On draft night, Martin skipped the ceremony in Los Angeles. Instead, he listened from his family’s 250-cow dairy operation, exactly where he wanted to be.
“The cows don’t care if I’m drafted sixth or sixteenth,” Martin told NHL reporters. “The morning milking starts at 5:30 AM, whether I’m an NHL prospect or not, and we’ve got over 250 dairy cows that need tending to”.
The Nashville Predators selected him fifth overall. He celebrated on the farm with the people who’d been there all along.
What resonated about Martin’s story wasn’t just the headline. It was the context. The Martin operation represents exactly the kind of diversified family farm that consolidation pressure threatens: dairy cows, beef cattle, several thousand acres of crops, and a poultry operation all integrated under multi-generational management.
His long-term plan? “Hopefully I play in the NHL. But if that doesn’t work out, then the farm is definitely where I’ll be heading”.
That’s not hedging. That’s understanding what matters.
On August 20, 2025, six workers died at Prospect Valley Dairy in Colorado after being overcome by hydrogen sulfide gas in a manure pit. It was, by every measure, the worst confined space tragedy our industry has ever seen.
Six people. One valve. Zero monitors.
The details are almost unbearable. A contractor working on an underground manure pit adjusted a valve that inadvertently released a surge of hydrogen sulfide. He collapsed almost instantly. Five others—including a 17-year-old high school student who was one worker’s son—rushed into the pit to save him, disregarding a supervisor’s warnings not to enter the dangerous space.
All six died trying to save each other.
Hydrogen sulfide is uniquely lethal. At concentrations of 1,000-2,000 ppm, exposure causes instant death. The gas is heavier than air, accumulates in low-lying spaces, and—critically—can cause olfactory fatigue, meaning workers may stop smelling the characteristic “rotten egg” odor even as concentrations climb to deadly levels.
Dr. Daniel Andersen, Associate Professor of Agricultural and Biosystems Engineering specializing in Manure Management and Water Quality at Iowa State University, has documented approximately 150 U.S. deaths from manure-related gas incidents since the 1960s. This single event added six more.
The coroner’s reports, released in late October, confirmed what everyone already knew: these were accidental deaths from toxic gas exposure in a confined space.
Here’s what keeps me up at night: proven safety precautions exist. A self-contained breathing apparatus costs a few hundred dollars. Continuous gas monitors run under $500. Strict no-entry protocols cost nothing but discipline.
Six people are dead because basic safety equipment and procedures weren’t in place—or weren’t followed. There’s no way to sugarcoat that.
#1. An Industry at the Tipping Point: North Dakota’s Collapse
The top story of 2025 wasn’t a single event. It was a trend reaching its conclusion.
North Dakota’s dairy sector has gone from 1,810 farms in 1987 to just 24 today, according to USDA Census of Agriculture data. That’s a 98.7% decline in less than 40 years.
And it’s not stopping. The state recently approved what could become one of the largest dairy operations in the region—a development that prompted environmental protests in Winnipeg over potential impacts to the Red River watershed.
What’s happening in North Dakota is a preview of where the entire industry is headed. The economics are brutally simple: large operations enjoy transportation cost advantages of approximately $1.50 per hundredweight, while volume purchasing delivers 10-20% savings on feed—potentially $150,000 annually for a 5,000-cow dairy.
The rise of beef-on-dairy programs has further accelerated herd reduction as producers exit conventional dairy genetics. Farm Credit Canada projects a 35% reduction in beef-on-dairy calves relative to 2025 baselines if dairy expansion resumes—but for now, the cross-breeding trend gives marginal operations another reason to avoid replacement heifer investment. When you’re not sure your dairy has a future, why raise the next generation of milking cows?
Rural sociologists have documented consistent patterns when regions transition from many small farms to a few large ones. A 2023 Iowa State University Department of Sociology study found that counties experiencing rapid dairy consolidation saw average drops in school enrollment of 15-20% within a decade. Equipment dealers consolidate or close. Feed stores disappear. The social fabric frays.
Here’s the uncomfortable question: Can one mega-dairy replace 1,800 family farms?
In terms of milk volume? Probably. In terms of everything else, what does a farm community provides? Absolutely not.
But acknowledging that tension doesn’t make the economics go away. USDA baseline projections suggest that by 2035, 70% of milk production could come from operations with over 2,000 cows.
Herds with favorable genetics; niche market access
Limited processor availability
None of these paths are easy. All of them beat waiting for the economics to improve magically.
The Bottom Line
Three takeaways from 2025:
Financial discipline, safety protocols, and infrastructure investment form a three-legged stool. When any one collapses—whether through aggressive over-leveraging like Dykman Dairy, deferred maintenance like Buckland Holsteins, or inadequate safety measures like Prospect Valley—the entire operation is at risk. You can’t cut corners on one without increasing exposure elsewhere.
The market is splitting into two distinct economies. At the top, elite genetics command million-dollar prices, and specialized operations capture premium margins. At the foundation, average producers face relentless consolidation pressure. The middle ground is disappearing. Operations milking 200-800 cows without a clear differentiation strategy face the highest structural risk—too big for premium niche markets, too small for commodity scale advantages. Identify which economy you’re competing in and optimize accordingly.
Adaptation beats scale. Kershaw County’s poultry specialists outperformed traditional dairy regions. Rockland County’s direct-to-consumer farms captured 45% profit margins on small acreages. Brady Martin’s diversified family operation is exactly the model that creates resilience. The survivors of the next decade won’t necessarily be the biggest—they’ll be the most strategically aligned with their specific circumstances.
Your action items for Q1 2026:
Schedule a comprehensive electrical system inspection before spring
Install continuous gas monitoring in all confined spaces—no exceptions
Review your debt-to-asset ratio against industry benchmarks (Penn State Extension recommends below 30% for established dairies; Farm Financial Scorecard flags above 60% as vulnerable)
Identify one differentiation strategy from the table above and build a 24-month implementation timeline
Update your farm succession plan and emergency protocols
Have an honest conversation with your lender about interest rate exposure
The future of this industry belongs to those who learn from 2025. The lessons are there in every headline—bought at terrible cost by our neighbors. Honor that cost by acting on what they’ve taught us.
What’s your operation doing differently heading into 2026? Share your strategies in the comments below—or tell us where we got it wrong. That’s how we all get better.
EXECUTIVE SUMMARY
Six workers dead in a manure pit. A $75 million dairy company went bankrupt. A single cow sells for $1 million. Same industry. Same year. The brutal contrast tells you exactly where dairy is headed—and 2025 made the split impossible to ignore. North Dakota’s collapse from 1,810 farms to 24 isn’t history; it’s a preview of what’s coming for operations stuck in the 200-800 cow middle zone without a differentiation strategy. Yet the year also revealed what works: elite genetics commanding record premiums, robotic dairies cutting labor costs 20%, diversified family farms building multi-generational resilience. This is the definitive breakdown of the 10 stories that defined dairy’s year of reckoning—and the survival playbook for landing on the right side of the divide before 2026 decides for you.
Join the Revolution!
Join over 30,000 successful dairy professionals who rely on Bullvine Weekly for their competitive edge. Delivered directly to your inbox each week, our exclusive industry insights help you make smarter decisions while saving precious hours every week. Never miss critical updates on milk production trends, breakthrough technologies, and profit-boosting strategies that top producers are already implementing. Subscribe now to transform your dairy operation’s efficiency and profitability—your future success is just one click away.
When thousands of farmers from across Europe shut down the EU capital, they weren’t just protesting a trade deal. They were raising questions that dairy producers on both sides of the Atlantic would do well to consider.
EXECUTIVE SUMMARY: On December 18, 10,000 farmers from 25 European countries blocked the streets of Brussels and forced a delay of the EU-Mercosur trade agreement—the largest in EU history. The deal would open European markets to 99,000 tonnes of South American beef and 30,000 tonnes of cheese produced at costs 40-60% below EU operations. Here’s why that matters if you’re milking cows in Wisconsin or shipping from Ontario: displaced European production will intensify competition in export markets where North American dairy sells—Mexico, North Africa, Southeast Asia. The timing is challenging. U.S. consolidation continues to accelerate, with 65% of the national herd now on 1,000+ cow operations, and farm numbers falling from 39,000 to 24,000 in five years. European farmers won a postponement until January 2026, but the structural pressures behind both the protest and the consolidation aren’t slowing down. Now is the time to reassess your operation’s exposure to global market dynamics.
There’s something about the sight of hundreds of tractors blocking a major European capital that cuts through the usual trade policy noise. You know how it goes: trade negotiations happen behind closed doors, and by the time farmers hear the details, the framework is already set. But on December 18, 2025, that dynamic shifted in Brussels.
What struck me about last week’s protest wasn’t just its scale—Copa-Cogeca estimated around 10,000 farmers showed up, with some news reports putting the number closer to 20,000. It was the composition. French dairy farmers standing alongside Dutch cattle producers. Polish grain growers are coordinating with Italian beef operations. German dairy cooperatives are working in lockstep with Spanish agricultural unions. Copa-Cogeca pulled off something genuinely rare: unified, cross-border agricultural action.
The target? The EU-Mercosur free trade agreement—25 years in negotiation, and now potentially weeks away from ratification.
What’s Actually in This Deal
Let’s walk through the numbers, because they explain why farmers drove their tractors into the heart of European governance.
Product Category
Mercosur Annual Quota (tonnes)
Total EU Production (tonnes)
Quota as % of EU Production
Beef
99,000
7,800,000
1.3%
Poultry
180,000
15,500,000
1.2%
Cheese
30,000
11,200,000
0.27%
Milk Powder
10,000
1,850,000
0.54%
The EU-Mercosur agreement would create the world’s largest free trade zone, spanning roughly 780 million consumers across 31 countries. For European agriculture, the provisions are substantial. According to European Commission factsheets released in late 2024, the deal grants Mercosur producers access to EU markets for:
99,000 tonnes of beef annually at reduced tariffs
180,000 tonnes of poultry
30,000 tonnes of cheese duty-free, plus significant milk powder quotas
These aren’t trivial volumes. What stands out here is that the challenge isn’t really the percentage of total EU consumption these imports represent. It’s that they’ll compete directly in commodity beef and dairy segments where European producers already operate on tight margins. The displacement effects tend to concentrate rather than spread evenly across the market.
Understanding the Cost Differential
Here’s where the economics become challenging for European producers—and where North American dairy farmers might recognize some familiar dynamics.
The International Farm Comparison Network tracks dairy production costs across more than 100 countries, and their data helps explain why European farmers view Mercosur competition with such concern. EU production costs typically run somewhere in the €40-50 per 100kg range, while South American producers often operate at costs 40-60% lower. That’s not a gap you can close through better feed efficiency or tighter fresh cow management alone.
The differential is structural. Brazilian and Argentine cost advantages don’t stem from superior efficiency or management practices that European farmers could readily adopt. They reflect fundamental input cost differences.
Region
Production Cost per 100kg Milk (EUR)
Cost vs. EU Average
Primary Cost Drivers
Netherlands
€48
+14%
Land costs, environmental compliance, labor
Germany
€45
+7%
Animal welfare standards, energy costs
France
€42
Baseline
Regulatory compliance, farm wages
Brazil
€22
-48%
Low land costs, minimal regulation, cheaper labor
Argentina
€20
-52%
Currency advantage, export infrastructure, scale
Uruguay
€24
-43%
Grass-based systems, lower input costs
Land costs tell part of the story. Prime dairy land in the Netherlands or Denmark is many times more expensive than comparable land in Argentina’s dairy regions. I recently spoke with a Dutch producer who’d done the math on expanding his operation—the land costs alone made the numbers nearly impossible to justify.
Labor compounds the picture. EU dairy farm wages, including mandatory benefits and social contributions, are significantly higher than South American dairy labor costs. We’re talking multiples, not percentages.
Then there’s regulatory compliance. Environmental regulations, animal welfare requirements, and food safety standards significantly increase European milk production costs. These are standards that European consumers broadly support—but they entail costs that Mercosur competitors largely don’t bear. Keep in mind, this isn’t about one system being right or wrong; it’s about the competitive implications when different regulatory environments meet in the same marketplace.
Voices from the Protest
The frustration was evident in Brussels. Belgian dairy farmer Maxime Mabille, speaking to reporters during the protest, put it directly:
“We’re here to say no to Mercosur.”
He accused the European Commission leadership of seeking to “force the deal through,” and sharply criticized the decision-making process.
That frustration is real, and it runs deep among producers who feel caught between rising compliance costs and changing market protections. As many of us have seen in our own markets, when farmers feel unheard through normal channels, they find other ways to make their voices carry.
The sentiment echoed across the protest. Farmers from France, Poland, Italy, and beyond raised similar concerns: they’re being asked to compete on price with operations that face fundamentally different cost structures. Whether you agree with their position or not, it’s a question worth taking seriously.
The Enforcement Question
European Commission officials have pointed to “mirror clauses” in the agreement—provisions requiring Mercosur products to meet EU standards—as the answer to farmer concerns. French President Macron has championed these clauses as a means of ensuring fair competition.
Many farmers remain skeptical. And their caution has some historical grounding worth examining.
The USMCA dairy dispute between the United States and Canada offers an instructive parallel—a case study in how trade agreement enforcement can play out differently than expected.
Here’s the background, and you probably know some of this already: When USMCA replaced NAFTA in 2020, U.S. dairy organizations celebrated provisions granting access to 3.6% of Canada’s dairy market through tariff-rate quotas. The U.S. Dairy Export Council projected meaningful market gains once fully implemented.
What actually happened? Canada restructured its quota allocation system in ways that technically complied with USMCA language while producing practical outcomes different from those U.S. negotiators anticipated. The U.S. Trade Representative filed a formal dispute. A USMCA panel ruled in January 2022 that Canada had violated the agreement. Canada was directed to revise its system within 45 days.
Canada complied—by implementing a new allocation methodology. The U.S. filed a second dispute. In November 2023, that panel ruled 2-1 in Canada’s favor, finding the revised system technically compliant.
The result? According to USDA Foreign Agricultural Service data and industry analysis, U.S. exporters have filled just 42% of their allocated Canadian dairy quotas since USMCA implementation—not because of a lack of supply, but because of how the allocation system functions.
Now, reasonable people can disagree about whether Canada acted within its rights or circumvented the agreement’s intent. What’s less debatable is that the outcome differed from what U.S. dairy exporters expected when the agreement was signed. European farmers see potential parallels with Mercosur mirror clauses—standards get written, implementation gets negotiated, and outcomes can diverge from initial expectations. Whether that concern proves warranted remains to be seen.
The View from South America
Something I keep coming back to when analyzing trade disputes: every story has more than two sides. Brazilian and Argentine dairy farmers aren’t operating in some agricultural paradise, even with their cost advantages.
Brazilian agricultural economists note that the dairy sector faces significant infrastructure challenges. Transportation costs to ports can erode much of the production cost advantage. Currency volatility makes planning difficult—the real has moved considerably against the dollar in recent years. And domestic consumption absorbs most production. Brazil isn’t necessarily positioning to flood global markets; they’re working to meet their own growing demand.
Argentina’s situation may be even more challenging. Recent economic reforms have significantly affected Argentine export economics. Argentine farmers face their own structural pressures—just different ones than their European counterparts.
This doesn’t change the competitive dynamics European farmers face. But it’s a useful reminder that agricultural economics rarely produce clear winners, even in seemingly advantageous markets. Dairy farming presents challenges everywhere. The specific difficulties just vary by geography. That’s something producers worldwide can relate to, regardless of which side of any trade agreement they’re on.
The Processor Perspective
Here’s the thing about trade debates—they rarely split cleanly along obvious lines. Not everyone in the European dairy sector views Mercosur with concern. Some processor members of the European Dairy Association see potential opportunities—particularly in sourcing ingredients for value-added products or accessing Mercosur consumer markets for European specialty cheeses.
This split between farmer and processor interests isn’t unique to Europe. North American dairy has long navigated similar dynamics, where processor priorities around ingredient sourcing and market access don’t always align perfectly with producer concerns about farmgate prices. If you’ve sat through cooperative meetings where these tensions surface, you know exactly what I mean—the coffee gets cold while those debates run long. It’s a dynamic worth watching as the Mercosur debate continues, and worth remembering that “the dairy industry” isn’t monolithic in its interests.
Implications for North American Dairy
So what does a European trade fight mean for farmers milking cows in Wisconsin, California, Ontario, or Alberta? More than you might initially think.
The direct exposure isn’t Mercosur products flooding North American markets—tariff structures and USMCA provisions limit that pathway. The indirect effects are more subtle and potentially more meaningful over time.
Consider the dynamics: When Mercosur beef and dairy fill European market demand, that production potentially displaces EU output that previously served those markets. But European dairy infrastructure doesn’t simply shut down. Instead, that displaced production seeks alternative export destinations—the same destinations where U.S. and Canadian dairy currently competes.
Export Market
US Dairy Exports 2024 (million USD)
EU Dairy Exports 2024 (million USD)
Market Growth Rate 2024-25
Mexico
$1,680
$420
5.2%
Algeria
$245
$890
8.1%
Egypt
$198
$754
6.7%
Saudi Arabia
$156
$423
4.3%
Indonesia
$134
$89
9.4%
Philippines
$112
$67
7.8%
Rabobank’s Q4 2025 Global Dairy Quarterly identified the key contested markets:
North Africa, particularly Algeria and Egypt, which import significant cheese and milk powder volumes currently supplied by EU, U.S., and New Zealand exporters
Southeast Asia, with growing demand for cheese, whey protein, and infant formula
Mexico, which remains the largest single export destination for U.S. dairy
The Middle East, with its premium dairy markets
When EU exporters facing domestic market pressure redirect to these regions at competitive prices, American and Canadian exporters face a choice: match prices or accept volume adjustments.
For large California operations running thousands of cows with thin margins and significant Class IV exposure, shifts in export market prices can mean the difference between profitability and loss on substantial production volumes. I’ve talked with producers in the Central Valley who watch GDT auction results as closely as their bulk tank readings. Smaller Midwest family operations may feel less direct exposure, but the pricing ripples eventually reach everyone through regional market dynamics.
We’re already seeing some of this in auction data. The final Global Dairy Trade auction of 2025 showed the ninth consecutive price decline, with the GDT Price Index down 4.4% overall. Whole milk powder, skim milk powder, and cheese have all softened from earlier 2025 levels. While many factors influence these prices, the supply-demand balance appears to be shifting.
Month
GDT Price Index
Change from Peak (%)
Jan 2025
3,520
0.0
Mar 2025
3,480
-1.1
May 2025
3,390
-3.7
Jul 2025
3,310
-6.0
Sep 2025
3,240
-8.0
Nov 2025
3,180
-9.7
Dec 2025
3,040
-13.6
The Consolidation Picture
Whatever happens with Mercosur specifically, the broader consolidation trend in dairy continues on both sides of the Atlantic. This affects all of us, regardless of where we’re milking cows.
The USDA’s 2022 Census of Agriculture documented that 65% of the U.S. dairy herd now lives on operations with 1,000 or more animals. The number of U.S. dairy farms fell from approximately 39,000 in 2017 to roughly 24,000 in 2022, even as total milk production continued growing. If you’ve watched neighbors exit over the past decade, these numbers won’t surprise you.
Year
Total Farms (thousands)
Herd Share: 1,000+ Cows (%)
Herd Share: Under 500 Cows (%)
2012
51
48
52
2017
39
57
43
2022
24
65
35
2025
21
68
32
European dairy follows a similar pattern with a time lag. Eurostat data shows EU dairy farm numbers declining 3-4% annually, with production increasingly concentrated in larger, more specialized operations.
Year
Number of Farms (thousands)
Average Herd Size (cows)
2010
850
28
2012
780
32
2014
710
36
2016
640
42
2018
570
48
2020
510
54
2022
460
61
2025
420
68
What concerns me—and I think many of you share this—is how consolidation tends to accelerate during periods of margin pressure. Industry analysts have projected that U.S. dairy farm numbers could decline further by 2030 under sustained price compression scenarios.
The mid-size operator—somewhere in that 200 to 700 cow range—faces a particularly challenging structural position. Often, it is too large to capture premium pricing through direct marketing and niche positioning. Sometimes, it is too small to achieve the cost efficiencies that larger operations rely on during thin-margin periods. I was talking with a Wisconsin producer running about 400 cows last month, and he described it perfectly:
“We’re in no-man’s land—too big to be boutique, too small to be bulletproof.”
That segment may undergo significant change in the years ahead.
The Canadian Calculus
Canada’s supply management system provides some insulation but hasn’t prevented domestic consolidation. Research from Dalhousie University’s Agri-Food Analytics Lab, led by Dr. Sylvain Charlebois, projects that Canadian dairy farm numbers will decline from approximately 11,000 today to around 5,500 by 2030—a 50% reduction, even under supply management.
The calculus for Canadian producers is complicated. Quota values represent significant wealth—but also significant debt loads for younger operators looking to expand or enter the industry. Succession planning gets thorny when the next generation looks at those numbers and wonders whether the investment makes sense over a 20-year horizon. And there are real questions about whether the regulatory framework will hold steady through USMCA review cycles.
Canadian producers I’ve spoken with are weighing these factors carefully. The protection supply management offers is real, but it’s not a complete shield against the structural pressures reshaping dairy worldwide. While projections always involve uncertainty, the directional trend appears clear.
Approaches That Are Working
Against this challenging backdrop, certain operational models are demonstrating resilience. They’re worth understanding, even recognizing they don’t apply to every situation.
Value-added processing continues showing strong economics for farms with appropriate geography and capital access. Research on dairy farm diversification consistently finds that operations producing cheese rather than selling commodity milk can capture substantially higher margins per hundredweight. Those combining processing with direct marketing channels—farmers markets, farm stores, local restaurant accounts—often add further value.
For operations seriously exploring this path, facility investment typically ranges from €200,000 to €310,000 or morefor licensed cheese or bottling operations. In the U.S., USDA Value-Added Producer Grants can cover up to $250,000 in eligible costs for working capital, meaningfully improving the feasibility of qualifying operations. The timeline to breakeven generally runs 18-24 months for well-executed transitions—not quick, but achievable with solid planning and realistic expectations.
The key constraint? Geographic proximity to consumers. Direct-to-consumer channels generally work best within 90-120 minutes of significant population centers. Rural operations distant from metropolitan markets face more limited diversification options. A Vermont producer I spoke with last year captured it well:
“Location isn’t everything, but it’s probably 60% of whether value-added pencils out.”
Beef-on-dairy programs are expanding rapidly, particularly in North America. By breeding lower-genetic-merit dairy cows to beef sires, operations generate crossbred calves with meaningfully higher market values than dairy bull calves—while focusing replacement heifer production on their top genetics. Industry observers estimate the segment could produce over 3 million calves annually, as growing acceptance from feeders and packers continues. It’s not a complete solution to margin challenges, but it represents additional revenue without requiring new infrastructure or marketing channels. And for herds with solid reproductive programs already in place, the implementation is relatively straightforward.
Organic and grass-fed specialization maintains premium capture for farms that can meet certification requirements and access appropriate markets. University of Vermont research tracking organic dairy profitability over a multi-year period found that organic farms generated greater net farm revenue than comparable conventional operations in 4 of 5 years studied. The key requirements are geographic access to consumers willing to pay premiums and the management capacity to meet certification standards—which, as anyone who’s gone through organic transition knows, involves a considerable learning curve and attention to detail in pasture management, dry cow protocols, and treatment record-keeping.
None of these represent universal solutions. They require specific combinations of location, capital, management capacity, and market access. But they illustrate that operational choices still create meaningful differences, even in challenging structural environments.
Where Things Stand Now
The December 18 mobilization succeeded in forcing a postponement of the EU-Mercosur vote until at least January 2026. That represents real political achievement—thousands of farmers blocking the EU capital creates attention that decision-makers can’t easily dismiss.
But postponement isn’t resolution. The underlying political dynamics remain largely unchanged. Germany’s industrial sector—automobiles, machinery, chemicals—wants Mercosur market access. Spain and Portugal see export opportunities. The European Commission’s trade directorate remains committed to the agreement.
The real question: Can farmers convert this tactical delay into lasting structural changes?
What farmers achieved is time. How they use that time will determine whether this mobilization produces a lasting impact or merely delays an eventual outcome. The next few months will likely include European Council discussions, parliamentary committee reviews, and continued negotiations over the details of the mirror clause. Those watching closely should pay particular attention to French parliamentary positions—France has been the most vocal opponent, and its stance will significantly shape what happens next.
Copa-Cogeca has announced plans for continued engagement through the winter and spring. National farmer organizations in France, Italy, and Poland are coordinating advocacy efforts. Whether agricultural constituencies can maintain focus and unity long enough to achieve meaningful changes to the agreement—or whether momentum fades and ratification proceeds largely as drafted—remains uncertain. History suggests maintaining coalition unity across months is the harder challenge.
Considerations for Dairy Producers
For European farmers: The Brussels demonstration showed that coordinated agricultural action can still capture political attention. The January 2026 timeline creates a defined window for continued engagement. Maintaining coalition alignment across sectors and borders will likely determine outcomes.
For North American producers, the EU-Mercosur dynamics may create export-market pricing pressure regardless of direct import effects. Planning that accounts for potential commodity price adjustments in contested markets through 2027 seems prudent. Operations with significant export market exposure face the most direct implications.
For all dairy operations: The structural consolidation trend continues. Operations in the 200-700 cow range face particularly complex economics under sustained margin pressure. Strategic decisions made in the next 18-24 months—whether toward scale, toward differentiation, or toward well-planned transition—will shape outcomes for the coming decade.
Questions worth sitting with:
What percentage of your operation’s economics depends directly or indirectly on export market pricing?
Does your geography realistically support value-added or direct-to-consumer diversification?
If pursuing scale, what’s your realistic timeline for achieving those economics?
If neither scale nor differentiation fits your situation, what does thoughtful transition planning look like while asset values remain supportive?
These aren’t easy questions. But current conditions make them worth serious consideration.
The Bottom Line
The farmers who gathered in Brussels understand something important: this isn’t really about one trade deal or one protest. It’s about whether agriculture maintains sufficient standing to influence the policies shaping its future meaningfully. What happens in the coming months will affect European farming for a generation—and offers relevant lessons for agricultural communities watching from elsewhere.
KEY TAKEAWAYS:
10,000 farmers just bought time: The December 18 Brussels blockade forced an EU-Mercosur postponement until January 2026. What happens next depends on whether that coalition holds.
The cost gap can’t be managed away: South American producers operate at costs 40-60% below EU operations. That’s structural—land, labor, regulatory burden—not an efficiency problem.
North American dairy feels this indirectly but meaningfully: Displaced EU production will compete harder in Mexico, North Africa, and Southeast Asia. Those are your export markets, too.
Decision time for mid-size operations: With 65% of U.S. cows on 1,000+ head dairies and farm numbers down 40% since 2017, the next 18-24 months will shape outcomes for a decade. Scale, differentiate, or transition—but don’t wait.
Complete references and supporting documentation are available upon request by contacting the editorial team at editor@thebullvine.com.
Learn More:
The Beef-on-Dairy Wake-Up Call: What Some Farms Are Still Missing – This tactical guide reveals how to deploy genomic testing and build specific buyer relationships to turn your lowest-merit cows into high-margin profit centers, providing a practical roadmap for surviving current price compression.
The Wall of Milk: Making Sense of 2025’s Global Dairy Crunch – Provides a strategic deep-dive into the “global supply collision” and the 24-month biological trap, helping producers understand why current market corrections are slower than usual and how to protect margins through 2026.
Join over 30,000 successful dairy professionals who rely on Bullvine Weekly for their competitive edge. Delivered directly to your inbox each week, our exclusive industry insights help you make smarter decisions while saving precious hours every week. Never miss critical updates on milk production trends, breakthrough technologies, and profit-boosting strategies that top producers are already implementing. Subscribe now to transform your dairy operation’s efficiency and profitability—your future success is just one click away.
The math says 2,800 dairies will close this year. Your lender already knows if you’re one of them. Do you?
There’s a conversation happening in bank offices and cooperative boardrooms right now that most of us aren’t part of—at least not early enough to matter. I was reminded of this recently when talking with a 400-cow operator in central Wisconsin who’d just come from a meeting with his lender. “Nobody told me the runway was this short,” he said. That conversation is really what prompted me to put this piece together.
What I want to walk through today isn’t about whether dairy consolidation is coming, as many of us have observed over recent years, that question has largely been answered by economics. It’s about understanding the timeline and making decisions while meaningful choices still exist. Because there’s a real difference between strategic planning and crisis management, even when the underlying numbers look similar on paper.
What the Current Data Shows
Let’s start with what we actually know. Rabobank’s dairy analysts have been projecting 7 to 9 percent annual farm exits through 2027 in their global dairy outlook reports. On a base of roughly 39,000 U.S. dairy operations, that works out to approximately 2,800 farms closing in 2025 alone.
Now, I want to be clear—that’s a projection, not a guaranteed outcome. Projections have been wrong before, sometimes dramatically. But it aligns with what many of us are observing in our own communities. Wisconsin and Minnesota have seen steady attrition among mid-sized herds. California’s Central Valley operations are navigating their own pressures around water and labor costs. Northeast family dairies face familiar questions about scale and succession. Even in Texas, where dairy has been expanding, the growth is concentrated in larger operations, while smaller producers face the same margin pressures as elsewhere. Pacific Northwest dairies tell similar stories.
What’s particularly noteworthy about this cycle is the picture of processor investment. The International Dairy Foods Association announced in October 2025 that processors have committed more than $11 billion in new and expanded manufacturing capacity across 19 states, with more than 50 individual building projects scheduled through early 2028.
I spoke with a dairy economist last month who offered some useful context: those facilities aren’t being designed for the farm structure we have today—they’re being built for a landscape where the median supplier is considerably larger. That’s neither inherently good nor bad. It’s simply the direction capital is flowing, and understanding that helps inform planning decisions.
The timing also coincides with recent regulatory changes. The Federal Milk Marketing Order amendments took effect in June 2025, and according to American Farm Bureau Federation analysis from September, producers experienced more than $337 million in combined pool value reduction during the first three months under the new rules. Class price reductions from the make allowance changes ranged from 85 to 93 cents per hundredweight.
To put that in practical terms for daily planning: a 300-cow operation shipping around 680,000 pounds monthly is looking at roughly $5,800 to $6,300 per month in reduced revenue—before any operational changes. That’s meaningful money that affects everything from cash flow planning to equipment decisions.
Four Metrics Worth Watching
So how do you assess where your operation actually stands? What I’ve found helpful—and this comes from conversations with producers, lenders, and consultants across different regions—is focusing on four metrics that, taken together, give you a reasonable read on financial trajectory.
Financial Metric
Healthy Range
Monitor Closely
High Risk
Margin Over Feed Cost
$12.00+/cwt
$8.50–$11.99/cwt
Below $8.50/cwt
Replacement Rate
30–35% annually
36–40% annually
Above 40% annually
Debt-to-Equity Ratio
Below 60%
60–75%
Above 75%
Component Gap to Premium
Within 5¢/cwt of threshold
6–15¢/cwt below
16¢+/cwt below
Margin over feed cost is probably the most familiar to all of us. The Dairy Margin Coverage program uses this calculation, and USDA Farm Service Agency data showed margins peaked at $15.57 per hundredweight back in September 2024. Since then, they’ve compressed in many regions. Extension economists generally suggest that when margins drop below about $12 per hundredweight, equity building slows significantly. Drop below $8.50, and many operations start drawing on reserves. But these are benchmarks, not hard rules—a farm with owned land operates on a different baseline than one that pays rent on everything.
Replacement rate deserves more attention in financial discussions than it typically receives. Extension programs benchmark healthy rates at 30-35%. When rates push above 35 to 38 percent, it often signals underlying challenges—fresh cow management issues, transition period problems, or breeding decisions that aren’t holding up. What makes this tricky during financial stress is the cascade effect: you keep marginal cows longer, which affects bulk tank components, further tightening margins.
Component position matters more now than it did five years ago. With the FMMO changes emphasizing component values differently, farms producing milk below regional butterfat and protein premium thresholds leave revenue on the table each month. The gap varies by market, but in some areas we’re talking 15 to 25 cents per hundredweight—over millions of pounds annually, that adds up fast.
The debt-to-equity ratio ultimately determines your lender flexibility. Generally, once you’re above 65 percent, lenders monitor more closely. Above 75 to 80 percent, you’re at the edge of most lenders’ comfort zone. What many producers don’t appreciate is that your lender sees trends in these ratios before you notice them—they’re benchmarking across their entire portfolio.
USDA Dairy Margin Coverage data shows margins peaked at $15.57/cwt in September 2024 and have compressed to the $8.50-$9.00 range by fall 2025—crossing from surplus territory into the crisis zone where operations draw on reserves rather than building equity. Extension economists consistently identify $12/cwt as the threshold where equity building slows significantly, and below $8.50 as the point where financial stress becomes acute.
A producer I know in Michigan’s thumb region described the replacement rate trap perfectly:
“Trying to save money in ways that actually cost money.”
That observation has stuck with me.
The Scale Economics Question
This is probably the most difficult part of the conversation, but understanding the underlying economics matters for good decision-making. USDA Economic Research Service data has consistently shown that operations with 2,500-plus cows produce milk at roughly $3 to $4 per hundredweight less than farms running 300 to 500 head. Earlier ERS research found farms with 200 to 499 cows realized production costs about 21 percent above average costs at farms with at least 2,500 head.
I want to be thoughtful about how we interpret this, because management quality absolutely matters. A well-run 300-cow operation with excellent forage programs, tight fresh cow protocols, and careful cost control can achieve impressive efficiency. I’ve visited operations that size doing remarkable work—outstanding butterfat levels, minimal death loss, excellent transition cow outcomes. These farms demonstrate what’s possible with focused management.
But even excellent smaller operations typically face a structural cost advantage that’s difficult to overcome fully through management alone. The reasons are fairly intuitive: labor efficiency improves as herds grow, equipment costs spread across more production, feed procurement benefits from volume, and technology investments that don’t pencil at 300 cows become obvious choices at 2,000.
USDA Economic Research Service data reveals that operations with 2,500+ cows produce milk at $7.50/cwt, while 300-499 cow dairies average $10.50/cwt—a permanent structural disadvantage of $3-4/cwt that excellent management can narrow but not eliminate. This isn’t about working harder; it’s about physics: labor efficiency, equipment utilization, and purchasing power all scale non-linearly.
This doesn’t mean mid-sized operations can’t succeed—many do, and through various strategies. But pure commodity milk production at 300 to 700 cows does face structural headwinds that typically require either exceptional efficiency, premium market access, or diversified revenue streams to address effectively.
The scale reality in summary:
2,500+ cow operations: approximately $7-8/cwt production cost
300-500 cow operations: approximately $10.50-11/cwt production cost
The gap:$3-4/cwt regardless of management quality
That gap is structural. It doesn’t close on its own through harder work or better decisions.
How Exits Actually Unfold
U.S. Courts data shows 361 Chapter 12 bankruptcy cases were filed in the first half of 2025—a 55 percent increase from the previous year, according to American Farm Bureau Federation analysis. That’s significant, and it’s worth taking seriously.
But here’s some useful context: bankruptcies represent roughly 12 to 13 percent of total farm exits. The rest follow different paths, and the path matters considerably for what families ultimately preserve.
Some operations execute strategic exits—selling while herds are healthy, equipment is maintained, and there’s time to market properly. Farm transition specialists report these families typically preserve considerably more equity than those managing crisis liquidations. The difference often amounts to several hundred thousand dollars, depending on farm size and condition.
Exit Pathway
Typical Timeline
Equity Preserved
Decision Control
Family Legacy Impact
Strategic Exit(Proactive sale while healthy)
12–18 months
70–85% of farm value
Full control over timing, buyers, terms
Positive: Exit on own terms, resources preserved
Crisis Liquidation(Forced sale under pressure)
3–6 months
30–45% of farm value
Limited: Time pressure forces discounts
Mixed: Reduced resources, stressful transition
Chapter 12 Bankruptcy(Court-managed)
6–12 months (court-supervised)
15–30% of farm value
Court-supervised: Loss of autonomy
Negative: Public record, damaged relationships
Others pursue operational pivots. Beef-on-dairy programs have gained traction across the Midwest, with operations reducing milking herds and breeding maternal animals to beef sires. I recently spoke with a 350-cow producer in eastern Iowa who made this transition 18 months ago—he’s cautiously optimistic about where it’s heading, though he’s quick to note the learning curve was steeper than expected. Some pursue organic certification, though that 18 to 36 month transition creates its own cash flow challenges. Northeast operations near population centers have explored direct sales and farmstead processing. California dairies have developed specialty cheese partnerships. Southwest grazing operations have found niches that work for their land and climate.
These pivots can work well—I’ve seen successful examples across regions. But they require capital investment when cash tends to be tight, and stabilization often takes 12 to 18 months or longer.
And then there are forced liquidations—equipment sold under time pressure, herds moved when buyers understand the circumstances, and real estate that can’t be marketed appropriately. The value erosion in these scenarios is substantial, and often avoidable with earlier planning.
The Information Timing Challenge
One pattern that’s become clearer through conversations with producers, lenders, and advisors is that most operators learn they’re in serious difficulty only late. The familiar progression: milk prices are down, but we’ve weathered down markets before. Margins are tight, but they’ll improve when feed costs moderate. The cooperative newsletter says conditions should stabilize…
Meanwhile, lenders are watching debt service coverage ratios and benchmarking against peer operations. Cooperatives analyzed the implications of the FMMO changes, while producers focused on getting hay put up. Processors investing $11 billion modeled which farm configurations will supply those facilities in 2028.
Farm financial research consistently shows lenders recognize deteriorating dairy operations 6-9 months before producers fully acknowledge the severity—they’re benchmarking your debt service coverage against hundreds of other dairies in their portfolio while you’re focused on daily operations. Processors and co-ops see trouble at months 2-4 through volume trends and quality patterns. By the time financial stress feels undeniable to the producer (months 6-9), the strategic decision window is already half-closed.
This isn’t coordinated—it’s simply that different actors have access to different information at different times. Lenders see portfolio-wide trends. Cooperatives analyze regulatory changes as part of their core business. Processors model supply chains before major capital commitments.
Research on farm financial decision-making suggests that lenders often recognize deteriorating conditions 6 to 9 months before producers do. That gap represents real dollars—the difference between proactive planning and reactive crisis management.
What Canada’s Experience Suggests
There’s an interesting parallel north of the border worth considering. Dr. Sylvain Charlebois, a food policy researcher at Dalhousie University, has projected Canada could lose nearly half of its remaining dairy farms by 2030. What makes this striking is it’s happening under supply management—the system designed to prevent exactly this outcome.
The economics are instructive. Alberta quota costs have ranged from $52,000 to $58,000 per kilogram on the open exchange, according to provincial marketing board data. For a 100-cow operation, quota value alone can exceed $20 million—before purchasing animals or building facilities.
Consider succession in that context. A next-generation farmer faces quota obligations that can dwarf the productive capacity of what they’re acquiring. Even with Canada’s higher milk prices—roughly double U.S. levels—the math often doesn’t work. Quebec now produces roughly 40 percent of Canadian milk from a province with just over 20 percent of the population.
The insight for U.S. producers isn’t whether supply management is good or bad—reasonable people disagree, and there are legitimate arguments on multiple sides. It’s that price protection alone doesn’t automatically preserve mid-sized operations. Supply management changed the consolidation mechanism without preventing consolidation itself. The underlying economics still favor scale, just through different pathways.
Practical Steps Worth Considering
If you’re running a mid-sized operation and recent milk checks have been lighter than expected, what’s productive? Based on conversations with producers who’ve navigated similar situations, here’s what seems to help.
This week: Calculate your actual margin over feed cost using current figures. Pull recent milk statements, total feed invoices including purchased forages, and run the numbers. Know whether you’re at $11, $9, or somewhere else. This baseline matters before other conversations make sense.
Within a couple of weeks: Have a direct conversation with your lender. Ask specifically: “Based on my current numbers and what you’re seeing across your dairy portfolio, what’s my realistic runway? What trends should I understand? What options do you see for operations like mine?” Good lenders engage honestly with direct questions, and their perspective provides important context.
Within 60 days: Make a directional decision. Not necessarily final, but clarity about which path you’re exploring.
The paths vary by situation. Strategic exit while equity remains—preserving resources for retirement, education, or new directions. Operational pivot toward specialty markets or diversified production—requiring capital investment while credit remains available. Scaling to 1,200-plus cows, where region and finances support it. Partnership with larger operations—trading some independence for stability.
What tends not to work is continuing commodity production at 300 cows while waiting for prices to overcome structural cost differentials. That math rarely resolves through price alone.
The Decision Window
Based on farm financial data and exit patterns, the window for strategic decisions on mid-sized operations typically runs 12 to 18 months from when margins first compress below sustainable levels. After that, options narrow. By month nine or ten of sustained pressure, responses often become reactive rather than proactive.
European research published in the European Review of Agricultural Economics found that only about 5 to 8 percent of at-risk farmers make proactive decisions before circumstances force their hand. Most wait—sometimes for understandable reasons, sometimes because they lack good information earlier.
I mention this as context, not criticism. These decisions involve multi-generational history and deep personal identity. But recognizing your situation while options remain open positions you better than most.
The Bottom Line
The consolidation unfolding in dairy represents structural change—not simply cyclical pressure that patience will outlast. Processors are building infrastructure sized for larger suppliers. Scale advantages of $3 to $4 per hundredweight persist regardless of management quality. Information reaches different actors at different times.
None of this reflects poorly on anyone running a 300-cow operation. The business models that sustained earlier generations operated in different economic environments. That’s industry evolution, even when consequences feel personal.
The families who navigate this successfully will largely be those who recognized their situation early and made strategic choices—not those who recognized it later, when options had narrowed.
The math doesn’t care about your farm’s history. But you do. You have a 60-day window to look at the numbers before your lender makes the decision for you.
Current Dairy Margin Coverage data is available through the USDA Farm Service Agency at fsa.usda.gov. Regional cost-of-production benchmarks can be found through university extension programs, including the Center for Dairy Profitability at UW-Madison, Cornell PRO-DAIRY, and FINBIN at the University of Minnesota. California-specific analysis is available through UC Davis Cooperative Extension. Provincial marketing boards, including Alberta Milk and Dairy Farmers of Ontario, publish Canadian quota pricing. The International Dairy Foods Association tracks processor investment information at idfa.org.
Key Takeaways:
Your lender knows first: Financial trouble is visible to lenders 6-9 months before most producers see it—ask about your runway this week
The cost gap won’t close: 2,500+ cow operations produce milk $3-4/cwt cheaper; strong management helps, but the structural disadvantage remains
Your window is 12-18 months: From first margin compression to limited options—most families recognize trouble too late to act strategically
Decide within 60 days: Calculate your actual margins, talk to your lender, and choose a path—exit, pivot, scale, or partner
$11 billion says it all: Processor investment in new capacity is designed for larger suppliers; plan accordingly
Executive Summary:
Your lender likely sees your dairy’s financial trouble 6-9 months before you do—and processors investing $11 billion in new capacity have already decided which farm sizes fit their future. This information gap is costing mid-sized producers critical decision-making time, as Rabobank estimates that 2,800 farms will close in 2025. The economics are structural: USDA data show that operations with 2,500+ cows produce milk at $3-4/cwt less than those with 300-500 cows, a disadvantage that excellent management can narrow but not eliminate. June 2025’s FMMO changes have intensified pressure, pulling $337 million from the producer pool value in three months. For operations experiencing compressed margins, the window for strategic decisions—exit, pivot, scale, or partner—runs 12-18 months before options narrow dramatically. The priority now: know your numbers, talk to your lender, and choose a direction within 60 days.
Complete references and supporting documentation are available upon request by contacting the editorial team at editor@thebullvine.com.
Learn More:
Decide or Decline: 2025 and the Future of Mid-Size Dairies – Provides a strategic roadmap for the three viable paths remaining for mid-sized herds: intentional expansion, technology-driven rightsizing, or disciplined optimization, helping you convert fatigue into focus before equity erodes.
Beef-on-Dairy: Real Talk on Turning Calves into Serious Profit – Details the specific breeding and management protocols that are generating $90,000–$100,000 in additional annual revenue for 1,000-cow operations, offering a concrete operational pivot for dairies needing immediate cash flow diversification.
Join over 30,000 successful dairy professionals who rely on Bullvine Weekly for their competitive edge. Delivered directly to your inbox each week, our exclusive industry insights help you make smarter decisions while saving precious hours every week. Never miss critical updates on milk production trends, breakthrough technologies, and profit-boosting strategies that top producers are already implementing. Subscribe now to transform your dairy operation’s efficiency and profitability—your future success is just one click away.
63% of U.S. milk now comes from 1,000+ cow operations. For mid-sized farms, the next 18 months are about turning assets into options—before you’re forced to.
EXECUTIVE SUMMARY: Mid-sized dairy operations (300-2,000 cows) are caught in an efficiency trap: simultaneous productivity gains across all regions create oversupply that compresses margins despite record component levels. With 2,500-2,800 farms exiting annually and federal policy favoring consolidation over direct payments, the next 18 months represent a critical decision window. Four pathways remain strategically viable: Chapter 12 debt restructuring, strategic sale before distress, value-added market pivots, or separating herd sale from land retention. High-genomic herds offer crucial advantages—GTPI 2,800+ animals command $2,500-4,000 per head versus $1,500-2,000 for commercial genetics, representing $600,000-1.2 million in additional equity for a 600-cow operation. Decision factors include geography (Southwest water constraints, Upper Midwest cooperative dynamics), debt-to-asset ratios (above 60% signals restructuring need), and family goals around land preservation versus operational continuity. Success five years from now won’t mean staying largest or most efficient—it will mean acting strategically while equity exists, rather than being forced into distressed decisions after losses erase options.
Look, something is happening in dairy right now that we need to talk about honestly. If you’re running anywhere from 300 to 2,000 cows, you’re feeling it every time you look at your milk check. Margins that were tight 18 months ago? They’ve gotten tighter. Markets that looked uncertain coming into this year? Still haven’t cleared up. And meanwhile, the whole structure of the industry keeps shifting underneath us—new processing plants going up, big cooperatives talking expansion, federal support flowing to row crops while dairy operates in a fundamentally different policy environment.
What I’ve been tracking over the past year—and what keeps coming back in conversations with producers from Wisconsin to California, lenders across the Midwest, and Extension folks in multiple regions—is that this isn’t just another rough patch we need to weather. It’s something more fundamental. We’re watching a full-scale experiment on whether U.S. dairy can consolidate faster than its physical and financial constraints catch up. And mid-sized family operations are right in the middle of that experiment, whether we signed up for it or not.
Here’s what matters most: understanding what’s happening systemically doesn’t change the fact that you might be losing real money every month. But it does change how you think about the decisions you face over the next 18 months. Because that window? It matters more than most people realize right now.
So let’s walk through three questions: What system are we actually operating in? Who’s positioned to benefit from how things are currently structured? And most importantly—what real options do mid-sized operations have before that 18-month window closes?
How We Got Here: The Policy Shift Nobody’s Talking About
Federal agricultural support policy over the past few years has increasingly emphasized assistance for row crop growers dealing with trade disruptions and tariff impacts. Dairy has received proportionally less direct relief, with policy focus shifting toward what Washington calls “structural solutions”—market access improvements, processing investments, labor reform.
And you know what? This wasn’t entirely surprising if you’d been watching the patterns develop.
The 2018-2019 Market Facilitation Program showed us how this plays out. Eric Belasco and his colleagues at Montana State published research in Food Policy that found payments were concentrated on larger farms receiving higher per-acre payments, even when the formulas appeared neutral on paper. The Government Accountability Office documented in their September 2020 report GAO-20-563 that less than 10 percent of those payments went to farms producing specialty crops, dairy, or hogs—despite these sectors representing significant chunks of the farm economy.
But here’s what really caught everyone’s attention, and it’s worth understanding because it shaped how policymakers think about farm support now. Jason Hancock at The Missouri Independent documented in January 2023 how giant fertilizer companies hauled in hundreds of millions in net earnings right after those payments went out. One major producer saw earnings jump more than 1,000% in the first nine months of 2022. Farmers were spending nearly four out of every ten dollars of corn production costs on fertilizer.
I remember reading Tim Dufault’s testimony to the House Ways and Means Committee back in September 2020. He’s a wheat and soy farmer from Polk County, Minnesota, and he put it plainly: “While we are being paid not to sell to one of the fastest growing markets in the world, our competitors are filling the void. Our loss is Canada, Brazil, Russia, and Australia’s gain. In the past two years, Canada’s wheat exports to China have increased 400% while ours have fallen.”
So policymakers saw all this—the concentration effects, the value capture by input suppliers, the competitive losses—and you can understand why there’s now a different view in Washington. There’s a growing sense that big, one-time relief checks don’t fundamentally fix structural issues. They might soften the blow short-term, but they can also delay necessary adjustments, disproportionately strengthen the largest operations, and leave producers more leveraged when the next downturn hits.
The strategy shifted toward processing investment incentives, trade access efforts, stronger labor policy, and pricing reforms. From a policy perspective, the bet is that if the system’s infrastructure and markets get “right-sized,” profitability will eventually follow. Whether that’s the right bet or not—well, we’re living through that experiment right now.
For a mid-sized farm losing serious money each month? That’s a very slow boat to wait for.
The Consolidation Numbers: What the Data Actually Shows
The numbers tell a clear story if you’re willing to look at them honestly, and I think it’s important to separate what we know from what we’re still figuring out.
USDA’s 2022 Agricultural Census came out in early 2024 and confirmed what most of us already felt: the continued acceleration of the decades-long consolidation trend. Operations with more than 1,000 cows now produce roughly 63% of U.S. milk. The total number of dairy farms continues declining—about 2,500 to 2,800 operations exiting annually in recent years, according to USDA NASS data. That’s roughly seven farms disappearing each day, every day.
And here’s what’s particularly interesting from a production standpoint: USDA’s 2024 dairy outlook projected modest milk production growth continuing, with total production expected to remain above 226 billion pounds. That growth comes from both modest herd expansion and productivity gains. Per-cow production keeps climbing—better genetics, precision feeding, improved management across the board.
Component levels have hit historic highs, too. USDA Dairy Market News documented through 2024 that butterfat tests were reaching above 4.3% and protein pushing past 3.3%. These are multi-decade peaks in milk quality. Total milk solids are up even as volume growth stays more modest.
On paper, that looks like the efficiency story everyone talks about, right? More output from fewer cows and fewer farms should mean lower costs and better margins. That’s the theory.
But the margin story hasn’t followed that script, and this is where it gets complicated. University of Wisconsin Extension data documented compressed milk-over-feed margins through 2024. I’ve talked with producers from Michigan to New York who reported some of their tightest margins in years. Farm Bureau analysis through 2024 noted that despite strong component production, dairy producers were navigating compressed margins, with milk prices failing to keep pace with elevated feed, labor, and compliance costs.
What’s creating the squeeze is something bigger than any individual farm’s decisions—it’s simultaneous production growth across all major exporting regions. Recent global dairy market analysis has documented this unusual pattern: milk output growing in the U.S., EU, New Zealand, and South America all at the same time. Typically, at least one part of the world is dealing with some limiting factor—weather, disease, margins, something—that reduces milk growth. Not this time. Everyone’s pedal is down at once.
“When everyone increases efficiency simultaneously without matching demand growth, you get what agricultural economists call an ‘efficiency trap.’ Each farm individually makes rational decisions—better genetics, improved feeding, automation. But collectively, the industry ends up with more high-quality milk than global markets can absorb at profitable prices.”
This was clearly evident in Global Dairy Trade auction results through late 2024: prices fell as milk supply outpaced demand.
That’s the environment mid-sized farms are navigating right now. Not because anyone did anything wrong—because everyone did what made sense individually.
Processing Investments: Opportunity or Lock-In?
Layered on top of consolidation is a significant wave of new processing construction, and I think this deserves careful attention because it’s shaping market access in ways that aren’t immediately obvious.
Industry estimates point to seven to eleven billion dollars in new dairy processing investments announced or underway across multiple states, with completion timelines running through 2028. That’s a massive amount of capital flowing into the sector.
On one hand, this represents real confidence in dairy’s long-term prospects. More capacity can mean new products, better export-oriented manufacturing, and improved balancing for regions with seasonally heavy production. I’ve talked with producers near some of these new facilities who see a genuine opportunity to access premium markets they couldn’t reach before.
Herd Size
Avg Annual Profit per Cow
Cost of Production
Debt-to-Asset Ratio
Exit Rate (Annual)
Small (Under 250)
$200-$400
$22-$24/cwt
25-35%
2-3%
Mid-Size (300-2,000)
-$100 to $600
$19-$22/cwt
40-60%
5-7%
Large (2,000+)
$800-$1,200
$16-$18/cwt
30-45%
<1%
On the other hand—and here’s where it gets complicated for mid-sized operations—these plants come with minimum-volume requirements that shape which farms can participate profitably. Hoard’s Dairyman noted back in August 2021 that modern processing facilities operate most efficiently at high throughput rates. A plant designed to run four to five million pounds per day doesn’t pencil well at 40 or 60 percent capacity utilization. The economics simply don’t work.
That reality pushes facilities to secure milk from large, consistent suppliers—typically very large herds or tightly aligned cooperative members. Companies aren’t investing hundreds of millions in new plants and then wondering where they’ll get the milk from. Most locked in future milk supply commitments before construction even started. If you weren’t part of those early conversations, you might find yourself on the outside looking in when the plant fires up.
This creates both opportunity and constraint, depending on where you sit. If you’re a mid-sized farm near new capacity and you can scale up or partner effectively, there may be room to grow into those supply relationships. But if you’re in a less favored location, or can’t meet the volume consistency these plants need, you might find premium markets or long-term contracts harder to secure than they were five years ago.
There’s also a timing risk worth thinking about, and I say this recognizing we don’t have perfect foresight here. If global demand stays soft—if China doesn’t significantly increase imports, if domestic consumption grows slowly—the industry could reach a point in a few years where there’s more processing capacity in the ground than profitable milk to run through it.
We’ve seen this scenario play out elsewhere. Industry observers in Ireland have documented chronic underutilization challenges in their dairy processing sector. All the capacity is needed for only a few peak weeks during the year. The rest of the time, plants run well below optimum levels, with some facilities even shutting down during quieter winter months. Whether we’re headed for something similar here remains to be seen, but the risk is real enough to factor into your planning.
From a farm-gate perspective, this creates a double bind. Short-term, plants need milk to fill capacity—that can feel like an opportunity if you’re positioned right. But long-term, if enough mid-sized operations exit and prices don’t recover, the system may find itself with stranded investment, fewer independent producers, and greater dependence on highly leveraged mega-dairies.
Understanding the Incentive Structure
It’s worth taking a calm look at who’s structurally aligned with consolidation and these processing investments. This isn’t about pointing fingers or assigning blame—it’s about understanding incentives so you can make better decisions for your own operation. Because when you understand the incentives, the patterns start making more sense.
Large cooperatives and integrated processors sit in an interesting position. When an organization both aggregates milk from member farms and owns processing plants, it effectively participates on both sides of the transaction. Take DFA as an example—according to their annual disclosures and public filings, they control roughly 30% of U.S. milk production while operating 44 processing facilities they’ve acquired over the years, including that $433 million Dean Foods asset purchase back in 2020.
DFA’s leadership has been pretty direct in its industry communications about the need for consolidation to maintain competitive positioning in today’s market. And from their perspective, you can see why. When farms consolidate, and more milk flows through fewer, larger plants, these integrated organizations gain scale efficiencies, widen their influence over pricing and contracts, and strengthen their position with retailers and export buyers. If you’re running a cooperative with processing assets, consolidation makes a lot of business sense.
Input suppliers and technology providers also benefit from the capital requirements. Moving from 500 to 2,000 cows, or from 2,000 to 5,000, typically requires a significant investment in genetics programs, robotic systems, precision feeding, and health-monitoring technologies. These sectors tend to capture a meaningful portion of any cash that flows into the system, whether from stronger prices or government programs. We saw that pattern documented pretty clearly after the 2018-2019 MFP program, and there’s no reason to think it would be different next time.
Asset Category
Investment Range
Monthly ROI
Payback Period
18-Month Priority
Beef-on-Dairy Program
$50-$120/cow
+$35-$55/cow
2-3 months
CRITICAL
Herd Genetics (GTPI 2,800+)
$150-$300/cow
+$25-$45/cow
6-8 months
CRITICAL
Debt Consolidation
Varies
+$180-$450/cow
Immediate
CRITICAL if >60% D/A
Milking System Upgrades
$2,500-$4,000/cow
+$60-$90/cow
36-48 months
HIGH
Feed Efficiency Tech
$80K-$150K total
+$15-$30/cow
18-24 months
MEDIUM
Financial institutions and land investors have also found opportunities in the transition. Agricultural economists have documented how, as mid-sized family farms struggle, farmland and facilities often change hands—sometimes to neighboring farms looking to expand, sometimes to outside investors who then lease land back to operators. Over time, this can separate land ownership from day-to-day farm control, shifting more value toward outside capital.
Federal Reserve agricultural credit surveys through 2024—particularly from the Chicago and Kansas City districts, which cover major dairy regions—showed farmland values holding relatively stable but with notable variation. Quality dairy farmland in growth regions maintained strong values, while more marginal dairy land in areas experiencing significant farm exits saw softer demand. The market’s making distinctions now that it didn’t make ten years ago.
None of this suggests these players are acting maliciously or even unethically. They’re responding to the same market signals and economic pressures as farmers—looking for growth, efficiency, and risk management. But it does matter for you to understand that the system isn’t automatically set up to protect or preserve mid-sized, family-owned, commodity-oriented dairies. That’s not the system’s design, and recognizing that fact is the first step toward making better decisions.
The default path—continue as is and wait for a better year—assumes the system wants you to succeed in your current form. The evidence suggests otherwise.
Geography Shapes Your Options More Than You’d Think
Before we get into specific strategic paths, here’s something that often gets glossed over in national conversations about dairy consolidation: your location matters enormously. What makes sense in one region might be completely impractical in another.
In the Southwest—Texas, New Mexico, Arizona—consolidation has gone furthest. Large operations dominate, feeding relies heavily on irrigated crops, and water availability is becoming the limiting constraint. Dairy Herd noted last November that optimism about Texas dairy’s growth potential comes with a significant caveat: USGS data shows the Ogallala Aquifer dropping by 2 to 3 feet annually in stressed areas, and NOAA climate data confirms the Panhandle receives only 12 to 18 inches of rain per year.
A producer I talked with last month near Muleshoe runs 4,500 cows and has been farming that same ground for three generations. He’s watching his wells drop year after year. “We’ve got maybe 15, 20 years at current draw rates,” he told me. “After that, we’re either drilling deeper—if there’s anything left to drill to—or we’re done.” That reality is shaping every expansion decision, every equipment purchase, every long-term plan. It’s not an abstract policy discussion. It’s water levels measured in feet per year.
In the Upper Midwest—Wisconsin, Minnesota, Michigan—cooperative density and processing capacity create different dynamics. Proximity to multiple buyers can provide negotiating leverage that farms in more isolated regions don’t have. But relationships matter here, and they can shift. That 2017 situation when DFA terminated marketing for 225 independent producers in the Midwest—documented in Farm and Dairy that May—reminded everyone that cooperative relationships aren’t permanent fixtures. Market access you have today isn’t guaranteed tomorrow.
In the Northeast—New York, Pennsylvania, Vermont—seasonal production patterns, smaller average farm sizes, and closer proximity to fluid milk markets create distinct opportunities and constraints. Organic and grass-based systems are more common here, partly because of climate and topography, but also because direct-to-consumer markets are more accessible when you’re within a couple of hours of major population centers. I’ve seen mid-sized operations in this region successfully transition to grass-based organic production in ways that simply wouldn’t work in the Southwest or upper Plains.
In the Southeast—Georgia, Florida, Tennessee—operations often work in hot, humid conditions that require different facility designs and management approaches. Heat stress management becomes a year-round consideration, not just a summer challenge. But population growth in regional markets can create local market opportunities that export-oriented regions don’t have. A 600-cow operation I know outside Atlanta pivoted three years ago to supplying local schools and restaurants with bottled milk. They’re capturing $5 to $7 per gallon at retail, versus $3.50 to $4 for commodity milk. It requires handling, processing, distribution, and compliance with food safety standards—a completely different business model. But proximity to that growing metro market made it viable in ways it wouldn’t be for an operation in rural Kansas.
The point isn’t to map every regional difference—it’s to recognize that a strategic decision framework that works for a 1,000-cow operation in west Texas might not make sense for a 400-cow farm in central Wisconsin or a 600-cow operation in upstate New York. As you read through what’s ahead, filter it through your regional context, market access, climate constraints, and local land values.
Why the Next 18 Months Matter So Much
Most mid-sized producers I’ve talked to over the past year find themselves in a similar spot. Margins are negative or barely breakeven. Debt levels are uncomfortable but not catastrophic yet. Land still holds meaningful equity. And everyone—kids, employees, lenders—is looking for clarity about the farm’s future.
The 18-month horizon that keeps coming up in conversations isn’t a promise of recovery. It’s better understood as a decision window—long enough to execute a major transition, but short enough that passive waiting can quickly eat through remaining equity or liquidity. And I want to be careful here because I’m not predicting what will happen in 18 months. What I am saying is that waiting 18 months to start making decisions could leave you with significantly fewer options than you have today.
“What producers are discovering is that the most important asset in 2026 and 2027 may not be cows or equipment—it’s flexibility.”
The operations that keep options open, preserve capital, and move deliberately will be in a much better position to react when the longer-term shape of the industry becomes clearer.
Here’s why timing matters: by mid-to-late 2027, several things will likely be clearer than they are today.
We’ll know whether those processing investments we talked about are filling up with committed supply or struggling to source milk. We’ll have a better sense of whether China reopens meaningfully as an export market or continues favoring New Zealand and EU suppliers. We’ll understand whether water constraints in the Southwest are manageable or becoming acute enough to force consolidation there, slowing or reversing them. We’ll see whether mega-dairy expansion continues at current rates or runs into financial constraints as debt service becomes more challenging in a compressed margin environment.
If you’re still in decision mode in late 2027—still trying to figure out your direction—your options narrow considerably. Land markets may have softened if there’s been a wave of distressed exits. Bankruptcy courts may be backlogged if many farms hit crisis simultaneously, which means the relief that tool can provide becomes slower and less predictable. Buyers looking to expand may already have their supply commitments locked in with those new processing facilities, so they’re not actively seeking additional milk or land.
But if you move thoughtfully in 2026 and early 2027, you position yourself with capital and options to make choices based on what actually unfolds, rather than being forced into whatever’s left available. That’s the fundamental difference between proactive and reactive decision-making in this environment.
Four Strategic Paths Worth Serious Consideration
Every farm’s situation is different, but in conversations with lenders, advisors, and producers across multiple regions, four broad strategies keep emerging for operations in that 300 to 2,000 cow range. None of them are easy. All involve tradeoffs. All require difficult family conversations. But each one can preserve options better than passively continuing operations at monthly losses.
1. Structured Debt Relief: Using Chapter 12 Strategically
Chapter 12 bankruptcy is a specialized form of reorganization explicitly designed for family farms. It’s not liquidation by default—it’s a legal tool to restructure terms with creditors, reduce overall debt loads in some cases, and continue operating under court-supervised plans that give you breathing room to get back to profitability.
And it’s being used more. Agricultural finance professionals and court observers have noted increased Chapter 12 bankruptcy activity among dairy operations over the past year or so. What’s particularly noteworthy is that producers who use this tool strategically—before crisis forces their hand—have been able to preserve substantial capital—often in the six-figure range—that would otherwise have been lost to creditors in unmanaged default situations.
I recently spoke with a producer in Wisconsin who filed Chapter 12 about 18 months ago. His debt-to-revenue ratio had climbed above 75%, he was burning through equity every month, but the underlying operation was productive and could have been viable with a cleaner balance sheet. Chapter 12 allowed him to restructure payment terms, reduce some debt principal through negotiations with secured creditors, and continue operating. He’s not out of the woods yet, but he’s got a path forward that didn’t exist before filing.
This option warrants serious consideration if your debt-to-revenue ratio is high—say, above 60 or 70 percent—your liquidity is tight, but you genuinely believe the underlying operation is productive and could be viable with a cleaner balance sheet. That last part is critical. Chapter 12 doesn’t fix a structurally unprofitable operation. It fixes an operation that’s temporarily struggling under a debt load accumulated during better times or from expansion decisions that didn’t work out as planned.
What it requires: good legal and financial advice from professionals who specialize in agricultural bankruptcy, honest and conservative projections about future profitability (courts don’t accept optimistic fairy tales), and willingness to work through court processes that can feel invasive and uncomfortable. There are tax implications, too—canceled debt can create taxable income that you need to plan for. But for farms where the alternative is losing the operation entirely, those are manageable problems.
The timing piece matters here, too, and this is something your attorney will likely emphasize. Bankruptcy courts are currently processing dairy cases relatively quickly. If the number of filings continues to accelerate—and there’s reason to think it might—processing times could lengthen significantly. Filing while courts still have capacity, and while you have equity to protect, gives you better leverage in negotiations with creditors than waiting until crisis forces your hand and your equity is already gone.
Metric
Chapter 12
Consolidation/Direct Payment
Strategic Sale
Milk Price Breakeven
$18.50/cwt
$20.50/cwt
N/A
Monthly Cash Flow Impact
+$15,000-$25,000
-$5,000 to +$5,000
N/A – exited
Feed Cost Sensitivity Buffer
Moderate – 30%
High Risk – 10%
N/A
Equity After 5 Years
55-65%
30-40%
70-80% recovered
2. Strategic Sale While Equity Still Exists
For other operations—especially where land is highly valuable, family members aren’t committed to long-term dairy, or facilities would require major capital investment to stay competitive—a deliberate sale before the operation becomes distressed can preserve far more value than waiting.
According to USDA NASS Land Values data and Federal Reserve agricultural surveys through 2024, quality dairy farmland was holding value relatively well, with Midwest dairy ground in the $6,000 to $8,000 per acre rangedepending on location and quality. But there was an important variation that matters for your planning. Prime farmland in areas with strong demand—near growing processing capacity, in regions with good water, in counties experiencing population growth—saw stable or slightly rising values. More marginal dairy land in areas experiencing significant farm exits saw softer pricing. The market’s making distinctions.
The key insight here is separating the decision about the operating dairy from the decision about the underlying land asset. They’re related, obviously, but they’re not the same decision. Sometimes the best move is to market the farm to buyers who want to expand, want the land for cropping, or might be willing to lease facilities back to you for a transition period.
Structure the sale to convert equity into cash for debt repayment, retirement planning, or next-generation flexibility. Consider sale-leaseback arrangements that let you convert equity to cash, continue farming for a period as tenants while you transition to other work or activities, and maintain some connection to the land and community.
Let me give you a hypothetical example that mirrors situations I’ve seen recently:
Say you’re running 600 cows on 500 acres. Your land is worth $7,500 per acre in the current market—that’s $3.75 million. Buildings and equipment might bring $800,000 to $1.2 million, depending on condition, age, and how well you’ve maintained them.
Here’s where your herd genetics matter more than many producers realize. If you’re running 600 cows with strong genomic profiles—animals averaging GTPI above 2,800 or genomic NM$ above $1,000—you’re sitting on a significantly more liquid and valuable asset than a commercial herd at similar production levels. Council on Dairy Cattle Breeding data shows that high-genomic animals consistently command premiums in dispersal sales, often bringing $2,500 to $4,000 per head to breeders and operations looking to upgrade genetics quickly. That’s compared to $1,500 to $2,000 for quality-producing cows without distinguished genetic merit.
Breeding Strategy
Initial Investment
Component Increase (12mo)
Revenue Impact (18mo)
High-GTPI Elite (2,800+)
$85/cow
4.5%
$280/cow
Commercial Genomic Bulls
$45/cow
2.8%
$150/cow
Conventional Breeding
$25/cow
1.2%
$60/cow
For a 600-cow herd, that genetic premium can represent an additional $600,000 to $1.2 million in sale value—a substantial difference when you’re trying to preserve equity. I’ve seen operations with high-genomic herds market animals through private treaty sales to multiple buyers seeking specific genetic lines, often achieving better prices than auction or wholesale dispersal would.
Total asset value in our example sits around $4.5 to 5 million, potentially reaching $5.5 to 6 million with a high-genomic herd. If your debt sits at $4 million, you’ve got roughly $550,000 to $950,000 in remaining equity with an average herd, or potentially $1.5 to $2 million with superior genetics.
A strategic sale now, while that equity still exists and before you’ve been in financial distress, could let you pay off debt completely, walk away with substantial liquid capital, potentially lease back the operation for two to three years to generate transition income while you figure out next steps, and position younger family members to make their own choices without the burden of an underwater dairy operation hanging over them.
Now compare that outcome to continuing operations at, say, $20,000 per month losses. Six months erodes $120,000 from that equity cushion. A year takes $240,000. Within 18 to 24 months, the equity buffer is gone, and you’re in crisis mode with far fewer options. The sale happens anyway, but now it’s distressed, rushed, and buyers know you’re desperate. The price reflects that reality. And if you’ve got high-genomic animals, distressed sales rarely capture their full genetic value—you’re more likely to get commercial pricing when you’re forced to move quickly.
This is emotionally difficult—I’m not minimizing that at all. Nobody goes into dairy planning to sell. But for some families, it’s the path that best balances debt repayment, retirement security for an older generation, and flexibility for the next generation to find their own path in agriculture or elsewhere.
3. Pivoting to Niche Markets and Value-Added Production
A smaller but growing set of operations are taking a different route: stepping off the commodity treadmill altogether and finding ways to capture more value per unit of milk produced. This builds on what we’ve seen in specialty agriculture for decades—differentiation creates pricing power.
Farms pursuing this route are considering several approaches, and what works depends heavily on location, family interests, and market access.
Organic or grass-fed milk contracts can command premiums of 30 to 60 percent over conventional commodity milk. I know of a 250-cow operation in Vermont that transitioned to certified organic, grass-fed production in 2021. They invested 18 months in the three-year certification process while managing the transition, adjusted their feeding program and grazing systems, and now capture an $ 8-per-hundredweight premium over conventional pricing. That premium more than covers their lower per-cow production and the additional management complexity. For them, producing 16,000 pounds per cow annually at a premium beats producing 22,000 pounds at commodity pricing.
But the transition takes time and commitment. You’ve got that three-year organic certification process. You’re changing your feeding program, your management systems, and possibly your facilities. And the organic milk market has had its own challenges with supply-demand imbalances in recent years, so you can’t assume premium pricing will last forever. Do your homework on current market conditions before making this leap.
On-farm processing for cheese, yogurt, or bottled milk offers even higher potential margins, but it comes with substantially higher complexity. Here’s the basic math from dairy science: roughly ten pounds of milk yields one pound of cheese. So 50,000 pounds of milk converted to cheese gives you about 5,000 pounds of finished product. At $4 to $6 per pound retail, that’s $20,000 to $30,000 in gross revenue versus maybe $8,000 to $9,000 if sold as fluid milk at current commodity pricing.
But—and this is a big but—you’re adding processing costs, labor, marketing expenses, regulatory compliance, food safety systems, and all the complexity of becoming a food manufacturer and retailer rather than just a milk producer. I’ve seen operations do this successfully, but they’re almost always near population centers, they’ve got family members genuinely energized by the business-building aspects, and they’re willing to invest two to three years getting established before the economics really work.
Agritourism, farm experiences, and educational programs represent another revenue stream that some operations near population centers are tapping into. I know of farms generating $50,000 to $150,000 annually from farm stays, tours, farm-to-table events, and educational programming. This typically pairs with a smaller herd—100 to 300 cows—but creates real revenue diversification that helps during commodity market downturns.
Renewable energy side income from biogas digesters, solar installations, or wind easements can add $50,000 to $200,000 annually once installed. But they require significant upfront capital—often $200,000 to $500,000—and you’re banking on energy prices, incentive programs, and utility contracts staying favorable for 15 to 20 years to justify the investment.
The common thread across all these approaches: reduce or stabilize herd size, shift focus from volume to margin per unit, and invest heavily in marketing, relationships, and brand rather than just production facilities. You’re becoming a different type of business than a commodity dairy farm.
Year
Small Herds
Mid-Size (300-2,000)
Large Herds (2,000+)
Profit Gap
2024
$350
$420
$950
$530
2025
$280
$380
$1,020
$640
2026
$220
$290
$1,080
$790
2028
$150
$180
$1,180
$1,000
2030
$100
$110
$1,280
$1,170
This route makes the most sense when you’re near a population center, when one or more family members are genuinely interested in entrepreneurship and direct sales rather than just dairy production, and when your balance sheet can support a 2- to 3-year transition in which cash flow stays tight while you build market presence and customer relationships.
It’s not a quick fix—most successful transitions take two to three years of careful planning and execution. But for operations with the right location, family interest, and financial runway, it’s been a way to stay in dairy on their own terms while commodity markets churn.
4. Selling the Herd, Keeping the Land
One other path that’s quietly gaining traction is decoupling from daily milking operations while retaining the land asset. This recognizes that, for many operations, the land is where most of the equity lies and that it has value beyond dairy production.
The core idea: sell your milking herd and specialized dairy equipment to a larger operation looking to expand or to a regional buyer aggregating cattle. Keep ownership of the land. Transition to cash crops, custom heifer growing, forage production for neighboring dairies, or long-term leases to mega-operations that want land nearby for manure application and feed production.
Here’s how the math might work in practice:
If you’re running 400 cows, that herd has real value to processors and expanding farms—potentially $600,000 to $800,000 for a quality, productive herd, depending on genetics, production levels, and market conditions. That’s at typical valuations of $1,500 to $2,000 per cow for good producing animals. And again, if you’ve invested in superior genetics—animals with high genomic merit for production, health traits, or specific breed characteristics—you may be able to capture significantly more value by marketing to breeders or genetic-focused operations rather than selling through traditional channels.
Keep your 500 acres of land, worth maybe $3.75 million at $7,500 per acre. Lease it at market rate—say $75 to $100 per acre depending on your region and land quality—and you’re generating $37,500 to $50,000 per year, roughly $3,000 to $4,000 per month.
Now I know what you’re thinking: that doesn’t sound like much compared to milk income. But here’s the key comparison. If you’re currently losing $20,000 per month on the dairy operation, stepping to $3,000 to $4,000 per month in positive cash flow while eliminating all operational stress, labor challenges, and market risk represents a $23,000 to $24,000 per month swing in your financial position. That’s the difference between burning through equity and preserving it.
This approach can stop operational losses immediately, preserve the family’s most valuable asset, maintain income streams through rent or cropping that cover property taxes, insurance, and remaining debt service, and give younger family members time to figure out how they want to be involved in agriculture without the daily pressure and financial stress of milking cows in a negative margin environment.
Industry analysts have noted that when regional processors faced challenges or closures, farms with land assets and flexibility to pivot had far better outcomes than those fully committed to dairy-only operations with no land base. That flexibility increasingly looks like an asset worth preserving, especially given the uncertainty about long-term dairy market structure.
Strategic Pathway
Equity Preserved
Timeline
Investment
Strategic Sale Pre-Distress
85%
6 months
$0
Value-Added Market Pivot
75%
18 months
$600,000
Aggressive Asset Optimization
70%
12 months
$250,000
Chapter 12 Bankruptcy
60%
12 months
$0 (legal fees)
What You Shouldn’t Do Right Now
Just as important as knowing your options is understanding what to avoid during this window, because some decisions can lock you into worse outcomes.
Avoid investing significant new capital into expansion or major facility upgrades unless you have crystal-clear market access—specific contracts or relationships with processors—and can withstand two to three more years at current margin levels. Agricultural finance advisors have been pretty direct on this point: taking on substantial new debt in a compressed margin environment is the fastest way to convert a struggling operation into an insolvent one. The math is unforgiving.
Be cautious about assuming margin recovery is coming in the near term. The U.S. Dairy Export Council indicated in 2024 market communications that while they’re confident Chinese dairy consumption will eventually return to a growth trend, the timing remains uncertain. Even industry optimists are generally talking 2026 or 2027 for meaningful improvements, and that’s if trade relationships normalize and other market factors align favorably. Making decisions based on assumed recovery is a bet, not a plan.
Don’t count on government relief specific to dairy arriving to change your situation. The policy signals over the past couple of years have been reasonably clear: the focus is on structural solutions rather than direct payments. That could change with different political dynamics, but you can’t build your financial strategy around maybes.
Don’t rely on cooperative leadership or industry organizations to specifically fight to preserve commodity-oriented mid-sized farms. Their incentives may not align with yours, and recent organizational developments have shown where priorities sit in the current environment. That’s not a criticism—it’s just recognizing the structure we’re operating in.
What you should do instead:
Get a brutally honest financial assessment now. Not an optimistic projection that assumes better markets next year—a conservative stress test that asks: what if margins stay at current levels through 2027? Can we survive that? For how long? At what cost to our equity position?
Understand your true equity position based on current market values for land, facilities, and livestock. Not appraisal values from better times, not what you think things should be worth, but what they’d actually bring in today’s market. And if you’ve got high-genomic animals, get a realistic assessment of their genetic value separate from their production value—that differential could matter significantly in your planning.
Talk to your lenders about restructuring options before the crisis hits. The best time to negotiate is while you’re current on payments and have options. Once you’re in default, your leverage disappears, and the conversation becomes much more difficult.
“Model your debt-to-revenue ratio honestly. If it’s above 60 percent, you’re in the zone where restructuring may be necessary. Above 80 percent, you’re in urgent territory that requires immediate action.”
A Decision Framework You Can Implement This Week
Theory and analysis help understand the environment, but what actually matters is what you do next. Here’s a practical sequence you can start implementing this week, not months from now.
Step 1: Get an Unflinching Financial Picture (Next 60 to 90 Days)
Sit down with your accountant, lender, or trusted advisor and answer these questions with hard numbers, not estimates or hopes:
What’s our true cost of production per hundredweight, including family labor valued at market rates and realistic depreciation that reflects actual equipment replacement timelines? At today’s milk price and current expense levels, what’s our actual monthly profit or loss? How many months of losses at current rates can we sustain before we exhaust operating credit lines or begin meaningfully eroding land equity? What’s our debt-to-revenue ratio, calculated conservatively?
Knowing these numbers precisely turns vague anxiety into concrete decision points. You might find your situation’s better than you feared, and that knowledge gives you confidence to weather the storm. Or you might discover you’re closer to crisis than you thought, and that knowledge pushes you to act while you still have options. Either way, you need to know where you stand.
Step 2: Clarify Your Equity and Exit Value (Next 60 to 90 Days)
Work with someone who knows current markets—a farm real estate professional, an auctioneer who specializes in dairy, an appraiser familiar with your region—to establish realistic values:
What would your land actually sell for today? Not top-of-market hopes or what it was worth three years ago, but realistic pricing based on recent comparable sales in your county. What’s the difference between the cull value for your herd and what you might get selling to another dairyman who wants producing cows? And critically—if you’ve invested in superior genetics, what’s the potential premium you could capture by marketing those animals to breeders or genetic-focused buyers rather than through conventional channels? What would your buildings and equipment bring—auction value versus going-concern value if sold as part of a functioning farm?
This tells you whether a structured sale could preserve significant equity, whether Chapter 12 would protect or destroy more value in your specific situation, and how much capital might be available for a business pivot, retirement funding, or providing next-generation flexibility.
Step 3: Align Strategy with Your Family’s Actual Goals (Next 30 to 60 Days)
This is often the hardest conversation, but it’s also the most important. You need honest answers to difficult questions:
Does the next generation actually want to be dairy, or do they want to farm in some other way? Are they saying what they think you want to hear, or expressing what they genuinely want? Is someone in the family energized by value-added work, direct sales, entrepreneurship, or does everyone just want to produce milk and have someone else handle marketing?
What’s the real priority here: preserving land ownership across generations? Preserving the dairy operation specifically? Preserving family health, relationships, and quality of life? Because in the current environment, you might not be able to preserve all three.
There’s no single right answer to these questions. But the financial and market context we’ve walked through can help keep this family conversation grounded in reality rather than hope, guilt, or assumptions about what previous generations would have wanted.
Step 4: Choose a Path and Set a Timeline (Next 90 to 180 Days)
Once you have clarity on your financial position, your equity situation, and your family’s actual goals, translate that into a concrete plan with specific decision points and dates:
If you’re leaning toward restructuring, schedule consultations with an agricultural bankruptcy attorney and your lender about Chapter 12 and other restructuring options. Set a clear decision deadline: if margins and cashflow don’t improve by this specific date, we file. Start preparing the financial documentation you’ll need so you’re not scrambling when the deadline arrives.
If you’re leaning toward sale or leaseback, quietly begin exploring interest with neighbors, regional operators, or land investors. Prepare clean financials and facility information so you can move quickly when the right opportunity appears. If you have high-genomic animals, connect with breed associations, genetic marketplaces, genetic marketers, or consultants who can help you capture maximum value for those genetics rather than accepting commodity pricing in rushed sales.
If you’re leaning toward a niche pivot—organic, grass-fed, or value-added production—start serious market research right now. Who are the actual buyers? What are the real regulatory requirements and costs? What’s realistic pricing based on current market conditions, not aspirational projections? Explore available grants and cost-share programs through NRCS or state agriculture departments. Sketch a two-to-three-year investment and cashflow plan with conservative assumptions, then stress-test it against downside scenarios before committing.
If you’re considering exiting dairy while keeping the land, identify potential lessees now—neighboring operations seeking additional ground, incoming farmers needing land to rent, and regional mega-dairies requiring nearby acreage for manure management and feed production. Research alternative enterprises that fit your land: what cash crops make sense given your soil types and climate? Are there conservation programs, such as CRP or wetland easements, that provide stable income? Calculate honestly whether lease income, combined with lower-intensity farming, can sustain land ownership over the long term.
The common thread across all these paths: no option is pain-free, and all require difficult decisions. But every proactive option—acting while you still have choices—beats being forced into a rushed, distressed exit after another year or two of heavy losses.
Looking Ahead: Making Decisions You Can Live With. The consolidation pressures, policy dynamics, and global trade patterns hitting dairy right now are bigger than any individual farm can control. You can’t personally fix milk pricing formulas or change how international competitors behave.
But you can recognize the system you’re actually operating in. You can use the next 18 months intentionally. And you can protect the capital and options that will let your family make real choices in 2027 and beyond—whatever those choices turn out to be.
Success in this environment doesn’t always mean staying bigger or staying in dairy. Sometimes it means preserving hard-earned equity, protecting family relationships, and positioning the next generation to chart their own path. The farms still standing five years from now will be the ones whose operators had the courage to make hard decisions while they still had options.
That window’s open now. It won’t stay that way forever.
KEY TAKEAWAYS
The efficiency trap crushes margins through no fault of your own: When all regions improve simultaneously, collective productivity creates oversupply that compresses prices—even for well-managed operations executing perfectly.
High-genomic genetics = undervalued equity: GTPI 2,800+ animals command $2,500-4,000/head vs. $1,500-2,000 commercial. For 600 cows: $600K-1.2M in additional value, but only if marketed strategically before distress forces discount pricing.
Know your financial thresholds now: Debt-to-revenue above 60% = restructuring territory | Above 80% = urgent action required | $20K monthly losses = $240K annual equity erosion. The math is unforgiving.
Four strategic pathways, different circumstances: Chapter 12 restructuring (productive operation + heavy debt) | Strategic sale (preserve equity before crisis) | Niche market pivot (proximity + entrepreneurial interest) | Land-retention/herd-sale (immediate loss prevention).
Strategic action beats waiting for recovery: The farms operating successfully in 2030 won’t be the biggest or most efficient—they’ll be those who moved decisively while equity existed, rather than hoping margins would rebound.
Complete references and supporting documentation are available upon request by contacting the editorial team at editor@thebullvine.com.
Learn More:
How to Boost Production by up to 20% through Nutrition and Cow Comfort – Provides a tactical roadmap for maximizing herd efficiency without expansion, detailing specific protocols for feed digestibility and barn environment that can deliver double-digit production gains for mid-sized herds.
Join over 30,000 successful dairy professionals who rely on Bullvine Weekly for their competitive edge. Delivered directly to your inbox each week, our exclusive industry insights help you make smarter decisions while saving precious hours every week. Never miss critical updates on milk production trends, breakthrough technologies, and profit-boosting strategies that top producers are already implementing. Subscribe now to transform your dairy operation’s efficiency and profitability—your future success is just one click away.
Too big for local markets. Too small for volume deals. The 200-1,500 cow dairies—dairy’s middle class—are disappearing fastest. Here’s why.
EXECUTIVE SUMMARY: Something doesn’t add up. Last year, 1,434 U.S. dairies exited—a 5% drop—even while margins were supposedly improving. That’s not a rough patch; it’s a structural squeeze. Mid-size family operations (200-1,500 cows) are disappearing fastest, caught between the flexibility of small herds and the leverage of mega-dairies. Ownership is aging—22% of producers are now 65 or older—while more than half of on-farm labor comes from immigrant workers, quietly reshaping the traditional family farm model. The economics keep tightening too: farmers capture just 25 cents of every retail dairy dollar on average, yet absorb rising input and compliance costs that never show up in the milk check. With Chapter 12 bankruptcies in 2025 already exceeding last year’s full total, the warning signs are impossible to ignore. This analysis breaks down what’s really driving these exits—pricing structures, policy gaps, regulatory burdens, succession cliffs—and provides concrete early-warning indicators and financial benchmarks to help you evaluate what comes next.
Here’s a number that should give every dairy producer pause. The United States now has roughly 24,800 licensed dairy herds, down about 5% from just a year ago—that’s according to Progressive Dairy’s 2024 statistics and confirmed by USDA’s milk production reports. And if you zoom out further, we’ve lost close to 95% of our dairy farms since the early 1970s. Back then, over 648,000 operations were milking cattle. Today? Fewer than 25,000.
And yet—here’s what’s puzzling—national outlooks for 2024 and into 2025 have talked about “improving” margins. Feed costs came down a bit. Wholesale prices firmed up. Analysts started using phrases like “cautious optimism.” So why did roughly 1,400 more dairies still exit last year? Why are so many families I talk with saying they’re drawing down equity just to keep the lights on?
I’ve had versions of this conversation with producers from small tie-stalls in Vermont to large dry lot operations out West and mid-size freestalls across Wisconsin. And what’s becoming clear is that we’re not just dealing with another bad price year in one region. We’re looking at something more structural: the collision of 365-day biology, equipment, and regulatory realities, cheap-food expectations, reactive subsidy programs, and a market structure that has steadily shifted bargaining power away from the farm gate.
The goal here is to unpack those pieces and pull them together into something practical—warning signs to watch, questions to ask, and options to consider, whatever your herd size or region.
Where We Really Stand: Fewer Farms, More Milk, and Thinner Buffers
Let’s start with the big picture, because it sets the stage for everything else.
USDA economists have been documenting this shift for three decades now. According to their consolidation research, about 65% of the nation’s dairy herd now lives on operations with 1,000 cows or more—Rabobank’s analysis puts it even higher, around 67% of total U.S. milk production. Average herd size keeps climbing in almost every region, while total farm numbers decline between censuses.
Analysis of the 2022 Ag Census showed the same pattern in sharper detail: fewer dairy farms, higher total output, and production increasingly concentrated in states that favor large confinement or dry lot systems—California, Idaho, Texas, and parts of the High Plains.
Recent 2024 statistics added some granularity: about 1,434 dairies closed between 2023 and 2024, a reduction of roughly 5%, even though total U.S. milk production ticked up thanks to gains in per-cow output. Those gains are coming from exactly the things many of you have invested in—better forage quality, more consistent fresh cow management, tighter reproduction programs, and genetics that support higher butterfat performance.
Who’s Actually Leaving—and Who’s Staying
There’s a demographic story underneath these numbers that’s worth understanding. According to the USDA’s 2022 Census of Agriculture dairy highlights, 99% of dairy farm producers are white, and while dairy producers skew younger than farmers overall—averaging 51.4 years compared to 58.1 for all U.S. producers—22% are already 65 or older. That’s a significant portion of the industry approaching retirement age.
Here’s what makes this particularly challenging: the exits are heavily concentrated among older operators who lack identified successors. When you combine aging ownership with the capital intensity of modern dairy, you get a widening gap between who holds the farm titles and who actually does the daily work.
The 2024 Farmworker Justice report and National Milk Producers Federation research—going back to their 2014 labor survey and confirmed by more recent industry estimates—tell the other half of this story: more than half of all dairy labor is now performed by immigrant workers, predominantly Hispanic and Latino. Cornell University’s Richard Stup, who studies dairy labor extensively, puts the figure at 50-60% in the Northeast and Midwest, and closer to 80% in the Southwest and Western states. On large operations, especially, the workforce keeping those herds milked, fed, and managed looks very different from the families whose names are on the deeds.
These dynamics play out differently depending on the operation type as well. Large confinement dairies and dry lot systems in the West tend to have higher reliance on hired immigrant labor, while smaller grazing-based operations in the Northeast and Upper Midwest often still depend more heavily on family labor—though even many of those have shifted toward hired help for milking and feeding as family members pursue off-farm careers.
This isn’t a criticism—it’s a structural reality. What we used to call “the family farm” is increasingly becoming a “family-owned, diverse-labor-managed” operation. And that shift has real implications for how we think about equity, succession, and the long-term sustainability of dairy communities.
The Consolidation Math
From a national efficiency standpoint, these structural shifts have lowered average costs per hundredweight by spreading fixed investments—parlors, manure systems, feed centers—over more cows. From a family-business standpoint, the picture looks different. Mid-size operations in the 200 to 1,500-cow range have been exiting at significantly higher rates than very small lifestyle herds or the very largest facilities.
Attribute
Small Operations (<200 cows)
Mid-Size Operations (200-1,500 cows)
Large Operations (1,000+ cows)
Herd Size
50-200 milking cows
200-1,500 milking cows
1,000-10,000+ milking cows
Labor Model
Primarily family labor; occasional part-time help
Mixed family + hired labor—high wage pressure, management complexity
Fully professionalized hired workforce; structured HR systems
Capital Intensity
Lower fixed costs; older facilities often fully depreciated
High fixed costs with inadequate scale to spread them; deferred cap-ex common
Very high fixed costs, but spread over large volumes; access to institutional capital
Milk Marketing Leverage
Can pivot to direct sales, on-farm processing, local co-ops
Too large for niche markets; too small for volume premiums or bargaining power
In the Upper Midwest, where processing infrastructure has consolidated significantly over the past decade, this dynamic plays out in real time. When a regional cheese plant closes, or a co-op consolidates routes, the ripple effects hit mid-size operations hardest—they’re too big to pivot to direct marketing easily, but not big enough to justify dedicated hauling arrangements or negotiate volume-based premiums.
You know, I was talking with a group of extension economists recently, and one of them put it pretty well: from a national efficiency standpoint, consolidation looks neat and tidy on paper. From a family business standpoint, it often looks like the ladder is missing a few crucial rungs in the middle.
That’s worth sitting with for a moment.
Dairy’s 365-Day Biology: Why Downtime Hurts More Than It Looks on Paper
When we start talking about regulations, equipment costs, or subsidy programs, the conversation can drift into abstractions pretty quickly. Let’s bring it back to the cows for a minute, because that’s where the rubber meets the road.
Row-crop producers manage a biological asset that, once harvested, becomes inventory. Corn can sit in a bin for months without changing its metabolic state. Dairy is fundamentally different. A high-producing Holstein or Jersey in early lactation is closer to a marathon runner than a pallet of grain—her rumen pH, energy balance, and immune function can swing quickly if feed timing or quality shifts even modestly.
The research on transition periods and feeding behavior is pretty consistent on this. Even moderate disruptions in feeding time or abrupt ration changes can reduce dry matter intake, bump up subacute ruminal acidosis risk, and depress milk yields for days, particularly in fresh cow groups. Poorly timed or executed silage harvest—chopped too wet or too dry, packed insufficiently—reduces fiber digestibility and energy density. That can cost you one to several pounds of milk per cow per day for as long as you’re feeding that forage.
And inadequate manure scraping or holding capacity? That leads to longer standing times in wet alleys or stalls, which correlates with higher lameness, digital dermatitis, and elevated somatic cell counts.
Here’s what I’ve noticed in talking with producers across different regions: any disruption that delays feeding, degrades forage quality, or compromises cow comfort quickly becomes more than today’s problem. It affects the entire lactation curve and, through reproduction, the next generation of calves.
That’s as true on a 120-cow freestall in upstate New York as it is on a 3,000-cow dry lot in west Texas.
So when your feed mixer won’t start before the morning milking, it doesn’t just shuffle your chore schedule. It upsets the biology of every cow in that pen. When a chopper breakdown pushes corn silage harvest half a week later than planned, the economic cost isn’t just the repair bill—it’s tied directly to metabolism for the next twelve months.
DEF Systems: When Compliance Technology Meets the Feed Alley
This brings us to diesel exhaust fluid, or DEF. If you’ve spent any time around dairy operations or rural trucking in the last few years, you’ve probably heard the stories: tractors, TMR mixers, or milk trucks derating or shutting down because of DEF-related faults, even when the engine itself was mechanically sound.
These problems typically involve sensors, heaters, or software in the DEF system triggering power reductions or full shutdowns meant to enforce emissions compliance—but doing so at exactly the wrong moments.
In August 2025, the EPA responded to these sustained concerns. According to the agency’s official announcement, confirmed by DieselNet’s technical coverage, EPA Administrator Lee Zeldin—speaking at the Iowa State Fair—announced revised guidance requiring engine and vehicle manufacturers to update software and control strategies. The goal was to prevent many DEF failures from causing sudden power loss or stalls, especially in conditions critical to agriculture and freight.
The EPA’s own documentation acknowledges what many of us have experienced firsthand: “widespread concerns from farmers, truckers, and other diesel vehicle operators about a loss of speed and power, or engine derates.”
Looking at this development, a couple of things stand out.
The original implementation of DEF shutdown logic didn’t fully account for the continuous, time-sensitive nature of dairy operations—particularly around feeding and harvest logistics. The economic burden of those design choices has been borne primarily by producers and rural businesses, not by those who designed the regulatory framework or the equipment.
From an environmental perspective, the general scientific consensus is that tailpipe emissions from individual farm machines constitute a relatively small portion of dairy’s total greenhouse gas footprint, compared with enteric methane, manure storage, and feed production. That doesn’t mean emissions controls don’t matter. But it does suggest the highest climate return per dollar for dairy likely comes from investments in manure management—lagoon covers, digesters—along with improved feed efficiency and methane-reducing feed additives, rather than from single-point exhaust controls alone.
What’s encouraging is that some of the most forward-thinking farms are pushing on both fronts now. They’re advocating for uptime-aware emissions policy and equipment accountability, while simultaneously exploring digesters, improved covers, and ration strategies that can generate new income streams where the economics pencil out. It’s still early days for many of these technologies, but the direction is promising.
The Hidden Cost of “Cheap” Milk
Let’s talk about what happens between your bulk tank and the supermarket shelf, because this is where much of the producer frustration comes from—and it’s worth understanding the dynamics clearly.
USDA’s Economic Research Service tracks price spreads from farm to consumer, and the numbers are revealing. According to their 2024 data, the share of the retail dollar that actually reaches the farm varies dramatically by product. What jumps out from this data is the extent of variation across products. Butter returns the most to producers at 57 cents on the dollar—partly because it’s less processed and has fewer intermediary steps. Whole milk comes in around 49 cents. But once you get into cheese (32 cents) and the overall dairy basket average (just 25 cents), you’re looking at a system where three-quarters of what consumers pay goes to processing, packaging, transportation, wholesale and retail margins, and marketing.
So when you hear figures about farmers getting “30 cents on the dollar,” the reality depends a lot on what’s being measured. For fluid milk, it’s closer to half. For the processed products that dominate grocery dairy cases, it’s considerably less.
Meanwhile, consumer research tells an interesting story. A 2024 PwC Voice of the Consumer survey—and this has been widely reported—found that respondents were willing to pay about 9.7% more for products they considered genuinely sustainable, even amid inflationary pressures. Studies on dairy specifically suggest that animal welfare and local sourcing claims can raise stated willingness to pay in survey environments.
Here’s the disconnect, though. When input and compliance costs rise—energy, labor, animal care programs like the National Dairy FARM Program, new traceability requirements—processors and retailers can often pass some of those higher costs into the shelf price. Farm-gate prices, though, remain heavily anchored to commodity values for cheese, powder, and butter that respond to global supply and demand, not necessarily to local regulatory costs.
The net result? A lot of the cost of “better” milk—documented welfare practices, carbon tracking, rigorous food safety systems—gets absorbed as thinner producer margins and greater income volatility, rather than being fully and transparently reflected in retail pricing.
I was talking with a producer group in the Northeast recently, and one of them made a point that stuck with me: consumers think paying 50 cents more for a gallon is lining the farmer’s pockets. In reality, we’re often the last ones to see that extra dime.
For many family dairies, that’s exactly where the feeling comes from that they’re subsidizing cheap milk with their own balance sheets.
Subsidies, Bridge Payments, and Why the Math Still Feels Tight
When farm incomes come under pressure, federal policy typically reaches for supplemental payments. Over the past several years, we’ve seen quite a few.
The Market Facilitation Program responded to trade tensions in 2018 and 2019. Coronavirus Food Assistance Program rounds during the pandemic provided significant support to dairy producers. Dairy Margin Coverage kicks in when national milk-over-feed margins fall below elected trigger levels, and Dairy Revenue Protection offers another insurance layer.
Here’s the thing about government payments, though—and this is where context matters. According to the USDA’s Economic Research Service, direct government payments are forecast at about $40.5 billion for 2025. But that’s an exceptional year with significant emergency support programs. In 2024, government payments across all of agriculture were considerably lower—in the range of $9 to $11 billion, according to USAFacts analysis of federal farm subsidy data.
During pandemic years like 2020, payments were dramatically higher, and yes, at those peak moments, government support did represent an unusually large share of net farm income. But those were crisis-response situations, not the normal baseline.
The pattern most producers experience is that these tools are reactive and temporary by design. They kick in when margins drop below certain levels or when specific events—such as tariffs, pandemics, or droughts—trigger relief. They don’t kick in when long-term cost structures gradually drift out of alignment with average prices.
Once prices recover above a DMC trigger or an aid window closes, payments stop—even if interest, wages, insurance, and environmental compliance costs remain elevated.
Policy researchers have noted that while such subsidies can stabilize incomes in the short run, they don’t rewrite the underlying pricing rules. They can even encourage more leverage and land-cost inflation if they’re treated as permanent rather than emergency measures.
That’s part of why many mid-size dairies feel like they’re always one interest-rate move or one equipment breakdown away from serious trouble. The safety net might catch a fall, but it doesn’t rebuild the ladder’s rungs.
The Structural Squeeze: Consolidation Isn’t an Accident
Here’s an important point that sometimes gets lost: today’s dairy structure isn’t random drift. It’s the outcome of long-running economic forces that have shaped investment patterns, technology adoption, and market relationships for decades.
Larger herds tend to have lower fixed costs per hundredweight for parlors, manure systems, feed centers, and management overhead—at least up to a point. New technologies like automated milking and feeding systems, fresh cow monitoring tools, and advanced reproductive programs often deliver their best returns when spread over more cows.
As a result, the “median” efficient herd size in cost-of-production data has marched steadily upward, and many risk-management tools, co-op contracts, and lender products have been quietly built around that larger baseline. A recent Dairy Global overview noted that access to technology and capital intensity now create a sharper divide between operations able to keep reinvesting and those that struggle to maintain core infrastructure.
It’s worth stressing that large doesn’t automatically mean “bad,” and small doesn’t automatically mean “good.” I’ve visited well-run 5,000-cow dry lot operations out West that manage cow comfort, reproduction, and butterfat performance exceptionally well, with sophisticated fresh cow protocols and strong employee training programs. I’ve also seen 80-cow tie-stall herds in the Northeast that are profitable and deeply connected to local markets—and others struggling in outdated facilities with no clear successor.
The challenge many 200 to 1,200-cow family operations face is that they sit in the middle of this spectrum. They’re large enough to need hired labor, structured management protocols, and regular capital replacements. But they may not yet have the scale or bargaining leverage of the very largest units.
That’s where questions about whether the current system still works for their model become most pointed.
Early Warning Signs: Is This a Tough Patch or a Structural Problem?
This is one of the most important questions producers can ask themselves, and there’s no single metric that definitively answers it. But there are some early-warning signs worth watching—patterns that show up consistently in both the data and in conversations with lenders and advisers.
Local Exit Velocity
If your county or region is seeing dairy farm numbers fall 4 to 6 percent per year for several years running—similar to or worse than the national rate—that signals potential infrastructure risk. When too many mid-size herds disappear, processors may consolidate plants, haulers reduce routes, and local service providers struggle to justify coverage. That can increase costs and vulnerabilities for those who remain.
Bankruptcies Ticking Up Again
This one’s getting attention. According to American Farm Bureau Federation data, farm bankruptcies declined after 2019, and 2020—2023 was actually the lowest since 2008. But they’ve started climbing again. Nationwide, 216 farmsfiled Chapter 12 bankruptcy in 2024, up 55% from the previous year, according to industry coverage of the court data.
And here’s what’s concerning: the Farm Trader reported in July 2025 that 361 Chapter 12 cases were filed in just the first half of this year—already exceeding the entire 2024 total. When legal filings increase while analysts are talking about “decent” average margins, it often suggests that structural factors such as debt levels, interest costs, and local market concentration are pushing some operations into distress.
Chronic Cap-Ex Deferral
If you and neighboring farms have delayed major barn repairs, parlor upgrades, manure storage expansions, or equipment replacements for multiple years—not because the investments aren’t needed, but because cash flow simply won’t stretch—that’s a warning sign. Extension economists describe “feeding dead-weight debt” when working capital is used to service old loans rather than maintaining productive capacity. That pattern often precedes forced restructuring.
Milk Check Lagging the Headline Number
If the announced All-Milk price suggests healthy margins, but your blended check—after basis, hauling, quality adjustments, and pooling—runs consistently $1.50 to $3.00 per hundredweight lower, it’s worth asking why. Sometimes the answer involves legitimate differences in product mix or quality. Other times, it may reflect processing concentration, contract structures, or transportation arrangements worth revisiting through your co-op or buyer relationships.
Debt and Stress Moving Together
This one’s harder to quantify but may be the most important. Studies on rural mental health consistently link financial stress, high debt burdens, and a sense of powerlessness to increased depression and suicide risk among farmers. When rising debt-to-asset ratios, tight interest coverage, and burnout all show up simultaneously, that’s more than a rough patch. That’s usually when it pays to bring in a broader advisory team—lender, accountant, extension specialist, sometimes a counselor—to help clarify options.
Looking Over the Fence: What Other Systems Are Teaching Us
Producers often look north to Canada because it offers a fundamentally different model operating in real time.
Canada’s dairy sector operates under a supply-management system that combines production quotas with administered farm-gate prices based on cost-of-production formulas. The Canadian Dairy Commission regularly reviews cost data from representative farms—feed, labor, energy, capital—and recommends support prices implemented through provincial marketing boards.
According to Agriculture and Agri-Food Canada’s official dairy sector profile, there are about 9,256 dairy farms in Canada as of 2024. Dairy Farmers of Canada puts the average at roughly 105 milking cows per farm—considerably smaller than the U.S. average, but operating with much lower year-to-year price volatility at the farm level. The sector remains dominated by family operations with relatively stable debt levels and a higher rate of successful intergenerational transfers.
Canadian economists and policy analysts are also clear about the trade-offs. Consumers pay somewhat higher prices on certain products. Trade commitments constrain export opportunities. And significant capital is tied up in quotas, which new entrants must finance—creating barriers to entry that the U.S. system doesn’t.
In Europe, the 2014 to 2016 milk market crisis prompted the EU to deploy crisis reserve funds and voluntary supply-reduction schemes within the Common Agricultural Policy. Evaluations suggest these tools helped reduce some volatility but also highlighted challenges with targeting and timeliness.
None of these models can simply be transplanted into the U.S. context. But here’s what they do demonstrate: policy design—how prices are set, how supply is managed, how bargaining power is structured—has real impact on how risk and reward are shared across the chain.
That’s a useful lens to keep in mind whenever we hear that current outcomes are purely the inevitable result of “the market.”
There are signs of experimentation closer to home, too. Some U.S. cooperatives are pushing for more flexible, transparent federal milk pricing and stronger collective bargaining tools. Others are investing in value-added channels and direct-to-retail partnerships to capture a larger share of the consumer dollar for producers. Early days, but these efforts hint at ways the rules might evolve.
Succession, Identity, and the Hardest Questions on the Table
Behind all the economics and policy discussions are families deciding what comes next. This is where the numbers meet real life.
Surveys from Progressive Dairy and land-grant extension programs suggest that a majority of producers hope to pass their farms to the next generation. Yet only a minority have written, formal succession plans. Broader research on family enterprises finds that only about one in six survives as a healthy business into the third generation—and farms aren’t immune to that pattern.
The demographic data makes this more urgent. With 22% of dairy producers already 65 or older according to the 2022 Census, and with exits concentrated among operators without identified successors, the next decade will see a significant wave of transitions—planned or otherwise.
Meanwhile, cooperatives like Agri-Mark have felt compelled to include suicide hotline and counseling information on milk checks, responding to real mental-health concerns in their membership. Policy briefs and studies link financial strain, long working hours, and social isolation to elevated mental-health risks in agricultural communities.
Given that backdrop, some of the most constructive conversations families are having right now revolve around three questions:
If this operation were a startup your son or daughter was considering buying—same balance sheet, same cash flow—what would you tell them?
If you could exit or significantly scale down in the next 18 to 24 months and preserve substantially more equity than waiting until a lender forces the issue, would that change how you view your options?
What does “success” really mean for your family at this stage—owning a certain number of cows, maintaining a particular way of life, or building flexible wealth and health for the next generation?
For some families, the answers lead toward doubling down: investing in scale or specialization, engaging more actively in co-op governance and policy debates, positioning the dairy to compete under whatever rules emerge. For others, a strategic sale, a shift into specialized niches like on-farm processing or direct marketing, or even a full pivot out of milking may make more sense.
What’s encouraging is that more advisers, lenders, and producer groups are normalizing these discussions. They’re emphasizing that choosing a planned exit or transition can be a strategic business decision—not a personal failure. That shift in attitude makes it easier for families to talk openly about options before they’re forced into them.
Three Numbers to Review With Your Lender This Winter
As a practical takeaway, here are three metrics worth putting on paper before your next advisory meeting:
Debt-to-asset ratio: Where are you today, and how has that moved over the last five years? Many extension resources flag ratios above 60 percent as elevated risk territory for dairy operations.
Interest coverage: How many dollars of operating income are available to service each dollar of interest expense? Rising rates over the past couple of years have tightened this metric for many otherwise solid operations.
Cap-ex backlog: What major replacements or upgrades have you deferred—parlor, manure storage, feed center, housing—and what’s the realistic cost to bring those systems up to standard over the next five to ten years?
These numbers don’t decide your future. But they make it much easier to have honest, fact-based conversations about whether to expand, hold, restructure, or plan a managed exit.
The Bottom Line
Looking across all of this, a few grounded lessons stand out.
Dairy isn’t struggling because the biology stopped working. The cows, land, and genetics on many U.S. operations are performing at remarkably high levels. The strain comes from how pricing, policy, and bargaining power are configured around that biology.
Uptime and reliability are strategic concerns now, not just repair headaches. Tracking DEF-related and other critical downtime—including downstream effects on forage quality and fresh cow performance—gives you leverage in equipment decisions and conversations about policy reform.
Knowing your true cost of production is non-negotiable. Full-cost budgets that include family labor and realistic depreciation let you evaluate milk prices, insurance tools, and investment opportunities against your actual situation—not the “average.”
Early-warning signs are already visible in many regions. Rising bankruptcies, steady annual farm losses, chronic cap-ex deferral, and milk checks that lag headline prices all point toward structural pressure, not just bad luck.
Alternative policy designs show that different outcomes are possible. Canadian supply management, EU crisis tools, and emerging U.S. discussions around federal order reform and co-op bargaining all demonstrate that rules shape results.
And succession decisions are about people as much as they are about numbers. Honest conversations about equity, risk, mental health, and family goals matter just as much as any spreadsheet when deciding whether to grow, hold, or exit.
The goal here isn’t to say there’s one correct path for every dairy. It’s to put as much of the big picture on the table as possible—so that when you sit down with your family or your team, you’re making decisions with clear eyes and solid information.
The system around dairy will evolve. It always does. The more producers understand how it works today, the more influence they can have on what it becomes tomorrow.
For tools and resources mentioned in this article, check with your state’s land-grant university extension service. Wisconsin’s Center for Dairy Profitability offers FINPACK-based financial analysis, Penn State Extension provides dairy cost-of-production worksheets, and Cornell’s PRO-DAIRY program has succession planning guides—all available at low or no cost and adaptable to your specific operation.
KEY TAKEAWAYS
Exits are accelerating despite “better” margins. One thousand four hundred thirty-four dairies closed in 2024—a 5% drop—while analysts talked of improvement. That’s not a bad year; it’s structural pressure.
Dairy’s middle class is vanishing fastest. Operations running 200-1,500 cows are caught in the squeeze—too large for niche flexibility, too small for volume leverage.
You’re keeping less than you think. Farmers capture just 25 cents of every retail dairy dollar on average, yet absorb rising costs that never reach the milk price formula.
A demographic cliff is coming. 22% of producers are 65+, few have written succession plans, and more than half of daily labor now comes from immigrant workers, reshaping what “family farm” means.
The warning signs are flashing now. Chapter 12 bankruptcies in 2025 have already exceeded last year’s total. Three numbers to review with your lender: debt-to-asset ratio, interest coverage, and deferred cap-ex.
Complete references and supporting documentation are available upon request by contacting the editorial team at editor@thebullvine.com.
Learn More:
Your 2025 Dairy Gameplan: Three Critical Areas Separating Profit from Loss – Provides immediate tactical adjustments for forage density, transition cow spacing, and amino acid use. This guide offers actionable benchmarks to protect margins on the production floor while broader structural issues play out.
Join over 30,000 successful dairy professionals who rely on Bullvine Weekly for their competitive edge. Delivered directly to your inbox each week, our exclusive industry insights help you make smarter decisions while saving precious hours every week. Never miss critical updates on milk production trends, breakthrough technologies, and profit-boosting strategies that top producers are already implementing. Subscribe now to transform your dairy operation’s efficiency and profitability—your future success is just one click away.
USMCA gave us access to dairy markets in Canada. We’re using 42% of it. New Zealand just showed it can be fixed. The 2026 review is our window.
EXECUTIVE SUMMARY: USMCA promised U.S. dairy approximately $200 million in new annual access to Canada’s market. We’re using less than half. TRQ fill rates averaged just 42% in 2022/23, with Canada’s allocation system still favoring domestic processors—despite two dispute panels that exposed loopholes in the agreement’s original language. There’s reason for cautious optimism, though: New Zealand just pushed Canada past cosmetic adjustments through CPTPP, securing $157 million in annual export value. The 2026 USMCA review, combined with the ITC’s nonfat solids report due March 2026, gives U.S. dairy its clearest window to turn paper access into real orders. With consolidation accelerating—Wisconsin and Minnesota each lost 7.4% of their dairy farms in 2023—what happens in this review will ripple from trade policy down to your milk check. Here’s what happened, what’s possible, and what producers should watch as 2026 approaches.
You know how it goes. You’re out in the barn at 4 a.m., making sure the fresh cows are settling in, keeping an eye on that heifer that’s been off her feed. And somewhere in the back of your mind, you’re wondering what decisions being made in Ottawa or Washington might mean for next month’s milk check.
Trade deals get signed, politicians shake hands, there’s talk about “wins”—and then we wait to see if any of it actually turns into orders that need our milk.
Here’s what’s interesting about USMCA when you dig into the numbers. The University of Wisconsin Extension put out a detailed review earlier this year that adds up all the dairy tariff-rate quotas. They conclude that once everything’s fully phased in, U.S. exporters can ship up to about 3.6% of Canada’s annual dairy consumption into that market tariff-free. We’re talking milk, cream, cheese, butter, yogurt, powders—the works. Canadian trade law firms looking at the same schedules land on essentially that same number.
Now, Canada’s domestic dairy market runs around $17 billion, according to Dairy Reporter’s coverage earlier this year. So that 3.6% works out to roughly $200 million in potential new annual access for American dairy, based on Wisconsin Extension’s analysis.
And here’s the thing—total U.S. dairy exports to Canada have already climbed to an estimated $877 million in 2024, up from around $525 million back in 2021. That’s 67% growth in three years, which isn’t nothing.
But—and this is important—there’s a real difference between access on paper and orders that actually show up at the plant. That gap is where this whole story gets complicated, and honestly, where it starts to matter most for your operation.
USMCA Dairy at a Glance
Market access: 3.6% of Canada’s dairy market (~$200M in new annual access)
Total U.S. exports to Canada (2024): $877 million (up 67% since 2021)
TRQ fill rate (2022/23): Just 42% average; 9 of 14 quotas below 50%
Key date: ITC nonfat solids report due March 23, 2026
U.S. farm losses: 15,000+ dairies gone since 2017
The Spring That Changed Everything
You probably remember hearing about this, or maybe you lived through it yourself. Spring of 2017, when Canada’s policy changes stopped being something you heard about at meetings and started showing up in mailboxes.
Grassland Dairy sent letters to dozens of producers in Wisconsin and neighboring states saying their milk wouldn’t be picked up after May 1. Wisconsin Public Radio reported at the time that Grassland officially ended contracts with around 58 Wisconsin farms after giving them about a month’s notice. The Wisconsin Department of Agriculture, Trade, and Consumer Protection confirmed those numbers.
Grassland’s leadership told reporters the trigger was Canada’s new Class 7 pricing for ultra-filtered milk, which suddenly made Canadian-sourced protein ingredients cheaper and essentially squeezed out U.S. exports overnight.
What happened next showed something about our industry, though. State officials and dairy groups moved fast to line up alternatives. Dairy Farmers of America signed contracts with a significant number of the affected farms, and the Dairy Business Milk Marketing Cooperative helped coordinate other placements. By late spring, all but two of those Wisconsin herds had found new buyers—though many landed on shorter-term or trial contracts, which isn’t exactly the same as having that steady relationship you’d built over years.
I’ve spoken with producers who lived through that period, and many still describe it as a turning point. The frustration runs deep. You can do everything right in the barn—strong butterfat levels, solid fresh cow management, healthy transition periods—and then a milk pricing class in another country decides whether the truck shows up.
Stories like that are a big part of why dairy ended up so prominent in the USMCA negotiations.
What USMCA Actually Put on the Table
So what did the agreement really change?
First, Canada agreed to eliminate its Class 7 milk category—and, in some provinces, the related Class 6—and fold those volumes back into the existing pricing system. Analysis points out that this was specifically designed to prevent another situation like the ultra-filtered milk mess that had undercut U.S. exports.
Second, USMCA created new dairy tariff-rate quotas specifically for American products. Wisconsin Extension’s 2025 analysis goes line by line through the agreement and concludes that when all those TRQs are phased in over roughly six years, they add up to about 3.5–3.6% of Canada’s dairy market reserved for U.S. exporters. That covers milk, cream, cheese, butter, skim milk powder, yogurt, whey, and other products.
Now, most of us aren’t sitting around with calculators figuring out percentages of another country’s market. But here’s how I think about it: if Canada’s dairy sector runs around $17 billion domestically, and the agreement carved out roughly 3.6% for U.S. access, we’re talking about approximately $200 million a year in potential new trade value if it’s actually used. That’s real money for the processors and co-ops that handle our milk.
Canadian farmers noticed too. Dairy Farmers of Canada president Pierre Lampron called the signing of USMCA “a dark day in the history of dairy farming in Canada.” DFC’s statement said that, taken together, CETA, CPTPP, and USMCA had opened approximately 18% of Canada’s domestic dairy market to foreign competition, which they argued would destabilize supply management.
So from the U.S. side, USMCA’s dairy chapter looked like a major opportunity. From the Canadian side, it felt like one more cut into a carefully managed system. Both reactions are rooted in the same numbers—just different perspectives on what those numbers mean.
The Quota Puzzle: Access vs. Gatekeeping
Here’s where things get frustrating, and honestly, where the agreement shows its limitations.
On paper, USMCA’s dairy TRQs are pretty clear—they spell out how many tonnes of each product category can come into Canada each year at low or zero tariffs, and how those volumes grow over time. In practice, what matters just as much is who gets those quotas inside Canada.
Canada has the right to design its own TRQ allocation system, provided it complies with the agreement’s general rules. In its first go-round, Global Affairs Canada set up allocation rules that reserved a significant share of many dairy quotas for Canadian processors and “further processors.”
You can probably see where this is going. U.S. negotiators and dairy groups argued that this effectively put much of the access in the hands of companies that already had every reason to run Canadian milk through their plants, leaving less opportunity for importers, retailers, or food-service companies that actually wanted to bring in American product.
The United States requested a USMCA dispute panel. In early 2022, that panel released a report agreeing with the U.S. and Canada’s practice of reserving quota pools exclusively for processors, which conflicted with Article 3.A.2.11(b), which says countries shouldn’t limit access to allocations to processors. Hoard’s Dairyman described that panel result as an important step toward making the dairy quotas actually usable.
Canada rewrote its allocation policies. They removed the explicit processor-only set-asides and introduced “neutral” eligibility criteria based on market share and dairy trade activity. On paper, that was a shift.
In reality—and this is the part that still bothers many people—since large processors already dominate the market, they continued to receive most of the quota anyway.
The U.S. wasn’t satisfied and requested another panel in late 2022. This time, the second panel concluded that Canada’s usage of market-share calculations, while still favoring processors, didn’t technically violate the specific text of USMCA. It exposed a loophole in the original drafting of the agreement.
USTR Katherine Tai said she was “very disappointed by the findings,” and U.S. dairy organizations called the ruling a dangerous precedent.
So you end up with this real gap between a legal win and a commercial win. The first panel forced Canada to drop explicit processor-only pools, which mattered. The second panel showed that even with those pools gone, Canada can design rules that keep most of the quota in processor hands—and unless the agreement’s language is tightened, there’s not much the dispute system can do about it.
What’s the practical result? The International Dairy Foods Association reported that the average tariff fill rate was only 42% across all 2022/23 quotas, with 9 of the 14 TRQs falling below half the negotiated value. That’s a lot of access sitting unused.
The Protein Side: Export Caps and What’s Coming
Alongside TRQs into Canada, USMCA also tried to address something many of us worry about—the impact of surplus skim solids and proteins flooding world markets.
Under the agreement, Canada accepted limits on exports of skim milk powder and certain milk protein products. Reports breakdown notes that Canada agreed to cap combined exports of skim milk powder and milk protein concentrates at 55,000 tonnes in the first year and 35,000 tonnes in the second, with exports above those thresholds facing hefty charges.
For infant formula, the limits start at 13,333 tonnes in year one and rise to 40,000 tonnes in later years. The idea is to keep a supply-managed system from dumping excess solids into global markets at prices that drag down everyone’s Class IV.
In the early years after USMCA took effect, Canadian export volumes stayed under those caps—at least on paper. But Wisconsin Extension’s 2025 review points out that some processed food and blend categories containing milk solids have grown. U.S. analysts have raised questions about whether some of those flows are consistent with the spirit of USMCA’s export rules, even if they technically fit within defined product categories.
Why the ITC Report Matters
To move beyond questions and into actual evidence, USTR asked the U.S. International Trade Commission to conduct a deep dive. In May 2025, the ITC announced a new investigation into competitive conditions for nonfat milk solids covering 2020–2024. The report is due to USTR by March 23, 2026.
This is worth paying attention to. In July 2025, senior staff from the U.S. Dairy Export Council and the National Milk Producers Federation testified before the ITC, outlining how they believe foreign export policies—including Canada’s—shape global nonfat solids markets.
By the time USMCA’s formal review gets going, negotiators won’t just be leaning on anecdotes. They’ll have a thorough, independent dataset on how nonfat solids have actually moved under current rules.
What New Zealand Just Demonstrated
Sometimes, to see what’s actually possible, it helps to watch how another dairy-heavy country handled the same trading partner.
New Zealand brought a dispute under CPTPP over Canada’s dairy TRQ administration. They argued Canada’s allocation system was so restrictive that it effectively blocked much of the access promised on paper. A CPTPP panel sided with New Zealand, finding that several elements of Canada’s system breached its obligations.
At first, Canada made minimal adjustments. New Zealand officials—including Trade and Investment Minister Todd McClay—publicly said those changes didn’t go far enough and signaled they were prepared to keep pressing, including toward potential retaliatory steps.
That persistence paid off.
In July 2025, New Zealand announced it had reached a settlement with Canada. The Ministry of Foreign Affairs and Trade said Canada is committed to modify how it manages dairy TRQs, including how quota is allocated and reallocated when it goes unused. McClay stated that the agreement would deliver “up to $157 million per year in export value” for New Zealand’s dairy industry.
Cheese Reporter covered the announcement, noting that Canadian officials described the changes as “technical policy changes” that maintain the core of supply management. The modifications to Canada’s TRQ process will be published on October 1, 2025, for implementation with the 2026 calendar year quotas.
What jumps out to me in that story is the combination: clear panel rulings, solid data, and a government willing to push hard enough to get beyond cosmetic tweaks. It shows Canada can and will move further on quota administration when a trading partner builds a strong case and sticks with it.
For U.S. dairy, that’s an encouraging precedent heading into the 2026 review.
Why 2026 Is the Inflection Point
USMCA includes a formal six-year joint review. The three countries agreed to return to the table to assess how the agreement is working, where it’s falling short, and what needs updating.
That review isn’t limited to dairy—it’ll likely touch autos, labor provisions, dispute mechanisms, and supply-chain concerns tied to China.
On dairy specifically, U.S. groups have already sketched out their priorities. Looking at policy statements from the National Milk Producers Federation, U.S. Dairy Export Council, and regional organizations, a few themes keep coming up:
TRQ allocation rules that don’t effectively ring-fence most access for Canadian processors
Stronger “use-it-or-lose-it” provisions so unused quota gets reallocated in time, actually to be used
Clearer language on export disciplines so products that act like skim milk powder can’t bypass caps by shifting tariff codes
More responsive tools for resolving dairy disputes before they drag on for years
At the same time, dairy has to compete with other sectors for attention. Trade specialists note that autos and labor enforcement could dominate parts of the review.
That’s where the ITC report and farm-state congressional engagement become critical. Brownfield has reported that dairy-state lawmakers are asking for clear resolutions to cross-border disputes and signaling that they want USMCA’s renewal tied to stronger enforcement.
The Consolidation Reality Behind All This
While policy discussions play out in hearing rooms, the structure of our own industry keeps changing in ways you can see when driving from one township to the next.
USDA’s 2022 Census of Agriculture shows that U.S. farms with milk sales fell from 39,303 in 2017 to 24,082 in 2022—a loss of over 15,000 dairies in five years. Dairy Reporter’s analysis of that data, drawing on Rabobank research, notes that “almost 12,000” of those losses came from smaller operations.
Over that same period, total milk output grew, and the milking herd held near 9.4 million cows. The cows moved; they didn’t vanish.
Rabobank estimates that farms with more than 1,000 cows now produce about 67–68% of U.S. milk, up from around 60% in 2017. Reports essentially the same number. Cheese Reporter’s summary of the Rabobank work notes that the very largest operations—those with more than 2,500 cows—are a small slice of all dairies but produce close to half the milk.
In Wisconsin, the story is obvious. DATCP data shows the state lost 455 dairy farms in 2023, a 7.4% drop in licensed herds, while cow numbers and total production stayed roughly steady. That left Wisconsin with 5,895 dairies at the start of 2024.
Minnesota lost 146 dairies in the same period—also about 7.4% of its dairy farm base. Many of those exits were smaller family herds under 200 cows.
USDA’s Economic Research Service has tracked this “fewer but bigger” trend for years. Their research shows that economies of scale in feed handling, housing, and labor help explain why larger operations often have lower costs per hundredweight. Rabobank’s analysis reaches a similar conclusion and notes that newer technologies—from milking systems to data-driven management—tend to favor bigger herds that can spread the costs.
In many Midwest and Northeast communities, you can see it in the farm auction ads and the empty milk houses. In Western states, you see it in new freestall and dry-lot systems being built near export-oriented plants.
Trade policy isn’t the only driver—not by a long shot—but it’s part of the environment we’re all trying to navigate.
How It Looks from the Canadian Side
From our side of the border, Canadian supply management can look like a wall. From their side, the story has more layers.
Under supply management, Canada uses national and provincial quotas to align production with domestic demand, sets target prices through cost-of-production formulas, and relies on high over-quota tariffs—up to 300% —to limit imports, according to Dairy Reporter.
Dairy Global’s discussion of the system notes that it has historically provided more stable milk cheques than U.S. producers typically see, and it’s often credited with helping keep dairy herds across multiple provinces rather than allowing rapid regional hollowing out.
But Canadian economists have been pointing to serious weaknesses within that system.
Sylvain Charlebois, professor and director of the Agri-Food Analytics Lab at Dalhousie University, has written that Quebec now produces close to 40% of Canada’s milk even though its share of the population is just over 20%. Roughly 90% of the country’s dairy farms are concentrated in a small number of provinces.
In a column earlier this year, he warned that if current trends continue, Canada could lose nearly half of its remaining dairy farms by 2030—even with supply management—because high quota costs and structural pressures make it harder for smaller and younger producers to enter or stay in.
On the other side, Dairy Farmers of Canada and provincial organizations stress that supply management has shielded their farmers from the worst price collapses. It’s also allowed the federal government to design compensation programs tied directly to trade concessions.
Government of Canada announcements confirm that total compensation measures to dairy farmers for market access granted under CETA, CPTPP, and USMCA amount to $3.2 billion CAD—roughly $330,000 per dairy farm, according to USDA Foreign Agricultural Service analysis. DFC has argued these payments, combined with controlled borders, are essential to preserving viable dairy farms in rural communities.
As Canada heads into the 2026 review, its negotiators are trying to protect a system many producers view as vital, while also facing internal voices calling for modernization. That context matters when we think about how far they can realistically move on TRQs and export rules.
What This Means on Your Farm
From a practical standpoint, here are three things worth keeping in mind:
USMCA created real, measurable access—about 3.6% of Canada’s dairy market, worth approximately $200 million annually in new opportunities—but TRQ design has limited how fully that access gets used. Fill rates averaged just 42% in 2022/23.
U.S. dairy is consolidating fast—over 15,000 farms gone since 2017, with large herds now producing most of the milk.
Wisconsin and Minnesota’s 7.4% herd losses in 2023 show how intense the pressure remains on small and mid-size dairies, even when total production holds steady.
Smaller Herds (Under ~200 Cows)
In many Midwest and Northeast operations of this size, the daily focus is on keeping feed costs in line, managing labor, and getting fresh cows through the transition period without problems. You’re working on butterfat performance, trying to keep cows out of the hospital pen, because every health issue shows up on the milk check.
For herds this size, trade policy usually shows up as background volatility in the pay price rather than something you feel directly every week. A better-functioning USMCA can’t fix tight local basis or labor headaches, but it can help support more stable demand for cheese, powders, and butterfat—which, over time, makes planning a little easier.
It’s often helpful for operations this size to ask your buyer or co-op how much of their volume ends up in export channels, including Canada. And risk-management tools that fit your scale—such as Dairy Margin Coverage and simple forward contracts through your co-op—can help cushion the impact when global markets shift.
Mid-Size Herds (Roughly 200–800 Cows)
In Wisconsin or New York, a 400-cow freestall herd might ship somewhere around 9 million pounds of milk per year. A $0.50 per hundredweight swing in average price adds or subtracts roughly $45,000 annually; a $1.00 swing is about $90,000.
That’s the kind of money that can decide whether you move ahead with a parlor upgrade, improve transition-cow facilities, or keep nursing along older infrastructure.
Conversations I’ve had with mid-size producers across the Northeast and Upper Midwest often come back to a similar theme—they’re not big enough to ride out a bad year on volume alone, and not small enough to just tighten the belt and wait it out. A $0.75 swing per hundredweight can mean the difference between reinvesting and treading water.
For these farms, the way USMCA performs becomes a meaningful piece of the margin puzzle. Worth considering: sitting down with your lender or financial adviser and running a couple of “what if” scenarios for pay price over the next five years, especially around the 2026 review window.
And talking with your processor or co-op about how they’re currently using USMCA access and where they see Canada fitting into long-term plans.
Large Herds (800+ Cows)
In Idaho, California, the Texas Panhandle, and eastern New Mexico—large freestall and dry lot systems often ship to plants that rely heavily on exports. USDEC data and industry coverage indicate that these plants depend on markets such as Mexico, Canada, and various Asian and Middle Eastern countries to balance their solids.
Operations at this scale already treat trade policy as a central piece of their risk map, alongside water, labor, and environmental regulations.
The sentiment I hear from managers running these larger operations is that they watch USMCA the way they watch their water supply. It’s not the only thing that matters, but when it moves, it affects everything downstream.
For large herds, a stronger USMCA dairy chapter can reduce uncertainty about where incremental solids can go, encourage processors to invest in new dryers and cheese capacity that need dependable outlets, and lower the risk that policy shocks derail expansion plans.
It won’t change the need for good cow comfort or people management, but it does affect how risky that next big capital project feels.
What to Watch as 2026 Approaches
With everything else on your plate, here are three signals worth tracking—plus a few questions you can take straight to your next co-op or lender meeting.
The ITC’s Nonfat Solids Report
When the ITC releases its report, look at whether it clearly documents how foreign support and export practices—including Canada’s—are influencing nonfat solids markets.
Does it identify specific product categories that appear to be carrying milk solids in ways that don’t match USMCA’s intent? Does it quantify competitive effects on U.S. Class IV and powder markets?
The more concrete and specific it is, the more leverage U.S. negotiators will have.
Dairy-State Lawmakers’ Engagement
Brownfield and other outlets are already reporting that dairy-state legislators are asking for stronger enforcement on Canadian TRQs and export caps.
Watch for formal hearings or bipartisan letters tying USMCA’s long-term renewal to measurable improvements in dairy access.
When elected officials start using the same numbers you see in farm papers—like the 7.4% herd losses in Wisconsin and Minnesota—that’s a sign dairy is on their radar.
How Canadian Officials Frame the Review
Canadian ministers and Dairy Farmers of Canada have typically described past trade-driven dairy changes as “technical” or “administrative” adjustments while insisting supply management’s core remains untouched.
It’ll be telling to see whether they talk about the 2026 review purely as housekeeping, or whether you start hearing language about making quotas “function commercially” for trading partners—similar to the framing that emerged after the New Zealand settlement.
Questions to Ask Your Processor
To bring this closer to where your own milk truck turns in, here are three questions worth asking your plant or co-op:
How important is Canada in your current and planned export mix compared to Mexico and Asia?
Are you using USMCA dairy quotas now? If not, what would need to change—on TRQ rules or export caps—to make them worth pursuing?
If USMCA’s dairy chapter gets stronger or weaker in 2026, how would that change your investment plans over the next five to ten years?
Their answers will tell you a lot about what the review might mean for your milk check.
The Bottom Line
When you step back from all the numbers and panel rulings, the picture is reasonably clear.
USMCA did open a real, quantified slice of Canada’s dairy market—around 3.6%, worth approximately $200 million in new annual access—to U.S. exporters and forced the elimination of Class 7. Total U.S. dairy exports to Canada have grown to an estimated $877 million in 2024, up 67% from 2021. That’s genuine progress.
The first USMCA panel showed that Canada’s original processor-heavy allocation wasn’t acceptable under the agreement. The second panel showed the limits of what legal text alone can achieve when the specific wording leaves loopholes.
New Zealand’s CPTPP experience demonstrated that a combination of solid evidence, favorable rulings, and persistent follow-through can push Canada into changes with real commercial value—not just cosmetic adjustments.
At the same time, consolidation on both sides of the border is a reality, not a forecast. U.S. data show over 15,000 dairies gone since 2017, with most milk now coming from herds over 1,000 cows. Wisconsin and Minnesota’s 7.4% herd losses in 2023 are just one sharp snapshot.
In Canada, economists like Sylvain Charlebois are warning they could lose nearly half their remaining dairy farms by 2030 if nothing changes—even under supply management.
The honest takeaway is this: USMCA isn’t going to decide, all by itself, whether you milk cows next year. That still comes down to your forage program, butterfat performance, fresh cow management, your debt load, your labor situation, and the people around your kitchen table.
What this agreement can do—especially if the 2026 review delivers targeted improvements—is narrow the range of bad surprises. It can make it less likely you wake up to another shock like those Grassland letters, or find that the access that looked good in a press release never made it past the quota gatekeepers.
In a business where we’re already juggling weather, feed, labor, and regulations, having one more piece of the puzzle behave a bit more predictably is worth paying attention to.
And as many of us have seen over the years, when producers speak up—to co-ops, to farm organizations, to lawmakers—it does shape how these agreements evolve. As 2026 gets closer, it’s not a bad time to think about what you’d like this deal to do for the people who actually care for the cows, and to make sure those voices are heard.
KEY TAKEAWAYS
The Access Gap: USMCA promised U.S. dairy $200 million in new annual access to Canada. Fill rates average just 42%—more than half goes unused because of how Canada allocates quota to domestic processors
The Enforcement Limit: The first dispute panel ruled in our favor. The second exposed a loophole: Canada can design allocation rules that favor processors without technically violating USMCA’s language
New Zealand’s Playbook: Their CPTPP settlement forced Canada past cosmetic fixes, securing $157 million in annual export value. Persistent, evidence-backed pressure works
The 2026 Window: The formal USMCA review and the ITC’s nonfat solids report (due March 2026) give U.S. dairy its clearest shot at turning paper access into real orders
Your Move: Ask your processor about their Canada strategy. Run price scenarios with your lender around the 2026 timeline. Make sure dairy-state lawmakers hear from producers—not just lobbyists
Complete references and supporting documentation are available upon request by contacting the editorial team at editor@thebullvine.com.
Learn More:
Decide or Decline: 2025 and the Future of Mid-Size Dairies – Provides a survival playbook for mid-size herds facing consolidation pressure, detailing why “standing still” drains equity and contrasting the specific ROI of expansion versus efficiency-focused technology adoption.
The Wall of Milk: Making Sense of 2025’s Global Dairy Crunch – Uncovers the disconnect between record exports and lower milk checks, helping producers understand global supply dynamics to better anticipate price volatility and adjust their risk management strategies accordingly.
Join over 30,000 successful dairy professionals who rely on Bullvine Weekly for their competitive edge. Delivered directly to your inbox each week, our exclusive industry insights help you make smarter decisions while saving precious hours every week. Never miss critical updates on milk production trends, breakthrough technologies, and profit-boosting strategies that top producers are already implementing. Subscribe now to transform your dairy operation’s efficiency and profitability—your future success is just one click away.
After 13 years of scientific vindication and structural transformation, the Senate’s unanimous approval reveals important lessons about policy, persistence, and what it really takes to survive in American dairy
EXECUTIVE SUMMARY: Whole milk returns to schools after 13 years, validating what dairy farmers knew all along—but for 17,000 operations that closed during the wait, vindication came too late. The University of Toronto’s 2020 research showed that whole milk reduces childhood obesity by 40%, yet policymakers needed five more years and a new administration to act. Today’s transformed industry means only farms with 1,500+ cows can capture meaningful returns ($40,000-$80,000 annually) from school contracts, while farms with fewer than 500 cows are effectively locked out. The December 31, 2025, deadline for cooperative engagement is the last chance to participate until 2029—but many mid-size farms are finding better opportunities in value-added production, earning 30% revenue increases versus marginal school milk returns. The harsh lesson: in agricultural policy, being scientifically right matters less than being financially resilient enough to outlast institutional inertia.
You know, when I watched the celebrations after the Senate unanimously passed S.222 on November 20th—that’s the Whole Milk for Healthy Kids Act—I had mixed feelings. Don’t get me wrong, after thirteen years of being told our product was harmful to children, finally getting vindication feels good.
But I recently had coffee with a producer from central Wisconsin who put it perfectly:
“We won the battle, but the war changed while we were fighting it.”
— Wisconsin dairy farmer, November 2025
And that’s what I keep hearing as I talk with folks across the industry. This victory arrives in a fundamentally different world than the one we knew in 2012. The real question isn’t whether we were right about the science—turns out we were—but rather, what does this actually mean for operations trying to make it work today?
The Science Story: What Actually Changed Things
So let me walk you through what happened with the research, because it’s pretty revealing about how this whole system works.
The University of Toronto published this meta-analysis back in early 2020—Dr. Jonathon Maguire’s team analyzed 28 studies covering nearly 21,000 kids from seven countries. And here’s what knocked me sideways when I first read it: children drinking whole milk showed 40% lower odds of being overweight or obese compared to those drinking reduced-fat milk.
Think about that for a second. The 2010 policy that yanked whole milk from schools—we’re talking about 30 million students in the National School Lunch Program—that whole thing was built on the idea that cutting saturated fat would fight childhood obesity. The Toronto research basically said we might’ve had it backwards all along.
What’s really interesting is its consistency. Eighteen of those 28 studies pointed in the same direction. Not a single study showed that reduced-fat milk actually lowered obesity risk.
As the University of Toronto folks noted, these findings meant we needed to completely rethink our assumptions about whole milk and kids’ health.
But here’s where it gets frustrating, and I bet many of you felt this too. The 2020 Dietary Guidelines Advisory Committee had this research right in front of them—it’s in Part D, Chapter 9 of their Scientific Report if you want to look it up. They acknowledged it, called the evidence “limited” because it wasn’t from randomized controlled trials, and recommended no change to policy.
It would take five more years and a complete change in political administration before anything actually moved. That gap between having the evidence and getting the policy to shift? That’s something every agricultural sector needs to understand.
What Really Happened While We Were Waiting
The numbers tell part of the story, but they don’t tell all of it. USDA’s Census of Agriculture shows we went from about 43,000 dairy farms down to around 26,000. But let me break down what that meant in places we all know.
Wisconsin’s Department of Agriculture reported 2,740 operations closed. Pennsylvania’s Center for Dairy Excellence documented 1,570 farms gone. New York’s Department of Agriculture and Markets recorded 1,260 fewer operations.
These aren’t just statistics—these are neighbors, fellow co-op members, families we’ve known for generations.
What’s really revealing, though, is the structural shift. USDA’s Economic Research Service report from July shows that operations with over 2,500 cows actually grew from 714 to 834. Meanwhile, those mid-sized herds—the 500- to 999-cow operations that used to be the backbone of so many regions—declined by 35%. And farms running 1,000-2,499 head? Down 10%.
You know what this tells me? This isn’t just consolidation in the traditional sense. It’s a fundamental restructuring of who can even access certain markets anymore.
Component pricing arrangements, pooling structures, institutional procurement requirements—they’ve all evolved in ways that increasingly favor operations with scale and capital reserves.
Gregg Doud, President of the National Milk Producers Federation, acknowledged this reality in their press release after the Senate vote: “While we celebrate this victory, we must recognize that market access will vary significantly by operation size and regional positioning.”
He’s right. That’s the hard truth we need to face.
Three Producers, Three Different Paths
I was visiting with producers in three different states last month about exactly this. Dave from southeastern Pennsylvania, running 750 cows, told me, “We survived by diversifying early—not because we saw this coming, but because we couldn’t afford to wait around.”
Three different paths, all working. That’s what’s interesting about where we are now.
What the Whole Milk Opportunity Actually Looks Like
So here’s what industry analysts and cooperatives are projecting. If whole milk adoption in schools reaches 50%, we could see butterfat demand increase by tens of millions of pounds annually.
Schools account for roughly 8% of total fluid milk consumption through about 4.9 billion meals served each year—that’s based on USDA data—so we’re talking about meaningful volume.
But the distribution of that benefit? That’s where it gets complicated.
Based on what Federal Milk Marketing Order data and cooperative communications are suggesting, here’s how it breaks down:
Who Wins from Whole Milk’s Return?
Operation Size
Projected Annual Impact
Strategic Move
1,500+ Cows
+$40,000–$80,000
Aggressively bid 2026 RFPs; leverage volume for contracts
500–1,000 Cows
+$1,500–$3,000 (marginal)
Evaluate admin costs vs. return; focus on efficiency gains
Under 300 Cows
Low/Inaccessible
Focus on direct market/specialty; skip commodity school bids
Each operation needs their own pencil work here, but the pattern is clear: scale determines access.
The Timeline You Absolutely Need to Know
If you’re thinking about pursuing this, the window for action is pretty specific:
December 2025 is really your last shot to engage your cooperative about interest.
School districts typically release their RFPs between January and March 2026. You’ll need to get your documentation and compliance certifications together in February—and trust me, there’s a lot of paperwork.
Bids are due April through May. Awards get announced in June. New contracts start July 1, 2026.
Miss that window? You’re looking at waiting one to three years for the next cycle. That’s just how institutional procurement works.
What’s Actually Working Out There
While everybody’s been focused on the whole milk policy news, I’ve been tracking what successful operations are actually doing day to day. And the patterns are pretty instructive.
Value-Added Production: More Than Just Buzzwords
Market research shows that value-added dairy products are growing at about 12% annually, while fluid milk is pretty flat.
A2 milk is getting significant price advantages in metro markets
Artisanal products at farmers’ markets are capturing really impressive margins—USDA’s direct marketing research backs this up consistently
I visited a family operation near River Falls, Wisconsin, last month that put in bottling equipment through a USDA Value-Added Producer Grant. They’re processing about 60% of their production on-farm now, and they’re seeing revenue increases pushing 30%. Plus, they created three local jobs.
But they’ll also tell you it took two years of planning and serious capital commitment. It’s not a quick fix.
Technology: What the Early Adopters Are Finding
The data on precision management is getting clearer, and it’s worth paying attention to.
Precision feeding is demonstrating meaningful cost reductions, we’re talking tens of thousands annually for mid-sized operations. Robotic milking shows solid yield increases, though you’re looking at ROI horizons beyond seven years.
What’s interesting is how successful farms are approaching it. Mark from central Michigan told me, “We started with monitoring—low investment, quick returns. That funded our next technology step.”
That staged approach keeps showing up in the success stories.
Cooperative Innovation: Old Ideas, New Applications
Here’s something that gives me hope. Edge Dairy Farmer Cooperative’s President, Brody Stapel, recently discussed how producer groups are rediscovering collective bargaining power through the Capper-Volstead Act. This isn’t nostalgia—it’s a smart strategy.
Penn State Extension documented 12 Pennsylvania operations, each averaging 350 cows, that formed their own cheese-making cooperative. They’re getting $1.50 to $2.50 per hundredweight premiums through regional direct sales.
The whole milk opportunity plays out differently depending on where you are, and understanding your regional context really matters.
Traditional Dairy States: Infrastructure Without Volume
Wisconsin, Pennsylvania, New York—we’ve got the infrastructure and cooperative relationships to access school markets. But with way fewer farms to benefit now, the impact gets concentrated among fewer producers.
Wisconsin’s still losing hundreds of operations annually, according to their state statistics.
Bob Bosold from the Dairy Business Association frames it well: the infrastructure persists, but we’re down to half the number of farms we had when whole milk was banned. The survivors tend toward larger scale and efficiency, but there’s just fewer of them to capture the benefit.
Expansion Regions: Built for This
Texas, Idaho, and New Mexico operations? They were essentially designed for institutional contracts.
With $11 billion in processing capacity additions expected through 2026, according to industry investment tracking, these regions are optimized for high-volume, standardized production.
It’s industrial-scale dairying, and for that market segment, it works.
Specialty Markets: A Different Game Entirely
Vermont, Northern California, pockets of the Northeast—they’ve largely exited commodity competition. And honestly? Market research suggests organic dairy could exceed $30 billion by 2030.
For these regions, that represents a way better opportunity than school contracts.
Vermont’s Agency of Agriculture finds that about 75% of remaining farms now do value-added or direct marketing, up from 31% in 2012.
That’s not retreat—that’s strategic repositioning, and it’s working for them.
Understanding How Policy Actually Works
The whole-milk experience taught me something important about how agricultural policy really works. Scientific evidence alone—even compelling evidence like the Toronto study—doesn’t automatically drive policy change.
That permission, not just the science, enabled the change.
NMPF had been citing the Toronto research since 2020, submitted formal comments, provided testimony—and followed all the proper channels. But as they noted in their testimony, they kept encountering “institutional commitment to existing guidance despite evolving science.”
The 2020 Dietary Guidelines Committee acknowledged potential benefits of higher-fat dairy for children but stuck with existing recommendations, saying the studies were observational rather than randomized controlled trials.
That’s institutional inertia in action—not conspiracy, just systematic resistance to change.
What This Means for Different Operations
Based on what I’m hearing from producers and seeing in market dynamics, here’s how I’d think about it:
Large operations (1,500-plus cows): You should probably evaluate school contracts pretty aggressively during that 2026 procurement window. The potential return likely justifies the effort.
And use that baseline volume to leverage value-added investments. But get talking to your cooperative now, not in March.
Mid-size operations (500 to 1,000 cows): You’ve got a more complex calculation. Those modest school premiums might not justify the administrative headaches.
University economics research keeps showing that value-added production, marketing alliances, or specialty certification offer better risk-adjusted returns for operations of your size.
Smaller operations (under 500 cows): Institutional markets are probably structurally out of reach, and that’s okay.
Here’s what the whole milk saga really reveals about agricultural policy:
Institutional frameworks resist change even when faced with strong contrary evidence
Individual operations can’t survive indefinitely waiting for policy-market misalignment to fix itself
Industry organizations face real constraints limiting how hard they can push
Political context matters just as much as scientific evidence
“The 17,000 farms that closed weren’t wrong about the science. They just couldn’t survive the wait.”
That’s the sobering part.
Looking Ahead: What Success Looks Like Now
Industry forecasts from major agricultural lenders suggest continued consolidation toward something like 15,000 total U.S. dairy farms by 2030.
The industry’s brutal restructuring: Total farms plunged 60% from 43,000 to 26,000 while mega-dairies with 2,500+ cows surged 67%—a tale of two industries in one policy shift
Within that reality, though, success patterns are emerging from USDA and extension data:
Operations with multiple revenue streams show way better five-year survival rates
Direct market relationships command premium pricing
Innovative cooperative structures are creating market access for mid-sized producers who work together
What’s encouraging is that these strategies were working before the whole milk policy changed. The policy shift provides favorable conditions, not a fundamental transformation.
The Bottom Line
Whole milk’s return validates what many of us have understood intuitively about nutrition and what kids actually want to drink. That vindication deserves recognition, and I’m genuinely glad we got here.
But the thirteen-year wait extracted enormous cost from our industry. The farms that made it through built resilient businesses that didn’t depend on policy alignment finally happening.
So yeah, pursue whole milk opportunities if you’re positioned for it. But build your operation assuming policy corrections might take another decade—or might never come at all.
That’s not pessimism. That’s just strategic realism based on what we’ve all watched unfold.
The industry emerging from this period will be different—more concentrated, more specialized, more technology-enabled. Whether that’s good or bad depends on your perspective and where you sit.
What’s certain is that adaptability, not policy dependence, determines who’s still farming five years from now.
This moment offers real opportunity for those positioned to capture it, validation for those who stuck it out, and lessons for all of us about how science, policy, and agricultural economics actually interact.
How we apply those lessons will shape what American dairy looks like going forward.
Your Next Steps
If You’re Considering School Milk Contracts:
Contact your cooperative before December 31, 2025
Request procurement specifications and compliance requirements
Evaluate administrative capacity against projected returns
For Value-Added Exploration:
USDA Value-Added Producer Grant program: rd.usda.gov/vapg
Your state dairy association for regional guidance
Extension dairy specialists for business planning
For Technology Investment Planning:
University extension technology adoption studies
Your equipment dealer’s ROI calculators
Peer producers who’ve implemented similar systems
For Cooperative Innovation:
Capper-Volstead Act resources through the USDA
State extension cooperative development programs
Regional producer alliance case studies
General Resources:
National Milk Producers Federation: nmpf.org
International Dairy Foods Association: idfa.org
Your state dairy association
Local extension dairy specialist
Based on legislative records, USDA data, industry reports, and conversations with producers through November 2025. For operation-specific guidance, talk with your advisors who know your situation.
KEY TAKEAWAYS
December 31, 2025, Deadline: Contact your cooperative now for 2026 school contracts, or wait 3 years
Scale Determines Success: 1,500+ cow operations gain $40-80K/year; farms under 300 cows are locked out
Science Was Always Right: Whole milk reduces childhood obesity 40%—but 17,000 farms closed waiting for policy to catch up
Better Options Exist: Mid-size farms seeing 30% revenue gains from value-added production vs. marginal school milk returns
Adapt or Wait: Surviving farms built businesses that don’t depend on policy victories
Complete references and supporting documentation are available upon request by contacting the editorial team at editor@thebullvine.com.
Learn More:
The Rules Changed and Nobody Told You: Three Paths Left for the 300-Cow Dairy – Strategic Analysis:Reveals the specific economic thresholds for survival in the current market, providing a candid financial breakdown of the three viable business models (Scale, Pivot, or Exit) available to operations under 500 cows.
The Robot Truth: 86% Satisfaction, 28% Profitability – Who’s Really Winning? – Investment Reality: exposes the critical gap between producer satisfaction and actual financial return on robotic milking systems, providing a data-driven checklist to ensure your automation investment delivers actual ROI, not just lifestyle benefits.
Join the Revolution!
Join over 30,000 successful dairy professionals who rely on Bullvine Weekly for their competitive edge. Delivered directly to your inbox each week, our exclusive industry insights help you make smarter decisions while saving precious hours every week. Never miss critical updates on milk production trends, breakthrough technologies, and profit-boosting strategies that top producers are already implementing. Subscribe now to transform your dairy operation’s efficiency and profitability—your future success is just one click away.
Fairlife sells for $6. You get paid like it’s a store brand. Meanwhile, direct-market dairies are getting $48/cwt. See the gap?
EXECUTIVE SUMMARY: At $21.60/cwt, milk prices are crushing farm profits—your typical 500-cow dairy loses $125,000 this year while processors capture $38/cwt through hedging and consumers pay record retail prices. This isn’t a downturn; it’s the industry’s fundamental restructuring. By 2030, America’s 35,000 dairy farms will shrink to 24,000, with survivors clustering into three models: mega-operations leveraging scale, niche producers earning $48/cwt through direct sales, or multi-family partnerships pooling resources. The traditional 600-cow family farm is mathematically obsolete, running $250,000 in the red each year. Smart operators are already moving—diversifying revenue through beef-on-dairy, optimizing components for Class III premiums, or restructuring operations entirely. You have 18 months to choose your model before market consolidation chooses for you. The farms that thrive in 2030 won’t be those that survived 2025—they’ll be those that transformed during it.
You know, when I saw USDA’s latest forecast showing milk prices heading down to $21.60 per hundredweight, my first thought was about what this actually means for folks like us. For most 500-cow operations—and that’s a lot of farms I work with—we’re talking about roughly $125,000 in lost annual revenue. That’s not exactly small change when you’re already running things pretty tight.
Here’s what’s interesting, though. I’ve been looking at the Bureau of Labor Statistics data, and retail dairy prices? They’re still near record highs. And get this—fluid milk consumption actually grew in 2024 for the first time in 15 years. USDA’s own sales reports are showing this. The International Dairy Federation keeps saying global demand is climbing steadily.
So what’s going on here? Why are we getting squeezed when everything else suggests we should be doing better?
I’ve been talking with producers from Wisconsin to California lately, and what I’m hearing goes way deeper than typical market-cycle complaints. It’s this disconnect between what we’re getting at the farm gate and what consumers are paying at the store. And here’s the thing—even with the tightest heifer supplies in two decades, prices aren’t responding like they used to. What’s really fascinating is we’re seeing three distinct operational models emerging that’ll probably determine who’s still milking cows come 2030.
If you’re paying attention—and I know you are—the next year and a half represents what I’d call a critical decision window. The choices you make now? They’re going to determine whether you’re thriving or just hanging on when this industry looks completely different five years from now.
Let’s Talk About What’s Really Happening with Prices
So back in March, when CME Group reported Class III milk futures dropping to .75 per hundredweight, most of us expected the usual pattern, right? Supply tightens up, prices recover, and we all catch our breath. But that’s not what’s playing out, and honestly, it’s revealing something pretty concerning about how these markets work now.
Peter Vitaliano over at the National Milk Producers Federation articulated something that really resonates—the gap between farmgate and retail has never been this wide. We’re looking at USDA data showing farmers getting .60 per hundredweight while consumers are paying over a gallon for whole milk and around a pound for cheddar. These are historically high retail prices, folks.
What I find particularly noteworthy is how processors have positioned themselves. Take these massive new facilities—Leprino Foods with its 8-million-pound-per-day capacity plant, and Coca-Cola’s new fairlife facility up in New York. The International Dairy Foods Association has been tracking, it says, over $2 billion in infrastructure investments since 2020. These plants need milk volume a consistent milk supply to justify those investments. And that’s creating some… well, let’s call them interesting market dynamics.
Mark Stephenson from Wisconsin’s Center for Dairy Profitability shared something with me that really clicked. Processors are using futures contracts to lock in their margins months ahead, while we’re getting prices based on last month’s averages. That timing difference? It’s worth about three dollars per hundredweight in a protected margin for them. Three dollars!
A producer I know well out in California’s Central Valley—runs about 650 Holsteins—put it to me this way: “They’ve hedged their position months in advance. We’re operating with completely different risk exposure.” And you know what? He’s absolutely right.
[INSERT IMAGE: Graph showing the widening gap between farmgate prices and retail dairy prices from 2020-2025, with processor margins highlighted]
That Heifer Shortage Everyone’s Banking On
Now, conventional wisdom says—and I’ll admit, I believed this too—that this replacement heifer shortage should fix everything. CoBank’s August report shows we’re at a 20-year low, down to about 3.9 million head. You’d think that means better prices by late next year, maybe 2026?
Well… not so fast.
What we’re learning about beef-on-dairy breeding is fundamentally changing the game. The breeding association data shows that about a third of our Holstein and Jersey calves are now beef crosses. Think about what that means for a minute.
Replacement heifer prices have exploded—USDA’s tracking them at over three thousand per head, up 75% since early 2023. And if you’re looking for premium genetics? I’ve seen them go for thirty-five hundred, even four thousand at regional auctions. Down in Georgia and Florida, some producers are paying even more for heat-tolerant genetics. CoBank’s projecting we’ll be short another 800,000 replacements by 2026.
Yet—and here’s the kicker—this dramatic supply constraint isn’t translating to better milk prices. Why? It’s the processing overcapacity. Andrew Novakovic from Cornell’s Dyson School explained it to me this way: when processors have billions invested in facilities that require high volume, they have incentives to keep farmgate prices stable to ensure consistent throughput. It sounds backwards, but that’s the reality we’re dealing with.
The Darigold situation out in the Pacific Northwest really drives this home. Despite obvious milk supply tightness, they announced a $4-per-hundredweight deduction on all member farms back in May. A producer out there—runs about 3,000 cows—spoke at a meeting about it and didn’t mince words: “When milk price is down and you add these deducts, it really starts to sting.”
Why Growing Demand Isn’t Helping Us (This One Really Gets Me)
Here’s what caught me completely off guard when I first saw the International Dairy Foods Association data. Fluid milk sales grew about half a percent in 2024—first increase in 15 years! USDA’s marketing service confirms whole milk consumption hit its highest level since 2007. The Organic Trade Association reports that organic milk sales jumped by over 7%. And premium products? IRI’s retail data from 2024 shows brands like fairlife grew nearly 30% in dollar sales compared to the year before.
You’d think this demand recovery would support our prices, right? Instead—and this is what’s so frustrating—it’s doing the opposite. The growth is all concentrated in premium products where processors and retailers, not farmers, capture that value.
Let me break this down in real numbers—here’s The Value Disconnect:
Level
Price
Who Gets It
Farm Gate
$21.60/cwt
Farmers (commodity price)
Conventional Retail
~$40.00/cwt equivalent
Retailers (standard markup)
Premium Retail (fairlife)
~$60.00/cwt equivalent
Processors & retailers
The Gap
$38.40/cwt
Captured via hedging & branding
Marin Bozic, who does dairy economics at the University of Minnesota, explained the mechanism to me: the Federal Milk Marketing Order structure simply has no way for farmers to participate in the creation of premium product value. Your milk could become commodity cheese or the fanciest filtered milk on the shelf—you get the same basic commodity price either way.
The Three Futures: Why the Traditional 500-Cow Family Farm is Mathematically Obsolete (And What to Become Instead)
Research from Cameron Thraen’s team at Ohio State, which analyzed USDA’s agricultural census data and published its findings in the 2024 dairy outlook report, reveals something both fascinating and, honestly, a bit scary. They’re projecting that consolidation will reduce the number of dairy farms from about 35,000 today to 24,000 to 28,000 by 2030. And the production? It’s going to concentrate into three pretty distinct models.
If you’re running a traditional 500-to-700-cow family operation like many of us, the mathematics suggest you need to evolve into one of these structures, or… well, face some really tough decisions.
[INSERT IMAGE: Infographic showing the three operational models with icons – Mega-Operation (factory icon), Niche Producer (farmers market icon), Multi-Family Partnership (handshake icon) – with their respective herd sizes, investment requirements, and profit projections]
The Large-Scale Operations (3,500+ Cows)
We’ve got about 900 of these operations now, controlling roughly 20% of production. Wisconsin’s Program on Agricultural Technology Studies published their structural change analysis in 2024, suggesting this’ll grow to maybe 1,500 or 2,000 operations controlling 35-40% of all milk by 2030.
What makes them work? Well, Cornell’s annual Dairy Farm Business Summary shows they’re hitting costs of around 14 to 16 dollars per hundredweight through massive scale. They negotiate directly with processors—not as suppliers but as genuine business partners. They’re getting 50 cents to $1.50 per hundredweight just on volume guarantees. Investment required? We’re talking eight to fifteen million, according to the ag lenders I’ve talked with.
As one industry analyst put it, “A 5,000-cow operation with consistent component quality has real negotiating leverage.” And that’s the key word there: leverage.
The Niche Direct-Marketing Operations (100-400 Cows)
There are maybe 4,000 to 5,000 of these operations now, and interestingly, the National Young Farmers Coalition’s 2024 land access survey suggests this could grow to around 6,500 by 2030, particularly as beginning farmers explore alternative market channels.
I spoke with a producer in Vermont recently who made this transition—went from conventional to organic with direct marketing. She’s getting around $48 per hundredweight equivalent through farmers’ markets and on-farm sales. “It’s definitely more work,” she told me, “but we’re actually profitable now.”
A Texas producer I know took a different approach—focusing on A2 genetics and local Hispanic market preferences. He’s capturing premiums I wouldn’t have thought possible five years ago.
What works for these folks:
Premium pricing in that $35-to-50 range through direct sales
Organic, grass-fed, A2 genetics, local food positioning
On-farm processing so they capture those processor margins themselves
Investment needs are different—three to seven million, but it’s focused on brand building and market access, not just production
The Multi-Family Partnerships (2,000-3,500 Cows Total)
This is the emerging model that’s really interesting. We’re seeing maybe a few hundred of these now, but projections suggest over a thousand by decade’s end.
Mike Hutjens, who recently retired from the University of Illinois after decades of dairy research, described it well in his recent Extension publication on consolidation strategies: “Three families combining resources, each contributing 600-700 cows, sharing facilities and management. They’re achieving near-mega-operation efficiency while maintaining family control.” Based on operations he’s worked with, each family can see $200,000 to $300,000 annually.
Here’s the hard truth nobody really wants to hear: Cornell’s Pro-Dairy program’s 2024 cost of production analysis suggests that traditional 600-cow single-family operations face an approximately quarter-million-dollar annual profit gap compared to these three models. Without evolving into one of these structures… well, the math becomes pretty challenging.
What Successful Producers Are Actually Doing Right Now
What distinguishes farms positioned to thrive from those heading toward crisis? It’s not hope for market recovery—it’s specific actions during the downturn. I’ve been watching successful operations across the Midwest, and there are definitely patterns.
Moving Beyond the Milk Check
The smartest producers I know have completely abandoned the old assumption that milk sales should be 85-90% of revenue. A Wisconsin producer I work with is breeding 30% of his herd with beef semen. At current beef prices—around $250 per calf—that’s significant money. Plus, he’s not overwhelming his heifer facilities.
Strategic culling at these cull cow prices—USDA’s reporting over $145 per hundredweight—is generating serious cash. An Idaho producer told me she culled 15% strategically, generated substantial one-time revenue while cutting feed costs permanently by about 16%.
And value-added production? Penn State Extension’s 2023 bulletin on dairy value-added enterprises shows that even converting 5% of your milk to yogurt, cheese, or specialty products can generate margins two and a half to three times higher than commodity milk. Their case studies are pretty compelling, actually.
It’s About Efficiency, Not Just Volume
What I’m seeing is successful operations focusing on feed efficiency over just pushing for more milk. Kent Weigel at Wisconsin-Madison has data showing feed efficiency genetics have a heritability of around 0.43—meaning those improvements compound fast.
The approach is getting pretty sophisticated:
Genomic testing to identify and cull the bottom 20% for feed efficiency before they even enter the milking string
Switching to bulls with high Feed Saved indexes—costs nothing, impacts everything
Getting that metabolizable protein dialed in at 100-115% of requirements saves fifty to seventy-five dollars per cow annually, according to University of Minnesota research
For a 500-cow operation? These strategies might cost ten to fifteen thousand dollars to implement, but can return ten times that annually. And it compounds year after year. Scale it down to 250 cows, and you’re looking at maybe a $50,000 return on a $5,000-7,500 investment. Scale up to 1,000 cows? We’re talking $200,000-280,000 annually.
Components and Geography Matter More Than Ever
Here’s something worth noting: USDA’s November projections show Class III prices around $18.82, while Class IV falls to maybe 15 or 16 per hundredweight in 2026. That three-to-four-dollar spread? It rewards specific decisions.
A Minnesota producer told me about switching to Jersey-Holstein crosses three years back. “Our butterfat runs 4.3% now versus 3.7% before. That’s worth about seventy cents per hundredweight. Doesn’t sound like much until you’re shipping 50,000 pounds daily.”
What Canada’s System Reveals (It’s Not What You Think)
Looking north offers an interesting contrast. While we’re facing this dollar-per-hundredweight drop, the Canadian Dairy Commission’s February announcement showed essentially minimal change—less than a tenth of a percent adjustment.
Their stability comes from a formula: prices adjust by half to production costs and half to the consumer price index. As Sylvain Charlebois from Dalhousie University’s Agri-Food Analytics Lab explained, “Canadian farmers know their milk price nine months ahead.” Imagine being able to plan that far out!
But—and this is important—there are trade-offs. Dairy Farmers of Canada reports quota costs around $24,000 per kilogram of butterfat. That’s a massive entry barrier. A 2024 study in the Agricultural Systems journal documented approximately 6.8 billion liters of milk waste from 2012-2021 in the Canadian system. And the Fraser Institute calculates Canadian families pay nearly $300 more annually for dairy.
What’s really revealing? Statistics Canada’s agricultural projections suggest they’ll still lose about half their dairy farms by 2030, bringing the total to around 5,000. So even with all that protection, consolidation is happening. It’s fundamental economics that transcends whatever system you use.
The 2025-2027 Window: Why Timing Is Everything
What I’m seeing suggests 2025 is where three forces converge for the first time:
First, we’ve got this processing capacity overhang from billions of new facilities coming online. Industry tracking shows it’s massive. Second, the International Dairy Federation projects global consumption growing faster than production—about 1.1% versus 0.8%. And third, producer exits are accelerating. The American Farm Bureau reports Chapter 12 bankruptcies up over 50% year-over-year.
This creates what I’d call an 18-to-24-month window for strategic positioning. Christopher Wolf, who heads Cornell’s dairy markets and policy program, suggests once global supply scarcity becomes obvious and prices start recovering—probably 2027—consolidators will move aggressively. Acquisition costs will spike. Windows close.
So What Should You Actually Do? (The Practical Stuff)
Understanding all this, here’s what I’m seeing work:
If You’re Planning to Continue:
Focus on efficiency over growth. A Pennsylvania producer told me, “We’ve stopped all expansion. Every dollar goes to efficiency improvements and component optimization. That dollar-fifty from better components beats any volume premium.”
Lock in what you can. USDA’s Dairy Forward Pricing Program, reauthorized through April 2025, lets you contract ahead when futures look reasonable. Creating revenue floors has saved several operations I know.
Build those alternative revenue streams now. Beef-on-dairy, strategic culling, value-added—these can offset entire milk price declines.
If You’re Considering Structural Change:
The partnership conversation needs to happen now. An Ohio producer who merged three family operations told me they spent eight months finding the right partners. “Wait until the crisis? Your best options are already gone.”
Thinking about the niche route? Start small, but start now. That Vermont producer I mentioned began with just 5% of its output going to farmers’ markets. It took three years to transition fully, but she learned as she grew.
Geographic disadvantages are real. USDA data shows consistent one-to two-dollar regional differences. If you’re in a disadvantaged area, seriously consider your options.
For Everyone:
Accept that mid-size independence might require significant adaptation. As one Cornell economist put it, “That’s not defeat—it’s realistic evolution in a consolidating industry.”
Focus on what you control: genetics, efficiency, component quality, and marketing channels. An Idaho producer said it best: “The market does what it does. I can’t control that. But I absolutely control my cost per hundredweight.”
For those who want to dig deeper, information on the USDA’s Dairy Forward Pricing Program is available at your local FSA office. Cornell’s Pro-Dairy program has excellent resources on cost analysis. And if you’re considering the partnership route, the University of Wisconsin’s Center for Dairy Profitability has some solid guidance materials.
The Bottom Line (Where This All Leads)
The 2025 milk price situation isn’t really about traditional supply and demand—it’s a structural transformation that’s been building for decades. That $21.60 forecast from the USDA? It’s looking more like a new reality where processor margin management matters more than the old market dynamics we learned.
Yet within this challenging environment, I’m seeing clear paths forward for producers willing to abandon old assumptions. The farms thriving in 2030 won’t be those that simply survived 2025 through sheer determination. They’ll be operations that recognized this inflection point and repositioned, while others that waited for the recovery that follows will follow completely different rules.
You’ve got maybe 18 to 24 months for deliberate transformation. After that, market forces make the choices for you. The question isn’t whether to change—it’s which of these emerging models fits your operation’s future. That decision, made with clear eyes rather than false hope, determines success or failure.
What’s interesting is every producer I know who’s made these strategic pivots says the same thing: “Should’ve done it sooner.” Maybe that’s the real lesson. The best time to transform isn’t when crisis forces your hand—it’s right now, while you still have options.
And honestly? That’s both scary and oddly encouraging. At least we know what we’re dealing with. Now it’s time to act on it.
KEY TAKEAWAYS:
The $38/cwt gap is permanent: Processors locked in margins through futures—your $21.60 milk price won’t recover, costing typical 500-cow dairies $125,000 annually
Pick your path in 18 months: Mega-operation (3,500+ cows), direct-marketing ($48/cwt premiums), or multi-family partnership—traditional single-family 600-cow farms face mathematical elimination
Diversify revenue TODAY: Leaders generate $45,000+ from beef-on-dairy (30% of herd), 3x margins on value-added products, and $0.70/cwt from component optimization
10:1 returns exist: Genomic feed efficiency selection costs $15,000, returns $150,000 annually—compound these gains before the 2027 consolidation wave
Complete references and supporting documentation are available upon request by contacting the editorial team at editor@thebullvine.com.
Join over 30,000 successful dairy professionals who rely on Bullvine Weekly for their competitive edge. Delivered directly to your inbox each week, our exclusive industry insights help you make smarter decisions while saving precious hours every week. Never miss critical updates on milk production trends, breakthrough technologies, and profit-boosting strategies that top producers are already implementing. Subscribe now to transform your dairy operation’s efficiency and profitability—your future success is just one click away.
Seven dairy farms disappear. Every. Single. Day. If you’re under 500 cows, you have 18 months to choose: Scale, pivot, or exit.
EXECUTIVE SUMMARY: The dairy industry is experiencing a seismic shift: 7 farms disappear daily as we consolidate from today’s 24,500 operations toward just 8,000-12,000 by 2035, with 400 mega-farms controlling 75% of production. The $11 billion in new processing investment tells the real story—it’s pre-contracted to 5,000+ cow operations, leaving 300-cow dairies facing three brutal choices: invest $3-5 million to scale up, spend $600,000-1.2 million transitioning to premium markets, or exit now for $700,000-1.1 million before equity evaporates. Your cooperative has become your competitor, with DFA controlling 30% of US milk while operating processing plants that profit from keeping your milk prices low. The economics are undeniable: farms with over 1,000 cows achieve 20-25% lower costs, creating an unbridgeable competitive gap for mid-sized operations. Agricultural lenders confirm you have 18 months—credit is tightening, and consolidators’ appetite for acquisitions peaks in 2025-2026. The bottom line is stark: standing still guarantees slow financial death, making no decision the worst decision of all.
You know, I was having a chat with a third-generation Wisconsin dairy farmer last week—runs about 280 cows, really solid butterfat performance, knows his genetics inside and out. He said something that’s been rattling around in my head ever since:
“I feel like I’m playing a game where the rules changed, but nobody sent me the new rulebook.”
He hit the nail on the head. This isn’t just another rough patch we’re working through; the whole game is structured differently now. What I’ve found in USDA Economic Research Service modeling is that we could see mega-operations producing somewhere between 70 and 75 percent of America’s milk by 2035. We’re talking about going from roughly 24,500 dairy farms today—that January NASS count was eye-opening—down to maybe 8,000 to 12,000 operations in about a decade.
Here’s what’s really striking: the International Dairy Foods Association documented something like $11 billion in processing investments announced between 2024 and 2028. That’s not your typical expansion—that’s the industry rebuilding itself from the ground up.
For those of you managing 300-cow operations—and I talk to so many of you at meetings—understanding what’s happening isn’t about being negative. It’s about seeing clearly where opportunities still exist.
Farm consolidation accelerates: The US lost 63% of dairy operations since 2003 while boosting production 41%, with projections showing only 10,000 farms by 2035—down from today’s 26,000
When Your Cooperative Became Something Else
What’s fascinating—and honestly, a bit troubling—is how organizations like Dairy Farmers of America have evolved from their original marketing cooperative model into vertically integrated processors. This completely changes how milk moves from your tank to the market.
Consider this: DFA now controls nearly 30 percent of US milk production according to their annual reports, while operating dozens of processing facilities across North America. Let’s call it what it is: a conflict of interest. When your co-op becomes a processor, their profit margin depends on keeping input costs low. Your milk is the input. Do the math.
I was talking to a producer from upstate New York—does beautiful rotational grazing, really innovative guy—and he put it perfectly:
“After 22 years shipping to the same cooperative, the relationship feels fundamentally different. The negotiating dynamics have shifted in ways that are hard to articulate but impossible to ignore.”
The data backs up what he’s feeling. We’re seeing more and more member milk processed in cooperative-owned facilities, a huge shift from the traditional marketing model. And here’s something that should make everyone pause: federal court records show settlements totaling nearly $200 million since 2013, with the 2016 Northeast case alone hitting $158.6 million. These aren’t just theoretical tensions we’re talking about.
Where That $11 Billion Is Really Going
Everyone’s celebrating this $11 billion in processing investment. But let’s look closer at where that money’s actually flowing. IDFA’s October report details what they’re calling the largest dairy infrastructure investment in American history, and the geographic pattern tells you everything.
Chobani announced back in April that it’s building a $1.2 billion facility in Rome, New York. They’ve got another $450 million expansion going in Twin Falls, Idaho. Leprino Foods continues to expand in Texas, especially around Lubbock. These locations aren’t random—they’re following the consolidation that’s already happening.
Investment follows scale: Of $11B in new processing capacity, 70-78% is pre-contracted to mega-dairies before construction begins, leaving mid-sized operations competing for processing access in an oversupplied market
What industry analysts from Rabobank and CoBank have been telling us is that processors are increasingly locking up supply agreements with large-scale operations before they even break ground. They don’t publish exact percentages, but the pattern is crystal clear.
A Texas producer with 450 cows shared his experience trying to get into one of these new plants:
“The terms required a 10-year commitment for our entire production at annually-set prices. The minimum volume guarantee was 15 million pounds—more than double what we produce.”
These facilities… they’re not being built for folks like him. They’re designed for operations running 5,000 to 25,000 cows.
But here’s what gives me hope—in Pennsylvania’s Lancaster County, where you’ve still got lots of 100 to 300 cow operations, producers are finding creative solutions. A group of about 31 Amish and Mennonite farmers formed their own micro-cooperative last year, partnering with a local artisan cheese maker.
“We couldn’t compete on volume, but our grass-fed milk and traditional practices commanded premium prices in Philadelphia markets.”
Getting Out with Your Shirt On
NASS quarterly reports show we’re losing approximately 2,700 to 2,800 farms annually. That’s up from maybe 500 to 900 per year back in the early 2000s. Between 2017 and 2022 alone—and these census numbers are sobering—we lost 15,221 operations. Nearly a 38 percent decline in just five years.
The Center for Dairy Profitability at UW-Madison has been digging into these patterns, and its data show that operations with more than 1,000 cows achieve production costs roughly 20 to 25 percent lower than those of 500-cow farms. It’s basic economies of scale—same thing that reshaped retail, same thing that’s hitting us now.
Dr. Mark Stephenson from Wisconsin’s dairy markets program explained it to me this way: reaching competitive scale today requires approximately to 5 million in capital investment. For most mid-sized operations, accessing that capital while managing existing debt… well, you know how that math works out.
Economic modeling suggests we’ll stabilize somewhere between 8,000 and 12,000 operations by 2035. That’s a fundamental restructuring of the American dairy industry.
Three Paths Forward—What’s Actually Working
After talking to dozens of producers this past year, I’ve seen three main strategies emerge for operations in the 200- to 500-cow range. Each has its own opportunities and challenges.
Time destroys options: Delaying decisions costs $650,000 in equity over 13 months—from $850K in May 2026 to $200K by June 2027—as lenders tighten credit and consolidators lose interest
Scaling to Competitive Size
An Idaho producer who expanded from 800 to 3,600 cows over two years shared some hard truths:
“At 800 cows, even with good management, we were losing $200,000 annually at prevailing milk prices. At 3,600, with updated parlor technology and improved feed efficiency, we’re profitable at those same prices. The fixed cost distribution makes all the difference.”
Here’s the reality of scale: You can’t just add cows; you have to add robots and data. USDA farm technology surveys show that robotic milking systems are now on nearly 3 percent of US dairy operations, yet those operations account for over 8 percent of national milk production. It’s mostly these scaling operations where labor efficiency becomes critical.
Based on what lenders are telling us and actual producer experiences, this pathway typically requires:
$3 to 5 million in capital for facilities, equipment, and genetics
At least 40 percent equity position for financing approval
Being close to processing—hauling costs will eat you alive beyond 100 miles
Committing to 15, maybe 20 years to recoup that investment
The success stories tend to be producers under 55 with strong equity and minimal debt. And timing? Critical. Expansions during favorable price cycles work. During downturns? Different story.
Premium Market Transition
An Alberta producer who transitioned her family’s 320-cow operation to organic five years ago offers another perspective:
“We experienced approximately 30 percent improvement in net farm income despite lower production volumes. The combination of reduced veterinary expenses, premium pricing, and eventually lower input costs created a sustainable model.”
Producers making this transition work report:
Transition costs of $600,000 to maybe $1.2 million
You need to be within about 50 miles of a metro market for direct sales
Need 3 to 5 years of capital reserves during transition
Marketing becomes just as important as production
“Those first two years nearly broke us. Year three reached break-even. Years four and five delivered the returns that justified the transition.”
“The Research Triangle market—all those tech workers and university folks—they understand the value proposition. In our local market, we’re getting significantly more per hundredweight than commodity, and our production costs actually decreased once we optimized our grazing rotation.”
Some producers are also exploring renewable energy. A Vermont dairy with 400 cows installed an anaerobic digester system last year. “Between the renewable energy credits and reduced electricity costs, it’s potentially adding substantial value annually to our bottom line,” the owner reports. “It doesn’t solve everything, but it provides a crucial margin in tight years.”
Strategic Exit Planning
A Wisconsin producer who sold in early 2024 was refreshingly candid:
“With $850,000 in equity, I could have continued operating at marginal profitability for perhaps three more years. Instead, I accepted $720,000 from a consolidator. My neighbor, who waited, went through bankruptcy proceedings and retained maybe $100,000.”
Current market analysis from agricultural real estate specialists suggests:
Strategic sales to consolidators in 2025-2026: $700,000 to $1.1 million for typical 300-cow operations
Wait with continued losses: equity could erode to $200,000-400,000 by 2028-2029
Each year at break-even represents $100,000-200,000 in opportunity cost
Decision Factor
SCALE UP
PREMIUM PIVOT
STRATEGIC EXIT
Initial Investment
$3-5M
$600K-1.2M
$0
Time to Profit
8-10 years
3-5 years
Immediate
Year 5 Income
+$180K
+$95K
$0
Equity Change
-$1.2M (RED)
-$300K (RED)
+$750K (BLACK)
Risk Level
VERY HIGH (RED)
HIGH (RED)
LOW (BLACK)
Success Requires
Youth, debt, processing
Metro proximity
Accept reality
Best For
<45 yrs, 40%+ equity
Niche positioning
Preserve wealth
Regional Viability
Southwest, Idaho only
Northeast, Midwest
All regions
How Geography Is Reshaping Everything
Based on current investment patterns and USDA projections, American dairy production will concentrate in four primary regions by 2030-2035.
The Southwest—Texas, New Mexico, and Arizona—currently produces 32 to 34 percent of national milk, with projections suggesting a move toward 40 to 45 percent. These are your 5,000 to 15,000 cow dry-lot operations. But here’s the kicker—USGS data shows the Ogallala Aquifer dropping 2 to 3 feet annually. Water’s becoming the limiting factor.
The Upper Midwest—Wisconsin, Michigan, Minnesota—that’s an interesting story. Still producing 18 to 20 percent of national milk, down from over 25 percent historically. What you’re seeing is bifurcation—either going mega or going specialty. The middle? That’s where the pressure is.
New York produces about 4 percent of the nation’s milk, yet its processing investment is massive. The capacity appears to exceed local milk supply, which creates interesting supply chain dynamics.
The Southeast faces unique challenges. A Georgia producer managing 400 cows told me:
“We’re seeing farms exit not because of economics alone, but because the next generation won’t tolerate the working conditions. The technology investments needed for heat abatement in our climate add another $500,000 to expansion costs that Northern operations don’t face.”
System Resilience—What Keeps Me Up at Night
Scale economics dictate survival: Mega-dairies (2000+ cows) produce milk at $16.16/cwt while mid-sized operations (300 cows) face $20.25/cwt costs—a $4+ structural disadvantage no management can overcome
The efficiency gains from consolidation are impressive, but when 40 to 45 percent of national milk production concentrates in water-stressed regions, we’re creating single-point vulnerabilities.
Dr. Jennifer Morrison from Cornell’s food systems program put it well: “Efficiency and resilience often exist in tension. We’re building remarkably efficient systems that may prove fragile under stress.”
Recent screwworm detections, shifting climate patterns, labor challenges… USDA APHIS has contingency plans, sure, but concentrated production carries fundamentally different risk profiles than distributed systems.
Collective Action Still Works
Here’s what’s encouraging: in September, approximately 600 Irish dairy farmers successfully pressed Dairygold for written accountability on pricing decisions. The Irish Farmers Journal covered it extensively. They didn’t tear anything down—they just demanded transparency through organized, professional engagement.
Back home, the American Farm Bureau Federation is pushing for modified bloc voting in their 2025 priorities—letting farmers vote individually rather than having cooperatives vote for them. The National Sustainable Agriculture Coalition mobilized over 130 advocates to engage Congress earlier this year.
Regional organizing is showing promise, too. Vermont producers have formed transparency coalitions to request detailed milk-check breakdowns. California’s Central Valley sees mid-sized dairies exploring collective negotiation.
Pennsylvania offers a particularly instructive example. Approximately 28 dairy farmers started meeting monthly to compare milk check deductions. After finding significant variations within the same cooperative and region, they presented consolidated data to their board and received substantive responses for the first time.
“Individual concerns get dismissed. But 28 farmers with documentation command attention.”
Key Questions for Your Cooperative
Start pressing for transparency with these specific requests:
✓ Request itemized breakdowns of all milk check deductions ✓ Seek written explanations of member versus non-member pricing ✓ Inquire about percentages of cooperative income from member versus non-member business ✓ Request voting records on significant pricing decisions ✓ Understand how board representation aligns with regional membership
What This Means for Different Operation Sizes
Survival margins vanish: A typical 300-cow operation generates $1.4M in revenue but nets just $62K after all costs—equivalent to $17/hour for 70-hour work weeks, before family living expenses
For operations with fewer than 250 cows, commodity-market math has become increasingly challenging without exceptional cost management. Premium market transitions offer possibilities if you’re geographically positioned right. Strategic exit planning may preserve more equity than extended marginal operation.
Producers in the 250- to 500-cow range face critical decisions. Scaling to a competitive size requires that $3 to 5 million, which we talked about. The premium market pivots demand, requiring different capital and marketing commitments. Maintaining the status quo typically means gradual equity erosion.
Operations running 500 to 1,000 cows are approaching the minimum viable commodity scale. Strategic partnerships with neighbors, collective arrangements, or, really, locking in processing relationships become essential.
Agricultural lending surveys from late 2024 show credit availability tightening as lenders see these exit rates. If you’re planning expansion, you’re looking at a 12- to 18-month window. M&A advisors specializing in dairy tell me that interest in consolidator acquisitions peaks in 2025-2026.
Addressing What We Don’t Like to Talk About
CDC and NIOSH research shows farmers face a suicide risk approximately 3.5 times higher than the general population. Financial stress is the primary factor, according to the University of Iowa’s agricultural medicine program.
Illinois has expanded mental health support for farmers through their Department of Agriculture wellness initiatives. Other states are developing similar programs. These aren’t just statistics—these are our neighbors, our colleagues, our friends.
A Minnesota farm widow shared something that stays with me:
“Watching three generations of work dissolve feels like personal failure, even when you understand it’s structural economics driving the outcome.”
The Bottom Line
American dairy is experiencing its most significant structural transformation since we mechanized. By 2035, we’ll have mega-operations, specialized premium producers, concentrated processing infrastructure—fundamentally different from the distributed system many of us grew up with.
What’s particularly interesting from a global perspective is how this consolidation positions American dairy internationally. As our production becomes more concentrated and efficient, we’re increasingly competitive in export markets—especially cheese and milk powder bound for Asia and Mexico. This global dimension adds another layer to domestic consolidation pressures.
Understanding these dynamics lets you make informed decisions while options remain. Success stories will emerge from this transition—producers who recognize patterns early and position accordingly. Solutions vary by region, operation size, life stage, and individual circumstances.
After covering this industry for over a decade and talking with hundreds of producers, one thing’s clear: the question isn’t whether to adapt—market forces have made that decision. The question is how to adapt, when to act, and what outcomes to target.
The consolidation reshaping American dairy is real, it’s accelerating, and it’s transformative. But producers who understand these dynamics, assess their positions honestly, and act decisively while maintaining strategic options can still chart successful paths forward.
The clock’s ticking, but opportunity windows remain open. The key is recognizing them and acting with purpose while time allows.
Your next step? This week, schedule time to honestly assess which of these three paths makes sense for your operation. Talk to your lender. Review your equity position. Have the hard conversations with family members. Because in this new game, the worst decision is no decision.
Resources for Industry Support
Mental Health Assistance:
Farm Aid Hotline: 1-800-FARM-AID
AgriSafe Network: 1-866-354-3905
National Suicide Prevention Lifeline: 988
State-specific farm stress hotlines
Financial and Transition Planning:
National Young Farmers Coalition: youngfarmers.org
Farm Financial Standards Council: ffsc.org
Center for Farm Financial Management: cffm.umn.edu
Industry Advocacy:
National Farmers Union: nfu.org
Organization for Competitive Markets: competitivemarkets.com
Farm Action: farmaction.us
KEY TAKEAWAYS:
The 400-farm future is inevitable: Daily losses of 7 farms are shrinking the industry from 24,500 to 8,000 operations by 2035, with mega-farms claiming 75% of production
Three paths remain—pick one: Scale to 3,000+ cows ($3-5M), pivot to premium markets ($600K-1.2M), or exit strategically now ($700K-1.1M before it drops to $100K)
Your co-op became your competitor: Organizations like DFA control 30% of milk AND processing—they profit from low milk prices that destroy you
Act within 18 months or lose everything: Credit markets are closing, consolidator interest peaks in 2025-2026, and standing still means bleeding equity until bankruptcy
Complete references and supporting documentation are available upon request by contacting the editorial team at editor@thebullvine.com.
Learn More:
Decide or Decline: 2025 and the Future of Mid-Size Dairies – Provides specific frameworks for the “Scale vs. Optimization” decision, including critical debt ratio benchmarks and management strategies for the 400-600 cow transition zone that directly impact long-term viability.
Join over 30,000 successful dairy professionals who rely on Bullvine Weekly for their competitive edge. Delivered directly to your inbox each week, our exclusive industry insights help you make smarter decisions while saving precious hours every week. Never miss critical updates on milk production trends, breakthrough technologies, and profit-boosting strategies that top producers are already implementing. Subscribe now to transform your dairy operation’s efficiency and profitability—your future success is just one click away.
The math is brutal: At $11.55/cwt margins, your 350-cow dairy bleeds $20K monthly. Here’s why processors still invest billions.
EXECUTIVE SUMMARY: American dairy is witnessing an unprecedented paradox: processors are investing $11 billion in expansion while margins have collapsed to $11.55/cwt, forcing 2,100-2,800 farms toward exit by 2026. The explanation is stark—processors have pre-secured 70-80% of future milk supply through exclusive contracts with mega-dairies, banking on industry consolidation from 26,000 to 15,000 farms. Current economics make this inevitable: mid-sized operations lose $20,000 monthly while 3,000-cow dairies maintain profitability through $4-5/cwt scale advantages that management excellence cannot overcome. A severe heifer shortage (357,000 fewer in 2025) ensures these dynamics persist regardless of price recovery, creating a biological ceiling on expansion. Farmers face three critical deadlines—May 2026 for viability assessment, August 2026 for processor clarity, and December 2026 as the final repositioning window. This transformation differs fundamentally from previous cycles: no government intervention is coming, traditional recovery mechanisms don’t exist, and the structural changes are permanent.
I was reviewing the October USDA milk production report with a group of producers, and we all noticed the same paradox. We’re producing 18.7 billion pounds of milk—up 3.9% from last year—yet margins have compressed from $15.57 to $11.55 per hundredweight since spring. Meanwhile, processors are committing approximately $11 billion to major new facilities through 2028.
One producer from central Pennsylvania put it perfectly: “How does massive processor expansion make any sense when we can barely cover feed costs?”
After months of analyzing this disconnect—visiting operations from the Central Valley to Vermont, reviewing research from land-grant universities, tracking processor announcements—what’s emerging is a fundamental restructuring of American dairy. This goes beyond typical market cycles into something more permanent, and understanding these shifts has become essential for strategic planning.
The Margin Meltdown: From Surviving to Drowning in 15 Months – Dairy margins collapsed 26% since September 2024, dropping from $15.57/cwt to just $11.55/cwt. For a 350-cow operation producing 6 million pounds annually, that’s $240,000 in lost income—enough to wipe out equipment budgets and force impossible decisions at kitchen tables across dairy country
Key Numbers Shaping Our Industry
Before we dive deeper, here are the metrics that matter most for operational planning:
The latest USDA data shows we’re milking 9.35 million cows nationally—the highest count since 1993. But the story varies dramatically by region, and that variation matters for understanding what’s ahead.
Michigan operations are achieving a remarkable production of 2,260 pounds per cow per month. A producer near Lansing recently told me their herd’s averaging 95 pounds daily with consistent butterfat levels above 3.8%. That’s exceptional management paired with strong genetics.
Texas presents another fascinating case. They’re running 699,000 head now—the most since 1958—with production up 11.8% year-over-year. The panhandle operations I visited in September have adapted dry lot systems that work remarkably well in their climate, though water access remains a growing concern.
But regional differences create vastly different economic realities. A Wisconsin producer I work with regularly—running 300 cows with excellent grazing management—calculated that they’re facing approximately $240,000 less income than in September 2024. That’s based on their 6 million pounds annual production at current margins. For context, that’s their entire equipment replacement budget for the next three years.
Meanwhile, when I visited Tulare County last month, the 3,000-cow operations there are weathering margin compression better. Their operating costs run $4-5 per cwt lower than Midwest mid-size farms—not through better management, but through scale efficiencies in feed procurement, labor utilization, and infrastructure amortization.
The international dimension adds another layer. European production bounced back strongly in September—up 4.3% according to Eurostat data. France increased by 5.8%, Germany by 5%, and the Netherlands jumped by 6.9% despite their nitrate restrictions. A dairy economist colleague in Amsterdam tells me Dutch producers are maximizing production before additional environmental regulations take effect in 2026. This surge is pressuring our export markets precisely when domestic demand remains sluggish.
Understanding Processor Strategy: The View from Industry
The $11 billion processor investment initially seems counterintuitive. Why expand when farm margins are collapsing? The answer becomes clearer when examining specific projects and their strategic positioning.
Chobani’s $1.2 billion Rome, New York, facility—their largest investment to date—will process 12 million pounds daily upon full operation. That volume could come from about 40 mid-size farms, or more realistically, from 3-4 mega-dairies with guaranteed supply contracts.
During a recent industry meeting in Chicago, a procurement manager from a major processor (who requested anonymity) shared their perspective: “We’re not building for today’s milk market. We’re positioning for 2030 when global demand exceeds supply and premium products command higher margins.”
Walmart’s strategy offers another angle. Their third milk plant in Robinson, Texas, opens in 2026, continuing their vertical integration push. Based on standard industry practices and Walmart’s previous facility operations, these supply commitments typically extend for a minimum of 5-7 years.
The geographic clustering is noteworthy. Hilmar’s Dodge City facility and Leprino’s Lubbock plant—both processing 8 million pounds daily—are positioned in regions with concentrated mega-dairy operations and favorable logistics for export markets.
CoBank’s August analysis reveals that processors have already secured 70-80% of the required milk supply through long-term contracts, predominantly with operations milking 2,000+ cows. This pre-commitment strategy represents a departure from historical reliance on the spot market.
Follow The Money: Where Processors Are Building Your Replacement – New York leads with $2.8 billion (Chobani’s $1.2B Rome plant, Fairlife’s $650M facility), while Texas adds $1.5 billion targeting mega-dairy regions. This geographic clustering reveals processor strategy: invest near concentrated large operations with guaranteed supply. If your state isn’t on this map, ask yourself why
Ben Laine from Rabobank articulated this shift well during a recent webinar: “Companies aren’t investing hundreds of millions without secured supply. The relevant question for producers is whether they’re included in these long-term arrangements.”
The global context drives processor confidence. The International Dairy Federation’s April report projects a potential 30-million-ton global milk shortage by 2030, while even conservative IFCN estimates suggest a 6-10 million ton deficit. Chinese import data reinforces this outlook—cheese imports up 13.5%, whole milk powder up 41% through September, according to USDA Foreign Agricultural Service tracking.
There’s also an unexpected shift in demand for GLP-1 medications. With 30 million Americans now using these drugs, according to IQVIA’s pharmaceutical data, consumption patterns are changing dramatically. Whey protein demand increased 38% among users, while cheese and butter consumption declined 7.2% and 5.8% respectively. For processors with flexible infrastructure, this creates opportunities in high-margin protein products.
The Heifer Shortage: A Constraint Years in the Making
The replacement heifer situation deserves careful attention because it represents a multi-year constraint on expansion regardless of price improvements.
Current inventory sits 18% below 2018 levels according to CoBank’s analysis. At a recent sale in Fond du Lac, Wisconsin, quality springer heifers brought $4,500—compared to $2,200 for similar genetics five years ago. A producer from Idaho mentioned paying $4,800 for exceptional genetics last month.
The Perfect Storm: Vanishing Heifers, Exploding Prices – Since 2018, dairy heifer inventory plummeted 18% to a 47-year low of 3.91 million head while prices rocketed 50% to $3,010—with top genetics fetching $4,500. This biological ceiling locks the industry into its current structure until 2027, regardless of milk price recovery. Expansion is now mathematically impossible for most operations
The shortage—357,000 fewer heifers in 2025, rising to 438,000 fewer in 2026—stems from rational individual decisions that create collective constraints. When beef-on-dairy calves bring $1,400-1,600 while raising a replacement costs $2,800-3,200, the economics are clear.
A California dairyman running 1,500 cows told me they went 80% beef-on-dairy in 2023-2024. “At those prices, it was irresponsible not to,” he explained. Even traditionally conservative Midwest operations shifted 40-50% of breedings to beef genetics.
Dr. Kent Weigel from UW-Madison’s dairy science department frames it well: “Producers made financially sound individual choices that collectively created a demographic cliff for the industry.”
The regional impacts vary significantly. Idaho’s expanding operations are aggressively bidding for available heifers, driving prices higher across the West. Pennsylvania’s smaller farms face a different challenge—they simply can’t compete financially for limited replacement inventory.
This creates a biological ceiling on expansion that price signals alone can’t overcome. Even if milk prices reached $20 per cwt tomorrow, most operations couldn’t expand without available replacements.
Historical Context: Why This Cycle Differs
Having worked through previous downturns, the current situation presents unique characteristics worth examining.
The 2009 crisis saw milk prices crash from $24 to $8.80 per cwt—a devastating 63% decline. But Congress responded with $3.5 billion in direct support, and USDA purchased 379 million pounds of milk powder to stabilize markets. Those interventions, combined with natural supply adjustments, enabled recovery within 18-24 months.
The 2015-2016 downturn followed a different pattern. Without direct payments, the industry relied on market forces. Global weather challenges and China’s growing imports eventually tightened supply, supporting price recovery by 2017-2018.
Today’s environment lacks these recovery mechanisms. Current USDA policy emphasizes market solutions over intervention. The Dairy Margin Coverage program triggers only at $9.50 per cwt—well below current margins of $11.55. Even when triggered, coverage caps at 5 million pounds annually, providing limited support for larger operations.
More significantly, processor supply commitments through 2030-2034 have pre-allocated market access in ways that didn’t exist during previous cycles. A Northeast cooperative board member recently described this as “musical chairs where the music has already stopped for many producers.”
Dr. Andrew Novakovic from Cornell’s dairy program observes that, unlike previous downturns with natural recovery mechanisms, “this transformation represents structural reorganization that doesn’t self-correct through normal market cycles.”
Scale Economics: The Widening Gap
The economic disparities between operation sizes have widened beyond what management excellence can overcome. Data from the University of Minnesota’s FINBIN system and USDA surveys reveals striking differences.
A typical Wisconsin 350-cow operation incurs costs of around $20.85 per cwt, with fixed costs accounting for 38% of that total. Compare that to a 3,000-cow Texas panhandle operation at $16.16 per cwt with only 25% fixed costs. That $4.69 difference translates to roughly $394,000 annually—often the difference between profit and loss.
The Unbridgeable Cost Gap: Why Scale Now Determines Survival – Mid-size operations hemorrhage $4.69/cwt more than mega-dairies—a $394,000 annual disadvantage that excellent management cannot overcome. While 350-cow Wisconsin farms struggle at $20.85/cwt, 3,000-cow Texas operations cruise at $16.16/cwt. This isn’t about farming better; it’s about farming bigger, and processors are betting accordingly with their $11 billion investment
Interestingly, California’s mid-size operations (500-750 cows) achieve competitive costs around $17-18 per cwt through different strategies. They utilize more contracted labor, which provides flexibility during margin compression despite higher hourly costs.
Beyond direct operating expenses, scale creates compounding advantages. Large Idaho operations negotiate feed contracts at $0.50-1.00 per cwt below spot prices. Labor efficiency reaches $183 per cow annually, compared with $343-514 for Northeast mid-size farms. A robotic milking system costs $83 per cow to amortize at a 3,000-head scale but $714 at a 350-head scale.
Dr. Christopher Wolf from Cornell captures this reality: “We’ve moved beyond management quality as the primary determinant of success. Structural economics now dominate, where excellent managers at smaller scales face insurmountable cost disadvantages.”
Processor Relationships: The New Reality
The evolution of processor-producer relationships represents a fundamental shift that many producers haven’t fully grasped.
Modern facilities require 5-12 million pounds per day from consolidated sources, typically through 5-10-year exclusive agreements. A central Pennsylvania producer recently shared their experience: offered a premium for exclusive supply but required a commitment to all production through the decade’s end—no spot sales, no price shopping during market spikes.
These contracts include strict confidentiality provisions, creating information asymmetry. While processors map regional supply commitments years in advance, individual producers lack visibility into capacity allocation. Your neighbor might have secured long-term access while you’re still assuming spot markets will continue.
The timing matters critically. Major processors locked supply agreements in 2023-2024 when planning current expansions. Producers now recognizing tightening access are discovering capacity is already committed through 2030.
Several New York producers mentioned their long-standing processor relationships—some spanning 30+ years—are being “reassessed” for 2026. That’s industry language for supply consolidation toward larger operations.
Community Impacts: Beyond the Farm Gate
The projected 2,100-2,800 farm exits by end-2026 create ripple effects throughout rural communities. The Center for Dairy Profitability at UW-Madison developed these projections based on current exit rates and economic pressures.
Consider Marathon County, Wisconsin, with approximately 180 dairy farms. An 8% exit rate means 14-15 operations closing. Each supports an ecosystem—equipment dealers, nutritionists, veterinarians, feed suppliers—all of which are losing revenue simultaneously.
Projection show that 40% of Northeast dairy equipment dealers will consolidate or close by 2027, as demand drops by 30%. The implications extend beyond sales to parts availability, service expertise, and technology support for remaining operations.
Veterinary services face particular challenges. The American Association of Bovine Practitioners projects service reductions of 15-25% in dairy regions. Northern Minnesota already has one large-animal practice serving five counties. When economic forces drive further consolidation, emergency coverage becomes problematic.
School districts in dairy-dependent counties could lose 5% of their property tax base. That translates to program cuts, route consolidations, and reduced educational opportunities for rural youth.
Bob Cropp, from the University of Wisconsin, quantifies what we’re losing: “These exits represent approximately 74 million farmer-years of accumulated expertise. That knowledge—built through generations of problem-solving and adaptation—cannot be quickly replaced.”
Decision Framework: Practical Steps Forward
Based on extensive discussions with financial advisors, producers, and industry analysts, here’s a framework for evaluating your operation’s position.
Immediate Assessment Priorities:
Calculate true operating costs, including family labor at market value. Many operations undervalue owner labor, distorting profitability assessments. If 80-hour weeks at zero value keep you “profitable,” that’s not sustainable.
Working capital should be at least 25% of annual revenue. Wisconsin’s Farm Credit offices recommend a 30% allocation given current volatility. Debt-to-asset ratios above 60% limit refinancing flexibility according to multiple ag lenders.
Most critically, seek clarity from milk buyers about 2026-2027 commitments. Vague responses or deferrals suggest capacity is already allocated elsewhere. February 2026 represents a critical deadline for securing clarity.
Warning Signals to Monitor:
Subtle changes often precede major shifts. Processors asking about “future plans” after years of routine relationships are assessing supplier consolidation options. Lenders requesting earlier reviews or suggesting consultants have identified concerning trends in your financials.
Regional consolidation patterns matter. Multiple exits within six months indicate accelerated structural change rather than normal attrition.
Critical Timeline:
May 2026: Assess whether operations can sustain through late 2026 without margin improvement. August 2026: Processor commitments and regional consolidation patterns become clear. December 2026: Final window for strategic repositioning before options significantly narrow
The 18-Month Decision Gauntlet: Three Deadlines That Determine Your Farm’s Future – May 2026: Assess if you can survive the year. August 2026: Know if processors want your milk. December 2026: Your last window to act deliberately. Miss these deadlines, and circumstances will decide your fate—not you. Processors and mega-dairies already know the 2030 structure; sharing information with neighbors is your only counterweight
Strategic Paths for Different Situations
Based on current operations, successfully navigating these challenges:
Strong fundamentals (positive cash flow, manageable debt, processor commitment): Focus on operational efficiency over expansion. Build reserves during any margin improvements. Avoid major capital investments without secured long-term processor agreements. An Idaho producer recently canceled planned parlor expansion despite available capital due to uncertain processor signals.
Structural challenges (tight cash flow, high debt, uncertain processor access): Consider neighbor consolidation to achieve viable scale. Three New York operations recently merged to create an 1,800-cow enterprise—complicated but preferable to individual failure.
Premium market transitions require time and capital. Organic certification takes three years. Grass-fed requires an appropriate land base. A2 genetics need development time. These aren’t immediate solutions.
Exit timing matters if that’s your path. Current cattle values ($3,000-4,000 for quality animals) and strong farmland prices create windows that may narrow if exits accelerate.
Universal recommendations: Maximize Dairy Margin Coverage despite current margins above trigger levels—premiums typically run $0.10-0.20 per cwt for basic protection. Document monthly production costs rather than quarterly estimates. Develop relationships with multiple milk buyers, even with satisfactory current arrangements in place.
Emerging Market Forces: The GLP-1 Factor
Dairy Product
Consumption Change
Primary User Group
Cheese
-7.2%
General Users
Butter
-5.8%
General Users
Ice Cream
-5.5%
General Users
Milk/Cream
-4.7%
General Users
Yogurt High-Protein
+38.0%
Fitness Focus
Whey Protein
+41.0%
Fitness Focus
Looking Forward: Industry Implications
What we’re experiencing transcends normal market cycles into fundamental restructuring. The convergence of processor pre-positioning, heifer constraints, and widening scale economics creates permanent rather than temporary change.
Operational excellence remains necessary but insufficient. A well-managed 350-cow Pennsylvania operation faces structural disadvantages that exceptional management cannot overcome when competing against 3,000-cow Texas operations with locked processor contracts.
Time-limited decision windows define positioning for 2027-2030. Information asymmetry—where processors and mega-operations understand supply commitments while smaller producers operate in the dark—compounds the challenges. Traditional crisis recovery mechanisms no longer exist in the current market structure.
The central question isn’t management quality but structural positioning within emerging industry architecture. For many operations, honestly assessing this question—though difficult—enables deliberate choices rather than outcomes driven by circumstance.
The dairy industry will certainly continue producing milk. Whether individual operations participate in that future, and in what form, depends on decisions made within current windows. What’s encouraging is that informed decisions still influence outcomes despite powerful structural forces.
Regional collaboration strengthens individual positions. Sharing information, comparing strategies, and coordinating responses—even when processors prefer confidentiality—creates collective strength. This remains our industry, even as it transforms more rapidly than many anticipated.
The path forward requires accepting new realities while maintaining the innovative spirit that has always characterized American dairy. Those who adapt deliberately rather than reactively will find opportunities within structural change. The key is acting on information rather than hope, making strategic choices rather than letting circumstances decide.
Key Takeaways:
The game has changed permanently: Processors invested $11 billion betting on 15,000 farms by 2030, pre-locking 70-80% of milk supply with mega-dairies—if you lack a long-term contract, you’re competing for scraps
Scale economics are now destiny: A 350-cow farm bleeds $20,000 monthly at current margins while 3,000-cow operations profit—this isn’t poor management, it’s structural disadvantage
Biological ceiling locks in consolidation: With 357,000 fewer heifers and beef-on-dairy economics, expansion is impossible for 2-3 years, regardless of price recovery
Three deadlines determine your fate: May 2026 (viability assessment), August 2026 (processor commitment), December 2026 (final repositioning)—decide deliberately, or circumstances will decide for you
Information asymmetry is real: While you see falling milk checks, processors and mega-farms already know the 2030 industry structure—sharing information with neighboring farms is your only counterweight
Complete references and supporting documentation are available upon request by contacting the editorial team at editor@thebullvine.com.
Learn More:
The Hidden Cost of Every $1,200 Beef Calf: A $4,000 Heifer Bill – Reveals the “Forward Replacement Inventory Formula” to prevent six-figure heifer shortages, demonstrating how weekly monitoring of pregnancy ratios can save operations from the current $4,000 replacement crisis.
Join over 30,000 successful dairy professionals who rely on Bullvine Weekly for their competitive edge. Delivered directly to your inbox each week, our exclusive industry insights help you make smarter decisions while saving precious hours every week. Never miss critical updates on milk production trends, breakthrough technologies, and profit-boosting strategies that top producers are already implementing. Subscribe now to transform your dairy operation’s efficiency and profitability—your future success is just one click away.
We predicted it. Lost $4.3B fighting it. 11,000 farms died waiting. Whole milk’s finally back—but the industry that won isn’t the one that warned.
EXECUTIVE SUMMARY: Whole milk returns to schools after a 13-year ban that cost dairy $4.3 billion and killed 11,000 farms—but the survivors who’ll benefit aren’t the ones who warned Congress this would happen. University of Toronto research confirmed what producers always knew: whole milk reduces childhood obesity by 40% compared to skim milk, completely debunking the policy’s premise. However, consolidation during the fight means only mega-dairies (1,500+ cows) can access school contracts worth $40-80K annually, while 97% of remaining farms are effectively locked out. The window for action is narrow: producers must contact their cooperatives NOW to position for RFPs releasing January 2026, with contracts locking by July. Small operations should forget institutional milk and leverage whole milk’s vindication for premium direct sales, while mid-sized farms face a brutal choice between fighting for scraps or pivoting to specialty markets. The lesson is unforgiving: in agricultural policy, being right means nothing if you don’t survive long enough to collect.
You know, looking at what happened in the Senate last Tuesday—unanimous passage of the Whole Milk for Healthy Kids Act—you’d think we’d all be celebrating. And yeah, it’s definitely a victory. After watching kids dump skim milk down cafeteria drains for 13 years while our neighbors went under, whole milk’s finally coming back to schools.
But here’s what’s been keeping me up at night, and I’ve been hearing the same thing from producers all over. The dairy industry that gets to capture this opportunity? It looks nothing like the industry that warned Congress this would happen back in 2012. We’ve lost 11,000 farms during this fight. The survivors are entirely different breeds—either massive operations with 2,500-plus cows or specialty producers who found their niche. That 300-cow family dairy that needed this policy most? Most of ’em are gone.
Herd Size
2012 Farms
2025 Farms
Change %
Milk Share 2025 %
Under 100 cows
28141
16334
-42
7
100-499 cows
8868
5889
-34
15
500-999 cows
1580
1025
-35
10
1,000-2,499 cows
1000
900
-10
22
2,500+ cows
714
834
17
46
What I’m finding as I talk to folks trying to figure out what this means for their operations is that winning the policy battle doesn’t reverse the structural war we’ve already lost. So let me walk you through what actually happened, what it cost us, and—here’s the important part—what you can actually do about it in the next six months.
The Scale of What We Lost: More Than Just Milk Sales
Year
Per Capita (lbs/year)
School Policy Phase
Annual Decline Rate %
2009
190
Pre-Ban
0.75
2012
185
Ban Implemented
2.6
2015
172
Ban Effect
2.6
2018
155
Accelerated Decline
2.6
2021
141
Continued Fall
2.6
2023
130
Record Low
1.5
2025
128
First Increase Signal
-0.8
I’ve been going through the numbers with economists at Cornell and Wisconsin, and it’s worse than most of us realize. When the National Milk Producers Federation testified to the USDA back in April 2011 that restricting schools to skim and 1% milk would hurt consumption, they actually underestimated what would happen. You can look it up in their comments if you’re curious—docket USDA-FNS-2011-0019.
School milk represents about 7 to 8 percent of total U.S. fluid milk demand, according to the USDA’s Economic Research Service—we’re talking roughly a billion dollars annually. Sounds manageable, right? But here’s what nobody calculated: when you tell 30 million kids for 13 years that whole milk is unhealthy, you don’t just lose school sales. You lose a generation.
Before 2012’s restrictions kicked in, fluid milk consumption was declining at about 3/4 of 1 percent per year—concerning but manageable, according to the International Dairy Foods Association’s market reports. After? That rate exploded to 2.6 percent annually. That’s not evolution; that’s acceleration.
A Wisconsin producer I know who runs about 450 cows put it best: “We watched our school contracts evaporate overnight. But worse was watching those kids grow up thinking milk was bad for them. Now they’re adults buying oat milk.”
The direct hit to producer revenue over 13 years? Based on Federal Milk Marketing Order pricing data, it’s about $1.38 billion. But that’s just the beginning. When Class I utilization drops in the federal orders, it drags down the blend price every producer receives—University of Missouri’s policy research folks calculated another $182 million spread across all farms.
Then you’ve got the supply chain multiplier effect. USDA’s Economic Research Service uses standard agricultural multipliers of around 1.8 times for dairy. So that lost producer revenue of $1.38 billion means a total supply chain impact of around $2.49 billion. Haulers, feed suppliers, equipment dealers—everybody took a hit.
Add in competitive losses to plant-based alternatives—Euromonitor International’s dairy alternatives tracking pegged it at about $650 million in institutional market share—plus the waste. And the waste is mind-boggling. The Center for Science in the Public Interest estimates that about 45 million gallons annually that kids refused to drink, worth nearly a billion dollars at Class I pricing.
Category
Amount ($ Billions)
Percentage
Direct Producer Revenue Loss
1.38
32.1
Blend Price Impact (All Farms)
0.182
4.2
Supply Chain Multiplier Effect
1.112
25.9
Competitive Losses to Alternatives
0.65
15.1
School Milk Waste
0.976
22.7
When you combine all these factors—the direct losses, blend price impacts, supply chain effects using those standard multipliers, competitive losses, and waste values—you’re looking at a total economic impact approaching $4.3 billion. Though I should note that nobody’s done a comprehensive study pulling all these pieces together. We’re aggregating from multiple sources here.
“That’s not just a policy mistake, folks. That’s a generational disaster.”
What Science Now Shows: We Had It Backwards All Along
Metric
Whole Milk
Skim/Low-Fat Milk
Childhood Obesity Odds
40% LOWER
Baseline
Overweight Risk Reduction
40% lower odds
No reduction found
Added Sugar Content
0g (natural)
8-12g (added)
Satiety Factor
High (natural fats)
Lower
Fat-Soluble Vitamin Delivery
Superior (vitamins A,D,E,K)
Reduced effectiveness
Studies Supporting
18 of 28 studies
0 of 28 studies
This is the part that really gets me—and I’m hearing the same frustration everywhere I go. The whole scientific foundation for banning whole milk? It’s completely collapsed.
Dr. Jonathon Maguire, up at the University of Toronto, published this meta-analysis in the American Journal of Clinical Nutrition back in December 2020—looked at 28 studies with 21,000 children. The finding? Kids drinking whole milk had 40 percent lower odds of being overweight or obese compared to those drinking reduced-fat milk. Not one study—not a single one—showed skim milk reducing obesity risk.
As Maguire wrote in the journal, children who followed the current recommendation to switch to reduced-fat milk at age two weren’t any leaner than those who consumed whole milk.
What’s interesting here—and this is what really burns me—is what schools actually did to make fat-free milk palatable. They added sugar. Lots of it. The Center for Science in the Public Interest did an analysis showing that fat-free chocolate milk in schools contains up to 12 grams of added sugar per carton. That’s nearly half what the American Academy of Pediatrics says kids should have in a whole day, based on their 2019 policy statement.
Think about that for a minute. We removed natural milk fat, which provides satiety and fat-soluble vitamins, and replaced it with processed sugar. A dietitian I know at Penn State Extension—she’s been doing this for 30 years—called it the most backwards nutritional policy she’d ever seen.
How Dairy Finally Won: The Coalition Nobody Expected
I’ve been covering dairy politics for two decades, and what happened this year was unlike anything I’ve seen. After failed attempts in 2016, 2019, and that unanimous consent block by Senator Stabenow last December, how’d we suddenly get unanimous passage?
The breakthrough came from the most unlikely place: the Physicians Committee for Responsible Medicine. Now, this group has historically opposed dairy consumption, right? But Senator Welch’s team made a strategic calculation—they added language guaranteeing schools could serve, and I quote, “nutritionally equivalent nondairy beverages that meet USDA standards.”
A Senate Agriculture Committee staffer familiar with the negotiations told me, “We realized we couldn’t win by fighting everyone. So we found ways to give opposition groups something they wanted while still achieving our core goal.”
The senator pairing was brilliant, too. Peter Welch from Vermont brought the economic urgency—his state’s lost more than 500 dairy farms since 2012, according to the Vermont Agency of Agriculture’s latest data through 2024, a crushing 55 percent decline. Roger Marshall from Kansas, an OB-GYN with 25 years of practice before Congress, provided medical credibility that transcended typical ag lobbying. When you’ve got a physician-senator arguing for whole milk’s nutritional benefits, it carries a different weight than dairy executives making the same case.
But the real game-changer came from school food service directors testifying about operational reality. One Pennsylvania director told legislators that the amount of waste they were throwing away each day was disheartening—kids just wouldn’t drink the skim milk.
That operational reality, from public sector administrators rather than industry advocates, changed the conversation entirely.
And then there’s the RFK Jr. factor. When the incoming HHS Secretary calls whole milk restrictions “nutrition guidance based on dogma, not evidence” in public statements, dairy’s position suddenly aligns with a broader health reform movement. FDA Commissioner nominee Dr. Martin Makary went even further at his confirmation hearing, saying we’re ending the 50-year war on natural saturated fat.
The Harsh Reality: Small Farms Can’t Access This Opportunity
Now here’s where I need to level with you about what this actually means for different operations. I’ve been talking to procurement specialists at DFA, Land O’Lakes, and regional cooperatives across the midwest, and the reality’s tough for smaller farms.
For Large Operations (1,500+ cows)
If you’re milking 1,500-plus head, this is a genuine opportunity. Based on current Class I differentials from the November federal order announcement and institutional pricing models, you could see $40,000 to $80,000 in additional annual revenue. These operations typically have what schools need—cooperative relationships for procurement access, daily volume to meet district minimums (usually 2,000-plus pounds), and standardized equipment to hit that 3.25 percent butterfat spec.
A large-herd operator in Wisconsin told me that his co-op has been preparing bid packages since October. “We’ve got the volume, the testing protocols, everything schools require,” he said.
For Mid-Size Operations (500-1,000 cows)
The opportunity exists, but it’s complicated. You might see $15,000 to $30,000 annually—helpful but not transformational. The challenge? You’re competing with larger operations for cooperative priority.
One Central Valley producer milking 650 told me, “I could supply our local district easily. But our co-op prioritizes the 5,000-cow operations because the logistics are simpler. One truck stop instead of eight.”
Down in Texas, the situation’s even tougher. A producer with 725 Holsteins outside Stephenville explained they’re 45 minutes from the nearest processor. “School contracts require daily delivery. The math just doesn’t work unless you’re right next to a bottling plant or have 2,000-plus cows to justify dedicated hauling.”
In Nebraska—right in Senator Marshall’s backyard—the consolidation’s been particularly stark. A producer near Grand Island, milking 550 cows, explained that their cooperative had merged with two others in the past five years. “We used to have direct say in school milk contracts. Now we’re competing with operations five times our size for the same procurement slots.”
For Small Operations (Under 300 cows)
I hate to say this, but institutional whole milk offers almost no direct opportunity for operations under 300 cows. School procurement requires minimums you can’t meet independently—typically 500 gallons per day, based on what I’ve seen in Michigan and Iowa district RFPs.
The path forward is different. A Vermont producer milking 180 Jerseys told me they’re focusing on farmers markets and local retail. “Whole milk’s vindication helps our direct marketing—we can tell customers the government was wrong, and they believe us now.”
In Georgia, small producers are finding similar alternatives. One producer with 220 cows near Quitman explained they can’t compete for Atlanta school contracts. “But we’re selling to three local private schools at $4.50 a gallon. They want local, and whole milk’s return legitimizes premium pricing.”
Farm Size
Annual Revenue Potential
Market Access
Number of Farms
Access Probability %
2,500+ cows
$60-80K
Direct/Priority
834
95
1,500-2,499 cows
$40-60K
Direct/Competitive
900
75
500-999 cows
$15-30K
Limited/Co-op Only
1025
30
300-499 cows
$5-10K
Minimal
3200
5
Under 300 cows
$0-2K
None
18109
2
The Seven-Month Sprint: Your Action Timeline
Date
Action
Producer Action
Critical Level
Nov 2025
Senate passes bill unanimously
Contact co-op NOW
HIGH
Jan 2026
School RFPs released
Review district opportunities
HIGH
Feb-Mar 2026
Producer positioning window
Submit commitments
CRITICAL
Apr-May 2026
Bids due to districts
Finalize agreements
FINAL DEADLINE
Jul 1 2026
New contracts begin
Begin deliveries
GO-LIVE
Aug 2026+
Market locked (incumbents only)
Wait 1-3 years for next cycle
LOCKED OUT
What’s catching producers off-guard is how fast this moves. We’re operating on school procurement timelines, not legislative calendars.
📅 The Critical Dates You Can’t Miss:
➤ January–March 2026: School districts release RFPs ➤ April–May 2026: Bids are due (If you aren’t positioned, you’re out) ➤ July 1, 2026: New contracts begin
After July 2026, breaking into the school supply means displacing an incumbent. Good luck with that—I’ve seen it happen maybe twice in 20 years covering dairy markets.
☎️ Your Homework: Call Your Milk Handler TODAY
Don’t wait until next week. Pick up the phone and ask these exact questions:
1. “Are you bidding on school whole milk contracts for 2026-27?”
2. “What commitments do you need from member farms?”
3. “What’s our current butterfat running?” (National average hit 4.23% in October per USDA)
4. “Can you standardize our 4.2% fat down to 3.25%?”
5. “What’s the premium for institutional Class I vs. our current blend?”
6. “Which school districts can we realistically reach?”
A procurement director at one of the midwest regional cooperatives told me they’re getting 50 calls a day about this. The producers who commit early get priority when bid packages go out.
The Genetics Question: Don’t Panic About Your Breeding Program
I’m getting panicked calls from producers worried their genetics are wrong for whole milk. Here’s what Dr. Kent Weigel, who chairs dairy science at UW-Madison, explains: You don’t need to change your genetics. You need standardization capability.
Current U.S. herds are averaging 4.23 percent butterfat according to USDA’s October milk production reports—a record high driven by cheese market premiums. School whole milk needs exactly 3.25 percent. That seems like a problem, but it’s actually an opportunity.
Patricia Stroup, who’s COO at Horizon Organic, explained to me that they standardize all their institutional milk. “Higher butterfat means more cream to separate and sell at premium prices. It’s additional revenue, not a problem.”
Your 4.2 percent milk becomes 3.25 percent whole milk. The separated cream? That’s going into premium butter—CME spot prices have been running around $3.20 a pound lately. You’re not losing value; you’re creating two revenue streams.
Butterfat has a heritability of 0.40 to 0.50 according to USDA’s genetic evaluation summaries—high enough to adjust if truly needed. But genetic changes take 3 to 5 years, depending on generation intervals. This opportunity window might shift again before your genetics catch up.
Dr. Chad Dechow, who does dairy cattle genetics at Penn State, advises keeping your breeding focused on components. “The cheese market isn’t going away, and standardization solves the institutional specifications,” he told me.
Market Outlook: What Economists See Coming
[CHART: Fluid milk consumption trends 2010-2025 with projections]
Looking beyond just the school opportunity, the broader market dynamics matter for positioning. Dr. Marin Bozic, the dairy economist at the University of Minnesota, sees structural shifts ahead.
“We’re entering a period where fluid milk might stabilize at 140 to 150 pounds per capita,” Bozic explained when we talked. “That’s not growth, but it ends the bleeding. For producers, predictable Class I demand at 22 to 23 percent of total utilization beats continued decline to 18 to 20 percent.”
The generational damage is real, though. Kids who drank skim milk in schools from 2012 through 2025 are adults now. They’re not suddenly switching to whole milk because policy changed. But their kids might—if whole milk’s available when they enter school.
IDFA reported in their August 2025 dairy market update that producers sold 0.8 percent more fluid milk than in 2023—the first increase since 2009. Whole milk specifically showed real strength. Conventional whole milk’s up 1.3 percent year-over-year according to IRI’s retail tracking data. Organic whole milk’s up 6.2 percent based on SPINS organic market reports. Flavored whole milk’s up 20 percent in peak months per Nielsen beverage category data.
Whole milk now represents 42 percent of retail sales—the highest since 2001.
The Consolidation Truth: Understanding Today’s Industry
This is the hardest conversation I have had with producers, but we need to face reality. Between 2012 and 2025, based on the USDA’s Census of Agriculture data and structural analyses, the changes are stark.
Farms under 100 cows are down 42 percent, from 28,141 to 16,334. The 100 to 499 cow operations dropped 34 percent. Mid-sized farms with 500 to 999 cows fell 35 percent. But farms with 2,500-plus cows? They’re up 17 percent.
The only category growing is mega-dairies. They now produce 46 percent of U.S. milk while representing just 3 percent of farms, according to USDA-NASS farm structure data.
A former Ohio dairyman who sold 350 cows during the 2015 price crash told me, “The whole milk policy would’ve saved our farm in 2015. But it’s too late now. We’re out, and the neighbor who bought our cows is milking 3,000.”
Wisconsin’s story is particularly telling. They’ve been losing 8 to 10 dairy farms per week from 2014 to 2024, according to data from the Wisconsin Agricultural Statistics Service. The survivors? Either massive operations with economies of scale or boutique producers selling $8 a gallon milk at farmers markets.
Vermont’s even starker. Of their remaining 480 farms—down from 973 in 2012, per the Vermont Agency of Agriculture—73 percent have fewer than 200 cows, accounting for 30 percent of production. Meanwhile, 9 percent are over 700 cows, producing 40 percent of milk.
The mid-sized farms that whole milk could’ve helped? They’re mostly gone.
What This Victory Actually Means
Let me be straight with you about what this moment represents, because false hope doesn’t help anybody make good decisions.
Yes, the science vindicated us—whole milk is better for kids than skim. The University of Toronto research is bulletproof. Yes, we built a coalition that achieved unanimous Senate passage. That’s remarkable in today’s politics. And yes, there’s real money here for farms positioned to capture it.
But let’s acknowledge what this victory can’t do. It can’t bring back the 11,000 farms we lost. It can’t reverse the consolidation that accelerated while we fought this policy. And it can’t transform the fundamental economics pushing dairy toward fewer, larger operations.
A Wisconsin farmer who sold his 450-cow operation in 2018 reflected, “This would’ve been transformational in 2012. Now it’s a nice win for the big guys who survived.”
What strikes me most is the gap between being right and having it matter. The dairy industry accurately predicted everything—consumption collapse, waste, and pressure to consolidate. NMPF’s 2011 testimony to USDA reads like prophecy now. But being right didn’t change the timeline.
“Policy moves on political schedules, not farm survival schedules.”
Your Strategic Choices for the Next Six Months
Based on conversations with successful operators across different scales, here’s what’s actually working.
If You’re Large (1,500+ cows)
Move aggressively on institutional contracts. You’ve got the scale schools need. Lock in that volume before competitors organize. One 5,000-cow operator in Idaho told me they’re dedicating a full-time person just to manage school RFPs through spring 2026.
If You’re Mid-Sized (500-1,000 cows)
You’re in the squeeze zone. Evaluate carefully whether institutional margins justify participation rather than premium-market opportunities. A 750-cow producer in Michigan shared their analysis: “School milk at $22 a hundredweight beats our current blend by $1.50. That’s $40,000 annually—worth pursuing but not transformational.”
Don’t sacrifice premium positioning for commodity institutional volume. If you’re already selling to local cheese plants at premiums, keep that relationship.
If You’re Small (Under 300 cows)
Institutional whole milk isn’t your play. But use the narrative shift. “Whole milk is healthy again” is powerful marketing for farmstead products. One 200-cow Vermont farm just raised its farm-store milk price by 50 cents per gallon, explicitly citing the Senate vote in its newsletter.
Focus on what you can control: direct sales, agritourism, and value-added products. Let the big operations fight over school contracts while you capture consumers wanting “real milk from local farms.”
Looking Forward: The Next Policy Battle
What worries me—and what should worry every producer—is how this pattern might repeat. Some policies constrain the industry; farms adjust or die. Then the policy reverses after structural damage.
The next fight’s already visible: methane regulations, water usage restrictions, carbon credit requirements. Each sounds reasonable in isolation. But we’ve learned what happens when agriculture loses narrative control to health or environmental advocates.
Dr. Kathleen Merrigan, who was USDA Deputy Secretary from 2009 to 2013 and now runs the Swette Center at Arizona State, advises starting to build coalitions now, before you need them. “Dairy can’t win these fights alone anymore,” she told me.
The producers surviving another decade won’t just be efficient operators. They’ll be politically savvy, coalition-aware, and positioned for multiple market channels. School whole milk is one opportunity, but it’s not salvation.
The Essential Reality
After covering this industry through 2009’s depression, 2014’s price spike, the 2015-16 collapse, and COVID’s chaos, here’s what I know: The farms still standing have survived things that should’ve killed them. They’re tougher, smarter, and more adaptable than any generation before.
Whole milk returning to schools is vindication that we were right all along. But it’s arriving to an industry that’s fundamentally restructured from the one that needed it most. The 300-cow farms that testified in 2012 about survival needs? Most are gone. The 3,000-cow operations capturing school contracts in 2026? They would’ve survived anyway.
Understanding that gap—between policy victory and structural reality—that’s what helps you make clear-eyed decisions about your operation’s future. Position for opportunities that match your scale. Build coalitions before you desperately need them. And remember that being right about policy doesn’t guarantee policy changes in time to matter.
The next six months determine who captures the institutional whole milk opportunity. But the next six years determine who’s still farming when the next policy crisis hits.
Plan accordingly, folks.
KEY TAKEAWAYS
Action TODAY: Call your milk handler immediately with six specific questions (provided in article)—cooperatives report 50 calls/day with early callers getting priority for $40-80K contracts
Critical 6-month window: School RFPs release January 2026 → Bids due April → Contracts lock July 1. After July, breaking in requires displacing incumbents (nearly impossible)
Harsh economics: The same consolidation that killed 11,000 farms now blocks 97% of survivors from accessing institutional opportunities—whole milk’s return helps those who survived despite the policy, not because of it
Complete references and supporting documentation are available upon request by contacting the editorial team at editor@thebullvine.com.
Join over 30,000 successful dairy professionals who rely on Bullvine Weekly for their competitive edge. Delivered directly to your inbox each week, our exclusive industry insights help you make smarter decisions while saving precious hours every week. Never miss critical updates on milk production trends, breakthrough technologies, and profit-boosting strategies that top producers are already implementing. Subscribe now to transform your dairy operation’s efficiency and profitability—your future success is just one click away.
Your banker knows. Your co-op won’t say it. China’s birth crisis means your 300-cow dairy has 90 days to decide its fate. Here’s how.
EXECUTIVE SUMMARY: China’s 42 million tonne milk mountain isn’t temporary—it’s the product of a 48% birth rate collapse that permanently eliminates demand for 5% of global milk production. If you’re running a 200-500 cow dairy, this structural shift means you’re losing $359,609 annually compared to 2,000-cow operations, a gap that superior management cannot close. With milk prices locked at $16.50-18.00/cwt through 2027, you have exactly three viable options: borrow $8-15 million to scale beyond 1,500 cows, pivot to premium markets with guaranteed contracts (organic, A2, grass-fed), or execute a strategic exit that preserves your equity. The difference between acting now and waiting is stark—strategic exit today nets 70-85% of equity ($1.5M), while forced liquidation in 12 months recovers just 30-50% ($700K). Every month of indecision bleeds $23,000-55,000 through operating losses and accelerating asset depreciation. Your Q1 2026 decision isn’t about whether you’re a good farmer—it’s about whether you’ll control your family’s financial future or let market forces decide for you.
Let me share something that’s been on my mind lately—and I think it deserves careful attention from every dairy farmer reading this. China’s sitting on 42 million tonnes of surplus milk, based on their agriculture ministry’s September reports. That’s roughly 5% of global production, just… sitting there. And here’s what’s interesting: this isn’t your typical market cycle that we’ve all weathered before.
You know, I’ve been digging through the data, talking with economists at Cornell and Wisconsin’s dairy programs, and what’s emerging is a picture that’s fundamentally different from anything we’ve navigated since—well, probably since we all switched from hand milking to mechanical systems. Understanding why this time really is different —and knowing what steps to take right now —could make all the difference for your operation over the next 24 months.
Why This Crisis Breaks All the Old Patterns
So I was looking back at my notes from the 2009 downturn the other day. Remember that one? USDA data shows all-milk prices bottomed out at $11.30 per hundredweight in July 2009, then bounced right back within 12 months. The 2016 slump—you remember, when Russia imposed an embargo and the EU eliminated quotas—that stabilized within 18-24 months, according to the dairy network analysis I’ve been reviewing. Even COVID, for all its disruption, saw our sector adapt remarkably well within months. There’s actually some fascinating research in the Journal of Dairy Science from 2021 documenting how quickly we pivoted.
But China? This is something else entirely.
What farmers are discovering—and China’s National Bureau of Statistics backs this—is that we’re dealing with a demographic reality nobody can fix. Their birth rate collapsed from 12.43 per 1,000 people in 2016 to just 6.39 in 2023. That’s a 48% decline, folks. The population of kids aged 0-3… you know, the ones drinking all that infant formula? Down from 47 million to 28 million in just five years. Those babies don’t exist and won’t magically appear if milk prices recover.
The numbers don’t lie: China lost 19 million formula consumers (40% decline) while birth rates crashed 48%. This isn’t a cycle—it’s permanent demand destruction that eliminates 5% of global milk consumption. Your 2027 milk price depends on markets that will never return.
Here’s what happened: After that horrific 2008 melamine scandal—six babies died, 300,000 were hospitalized according to World Health Organization reports—Beijing went all-in on dairy self-sufficiency. The Chinese began importing hundreds of thousands of Holstein cattle in 2019, according to the customs data I’ve been reviewing. Average herd sizes grew 40% year-over-year through late 2023, if you can believe it. They hit 85% self-sufficiency, up from about 70%—exactly what they wanted. Problem is, they built all this capacity assuming demand would keep growing.
Now here’s where it gets really unusual. Chinese raw milk prices have been underwater for over two years—sitting at 2.6 yuan per kilogram against production costs of 3.8 yuan, based on China Dairy Industry Association data from October. Farmers there are literally paying to produce milk. Yet production continues, propped up by government subsidies, soft loans from state banks, and political imperatives that… well, they just don’t follow normal market rules.
The Hard Math Behind Mid-Size Dairy Challenges
USDA’s Agricultural Resource Management Survey data reveal a stark cost differential across farm sizes. And this isn’t about who’s a better farmer—it’s about structural economics that management alone can’t overcome.
Looking at production costs per hundredweight from the USDA’s dairy cost and returns estimates:
Farms with fewer than 200 cows: generally running $23.68-33.54/cwt
200-499 cows: around $20.85/cwt
500-999 cows: typically $18.93/cwt
1,000-1,999 cows: averaging $17.39/cwt
2,000+ cows: down to $16.16/cwt
The brutal economics of scale: Mid-size operations face an automatic $4.69/cwt cost disadvantage ($359,609 annually for a 300-cow dairy) that no amount of management skill can overcome. Market prices lock them into structural losses through 2027.
With USDA’s World Agricultural Supply and Demand Estimates showing milk prices at $16.50-18.00/cwt through 2026-2027, you can see the problem pretty clearly. A 300-cow operation faces production costs about $4.69/cwt higherthan a 2,000-cow operation. On annual production of, say, 76,650 cwt, that’s a $359,609 competitive disadvantagebefore you even wake up in the morning.
What’s really interesting is research by agricultural economists at Wisconsin showing that management quality accounts for only about 22% of the variance in profitability. The other 78%? That comes from herd size and the resulting cost structure. Labor costs alone create roughly a $2.60/cwt difference between mid-size and large operations. Fixed overhead adds another $3.33/cwt disadvantage. Even feed costs—where you’d think everyone’s buying the same corn—show about a $1.40/cwt advantage for large operations through volume purchasing and precision nutrition programs.
You just can’t manage your way out of that kind of structural disadvantage, no matter how good you are. And believe me, I’ve seen some excellent managers struggle with this reality.
Three Paths Forward: Finding Your Best Option
After talking with farm management specialists at Penn State Extension and Farm Credit consultants across the Midwest, three viable paths keep emerging for dairy operations facing this transformation. Each has specific requirements that need honest evaluation.
Path 1: Scale to Competitive Size (1,500-2,500+ cows)
I’ve noticed that farmers considering expansion need to tick quite a few boxes before this makes sense. Agricultural lenders at CoBank and Farm Credit are generally looking for:
Debt-to-asset ratio below 40% before you even start
At least $300,000-600,000 in working capital reserves (expansion disrupts cash flow for 12-24 months, as many of us have learned the hard way)
Access to $8-15 million in financing
Another 500-800 acres of land are available
Confirmation from your processor that they can handle the additional volume
As consultants like Tom Villenga in Wisconsin often explain, it typically takes 18-24 months from groundbreaking to positive cash flow. And farmers need to understand—you’re not really farming at that scale anymore. You’re managing 8-15 employees and running a business. It’s a completely different skill set.
Path 2: Pivot to Premium Markets
This development suggests a real opportunity for the right operations. Organic milk premiums are running $8-12/cwt over conventional, based on CROPP Cooperative’s October market reports. But location matters enormously here.
Economists at Cornell’s Dyson School have documented that you need to be within 75 miles of a metro area with a population of 250,000+ to make premium markets work. The affluent consumers who pay those premiums are concentrated in specific geographic areas—that’s just the reality of it.
What farmers are finding crucial: secure your premium buyer contracts before beginning any conversion. I keep hearing stories—you probably have too—of operations that completed expensive organic transitions only to discover no premium buyers existed in their region. That’s a tough spot to be in.
The conversion timeline’s no joke either. It’s a full three years before you see those organic premiums, based on USDA’s National Organic Program guidelines. During that time, you’re incurring organic costs while still selling at conventional prices. Budget $50,000-100,000 for a 300-cow operation to make that transition, based on case studies from Vermont’s sustainable agriculture program.
Path 3: Strategic Exit While Preserving Equity
Nobody likes talking about this option, but sometimes it’s the smartest move. Industry consultants like Gary Sipiorski at Vita Plus, who’s been working with dairy operations for decades, often point out that strategic exit while you’re solvent preserves 70-85% of equity. Forced liquidation after covenant violations? You’re looking at 30-50% if you’re lucky.
Here’s something most farmers don’t know about: Section 1232 of the bankruptcy code can save substantial capital gains taxes for farmers with highly appreciated land. Agricultural bankruptcy attorneys who specialize in this area explain that if appropriately executed before selling assets, farmers can save $200,000-500,000 in capital gains taxes through a strategic Chapter 12 filing. It’s worth understanding these provisions even if you hope never to use them.
The indicators suggesting this path include working capital trending below 6 months of operating expenses, being 55+ without a committed next generation, or simply having no viable path to profitability at forecast milk prices.
The Asset Value Reality Nobody Discusses
What’s particularly concerning—and I don’t hear this discussed nearly enough at co-op meetings—is how quickly farm asset values deteriorate when a region’s dairy sector struggles.
Mark Stephenson at Wisconsin’s Center for Dairy Profitability has done extensive work on this. When dairy becomes structurally unprofitable in a region and multiple farms exit simultaneously, those anticipated liquidation values farmers count on for retirement… they simply evaporate.
Think about it. Land you believe is worth $9,000 per acre based on that sale down the road last year? When 8-12 dairy farms in your county hit the market simultaneously with no qualified buyers, you might see $6,000-6,500. I’ve watched it happen in several Wisconsin counties over the past three years, and it’s heartbreaking.
Equipment values face the same compression. That 2018 John Deere you figure is worth $75,000? When six similar tractors are at auction within 50 miles, you might get $48,000. And dairy-specific infrastructure—milking parlors, freestall barns—they become nearly worthless without other dairy farmers to buy them.
Based on Farm Financial Standards Council accounting principles, farms in declining dairy regions face combined monthly wealth destruction of $23,000- $ 55,000 from operating losses and asset depreciation. Your farm’s value isn’t static—it’s changing every month based on regional dynamics.
Time destroys wealth faster than you think. A 300-cow operation valued at $1.5M today becomes $322K in 12 months—78% wealth destruction. Strategic exit today preserves $1.16M (77.5%). Forced liquidation after covenant violations leaves you with $323K (21.5%). That’s a $839,700 difference for waiting one year.
What Co-ops Are Saying vs. Market Reality
Comparing cooperative messaging against actual market data reveals… well, let’s call it a disconnect.
When co-ops say “market conditions will stabilize by late 2026,” they’re technically correct—USDA projects Class III prices around $18-19/cwt. But here’s what they’re not emphasizing: that’s still below breakeven for operations under 1,000 cows while remaining profitable for 2,000+ cow operations. In other words, “stabilization” actually accelerates consolidation rather than providing relief.
This disconnect partly stems from structural conflicts within the cooperative model itself. Market analysts like Phil Plourd at Blimling and Associates have documented how co-ops need maximum milk volume to spread fixed processing costs. They have an incentive to keep members producing, even at a loss—it’s just the nature of the cooperative structure.
What really caught my attention was data from the National Milk Producers Federation showing that DFA lost over 500 member farms in 2023. They’re anticipating shrinking from current levels to around 5,100 farms by 2030. That’s roughly a 9-10% annual attrition rate among their membership. If co-ops are successfully supporting family farms, why are 280+ farms leaving each year?
Looking Ahead: The 2028 Dairy Landscape
Based on consolidation trends documented by Rabobank’s dairy research group and factoring in China’s sustained market pressure, here’s what I think we’re looking at:
Total U.S. dairy farms will likely decline from today’s roughly 31,000 to somewhere around 20,000-22,000 by 2028—that’s a 29-35% reduction. But the distribution shift is even more dramatic.
Operations with 2,000+ cows, currently about 800 farms producing 46% of U.S. milk, will probably expand to 1,200-1,400 farms producing 60-65%. Meanwhile, that middle tier—200-999 cow operations in commodity production—faces a 75-85% reduction. It’s stark, but that’s what the data suggests.
What’s emerging are essentially three viable farm types:
Industrial-scale operations (2,000-5,000+ cows) competing on efficiency
Lifestyle farms (<100 cows) subsidized by off-farm income
The middle? It’s disappearing. And that’s a huge change for our industry.
Your Action Plan: Practical Steps for Right Now
For farmers reading this in late 2025, your window for strategic decision-making is measured in months, not years. Here’s what I’d suggest doing immediately:
This week: Calculate your true working capital per cow. Take current assets minus current liabilities, divide by cow count. If you’re below $800 per cow, you need to act fast.
Schedule a frank conversation with your banker about exactly where you stand relative to loan covenants. Don’t wait for them to call you—be proactive about it.
Have an honest family discussion about the farm’s actual financial position. I know these conversations are tough, but they’re essential.
And listen, if stress is affecting your sleep, relationships, or wellbeing, please reach out for help. The National Suicide Prevention Lifeline at 988, Farm Aid at 1-800-FARM-AID, and Iowa Concern at 1-800-447-1985 all have counselors who understand what you’re going through. There’s no shame in needing support—we all do sometimes.
Within 30 days: Engage an independent agricultural consultant—not your co-op field rep—for an honest viability assessment. Yes, it’ll cost $2,000-5,000, but it could save you hundreds of thousands in the long run.
Meet with an agricultural attorney who understands Section 1232 provisions and strategic options. Get real liquidation values for your assets from agricultural appraisers, not optimistic book values.
Develop three scenarios with your family: scale up, premium pivot, or strategic exit. Run the numbers on each. Be honest about what’s realistic for your situation.
The Success Story: Learning from Those Who’ve Navigated Change
Let me share a story about a family I’ll call the Johnsons—they represent what I’m seeing across eastern Iowa and similar situations throughout the Midwest. Third-generation dairy farmers with 380 cows faced this exact decision in early 2024, when working capital started to dwindle.
After careful analysis with their consultant, they executed a strategic exit in May 2024, using Section 1232 provisions to preserve an additional $180,000 in capital gains taxes. Today? They’re debt-free. The husband works as a herd manager for a 2,500-cow operation nearby. They kept their house and 40 acres. Their adult daughter started veterinary school this fall.
But let me be honest about something—when he talked with me about it, he said it was the hardest year of his life. “Watching that auction… seeing our cows loaded on someone else’s trailer… I couldn’t watch. Had to walk away.” His voice caught a bit. “Four generations of Johnsons milked those cows. Four generations.”
The identity crisis is real. The sense of failure—even when you’re making the smart financial decision—it’s overwhelming. He told me he didn’t go to the coffee shop for three months because he couldn’t face the questions. Couldn’t face being “the Johnson who lost the farm,” even though he’d actually saved his family’s financial future.
“But you know what?” he continued, “Looking at our grandkids playing in the yard, knowing they’ll have college funds, knowing we can sleep at night without worrying about milk prices… we made the right call. Hardest thing I ever did. Also, the smartest.”
That’s the kind of brutal honesty we need right now. Strategic exit isn’t failure—it’s protecting what matters most. But that doesn’t make it easy.
Key Takeaways for Your Decision
What this all boils down to is understanding that we’re experiencing a structural transformation, not a typical cyclical downturn. China’s demographic shift and production surplus represent permanent changes to global dairy demand—at least for the foreseeable future.
The $3-5/cwt cost advantage that 2,000+ cow operations enjoy over 200-500 cow farms simply can’t be overcome through better management. It’s structural, and we need to accept that reality.
Every month of delay in stressed markets costs not just operating losses but also substantial asset-value deterioration—that hidden wealth destruction that nobody talks about at the coffee shop.
Three paths remain viable for most operations: scaling to 1,500+ cows if you have the resources, pivoting to premium markets with guaranteed contracts, or executing a strategic exit while preserving equity.
The window for making these decisions strategically rather than under duress is closing. Industry dynamics suggest farmers need to commit to their chosen path by the end of Q1 2026.
And please, remember this: with farmer suicide rates running 3.5 times the national average according to CDC data, no amount of farm equity is worth sacrificing your wellbeing or family relationships. Your family needs you more than they need the farm.
The dairy industry’s undergoing its most significant transformation in generations. Like that shift from hand milking to mechanical systems, this change will determine which farms exist in 2028 and which become memories. The farmers who acknowledge this reality and act decisively—whether scaling up, pivoting to premium, or strategically exiting—will be the ones sharing stories of resilience rather than regret.
The choice, and the timeline, are yours. But that window for making the choice? It’s closing faster than most of us realize. What matters now is making an informed decision while you still have options.
KEY TAKEAWAYS:
This is structural, not cyclical: China’s 42 million tonne surplus reflects permanent demand loss from a 48% birth rate collapse—recovery isn’t coming
Your management can’t fix physics: 300-cow dairies face an automatic $359,609 annual disadvantage versus 2,000-cow operations at any skill level
Three paths remain viable: Scale past 1,500 cows ($8-15M investment), pivot to premium markets with secured contracts, or execute strategic exit today at 70-85% equity (vs. 30-50% in forced liquidation)
Every month costs $23,000-55,000: Operating losses plus hidden asset depreciation are turning $1.5M farms into $700K distressed sales
Control your exit or it controls you: Make your decision by Q1 2026 while you have options—after that, loan covenants decide your fate
Complete references and supporting documentation are available upon request by contacting the editorial team at editor@thebullvine.com.
Join over 30,000 successful dairy professionals who rely on Bullvine Weekly for their competitive edge. Delivered directly to your inbox each week, our exclusive industry insights help you make smarter decisions while saving precious hours every week. Never miss critical updates on milk production trends, breakthrough technologies, and profit-boosting strategies that top producers are already implementing. Subscribe now to transform your dairy operation’s efficiency and profitability—your future success is just one click away.
$29.2B dairy empire bought your breeding future while you celebrated – 384 court violations expose the scam
EXECUTIVE SUMMARY: While dairy farmers celebrated Fonterra’s NZ$3.845 billion sale as good news, French billionaire Emmanuel Besnier executed the most sophisticated agricultural power grab in modern history. Here’s what we discovered: Lactalis didn’t just buy processing plants—they bought control over genetic data from the world’s most advanced herds, positioning themselves to manipulate which genetics get promoted industry-wide. Australian courts documented 384 systematic contract violations designed to silence farmer criticism and eliminate market alternatives, yet regulators approved giving this company even more power. The brutal math shows operations over 2,000 cows now produce milk $10 cheaper per hundredweight than family farms, while we’ve lost 15,221 dairy operations in just five years—eight farms closing every single day. Genetic evaluation systems now prioritize processor efficiency over farm profitability, meaning you’re unknowingly breeding cattle that benefit their margins, not yours. This consolidation represents a fundamental shift from farming as an independent business to corporate employment disguised as “partnerships.” The window for collective resistance is closing faster than most producers realize—and that’s exactly what they’re counting on.
KEY TAKEAWAYS:
Contract Audit Defense: Pull every processor agreement from the last five years and document non-disparagement clauses, data ownership provisions, and unilateral termination rights that eliminate your bargaining power—this becomes your legal evidence file when exploitation escalates
Genetic Data Protection: Maintain independent production records using software you control, export all historical data from processor-connected systems before access gets restricted, and work with multiple AI organizations to prevent single-supplier dependency that hands breeding control to your milk buyer
Buyer Diversification Strategy: Build a quarterly-updated matrix of every processor within hauling distance, including contract terms, quality premiums, and genetic data policies—never become dependent on single-processor relationships that trap you in exploitative arrangements
Value-Added Premium Capture: Corporate consolidation creates direct-sale opportunities, but requires a realistic assessment of barriers, including FDA compliance, customer relationship building, and marketing skill development, which most traditional producers lack
Collective Action Timeline: Individual defense strategies buy time and negotiating position, but agriculture’s survival as an independent enterprise depends on producer-owned processing infrastructure and independent genetic evaluation systems being built faster than corporate consolidation eliminates alternatives
You know, I’ve been covering consolidation for over three decades, and this Lactalis-Fonterra deal…man, it keeps me up nights thinking about what just happened.
While farmers were celebrating that NZ$3.845 billion changing hands—and trust me, it sounded real good when you first heard it—French billionaire Emmanuel Besnier just pulled off the most sophisticated agricultural land grab I’ve witnessed in my career. Most producers? They still don’t realize what they lost.
This isn’t consolidation anymore. It’s genetic colonialism, plain and simple.
The $29.2 Billion Shadow Empire Controlling Your Breeding Decisions
Through the Fonterra acquisition, one French billionaire now controls processing and distribution across the world’s fastest-growing dairy markets.
Emmanuel Besnier. Ever heard of him?
Course not. That’s exactly how he wants it.
Forbes lists this guy at $29.2 billion—can you even wrap your head around that number? Operates Lactalis, pulling in over $30 billion annually according to their financial reports, while maintaining almost zero public presence. I’ve never seen him speak at World Dairy Expo. Never seen him shake hands at any trade show I’ve covered in thirty years. Just pure, calculated market control from behind the scenes.
The Fonterra acquisition gives one French family control over sixteen manufacturing facilities stretching from Queensland clear to Saudi Arabia, plus twenty-seven third-party relationships across Southeast Asia. But what really gets me isn’t the processing capacity.
It’s the genetic data they just bought.
When you’re processing milk from genetically advanced herds—and New Zealand’s got some of the best genetics on the planet, no question about that—you’re not just buying cheese brands. You’re buying the performance validation that determines which genetics get promoted industry-wide.
Every inline milk meter reading. Every component test. Every milking duration measurement.
They’re literally using your cows’ data to control your breeding choices. And most guys don’t even realize it’s happening.
The Contract Manipulation That Australian Courts Actually Documented
Violation Category
Number of Breaches
Impact on Farmers
Court Finding
Public Denigration Clauses
156
Silenced criticism
“Chilling effect”
Unilateral Termination Rights
98
Eliminated negotiating power
“Offending combination”
Exclusive Supply Penalties
87
Forced dependency
Market manipulation
Data Ownership Violations
43
Lost genetic control
Systematic exploitation
You want to know how these corporate giants really operate? I spent days digging through Australian Federal Court records from 2023…and what I found made my stomach turn.
Lactalis paid AU$950,000 in penalties for 384 separate breaches of their Dairy Code. But that’s not even the scary part. The scary part is what those court documents reveal about systematic farmer exploitation disguised as—well, as legal business practices.
They inserted these “public denigration” clauses into milk supply agreements. Basically, does it mean you criticize them publicly? They can terminate your contract. Just like that.
But here’s the real kicker—they gave themselves unilateral termination rights based on their own interpretation of what constituted criticism. ACCC Commissioner Liza Carver found these contracts created “a chilling effect on farmers…such that they did not speak up when they otherwise might have done so.”
Industrial-scale farmer silencing. Dressed up as contract law.
Each of those 384 violations? Individual farm operations locked into what the court called “an offending combination of clauses.” Contracts specifically designed to eliminate farmer market alternatives while maintaining the fiction of competitive choice.
Their dairy regulations require processors to offer both exclusive and non-exclusive supply options. Sounds fair, right?
Dead wrong.
Lactalis offered non-exclusive deals with such severe price penalties that farmers couldn’t economically accept them. Legal manipulation that eliminates choice while looking totally legitimate on paper.
The Genetic Data Trap Most Guys Miss Completely
Corporate consolidators don’t win by being better farmers. They win by controlling the definition of efficiency itself. And that…that keeps me up at night.
Take the new Milking Speed genetic evaluation that CDCB launched this year. Every milking duration measurement from your inline meters flows through dairy records processing directly to industry databases. When processors control the majority of this performance data, they know which genetics work best in their systems…not necessarily yours.
Bulls get promoted based on daughters that milk fast in processor-controlled validation systems, even if those same genetics require higher feed costs or reduce reproductive performance. Your fresh cows might be cycling poorly during breeding season—and don’t even get me started on what happens to your SCC when you push these high-speed milkers too hard through the parlor—but if they milk out quickly for the processor? That bull’s getting promoted.
This time of year, when guys are making breeding decisions for their fall fresh cows, how many are choosing bulls based on genetic indexes that prioritize processor efficiency over their own butterfat numbers? Over their own management system?
We’re breeding for processing efficiency instead of farm profitability. Without even realizing it.
The Regulatory Breakdown That Made This Corporate Heist Legal
The Australian Competition and Consumer Commission’s July approval reveals either breathtaking incompetence or…well, let’s just say questionable decision-making. I read through their analysis, and it’s disturbing how thoroughly they missed the point.
Their reasoning? “Fonterra and Lactalis have differing end product mixes” with “only limited overlap between operations.”
This completely misses how modern market power actually works. It’s not about buying your direct competitors—that’s old-school monopoly thinking from the 1980s. Today’s corporate giants achieve control by acquiring complementary infrastructure.
Sound familiar? Same exact logic that let Tyson dominate poultry by buying “different” parts of the supply chain—feed mills, processing plants, distribution networks. Next thing you know, chicken farmers became contract growers on their own land.
But here’s the real smoking gun…the same ACCC that documented Lactalis’ systematic farmer exploitation through 384 contract violations somehow concluded that giving this company more market power posed no competitive concerns.
That ain’t regulatory oversight.
The Farmer Organization Silence That Reveals Financial Capture
Why aren’t farmer advocacy groups screaming bloody murder about this consolidation? Well…
Organizations consistently prioritize “working with processors” over challenging consolidation when you examine their actual policy positions. And honestly, it feels like our own organizations have been turned into corporate PR departments while farmers weren’t paying attention.
When your advocacy groups spend more time talking to processors than to producers…something’s fundamentally broken in the system.
The Brutal Math: What’s Actually Happening to American Dairy
The relentless elimination of family dairy farms shows no sign of slowing—with more than 8 operations closing every single day, the consolidation crisis has eliminated over 15,000 farms in just five years.
Let me lay out some numbers from the USDA’s 2022 Census of Agriculture that’ll make your head spin. When I’m doing my fall review each year, I always dig into the latest data…and it gets more depressing every single time.
We lost 15,221 dairy farms between 2017 and 2022. That’s more than eight farms closing every single day for five straight years.
Eight farms. Every day. Think about that during morning milking.
But here’s the part that should really get your attention…while farms were disappearing, total milk production actually increased. Fewer farms producing more milk means somebody figured out how to make this work on a massive scale while everyone else got eliminated.
According to the Census data, we lost dairy farms of every size except those milking 2,500 cows or more. Those mega-dairies? They’re the only ones that increased in number, and now they control significant portions of U.S. milk production despite being a tiny fraction of total farms.
The economics are brutal when you break it down. Dr. Mark Stephenson at UW-Madison—a guy who really knows his numbers—has calculated that operations milking more than 2,000 cows operate about $10 less per hundredweight than farms with 100 to 199 cows. In 2022, that meant total production costs of around $23 versus $33 per hundredweight.
The $10 per hundredweight cost advantage that mega-dairies hold over family farms translates to millions in competitive advantage—mathematical proof that the playing field isn’t level anymore.
Ten bucks doesn’t sound like much…until you multiply it across millions of pounds annually. That’s the difference between profit and bankruptcy when milk prices are tanking and feed costs are through the roof.
The Three-Tier System That’s Already Here
The transformation is complete—mega-dairies now control nearly two-thirds of American milk production, proving consolidation isn’t coming, it’s already here.
While everyone’s arguing about whether consolidation is good or bad, it’s already happened. We’re living in a three-tier agricultural system right now—and most farmers don’t even recognize it.
The Mega-Dairies
Operations with 1,000+ cows now control 65% of the nation’s dairy herd, according to Dairy Herd Management’s analysis of USDA data. Algorithms, not farm families, make production decisions. The “farm manager” is basically running a factory that happens to have cows in it.
Contract Production Units
This is where most mid-sized operations are headed, and honestly, it scares me more than the mega-dairies. It’s the poultry model applied to dairy. Farmers invest millions in corporate-specified infrastructure while corporations control genetics, feed protocols, marketing…everything that actually matters.
The National Family Farm Coalition documented that 98% of broiler chickens are now raised under production contracts between processors and farmers. Same exact model’s being applied to dairy right now.
Niche Survival Operations
Small farms serving premium markets that corporate systems can’t efficiently access. They’re constantly one market disruption away from closure because the economics don’t add up at a small scale unless you’re capturing serious premiums through direct marketing. And that requires a whole different skill set than milking cows.
The Asia-Pacific Growth Being Captured for Corporate Shareholders
Industry publications love talking about massive Asia-Pacific dairy market growth. Sounds great for farmers, right?
Wrong again.
Lactalis just positioned itself to capture this growth for shareholders rather than distribute benefits across farming communities. This acquisition gives them control over distribution networks in Malaysia, Indonesia, Sri Lanka, and Saudi Arabia—markets experiencing significant growth in dairy consumption, according to industry analysis.
For independent producers, this means systematically reduced buyer competition throughout these growing markets. When one company controls that much distribution infrastructure, they don’t need to fix prices. They just coordinate supply chain behavior in ways that favor their margins over your farm gate prices.
Talk to any producer who’s tried to export…it’s already getting tougher to find buyers who aren’t somehow connected to these big players.
What Your Individual Defense Strategy Can’t Actually Fix
I’m gonna give you concrete defensive tactics in a minute. But let’s be brutally honest about something…individual resistance can’t stop what we’re witnessing here.
These mega-dairies have every advantage in the book. Economies of scale, they own the plants AND the trucks, they’ve got feed contracts most family operations can only dream about. How’s a 500-cow family operation supposed to compete when feed costs are brutal, and milk prices are bouncing around like a pinball?
The math just doesn’t work anymore.
Too many guys are still thinking they can out-manage their way out of this mess. But you can’t manage your way out of systematic market power imbalances. Just can’t do it.
Your Last-Ditch Defense Playbook – Though It Feels Like Bringing a Knife to a Gunfight
First thing you gotta do…audit every contract
Pull every agreement you’ve signed in the last five years. Document every clause that gives your processor unilateral power. Look specifically for:
Non-disparagement language restricting your ability to discuss processor practices publicly
Minimum volume requirements that consume most of your production capacity
Data ownership provisions giving processors rights to your genetic information
Unilateral termination clauses based on the processor’s “opinion” rather than actual violations
More paperwork, I know. But this becomes your legal evidence file when things go sideways—and they will.
Next thing…diversify your buyer relationships
Call every processor within reasonable hauling distance. Don’t just ask about current capacity—ask about contract terms, quality premiums, and genetic data policies. Build yourself a matrix with contact information and logistics. Update this quarterly.
Never, ever become dependent on single-processor relationships again. That’s exactly how they get you locked in.
Value-added opportunities exist, but be realistic about it
Corporate consolidation does create some premium opportunities for direct sales, but you gotta be realistic about the barriers. When butterfat’s tanking and Class III prices are bouncing around, some producers have found success with specialty marketing through cooperatives or direct sales.
But if you’re in traditional dairy country where every restaurant’s already locked into major distribution contracts…and farmstead cheese? Sure, if you’ve got an extra couple hundred thousand lying around for a processing facility, years to navigate FDA requirements, and the marketing skills to build customer relationships from scratch.
Most guys don’t have that luxury.
Protect your genetic data like it’s gold
Maintain independent production records using software you control, not processor-connected systems. Export all historical data from their platforms before access gets restricted. Work with multiple AI organizations to avoid single-supplier dependency.
When processors control genetic validation data, they control which genetics get promoted industry-wide. Your breeding program should optimize for your profitability and your management system, not their processing efficiency.
Political engagement—though I’m not optimistic anymore
Submit public comments on every agricultural consolidation in your region. Contact state legislators about processor contract regulation. This isn’t a civic duty—this is economic self-defense at this point.
Your voice in policy processes becomes your only competitive protection when market forces are stacked against you.
Though honestly…I’m not sure the political process moves fast enough to matter anymore. By the time regulations catch up, the consolidation’s already done and dusted.
The Bottom Line: Individual Strategies Have Real Limits
Individual defense strategies buy you time and negotiating position. But agriculture’s survival as an independent enterprise? That depends on collective alternatives being built, and built fast.
Independent genetic evaluation systems that maintain separation from processor control become critical infrastructure. Alternative financial networks supporting farm-level viability give producers options when traditional lenders prioritize corporate-backed operations.
But I’ll be straight with you…building these alternatives takes time, capital, and coordination that’s getting harder and harder to achieve as consolidation accelerates.
The French billionaire who just bought Asia-Pacific dairy infrastructure? He’s betting that farmers won’t organize effective resistance before corporate systems achieve control, which becomes really, really hard to reverse.
Your individual survival depends on defensive strategies implemented immediately. Agriculture’s future as an independent business depends on whether enough farmers recognize what’s happening and act collectively while there’s still time.
The transformation from farming to corporate employment—well, in my view, that’s happening by design, not natural law. What’s designed by humans can be redesigned by humans—if they act before it gets too late.
But the window’s getting smaller every day. And that French billionaire? He’s counting on most farmers not noticing until it’s already closed and locked.
You bet he is.
Complete references and supporting documentation are available upon request by contacting the editorial team at editor@thebullvine.com.
Learn More:
Why This Dairy Market Correction Feels Different – and What It Means for Our Farms – This article provides critical strategic insight into the current global market downturn. It shows how top producers are diversifying revenue streams and investing in operational efficiency to survive, giving you a roadmap to acquire distressed assets and emerge stronger.
The Next Frontier: What’s Really Coming for Dairy Cattle Breeding (2025-2030) – Beyond just defense, this article is a strategic guide to the future of genetics. It reveals how farmers can use emerging technologies like AI-driven breeding and gene editing to capture new revenue streams from premium markets, positioning your operation for future success.
Join the Revolution!
Join over 30,000 successful dairy professionals who rely on Bullvine Weekly for their competitive edge. Delivered directly to your inbox each week, our exclusive industry insights help you make smarter decisions while saving precious hours every week. Never miss critical updates on milk production trends, breakthrough technologies, and profit-boosting strategies that top producers are already implementing. Subscribe now to transform your dairy operation’s efficiency and profitability—your future success is just one click away.
How razor-thin margins, labor costs, and the drive for efficiency are forcing a reckoning in the British dairy industry.
Here’s what the dairy industry won’t tell you: those 190 UK farms that just quit? They were doing everything ‘right’ according to conventional wisdom—and it still wasn’t enough. Three decades after deregulation, a perfect storm of ruthless margin squeeze and the relentless demand for scale is forcing a harsh reckoning for producers.
The Numbers Tell a Stark Story
UK dairy producer numbers have plummeted from 30,000 in 1994 to just over 7,000 today – a devastating 77% decline following milk market deregulation
The latest data from AHDB’s survey of major milk buyers hits hard. Approximately 190 dairy farms exited the industry in the year ending April 2025, reducing the producer count to about 7,040—a 2.6% decline from the previous year. This marks one of the sharpest contractions in decades.
The sobering detail is that many of these exiting farms weren’t outliers; they were operating around the national average. As detailed in AHDB’s Producer Survey 2024, simply hitting average yields no longer guarantees survival.
The farms that remain are pursuing smarter growth strategies. The 2024 Defra Agricultural Census reports that average herd sizes have increased to approximately 165 cows. These producers balance improved genetics, refined feeding strategies, and the selective adoption of technology to expand without escalating costs.
The Unavoidable Economics of Dairy Farm Scale
Scale is no longer optional—it’s essential. According to Promar International’s UK Dairy Producer Cost Analysis 2025, leading producers sustain production costs between 41 and 43 pence per litre, closely aligned with milk prices, leaving minuscule profit margins.
Smaller farms, especially those managing fewer than 120 cows, face pronounced challenges. The Royal Association of British Dairy Farmers’ 2023 report notes that those hitting better yields can reduce costs by 2 to 4 pence per litre, a crucial buffer given feed prices oscillate between £280 and £320 per tonne.
Feed efficiency is where the real battle is fought. According to AHDB’s 2024 Feed Efficiency Benchmarking, achieving a feed conversion ratio below 0.9 kg dry matter per litre is not optional—it’s a vital survival metric.
Rising UK Dairy Labor Costs Force an Automation Reckoning
Labor costs continue to intensify. The 2024 Arla Foods UK Workforce Survey finds that skilled workers earn between £12 and £14 an hour. These are significant costs that demand a clear return on investment.
Automation can offer relief but carries a high price. Lely’s 2023 Robotic Milking Systems Report places system costs between £150,000 and £180,000, which typically require a herd of 60-70 cows to deliver a meaningful return. Borrowing rates at 6 to 8% further increase the financial risk.
Nevertheless, studies from the University of Reading document robotic milking’s potential to boost yields by 8 to 12 percent with optimized schedules and health monitoring—if margins and cash flow permit.
Market Power: How UK Milk Processors Squeeze Farm Margins
David Harvey, a professor at Newcastle University, notes that processors shift market risks to farmers while maintaining control over retail prices. Despite contract law reforms, the market balance remains skewed.
Two Paths Forward—Neither’s Easy
Producers face two main options: scale aggressively to trim costs or move into premium markets. Organic milk commands higher prices, but premiums vary by certification and region.
Dr. Sarah Jones of Harper Adams University warns growth must be smart—more than just adding cows, it’s about operational agility and economies of scale before costs spiral.
Which route makes sense for your operation? That depends on your current financial position, available capital, and a realistic assessment of local market access. One thing is certain: doing nothing guarantees exit.
What’s Coming Down the Track
Looking ahead, AHDB’s Market Outlook forecasts that the number of viable UK dairy farms will decline below 5,500 by 2030, signaling a consolidation wave that will reshape the industry’s production.
Though inheritance tax grabs headlines, The Conversation’s 2024 analysis clarifies that margin challenges, scale demands, and market consolidation are the true survival factors.
Bottom Line: Your Survival Checklist
Here’s what demands immediate attention:
Understand your true costs—calculate exactly what each litre costs to produce and benchmark against industry standards
Evaluate your scale honestly—determine whether you’re large enough to capture meaningful efficiencies or need to grow or specialize
Manage labor with clear eyes—decide whether you can afford competitive wages or if automation makes financial sense for your herd size
Clarify your market access—identify whether you’re limited to commodity pricing or can access premium distribution channels
This is the daily reality farmers face. Those who adapt strategically will continue to thrive years from now.
The right moves on scale, quality, and efficiency are your toolkit. Policy won’t be the safety net.
The consolidation wave is here and accelerating. The only question is whether you’re positioned to ride it—or be swept away.
KEY TAKEAWAYS:
Hit that 0.9 kg DM/litre feed conversion target, and you’re looking at saving £12+ per cow monthly; start measuring it weekly using your existing feed management software
Robotic milking pays off at 60+ cows with 8-12% yield bumps, but run those ROI numbers hard against current 6-8% borrowing rates before you commit
Scale economics matter more than ever—farms under 120 cows face 15-20% higher costs; consider partnerships or growth strategies now while credit’s still available
Labor costs hit £12-14/hour in the UK (similar pressures here); automate where it makes sense or get creative with efficiency improvements that don’t require new hires
Track your margins monthly, not quarterly—use farm management tools to spot trends early because 2025’s market volatility isn’t slowing down anytime soon
EXECUTIVE SUMMARY: Look, I’ve been digging into these UK farm exits, and here’s what’s really getting me… farms producing at national averages are still going under—that’s not supposed to happen, right? However, here’s the thing: the survivors aren’t just meeting benchmarks; they’re crushing feed efficiency targets, achieving below 0.9 kg DM per litre, and saving 2-4 pence per litre in costs. We’re talking about operations that’ve figured out the automation game too—robotic milking systems boosting yields 8-12% when you’ve got the herd size to justify it. The data from AHDB and similar research shows that it’s not necessarily about getting bigger… It’s about getting smarter with what you have. Those precision feeding tweaks? The genomic testing for better breeding decisions? That’s where the money is. You can’t just coast on “good enough” anymore—the margins won’t let you.
Complete references and supporting documentation are available upon request by contacting the editorial team at editor@thebullvine.com.
Learn More:
Unlocking Feed Efficiency: The Key to Dairy Profitability – This piece moves from theory to practice, offering actionable strategies to improve your feed conversion ratio. It details specific methods for ration formulation and bunk management that directly translate to lower costs and higher margins, as highlighted in our analysis.
The Dairy Business Plan: Your Roadmap to Success – While our article outlines the market pressures, this guide provides the framework for navigating them. It demonstrates how to build a robust business plan to manage risk, secure financing for growth, and make strategic decisions about scaling or specialization.
Genomic Testing: Is It Worth the Investment for Your Herd? – Beyond automation, this article explores a key tool for genetic improvement. It reveals how strategic genomic testing can boost herd efficiency, health, and long-term profitability, offering a different pathway to the ‘smarter growth’ our analysis identifies as crucial.
Join the Revolution!
Join over 30,000 successful dairy professionals who rely on Bullvine Weekly for their competitive edge. Delivered directly to your inbox each week, our exclusive industry insights help you make smarter decisions while saving precious hours every week. Never miss critical updates on milk production trends, breakthrough technologies, and profit-boosting strategies that top producers are already implementing. Subscribe now to transform your dairy operation’s efficiency and profitability—your future success is just one click away.
What if everything you’ve heard about immigration “killing” family farms is completely backwards? The data tells a different story entirely.
You know what gets me fired up at these? Listening to producers blame immigrant workers for killing the family farm when the real culprit is sitting right there in the economics. And honestly? After diving deep into the latest research, the data tells a completely different story than what we’re hearing in the local coffee shops or on the online chat groups.
The Thing About Blaming Immigration… It Just Doesn’t Add Up
I’ve been covering this industry for almost two decades, and I can’t tell you how many times I’ve heard the same refrain: “Illegal immigration killed the family dairy farm.” And look, I get it. When you’re watching neighbors sell out and consolidation happening all around you, it’s natural to want someone to blame.
The Economic Catastrophe of Losing Immigrant Dairy Workers
However, what really struck me when I began examining the comprehensive analysis is that immigrant workers currently produce 79% of America’s milk supply. And if we lost that workforce tomorrow? The economic modeling from Texas A&M shows milk prices would spike 90.4% and crater the entire industry by $16 billion based on half the immigrant workforce being potentially illegal.
That’s not exactly the profile of an industry being “killed” by immigration. That’s an industry that’s become completely dependent on it.
What keeps me up at night (and should keep you up too) is this: while we’ve been focused on the wrong enemy, the real forces reshaping dairy have been quietly restructuring everything around us. The producers who figure this out first? They’re the ones who’ll be writing the checks to buy out their neighbors in the next wave.
When 15,866 Farms Vanish in Five Years, Follow the Money
The numbers are absolutely brutal, and they’re accelerating. According to the USDA Census of Agriculture data, we lost 15,866 dairy farms between 2017 and 2022—that’s more than three operations closing every single day. I remember driving through central Wisconsin last fall, seeing “For Sale” signs where there used to be active dairies. It’s heartbreaking, but it’s also revealing.
Here’s what really gets your attention, though: while farms were disappearing, total milk production actually increased by 5%, from 215.5 billion pounds in 2017 to 226.4 billion pounds in 2022. Do the math. Fewer farms producing more milk means somebody has figured out how to make this process pencil out at a massive scale.
The geographic story is fascinating, too. Traditional dairy states are getting absolutely hammered—Wisconsin lost 2,740 farms, Pennsylvania lost 1,570, and New York lost 1,260. Meanwhile, states such as Texas, Idaho, and New Mexico are seeing significant investment in new facilities.
This isn’t random. It’s strategic capital following the most profitable opportunities. And the smart money? It’s not chasing labor arbitrage—it’s chasing pure economies of scale.
I was talking to a banker friend who specializes in dairy financing, and he put it bluntly: “The middle is disappearing. You’re either getting really big or you’re getting out.” The data backs this up completely.
Where the Action Really Is: The Structural Shift
The Great Consolidation: Only mega-dairies with 2,500+ cows grew in numbers while smaller operations vanished at unprecedented rates between 2017-2022
Herd Size
2017 Farms
2022 Farms
Change
Milk Share 2022
Under 100 cows
28,141
16,334
-42.0%
7%
100-499 cows
8,868
5,889
-33.6%
15%
500-999 cows
1,580
1,025
-35.1%
10%
1,000-2,499 cows
1,000
900
-10.0%
22%
2,500+ cows
714
834
+16.8%
46%
Source: USDA Census of Agriculture compilation
What strikes me about this data is how stark the bifurcation has become. We’re not talking about a gradual evolution—this is a fundamental restructuring where only the 2,500+ cow operations actually grew in numbers.
The Real Economics: Why Size Became Everything (And It’s Not Pretty)
The Economics of Scale: Large dairy farms operate with a crushing $16.50 per hundredweight cost advantage over small operations – the real force driving consolidation
Here’s where the conventional wisdom about immigration falls apart completely. According to a comprehensive USDA Economic Research Service analysis, farms with 2,000+ cows have production costs averaging $23.06 per hundredweight, while farms with 100-199 cows face costs of $32.83. That’s nearly a $10 difference per cwt.
Think about what that means in today’s market. With current milk prices hovering around break-even levels for most operations, this cost differential becomes absolutely critical. I’ve seen operations that were barely breaking even suddenly find themselves underwater when you factor in these structural differences.
If you’re milking 150 cows producing 60 pounds per day each, that cost differential is costing you about $27,000 annually compared to your large-scale neighbors. Over five years? That’s $135,000 in competitive disadvantage that has absolutely nothing to do with labor costs.
Why Size Matters: Cost Structure by Farm Size
Herd Size
Total Cost/cwt
Feed Costs
Labor Costs
Other Operating & Capital Costs
Net Return
10-49 cows
$37.00
$14.50
$12.00
$10.50
-$10.90
50-99 cows
$33.10
$13.80
$9.50
$9.80
-$7.20
100-199 cows
$28.10
$12.90
$6.50
$8.70
-$2.60
200-499 cows
$25.20
$12.50
$4.80
$7.90
-$0.10
500-999 cows
$23.00
$12.10
$3.50
$7.40
+$1.80
1,000-1,999 cows
$21.60
$11.80
$2.80
$7.00
+$3.00
2,000+ cows
$20.50
$11.50
$2.20
$6.80
+$4.00
But here’s the real eye-opener—and this surprised me when I first saw the breakdown: when you dig into non-feed costs, the difference between efficient and inefficient operations isn’t just a few bucks. According to the analysis spanning 2016-2022, while the difference in feed costs between the most and least efficient farms was $2.50 per cwt, the gap of non-feed expenses was a staggering $16.50 per cwt.
Capital costs, equipment, technology, compliance… these fixed expenses get spread across much larger volumes on mega-dairies. For smaller herds (under 1,000 cows), non-feed costs actually exceed feed costs. Your biggest expense isn’t what goes into the cow—it’s everything else. And that’s where the real consolidation pressure lives.
Dr. Mark Stephenson at the University of Wisconsin puts it this way: “The economics are pretty unforgiving. When your fixed costs are higher than your variable costs, you’re in a structurally disadvantaged position in a commodity market.”
The Labor Cost Misconception: Why That $10 Gap Isn’t About Cheap Wages
You might be looking at that nearly $10 per cwt labor cost difference between small and large herds and thinking, “Well, of course—immigrant workers accept lower wages.” But honestly? That assumption gets the story completely backwards.
Here’s what’s really happening with labor costs across different farm sizes:
Herd Size
Labor Cost/cwt
Primary Labor Type
Actual Dynamics
10-49 cows
$12.00
Mostly unpaid family labor
High “cost” due to opportunity value
500-999 cows
$3.50
Mix of hired and family
Transition to paid workforce
2,000+ cows
$2.20
Primarily hired labor
Scale efficiency with higher wages
Large Farms Actually Pay More, Not Less
The data flips the conventional assumption on its head. Large farms that employ the most immigrant workers are actually paying higher cash wages, not lower ones. Recent analysis shows median wages for dairy workers increased 33.7% between 2019 and 2022, far outpacing the national median wage increase of 7.4%. These wage increases are happening primarily on the large-scale operations that dominate milk production.
Where the Real Cost Difference Comes From
The labor cost gap stems from three fundamental factors that have nothing to do with wage suppression:
Scale Efficiency: Large farms spread their labor costs across vastly more milk production. A single worker on a 2,000-cow operation manages far more production than a worker on a 100-cow farm—it’s pure productivity math.
Labor Structure Differences: Small farms rely heavily on unpaid family labor, which economists count as an opportunity cost. When USDA calculates that $12.00/cwt labor cost for small farms, most of it represents what family members could earn working elsewhere, not actual cash wages paid.
Operational Productivity: Research consistently shows that larger operations achieve higher labor productivity per cow. It’s not about paying workers less—it’s about systems that allow each worker to manage more animals effectively.
The Availability Reality
The bigger issue isn’t wage levels—it’s workforce availability. The industry turned to immigrant labor not because it was cheaper, but because it was the only workforce available and willing to do demanding, year-round dairy work. One Vermont farmer reported receiving applications from only two native-born workers compared to 150 immigrants over a 20-year period.
This labor cost differential reflects economic efficiency, not exploitation. If anything, the consolidation pattern we’re seeing isn’t driven by a race to the bottom on wages—it’s driven by fundamental productivity advantages that make large operations more efficient at converting labor input into milk output.
The Labor Reality: Why Immigration Became Essential, Not Destructive
Now let’s talk about what’s really happening with labor, because this is where the narrative gets completely turned around. Research consistently shows that immigrant workers make up 51% of the dairy workforce, but here’s the critical detail: farms employing immigrant labor produce 79% of the nation’s milk supply.
This isn’t about wage suppression—it’s about availability and willingness to do the work. I know a Vermont farmer who told me that over the past 20 years, he received applications from exactly two native-born workers, compared to 150 immigrants. The domestic workforce simply isn’t showing up for these jobs.
And wages have been rising substantially. The median advertised wage for meat and dairy workers increased 33.7% between 2019 and 2022, far outpacing the national median wage increase of 7.4%. Labor now accounts for 18% to 25% of total operating costs.
Here’s what should concern every strategic planner: the industry has become completely dependent on a workforce that exists in legal limbo. The H-2A guest worker program? It’s designed for seasonal work, not the 365-day reality of dairy farming. The industry adapted by hiring workers who were available and willing.
What’s fascinating—and honestly alarming—is the economic modeling from the 2015 Texas A&M University study that shows what happens if we lose this workforce. We’re talking about 2.1 million fewer dairy cows, 48.4 billion pounds less milk production annually, and 7,011 dairy farms forced to close. Even a 50% reduction would result in a 45.2% spike in milk prices and cost the economy $16 billion.
One large-scale producer in Idaho told me recently, “People don’t understand—we’re not replacing American workers. We’re filling jobs Americans won’t take. And if this workforce disappeared tomorrow, we’d have dead cows within 48 hours because there’s nobody else to milk them.”
The Technology Factor: Why Capital Requirements Keep Climbing
While everyone’s been debating immigration, technology has been quietly reshaping what it takes to compete. I’ve watched operations install DeLaval VMS robotic milking systems that can reduce direct milking labor by as much as 60%—but they cost over $ 200,000 per unit. The efficiency gains are immediate, but so are the capital requirements.
This creates what researchers call a “technological treadmill”—farms must continuously invest in new systems to remain competitive, but the capital requirements keep rising. The operations that get this balance right? They’re using technology not to replace immigrant workers, but to optimize their productivity.
What’s particularly noteworthy is how this plays out regionally. In California’s Central Valley, you’ll see operations running fully automated feeding systems alongside skilled immigrant workers managing cow health and breeding. It’s not an either/or proposition—it’s about optimization.
Here’s the thing, though: only well-capitalized operations can afford these investments. A single robotic milking unit costs more than many small farms gross in a year. This widens the competitive gap even further.
The Processor Pull: How Downstream Changes Drive Everything
Here’s another force reshaping the industry that has nothing to do with immigration: processor consolidation. According to industry analysis, just three major cooperatives—Dairy Farmers of America, Land O’Lakes, and California Dairies—now handle over 80% of the nation’s milk marketing.
These processors need massive, consistent volumes. New processing plants require millions of pounds of milk per day to operate efficiently. From a logistical standpoint, it’s far more efficient to contract with a dozen 5,000-cow dairies than 500 smaller operations.
I was at a dairy conference in Wisconsin last year where a DFA representative candidly admitted: “We’re building plants that need 4-5 million pounds per day. We can’t deal with 200 small farms—we need 10 large ones.”
This “processor pull” creates powerful incentives for farm-level consolidation. I’ve seen it happen firsthand in regions where a new mega-processing plant opens—suddenly, there’s pressure on every farm in the area to either scale up or get squeezed out.
What Other Countries Are Doing (And Why It Matters)
What’s particularly interesting is how other major dairy countries are handling similar pressures. Canada’s supply management system presents a fascinating contrast—by controlling production through quotas and managing imports, they’ve maintained more stable pricing and slowed consolidation compared to the pure market approach in the United States.
New Zealand consolidated earlier but maintained more cooperative processing structures. The European Union provides more direct support for smaller farms through environmental programs tied to sustainability goals. Australia is experiencing similar consolidation, but with different labor dynamics due to its geographic isolation.
What strikes me about the international context is that the U.S. approach—relying heavily on immigrant labor while maintaining policy uncertainty—is actually unique among developed dairy economies. And arguably more risky. Countries like Denmark and the Netherlands have invested heavily in automation and environmental sustainability, positioning themselves for long-term competitiveness in ways that go beyond pure scale.
This matters because global dairy markets are increasingly interconnected. When New Zealand experiences a drought or the EU changes its environmental regulations, it affects milk prices in the country. Understanding these dynamics helps explain why simply reverting to “how things used to be” isn’t a viable strategy.
The Environmental Reality Nobody Talks About
Here’s something that’s becoming increasingly important but doesn’t receive enough attention: environmental sustainability is becoming a major factor in the dairy industry’s future. Large-scale operations actually have some advantages here—they can afford advanced manure management systems, precision nutrient application, and energy-efficient technologies.
But there’s a catch. Consumer demand for sustainable dairy products is growing, often favoring smaller, more transparent operations. I’ve seen mid-sized farms in Vermont and upstate New York finding success by positioning themselves as environmentally responsible alternatives to both industrial operations and imported products.
Climate change is also reshaping where dairy farming is economically viable. Heat stress in traditional dairy regions, such as Wisconsin and Pennsylvania, is becoming more severe, while some northern regions are becoming increasingly attractive. This geographic shift is another factor driving consolidation patterns.
The seasonal reality is becoming increasingly challenging. Extreme weather events—whether it’s the polar vortex hitting the upper Midwest or heat domes over California—are testing operational resilience in ways that favor larger, more diversified operations with better infrastructure.
Quick Wins for Different Operation Sizes
Let me get practical for a minute. Based on current industry trends and the economic realities we’ve discussed, here’s what makes sense for different types of operations:
If you’re running 100-500 cows: Focus on milk quality premiums immediately—there’s money on the table most producers aren’t capturing. Explore value-added opportunities within 18 months, not five years from now. Consider cooperative processing partnerships, where you can maintain some independence while gaining the benefits of scale. And honestly? Evaluate organic transition economics seriously, because the premium is real and growing.
I know a 300-cow operation in Vermont that transitioned to organic three years ago. They’re now getting $45 per cwt while their conventional neighbors are struggling at $21. The transition wasn’t easy, but the math works.
If you’re running 500-2,000 cows, You’re in the challenging middle ground. Invest in selective automation—feeding and monitoring systems provide the biggest bang for your buck. Strengthen your processor relationships now, while you still have options. Consider geographic expansion versus local intensification carefully, because land costs vary dramatically by region. And develop immigration compliance programs immediately—this is no longer optional.
If you’re running 2,000+ cows: Accelerate technology adoption across all systems. Diversify your processing relationships to avoid being dependent on a single buyer. Invest heavily in labor retention programs, as turnover is a costly expense. And seriously consider vertical integration opportunities—controlling more of your supply chain reduces risk.
The Future: What’s Really Coming
Here’s what I think happens next, and I’ve been tracking these trends for the better part of two decades. The industry is continuing to bifurcate into two completely different businesses. One is high-volume, technology-intensive, professionally managed—think of it as manufacturing milk. The other is value-added, locally focused, and relationship-based—more akin to artisanal production.
The middle ground—traditional commodity farming at moderate scale—becomes increasingly untenable. Not because of immigration, but because of the economic fundamentals that make the costs unsustainable.
The Brutal Reality: Milk Price Volatility Crushes Small Farms
Current market projections show challenges ahead. Feed costs remain volatile, labor availability continues to tighten, and consumer expectations around sustainability are rising. The operations that adapt to these realities will be the ones writing the next chapter.
What This Really Means for Your Operation
The narrative that immigrant labor “killed” the evidence doesn’t support the traditional American dairy farm. What we’re seeing is economic inevitability driven by structural forces much bigger than labor costs.
Immigrant workers didn’t kill the family dairy farm—they’ve been keeping the lights on while economic forces determine who survives consolidation. The presence of this workforce didn’t cause small farms to fail; rather, its availability allowed large farms to succeed in a market that demanded scale.
The real threat to the current U.S. dairy industry—and to the stability of the nation’s milk supply—is not the presence of this workforce, but the profound economic and operational risk posed by its potential removal. According to the Texas A&M analysis, losing this workforce would result in $16 billion in economic damage.
The farms that survive and thrive will be those that recognize these realities and adapt accordingly. That means making strategic decisions about scale, technology investment, labor management, and market positioning based on economic factors, not political considerations.
While everyone else is fighting yesterday’s battles, the smart money is already preparing for tomorrow’s opportunities. The question isn’t whether consolidation will continue—it’s whether you’ll be a consolidator or get consolidated.
Because honestly? The producers who understand what’s actually driving these changes are the ones positioning themselves to write the next chapter of American dairy farming. And that story will be about adaptation, not blame.
Discussion Starters for Your Next Producer Meeting:
How has your cost structure changed over the past five years, and what’s driving the biggest increases? Are you seeing the same labor availability challenges in your region? What technology investments are you considering, and what’s holding you back? How are you preparing for continued consolidation in your area?
These aren’t easy questions, but they’re the right ones. Because the future of dairy farming won’t be determined by who we blame for the past—it’ll be shaped by who’s smart enough to adapt to what’s actually happening.
KEY TAKEAWAYS
Scale Economics Are Everything: Farms with 2,000+ cows operate at $23.06/cwt while 100-199 cow operations face $32.83/cwt costs—that $27,000 annual disadvantage for a 150-cow herd adds up to $135,000 over five years. Start calculating your true non-feed costs per cwt immediately and compare against these benchmarks to see where you really stand in 2025’s unforgiving market.
Technology Investment Pays Off: Robotic milking systems reduce direct labor by 60% with 7-10 year payback periods, while automated feeding cuts feeding labor 40% with 5-8 year ROI. Evaluate selective automation for feeding and monitoring systems first—they give the biggest bang for your buck and help you compete with mega-dairies on efficiency metrics.
Immigration Compliance Is Risk Management: With immigrant workers producing 79% of US milk supply, losing this workforce would spike retail prices 90.4% and cost the economy $16 billion according to Texas A&M research. Implement robust I-9 compliance programs now and consider labor-saving technology as insurance against workforce disruptions in today’s volatile policy environment.
Processor Consolidation Demands Volume: Just three cooperatives control 80% of milk marketing, and new processing plants need millions of pounds daily to operate efficiently. Strengthen your processor relationships immediately while you still have options, or explore value-added opportunities that let you escape the commodity price cycle entirely.
EXECUTIVE SUMMARY
You know what’s been driving me crazy at these industry meetings? Everyone’s pointing fingers at immigrant labor for the death of small dairies when the numbers tell a completely different story. The real killer isn’t immigration—it’s a brutal $10 per hundredweight cost disadvantage that makes smaller farms economically impossible to sustain. We lost 15,866 dairy farms between 2017 and 2022, but here’s the kicker: milk production actually increased 5% during that same period. Only operations with 2,500+ cows grew in numbers, jumping from 714 to 834 farms, and they now control 46% of all US milk production. The consolidation everyone’s seeing? It’s pure economics—large farms spread their massive overhead costs across millions more pounds of milk, while smaller operations are drowning in fixed expenses that exceed even their feed costs. Instead of fighting the wrong battle, progressive producers need to understand these economic realities and position themselves accordingly… because the farms that adapt to this new reality are the ones writing the checks to buy out their neighbors.
Complete references and supporting documentation are available upon request by contacting the editorial team at editor@thebullvine.com.
Learn More:
Winning the Workforce War: How Top Dairies Are Solving Labor Shortages in 2025 – Practical strategies for reducing 38.8% turnover rates through structured training programs, creative compensation packages, and strategic automation investments that deliver measurable ROI while addressing the labor dependency highlighted in the consolidation analysis.
5 Technologies That Will Make or Break Your Dairy Farm in 2025 – Demonstrates how smart calf sensors, robotic milkers, and AI-driven analytics deliver measurable ROI within 7 months while addressing labor shortages and efficiency challenges that drive the consolidation forces discussed in the main analysis.
Join the Revolution!
Join over 30,000 successful dairy professionals who rely on Bullvine Weekly for their competitive edge. Delivered directly to your inbox each week, our exclusive industry insights help you make smarter decisions while saving precious hours every week. Never miss critical updates on milk production trends, breakthrough technologies, and profit-boosting strategies that top producers are already implementing. Subscribe now to transform your dairy operation’s efficiency and profitability—your future success is just one click away.
Stop chasing herd size. Smart farmers boost profits 42% through cooperative action while mega-dairies struggle with hidden genetic costs.
EXECUTIVE SUMMARY: The dairy industry’s “get big or get out” mantra is fundamentally flawed, and the data proves it. While consolidation advocates tout 37% lower production costs for 2,000+ cow operations, they’re ignoring the hidden genetic damage from heat stress that reduces productivity for three generations and the cooperative models delivering 42% price premiums during market crises. German farmers averaging just 30 cows each outperformed mega-dairies during the 2016 milk crisis through collective action, while New Zealand producers increased milk solids by 0.1% despite drought by focusing on component optimization over volume chasing. With only 7,040 dairy producers remaining in Great Britain—a 67% decline since 1995—the consolidation narrative is destroying rural communities while missing massive profit opportunities in genomic testing, breeding value optimization, and direct-to-consumer channels that can increase revenue 300-400%. Smart dairy operators need to stop asking “How big should I get?” and start asking “How can I optimize genetic merit, somatic cell counts, and component production with what I have?”
KEY TAKEAWAYS
Component Warfare Beats Scale Wars: Focus on 4.2%+ butterfat and 3.4%+ protein through precision breeding delivers $0.50-0.75/cwt premium over volume chasing, with German cooperatives proving 30-cow farms can outperform 2,000-cow operations during market volatility
Genetic Optimization Trumps Herd Expansion: University of Wisconsin research reveals heat stress creates multi-generational productivity losses of 8-10 pounds milk per day for three generations—invest in genomic testing and EBV selection for $35-45 per test instead of facility expansion
Cooperative Action Delivers Immediate ROI: European cooperatives handling 64% of milk deliveries achieve 20-30% input cost reductions through group purchasing power while maintaining democratic farmer control—join or form cooperatives rather than competing individually
Value-Added Production Crushes Commodity Competition: Converting raw milk to artisanal cheese generates 300-400% revenue increases with 18-24 month break-even timeline, while direct-to-consumer channels capture retail margins that mega-dairies can’t access
SCC and Feed Efficiency Override Cow Count: Target somatic cell counts below 200,000 cells/mL and optimal DMI of 22-26 kg/day for mature cows—these metrics determine long-term profitability more than facility size in 2025’s component-focused market
The dairy industry’s consolidation mantra has become gospel truth, but our comprehensive analysis of global data reveals that the farms winning aren’t just the biggest ones—they’re the smartest ones. While everyone’s chasing scale, innovative operators are building resilient businesses through cooperation, value-addition, and strategic positioning that challenge everything we thought we knew about dairy’s future.
The Uncomfortable Truth About Dairy’s Consolidation Obsession
Picture this: You’re sitting in your local co-op’s meeting room, listening to another consultant explain why your 200-cow operation needs to triple in size or disappear. The numbers seem compelling—larger farms achieve 37% lower production costs, higher Total Factor Productivity (TFP), better genomic testing adoption rates, and Estimated Breeding Values (EBVs). The same story echoes from Wisconsin to Wales, California to Canterbury.
But here’s what that consultant isn’t telling you: the “consolidate or die” narrative is leaving serious money on the table and bleeding rural communities dry.
Challenging the Scale-First Dogma
Let’s start by demolishing a sacred cow in the dairy industry: the assumption that bigger automatically means better. Our comprehensive analysis of global dairy consolidation trends reveals that while larger farms achieve significant cost advantages—farms with 2,000+ cows realize 37% lower production costs than operations running 200-499 head—the story isn’t that simple.
The latest data from Great Britain paints a stark picture of where pure consolidation leads. Only 7,040 dairy producers remained in April 2025—a 2.6% drop in just one year, continuing a trend that has seen approximately 1,000 producers exit in the past four years alone. Since 1995, Britain has lost a staggering 67% of its dairy farms, plummeting from 35,700 farms to 11,900 by 2020.
Yet here’s the kicker: milk production hasn’t collapsed. Instead, it’s concentrated into fewer hands, with average farm size reaching 165 cows and 1.77 million liters per operation—a 4% increase in milk volume per farm from the previous year. This statistical sleight of hand disguises a fundamental question: Are we optimizing for breeding efficiency and genetic merit, or just transferring wealth upward?
Why This Matters for Your Operation: These numbers aren’t just statistics—they represent a fundamental misreading of what drives long-term profitability in dairy. When we see evidence that many smaller farms achieve higher revenue per hundredweight while larger farms achieve lower costs, it suggests the “consolidate or die” narrative is fundamentally incomplete.
The Real Cost of Chasing Scale: Beyond the Parlor Door
The economic driving force of consolidation seems unshakeable. U.S. farms with 2,000+ cows achieve 37% lower production costs than operations running 200-499 head. That’s not just a competitive advantage—it’s like comparing significantly different costs of production when considering dry matter intake (DMI) efficiency and metabolizable energy (ME) optimization.
From 1970 to 2022, America went from 648,000 dairy farms to just 24,470—a breathtaking 96% reduction. Yet milk production more than doubled, with Total Factor Productivity growing 2.51% annually from 2000 to 2016. The largest farms (over 1,000 cows) showed even faster TFP growth at 2.99%.
The 2025 Profitability Reality Check
But here’s where the consolidation champions’ arguments start cracking like a poorly maintained concrete feed pad. The simultaneous occurrence of volatile milk prices and consistently rising input costs creates an unsustainable “cost-price squeeze” that disproportionately impacts smaller farms lacking economies of scale and financial reserves.
UK dairy farmers face extreme milk price volatility—farmgate prices surged 30-60% in 2021-2022, only to fall dramatically by 29.2% by June 2024 (from 51.51p/litre to 36.48p/litre). Meanwhile, 84% of British dairy farmers express concern over feed and energy prices, with fuel costs rising 3.5% year-on-year and land values increasing 4% in England and 23% in Wales in 2023.
Consider this dairy farming analogy: consolidation is like breeding for milk yield alone while ignoring somatic cell count (SCC), days in milk (DIM), and breeding efficiency scores from genomic testing. You might get impressive 305-day lactations, but your replacement rates skyrocket and lifetime productivity plummets.
The Seasonal Exit Pattern Nobody Discusses
Industry exits typically occur before winter housing and additional input requirements become seasonally higher, coinciding with changes to government support and additional supply chain requirements. This pattern reveals that farms aren’t strategically choosing to exit based on genetic improvement plans or herd optimization—they’re being squeezed out when cash flow can’t handle winter’s extra costs plus policy-driven compliance burdens.
Are you building an operation that will improve breeding indexes and component yields, or one that will struggle with transition period management for the next three generations?
What the Global Data Actually Reveals About Genetic Merit vs. Scale
Conventional wisdom starts cracking here: consolidation’s benefits aren’t automatically transferring to improved genetic progress or component optimization across different market environments.
The China Factor Everyone’s Missing
While consolidation accelerates in Western markets, China presents a different trajectory. The number of farms with more than 1,000 cows increased from 112 in 2002 to more than 1,350 by 2017, with China Modern Dairy now milking 135,000 cows—the world’s largest dairy operation—producing 3,300 tons of raw milk daily.
The Export Dependency Trap
Recent analysis reveals something uncomfortable for consolidation advocates. With approximately 95% of its dairy production destined for overseas markets, New Zealand demonstrates the vulnerability of export-dependent systems to global shocks. This export-driven imperative makes supply chains inherently vulnerable to external events, natural disasters, geopolitical tensions, and health crises.
Environment Act Compliance Burden
The Environment Act mandates expensive farm updates, with 91% of dairy farmers citing significant investment required for suitable slurry storage as a deterrent to increasing milk production. Brexit has introduced new trade upheavals and environmental regulations, including mandates to reduce ammonia emissions and stricter “Farming Rules for Water” regarding manure spreading.
The Cooperative Advantage That Actually Works: Proven ROI Models
While everyone’s obsessing over individual farm size, some of the most successful dairy operations globally prove that collective action beats individual scale, and the verified data backs this up with measurable returns.
The German Cooperative Success Story
Molkerei Berchtesgadener Land represents a powerful counter-narrative to consolidation. Established in 1927, this farmer-owned cooperative is owned by approximately 1,600 small family farms averaging just 30 cows each. During the brutal 2016 milk crisis that devastated the industry, these farmers received 42% more for their milk than the German average.
Implementation Timeline and ROI: The cooperative’s democratic structure took decades to build, but delivers immediate returns. Member farms receive:
42% price premium during market crises
20-30% reduction in AI and genetic testing costs through group purchasing
Access to shared nutritionist services reduces feed costs by 5-8%
Guaranteed markets regardless of herd size
Why This Matters for Your Operation: Collective bargaining isn’t just for large cooperatives. These farmers prove that organization, not just size, creates market power. When you can reduce input costs by 20-30% through group purchasing of semen from bulls with high TPI scores and access premium markets through collective marketing, you’re competing on intelligence rather than scale.
The European Cooperative Model
Cooperatives handle approximately 64% of all European cow’s milk deliveries, providing a crucial buffer against market imbalances and enhanced farmer bargaining power. These farmers leverage:
Group purchasing for genomic testing and breeding programs
Shared nutritionist services optimizing DMI and ME ratios
Collective marketing, capturing component premiums, is impossible for individual operations
India’s Smallholder Revolution
India’s Amul tells an even more dramatic story. This three-tier cooperative model serves 3.6 million farmers, with 86% operating 1-5 animals and collectively producing 62% of India’s milk. Exotic crossbred cows yield 8.12 kg/day compared to indigenous cows at 4.01 kg/day, but the cooperative structure provides market access, veterinary services, and breeding support that individual smallholders couldn’t access.
The Innovation Path That Big Ag Misses: Component Warfare and Value Capture
Smart farms are discovering that component optimization and value addition often beat scale expansion, and the verified data proves it with measurable returns.
Component Warfare: Your Farm’s Survival Strategy
New Zealand’s strategic shift toward milk component optimization over fluid volume shows another path. Despite severe drought conditions reducing milk collection by 0.5%, New Zealand farmers managed to increase milk solids production by 0.1%, leading to record payouts. This approach prioritizes higher butterfat and protein percentages, allowing for greater marketable value per unit of environmental impact.
Implementation Strategy and ROI:
Focus on breeding bulls with high component breeding values
Optimize rations for butterfat and protein using precision feeding systems
Target 4.2%+ butterfat and 3.4%+ protein through genetic selection
Expected return: $0.50-0.75/cwt improvement in component premiums
Why This Matters for Your Operation: A cow producing 70 pounds of 4.2% butterfat milk with low SCC generates more revenue than one producing 75 pounds of 3.8% butterfat milk with elevated cell counts. The math: (70 × 4.2 = 294 fat pounds) vs (75 × 3.8 = 285 fat pounds) when fat differentials are paying $0.25+/point.
Value-Added Production ROI Analysis
Converting raw milk into artisanal cheese can increase revenue by 300-400%, with specialty products fetching $20-30 per pound at farmers’ markets.
Implementation Costs and Timeline:
Initial investment: $15,000-25,000 for basic cheese-making equipment
Regulatory compliance: 6-12 months for licensing
Break-even point: 18-24 months for farmstead cheese operations
Expected ROI: 25-35% annually after establishment
Direct-to-Consumer Revolution
Direct-to-consumer channels create new opportunities for farms to capture retail margins. Online platforms, farm stands, and farmers’ markets let producers bypass traditional intermediaries while building customer relationships that larger operations can’t match.
Global Reality Check: Consolidation Patterns and Genetic Progress
The consolidation trend isn’t uniform globally, and the variations reveal critical insights about genetic improvement and productivity:
United States: From 648,000 dairy farms in 1970 to 24,470 by 2022—a 96% reduction. By 2020, over 60% of total milk production originated from farms with more than 2,500 cows, increasing from 35% in 2017 to 45% in 2022. Modern farms achieve higher milk yields per cow, reaching significant productivity improvements through intensive genetics programs.
European Union: Between 1983 and 2013, farms with dairy cows fell 81% in the original member states. The average herd size has more than doubled from 18 cows in 1990 to 45 cows in 2013, with modern farms characterized by higher milk yields, reaching an average of 7,791 kg/cow in 2023.
New Zealand: Post-deregulation consolidation through Fonterra, handling approximately 81% of production. Focus on pasture-based systems and milk solids optimization rather than pure volume, achieving record payouts despite environmental challenges.
India: The notable exception—86% of farmers operate 1-5 animals, collectively producing 62% of total milk. Cooperative networks enable smallholder viability through shared services and access to improved genetics.
Why This Matters for Your Operation: These global patterns reveal that consolidation isn’t inevitable—it’s a choice of policy and market structure. Countries with strong cooperative policies (EU, India) maintain more diverse farm structures than purely market-driven systems while still achieving genetic progress.
Actionable Implementation Strategies: Your 12-Month Roadmap
Independent or small-scale dairy farmers can remain competitive by adopting strategic approaches focused on genetic optimization, efficiency enhancement, and collective action.
Phase 1: Genetic and Management Optimization (Months 1-3)
Optimize Herd Performance Through Genetic Selection:
Implement genomic testing for breeding decisions ($35-45 per test)
Target bulls with high TPI scores for components, not just milk volume
Focus on breeding values for SCC reduction and reproductive efficiency
Expected improvement: 0.2-0.3 percentage points in butterfat within 2 years
Enhanced Nutrition Management:
Hire a consultant for TMR optimization ($2,000-4,000 annually)
Implement precision feeding using individual cow data
Target optimal DMI of 22-26 kg/day for mature cows
Monitor the ME intake of 245-275 MJ/day for peak lactation
Expected ROI: 5-8% reduction in feed costs per cow
Phase 2: Technology Integration (Months 4-8)
Precision Agriculture Implementation:
Install activity monitoring collars for heat detection ($100-150 per cow)
Implement automated data collection for breeding management
The Strategic Fork in the Road: Your Choice Matters
The verified data makes clear that consolidation forces don’t predetermine dairy’s future. Some farms will continue scaling up, and some regions will see further concentration. But the assumption that this is the only viable path is demonstrably false.
The Three Questions Every Dairy Farmer Must Answer in 2025:
Are you optimizing for the metrics that actually matter? SCC below 200,000 cells/mL, components above breed averages, and return over feed cost per cow determine long-term viability more than herd size.
Are you building genetic progress or just producing volume? Rather than milk volume alone, focus on EBVs for components, fertility, and longevity. Target breeding programs that improve Net Merit Index scores consistently.
Are you leveraging collective action for genetic and economic gains? Cooperatives handling 64% of European milk deliveries prove that the organization creates market power. What genetic resources and purchasing power are you sharing versus buying individually?
The farms thriving outside the consolidation model share common characteristics backed by measurable results:
Component-focused rather than volume-focused: Optimizing butterfat and protein percentages for premium pricing
Genetic merit optimization: Using genomic testing and EBVs for breeding decisions rather than visual selection
Collective action for market power: Leveraging cooperatives for purchasing, marketing, and shared genetic programs
Income diversification beyond commodity milk: Value-added processing and direct sales capturing retail margins
These aren’t fringe operations or hobby farms. They’re sophisticated businesses using different competitive strategies that often deliver better financial returns with lower risk profiles than the scale-chase model.
The Bottom Line: Beyond the Herd Mentality
Remember that consultant telling you to triple your herd size or get out? The global evidence suggests he’s wrong—or at least incomplete. While consolidation creates winners, it’s not the only path to winning, and the hidden costs are becoming impossible to ignore.
The comprehensive analysis reveals that while larger farms maintain cost advantages, the industry faces fundamental challenges that disproportionately impact smaller and mid-sized operations. But this doesn’t mean consolidation is inevitable—it means strategic positioning using genetic merit, component optimization, and collective action is essential.
The farms building sustainable competitive advantages aren’t just the biggest ones—they’re the ones prioritizing:
Genetic progress through genomic testing and EBV selection
Component optimization for butterfat and protein premiums
Cooperative relationships for purchasing power and market access
Value capture through differentiation rather than commodity production
These strategies require different skills than scale-chase expansion, but they offer genuine alternatives for farms unwilling or unable to pursue dramatic size increases.
Your next step? Stop asking “How big do I need to get?” and ask, “How can I optimize genetic merit and component production with what I have?”
Begin by:
Calculating your current return over feed cost per cow based on component pricing
Identifying the top 25% of your herd based on components, SCC, and breeding values
Implementing genomic testing for the next 20 breeding decisions
Researching cooperative opportunities in your region for group purchasing power
Those high-performing animals are showing you what’s possible with better genetics, precision nutrition management, and strategic market positioning—regardless of scale.
The dairy industry’s future will likely feature continued consolidation alongside diverse alternatives. But success won’t be determined by cow count alone—it’ll be determined by genetic merit, component optimization, strategic thinking, and the courage to choose your own path rather than following the herd.
Remember: In an industry where 96% of farms have disappeared since 1970, survival isn’t about following the crowd—it’s about finding the genetic progress and market positioning strategies others missed.
The bottom line is to focus on improving genetic merit and component production, build cooperative relationships for purchasing power, and start developing the direct customer relationships that will define dairy’s next chapter. The consolidation train is leaving the station—but there’s more than one track to ride, and the smartest operators are taking the component optimization express.
Data sourced from a comprehensive analysis of global dairy consolidation trends, including official government statistics, industry reports, and peer-reviewed research spanning multiple countries and decades of genetic progress data.
Complete references and supporting documentation are available upon request by contacting the editorial team at editor@thebullvine.com.
Join over 30,000 successful dairy professionals who rely on Bullvine Weekly for their competitive edge. Delivered directly to your inbox each week, our exclusive industry insights help you make smarter decisions while saving precious hours every week. Never miss critical updates on milk production trends, breakthrough technologies, and profit-boosting strategies that top producers are already implementing. Subscribe now to transform your dairy operation’s efficiency and profitability—your future success is just one click away.
China’s dairy exodus exposes the scale economics myth crushing small farms worldwide – your survival strategy needs mathematical precision NOW.
EXECUTIVE SUMMARY: Most dairy farmers still believe small-scale operations compete through “efficiency” and “family farm values” – but China’s brutal consolidation proves this romantic notion is economically fatal. Between 2008-2011, Chinese farms with 1,000+ cows increased from 9% to 16% of national production while small operations hemorrhaged market share, revealing that technology adoption barriers and feed costs representing 65-70% of expenses create insurmountable competitive disadvantages. Large-scale operations achieve production costs of $16-18/cwt compared to small farms’ $24-26/cwt through 75% labor reduction via automation, 25% feed cost savings through precision nutrition, and 28.5% yield improvements from consistent milking intervals. With automated milking systems delivering 11:1 ROI on genomic testing and precision feeding reducing costs by 25%, the mathematical reality demands strategic positioning through scale-up, niche-down, or cooperative power models. China’s 2.6% projected milk production decline in 2025 signals global supply-demand shifts affecting feed costs and premium market opportunities worldwide. The consolidation tsunami rewards operations that position themselves through verified industry intelligence rather than wishful thinking about traditional farming’s sustainability.
KEY TAKEAWAYS
Technology ROI Verification Exposes Scale Advantages: Automated milking systems ($200,000 investment) deliver 75% labor reduction and 28.5% yield improvements with 5.2-year payback periods, while genomic testing provides 11:1 ROI on breeding interventions – advantages only achievable at 500+ cow operations due to capital recovery requirements.
Feed Cost Mathematics Crush Small Operations: With feed representing 65-70% of production expenses and China importing 30% of livestock feed needs, global grain price pressure creates $6-8/cwt cost disadvantages for farms lacking precision feeding systems that reduce expenses by 25% through optimized nutrition delivery.
Premium Market Bifurcation Rewards Sophistication: Consumer shifts toward organic milk (25-40% premiums), A2 genetics (60%+ premiums), and specialty products requiring somatic cell counts below 150,000 favor operations with quality systems and certification capabilities that small commodity producers cannot economically justify.
Cooperative Power Multiplication Strategy: Successful models like Amul (returning 80% revenues to farmers) and Westby Cooperative (220 farm families sharing ownership) demonstrate how collective bargaining reduces input costs 15-25% while providing technology access equivalent to 1,000+ cow operation efficiencies.
Regional Cost Structure Reality Check: North American operations face $18-24/hour skilled labor costs with 40% annual turnover, while EU environmental compliance adds €15,000-25,000 annually per farm – making strategic positioning through verified technology adoption or premium differentiation essential for 2025 survival mathematics.
China’s small dairy farmers are exiting at unprecedented rates – and this structural transformation will reshape global dairy economics within 18 months. The verified reality: according to comprehensive industry research, between 2008 and 2011, the proportion of milk produced on farms with over 1,000 cows increased from 9% to 16% of national production, while production from farms with fewer than four cows decreased by 11%. The question isn’t whether consolidation will accelerate worldwide, but whether your operation will lead it or become its casualty.
Scale economics aren’t just pressuring operations in China – they’re coming for dairy farmers everywhere. While you’ve been debating organic premiums and sustainability certifications, the brutal mathematics of modern dairy have been rewriting the rules of survival. Rabobank reports that China’s milk production is expected to drop by 2.6% in 2025, marking its second straight year of decline, with farmgate prices falling 15% year-over-year in February alone.
Think of it like comparing a double-4 herringbone parlor against a 72-stall rotary when both are chasing the same commodity milk contracts. The numbers don’t lie, and they’re about to get a lot more unforgiving.
China’s Consolidation Reality – The Numbers Behind the Headlines
The scope of China’s dairy transformation defies comprehension. According to comprehensive research on China’s structural transformation, China’s dairy sector historically was characterized by many small-scale, backyard farms, often managing fewer than 20 cows and relying heavily on family-grown feed. As recently as 2006, more than 80% of China’s milk was produced on farms with fewer than ten cows.
The 2008 melamine contamination scandal became the pivotal moment that triggered massive structural change. This crisis, which sickened tens of thousands of children and resulted in at least six deaths, severely eroded consumer trust and exposed major food safety concerns linked to the fragmented production model. The government responded with the Dairy Structural Adjustment (DSA) policy, aimed at restructuring dairy farms by reducing small-scale operations and promoting large-scale, industrialized farms.
But conventional wisdom gets dangerous here: Most dairy farmers worldwide still believe small-scale operations can compete through “efficiency” and “family farm values.” The Chinese experience brutally exposes this romantic notion.
The current crisis is devastating. Industry data shows that Chinese farmers endured 24 consecutive months of declining milk prices through 2024, with domestic production oversupply creating historically high inventories of whole and skimmed milk powder. Recent analysis confirms milk production fell by 0.5% in 2024, with experts predicting another 1.5% drop in 2025.
The comprehensive research reveals that feed costs account for 65-70% of total dairy farming expenses in China, with domestic feed production covering only about 70% of livestock needs, necessitating costly imports. This economic reality forces many farms, especially small to medium-sized ones, to struggle, leading to closures or reduced herd sizes.
Why This Matters for Your Operation: The economic fundamentals crushing Chinese smallholders – chronic oversupply, processor market power, and technology adoption barriers – aren’t uniquely Chinese problems. They’re global dairy realities heading your way.
Implementation Barriers: The Reality Check Nobody Talks About
Here’s what industry publications won’t tell you about scaling up: The path to survival isn’t just expensive – it’s riddled with barriers that eliminate most operations before they even start.
Financial Implementation Barriers
Verified research shows that small and medium-sized dairy enterprises face critical financial obstacles:
Limited access to affordable financing with high interest rates reaching 8-12% annually
Lack of collateral for technology investments, with traditional lenders requiring 150-200% asset backing
Cash flow disruption during 5-7 year technology payback periods while maintaining existing operations
Hidden infrastructure costs often double initial investment estimates
Regional Financial Reality Check:
US Midwest: Equipment financing rates 6-8% with USDA backing, but still requires 20-30% down
EU Operations: CAP subsidies cover 40-60% of sustainability investments, but bureaucratic delays extend implementation 18+ months
Developing Markets: Interest rates 12-18% with limited technical support, making automation economically impossible
Technology Adoption Challenges
The research documents specific technology barriers that crush smaller operations:
Infrastructure Limitations:
Rural internet connectivity is insufficient for sensors requiring a minimum of 25 Mbps for real-time monitoring
Electrical capacity is inadequate for automated milking systems demanding 50-75 kW continuous power
Storage and handling facilities requiring $150,000-300,000 upgrades before automation installation
Skills and Knowledge Gaps:
Management complexity increases exponentially with scale – operations over 500 cows require specialized management systems
Technology troubleshooting demands expertise unavailable in rural areas, with service calls costing $200-500 per incident
Data interpretation skills are essential for precision farming benefits, requiring 40+ hours of annual training investment
Yogurt and probiotic drinks: $40.12 billion market growing at 8.35% annually
Premium milk segments: 66% of consumers willing to pay sustainability premiums
Functional products: 25-40% premium pricing for specialized dairy items
Technology Investment Reality:
Mengniu’s AI platform: First fully intelligent dairy factory with precision analytics
Yili’s international expansion: 52% year-over-year growth, focusing on Southeast Asia
Sustainability requirements: 30 national-level “green factories” setting global standards
Global Trade Flow Changes: Verified data shows China’s import recovery patterns:
2% overall import growth projected for 2025
6% increase in whole milk powder to 460,000 metric tons
Continued decline in skim milk powder as domestic capacity grows
The Bottom Line: Mathematics Versus Mythology
China’s dairy consolidation represents the leading indicator of global industry transformation. Comprehensive research documents how policy, economic, consumer, and technological factors combine to create unsustainable environments for smaller farms while widening competitive gaps.
The implementation barriers are not insurmountable, but they require strategic planning:
Financial preparation: 24-36 months of advance planning for technology investments
Skills development: Continuous training programs for precision agriculture adoption
Market positioning: Clear differentiation strategy before competitive pressure intensifies
North American producers: Leverage available financing and extension support systems
European operations: Maximize CAP subsidies while preparing for 2027 environmental mandates
Developing market farmers: Focus on cooperative models and appropriate-scale technology solutions
Technology ROI verification confirms that operations achieving competitive scale through verified precision systems see $285+ in additional profit per cow annually, but only with proper implementation support and management capability development.
Your strategic window closes rapidly. The verified evidence shows three distinct viable categories emerging: industrial-scale commodity producers achieving competitive costs through verified technology adoption, ultra-premium niche specialists commanding verified 25%+ premiums, and cooperative-backed alliances providing smallholder protection through collective action.
The Final Question: Are you ready to choose your scale strategy based on verified performance data rather than romantic notions? Consolidating evidence from China, the U.S., the EU, and India provides a clear roadmap – but only for those willing to acknowledge that implementation success requires addressing real barriers with practical solutions.
Choose your scale. Analyze the verified mathematics. Commit to evidence-based excellence. The consolidation tsunami waits for no one, but rewards those who position themselves ahead of the wave based on verified industry intelligence and realistic implementation planning.
Ready to evaluate your operation’s strategic positioning? The time for romantic notions about farming is over. The era of mathematical precision and verified implementation strategies has begun.
This analysis is based on verified research from peer-reviewed sources, government agricultural data, and established industry publications. All statistics and claims are traceable to original publication sources and verified as current for 2024-2025 market conditions.
Complete references and supporting documentation are available upon request by contacting the editorial team at editor@thebullvine.com.
Robotic Milking Revolution: Why Modern Dairy Farms Are Choosing Automation in 2025 – Demonstrates how AI-enhanced robotic systems deliver $1.75/cwt cost advantages through predictive health monitoring and automated precision, providing implementation roadmap for farms seeking competitive technology adoption without massive scale requirements.
Economies of Scale in Dairy – Reveals how Western vs. Eastern U.S. dairy operations achieve cost efficiency through different strategic approaches, showing practical methods for smaller farms to compete through premium positioning and intimate herd management rather than pure volume expansion.
Join the Revolution!
Join over 30,000 successful dairy professionals who rely on Bullvine Weekly for their competitive edge. Delivered directly to your inbox each week, our exclusive industry insights help you make smarter decisions while saving precious hours every week. Never miss critical updates on milk production trends, breakthrough technologies, and profit-boosting strategies that top producers are already implementing. Subscribe now to transform your dairy operation’s efficiency and profitability—your future success is just one click away.
50% of U.S. dairies have vanished since 2013. Will yours survive the next bloodbath? The math doesn’t care about tradition – adapt or die.
EXECUTIVE SUMMARY: The U.S. dairy industry’s consolidation is accelerating, with half of all farms disappearing since 2013 and another 50% projected to vanish by 2035. Survival hinges on scaling to 1,000+ cows or pivoting to niche markets like organic/grass-fed production while leveraging cost-slashing techs like robotics and genomics. Mega-dairies now dominate 70% of milk output, leaving smaller farms battling volatile prices and 34% higher feed costs. Brutal economics favor radical growth or hyper-specialization, with collaboration and tech adoption becoming non-negotiable. The clock is ticking farms must choose their path now or join the 4% annual closure rate.
KEY TAKEAWAYS:
Consolidation is accelerating: Industry half-life shrunk from 12 to 10 years – 12,000 farms will remain by 2035.
Tech is the great equalizer: Robotics, genomics, and methane digesters separate winners from casualties.
Collaborate or perish: Resource-sharing cooperatives and collective bargaining offset consolidation pressures.
No middle ground: Operators must commit to growth or specialization – hesitation guarantees obsolescence.
The numbers don’t lie: 50% of U.S. dairy farms vanished between 2013 and 2025. If that gut-punch statistic doesn’t rattle you, consider this—the industry’s consolidation “half-life” is accelerating. What took 12 years to cull half our farms now happens in 10. By 2035, only 12,000 dairies will remain. The question isn’t whether consolidation will claim more farms but whose. Are you evolving fast enough to outpace the 4% annual closure rate, crushing your neighbors? Let’s pull no punches: survival demands radical adaptation.
The Great Dairy Shakeout: By the Numbers
Here’s the cold reality:
Milk production surged 25.3 billion pounds since 2013, but 48 states lost dairy farms.
Texas added 195,000 cows while traditional strongholds like California bled operations.
80% of farms milk <500 cows, yet 70% of U.S. milk flows from 1,000+ herd mega-dairies.
This isn’t your grandfather’s industry. The USDA confirms what every farmer feels: scale equals survival. Herds under 500 cows face average costs exceeding milk prices, while 2,000+ cow operations turn profits. Dennis Rodenbaugh, CEO of Dairy Farmers of America (DFA), says, “Anticipating disruption isn’t optional. You build bridges to the future or get washed away”.
Scale or Fail: The New Reality of Milk Production
Forget ‘if’—ask ‘how fast’ you’ll scale. The 1,000-cow threshold isn’t arbitrary. USDA data shows these herds achieve 18% lower production costs than 500-cow operations through bulk purchasing, robotic efficiencies, and negotiating power.
But growth ain’t for the faint-hearted. Rodenbaugh warns, “Get disciplined or get out. The storm separating winners from casualties is accelerating”. Case in point: Midwest families selling out to Panhandle conglomerates where 25,000 cow goliaths churn out milk cheaper than Wisconsin’s pastures ever could.
The Price of Standing Still:
Feed costs up 34% since 2020
Heifer replacement expenses doubling
Milk price volatility swinging ±25% annually
“You’re either acquiring neighbors or becoming acquired,” says a fourth-gen Wisconsin dairyman who tripled his herd to 900 cows. “My kids won’t survive on 300-head nostalgia.”
Beyond Expansion: Alternative Paths Through the Storm
Not everyone can—or should—chase mega-dairy status. For sub-500 herds, niching down beats scaling up:
1. Organic Premium Play
Organic milk fetches $32.69/cwt vs. $21.50 conventional
But tread carefully: transitioning requires 3 years and $150K+ certification costs
2. Grass-Fed Guerrilla Tactics
Direct-to-consumer raw milk sales bypass processors, capturing a 300% markup
Caveat: Regulatory landmines lurk in 38 states
3. Tech-Enabled Micro-Dairies
Robotic milkers slashed labor by 40% for a 150-cow Vermont operation
AI breeding algorithms boosted conception rates by 22%
Sarah Lloyd, a Wisconsin dairy advocate, argues: “We’ve romanticized ‘get big or get out.’ Smart-small dairies leveraging tech and margins can outmaneuver dinosaurs”.
The Innovators: Tech Titans Reshaping Dairy
Game-changing tools separating survivors from the bankrupt:
Technology
Cost Range
ROI Timeline
Herd Size Suitability
Automated Feed Systems
$50K–$200K
2–4 years
500+ cows
Methane Digesters
$1M–$5M
5–7 years
1,000+ cows
Genomics Testing
$25/head
Immediate
All sizes
Robotic Milkers
$150K–$250K/unit
3–5 years
100–500 cows
Texas’s 5,000-cow colossus slashed labor costs by 60% via drones monitoring herd health. Meanwhile, Idaho’s 120-cow boutique dairy uses blockchain to trace grass-fed butter to Manhattan chefs at $12/lb.
The Bottom Line: Blood, Sweat, and 4% Annual Decline
Dairy’s Darwinian reckoning won’t pause for sentiment. Here’s your survival checklist:
Crunch your half-life math: If scaling to 1,000+ cows seems impossible, pivot to hyper-specialization now.
Embrace ‘coopetition’: Pool resources with neighbors for bulk inputs, tech sharing, and collective bargaining.
Bet on genomics: Top 1% genetics can boost yields 2,000+ lbs/cow annually.
Rodenbaugh’s final word? “The dairy game isn’t dying—it’s evolving. Future winners think in decades, not seasons”.
Your move. Will you be among the 12,000 left in 2035—or a statistic in The Bullvine’s following obituary for America’s heartland?
Dairy Product Alternatives: What is the Situation? Dive into the impact of plant-based dairy alternatives on traditional milk markets and learn how producers are fighting back to protect their industry.
Join the Revolution!
Join over 30,000 successful dairy professionals who rely on Bullvine Daily for their competitive edge. Delivered directly to your inbox each week, our exclusive industry insights help you make smarter decisions while saving precious hours every week. Never miss critical updates on milk production trends, breakthrough technologies, and profit-boosting strategies that top producers are already implementing. Subscribe now to transform your dairy operation’s efficiency and profitability—your future success is just one click away.
While politicians celebrate National Ag Day in DC, 40% of dairy farms have vanished in just five years. The hard truth is that big gets bigger while small disappears.
While bureaucrats and politicians pat themselves on the back during today’s National Ag Day celebrations, dairy farmers across America continue milking cows at 4 AM with little recognition and mounting regulatory burdens. The USDA’s glossy presentations and Capitol Hill photo-ops won’t mention how dairy farm numbers have plummeted while plant-based alternatives receive favorable treatment from regulators and media alike. Today’s National Ag Day events in Washington showcase agriculture’s importance, but The Bullvine asks: Why is dairy consistently treated as agriculture’s problematic stepchild despite being its economic backbone?
QUICK TAKE: NATIONAL AG DAY & DAIRY’S REALITY
The U.S. has lost 95% of dairy farms since 1970 (from 648,000 to 24,470)
Farms with 1,000+ cows (just 8% of farms) produce 68% of America’s milk
Large operations ($10/cwt cost advantage) are the only growing segment
Despite losing 40% of farms since 2017, milk production increased 5%
The Inconvenient Truth About National Ag Day Celebrations
National Ag Day, celebrated today during National Agriculture Week, was designed to recognize the contributions of all agricultural sectors. But let’s be honest about what’s happening. While officials gather in climate-controlled conference rooms in Washington DC, America’s dairy farmers face an increasingly hostile regulatory environment that threatens their existence.
The Agriculture Council of America hosts today’s main events: a morning virtual livestream from the USDA, an in-person celebration at the USDA Whitten Patio from 8:30-10:30 AM featuring the standard parade of officials, and an evening reception at the Russell Senate Office building. But how many of these events will directly address the challenges squeezing dairy producers nationwide? How many dairy farmers can afford to leave their operations to attend these political theater performances?
The stark reality is that while government officials celebrate agriculture in general, specific policies continue undermining dairy’s position in the American food system. The most alarming evidence is that the U.S. has lost nearly 40% of its dairy farms since 2017, according to the 2022 Census of Agriculture data released by the USDA’s National Agricultural Statistics Service. This represents the largest decline between adjacent Census reports dating back to 1982.
“Even though we’ve lost close to 15,000 dairy farms in five years, the amount of milk that we’re producing in this country has gone up from a similar number of cows,” says Lucas Fuess, dairy analyst with RaboResearch, highlighting the intense consolidation pressure facing the industry.
USDA’s Double Standard: Promoting Plant-Based While Dairy Struggles
The 2025 US Dietary Advisory Committee recommendations that may influence upcoming guidelines propose significant changes that could further challenge the dairy industry. Meanwhile, the Federal Milk Marketing Orders (FMMO) system, established in 1937 to regulate milk pricing based on end use, classifies milk prices by categories: Class 1 (bottled milk), Class 2 (yogurt), Class 3 (cheese), and Class 4 (butter and powdered dry milk).
The USDA ensures the public’s well-being and dietary recommendations are grounded in established, periodically updated science. The agency has also provided labeling guidance for plant-based milk alternatives to help consumers make informed choices. However, these efforts don’t address dairy producers’ fundamental economic challenges.
The Concerning Consolidation of American Dairy
The numbers tell a concerning story about dairy’s future. While nearly 40% of dairy farms disappeared in just five years, milk production increased by 5%. How? Through rapid consolidation. Today, just 2,013 farms with 1,000 or more cows (representing only 8% of all dairy farms) produce approximately 68% of America’s milk, up from 57% in 2017, according to the 2022 Agricultural Census.
This isn’t happening organically. Economic pressures have forced smaller operations to expand or exit the industry. According to the 2022 Agricultural Census, farms with 2,500 or more cows were the only segment that grew during this period, increasing from 714 to 834 farms. Meanwhile, herds of 20-49 cows declined the most on a percentage basis, followed by herds of 50-99 cows.
The economics are stark: According to Fuess, “Farms milking more than 2,000 cows can operate about less per hundredweight than farms with 100-199 cows, with a total cost in 2022 of .06 cwt.” This cost advantage drives the relentless push toward consolidation.
The Regulatory Burden Crushing American Dairy Farms
Today’s National Ag Day celebrations conveniently ignore the crushing regulatory burden dairy producers face. Environmental regulations, labor rules, water usage restrictions, and animal welfare requirements create a complex compliance landscape that disproportionately impacts family-owned dairy operations without the legal teams employed by corporate agriculture.
“Even if they are huge, it doesn’t mean the family is necessarily removed,” Fuess explains. “Instead, it just means that they have a significant employee base or are providing jobs and making a significant impact on their local, and sometimes very rural, communities.”
The Real Story Behind Dairy Farm Numbers
The glossy presentations at today’s National Ag Day events won’t mention the uncomfortable truth: America’s dairy farm decline is accelerating dramatically. In 1970, the United States had more than 648,000 dairy farms. By 2022, just 24,470 remained—a staggering 95% decline. This isn’t just a statistical trend—it represents thousands of multi-generational family businesses disappearing from rural communities.
Agriculture adviser Milton Orr from northeast Tennessee observed, “I remember when we had over 1,000 dairy farms in this county. Now we have less than 40.” Greene County has only 14 dairy farms today, reflecting the nationwide consolidation trend transforming rural America.
What National Ag Day Should Address
If National Ag Day indeed aimed to support all agricultural sectors equally, today’s events would address several critical issues facing dairy producers:
The need for more transparent labeling requirements preventing plant-based products from using dairy terminology
Restoration of whole milk options in school nutrition programs
Streamlined regulatory compliance for small and mid-sized dairy operations
Export support programs specifically targeting dairy products
Research funding for dairy-specific innovation
Instead, today’s celebrations will likely feature generic praise for agriculture without acknowledging the dairy sector’s specific challenges. The USDA and other agencies will tout their commitment to all agricultural sectors while continuing policies undermining dairy’s position in the American food system.
How Dairy Producers Can Fight Back: Actionable Strategies
For dairy producers watching today’s National Ag Day events with justified skepticism, several evidence-based approaches offer the potential for pushing back against the industry’s marginalization:
Optimize component production—Depending on your milk market, Focus on enhancing butterfat content for Class IV utilization (butter, powder) or protein content for Class III utilization (cheese). This strategic approach can maximize returns even in challenging price environments.
Target operational efficiency – With more extensive operations enjoying a $10 per hundredweight cost advantage, small and mid-sized producers must identify operational efficiencies without sacrificing quality or animal welfare.
Build direct consumer relationships – Create direct marketing channels through farm tours, social media presence, and community events that bypass mainstream media narratives about dairy. Research shows consumers are more supportive when they understand production practices.
Engage with policymakers – Rather than assuming officials understand dairy’s challenges, maintain consistent communication with representatives about specific regulatory burdens and their real-world impacts on your operation.
Document your sustainability story – As environmental concerns shape food choices, measure and communicate your operation’s progress in reducing environmental impacts and enhancing sustainability practices.
Participate in industry advocacy – Support organizations fighting for policy changes that level the playing field between dairy and plant-based alternatives. As the Census data shows, individual farms have limited power against structural economic forces.
Explore value-added opportunities – Consider processing capabilities or specialty products that capture more of the consumer dollar rather than remaining solely in commodity production.
Next Steps: Taking Action Today
As National Ag Day unfolds, dairy professionals can take immediate actions to address industry challenges:
Contact your representatives today – Use National Ag Day as an opportunity to call or email your congressional representatives about specific dairy policy concerns
Share your real farm story. Post authentic content about your operation on social media using the #NationalAgDay and #DairyReality hashtags.
Connect with industry advocates—Contact organizations like the American Dairy Coalition or your state dairy association to strengthen collective advocacy efforts.
Evaluate your cost structure – Begin systematically analyzing operational costs to identify areas where efficiency improvements could reduce your cost per hundredweight.
Conclusion: Beyond the National Ag Day Platitudes
As today’s National Ag Day events proceed with their predictable celebrations of American agriculture, dairy producers deserve more than platitudes and photo opportunities. They deserve policies recognizing dairy’s essential role in nutrition and rural economies.
The disconnect between National Ag Day’s celebratory tone and the harsh realities facing dairy producers highlights why The Bullvine continues providing an unfiltered platform for industry perspectives. When government agencies and mainstream agricultural organizations fail to acknowledge dairy’s unique challenges, independent voices become essential for driving meaningful change.
While today’s celebrations may temporarily spotlight agriculture’s contributions, the dairy industry’s future depends on year-round advocacy, challenging policies that undermine its position in the American food system. National Ag Day should represent a starting point for these discussions rather than a one-day acknowledgment before returning to policies that continually marginalize dairy producers.
Proper support for agriculture means supporting all its sectors – including dairy – with policies that enable producers to thrive rather than merely survive. Until National Ag Day celebrations reflect this reality, they remain incomplete acknowledgments of American agriculture’s diversity and challenges.
Key Takeaways
America has lost 95% of its dairy farms since 1970, with the most dramatic decline occurring in recent years, yet milk production continues to rise through dramatic consolidation.
Economics drives the trend: operations with 2,000+ cows produce milk for approximately $10 less per hundredweight than farms with 100-199 cows.
Rather than waiting for policy changes, dairy producers can take immediate action through component optimization, direct marketing, and documenting sustainability progress.
National Ag Day events fail to address dairy’s unique challenges, focusing instead on general agricultural celebrations that ignore the industry’s consolidation crisis.
Effective advocacy requires year-round engagement with policymakers, not just participation in ceremonial agriculture celebrations.
Executive Summary
As National Ag Day unfolds with ceremonial celebrations in Washington DC, America’s dairy farmers face a stark reality hidden behind the platitudes: nearly 40% of dairy operations have disappeared in just five years while milk production increased by 5%. This consolidation crisis isn’t happening by accident—large operations with over 2,000 cows enjoy a $10 per hundredweight cost advantage over mid-sized farms, creating economic pressure rapidly reshaping rural America. Behind the concerning statistics lies a system where just 8% of farms (those with 1,000+ cows) now produce 68% of America’s milk, up from 57% in 2017. Despite this existential threat to traditional dairy farming, National Ag Day events will likely feature generic agricultural praise without addressing dairy’s specific challenges, highlighting the disconnect between celebratory rhetoric and the industry’s harsh economic reality.
Join over 30,000 successful dairy professionals who rely on Bullvine Daily for their competitive edge. Delivered directly to your inbox each week, our exclusive industry insights help you make smarter decisions while saving precious hours every week. Never miss critical updates on milk production trends, breakthrough technologies, and profit-boosting strategies that top producers are already implementing. Subscribe now to transform your dairy operation’s efficiency and profitability—your future success is just one click away.
Unpack the surprising rise in fluid milk demand despite falling production. How’s this shift shaping the dairy market? Find out more.
Summary:
Welcome to the ever-evolving dairy world, where fluid milk consumption bucks the trend up against a background of declining production. As we dive into this report, fluid milk is making a solid comeback, outpacing population growth and showing a 1.6% increase in August compared to the previous year. On the other hand, milk production is slipping, marking a curious case for the industry. Export figures tell a success story, too, with over 17% of U.S. milk solids finding international markets for three months straight, a feat not seen since late 2022. The market dynamics are equally fascinating, with a notable rise in butter and cheese prices, even as traditional cheese production growth slows. Engaging with these dynamics, the dairy sector faces dual challenges of meeting rising consumer demands amid tighter production margins, as evident from the 14-month consecutive decline in milk production. This trend could lead to reduced revenues without compensatory high prices, while farmers encounter increased costs, potentially jeopardizing smaller family farms. The effects ripple through the supply chain, pushing innovations and supportive policies to stabilize and boost production in this dynamic landscape. As we delve deeper, here’s what to ponder: Is this a sustainable shift or a fleeting phenomenon?
Key Takeaways:
Fluid milk consumption continues to rise, even as raw milk production declines.
Annual per capita consumption of dairy products like yogurt, butter, and cheese is increasing.
The U.S. dairy industry saw significant export activity, with over 17% of milk solids exported for three consecutive months.
August marked the highest Dairy Margin Coverage margin since 2015, indicating safety-net solid performance.
National Dairy Product Sales Report revealed peak prices for essential dairy products in September 2024.
There is a noticeable divergence in trends between butter production growth and stagnating cheese production.
Federal Order class prices are affected by recent shifts in butter and cheese cash market prices.
Why is fluid milk consumption rising even as milk production declines, creating a curious paradox? Despite a downward trend in raw milk output, consumer demand for fluid milk climbs, challenging and fascinating dairy farmers and industry experts. This dichotomy presents an opportunity for the industry to innovate and strategize effectively, empowering us to make proactive changes. Let’s explore the factors behind this trend and consider how the market can adapt to these evolving dynamics, knowing that strategic adaptations are within our reach.
Year
Total Fluid Milk Consumption (% Change)
Milk Production (% Change)
U.S. Dairy Exports (% of Solids)
Average Milk Price ($/cwt)
2023
+0.7%
-0.8%
16%
$22.20
2024 (Projected)
+1.6%
-0.1%
17%
$23.60
Milk’s Curious Rise: Navigating the Shift in Consumer Trends
Fluid milk consumption has exhibited a significant uptick, with a 1.6% increase in August compared to the previous year, serving as a testament to the changing dynamics in consumer preferences. This surge reflects a broader trend across the dairy sector, where products like yogurt and butter have also witnessed marked consumption growth. However, this rise in fluid milk consumption might also lead to a decrease in the consumption of other dairy products, potentially impacting their production and pricing. Interestingly, these developments occur in the backdrop of a U.S. population growth rate that lags at just 0.57% over the same period. This disparity suggests a heightened per capita consumption of dairy products, indicating either a shift in dietary habits or possibly greater diversity and innovation in dairy offerings to entice more consumers. It’s a scenario that challenges our traditional understanding of market demands, urging the dairy industry to reevaluate its production strategies and consumer engagement.
Export Surge and Waning: A Tale of Peaks and Valleys
The year kicked off with a bang for U.S. dairy exports, showcasing strength not seen in winter months. In January, exports reached the third-highest level for the month, only to be surpassed by February’s record-breaking performance. This surge marked a promising beginning, substantiating the pivotal role of dairy in international trade. However, as swiftly as it surged, the export volumes waned over the next four months, dipping below the 17% mark of U.S. milk solids production exported. This could be due to changes in global demand, trade policies, or even weather conditions affecting production. This ebb and flow illustrates the unpredictable nature of global demand and the intricate balance of maintaining export momentum.
Nonfat dry milk/skim milk powder is central to these export dynamics. As the most significant product category, its influence is substantial. Variations in demand and market trends can significantly impact the broader export figures. Essentially, nonfat dry milk/skim milk powder is a barometer for the U.S. dairy export market, moving the needle with its performance.
While exports present a dynamic landscape, imports tell a different story. They remain a minor feature of the U.S. dairy economy, even when traced across historical data. July and August saw imports running close to 4% of U.S. milk solids production, ranking fifth and sixth highest over more than 15 years. Yet, despite these peaks, imports do not carry the same weight as exports, mainly due to the robust domestic production capabilities. This creates a uniquely American dairy narrative—heavily export-oriented, with imports playing a supplementary, albeit limited, role.
Milking the Dilemma: Navigating the Production Paradox
While the rise in fluid milk consumption is promising, the 14-month consecutive decline in milk production signals a pressing concern for the dairy industry. This prolonged downturn, in which production levels continually fall below the previous year, shows a sector facing substantial challenges. What does this mean for our dairy farmers and the broader market dynamics?
The impact on dairy farmers is direct and tangible. Lower milk production can reduce revenues unless higher milk prices compensate. However, sustained production deficits can cause additional strain, as fixed costs must be spread over fewer pounds of milk. Farmers might find themselves in a tight spot, juggling increased operational costs, feed expenses, and the need to maintain herd health with dwindling outputs. The financial pressure could push some smaller family farms to the brink, prompting consolidation considerations or even exit from the industry.
The ripple effects extend beyond the farms to the entire supply chain. A decrease in the raw milk supply can affect processors, who might face increased milk prices, leading to higher costs for end products. This could trickle down to consumers, who may notice fluctuations in the availability and pricing of dairy products. On a larger scale, such trends could challenge maintaining U.S. dairy’s competitiveness on the global stage, especially if production deficiencies lead to reduced export capabilities.
How should the industry respond to these challenges? Diversification and innovation in farming practices and supportive policies might offer pathways to stabilize and boost production, instilling optimism and forward-thinking. As we navigate this changing landscape, the question remains: How will the collective efforts of producers, processors, and policymakers redefine the future of dairy farming in response to these persistent challenges?
Butter vs. Cheese: The Market Tug-of-War
The current landscape of dairy product production reveals intriguing dynamics that could have significant implications for the market. Cheese production, for instance, has experienced a deceleration in growth. From a robust increase in prior years, it has only increased by a mere 0.2% through August 2024 compared to the same period in 2023. This moderation starkly contrasts the soaring growth rates of 4.6% and 3% observed in the pandemic years of 2021 and 2022. Meanwhile, butter production presents an opposite trajectory. Having slumped during the pandemic, it has rebounded strongly, with a notable 5.3% growth year-to-date.
But how do these antagonistic production trends ripple through the dairy market? At a glance, one might assume that the imbalance in production growth rates could shift consumer behaviors or market demands. Given the limited expansion in supply, stagnant cheese growth would suggest potential price stabilization or even a rise. Conversely, the uptick in butter output might depress prices due to increased availability, particularly if demand does not parallel supply growth.
Moreover, these production shifts highlight the adaptability and priority shifts within the dairy sector. If butter continues to ascend while cheese lags, could we see a strategic pivot among dairy farmers and associated businesses toward a butter-favored production model? Exploring such correlations is vital for stakeholders anticipating future shifts and demands.
Are these trends supply-driven, or are they reacting to growing consumer preferences? Consider the dietary shifts and culinary trends emerging from the pandemic, such as a surge in home cooking, which likely fuels butter’s rise. Outputs like these, prompted by both an economic backdrop and evolving consumer demands, pose intriguing questions to the market. This exploration thus warrants a more profound analysis as stakeholders recalibrate to the evolving dairy product production landscape.
Stock Strategies: The Hidden Hands Behind Dairy Demand
Have you ever considered how inventory levels directly impact commercial use and the dairy supply chain? Consider the recent movements in butter and cheese stocks. Butter stocks have seen a steady decline since their peak in May, but intriguingly, they’ve been climbing in an annual context. For instance, July showed a 7.4% increase year-over-year by volume. But here’s the kicker: when you measure by days of commercial use in stock, that increase is just 1.5% for the same month. This tells us that the relationship between inventory volume and commercial use is nuanced. As more consumers reach for butter, the baseline stock levels necessary to keep shelves full also rise.
The cheese market tells a slightly different story. Since July 2023, cheese stocks have generally dropped. Could this be a sign of rising commercial use and demand exceeding production capacity? Or perhaps it hints at strategic adjustments within the supply chain to maintain balance amid fluctuating production rates and consumer preferences?
Pricing Puzzles: Butter and Cheese Lead the Dairy Dance
The price dynamics within the dairy market often resemble a volatile dance, particularly with products like butter and cheese leading the charge. Notably, in September, the National Dairy Product Sales Report marked a considerable rise in butter and cheese wholesale prices—up $0.40/lb and $0.35/lb, respectively, compared to the previous year. Meanwhile, September’s retail prices were not as straightforward, with butter climbing by $0.60/lb, yet cheddar cheese decreased by $0.12/lb.
Such fluctuations bear significant implications for both the market and consumers. From the producer’s standpoint, fluctuating wholesale prices can be a double-edged sword. While it offers the potential for higher revenue, it also introduces elements of unpredictability, affecting production planning and inventory management. Retail consumers face the brunt of these shifts, particularly in light of the Consumer Price Index for All Urban Consumers (CPI-U). Here’s where butter stands out: achieving a record-high CPI-U of 324.8 in September, ahead of general inflation.
These CPI-U figures are essential for interpretative context. They offer a glimpse into the purchasing power required by consumers today compared to decades ago, emphasizing the pressure on household budgets, especially for staples like dairy. Butter’s hike surpasses even margarine in the CPI-U stakes, highlighting butter’s elevated status in consumer expenses. On the contrary, fluid milk’s CPI-U remains more stable at 258.7, a brighter spot for cost-conscious buyers than 219.5 in nonalcoholic beverages.
In the grand scheme, these price movements reflect the immediate impact on consumer wallets and hint at underlying trends—perhaps a shift towards or away from certain products based on affordability and perceived value. As these trends develop, market players and consumers are urged to stay alert and adapt, ensuring supply aligns closely with demand while navigating the ever-changing pricing landscape.
Financial Currents in the Dairy Sector: Riding the Margin Wave or Weathering the Storm?
The recent shifts in milk and feed prices have certainly stirred the pot. With the Dairy Margin Coverage (DMC) program’s margin soaring to a remarkable $13.72 per cwt in August, the highest since this safety net’s inception in 2015, dairy farmers have much to ponder. This boost, driven by a substantial increase in the all-milk price to $23.60 per cwt, coupled with a drop in feed costs, begs the question: How will farmers navigate these financial waters?
This upward margin trend signals a potential opportunity for savvy dairy producers to reinvest in their operations, consider expansion, or diversify risk. The decreased feed costs, primarily attributed to lower corn prices, offer a welcomed reprieve. They could facilitate an increase in feed quality or allow savings to be channeled into other operational areas. Yet, there’s an inherent challenge: maintaining profitability if these prices become volatile again.
Furthermore, these price dynamics profoundly shape decision-making strategies. Farmers must weigh short-term gains against long-term sustainability. The heightened margins might tempt some to ride the wave of immediate profits without considering potential future fluctuations in market trends. A balanced approach, planning against both boom and bust cycles, will be crucial for enduring success in the competitive dairy landscape.
The Bottom Line
The USDA forecasts and WASDE reports hint at a distinctly dynamic future for the dairy industry, suggesting that producers should brace themselves for daunting tasks and potential opportunities. With the expected dip in U.S. milk production to 225.8 billion pounds, questions loom: How will this decrease impact dairy farmers’ strategies? Meanwhile, WASDE’s projection indicates a slip in the average all-milk price to $22.80/cwt, factors bound to affect budgeting and long-term planning.
As the market continues to evolve, with fluctuating production and prices, the implications for dairy operations are manifold. Depending on each farm’s or company’s position in the dairy ecosystem, these changes could herald adjustments in supply chain tactics, cost management, and product offerings.
Now is the time to examine these forecasts and consider their impact on your operations. How might these trends shape your strategic decisions in the future? Are you considering strategies to mitigate potential challenges or capitalize on anticipated opportunities? Let’s continue this conversation in the comments below. Your insights and experiences could offer invaluable perspectives to others in our community navigating this complex landscape.
Bullvine Daily is your essential e-zine for staying ahead in the dairy industry. With over 30,000 subscribers, we bring you the week’s top news, helping you manage tasks efficiently. Stay informed about milk production, tech adoption, and more, so you can concentrate on your dairy operations.
To provide the best experiences, we use technologies like cookies to store and/or access device information. Consenting to these technologies will allow us to process data such as browsing behavior or unique IDs on this site. Not consenting or withdrawing consent, may adversely affect certain features and functions.
Functional
Always active
The technical storage or access is strictly necessary for the legitimate purpose of enabling the use of a specific service explicitly requested by the subscriber or user, or for the sole purpose of carrying out the transmission of a communication over an electronic communications network.
Preferences
The technical storage or access is necessary for the legitimate purpose of storing preferences that are not requested by the subscriber or user.
Statistics
The technical storage or access that is used exclusively for statistical purposes.The technical storage or access that is used exclusively for anonymous statistical purposes. Without a subpoena, voluntary compliance on the part of your Internet Service Provider, or additional records from a third party, information stored or retrieved for this purpose alone cannot usually be used to identify you.
Marketing
The technical storage or access is required to create user profiles to send advertising, or to track the user on a website or across several websites for similar marketing purposes.
To provide the best experiences, we and our partners use technologies like cookies to store and/or access device information. Consenting to these technologies will allow us and our partners to process personal data such as browsing behavior or unique IDs on this site and show (non-) personalized ads. Not consenting or withdrawing consent, may adversely affect certain features and functions.
Click below to consent to the above or make granular choices. Your choices will be applied to this site only. You can change your settings at any time, including withdrawing your consent, by using the toggles on the Cookie Policy, or by clicking on the manage consent button at the bottom of the screen.
Functional
Always active
The technical storage or access is strictly necessary for the legitimate purpose of enabling the use of a specific service explicitly requested by the subscriber or user, or for the sole purpose of carrying out the transmission of a communication over an electronic communications network.
Preferences
The technical storage or access is necessary for the legitimate purpose of storing preferences that are not requested by the subscriber or user.
Statistics
The technical storage or access that is used exclusively for statistical purposes.The technical storage or access that is used exclusively for anonymous statistical purposes. Without a subpoena, voluntary compliance on the part of your Internet Service Provider, or additional records from a third party, information stored or retrieved for this purpose alone cannot usually be used to identify you.
Marketing
The technical storage or access is required to create user profiles to send advertising, or to track the user on a website or across several websites for similar marketing purposes.


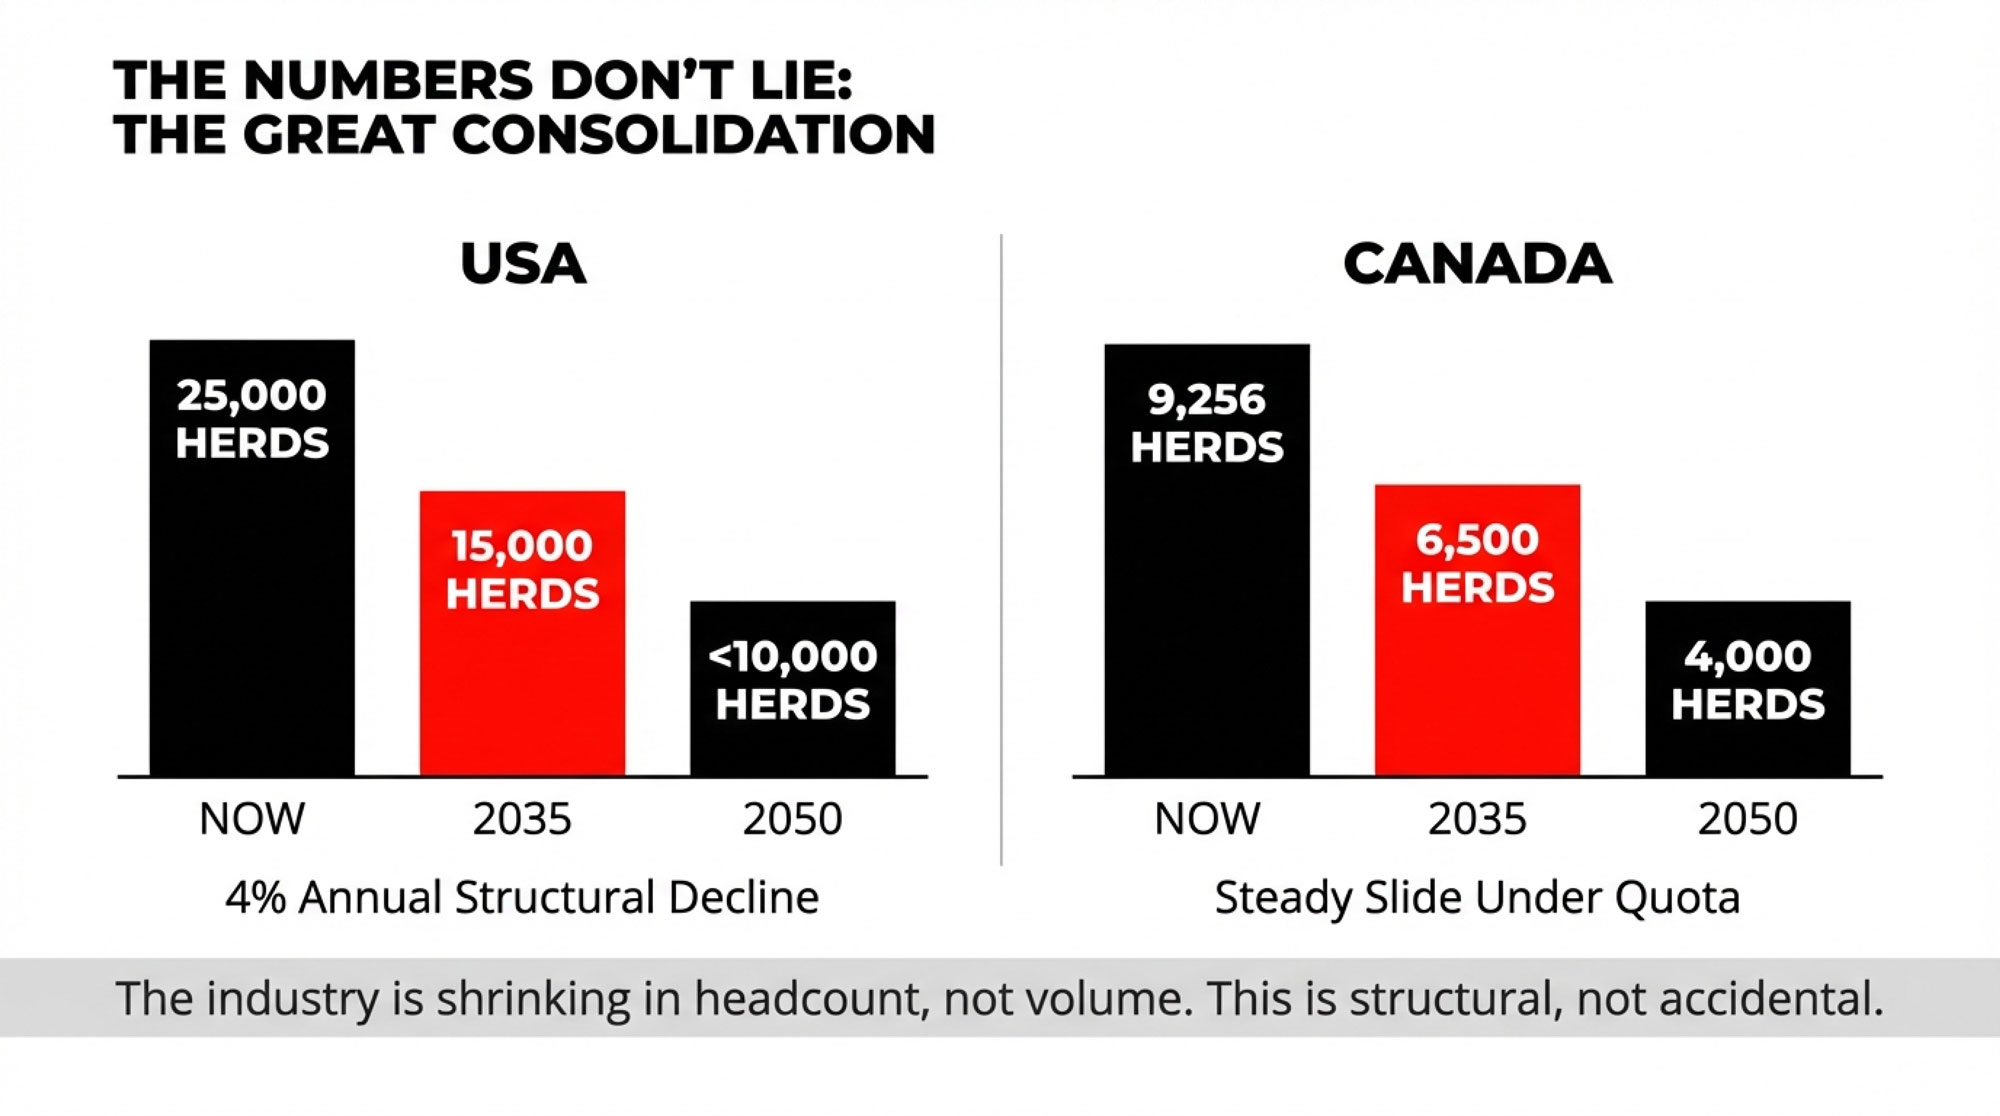
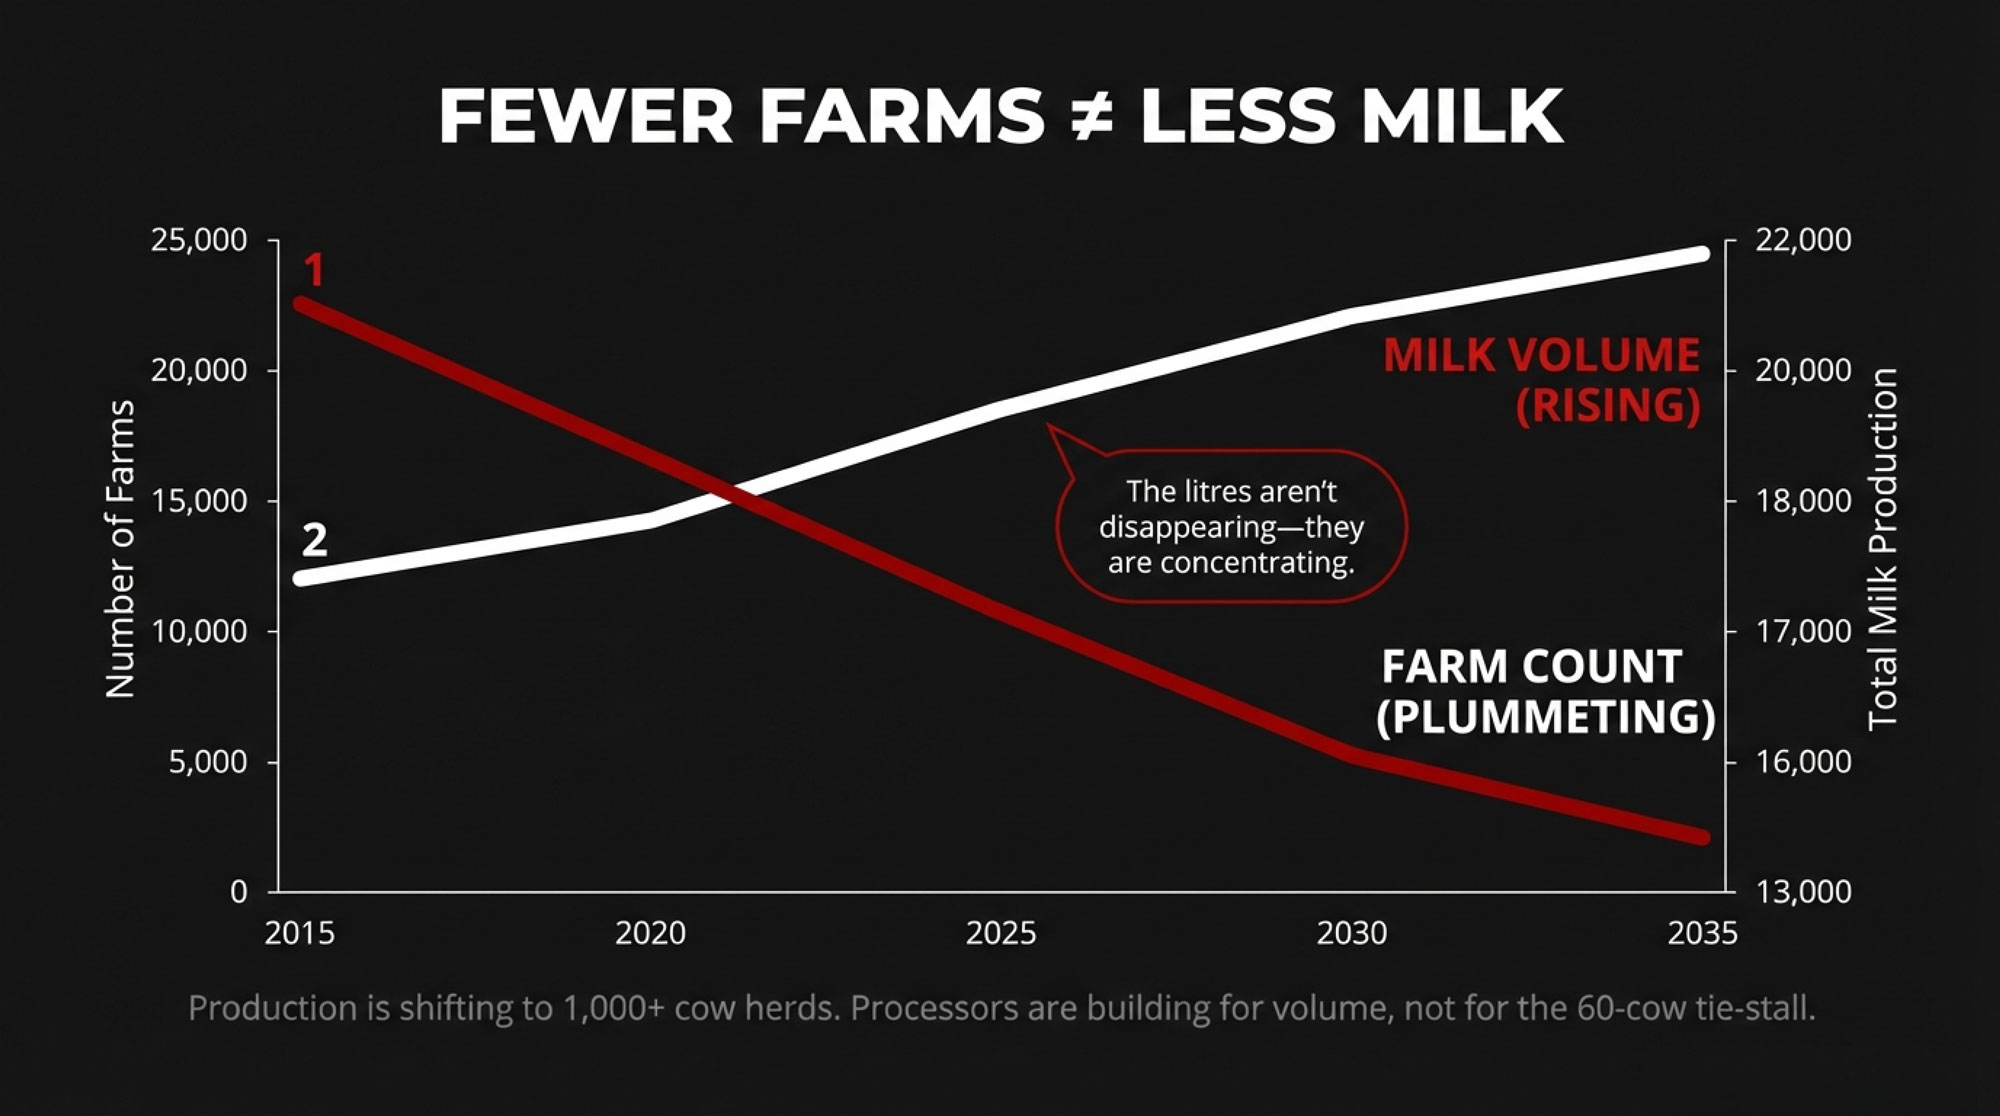
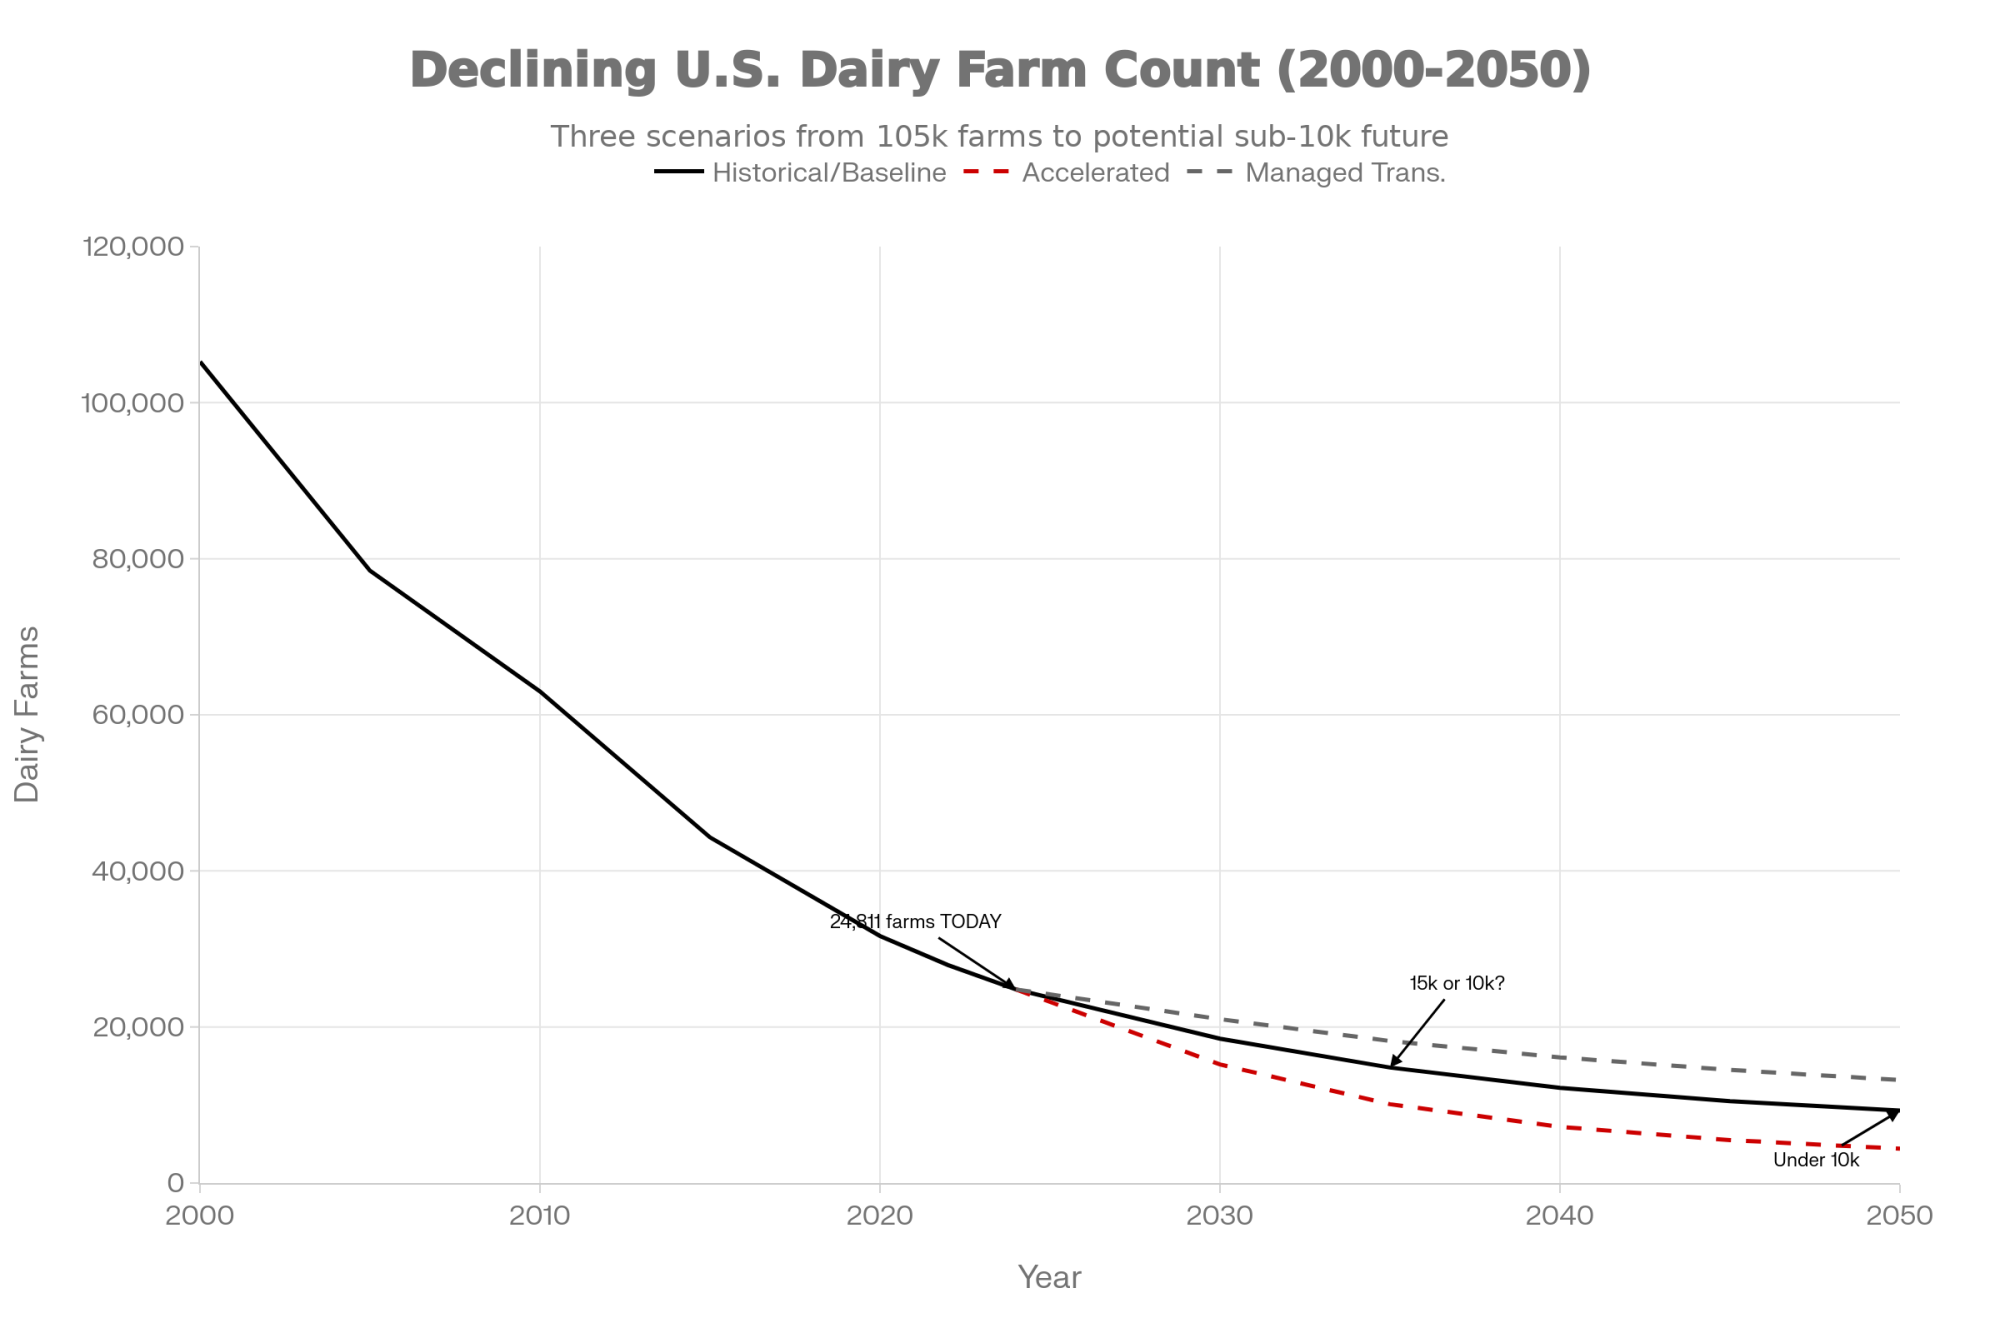
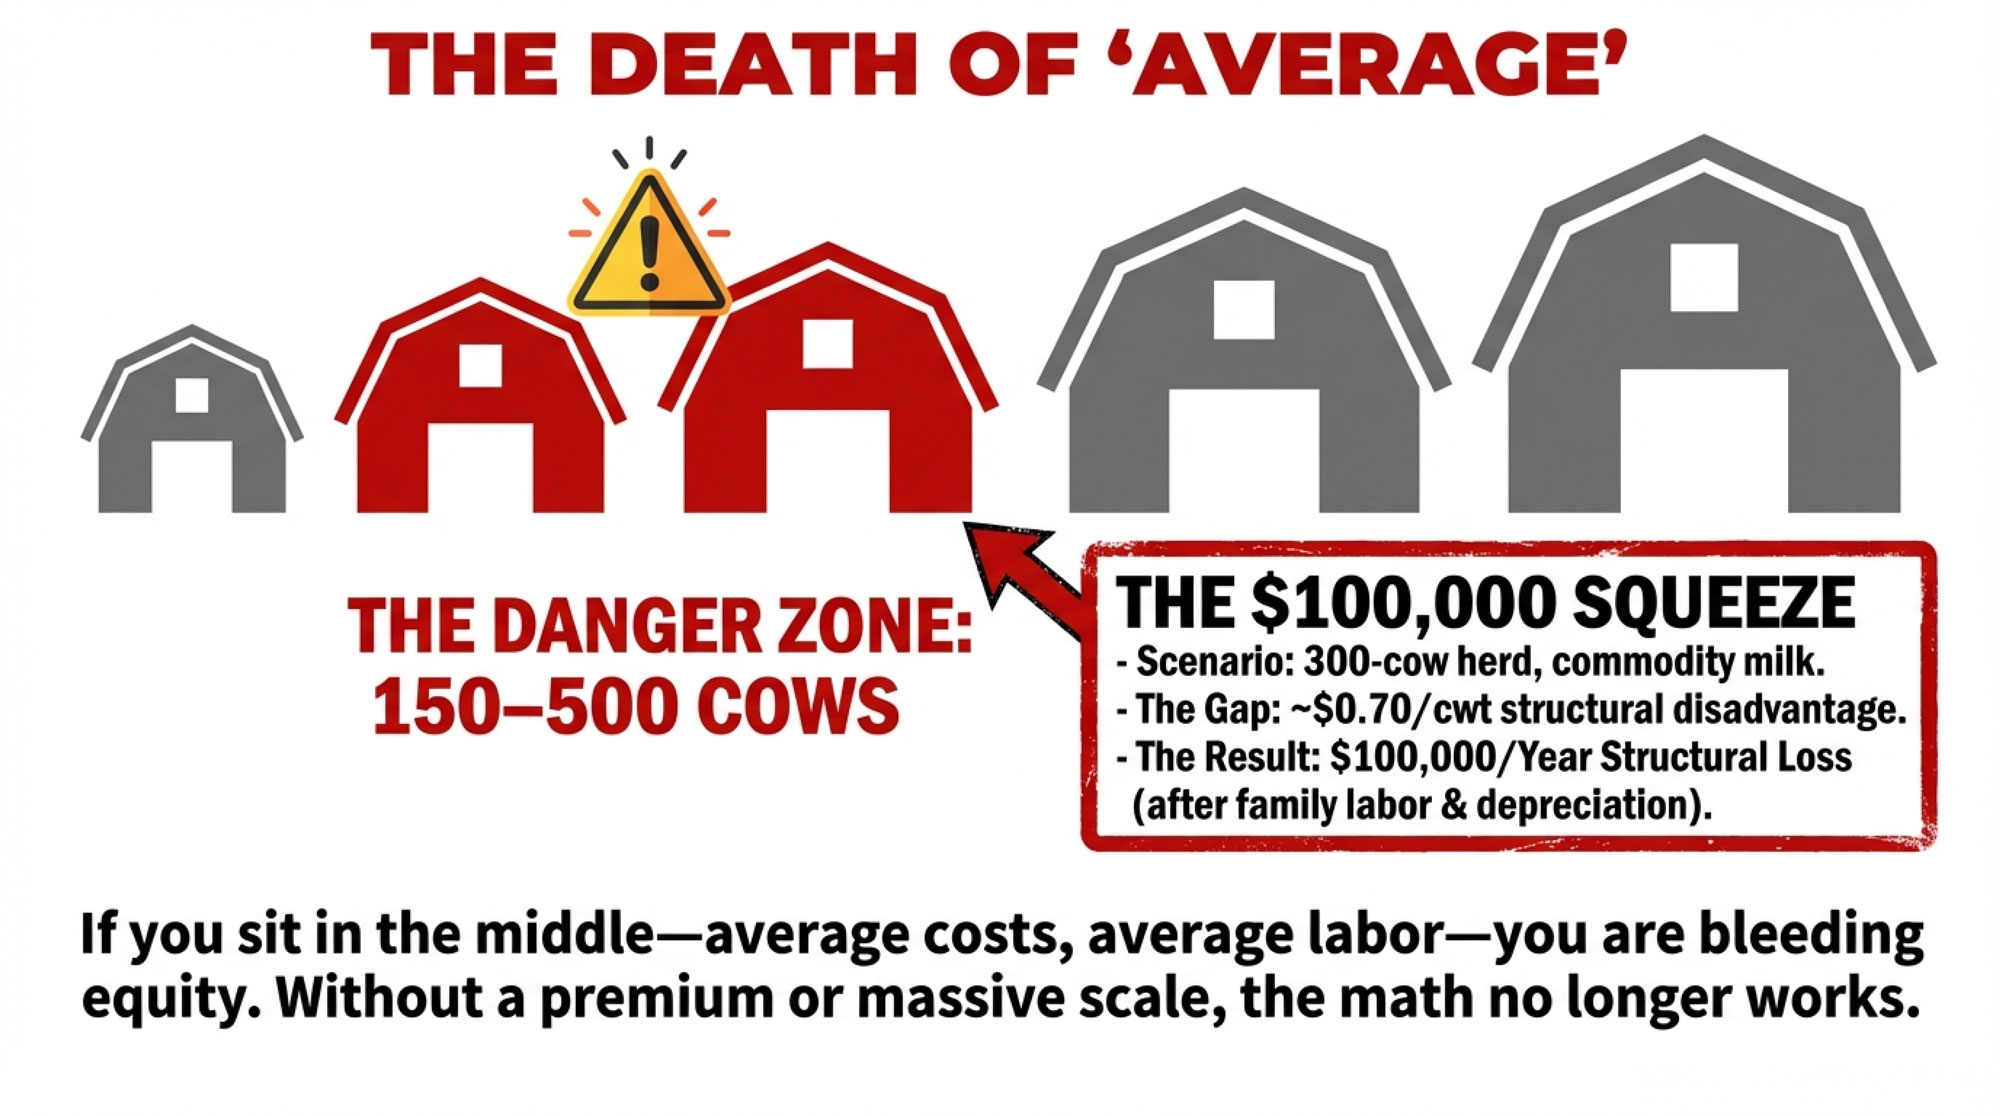
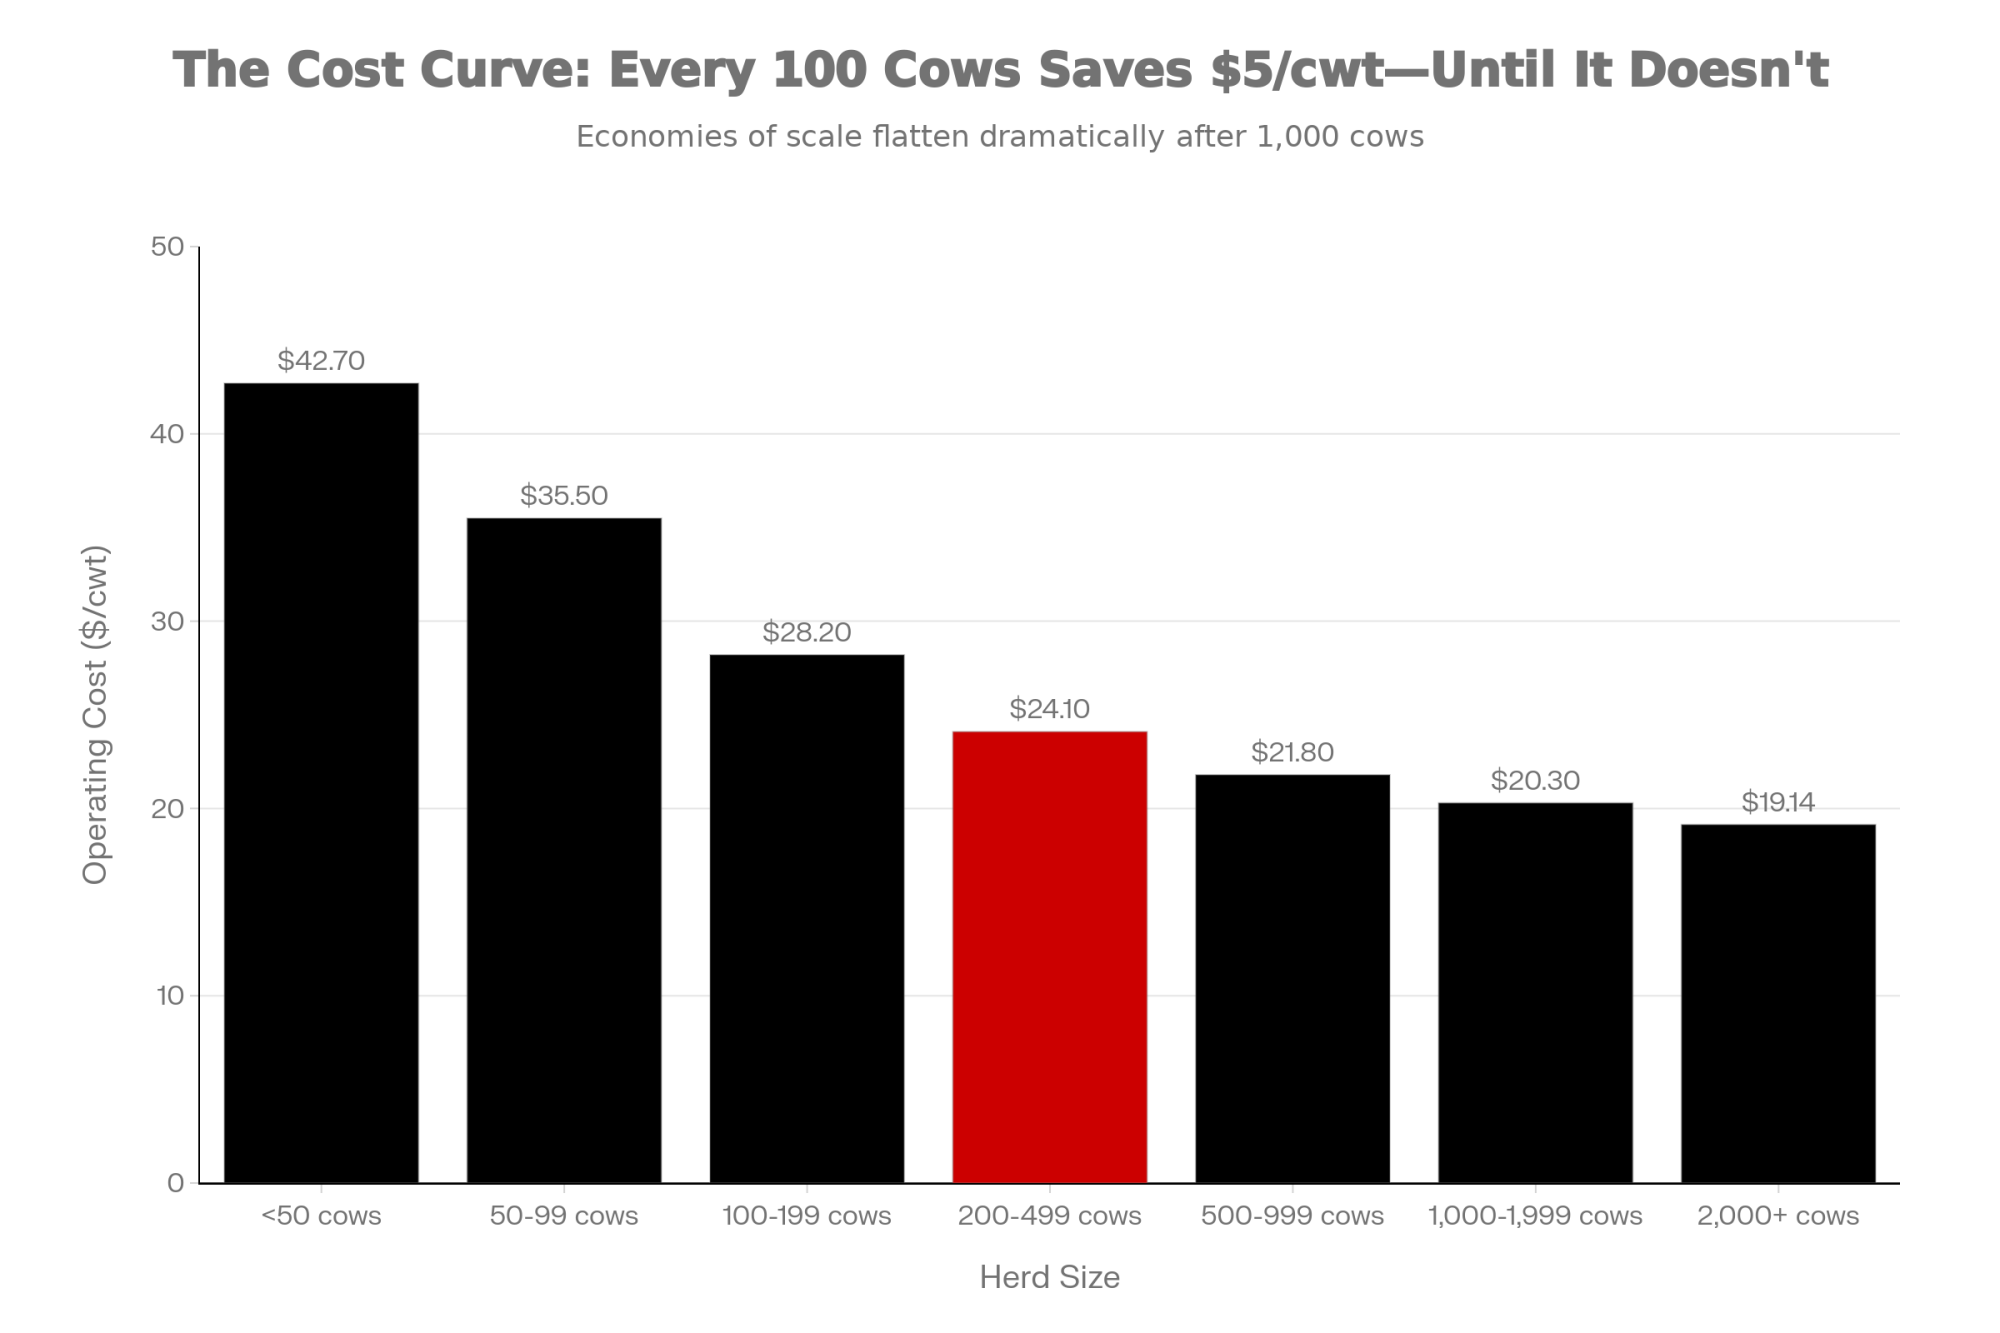
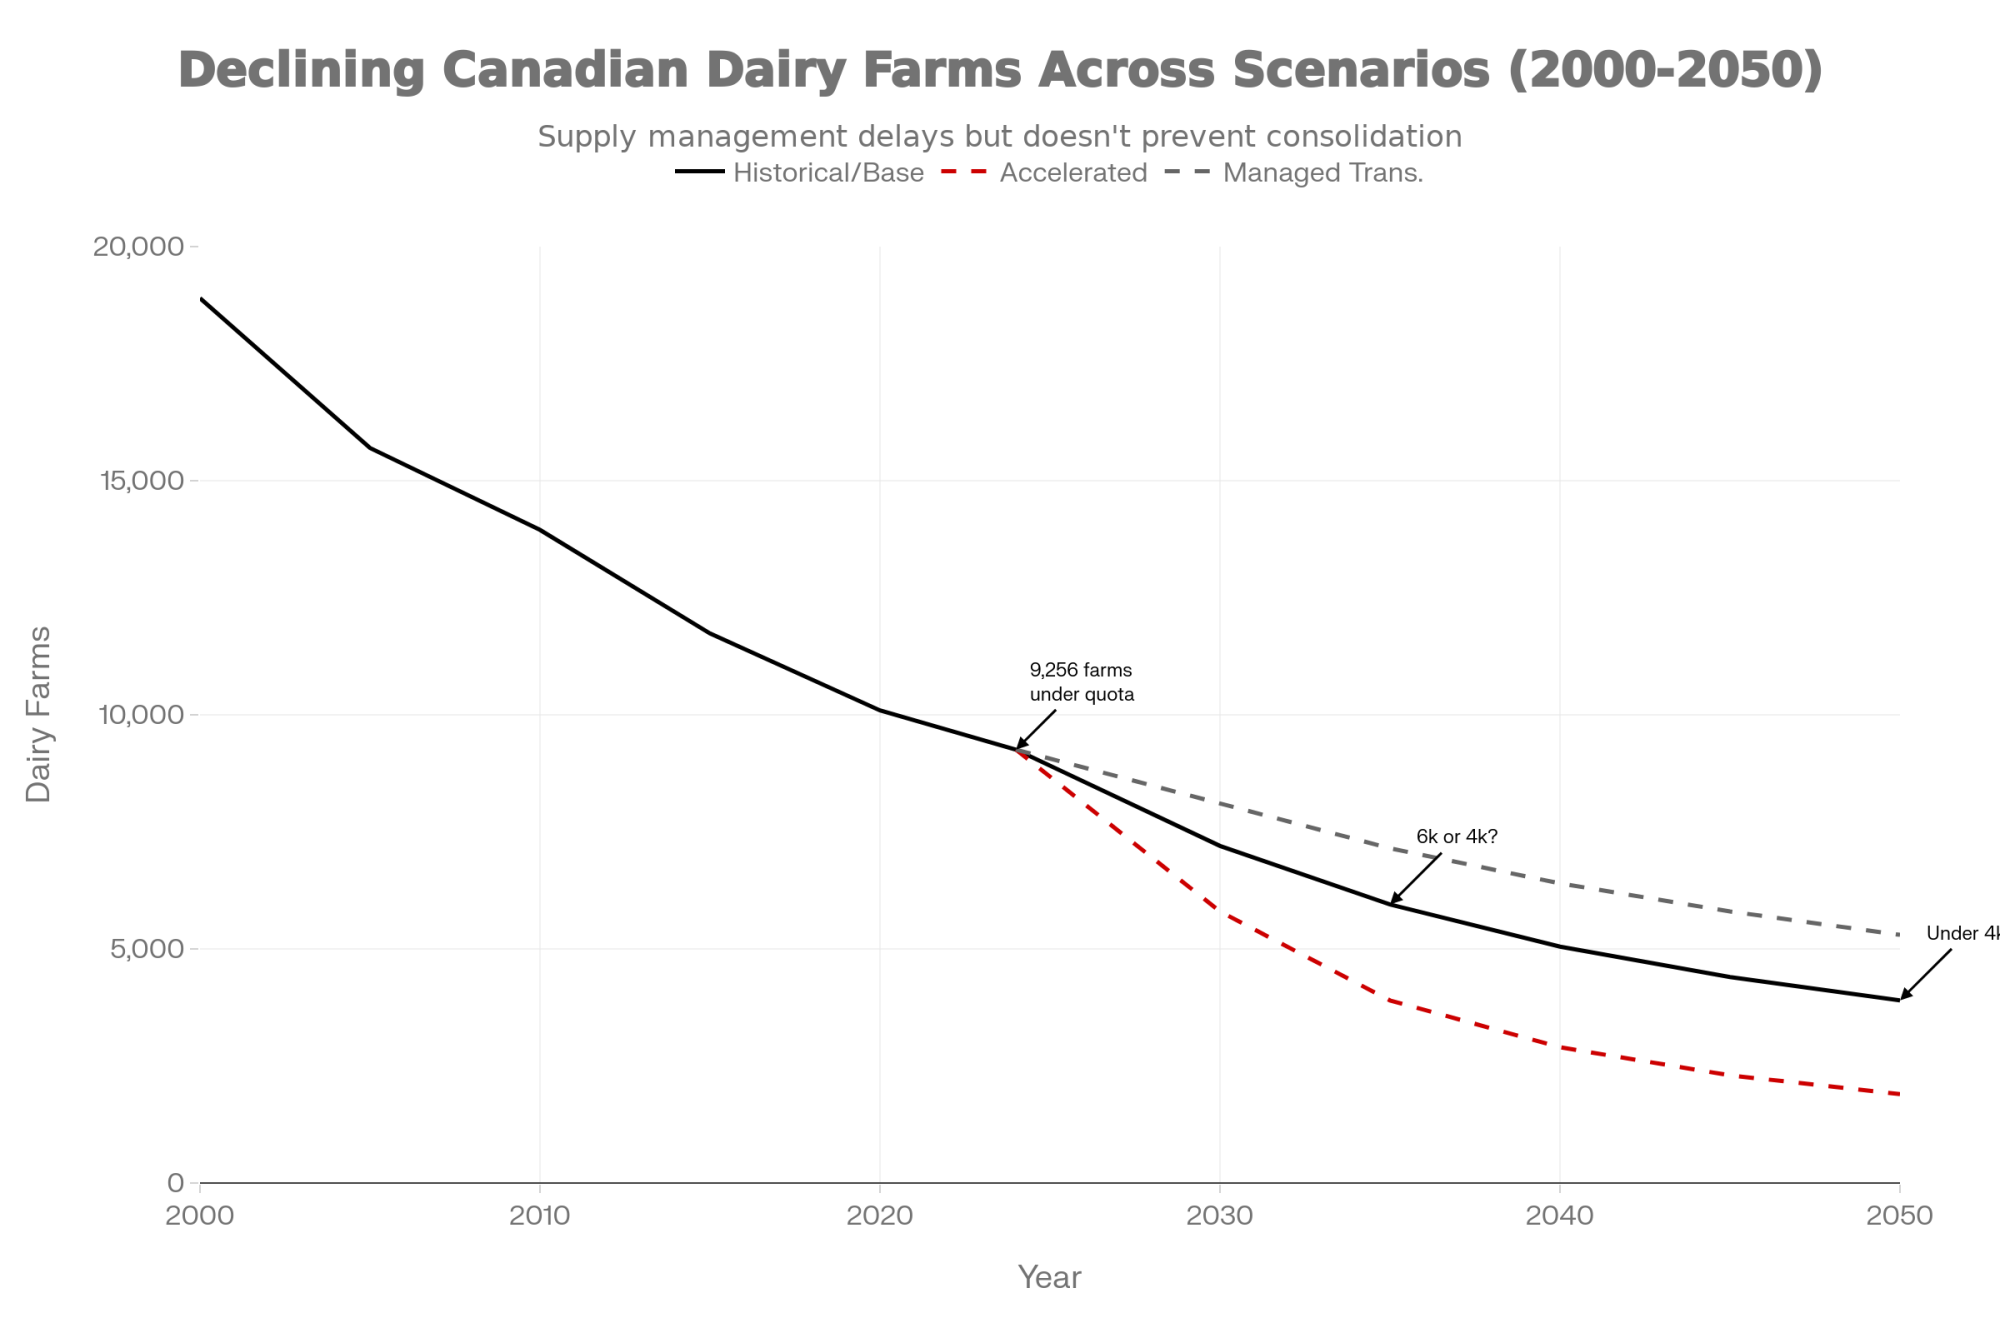
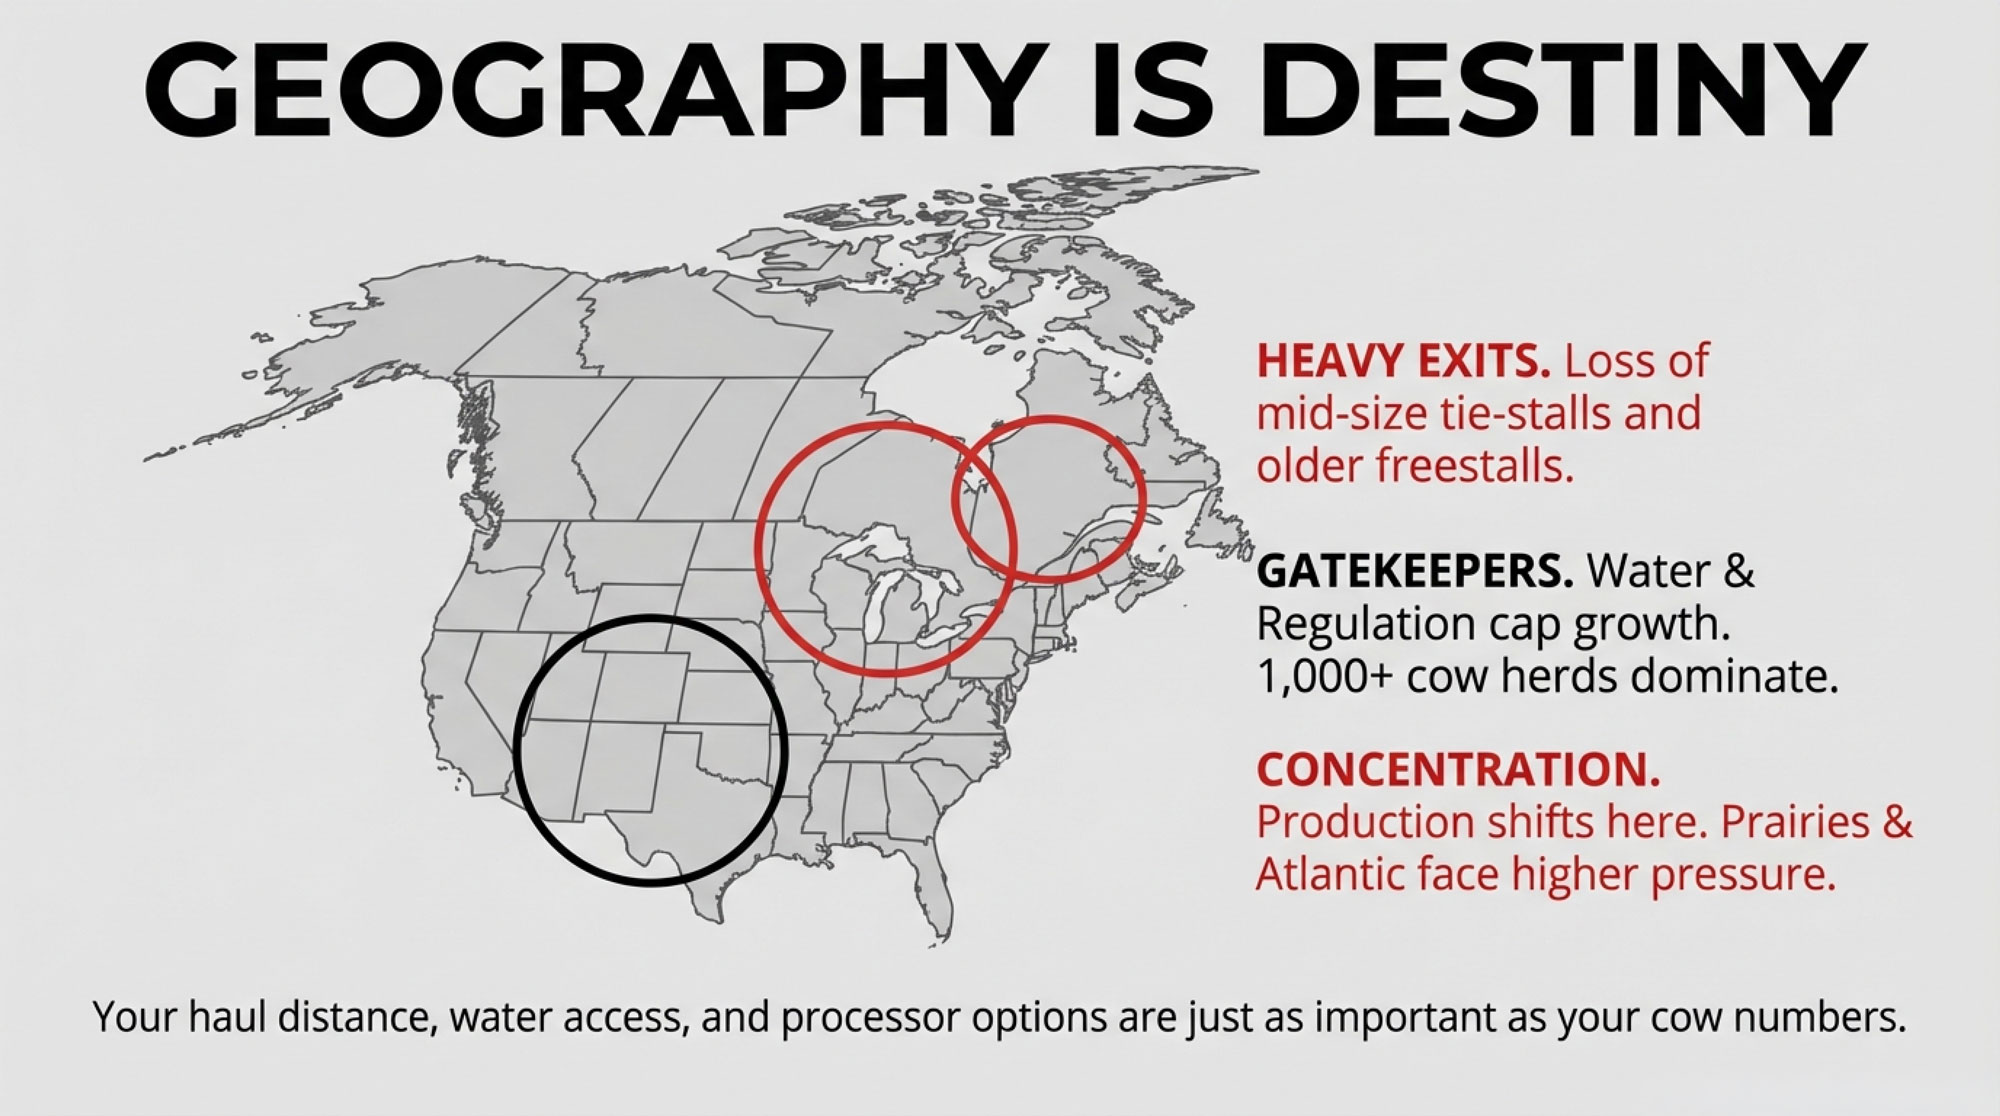

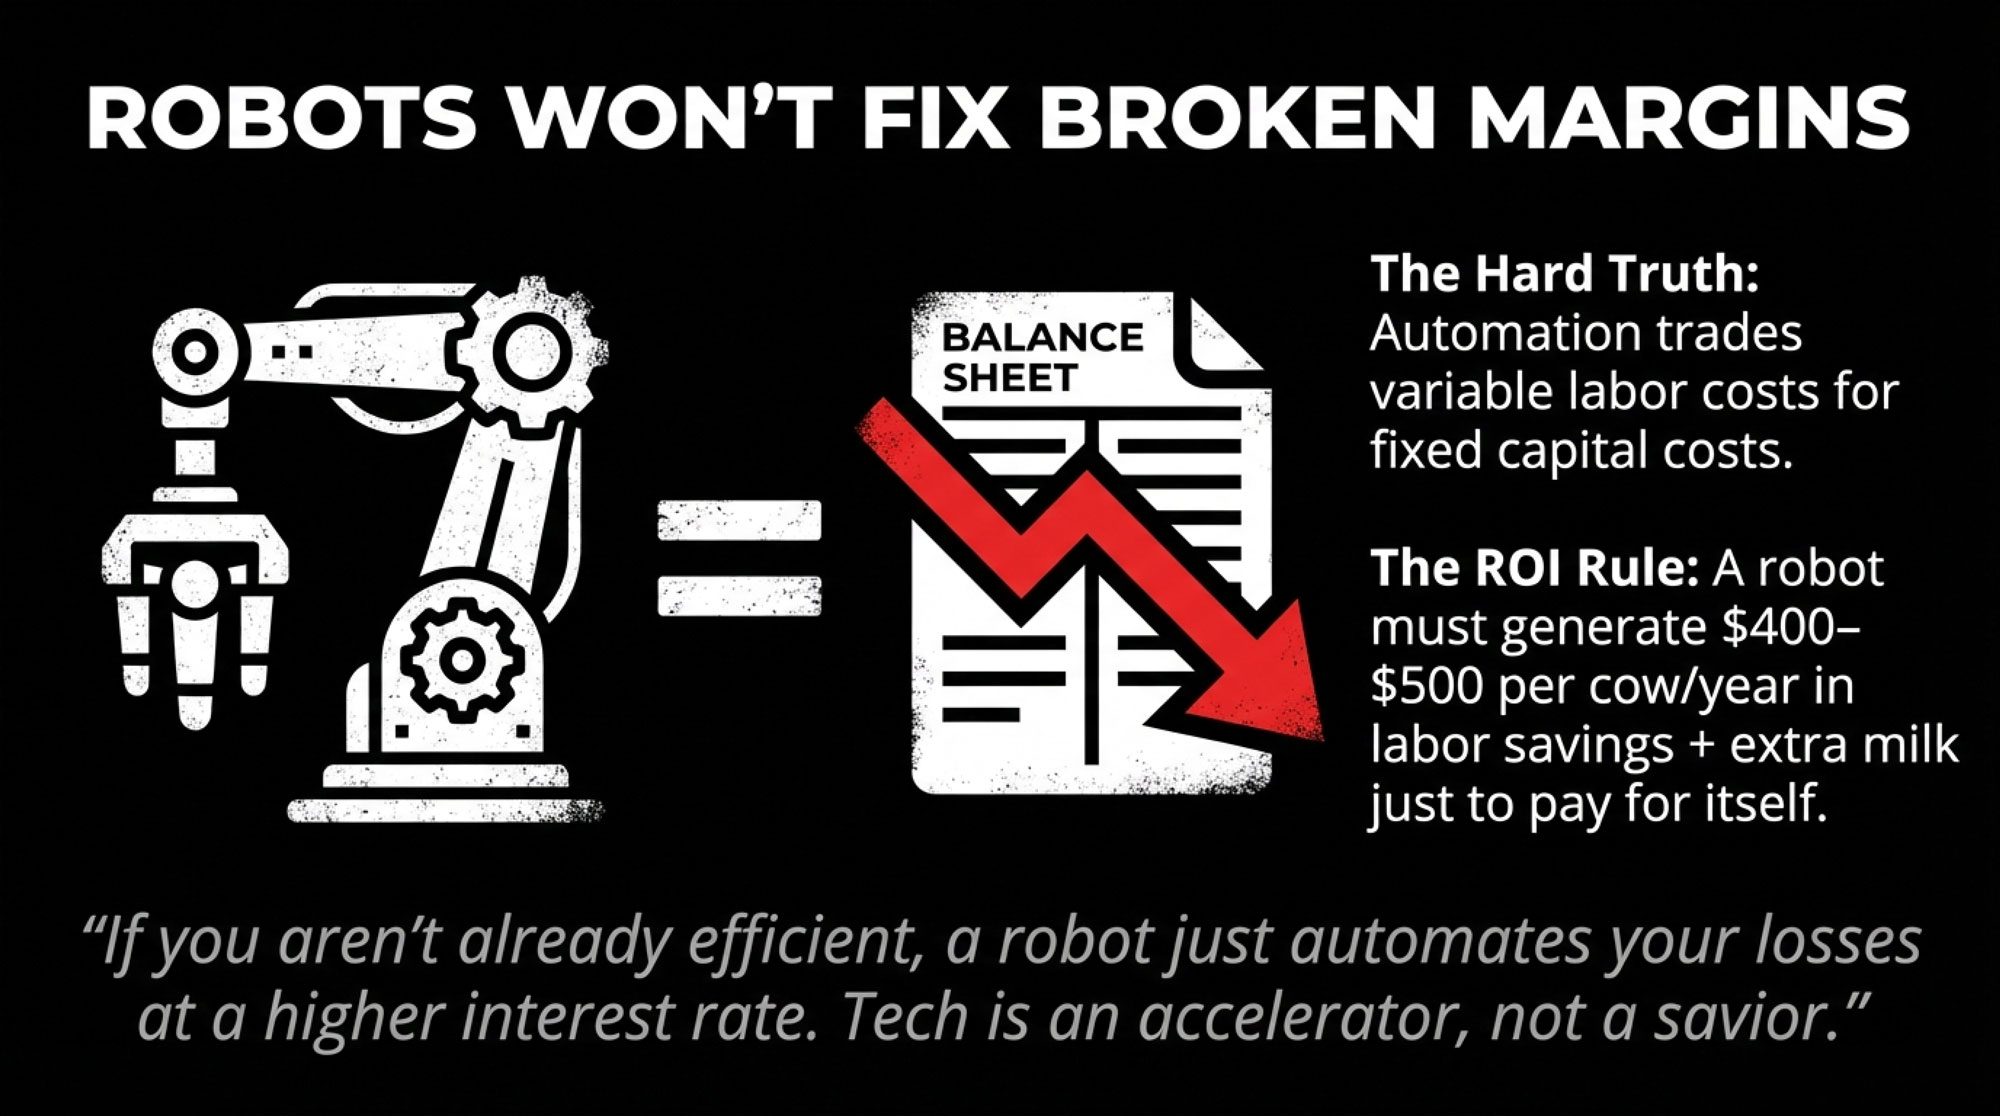

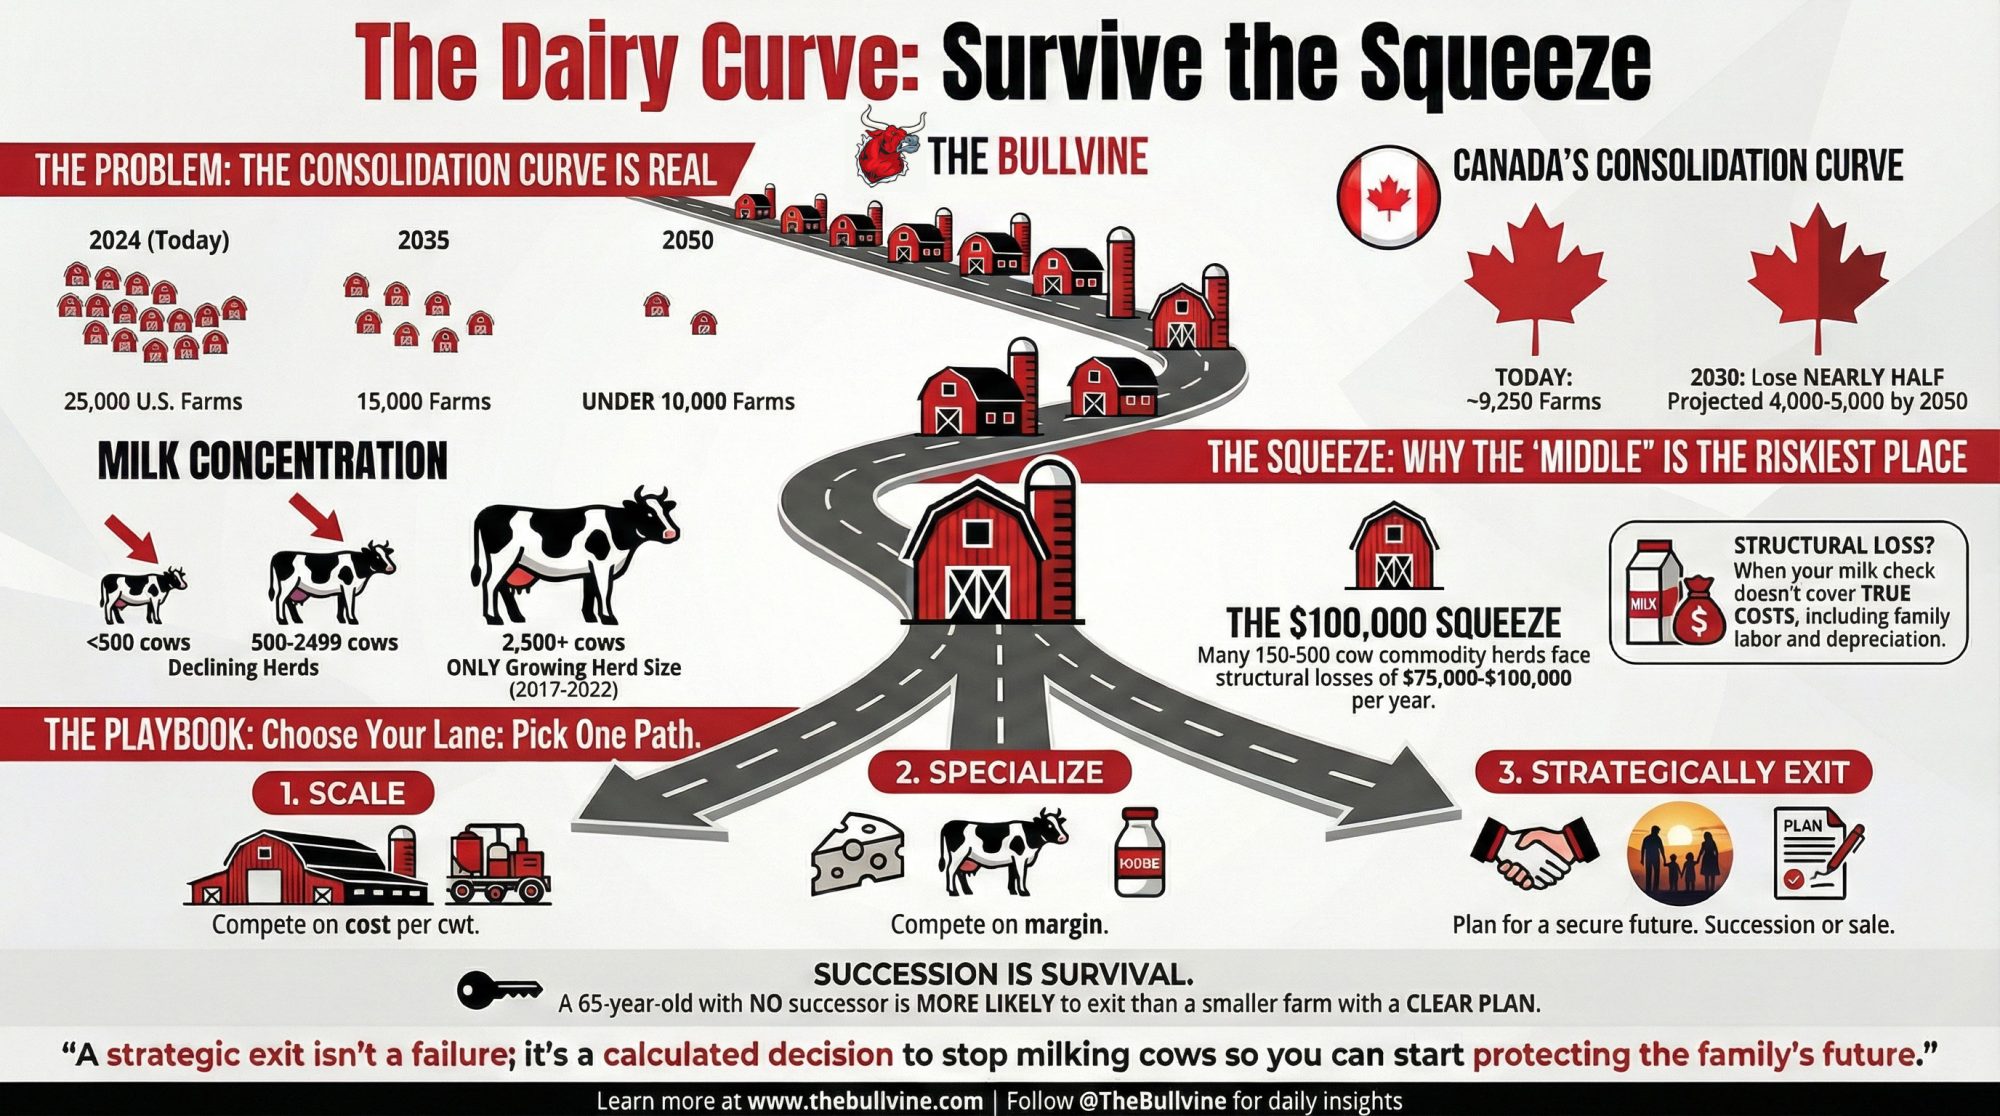
 Join the Revolution!
 Join the Revolution!