Archive for Class III milk

Tariffs Cost Dairy Farmers $2.6 Billion Last Time. You’ve Got 60 Days Before It Hits Again.

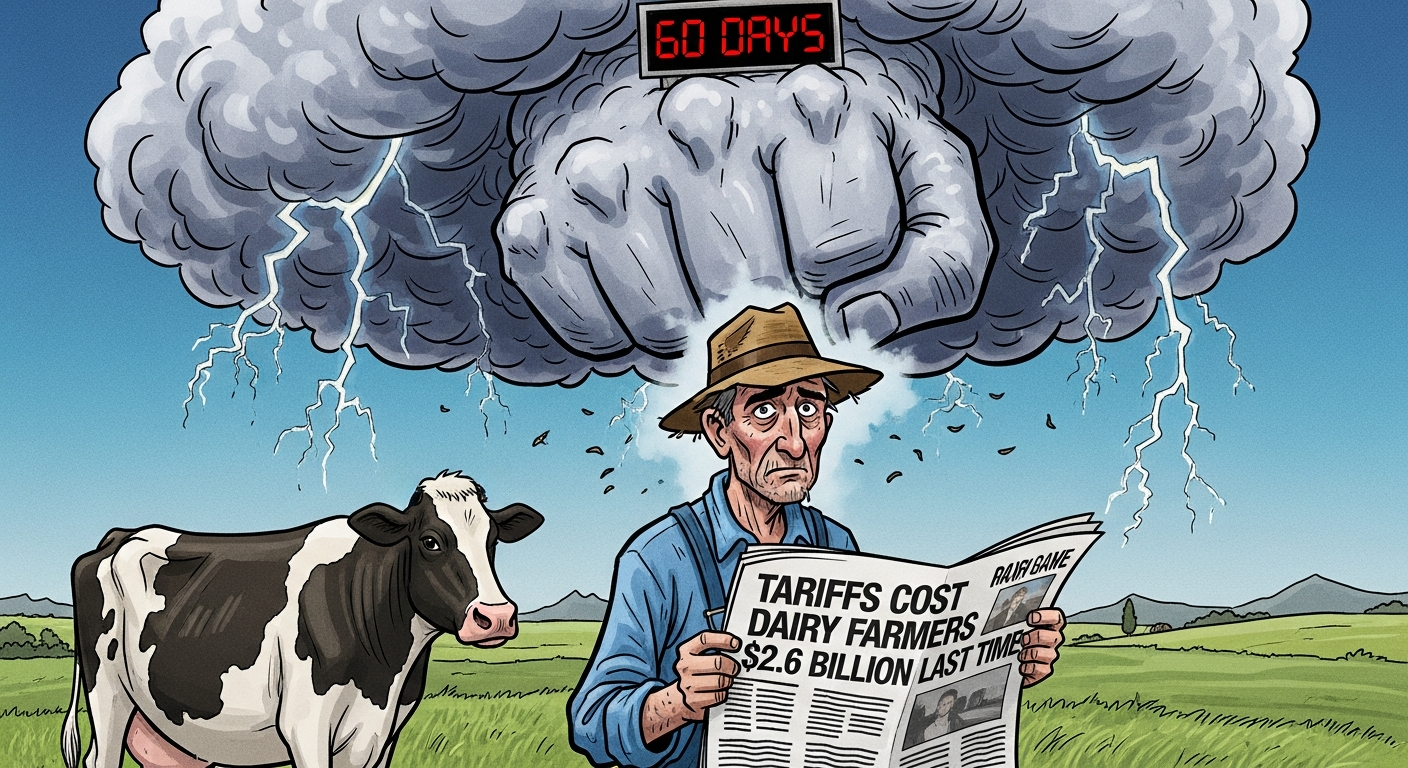
Tariffs stripped $2.6B from dairy farms last time. Use the next 60 days—or your milk check will make the decision for you.

Executive Summary: Tariffs stripped an estimated 2.6 billion dollars from U.S. dairy farms during the last China trade war, and today Mexico alone buys about 29 percent of all U.S. dairy exports while relying on the U.S. for more than 80 percent of its imported dairy. Using current data from USDA‑FAS, USDEC and CoBank, the article shows how that dependence on a few big buyers turns Washington’s tariff tools into direct Class III and milk‑check risk for every herd tied to cheese, powder, and whey markets. China’s experience—export value dropping to 377 million dollars and whey shipments collapsing 69 percent after retaliatory tariffs—illustrates how fast demand can vanish and how slowly it comes back once buyers switch to competitors like the EU. Against that backdrop, the piece lays out a plain‑spoken 60‑day decision window: put two price scenarios on paper, meet once with your co‑op and once with your lender, and use USDA/extension guidance to decide how DMC, LRP‑Dairy, and succession timing fit your risk tolerance. Written in a peer‑to‑peer, “over coffee” voice, it gives progressive dairy producers a clear, credible playbook to manage tariff risk before their milk check makes the decisions for them.

You know, if we were sitting down over coffee at World Dairy Expo or at a winter meeting in Ontario, with producers from Wisconsin freestalls, New York tiestalls, and California dry lot systems all at the table, I’d probably start with this: all the talk about presidential “emergency” tariff powers might sound like it belongs in Washington, but the impact doesn’t stay there. It flows through export channels and, sooner than most of us would like, it shows up in the milk check you’re depositing at home.

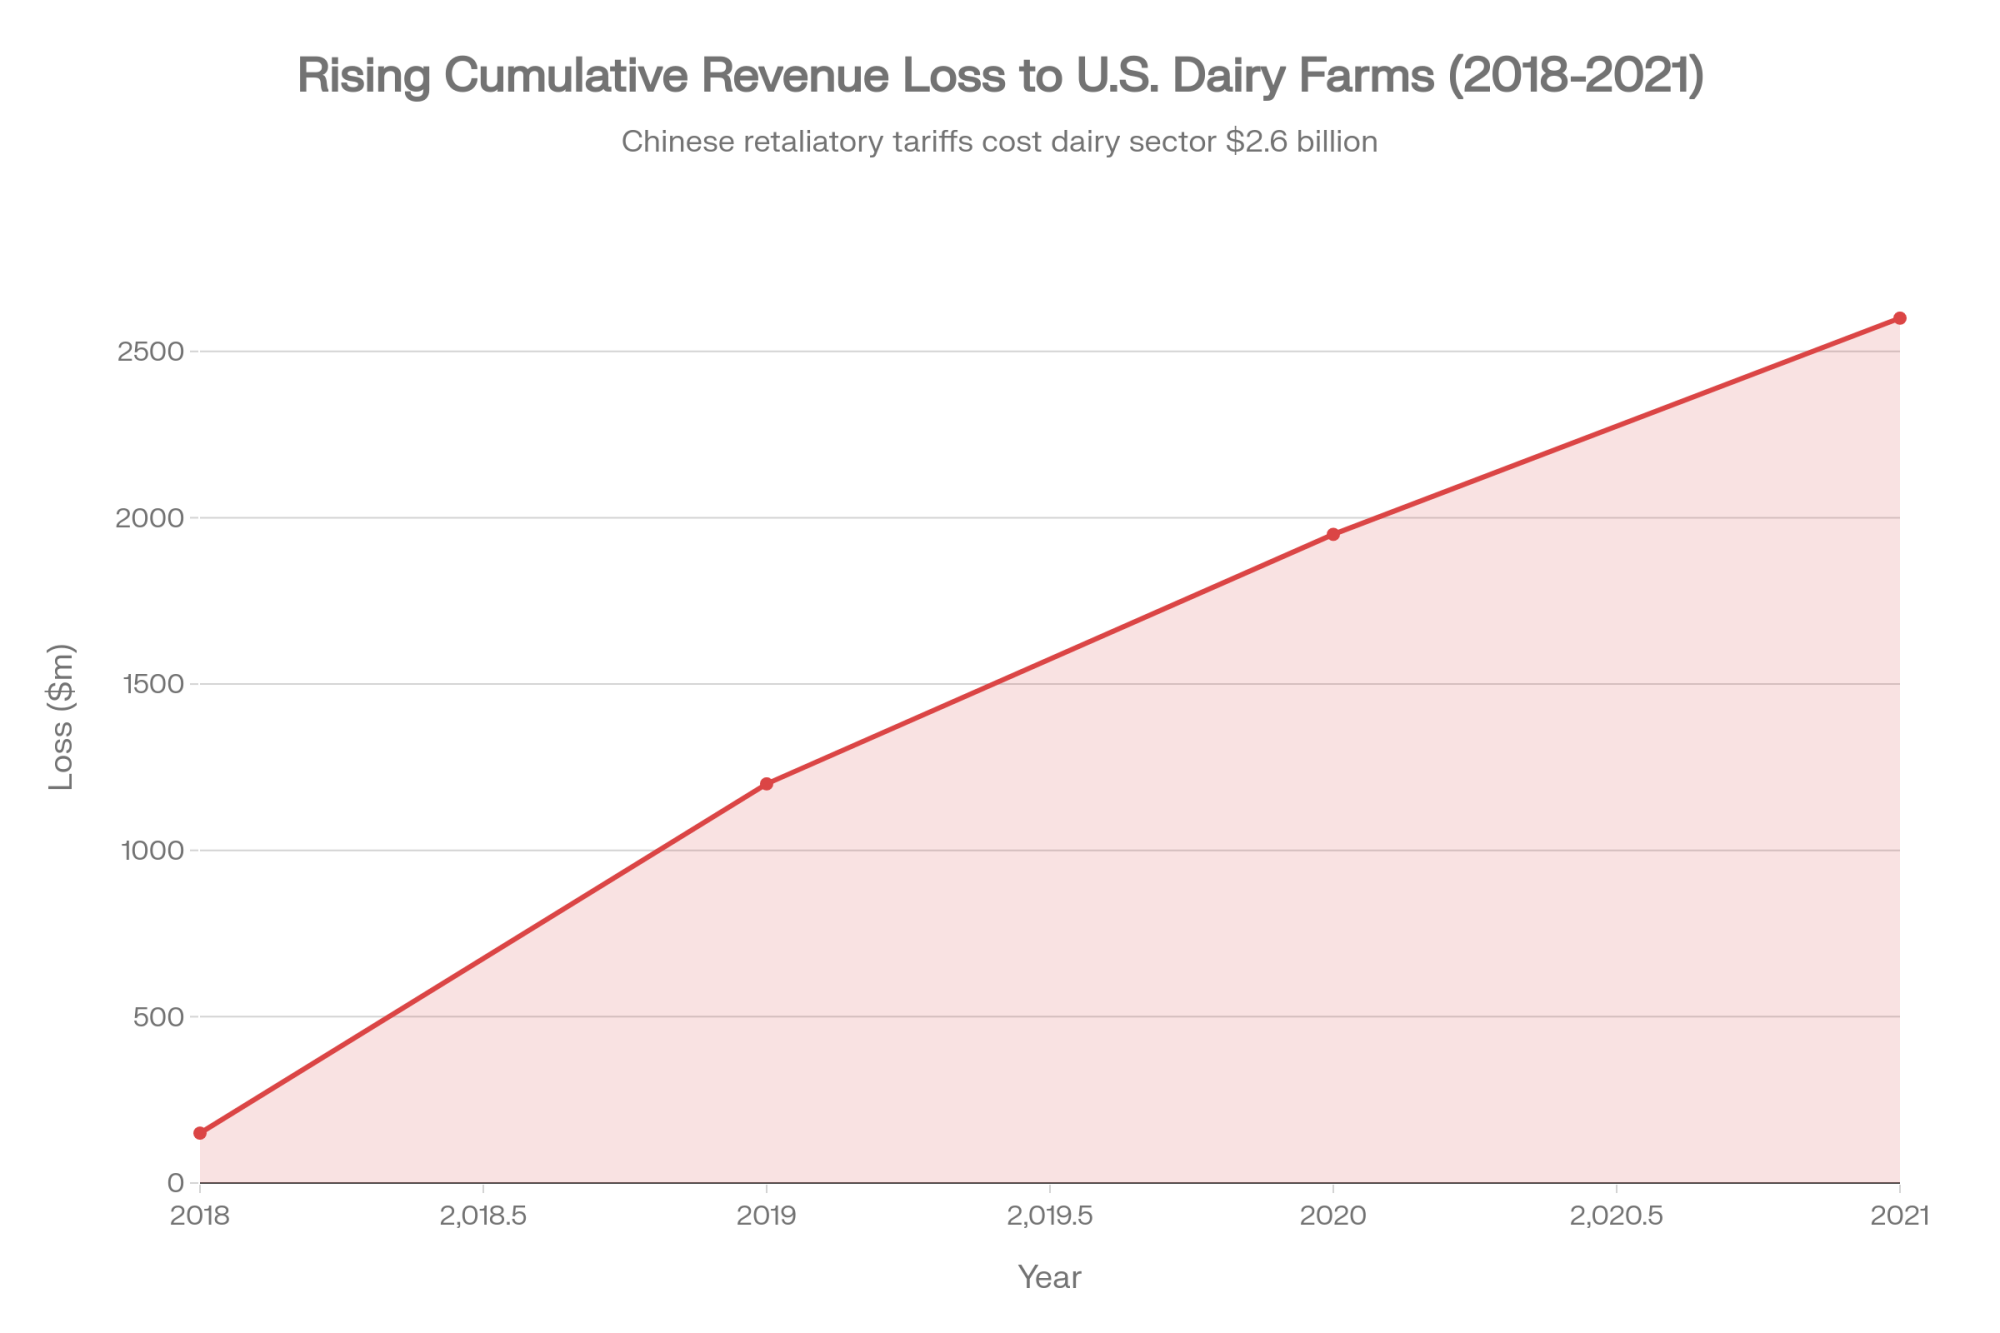
In early 2025, President Donald Trump signed executive orders imposing 25 percent tariffs on most goods from Mexico and Canada and 10 percent on goods from China, creating fresh uncertainty for U.S. dairy exporters and the farms that ultimately depend on those markets. Cornell University’s Charles Nicholson, Ph.D., an adjunct associate professor in the Charles H. Dyson School of Applied Economics and Management, told the Dyson Agricultural and Food Business Outlook conference that “if you pick a trade fight with our major export destinations… that has some substantive negative implications for dairy farms and processors”. What really made people sit up was his estimate that Chinese retaliatory tariffs alone cost U.S. dairy farms about 2.6 billion dollars in lost revenue from 2019 through 2021. 

What’s interesting here is that this isn’t just a policy debate. It’s about timing, concentration risk, and how much room you’ve got to maneuver before that next shock hits your milk price.

Let’s walk through what the data actually shows.

Looking Back: What 2018–2019 Really Taught Us

Looking at this trend, the 2018–2019 tariff period remains the clearest case study we’ve got on how quickly things can change.

On the Mexico side, USDA’s Foreign Agricultural Service published a GAIN report in June 2018 showing that Mexico responded to U.S. steel and aluminum tariffs with retaliatory tariffs on a range of U.S. products, including multiple cheese tariff lines. That report laid out how certain U.S. cheese categories were hit with new tariff rates starting June 5, 2018, and then increased again on July 5, with some lines moving into the 20–25 percent range depending on the specific HS code. That shift happened in a matter of weeks, not years. 

On the China side, the U.S. Dairy Export Council tracked the fallout as Beijing rolled out its own retaliatory measures. Cheese Reporter, summarizing USDEC’s January 2020 export review, noted that for the 12 months from December 2018 through November 2019, the value of U.S. dairy exports to China totaled about 377 million dollars—a roughly 47 percent decline from the prior 12‑month period. That’s a big haircut on a single key market. 

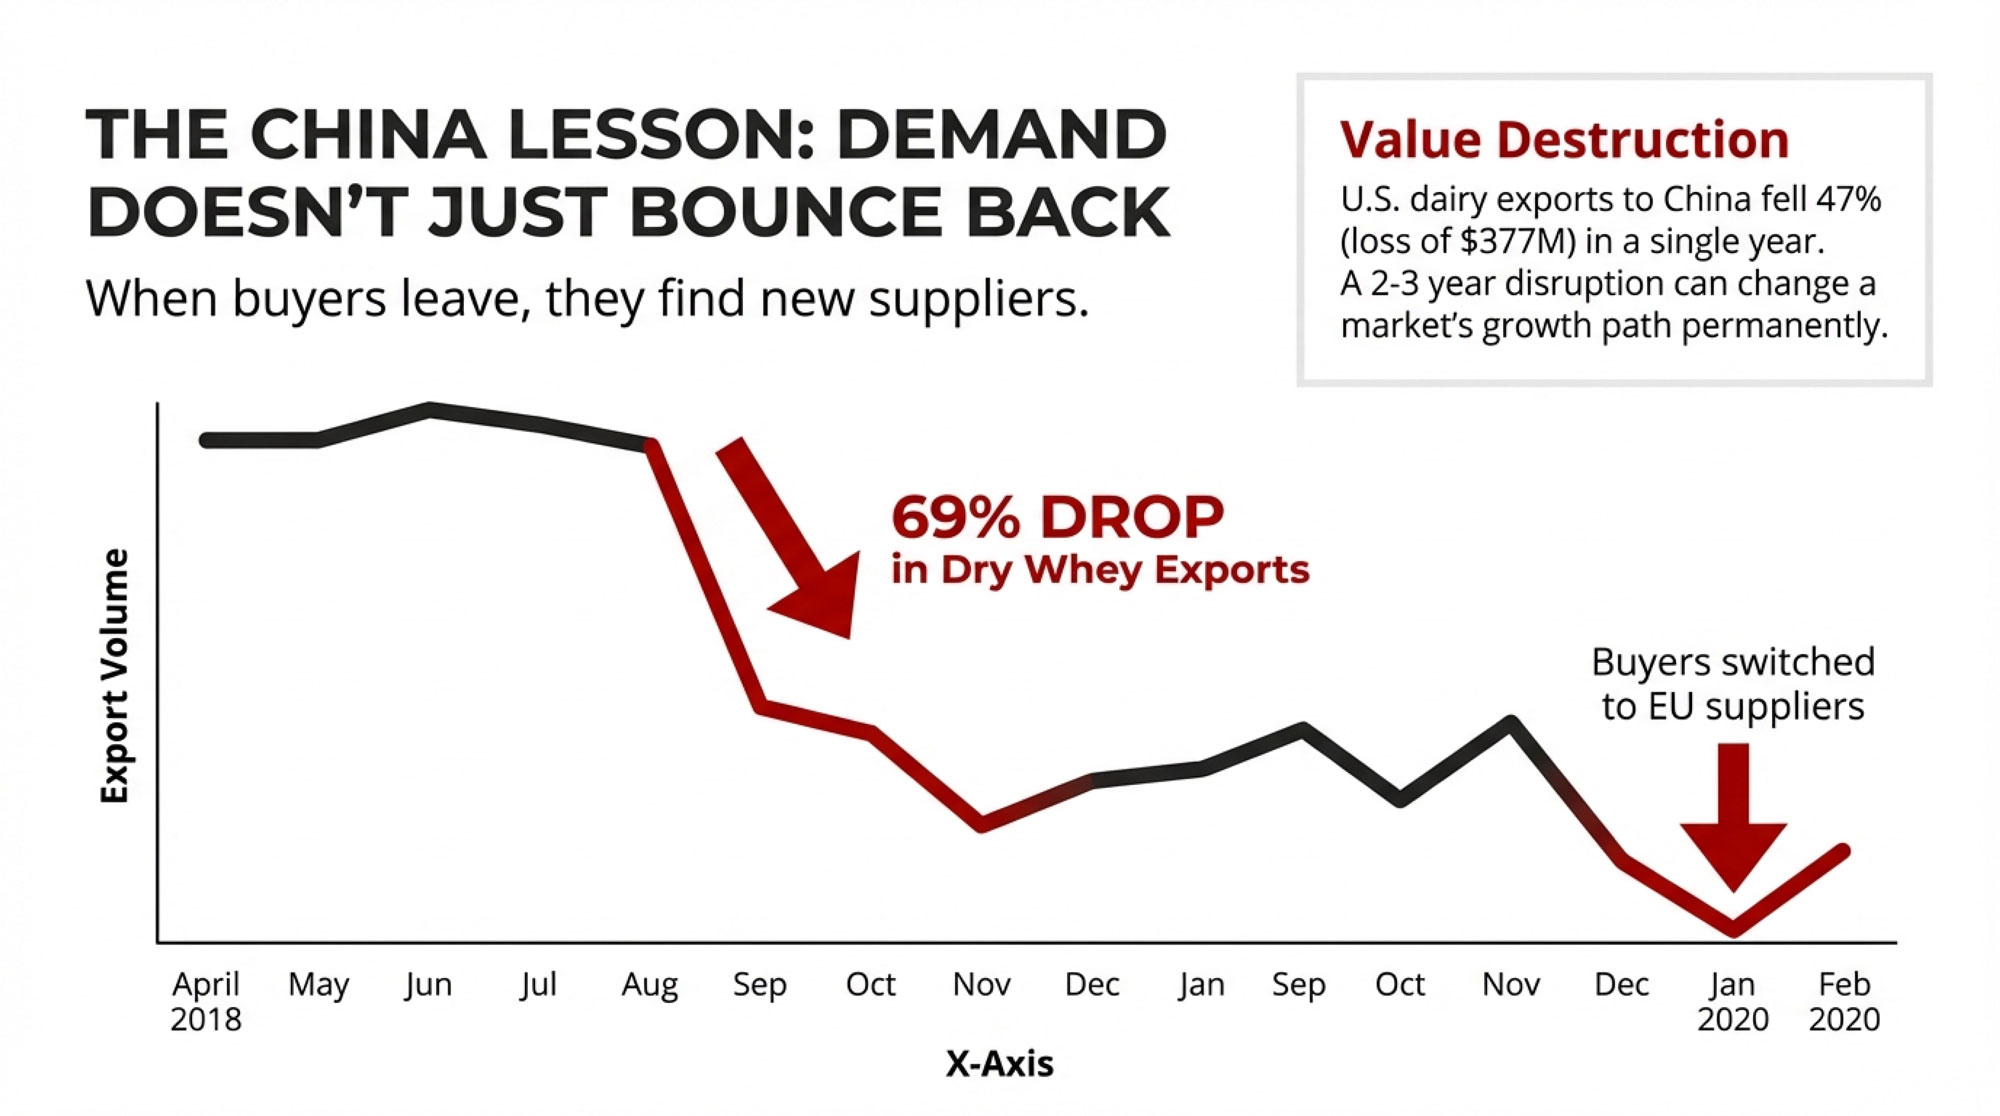
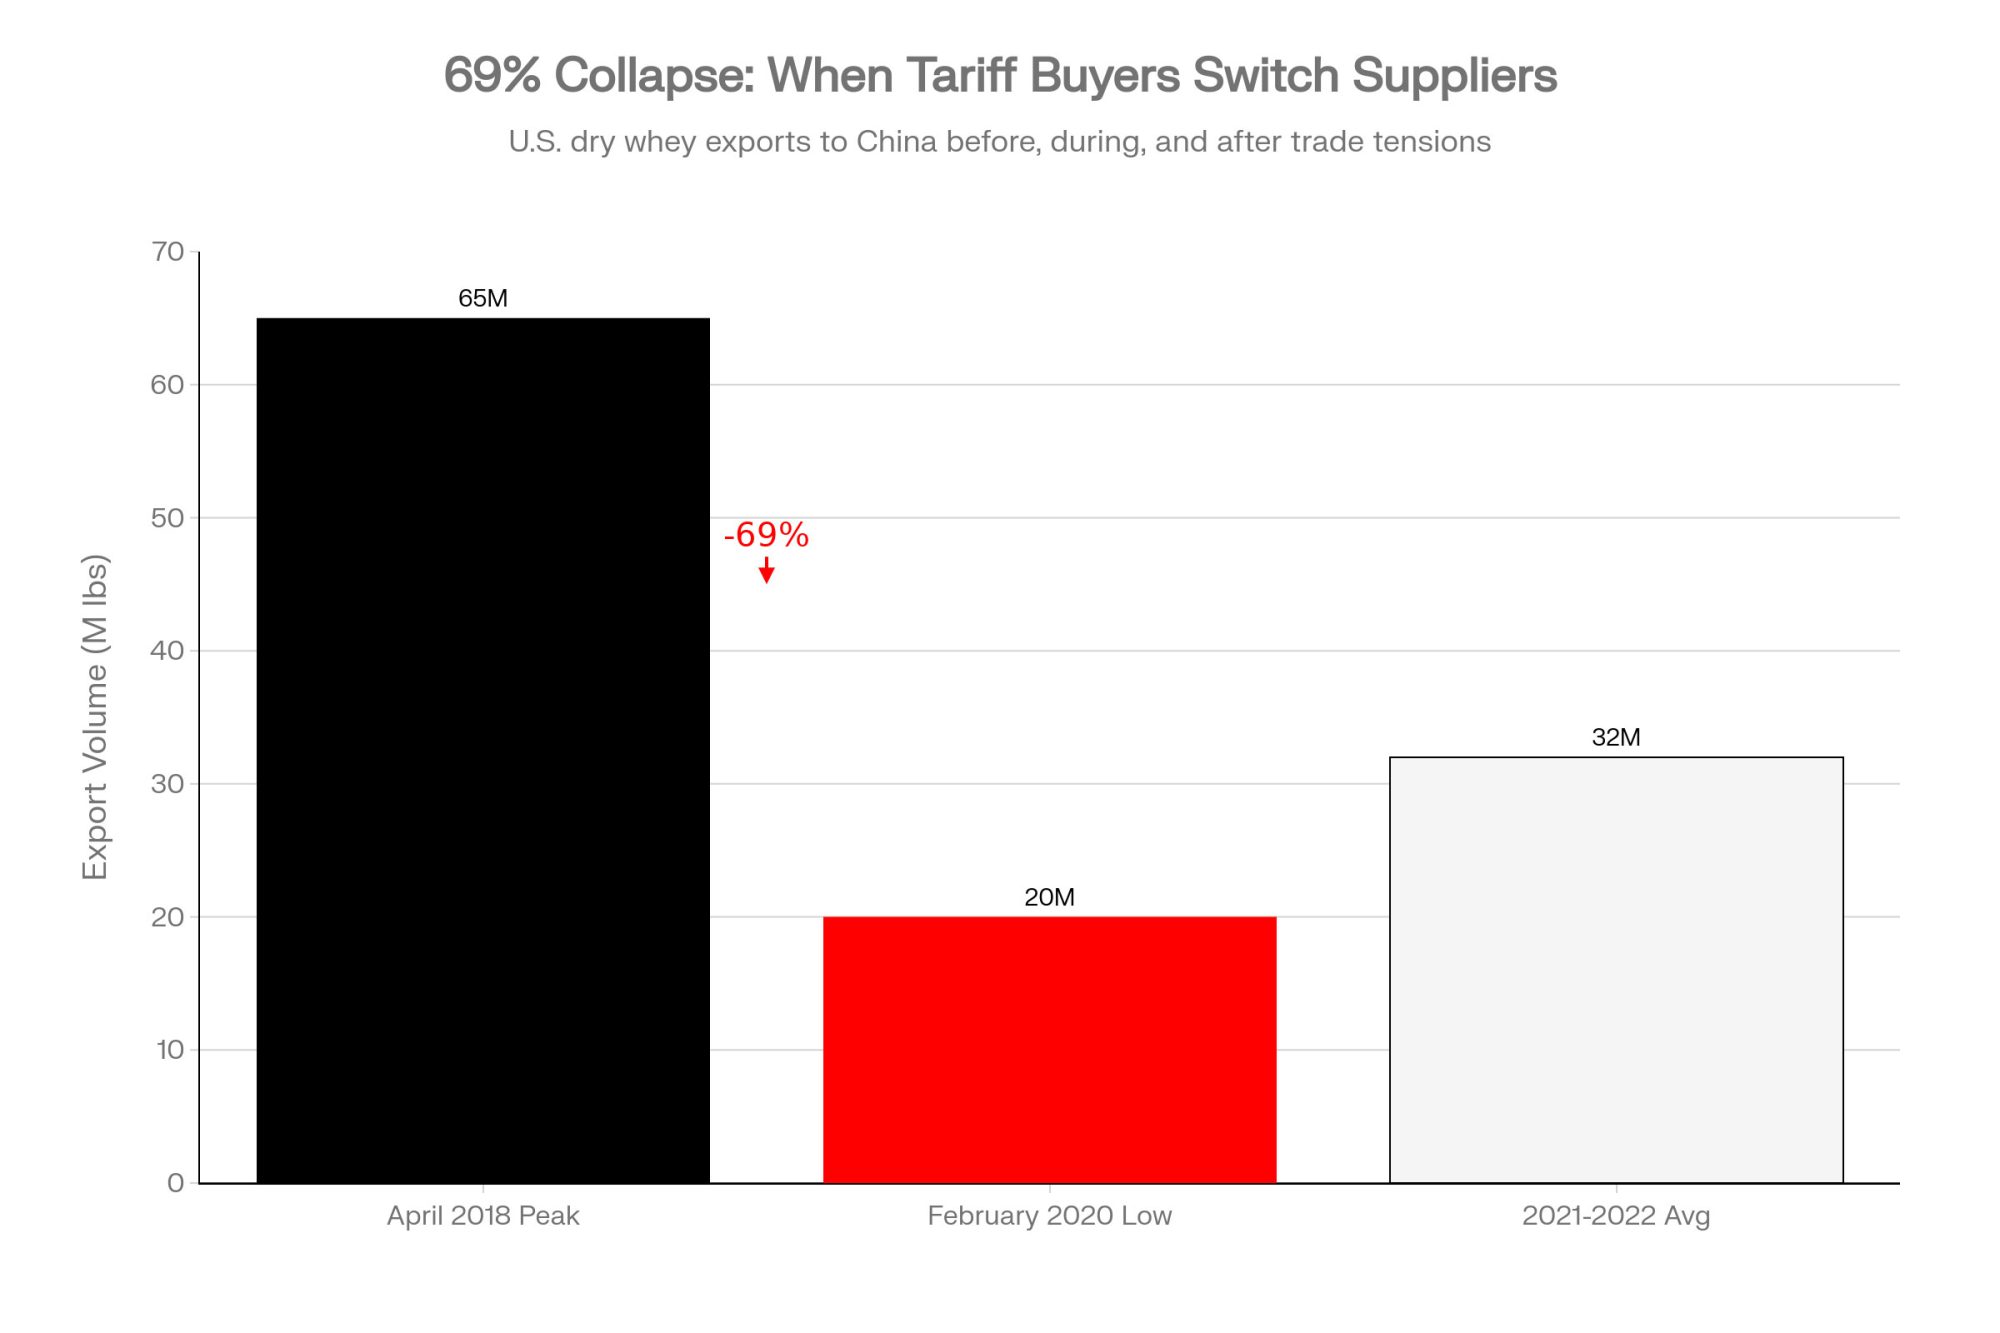
In an April 2025, after China imposed a 20 percent retaliatory tariff on U.S. dry whey in 2018, U.S. dry whey exports to China dropped 69 percent from their April 2018 peak to their February 2020 low, measured on a 12‑month rolling basis. That’s not just noise; that’s a major demand hole for a key by‑product that helps pay the bills in a lot of cheese and whey plants. 

As many of us have seen, once those kinds of volumes start moving, they don’t necessarily come back quickly. And if you wait to react until your milk check clearly reflects the problem, you’ve already given up most of your best options.

Mexico: Our Best Customer… and a Big Point of Exposure

You probably know this already, but the more recent numbers really drive home how central Mexico has become to U.S. dairy.

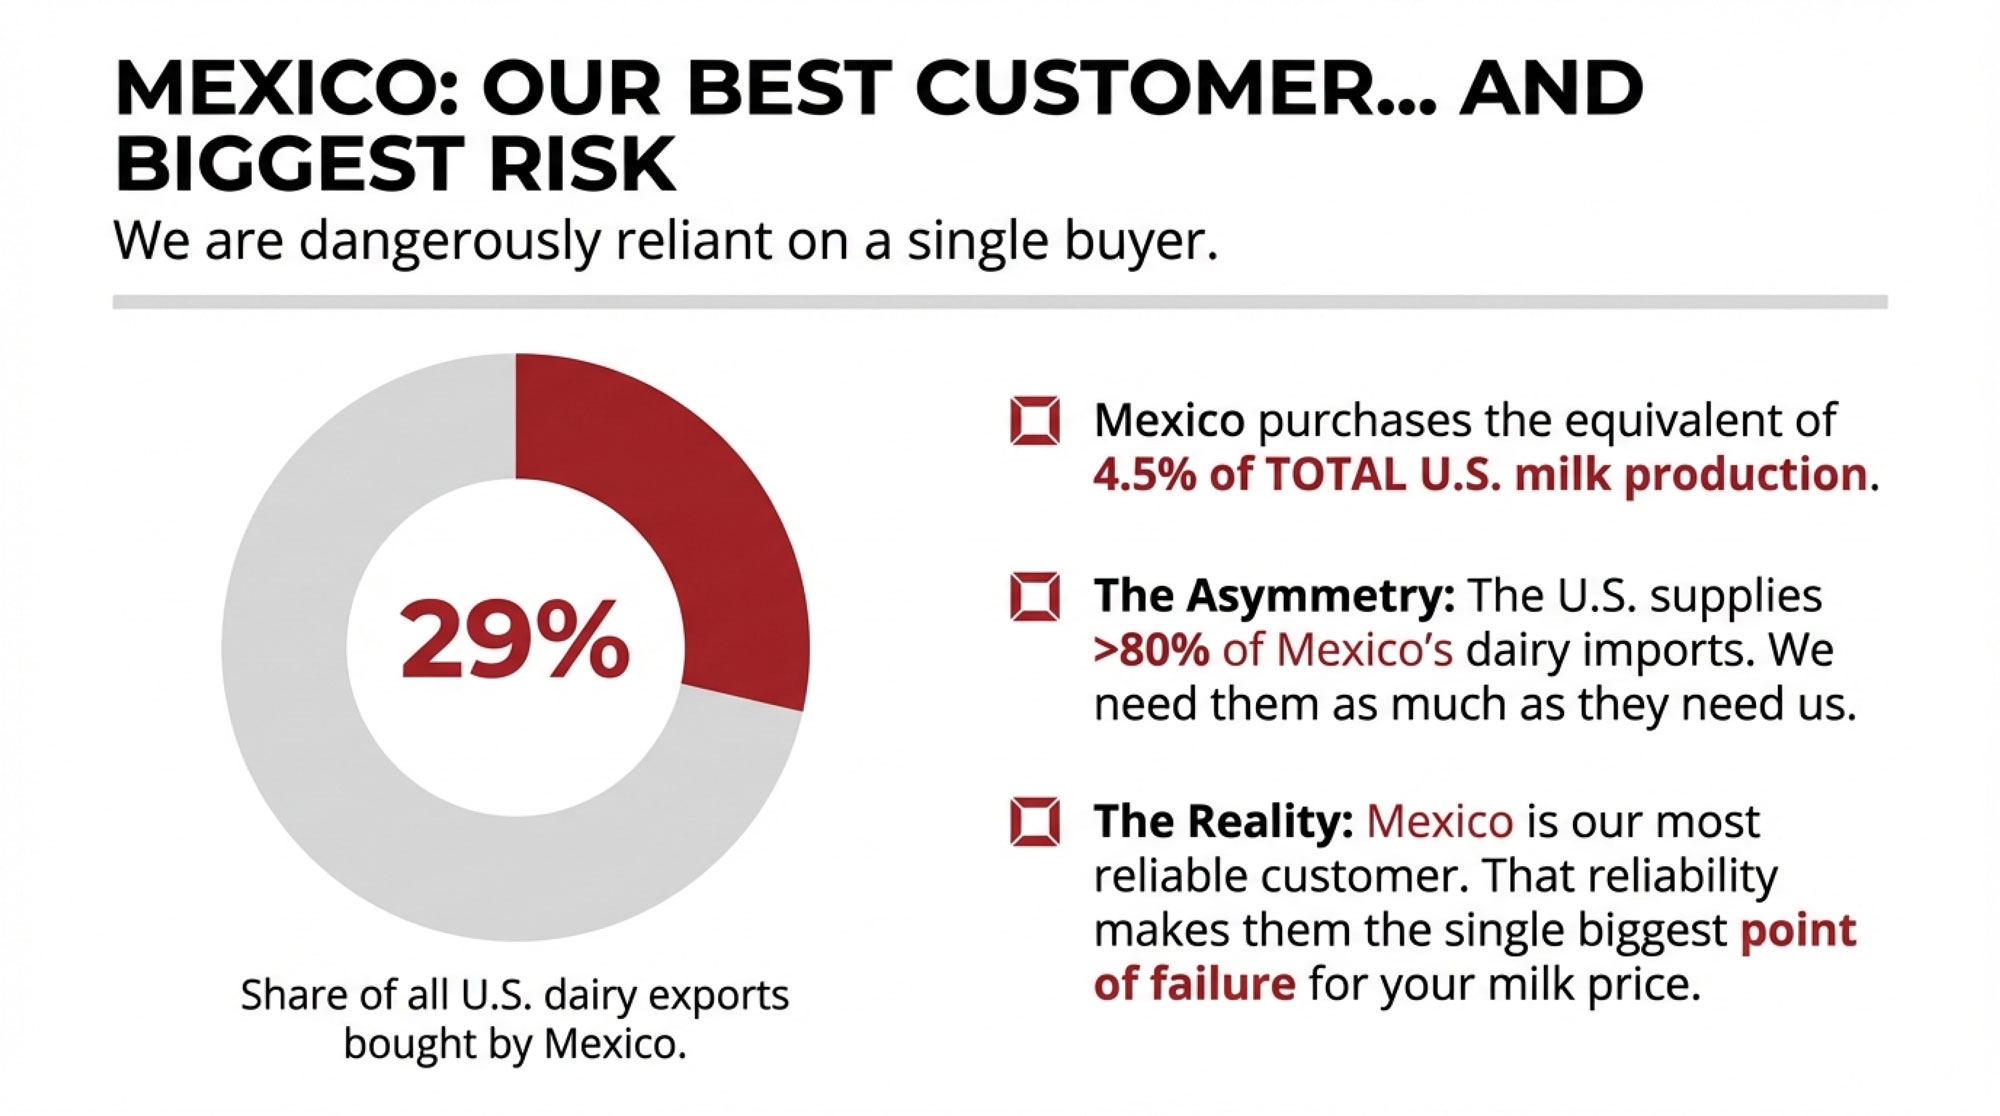
Citing USDA‑FAS data, it was reported that by September 2024, Mexico’s purchases accounted for 29 percent of all U.S. dairy product exports on a value basis. That same piece noted that the United States supplied Mexico with over 80 percent of its imported dairy products in 2024. So from Mexico’s side, the U.S. is the dominant supplier. From the U.S. side, Mexico accounts for close to a third of dairy export value. 

CoBank’s December 2024 report, “Mexico Has Become America’s Most Reliable Customer for U.S. Dairy Exports,” put it into milk terms. Their analysts calculated that Mexico purchases the equivalent of about 4.5 percent of total U.S. milk production through imported dairy products and ingredients. Corey Geiger, CoBank’s lead dairy economist, noted that Mexico runs a dairy product deficit of roughly 25–30 percent each year, and that the U.S. supplies over 80 percent of that shortfall. 

USDA‑FAS projections reinforce the idea that this isn’t going away overnight. In its May 2025 “Dairy and Products Semi‑annual – Mexico” report, FAS forecast Mexico’s fluid milk production to increase about 1 percent to 13.9 million metric tons in 2025 and projected similar modest growth in consumption. That same report highlighted that processors are expected to increase milk powder imports as they continue to favor lower‑cost raw materials for manufacturing. 

What the data suggests is an asymmetric relationship:

  • For Mexico, U.S. dairy is the dominant source of imports, but those imports sit on top of a large and growing domestic production base. 
  • For the U.S., Mexico is the single largest export destination—accounting for around 29 percent of total dairy export value and a major share of cheese, powder, and other products. 

So when CoBank calls Mexico “America’s most reliable customer” for U.S. dairy exports, they’re leaning on hard numbers. But Nicholson’s warning comes back into focus too: if trade tools get used aggressively and provoke retaliation in a market that important, the downside for U.S. dairy farms and processors is substantial. 

Key Numbers Worth Knowing

Looking at the numbers pulled together by USDA‑FAS, USDEC, and CoBank, a few datapoints really frame the risk:

  • Mexico’s share of U.S. dairy exports: about 29 percent by September 2024, based on USDA‑FAS trade data. 
  • U.S. share of Mexico’s dairy imports: over 80 percent of imported dairy products in 2024, per USDA‑FAS data reported by CoBank. 
  • Share of U.S. milk exported to Mexico: roughly 4.5 percent of U.S. milk production equivalent, according to CoBank’s 2024 analysis. 
  • U.S. dairy export value to China (Dec 2018–Nov 2019): about 377 million dollars, a 47 percent decline from the prior 12‑month period, per USDEC numbers reported by Cheese Reporter. 
  • Dry whey exports to China: a 69 percent drop from the April 2018 peak to the February 2020 low on a 12‑month rolling basis after China imposed a 20 percent retaliatory tariff, as documented by Hoard’s Dairyman. 
  • Estimated U.S. dairy farm revenue loss from China tariffs (2019–2021): about 2.6 billion dollars, according to Nicholson’s analysis cited by Cornell. 

Those numbers alone explain why tariff talk matters to your bottom line, even if all your cows are standing in a barn thousands of miles from the border.

China’s Lesson: When Demand Doesn’t Fully Come Back

Now let’s swing back to China, because what happened there is a warning about long‑term demand, not just short‑term pain.

USDEC’s review, as quoted in Cheese Reporter’s 2018–2019 tariff lessons column, showed that by 2017–2018, China had grown into a key destination for U.S. dairy—especially whey and other ingredients. Then the retaliatory tariffs hit. As mentioned earlier, USDEC’s tally showed the value of U.S. dairy exports to China fell to about $ 377 million in the 12 months from December 2018 through November 2019, a 47 percent drop from the previous year. 

2025 whey analysis dug deeper into the ingredient side. With a 20 percent retaliatory tariff on U.S. dry whey, exports to China dropped 69 percent from that April 2018 peak to a February 2020 low, using a rolling 12‑month comparison. During that period, it was noted that Chinese buyers shifted toward more EU dry whey, which wasn’t facing the same tariff penalty. 

Nicholson and other trade economists have pointed out that once buyers qualify alternative suppliers and re‑tool supply chains, not all of that business returns when tariffs ease or exemptions appear. A two‑ or three‑year disruption can change the growth path of a market for much longer than that. 

For U.S. producers, the key lesson is simple: when tariffs push a major buyer to diversify, some of that lost demand can become permanent.

So, Where Does This Leave Your Farm?

So, with all of that in mind, what does this actually mean when you walk back into your parlor or robot room?

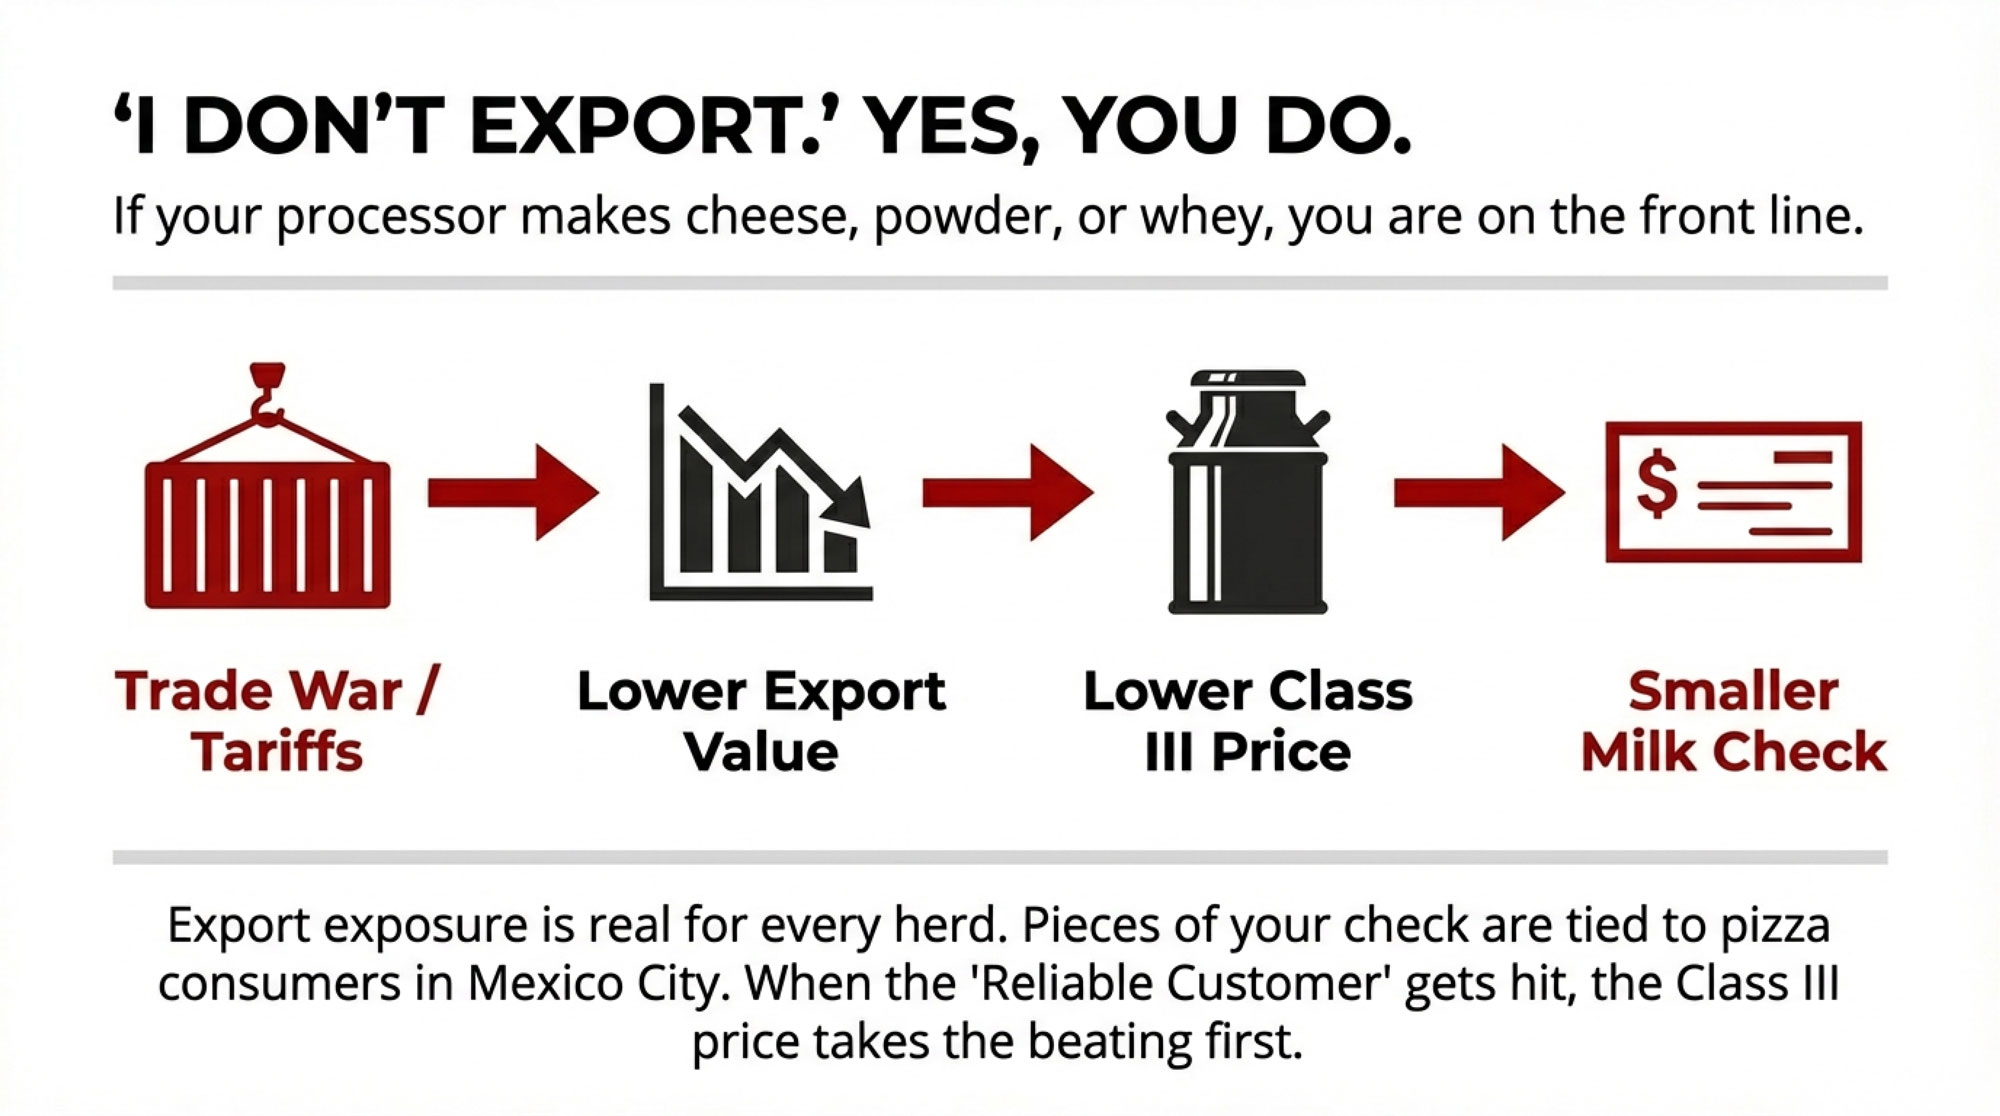
First, it means export exposure is real, whether you’ve ever thought of yourself as an “export farm” or not. If your milk goes to a cooperative or processor that makes cheese, nonfat dry milk, whey, or other export‑oriented products, then pieces of your check are indirectly tied to people buying pizza in Mexico City or feed products in Asia. The concentration numbers—Mexico taking 29 percent of U.S. dairy export value and importing the equivalent of 4.5 percent of U.S. milk output—make that pretty clear. 

Second, it means that when tariffs and trade headlines start moving from talk to action, you don’t have unlimited time to react. The 2018–2019 episode showed that retaliatory moves can go from announcement to significantly lower export values in less than a year, and in the case of whey, the effect on shipments was both steep and persistent. That’s why thinking in terms of a “window” makes sense—there’s a period where you can still get ahead of it. 

Third, it means that planning and conversations matter as much as any single policy announcement. And that part’s under your control.

Questions to Bring to Your Co‑op or Buyer

Looking at this trend, one of the healthiest shifts in the last few years is that more producers are asking pointed, respectful questions about how their milk buyer is positioned.

For co‑op members in the Upper Midwest, for example, where a lot of milk heads into cheese vats, it’s worth asking your board or management:

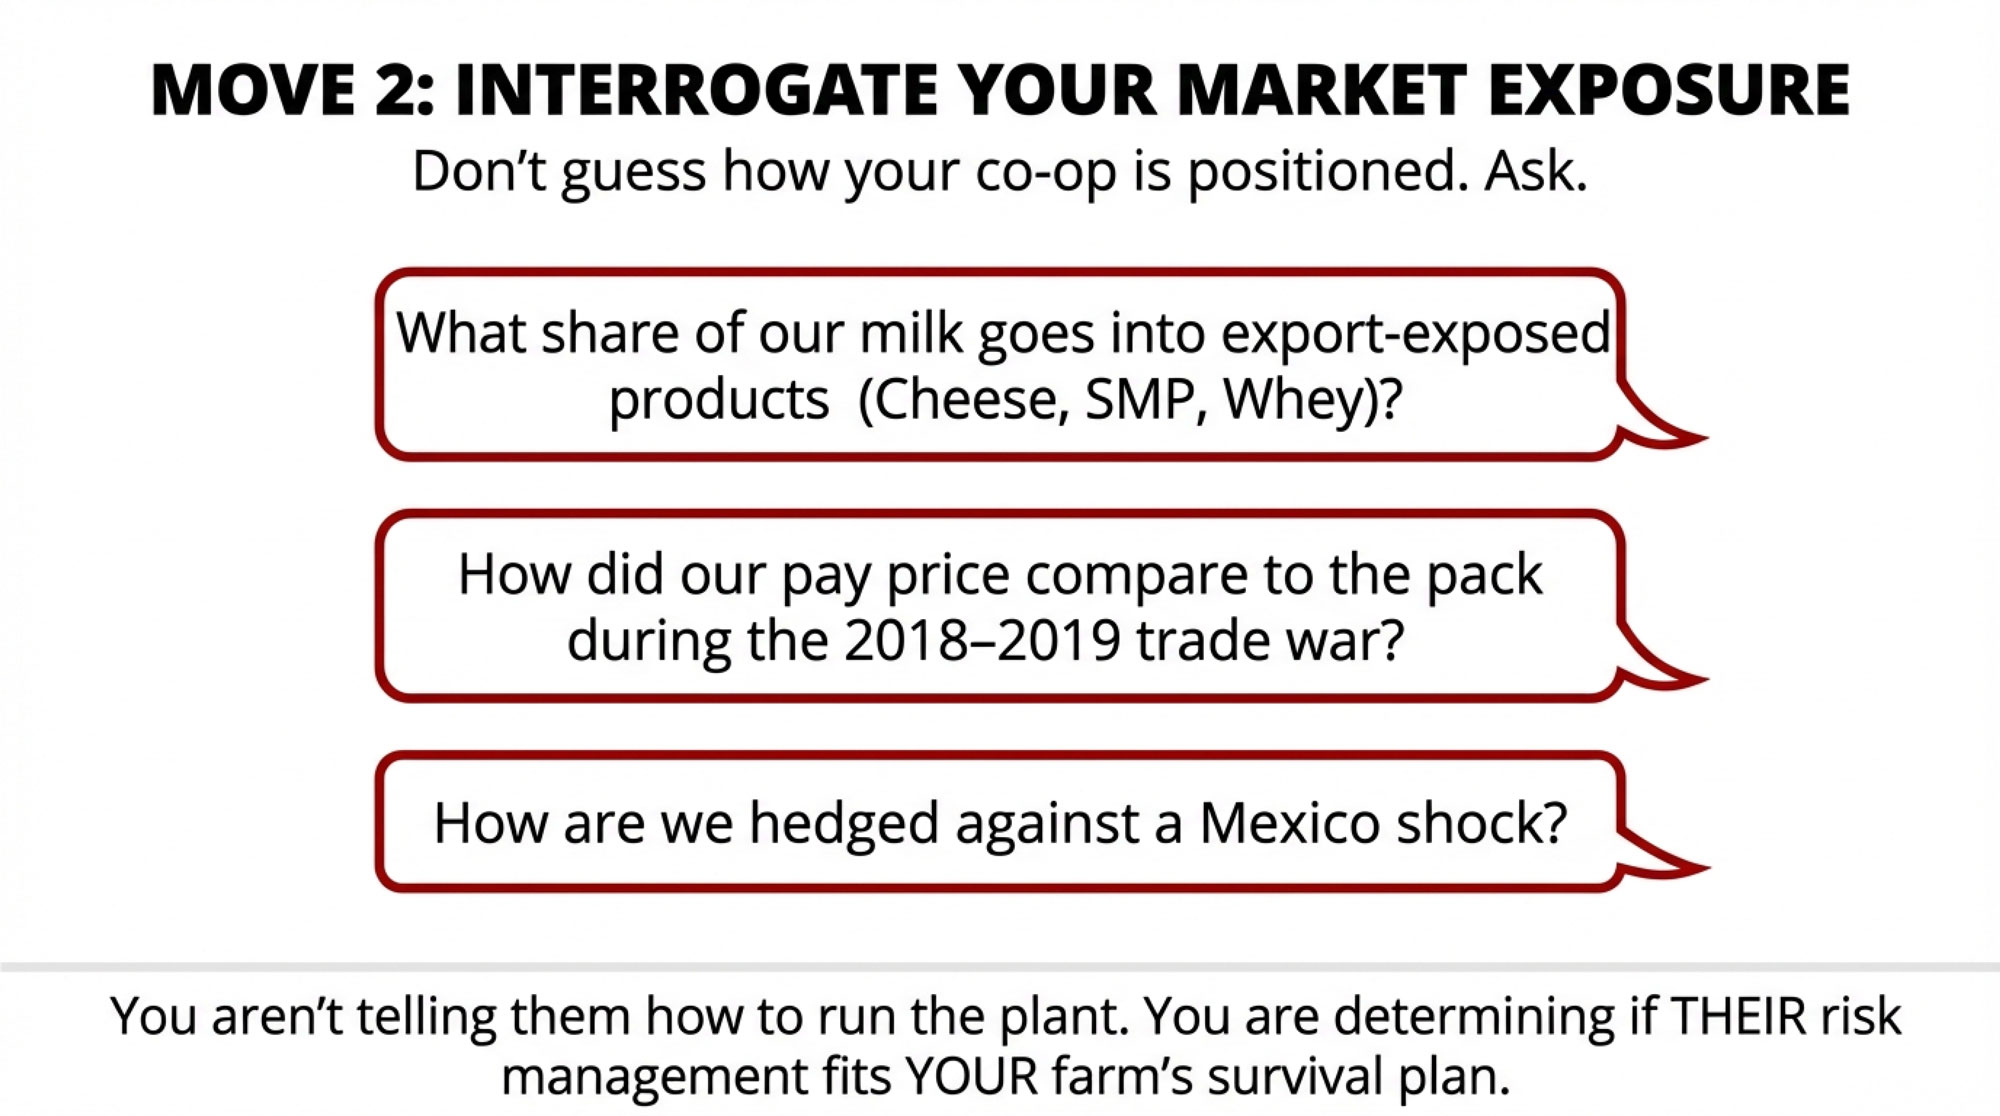
  • Roughly what share of our milk is going into export‑oriented products like cheese, skim milk powder, and whey, given the national export patterns CoBank and USDEC have outlined? 
  • During the 2018–2019 tariff period, how did our average pay price compare to other buyers in our federal order—were we generally ahead, behind, or about in the pack?
  • What kinds of tools does the co‑op use today—hedging, product diversification, long‑term contracts—to buffer members from sudden export demand shocks?

If you’re shipping to a proprietary plant in Idaho or California that sells into both domestic and export markets, the questions are similar. You’re not trying to tell them how to run the business; you’re trying to understand how your farm fits into their risk picture.

Industry groups like the Wisconsin Cheese Makers Association have recently highlighted how trade tensions and export barriers shape decisions at cheese and whey plants, including product mix and market focus. Those kinds of articles make good conversation starters and show that processors are thinking about this, too. 

And I’ve noticed that when producers come to meetings with numbers and questions rather than just frustration, the conversation usually improves for everyone.

Sitting Down With Your Lender Before There’s a Fire

What many lenders have said in interviews with dairy media and farm‑management educators is pretty consistent: the best conversations happen before there’s a cash‑flow emergency. 

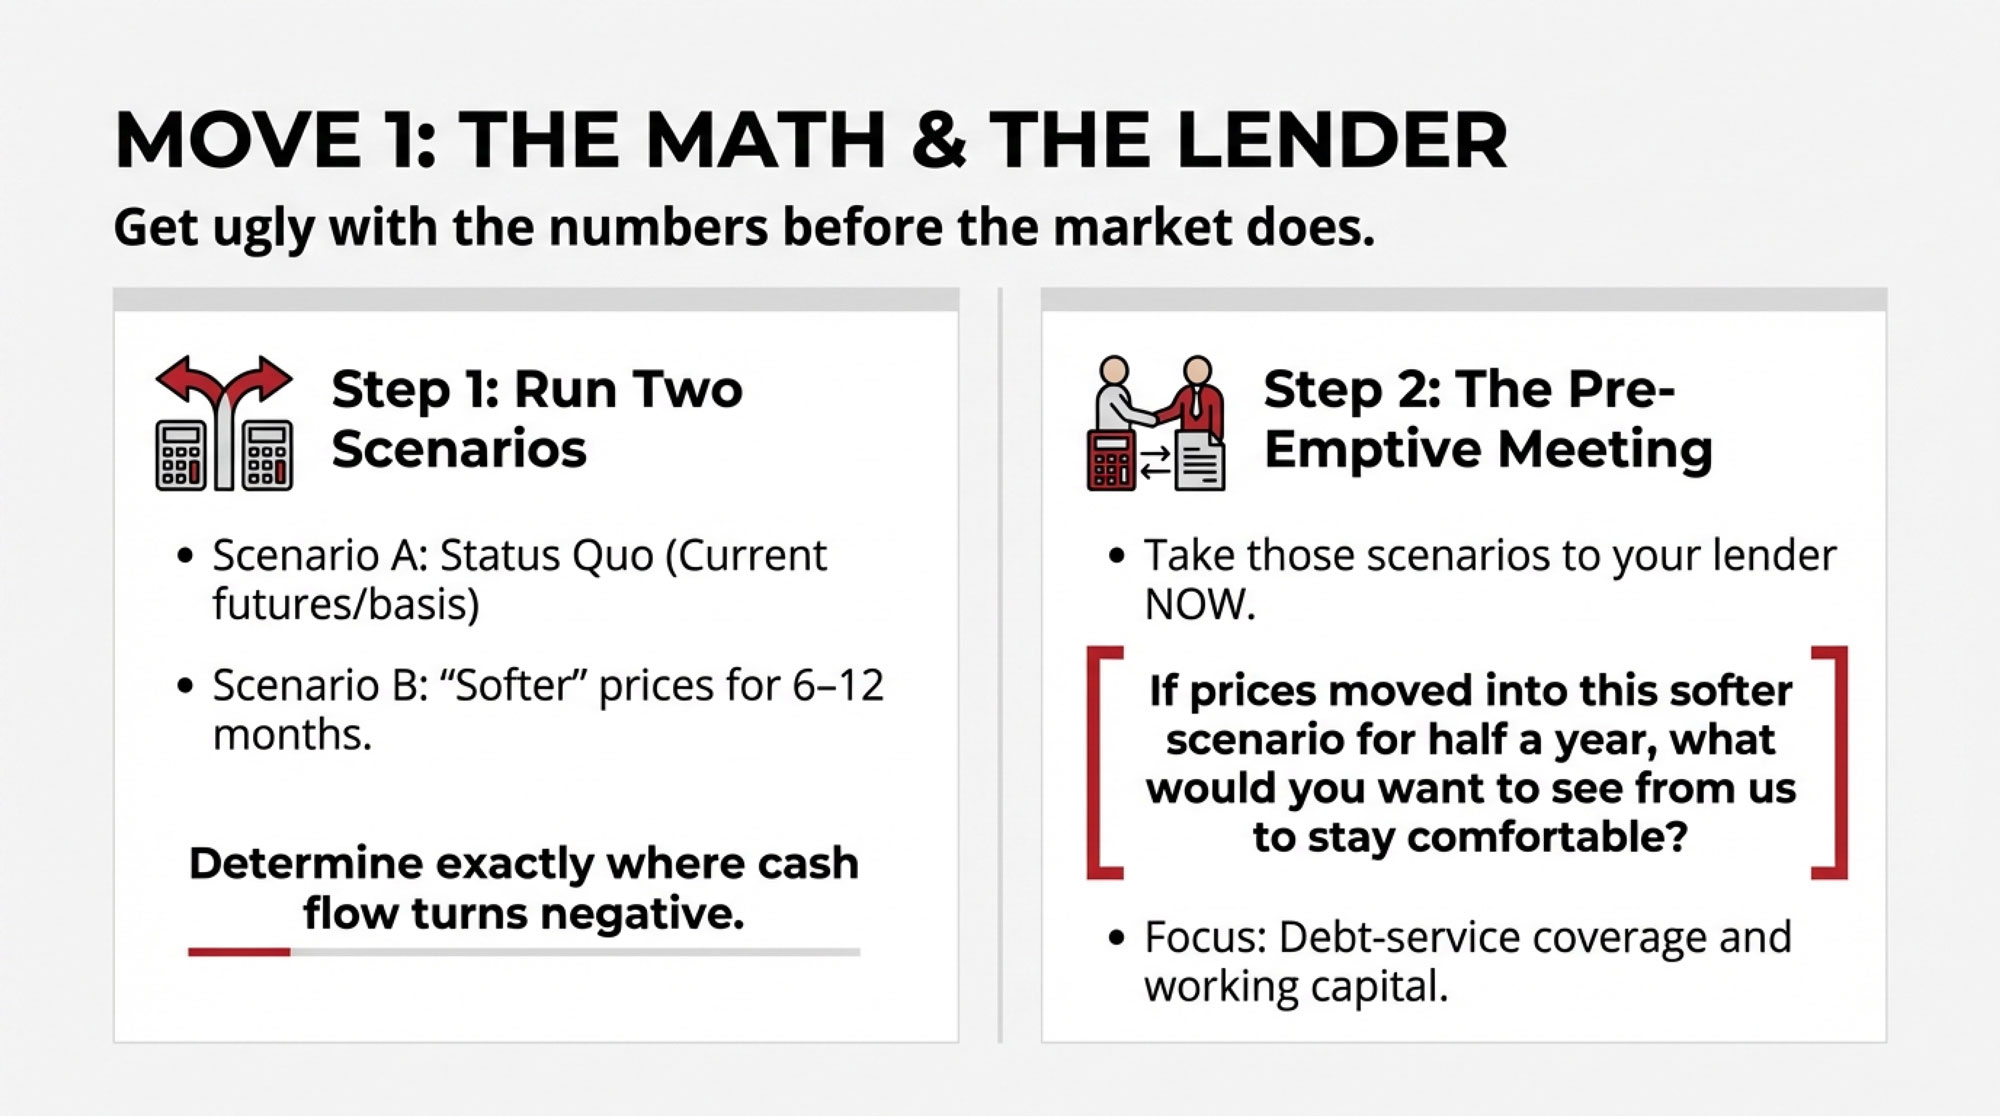
You don’t need perfect forecasts to have a useful meeting. What you do need are a few grounded scenarios you can walk through together:

  • One based on today’s outlook, using current futures and your local basis.
  • One that assumes a noticeable softening in prices for six to twelve months—something that would squeeze margins but not necessarily be catastrophic.

You might not know all your ratios off the top of your head, but you can bring a simple printout or spreadsheet with you:

  • Herd size and average production per cow.
  • Your recent butterfat performance and component levels.
  • Rough cost per hundredweight from your last farm financial review.
  • Current term debt schedule and operating line limits.

Then you can ask very practical questions:

  • “If prices moved into this softer scenario for half a year, what would you want to see from us to stay comfortable with our operating line?”
  • “Are there any term loans we could look at restructuring in advance to give us more breathing room on cash flow if things get choppy?”

Farm Credit associations and other ag lenders often publish their own dairy outlooks and risk‑management articles, and university extension programs pick them up and discuss them. Skimming one or two of those ahead of time can help you frame what your lender is already worrying about. 

What’s encouraging is that lenders generally don’t expect perfection. They expect awareness and a plan.

Thinking About Risk Tools Without the Sales Pitch

Programs like Dairy Margin Coverage and Livestock Risk Protection are designed for exactly the kind of volatility we’re talking about.

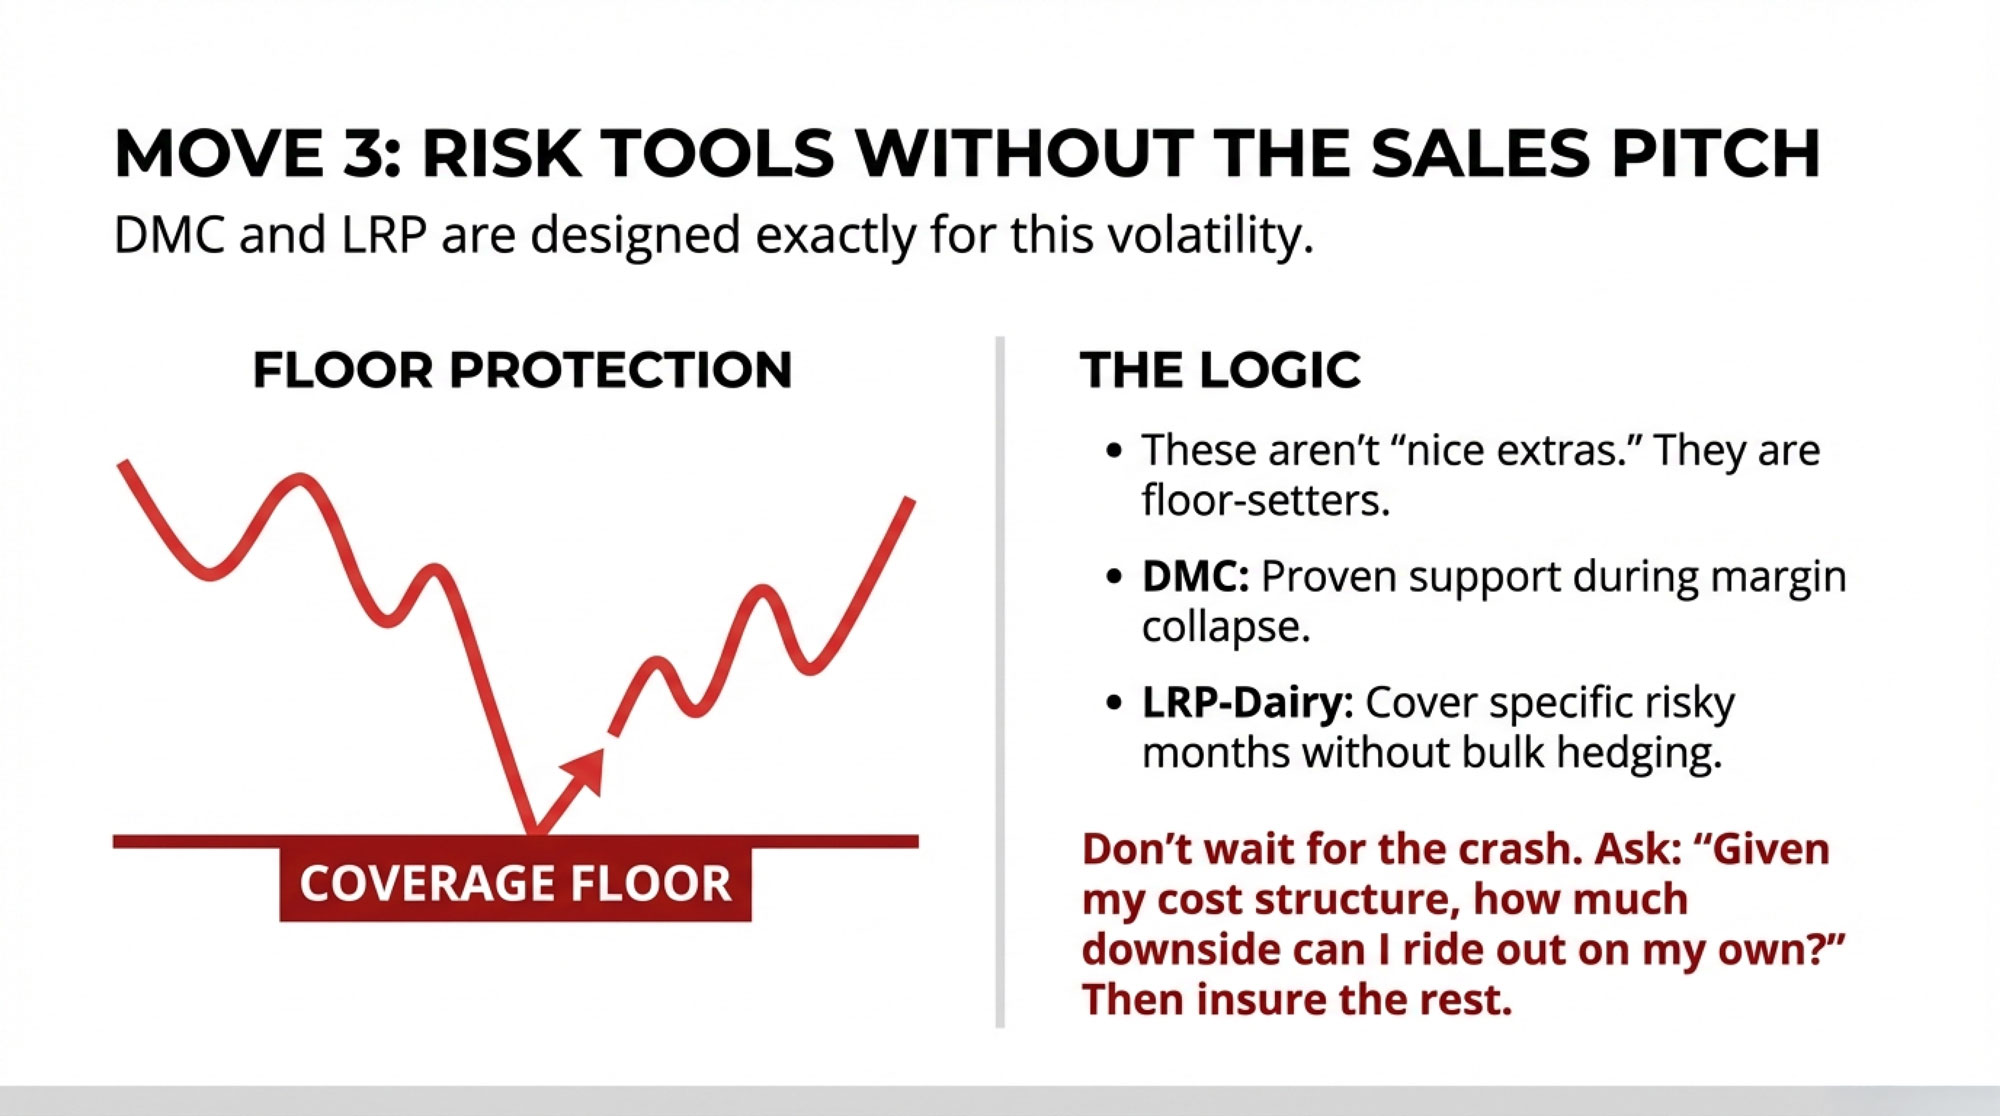
USDA’s Farm Service Agency has documented how DMC payments supported participating farms during the margin collapses of 2020, especially for operations that chose higher coverage levels up to the Tier I cap of 5 million pounds per year at 9.50 dollars per hundredweight. USDA’s Risk Management Agency, in its LRP‑Dairy materials, explains how producers can buy coverage on expected milk prices for specific months, with indemnities paid when actual index values fall below the coverage level, allowing smaller‑volume coverage than traditional futures or options. 

The data and case examples shared by land‑grant extension programs—like those from UW–Madison, Penn State, and Ohio State—suggest these tools tend to work best when they’re part of a thought‑out risk plan rather than a last‑minute scramble. Extension economists and dairy business management specialists have walked through examples of aligning DMC coverage with the cost of production and using LRP‑Dairy selectively on a portion of milk to cover the riskiest months. 

So instead of treating these programs as “nice extras” or something you only look at when prices are already ugly, it’s worth asking yourself:

  • “Given my cost structure and butterfat performance, how much downside can I realistically ride out on my own?”
  • “Beyond that point, what portion of my milk do I want to insure, and with what mix of tools that I actually understand?”

Your local extension educator, FSA staff, and crop insurance agent can help you look at USDA summaries of past payouts and current premium tables so you’re making decisions based on numbers, not anecdotes.

If Exit Is on the Horizon, Timing Still Matters

This is a tough topic, but it’s part of the real conversation on a lot of farms, especially in regions like the Northeast and Upper Midwest, where farm numbers have been under pressure for years.

In some operations—where the next generation is unsure about taking over or where the main operators are dealing with health issues—the question isn’t just “how do we ride out another tough year?” It’s also “if we’re going to be done sometime in the next five to ten years, when and how do we want that to happen?”

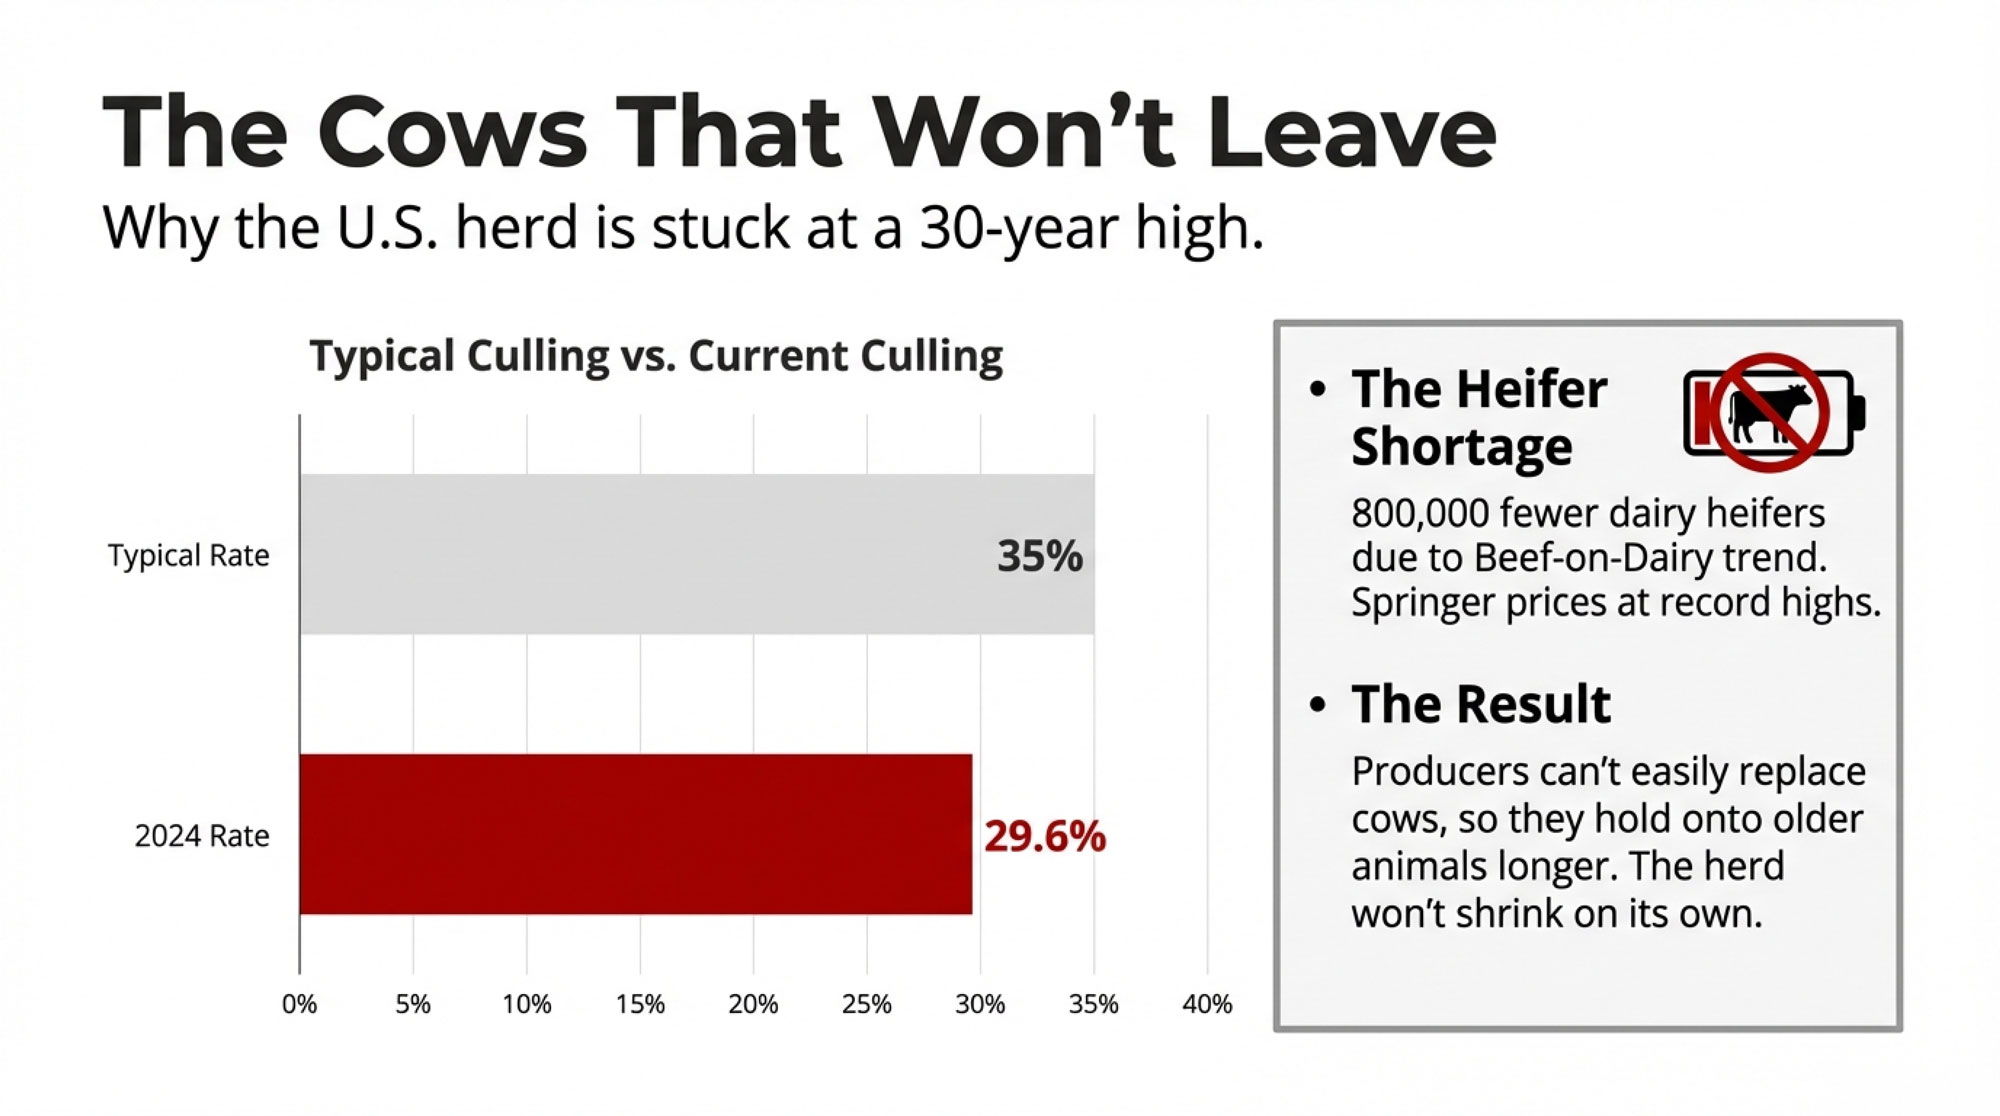
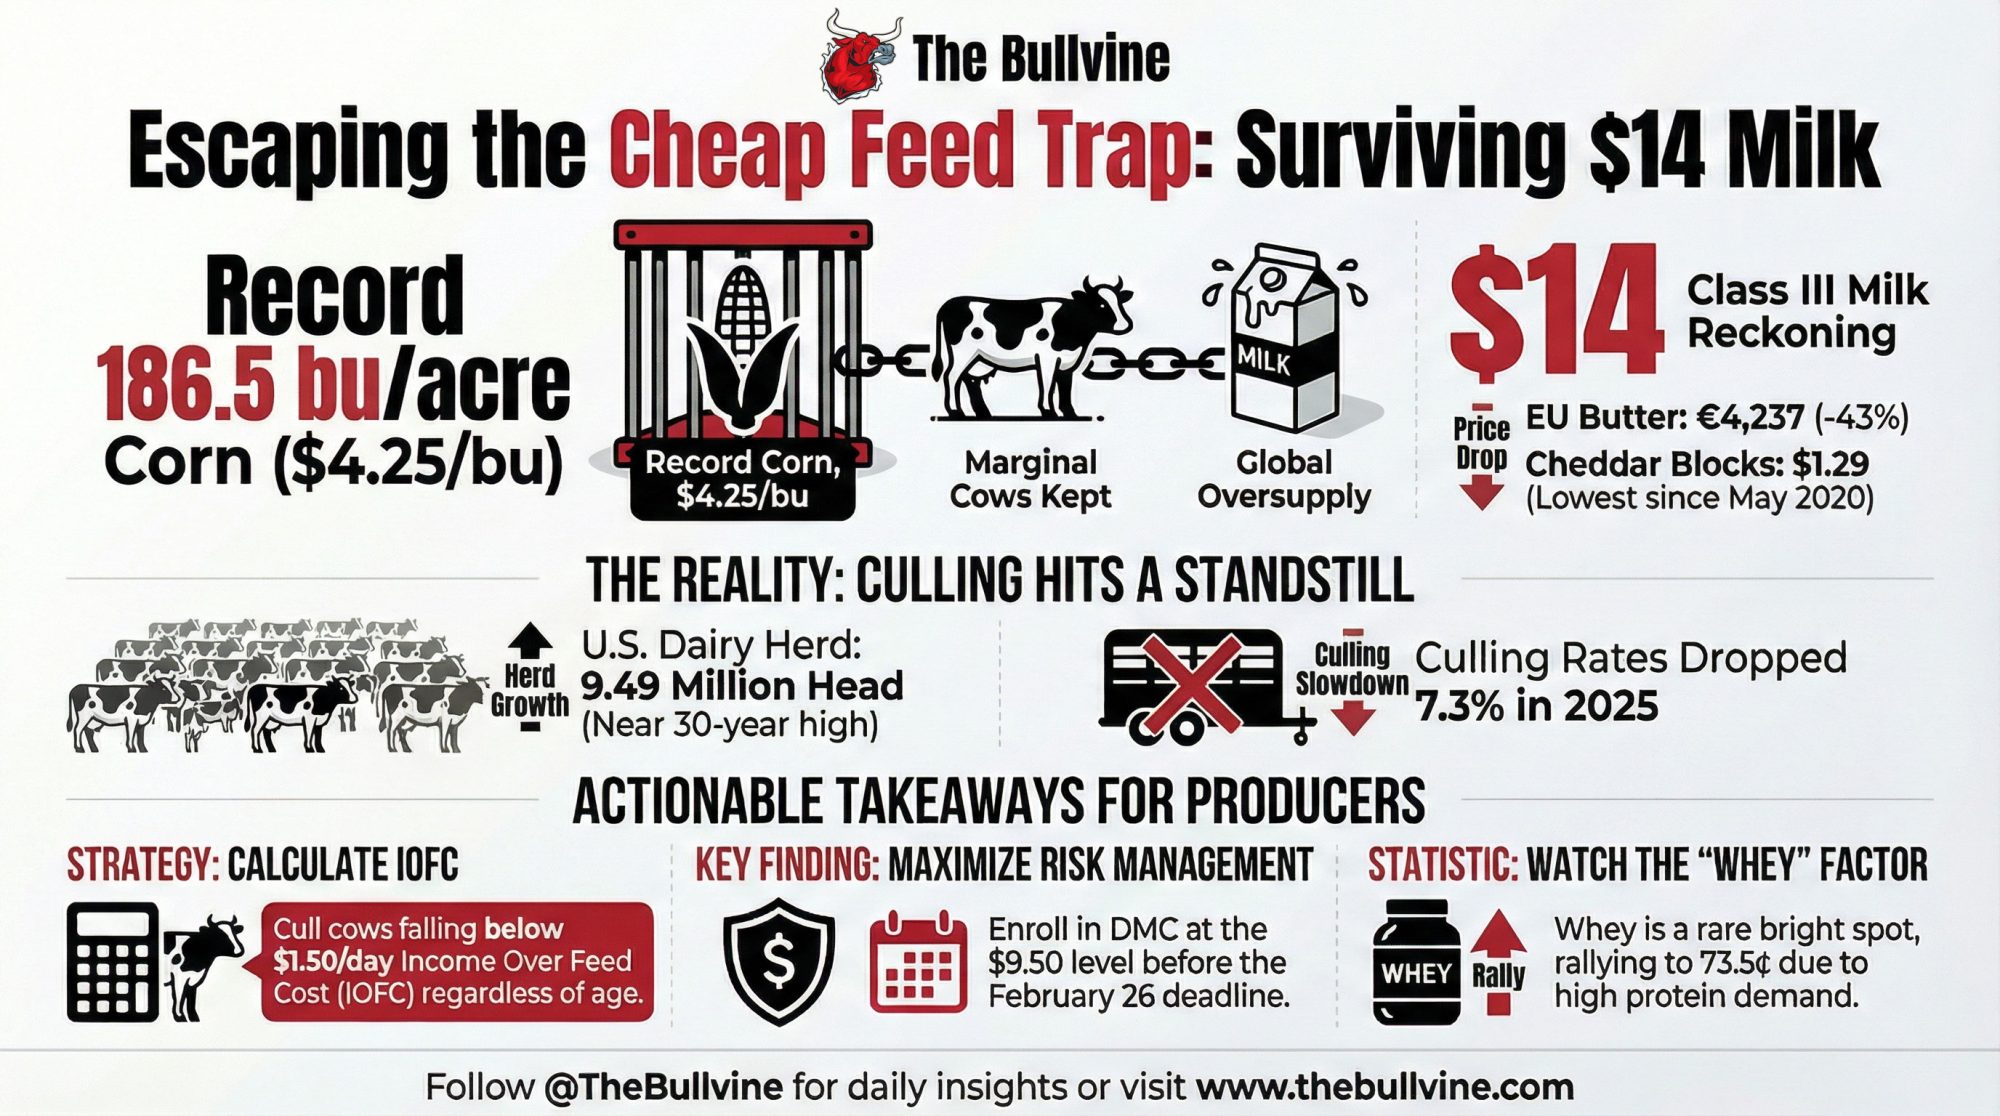
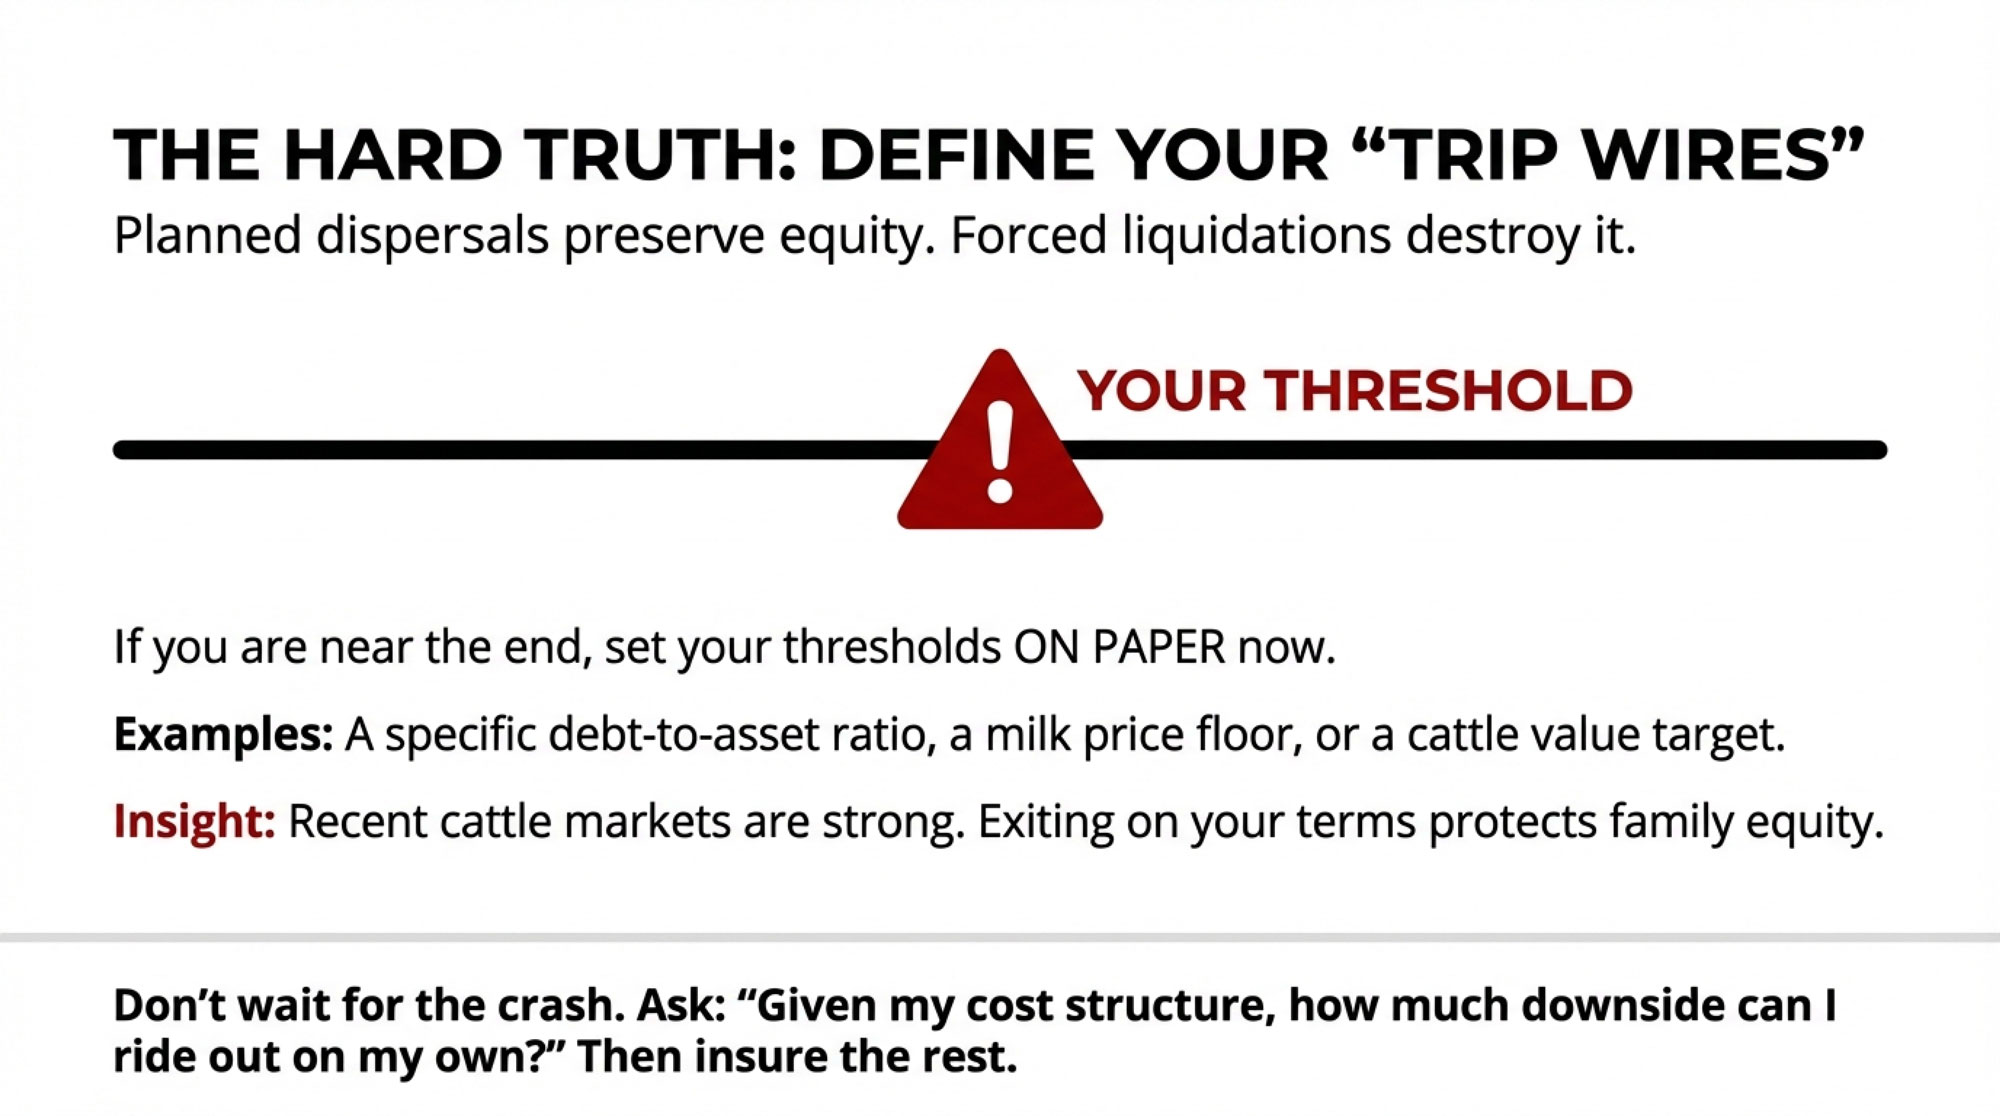
Cull cow and bred heifer prices have gone through stronger periods recently, supported in part by tighter beef supplies and the growing use of beef‑on‑dairy genetics, which can improve the value of crossbred calves and cull animals. Farm‑management articles and extension transition resources from universities in Wisconsin, Pennsylvania, and Ontario have noted that planned dispersals in reasonably firm cattle markets often preserve more equity than forced liquidations after prolonged low‑margin periods and mounting debt, based on farm case studies and lender feedback. 

The exact dollars will vary herd by herd. But the pattern is consistent enough that it’s worth a kitchen‑table discussion if you’re in that stage:

  • “If we did decide to exit in the next few years, what conditions—milk price, cattle price, debt level—would make that feel like a planned move rather than a last‑ditch sale?”
  • “What level of equity do we want to protect for the family, whether that’s land, retirement savings, or off‑farm investments?”

Extension farm‑transition specialists have checklists and meeting templates that can help you structure those conversations and bring everyone into the loop before circumstances force decisions. 

It Might Not Be 2018–2019 All Over Again… But It’s Worth Being Ready

It’s worth noting that not every tariff scare becomes a full‑blown crisis.

USDA‑FAS’s 2025 outlook for Mexico shows continued growth in domestic dairy production and ongoing demand for imported powders and cheese, even in the face of broader trade tension. CoBank’s analysis frames Mexico as a structurally reliable customer for U.S. dairy, given its persistent deficit and heavy reliance on the U.S. supply. Trade press coverage has also highlighted that some announced tariff measures end up delayed, modified, or partially offset by exemptions and side deals, which can soften the blow for agriculture.

What’s encouraging is that the U.S. dairy sector has adapted to shocks before. Exporters have shifted product mixes and markets, processors have invested in new capabilities, and producers have improved fresh cow management, feed efficiency, and overall cost control in response to tough years. That doesn’t mean it’s easy; it means it’s possible. 

At the same time, the data from the last tariff cycle—and Nicholson’s 2.6‑billion‑dollar loss estimate—are a reminder that when major markets pull back, the financial damage can be both large and long‑lasting. That’s why this isn’t about predicting doom; it’s about deciding how you want to be positioned if the road gets rough. 

A Simple 60‑Day Framework You Can Actually Use

MetricCurrent OutlookSofter Scenario (6–12 mo)Change
Class III Milk Price ($/cwt)$18.50$16.00–$2.50
Butterfat Premium ($/lb)$2.10$1.85–$0.25
Feed Cost per Cow/Day$9.25$9.50+$0.25
Est. Margin per Cow/Day$3.20$1.15 ⚠️ RED–$2.05

So, over the next couple of months, here’s a straightforward way to put all this into practice without turning it into a full‑time project.

  1. Put two price scenarios on paper.
    Use your own numbers—your butterfat performance, average production per cow, and local basis. Start with something close to today’s outlook based on current futures. Then sketch a second scenario in which prices are meaningfully softer for 6 to 12 months. You don’t need to be perfect; you just need to see roughly where cash flow turns from positive to negative and what that looks like in dollars per month.
  2. Take those scenarios to one meeting with your co‑op or buyer.
    At a member meeting in Wisconsin, a one‑on‑one with a field rep in New York, or a call with a plant in the West, use the Mexico and China numbers as a backdrop and ask: “If export markets got choppy like they did in 2018–2019, how would that likely show up in our pay price, and what options would you have beyond just dropping the check?” Co-op and processor leaders have been talking publicly about trade risk and export barriers in venues like the Wisconsin Cheese Makers Association and national dairy policy forums—referencing those discussions shows you’re paying attention. 
  3. Take the same scenarios to one meeting with your lender.
    Sit down with your banker or Farm Credit officer and say: “Here’s what our cash flow looks like at these two price levels. If the softer scenario showed up for half a year, what would you want to see from us to stay comfortable? Are there things we could adjust now to give both of us more confidence?” Dairy‑focused lenders interviewed by farm media and extension often point to debt‑service coverage, working capital, and equity as the main gauges they watch. Ask them which ones they’re watching on your operation. 
  4. Ask good questions about risk tools.
    With your extension educator, FSA office, or insurance agent, walk through how DMC and LRP‑Dairy actually performed in 2020 and other recent years for farms your size, using USDA and extension summaries as your guide. You’re not committing on the spot; you’re making sure you understand what they can realistically do for your operation and the costs involved. 
  5. If succession or retirement is a live topic, name the “trip wires.”
    If the family’s talked about being “done at some point,” put rough thresholds on paper—maybe a certain milk price, debt‑to‑asset ratio, or cattle value—and discuss at what point a planned exit might be better than pushing through at any cost. Extension farm‑transition specialists and case studies from Wisconsin, Pennsylvania, and Ontario can give you examples of how other families have navigated those choices. 

None of this requires you to guess which tariff will be announced next or how Mexico or China will respond. It just puts you in a better position to decide, rather than react.

Closing Thoughts: Deciding While You Still Have Room

As many of us have learned, nobody—whether it’s USDA, USDEC, your co‑op, or your lender—has quite the same focus on your farm’s future as you do. They all bring tools and information to the table, but they’re looking across hundreds or thousands of farms, not just yours. 

What’s encouraging is that you don’t need to control court decisions, trade negotiations, or election outcomes to tilt the odds a bit more in your favor. You can use this “60‑day window” idea as a reminder: there is a period between policy talk and milk‑check pain where you still have room to adjust your plan.

If things stay relatively calm, you’ll have invested some time in understanding your operation better and strengthening relationships with the people who help finance and market your milk. If tariffs and trade disputes start biting into exports again, you’ll be glad you didn’t wait for your milk statement to tell you there was a problem.

Because once the damage is printed on that check, you’re not really deciding anymore. You’re reacting.

Right now, you still have room to decide.

Key Takeaways

  • $2.6 billion lost: Chinese retaliatory tariffs alone cost U.S. dairy farms an estimated $2.6B in revenue from 2019–2021, per Cornell economist Charles Nicholson. ​
  • 29% in one market: Mexico buys about 29% of all U.S. dairy exports and relies on the U.S. for over 80% of its imported dairy—one trade dispute could ripple through the entire sector. ​
  • Demand doesn’t snap back: After China imposed 20% tariffs on U.S. dry whey, exports dropped 69% and buyers shifted to the EU; much of that volume never fully returned. ​
  • You have a 60-day window: From tariff announcement to milk-check impact is roughly 60–90 days—enough time to run price scenarios, schedule one meeting each with your co-op and lender, and review your DMC/LRP position.
  • Decide now or your check decides later: Farms that act in the window keep their options open; farms that wait until the damage prints are already reacting instead of choosing.

Complete references and supporting documentation are available upon request by contacting the editorial team at editor@thebullvine.com.

Learn More

Join the Revolution!

Join over 30,000 successful dairy professionals who rely on Bullvine Weekly for their competitive edge. Delivered directly to your inbox each week, our exclusive industry insights help you make smarter decisions while saving precious hours every week. Never miss critical updates on milk production trends, breakthrough technologies, and profit-boosting strategies that top producers are already implementing. Subscribe now to transform your dairy operation’s efficiency and profitability—your future success is just one click away.

NewsSubscribe
First
Last
Consent

$14 Milk, $4 Corn, and the Cows Nobody Will Cull: This Week’s Global Dairy Reckoning

Cheap feed is a trap. Every cow that should’ve been culled is still milking—and $14 Class III is the price we’re all paying.

Global dairy market reckoning

EXECUTIVE SUMMARY: Class III is testing $14. EU butter crashed 43% year-over-year. Cheddar blocks hit $1.29—their lowest since May 2020. Welcome to synchronized oversupply: EU-27+UK November milk surged 4.6%, the U.S. dairy herd is near a 30-year high, and cull rates are at historic lows because $4.25 corn makes even marginal cows cash-flow positive. That’s the trap—cheap feed was supposed to ease the pain, but it’s keeping underperforming cows in barns across the industry and delaying the correction prices desperately need. GDT Pulse finally showed signs of life Sunday (WMP +1.0%, SMP +2.1%), but until someone starts culling, $14 milk isn’t going anywhere.

Futures Markets: Still Searching for a Floor

The futures boards told a grim story last week—and frankly, nobody’s quite sure where the bottom is yet.

EEX European Futures moved 4,550 tonnes (910 lots), with Wednesday posting the busiest session at 1,905 tonnes. Butter futures took the worst of it. The Jan26-Aug26 strip dropped 4.5% to average €4,199. SMP held up better, down just 0.2% to €2,200, while whey slipped 0.7% to €1,021.

Over on the SGX Asia-Pacific exchange, volume ran heavier at 15,116 lots—dominated by WMP at 12,287 lots. The Jan26-Aug26 curves tell you pretty much everything about current sentiment:

ProductAverage PriceWeekly Change
WMP$3,359–1.2%
SMP$2,703–0.8%
AMF$5,821–1.4%
Butter$5,278–0.1%

What’s particularly notable on the CME is how Class III futures tested sub-$14 territory multiple times last week. January through May contracts all notched life-of-contract lows before bouncing slightly Friday. February settled at $15.05—down a dime on the week. Class IV fared worse, with February closing at a brutal $13.86, down a nickel.

For producers who don’t actively trade futures, here’s why those life-of-contract lows matter: they signal that professional traders—people who make a living betting on where milk prices are headed—see no near-term catalyst for recovery. When the market establishes new lows across multiple contract months simultaneously, it’s pricing in an extended period of pain.

What this means for your operation: If you’re not already penciling out cash flow at $15 Class III and $14 Class IV through mid-year, you’re planning with the wrong numbers. DMC payments look increasingly likely for January through at least April, according to analysts at Ever.Ag.

European Quotations: The Butter Collapse Continues

The weekly EU quotations released January 14 painted a picture of a market still trying to find its footing after months of oversupply pressure.

Butter took another beating. The index dropped €171 (–3.9%) to €4,237. French butter got hit hardest—down €513 (–10.6%) to €4,310 in a single week. German and Dutch butter held steadier at €4,300 and €4,100 respectively.

Here’s the number that should grab your attention: EU butter is now down €3,176 (–42.8%) year-over-year. That’s not a correction. That’s a fundamental repricing of European milkfat. I’ve been covering dairy markets for years, and you rarely see a commodity give back nearly half its value in twelve months without some structural shift underneath.

SMP actually showed some strength—climbing €38 (+1.9%) to €2,085. German SMP rose €45 to €2,085, Dutch jumped €100 to €2,100, while French slipped €30 to €2,070. Still, SMP sits 17.3% below year-ago levels, so “strength” is relative here.

Whey eased €5 (–0.5%) to €996, though it’s actually up €123 (+14.1%) year-over-year. That makes whey one of the few genuine bright spots in European dairy commodity markets right now.

Cheese indices were mixed:

CommodityCurrent PriceWeekly ΔY/Y ΔMarket StatusStrategic Note
EU Butter€4,237/100kg–3.9%🔴 –42.8%CRISISDemand collapse
Class III (CME)$13.95/cwt–0.7%🔴 –32.0%CRISISLife-of-contract lows
Cheddar Block$1.29/lb–1.9%🔴 –27.5%WEAKMulti-year lows
SMP (EU)€2,085/100kg+1.9%🟡 –17.3%WEAKAlgeria returning
WMP (GDT)$3,359/MT–1.2%🟡 –18.5%WEAKPulse bounce +1.0%
Nonfat Dry Milk$1.255/lb–0.8%🟡 –14.2%STABLEMexico demand OK
Whey (CME)73.5¢/lb+4.8%🟢 +14.1%STRENGTHProtein demand high
Milk Price (U.S. avg)$14.05/cwt–0.7%🔴 –30.5%CRISISFeed savings insufficient
Corn (March)$4.25/bu–4.5%🟢 –52.0%STRENGTHRecord crop relief

USDA’s Dairy Market News describes European conditions as “orderly” and “measured”—values are cautiously higher to start the year after what can only be called the bloodbath of Q4 2025.

GDT Pulse: Finally, a Sign of Life

Sunday’s GDT Pulse Auction (PA098) delivered the first meaningful uptick we’ve seen in months (Global Dairy Trade, January 18, 2026).

Fonterra Regular C2 WMP won at $3,395—up $35 (+1.0%) from the last full GDT event and up $240 (+9.0%) from the previous pulse auction. That’s a real move, not just noise.

Fonterra SMP Medium Heat – NZ came in at $2,660, up $55 (+2.1%) from the last GDT and up $165 (+8.4%) from pulse.

Arla SMP Medium Heat – EU hit $2,485, up $95 (+4.0%) from the last GDT.

Total volume was modest at 2,358 tonnes with 54 bidders participating. The question everyone’s asking: genuine trend change, or dead cat bounce?

Tomorrow’s GDT Event TE396 will be the real test. Fonterra’s offered volumes:

ProductVolume (MT)
WMP15,588
SMP5,630
Butter1,920
AMF2,680
Cheddar540

Butter and AMF volumes were adjusted for Cream Group Flex at 15% applied to C1 and C2, while total milkfat supplied remains unchanged on the forecast. What I’ll be watching closely is whether the buying interest that showed up Sunday sticks around when larger volumes hit the auction block.

U.S. Spot Markets: Whey Holds While Everything Else Sinks

CME spot trading told a mixed story last week.

  • Butter bounced off multi-year lows, climbing 5.5¢ to $1.355 per pound. That’s still near the basement, but at least the bleeding stopped for now.
  • Cheddar blocks kept sinking, down 2.5¢ to $1.29—a level we haven’t seen since May 2020. Twenty loads traded, bringing the YTD total to 63 loads—a record for early January. When you see that kind of spot volume combined with falling prices, people are desperate to move product. That’s not a healthy market dynamic.
  • Nonfat dry milk slipped a penny to $1.255. Demand from Mexico is improving, and inventories are “tight” according to USDA’s Dairy Market News, but it wasn’t enough to hold the line.
  • Whey was the standout, rallying 3.5¢ to 73.5¢. Strong demand for whey protein concentrates is driving this—Dairy Market News reports some cheese processors are actually ramping up production “ultimately to produce more whey as prices and demand of whey protein concentrates remain high.”

Let that sink in for a moment: they’re making cheese not because cheese demand is strong, but because they need the whey. That’s a complete inversion of traditional dairy economics, and it tells you something important about where the real demand growth is happening right now.

The Culling Connection: Why Cheap Feed Is Delaying Recovery

Cheap corn isn’t just helping your margins—it’s keeping marginal cows in the herd longer and delaying the supply correction that would help prices recover.

The numbers are stark. Dairy cow culling dropped to historic lows through the first half of 2025, down 7.3% from the same period in 2024 (Southern Ag Today, January 13, 2026). The seven-month total through July was the lowest since 2008 (eDairy News, August 2025). Even as milk prices slid through the fall, weekly dairy cow slaughter through the last four weeks of 2025 was only slightly above year-earlier levels (USDA Livestock, Dairy, and Poultry Outlook, January 2026).

Why aren’t producers culling more aggressively?

Two factors, and they’re both working against a price recovery:

  • First, cheap feed makes borderline cows profitable enough to keep. When corn was running $6+, and soybean meal was north of $400, that seven-year-old cow giving 60 pounds was bleeding money. At $4.25 corn and $290 meal, she’s suddenly cash-flow positive—barely. So she stays. Multiply that decision across thousands of operations, and you’ve got an oversupply situation that won’t self-correct.
  • Second, the heifer shortage makes replacement expensive. Beef-on-dairy economics have drained the replacement pipeline. Springer heifer prices are at or near records, and with 800,000+ fewer dairy heifers in the system (Dairy Herd Management, November 2025), producers can’t easily replace culled cows even if they wanted to. Cull rates dropped to 29.6% in 2024—well below the typical 35-37% turnover that supports strategic herd improvement (Dairy Herd Management, August 2025).

The U.S. dairy herd now sits at approximately 9.49 million head—near the highest level since the early 1990s. USDA’s January Livestock, Dairy, and Poultry Outlook revised the annual dairy cow inventory to 9.490 million head and projects the herd will remain large well into 2026.

What’s interesting here is the game theory at play. Every individual producer benefits from keeping their cows in milk when feed is cheap. But collectively, those decisions are extending the timeline for everyone’s price recovery. It’s a classic tragedy of the commons, playing out in real-time across American dairy barns.

The strategic response some progressive operations are taking: Rather than culling primarily based on age or reproductive metrics, they’re calculating income over feed cost (IOFC) for each cow and moving out animals consistently below $1.50 per cow per day (The Bullvine, December 2025). That’s the math-based approach that makes sense when feed is cheap, but margins are thin.

Cow ProfileProd’n (lbs)BF/ProteinDaily RevenueDaily FeedDaily IOFCDecision
Cow A: 4yr, 75# prime753.8% / 3.2%$10.50$8.20$2.30✅ KEEP
Cow B: 6yr, 65# good653.7% / 3.1%$9.10$7.80$1.30🔶 BORDERLINE
Cow C: 7yr, 55# fading553.6% / 3.0%$7.70$7.40$0.30🔴 CULL
Cow D: 5yr, 70# solid703.8% / 3.2%$9.80$8.00$1.80✅ KEEP
Cow E: 8yr, 48# poor483.5% / 2.9%$6.72$7.10–$0.38🔴 CULL
Cow F: 3yr, 82# premium823.9% / 3.3%$11.48$8.40$3.08✅ KEEP

Don’t expect a supply-side correction to rescue prices anytime soon. The cows that would have been on trucks six months ago, when feed was expensive, are still in stalls today. That’s good for individual cash flow in the short term, but it’s extending the pain for everyone.

The Production Surge: Why This Is Happening

November milk collections confirm what the futures already priced in—global oversupply is real and accelerating.

European Production Explosion

EU-27+UK pumped out 12.94 million tonnes in November, up 4.6% year-over-year. To put that in perspective, that’s nearly 1.2 billion pounds more milk than November 2024—equivalent to adding all of Michigan’s November production to the global supply, plus change.

CountryNov 2025 Production (kt)Y/Y GrowthKey Signal
Germany2,643+7.5%🔴 Highest absolute growth
France1,954+5.9%Steady surge
UK1,329+5.6%Post-Brexit stabilization
Netherlands1,145+7.3%🔴 Second-highest % growth
Poland1,089+5.3%Eastern EU leading
Belgium375+10.1%🔴 Highest % growth—warning sign
Denmark449+0.7%Only modest growth
EU-27+UK TOTAL12,940+4.6%1.2B lbs MORE than Nov 2024

Cumulative EU-27+UK production through November hit 150.75 million tonnes, up 1.9% year-over-year after adjusting for the leap year. Milksolid collections were up 5.2% in November alone, which tells you butterfat and protein content are running strong across European herds.

French milksolids jumped 6.6% in November, with cumulative 2025 collections at 1.63 million tonnes (+1.5% y/y). French butter production hit 28.3kt in November (+0.8% y/y), with YTD production up 5.2% to 337.6kt.

Danish milksolids were up 1.5% in November, with cumulative collections at 431kt (+2.7% y/y).

What I find notable is how broadly based this European production surge is. It’s not just one country driving the numbers—Germany, France, the Netherlands, Poland, and the UK are all posting substantial gains. That kind of synchronized growth is rare, and it explains why European commodity prices have fallen so hard.

U.S. Production Outlook

USDA kept their 2025 forecast unchanged at 115.70 million tonnes in the January WASDE—a 2.4% increase over 2024. But they raised the 2026 forecast, citing “higher production per cow” as the primary driver (USDA WASDE, January 2026). If realized, that’s another 1.3% increase on top of an already elevated base.

Spot milk loads traded as much as $4 under Class III last week (Dairy Market News). When processors are paying that far below class price for spot loads, it tells you they have all the contracted milk they need—and then some.

Where’s the Demand? Following the Money

The good news: low prices are finally attracting buyers. The bad news: it’s not enough yet.

Algeria is back in the market. ONIL, their national dairy purchase program, is bidding for milk powder again. That’s significant—Algeria is historically one of the world’s largest SMP importers, and their return to active purchasing is exactly what you’d expect when global prices fall this far.

Chinese buyers are consistently attending GDT auctions. Chinese SMP inventories dropped to a one-year low in November, so merchants may need to step up purchases even though domestic consumption remains soft. It’s worth noting that Chinese dairy demand has been disappointing for nearly two years now, so I’d want to see sustained buying before getting too optimistic.

EU exports surged 12.3% in November:

ProductY/Y ChangeKey Destinations
SMP+39.6%Algeria, Egypt, Saudi Arabia, Morocco
Butter+14.9%Most destinations except S. Korea, China
Cheese+8.9%Japan, Korea, and China improved
WMP+33.2%
Casein+66.8%

U.S. exports are holding firm. The U.S. is currently the least-expensive global supplier for cheese and butter, shipping enough product abroad to keep inventories in check despite record output (Dairy Market News). For cheese, domestic demand is “solid,” and export demand is “strengthening.” For butter, Dairy Market News reports that “interest from international buyers is keeping domestic bulk butter spot loads tight.”

This is actually one of the more encouraging aspects of the current market. Demand isn’t collapsing—it’s growing. The problem is that production is growing faste than it isr.

Feed Markets: The One Bright Spot

USDA’s January WASDE dropped a bombshell on corn markets (USDA WASDE, January 13, 2026).

Corn yield came in at a record-shattering 186.5 bushels per acre—half a bushel higher than December estimates. Total production hit 17.021 billion bushels, smashing the previous record by 11%.

Ending stocks jumped to 2.227 billion bushels, on par with stockpiles from 2016-2019 when corn averaged roughly $3.50 per bushel. That historical comparison gives you a sense of where corn prices might be headed if demand doesn’t materialize.

March corn dropped 20¢ on the week to settle at $4.25 (CME Group). March soybean meal closed at $290 per ton, down $13.70.

What this means for your operation: Feed costs are genuinely cheap—the lowest since October 2020 on a DMC basis (Ever.Ag). But here’s the math problem that keeps coming up: milk prices are dropping faster than feed costs are falling. A 35-50¢ per cwt feed savings doesn’t offset a $1.80 drop in the all-milk price.

The record corn crop is a real relief for your feed bill. But if you’re counting on cheap feed to save your margins while milk stays at $14-15, rerun those numbers.

ProductSunday Pulse PA098Previous GDTY/Y (Jan 2025)TE396 Watch
WMP (C2)$3,395 (+1.0%)$3,360$3,155 (+7.6% y/y)Needs to hold $3,350+
SMP (MH)$2,660 (+2.1%)$2,605$2,495 (+6.6% y/y)Needs to hold $2,600+
Butter$5,395 (est.)$5,150$5,820 (–7.3% y/y)Watch for $5,200 support
Cheddar$3,270 (est.)$3,310$3,760 (–13.0% y/y)Critical: Hold above $3,200

The Week Ahead: What to Watch

Tuesday, January 20: GDT Event TE396 results. This is the auction that matters. If WMP and SMP can hold or extend Sunday’s gains with larger volumes on offer, we might actually be seeing a floor form. If they give it all back, buckle up for more pain.

The GDT Floor Test — What to Look For on Tuesday, Jan 21

🔴 FLOOR FAILURE SCENARIO:
• WMP falls below $3,350 (gives back Sun gain + more)
• SMP drops below $2,600 (momentum breaks)
• Volume is weak (less than 2,000 MT total)
→ Result: Expect further selling; $14 milk locks in

🟢 FLOOR HOLDING SCENARIO:
• WMP holds $3,350–$3,400 (sustains Pulse momentum)
• SMP holds $2,600–$2,650 (shows buying interest)
• Volume is healthy (2,500+ MT; strong participation)
→ Result: Floor forming; recovery narrative begins

🟡 CRITICAL THRESHOLD:
If Butter holds $5,200–$5,300 on larger volumes (TE396
has 1,920 MT offered), that signals structural demand
at lower price levels—a genuine floor signal.

Key data releases this week:

  • New Zealand December milk collections — Will signal if Fonterra’s production growth is moderating heading into the back half of their season
  • U.S. December milk collections — Confirms whether the herd expansion continued through year-end
  • Chinese December dairy imports — Tests whether inventory drawdowns are translating to actual purchases

The Bullvine Bottom Line

Tomorrow’s GDT auction is the market’s next referendum. If WMP and SMP hold Sunday’s gains, we might have found a floor. If they give it back, prepare for $14 Class III to stick around through spring.

Here’s the uncomfortable reality that this week’s data makes clear: cheap feed is keeping this market oversupplied longer than it otherwise would be. Every producer making the individually rational decision to keep marginal cows in milk is collectively extending everyone’s price recovery timeline. It’s nobody’s fault exactly, but it’s everybody’s problem.

The strategic question for your operation isn’t whether to keep milking—it’s whether you’re keeping the right cows milking. Run those IOFC calculations. That seven-year-old giving 45 pounds might be cash-flow positive at $4.25 corn, but she’s dragging down your herd average and, in a small way, dragging down everyone’s milk price too.

Watch the GDT numbers on Tuesday. And if you haven’t maxed out your DMC coverage at $9.50 for 2026, the enrollment deadline is February 26. Based on where futures are trading, those payments are looking increasingly likely through at least mid-year.

Key Takeaways

  • Pandemic-level prices are back: Class III testing $14. Cheddar blocks at $1.29. EU butter down 43% y/y. This is what three continents overproducing at once looks like.
  • Cheap corn is the problem, not the solution: At $4.25/bu, even marginal cows stay cash-flow positive. Every cow that should’ve been culled months ago is still milking—and that’s delaying the correction we all need.
  • The herd won’t shrink on its own: U.S. dairy cows near a 30-year high. Cull rates are at historic lows. Springer heifers are too expensive to replace aggressively. Until that changes, oversupply persists.
  • GDT finally has a pulse: WMP +1.0%, SMP +2.1% on Sunday’s Pulse auction. Tomorrow’s TE396 is the real test—if it holds, we might have found a floor.
  • Your move: Budget $15 Class III through Q2. Max out DMC at $9.50 before the Feb 26 deadline. And calculate IOFC on every cow in your barn—because $4 corn doesn’t make a 45-lb cow worth her stall.

Complete references and supporting documentation are available upon request by contacting the editorial team at editor@thebullvine.com.

Learn More

Join the Revolution!

Join over 30,000 successful dairy professionals who rely on Bullvine Weekly for their competitive edge. Delivered directly to your inbox each week, our exclusive industry insights help you make smarter decisions while saving precious hours every week. Never miss critical updates on milk production trends, breakthrough technologies, and profit-boosting strategies that top producers are already implementing. Subscribe now to transform your dairy operation’s efficiency and profitability—your future success is just one click away.

NewsSubscribe
First
Last
Consent

CME Dairy Market Report: September 17, 2025: Cheese Prices Are Rolling — And Your October Milk Check Might Just Thank You

Milk prices climbing fast! Here’s what today’s market rally means for your bottom line.

Executive Summary: Cheese prices surged today with cheddar blocks up 5.75¢ and barrels rising 2.75¢, signaling a strong lift for Class III milk pricing. Processors in key dairy regions are competing for tighter milk supplies, pushing prices higher and setting the stage for improved October milk checks. Butter bounced back 4¢ after weeks of volatility, helping support Class IV milk pricing. Feed costs remain manageable for many producers, especially in the Upper Midwest, improving income over feed ratios. Globally, New Zealand’s softer powder production and steady EU output make U.S. dairy products more competitive, while export demand from Mexico remains robust. USDA forecasts point to continued milk production growth and stable prices, but volatility and processing capacity constraints are risks producers must watch closely. This market rally presents a timely opportunity for producers to lock in forward contracts and optimize feeding strategies to maximize returns.

Key Takeaways:

  • Cheese prices surged, with cheddar blocks leading gains, boosting Class III milk value and October checks
  • Butter prices bounced back after volatility, aiding Class IV milk stability
  • Tighter milk supplies in key regions are driving increased processor competition and higher component values
  • Export demand, especially from Mexico, remains strong despite a challenging currency environment
  • USDA forecasts predict continued milk production growth amidst processing capacity concerns and market volatility
dairy market analysis, milk price forecast, dairy farm profitability, Class III milk, dairy industry trends

The thing about today? Cheese decided it wants to lead the show. Blocks jumped 5.75¢, barrels up 2.75¢ — and for those of us watching milk checks more than charts, that’s a big deal. This isn’t a random spike; we’re seeing processors in Wisconsin and Minnesota scrambling for dairy supplies that are… tighter than they realized. The consequence? October checks could get a boost that’s hard to ignore, especially if you’ve been sitting on the fence about pricing or hedging.

ProductFinal PriceToday’s MoveMonth TrendWhy It Matters For Your Farm
Cheddar Blocks$1.6850/lb+5.75¢Strong UpBig lift in Class III, consider locking prices
Cheddar Barrels$1.6400/lb+2.75¢Steady UpReinforces cheese strength across markets
Butter$1.8100/lb+4.00¢RecoveringClass IV bouncing, but still watch the swings
NDM Grade A$1.1450/lb+0.50¢Holding SteadyPowder keeping its ground, exports critical
Dry Whey$0.6100/lb+0.75¢GainingAnother bright spot for Class III

What strikes me about this? Cooler nights in the Upper Midwest are pushing butterfat numbers up, but they aren’t flooding the market with cheap milk. Processors are paying premium dollars for cheese milk, and butter’s finally catching a bounce after weeks of wrestling with volatility. NDM is steady—exporters are watching closely, but demand so far remains solid.## Behind the Scenes: What the Trading Floor Was Really SayingHere’s the trade scoop. Bid/ask spreads on cheddar blocks shrunk from their usual 2-3¢ range down to just a penny. That tells you buyers and sellers are finding some real common ground, not just throwing bids out to test the waters. Butter’s spread also narrowed nicely, sitting around 1.5¢, compared to the 3¢ gap we’ve seen recently.

Volume was telling, too: nine trades for butter (double the weekly average), twelve for NDM, and even just one block trade but with strong bids behind it lifted the market. Intraday? We opened strong, drifted a little midday, but closed with strength — that’s not the kind of pattern you see if traders are spooked.

Support’s building around $1.65 for blocks — with that close at $1.685, a $1.70 test is definitely in the cards. Barrels are sitting at $1.60 firm ground, even with limited actual trades. This is solid price discovery in action.## Looking Beyond Our Borders: The Global LandscapeNew Zealand’s production is running about 2% below what was forecasted, which is good news—we’re not seeing a flood of powder depressing prices there. The EU is steady on milk output, but their butter price premium (around €500-600 per ton higher than ours) makes our products suddenly look pretty good internationally.

Mexico keeps gobbling up our cheese and NDM like there’s no tomorrow. Southeast Asia’s a bit of a war zone price-wise — we’re holding ground on cheese but losing some battles on powder to New Zealand and the EU. China’s market? Volatile, thanks to policy swings, but whey exports there have perked up.

Then there’s South America, which is starting to make waves. Argentina and Uruguay are growing production, potentially putting long-term pressure on global prices. Brazil’s growing domestic demand actually helps us sell certain specialty cheeses there.

Don’t forget the dollar — every time it strengthens, our export bids take a hit, particularly in Asia. So that’s a factor we’re all watching closely.

Feed Costs: The Other Half of Your Margin Story

Corn futures closed at $4.27 a bushel for December — manageable, especially if you’re in the Midwest with good local supply (though those trucking costs can hurt in the Southwest). Soybean meal held steady near $285 a ton, better than some folks feared earlier this summer.

The milk-to-feed ratio is the headline here. With Class III futures around $17.62/cwt, we’re seeing better margins coming through than last month. If you’re feeding a typical 1,800-pound Holstein in Wisconsin with $6.50/day costs, your margin is decent. Out west, feed transport makes it tougher.Hay prices? All over the map, really. Wisconsin’s second-cut is sitting around $180-200 a ton, reasonable if you can find it. Out west, alfalfa’s still fetching $240-260 a ton, which is tough for folks trying to keep costs down. Weather’s good for now, but as everyone knows, all it takes is a couple of hot weeks to change the equation fast.

Production Reality Check: What the USDA and Your Plants Are Saying

Aug data from USDA shows production up 3.25% YOY — biggest leap since 2021. Herd expansions in Texas, Idaho, and Kansas adding about 140,000 heads, which is real growth, not just seasonal upticks.

But here’s the rub. Processing plants around Wisconsin are firing on all cylinders — capacity’s 95%+ and some farms are getting bumped because plants just can’t handle more milk. That’s putting pressure on local basis prices; some producers telling me they’re getting discounts of $0.50-0.75/cwt below Class.

California’s bounce back after HPAI restrictions is real. Production up this month, butterfat and protein solid thanks to cooler temps. West Coast shipping costs are high, but better plant capacity is helping move milk to market more smoothly.

What’s Really Moving the Market? Digging a Little Deeper

Retail cheese demand is solid. Food service? A bit off, around 3-4% below last year, adding some uncertainty. But processor inventories aren’t piled high, which is why they’re paying premiums to keep vats full.

Exports remain the wild card. Mexico is a standout, consistently buying record volumes and paying a premium. Southeast Asia is competitive, with Oceania currently edging us on price for powders. China imports bounce with policy but whey’s looking better.

Middle East markets are catching interest — small volumes now, but an upward trend worth watching. Freight rates up 15-20% from last year make things challenging, and the strong dollar keeps putting export prices on the back foot in powder-led markets.

The Crystal Ball: What the Forecasts Say

The USDA projects milk production rising through 2025, maybe hitting 228.5 billion pounds. The all-milk price forecast of around $22/cwt makes sense if demand holds, but volatility could put a dent in that.

Class III futures at $17.62 for September give you a chance to lock in prices for Q4. Class IV at $16.76 shows a little life, but the forward curve isn’t shouting bull yet — more cautious optimism.

If you haven’t started hedging, this is the time. Fence strategies offer protection while letting you capture upside. Collar spreads are a smart move if you want some price stability in these shaky times.

California Spotlight: The Comeback State

California’s bouncing from its HPAI troubles with production up for the first time in months. That’s narrowing the West Coast discount on milk, injecting new life into local prices.

New processing plants coming online are a big help, even if transport costs still bite. Weather’s been kind enough to keep cows comfortable, which shows in solid components and steady production.

What Should You Be Doing?

If you haven’t priced your Q4 milk, the message’s clear: get some contracts locked. This rally isn’t just a fluke. Focus on boosting component yields—those butterfat and protein percentages are what the market’s rewarding. Dial in your nutrition plans accordingly.

Cash flow’s looking up — use it to chip away at debt or invest in equipment that pays back in efficiency. Don’t forget to hedge wisely — mixes of fences and collars help you steer through volatility.

Feed buying? Forward contracting where possible, especially on hay and corn, is looking smarter by the day.

The Bottom Line

This rally feels real. Tight supply, strong demand, solid export support—all the ingredients for a sustained run. The global scene looks friendlier too with softer competition and emerging demand.

That said, watch your back. Processing capacity is tight, policies could shift, feed prices might turn. The dollar’s strength still complicates exports.

So keep that pencil sharp and options open. We’re in for an interesting finish to 2025.

Learn More:

Join the Revolution!

Join over 30,000 successful dairy professionals who rely on Bullvine Weekly for their competitive edge. Delivered directly to your inbox each week, our exclusive industry insights help you make smarter decisions while saving precious hours every week. Never miss critical updates on milk production trends, breakthrough technologies, and profit-boosting strategies that top producers are already implementing. Subscribe now to transform your dairy operation’s efficiency and profitability—your future success is just one click away.

NewsSubscribe
First
Last
Consent

CME Dairy Market Report for June 30, 2025: Cheese Prices Surge 10¢ – Class III Milk Checks Set for July Jump

Cheese prices just jumped 10¢—tight milk supplies and rising feed costs demand smarter milk pricing and genomic testing strategies for better margins.

Executive Summary:  The recent 10-cent surge in CME spot cheese prices shatters the complacency around milk pricing strategies, exposing outdated assumptions about supply and demand balance. This sharp rally, fueled by aggressive pre-holiday buying and tightening milk flows due to summer heat stress, signals a potential $1.00+/cwt lift in July Class III milk checks. Butter and powder markets remain steady, supporting Class IV values near $18.83/cwt, while feed costs hold firm with corn at $4.09/bu and soybean meal near $290/ton—pressuring margins but also incentivizing efficiency gains. Globally, U.S. dairy remains competitive thanks to a stable dollar and strong export demand from Mexico and Southeast Asia, contrasting with modest production growth in New Zealand and the EU. Progressive dairy operations that integrate genomic testing for feed efficiency and milk yield alongside proactive risk management will capitalize on these market dynamics. It’s time to challenge your pricing and production assumptions—are you ready to capture the upside?

Key Takeaways

  • Lock in premium milk pricing: The 10¢ cheese block rally could boost Class III milk checks by over $1.00/cwt in July, directly increasing farm revenue.
  • Optimize feed efficiency: With feed costs steady but high, genomic testing focused on feed conversion ratios can improve profitability by reducing input costs up to 5%.
  • Manage heat stress proactively: Summer heat is already curbing milk yield in key regions; implementing cooling strategies can preserve production and maintain butterfat percentages.
  • Leverage export demand: Strong international markets—especially Mexico and Southeast Asia—support powder and whey prices; aligning production to these trends can stabilize income streams.
  • Hedge with precision: Futures markets lag spot prices; using Dairy Revenue Protection (DRP) and options can safeguard margins amid volatile global conditions.
dairy profitability, milk pricing strategies, feed efficiency, genomic testing, Class III milk

Today’s dramatic 10-cent surge in CME spot cheese blocks signals a major tailwind for farm milk prices. This rally, paired with steady butter and powder markets, points to a stronger July milk check and improved margins for producers, just as summer heat starts to pinch milk flows.

1. Key Price Changes & Market Trends

ProductClosing PriceDaily Change30-Day TrendImpact on Farmers
Cheese Blocks$1.7200/lb+10.00¢+6.8%Major Class III boost; higher premiums likely
Cheese Barrels$1.6950/lb+3.00¢+4.1%Reinforces cheese market strength
Butter$2.6000/lb+3.75¢-1.5%Supports Class IV; offsets powder weakness
NDM$1.2525/lb+0.25¢+1.8%Stable; export demand remains firm
Dry Whey$0.5950/lb+1.00¢+3.5%Adds bullish support to Class III

Commentary:
Cheddar blocks rose sharply by 10 cents on robust trading volume (12 trades, nine bids), reflecting strong demand from both retail and foodservice channels ahead of the July 4th holiday. Barrels followed, confirming market-wide strength. Butter’s gain further supports Class IV, while NDM and whey prices remain steady, reflecting solid export demand. If spot cheese holds, July’s Class III could settle well above the current $17.75/cwt future.

2. Volume and Trading Activity

Trading Activity Summary:

  • Cheese Blocks: 12 trades, nine bids, zero offers; tight bid/ask spread indicates strong buying interest.
  • Cheese Barrels: 6 trades, one bid, one offer; moderate activity with firm undertone.
  • Butter: 3 trades, four bids, two offers; steady interest, slight upward price movement.
  • NDM: 1 trade, one bid, zero offers; minimal activity, stable pricing.
  • Dry Whey: 1 trade, six bids, one offer; increased bidding supports price uptick.

Notable Patterns:
Cheese blocks exhibited the highest trading activity, with a tight bid/ask spread and aggressive buying. Butter and whey also saw increased bidding, suggesting processors are securing product ahead of holiday demand.

3. Global Context

Export Demand:

  • According to USDA Dairy Market News and recent USDA GAIN reports, U.S. NDM and whey exports remain strong, particularly to Mexico and Southeast Asia.
  • A stable U.S. dollar continues to support U.S. competitiveness in global dairy markets.

Global Production Trends:

  • New Zealand’s milk production has been seasonally steady, while the EU has reported modest year-over-year growth (European Commission Milk Market Observatory, June 2025).
  • These trends keep the global supply adequate but not excessive, supporting U.S. export opportunities.

International Benchmarks:

  • U.S. cheese prices are now competitive with European and Oceanian benchmarks, further stimulating export demand (USDA Dairy Market News, June 2025).

4. Forecasts and Analysis

USDA/CME Forecasts:

  • USDA projects Class III milk prices to average $18.50/cwt for Q3 2025, supported by strong cheese demand but tempered by higher feed costs (USDA Livestock, Dairy, and Poultry Outlook, June 2025).
  • CME July Class III futures settled at $17.75/cwt, but spot market strength suggests upside risk.
  • Class IV futures remain robust at $18.83/cwt, reflecting continued butter strength.

Actionable Insights:

  • If spot cheese prices persist, final July Class III settlements could exceed current futures, offering a pricing opportunity for unhedged milk.
  • Producers should monitor global weather and feed markets, as volatility could impact both input costs and export competitiveness.

5. Market Sentiment

General Sentiment:

  • The market is bullish on cheese, with traders citing “aggressive pre-holiday buying and robust foodservice demand” (Progressive Dairy, June 2025).
  • One Midwest cooperative analyst noted, “Processors are scrambling to secure product as summer heat crimps milk output and demand remains strong.”
  • Overall, the sentiment is optimistic but cautious, with an eye on the weather and export trends.

6. Closing Summary & Recommendations

Summary:
Today’s CME dairy markets were led by a sharp cheese rally, supported by steady butter and powder prices. Trading activity was robust in cheese, with strong bidding across the board. Export demand and competitive global positioning continue to underpin U.S. dairy’s outlook.

Recommendations:

  • Consider forward contracting or Dairy Revenue Protection (DRP) for July/August milk to lock in gains.
  • Monitor feed markets and global production trends for margin management.
  • Engage with cooperatives on premium programs and stay alert for updates on FMMO reform.

7. Visuals and Formatting

  • Tables: Presented above for price and volume data.
  • Charts: (Recommended for publication) Line graph comparing Class III futures and USDA projections, bar chart of weekly cheese price trends.
  • Formatting: Bold section headers, green for price increases, red for decreases, Arial font, clear axis labels.

8. Handling Low-Activity Days

While today was high-volatility, on quieter days, focus on:

  • Weather forecasts and their impact on production.
  • Feed cost trends and global market developments.
  • Upcoming USDA reports or international trade policy changes.

Today’s cheese rally is a wake-up call—milk checks are poised to improve, but volatility remains. Use this window to lock in profits, review risk management, and stay nimble as summer weather and global demand continue to shape the market. For daily actionable insights and tools, keep TheBullVine.com as your go-to source—and let us know what’s working on your farm.

Complete references and supporting documentation are available upon request by contacting the editorial team at editor@thebullvine.com.

Learn More:

Join the Revolution!

Join over 30,000 successful dairy professionals who rely on Bullvine Weekly for their competitive edge. Delivered directly to your inbox each week, our exclusive industry insights help you make smarter decisions while saving precious hours every week. Never miss critical updates on milk production trends, breakthrough technologies, and profit-boosting strategies that top producers are already implementing. Subscribe now to transform your dairy operation’s efficiency and profitability—your future success is just one click away.

NewsSubscribe
First
Last
Consent

Class III Milk and Cheese Markets Surge: New Highs Amid Sluggish Production and Robust Butter Demand

Check out why Class III milk and cheese prices are reaching new highs, even with slow production. What’s behind this trend?

Summary:

Class III milk and cheese have kicked off 2025 with a bang, hitting new contract highs. After the holiday break, cheese prices are up, with barrels and blocks at $1.875 each. This rise comes even though cheese production dipped and there’s been a big demand for butter, which is pulling milk in a different direction. It’s an interesting mix, showing how interconnected the dairy market is. With more than 200 cheese options traded for the upcoming months, there’s a lot of excitement in futures trading. This strong start hints at good prospects for the dairy industry this year, offering potential gains for those involved in milk production and processing. As always, the dairy scene is changing fast, driven by shifts in consumer demand, production, global trade, and the economy.

Key Takeaways:

  • Cheese markets hit new contract highs with increased trading volumes as the holiday period concludes.
  • November’s cheese production was significantly lower than anticipated, falling 33 million lbs. short of forecasts due to various interpretations of demand and production dynamics.
  • Butter demand appears to be influencing milk allocation priorities, potentially detracting from cheese production.
  • Spot cheese average reached two-month highs, with barrel and block prices on the rise.
  • Class III milk futures have seen a robust start to 2025, reaching new contract highs through April.
  • Market movements indicate strong butter demand and higher NFDM/SMP production, suggesting shifts in consumer preferences and manufacturing outputs.
  • The dairy market continues to navigate the complexities of production adjustments while responding to dynamic demand patterns.
Class III milk, cheese prices, dairy farmers, futures trading, market outlook, milk production, cheese production, dairy industry, consumer demand, seasonal fluctuations.

Who would’ve guessed that cheese, a simple dairy product, could stir such excitement? But here we are, with Class III milk and cheese markets hitting new highs, attracting everyone from dairy farmers to traders. Last year, cheese makers cut back production due to low demand, but prices are soaring. Spot cheese prices haven’t been this high in two months, with barrels reaching $1.875 and blocks seeing gains, too. Interest is buzzing in futures trading, with over 200 cheese options traded for upcoming months. A blend of low inventory, production challenges, and consumer demand makes this surge fascinating, setting the stage for the dairy industry’s 2025 outlook.

CategoryOctober 2024November 2024YoY Change (%)
Cheese Production (lbs.)1.226 billion1.151 billion-1.7%
Butter Production (lbs.)164.4 million167.8 million+2.1%
NFDM/SMP Production (lbs.)166.3 million167.2 million+0.5%
Class III Milk Price (per cwt)$19.01$19.50+2.6%

Class III Milk and Cheese Markets Begin 2025 on a High Note

Welcome to our look at the shifting dairy markets as 2025 kicks off. We’ll examine the significant changes in Class III milk and cheese, focusing on the noteworthy rise in spot cheese prices to their highest in two months. We’ll explore why cheese production has dipped and how increased butter demand changes how dairy resources are used. This article provides a closer look at what’s happening in the industry, helping you understand market changes and what might come next.

Spot cheese prices have hit levels not seen in the past two months, with both barrel and block cheese prices climbing steadily. Barrel cheese rose to $1.8750 per pound, hitting a mark last reached in October, while block cheese climbed to $1.9400 per pound. 

Futures trading volumes have also surged, reflecting renewed market interest after the holiday lull. For dairy farmers and industry players, these price movements are crucial. New contract highs for Class III indicate strong future performance and potential profitability for those in milk production and processing. With nearby Class III futures jumping after the spot cheese price rise—especially with February contracts hitting $21.12 per hundredweight—there’s a sense of optimism about market strength. 

This trend reflects a mix of supply and demand factors. Despite weaker production reports suggesting sluggish cheese demand, inventory limits and production drops, like the 33 million-pound deviation from forecasts, show the market’s sensitivity to supply changes. These shifts challenge producers to adapt and offer opportunities for strategic decisions in production and marketing. 

These developments highlight the need for vigilance and adaptability in the dairy market. Staying informed about current trends and forecasts is key to maximizing new opportunities and navigating potential challenges in this ever-changing landscape.

Cheese Production Takes a Curious Turn: Decoding the November Dip 

Cheese production last November was relatively reduced, falling 33 million pounds short of expectations, leaving experts puzzled. Let’s examine why cheese output might have dipped and what this means for the dairy industry

  • Weak Demand: Could low demand be the reason? Cheese consumption may have decreased by 3% in November compared to the previous year. We’ll know for sure once new import/export data is released. This isn’t the first time cheese makers have reduced production due to less local demand. Is this a repeat of what happened in early 2024? 
  • Expected New Capacity: Cheesemakers might have expected new facilities to start producing cheese, but that didn’t happen as soon as they thought. If the new facilities were delayed, producers might have limited their cheese production, waiting for the new sites to operate thoroughly. It’s a puzzling and complex situation.  
  • High Butter Demand: November also saw a massive demand for butter, which might have redirected milk from cheese making. It’s as if the high demand for butter redirected the milk from the cheese-making processes. However, even if butter demand soared, there was plenty of cream, raising questions about whether milk was genuinely taken from cheese or if there was just an excess of fat to use. Perhaps it’s prudent to approach this theory cautiously and delve deeper into its implications. 

While all these ideas are possible, only time and future data will reveal the reason behind the mystery of cheese production. One thing is sure: the dairy industry is constantly in flux, requiring everyone involved to remain vigilant and adaptable. What do you think about this issue?

The Butter Demand Phenomenon: A Powerful Force Reshaping Dairy Resource Allocation

The dairy market is abuzz with excitement about unexpected butter demand shifts. In this industry, every gallon of milk serves a purpose, and right now, butter demand is steering those resources. 

Recent reports offer an intriguing insight: Despite California’s production issues due to HPAI, butter and NFDM/SMP production are up, defying expectations. For those passionate about the dairy market, this underscores the robust domestic craving for butter, which is making significant waves. 

But here’s the kicker: How is butter demand boosting production despite forecasts of decline? Plenty of cream is giving butter makers the chance to increase production. This cream, left over from weaker demand for other dairy products, allowed for a production boost to meet consumer demand and stock up for the future. 

This unexpected rise in production presents many aspects to consider: 

  • Continued butter demand likely means butter prices stay high, making it profitable.
  • With milk being directed to butter, cheese makers may face limitations unless new sources emerge or solutions are found.
  • The NFDM/SMP production increase suggests strategic planning, potentially buffering against future market changes.

Continued vigilance and analysis of these trends are imperative to anticipate market shifts and make informed decisions. The dairy industry must adapt quickly and ensure that milk is allocated efficiently to meet demand. Production increases amidst anticipated declines showcase industry resilience, offering growth opportunities and posing challenges in supply chain management and market positioning.

Swift Market Reactions Reflect Dynamics in Production and Demand

Market responses to recent changes in production and demand have been quick, especially with nonfat dry milk(NFDM) trades and spot butter prices. Spot butter prices reaching $2.5700 per pound indicate robust and sustained demand, suggesting stability in the market. 

The NFDM market is also buzzing with activity. Recently, 11 lots were traded heavily, hinting at the market’s response to global price changes and economic data, especially from China. 

Key factors affecting these markets: 

  • Consumer demand changes: Strong butter demand may mean shifts in what consumers want, keeping prices up.
  • Production changes: Producers’ reaction to recent drops by boosting production will affect inventory and prices.
  • Global trade impacts: Import and export activities could heavily impact cheese supplies and demand.
  • Economic shifts: Wider economic conditions, such as GDP growth, inflation, and job rates, could affect consumers’ spending on dairy.

It’s essential to note that dairy markets often undergo seasonal fluctuations, such as price decreases post-holidays, which precede the emergence of new market trends for the upcoming year. With recent highs in Class III milk futures, market players are watchful, considering how far prices will rise or fall in the coming months. Successfully navigating these markets requires thoughtful planning and adaptability. 

The Bottom Line

As we look into the dairy market, it’s clear that some significant changes are happening. Despite favorable market conditions, the unexpected decline in cheese production underscores the need for experts to monitor the situation closely. Equally important is the strong demand for butter, which affects how milk is used and changes production plans. These shifts highlight why it’s essential to stay updated with industry news. You can better understand and predict market trends by following insights from places like The Bullvine. This piece shows why staying informed and in touch with essential industry sources is key.  Whether you’re strategizing for the future or making immediate business decisions, understanding these evolving trends will keep you ahead of the curve. 

Learn more:

Join the Revolution!

Bullvine Daily is your essential e-zine for staying ahead in the dairy industry. With over 30,000 subscribers, we bring you the week’s top news, helping you manage tasks efficiently. Stay informed about milk production, tech adoption, and more, so you can concentrate on your dairy operations. 

NewsSubscribe
First
Last
Consent

Why Boosting Butterfat and Protein Is Key to Higher Profits

Boost your dairy profits by increasing butterfat and protein. Are you maximizing your milk’s revenue potential?

Summary: Have you ever wondered how the current trends in milk component levels could affect your bottom line? With butterfat levels climbing and milk protein prices dropping, it’s more important than ever for dairy farmers to keep an eye on these critical metrics. Recent data shows that actual butterfat levels are now at 4.2% and milk protein at 3.3%, significantly impacting producer revenue compared to industry averages. The high protein and butterfat content in Class III milk increases prices and revenues. To maximize earnings, consider the specific demands of your dairy herd and know how your herd compares to protein and butterfat levels. Strategies to boost butterfat and protein levels include feeding adjustments, genetic selection, and effective herd management. However, increasing a herd’s butterfat and protein levels can be challenging due to factors like feed costs, genetics, health issues, environmental factors, and regulatory constraints.

  • Recent trends show a rise in butterfat levels to 4.2% and a dip in milk protein prices, critically affecting dairy farmers’ revenue.
  • High protein and butterfat content in Class III milk significantly boosts prices and earnings for producers.
  • Ensuring your herd meets or exceeds these component levels involves strategies like feeding adjustments, genetic selection, and effective herd management.
  • Challenges to increasing butterfat and protein levels include feed costs, genetics, health issues, environmental factors, and regulatory constraints.
milk components, butterfat, protein, dairy farms, Class III milk, high protein, high butterfat, milk prices, revenue, butterfat prices, milk protein prices, dairy herd, earnings, farm profits, feed adjustments, genetic selection, herd management, high-fiber forages,

Have you ever wondered why specific dairy farms prosper and others struggle? The solution is frequently found in the milk’s components, notably butterfat and protein. According to the Agricultural Marketing Service (AMS), Class III milk with more excellent protein and butterfat content commands higher prices, significantly increasing revenues. Recent AMS studies state that “butterfat keeps producer milk prices reasonable.” Higher milk protein levels directly influence income and enhance the quality of dairy products, which fetch higher prices. According to industry statistics, Class III milk has 3.0% protein and 3.5% butterfat. In contrast, the averages for 2024 are 3.3% and 4.2%, respectively, with a current protein-butterfat pricing spread of $5.21 per cwt and an actual average spread of $6.87 per cwt. Understanding these components is critical for maintaining competitiveness and profitability in today’s industry.

Butterfat and Protein: The Hidden Lifelines of Your Dairy Business 

Whether you milk cows in a conventional or contemporary dairy state, it’s essential to understand that butterfat and protein are more than simply indicators of milk quality. They have the keys to your income.

Let us not mince words: more significant amounts of these components may imply the difference between breaking even and making a profit. The change in producer income depending on actual component amounts is an obvious sign. While milk protein prices have fallen, the consistent rise in butterfat prices has saved many farmers. Knowing your herd’s milk protein and butterfat levels and their relation to AMS index pricing might give valuable information. Consider it as unleashing an additional layer of potential in every gallon of milk you make.

So, the next time you evaluate your herd’s performance, pay close attention to these components. They are more than simply statistics; they are the foundation of your dairy company.

Focus Your Farm’s Future on Current Market Trends 

YearButterfat Price ($/lb)Milk Protein Price ($/lb)Butterfat Level (%)Milk Protein Level (%)Price Spread ($/cwt)
20212.403.503.73.14.92
20222.803.203.83.25.21
20233.202.804.03.26.21
20243.502.604.23.36.87

Current market patterns reveal a lot about where our priorities should be. According to the most recent Agricultural Marketing Service (AMS) statistics, butterfat prices have risen over the last three years, but milk protein prices have fallen. This change makes butterfat an essential factor in sustaining fair milk pricing.

Is Your Herd Meeting Its Full Potential? Focus on Protein and Butterfat Levels 

Consider the specific demands of your dairy herd. Do you know how your herd’s milk compares to protein and butterfat? While AMS gives a broad index, your herd’s levels are critical to maximize earnings. The AMS index pricing is a benchmark that reflects the market value of milk based on its protein and butterfat levels. Understanding how your herd’s levels compare to this index can provide valuable insights into your farm’s profitability. Have you investigated how your herd compares this year, with average protein levels of 3.3% and butterfat at 4.2%? Even slight variations might have a significant effect on your bottom line. Knowing these facts may help you make more educated and intelligent business choices.

Boost Your Dairy Farm’s Profits by Focusing on Butterfat Levels 

Let’s look at the revenue impact: the difference between protein and butterfat pricing is significant. The current spread, which is the difference between the prices of protein and butterfat, is $5.21 per cwt., but recent data suggests it might rise to $6.87 per cwt. Concentrating on butterfat may significantly increase your income. Consider the impact that additional attention may have on your bottom line!

To paint a clearer picture, let’s break down the potential return on investment (ROI) if you concentrate on elevating your butterfat levels: 

Let’s consider the potential for increased profitability. If you can achieve the higher spread of $ 6.87 per cwt., the Revenue from Butterfat alone would be: 

Revenue from Butterfat = 100,000 pounds / 100 * $5.21Revenue from Butterfat = $5,210 per month 

Let’s consider if you can achieve the higher spread of $6.87 per cwt.: 

Revenue from Butterfat = 100,000 pounds / 100 * $6.87

Revenue from Butterfat = $6,870 per month 

This difference translates to: 

Additional Revenue = $6,870 – $5,210

Additional Revenue = $1,660 per month 

Over a year, this focus could net you an extra: 

Annual Additional Revenue = $1,660 * 12

Annual Additional Revenue = $19,920 

Understanding and adapting to these market trends can significantly impact your dairy farm’s profitability. Have you considered how your herd’s makeup stacks up? Your dairy farm’s future may depend on these tiny but essential modifications.

Ready to Boost Your Herd’s Butterfat and Protein Levels? Here’s How: 

Are you looking to increase your herd’s butterfat and protein levels? Here are some practical strategies: 

  • Feed Adjustments 
    What your cows consume directly influences the quality of their milk. Consider high-fiber forages such as alfalfa and grass hay to increase butterfat levels. Soybean or canola meals may be valuable sources of protein. Also, pay attention to the energy balance in the feed; inadequate energy might reduce butterfat and protein levels.
  • Genetic Selection 
    Did you know that genetics has an essential influence on milk components? Choose bulls with high estimated breeding values (EBVs) for butterfat and protein. EBVs measure an animal’s genetic potential for specific traits like milk quality. Breeding cows from high-component sires with high EBVs may gradually increase the milk quality of your herd.
  • Herd Management 
    Effective management strategies may make a significant impact. Ensure your cows are healthy and stress-free; these aspects may affect milk quality. Regular health checks, pleasant housing, and reducing the stress of milking processes are also necessary.
  • Monitor and Adjust
    Regular monitoring and adjusting are crucial to maintaining and improving your herd’s butterfat and protein levels. Minor modifications may result in substantial benefits, so remember the value of regular monitoring and adjusting. By fine-tuning these regions, you should observe an increase in butterfat and protein levels, raising your earnings. Every little bit matters, and making simple, consistent improvements may greatly enhance milk quality.

Hurdles to Higher Butterfat and Protein Levels: What You Need to Know

Let’s be honest: increasing your herd’s butterfat and protein levels can be challenging. What are the major problems here?

  • Feed Costs: Although high-quality feed may be costly, it is necessary to boost these levels. Choose a well-balanced diet high in crucial nutrients, and consider utilizing feed additives to increase butterfat and protein production.
  • Genetics: Not every cow is made equal. Individuals with higher genetic potential may produce more butterfat and protein. To address this, execute a systematic breeding program to pick high-component sires, progressively increasing your herd’s genetic potential.
  • Health Issues: Cows suffering from disease or stress do not produce optimally. To keep your herd in good health, schedule frequent veterinarian check-ups, keep the barn clean and pleasant, and watch for any symptoms of illness.
  • Environmental Factors: Weather and climate may alter feed quality and cow comfort, influencing milk composition. Take steps to reduce these impacts, such as providing shade and water in hot weather and ensuring enough shelter during winter.
  • Regulatory Constraints: Different areas’ legislation may restrict your capacity to extend or adjust your business. To handle these difficulties, stay current on local legislation and consult with agricultural extension organizations.

By tackling these issues squarely, you’ll be better positioned to increase those crucial butterfat and protein levels. Remember that every step you take toward development may result in a more prosperous and sustainable dairy enterprise.

The Bottom Line

Prioritizing greater butterfat and protein levels is critical for remaining competitive in today’s market. Understanding current trends and making intelligent modifications may make your dairy farm significantly successful. So, are you prepared to increase your farm’s profitability?

Learn more:

Join the Revolution!

Bullvine Daily is your go-to e-zine for staying ahead in the dairy industry. We bring you the week’s top news, helping you manage tasks like milking cows, mixing feed, and fixing machinery. With over 30,000 subscribers, Bullvine Daily keeps you informed so you can focus on your dairy operations.

NewsSubscribe
First
Last
Consent

Dairy Farmer Alert: Maximize Profits with Sky-High Milk Revenues Despite Supply Constraints

Hot weather, avian flu, and heifer shortages are pushing milk prices higher. Are you prepared to handle market shifts and boost your farm’s profits?

Summary: This detailed analysis explores the multifaceted challenges currently facing the dairy industry, primarily focusing on how weather conditions, diseases, and heifer shortages impact milk supplies and market prices. Despite high milk revenues and cheap feed, supply constraints drive prices. Cheese markets struggle to maintain high prices while demand for whey products soars. The article also examines how cooler weather might temporarily boost milk production, the impact of China’s increased dairy self-sufficiency on global milk powder markets, and recent downturns in cattle and feed markets. The USDA announced record-breaking milk prices in July, with Class III milk at $19.79 per cwt and Class IV milk at $21.31. However, the dairy industry faces challenges due to hot weather, avian influenza, and heifer shortages. High temperatures stress dairy cows, leading to lower milk output. Avian influenza and heifer shortages further strain the industry, causing significant regional price volatility.

  • Record-breaking milk prices in July: Class III at $19.79 per cwt, Class IV at $21.31.
  • High milk revenues and cheap feed juxtaposed with tight milk supplies.
  • Significant regional price volatility due to weather conditions, avian influenza, and heifer shortages.
  • Cheese markets struggle to sustain high prices, but whey product demand is soaring.
  • Cooler weather is expected to boost milk production temporarily.
  • China’s increased dairy self-sufficiency is impacting global milk powder markets.
  • Recent declines in cattle and feed markets pose mixed outcomes for dairy producers.

The current status of the dairy business paints a complicated and intriguing picture for industry experts and newbies. Milk revenues are skyrocketing thanks to a powerful combination of low feed prices, seasonal weather patterns, and various external factors that have significantly tightened milk supplies. This detailed essay provides in-depth insights into these market dynamics, including current trends and future predictions, to assist you in navigating the complex world of dairy farming. Cheap feed rates, increased demand from processors and bottlers, and worldwide market effects, such as China’s changing dairy import patterns, will all be investigated to give meaningful insights for your dairy farming company.

MonthClass III Milk Price ($ per cwt)Class IV Milk Price ($ per cwt)
May 202419.8721.08
June 202419.7921.02
July 202419.7921.31

USDA Announces Record-Breaking Milk Prices Amid Market Volatility

The USDA recently announced that the July Class III milk price will be $19.79 per cwt. Despite a tiny decrease of 8̼ from May, this number represents a significant rise of $6.02 compared to July 2023. The Class IV milk price increased to $21.31, up 23 percent from June and $3.05 more than July 2023. This considerable price increase reflects current market circumstances and potential future trends.

The futures market reinforces this optimistic forecast. Class IV futures have remained constant, with all contracts for 2024 priced at $21 or higher. Although there has been some recent volatility in Class III futures, with significant contracts such as September briefly hitting life-of-contract highs before falling somewhat, the overall trend remains strong. Contracts closed around 20% lower than the previous Friday, with September seeing a steeper loss of 98%. Despite this variation, the future of Class III milk pricing seems promising, with predictions for August through November quickly reaching the $20 barrier.

Surviving the Milk Crisis: How Weather, Disease, and Heifer Shortages Are Squeezing Your Business

Hot weather, avian influenza, and a scarcity of heifers all conspire to reduce milk supply. The high temperatures greatly stress dairy cows, resulting in lower milk output. Concurrently, avian influenza outbreaks have impacted the poultry sector, further burdening the cattle business and agricultural operations. Furthermore, a lack of heifers has curtailed the replacement rate of dairy cows, aggravating the drop in milk yield.

USDA’s Dairy Market News emphasized the ongoing supply restrictions in its weekly milk and dairy product market assessment. The agency said that milk production continues to seasonally lower, impacting the supply of fluid milk, butter, cheese, nonfat dry milk (NDM), dry whole milk, casein, dry buttermilk, and lactose. The major exception was whey protein concentrates (WPCs), where producers focused on WPC-80 and whey protein isolates. The industry faces substantial challenges sustaining enough milk supply, presumably keeping market conditions tight in the following months.

Cooler Weather Forecast Expected to Boost Milk Production While Structural Issues Persist

The milder weather forecast for later this year is expected to boost milk production, offering a glimmer of hope amidst persistent supply limitations. Lower temperatures have traditionally helped to maintain cow comfort and milk output, which merchants and processors throughout the nation are eagerly anticipating. However, it’s important to note that milk supply is projected to remain somewhat tight despite the approaching seasonal rise due to persistent structural difficulties in the sector.

Milk prices have varied significantly among regions, with the central area seeing the most volatility. This week, spot milk in this region traded from stable to $2 above Class III, the most significant premium since early August 2014. This premium reflects regional variations in supply and demand dynamics, with spot milk prices above the historical average in 48 of the previous 52 weeks. These geographical disparities highlight the dairy market’s complexity since localized events may considerably influence pricing and supply chain architecture.

Why Soaring Dairy Prices Might Backfire on Your Farm This Season

However, tighter supply may only drive up costs to a certain point. Excessively high prices necessarily reduce demand, restricting the market. Consumers, who are already stressed by regular price rises in restaurants and supermarkets, are vulnerable to more increases. As prices rise, consumers’ buying power declines, making it less likely that they will continue to pay more for dairy goods.

The recent significant drop in Wall Street has also influenced market sentiment. Investors ‘ fears about demand have grown against the background of massive financial losses. This genuine market concern reflects consumers’ rising reluctance to bear more extraordinary expenses in uncertain economic circumstances. The dairy business struggles to balance demand with increasing costs, exacerbated by such sentiments.

Cheddar Struggles While Whey Soars: A Dairy Diaries Update

MonthCheddar Price ($/lb)Whey Price ($/lb)Non-Fat Dry Milk Price ($/lb)
May 2024$1.95$0.60$1.22
June 2024$1.90$0.61$1.24
July 2024$1.85$0.615$1.24

Spot Cheddar barrels had a brief victory in May and June, hitting the $2 mark, only to fail soon after that. This week’s volatility continued as they flirted above $2 before sliding to $1.93 per pound, indicating a 4˼ loss from last Friday. Cheddar cubes fell 8% at $1.85.

The whole dairy product industry had a distinct trend. CME spot whey prices reached their highest level since April 2022, completing the week at 61.5˼, a substantial 4.5ɼ rise. This rise may be linked to solid demand for Whey Protein Concentrates (WPCs) and Whey Protein Isolates (WPIs), exacerbated by maintenance downtimes at important whey production plants, further constraining supply.

Nonfat Dry Milk (NDM) rose 0.75 percent to $1.24, tying its highest price since February 2023. However, this market, too, has issues. Rapid expansion in Chinese milk production has decreased dependence on imported milk powder, with Rabobank reporting that China currently satisfies 85% of its dairy demand locally, up from 70% four years ago. This trend gradually reduces the global milk powder supply, resulting in further price hikes.

Butter prices have remained robust. After a slight loss, they recovered 1.5˼ to close at $3.105. Despite increasing output and more significant stock levels than the previous two years, customer worries over the forthcoming autumn baking season have maintained demand strong.

Despite the challenges, the dairy market demonstrates resilience. It reflects a combination of increasing pricing and supply restrictions caused by seasonal demand swings and global production dynamics. This complex ecosystem needs regular monitoring, but the market’s ability to adapt to changes should reassure dairy farmers about the industry’s resilience and potential for profitability.

Chinese Self-Sufficiency in Dairy Disrupts Global Milk Powder Markets

YearChina’s Dairy Self-Sufficiency (%)Milk Powder Imports (MT)
201970%800,000
202075%750,000
202180%700,000
202282%650,000
202385%600,000

Understanding the global market dynamics is crucial in navigating the dairy business. As global milk powder supplies continue to deplete, resulting in an incremental increase in market pricing, it’s important to note that one essential aspect driving this trend is China’s tremendous expansion in milk output. Rabobank notes that China currently satisfies 85% of its dairy demand, up from 70% only four years ago. This shift towards domestic self-sufficiency has replaced significant milk powder imports, significantly impacting global supply dynamics.

As milk powder supplies continue to dwindle, the market remains volatile. Prices will likely rise if demand increases, reflecting the fundamental economic laws of supply and demand. According to Rabobank’s estimates, any revival in demand might drive prices higher, putting more pressure on global dairy markets. Dairy farmers and exporters must know these worldwide trends to successfully manage and prevent future market instability.

Shifting Feed and Cattle Markets: A Mixed Bag for Dairy Producers

MonthCorn Price (per bushel)Soybean Price (per bushel)Soybean Meal Price (per ton)
May 2024$4.15$10.45$330
June 2024$4.10$10.35$328
July 2024$4.03$10.29$325

Dairy farmers should be relieved and cautious as feed markets continue to decline. December corn prices fell below the psychologically critical $4 threshold for the first time in recent years, finishing at $4.0375 per bushel, down 6% for the week. This drop is linked to ideal growth circumstances, which include a healthy balance of sunlight and rain in prominent growing areas. In November, soybeans declined almost 20% to $10.29, but December soybean meal remained stable at $325 per ton.

Dairy farmers face a more complicated picture in the cattle market. While milk revenue over feed margins remain strong, aided by significant beef checks, recent cattle price trends are reason for worry. A big selloff on Wall Street has raised concerns about demand, compounded by persistent reports about the possible shutdown of a cow slaughterhouse in Nebraska. Such a shutdown would lower demand for fed cattle, moving negotiating leverage away from cattle feeders who want higher prices and toward cattle packers who wish to cut animal expenses.

Despite enjoying large margins for many years, cattle packers have lately begun losing money. This turnaround has dramatically dropped cattle prices this week, raising questions about the sustainability of present levels. Cattle values look to be headed for a downturn. While this drop in cattle prices may marginally reduce the value of dairy calves and cull cows, they’re still around record highs.

Mastering the Dairy Market: Proven Strategies for Weathering Price Volatility and Ensuring Farm Stability

Given the volatile nature of today’s dairy markets, sound risk management is critical. Futures contracts provide financial security by locking in prices for future milk sales. Furthermore, insurance such as the USDA’s Dairy Revenue Protection (DRP) and Livestock Gross Margin for Dairy (LGM-Dairy) protect against revenue losses and feed expense threats. Diversification is essential; expanding into other agricultural products or integrating on-farm processing may provide new income streams, such as specialty cheese manufacturing or farm-based retail. Farmers may use futures contracts, insurance, and diversification to secure income and establish long-term resilience.

The Bottom Line

As we negotiate the complexity of the dairy market, it is critical to recognize that present circumstances, typified by restricted supply and high prices, result from several converging events, including harsh weather, avian influenza, and heifer shortages. These problems have substantially impacted milk pricing, creating both possibilities and hazards for dairy producers. While some relief is expected from seasonal increases in milk production as more unusual weather arrives, the mismatch between expanding dairy processing capacity and milk production, combined with global shifts such as China’s increasing self-sufficiency, suggests that milk supplies will remain tight. Dairy producers must remain knowledgeable and adaptable, monitor feed and cattle markets, grasp structural supply challenges, and react to changing circumstances to maintain profitability. The capacity to negotiate this complex terrain will determine dairy farmers’ success; be watchful, keep educated, and accept change front.

Learn more: 

Will the Surge in Milk Prices Last? Analyzing Trends and Future Outlook

Will the surge in milk prices last? Discover the trends and future outlook for milk, cheese, and butter prices, and what it means for your grocery budget.

The early-year increase in milk prices has pleasantly surprised dairy producers in changing agricultural markets, characterized by shifting consumer preferences and fluctuating grain prices. While Class IV milk reached $21.08, a level not seen since mid-2022, June’s Class III milk price was notably $19.87, the most since December 2022. The economic situation of dairy farmers depends on this increase, which also influences the whole agricultural industry. With May’s revenue above feed price rising to $10.52, the greatest since November 2022, dairy producers have optimism given changing grain prices.

Record Highs in Class III and IV Milk Prices Signal Potential Market Stability

MonthClass III Milk Price ($)Class IV Milk Price ($)
January 202318.2719.60
February 202318.8820.22
March 202319.1720.75
April 202319.4421.05
May 202319.7521.08
June 202319.8721.08

The recent record highs in Class III and IV milk prices, the highest since December 2022, signal a potential market stability. With Class III milk reaching $19.87 and Class IV prices hitting $21.08, this increase could provide a stable market environment that would benefit both customers and operators, instilling a sense of reassurance in the industry.

Optimizing Feed Costs: A Path to Enhanced Dairy Farm Profitability

MonthFeed Cost ($/ton)
January290
February285
March275
April270
May268
June265

The recent increases in revenue above feed cost have substantially benefited dairy producers. Driven by dropping grain prices, the May number of $10.52 is the highest since November 2022. Grain prices fall; lowering feed costs increases dairy farmers’ profit margins. Should present grain market patterns continue, dairy producers might lock in low feed costs, thus providing financial stability for the following year. Using forward contracts or other financial instruments to hedge against growing feed costs can guarantee ongoing profitability. Although the future is bright, awareness is required as grain market volatility might rapidly alter the scene and call for swift decisions. The conditions provide a great chance to maximize feed costs and increase revenue above feed prices, enabling a steady and prosperous future in the dairy sector.

The Evolution of Cheese Production: American vs. Italian Varieties 

MonthAmerican Cheese Production (Million lbs)Italian Cheese Production (Million lbs)
January475.2487.1
February450.6472.8
March460.5485.9
April470.3490.7
May488.2505.0
June473.0498.3

The mechanics of American cheese manufacturing have shown interesting patterns deserving of conversation. Since the beginning of the year, output has been steadily declining; May 2023 shows a 5.7% drop over the year before. This tendency is shocking when compared to consistent milk output statistics. Production methods and market tastes most certainly have the answer. Particularly Italian-type cheeses, there is a clear shift towards other cheese types. Italian cheese output is much greater than it has been in 2023 and exceeds past year averages. Changing consumer preferences, such as preferring mozzarella and parmesan over conventional American cheese, caused this change.

Essential elements include worldwide gastronomic trends and well-liked meals such as pasta and pizza with Italian cheese. Driven by a passion for culinary variety and premium, handcrafted goods, consumer behavior demonstrates a rising predisposition for varied and gourmet cheese selections. Responding to worldwide demand trends, the sector is realigning its manufacturing strategy to take advantage of higher-margin items.

Therefore, the whole cheese production spectrum is vital even if American cheese stocks are still below the previous year’s. This implies that American cheese production is declining, led by Italian-type cheese’s appeal and significant outputs, but the sector is rebounding. The industry creates paths for possible market stability and profitability as it adjusts to these changing consumer patterns.

Analyzing American Cheese Inventory: What Lower Levels Mean for Future Pricing

MonthAmerican Cheese Inventory (Million Pounds)Year-Over-Year Change (%)
January700-3%
February710-2%
March720-1%
April715-4%
May700-5%

American cheese inventory has always been below last year, which should help to explain why prices should rise given demand growth. The fluctuations in overall cheese output—some months larger and others lower—have kept stockpiles close. Still, demand for American cheese has not skyrocketed; careful consumption has kept prices erratic instead of steadily increasing.

Should demand follow last year’s trends, limited supply may cause prices to rise. Cheese consumers’ careful approach shows a wait-and-see attitude toward changing output. Record-high cheese exports in March, April, and May positively signal worldwide solid demand, supporting the market even with higher pricing points.

American cheese prices can get under increasing pressure if strong export demand meets or surpasses local consumption. Stable or declining feed prices increase the likelihood of this, enhancing dairy companies’ general profitability. Thus, cheese inventory and demand dynamics provide a complex projection with possible price rises depending on the stability of the local and foreign markets.

Robust Cheese Exports: Navigating Record Highs and Future Uncertainties 

Month2022 Cheese Exports (million pounds)2023 Cheese Exports (million pounds)Percentage Change
January75.581.2+7.5%
February68.172.4+6.3%
March73.078.5+7.5%
April74.280.1+7.9%
May76.482.3+7.7%

With record highs in March, April, and May, the latest patterns in cheese exports show a strong market presence. This expansion indicates a robust global demand even if cheese prices increase. Higher costs usually discourage foreign consumers, but the consistency in export numbers indicates a strong worldwide taste for U.S. cheese. This helps the dairy sector maintain a competitive advantage in changing pricing.

Still, the viability of this tendency is being determined. Should prices keep rising, specific foreign markets could change their buying policies, reducing demand. A wide variety of cheese products appealing to different tastes might balance this risk and guarantee ongoing demand.

Strong cheese exports support the worldwide posture of the U.S. dairy sector and help to steady home milk prices. Strong cheese and butter exports should provide dairy producers a solid basis as worldwide butter demand increases, enabling them to negotiate price constraints and market expectations boldly.

Although cheese exports are moving in an encouraging direction now, stakeholders must be alert. Maintaining development depends on examining price changes and reactions in foreign markets. Balancing high local pricing with worldwide solid demand will rely primarily on creative ideas in strategic market participation and product offers.

Global Butter Demand: Navigating the Surge and Potential Market Ripples 

YearDomestic Demand (Million Pounds)International Demand (Million Pounds)Total Demand (Million Pounds)
20201,4801,2952,775
20211,5251,3202,845
20221,5451,3502,895
20231,5701,3752,945

A promising increase in international butter demand suggests a possible influence on butter prices in the following months. Driven by better economic times and a rising consumer taste for dairy products, recent statistics show a consistent comeback in world butter exports. Rising worldwide demand will cause butter prices to be under increasing pressure. Strong export demand historically matches rising local pricing, which helps manufacturers. Should export growth continue, this tendency is likely to endure.

Nevertheless, supply chain interruptions, geopolitical concerns, and changing feed prices might influence market circumstances. Low-cost manufacturers from developing nations also bring challenges of price competition. Driven by strong worldwide demand, the butter industry seems ready for expansion, yet players must constantly observe changing dynamics.

Strategic Outlook: Navigating the Future of Milk Prices Amid Market Dynamics and Economic Factors

Milk prices’ path will rely on several significant variables that combine market dynamics with general economic circumstances. While sustained high prices provide hope, they also present possibilities and problems for buyers and producers.

High prices allow producers to increase profitability through capitalization. Locking in favorable feed prices might lead to significant cost savings, considering the present grain price pressure. Diverse manufacturing of highly sought-after cheeses, including Italian-type cheeses, could improve income sources, fostering a sense of optimism in the industry.

Risks, however, include changes in foreign demand and erratic market circumstances. Higher costs discourage worldwide consumers, affecting local pricing and exports. Furthermore, changes in consumer tastes toward plant-based dairy substitutes might slow down conventional dairy industry expansion. To stay competitive, the sector has to be creative.

Buyers must guarantee consistent supply chains in retail and food service despite changing customer patterns and costs. Higher prices need flexible pricing policies and intelligent buying. Matching goods with customer tastes for sustainability, and better choices might provide a business advantage.

Although milk prices’ future is bright and unknown, stakeholders may utilize strategic foresight and flexibility to seize possibilities and reduce risk. Tracking consumer behavior and market trends can help buyers and producers flourish in a changing dairy environment.

The Bottom Line

The present success in Class III and IV milk pricing shows a solid but delicate balance for dairy farmers as we negotiate the subtleties of the dairy market. Recent highs encourage a look at lifespan and environmental impact. Changing cheese production patterns, grain price swings, and better revenue over feed ratios highlight a dynamic market. The drop in American cheese output against the increase in Italian cheese reveals a complicated customer choice and market adaption story. Strong cheese export performance reveals the sector’s worldwide resiliency even against growing prices. This should inspire cautious optimism by implying better circumstances ahead and continuous foreign demand. Still, volatility is natural, especially given the changing global butter demand and possible export rebounding. Shielding against downturns mostly depends on careful planning and hedging of expenses. In the end, even if the increase in milk prices provides relief and a promising future, monitoring and market and consumer trend adaptability are crucial. Maintaining momentum and guaranteeing long-term viability will depend on pushing sustainability and openness.

Key Takeaways:

  • Higher Milk Prices: Both Class III and Class IV milk prices reached their highest levels since December 2022, signaling potential market stability.
  • Enhanced Income Over Feed: The income over feed price has been improving, with lower grain prices potentially boosting dairy farm profitability in the near term.
  • Shift in Cheese Production: A noticeable trend towards Italian-type cheese production, despite a decline in American cheese output, could reshape market dynamics.
  • Consistent Cheese Inventory: Lower American cheese inventory levels, paired with steady demand, may lead to higher prices if consumption rises.
  • Strong Export Markets: Record-high cheese exports in recent months indicate robust international demand, which could sustain higher prices moving forward.
  • Global Butter Demand: Improving international butter demand suggests potential price increases if export strength continues throughout the year.

Summary:

The dairy industry has experienced a significant increase in milk prices, signaling potential market stability. Class IV milk reached $21.08, the highest level since mid-2022, and June’s Class III milk price was $19.87, the most since December 2022. This has impacted the economic situation of dairy farmers and the agricultural industry. May’s revenue above feed price rose to $10.52, giving dairy producers optimism due to changing grain prices. Record highs in Class III and IV milk prices provide a stable market environment that benefits both customers and operators. Lowering feed costs can increase dairy farmers’ profit margins, and if present grain market patterns continue, producers might lock in low feed costs, providing financial stability for the following year. Using forward contracts or other financial instruments to hedge against growing feed costs can guarantee ongoing profitability. The evolution of cheese production, particularly American vs. Italian varieties, has shown interesting patterns, with strong export demand meeting or surpassing local consumption, enhancing dairy companies’ profitability. Global butter demand is expected to influence butter prices in the coming months, driven by better economic times and rising consumer tastes for dairy products.

Learn more:

Understanding the Differences Between Cheese and Butter: Pricing Trends, Production, and Market Dynamics

Learn the main differences between cheese and butter pricing, production, and market dynamics. See how these factors affect Class III milk prices.

Ever wonder why your food bill swings? Knowing the variations between cheese and butter and how they affect Class III milk pricing—can provide insightful analysis. This essay seeks to analyze cheese and butter price patterns so that you can better understand dairy economics.

The fundamental variation in price patterns between butter and cheese is pronounced. Cheese costs have remained constant over the last five years while butter prices have skyrocketed. These developments are vital for customers and everyone working in the dairy sector.

Let us explore the figures’ background and their implications for you.

Cheddar Cheese Pricing: A Beacon of Stability Amid Inflation

YearRetail Price ($/lb)Wholesale Price ($/lb)
2019$5.50$1.85
2020$5.55$1.80
2021$5.60$1.82
2022$5.54$1.84
2023$5.56$1.83
2024$5.37$1.87

Over the last five years, cheddar cheese prices have been remarkably stable. Retail prices averaged $5.57 per pound; in May 2024, specifically, they were $5.37 per pound. Wholesale prices in May 2024 were $1.87 per pound, averaging $1.83 per pound in 2019. This stability, even in the face of inflation, is a testament to the well-managed Class III milk and cheese manufacture.

The Stability Powerhouse: Understanding the Dynamics of Wholesale Cheese Inventories 

YearInventory (Million Pounds)
202055
202157
202256
202356
202456

The predictability of wholesale inventory levels, especially for cheddar, is a cornerstone in determining the price of American cheese. Stable inventory levels provide a predictable supply environment that results in consistent pricing. The above table demonstrates, discounting the COVID era, that the constancy in days’ supply of American cheese over the previous five-plus years has been around 56 million pounds.

Because manufacturers and stores can depend on a constant inventory level, this consistency helps reduce price fluctuation. Well-matched supply to demand helps avoid abrupt price swings. Maintaining the stability of Cheddar cheese pricing depends mostly on tightly controlled inventory levels.

Knowing this impact enables one to understand why outside inflation does not change Cheddar cheese prices. Reasonable inventory control guarantees a balanced market, acting as a buffer against unanticipated changes in demand and supply.

Strategically Managed Factors Behind Cheese Pricing Stability 

Thanks to well-controlled variables, cheese prices stay constant. Consistent Class III milk output guarantees a consistent raw material supply, avoiding unneeded price swings.

In cheese manufacture, advanced processing methods and inventory control prevent overproduction and shortages, preserving steady wholesale and retail prices.

Understanding customer demand is crucial for manufacturers to match their production plans, particularly during high-spending seasons like holidays. This customer-centric approach is a key factor in maintaining the stability of Cheddar cheese pricing.

Even with outside economic forces like inflation, coordinated efforts from first Class III milk production to final retail sales help maintain cheese price stability.

Unpacking the Divergence: Butter’s Rise Amid Cheese’s Calm

YearRetail Price per PoundWholesale Price per Pound
2020$4.50$2.00
2021$4.70$2.10
2022$5.10$2.30
2023$5.40$2.60
2024$5.60$2.72

Trends in butter price provide a different picture from cheese pricing stability. Butter prices have risen dramatically starting in 2022. Retail costs have increased 13%, but wholesale prices have jumped 36%.  This volatility emphasizes the significance of knowing what is causing these fluctuations in the butter market compared with the consistent tendencies of cheese.

Inventory Consistency vs. Pricing Volatility: Unraveling the Butter Conundrum

YearInventory (Million Pounds)
201962
202070
202165
202268
202371

Examining the wholesale butter supply levels reveals an exciting narrative. This table shows a constant trend in the days’ butter supply from 2019 forward. People starting to eat at home caused a notable rise in supply during the COVID-19 era.

Post-pandemic inventory levels steadied even with this increase. Chart IV’s start and finish show constant days’ supply when compared. A consistent supply may indicate consistent pricing. Chart III, however, demonstrates that, despite continuous inventory levels, retail and wholesale prices of butter have fluctuated significantly.

Unlike the steadiness in the cheese market, this mismatch implies that other factors are pushing butter prices upward. Awareness of these elements helps one appreciate the general patterns in dairy prices.

Decoding the Butter Price Surge: An Intricate Web of Influencing Factors

Knowing why butter and butterfat prices have skyrocketed requires looking at numerous elements. USDA butter prices are complicated and dependent on many factors, making navigation difficult.

Butter prices have gradually climbed over the last 25 years, clearly displaying a consistent trend of ongoing increases.

Minimal Global Impact: The Predominance of Domestic Dynamics in Butter Pricing

Exports or imports do not influence butter prices much. While imports are higher and result in net imports exceeding net exports, butter exports account for about 4% to 5% of total output. This demonstrates how mostly domestic factors affect butter prices.

Complicating matters include consumption trends and packaging. The change from dining out to home cooking during COVID raised demand for residential butter packaging. This shift upset supply systems, driving retail and wholesale prices and emphasizing how much consumer behavior influences the butter market.

The Bottom Line

The price dynamics of cheese and butter are essentially different but equally crucial for Class III milk pricing. Well-managed inventory levels and consistent customer demand have helped cheddar cheese prices stay constant, therefore shielding them from inflation. On the other hand, butter has demonstrated notable price fluctuation, driven by variations in packaging, COVID-related demand changes, and butter manufacturing complexity. Even with constant supply levels, deeper market factors have increased butter prices.

These observations show that while more general factors, cheese benefits from organized manufacturing and inventory policies influence butter’s price. Stakeholders all over the dairy supply chain depend on an awareness of these distinctions. Whether your role is customer, distributor, or manufacturer, understanding the elements behind these patterns can help you to negotiate the market. Keep educated and proactive in changing the dairy scene. Strategic choices. Keep updated.

Key Takeaways:

  • Cheddar cheese prices have showcased remarkable stability both at retail and wholesale levels despite inflationary pressures.
  • Wholesale cheese inventory levels, particularly for American cheese, have been consistent, ensuring stable supply and pricing.
  • Advanced management practices in Class III milk production and inventory control have contributed to this pricing steadiness for cheese.
  • In contrast, butter prices have experienced significant increases, particularly since 2022, driven by complex market factors.
  • Butter inventory levels have also been stable, but unlike cheese, butter prices have increased markedly over the years.
  • Factors influencing butter pricing include long-term trends, minimal impact from global trade, and fluctuating demand between home and restaurant consumption.

Summary:

This essay explores the price patterns of cheese and butter, focusing on the impact of inflation on dairy economics. Cheese prices have remained stable over the last five years, with retail prices averaging $5.57 per pound and wholesale prices at $1.87 per pound in May 2024. Stable inventory levels, particularly for cheddar, are crucial for determining American cheese prices. Strategic factors behind cheese pricing stability include well-controlled variables, consistent Class III milk output, advanced processing methods, inventory control, and understanding customer demand. However, butter prices have risen dramatically since 2022, with retail costs increasing 13% and wholesale prices jumping 36%. Understanding the butter price surge requires examining various elements, including USDA butter prices, which are complex and dependent on various factors. Understanding these price dynamics is crucial for stakeholders in the dairy supply chain to negotiate the market and make strategic choices.

Learn more:

Send this to a friend