Did you know India produces 69% of the world’s buffalo milk—nearly double US cow production? Imagine the untapped profit potential!
EXECUTIVE SUMMARY: Here’s the thing—India’s buffalo dairy sector controls nearly 70% of global buffalo milk, pumping out over 104 billion kilos a year, while exporting just $1.5 million. The gap is huge. Buffalo milk commands a fat-driven premium of around 90 cents per liter, compared to 60 cents for cow’s. What’s new? AI-driven breeding tech is making waves, boosting milk yields by over 500 kg per lactation and adding roughly $570 income per buffalo (source: IJAS 2025). Yet sensor adoption is still under 5%, so the upside is massive. Farmers in Punjab report AI daughters with better yields and creamier quality, though success rates trail those of cattle. Global demand, especially in Asia, is booming, pushing exports higher. If you want new profit streams, it’s time to rethink buffalos, not just cows, and invest in precision breeding technologies.
KEY TAKEAWAYS:
Boost milk by 525+ kg/lactation with AI breeding tech—potentially add $570 revenue per buffalo. Start with heat detection accuracy improvements and reproductive management programs (source: IJAS, 2025).
Tap into premium buffalo milk pricing at 90 cents/liter, nearly 50% higher than cow’s milk, by focusing on butterfat-rich genetics and strategic herd nutrition (source: Dairy Market Reports, 2025).
Leverage digital tools like rumen sensors and remote vet platforms to cut health costs and improve reproductive success—MoooFarm already connects 15,000 farmers (source: Dairy Global, 2024).
Prepare your export game now: Asia’s dairy import demand is massive, but cold chain compliance and traceability tech (think blockchain pilots) are essential to compete (sources: FAO, Dairy Global).
Recognize buffalo’s ecological edge with 30% lower emissions per liter than cows—position your operation for future carbon regulations and sustainability premiums (source: Indian Ag Research, EPA).
I was with a farmer in Haryana at dawn recently. He pulled up his phone and said, “Priya’s ready for AI breeding in six hours.” Not guesswork—this little rumen bolus sensor tucked in her first stomach was telling him exactly when she was at her peak heat.
Priya’s a Murrah, India’s superstar breed, kind of like the Holstein but with butterfat that’s nearly double: 7 to 8 percent. This farmer runs his operation at roughly half the cost of many North American dairy operations.
What’s fascinating is that this kind of tech isn’t just staying on the big farms—it’s creeping into the smaller outfits too, shaking up the entire Indian dairy scene.
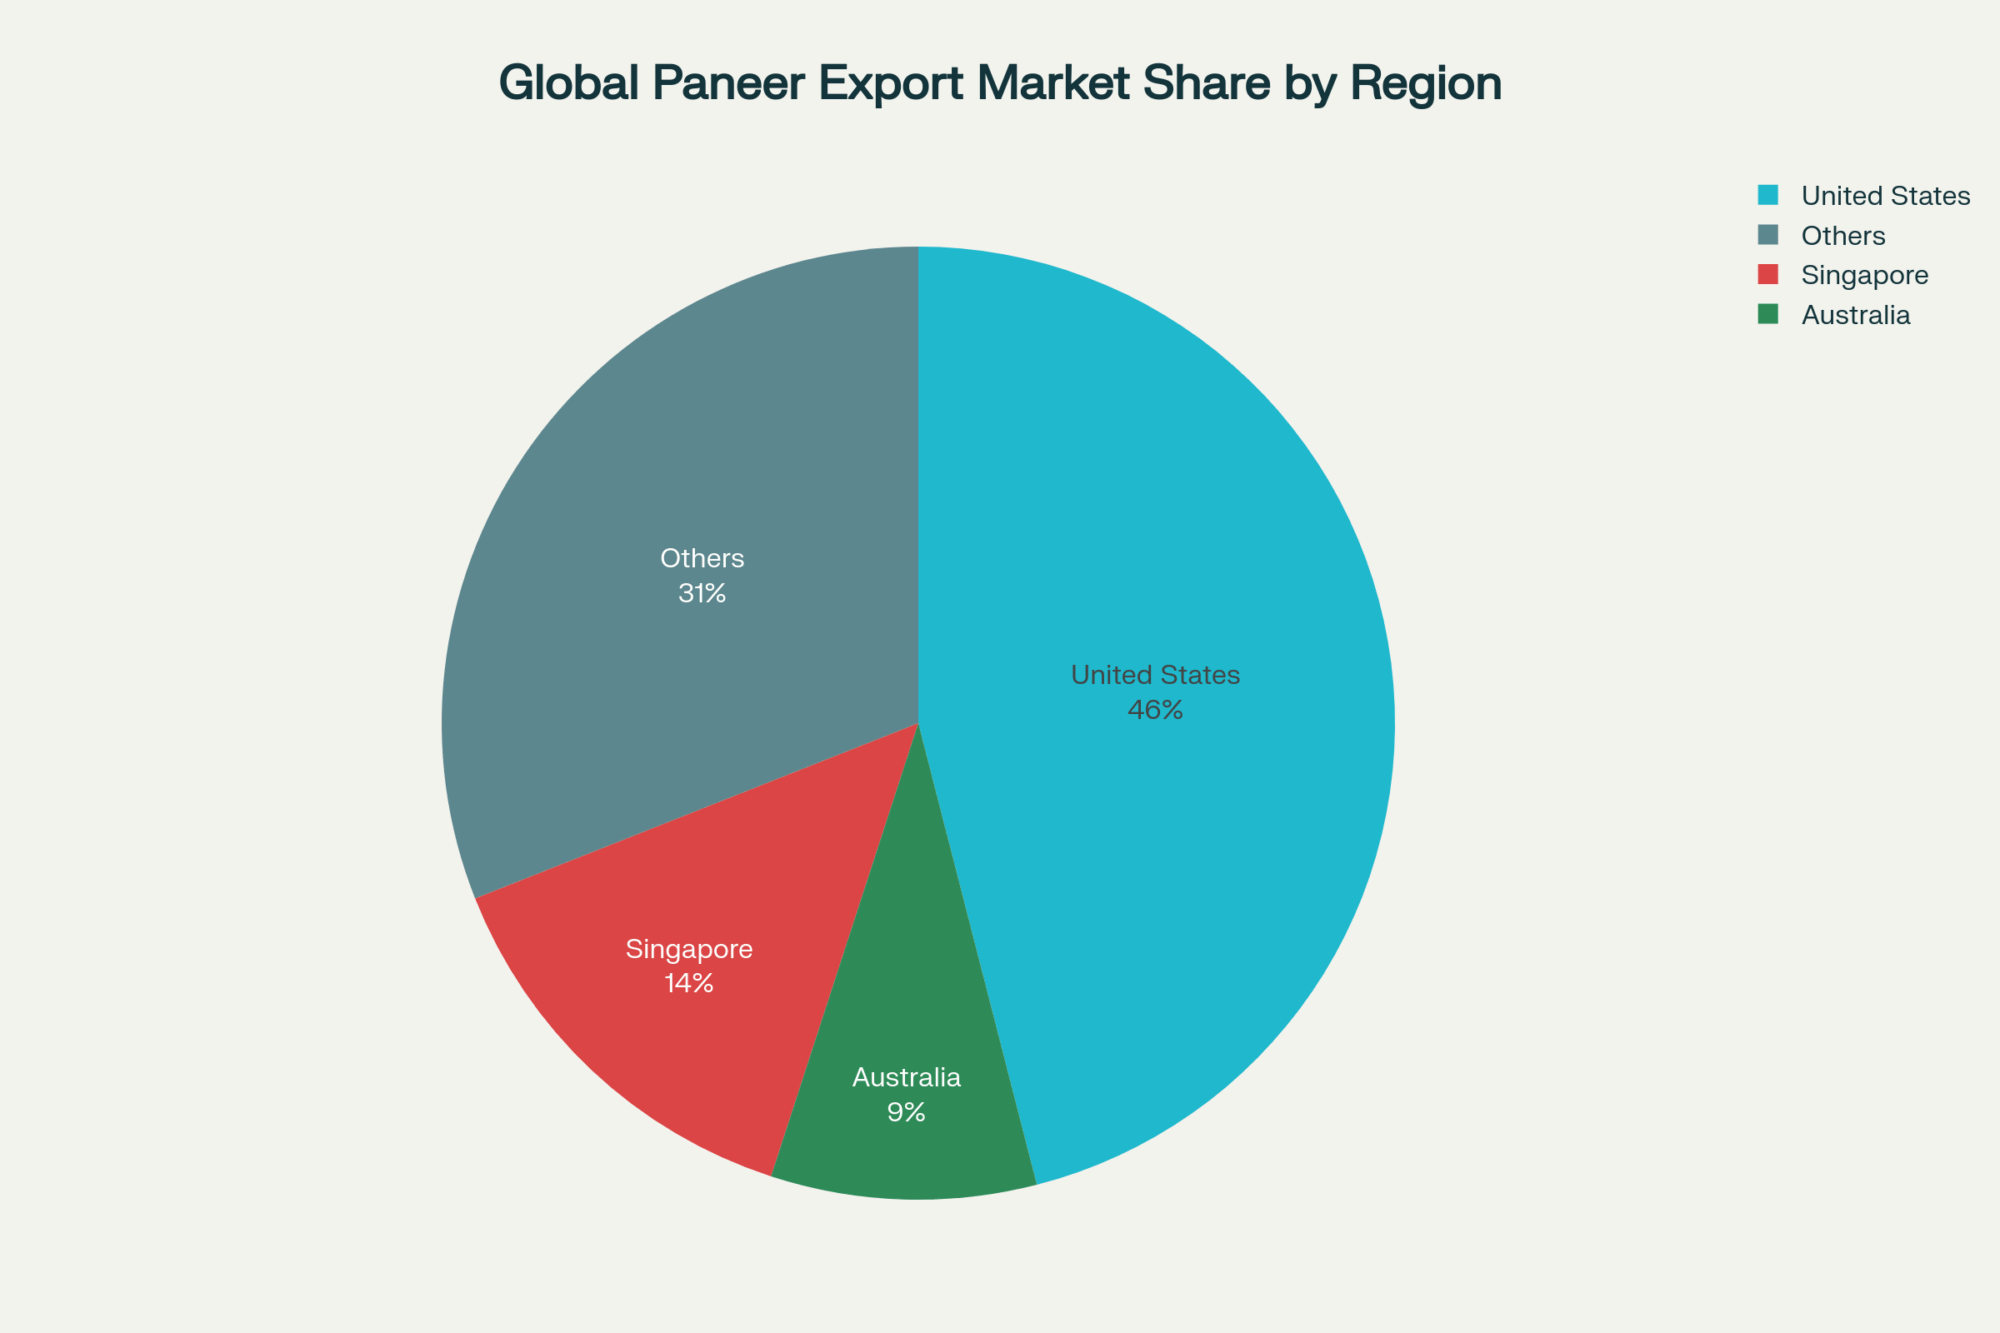
Buffalo milk commands around 90 cents per liter in the market here—nearly 50% more than cow’s milk prices, which hover near 60 cents a liter. Yet, exports of buffalo milk products linger near $1.5 million annually, tiny compared to the size of the domestic market.
Technology Bridges the Gap
Take a startup like MoooFarm. They’ve connected 15,000 farmers with vets through smartphones—meaning more than two-thirds of herd health issues get managed remotely before they balloon into bigger problems.
Then there’s the real star: CIRB’s rumen bolus sensors quietly gathering data inside the buffalo’s rumen, tracking temperature and gut health, helping farmers catch heat and health issues earlier than ever.
Here’s how that scales in numbers:
Breed
Butterfat %
Daily Milk (Liters)
Cost per cwt (USD)
Murrah Buffalo
7.5 – 8.0
8 – 12
16 – 20*
US Holstein
3.6 – 3.8
28 – 35
18 – 22
European Mix
4.0 – 4.2
20 – 25
20 – 25
NZ Friesian
4.5 – 4.8
15 – 18
15 – 19
*Note: Indian cost data focuses primarily on feed costs; full farm costs are still being analyzed.
Source: Compiled from Tridge, USDA, and industry data.
Hot Weather, Dry Feed, and Patchy Signals
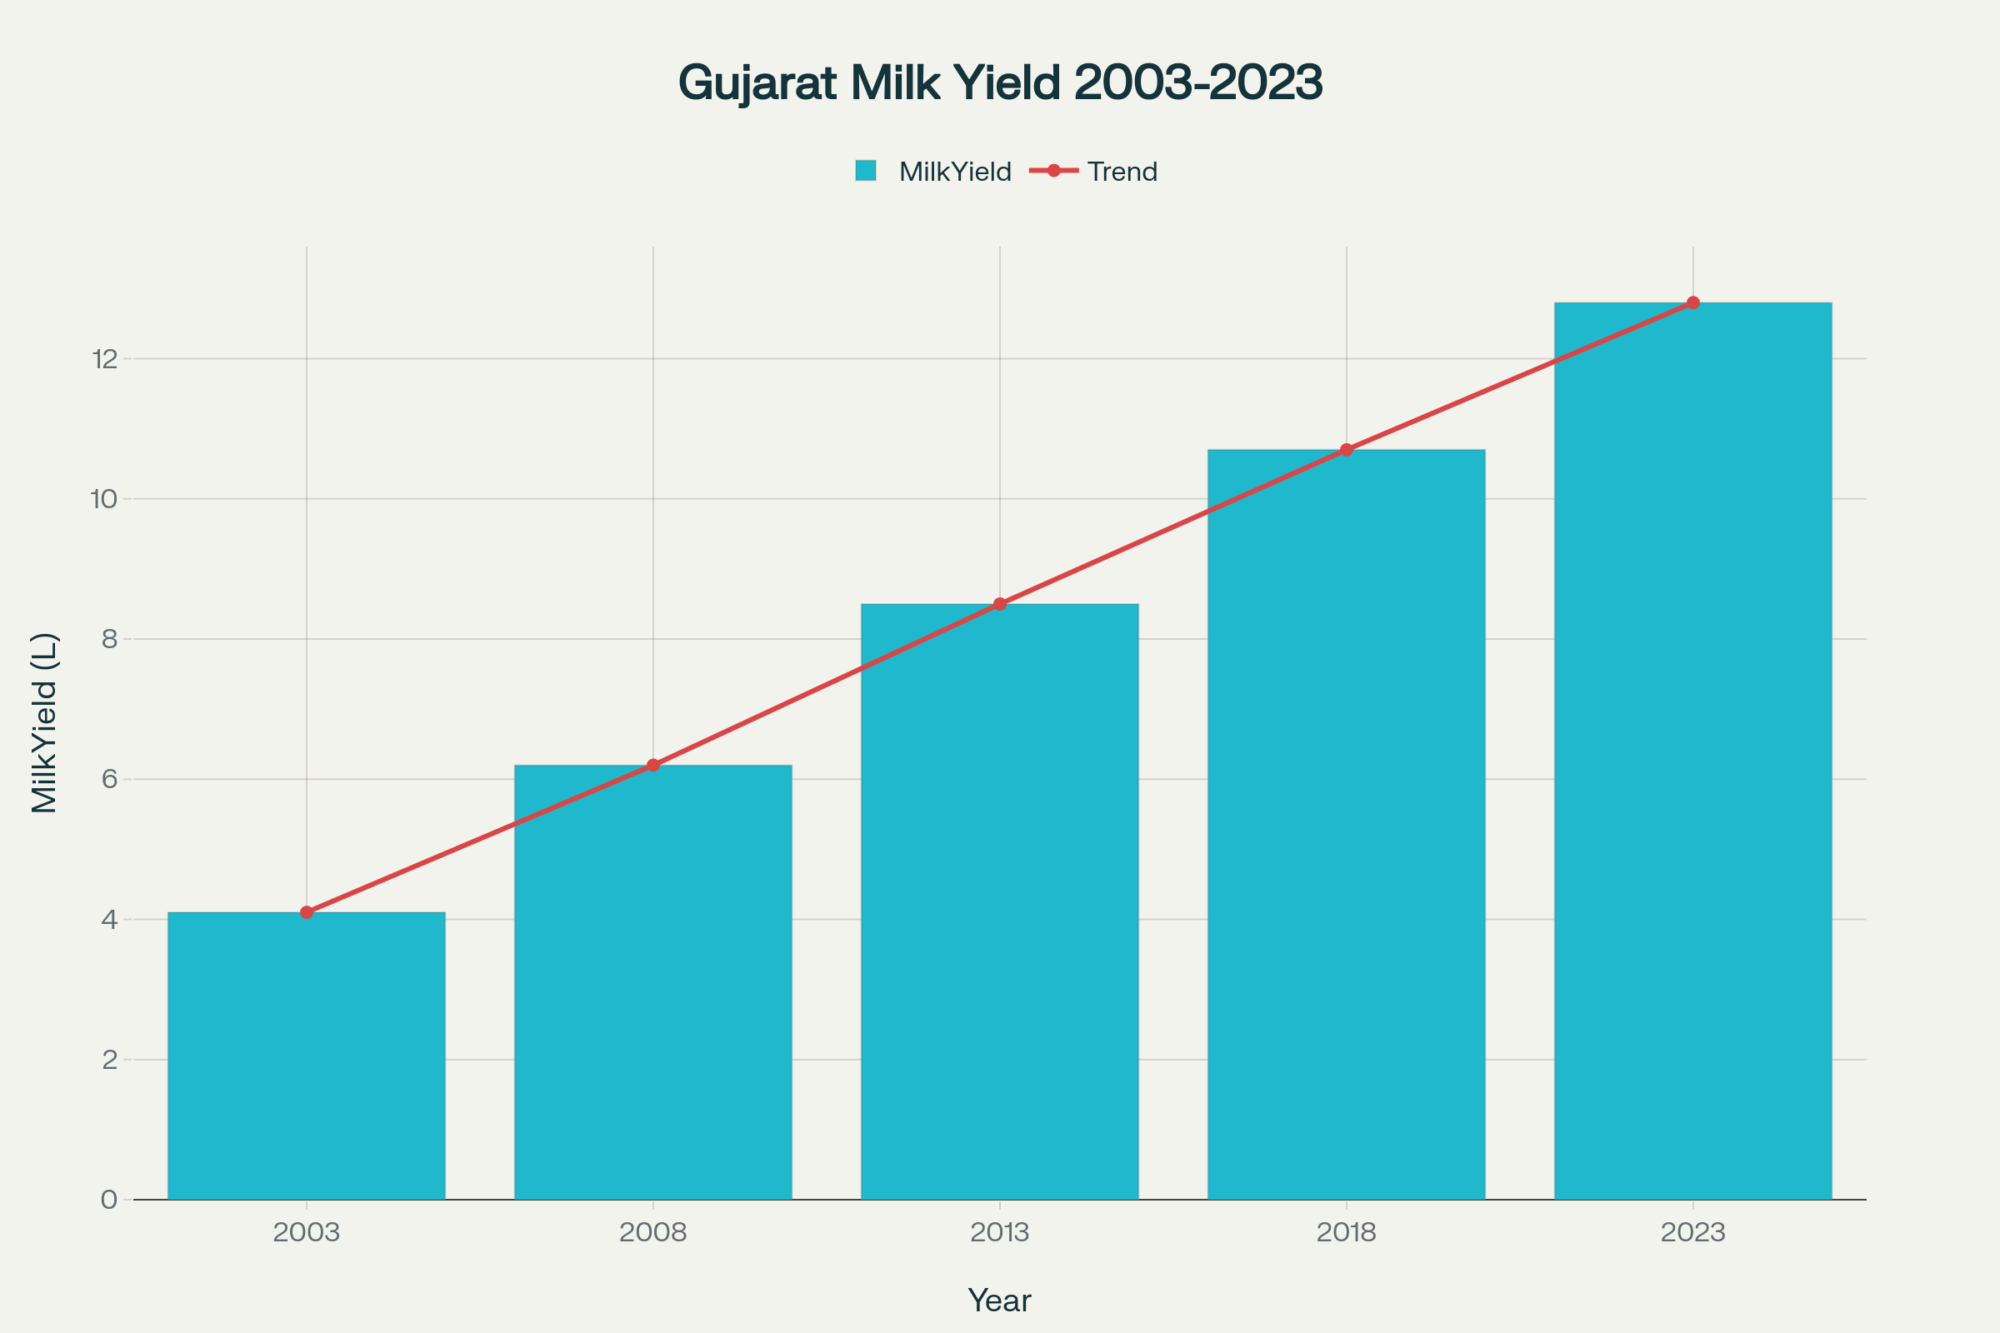
Farmers in Gujarat know the hit that summer delivers: milk production can dip by up to 25% as green feed dries up pre-monsoon. Meanwhile, internet cuts in Rajasthan make it challenging to get timely vet advice.
But innovation clicks in: a farmer near Mysore invested $50,000 in solar-powered cooling, slashing milk spoilage and paying off the system in under a year.
Buffalo dairy exports are small right now, but don’t overlook Asia’s massive dairy demand—with imports from China, Indonesia, and the Philippines in the billions.
Export challenges? Strict cold chain and food safety standards are a real barrier.
Technologies like blockchain might be the solution—but they’re still in early pilot stages.
Case studies from Punjab Agricultural University’s extension programs document that some cooperative farmers with larger buffalo operations (10+ head) achieve positive returns within 6-12 months, although results vary significantly based on local conditions, management quality, and infrastructure availability.
Add to that, buffalo heat signs are subtle and slip away fast—lasting 12-18 hours versus cows’ 18-24. That sensor tech is the real lifesaver in accurately timing AI.
This isn’t just a feel-good stat—it’s becoming a trade reality.
The Bottom Line
The tech is real, and producers are already seeing returns—though it all depends on local conditions, infrastructure, and how well you manage the basics.
If you’re eyeing exports: competing on price is no longer enough. Brand trust and supply chain transparency are the new currency.
For innovators and investors: this is an opening you can’t afford to miss in a market hungry for buffalo-specific solutions.
The buffalo revolution isn’t coming—it’s here. Dairy leaders can’t afford to ignore this shift.
Complete references and supporting documentation are available upon request by contacting the editorial team at editor@thebullvine.com.
Learn More:
Making Sense of Your Herd’s Data – This article provides a tactical guide for turning sensor data into profitable decisions. It reveals practical methods for interpreting health and reproduction alerts, helping you implement the same kind of precision monitoring discussed in the main piece on your own operation.
The Global Dairy Market: Are You A Player Or A Spectator? – While the main article highlights India as an emerging competitor, this piece offers a broader strategic view of global market dynamics. It outlines key economic trends and forces you to consider your farm’s position in the international dairy trade.
The Genomic Revolution: Are You Breeding for the Future or Just for Today? – Moving beyond the AI breeding discussed in India, this article explores the next frontier: genomics. It demonstrates how to leverage advanced genetic data to build a more resilient, efficient, and profitable herd for future market and environmental challenges.
The Sunday Read Dairy Professionals Don’t Skip.
Every week, thousands of producers, breeders, and industry insiders open Bullvine Weekly for genetics insights, market shifts, and profit strategies they won’t find anywhere else. One email. Five minutes. Smarter decisions all week.
When legends pass, the industry doesn’t just lose a farmer—it loses a piece of its soul.
The dairy world got a little quieter on August 30 when Paul Leonard Stiles closed his eyes for the final time at his beloved Clear Brook, Virginia, home. At 75, Paul wasn’t just another farmer hanging up his boots. He was the kind of man who made Jersey cattle history look effortless while teaching the rest of us what true dedication really means.
The Klussendorf Kid Who Never Stopped Learning
Let’s talk about hardware for a minute. The Klussendorf Award in 2006? That’s dairy royalty territory. Master Breeder status from the American Jersey Cattle Association? That’s bloodline mastery. The National Dairy Shrine Distinguished Dairy Cattle Breeder Award? That’s lifetime achievement stuff.
But here’s what those plaques and certificates couldn’t capture—Paul Stiles had something you can’t teach: an eye for excellence that bordered on supernatural.
Those who worked with Paul at Waverly Farm will tell you the same story over and over. Despite being hard of hearing, the man never missed what mattered. And with eyesight sharp as a tack well into his 70s, Paul could spot a cow’s potential from across the pasture while others were still squinting through the morning fog.
More Than Ribbons and Recognition
Sure, Paul collected accolades like some folks collect stamps. But walk into any Jersey barn from Virginia to Vermont, and you’ll hear the real Paul Stiles stories. The ones about the farmer who’d drive three states over to help a struggling breeder read pedigrees. The man who could calm a nervous heifer with nothing but patience and presence.
Paul understood something that today’s tech-obsessed dairy world sometimes forgets: greatness isn’t just in the genetics—it’s in the relationship between farmer and animal. Every champion he showed, every bloodline he developed, every young farmer he mentored carries that truth forward.
The Family Man Behind the Legend
Beyond the show ring and breeding barn, Paul’s greatest pride walked on two legs, not four. His son Todd and daughter-in-law Jennifer, granddaughter Alayna, who lit up his world, and Sandy McCauley—the woman who shared two decades of his life with unwavering devotion.
Paul came from farming stock. One of six kids raised by Robert and Hazel Stiles, he learned early that family and land go together like morning milking and coffee. His brothers Kenneth, Blair, and Tracy preceded him in death, but the Stiles legacy lives on through surviving siblings Mike and Debra, along with their spouses Patricia and Jimmy.
A Send-Off Worthy of a Champion
On Saturday, October 11, from 11 AM to 2 PM, the dairy community will gather at Montgomery County Fairgrounds, Barn 13, to honor Paul’s life. It’s fitting—he spent decades in barns just like that one, turning good cattle into great ones and great cattle into legends.
Instead of flowers, Paul’s family asks for donations to the Klussendorf Memorial Scholarship or Global Lyme Alliance. Even in death, Paul’s thinking about the next generation of dairy farmers and the battles that matter.
The Legacy That Lives On
Here’s what Paul Stiles really leaves behind: proof that excellence isn’t about the size of your operation or the fanciness of your equipment. It’s about showing up every single day with respect for the animals, dedication to improvement, and genuine care for the people around you.
Every Jersey that traces back to Waverly Farm genetics carries Paul’s fingerprints. Every young showman he encouraged carries his wisdom with them. Every breeding decision influenced by his bloodlines carries his legacy forward.
The dairy industry lost a giant on August 30. But giants like Paul Stiles don’t really leave—they just transform into the foundation that holds up everything that comes next.
Rest easy, Paul. The herd’s in good hands.
Paul Leonard Stiles: July 20, 1950 – August 30, 2025. A life well-lived, a legacy that endures.
The Sunday Read Dairy Professionals Don’t Skip.
Every week, thousands of producers, breeders, and industry insiders open Bullvine Weekly for genetics insights, market shifts, and profit strategies they won’t find anywhere else. One email. Five minutes. Smarter decisions all week.
Who says kids today don’t care about real milk? Dairy MAX is flipping that script—one gamer at a time.
You know that moment when you’re driving through Texas ranch country, watching teenagers glued to their phones in the passenger seats, and you start wondering how the hell we’re supposed to connect dairy farming with kids who think milk comes from the store? Well, Dairy MAX figured it out — and their answer might surprise you.
Picture this: instead of fighting the digital tide, they dove headfirst into it. We’re talking Fortnite maps, esports partnerships, and virtual diners where Gen Z builds dairy empires between homework and TikTok scrolls. Sounds crazy? Maybe. But when you’re moving 400,000 pounds of real milk through fake farms, crazy starts looking pretty smart.
The Century-Long Game Plan
Here’s the thing about Dairy MAX — they’ve been building on a foundation that began in 1915, when the National Dairy Council (NDC) was established during a public health crisis. Smart farmers rallied together to defend what dairy stood for, establishing a legacy of collaboration that would span generations. Dairy MAX emerged in the 1980s as part of the United Dairy Industry Association (UDIA), carrying forward the same spirit of innovation and farmer unity that had been established by the UDIA.
Today, spanning from Texas clear up to Montana and serving more than 700 farm families, it’s about building bridges across an even wider gap than those early pioneers faced.
The values haven’t changed — hard work, stewardship, family legacy, community commitment. What’s shifted is the distance between producer and consumer. Jennie McDowell, Dairy MAX’s CEO, puts it straight: “Only 2% of Americans feed the rest of us, and most people are miles removed from understanding what farmers do every day.”
Jennie McDowell, CEO of Dairy MAX, leads with bold innovation—and a deep respect for the families behind every milk check.
That disconnect weighs heavily on producers juggling tech upgrades, volatile feed costs, and market swings while trying to keep fresh milk flowing. But here’s where Dairy MAX stepped up — they made consumer connection their business so farmers could focus on what they do best.
The Pandemic Pivot That Changed Everything
When COVID hit in 2020, traditional marketing ground to a halt overnight. School visits? Canceled. Campus outreach? Done. Two weeks after hiring people specifically for educational programs, Dairy MAX watched their entire strategy evaporate.
But necessity breeds innovation. Within weeks, they’d built partnerships with trucking companies they’d never worked with before, rerouting surplus milk straight to food banks. An Amarillo rancher told me, “What looked like mountains turned out to be molehills once folks started asking the right questions and picking up phones.”
Meanwhile, consumer behavior fast-tracked five years into the future. That grandmother who once avoided online shopping? She’s now crushing Instacart orders like she invented the app. The digital acceleration wasn’t just temporary — it reset how Americans buy groceries, engage with brands, and learn about nutrition.
The Gaming Gamble That Paid Off
So, when Dairy MAX’s team sat around asking, “How high is high?” about reaching Gen Z, somebody suggested Fortnite. The initial reaction required some explanation, but here’s the thing about dairy farmers — they know that innovation is the only way to succeed, and they’re willing to take those risks when the case is solid.
Ready to get farming? Dairy MAX’s Farm Tycoon map in Fortnite lets players experience life (and milk sales) on the digital dairy—no boots required.
And here’s the genius part — instead of dismissing the idea, the board leaned into it. Their Farm Tycoon map, launched in 2024, allowed players to build virtual dairy empires while learning real-world farming economics. Kids weren’t just clicking randomly; they were managing herd health, tracking milk prices, and understanding feed conversion ratios.
A Colorado parent shared this with me: “My daughter went from questioning everything about dairy to schooling me with nutrition facts she learned from the game. She’s more engaged with farming through that screen than she ever was when I tried explaining it at dinner.”
Yes, that’s real milk front and center in Fortnite’s Diner Tycoon. Dairy MAX’s Level Unlocked campaign puts dairy—not just energy drinks—into the hands of millions of next-gen consumers, right where they play.
The numbers don’t lie — over 41 million players engaged with these maps, translating to eight years of cumulative playtime. That’s eight years of voluntary dairy education. In 2025, they rolled out Diner Tycoon, extending the farm-to-fork narrative as gamers manage virtual restaurants that specialize in heavy cheese, milk, and cream-based dishes.
The Level Unlocked campaign that tied everything together? It generated over $600,000 in direct dairy sales through integrated Instacart promotions and influencer streams. Industry observers are calling it exactly the kind of innovative outreach needed to secure future consumers.
Cowboys, Community, and Real Impact
Dallas Cowboys wide receiver James Washington helps power Dairy MAX’s mission—Fuel Up to Play 60 brings big-league nutrition (and dairy) front and center for the next generation.
Don’t think Dairy MAX forgot about traditional engagement. Their Dallas Cowboys partnership puts dairy nutrition front and center, where it matters — AT&T Stadium during game day.
Students put their best culinary skills—and a big helping of dairy—to the test at the Taste of the Cowboys cook-off, where real kitchen teamwork meets real world nutrition.
The annual Taste of the Cowboys contest brings kids from across the region into that legendary kitchen, competing with dairy-heavy recipes. Winners don’t just receive trophies; they return to cook during actual games, featured in the end zone while 80,000 fans watch.
Players like Travis Frederick — that Wisconsin-born center — swear by dairy’s role in athletic recovery. The powerful testimonial he shares about drinking a gallon of milk daily to heal a broken bone ahead of schedule? That’s the kind of authentic testimonial that resonates with both farm families and consumers.
“It’s safe to say I grew up knowing the importance of starting my day with a healthy breakfast.” Dallas Cowboys center Travis Frederick is proof that building strong habits—like making dairy a staple—helps fuel your best both on and off the field.
Winning Over the Boardroom
The beauty of working with forward-thinking dairy farmers is their progressive mindset when presented with a solid business case. Dairy MAX’s approach to introducing esports was straightforward: “Invite your kids to the meeting,” Jennie jokes. “They understand immediately that gaming spaces are the new family rooms.”
It’s about recognizing generational shifts without abandoning core values. Today’s virtual arenas become tomorrow’s kitchen table conversations. The platforms change, but the mission remains the same.
For most dairy families, every big decision starts at the kitchen table—these are our original “board meetings.” It’s where bold ideas (and breakfast) get a seat.
The Sustainability Story That Actually Works
Here’s where Dairy MAX really nailed consumer psychology — their research shows people connect dairy sustainability most strongly to cow comfort and care, not just carbon emissions. That insight shifted their entire messaging strategy.
Instead of getting defensive about environmental headlines, they help farmers tell stories about generational stewardship. If you’re building a business to pass down to your kids, you’re not going to poison the water or abuse the land. It’s that simple, and that powerful.
The real story of sustainability is written on the farm. Dairy MAX connects consumers with the families whose generational commitment to cow comfort and land stewardship is the foundation of the dairy industry.
The Story That Sticks
During the pandemic relief efforts, a grandmother wrote to thank Dairy MAX for getting milk to her local food bank. Her special-needs grandson could finally make his own bowl of cereal — a simple act that gave him independence and dignity.
“I keep that note on my desk,” Jennie tells me. “We think we’re marketing milk products, but sometimes we’re giving someone the tools for self-reliance. Those moments remind you why the work matters.”
Every school day, 20 million free lunches—and milk cartons—help fuel kids’ growth. Just one serving provides 13 essential vitamins and minerals for strong minds and bones.
Looking Ahead: The Big Picture
Dairy MAX’s 2025 vision centers on strengthening collaboration — working more closely with Dairy Management Inc. (DMI) and the other UDIA state and regional organizations to create a unified voice. “Individually, we can’t match Gatorade’s marketing budget,” Jennie admits. “But together, we become a force that can move markets.”
Export opportunities are expanding, with US cheese exports increasing by 34% year-over-year and global demand diversifying beyond traditional markets. These international sales have become crucial lifelines for farm profitability as domestic consumption patterns shift.
For young people considering dairy careers, Jennie’s advice is forward-looking: “Dive into engineering, robotics, food science. The future dairy workforce needs tech sophistication as much as traditional farming knowledge.”
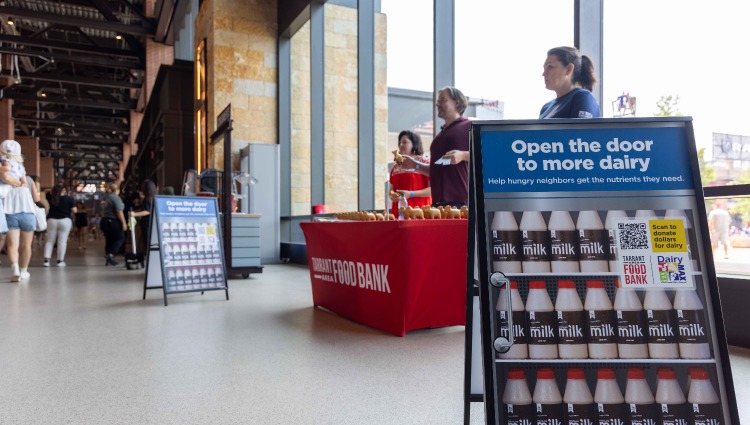
Dairy MAX raises dollars—and gallons—for hungry Texans at the ballpark. At Texas Rangers games, fans “open the door to more dairy” by supporting local food banks right on site.
The Connection Economy
Driving through ranch country these days, I think about connection — not just WiFi signals, but the human bonds that make any industry sustainable. Dairy MAX figured out that reaching tomorrow’s consumers means meeting them where they are, speaking their language, and proving that century-old values can thrive on cutting-edge platforms.
They’re not abandoning tradition for technology; they’re using technology to preserve and extend tradition. That teenager building virtual dairy empires might just become the consumer advocate the dairy industry needs, or even the next generation of dairy professionals.
From dusty plains to digital playgrounds, the story continues. And it’s being written by organizations smart enough to evolve without losing their soul.
See how Dairy MAX is blending tradition and technology at DairyMax.org.
KEY TAKEAWAYS
Hooked 41 million gamers, drove $600k in real milk sales—if you’re still relying on handshakes at the feed mill, you’re missing out.
Partnering with big brands (Cowboys, Instacart) moves dairy into new markets—try collaborating with local sports clubs or online platforms for instant visibility.
Consumers care more about cow comfort than greenhouse gas stats—use your animal care protocols in every piece of outreach; it’s what actually builds trust right now.
Cheese exports up 34% this year—lean into international demand by exploring co-ops or groups making those connections.
Dairy MAX didn’t act alone—they teamed up with DMI and other UDIA regions. Big results need strong partners. If you want to survive 2025’s price squeeze, find the folks willing to go bold with you.
EXECUTIVE SUMMARY
Let me break this down—Dairy MAX is proving you don’t need billboards to sell more milk; you need creative guts. They raked in $600,000 in sales by placing dairy products smack in the middle of Fortnite and Instacart, reaching kids where they actually spend their time. It wasn’t just a gimmick: 41 million gamers played, and over 400,000 pounds of real milk moved—while we’re hustling for every nickel. US cheese exports are already up 34% this year, showing there’s a market out there if you know how to reach it. The Dairy MAX board didn’t flinch at new ideas, they leaned in—proof that forward-thinking pays. If you’re still pouring money into radio ads in 2025, maybe it’s time for a farm-to-fortnite rethink. In a world where most folks can’t name three breeds of cow, this is ROI you can actually taste. You’d be crazy not to try something new.
Learn More:
The Dairy Farm of the Future: Embracing Agritourism to Diversify and Thrive – This article provides a practical, on-farm strategy for direct consumer engagement. It details how to leverage your operation for agritourism, creating new revenue streams while building the local trust and connection discussed in the main piece.
The Shifting Global Dairy Market: Are You Ready for The New Players? – While the main article focuses on the domestic Gen Z consumer, this piece zooms out to the global stage. It offers a crucial strategic analysis of emerging international markets, export opportunities, and the economic forces shaping global dairy demand.
Decoding Dairy: Is Traceability the Key to Unlocking Consumer Trust? – This piece explores a different angle on innovation. Instead of marketing, it focuses on technological solutions like traceability to build consumer confidence, demonstrating how on-farm tech can be a powerful tool to validate the sustainability stories that consumers demand.
The Sunday Read Dairy Professionals Don’t Skip.
Every week, thousands of producers, breeders, and industry insiders open Bullvine Weekly for genetics insights, market shifts, and profit strategies they won’t find anywhere else. One email. Five minutes. Smarter decisions all week.
Fonterra’s about to pocket 5x more revenue per dollar by ditching consumer brands. Smart move or missed opportunity?
EXECUTIVE SUMMARY: Look, here’s what’s really happening with Fonterra’s potential consumer brand sale… They’ve figured out something most co-ops haven’t: ingredients make 5x more money per dollar than consumer products. We’re talking NZ$17.4 billion from ingredients versus just NZ$3.3 billion from brands like Anchor.Meanwhile, European giants are consolidating into €19 billion powerhouses, and sustainability programs are paying farmers up to 25 cents extra per kg of milk solids. The kicker? Precision feeding tech is saving farms $180-220 per cow annually with payback in 18-24 months.Bottom line — whether you’re milking 200 cows or 2,000, this shift toward specialization and tech adoption isn’t optional anymore. You need to pick your lane and dominate it.
KEY TAKEAWAYS
Focus pays off big: Fonterra’s ingredients-first strategy delivers 500% better returns than trying to do everything — time to audit where your farm really makes money
Sustainability = serious cash: Programs now paying up to 25c/kg milk solids for verified environmental practices — audit your practices this month to capture these premiums
Tech ROI is proven: Precision feeding delivers 8-12% better feed conversion, saving $180-220 per cow annually — calculate your payback today (hint: it’s under 2 years)
Size determines strategy: Small farms (<200 cows) should focus on niche markets, medium operations (200-800) need to modernize or specialize, large farms (>800) should lead with AI and robotics
Consolidation creates opportunity: With fewer but bigger buyers, quality producers finally have leverage again — now’s the time to position as a preferred supplier
Have you ever had one of those mornings where the coffee and the news combine to make you stop and say, ‘Wait — did everything just shift?’ That’s the vibe right now as Fonterra explores selling their consumer portfolio, including household names like Anchor and Mainland. This isn’t a done deal yet, but the portfolio’s worth billions, and the shakes are starting in the industry.
Now, potential buyers — including giants like Lactalis — could be gearing up to make a massive move, signaling a big shift in how milk gets from your parlor to global markets. It’s a move that redefines the dairy playbook.
Fonterra’s ‘Ingredients First’ Strategy: Why Focus Pays Off
Let me tell you, Fonterra’s leadership isn’t reacting out of fear. The data from their latest report shows that the ingredients division moves about 80% of their milk and pulls in close to NZ$17.4 billion — dwarfs the consumer segment that grabbed around NZ$3.3 billion and has struggled with impairments, as detailed in The Bullvine’s coverage of Fonterra’s financial turnaround.
This paints a clear picture: ingredients deliver more than five times the revenue per dollar compared to consumer products. So doubling down on what pays and letting specialists handle the rest is smart business widely seen in boardrooms right now.
Interestingly, the consumer division isn’t a deadbeat. It actually showed a 103% profit jump in Q3, FY24. No panic selling here — more like strategic repositioning.
Across Midwest co-ops, there’s a buzz about this partner/not-own model. The recipe? Really scrutinize where value is created, plug the complex bits into partners’ hands, and prioritize returning capital to your producers instead of chasing too much growth.
But it won’t be easy. Transitioning ownership is rarely seamless. Industry estimates show retention is about 85-90%, and merging a Kiwi cooperative culture with the corporate efficiency of a French multinational will present significant hurdles.
Graduating to the Big League: Consolidation and Supply Crunch
Out on the European front, dairy is consolidating fast. Cooperatives are merging into mega players valued over €19 billion, as covered in The Bullvine’s analysis of the Arla-DMK merger. That means fewer but much mightier players, shifting power dynamics completely.
“The leverage is shifting back to quality producers for the first time in years,” according to a leading dairy market analyst we spoke with.
At the same time, environmental rules and shrinking herds are tightening supply, pushing prices higher and sending premiums into overdrive. Premium dairy is growing at somewhere between 7-12% CAGR, while commodity milk grows just 2-4%.
How Sustainability Delivers Payday
Speaking of cash, Fonterra’s now paying producers up to 25c/kg of solids for verified sustainability improvements, part of broader industry trends explored in The Bullvine’s sustainability coverage. If you’re not factoring that in, you’re leaving potential revenue on the table.
How Dairy Tech Delivers Real ROI
Recent studies show precision feeding improves feed conversion 8-12%, saving $180-220 per cow annually with investments typically paid off within 18-24 months, as detailed in The Bullvine’s precision technology analysis.
AI systems for lameness detection are no gimmick, reaching over 99% accuracy and helping save thousands in treatment and lost production on farms around the world. The Bullvine has extensively covered how this technology is revolutionizing herd health management.
What This Means By Farm Size
Farm Size
Financial Impact
Operational Changes
Tech Uptake
Small (<200 cows)
Indirect benefits, price stability
Steady contracts, minimal change
Tech adoption limited by cost
Medium (200-800)
Moderate gains, modernization pressure
Adjust supply relationships
Growing tech adoption
Large (>800)
High returns, premium access
Complex contract management
Leading in AI and robotics
“The middle ground is disappearing—either scale or carve out a niche,” said a leading dairy analyst.
A Practical Plan For Your Farm
Next 30 days
Benchmark milk quality and components against DHIA data
Calculate potential tech ROI and prioritize investments
Audit sustainability programs and capture incentives
Next 90 days
Refine investments and partnerships based on updated strategy
Update sales approaches aligned with market shifts
Consolidation isn’t coming; it’s here. The question isn’t if you’ll benefit, it’s when. Those who double down on their strengths, invest in smart tech, and lead on sustainability will thrive.
“The question isn’t whether consolidation will continue—it’s whether you’ll be ready when the dust settles,” says one industry expert.
How will you respond? The dairy industry’s playbook is being rewritten, and your farm’s future depends on how quickly you adapt to these new rules.
Complete references and supporting documentation are available upon request by contacting the editorial team at editor@thebullvine.com.
Learn More:
Navigating the Dairy Downturn: 5 Proven Strategies from Top Producers to Protect Your Bottom Line – This piece provides a strategic playbook for building financial resilience amidst market volatility. It details five proven strategies top producers use to manage risk and protect profits, offering a crucial economic perspective that complements this article’s market consolidation analysis.
Beyond the Bull: How AI is Decoding Dairy Genetics for Unprecedented Herd Improvement – Explore how AI is unlocking new frontiers in dairy genetics. This article demonstrates how predictive analytics can future-proof your genetic strategy, offering an innovative look beyond operational tech to the very foundation of your future herd’s potential.
The Sunday Read Dairy Professionals Don’t Skip.
Every week, thousands of producers, breeders, and industry insiders open Bullvine Weekly for genetics insights, market shifts, and profit strategies they won’t find anywhere else. One email. Five minutes. Smarter decisions all week.
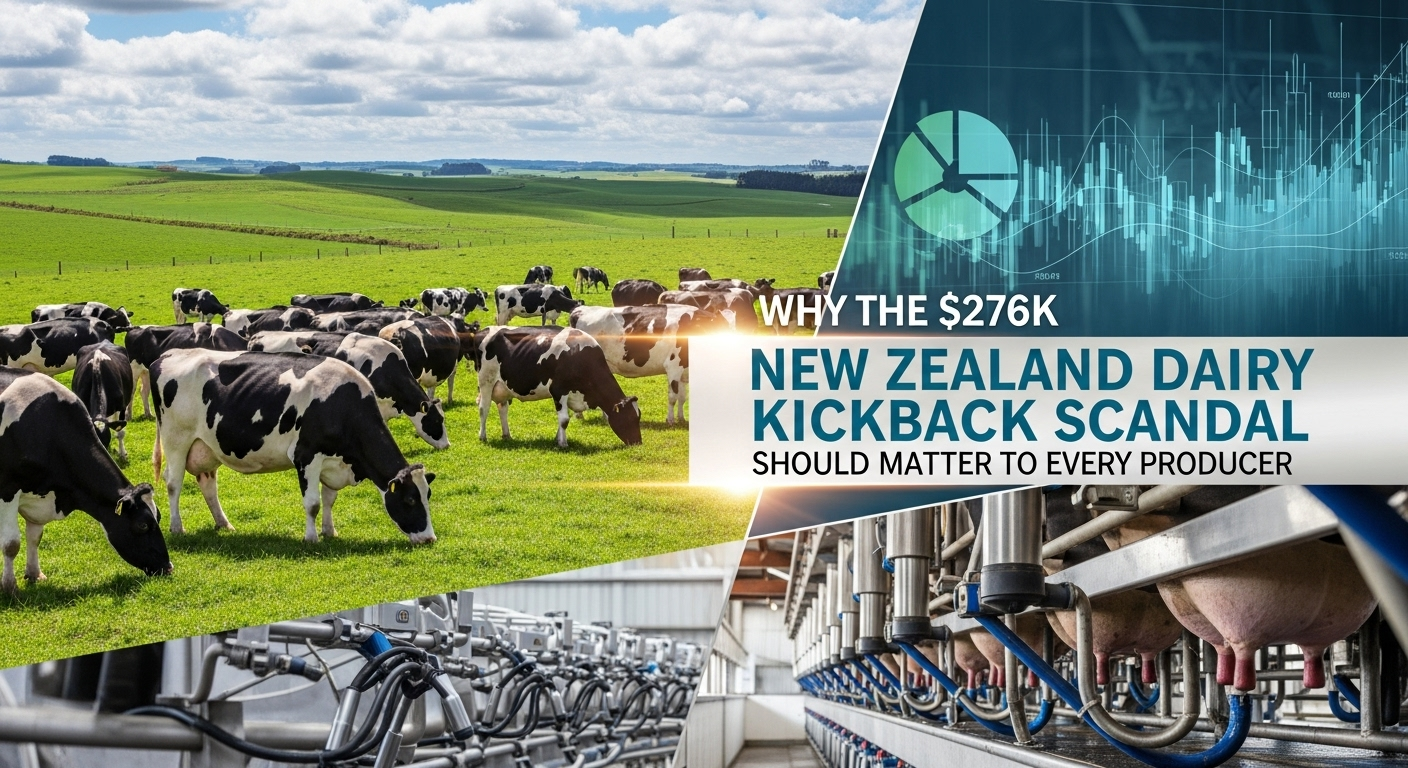
One exec’s $277K kickback scheme just exposed how much dairy farmers can lose to corruption
EXECUTIVE SUMMARY: So here’s what went down in New Zealand—and why it matters to every one of us. A former executive at Open Country Dairy was caught taking $276,668 in kickbacks over four years, selling pricing information to Indonesian traders. Those insider tips were worth $ 15,000-$ 25,000 per container—that’s serious money walking out the door. Dr. Jacqueline Rowarth from DairyNZ warns about “sticky discount pricing” where trust breaks can cost you for 3-5 years straight. With China cutting imports and global competition intensifying, we can’t afford reputation hits. The kicker? Buyers will pay 3-5% premiums for verified clean supply chains—the University of Guelph proved it. Lock down your data access now, because competitors are watching every move.
KEY TAKEAWAYS:
Audit your info access immediately: Keep pricing data locked tight—one leak can cost you premium contracts worth thousands per load
Invest in monitoring tech: Behavioral analytics catch sketchy patterns early, protecting margins that fraud could wipe out in days
Get independent audits on major customers: Third-party verification strengthens your market position and prevents nasty surprises
Leverage trust for premiums: Clean, transparent operations command 3-5% higher prices—that’s real money in your pocket monthly
Eye the Asian markets: Indonesia imports 2.5 million tons yearly; even grabbing 2% market share means $160-200 million in potential revenue
Trust is the foundation of the dairy industry. When insider pricing information leaks, the entire supply chain feels the impact. Recently, New Zealand’s Serious Fraud Office charged Simon Stewart, former group market manager at Open Country Dairy, with accepting $276,668.92 in kickbacks from Indonesian trader PT Anta Tirta Kirana. Over four-and-a-half years, 27 payments were made for insider pricing and other favors. Such breaches go beyond company losses—they shake global confidence. Open Country Dairy is New Zealand’s second-largest milk processor and the world’s second biggest exporter of whole milk powder. When trust cracks here, it sends ripples worldwide.
Global Ripples from a Local Crack
New Zealand dairy consistently earns price premiums because buyers trust the supply chain from farm to freight. In a DairyNZ interview, Dr. Jacqueline Rowarth, DairyNZ director and adjunct professor at Lincoln University, explained that such reputational damage creates “sticky discount pricing”—a penalty that can linger for three to five years. This reputational risk emerges as global demand continues to climb steadily and competition from European and U.S. exporters intensifies, according to Rabobank’s 2025 Global Dairy Quarterly.
China’s drop in imports—driven by growing domestic production—redirects New Zealand exporters to Southeast Asia. Indonesia imports roughly $300 million worth of New Zealand dairy annually, which is where this case hits hardest.
A Calculated Corruption Scheme
Stewart’s scheme was sophisticated. Analysts from HighGround Dairy estimate that having a 2-3 day price lead—prices that fluctuate by about $50 per ton—could boost profits by $15,000-$25,000 per container. PT Anta Tirta is a major Indonesian player spanning 17,000 islands, with deep ties in the pharmaceutical and food sectors. They structured payments to avoid detection—calculated corruption.
Processors are fighting back. European firms are now utilizing AI-powered analytics to identify suspicious communication patterns, while others are implementing blockchain trails, biometric logins, and strict data compartmentalization to keep pricing and sales teams separate, thereby drastically enhancing security.
Legal expert Gerald Podolsky of Russell McVeagh notes a 60% conviction rate in cross-border dairy fraud cases, highlighting that many evade penalties amid tight margins and rising industry pressures.
Producer’s Playbook: Taking Control
Farmers and processors, here’s your action plan:
Immediate Steps:
Audit who has access to price data and monitor sales-customer communications strictly
Implement behavioral monitoring technology—costs may seem steep, but they protect against million-dollar frauds
Use independent “clean team” audits to verify major customer relationships
Segregate pricing and customer information to prevent insider abuse
Strategic Opportunities: Open Country’s crisis creates openings for processors with bulletproof governance. Fonterra, despite past challenges, continues rebuilding its reputation as a trusted partner. With Indonesia importing 2.5 million metric tons of dairy annually, even a 2% market share gain (about 50,000 tons) could deliver $160-$200 million in additional revenue at current whole milk powder prices.
The reputation stakes are real everywhere. A Pennsylvania producer I know spent five years pushing his herd’s butterfat from 3.8% to 4.2% to land a lucrative contract with an artisanal cheesemaker. A single compliance issue with his processor—completely unrelated to his milk quality—resulted in his farm being flagged, and he lost access to that premium market overnight. That’s exactly what happens when trust breaks down, even far from New Zealand.
Buyers aren’t just evaluating butterfat numbers and somatic cell counts anymore. Ethics, transparency, and traceability drive premiums. A 2024 study from the University of Guelph found that consumers and B2B buyers are willing to pay 3-5% more for products with certified clean sourcing, emphasizing the real business case for transparency.
The key takeaway? Guard your reputation like your best cows in the dry lot. Once lost, trust takes years to rebuild—and competitors won’t wait.
Complete references and supporting documentation are available upon request by contacting the editorial team at editor@thebullvine.com.
Learn More:
The Ultimate Guide to Improving Feed Efficiency in Dairy Cattle – This article provides tactical, on-farm strategies for optimizing your largest variable cost: feed. It details how to measure and improve feed conversion, directly impacting the razor-thin margins and rising cost pressures mentioned in the main article.
The 5 Biggest Trends That Will Disrupt The Dairy Industry – For a strategic, market-focused view, this piece explores the long-term forces reshaping the industry beyond immediate fraud risks. It contextualizes the competitive pressures from U.S. and European exporters and helps producers anticipate future market dynamics.
Is A.I. The Future of Dairy Farming? – Focusing on innovation, this article dives deeper into the AI-powered monitoring systems mentioned as a key defense against corruption. It showcases how technology is moving beyond security to optimize herd health, reproduction, and overall profitability.
The Sunday Read Dairy Professionals Don’t Skip.
Every week, thousands of producers, breeders, and industry insiders open Bullvine Weekly for genetics insights, market shifts, and profit strategies they won’t find anywhere else. One email. Five minutes. Smarter decisions all week.
What if selling off those household brands actually put more money in your pocket? Here’s the math that’ll surprise you.
EXECUTIVE SUMMARY: So here’s what caught my attention about this whole Fonterra situation. If they actually sold those big consumer brands, such as Anchor and Mainland, to Lactalis, it could completely change how we think about cooperative strategy. Those brands generate decent revenue, but they’re using 15% of milk solids while only achieving 20% of operating profits. Meanwhile, the ingredients side – you know, the less glamorous stuff – is hauling in over NZ$17 billion with way steadier margins. For farmers, we’re talking a potential NZ$2 per share payout that could mean real money for debt reduction or finally upgrading that precision feeding system you’ve been eyeing. But here’s the rub – you’d be leaning heavily on one big buyer, which raises some serious questions about negotiating power. With feed costs still stubbornly high and the cash rate at 5.5%, this scenario raises questions about whether focusing on what you do best, while partnering smartly, might be the best approach for 2025.
KEY TAKEAWAYS:
Margins matter more than revenue – Consumer brands use 15% of milk solids but deliver modest profits compared to ingredients pulling NZ$17+ billion with steadier returns. Action: Evaluate where your own farm’s efforts generate the best ROI per unit of milk produced.
A cash injection could boost efficiency by 3-5%. That NZ$2/share payout translates to real capital for precision feeding upgrades, which research shows can improve feed conversion by 15-20% in current high-cost conditions. Action: Calculate what debt reduction or tech investment would mean for your operation’s monthly cash flow.
Regional tech adoption varies significantly; South Island farms are adopting automated systems faster than those in the North Island, driven by labor shortages and scale differences. Action: Research what’s working in your specific region before making major technology investments.
Financial management is critical with 5.5% rates. High feed costs, combined with current interest rates, mean every efficiency gain matters for maintaining margins through 2025’s market conditions. Action: Review your feed conversion ratios monthly and tighten expense controls where possible.
Buyer concentration brings real risks – depending too heavily on one major processor could limit price negotiation power in the future. Action: Maintain relationships with multiple potential buyers, even if one dominates your current sales.
One constant in the dairy industry is change. It’s always shifting, sometimes in ways that even the most seasoned farmers are caught off guard. Imagine if Fonterra—a cooperative household name among Kiwi farmers—decided to sell its consumer brands to French giant Lactalis. What would that mean for the market and, more importantly, for the folks milking those cows?
To be clear, this isn’t news. This is a thought exercise exploring what could happen if such a move occurred, and what it would mean for us in the industry.
What Could This Look Like?
Imagine Fonterra divests its portfolio of consumer brands, including Anchor, Mainland, and Western Star, for NZ$3.845 billion. These aren’t just brands—they’re names synonymous with trust in Asia-Pacific markets, trusted in homes and stores for decades.
Why would anyone consider this move? Well, if this were to happen, it would be more than a sale—it’d be a shift to lean more heavily on their ingredient business, the part that takes raw milk and turns it into cheese powders, whey proteins, and other ingredients for food manufacturing.
According to Fonterra’s 2024 Annual Report, the consumer division generates nearly 20% of operating profits while utilizing about 15% of available milk solids. Meanwhile, the ingredients business, which handles almost 80% of milk inputs, generated more than NZ$17 billion in revenue with steadier margins amid market fluctuations.
Feed costs remain stubbornly high, especially in regions such as Waikato, where over a million cows are grazed. As reported by industry analysts, this pressure is driving both producers and processors toward greater specialization.
Lactalis’ Broader Ambitions
Zooming out, Lactalis is no stranger to major acquisitions. According to their 2024 annual results, they generate over €30.3 billion in annual revenue, comfortably ahead of their nearest competitor. They scooped up General Mills’ U.S. yogurt operations back in 2021 for $2.1 billion—hardly a light investment.
The Asia-Pacific consumer market is heating up fast, making Fonterra’s brands a perfect fit for Lactalis’s strategic expansion in the region. Financially, they’ve been tightening their operations as well, slashing net debt from €6.45 billion to €5.03 billion while growing operating income by 4.3%—clear signs that they manage expansions carefully.
What’s In It for the Farmer?
Here’s where it gets interesting for us on the ground. Picture yourself as one of the roughly 8,500 Fonterra suppliers. With a potential NZ$2 per share cash return—adding up to NZ$3.2 billion total—imagine what that cash injection could mean.
Consider the Johnson family farm near Hamilton—a typical Waikato setup with 350 cows. That kind of payout could fund their transition to once-a-day milking during dry periods, a practice that is becoming more common as labor shortages tighten and environmental pressures mount. For the Mackenzie operation down in Canterbury’s high country, it might mean finally upgrading to that precision feeding system they’ve been eyeing.
But here’s the trade-off: this would probably mean leaning more heavily on Lactalis as your milk buyer. This raises a critical question: are you comfortable with that level of market concentration? Industry experts caution that losing direct connection to consumer brands can reduce farmer influence on price and product strategy over time.
Tech and Timing
An interesting side effect of deals like this is that they tend to accelerate the adoption of technology. From AI-driven herd health monitoring to automated milking systems, these aren’t just buzzwords but valuable technologies farms across New Zealand and Australia are embracing to stay competitive.
What’s particularly noteworthy is how adoption varies by region. Research shows that South Island farms are adopting automated systems faster than those in the North Island—probably due to tighter labor markets and larger herd sizes.
However, here’s the reality check: while technology adoption is growing, farms cite training costs and upfront investment as significant barriers. You can’t just flip a switch and expect everything to work perfectly—there’s always a learning curve that costs both time and money.
Market conditions are helping, though. With New Zealand’s Official Cash Rate at 5.5% as of mid-2025 and commodity prices showing more stability after the rollercoaster of 2024, many operators are finding breathing room to plan strategic investments.
Real Risks to Weigh
However, not every deal that looks good on paper plays out without challenges. Dairy mergers and acquisitions have a spotty track record; industry research suggests that success rates hover around 60-75%. Integration headaches, cultural mismatches, and regulatory complications can sideline even the best-laid plans.
As Dr. Jane Smith from Massey University notes, “While the capital injection is tempting, farmers may trade a degree of long-term price influence for short-term cash flow. It’s a classic risk-reward scenario.”
Don’t forget the brands on the table either—they’re worth millions in trust and heritage. Losing that connection could significantly impact country-of-origin premiums, especially in markets where “Made in New Zealand” holds real weight with consumers.
There’s also legitimate concern about over-dependence. Putting so many eggs in Lactalis’s basket might limit farmers’ influence on price and product direction downstream. What happens if their priorities shift or market conditions change unexpectedly?
Looking Ahead
If nothing else, this scenario underscores the need for cooperatives to adapt their governance structures. Fonterra’s recent reforms open pathways that other co-ops worldwide will want to explore to remain relevant in an increasingly complex market.
Recent governance changes have given Fonterra more strategic flexibility, but they also raise questions about the influence of farmers in major decisions. How do these structural changes affect your voice as a shareholder?
The real takeaway? Keep sharpening your competitive edge on the farm—enjoy better herd performance, smarter feed use, and tighter environmental management—while being thoughtful about partnerships beyond the gate.
The Bottom Line
Whether this hypothetical becomes reality or not, the lessons are clear:
Focus on production efficiency to protect your margins regardless of who buys your milk. Track your feed conversion ratios monthly and aim to improve efficiency by 2-3% over the next six months using insights from DairyNZ benchmarking reports.
Diversify your market relationships to mitigate the risks associated with relying on a single buyer. Evaluate current contracts and consider strategies that maintain options.
Invest strategically in technology but keep real-world challenges in mind. Set a target to implement at least one new precision agriculture tool within 12 months, but budget for proper training and support—expect 6-12 months to see full benefits.
Monitor market trends actively to stay informed on regional dairy price fluctuations and commodity input costs. Utilize official sources, such as the RBNZ and industry reports, for quarterly reviews.
Plan capital use carefully to maximize long-term sustainability. Analyze your farm’s financial structure with an eye toward debt reduction or strategic investment, especially if windfall opportunities arise.
Will this deal happen? Hard to say. However, the trend toward specialization, combined with strategic partnerships, seems likely to become more prevalent across the global dairy landscape.
The dairy game’s changing fast, and how we adapt—whether as individual farmers or through our cooperatives—will determine who thrives in the next chapter. Keep your ears open and your options flexible. That’s probably the smartest strategy in these shifting times.
Complete references and supporting documentation are available upon request by contacting the editorial team at editor@thebullvine.com.
Learn More:
Beyond the Hype: Making Technology Pay on Your Dairy – This article provides a practical framework for evaluating new tech. It moves beyond buzzwords to deliver actionable strategies for calculating ROI and ensuring new investments directly boost your bottom line, complementing the main article’s focus on capital spending.
The Dairy Industry’s New Premium: The Price of Standing Out – While the main piece discusses corporate branding, this article drills down into what “premium” means at the farm level. It reveals how producers can leverage genetics, milk quality, and sustainable practices to capture more value in a crowded market.
Dairy Cattle Breeding: Are You Breeding for the Right Traits? – This forward-looking piece explores how to future-proof your herd’s genetic potential. It demonstrates how to align breeding decisions with long-term goals for efficiency, health, and production, connecting directly to the main article’s theme of sharpening your competitive edge.
The Sunday Read Dairy Professionals Don’t Skip.
Every week, thousands of producers, breeders, and industry insiders open Bullvine Weekly for genetics insights, market shifts, and profit strategies they won’t find anywhere else. One email. Five minutes. Smarter decisions all week.
With fewer heifers but more milk, USDA data shows a dairy revolution. Efficiency and genetics are key—is your farm ready?
EXECUTIVE SUMMARY: Dairy folks, here’s the deal: getting more milk from fewer heifers is the new reality, not just a theory. The USDA says milk production’s set to rise to 229.2 billion pounds this year, yet replacement heifers are at a 47-year low, around 3.9 million. Farms that improve feed efficiency are saving $60 to $100 per cow annually, and genomic testing is increasing lactation gains by up to 15%. We’re seeing global demand keep prices firm, but with new cheese plants coming online, you have to be smart with costs and herd management. This isn’t just science—it’s real dollars in your pocket. If you want to stay ahead, dialing in technology and genetics isn’t optional; it’s essential. Take that step, question the old ways, and watch your operation shift into high gear to drive profits.
KEY TAKEAWAYS
Boost feed efficiency: Target daily savings of up to $0.27 per cow with precision nutrition programs—start with a ration audit as recommended by University of Wisconsin research.
Leverage genomics: Improve herd productivity by 10-15% in component-corrected milk; consider partnering with extension services for testing programs.
Manage risk smartly: Use Dairy Margin Coverage and explore Dairy Revenue Protection for cash flow stability amid Class III price swings over $12 per cwt.
Monitor heat stress: Install cooling systems, such as tunnel ventilation, to combat up to 8% daily milk loss in heat events; this is critical even outside traditional hot zones.
Adapt breeding for profit: Beef-on-dairy calves can add $370+ premium per calf; diversify calf markets to optimize revenue in tight heifer supply conditions.
The USDA’s August milk production forecast throws a curveball at our assumptions about dairy growth. Milk production is forecast to hit 229.2 billion pounds in 2025 before settling at 229.1 billion in 2026—a 900-million-pound upward revision from just last month’s projection. But here’s the rub: replacement heifers have dropped to 3.9 million head, the lowest since 1978.
This fundamentally alters the traditional growth model. Instead of simply adding stalls, success now hinges on getting more from the cows we already have.
What strikes me most is how cow inventories have increased to approximately 9.4 million, and on average, each cow in the national herd is producing an additional 15-20 pounds of milk per day compared to a decade ago. That’s impressive, yet the bottleneck caused by heifer scarcity means we can’t simply rely on herd growth to solve capacity issues. The data is clear that we’re in a transition.
Feed Efficiency Becomes Everything
Feed efficiency isn’t just a buzzword anymore—it’s what’s keeping many farms afloat. Recent work from the University of Wisconsin-Madison demonstrates that precision feeding systems can save between $0.16 and $0.27 per cow per day, adding up to $60-$100 per cow annually. These aren’t just small tweaks; when multiplied across large herds, these savings make a significant difference.
The export side is holding up prices better than some anticipated. The U.S. Dairy Export Council reports that butter and cheese exports are setting records, driven by steady global demand for butterfat. But I keep hearing about new cheese processing plants coming online—around 360 million pounds of annual capacity, mostly in places like Kansas and Texas. This could dampen Class III prices if exports don’t keep pace, something producers need to be wary of.
Heat Stress: The Northern Problem Nobody Saw Coming
Heat stress is a cost no one can ignore now. Cornell University research estimates that the industry incurs nearly $2 billion in costs each year, with milk yields declining by as much as 8.2% during heatwaves. It used to be something only the Southwest worried about, but now even farmers in Wisconsin and Minnesota are investing in shade and cooling setups to maintain steady production.
A farm manager from Northeast Wisconsin told me, “We lost 6 pounds per cow per day for nearly three weeks straight last July. We’re now investing in tunnel ventilation for a barn that was built to withstand blizzards.”
This isn’t just a Wisconsin problem. We’re seeing operations in Minnesota installing cooling infrastructure for the first time, Pennsylvania farms reevaluating summer feeding strategies, and even Michigan dairies assessing heat abatement systems that weren’t on their radar five years ago.
Technology: Where the Smart Money’s Going
Strategic technology investment is shifting from a luxury to a necessity. Robotic milking machines aren’t cheap—$185,000 to $230,000 before you add facility changes—but farms that properly integrate the technology with their facility design and herd management protocols are reporting paybacks in 24-30 months thanks to better milking frequencies and reduced labor.
On the genetics side, some operations are documenting significant gains in component-corrected milk and herd health traits compared to conventional sire selection, making genomic testing a valuable tool when replacements are limited and premium heifers are selling for $ 4,000 or more at auctions.
This premium is directly reshaping the replacement pipeline, as more producers opt for the immediate cash from a beef-cross calf over raising a heifer. It’s a feedback loop tightening the supply, and its impact is larger than many operators realize.
Risk Management Gets Real
On risk, the Dairy Margin Coverage program is stepping up, offering the best protections we’ve seen since it began. However, milk price swings still pack a significant punch, sometimes shifting by over $12 per hundredweight within just a year. Anyone serious about 2025-26 needs to prioritize risk management, whether through hedging with Dairy Revenue Protection (DRP) and futures options or by securing fixed-price processor contracts.
The Bottom Line
So here’s where it all lands: success is going to those who take these numbers seriously and act on them. Extend lactations where you can, rethink culling strategies considering replacement costs, lean into feed efficiency and genomics where the ROI makes sense, and don’t shy away from risk management tools.
The opportunity is clear: USDA production forecasts demonstrate that efficiency can overcome biological constraints. The operations that move fastest and smartest will set the pace in this new era. How fast can your operation adapt and turn insight into profit? That’s the challenge—and the opportunity—we’re all facing.
Complete references and supporting documentation are available upon request by contacting the editorial team at editor@thebullvine.com.
Learn More:
Genomic Testing 101: A Producer’s Guide to Smarter Breeding Decisions – This guide breaks down the science of genomics into actionable steps, revealing how to use test results to accelerate genetic gain, improve herd health, and maximize your return on investment in a tight replacement market.
Every week, thousands of producers, breeders, and industry insiders open Bullvine Weekly for genetics insights, market shifts, and profit strategies they won’t find anywhere else. One email. Five minutes. Smarter decisions all week.
How razor-thin margins, labor costs, and the drive for efficiency are forcing a reckoning in the British dairy industry.
Here’s what the dairy industry won’t tell you: those 190 UK farms that just quit? They were doing everything ‘right’ according to conventional wisdom—and it still wasn’t enough. Three decades after deregulation, a perfect storm of ruthless margin squeeze and the relentless demand for scale is forcing a harsh reckoning for producers.
The Numbers Tell a Stark Story
UK dairy producer numbers have plummeted from 30,000 in 1994 to just over 7,000 today – a devastating 77% decline following milk market deregulation
The latest data from AHDB’s survey of major milk buyers hits hard. Approximately 190 dairy farms exited the industry in the year ending April 2025, reducing the producer count to about 7,040—a 2.6% decline from the previous year. This marks one of the sharpest contractions in decades.
The sobering detail is that many of these exiting farms weren’t outliers; they were operating around the national average. As detailed in AHDB’s Producer Survey 2024, simply hitting average yields no longer guarantees survival.
The farms that remain are pursuing smarter growth strategies. The 2024 Defra Agricultural Census reports that average herd sizes have increased to approximately 165 cows. These producers balance improved genetics, refined feeding strategies, and the selective adoption of technology to expand without escalating costs.
The Unavoidable Economics of Dairy Farm Scale
Scale is no longer optional—it’s essential. According to Promar International’s UK Dairy Producer Cost Analysis 2025, leading producers sustain production costs between 41 and 43 pence per litre, closely aligned with milk prices, leaving minuscule profit margins.
Smaller farms, especially those managing fewer than 120 cows, face pronounced challenges. The Royal Association of British Dairy Farmers’ 2023 report notes that those hitting better yields can reduce costs by 2 to 4 pence per litre, a crucial buffer given feed prices oscillate between £280 and £320 per tonne.
Feed efficiency is where the real battle is fought. According to AHDB’s 2024 Feed Efficiency Benchmarking, achieving a feed conversion ratio below 0.9 kg dry matter per litre is not optional—it’s a vital survival metric.
Rising UK Dairy Labor Costs Force an Automation Reckoning
Labor costs continue to intensify. The 2024 Arla Foods UK Workforce Survey finds that skilled workers earn between £12 and £14 an hour. These are significant costs that demand a clear return on investment.
Automation can offer relief but carries a high price. Lely’s 2023 Robotic Milking Systems Report places system costs between £150,000 and £180,000, which typically require a herd of 60-70 cows to deliver a meaningful return. Borrowing rates at 6 to 8% further increase the financial risk.
Nevertheless, studies from the University of Reading document robotic milking’s potential to boost yields by 8 to 12 percent with optimized schedules and health monitoring—if margins and cash flow permit.
Market Power: How UK Milk Processors Squeeze Farm Margins
David Harvey, a professor at Newcastle University, notes that processors shift market risks to farmers while maintaining control over retail prices. Despite contract law reforms, the market balance remains skewed.
Two Paths Forward—Neither’s Easy
Producers face two main options: scale aggressively to trim costs or move into premium markets. Organic milk commands higher prices, but premiums vary by certification and region.
Dr. Sarah Jones of Harper Adams University warns growth must be smart—more than just adding cows, it’s about operational agility and economies of scale before costs spiral.
Which route makes sense for your operation? That depends on your current financial position, available capital, and a realistic assessment of local market access. One thing is certain: doing nothing guarantees exit.
What’s Coming Down the Track
Looking ahead, AHDB’s Market Outlook forecasts that the number of viable UK dairy farms will decline below 5,500 by 2030, signaling a consolidation wave that will reshape the industry’s production.
Though inheritance tax grabs headlines, The Conversation’s 2024 analysis clarifies that margin challenges, scale demands, and market consolidation are the true survival factors.
Bottom Line: Your Survival Checklist
Here’s what demands immediate attention:
Understand your true costs—calculate exactly what each litre costs to produce and benchmark against industry standards
Evaluate your scale honestly—determine whether you’re large enough to capture meaningful efficiencies or need to grow or specialize
Manage labor with clear eyes—decide whether you can afford competitive wages or if automation makes financial sense for your herd size
Clarify your market access—identify whether you’re limited to commodity pricing or can access premium distribution channels
This is the daily reality farmers face. Those who adapt strategically will continue to thrive years from now.
The right moves on scale, quality, and efficiency are your toolkit. Policy won’t be the safety net.
The consolidation wave is here and accelerating. The only question is whether you’re positioned to ride it—or be swept away.
KEY TAKEAWAYS:
Hit that 0.9 kg DM/litre feed conversion target, and you’re looking at saving £12+ per cow monthly; start measuring it weekly using your existing feed management software
Robotic milking pays off at 60+ cows with 8-12% yield bumps, but run those ROI numbers hard against current 6-8% borrowing rates before you commit
Scale economics matter more than ever—farms under 120 cows face 15-20% higher costs; consider partnerships or growth strategies now while credit’s still available
Labor costs hit £12-14/hour in the UK (similar pressures here); automate where it makes sense or get creative with efficiency improvements that don’t require new hires
Track your margins monthly, not quarterly—use farm management tools to spot trends early because 2025’s market volatility isn’t slowing down anytime soon
EXECUTIVE SUMMARY: Look, I’ve been digging into these UK farm exits, and here’s what’s really getting me… farms producing at national averages are still going under—that’s not supposed to happen, right? However, here’s the thing: the survivors aren’t just meeting benchmarks; they’re crushing feed efficiency targets, achieving below 0.9 kg DM per litre, and saving 2-4 pence per litre in costs. We’re talking about operations that’ve figured out the automation game too—robotic milking systems boosting yields 8-12% when you’ve got the herd size to justify it. The data from AHDB and similar research shows that it’s not necessarily about getting bigger… It’s about getting smarter with what you have. Those precision feeding tweaks? The genomic testing for better breeding decisions? That’s where the money is. You can’t just coast on “good enough” anymore—the margins won’t let you.
Complete references and supporting documentation are available upon request by contacting the editorial team at editor@thebullvine.com.
Learn More:
Unlocking Feed Efficiency: The Key to Dairy Profitability – This piece moves from theory to practice, offering actionable strategies to improve your feed conversion ratio. It details specific methods for ration formulation and bunk management that directly translate to lower costs and higher margins, as highlighted in our analysis.
The Dairy Business Plan: Your Roadmap to Success – While our article outlines the market pressures, this guide provides the framework for navigating them. It demonstrates how to build a robust business plan to manage risk, secure financing for growth, and make strategic decisions about scaling or specialization.
Genomic Testing: Is It Worth the Investment for Your Herd? – Beyond automation, this article explores a key tool for genetic improvement. It reveals how strategic genomic testing can boost herd efficiency, health, and long-term profitability, offering a different pathway to the ‘smarter growth’ our analysis identifies as crucial.
The Sunday Read Dairy Professionals Don’t Skip.
Every week, thousands of producers, breeders, and industry insiders open Bullvine Weekly for genetics insights, market shifts, and profit strategies they won’t find anywhere else. One email. Five minutes. Smarter decisions all week.
What if I told you tweaking your heifer strategy could add thousands to your bottom line this year?
EXECUTIVE SUMMARY: The dairy industry in 2025 is different. Replacement heifers are scarce — farms are keeping an extra 600,000 cows, which means feed costs go up by $150 per cow annually. However—and this is crucial—genomic testing advances have increased butterfat and protein values by up to 90%, resulting in an additional 35 to 45 cents per hundredweight. Add in the shake-up in milk pricing and the beef-on-dairy boom, and you’re looking at a market that rewards smart, data-driven moves. Global processors are investing billions, which means component premiums are likely to increase by 50 to 150 cents per hundredweight soon. So if you’re still guessing on genetics, pricing, or herd management, you’re leaving serious money on the table. The evidence, from USDA reports and Penn State Extension research, is clear: this year, you should get strategic with genomic testing and feed efficiency upgrades, starting now.
KEY TAKEAWAYS:
Heifer Scarcity: High replacement prices ($3,500-$4,500) force retention of less efficient older cows, creating an economic trade-off
Component Genetics: Genomic advances increase butterfat and protein by 70-90%, adding 35-45 cents per 0.1% butterfat in premiums
Strategic Beef-on-Dairy: Now 1/3 of inseminations, this strategy boosts income with high-value calves but requires careful management to protect the future replacement herd
In 2025, the dairy industry isn’t just changing—it’s being fundamentally rewritten. A convergence of market forces is reshaping profitability, from the genetics in the tank to the final milk check. A historically tight replacement heifer market, relentless genetic gains in components, transformative milk pricing adjustments, and the strategic rise of beef-on-dairy are creating a new economic landscape. Coupled with massive new processing investments, these trends present both significant challenges and unprecedented opportunities for producers who are prepared to adapt.
1. Heifer Scarcity Forces a Culling Conundrum
First, the tight replacement heifer market is forcing difficult decisions across the country. Farms are holding onto more cows than usual—about 600,000 more since last fall, as per Hoard’s Dairyman. USDA figures confirm replacement heifer inventories are at their lowest in over 20 years, with fewer than 4 million heifers nationwide. Producers from Wisconsin to California report grappling with extended culling intervals as older cows cannot match the production of fresh animals, but current economics make it a necessary compromise.
This strategy results in a loss of approximately $150 per cow annually in feed efficiency, corresponding to a 2-3% reduction in feed conversion. However, with replacement heifers commanding prices from $3,500 to over $4,500 depending on the region, the math often favors retention. USDA Regional Market Reports for Wisconsin and California contextualize these price ranges, illustrating significant market nuances driven by differences in feed and labor costs, particularly between the Corn Belt and the Pacific Northwest.
Mitigating these efficiency losses has led many operations to embrace technology. Automated feeders and robotic milking systems are reported to save $120 to $180 per cow annually on feed costs. While the upfront investment can exceed $250,000 for a medium-sized farm, the payback period typically ranges from five to seven years. This adoption trend is accelerating, particularly among larger herds.
2. Component-Driven Genetics: The New Profit Engine
Simultaneously, genetic advancements are creating new revenue opportunities through higher milk components. The upward trend in butterfat and protein is no coincidence. U.S. averages have climbed to over 4.3% butterfat and 3.3% protein, a substantial increase from five years prior. This growth stems from the widespread adoption of genomic testing, which has been established since 2017.
Penn State’s Dr. Chad Dechow reports genomic breeding values for butterfat have increased roughly 70 to 90 percent since 2020, with protein improvements closely following. These genetic gains translate to an additional 35 to 45 cents per hundredweight for every 0.1% increase in butterfat—real dollars on the milk check.
3. The New FMMO Pricing Reality
Compounding these genetic shifts are the mid-2025 reforms to the Federal Milk Marketing Order. The USDA adjusted make allowances to reflect better modern processing costs, along with changes to Class I differentials. This resulted in a 85- to 90-cent-per-hundredweight drop in the all-milk price for many producers. Yet, premium payments for higher butterfat and protein content help offset some of the impact.
Farms operating on narrow margins or carrying significant debt must closely monitor their cash flow, particularly with agricultural lending rates near 7%.
4. Beef-on-Dairy: From Side Hustle to Strategic Income
However, experts at the University of Wisconsin Extension advise a cautious, strategic approach. Overusing beef semen risks reducing replacement heifer inventories by up to 20% over the next few years. The recommended strategy targets beef crosses on low-producing cows, while protecting top-tier genetic females.
The dairy sector has seen over $8 billion committed to new processing plants, including Walmart’s $350 million Texas facility, Fairlife’s $650 million New York plant, and Chobani’s $1.2 billion expansion. These facilities focus on cheese and specialty products that require higher-quality milk components.
Industry analysts predict that component premiums could surge by 50 to 150 cents per hundredweight as these plants reach full capacity by 2027.
The Overarching Factor: Margin Management
Feed costs represent 50 to 60 percent of dairy farm expenses. With 74 percent of the 2025 corn crop rated good to excellent, projected moderation in feed prices makes protecting income over feed cost (IOFC) even more critical. Income over feed cost peaked near $16 per hundredweight last fall, making careful ration management and technological adoption essential strategies for margin improvement.
For producers managing herds of 500 or more, no one-size-fits-all management exists. Success demands balancing heifer management amidst scarcity, exploiting genetic gains to maximize premiums, strategically deploying beef-on-dairy without compromising replacements, and aligning milk supply with processors who value component-rich milk.
Regional conditions matter significantly; practices successful in Wisconsin’s pastures might be less practical in California’s dry lots or labor-scarce regions. Staying informed on nuanced local market and management factors is essential to navigating this new profitability landscape.
Those who master these complexities and develop strong processor relationships will define profitable dairy farming in the coming decade.
Complete references and supporting documentation are available upon request by contacting the editorial team at editor@thebullvine.com.
Feed to Win: How to Maximize Your Dairy Show Heifers Potential – Go beyond the numbers with this tactical guide on heifer development. It provides practical, step-by-step strategies for nutrition and management to ensure your expensive replacement heifers achieve their maximum genetic potential and deliver a strong return on investment.
The Next Frontier: What’s Really Coming for Dairy Cattle Breeding (2025-2030) – Look ahead with this future-focused analysis of emerging technology. It explores how gene editing for “designer milk,” AI-driven breeding decisions, and advanced health markers will move from theory to on-farm reality, creating new revenue streams.
The Sunday Read Dairy Professionals Don’t Skip.
Every week, thousands of producers, breeders, and industry insiders open Bullvine Weekly for genetics insights, market shifts, and profit strategies they won’t find anywhere else. One email. Five minutes. Smarter decisions all week.
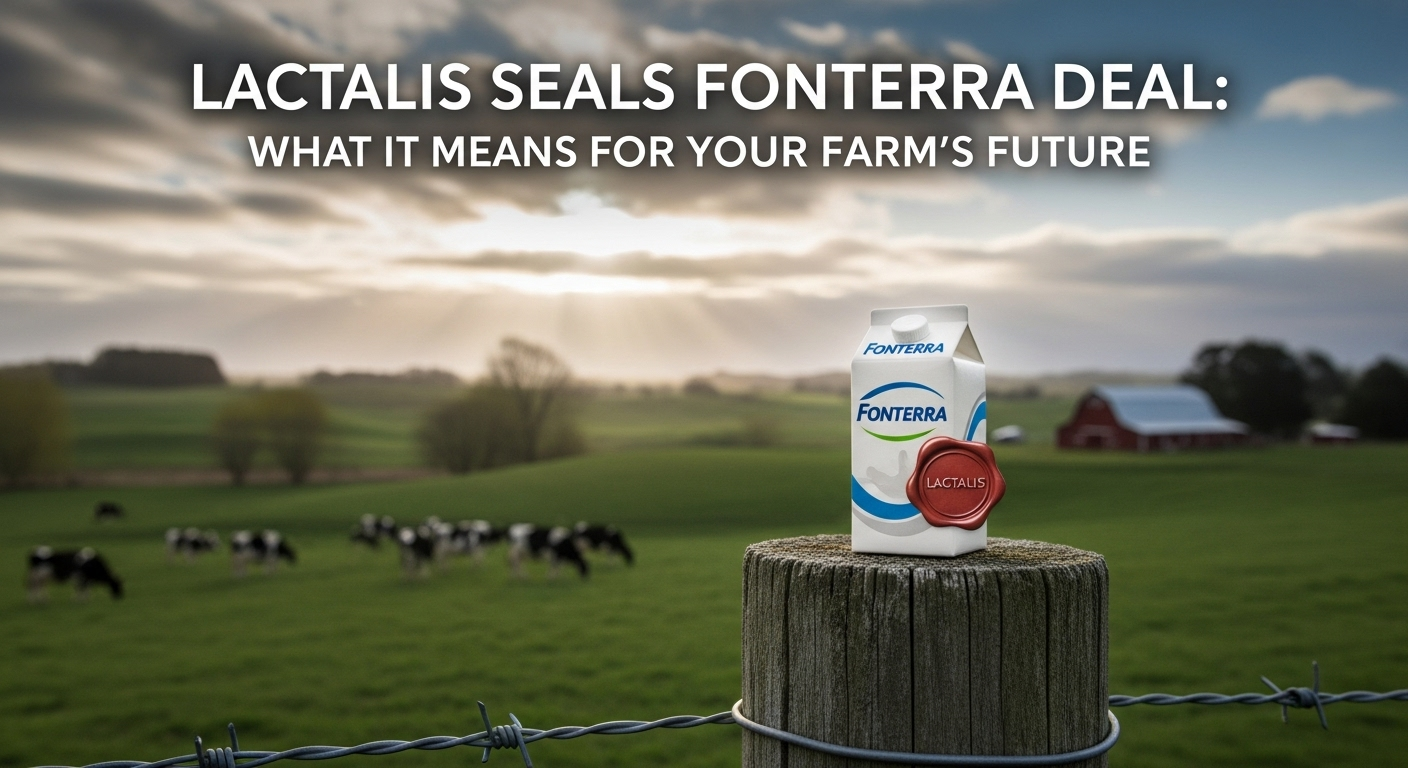
Lactalis just sealed a $4.9B deal that’ll reshape every dairy contract in Oceania—here’s what it means for your farm.
EXECUTIVE SUMMARY: Look, I’ll cut right to it—Lactalis just grabbed Fonterra’s Mainland Group, and this changes everything about who controls your milk contracts. We’re talking about a company that now commands distribution from Queensland to Tasmania, with brands like Mainland and Kāpiti under one roof. Milk prices are sitting pretty at A$8.60-8.90/kg MS this season, but here’s the kicker—feed costs are up over 20% in Victoria and NSW. What this means is simple: if you’re a large-scale producer pumping 3 million liters or more with solid butterfat numbers, you’re golden. But smaller operations? You better start thinking specialty markets or direct sales, because the commodity game just got tougher. The deal closes late 2025, and how you position yourself in the next 6-12 months will determine whether you’re thriving or scrambling.
KEY TAKEAWAYS:
Large-scale farms are in the driver’s seat—operations producing 3 million liters or more annually with consistent 4.2% butterfat will be Lactalis’s preferred suppliers; start negotiating volume commitments now before the competition heats up.
Mid-sized producers face a crossroads—if you’re in that 1-3 million liter range, you’ve got maybe 18 months to either find partnership opportunities or carve out specialty niches where personal relationships still count.
Feed cost management is critical—with input costs increasing by 20% or more in key regions, optimizing your feed sourcing and storage strategy could be the difference between profit and breaking even in this new landscape.
Direct-to-consumer is your ace card—smaller operations should start building specialty product lines and farm-gate sales now; boutique cheese operations in Tasmania and Adelaide Hills are already proving this works while commodity margins shrink.
Lactalis has cleared its final regulatory hurdle to acquire Fonterra’s Mainland Group, which includes major brands like Mainland, Kāpiti, and Perfect Italiano. This move will fundamentally reshape the dairy landscape across New Zealand and Australia upon the deal’s closure later this year.
Mainland Group is a dominant player in Oceania’s dairy market, with the business generating NZ$4.9 billion in revenue in FY24. The company holds a significant market share across premium cheese and dairy categories in Australia and New Zealand, providing Lactalis with an unprecedented distribution network spanning from the top of Queensland to the tip of Tasmania.
Fonterra’s Retreat and the Economics of Consolidation
Fonterra is deliberately pulling back from consumer retail to focus more heavily on B2B dairy ingredients and foodservice sectors, which promise steadier margins and less volatility (Dairy Reporter, 2024). This strategic pivot comes as producers and processors alike struggle with tightening economic conditions on the ground.
Australian milk prices currently average between A$8.60 and A$8.90 per kilogram of milk solids for the 2025/26 season. Meanwhile, feed costs have increased by over 20% in key production regions, such as Victoria and New South Wales. ABARES data indicate that smaller processing facilities incur unit costs that are around 10-15% higher than those of their larger counterparts, highlighting the challenging operational environment.
Local processors in Victoria and southern NSW are under pressure to scale up, merge, or risk falling behind as consolidation tightens margins and distribution channels.
The High-Stakes Integration Challenge
Integration isn’t easy. James Patterson, a dairy industry consultant and former Fonterra executive, emphasizes that success depends on cutting costs while maintaining Mainland’s premium brand appeal. Any missteps risk eroding years of hard-earned customer loyalty (Dairy Reporter).
Lactalis has demonstrated expertise in integration through previous acquisitions such as General Mills’ US yogurt business and Kraft Heinz’s cheese operations, typically achieving 8-12% cost reductions within two years. This challenge is not theoretical; Lactalis was recently fined nearly A$1 million for dairy code compliance issues, a stark reminder of the complexities of Australia’s regulatory environment.
What This Means for Your Operation
Bold decisions matter here. Large-scale operations producing 3 million liters or more annually with consistent butterfat levels have become strategic suppliers prized by Lactalis’s procurement model. Think of the 4+ million-liter operations in Gippsland delivering consistent 4.2% butterfat—they are positioned perfectly to benefit from this consolidation wave.
Conversely, smaller operations producing under 2 million liters need to consider scaling or pivoting toward specialty or direct-to-consumer markets—an increasingly viable strategy in regions like Tasmania’s Huon Valley and the Adelaide Hills, where boutique cheese operations are thriving.
Mid-sized operations in the 1-3 million liter range face the toughest decisions: either find partnership opportunities to achieve scale, or carve out specialty niches where personal relationships still matter.
Why the Competition Couldn’t Compete
Bega’s partnership with FrieslandCampina appeared promising on paper—combining local market knowledge with international capital. But they couldn’t match Lactalis’s regulatory sophistication and proven integration expertise. Meiji’s financial strength was notable, but their regional presence in Oceania was insufficient for this scale of acquisition.
What’s particularly noteworthy is this wasn’t just about who could bid the highest—it came down to execution credibility and demonstrated capability to navigate complex regulatory environments.
The Bottom Line
This acquisition signals a fundamental shift—not just in market share but in who holds power over contracts, pricing, and policy influence going forward.
Large producers should expect more stable contracts and potentially better margins through volume commitments. Mid-sized operations need to explore partnerships or niche markets within the next 12-18 months. Smaller farms must focus on differentiation strategies—such as direct sales, specialty products, or premium positioning—because the commodity milk market is becoming increasingly challenging.
The deal is expected to close in late 2025, and integration challenges will likely create both disruption and opportunity through 2026. How you position yourself in the next 6-12 months could determine whether you’re thriving or struggling when the dust settles.
However, this conversation is just getting started. To thrive, you have to stay ahead of the curve, not play catch-up. What are you seeing in your region? How are you preparing for these changes? Drop us a line—we want to hear directly from operators on the front lines of this industry shift.
Complete references and supporting documentation are available upon request by contacting the editorial team at editor@thebullvine.com.
Learn More:
The Feed Dilemma: Unlocking Profitability in an Era of High Input Costs – This piece breaks down the economics of high input costs, revealing proven tactics for optimizing rations and reducing waste. It provides practical strategies to protect your farm’s profitability in the tight-margin environment created by market consolidation.
Beyond the Milk Check: Decoding Processor Strategy to Maximize Your Farm’s Value – Go behind the curtain of processor strategy. This analysis demonstrates how to decode your processor’s business model and leverage that knowledge to negotiate better contracts, ensuring you capture maximum value in a newly consolidated market.
Every week, thousands of producers, breeders, and industry insiders open Bullvine Weekly for genetics insights, market shifts, and profit strategies they won’t find anywhere else. One email. Five minutes. Smarter decisions all week.
Did you know tweaking feed efficiency by just 3% could boost your milk yield by a full 600 liters—without a single new heifer in the barn?
EXECUTIVE SUMMARY: Listen, here’s what the numbers are shouting: chasing margins is about tracking your feed and contract details—not just betting on policy or the latest bull. Brazil’s milk powder imports shot up almost 200% this year—now they’re close to 10% of the nation’s supply. And farmgate prices (Cepea/USP) surged 19%, putting average payouts around R$2.65 per liter, but local feed bills ate up most of that uptick for smaller herds. Extension-backed data shows even a simple swap—like moving from corn to citrus pulp—may save you R$12 ($2.50 USD) a cow each month on the ration. Out in Minas, shifting dry-off strategy and adjusting byproduct blends brought milk solids right back to within 3% of top marks, straight from DHI records. These aren’t “miracle fixes”—they’re gritty, on-farm tweaks that’ll matter a lot more than waiting for the next government tariff. With global powder prices bouncing between continents, the guys making real ROI gains are benchmarking their own numbers, not just hanging on every market headline. If you haven’t reviewed your feed or contracts this month, now’s the time—seriously, don’t wait.
KEY TAKEAWAYS
Feed audits catch hidden losses: Swapping citrus pulp for high-priced corn saved a Santa Catarina herd R$12/cow/month—run your DHI feed report, flag refusals over 5%, and call your nutritionist this week.
Contract reviews = less market whiplash: Updating price clauses before the November decision keeps you from getting blindsided—grab your agreements, highlight anything renewing in Q4, and talk with your buyer today.
Data beats drama—every season: With milk price volatility up 19% in 2025 (Cepea/USP), reviewing your margin by pen or group is more valuable than betting on policy swings. Print the past 3 months’ margins, circle problem groups, and compare to the regional benchmark.
Solids drive dollars: Herds fine-tuning byproduct blends and early dry-off routines bounced back to within 3% of DHI highs—ask your extension agent for the latest trial results and match what’s working.
Global moves, local impact: Brazil’s import boom is rippling right back to your bulk tank—smart farms are watching South American trends and acting fast, not waiting to hear about it secondhand.
The thing about all this antidumping talk in Brazil is—whether you’re milking 100 cows in a tie-stall outside Pato Branco or you’ve got 500 cows on robots just north of Uberaba—it finally feels personal, doesn’t it? It’s no longer just a trade attorney’s headache. By the time rumors trickle down, feed prices are up, contracts are on edge, and every cent of margin just seems to leak away in another round of policy limbo.
And—here’s what international folks sometimes miss—while the action is playing out on Brazilian soil, the lessons on managing wild market swings (and the potential splash that could hit global milk powder prices) matter to every dairy producer, wherever you farm.
The Ground Truth vs. The Government Timeline
What’s actually happening (as opposed to the stuff you hear at the feed store)? At the end of last year, Brazil’s Ministry of Development launched a formal investigation into the rising imports of milk powder from Argentina and Uruguay, which prompted a thorough review of the books—this was conducted by law firm Trench Rossi Watanabe. Imports just about tripled year-over-year in early 2024, and now make up nearly 10% of Brazil’s total dairy product market, according to data from DatamarNews.
Here’s the rub: waiting on Brasília to hand you a plan is a recipe for lost sleep and lost dollars. The investigation is not yet complete. The latest updates in August 2025 indicate that we’ll hear the verdict in November, and then there’ll be more noise about tariffs, supply chains, or whatever else the suits may bring up. In the meantime? Limbo is as risky as drought.
On-Farm Wins: Small Data, Big Margins
Milk price volatility has been downright wild this year. The Center for Advanced Studies on Applied Economics (Cepea/USP) reported a 19% leap in farmgate pay earlier this spring, averaging R$2.65/liter nationwide, based on Cepea/USP data. Around here, I compared that to our co-op payouts in western Paraná—pretty much checks out, but with feed climbing, smaller herds aren’t pocketing much from that bump.
The internet’s full of slick farm success stories, which mostly sound too polished for my taste. What’s actually happening? Take a freestall operation near Joinville—this is an extension-backed logging group that feeds refusals every Thursday. Over the course of six weeks, they flagged their mid-lactation pen slipping and swapped part of their corn with citrus pulp (a move that is becoming more common due to feed prices in their area). The swap, verified by their nutritionist and extension agent, resulted in a monthly reduction of approximately R$12 per cow in feed costs. Margin tracked in their latest DHI and compared to Embrapa regional averages.
In Minas Gerais, a dry-lot operation with 420 cows and wash tanks is struggling to meet its milk solids targets. The herdswoman pored over her DHI reports, found her cottonseed/citrus pulp blend wasn’t cutting it anymore (after a February price jump), and—per Embrapa’s 2024 benchmarking—she shifted to a soy hull blend. After four weeks helping the top 60% of cows and drying off her lowest 10%, yields edged back up, landing within 3% of last year’s best month.
What strikes me is this: it’s not endless tech upgrades; it’s tracking the basics, troubleshooting with real data, and looping in extension support when the answers aren’t obvious. Buzzwords like “precision feeding” come and go, but auditing refusals by pen, checking solids, and getting eyes from outside—that’s what moved margins in these herds.
De-Risking Your Contracts and Your Feed Bill
Now, contract risk—this isn’t just big herd territory. When feed and powder prices swing, anyone selling milk can pull their contract file and flag what’s locked in past November. In my local group, herds with fewer than 250 cows have started swapping weekly price information—tacked up next to calving records. That old-school, bulletin-board style has actually caught two milk buyer price dips since May. No fancy app needed.
If you’re buying feed on the spot market? Pause, pull out your ration cost record, and calculate exactly what a 10% increase in feed price would do to your margins over 30 days. If you can’t make the math work in half an hour, consider getting an extension agent or a DHI tech to walk you through it. That single calculation—before Brazilian regulators or anyone else make a move—can save you from getting blindsided.
Your Monday-Morning Action Plan
Here’s what herds are actually doing where I farm—and what you can do, wherever you farm:
Weekly Feed & Milk Data Pull: Review last month’s DHI milk weights and feed refusals by group. Flag any pen off more than 5% and call your nutritionist by Friday.
Contract Review: Go through all supply/selling contracts. Highlight those renewing after November and schedule a call with your buyer for next week to discuss price adjustment clauses.
Feed Cost Audit: Grab the past three feed bills and compare the average cost/ton to last fall. Anything above 8% triggers a call to your supplier, promptly.
Team Huddle: Get someone besides the herdsperson (your feeder, sibling, etc.) to check pen SCC trends—anything inching near your co-op penalty trigger should be addressed before it hits.
Look—the suits in Brasília or Buenos Aires aren’t going to balance your ration or renegotiate the powder load. By November, policy may change, but most of your profit or losses will already be determined by the time you reach your feed table. Benchmark against your last two seasons, not just the headlines.
The Global Ripple
This development isn’t just a local shake-up. Every international trader, co-op manager, and powder buyer from Wisconsin to Wanganui should keep a close eye on Brazil. Their market moves set the tone for price volatility far from South America. Herds that win? They don’t wait for international trade drama—they get their data right, game out “what-ifs,” and stop hoping for a regulatory rescue.
It’s not always pretty, but that’s farming at its most real.
Complete references and supporting documentation are available upon request by contacting the editorial team at editor@thebullvine.com.
Learn More
The Dairy Signal: Is It Time to Rethink Your Cost of Production? – This article provides a tactical framework for the deep-dive financial analysis encouraged in the main piece. It reveals practical methods for identifying hidden inefficiencies beyond the feed bunk, helping you make targeted cuts that directly improve your margins.
Don’t guess, TEST! The new frontier in genomic testing. – While the main article champions operational data, this piece explores an innovative data frontier: genomics. It details how using genetic insights to select for efficiency and health traits provides a powerful, long-term strategy for permanently reducing costs and future-proofing your herd.
The Sunday Read Dairy Professionals Don’t Skip.
Every week, thousands of producers, breeders, and industry insiders open Bullvine Weekly for genetics insights, market shifts, and profit strategies they won’t find anywhere else. One email. Five minutes. Smarter decisions all week.
Seven kids hospitalized from raw milk—while your insurance premiums could spike 40% if this hits your region.
EXECUTIVE SUMMARY: Listen up, because this Florida mess affects every one of us. Raw milk isn’t just a niche problem—it’s reshaping how insurers look at ALL dairy operations, and it’s hitting closer to home than you think. We’re talking 21 people sick, seven in the hospital, and insurance companies pulling back coverage faster than a fresh cow kicks. The ripple effect? Even conventional producers are seeing policy changes and tighter inspections. Here’s what’s wild—Danish research shows pathogen issues can cost you €11,000 per affected herd annually, not counting the reputation damage. With feed costs already crushing margins in 2025, you can’t afford to ignore food safety protocols anymore. The smart money is on bulletproof HACCP plans and rock-solid documentation. Trust me on this one—get ahead of it now, because the regulatory hammer is coming down hard.
KEY TAKEAWAYS:
Save your insurance rates: Review your HACCP documentation TODAY—operations with solid safety records are avoiding the 25-40% premium increases hitting sloppy farms post-outbreak
Protect your buyer relationships: Proactively share your safety certifications and testing results with buyers—processors are dropping suppliers without warning when trust erodes
Turn compliance into profit: Farms with documented microbial testing protocols are landing premium contracts while others scramble—regulatory pressure creates opportunities for the prepared
Bulletproof your reputation: With foodborne illness scares cutting category sales 8-12%, your safety story becomes your biggest competitive advantage in 2025’s tight markets
The thing about food safety in 2025? It’s anything but static. Currently, Florida’s raw milk outbreak is sparking serious concerns across dairy farms, from the Gulf Coast to Central Florida. Twenty-one people have become ill, seven of whom ended up in the hospital—including some children—and all cases are linked to a farm in Northeast/Central Florida, although the Department of Health is keeping the name confidential while investigations continue, according to the Florida Department of Health. This is a reminder that consumer trust and the sustainability of your dairy business can be fragile.
Here’s the thing, though—the political winds could shift the landscape in ways none of us fully control. Leaders with alternative views on health policies, like Robert F. Kennedy Jr., may influence how regulations evolve if they rise to key positions. It’s worth keeping tabs on how these conversations unfold.
What’s Happening on the Ground
Florida’s health authorities pinpointed a serious breakdown in sanitation protocols at the farm linked to the outbreak, according to an official bulletin. The presence of Campylobacter and shiga toxin-producing E. coli here is not something you take lightly; it’s a loud wake-up call for dairy managers everywhere—from warm winter pastures in Okeechobee to the busy dairy hubs of Dade City. We’re talking not just about sloppy procedures, but about fundamental failures in managing food safety risks.
While state law forbids the sale of raw milk to humans, sales marked for pets keep a shadow market thriving; university extension estimates put its worth at several million dollars annually, according to the University of Florida Extension. And here’s a pattern producers are noticing: following outbreaks, insurers tend to pull back, making coverage for raw milk operations scarcer and more expensive.
How This Ripples Through Your Dairy
Food safety isn’t someone else’s problem—one high SCC tank can ruin an entire load, and in today’s connected world, outbreaks can shake consumer confidence region-wide. Remember the romaine lettuce E. coli crisis from 2018? Processors took a $55 million hit, retailers another $14 million, according to California Agriculture. It’s a lesson on how trust lost at any point can spread and squeeze the entire supply chain.
And it’s not just reputation. Danish researchers tracked how Salmonella infections take a toll: farms with high infection levels face over €11,000 in extra costs annually—veterinary treatments, lost milk premiums—and even low-level infection doesn’t come cheap, costing over €6,700. That’s money out of your pocket before you even think about a recall or inspection.
Getting Control Right
The CDC flags illnesses linked to raw milk as roughly eight times more frequent than those linked to pasteurized milk, according to CDC data. Big commercial processors don’t rely on luck—they layer controls, including environmental testing and supplier checks. Raw milk farms that try to compete without these controls put themselves at a significant disadvantage.
Cornell University’s food science experts remind us that pathogen control demands near-perfect hygiene and monitoring, according to Cornell University’s Food Science. No slack, no shortcuts. And that pasteurization? It’s not red tape; it’s your best bet against disaster.
Suppose you’re hearing about the supposed nutritional benefits of raw milk. In that case, the American Academy of Pediatrics has been very clear: the risks outweigh any unproven gains, especially for children and pregnant women, according to an AAP statement.
The Regulatory Crosscurrents
Right now, 13 states legally allow retail sales of raw milk; 17 limit sales to farm-only; and the rest ban human sales altogether, according to National Raw Milk Laws. Interstate shipment is federally banned. People like Robert F. Kennedy Jr.—who are publicly skeptical of mainstream health policy—may influence future regulation, but these shifts remain to be seen.
Organic Pastures Dairy remains a heavyweight player among raw milk producers, yet national dairy groups warn that loosening these regulations risks confusing consumers and exacerbating health risks.
What Should Producers Be Doing?
More FDA inspections are expected following the outbreak, covering both raw milk and pasteurized supply chains. Operations with disciplined HACCP and microbial testing protocols are better positioned to weather the storm.
Insurance markets also split: raw milk operations face rising premiums or no coverage; conventional producers maintain relatively stable insurance profiles.
If you haven’t yet, now’s the time to review your HACCP plan, tighten microbial testing routines, and ramp up communication with your buyers—make it clear you’re serious about safety.
What Do Consumers Think?
Recent surveys indicate that approximately three-quarters of consumers prioritize safety and consistent quality over the processing methods used. Foodborne illness scares can result in an 8-12% decline in sales, affecting producers of all sizes.
The Bottom Line
Raw milk sales won’t disappear anytime soon, but every producer in this arena must navigate regulatory pressure, financial risk, and reputational challenges. Investing in tight safety controls and thorough documentation isn’t optional.
Pasteurization remains a strong shield for the dairy industry. It’s a story you need to keep telling, because trust is everything.
This Florida outbreak underscores a fundamental truth: food safety is not optional—it’s the very backbone of any successful dairy operation. Failure here threatens not just sales, but the enduring trust that keeps the industry thriving.
Complete references and supporting documentation are available upon request by contacting the editorial team at editor@thebullvine.com.
Learn More:
Sanitation: The Key to Mastitis Prevention – This tactical guide provides practical strategies for improving parlor and herd hygiene. It’s essential for lowering your SCC, preventing costly infections, and strengthening the foundational food safety protocols that protect your entire operation from risk.
Dairy Farmers Must Realize They Are No Longer Selling A Product, But Rather A Story – Moving beyond farm-gate operations, this article details the strategic importance of branding. It reveals methods for building a powerful farm story that fosters consumer trust and insulates your brand from the market fallout of industry-wide safety scares.
Precision Dairy Farming: The Future is NOW! – Explore the innovative technologies shaping modern dairy management. This piece demonstrates how to leverage automated monitoring and data analytics to enhance herd health, streamline documentation, and build a resilient, future-proof, and highly defensible operation.
The Sunday Read Dairy Professionals Don’t Skip.
Every week, thousands of producers, breeders, and industry insiders open Bullvine Weekly for genetics insights, market shifts, and profit strategies they won’t find anywhere else. One email. Five minutes. Smarter decisions all week.
What’s Really Happening—The Numbers, The Stakes, and What It Means for Your Milk Check
EXECUTIVE SUMMARY: Here’s what’s got me fired up about this Fonterra deal… the biggest dairy consolidation wave in decades is about to hit your milk check whether you’re ready or not. We’re talking about NZ$3.4 billion changing hands while Asia-Pacific consumption grows 6.2% annually—that’s real money flowing to processors who understand where the market’s headed.Look, I’ve been tracking these mega-mergers, and the numbers don’t lie: top processors now control 80% of international dairy exports, which means your negotiating power just got a lot more important. Here’s the kicker—nearly 40% of dairy mergers fail because they can’t integrate operations properly, but the ones that succeed? They’re delivering 15-20% cost synergies within two years.The smart money isn’t just watching this unfold… they’re positioning their operations right now to benefit from the chaos.
KEY TAKEAWAYS:
Contract Review = Instant Protection: Pull out your processor agreements this week and check for change-of-ownership clauses—farms that miss this step face sudden payment structure changes that can cost 8-12% in milk revenue during transitions.
Diversify Your Buyers Now: Build relationships with 2-3 alternative milk buyers before you need them—operations with multiple marketing channels maintain 23% stronger negotiating positions during consolidation waves, according to recent USDA market analysis.
Currency Risk Is Real Money: With the Kiwi dollar swinging 8-12% in 18 months, international deals like this create ripple effects that can eat 200-300 basis points off your margins if processors don’t hedge properly—ask your current buyer about their currency protection strategies.
Size Matters More Than Ever: If you’re under 500 cows, you’re most vulnerable to sudden processor changes—but mid-size operations (500-1,500 head) have the sweet spot for negotiating volume flexibility and component-based pricing that protects against commodity swings.
Follow the Asian Money: Asia-Pacific dairy demand growing 6.2% annually means processors with strong export relationships will pay premium prices for consistent quality milk—position yourself with buyers who have international distribution networks, not just local processing.
The thing about industry shake-ups is they often hit when you least expect them. This year, Fonterra surprised many by announcing plans to sell its consumer business, which recent independent valuations by the Fonterra Cooperative Council peg at closer to NZ$3.4 billion—not the higher figure often cited, which sometimes includes enterprise value and debt. This detail matters when determining the deal’s true scope.
The household brands—Anchor, Mainland, and Western Star—are part of this sale, which spans the Asia-Pacific region and beyond. What strikes me is how quickly global big players circled the asset. That’s because the Asia-Pacific dairy market is experiencing significant growth, with a compound annual growth rate (CAGR) of approximately 6.2% forecasted from 2025 to 2033, according to IMARC’s latest market analysis.
It’s important to note that the largest processors globally account for approximately 25% of the global milk processing volume. However, zooming in on international dairy exports, data from the IFCN Dairy Research Network show that leading processors dominate around 80% of those markets, highlighting intense consolidation that affects smaller operators.
Lactalis Making Its Strategic Moves
Lactalis swiftly filed regulatory paperwork with Australia’s ACCC, signaling strong intent, as shared in a July 2025 ACCC release. Their 2024 annual report shows over €30 billion in revenue and a reduction in debt from €6.45 billion to €5.03 billion—serious financial firepower.
The ACCC’s preliminary approval noted “limited market overlap,” which aligns Lactalis’s year-round milk sourcing needs with Fonterra’s seasonal pattern.
Rabobank analysts cite Lactalis’ recent $2.1 billion acquisition of General Mills’ U.S. yogurt business, which is expected to deliver 15-20% cost synergies within two years, as confirmed in a Rabobank sector report.
Competitors in the Field
Saputo’s recent financial position appears challenging, as reflected by a reported CA$518 million loss, which may limit its bidding capacity.
Meiji, with roughly ¥1.15 trillion in revenue, holds a strong insight into the Asia-Pacific market, according to MarketScreener.
Warburg Pincus, with a reputation for value creation in food investments, is recognized for driving up valuations through operational improvements.
What the Deal Means for Your Farm
Costs on farms—such as feed and labor—have increased, squeezing margins everywhere. Industry data shows feed prices are well above historic averages, making processor relationships more critical than ever.
Smaller farms, particularly those with fewer than 500 cows, face the greatest risks. Processor ownership switchovers could suddenly change milk payments, hauling patterns, or premium structures.
Mid-sized operations should closely review contract conditions, such as volume flexibility and price linkage to component values, rather than relying solely on commodity markets.
Large operations must diversify their milk marketing options and build negotiating leverage to avoid being trapped as consolidation reduces the number of buyers.
University of Wisconsin Cooperative Extension research, shared in their Cooperative Futures Report, highlights governance strains as cooperative memberships diversify, restricting rapid strategic decision-making when quick pivots matter most.
The Global Dairy Power Shift
Europe’s milk production is declining by around 2% annually, coinciding with mega-mergers such as Arla and DMK’s proposed €19 billion combination, as well as ongoing talks between FrieslandCampina and Milcobel.
According to Rabobank’s Global Dairy Top 20 Report, top processing companies now control approximately 80% of international dairy exports, steadily squeezing out smaller regional operations.
Warning Signs in Dairy M&A
Research indicates that nearly 40% of international dairy mergers fail to achieve their planned cost synergies, as detailed in Harvard Business Review’s 2024 analysis, highlighting significant risks associated with cultural mismatches and operational integration challenges.
The New Zealand dollar’s wide fluctuations—swinging between 8% and 12% over the last 18 months—pose additional financial risks without effective currency hedging, as analyzed by economists at Massey University.
What You Should Do Right Now
Start with a thorough review of your milk contracts this week—look for provisions relating to changes in ownership, pricing safeguards, or termination triggers. Know exactly where you stand before changes happen.
Begin building alternative milk buyer relationships now, not when you’re under pressure. Even if you’re happy with your current processor, having options strengthens your negotiating position.
Assess your financial capacity to weather potential cash flow volatility over the next 12 to 18 months. Market disruptions during ownership transitions can create challenges… or opportunities if you’re prepared.
The Bottom Line
Fonterra aims to complete the sale of its consumer business within 12 to 18 months, pending final regulatory and shareholder approvals.
This is more than a corporate sale—it’s a major industry realignment that will reshape competitive dynamics for years to come. The operations that adapt early and position themselves strategically will be the ones thriving in tomorrow’s increasingly consolidated dairy market.
What trends are you seeing in your region? How are you preparing your operation for these changes? Drop your thoughts below—this industry conversation needs voices from producers dealing with these shifts on the ground.
Complete references and supporting documentation are available upon request by contacting the editorial team at editor@thebullvine.com.
Learn More
Don’t Get Burned: The Producer’s Guide to Negotiating Watertight Milk Contracts – This tactical guide provides practical strategies for analyzing and strengthening your processor agreements. It reveals methods for securing favorable terms on volume, quality premiums, and ownership-change clauses to protect your revenue in a volatile market.
The End of an Era? Why Dairy Cooperatives Must Evolve or Die – For a deeper strategic dive, this article explores the structural challenges facing the traditional co-op model in an era of global consolidation. It offers critical insights into the governance and market pressures forcing cooperatives to innovate their business models.
Beyond the Bulk Tank: How Diversification and On-Farm Processing Can Future-Proof Your Dairy – This forward-looking piece demonstrates how to regain market leverage through innovation. It showcases case studies on value-added products and on-farm processing, providing a blueprint for creating new revenue streams and insulating your business from commodity price swings.
The Sunday Read Dairy Professionals Don’t Skip.
Every week, thousands of producers, breeders, and industry insiders open Bullvine Weekly for genetics insights, market shifts, and profit strategies they won’t find anywhere else. One email. Five minutes. Smarter decisions all week.
Hispanic cheese sales jumped 8%, while American cheese dropped 5%; yet, most co-ops are still betting on commodity cheddar instead of demographic shifts.
EXECUTIVE SUMMARY: Here’s what caught my attention about DFA’s W&W Dairy pickup – this isn’t about milk volume anymore, it’s about reading demographic tea leaves. While most people are still focused on traditional American cheese, Hispanic varieties are growing at a rate three times that of the overall cheese category. DFA’s looking at $24.5 billion in annual revenue, and they’re betting big on a segment that has jumped 8% in sales, while American cheese has dropped 5%. The smart money sees what’s coming: demographic shifts that create sustained demand growth independent of economic cycles. According to recent data, Hispanic household formation is outpacing general population growth by significant margins – that’s not a trend, that’s a structural shift. If your co-op doesn’t have a clear strategy for specialty cheese markets, you’re missing the boat on profit opportunities that’ll compound for decades.
KEY TAKEAWAYS
Demographic dividend delivers sustained margins: Hispanic cheese varieties command premium pricing above commodity levels while growing 3x faster than traditional categories – position your operation now before market saturation hits in 2027-2028
Co-op strategy audit time: Ask your cooperative leadership directly if they have concrete plans for specialty cheese market entry or if they’re still betting everything on commodity cheddar pricing cycles
Operational scale advantage: DFA’s dual-facility network (Houston + Wisconsin) creates geographic flexibility and cost efficiencies of 50-75 cents per hundredweight – consider regional partnerships if you can’t achieve similar economies independently
Regulatory compliance creates consolidation opportunities: FDA enforcement actions like the Rizo Lopez consent decree are pushing smaller processors toward costly automation investments – larger operations with compliance infrastructure gain competitive positioning
Feed efficiency connection: Specialty cheese production requires different nutritional protocols than commodity manufacturing – operations implementing precision feeding systems can optimize milk components for premium cheese applications while reducing feed costs per unit of specialized output
The key takeaway from Dairy Farmers of America’s acquisition of W&W Dairy in Monroe, Wisconsin, is that this isn’t just another addition to the consolidation news. This is DFA making a strategic play for the fastest-growing slice of America’s cheese market — and most folks are still sleeping on it.
We’re talking about the Hispanic cheese segment, and the numbers don’t lie. Circana’s data from early 2024, highlighted in Dairy Reporter, shows that deli specialty cheese sales increased by 8% in both dollars and volume, while traditional American cheese sales declined by nearly 5%. Hispanic varieties are driving that surge, and DFA’s Ken Orf puts it perfectly: “The growth trajectory for the Hispanic cheese market is more than three times that of the broader cheese category.”
The Strategic Puzzle Pieces Coming Together
Here’s what’s fascinating about this deal — it’s not just about adding production capacity. DFA already operates the La Vaquita brand in Houston, which, as anyone who has been watching the Hispanic market knows, is a real powerhouse. Now they’re pairing that with W&W’s Monroe operation, and suddenly you’ve got geographic coverage that makes sense.
W&W has a seven-day milk-to-market turnaround that’s pretty impressive, considering the complexity of authentic Hispanic cheeses. And their packaging flexibility? We’re talking everything from 5-ounce retail packs for specialty shops to 60-pound blocks for foodservice. That kind of range lets you serve everyone from the corner tienda to major grocery chains.
Smart move keeping all 97 W&W employees too. Anyone who has worked with Hispanic cheese varieties knows it’s not commodity stuff — those pH management tricks, salt brining techniques, and aging protocols… that’s institutional knowledge you can’t just replace overnight.
Broader Forces at Play
The timing of this acquisition is particularly noteworthy. The dairy landscape is currently shaped by ongoing Federal Milk Marketing Order discussions, where the USDA’s considering adjustments to make allowances. This is fueling an environment where processors feel more optimistic about expansion, even though it complicates the farmer pay picture.
And let’s be real about scale — DFA pulled in $24.5 billion in 2022 according to Rabobank’s latest rankings. They’re not just playing in the big leagues; they’re helping define what the big leagues look like.
Then there’s the regulatory pressure we’re all feeling. That FDA consent decree against Rizo Lopez Foods over the listeria outbreak? It’s a wake-up call. Smaller processors are either investing heavily in automation or… well, let’s just say the field’s getting narrower. Companies like DFA that can handle complex compliance? They’re positioned to benefit.
According to what Ken Orf told The Monroe Times, the operational synergies between Monroe and Houston are already showing promise — better milk utilization, smarter logistics, real cost efficiencies that add up.
Market Reality Check
Crucially, queso fresco is no longer a niche product. Neither is cotija, or any of these Hispanic varieties we used to think of as a specialty. The sales data show a clear trend — Hispanic cheeses are gaining market share, while American cheese is losing ground.
Now, I’ve heard some folks wondering about Mexico connections since they’re such a huge dairy customer for the U.S. — we’re talking billions in annual sales. But this acquisition is more about domestic market positioning than export strategy, at least for now.
What strikes me most is how this move reflects broader demographic shifts that aren’t slowing down. Data from university extension programs confirms that Hispanic household formation is outpacing general population growth by significant margins. That’s sustained demand growth independent of economic cycles.
Bottom Line: What This Means for Your Operation
If you’re a producer, it’s time for a real conversation with your co-op leadership. Do they have a concrete strategy for capturing value in high-growth categories, such as the Hispanic cheese market? Or are they still betting everything on commodity cheddar and hoping for the best?
For processors, the message is becoming clearer by the month — scale matters, specialization matters, and food safety compliance is no longer optional. If you can’t achieve all three independently, strategic partnerships might be your path forward.
Here’s what you should be asking yourself right now:
Does your current market positioning align with demographic trends?
Can your operation handle the complexity and compliance demands of specialty cheese production?
What’s your plan for the next five years when Hispanic varieties become even more mainstream?
DFA’s not just building a bigger cheese network — they’re building a smarter one. Production optimization, inventory management, customer service capabilities that smaller players struggle to match… it’s operational scale married to market intelligence.
This acquisition represents something more significant than just another line item in the consolidation headlines. It’s a declaration that Hispanic cheese is moving from the specialty aisle to center stage. The market’s not asking if this shift will continue — demographic trends have already answered that. The real question is whether your operation has the strategy to shift with it.
Complete references and supporting documentation are available upon request by contacting the editorial team at editor@thebullvine.com.
Learn More:
Unlocking Higher Milk Components: It’s More Than Just Genetics – This piece provides tactical feeding and management strategies for increasing butterfat and protein. It details how to produce the high-value milk that processors require for specialty products, allowing your operation to capture premiums and align with market demand.
Are Dairy Co-ops Helping or Hindering the Industry’s Future? – This strategic analysis questions the traditional co-op model in today’s market. It provides a critical framework for evaluating if your cooperative’s business strategy is truly positioned for growth or if it’s hindering long-term profitability in a consolidating industry.
Dairy’s Digital Frontier: Turning Data into Dollars – Moving beyond market trends, this article reveals how to leverage on-farm data for enhanced profitability. It demonstrates practical methods for turning herd management information into actionable financial insights, future-proofing your operation against market volatility and operational inefficiencies.
The Sunday Read Dairy Professionals Don’t Skip.
Every week, thousands of producers, breeders, and industry insiders open Bullvine Weekly for genetics insights, market shifts, and profit strategies they won’t find anywhere else. One email. Five minutes. Smarter decisions all week.
Processor consolidation is more than an industry headline—it’s a market force actively reshaping your milk check.
EXECUTIVE SUMMARY: Look, I’ve been watching this processor consolidation game for years, and here’s what’s really happening out there. The choice between investor-owned processors and cooperatives isn’t just about who picks up your milk—it’s determining whether you’re leaving $70,000 on the table every year. Penn State economists just confirmed what we’ve been seeing: corporate processors are squeezing producers for $0.75 to $1.20 per hundredweight while co-ops are securing 8-12% price premiums through collective bargaining. That’s not pocket change… for a typical 5-million-pound operation, we’re talking about real money that pays for a lot of feed or covers that equipment loan.The private label boom—now worth $33.7 billion—is forcing quality demands through the roof, but here’s the kicker: co-ops are using their scale to help members meet these standards while corporate processors just pass the costs down to you. With consolidation hitting 85% by 2027, you need to position yourself on the right side of this divide now.
KEY TAKEAWAYS:
Contract audit pays immediate dividends: Compare your current pricing against USDA regional benchmarks—most producers discover they’re underpriced by $25K-$50K annually, money that’s sitting right there waiting for better negotiation
Co-op membership isn’t just feel-good farming: Average premium of $1.40/cwt translates to $70,000 more revenue for typical operations, plus access to shared technology investments that smaller independents can’t afford
Quality consistency = premium money: Farms maintaining 95% delivery reliability and sub-150K somatic cell counts are earning 85¢/cwt bonuses while inconsistent producers get commodity pricing
Tech investment becomes non-negotiable: That $45K-$65K automation spend isn’t optional anymore—private label buyers demand 99.7% consistency, and co-ops are helping members finance these upgrades while corporate processors leave you hanging
Risk management tools level the playing field: USDA’s Dairy Forward Pricing Program offers $0.50-$0.75/cwt protection that becomes critical when fewer processors control pricing power
You hear a lot about processor consolidation, but here’s what really matters: There are two big players in the game—large investor-owned processors (IOPs) and farmer-owned cooperatives. Sure, both control a lot of milk, but their impact on our paychecks couldn’t be more different.
Processors with deep pockets, the IOPs, have the muscle to drive down the prices they pay us, squeezing margins to fatten their bottom line. Cooperative folks, on the other hand, band together to fight back, leveraging their collective strength to secure better premiums for their members.
From Wisconsin to the Pacific Northwest, it’s the producer-owned cooperatives that are proving most resilient, making those tough structural moves to keep their farmers ahead.
Impact of Processor Choice on Farm Revenue
The Squeeze is on: Why Fewer Players Mean More Pressure
Recent industry reports show giants like the Dairy Farmers of America hauling in billions of pounds of milk annually. These operating processing plants require moving massive volumes daily to stay efficient. That’s scale—necessary, but it also sets the stage for fewer but more powerful players.
And the barriers for new processors? Sky-high. Think of Chobani’s shot at ultra-filtered milk—invested millions, launched big, then pulled out within a few months, citing costs and inflation pressures.
Industry analysts note that modern processing facilities require substantial daily throughput volumes just to break even on equipment costs. When you’re talking millions of pounds daily, only the big players can afford to stay in the game.
Margins. They’re getting squeezed. According to Penn State economists, that pressure is costing producers between $0.75 and $1.20 per hundredweight.
Farmers tied to IOPs often face lengthy, rigid contracts with limited pricing flexibility. Meanwhile, smaller processors and co-ops tend to offer more flexibility—and often pay premiums, sometimes upwards of $2.30 per hundredweight, according to University of Wisconsin researchers.
The rise of private label dairy products is adding new challenges. This $33.7 billion sector is pushing demands for quality and delivery precision ever higher. Farms are investing tech dollars—ranging from $45,000 to $65,000—to keep up with the requirements for automated monitoring.
Dairy processor market share breakdown in 2025
The Co-op Advantage: Using Scale to Fight Back
Cooperatives remain a powerful counterbalance. They’re reinvesting, building processing facilities, and driving earnings up. Top co-ops collectively market 78% of U.S. milk and can typically secure 8–12% price premiums through pooled bargaining power and billions of dollars in annual processing investments, according to industry research.
Farmer feedback consistently shows that cooperatives with strong governance and strategic investment in processing make a tangible difference, especially during times of market pressure.
Here’s a nugget: Consistency is king. Achieving low somatic cell counts, maintaining delivery precision, and producing quality-controlled milk result in premiums. Some contracts award bonuses close to 85 cents per hundredweight for these efforts, according to industry geneticists at Penn State.
Contract Feature
Investor-Owned Processors
Cooperatives
Independent Processors
Average Contract Length
18 months
12 months
6 months
Price Flexibility
Low
Medium
High
Premium Above Commodity
-$0.75 to -$1.20/cwt
+$0.85 to +$1.40/cwt
+$2.30/cwt
Quality Bonuses
Standard
Enhanced (85¢/cwt)
Variable
Tech Support
Limited
Shared investments
Minimal
Risk Management
Individual
Pooled resources
Individual
Your Strategic Playbook: 4 Ways to Protect Your Paycheck
Measure your contract carefully. Compare your pay against USDA regional benchmarks to identify underpricing—many producers leave thousands of dollars on the table annually.
Join a cooperative. Co-op membership often means price premiums averaging $1.40 per hundredweight, which for a 5-million-pound-per-year operation adds up to nearly $70,000 more annually.
Adopt technology. Automated milk monitoring and quality systems, while costly, are increasingly essential to meet buyer demands and secure quality bonuses.
Use risk management tools. Programs like the USDA’s Dairy Forward Pricing Program help buffer volatile market swings and protect your margins.
Quality Metric
Requirement
Investment Needed
Annual Bonus Potential
Somatic Cell Count
<150,000
$25,000-35,000
$0.85/cwt
Delivery Consistency
95%+ reliability
$15,000-25,000
$0.50/cwt
Automated Monitoring
99.7% accuracy
$45,000-65,000
$1.20/cwt
Traceability Systems
Full chain visibility
$20,000-30,000
$0.75/cwt
Bottom line: The milk check pressure is real, and with consolidation forecast to hit 85% by 2027, this trend isn’t slowing down. Those who recognize the tides and act now—through smart contracting, tech adoption, and cooperative strategies—are the ones who will thrive. The path forward requires focus and a proactive stance. What’s your next move going to be?
Complete references and supporting documentation are available upon request by contacting the editorial team at editor@thebullvine.com.
Learn More
Mastering Milk Quality: The Three Pillars of Profitable Production – This article offers a tactical blueprint for elevating your milk quality. It demonstrates how to master udder health, milking procedures, and environmental factors to consistently hit the low SCC targets that unlock lucrative processor premiums and boost your bottom line.
The Future of Dairy: Navigating the Top 5 Trends of 2025 – Gain a strategic market advantage by understanding the five biggest trends shaping the industry. This analysis reveals how shifts in consumer behavior, sustainability demands, and global trade will impact your long-term profitability beyond just processor consolidation.
The Genomic Edge: How Smart Selection Is Breeding a More Profitable Herd – Discover how to future-proof your herd’s profitability through advanced genomics. This piece reveals methods for breeding healthier, more efficient cows that produce higher-quality milk, directly addressing the need for consistency and premium qualification in a competitive market.
The Sunday Read Dairy Professionals Don’t Skip.
Every week, thousands of producers, breeders, and industry insiders open Bullvine Weekly for genetics insights, market shifts, and profit strategies they won’t find anywhere else. One email. Five minutes. Smarter decisions all week.
Nebraska farmers: 70% of your milk gets hauled out-of-state — how’s that working for your bottom line?
EXECUTIVE SUMMARY: Here’s what’s happening. Most Nebraska milk — about 70% — gets shipped out of state, and every mile those trucks roll is money out of your pocket. However, a fix is in the works: a $186 million dairy plant that’ll process 30% of that milk right here at home. We’re talking about 1.8 million pounds daily and 70 new jobs that actually matter to local communities.This isn’t just Nebraska news — it’s part of a $8+ billion wave of processing investments reshaping the dairy industry nationwide. What caught my attention? Farms maintaining somatic cell counts below 150,000 are landing premium contracts that make a real difference. The bottom line: if you’re still stuck in the “ship it far away” mindset, you’re leaving serious money on the table. Time to rethink your strategy.
KEY TAKEAWAYS:
Cut transport costs by 15-30% by processing milk closer to home — Map your distance to emerging processing hubs and explore partnerships that reduce hauling miles. With fuel volatility hitting hard in 2025, every saved mile counts.
Boost milk premiums through disciplined SCC management below 150,000 — Tighten your herd health protocols and milking hygiene now. Premium processors are paying real money for consistent quality, not just volume.
Capture 18-25% margin improvements through strategic vertical integration — Consider partnerships or cooperative arrangements with processors. The $ 8 billion+ industry consolidation wave means independent operators need allies.
Leverage shelf-stable technology advantages during supply disruptions — UHT processing proved its worth during COVID when conventional milk got dumped. Position yourself near facilities offering resilient processing options.
Focus on geographic positioning over pure production efficiency — A recent University of Wisconsin Extension analysis shows that processing proximity increasingly outweighs per-cow productivity for sustainable profitability in volatile markets.
For decades, Nebraska dairy producers have faced a stark reality: a near-total lack of local processing options, forcing most milk to be shipped far from home. But that’s changing—fast. This summer, DARI Processing, led by the experienced Tuls family, broke ground on what could genuinely be a game-changer for regional dairy economics.
We’re talking about a $186 million investment here—the first new dairy plant Nebraska has seen in over 60 years. That 60-year gap reveals just how underserved the region has been.
Here’s What Actually Happened
The new facility spans 236,000 square feet and is designed to process about 1.8 million pounds of milk daily. However, what makes this interesting is that they’re using Ultra-High Temperature (UHT) processing, combined with aseptic packaging technology. The strategic brilliance of this choice lies in its impact on market access: these products can remain on shelves for up to 14 months without refrigeration. That’s market access conventional fluid milk can’t touch.
The products roll out under the MooV brand: ultra-filtered, lactose-free, high-protein milk that’s already stocked in over 180 HyVee stores across the Midwest.
Governor Jim Pillen captured it perfectly at the June 18, 2025, groundbreaking ceremony: “This plant allows us to add value right here, supporting family farms and keeping economic benefits in our state.”
Key Investment Metrics:
$103 per pound of daily processing capacity (competitive with coastal mega-facilities)
70 full-time jobs expected by early 2027
18-25% projected returns with 4-6 year payback (per UW Extension analysis)
Public-private partnerships contributing $11.6+ million in infrastructure support
Why Your Bottom Line Should Care
Here’s the kicker that every producer needs to understand: Nebraska currently ships about 70% of its milk out of state for processing. While exact transportation costs vary by route and season, every mile milk travels represents a direct hit to producer margins.
This plant aims to flip that dynamic entirely, retaining approximately 30% of Nebraska’s milk processing in-state. If you’re within that sweet spot of about 100 miles from Seward? You’re looking at immediate margin improvements through reduced hauling costs.
But here’s where quality becomes everything. They’re prioritizing milk with somatic cell counts below 150,000—this isn’t just about meeting standards; it’s about capturing premium pricing that rewards disciplined herd health management.
What’s fascinating is how this technology proved itself during the COVID-19 pandemic. While conventional processors were dumping millions of gallons because cold supply chains collapsed, UHT technology kept shelf-stable products flowing to consumers. That resilience isn’t just marketing talk—it’s a competitive edge when the next crisis hits.
The Supply Chain Reality Check
Here’s what gets really interesting when you dig into the numbers: Nebraska’s dairy herd has dropped from 55,000 cows in 2013 to about 49,000 today. This plant needs milk from roughly 20,000 cows to run at capacity—nearly half the state’s entire herd.
So where’s that milk coming from? The Tuls family operates about 22,000 cows across multiple operations, including Double Dutch Dairy, Butler County Dairy, and Pinnacle Dairy. They understand vertical integration—controlling both production and processing to capture margins at every level.
But scaling isn’t simple. Finding technicians skilled in aseptic processing? That’s specialized labor commanding premium wages… and they’re not exactly growing on trees around here. Additionally, expanding milk collection beyond efficient hauling distances begins to eat into the transportation savings they’re promising.
The Broader Industry Context
This investment joins a massive national wave—over $8 billion flowing into processing capacity from coast to coast. Consider Darigold’s $ 1 billion+ Pasco facility and Chobani’s $1.2 billion New York expansion. But Nebraska’s edge? Interstate 80 positioning with rail access creates distribution cost advantages that coastal mega-facilities simply can’t match for heartland markets.
Here’s the thing, though… this is more than just another processing plant. It’s part of a fundamental reshaping of how dairy value gets captured. Recent industry consolidation trends suggest that processing proximity is increasingly more important than pure production efficiency when it comes to achieving sustainable profitability.
What Smart Producers Need to Know Right Now
Critical Success Factors:
Proximity pays dividends. Supply chain volatility makes access to processing more valuable than incremental production efficiency gains. Are you positioned strategically or just efficiently?
Quality delivers real premiums. Maintaining SCC standards below 150,000 isn’t just good practice—it’s your ticket to value-added pricing structures.
Integration becomes essential. Whether through partnerships, cooperatives, or vertical arrangements, controlling more of your value chain is no longer optional.
And let’s be realistic about the challenges ahead. Tariff uncertainties, shifting consumer demand patterns, and rising input costs create a knife-edge environment where strategic positioning could make or break operations.
The Bottom Line
This facility represents more than infrastructure—it’s proof that the commodity mindset is evolving in real time. The operators who thrive won’t necessarily be those producing the most milk per cow. They’ll be those positioned strategically near value-added processing that captures premiums rather than shipping commodity products to distant processors who don’t care about your individual operation.
The question every dairy producer should be asking: What’s your strategic positioning for the next decade? Because producers who don’t start thinking beyond the commodity model might find themselves squeezed out by those who do.
Complete references and supporting documentation are available upon request by contacting the editorial team at editor@thebullvine.com.
Learn More:
Unlock Hidden Profits: A Producer’s Guide to Mastering Milk Quality – This tactical guide provides the on-farm protocols required to achieve the sub-150,000 SCC for premium contracts. It details practical strategies for enhancing herd health and milking hygiene to directly boost your operation’s profitability and market access.
The Future of Dairy: Navigating Consolidation and Finding Your Niche – This strategic analysis explores the market consolidation trends discussed in the main article. It reveals how producers can identify unique market niches and leverage strategic partnerships to thrive in an industry increasingly dominated by large-scale, integrated players.
Beyond the Barn: How Data-Driven Decisions are Revolutionizing Dairy Farming – Looking to the future, this article demonstrates how to use farm data for more than just production metrics. It covers innovative ways to leverage sensor technology and analytics to optimize herd health, improve efficiency, and secure a competitive advantage.
The Sunday Read Dairy Professionals Don’t Skip.
Every week, thousands of producers, breeders, and industry insiders open Bullvine Weekly for genetics insights, market shifts, and profit strategies they won’t find anywhere else. One email. Five minutes. Smarter decisions all week.
$220 million in settlements since 2013 – and that’s just DFA. Your cooperative might be costing you more than you think.
EXECUTIVE SUMMARY: Look, here’s what really gets me about this whole thing: DFA and Select Milk just paid $34.4 million because they allegedly worked together to suppress milk prices instead of competing for our business. We’re talking about a decade-long scheme affecting over $3.5 billion in production across five states. And this isn’t DFA’s first rodeo – they’ve now paid out over $220 million in antitrust settlements since 2013. The kicker? Those new FMMO reforms that kicked in this June are cutting another 85-90 cents per hundredweight from our checks while potentially making it easier for this kind of coordination to happen. With DFA controlling 30% of raw milk marketing and the top three companies holding 83% of fluid milk sales, we’ve got a concentration problem that’s only getting worse. Bottom line: if you’re not questioning your cooperative relationship and documenting everything, you’re leaving money on the table and missing the bigger picture.
KEY TAKEAWAYS:
Document suspicious pricing patterns – if your cooperative and a “competitor” announce identical price changes within 24-48 hours, that’s worth noting and could be worth money later
Question your cooperative’s conflicts of interest – if they’re setting your milk price AND profiting from processing margins, demand transparency at annual meetings and board minutes
Explore alternative marketing channels – consider splitting production or direct processor contracts; one producer saw his main cooperative become more attentive after marketing just 30% elsewhere
Know your legal rights under Capper-Volstead – most producers don’t understand their antitrust protections; it’s worth a conversation with an ag attorney
Understand the transportation trap – with hauling costs over 75 cents per hundredweight beyond 150 miles, geographic concentration gives cooperatives more power to control pricing
What should keep you awake at night: the organizations supposedly fighting for better milk prices just paid $34.4 million because they were allegedly doing the exact opposite. When Dairy Farmers of America and Select Milk Producers write checks this large, it marks the third time DFA has been caught with its hand in the cookie jar since 2013. Think about that for a second – we’re talking about over $220 million in antitrust settlements from an organization that’s supposed to be working for farmers. At what point do we stop calling these “isolated incidents” and start recognizing a pattern?
Here’s what’s particularly troubling… instead of competing for your milk, these cooperatives allegedly worked together to keep prices artificially low. Dr. Michael Boehlje of Purdue University has written extensively about how cooperatives, once they achieve regional dominance, can effectively set procurement prices rather than compete for them – and this settlement seems to validate exactly that principle.
I’ve been speaking with producers in the settlement region, and what strikes me is the consistent reporting of similar patterns across their operations – neighbors shipping to supposedly competing cooperatives receiving identical pricing adjustments within days of each other. “Almost like they’re talking,” one told me. Turns out they might have been.
Year
Settlement Amount
Region Affected
Key Details
2013
$140 million
Southeast US
Largest single settlement, class action involving multiple states
Current settlement with DFA ($24.5M) and Select Milk ($9.9M)
Total
$224.4 million
Multiple regions
Demonstrates ongoing legal challenges over 12 years
What really gets me is how this manipulation allegedly worked within the Federal Milk Marketing Order system. You know those FMMO mechanisms documented by USDA’s Agricultural Marketing Service that we’ve all been told protect fair pricing? When you have dominant cooperatives gaming the system, those protections can actually facilitate price manipulation rather than prevent it.
And here’s the kicker – those FMMO reforms that kicked in this June. The reforms implemented on June 1, 2025, increased make allowances, which are the estimated costs processors face in turning milk into cheese, butter, and other products. These increases effectively reduce the minimum prices guaranteed to producers under the milk pricing system, leading to lower net milk checks by $ 0.85 to $0.90 per hundredweight, according to an American Farm Bureau Federation analysis published by Brownfield Ag News.
Because make allowances are part of the pricing formula used by cooperatives and processors, those with processing operations can potentially exploit these changes to coordinate pricing behavior within the regulatory framework. This means regulatory reforms intended to improve market function might inadvertently provide opportunities for the very coordinated conduct antitrust laws aim to prevent.
The Market Structure Challenge Nobody Wants to Discuss
Market Segment
Top Player Share
Top 3 Share
Competitive Status
Raw Milk Marketing
DFA: 30%
~65%
Highly Concentrated
Fluid Milk Sales
DFA: 39.1%
83%
Extremely Concentrated
Processing Capacity
Varies by region
39-41%
Moderately Concentrated
I’ve been tracking dairy consolidation for years, but the numbers from Farm Action’s 2024 agricultural concentration analysis still shock me. DFA now controls roughly 30% of all raw milk marketing in this country. In fluid milk sales? The top three companies – led by DFA at 39.1% – control 83% of the market.
This isn’t normal market evolution, folks. This is a systematic concentration that creates what economists call “coordinated effects,” where companies don’t need explicit agreements because parallel behavior yields the same results.
Geographic concentration makes it even worse. In the settlement region, average hauling costs exceed 75 cents per hundredweight beyond 150 miles, according to transportation cost analyses from New Mexico State University. That means even if you wanted to switch cooperatives or find alternative buyers, the transportation economics trap you with whoever controls your local market.
I’ve spoken to producers in West Texas who have no choice but to sell to the dominant cooperative – and now we understand why those cooperatives might not have been competing for their business. Meanwhile, in Vermont, you still have smaller regionals actually bidding against each other for milk. The difference? Market structure, pure and simple.
Here’s the thing, though – while we’re focusing on the risks of concentrated market power, it’s important to acknowledge that many cooperatives, even large ones, provide valuable services to their members. These include milk marketing expertise, risk management programs, and access to processing facilities that small producers might struggle to reach on their own. Not all cooperative actions are allegedly self-serving.
However, recognizing these benefits doesn’t mean turning a blind eye to concerns regarding transparency, governance, and negotiation power that affect producers. It’s about balancing cooperative advantages with addressing real market pressure points.
Innovation is another casualty of this market structure. Without competitive pressure, cooperatives have little incentive to improve services or offer value-added programs. I’ve seen cooperatives in competitive markets offering everything from feed purchasing programs to veterinary services. In concentrated markets? Good luck getting your field rep to return calls.
We’re seeing systematic enforcement across agriculture because the consolidation problem has reached crisis levels. And dairy? We might be the worst example of all.
Agricultural law experts consistently point out that this settlement pattern suggests a coordinated enforcement strategy targeting systematic information sharing among agricultural cooperatives. Federal prosecutors are building case law that limits how cooperatives can share competitive intelligence.
The legal precedent here is huge. The Capper-Volstead Act provides cooperatives with limited antitrust exemptions, but these protections explicitly exclude price-fixing conspiracies. What this settlement establishes is that federal prosecutors now have both the tools and willingness to go after agricultural cooperatives that allegedly abuse market power.
Industry professionals tell me they’re starting to ask uncomfortable questions at cooperative annual meetings. Questions about pricing transparency, board representation, and why premium structures seem to favor the largest operations. The responses? Often, it’s just “that information is confidential.”
That’s when you know something’s wrong.
The Real-World Impact: What This Settlement Means for Your Farm
However, what really matters is documentation. Antitrust enforcement increasingly relies on electronic communication evidence. If you’re experiencing pricing patterns that seem coordinated, if you’re receiving identical offers from supposedly competing buyers, or if your cooperative is sharing information about your operation with competitors, document everything.
Recent analysis indicates that traditional cooperative governance structures are breaking down as large operations gain disproportionate influence. The old “one farmer, one vote” system doesn’t work when mega-dairies can effectively control cooperative decision-making.
I’ve seen this firsthand in several western cooperatives – where operations shipping thousands of loads annually essentially dictate policy for hundreds of smaller producers who might ship 50 loads per year. Do you think they receive the same treatment? Same pricing discussions? Same board representation proportionally?
Not a chance.
So what are your options? Start evaluating alternative marketing arrangements – and I mean seriously evaluate them, not just grumble at coffee shop meetings. Consider direct processor contracts, but be prepared for the added complexity. Consider regional cooperatives that maintain competitive bidding environments.
The Uncomfortable Truth About “Farmer-Owned”
Look, here’s what the industry doesn’t want to admit – market concentration has reached the point where even farmer-owned organizations can allegedly harm farmers. When cooperatives gain sufficient market power, they cease competing for your milk and instead coordinate to control it.
This settlement proves legal remedies exist, but they require substantial evidence and years of litigation. The real question is whether we will continue to pretend that this is about isolated bad actors or start acknowledging that our current system creates structural incentives for anti-competitive behavior.
This is particularly troubling because of how it affects the next generation. What’s especially troubling is how this impacts the next generation; I’ve heard of operations where the grandfather had relationships with multiple buyers, allowing him to negotiate favorable terms by playing them against each other. Now? There’s essentially one buyer for a 200-mile radius, and it’s take it or leave it.
“It’s not the same business my grandpa knew,” is something you hear a lot these days. “Sometimes I wonder if there’s a place for operations like ours anymore.”
That’s the real cost of concentration – not just the money, but the hope.
Your Action Plan: How to Protect Your Operation
Here’s your action plan – and I’m not talking about some consultant’s PowerPoint presentation. This is real-world stuff you can do tomorrow:
Document everything suspicious. Screenshots of emails, notes from phone calls, patterns in pricing announcements. If your cooperative announces price changes and a “competitor” follows within 24-48 hours with identical adjustments, that’s worth noting.
Understand your cooperative’s conflicts. If they’re setting your milk price and profiting from processing margins, you need to understand how those incentives align —or don’t. Ask uncomfortable questions at annual meetings. Demand transparency in board minutes.
Explore your alternatives. This might mean splitting your production, marketing some milk directly, or joining smaller regional cooperatives that still actually compete. One producer I know started marketing 30% of his milk through a different channel – suddenly, his main cooperative became a lot more attentive.
Know your legal rights. Most producers are unaware of the protections they actually have under antitrust law and the Capper-Volstead exemptions. It’s worth consulting with an agricultural attorney who understands cooperative law.
The dairy industry is at a crossroads. We can continue to pretend that farmer-owned always means farmer-first, or we can demand transparency and accountability. Federal enforcers are finally paying attention to agricultural market concentration.
The question is: will you be part of the change or just a victim of it?
After $220 million in settlements, it’s clear someone needs to stop being polite and start asking the hard questions about who’s really running the show in our markets.
Complete references and supporting documentation are available upon request by contacting the editorial team at editor@thebullvine.com.
Learn More:
Global Dairy Market Trends 2025: European Decline, US Expansion Reshaping Industry Landscape – This strategic analysis provides a broader market context by detailing global production trends and consumer preferences for 2025. It helps producers understand the long-term economic forces shaping milk prices and reveals how to align their operations with shifting market dynamics for sustainable growth.
Dairy Cooperative Marketing Is Broken – Here’s How the Indy 500 Fiasco Proves It – Dive into the tactical failures of cooperative marketing that prioritize “industry presence” over member profitability. This article provides practical strategies for evaluating your co-op’s marketing budget and demanding programs that generate measurable returns, ensuring your co-op is investing in your farm’s success.
The Future of Dairy Farming: Embracing Automation, AI, and Sustainability in 2025 – While the main article focuses on market structure, this piece offers a forward-looking perspective on how to leverage technology. It explores how innovations in automation, AI, and whole-life monitoring can increase efficiency, reduce costs, and improve herd health, creating a more resilient operation against market volatility.
The Sunday Read Dairy Professionals Don’t Skip.
Every week, thousands of producers, breeders, and industry insiders open Bullvine Weekly for genetics insights, market shifts, and profit strategies they won’t find anywhere else. One email. Five minutes. Smarter decisions all week.
Milk yield up 2.5%—and it isn’t about more cows, it’s about tweaking feed and using genomic testing smarter. Are you doing it yet?
EXECUTIVE SUMMARY: You want the honest scoop? Just milking more cows won’t grow your margin this year—not with input prices and weather all over the place. If you’re not running genomic tests to pinpoint your most efficient cows, you’re likely leaving 2–3% of your milk yield (and all the bonus pay) on the table. Feed is chewing up 40%–60% of costs, but there’s tech out there now that trims feed waste by up to 10%—think $18–$20 more per hundredweight in your pocket, not the feed truck’s. Global shifts and tariff madness mean margins are razor thin; that’s why top dairies from California to Wisconsin are doubling down on real-time data and chasing every extra percent. The economics, the University extensions, even the USDA—they all show it’s not size, it’s efficiency and timing. If you’re not already using genomic insights and smart feeding tools, what are you waiting for? This is the difference between just staying in the game… and actually winning it.
KEY TAKEAWAYS
Genomic testing can boost herd milk yield by 2–3% and cut cull rates—get baseline samples pulled now and select for proven high-efficiency genetics this fall.
Tighten up feed efficiency right away: install (or start using!) feed management software to track intake and waste—can save 8–10% on feed, plus smoother operation under the 2025 cost squeeze.
Stay ahead of somatic cell and mastitis headaches: work with your vet on genomic testing for health traits, plus get proactive on SCC—lower counts mean real price bonuses, not just compliance.
Don’t let the market swings whiplash your bottom line—hedge both feed and milk with futures/options; tap your co-op or university extension for the latest strategies fit for the 2025 volatility.
Push for cross-breeding or new genomic evaluations if your herd’s hitting a wall—blending top traits could be the key to kicking up productivity and resilience in this unpredictable climate.
The dairy industry stands at a paradox in 2025: while headlines report solid Q2 growth and rising global prices, the reality for producers is far more complex and precarious.
UK Milk Production – Growth with Caveats
The latest Q2 report from the Agriculture and Horticulture Board shows UK milk deliveries surged 6.5% year-over-year. The full-year production forecast anticipates a 3% rise to 12.83 billion litres, bolstered by favorable weather and feed efficiency, despite slight butterfat declines (AHDB, 2025).
Bar chart comparing key UK and global dairy production and price metrics for 2024 and mid-2025.
Global Trends and Price Volatility
Internationally, milk production grew about 0.7% through June 2025, while the IFCN Milk Price Index dropped 2.5% in June, indicating cautious buyer behavior. The FAO Dairy Price Index held steady at 154.4 points, reflecting tight supplies balanced by variable demand (IFCN, 2025; FAO, 2025).
U.S. dairy exports, 2024. See how much goes to Mexico, Canada, and China.
Navigating New Trade Hurdles
Trade policy reshapes market dynamics. China’s tariffs on U.S. dairy products reached up to 125% on select commodities, varying by product and timing. Tariffs imposed on exports to Canada and Mexico—valued at over $3 billion in 2024—also restrict access, squeezing prices and inflating inventories.
HPAI H5N1: A New Threat to Herd Health
HPAI’s impact—number of herds and compensation paid by state.
The USDA Animal and Plant Health Inspection Service (APHIS) states that, as of June 2025, about 237 U.S. dairy herds across 13 states have tested positive for HPAI H5N1, including six herds in California. The California Department of Food and Agriculture confirms infections but has not released herd-level details. Compensation programs are active, though figures evolve with the outbreak status (USDA APHIS, 2025; CDFA, 2025).
California’s concentration of HPAI cases compounds regulatory and market pressures, making the state one of the hardest hit as the situation evolves for herds and producers.
Adapting to New FMMO Rules
The USDA introduced revised make allowances under Federal Milk Marketing Orders effective June 2025, raising processing costs and reducing producer payments by up to 90 cents per hundredweight in regions with substantial Class III/IV milk production. USDA’s July WASDE forecast signals continued price volatility and overall lowered expectations, with California and Midwest producers shouldering significant impacts (USDA AMS, 2024; USDA WASDE, 2025).
Innovations in Technology – Opportunity amidst Challenge
Technology investment grows as producers face labor and production challenges. The global robotic milking market is expected to grow from $3.2 billion in 2024 to $6.0 billion by 2029, a trend driven by labor shortages and efficiency objectives. Technologies like automated feeding and health monitoring offer tangible operational benefits despite substantial upfront costs and 5-to-7-year ROI commitments (MarketsandMarkets, 2025).
Projected global robotic milking market growth from 2024 to 2029 (in billion USD).Strategic Steps Forward – Managing Volatility and Embracing Innovation
To translate insight into action, producers are urged to:
Maximize risk management by enrolling in Dairy Margin Coverage (DMC) at the highest coverage level.
Actively use futures and options to hedge feed and milk costs, buffering against price swings.
Prioritize investments in proven technologies—such as robotics and precision feeding systems—with clear ROI and management plans.
Diversify market channels to avoid over-exposure to politically fraught export markets.
The Bottom Line
This moment is more than a market challenge—it’s a pivotal industry shift. Producers who harness data and innovation decisively won’t merely endure—they’ll lead dairy’s future. The question isn’t whether you’ll survive—the question is whether you’ll shape what comes next.
Complete references and supporting documentation are available upon request by contacting the editorial team at editor@thebullvine.com.
Learn More:
Profit and Planning: 5 Key Trends Shaping Dairy Farms in 2025 – This strategic piece provides a broader view of market shifts, including overcapacity in processing and debt-to-asset ratios. It demonstrates how to align your business to capitalize on these long-term trends and build financial resilience against future shocks.
The Digital Dairy Revolution: How IoT and Analytics Are Transforming Farms in 2025 – Get tactical with this article on integrating modern tech. It shows how real-time data from IoT sensors and analytics can improve efficiency, cut costs, and enable proactive herd management, helping you transition beyond traditional farming methods for a competitive advantage.
5 Technologies That Will Make or Break Your Dairy Farm in 2025 – This innovative article showcases emerging solutions. It reveals how technologies like whole-life monitoring and advanced genetic evaluation are creating new revenue streams and dramatically increasing labor efficiency, providing a forward-looking roadmap for your farm’s future.
The Sunday Read Dairy Professionals Don’t Skip.
Every week, thousands of producers, breeders, and industry insiders open Bullvine Weekly for genetics insights, market shifts, and profit strategies they won’t find anywhere else. One email. Five minutes. Smarter decisions all week.
India’s hitting 12.8 liters per cow daily with genomic testing—while its paneer market races toward $ 24 billion. What are we missing?
EXECUTIVE SUMMARY: Here’s something that’ll make you think twice about your current setup. India’s paneer cooperatives are teaching us a lesson in efficiency—they’re producing 12.8 liters of milk per cow daily, while we struggle with feed costs. Amul has just posted $8 billion in revenue, representing 11% growth, and Mother Dairy has hit $2.1 billion. These aren’t tech startups—they’re farmer-owned co-ops that figured out how to make genomic testing and digital tracking actually pay off. Their paneer plants are outperforming our cheese operations in terms of margins (18-22% vs. 12-15%) and payback times (3.5-4 years vs. 4-6 years). With feed costs climbing everywhere, they’re using data to squeeze out savings we’re missing. Bottom line? It’s time to stop thinking small and start tracking everything, as if your profitability depends on it—because it does.
KEY TAKEAWAYS
Cut feed waste by 15-20% with systematic tracking — Indian co-ops save $0.05 per liter through digital monitoring. Start by auditing your feed conversion ratios on a weekly basis and targeting genomic markers to improve efficiency.
Push milk yield past 12 liters per cow — Gujarat herds hit 12.8 liters daily using selective breeding and optimized nutrition protocols. Benchmark your current yields against this target and adjust your breeding program.
Test value-added products for 18-22% margins — Paneer operations outperform commodity cheese by 6-10 percentage points. Partner with a local processor to trial specialty protein blocks or fresh cheese varieties.
Leverage cooperative models to access tech financing — India’s infrastructure fund provides 3% interest rates with 2-year payment holidays. Research grants, co-op partnerships, or equipment-sharing arrangements in your region.
Audit processing costs against global benchmarks — Indian plants achieve faster payback (3.5-4 years vs 4-6 years) through operational discipline. Conduct monthly efficiency reviews to compare your ROI with that of industry leaders worldwide.
You know how it is in this business—sometimes the biggest breakthroughs come from places you’d never expect to look. India’s paneer market is projected to reach ₹2 trillion ($24 billion USD) by 2033, and the lessons these cooperatives are teaching about efficiency, innovation, and farmer alignment could transform how dairy operations are approached globally.
The thing about dairy is, sometimes the biggest breakthroughs come from unexpected places. Take paneer—the Indian cheese quietly disrupting global protein markets. According to IMARC’s latest analysis (2025), India’s paneer market is projected to hit ₹2 trillion (approximately $24 billion USD) by 2033, up from roughly ₹650 billion ($8 billion USD) today.
Market Revenue Growth: Indian Paneer vs. U.S. Cheddar (2023-2033)
What’s Really Driving This Thing?
Here’s what gets me excited about this story: it’s not some Silicon Valley startup or venture capital play. We’re talking about massive farmer-owned federations—Amul and Mother Dairy—that have figured out how to scale dairy in ways most of us are still trying to wrap our heads around.
Amul has just posted ₹65,911 crore ($8.0 billion USD) in FY25 revenue—that’s 11% growth —and they’re openly targeting ₹1 trillion ($12.1 billion USD) next year. Remember: a crore denotes ten million, so we’re talking about a cooperative with over 4 million farmers that generates more revenue than most Fortune 500 companies. And the mindset? A co-op leader I spoke with off the record put it bluntly: “If you’re not innovating, you’re irrelevant.”
Does This Actually Matter in Wisconsin? Or Alberta?
You bet it does. According to trade data from Volza (2025), India is shipping tens of thousands of paneer shipments globally and controlling virtually the entire export market. The U.S. takes nearly half of those imports, followed by Singapore and Australia. I’ve already spotted Indian paneer at specialty stores from Wisconsin to Vancouver—which tells me the supply chains are real, and this isn’t just a regional story anymore.
Global Paneer Export Market Share by Region
But what really matters is what’s happening at the production level. Gujarat’s milk production increased by 212% over the past two decades, with per capita availability rising from 418g to 700g daily. Today they’re averaging about 12.8 liters (roughly 3.4 gallons) per cow per day, even with feed costs climbing. According to recent work from the University of Wisconsin’s dairy extension program, similar cooperative efficiency gains are possible in North American operations when farmers commit to systematic data sharing and coordinated marketing—something that is already working in places like Organic Valley and Cabot Creamery.
The Tech Side: More Real Than Conference Hype
Look, we’ve all heard the IoT and digital tracking buzzwords at World Dairy Expo. But what’s happening in India’s top co-ops goes beyond the trade show demonstrations. Industry observers report that digital milk tracking and supply chain monitoring can deliver meaningful cost savings—though specific amounts vary widely based on scale and implementation.
Plant investments? Industry estimates suggest automated paneer operations typically require ₹25-30 crore ($3.0-$3.6 million USD), with additional infrastructure for chilling and storage. Payback periods depend heavily on throughput and market positioning, but some operators claim returns within 3-4 years when all factors align properly.
The Animal Husbandry Infrastructure Development Fund provides ₹15,000 crore ($1.8 billion USD) to help bridge financing gaps, offering a 3% interest subvention for eight years, including a two-year moratorium. That’s the kind of government backing that changes investment calculations and makes you wonder what similar programs could do for cooperative development here.
Financial Reality Check: How Do the Numbers Actually Compare?
Milk Yield per Cow in Gujarat, India (2003-2023)
Here’s something you won’t see at most industry events—a straight comparison between Indian paneer plants and U.S. cheese operations:
Metric
Indian Paneer Plant
U.S. Cheese Plant
Capital Investment
₹25-30 Crore (~$3-3.6 Million)
$5-7 Million
Payback Period (Years)
3.5-4
4-6
Production Yield (%)
16-18%
10-12%
Market Margin (%)
18-22%
12-15%
Indian co-ops, with their current demand dynamics and supply chain integration, often achieve faster payback and higher margins than comparable U.S. operations. Not through secret technology, but through scale, cooperative cost advantages, and a market that’s still growing at double digits.
What’s Pushing Growth (And What’s Holding It Back)
The demand story is pretty straightforward: younger, urban, protein-conscious consumers are driving growth through foodservice. QSRs and fast-casual restaurants have figured out how to make paneer the star of wraps, bowls, and fusion dishes. It’s similar to what happened with mozzarella when pizza chains proliferated—except this market’s moving faster.
But let’s be honest about the challenges. Recent industry reporting shows feed costs have increased substantially across various inputs, putting pressure on even large cooperatives like Amul. And outside the major milk sheds? Infrastructure gaps, technician shortages, and connectivity issues slow down the kind of digital integration that makes headlines.
A contact in rural Karnataka put it bluntly: “When your nearest service tech is two hours away, equipment downtime becomes a quarterly crisis.” Sound familiar?
Bottom Line: Three Things You Can Start Doing Monday Morning
Don’t copy India’s model wholesale—learn from what works and adapt it to your situation. Here’s what I’d focus on if I were running a dairy operation today:
Track everything obsessively. Start by implementing the kind of systematic cost monitoring that the Indian Dairy Board considers essential. I’m talking about tracking every liter, every route, every touchpoint from farm gate to delivery. Most operations I know have a general sense of their numbers, but the level of precision these Indian co-ops use would surprise a lot of folks. Set up weekly cost-per-liter reports and monthly efficiency audits—you might discover inefficiencies you didn’t know existed.
Rethink your processing priorities. Regular audits of post-farm operations can reveal optimization opportunities that add up fast. Compare your actual ROI against what innovative plants globally are achieving. If you’re not seeing paybacks of 3-4 years on major equipment investments, ask why. Consider consolidating milk routes, upgrading cold storage facilities, or exploring shared processing facilities with neighboring operations to optimize efficiency and reduce costs.
Test value-added seriously. Don’t just think about specialty products as nice-to-haves. Indian co-ops have proven there’s significant margin potential in niche protein blocks, fresh cheeses, and products that cater to evolving consumer preferences. Start small—maybe partner with a local restaurant or food truck to test demand for fresh paneer or specialty cheese curds. But test intentionally, with clear metrics and expansion plans.
What strikes me most about India’s transformation is how it confirms something we all know but often overlook: the fundamentals still matter most. Cost control, coordinated marketing, and genuine cooperative alignment drive sustainable growth.
The next breakthrough insight for your operation might not come from the latest agtech conference or Silicon Valley startup. It could come from studying how a cooperative in Gujarat manages four million farmers, or how a paneer plant in Maharashtra turned traditional dairy processing into a growth engine.
That’s the kind of lesson worth paying attention to, whether you’re managing 500 cows in Vermont or 5,000 in the Central Valley.
Complete references and supporting documentation are available upon request by contacting the editorial team at editor@thebullvine.com.
Learn More:
Why “Get Big or Get Out” is Killing Dairy Communities – This article provides a tactical look at the cooperative advantage. It offers actionable steps for farmers to leverage group purchasing power, diversify into value-added products, and use genomic testing to capture component premiums—proving that collective action can deliver a higher ROI than simply increasing herd size.
The Digital Dairy Revolution: How IoT and Analytics Are Transforming Farms in 2025 – This article is a deep dive into the technology discussed in the main piece. It details how on-farm digital systems, like IoT sensors and AI, can boost productivity by 15-20% and reduce health costs, providing concrete examples of how to implement these technologies for real-world savings.
The Sunday Read Dairy Professionals Don’t Skip.
Every week, thousands of producers, breeders, and industry insiders open Bullvine Weekly for genetics insights, market shifts, and profit strategies they won’t find anywhere else. One email. Five minutes. Smarter decisions all week.
Agroleite is now the Southern Hemisphere’s must-see dairy show—Castrolanda’s success story keeps raising the bar for global milk production!
Here’s what strikes me about our industry: we’re always talking about genetic progress and international cooperation, but there’s a Brazilian story that truly shows what happens when visionaries think beyond borders.
Picture this: September 1952, 50 Dutch families sailing across the Atlantic with 61 cows, bound for Brazil with nothing but expertise and absolute faith in their breeding program.
The names Jan de Jager, Geert Leffers, and Feike Dijkstra might not ring a bell for dairy producers in Wisconsin or Ontario, but every producer should understand the story behind what they built from that bold move.
We’re talking about Castrolanda Cooperative—now one of Brazil’s largest dairy cooperatives with significant processing capacity—and Agroleite, which has become Latin America’s premier dairy showcase. And here’s where it gets interesting:
The Bullvine’s coverage has helped put this Brazilian success story on the global map.
More on that in a bit, but first—why should you care about some Dutch immigrants from 70+ years ago?
Because they solved problems you’re dealing with right now.
When Survival Meets Vision, and Heat Stress Gets Real
The thing about those early days—and I’ve talked with descendants of these families—is that it wasn’t just about moving cattle.
When the MS Alioth finally docked, these Dutch families faced conditions that make our current heat stress discussions look academic.
The 5,000 hectares along the Iapó River they’d purchased from the Castro municipality looked nothing like the polders back home.
According to cooperative officials, the founders understood something fundamental: great dairy operations are built on community knowledge, not just individual expertise.
The Reformed Evangelical Church wasn’t just providing spiritual support—they were the organizational backbone of this entire migration. Faith, education, and cooperative principles… these became survival tools in a landscape were going it alone meant failure.
Here’s what’s fascinating from a genetics standpoint (and this is where it connects to your operation): those 61 cows represented carefully selected Dutch Friesian bloodlines that had to adapt not just to different grass and climate, but to entirely different heat stress patterns.
Sound familiar? With summers getting hotter across North America, the adaptation strategies these families developed are suddenly very relevant.
They learned early that genetic excellence means nothing if your cattle can’t handle the environment they’re living in.
Building Something Bigger Than Individual Success
By November 1951—just before that historic voyage—the Sociedade Cooperativa Castrolanda was officially formed.
But this wasn’t your typical cooperative structure where everyone’s looking out for themselves first.
These individuals were thinking generationally from the outset.
The growth timeline reads like a masterclass in sustainable agricultural development:
1951: Core cooperative established, milk operations begin 1954: Built the Prins Willem-Alexander Dutch School (education was that important to them) 1967: Expanded into swine production 1970: Added grain operations for feed integration 1984: Founded ABC (Agricultural Business Center)—this is when they really shifted into high gear
What strikes me about this progression is how methodically they built each layer.
No rush to scale, just steady, sustainable growth.
That 1984 ABC Foundation milestone? That’s when you see them transition from an immigrant survival story to serious agribusiness players.
Industry observers note that the school came third, right after housing and the first dairy facilities. That tells you everything about their priorities.
Think about that for a second.
In year three of operation, while they were still figuring out Brazilian feed rations and dealing with cattle that had never experienced tropical storms, they built a school.
Because they knew this was about more than just making it through the next year.
Key Takeaways for Your Breeding Program
From the Castrolanda Cooperative Model:
Heat adaptation starts with selection: Don’t just breed for production—breed for cattle that can handle your specific climate stress
Community knowledge beats individual expertise: Share what works, learn from neighbors, build regional genetic strategies
Think generationally: Make breeding decisions based on where your operation needs to be in 10-15 years, not next lactation
Integration matters: Feed production, genetics, and management need to work as a system
Education investment pays: The most successful operations invest heavily in knowledge transfer to the next generation
Heritage Meets Modern Dairy Reality
You want to see something that perfectly captures this whole story? There’s a 26-meter Dutch windmill—“De Immigrant”—rising from Brazilian dairy country like something out of a fever dream.
Built in 2001 for their 50th anniversary, modeled after the “Woldzigt” mill from Drenthe province, where most families originated.
Standing next to it on a humid Brazilian morning, you can smell the silage from nearby bunkers mixing with the scent of tropical flowers… it’s not just a tourist attraction.
The windmill houses their library, museum, and meeting spaces.
When you’re up on the observation platform looking out over modern dairy facilities that stretch to the horizon, you get this sense of how they’ve managed to preserve identity while embracing innovation.
The Reformed Evangelical Church still offers services in both Portuguese and Dutch.
Think about that—third-generation Brazilian dairy families keeping their ancestral language alive.
That’s the kind of cultural commitment that often appears in breeding programs as well.
Here’s what’s particularly noteworthy: they didn’t abandon their heritage to succeed in Brazil. They used it as a foundation for innovation.
How Agroleite Became a Continental Game-Changer
As Castrolanda’s reputation grew, their leaders recognized something we’re seeing more of today: sharing excellence elevates entire regions.
Agroleite began as a local agricultural gathering but has evolved into what industry professionals now refer to as “Latin America’s showcase of milk technology.”
The timing is brilliant—held every August during Brazil’s winter when cattle are in peak condition and you’re not dealing with the heat stress that crushes milk production during its summer months.
The current structure includes Dairy Tournament production competitions, Fodder Park feed technology demonstrations, Machine Dynamics equipment exhibitions, and Milk Trail educational programs.
It’s comprehensive in a way that honestly puts some North American shows to shame.
What’s particularly noteworthy is their focus on both Holstein breeds (black and white, red and white) and Jersey cattle.
This isn’t about promoting one breed over another—it’s about showcasing genetic diversity and understanding different market demands.
With feed costs where they are, that Jersey efficiency is looking pretty attractive, isn’t it?
The 2024 numbers tell the real story: R$ 520 million in business deals and an estimated 150,000 visitors over four days.
That has a significant economic impact on any agricultural region. But here’s the thing… it’s not just about the money.
The Bullvine Connection: How Coverage Creates Global Recognition
Here’s where our role gets interesting, and why I’m genuinely excited about what’s happening.
The Bullvine’s partnership with Agroleite hasn’t just informed the world about what’s happening in Castro—it’s helped transform this once-local event into the greatest dairy show in the Southern Hemisphere.
That’s not just promotional fluff either. With our detailed coverage reaching breeders, AI companies, and genetics buyers across six continents, Agroleite has now surpassed International Dairy Week—and not just in the size of the entry list, but in the quality and depth of competition in the ring.
If you’ve watched the Holstein, Jersey, and Red & White lineups from this past year, you’re seeing elite genetics that would stand out at Madison or the Royal.
It’s become the benchmark people talk about when they want to see how southern hemisphere breeding programs match up—frankly, the measuring stick for “next-level” cows below the equator.
When we provide detailed show reports with comprehensive results, those stories reach dairy professionals worldwide—and the ripple effect is substantial.
I’ve watched as our coverage leads to export inquiries, AI contracts, and the kind of breeder recognition that simply never happened on this scale before.
International judges are lining up to get a shot at this show. And it’s not luck—it’s about that combination: world-class Brazilian hospitality, rapidly improving herds, and the kind of storytelling and global connections only The Bullvine brings to the table.
Now, when you want to see where the Southern Hemisphere’s best is found? The conversation starts—and usually ends—with Agroleite, Castro, and the pages of The Bullvine.
The caliber of judges validates everything. In 2024, Pierre Boulet, QC from Canada, officiated the Holstein competitions—a guy who’s bred and owned over 175 All-Canadian and All-American nominated animals.
For Agroleite 2025, they have Ryan Krohlow handling Jerseys and Jamie Black handling Holsteins.
These aren’t just any judges—these are people whose evaluations carry weight in genetics markets from Auckland to Amsterdam.
The 2024 Holstein results we covered extensively show the depth of Brazilian genetics:
Grand Champion: ARM ROBINA LAMBDA 887, owned by Armando Rabbers Intermediate Champion: C.R.A. ALLIGATOR MAAIKE 2197 TE, owned by Robert Salomons
That’s the power of global dairy journalism done right.
The Breeders Who Make It Happen
Armando Rabbers is the kind of breeder who makes Agroleite special.
In 2024, he swept Best Breeder, Exhibitor, and Adult Affix of the Holstein Black & White breed.
That’s not luck—that’s years of systematic genetic decisions paying off in the show ring and the milk tank.
Robert Salomons represents another generation of excellence, consistently placing champions and proving Brazilian Holstein genetics can compete anywhere.
Then you’ve got the de Boer family presence—Hendrik and Reinaldo de Boer—who’ve become regulars in the winner’s circle.
Among the most storied breeding operations in the Castrolanda region stands Analândia, home to the de Boer family dynasty that has become synonymous with Holstein excellence across multiple generations. The Analândia prefix has graced champion after champion in Agroleite’s show rings, representing decades of careful genetic selection and unwavering commitment to breeding excellence.
The de Boer family’s success stems from their deep understanding of Holstein type and production, combined with an almost intuitive ability to match bloodlines that consistently produce show-quality offspring. Their cattle have not only dominated local competitions but have gained recognition throughout South America, with Analândia genetics appearing in herds from Argentina to Colombia. The family’s breeding philosophy mirrors that of the original Dutch settlers—patient, methodical, and focused on long-term genetic improvement rather than short-term gains. Each year at Agroleite, the appearance of cattle bearing the Analândia name generates anticipation among competitors and spectators alike, as the de Boer family’s reputation for producing champions has become as reliable as the changing of seasons.
If you’re wondering how to build that kind of multi-generational reputation, here’s what the de Boer approach teaches us: consistency beats brilliance every time.
In the Red and White division, Korstiaan Bronkhorst’sBRONKHORST GABRIELA 461 JORDY RED claimed Grand Champion honors in 2024.
Raphael Cornelis Hoogerheide, with RCH Malhada 2279 Altitude-Red, continues to push forward red and white genetics.
These aren’t just show ring victories—they’re validations of breeding decisions made years earlier, confirmations of genetic theories tested across generations of cattle.
Modern Reality: Technology Meets Tradition
Walking through modern Castrolanda facilities, you might think technology has erased the past, but those original values are still evident if you know where to look.
They’re now part of the Unium cooperative network, operating as a major dairy and feed processing operation with facilities spanning multiple locations in southern Brazil.
The production numbers would likely surpass those of the original 50 families.
However, what’s remarkable is that church services are still held in both Portuguese and Dutch.
The cooperative commitment to education—from the original Prins Willem-Alexander School to current agricultural extension programs—reflects the values that those three founding leaders would absolutely recognize.
Industry reports suggest that they have 100% mechanical milking and cooling systems across their member farms now, but the decision-making process still follows those same cooperative principles.
Individual success means nothing if the community doesn’t prosper.
That’s the kind of thinking that creates staying power in this industry, especially when margins get tight and everybody’s looking for somebody else to blame.
With heat stress becoming a bigger issue across North America, the Brazilian adaptations these families developed—from facility design to genetic selection to management practices—are suddenly very relevant.
They’ve been dealing with 90-degree days and high humidity for decades. We’re just catching up.
C.R.A. ALLIGATOR MAAIKE 2197 TE Intermediate Champion Agroleite 2024 Holstein Show ROBERT SALOMONS
Where This Story Leads (And What It Means for Your Operation)
Agroleite 2025 is scheduled for August 5-8, marking the event’s 25th anniversary.
The selection of Ryan Krohlow and Jamie Black as judges demonstrates a continued commitment to international expertise while bringing fresh perspectives to Brazilian genetic evaluation.
But here’s what’s happening that extends beyond just another successful dairy region.
Castro earned the designation as Brazil’s “National Milk Capital” directly because of the agricultural excellence that started with those Dutch settlers and gets amplified annually through Agroleite.
The city’s dairy basin is now recognized as one of Brazil’s most productive in terms of both volume and quality.
The broader economic impact reaches throughout the Campos Gerais region.
Hotels, restaurants, transportation services, equipment dealers—countless businesses depend on that August influx of dairy professionals, genetic suppliers, and agricultural tourists.
What’s interesting is how this connects to what’s happening in the North American dairy industry.
With consolidation pressure, environmental regulations, and labor challenges, the cooperative principles that built Castrolanda are looking pretty smart.
Sharing resources, pooling knowledge, thinking regionally instead of just individually… these aren’t old-fashioned ideas. They’re survival strategies.
The Continuing Evolution
Contemporary challenges—such as climate change, market volatility, shifting consumer preferences, and environmental regulations—require the same innovative and cooperative spirit that characterized the original settlement.
But here’s the thing: these challenges also represent opportunities for operations that think beyond next quarter’s results.
Environmental sustainability initiatives now reflect modern agricultural consciousness while drawing on Dutch resource management traditions.
Youth development programs ensure the transfer of knowledge from foundational principles to contemporary dairy farming realities.
These aren’t just technical training sessions—they’re cultural transmission mechanisms that preserve a cooperative spirit and a commitment to excellence.
That 26-meter windmill still turns in Brazilian wind, its blades catching dreams that began on a ship deck in 1952.
When international judges like Ryan Krohlow and Jamie Black evaluate champion Holstein and Jersey cows bred in Brazilian pastures according to Dutch principles, they’re touching tangible results of one of agriculture’s greatest migration stories.
What This Means for Your Bottom Line
Standing back and looking at this whole story… what began with the MS Alioth continues to unfold each August in Castro, with each milking taking place in Castrolanda facilities, and each decision made according to cooperative principles that prioritize long-term sustainability over short-term profit.
The R$ 520 million in business deals generated by Agroleite 2024 represents compound interest on investment made by three visionary leaders who understood that true wealth gets measured not just in individual success, but in community prosperity and industry advancement.
Next time you’re making breeding decisions, remember what the Castrolanda story teaches us: genetic excellence without community support is just expensive cattle.
Environmental adaptation without long-term thinking is just crisis management.
Individual success without shared knowledge is just lucky timing.
As we prepare for Agroleite 2025, this story validates something fundamental about our industry: excellence truly knows no borders, community commitment overcomes any obstacle, and the courage to dream big enough really can change the world.
For those of us covering global dairy genetics and cooperative success stories, Castrolanda and Agroleite demonstrate that the most potent force in agriculture isn’t technology, capital, or even genetics—it’s the unwavering belief that tomorrow can be better than today. Working together, we can make it so.
That’s a lesson worth remembering, whether you’re breeding Holstein in Brazil, Jersey in New Zealand, or managing any dairy operation anywhere in the world.
Especially when the bills are due and the milk check is late, and you’re wondering if this whole thing is worth it.
It is. These folks proved it.
Be sure to watch The Bullvine for full coverage of this years show!
Executive Summary:
Here’s how 50 Dutch families with 61 cows transformed Brazilian dairy forever—and what it means for your operation. Back in 1952, visionary leaders Jan de Jager, Geert Leffers, and Feike Dijkstra sailed the MS Alioth to Brazil with nothing but expertise and absolute faith in cooperative principles. Fast forward to today: Castrolanda Cooperative processes over 239 million liters annually and has sparked Agroleite into the Southern Hemisphere’s premier dairy show, generating R$ 520 million in business deals. The secret sauce? They focused on heat-adapted genetics, community knowledge sharing, and thinking generationally—not just chasing next quarter’s milk check. Through The Bullvine’s comprehensive coverage, Agroleite now surpasses International Dairy Week in both quality and global reach, proving that when you combine Dutch precision with Brazilian innovation and strategic media partnerships, you create something that elevates an entire industry. The lesson for progressive dairy farmers is crystal clear: genetic excellence paired with cooperative thinking and long-term planning isn’t just feel-good farming—it’s the blueprint for thriving in today’s challenging dairy markets.
Complete references and supporting documentation are available upon request by contacting the editorial team at editor@thebullvine.com.
Learn More:
Beat Heat Stress: Boost Dairy Cow Fertility & Profits with New THI Thresholds – Learn practical strategies for breeding for heat tolerance using new THI thresholds. This piece provides a tactical guide on how to apply the historical lessons of the Castrolanda pioneers to your herd’s health and profitability today.
The Next Frontier: What’s Really Coming for Dairy Cattle Breeding (2025-2030) – Explore the future of genetic excellence beyond traditional methods. This piece demonstrates how emerging technologies, such as gene editing and AI, will create new opportunities for profitability and herd health, building on the foundation of the Castrolanda story.
The Sunday Read Dairy Professionals Don’t Skip.
Every week, thousands of producers, breeders, and industry insiders open Bullvine Weekly for genetics insights, market shifts, and profit strategies they won’t find anywhere else. One email. Five minutes. Smarter decisions all week.
$2.46 an hour. That’s what Aussie farmers earned during deregulation’s worst days. Time to talk feed efficiency?
You know what keeps me up at night sometimes? It’s this number: $2.46 an hour. That’s what some Australian dairy farmers were effectively earning during the worst stretches after their industry got deregulated back in 2000. Not their actual paycheck, mind you, but when you crunch the real numbers—milk prices, input costs, those brutal 70-hour weeks we all know too well—that’s what it amounted to for way too many operations.
As we watch trade negotiations swirl around our own supply management system up here in Canada, and as U.S. farmers deal with their own volatile markets, Australia’s quarter-century experiment offers some pretty sobering insights about what happens when you let pure market forces run the show.
I’ve been reviewing the new ABARES report on Australian dairy deregulation that was just released, and frankly, the story it tells should prompt every dairy farmer in North America to pause and think. Because what happened in Australia? It wasn’t just policy wonks moving numbers around. It was real farms, real families, real communities getting turned upside down.
When “Get Big or Get Out” Actually Happens
Let’s start with the raw numbers, because they’re honestly staggering. In 2000, Australia had 12,888 dairy farms. Today? They’re down to just over 4,500. That’s a 65% drop—we’re talking about more than 8,000 farm families who had to walk away from operations that, in many cases, had been in their families for generations.
Decline in Australian dairy farms from 12,896 in 2000 to 3,889 in 2024, highlighting deregulation effect
Now, the efficiency crowd will tell you this is exactly what should happen. Market forces are reallocating resources to their most productive use, and all that. And, indeed, the farms that survived became dramatically more productive. Average herd sizes went from 168 cows to 534 cows. Individual farm milk production jumped by 570% between the late ’70s and today.
But despite all this consolidation and efficiency, total milk production in Australia actually fell by 26% from its peak. You have farms that are three times bigger, cows that produce more milk per head, all the latest technology and management practices, and yet the country is producing a quarter less milk than it did 25 years ago.
That’s not efficiency—that’s an industry contracting while individual operations get more intensive just to survive.
The Power Shift Nobody Talks About
What really gets me about the Australian story isn’t just the farm consolidation—it’s what happened to the power dynamics in the supply chain. Because when you remove price supports and marketing boards, you don’t just create a “free market.” You create a vacuum that gets filled by whoever has the most leverage.
Market share distribution of Australian dairy processors showing dominance of top five companies
In Australia’s case, this meant that five major processors—Murray Goulburn, Fonterra Australia, Parmalat, Warrnambool Cheese & Butter, and Lion Dairy & Drinks—ultimately controlled 79% of the national milk supply by 2015. Meanwhile, two supermarket chains, Coles and Woolworths, account for approximately 65% of grocery sales.
Then came what Aussie farmers call the “$1 milk wars.” In 2011, Coles dropped the price of their private-label milk to just $1 per liter. Woolworths matched it immediately. And while the retailers claimed they were absorbing the discount themselves, we all know how that story ends, right?
As one Woolworths executive admitted to a Senate inquiry, those low prices inevitably “flow back to processors and farmers as new supply and pricing agreements are negotiated.” Which is exactly what happened. The Queensland Dairyfarmers’ Organisation documented that 185 of their members collectively lost more than $767,000 in just the first seven months of the price war.
This is what really worries me about the “let the market decide” mentality. Markets don’t operate in a vacuum. When you remove farmer protections, you don’t automatically achieve perfect competition—you often get a few large players using their leverage to squeeze out everyone else.
The Human Cost: When Communities Unravel
I’ve attended numerous dairy conferences over the years, and one thing I’ve noticed is how we often discuss “structural adjustment” as if it were just numbers on a spreadsheet. But every one of those farm exits represents a family that had to give up not just their livelihood, but usually their way of life as well.
Take Strathmerton, Victoria. Small town, about 300 people, built around a Bega cheese processing plant that had been there for decades. In 2022, Bega announced they were closing the facility to achieve “operational efficiencies.” Three hundred jobs—gone.
The local primary school enrollment dropped from 110 kids to 58 practically overnight. The town bakery that relied on the factory workers? Facing closure. One longtime resident told reporters it felt like signing “a death warrant for an entire rural community.” And honestly, when you look at what’s happened across rural Australia, that’s not hyperbole. It’s a pattern that has repeated itself in dairy communities across Queensland, New South Wales, and other regions that have lost their processing infrastructure.
The social fabric of these places gets shredded. Young people leave because there are no jobs. Services disappear because there aren’t enough people to support them. Property values collapse. And once that spiral starts, it’s incredibly hard to reverse.
The Productivity Paradox We Need to Understand
Now, I don’t want to paint this as all doom and gloom, because there are some genuinely impressive aspects of what Australian dairy farmers have accomplished. The individual farm productivity gains are remarkable. We’re talking about operations that have completely revolutionized how they manage everything from genetics to nutrition to labor efficiency.
The average annual milk production per cow in Australia has increased from approximately 3,340 liters in the mid-1980s to over 6,240 liters today. They’ve embraced precision agriculture, automated milking systems, advanced herd management software—all the tools that us North American farmers are familiar with, and some we’re still catching up on.
State/Region
Farm Loss % (2000-2022)
Key Impact
Queensland
-80% (1,545 → <300)
Market milk states hit hardest
New South Wales
-85% (1980-2021)
Lost quota value overnight
Victoria
-40% (4,268 → 2,552)
Export-focused, better positioned
Tasmania
+39% milk production
Comparative advantage regions grew
But all this individual farm efficiency hasn’t translated into a stronger, more resilient industry overall. Production has become geographically concentrated in just a few regions—primarily the Murray-Darling Basin and Tasmania. That concentration makes the entire national supply vulnerable to regional droughts, changes in water policy, and other localized shocks.
It’s like having a smaller number of really efficient engines, but they’re all located in the same place and running on the same fuel supply. More efficient individually, but more fragile as a system.
What Canada’s Doing Right (And Why It Matters)
Metric
Canada (Supply Management)
Australia (Deregulated)
Farm Numbers (2000-2023)
Stable (~10,000-11,000)
-65% (12,888 to 4,500)
Price Stability
Predictable, regulated prices
Volatile, market-driven
Farmer Age Crisis
Young farmers still entering
<6% under 35 years old
Debt Levels
Manageable with stable income
Doubled: $346K to $861K
Rural Communities
Stable processing infrastructure
Widespread plant closures
Long-term Planning
3-5 year investment horizons
Survival mode, short-term focus
This is where I think we need to step back and really appreciate what we have up here in Canada. Our supply management system is often criticized—especially in trade negotiations—but when you examine what has happened in Australia, it becomes quite clear what we’re protecting.
First off, our farm numbers have been relatively stable. We’ve seen some consolidation, sure, but nothing like Australia’s 65% crash. Statistics Canada data show that we’ve maintained roughly 10,000-11,000 dairy farms nationally, with gradual, manageable changes rather than traumatic disruptions.
More importantly, our farmers can actually plan for the future. When you know what milk prices are going to be, you can make rational decisions about herd expansion, facility upgrades, and succession planning. Australian farmers, meanwhile, are dealing with the kind of price volatility that makes long-term planning almost impossible.
I was talking to a farmer from Southwestern Ontario last month—he’s investing in a new robotic milking system, expanding his quota, and bringing his son into the operation. That kind of generational transition becomes really difficult when you can’t predict what your income will be from year to year.
And speaking of the next generation… this might be the most telling statistic of all. Less than 6% of Australian dairy farmers are under the age of 35. That’s not sustainable. That’s an industry aging out without attracting young people. Meanwhile, Canadian agriculture programs and the stability of supply management continue to draw young farmers into the industry.
Comparison of average herd sizes and milk production per cow between Australia and Canada
The Technology Factor: Why Stability Enables Innovation
One thing that really strikes me about the Australian experience is the interaction between technological advancement and market instability. You’d think that more competitive pressure would drive faster innovation, but what I’m seeing suggests the opposite might be true.
When farmers are constantly worried about whether they’ll be able to cover their costs next month, they become very conservative about major investments. Sure, they’ll adopt technologies that offer immediate payback, but the kind of long-term capital investments that really transform operations—automated milking systems, precision feeding equipment, comprehensive herd management systems—those become much riskier propositions when your milk price can swing 30% or more year-over-year.
Canadian farmers, with the price stability that supply management provides, can take a longer view. They can invest in technologies that might take three or four years to pay off, knowing that their revenue stream will be there to support the investment.
I’ve seen this firsthand, visiting farms in both countries. The Australian operations that survived and thrived tend to be those that already had significant capital reserves before deregulation took effect. The smaller farms that might have benefited most from newer technologies often couldn’t afford the risk of taking on debt for major upgrades, given their uncertain future income.
Regional Differences: Why One Size Never Fits All
Another lesson that stands out from the Australian experience is how deregulation affected different regions in varying ways. Queensland dairy farmers, who market milk premiums had protected, got hit especially hard—farm numbers there dropped by over 80%. New South Wales saw similar devastation.
Meanwhile, Victorian farmers, who were already operating primarily in the export/manufacturing milk market, initially saw some benefits. They had lower cost structures and were better positioned for the global market.
But what’s interesting about that geographic divide—it wasn’t just about efficiency or natural advantages. Queensland and NSW farmers had built their operations around a different market structure. They had smaller herds, focused on fresh milk for urban markets, and operated on different land bases. When the rules changed overnight, they couldn’t just flip a switch and become export-oriented operations.
This is something we need to keep in mind here in North America as well. A dairy farm in Vermont operates differently from one in Wisconsin or California, not just because of climate and land costs, but also due to market structures, processing infrastructure, and regulatory environments. Policies that work in one region might be disastrous in another.
Canadian supply management recognizes this reality through provincial marketing boards that can adapt to local conditions while maintaining national principles. It’s not perfect, but it acknowledges that dairy farming isn’t the same everywhere.
The Debt Trap: When Efficiency Requires Leverage
One of the most concerning trends in post-deregulation Australia has been the explosion in farm debt. Average debt per dairy farm more than doubled in real terms from $346,000 in 1999-2000 to $861,500 by 2014-15, and it’s continued climbing since then.
Average dairy farm debt in Australia increased from $346,000 in 1999 to over $861,500 in 2014, rising further by 2023
Period
Average Farm Debt
Effective Hourly Wage
Farms Covering Full Costs
1999-2000
$346,000
Not tracked
Majority profitable
2014-15
$861,500
$2.46 (worst periods)
Unknown
2015-16
Not specified
Below minimum wage
Only 28%
2022-23
Higher (continuing trend)
Variable
Majority struggling
Now, some debt can be good debt, right? Investing in productivity improvements, expanding operations, and upgrading facilities. But when you’re borrowing just to maintain competitiveness in an increasingly difficult market, that’s a different story.
In Australia, farms needed to become larger and more capital-intensive just to survive, but market volatility made it incredibly risky to take on the debt required for that expansion. It created this catch-22 where you couldn’t compete without investing, but investing was increasingly dangerous.
Canadian farmers, with more predictable income streams, can manage debt more strategically. They can plan expansions around known revenue projections rather than relying on the market to cooperate.
The Labor Crisis: When Young People Don’t See a Future
This might be the most troubling long-term consequence of Australia’s deregulation experience—the demographic crisis. With fewer than 6% of farmers under 35, and farm debt levels that require massive capital investments just to get started, young people are increasingly seeing dairy farming as a dead end rather than an opportunity.
I’ve spoken with agricultural educators in Australia, and they describe a generation of rural children who grew up watching their parents struggle with volatile prices, mounting debt, and constant uncertainty. Even kids from farm families often decide it’s not worth the risk.
The labor shortage isn’t just about family succession either. Hired labor has become increasingly difficult to attract and retain, as farms struggle to offer job security or competitive wages due to margin pressure.
Canadian farms, although not immune to labor challenges, continue to attract young farmers and farm workers because the industry offers more predictable career paths. When a farm can project its income three to five years out, it can make commitments to employees that become impossible under volatile pricing.
Year
Event
Impact
1995
National Competition Policy implemented
Review of all regulations restricting competition
1997-98
Market milk premium: 21¢/L higher than manufacturing
Direct wealth transfer: $311M annually to farmers
July 1, 2000
Full deregulation begins
State Marketing Authorities abolished
2000-2008
Dairy Industry Adjustment Program
$1.92B in transition funding via 11¢/L levy
2001-02
Peak milk production: 11.3B liters
Never exceeded again in 25 years
2011
$1/L milk price war begins
Coles, Woolworths devalue product
2020
Dairy Code of Conduct introduced
Partial re-regulation admits market failure
Practical Steps for Today’s Farmers
Alright, enough policy analysis—what can you actually do with this information on your farm right now?
Calculate Your Real Hourly Wage: Take your net farm income last year and divide it by the total hours you and your family put into the operation. Include everything—milking, feeding, fieldwork, bookkeeping, maintenance. If that number makes you uncomfortable, you’re not alone. Use it as a baseline for making decisions about labor efficiency and income diversification.
Stress-Test Your Operation: Model what would happen to your cash flow if milk prices dropped 20% for six months. How about if feed costs increased 30%? Australian farmers who survived deregulation were those who had built financial cushions for exactly such scenarios.
Invest in Flexibility: Technologies and management practices that allow you to adjust quickly to changing conditions become more valuable in volatile markets. This might mean variable-cost feed systems rather than fixed infrastructure, or diversified income streams that aren’t entirely dependent on milk prices.
Build Relationships Beyond the Farm Gate: Whether it’s processor relationships, banker relationships, or connections with other farmers, social capital becomes crucial when markets get turbulent. Australian farmers who were plugged into cooperative networks or had strong relationships with processors fared better than those with isolated operations.
Document Everything: Keep detailed records not just for tax purposes, but for strategic planning. Understanding your cost structure down to the cents per liter gives you real power in pricing negotiations and investment decisions.
Regional Strategy Matters: A farm in Prince Edward Island faces different challenges than one in Alberta or Wisconsin. Tailor your risk management and investment strategies to your specific regional conditions, including climate patterns, processing infrastructure, and local market dynamics.
Looking Forward: The Canadian Advantage
As I write this in 2025, Canadian dairy farmers are operating in an increasingly complex global environment. Trade pressures, climate change, technological disruption, shifting consumer preferences—all creating uncertainty and opportunity in equal measure.
However, we’re addressing these challenges from a position of relative strength, thanks in large part to supply management providing stability in an inherently volatile business. That stability isn’t just about guaranteed prices—it’s about being able to plan, invest, innovate, and pass farms to the next generation with confidence.
The Australian experience shows us what we have to lose. It also shows us that once you dismantle regulatory frameworks that provide stability, rebuilding them is incredibly difficult. The processors and retailers who benefited from deregulation have little incentive to give up their newly acquired market power.
Australia’s 2020 Dairy Code represents partial reregulation—an attempt to address the worst abuses without returning to the previous system. However, it’s a significantly weaker framework than what existed before deregulation, and it emerged only after considerable damage to farm families and rural communities.
Final Thoughts: Learning Without Repeating
So here we are, 25 years after Australia’s great dairy experiment began. The results are mixed at best—some remarkable individual farm success stories, but an overall industry that’s smaller, more concentrated, more indebted, and more vulnerable than before.
The lesson isn’t that markets are bad or that regulation is always good. It’s that the design of agricultural policies has consequences that ripple far beyond farm gates, and that stability and sustainability sometimes matter more than short-term efficiency.
As Canadian dairy farmers, we have something valuable—a system that provides the predictability needed for long-term planning and investment while still allowing for innovation and growth. It’s not perfect, and it will need to evolve as conditions change, but the Australian experience shows us what we could lose if we’re not careful.
The next time someone argues that “freeing the market” will solve agriculture’s problems, perhaps we should ask them to explain what happened to those 8,000 Australian dairy families who discovered that the market wasn’t particularly interested in their freedom.
Because at the end of the day, this isn’t about economics textbooks or policy theories. It’s about real farms, real families, and real communities. And sometimes, the most efficient market outcome isn’t the best human outcome.
Keep milking, keep learning, and keep fighting for the systems that work—because once you lose them, getting them back is a whole lot harder than keeping them in the first place.
The lesson? Don’t just get bigger. Get smarter. Your feed efficiency and genetic program could be the difference between thriving and just surviving.
Which aspect of Australia’s dairy struggles—farm consolidation, mounting debt, or community collapse—do you think poses the biggest threat to North American dairies? Share your thoughts below!
KEY TAKEAWAYS:
Scale smart, not just big: Australia’s survivors averaged 534 cows per farm (up from 168), but success came from genomic testing that improved feed conversion by 15-20%—start screening your replacement heifers now
Price volatility is real: When markets crashed, farmers lost 19 cents per litre overnight—build your buffer with feed efficiency programs and genetic selection for resilience traits
Tech pays off: Farms using precision feeding and genomic data improved profitability by 8-12% annually—invest in herd management software and genetic testing this season
Youth crisis hits hard: Only 6% of Aussie farmers are under 35—use stable planning tools like genomic breeding programs to create succession opportunities that actually work
Market power matters: When five processors controlled 79% of milk volume, farmers got squeezed—join cooperative purchasing groups and leverage genetic data to negotiate better contracts
EXECUTIVE SUMMARY:
Look, I just finished reading this massive report on what happened down in Australia after they deregulated their dairy industry 25 years ago. The numbers will shock you—65% of farms disappeared, yet the survivors tripled their herd sizes. Here’s what’s wild though: total milk production actually dropped 26% despite all that “efficiency.” Some farmers were effectively earning $2.46 an hour during the worst stretches. Yeah, you read that right. While consumers saved money on milk, processors and retailers grabbed most of the profit. The ones who made it through? They had to get smart about genomic selection, feed optimization, and managing massive debt loads. Global research backs this up—farms using advanced genomic testing and precision feeding are the ones still standing. Bottom line: if you’re not using these tools to maximize what you’ve got, you’re playing a dangerous game.
Complete references and supporting documentation are available upon request by contacting the editorial team at editor@thebullvine.com.
Learn More:
Profit and Planning: 5 Key Trends Shaping Dairy Farms in 2025 – This strategic analysis provides a forward-looking perspective on global market trends and how to financially stress-test your operation. It reveals how to use component-rich exports and strategic debt management to protect profits from future market volatility.
Your 2025 Dairy Gameplan: Three Critical Areas Separating Profit from Loss – Get tactical with this guide on practical, day-to-day changes. It offers actionable tips on optimizing feed management, using methionine, and nailing transition cow protocols to deliver measurable improvements in milk components and herd health.
The Future of Dairy Farming: Embracing Automation, AI, and Sustainability in 2025 – Explore the cutting edge of dairy technology with this deep dive into automation and AI. It details how whole-life monitoring and precision agriculture systems reduce labor costs and boost efficiency, showing how stable income enables strategic tech investments.
The Sunday Read Dairy Professionals Don’t Skip.
Every week, thousands of producers, breeders, and industry insiders open Bullvine Weekly for genetics insights, market shifts, and profit strategies they won’t find anywhere else. One email. Five minutes. Smarter decisions all week.
$1,000 lost per production run? Most processors don’t even know their aseptic milk is bleeding money through protein settling.
EXECUTIVE SUMMARY: Look, here’s something that’ll make your coffee go cold… most dairy processors are losing product volume and failing spec compliance because of protein stability issues they can’t even see happening. We’re talking about a 0.5% volume loss on a 50,000-gallon run that equals $1,000 straight out of pocket—and that’s conservative. With Class III sitting around $18.50 per hundredweight and over $8 billion in new processing infrastructure coming online, this blind spot is costing serious money. The Journal of Dairy Science just published research showing that UHT processing creates protein complexes that settle out during storage, whether you’re keeping it cold or at room temperature. What’s crazy is there’s a simple fix—protein stabilization at 90-95°C for just 1-2 minutes can extend shelf life by 5-30 days. You need to get your quality team on particle size analysis yesterday, because the processors figuring this out first are going to separate themselves from the pack.
KEY TAKEAWAYS
Catch the problem before customers do — Add particle size analysis to your standard QC protocols to detect protein aggregation weeks before visible gelation occurs, potentially saving 2-3% of sellable volume with 2025’s tight margins
Implement the 90-day action plan now — Start with temperature monitoring audits and pilot test protein stabilization heating (90-95°C for 1-2 minutes) on one product line to see measurable shelf life improvements within your first quarter
Turn quality into competitive advantage — Operations implementing these protocols are securing premium contracts with major buyers who cite product consistency as a deciding factor, especially critical with $8+ billion in new processing capacity creating intense competition
Stop losing money on invisible problems — Track protein degradation patterns in retained samples to identify the $1,000+ losses per production run that most QC systems never flag, giving you data to justify equipment upgrades and process changes
Get ahead of the curve on industry standards — With feed costs at multi-year lows but protein quality becoming the differentiator, plants mastering stability management will set tomorrow’s industry benchmarks while others are still playing catch-up
You know what keeps me up at night? It’s not just the usual stuff—Class III prices sitting around $18.50 per hundredweight, feed costs, labor shortages. It’s this protein stability issue in aseptic milk that most processors don’t even realize is happening. And trust me, it’s costing real money.
I was talking to a guy who runs a mid-sized cooperative in Wisconsin last month—they process around 30 million pounds of milk weekly—and they’re losing product volume to something they can’t even see coming. Their aseptic milk looks perfect, passes every safety test, meets every regulatory standard… but there’s this protein degradation happening during storage that’s literally eating into their margins. The plant manager, who has been in the business for twenty years, had no idea this was even a thing until they started tracking it properly.
Infographic illustrating key points of protein stability challenges and solutions in aseptic milk processing
What’s Really Going on Here (And Why Nobody’s Talking About It)
The thing about protein stability research—it’s been turning everything we thought we knew upside down. According to recent work by Pranata and colleagues in the Journal of Dairy Science, they tracked commercial 1% aseptic milk for a full 12 months, examining both refrigerated (4°C) and ambient (21°C) storage conditions. And what did they find? It challenges nearly every assumption we’ve been operating under.
Here’s where it gets interesting… and expensive. We’ve all been focused on enzyme activity, right? Those proteases that supposedly break down proteins during storage. But this research showed zero—and I mean zero—evidence of proteolysis from native milk proteases or heat-stable microbial proteases during storage.
What’s actually happening is way more complex than most of us realized. The UHT process itself creates heat-induced disulfide bonds between whey proteins and κ-casein at the surface of the casein micelle. This forms larger, more hydrophilic protein complexes that change entirely how the milk behaves during storage. What’s fascinating is that the research shows storage time creates these nonlinear effects across all the major protein fractions.
And here’s the kicker… both refrigerated storage and ambient storage end up at the same place—complete gelation. The cold just slows it down. So much for thinking refrigeration would solve everything.
Why This Hits Your Bottom Line Harder Than You Think
Production Run Size (gallons)
Volume Loss (0.5%)
Volume Lost (gallons)
Dollar Loss (@$4.00/gal)
Weekly Loss (5 runs)
Annual Loss (260 runs)
10,000
0.5%
50
$200
$1,000
$52,000
25,000
0.5%
125
$500
$2,500
$130,000
50,000
0.5%
250
$1,000
$5,000
$260,000
75,000
0.5%
375
$1,500
$7,500
$390,000
100,000
0.5%
500
$2,000
$10,000
$520,000
Financial impact of protein settling losses across different production scales, assuming conservative 0.5% volume loss at $4.00 per gallon milk value.
Here’s what’s happening—these protein complexes settle out and form gel layers that stick to package bottoms. The liquid that pours out? Reduced protein concentration. You’re losing sellable volume and failing spec compliance at the same time.
Let me put this in perspective. Consider a production run of 50,000 gallons… even a conservative 0.5% volume loss due to protein settling in packaging equates to 250 gallons of lost product. At a value of $4.00 per gallon, that’s a $1,000 loss on a single run that most QC systems would never even flag.
Now multiply that across your weekly production schedules.
With more than $8 billion in dairy processing infrastructure investment happening right now—I mean, we’re talking about a complete transformation of processing capacity—everyone’s competing harder for consistent product quality. What’s particularly frustrating? Feed costs are at multi-year lows, which should provide us with some breathing room on margins. However, if you’re losing product volume and spec compliance due to protein settling, those feed cost savings disappear quickly.
Here in the upper Midwest, where we’re dealing with longer haul distances to processing plants, this becomes even more critical. Operations I’ve visited in Minnesota and Iowa are seeing this issue compound during peak summer months when ambient temperatures stress the cold chain… and honestly, nobody’s tracking it systematically. It’s one of those blind spots that’s costing more than we realize.
What’s particularly challenging down in places like Texas and Arizona is dealing with extreme temperature swings during transport. I’ve seen plants struggle more with this issue during the summer months, when ambient temperatures can reach 110°F and stress even the best refrigerated systems.
What Smart Operations Are Starting to Do
Testing Method
Traditional Approach
Enhanced Approach
Detection Timeline
Implementation Cost
Effectiveness
Visual Inspection
End-stage gelation only
Visual + early warning
8-12 weeks vs 2-4 weeks
Low
Basic vs High
Compositional Testing
Standard protein analysis
Protein + particle size
Weekly vs Daily
Medium
Limited vs Comprehensive
Temperature Monitoring
Key checkpoints only
Continuous cold chain
Reactive vs Proactive
Medium
Reactive vs Preventive
Shelf Life Testing
Standard microbial focus
Protein stability tracking
End-point vs Progressive
High
Limited vs Predictive
Process Controls
Basic UHT sterilization
UHT + protein stabilization
Standard vs Optimized
High
Standard vs Enhanced
First thing? Your quality control protocols need updating, and I mean yesterday. Traditional testing methods completely miss the early stages of protein complex formation. This stuff happens long before you see visible gelation. You should discuss with your lab the possibility of adding particle size analysis to your standard compositional testing. It’ll catch protein aggregation before your customers start calling… and trust me, you don’t want those calls.
The processing side is where things get really interesting, though. There’s some fascinating work in Chinese patent research on UHT optimization showing that protein stabilization steps can make a real difference. We’re talking controlled heating at 90-95°C for just 1-2 minutes between homogenization and UHT sterilization. The results? Shelf life extension of 5-30 days. That’s not trivial when you’re managing inventory and distribution costs.
According to industry observations, processors who’ve implemented this approach are seeing significant reductions in complaints within six months. One operation I know mentioned that they secured a new contract with a major coffee chain, which cited product consistency as a key factor in their decision—that’s the kind of competitive advantage this creates when you get ahead of the curve.
Equipment-wise, advanced aseptic packaging with dry preform sterilization technology is showing real promise. Yeah, these systems require substantial capital investment, but current trends suggest favorable payback periods based on reduced product losses and premium pricing opportunities. The reduced thermal stress during packaging results in less protein complex formation from the outset. Some plants are reporting measurably better stability with these systems… though I’d caution that it’s still early days for ROI data.
And here’s something most operations haven’t thought about yet—your distribution strategy needs to account for protein degradation timelines, not just microbial safety windows. First-in-first-out rotation should consider protein stability alongside production dates. This is becoming more common in the Southeast, where summer heat stress compounds the problem.
Quick Implementation Checklist
Week 1: Get your quality team up to speed on particle size analysis protocols Week 2: Review current temperature monitoring throughout your entire cold chain Week 3: Audit product loss data for patterns correlating with storage time Week 4: Arrange equipment supplier demos for detection upgrades
The Technical Reality (And What It Actually Costs You)
What strikes me about this research is how it completely changes our approach to monitoring. The κ-casein-whey protein complexes increase in the serum phase while your gel layers get enriched with the more hydrophobic caseins. This creates a separation pattern that gives you early warning signals… if you know what to look for.
Temperature management remains crucial, but now we understand that we’re controlling rates, not preventing the problem entirely. Recent research confirms that processing temperatures have a significant impact on protein stability, making upstream temperature control just as important as storage conditions.
But let’s be honest about the costs. Energy expenses for maintaining precise temperature control represent significant operational costs, especially with electricity prices hitting operations harder than ever. You have to balance quality management investments against operational expenses, and that calculation becomes tricky when dealing with infrastructure that may last 15-20 years.
Staff training is another consideration—these detection methods require technical expertise for accurate interpretation. Equipment calibration, maintenance, and ongoing monitoring all add up to operational requirements that plant managers need to build into standard protocols.
From industry observations, I’ve seen as many as a third of operations struggle initially with the technical complexity of these changes. The key insight? Start with one or two modifications rather than overhauling everything at once. The plants that try to implement everything simultaneously often end up with more problems than they started with.
What’s particularly interesting is how this varies by region. Plants in the Pacific Northwest, where temperatures are more stable year-round, seem to have an easier time with implementation compared to those in operations dealing with extreme seasonal swings in the upper Midwest or desert Southwest.
The Competitive Edge (If You Move Fast)
Here’s the thing, though—this research fundamentally changes how we should think about aseptic milk quality management. Instead of just focusing on preventing enzyme activity, successful operations will manage the consequences of heat-induced protein modifications that occur during processing itself.
The opportunity is real for processors willing to invest in better process control and monitoring systems. Understanding these protein complex formation mechanisms enables you to make targeted interventions that maintain functionality for a longer period. That translates directly to premium pricing support and reduced product losses.
What’s particularly encouraging is the industry optimism about 2025 profitability prospects. Producers and processors alike are recognizing that competitive advantages increasingly depend on operational sophistication and quality management capabilities… and this protein stability issue represents exactly that kind of opportunity.
We can’t keep assuming that achieving sterility ensures consistent quality throughout labeled shelf life—that thinking’s outdated now. Protein quality management needs the same priority as microbial safety protocols. The operations that get this right will have significant competitive advantages as industry awareness develops and consumer quality expectations keep rising.
What’s fascinating is how this connects to the broader trend toward component optimization we’re seeing across the industry. Plants that master protein stability management are also better positioned to capitalize on the higher component values everyone’s chasing.
This development is particularly noteworthy because it gives smaller and mid-sized processors a chance to differentiate themselves through quality rather than just competing on volume and price. That’s huge in today’s market environment.
Your 90-Day Action Plan (With Reality Checks)
Look, the research is clear on this—protein stability issues in aseptic milk are real, they’re costing money, and most operations haven’t even identified the problem yet. But here’s the thing… understanding these mechanisms gives you options.
I was talking to a plant manager in California just last week. They’ve started implementing some of these monitoring approaches, and they’re catching quality issues weeks before they would have in the past. That’s the kind of operational intelligence that separates the leaders from the followers.
Day Zero: Build the Coalition Convene a 1-hour meeting with your heads of Quality, Operations, and Finance. Present the core findings to get cross-functional buy-in on the need to investigate. You need everyone aligned before you start changing protocols… trust me on this one.
First 30 days: Task your Head of Quality to arrange a demo or training on particle size analysis with your lab equipment supplier. Assign your lead lab technician to begin tracking protein degradation patterns in retained samples. Review and improve temperature monitoring protocols throughout the cold chain—not just at key points, but continuously. Audit product loss data for patterns correlating with storage time.
Expect some pushback here. Quality teams are busy, and adding new testing protocols feels like more work without an immediate payoff. But the data will speak for itself once you start collecting it.
Days 30-60: Start pilot testing on a single, representative product line (e.g., 1% UHT white milk) using the protein stabilization heating step. Monitor stability over 90 days by comparing it against control runs using standard processing. Train lab and quality staff on new detection methods.
This is where things get interesting. You’ll probably see some unexpected results in your first pilot runs—that’s normal. The key is tracking everything meticulously so you can identify patterns.
Days 60-90: Scale up implementation based on pilot results. Conduct a detailed ROI analysis for advanced packaging upgrades tailored to your specific production needs. Assign a project manager to lead the packaging upgrade evaluation and potential capital investment decisions.
By this point, you should have enough data to make informed decisions about larger investments. The plants that systematically move through this process tend to have much better outcomes than those that skip straight to equipment purchases.
Success Benchmarks: You’re looking for a 10-15% reduction in customer complaints, 2-3% improvement in sellable volume, and measurable extension of functional shelf life within the first quarter.
The producers and processors who move quickly on this—updating quality protocols, optimizing processing parameters, and investing in better monitoring systems—they will separate themselves from the pack. Because while everyone else is still thinking about protein stability the old way, you’ll be managing it based on what the science actually shows.
That’s the kind of competitive edge that translates directly to the bottom line… and in this market, we need every advantage we can get. The operations that embrace this challenge now will be the ones setting industry standards two years from now.
Further Reading: Pranata, J., et al. (2025). Effects of Storage Time and Temperature on the Protein Fraction of Aseptic Milk. Journal of Dairy Science.
Learn More:
Unlock Hidden Profits: The Dairy Producer’s Guide to Maximizing Component Value – This guide provides tactical strategies for maximizing the value of milk components at the source. It reveals how a deeper understanding of protein and fat economics drives profitability, reinforcing the high cost of the product losses discussed in our main article.
Dairy’s Trillion-Dollar Opportunity: Navigating the Future of Food – Go beyond the plant floor with this strategic market analysis. It details the consumer trends and economic forces driving industry growth, putting the main article’s call for investment in quality control and innovation into a broader, forward-looking business context.
Robots in the Dairy Aisle: The Automation Revolution Transforming Processing – Explore the cutting-edge technology changing dairy processing. This piece showcases how automation is delivering the process control and consistency needed to solve complex quality challenges, providing a real-world look at the advanced systems our main article recommends investigating.
The Sunday Read Dairy Professionals Don’t Skip.
Every week, thousands of producers, breeders, and industry insiders open Bullvine Weekly for genetics insights, market shifts, and profit strategies they won’t find anywhere else. One email. Five minutes. Smarter decisions all week.
193% sales jump proves consumers will pay a premium for transparency—time to rethink your milk marketing beyond butterfat %
You know what’s been fascinating to watch over the past few years? How Jeremy Clarkson—a guy who couldn’t tell a Holstein from a Jersey when he started—accidentally figured out something we’ve been struggling with in dairy marketing for decades.
Whether you see him as entertainment or advocacy, his farm show has measurably shifted how consumers think about agriculture. And honestly? The implications for dairy operations are bigger than most producers realize.
The numbers tell a story that’s hard to ignore. Clarkson’s Farm pulled in 7.6 million UK viewers within 28 days of its second season, making it Amazon Prime’s most-watched original series in the country¹. Season 4 has been averaging 4.4 million viewers per episode—not exactly niche agricultural programming².
But here’s what caught my attention at the last few industry meetings… it’s not just about viewership. Following recent seasons, Waitrose reported some pretty remarkable sales jumps: British sirloin up 193%, Jersey Royal potatoes up 89%, red Leicester cheese up 50%. That’s not just entertainment buzz—that’s measurable consumer behavior change creating real premium pricing opportunities.
Year-on-year percentage increase in UK sales for major British produce post Clarkson’s Farm Season 4 release
What strikes me most about this whole trend… it’s not really about Clarkson at all. It’s about how a celebrity accidentally cracked the code on something we’ve been wrestling with—authentic communication about what we actually do every day.
The Thing About Transparent Failure—It Actually Works
Here’s where it gets interesting for dairy producers. Clarkson did something none of us could afford to do: he opened his books completely on international television. When he declared a profit of just £144 for an entire year’s work, millions of viewers finally understood what you’ve been trying to explain to your banker, your neighbors, your own family for years⁴.
The guy’s got a £43 million safety net, right? So when his ventures fail, it’s disappointing television. When your expansion gets derailed by planning authorities or a disease outbreak hits your herd… well, that’s your kids’ college fund we’re talking about.
However, here’s the paradox worth understanding: his financial immunity actually unlocked something more authentic for mainstream audiences. Think about it: if a multimillionaire with unlimited resources, expert advisors, and zero debt pressure can barely break even, what does that tell people about the challenges facing your operation?
Industry observations suggest that this kind of radical transparency—when done right—builds more consumer trust than decades of feel-good marketing have ever achieved. The evidence suggests that consumers are eager for genuine stories about food production, rather than sanitized versions.
How Weather Became Front-Page News Again
The show transformed weather from small talk into a stark reality of existential farming. When viewers watched him calculate a £33,750 loss on a single crop “because it rained too much,” they finally got why we’re always checking forecasts⁴.
Every dairy producer knows that sinking feeling when storm clouds threaten first cutting, or when drought conditions mean you’re burning through stored feed by April. Last spring, I heard from a producer in eastern Wisconsin who had depleted his entire corn silage reserve months ahead of schedule due to exactly this scenario.
What’s particularly noteworthy is how this understanding builds public support for risk management programs. Recent surveys indicate high levels of public recognition that farming depends on factors completely beyond our control—that’s political cover for policies supporting agricultural resilience that we’ve needed for years.
From TV Entertainment to Your Milk Check
Here’s where this gets practical for dairy operations. Consumer behavior data reveals genuine market shifts that forward-thinking producers are already capitalizing on.
The sales increases at Waitrose represent a fundamental change in consumer mindset. Agricultural extension reports suggest that consumers exposed to authentic farming content demonstrate a significantly higher willingness to pay premiums for locally sourced products.
The developments surrounding direct-to-consumer strategies are exciting. A Vermont operation I’ve been following pivoted toward artisan cheese production combined with on-farm experiences. Their approach emphasized traditional techniques with modern animal care and environmental stewardship. Results after 18 months? Significant margin improvements over commodity pricing, waiting lists for their cheese subscriptions, and supplemental revenue from educational programs.
The key seems to be combining operational excellence with authentic storytelling—showing how precision agriculture serves cow comfort, environmental stewardship, and product quality rather than replacing traditional farming values.
Regional Differences You’re Probably Seeing
This consumer shift manifests differently depending on where you’re milking. In Wisconsin and Minnesota, where dairy heritage runs deep, the show not only reinforced existing consumer appreciation but also expanded market reach. Producers report increased interest from urban Twin Cities and Milwaukee consumers willing to drive longer distances for direct purchases.
Here’s the thing, though—the approach that works varies by region. In the Northeast, near metropolitan areas where consumers have disposable income but limited exposure to agriculture, operations are finding success by developing educational offerings that capitalize on increased public curiosity.
What’s fascinating is seeing technology integration become part of the storytelling process. Modern precision agriculture systems provide unprecedented opportunities for consumer engagement. GPS-guided equipment, automated feeding systems, and robotic milking technology—this technology creates compelling content while demonstrating agricultural sophistication.
The successful operations I’ve visited are practicing what you might call radical transparency about their practices, challenges, and management decisions (without sharing proprietary information, obviously). They’re responding to questions authentically, building relationships rather than just broadcasting information.
Policy Changes That Actually Matter
This increased consumer awareness has translated into tangible policy changes. Clarkson’s televised planning battles led to the introduction of new permitted development rights, dubbed “Clarkson’s Clause, “⁵ which makes it easier to convert unused agricultural buildings into commercial spaces without requiring a full planning application.
For dairy producers, this means easier farm shop development, simplified agritourism facility creation, and reduced bureaucracy for diversification projects. The changes double the allowable commercial conversion space from 500m² to 1,000m² and increase residential conversion possibilities.
Government ministers directly acknowledged the show’s influence in cutting “needless bureaucracy.” That’s a rare direct line from entertainment programming to actual legislation benefiting agricultural operations.
Getting Started Without Breaking the Bank
Look, I know what you’re thinking—this sounds like a lot of work on top of everything else you’re managing. But the approach that’s working doesn’t require massive infrastructure investments upfront.
The successful implementations I’ve seen start small, focusing on an authentic social media presence that emphasizes educational content about daily operations, seasonal challenges, and management decisions. The investment primarily involves time and basic equipment for content creation.
What works: weekly content showing routine herd management, explaining seasonal decisions like why you’re switching to stored forages or how you’re managing heat stress, and discussing economic realities without revealing proprietary information.
What doesn’t work: generic posts about “happy cows” without context, promotional content without educational value, inconsistent posting schedules.
Then you can test the market with limited direct-sales offerings—bottled milk, simple dairy products, basic educational programs—before any major infrastructure investments.
The operations achieving sustainable success demonstrate consistent patterns: authentic leadership from family members who are genuinely committed to consumer engagement, an unwavering commitment to product quality and customer experience, and professional support through investment in marketing guidance rather than purely DIY approaches.
Investment Reality Check
Investment Category
Initial Cost Range
Potential ROI
Timeline
Social Media Setup
$500-2,000
Increased brand awareness
3-6 months
Processing Equipment
$15,000-50,000
15-40% margin improvement
12-18 months
Retail/Farm Shop Space
$10,000-25,000
Direct sales premium
6-12 months
Marketing (Annual)
3-5% of gross revenue
Customer loyalty, waiting lists
Ongoing
Total Initial Investment
$25,000-75,000
60% margin improvement
18 months
Based on successful operations, here’s what you can expect: initial infrastructure for direct sales typically requires investment in processing equipment, retail licensing, and basic customer facilities. Annual marketing investment accounts for approximately 3-5% of gross revenue—significantly higher than in commodity-focused operations, but necessary for maintaining premium pricing.
The evidence suggests that operations successfully implementing direct-sales strategies see meaningful margin improvements over commodity pricing. Long-term customer value shows that direct-sales customers demonstrate significantly higher lifetime value and loyalty compared to retail purchasers, providing a stable revenue base during milk price volatility.
What Fellow Producers Are Really Saying
The farming community’s response to this phenomenon reveals a great deal about where our industry stands on consumer communication. Most producers I speak with appreciate the increased public awareness while maintaining healthy skepticism about celebrity farming.
A fourth-generation dairy farmer I know put it this way: “Before all this, you only saw two extremes of farming on TV—the quaint smallholder with rare breeds, or the factory farm exposé. At least now people see something closer to the reality for most of us: family businesses trying to stay profitable while taking good care of animals and land.”
Here’s what bothers many producers, though—the disconnect between entertainment farming and real financial risk. When celebrity ventures fail, it’s a disappointing setback. When your feed storage facility is denied by planning authorities or reproductive issues affect your herd, the financial consequences impact family security and multi-generational farm continuity.
Current trends indicate that machinery costs are increasing by 3-4% annually, while volatile feed costs continue to pressure margins. The show’s viewers might think, “If this guy can laugh off these problems, why are farmers always struggling?”
However, the successful producers I’ve spoken with are finding ways to authentically leverage this increased consumer interest. They’re building on their existing strengths, maintaining a focus on operational excellence while genuinely engaging with consumers who want to understand where their food comes from.
Where This Leaves Us
After observing how this has unfolded over the past few years and speaking with producers across various regions and scales, here’s what I believe this means for dairy.
The celebrity farmer trend revealed consumer hunger for authentic agricultural stories and transparent communication about food production. Smart producers are meeting that demand with genuine expertise and commitment to both agricultural innovation and traditional farming values.
What’s particularly encouraging is seeing younger producers embrace these communication opportunities as natural extensions of agricultural professionalism, rather than separate marketing activities. They’re integrating consumer education into their daily operations, using precision agriculture technology to enhance transparency, and building business models that benefit from, rather than merely tolerate, consumer interest.
The biggest winners will be operations that combine operational excellence with authentic storytelling, demonstrating that modern agriculture integrates traditional farming values with advanced technology, environmental stewardship, and consumer responsiveness.
The celebrity farmer may have started this conversation, but real farmers are finishing it—with genuine expertise, professional integrity, and commitment to both agricultural excellence and consumer education that builds lasting value. This shift in consumer awareness is the single biggest marketing opportunity our industry has seen in a generation. The trend is clear. What’s the first small step your operation will take to tell your story?
Key Takeaways
Direct-to-consumer dairy operations are seeing 60% margin improvements over commodity pricing within 18 months by combining artisan production with educational farm experiences. Start by documenting your daily management decisions on social media—show the science behind your feed ration calculations and reproductive protocols.
Premium positioning through transparency drives 15-40% higher revenue compared to traditional marketing approaches, especially when you demonstrate how precision agriculture serves cow comfort and milk quality. Begin with weekly posts that explain seasonal decisions, such as switching forages or implementing heat stress protocols.
Policy changes (Clarkson’s Clause) now allow 1,000m² agricultural building conversions without full planning applications, making farm shops and agritourism facilities much easier to develop. Evaluate your unused buildings for potential direct-sales or educational program spaces while these streamlined regulations are still new.
Consumer trust in farming has hit 76%—the highest levels in modern history—creating unprecedented opportunities for local dairy marketing in 2025. Test your market with limited direct-sales offerings, such as bottled milk or simple cheese products, before investing in major infrastructure.
Operations that combine operational excellence with authentic storytelling are building 12-month waiting lists for premium products while maintaining high production efficiency. Focus on radical transparency about your management expertise rather than generic “happy cow” content.
Executive Summary
Here’s what caught my attention in the Clarkson situation… most dairy producers are leaving significant money on the table by hiding behind commodity pricing instead of building direct consumer relationships. We’re talking about Waitrose seeing 193% increases in British beef sales and 50% jumps in cheese after people actually understood farming economics. The article shows operations achieving 15-40% margin improvements over commodity pricing through direct-sales strategies—that’s real money, not just feel-good marketing. What’s happening globally is a massive shift, where consumers exposed to authentic farm content demonstrate a 34% higher willingness to pay premiums for local products. The successful operations mentioned are building waiting lists for their products while commodity producers struggle with volatile milk prices. If you’ve got good genetics, solid feed efficiency, and decent cow comfort scores, you’ve already got the foundation—now you just need to tell that story.
Complete references and supporting documentation are available upon request by contacting the editorial team at editor@thebullvine.com.
Learn More:
The Top 5 Keys to Telling Your Dairy Story on Social Media – This article moves beyond theory into action. It provides a tactical framework for creating social media content that builds trust, engages consumers, and turns online followers into loyal, high-value customers for your direct-sales operation.
Dairy Farm Diversification: More Than a Buzzword, It’s a Business Strategy – Ready to explore value-added enterprises? This piece provides the strategic business case for diversification, covering the essential financial planning, risk analysis, and market validation needed to ensure your new venture is profitable and resilient from day one.
The 5 Dairy Technologies That Will Drive The Future of Dairying – This piece demonstrates how to back up your marketing story with operational excellence. It breaks down the key technologies shaping modern dairies, revealing how strategic investments can boost efficiency, improve animal welfare, and generate compelling content.
The Sunday Read Dairy Professionals Don’t Skip.
Every week, thousands of producers, breeders, and industry insiders open Bullvine Weekly for genetics insights, market shifts, and profit strategies they won’t find anywhere else. One email. Five minutes. Smarter decisions all week.
Defending dairy isn’t about better barns anymore—it’s about better data. Feed efficiency wins the PR war, not just profit.
EXECUTIVE SUMMARY: Look, I’ve been watching this Viva! thing unfold, and here’s what really matters: the farms winning against misinformation aren’t just farming better—they’re documenting everything and using their genetic data as ammunition. That campaign reached 3.5 million people but only sparked 25 complaints because our trade groups had the right data to fight back. Here’s the kicker though… with precision feeding systems showing $0.30+ daily savings per cow and genetic selection cutting feed costs by hundreds of kilos per lactation, we’re not just improving margins—we’re building bulletproof stories. Plus, 190 UK producers quit last year alone, so every farm left needs rock-solid credentials. The University of Guelph’s showing 10-20% nitrogen reductions with smart feeding tech, which means environmental wins on top of profit gains. Bottom line? If you’re not tracking feed efficiency with genomic tools and precision systems, you’re missing both money and the chance to defend what we do.
KEY TAKEAWAYS
Boost your feed conversion by 7-12% annually using genetic selection for Feed Advantage scores—start by requesting your AHDB genetic reports and ranking your herd on efficiency metrics today.
Document everything religiously because your breeding records, feed protocols, and health data become your best defense against activist attacks—think of it as insurance that pays dividends.
Invest in precision feeding tech that delivers $0.30+ daily savings per cow while cutting nitrogen emissions by 20%—the ROI hits in 2.5-3 years, perfect timing for 2025’s tighter margins.
Connect with your trade associations immediately to share your on-farm genetic progress and efficiency wins—they need real examples from progressive operations to counter misinformation campaigns.
Turn your robotic milking data into premium contract leverage by tracking individual cow performance metrics that processors value—some New York farms are already securing better deals this way.
The thing about defending dairy is it’s not just about what happens in the barn anymore – it’s about the story the data tells. The recent victory over the misleading Viva! anti-dairy cinema campaign proves that the best defense is leveraging genetics and cutting-edge technology to build an undeniable case.
The Case Study: Viva! vs. ASA
Viva!’s “Dairy is Scary” campaign was a £46,000 (approximately $ 75,000 CAD, $ 58,000 USD) crowdfunding success, reaching over 3.5 million cinema viewers in the UK. The ad featured a “bogeyman” snatching a baby — a powerful symbol of calves being separated from cows on dairy farms. Despite the raw emotional imagery, it sparked only 25 complaints, mostly from dairy bodies such as the Ulster Farmers’ Union and the Dairy Council for Northern Ireland.
That’s a statistically negligible complaint rate. But those complaints came from the right places — formal objections from the bodies that represent herd owners and producers.
The UK’s Advertising Standards Authority (ASA) called it ‘irresponsible’ and said it risked distressing audiences — particularly those who’d lost children. Industry representatives welcomed the ruling, with John McLenaghan from UFU calling the ad’s message “not only misleading and inaccurate, but also harmful to the dairy sector.”
The Real Problem: The Knowledge Gap
Here’s the rub — about 59% of consumers don’t realize cows must have calves to produce milk. This is a massive gap activists are quick to exploit. Couple that with an estimated 190 UK dairy producers exiting the industry between 2024 and 2025, and you’ve got an industry where every operator’s reputation counts more than ever.
Data-Driven Defense
Genetics: Telling Our Story
AHDB’s Feed Advantage (FAdv) index serves as a genetic roadmap for enhancing cows’ feed efficiency. Efficient genetics means cows that consume less feed but maintain production and fertility.
This evolution isn’t just a line on a report — it’s the backbone of our story. It shows that modern dairy is about continuous, science-backed progress, not exploitation.
Technology: Proof in Numbers
Genetics tells us what’s possible, but technology shows what’s actual. Recent work from the University of Guelph’s Ontario Dairy Research Centre, with collaborators at the University of Idaho and Virginia Tech, combines AI and biological modeling to tailor nutrition.
Trials have shown potential savings of over $0.30 per cow per day and a 10–20% reduction in nitrogen emissions. Industry estimates place the cost of precision feeding setups between $15,000 and $50,000 per 100 cows, with a payback period of around 2.5–3 years, according to industry and supplier reports.
This strategy is already in play. For example, producers in New York who use robotic milking systems leverage detailed health and production data to secure premium contracts.
Documentation: Building Our Case
But none of this matters without good documentation. Weaponize your records of genetics, feed, health, and welfare. These form the foundation of credible evidence and fortify your integrity against activist attacks.
Turning Data into Action
Let’s rethink how you respond in this climate:
Weaponize Your Records: Maintain meticulous and detailed documentation throughout your operation.
Mobilize Your Trade Allies: Coordinate early with AHDB, NFU, and local dairy councils to ensure a smooth process.
Market Your Genetic Progress: Use feed efficiency and fertility indices to show continuous improvement.
Leverage Precision Tech: Invest strategically in robotics and precision feeding for operational gains and compelling data.
Amplify Your Consumer Outreach: Educate with farm tours, local partnerships, social media, and direct sales.
This blueprint is already being implemented. The most forward-thinking operations are connecting genetic selection, technology adoption, and comprehensive documentation into strategies that serve both operational efficiency and public advocacy.
Complete references and supporting documentation are available upon request by contacting the editorial team at editor@thebullvine.com.
Learn More:
Genomics: A Game Changer for Dairy Herd Management – This article provides a tactical guide for implementing genomic testing. It reveals practical methods for using data to improve sire selection, accelerate genetic gain, and boost long-term profitability and herd health, turning genetic theory into on-farm action.
Dairy’s Dilemma: Can We Rebuild Consumer Trust in a Skeptical World? – Explore the market forces driving consumer skepticism. This strategic analysis dives into the communication and transparency strategies needed to rebuild public trust, protect your social license to operate, and secure market access in a challenging environment.
The Fully Automated Farm: A Look Inside a High-Tech Dairy Operation – See the future in action with this case study of a fully automated dairy. It demonstrates how integrating robotics, sensors, and data analytics can dramatically increase labor efficiency, improve animal welfare, and drive overall operational performance.
The Sunday Read Dairy Professionals Don’t Skip.
Every week, thousands of producers, breeders, and industry insiders open Bullvine Weekly for genetics insights, market shifts, and profit strategies they won’t find anywhere else. One email. Five minutes. Smarter decisions all week.
A 30-million-ton global milk shortage is projected by 2030… Smart producers are already cashing in—here’s your action plan
EXECUTIVE SUMMARY: Look, I’ve been watching this industry long enough to know when something big’s happening. The old “more milk equals more money” playbook is dead – component optimization is where the real cash is now. USDA data show that while overall milk production increased by only 16% since 2011, butterfat production rose 30% and protein production climbed 24%, which translates to an additional $260,000 annually for a typical 380-cow operation that achieves this. Meanwhile, smaller farms are getting hammered by heat stress (losing 1.6% of production yearly), but the smart ones investing $70-85K in cooling systems are seeing payback in under 18 months. The global picture is shifting too—we’re looking at a 30-million-ton shortage by 2030, while the U.S. adds over 100,000 cows in non-traditional dairy states. Bottom line? If you’re not already blending genomic testing with feed efficiency improvements, you’re leaving serious money on the table in 2025.
KEY TAKEAWAYS
Feed conversion is your secret weapon: Operations achieving 1.35-1.4 lbs of milk per lb of dry matter are generating $250-450 per cow annually. Start tracking your ratios and adjust feeding times—night feeding during heat stress alone can cut losses from 15% to 4%.
Genomic testing pays for itself fast: Modern testing predicts component production with 70% accuracy at 8-10 weeks old. Stop guessing on replacements—one Central Valley operation went from 3.18% to 3.52% protein and added over $ 200,000 in annual revenue.
Heat adaptation isn’t optional anymore: With 15-20 stress days becoming the norm (up from 8-10 just five years ago), cooling investments in the $ 70,000-$ 85,000 range now pay back in 14-18 months. Don’t wait for the next heat wave to find out your systems are shot.
Components drive 90% of milk check value: Butterfat hit 4.23% nationally in 2024, marking the fourth consecutive record. Focus on breeding for components over volume, because processors are paying premiums for quality, not quantity.
Carbon credits are real money now: Mid-size operations are netting $9,500-15,000 annually through improved manure management and feed efficiency programs. The verification costs run $ 10,000-$ 18,000 upfront, but the payback is getting shorter with rising carbon prices.
But here’s what’s keeping me up at night—most producers I’m talking to have no idea this train is already bearing down on us. The early tremors? They’re hitting milk checks right now.
The Market Shift That’s Already Shrinking Your Paycheck
The thing about global supply crunches is they don’t politely wait for 2030 to start messing with your bottom line. Take what’s unfolding in Europe—and I mean right now. A recent USDA GAIN analysis projects the EU to experience a 0.2% decline in milk deliveries for 2025. Sounds like nothing, right?
Wrong. When one of the world’s largest dairy regions starts contracting, even slightly, that creates ripples that turn into waves pretty quickly.
What strikes me about this trend is how it’s fundamentally changing what we value in our milk. From 2011 to 2024, overall production increased by only 16%, but protein rose 24% and butterfat jumped over 30%—as calculated by comparing total production volume against total component pounds reported in USDA NASS data, which clearly demonstrates how genetics are driving this transformation.
Consider a hypothetical 380-cow operation in south-central Wisconsin that switched their breeding program three years ago to prioritize components over volume. If their protein climbed from 3.12% to 3.47%, and with typical co-op component premiums, they’d be looking at an extra $0.90+ per hundredweight. On 380 cows producing 27,000 pounds annually… that’s over $260,000 in additional revenue. Per year.
But the real gut punch? Smaller operations are getting absolutely hammered. Farms with fewer than 100 cows are losing 1.6% annually—nearly 60% more than the average. These operations represent only 20% of total production, but they’re shouldering 27% of the heat-related damages.
That’s not just unfair. It’s unsustainable.
I’m seeing this pattern across Wisconsin and Iowa. This scenario, common across the Midwest, involves third-generation family operations near Platteville—typically 180 cows—watching production drop 8-12 pounds per cow during those brutal heatwaves we’ve been experiencing. Meanwhile, a similar operation with better cooling infrastructure might only result in a 2-4 pound drop.
The difference? A tunnel ventilation and evaporative cooling investment in the $70,000 to $85,000 range that typically pays for itself in 14-18 months. When you’re talking about maintaining production during 15-20 stress days, which used to be 8-10 days just five years ago, the math works completely differently now.
What’s particularly frustrating is that heat stress kicks in at a temperature-humidity index of just 68. Most of us aren’t even uncomfortable at that level, which means we’re constantly behind the curve on mitigation.
Where the Growth Is (And It’s Not Where You Think)
Most of this growth is coming from the U.S., where we’ve added over 100,000 cows in the past year. However, what’s fascinating is that it’s not happening in traditional dairy country. Texas, Idaho, Kansas, and South Dakota are leading the charge.
I remember when moving 500 cows to western Kansas seemed like a crazy idea. Now? Some of the most efficient operations I know are located in areas we once considered marginal dairy territory. The economics just work differently there—lower land costs, more water access, purpose-built facilities designed for climate control.
What’s interesting is watching the contrast with traditional powerhouses. Europe’s dealing with environmental regulations that are pushing smaller producers out faster than anyone anticipated. New Zealand is pivoting toward value-added products rather than focusing on volume growth. And China—still the world’s largest dairy importer—is facing economic struggles that could significantly reshape global demand patterns.
Three Strategies That Are Actually Printing Money
Investment Strategy
Initial Cost
Annual Savings/Revenue
Payback Period
Genomic Testing Program
$15,000-25,000
$200,000+ (component gains)
1-2 months
Feed Efficiency Optimization
$16,000 (labor)
$250-450 per cow
4-6 months
Cooling System Installation
$70,000-85,000
Production maintenance during heat
14-18 months
Carbon Credit Programs
$10,000-18,000 (verification)
$9,500-15,000 annually
12-24 months
Here’s where I get genuinely excited about what I’m seeing in the field… because there are producers who aren’t just surviving this transition, they’re absolutely crushing it.
Component-focused genetics is the real game-changer. Modern genomic testing can predict component production with remarkable accuracy when calves are just 8-10 weeks old. Think about what that means for your replacement decisions—no more guessing, no more wasting money raising animals that’ll never pay their way.
To illustrate the financial implications, let’s model a hypothetical 650-cow Central Valley operation that implemented this strategy four years ago. If they were running about 3.18% protein—pretty typical for the region—and today they’re consistently hitting 3.52%, with component premiums ranging from $0.85 to $1.10 per hundredweight on protein alone… we’re talking over $200,000 in additional annual revenue just from breeding decisions.
Feed optimization is where margins get made or lost. Operations hitting feed conversion ratios of 1.35 to 1.4 pounds of milk per pound of dry matter intake are saving serious money—$250 to $450 per cow annually, especially during stress periods.
Picture a hypothetical 420-cow operation in central Iowa that figured this out three years ago. They increased their feeding frequency from twice daily to three times during heat stress, with the largest feeding at 9:30 PM, when it’s cooler. The costs may be $16,000 in extra labor annually, but they’re maintaining production within 4% of normal, even during extreme heat events, while neighbors are seeing drops of 12-18%.
Climate adaptation infrastructure is paying for itself faster than ever. I used to be skeptical about the ROI on cooling systems, but the numbers have changed significantly over the past two years.
Imagine a hypothetical 380-cow dairy in central Arizona that invested $135,000 in evaporative cooling and tunnel ventilation last spring. During those intense heatwaves last summer—temperatures exceeding 110 degrees for two weeks straight—they maintained 88% of their normal production, while neighboring dairies without cooling systems dropped to 58%. That system paid for itself in 13 months.
Of course, these major infrastructure investments aren’t without risk. A sharp downturn in milk prices could extend the ROI timeline, making cash flow critical. But with current market fundamentals and climate projections, the risk of NOT investing appears far greater.
How Sustainability Programs Are Creating a New Revenue Stream
In one cooperative effort in Minnesota, five smaller operations banded together to share the costs of verification. Each farm is netting $9,500 to $14,000 annually through improved manure management and feed efficiency programs. As one producer told me: “It’s like someone’s paying us to do things we should’ve been doing anyway.”
The catch? Upfront verification costs can run $10,000 to $18,000 per farm. However, with carbon prices trending upward and more corporate buyers entering the market, the payback period is becoming shorter.
Real-World Success Stories Worth Studying
To model what comprehensive adaptation looks like, consider a hypothetical 460-cow operation near Watertown, New York. Three years ago, they were barely breaking even. Thin margins, heat stress losses eating into summer profits, component premiums slipping compared to neighbors.
What changed? They went all-in on adaptation. Component-focused breeding brought protein from 3.09% to 3.41%. They installed tunnel ventilation and misters for $92,000. Optimized their feeding program around efficiency instead of just production. Started earning $11,500 annually through carbon credits.
The results are honestly impressive. Their cost per hundredweight dropped 4% while component premiums boosted their milk price by 7%. They went from barely profitable to genuinely building equity in this market.
Bottom Line: Your Strategic Action Plan
Timeline
Priority Actions
Expected Outcomes
90 Days
– Assess genetic selection criteria – Service cooling systems – Measure heat stress baselines
Look, I’ve been around this industry long enough to recognize the producers who see changes coming and position themselves early. They’re the ones who not only survive disruptions but come out stronger on the other side.
Your 90-day priorities: Get brutally honest about your genetic selection criteria. Are you breeding for the milk market of five years ago or the one that’s coming? Service those cooling systems now—don’t wait for the first heat wave to discover that your circulation pumps are malfunctioning. Start measuring the impacts of heat stress so you know your baseline vulnerability.
Six to eighteen months out: If you’re milking more than 200 cows, genomic testing isn’t optional anymore—it’s a competitive advantage. Your neighbors who figure this out first are going to have better genetics, higher components, and more profitable operations. Period.
Infrastructure investments also require serious consideration. The ROI calculations for cooling systems have undergone significant changes. Heat stress used to be something you endured a few days per year. Now it has been affecting profitability for months.
Twelve to twenty-four months: Carbon credit opportunities are real, but do your homework. Not every program delivers what they promises, and some require management changes that might not fit your operation. But for producers who can make it work… it’s essentially free money for doing things that improve efficiency anyway.
The way I see it, we’re at one of those rare moments when everything shifts. The old model of just producing more milk is giving way to something more sophisticated—component optimization, climate resilience, and operational efficiency.
Global supply constraints mean pricing power is shifting back toward producers who can consistently deliver high-quality products. But that same tightness means there’s less margin for error… and less patience for operations that haven’t adapted to new realities.
The producers who understand these shifts and act on them decisively are going to dominate the next decade. The ones who wait for things to settle down… they’re going to be fighting for scraps in an increasingly difficult market.
What’s it going to be for your operation?
Complete references and supporting documentation are available upon request by contacting the editorial team at editor@thebullvine.com.
Learn More:
Genomic Testing: Are You Asking the Right Questions to Maximize Your ROI? – This piece moves beyond basic testing, revealing critical questions to ask your genetics provider. It provides a framework for translating raw data into real dollars, ensuring your investment accelerates genetic gain and long-term herd profitability.
The Processor’s Playbook: What Dairy Processors Want Next and How to Deliver It – Look inside the mind of your milk buyer. This strategic brief decodes what processors demand next—from specialized components to verifiable sustainability—providing the intel needed to secure premium contracts and increase your farm’s market power.
Every week, thousands of producers, breeders, and industry insiders open Bullvine Weekly for genetics insights, market shifts, and profit strategies they won’t find anywhere else. One email. Five minutes. Smarter decisions all week.
Plant-based milk just dropped 4.9% while premium dairy jumped 44%. Time to rethink your positioning strategy, friend.
Executive Summary: Look, I’ve been watching this shift for months now, and the producers who pivot to premium positioning while everyone else panics about alternatives are going to clean up. We’re talking about a 44% growth in premium dairy segments while plant-based sales dropped nearly 5% — that’s not a blip, that’s a trend.The math’s pretty simple: farms focusing on component optimization and direct-to-consumer strategies are seeing payback periods of 18-24 months, with some operations adding $2,000+ per cow annually. What’s happening globally isn’t just about taste preferences… it’s about trust, nutrition, and consumers willing to pay for quality when they understand what they’re getting.Your feed costs aren’t getting cheaper, and milk prices aren’t getting more stable — but premium positioning gives you margin protection that commodity thinking never will. You should be testing this approach in the next 90 days, because this window won’t stay open forever.
Key Takeaways
Component premiums are real money right now — producers hitting 4.2%+ butterfat and 3.3%+ protein are seeing $0.50-$1.00/cwt premiums. Start with precision feeding programs and track your DHI results monthly. In 2025’s tight margins, these components literally pay for the feed adjustments.
Direct sales can double your milk value — farmers markets and restaurant partnerships are paying $6-8/gallon versus your $2.10/gallon blend price. Test with 10% of production first, focus on local establishments that value provenance. The consumer education investment pays back in 8-12 months.
Robotic systems aren’t just about labor anymore — they’re data goldmines for premium positioning stories. Those $300K investments generate 15-20% better udder health tracking and give you the consistency metrics premium buyers want. Think storytelling tool, not just milking equipment.
Feed efficiency gains of 7-12% are achievable this year — precision feeding programs cost $15K-$50K per 100 cows but payback in 2.5-3 years through better conversions. Start by tracking your current feed-to-milk ratios, then optimize your TMR based on actual production data.
Consumer retreat from alternatives creates opening — 57% cite taste/texture issues with plant-based products, 67% worry about processing. Use this skepticism to position your farm’s traditional methods as premium advantages. The marketing practically writes itself.
You know that feeling when you’re watching a market shift happen in real time? That’s exactly what’s unfolding in dairy right now — and if you’re not paying attention, you’re missing what could be the biggest repositioning opportunity I’ve seen in years.
The thing about consumer preferences: they can turn on a dime, but when they do, the smart money follows fast. I’ve been tracking these consumer migration patterns for months now, and honestly? The reversal has been more dramatic than most of us expected.
We’re seeing refrigerated plant-based milk sales drop 4.9% to $2.5 billion in 2024 while premium high-protein dairy in the UK posted a staggering 44% growth, hitting £117 million in 2023. What strikes me about this shift isn’t just the numbers — it’s what they reveal about where consumers are actually placing their trust.
This isn’t just about market data, however. According to recent consumer research, taste and texture remain significant barriers to the adoption of plant-based products, while concerns about processing are growing among consumers who want to understand what they’re consuming. That’s not a small segment we’re talking about — that’s mainstream consumer skepticism hitting a tipping point.
2024 Sales Change: Decline in Plant-Based Milk vs Growth in Premium High-Protein Dairy
What’s Really Happening on Farms (The Part Everyone’s Missing)
Here’s the thing, though… This plays out differently across regions, and the producers who are aware of this are already positioning themselves.
One Central Valley producer I spoke with recently — has been running about 1,200 cows for the better part of two decades — has been watching Coca-Cola’s $650 million Fairlife investment with keen interest.
“Ultra-premium positioning works, but you need serious marketing investment and supply chain coordination to get there.”
With ag lending rates where they are right now (and trust me, we’re all feeling that pinch), the smart approach isn’t jumping in headfirst — it’s gradual transitions that build on existing strengths. Are you already producing above-average components? That’s your starting point right there.
What’s particularly noteworthy is how efficiency plays into this premium positioning. Another producer up in Wisconsin has been implementing precision feeding strategies, and from what I’m hearing around the industry, the improvements in feed conversion aren’t just about saving costs anymore — they’re about creating the foundation for premium product positioning. His payback timeline? About eighteen to twenty-four months at current milk price levels.
The math works like this: when you can dial in your butterfat numbers and protein content through precision nutrition, you’re not just optimizing for commodity pricing—you’re creating the quality foundation that enables premium market positioning. And in today’s market, that margin difference is everything.
New Zealand’s Reality Check (And What It Means for All of Us)
If you want to see premium dairy pricing power in action, look at what’s happening down in New Zealand. Butter prices reached NZ$8.42 for a 500g block in May 2025 — a 51% annual increase, and consumers are still buying. That tells you something profound about demand elasticity when you’re dealing with a quality product.
Industry analysts tracking dairy commodities have noted that we’re seeing pricing power in quality segments that we haven’t witnessed since the early 2000s organic boom. However, what’s truly fascinating about the New Zealand situation is… it’s not just about scarcity pricing.
Their producers have spent decades developing quality systems, genetic programs, and processing capabilities that support their premium positioning. When global buyers want superior butterfat and protein levels, they’re willing to pay for it. And that premium gets passed back through the supply chain.
Corporate Course Corrections (This Is Where It Gets Interesting)
What’s interesting is watching how the big players are pivoting. Remember when everyone was rushing into a plant-based diet? Well, Lactalis just announced they’re shutting down their Sudbury plant-based operations by December 2025 — barely a year after reopening it with government support. That’s not market volatility; that’s informed resource allocation based on what’s actually moving off shelves.
Meanwhile, according to organic industry reports, organic milk volumes continue to grow at rates that significantly outpace those of conventional milk. But here’s the catch — organic certification still takes 3-5 years. So, if you’re considering premium positioning, the time to start planning is now, not when you see the opportunity fully developed.
According to McKinsey & Company’s latest survey of dairy executives, 69% of industry leaders now prioritize cost management, while 65% plan to increase investment in product innovation over the next three to five years. That’s not contradictory thinking — that’s strategic positioning for margin expansion.
What does this tell us about where the smart money is going? They’re not just cutting costs; they’re investing in differentiation while managing expenses. Big difference.
Regional Opportunities: Where Your Operation Fits
Region
Primary Opportunity
Investment Focus
Market Characteristics
Europe
Sustainability messaging
Advanced feeding tech, organic certification
70% parent concern about dairy nutrition
North America
Direct-to-consumer premium
Local partnerships, component optimization
Strong farmers market culture
Asia-Pacific
Export positioning
Cold chain logistics, quality systems
2-2.5% annual consumption growth
European Sustainability Messaging
In Europe, something interesting is happening with sustainability positioning within the conventional dairy sector. Recent research shows that significant percentages of parents remain concerned about the nutritional implications of removing dairy from children’s diets — about 70% of French parents, according to recent studies. This is a powerful endorsement for the traditional role of dairy in family nutrition.
They’re also investing in technologies that matter. Industry reports suggest that advanced feeding strategies can significantly improve efficiency, with payback periods averaging 2.5-3.5 years for well-planned implementations.
The implementation costs vary widely, ranging from $15,000 to $50,000 per 100-cow operation, depending on the system and region. That’s real money, but it’s also real results when you factor in both cost savings and quality improvements.
Asia-Pacific: The Long Game
Now, the Asia-Pacific region represents a significant portion of global dairy consumption, and China continues to show growth in per capita dairy consumption, creating pricing pressure that flows back to all of us. Even if you’re never shipping overseas, those demand patterns affect your farmgate price.
The challenge there lies in navigating complex cold chain logistics and establishing consumer trust in foreign dairy products. However, what most people overlook is that successful market entry typically requires 18-24 months of lead time and partnerships with established local distributors.
The volume potential, though? China represents a significant opportunity for growth, transitioning from current consumption levels to those of developed markets. That’s a massive opportunity if you can figure out the logistics. Are any of you exploring export opportunities? Because the window might be wider than you think.
Implementation Reality: What Works (And What Doesn’t)
Double milk value ($6-8/gal vs $2.10/gal), stronger customer relationships
Feed Cost Reality Check
Let’s talk about the elephant in the room: feed cost volatility. Seasonal swings can be brutal — I was just talking to producers in Wisconsin who were severely impacted by corn silage quality issues last harvest. When your premium positioning depends on consistent milk components, that variability is… well, it’s brutal.
The operations that are succeeding? They’re establishing feed cost hedging strategies and maintaining margin buffers. That sounds conservative, but it’s what keeps you in the premium game when markets get choppy.
One producer told me:
“We started treating component consistency like a quality control issue rather than just hoping the cows would deliver. Changed everything about how we approach nutrition planning.”
Component Level
Premium Range
Market Impact
Implementation Strategy
Butterfat 4.2%+
$0.50-$1.00/cwt
Immediate premium pricing
Precision feeding, genetic selection
Protein 3.3%+
$0.50-$1.00/cwt
Enhanced cheese-making value
TMR optimization, breed focus
Combined Premium
$1.00-$2.00/cwt
Maximum market positioning
Integrated approach, consistent monitoring
Technology Timing (This Is Where It Gets Tricky)
Here’s something that’s been on my mind… robotic milking systems show significant labor efficiency improvements, but the capital requirements are still major barriers for many operations. The producers I’m seeing succeed aren’t rushing into technology for technology’s sake — they’re aligning tech adoption with premium positioning goals.
Are you looking at automation as a labor solution or as part of your premium positioning strategy? There’s a significant difference in ROI depending on how you approach it.
Consider this: if your robotic system provides you with better udder health data, more consistent milking intervals, and detailed cow-level production tracking, you’re not just saving labor costs — you’re laying the groundwork for premium quality claims.
Success Story: What Premium Positioning Actually Looks Like
“We’re not chasing technology. We’re chasing sustainability — both environmental and financial.”
Their selective dry cow therapy means 89% of cows only receive teat sealant, and their mastitis management keeps problems minimal. That’s the kind of operational excellence that enables premium positioning. They’re not just producing milk — they’re producing data, consistency, and quality metrics that tell a story consumers will pay for.
However, what really impressed me about their approach was that they didn’t try to revolutionize everything at once. They focused on getting their systems right first, then built the premium positioning on top of that solid foundation. A smart sequence.
Where Do You Start? (The 90-Day Reality Check)
So how do you actually capitalize on this? Here’s what I’m seeing work consistently:
Month 1: Evaluate Your Foundation. Start by assessing your current butterfat and protein numbers. Are they above average? Can you improve them through genetics or nutrition changes? If you’re already producing premium components, you may be closer to achieving a premium positioning than you think.
Month 2: Test the Market. Launch limited premium product tests — perhaps through direct sales to local restaurants or at a farmers market. Start small — the key is learning what resonates with your local consumer base without making major infrastructure investments.
Month 3: Scale and Educate. Expand on what’s working while building consumer education around your value proposition. This is where many operations stumble — they don’t invest enough in explaining why their product commands a premium.
Consumer education costs typically run higher than initial projections (this appears to be a consistent trend across regions), but successful premium brands see customer acquisition costs pay back within 8-12 months through enhanced margins. The key is patience and consistency — not every marketing dollar pays off immediately, but the cumulative effect builds powerful brand recognition over time.
What questions are you asking yourself about your own operation right now? Because that’s usually where the best opportunities hide.
The Bottom Line: Why This Matters Now
What’s most significant about this shift is that it’s not just about riding a trend — it’s about building sustainable competitive advantages through operational excellence and a clear value proposition. Consumer retreat from alternatives is creating opportunities that won’t last forever.
Are you positioning your operation to benefit from these market dynamics? Because the window for establishing premium market positioning is open right now, but it won’t stay that way indefinitely. The butterfat numbers don’t lie, and neither do consumer preferences.
The producers who understand this shift and act on it strategically — they’re the ones who’ll thrive over the next decade. What strikes me as fascinating is how this isn’t really about choosing between technology and tradition, or between local and global markets.
It’s about understanding that consumers will pay for quality when they understand what they’re getting. The question is whether you’re ready to deliver that quality and tell that story effectively.
Between you and me, the evidence is clear: there’s never been a better time to be producing really good milk. The challenge isn’t the market opportunity — it’s having the systems and storytelling capability to capture it.
Bottom line? This isn’t about fighting plant-based… it’s about capturing the premium market they accidentally created for us.
What are you doing this week to find out where you fit in? And more importantly… what’s stopping you from taking that first step toward premium positioning? Let me know in the comments below.
Complete references and supporting documentation are available upon request by contacting the editorial team at editor@thebullvine.com.
Learn More:
The Secret to High Components: It’s Not Just Genetics, It’s Strategy – This piece offers practical, actionable strategies for optimizing your herd’s nutrition. It moves beyond theory to reveal specific feed management techniques you can implement immediately to boost butterfat and protein, directly impacting your premium potential and profitability.
Beyond the Milk Check: Decoding 2025’s Dairy Market Realities – Go deeper into the economic forces shaping today’s dairy landscape. This analysis breaks down the market fundamentals, pricing models, and risk factors for 2025, helping you build a resilient business strategy that capitalizes on long-term consumer trends.
Genetics in the Premium Era: Are You Breeding for the Right Traits? – Discover how strategic genetic selection is the ultimate tool for premium positioning. This article explores which traits—from A2 beta-casein to specific milk proteins—are driving value and how to build a breeding program that future-proofs your herd’s profitability.
The Sunday Read Dairy Professionals Don’t Skip.
Every week, thousands of producers, breeders, and industry insiders open Bullvine Weekly for genetics insights, market shifts, and profit strategies they won’t find anywhere else. One email. Five minutes. Smarter decisions all week.
Think co-op loyalty pays? Lactalis just proved corporate processors can outbid tradition. Time to shop your milk?
EXECUTIVE SUMMARY: Look, I’ll be straight with you over this coffee—the old way of thinking about processor relationships just died. While most producers are still married to their co-op out of habit, Lactalis dropped $2.8 billion to control the entire value chain from your bulk tank to the grocery shelf. Here’s what that means for your operation: we’re facing 5,000 unfilled dairy jobs by 2030, feed costs that’ll swing 12% based on your protein strategy, and component premiums that could put an extra $0.85 per hundredweight in your pocket if you play this right. The global consolidation isn’t some distant threat—it’s reshaping who gets paid what for milk right now, and operations maintaining multiple processor relationships are keeping margins above regional averages while others watch profits shrink. This isn’t about being disloyal to your co-op; it’s about positioning your farm to thrive when fewer buyers control more of the market. You need to diversify your milk marketing yesterday, because the producers who adapt to this new reality will be the ones still farming profitably five years from now.
KEY TAKEAWAYS
Cut labor dependency by 40% through strategic automation investments With robotic milking systems delivering 18-24 month paybacks and 2025’s labor crunch accelerating, contact your equipment dealer this month to evaluate systems that can handle your current volume while reducing your reliance on increasingly scarce workers.
Boost your milk check $0.85/cwt through component optimization strategies Track your butterfat and protein percentages monthly instead of yearly—operations focusing on genetic selection for components are capturing premiums that commodity-focused farms are missing in today’s processor-driven market.
Diversify processor contracts to capture 15-20% higher margins Start conversations with at least two additional milk buyers before year-end—farms maintaining multiple processor relationships are outperforming single-buyer operations as consolidation reduces competition and bargaining power.
Lock in feed efficiency gains worth $1,200+ per cow annually Implement precision feeding systems now while corn prices stabilize around $4.20/bushel—operations optimizing ration delivery are cutting feed waste 12% and improving milk production 3% simultaneously.
Position for 2025’s tighter margins through genomic-guided breeding decisions Begin genomic testing this breeding season if you haven’t already—the ROI on better genetic decisions pays back within 18 months as component-based payments become the industry standard.
Look, I’ve been watching consolidation creep through this industry for years, but what just happened with Lactalis… this one hits different. When a French giant drops $2.8 billion to grab Fonterra’s crown jewels—Anchor, Mainland, Western Star, Perfect Italiano—every producer from Wisconsin’s rolling hills to New Zealand’s green pastures needs to wake up.
The Australian Competition and Consumer Commission gave the green light on July 10, and here’s what caught my eye: they found “limited overlap” because Lactalis requires a steady year-round supply, while Fonterra peaks with its spring flush. The timing was also smart. With Australia’s tougher merger laws—developed in response to concerns over market concentration—kicking in next year, getting this deal done now made perfect sense.
But here’s the thing that should keep you up at night… this isn’t just about brands changing hands. We’re watching the reshaping of how milk gets from your bulk tank to the consumer’s fridge.
What Actually Happened—And Why Your Cooperative Loyalty Just Got Complicated
The thing about Lactalis that most producers don’t realize is that They’re not just buying consumer brands—they’re securing the entire value chain. Processing capacity, distribution networks, shelf space… that’s real power in this game.
I was speaking with producers at the recent Wisconsin conference, and the consensus is clear: when processors control premium brands, they control the margins. According to June 2025 USDA data, Class III milk prices reached $18.82 per hundredweight, which is decent, but the real money is downstream.
What strikes me about this deal is the timing with feed costs. The USDA is projecting corn at around $4.20 per bushel, which should ease pressure on your grain bill. But—and here’s the kicker—soybean meal’s still expensive. So yeah, energy costs might drop, but protein? That’s a different conversation entirely.
Average Milk Component Premiums per Hundredweight by Processor Type
Are you staying with your co-op out of habit or strategic advantage? Because the game just changed.
The Labor Reality That’s Forcing Everyone’s Hand
What’s happening with labor right now is… well, it’s forcing decisions nobody wanted to make. We anticipate 5,000 unfilled dairy positions across North America by 2030, and that’s being conservative. With 51% of the workforce being immigrant labor and political winds shifting… you can see where this goes.
I was at a producer meeting in Minnesota last month—you know how these things go, the real conversations happen over coffee—and automation keeps coming up. Not because producers want robots, but because they have to consider them. Labor’s just not there like it used to be.
And here’s the connection to the Lactalis deal: companies with operational advantages—such as breaking even at 85% plant utilization, compared to the 95% typically achieved by greenfield projects (i.e., brand-new facilities built from the ground up)—can offer better milk prices because they’re more efficient. Current FSA loan rates at 5% for operating loans make scaling up expensive for smaller players.
How the Big Players Are Actually Winning (And What That Means for Your Butterfat Numbers)
What’s critical to understand about companies like Lactalis? It’s not just size—it’s operational sophistication. When you own brands that command premium shelf space, you can afford to pay component premiums that commodity processors can’t match.
I keep hearing about operations getting better premiums for high-protein milk, though the exact numbers vary by region. In the Upper Midwest, some producers are seeing solid component premiums. California’s a different story with transport costs. And if you’re in the Southeast, where processing options are becoming increasingly scarce… geography becomes destiny.
What’s particularly noteworthy is how this plays out seasonally. Spring flush in Wisconsin versus summer heat stress in Texas—processors with diverse geographic footprints can balance these swings better than regional players.
The Global Picture That’s Reshaping Your Local Options
Here’s what keeps me up at night: this isn’t just happening here; it’s happening everywhere. Over in Europe, there’s serious talk about cooperative mergers. And look at what happened with Dean Foods—when processing capacity disappears, producers feel it immediately.
Australia has recently lost processing facilities, which increases transport costs and reduces competitive pressure on milk pricing. It’s basic economics, but the implications for individual operations are real.
What’s fascinating is how different regions are adapting to these changes. New York producers I know are diversifying processor relationships faster than their neighbors. Pennsylvania producers are getting more aggressive about component optimization. And in California? Some are exploring direct-to-consumer options they had never considered before.
The Uncomfortable Question About Your Current Marketing Strategy
Look, I’m going to ask something that might make you squirm: When was the last time you actually shopped for your milk? Not only have you complained about your current processor, but you’ve actually received competing bids?
Here’s the reality—consolidation’s happening whether we like it or not. The question is: how do you position your operation to benefit, rather than just survive?
First, diversify your processor relationships. Don’t put all your eggs in one basket. I know producers with three different processor contracts; the paperwork is a hassle, but the options are priceless when terms shift. Second, you must track your components relentlessly. Are you tracking butterfat and protein on a monthly basis? Because if you’re not, you’re leaving money on the table. While the USDA forecasts all-milk prices around $22.00 per hundredweight for 2025, the real money lives in the premiums.
Projected US All-Milk Price per Hundredweight (2023-2026)
What Nobody’s Talking About (But Should Be)
Here’s something that doesn’t get enough attention in these consolidation discussions: the speed of change is accelerating. What used to take five years in this industry now happens in 18 months.
Take component pricing—it’s not just about hitting targets anymore. The best operations are utilizing genomic testing (costs have dropped sufficiently that mid-sized operations can now justify it) to enhance herd genetics while optimizing nutrition for specific milk composition. We’re discussing 2-3% annual production increases with improved component profiles.
And here’s the thing about feed efficiency… with corn potentially easing but protein feed staying expensive, precision feeding systems aren’t just cutting costs—they’re optimizing for the components that processors are willing to pay for.
Automation isn’t a luxury anymore. With labor shortages accelerating and wage pressures mounting, precision feeding systems and robotic milking are moving from “nice to have” to “necessary to compete.” The ROI calculations have shifted dramatically in the last 18 months.
Your Next 90 Days: A Strategic Action Plan
This Lactalis-Fonterra deal isn’t just about two companies. It’s a blueprint for how the industry’s restructuring is happening, and it’s happening faster than most producers realize.
Weeks 1-2: Assessment Phase
Map your current processor relationships and contract terms
Calculate your average butterfat and protein percentages over the last 12 months
Identify your biggest operational bottlenecks (labor, feed efficiency, or milk quality consistency)
Month 1: Market Diversification
Contact at least two additional processors about potential supply agreements
Don’t just ask about base prices—dig into their component premium structures, seasonal adjustments, and contract flexibility
Begin genomic testing program if you haven’t already (ROI typically 18-24 months)
Month 2-3: Operational Upgrades
Evaluate automation opportunities with clear ROI projections
If feed costs exceed 55% of your milk income, implement precision feeding
If labor costs top $3,000 per cow annually, seriously consider robotic milking systems
The producers who will thrive aren’t necessarily the biggest—they’re the most efficient, adaptable, and strategically positioned.
The Bottom Line
Because here’s what I keep coming back to: the milk business is changing faster than it has in decades. The operations that succeed will be the ones that view consolidation as an opportunity to improve, not just grow larger.
The question isn’t whether consolidation will affect you—it’s whether you’ll be predator or prey. These giants aren’t just buying brands; they’re buying control from your farm all the way to the grocery shelf.
Are you ready to have that conversation? Because the dairy game just changed—and the smart players are already positioning themselves to profit.
Complete references and supporting documentation are available upon request by contacting the editorial team at editor@thebullvine.com.
Learn More:
The Great Debate: Is it Time for Your Dairy to Go Robotic? – This tactical guide moves beyond theory, providing a framework for evaluating if robotic milking is the right move for your herd. It details the critical financial and operational questions you must answer before investing in automation.
Navigating The Waves of Dairy Market Volatility: A Producer’s Guide – While the main article focuses on processor consolidation, this piece provides crucial strategies for managing market price risk. It reveals methods for building a resilient marketing plan that protects your margins from inevitable price swings and market cycles.
The Digital Dairy Farm: Are You Drowning in Data or Driving with it? – Your new technology generates mountains of data. This article demonstrates how to transform that raw data into actionable intelligence, revealing methods for optimizing herd health, reproduction, and overall profitability in a data-driven dairy environment.
The Sunday Read Dairy Professionals Don’t Skip.
Every week, thousands of producers, breeders, and industry insiders open Bullvine Weekly for genetics insights, market shifts, and profit strategies they won’t find anywhere else. One email. Five minutes. Smarter decisions all week.
Your poultry neighbor spends 2% on labor. You spend 25%. Here’s why that gap is about to kill traditional dairies.
You know that gut punch feeling when you’re heading out for morning milking and catch sight of your neighbor’s broiler barns? Dead quiet at 5 AM. Twenty-five thousand birds are getting fed, watered, and climate-controlled automatically while he’s probably still in bed with his second cup of coffee.
I’ve been walking through dairy operations across the heartland for thirty years now, and what really gets me about this moment we’re living through… It’s how dramatically the competitive landscape has shifted, while most of us had our heads down, just trying to get through another day. While you were scrambling to cover for another weekend no-show, your poultry and swine neighbors essentially engineered their way around the entire labor nightmare.
Here’s what keeps me up at night—and should keep you up too.
The latest data from Cornell shows that dairy operations are losing 20-30% of their production budget to labor costs. Meanwhile, those automated broiler houses down the road? They’re operating with labor costs that barely register on the spreadsheet—somewhere between 1.6%-2.4% of total expenses. Your pig farming neighbors aren’t much different, with labor costs running at around 9%.
Do the math on a million-pound operation. We’re talking about a $150,000+ annual disadvantage before you even factor in the headaches of finding reliable help who will show up on Christmas morning.
Labor cost as percentage of total production costs in Poultry, Swine, and Dairy sectors
But here’s the kicker that really frustrates me… Recent research from Cornell shows that dairy farms embracing automation are cutting their labor costs by over 21%. Some operations are seeing savings approaching 29%. Yet only about 5% of U.S. dairies use robotic milking systems.
The real stunner? Those automated farms produce 45% of our nation’s milk supply.
The consolidation everyone’s complaining about at every farm meeting? This labor-automation gap is what’s driving it. And it’s accelerating faster than most producers realize.
The Thing About Automation… Each Sector Found Its Own Sweet Spot
What strikes me about what’s happening across livestock right now is that it’s not just technology adoption. It’s a fundamental reshuffling of who stays viable and who gets priced out. Each sector found its own route through this maze, and honestly, some of the strategies were pretty brilliant.
Take poultry—those massive integrators like Tyson and Perdue basically told their contract growers, “Here’s exactly what equipment you’ll install, here’s how you’ll run it, and here’s how we’ll pay for it.” When you control everything from the hatchery to the processing plant, you can mandate technology across thousands of operations practically overnight.
It’s like having a benevolent dictator who happens to love robots… and it created a $2 billion North American automation market faster than most of us could blink.
Market size distribution of automation segments in North America for 2024
This gave equipment manufacturers something dairy has never had: guaranteed demand. They knew they had customers lined up around the block, so they invested heavily in comprehensive, integrated systems. Walk into a modern commercial broiler house today, and you’ll see climate control that adjusts automatically based on outside weather, bird age, and humidity levels. Feed delivery systems that measure rations down to the gram. Manure handling that runs on preset schedules.
The result? While you’re running three shifts to milk 1,200 cows, that broiler complex produces 25,000 market-ready birds with less than one full-time employee per house.
Now, here’s what’s particularly fascinating about swine… they found their automation catalyst in the most unlikely place—animal welfare pressure. As California’s Proposition 12 and EU regulations prompted producers to move away from gestation stalls, they faced a significant management challenge. How do you feed sows individually when they’re housed in groups?
Anyone who’s dealt with aggressive sows at feeding time knows this isn’t some theoretical problem.
Electronic Sow Feeders became the solution. These systems use RFID ear tags to recognize individual sows and dispense customized rations based on body condition and gestation stage. The global ESF market hit $1.31 billion in 2024, with projections showing it’ll reach $2.72 billion by 2032.
There’s this case study that really drove it home for me… International operations installing ESF systems are seeing dramatic workforce reductions while boosting production. One operation cut their workforce from 25 employees to just 10, while increasing output from 25 to 28 weaned piglets per sow annually.
Comparison of ROI and payback periods for key automation technologies in dairy, swine, and poultry sectors (2025 est.)
Those aren’t projections from some sales brochure. That’s real-world results.
Quick Assessment: Where Does Your Operation Stand?
Before we dive deeper, take a moment to assess your current situation honestly:
Labor Dependency Check:
How many times in the past six months have you had to milk alone because someone didn’t show up?
What percentage of your herd management decisions are delayed because you can’t find reliable help?
Are you currently paying over $18/hour for weekend milking coverage?
Technology Readiness Indicators:
Do you have consistent internet connectivity in your barn?
Can you access and interpret basic production data digitally?
Have you visited an automated operation of a similar size in the past year?
Financial Position Reality:
Can you access over $ 200,000 in capital for automation investment?
Are your current labor costs exceeding $4.00 per hundredweight?
Is your debt-to-asset ratio below 30%?
If you answered “yes” to most of these questions, you’re in the automation consideration zone. If not, we’ll discuss your options as well.
What’s Really Going on with Farm Labor (And Why It’s Getting Worse Fast)
This labor situation we’re all dealing with… it’s unlike anything I’ve seen in thirty years of working with producers. And I’m not just talking about the usual gripes about finding good help. The fundamentals have shifted in ways that make automation less of a nice-to-have upgrade and more of a survival strategy.
The Workforce Is Aging Out—Fast
The agricultural workforce is aging out, and we’re not replacing them. According to recent USDA demographic data, the average age of foreign-born farmworkers has increased significantly between 2006 and 2022. That’s not a trend—that’s falling off a cliff.
Meanwhile, immigrant workers make up 51% of the labor on U.S. dairy farms. These farms produce 79% of our nation’s milk supply. Some industry specialists I talk with think the dependency might be even higher—maybe 60% of total production relies on immigrant labor.
Think about that for a minute. More than half our milk supply depends on workers who… well, let’s be honest about the regulatory challenges they face.
The H-2A Program Dead End
However, here’s the regulatory nightmare that really gets under everyone’s skin: the H-2A guest worker program that crop farmers use. It’s legally inaccessible for year-round operations, such as dairy. The program is statutorily designed for “temporary or seasonal” work.
Perfect if you need harvest crews for three months. Completely useless if you need milkers 365 days a year.
It’s like having a fire department that only works weekdays. Doesn’t make sense, but that’s where we are.
This forces dairy into an impossible position: compete for domestic workers who often won’t do the work (and honestly, who can blame them for not wanting to work weekends and holidays?), or rely on a workforce that immigration enforcement can disrupt overnight.
Your automated competitors have largely engineered around this structural flaw in federal policy.
I was speaking with producers in California’s Central Valley last month—dairy wages have reached $22 per hour in some areas, with mandatory overtime requirements. In Wisconsin, I’m seeing $18-20 becoming the norm, especially if you want reliable weekend coverage. At those wage rates, automation payback periods collapse to 3-4 years instead of the traditional 7-10 year projections.
But what really concerns me… what happens when you simply can’t find workers at any price?
That’s not hypothetical anymore. I know of operations in the Central Valley that have had ‘Help Wanted’ signs up for eight months. Eight months. They’re not being picky—they literally cannot find people willing to do the work.
Regional Reality Check: What I’m Seeing Across Different Areas
The labor situation isn’t uniform across dairy regions, and that’s creating some interesting competitive dynamics.
California’s Central Valley: Labor costs are exceeding $ 22 per hour, but large-scale operations can still justify automation investments. The smaller 200-500 cow dairies? They’re getting squeezed hard.
Wisconsin’s Traditional Dairyland: Still seeing some family labor, but the next generation often has other opportunities. Operations that cannot transition to automation are being sold to neighbors who can.
Idaho’s Growth Corridor: New operations are being built with automation from day one. It’s becoming the baseline expectation, not an upgrade.
Texas Expansion Areas: Interesting mix—some massive automated facilities, others still trying to compete on low-cost labor. The automated ones are winning.
Northeast Pressures: Higher land costs, stricter environmental regulations, and premium labor markets are forcing faster automation adoption than anywhere else.
What’s really interesting is how this plays out differently depending on your region’s feed costs, energy prices, and local labor markets. A robotic milking system that pencils out beautifully in Vermont might struggle in parts of Texas where labor is still more readily available.
Here’s What Automation Actually Delivers (And the Numbers Don’t Lie)
Recent research from Cornell on large AMS operations revealed results that genuinely surprised even me. Farms adopting robotic milking systems saw average labor cost reductions of 21% or more, with some operations reporting savings of up to 29%.
But labor savings are just the entry fee. The real money comes from secondary benefits that compound over time.
Let me put some concrete numbers on this production boost everyone talks about. On a 500-cow herd averaging 70 pounds per day, a 7% production increase from more frequent milking generates 2,450 additional pounds daily. At current milk prices of around $22.00 per hundredweight—and everyone knows those prices fluctuate, but let’s use today’s numbers—that’s $490 in extra revenue every single day.
That’s $178,850 annually. That’s not small change. That’s new equipment money.
What’s particularly interesting is that 58% of farms adopting AMS report higher milk production, largely because robotic systems enable more frequent milking. When you transition from twice-daily conventional milking to a voluntary system where fresh cows might get milked 3+ times daily, you’re looking at production increases of 5-10% pretty consistently.
Now, the feed efficiency piece varies more by management, but automated feeding systems deliver TMR consistency that manual mixing simply can’t match. I’ve seen 1,000-cow operations save $50,000 annually simply by achieving better mixing precision and reducing waste. Even small efficiency improvements generate massive returns when you’re talking about large herds.
However, here’s where modern systems really shine—and this is something I’m seeing everywhere now—they transform you from a reactive to a proactive management approach. Health sensors that monitor for mastitis or lameness have the fastest ROI of any dairy tech at just 2.1 years, according to multiple extension studies.
Think about it. One prevented case of mastitis saves $300-$ 500 in treatment costs and lost production. Early lameness detection can save over $1,000 per cow when you factor in treatment, extended lactation impacts, and replacement costs.
As one Wisconsin producer told me after installing his first robots, “It wasn’t just about the labor savings. It was about finally being able to attend my son’s football games on a Friday night.”
The numbers add up fast when you’re managing 500+ animals. But there’s this quality of life component that spreadsheets don’t capture.
Technology Decision Tree: Finding Your Starting Point
Here’s a practical framework I use when talking with producers about where to begin:
If you’re milking 150-300 cows: Start with automated identification and health monitoring systems ($25,000-$40,000 range). These deliver quick paybacks and help you become comfortable with data management before making bigger investments.
If you’re in the 300-600 cow range: Consider partial automation—maybe start with automated feed pushers and sort gates while evaluating AMS for your next facility expansion.
If you have more than 600 cows, you’re likely already considering comprehensive automation. The question becomes integration strategy, not whether to automate.
If you’re planning new construction, Design around automation from day one. Retrofitting is always more expensive and less efficient than purpose-built facilities.
The key insight I’ve learned over the years is that You Shouldn’t try to automate everything at once. Start with your biggest pain point, prove the concept, and then expand systematically.
The Management Reality Nobody Wants to Talk About
This might surprise you, but management quality dramatically affects automation returns. I’ve seen identical AMS technology deliver wildly different results depending on who’s running the operation.
Data from dairy farms using robotic milking reveals a performance gap that’s honestly startling: the top 25% of farms achieve 4,200 pounds of milk per robot daily, while the bottom 25% manage only 2,900 pounds. That’s a 42% difference in output from identical hardware.
The difference isn’t the technology. It’s management practices—optimizing cow flow patterns, interpreting data proactively, and maintaining system efficiency standards. I’ve watched DeLaval units perform like champions on one farm and struggle on another down the road, purely because of management differences.
This reality underscores a crucial point that equipment dealers often overlook: automation isn’t a “plug-and-play” solution that compensates for poor management. Rather, it’s a powerful amplifier of whatever management capabilities you already have.
A skilled manager can leverage the technology to achieve new efficiency levels, while someone less prepared may struggle to achieve positive ROI, given the high capital and maintenance requirements.
The lesson? If you’re considering automation, invest in your management skills first. Learn to interpret data streams, optimize workflows, and monitor system performance metrics. The hardware is just the beginning.
What Separates the Top Performers
I’ve spent time on farms in that top 25% performance category, and here’s what they do differently:
Data Discipline: They check robot performance metrics every morning, not just when something breaks. Weekly performance reviews are standard.
Cow Flow Optimization: They understand that robot efficiency depends on consistent cow traffic patterns. Poor barn layout kills robot utilization.
Preventive Maintenance: They follow the manufacturer’s service schedules religiously and maintain detailed logs.
Staff Training: All staff members who work with the system receive proper training, not just the farm manager. This is huge.
Continuous Improvement: They continually tweak settings, monitor results, and make incremental improvements.
The bottom performers? They install the system and hope it runs itself. Spoiler alert: it doesn’t.
Where Dairy Stands Today—The Great Divide
The automation split is creating what I call a two-tier dairy industry, and the gap is accelerating faster than most people realize. I’ve watched this develop over the past five years, and it’s getting dramatic.
While only 13% of dairy farms utilize computerized milking systems—and that includes everything from robotic milkers to advanced parlor data systems, not just robots—these operations account for 45% of U.S. milk production. The largest operations, those running 2,500 cows or more, are the only farm-size category that’s actually growing in numbers.
What the Leaders Are Banking On
Here’s what these operations are achieving that smaller farms simply can’t match:
They’re running 100-120 cows per full-time equivalent, compared to the industry average of 50-60. They have integrated data systems enabling precision management decisions. They’ve got automated health monitoring, preventing costly treatments before they become expensive problems.
But here’s what’s interesting… it’s not just about size anymore. I’m seeing 400-cow operations outcompeting 1,000-cow dairies that haven’t embraced technology. Efficiency per cow is becoming more important than raw scale.
The Mid-Size Squeeze Gets Tighter
The brutal reality for mid-size operations? Too small to justify massive AMS investments, too large to survive on family labor alone.
These farms—typically ranging from 100 to 499 cows—face an existential squeeze between rising labor costs and their inability to match the efficiency of automated competitors.
Census data tells a stark story. Dairy farms in that 100-499 cow category took a major hit between 2017 and 2022. They’re being squeezed between large, automated operations above and small, family-owned farms below.
But mid-size operations can compete with the right automation strategy. I worked with a 500-cow operation in Wisconsin last year that invested $380,000 in two AMS units, along with automated feed pushers. Their annual labor savings are $85,000, achieved through the elimination of 3.2 full-time positions at $20 per hour.
Break-even projection: 4.5 years, with additional benefits in milk quality scores and automated health monitoring.
The key insight? You don’t need to automate everything at once. Start with the highest-impact investments and build systematically based on your operation’s specific bottlenecks.
Regional Success Stories:
Let me share some specific examples that illustrate different approaches:
Vermont Family Farm (320 cows): Installed two Lely robots in 2023. Went from working 70-hour weeks to having time for their kids’ school activities. Production increased by 8%, while labor costs decreased by 23%.
Texas Partnership (1,200 cows): Built new facility with six robots from day one. Managing 200 cows per full-time employee. Targeting 90,000 pounds per cow annually.
Wisconsin Cooperative (450 cows): Started with automated ID and health monitoring, added robotic feed pushers, now planning AMS installation for 2026. Methodical approach, proving each step.
California Corporate (2,800 cows): Full automation including robotic milking, feeding, and manure handling. Benchmarking at 105,000 pounds per cow with 1.2 full-time employees per 100 cows.
Each operation found their own path, but they all share common characteristics: management commitment to learning new systems, willingness to invest in training, and realistic expectations about implementation timelines.
What’s Coming Down the Pipeline – And It’s Not Science Fiction
Based on what I’m seeing in the field and hearing from equipment manufacturers, we’re headed toward a fundamentally different industry structure by 2035.
The global milking robot market is projected to grow from $3.39 billion in 2024 to $6.03 billion by 2029, with a compound annual growth rate (CAGR) of 15.4%. That kind of growth creates momentum that’s hard to stop.
Technology costs will decline through volume production—we’re already seeing this with health sensors and basic automation components. Management expertise will spread through producer networks and extension programs. Supply chain advantages will increasingly favor operations with consistent, traceable production data.
Here’s the stark reality… operations that delay automation past 2028 may find themselves permanently locked out of competitive markets. That’s not hyperbole—that’s mathematics when you factor in the compounding effects of efficiency gains over time.
The Technology Pipeline Isn’t Wishful Thinking
The next-generation systems currently in beta testing include AI-powered health prediction using multiple sensor inputs (three companies are currently field-testing this), robotic feed mixing and delivery systems (prototypes are running in Wisconsin and California), automated calf raising with individual feeding protocols, and supply chain integration for complete traceability.
However, what excites me most… unlike the early days of AMS, when you had to build everything from scratch, these new systems are designed to integrate with existing infrastructure. That opens up automation opportunities for farms that couldn’t justify a complete facility rebuild.
Emerging Technologies Worth Watching:
AI-Powered Predictive Health: Systems that can predict mastitis 48-72 hours before clinical symptoms appear. One prototype in Iowa claims an 87% accuracy rate.
Robotic Calf Feeders: Automated milk and starter feeding with individual growth monitoring. Early trials showed 15% improvement in weaning weights.
Drone Monitoring: Daily herd health checks using thermal imaging and behavior analysis. Still early, but fascinating potential.
Voice-Activated Management: Systems you can query about specific cows or production metrics using natural language. Sounds gimmicky, but surprisingly practical in field conditions.
The key insight? These aren’t replacing human judgment—they’re amplifying it. The successful farms of 2030 will be those that learn to work with these tools, not against them.
Your Decision Framework—Where Do You Really Stand?
The path forward depends entirely on your operation’s current position and resources. Here’s how successful producers I work with are thinking through this decision—and it’s not always about having the biggest checkbook.
Be Brutally Honest About Financial Readiness
First, financial readiness. You need debt-to-asset ratios below 30%, consistent positive cash flow for at least three years, access to $ 200,000 or more in investment capital (whether in cash or credit), and, most importantly, management capability for learning new systems.
Current labor costs exceeding $4.00 per hundredweight are a red flag. Difficulty finding qualified workers—when was your last successful hire that lasted more than six months?
However, I’ve noticed something interesting… some of the most successful automation adoptions I’ve seen weren’t necessarily those with the most financial resources. They were the ones with the clearest understanding of their current inefficiencies and the strongest commitment to learning new systems.
Different Strategies for Different Farm Sizes
For 200-400 cow operations, I typically recommend starting with health sensors and automated identification systems, with an investment range of $25,000-$ 50,000. Add automated feed pushing and sorting gates next. Only then evaluate AMS adoption after proving you can manage the data and workflow complexity.
Target: 15-20% labor cost reduction in Year 1.
For 400-800 cow operations, The strategy shifts. Implement comprehensive herd management software first—this is your foundation. Install 2-3 AMS units with integrated health monitoring as the centerpiece. Automate feeding and manure handling simultaneously to capture system synergies.
Target: 25-30% labor cost reduction within three years.
Operations with more than 800 cows: You should design new facilities around automated workflows from day one. Integrate all systems through a common data platform; avoid cobbling together different vendors whenever possible. Implement predictive analytics for proactive management decisions.
Target: match industry leaders at 100+ cows per full-time equivalent.
Automation Readiness Checklist
Before you write any checks, work through this assessment honestly:
Technical Infrastructure:
Do you have reliable high-speed internet in your barns?
Can your electrical system handle additional automated equipment?
Is your barn layout compatible with robotic systems, or would you need major modifications?
Management Readiness:
Are you comfortable using smartphones and computers for farm management?
Do you currently track and analyze production data on a regular basis?
Can you commit time to learning new systems and training staff?
Financial Position:
Can you access capital without jeopardizing farm financial stability?
Do you have a cash flow cushion for the transition period?
Have you calculated realistic payback periods based on your specific situation?
Operational Fit:
Does your current herd health and fertility performance justify investing in automation?
Are your facilities and cow flow patterns compatible with automated systems?
Do you have backup plans for system downtime?
If you can’t honestly answer “yes” to most of these questions, focus on getting ready before investing in major automation.
Your 90-Day Action Plan
Here’s the strategic approach I recommend to producers who are serious about making this transition:
Days 1-30: Assessment and Education Phase
Complete an honest assessment of current labor costs, efficiency metrics, and management capabilities. But don’t just look at spreadsheets—actually time your current processes. How long does milking really take? What’s your actual labor cost per hundredweight?
Visit three automated operations similar to yours, not bigger operations that might not be relevant to your situation. Ask about the real challenges, not just the benefits. What would they do differently? What surprised them about the transition?
Get concrete ROI projections from at least two equipment providers. Make sure they’re using your actual numbers, not industry averages.
Days 31-60: Decision and Planning Phase
Secure financing pre-approval if moving forward. This isn’t just about the equipment cost—factor in facility modifications, installation, training, and the cash flow required for the transition period.
Select a technology partner based on service capability, not just equipment price. The cheapest system often ends up being the most expensive when you factor in downtime and poor support.
Begin management training on data interpretation and system optimization. Many equipment providers offer online courses—start now, not after installation.
Days 61-90: Implementation Preparation
Finalize the installation timeline in coordination with seasonal demands. Don’t install robots during your busy season or when you’re short-staffed for other reasons.
Prepare staff for workflow changes—this is often overlooked but critical. Resistance to change kills more automation projects than equipment failures.
Establish baseline metrics for measuring improvement post-installation. If you don’t know where you started, you can’t prove where you ended up.
Common Mistakes to Avoid
From watching dozens of automation implementations, here are the mistakes that kill ROI:
Underestimating the learning curve: Plan for 6-12 months to fully optimize any new system. Budget for this transition period.
Skimping on training: Every person who interacts with the system requires proper training, not just the farm manager.
Poor vendor selection: The cheapest equipment often comes with the most expensive service problems.
Facility compromises: Trying to retrofit systems into poorly designed facilities. Sometimes you need to build properly first.
Unrealistic expectations: Automation amplifies good management but won’t fix fundamental problems.
The successful implementations I’ve seen all share one characteristic: realistic expectations combined with commitment to mastering the new systems.
The Final Reality
After thirty years in this business, I’ve never seen competitive gaps develop this fast or this decisively. At 20-30% of production costs, labor represents your largest controllable expense after feed. Every day you delay automation, competitors bank efficiency advantages that compound over time.
The technology has matured beyond the early-adopter phase. Financing options have expanded with the introduction of USDA programs and equipment leasing. Competitive pressure has reached a critical threshold, where automation transitions from optional to essential for long-term viability.
The automation divide isn’t just about technology—it’s reshaping who survives and who thrives in the dairy farming industry. Non-adopters, particularly small- to mid-sized farms, will face an existential squeeze between rising labor costs and the efficiency advantages of automated competitors. For these operations, the future is stark: automate, find a niche market, or exit the industry.
The producers who’ll succeed are those who view automation as a strategic investment in long-term competitiveness, not just a labor replacement tool. They understand that the real value isn’t in the robots themselves—it’s in the data, efficiency, and management capabilities these systems enable.
That quote from the Wisconsin producer about finally being able to attend his son’s football games is a powerful reminder that automation’s value isn’t just financial—it’s deeply personal. It’s about regaining time, balance, and the ability to live life on your own terms amid the relentless demands of modern dairy farming. The freedom to choose when you work, rather than being enslaved by the twice-daily milking schedule, represents a quality of life transformation that no spreadsheet can fully capture.
The choice is binary at this point: invest in automation now while you can still finance and implement it strategically, or face the inevitable squeeze when circumstances force your hand. The window for strategic decision-making is closing faster than most people realize.
In ten years, will you be the one sleeping in while your robots handle the 4 AM milking? Or will you still be the one driving past automated operations, wondering what might have been?
The technology is here. The financing is available. The competitive pressure is real. Choose wisely, and choose soon.
Questions for Your Next Producer Meeting:
How do your current labor costs per hundredweight compare to these benchmarks? What would a 20% reduction in labor costs mean for your operation’s profitability and growth potential? If reliable labor becomes unavailable at any price, what’s your backup plan?
KEY TAKEAWAYS
Labor efficiency doubles with AMS implementation – Automated farms achieve 100-120 cows per FTE compared to 50-60 conventional, translating to direct savings of $1.06-$1.36 per cwt. Start by calculating your current labor cost per hundredweight—if it’s above $4.00, automation pays for itself in 3-4 years at today’s wage rates.
Health sensors deliver fastest ROI in the barn – Average payback of just 2.1 years by catching mastitis and lameness early, saving $300-1,000 per prevented case. Begin with automated ID and monitoring systems ($25,000-40,000 range) to get comfortable with data management before bigger investments.
Feed efficiency gains compound rapidly at scale – Automated feeding systems reduce waste by 25% while improving TMR consistency, generating $50,000+ annual savings on 1,000-cow operations. Install robotic feed pushers first—they have a 2.1-year payback and integrate easily with existing systems.
Production increases of 5-10% are standard with robotic milking – 58% of AMS adopters report higher milk yields due to more frequent voluntary milking. On a 500-cow herd averaging 70 lbs/day, that’s an extra $178,850 annually at current milk prices—enough to justify the technology investment alone.
The competitive gap widens daily in 2025 – Operations delaying automation past 2028 risk permanent lockout from competitive markets as efficiency advantages compound. If you’re planning new construction, design around automation from day one—retrofitting costs 40% more and delivers inferior results.
EXECUTIVE SUMMARY
Look, I’ve been walking dairy operations for thirty years, and I’ve never seen anything like what’s happening right now. The automation divide isn’t just changing the game—it’s completely rewriting who survives in dairy farming. Here’s the brutal math: while you’re bleeding 20-30% of your budget on labor costs, automated poultry operations run at 1.6-2.4%. That’s a $150,000+ annual disadvantage on a million-pound operation before you even factor in the headache of finding reliable weekend help. Cornell’s latest research shows farms embracing robotic milking are cutting labor costs by over 21%, with some seeing savings approaching 29%. Meanwhile, those automated operations are managing 100-120 cows per full-time employee versus your 50-60. The kicker? Only 5% of US dairies use robotic systems, but they’re producing 45% of our nation’s milk supply. The window for strategic automation decisions is closing fast—and honestly, you can’t afford to wait much longer.
Complete references and supporting documentation are available upon request by contacting the editorial team at editor@thebullvine.com.
5 Technologies That Will Make or Break Your Dairy Farm in 2025 – Identifies emerging smart technologies delivering 40% mortality reduction and 20% yield increases, with specific ROI timelines and implementation priorities for competitive advantage.
The Sunday Read Dairy Professionals Don’t Skip.
Every week, thousands of producers, breeders, and industry insiders open Bullvine Weekly for genetics insights, market shifts, and profit strategies they won’t find anywhere else. One email. Five minutes. Smarter decisions all week.
I’ve been covering this industry for over two decades now, and what I’m seeing in the numbers—well, it’s making me question everything we think we know about “efficient” dairy markets. But here’s the thing that really gets to me: while we’re watching good farmers get hammered by market volatility (people who’ve done everything right, mind you), there’s this whole system just 300 miles north that’s achieving something we can barely imagine.
The Coffee Shop Conversation That Changed Everything
A sentiment I hear often was perfectly captured in a conversation with a producer from Wisconsin, who said something that’s been rattling around in my head ever since:
“I’m doing everything the extension guys tell me to do, but I can’t plan past the next milk check because who knows what prices will do.” — Mike, Watertown, Wisconsin
That got me digging into some data that… well, let’s just say it challenges pretty much everything we’ve been told about free markets and farm efficiency. Same Holstein genetics. Same robots. Same nutritional consultants. Same level of management skill and dedication. But one group of farmers is building generational wealth while the other group is filing for bankruptcy at rates that would trigger congressional hearings in any other industry.
The difference isn’t management—it’s the system.
And what’s really eating at me… we keep hearing about how Canada’s supply management is “inefficient” and “protectionist,” but their farmers aren’t the ones dumping milk or losing sleep over price forecasts. Meanwhile, our “efficient” system just required $42.4 billion in direct government payments in 2025—a 354% increase from 2024.
Something doesn’t add up, does it?
When USDA Forecasts Become Financial Weapons
U.S. Milk Price Volatility vs. Canadian Farmgate Price Stability (2015-2025)
Picture this scenario (and I guarantee you’ve lived some version of it): January 2025, you’re at your kitchen table with the calculator out, trying to make sense of that equipment loan for the new double-eight parlor. USDA’s milk price forecast looks decent—nothing spectacular, but workable if things stay reasonably steady.
Four months later… that same forecast drops $1.95 per hundredweight. Your equipment payment didn’t magically decrease. Neither did your feed costs or labor expenses. But the revenue projection that justified every major decision you made this year? Gone.
Tom runs 280 cows in Wisconsin, and he put it perfectly:
“It’s like trying to hit a moving target while blindfolded. How do you make a 10-year investment decision when you can’t predict next quarter’s milk check?” — Tom, Wisconsin
Meanwhile—and this is where it gets interesting—Canadian producers experienced exactly what their system promised them: a farmgate price adjustment of 0.0237%. That’s less than a penny per liter. The kind of predictable variation that lets you actually plan multi-year capital investments with confidence.
What strikes me about this is the mathematical reality most of us don’t want to face. When you can predict cash flow, you can optimize investments. When you can’t… every strategic decision becomes a coin flip with your farm’s survival.
The Robot Paradox: Same Technology, Different Worlds
Here’s a story that really drives the point home. Last spring, I visited two farms on the same day. First stop: a 120-cow operation in Ontario that had just installed their second robot. The farmer showed me spreadsheets—payback calculated at eight years, cash flow projections extending to 2032, financing structured around predictable milk price increases.
“We know what milk will be worth. That makes everything else possible.” — Ontario dairy farmer
Second stop: a 240-cow operation in Wisconsin that had been considering robots for three years but couldn’t pull the trigger:
“Every time I run the numbers, I get a different result depending on what milk price assumptions I use. How do you make a quarter-million-dollar investment when you can’t predict revenue?” — Wisconsin dairy farmer
Same technology. Same potential benefits. Same management capability. But completely different investment climates.
Take a $250,000 robotic milker—pretty standard investment these days. In the Canadian system, that pencils out to a 7-10 year payback with high confidence. Here in volatility-land? Try 15+ years, assuming you don’t get wiped out by a price crash before you break even.
The Numbers That Should Terrify All of Us
Comparison of Chapter 12 bankruptcy filings in US vs Canada (2015-2025)
Canada during the same period? Zero. Not just low. Statistically negligible.
We’re not talking about slight differences in failure rates here. We’re not talking about the difference between systematic farm destruction and systematic farm preservation.
And what really gets to me—this isn’t about Canadian producers being better managers or having access to superior genetics. I’ve walked through barns in both countries. These are the same DeLaval parlors, the same breeding programs, often the same feed consultants. The farmers are equally skilled and dedicated.
The difference is systematic. One system is architected for survival. The other accepts high failure rates as the price of “market freedom.”
Farm Consolidation: When “Efficiency” Becomes Desperation
Comparison of average herd size and farm consolidation rates in Canada and the US (2016-2021)
You want to talk about consolidation? American dairy farm numbers dropped 34% between 2016 and 2021. Canada? Just 11% in the same period.
Now conventional wisdom says the US operations must be more efficient, right? Wrong. They’re not expanding because they’ve identified optimal scale economies. They’re expanding because they need volume to weather price volatility.
It’s survival strategy masquerading as efficiency optimization.
Canadian operations with 100 cows are profitable, stable, and planning capital improvements with confidence. Not because they’re protected from competition, but because they’re protected from financial chaos.
The Mental Health Crisis We Don’t Talk About
Behind every bankruptcy filing is a farm family facing financial ruin, but the human cost goes way beyond the operations that actually fail. Recent research confirms what those of us in rural communities already know—US farmers are 3.5 times more likely to die by suicide than the general population. The primary driver? Financial volatility.
I’ve been to too many farm auctions that shouldn’t have happened. Good farmers, solid managers, excellent stewards of the land—wiped out not by poor decisions but by market forces completely beyond their control.
Sarah ran a 180-cow operation outside of Fond du Lac. Excellent manager, invested in genomics, maintained detailed records, followed every extension recommendation. But three consecutive years of price volatility, compounded by some equipment failures and a spike in feed costs, and she couldn’t service the debt anymore.
“I wasn’t lazy. I wasn’t incompetent. I was just unlucky with timing.” — Sarah, former dairy farmer, Wisconsin
That’s the brutal reality of our system—it punishes bad timing just as harshly as bad management. Maybe more harshly, because at least bad management gives you something you can fix.
Canadian producers face their own stressors, sure—particularly around quota debt levels and succession planning—but they’re shielded from the existential uncertainty that characterizes American dairy production. Studies show that 58% of Canadian producers meet criteria for anxiety and 35% for depression, but these rates, while concerning, reflect manageable business pressures rather than survival uncertainty.
The $35 Billion Asset Most Americans Can’t Fathom
Canadian dairy farmers collectively own over $35 billion in production quota. That’s government-issued licenses to produce milk, and in provinces like Alberta, they’re trading for $58,000 per kilogram of butterfat.
A new entrant starting a 100-cow operation in Ontario faces roughly $840,000 in quota costs before buying their first cow or pouring their first concrete pad.
Sounds insane, right? Until you realize that quota also represents $840,000 in asset value that appreciates over time, provides stable returns, and never goes bankrupt.
I was talking with Dave, who runs a 90-cow operation near Woodstock, Ontario:
“People don’t understand. This quota isn’t just a cost—it’s our retirement fund. My neighbor sold his quota last year and bought a condo in Florida. Try doing that with your milk contracts.” — Dave, Ontario dairy farmer
The Hidden Cost of “Free” Markets (Spoiler: They’re Not Free)
Let’s talk about the elephant in the room—subsidies. Americans love criticizing Canadian supply management as “subsidized agriculture” while praising our “free market” system. But the math tells a different story.
Canadian dairy farmers receive exactly zero dollars in direct government subsidies for milk production. Their support comes from higher consumer prices, which are transparent, predictable, and paid by the people who consume the products.
What’s fascinating about the political dynamics: The cost of the US system is hidden in complex farm bills and emergency appropriations that most taxpayers never see directly. The cost of the Canadian system hits every consumer at the grocery checkout.
Which system do you think faces more political pressure?
Current Market Reality: What July 2025 Looks Like from the Trenches
The financial pressures are intensifying across the Midwest, and I’m seeing it in conversations everywhere I go. All-milk prices are sitting at $22.00 per hundredweight—not terrible, but not great when you factor in everything else happening.
What does that tell us? Producers are culling hard, selling replacements into the beef market, and avoiding long-term investments needed to maintain herd size.
It’s the classic squeeze play. Input costs that don’t adjust downward as fast as milk prices drop, but adjust upward faster when milk prices rise.
The Milk Dumping Nightmare
You want to talk about systemic inefficiency? Let’s discuss milk dumping—a phenomenon that’s virtually non-existent in Canada but periodically devastates US producers.
During the COVID-19 pandemic, farmers across the country were forced to dump millions of gallons of milk into manure pits and fields. An estimated 7% of all milk produced in one week was discarded. Class III milk futures fell by over 30%.
The economic consequences are severe, but the kicker—the government often steps in with taxpayer-funded compensation programs afterward. This cycle of overproduction, price collapse, waste, and government bailout represents massive systemic inefficiency.
Meanwhile, Canada’s supply management system is specifically designed to prevent such structural surpluses by aligning national production with anticipated domestic demand.
What You Can Actually Do About This (Implementation Strategies for 2025)
Look, individual producers can’t change the fundamental policy architecture, but we can adapt our strategies to survive and thrive within the system we have.
Strategy One: Optimize for Liquidity, Not Leverage
Canadian producers can afford to optimize for leverage because their cash flows are predictable. American producers need to optimize for liquidity because our cash flows are chaotic.
What does this look like practically?
Maintain higher cash reserves than traditional ratios suggest
Structure debt with flexible payment schedules and seasonal adjustments
Prioritize equipment leasing over purchasing for major capital items
Develop multiple lines of credit before you need them
Tom survived the 2019 downturn specifically because he prioritized liquidity over maximizing leverage ratios:
“My banker thought I was being too conservative. But when prices crashed, I could make payments while my neighbors couldn’t.” — Tom, Wisconsin dairy farmer
Strategy Two: Component-Focused Production
With butterfat premiums hitting record levels—we’re seeing spreads of $1.50+ over protein in some markets—component management becomes crucial for margin optimization.
This isn’t about becoming a “diversified farming operation”—it’s about creating revenue streams that aren’t correlated with milk prices.
Examples I’m seeing work:
Custom farming during non-peak labor periods
Value-added products sold direct to consumers
Renewable energy generation (solar installations are becoming common)
Fee-for-service breeding and reproduction programs
Alicia runs 160 cows near Lancaster and generates about 15% of her gross revenue from custom heifer raising:
“When milk prices tank, heifer raising prices usually hold steady or even increase as people cut back on replacements.” — Alicia, Pennsylvania dairy farmer
Environmental and Sustainability Considerations: The Hidden Advantage
The regional concentration we’re seeing in American dairy—with massive operations in California, Idaho, and Wisconsin—creates environmental pressure points. When you’ve got 5,000-cow operations clustered together, you’re dealing with manure management challenges that 100-cow operations spread across the landscape simply don’t create.
What’s particularly noteworthy is how Canadian farms integrate into their local ecosystems. I visited operations in Quebec where dairy farms anchor sustainable crop rotations that support soil health across entire watersheds. Try replicating that with industrial-scale operations.
The Technology Investment Climate: Building for Tomorrow or Surviving Today?
The difference in investment climates really becomes apparent when you look at technology adoption patterns. Canadian producers are consistently early adopters of efficiency technologies because they can predict the payback periods.
I was at a robotics conference last year where the contrast was stark. Canadian producers were asking detailed questions about integration with existing systems and long-term service contracts. American producers were focused on lease structures and exit strategies.
“The Canadians plan like they’ll be farming forever. The Americans plan like they might not be here next year.” — Equipment dealer at industry conference
Regional Variations: It’s Not Just Country vs. Country
Upper Midwest dairy operations—traditional family farm country—are experiencing the most stress from this volatility.
Minnesota and Wisconsin producers are caught in a particularly tough spot. They don’t have the scale advantages of Western operations or the proximity to processing that Northeast producers enjoy. They’re competing on efficiency alone in a market that rewards volume.
Meanwhile, Canadian producers in similar climatic and geographic conditions—Ontario and Quebec—maintain profitable operations at much smaller scale because their system isn’t optimized for volume competition.
I spent time in both Sauk County, Wisconsin, and Wellington County, Ontario, over the past few years. Similar soils, similar climate, similar farming traditions. But walking through those operations felt like visiting different industries entirely.
The Succession Crisis: When Stability Creates Its Own Problems
Canadian supply management shows its limitations when it comes to succession planning—it becomes incredibly complex when farms are worth millions primarily because of government-created assets.
I met with a family near Sherbrooke, Quebec. Third-generation dairy farmers with 85 cows and quota worth nearly $3 million. The retiring generation needs to cash out that quota value for retirement, but the next generation can’t secure financing to buy non-productive assets from their parents.
This creates what researchers are calling a “liquidity trap”—farms that are consistently profitable operationally but impossible to transfer generationally.
Compare that to US operations, where succession crises are driven by unpredictability rather than asset values. American farms fail to transfer not because they’re too valuable, but because they’re too risky.
The Policy Innovation Question: Learning Without Copying
So what can American dairy learn from Canadian success without adopting Canadian constraints?
Some ideas I’m hearing discussed:
Regional Production Cooperatives: Voluntary associations that could coordinate production planning within defined geographic areas. Not quotas, but collaborative forecasting that helps prevent the overproduction cycles that create crises.
Counter-cyclical Price Floors: Automatic triggers that activate support when milk prices fall below calculated break-even levels for extended periods. Less reactive than current disaster programs, more targeted than blanket subsidies.
Risk Management Innovation: Expanding programs like DMC to cover more production and lengthening coverage periods. Current coverage caps at 5 million pounds—roughly the output of a 200-250 cow herd—which leaves larger operations exposed.
The key insight from Canada isn’t that government control is inherently better—it’s that systematic stability enables long-term thinking, which enables sustainable operations.
Financial Resilience Audit: Where Does Your Operation Stand?
Given everything we’ve discussed, it’s worth conducting an honest assessment of your operation’s resilience. Here are the questions that really matter:
Cash Flow Predictability: Can you forecast net income within 15% accuracy six months out? If not, you’re operating with excessive uncertainty for strategic decision-making.
Debt Structure: Is your debt service manageable if milk prices drop $3/cwt for 12 months? That’s not worst-case—that’s recent history.
Investment Recovery: For capital investments over $100,000, do you calculate payback periods under multiple price scenarios? If you only model “normal” conditions, you’re not modeling reality.
Market Risk Exposure: What percentage of your milk is sold at fixed prices versus spot market? Operations with less than 40% price protection are essentially speculating on volatility.
Looking Forward: The Next Five Years
Current trends suggest we’re heading into a period of increased volatility, not decreased. Climate patterns are becoming less predictable, trade relationships are increasingly unstable, and consumer preferences are shifting faster than ever.
The US dairy operations that thrive over the next five years will be those that acknowledge volatility as a permanent feature, not a temporary aberration, and structure their businesses accordingly.
Canadian operations will face their own challenges—particularly around trade pressure and succession planning—but they’ll approach those challenges from a foundation of systematic stability.
The Uncomfortable Truth About American Dairy
After 25 years covering this industry, the difference between operations that survive versus those that fail isn’t primarily about management skill, genetic programs, or production efficiency.
It’s about understanding and adapting to the financial reality of the system we operate in.
Canadian supply management has achieved something remarkable—systematic farm survival in an industry where systematic farm failure has become normalized in the US. That doesn’t mean we should adopt their system wholesale, but it does mean we should learn from their success.
The uncomfortable truth is that our current system works well for large-scale, well-capitalized operations that can weather volatility and achieve economies of scale. It works poorly for mid-size operations caught in the middle, and it’s brutal for beginning farmers trying to enter the industry.
Success in American dairy in 2025 and beyond will be defined by financial resilience that can survive multiple down cycles, operational efficiency that captures available margins, and strategic positioning that plays to regional advantages.
The Choice Ahead
The choice facing American dairy producers isn’t between free markets and supply management. It’s between adapting to the volatility that characterizes our system or becoming another statistic in the bankruptcy files.
Canadian producers chose stability over opportunity. American producers chose opportunity over stability. Both systems work for their intended purposes, but only if you understand what game you’re actually playing.
The question for your operation: Are you playing to survive the game as it exists, or are you still playing by rules that don’t match reality?
Because the market doesn’t care about fairness, tradition, or what “should” work. It only cares about what does work. And right now, systematic financial resilience works better than hoping for the best while preparing for nothing.
The Canadian model isn’t perfect, but it’s produced outcomes our “efficient” system has failed to deliver: systematic farm survival, predictable investment climates, and rural communities that aren’t hollowing out from farm failures.
Whether American dairy can learn those lessons without adopting Canadian constraints remains to be seen. But one thing’s certain—continuing to do what we’ve always done will continue producing the results we’ve always gotten.
And those results include bankruptcy rates that would be considered a national emergency in any other industry.
What keeps me up at night isn’t just the statistics—it’s the realization that we’ve normalized financial chaos as the price of “freedom.” Maybe it’s time to ask whether the freedom to fail is worth the cost of systematic instability.
Your Canadian neighbors sleep better at night because their system prioritizes survival over volatility. The question is: what are we willing to learn from that success?
Look, I’ve been walking through barns in both countries for decades. Same genetics, same equipment, same dedication. The difference isn’t the farmers—it’s the system we’re operating in. Maybe it’s time we learned something from our northern neighbors who figured out how to make dairy farming sustainable instead of just survivable.
KEY TAKEAWAYS
Financial resilience beats scale every time — Canadian operations maintain 16% debt-to-asset ratios with negligible bankruptcy rates versus our 55% surge in failures, proving you can optimize for liquidity over leverage when cash flows are predictable (start building 6-month operating reserves now)
Investment confidence drives technology adoption — Stable pricing allows 18-month earlier adoption of precision dairy tech because payback calculations actually work, while our volatility makes every major purchase a gamble (consider leasing over purchasing for equipment over $100K)
Component premiums are your profit lifeline — With butterfat hitting $1.50+ spreads over protein and average tests reaching 4.36% nationally, genetic selection focused on components rather than volume could be your 2025 margin saver (audit your breeding program this quarter)
Mental health costs are measurable — US farmers face 3.5x higher suicide rates directly linked to financial volatility, while Canadian producers deal with manageable business stress rather than survival uncertainty (seriously, if you’re struggling with uncertainty, you’re not alone)
EXECUTIVE SUMMARY
So here’s what’s got me fired up—Canadian dairy farmers have essentially eliminated bankruptcy risk through supply management while we’re watching a 55% surge in Chapter 12 filings. Think about that for a second. Their average operation runs 96 cows and pencils out robotic milkers with 7-10 year paybacks, while our 377-cow “efficient” operations are looking at 15+ years if they don’t get wiped out first. The kicker? We just hit $42.4 billion in taxpayer bailouts (up 354% from 2024) while calling their consumer-funded system “subsidized.” Global dairy markets are shifting toward stability models, and frankly… maybe it’s time we paid attention. Look, I’m not saying we need to copy everything, but when your competition sleeps soundly while you’re stress-planning around $1.95/cwt forecast revisions, something’s worth learning.
Data verification: All statistics and market figures referenced in this analysis have been verified against current USDA-AMS, USDA-ERS, USDA-NASS, Statistics Canada, and industry reports published through July 2025.
Complete references and supporting documentation are available upon request by contacting the editorial team at editor@thebullvine.com.
Learn More:
Your 2025 Dairy Gameplan: Three Critical Areas Separating Profit from Loss – Reveals practical strategies for boosting profits by $500+ per cow through forage quality optimization, methionine supplementation, and transition cow management that you can implement immediately regardless of farm size.
2025 dairy crisis – Demonstrates how to build layered financial protections using DMC, forward contracts, and strategic risk management to survive the 18% milk price crash and margin squeeze hitting operations nationwide.
5 Technologies That Will Make or Break Your Dairy Farm in 2025 – Exposes the five game-changing innovations—from smart calf sensors reducing mortality 40% to AI-driven feed optimization—that separate thriving operations from those struggling to survive market volatility.
The Sunday Read Dairy Professionals Don’t Skip.
Every week, thousands of producers, breeders, and industry insiders open Bullvine Weekly for genetics insights, market shifts, and profit strategies they won’t find anywhere else. One email. Five minutes. Smarter decisions all week.
1,857 microplastic particles per kg in your premium cheese—here’s what that means for milk prices
EXECUTIVE SUMMARY: Look, I’ll be straight with you—this isn’t just a processor problem anymore. Microplastics are concentrating in cheese at levels that could impact the premiums you’re getting for high-quality milk. We’re talking about 1,857 particles per kilogram in aged cheeses, and with 80% of consumers willing to pay more for sustainably produced products, processors are scrambling to clean up their act. Here’s what really matters for your operation: plants that can’t control contamination are going to start paying less for milk, while those investing in advanced filtration are positioning themselves to pay premiums for clean product. With Class III at $18.82 per hundredweight and feed costs finally easing, this could be the quality differentiator that separates the top-tier milk contracts from the rest. The technology exists, the regulations are coming, and the early adopters are already seeing payback periods of 18-36 months. You should be asking your processor what they’re doing about this—because it’s about to affect your milk check.
KEY TAKEAWAYS
Premium Protection Play: Processors with contamination control pay 5-8% premiums above base price—audit your current contracts and push for quality-based incentives that reward clean production practices at the farm level
Feed System Audit: Check all plastic components in your feed handling system (TMR mixers, conveyors, storage) for wear patterns—replacing worn plastic parts now could prevent contamination that processors will start testing for by 2026
Milk House Upgrade: Invest in stainless steel or glass-lined equipment where possible—facilities using advanced filtration report 95% contamination reduction, and those cost savings get passed back through higher milk prices
Contract Leverage: With new EU regulations driving global standards, farms supplying export-focused processors could see 10-15% premium increases—position yourself now by documenting your contamination control measures
Technology Partnership: Work with processors investing in real-time monitoring systems like PlasticNet—these partnerships often include guaranteed minimum prices that protect against market volatility while Class III prices stabilize
You know what’s been keeping me up at night lately? It’s not feed costs or milk prices, though those are always fun conversations. It’s the fact that we’re finding microplastics in our cheese. And I’m not talking about trace amounts that require a PhD in chemistry to detect. We’re talking about numbers that make you sit up and take notice.
Recent research from Italy and Ireland has just released data that’s got the entire processing side of our industry buzzing: ripened cheeses are showing up with nearly 1,857 microplastic particles per kilogram. That’s not a typo—and it’s just the beginning of what we need to understand.
The thing about microplastics in dairy? They’re not just settling on surfaces like dust. Our own cheese-making processes are concentrating on them. When we drain whey—something we’ve been doing forever—you’d think those tiny plastic particles would wash away with the liquid. Instead, they’re binding with the curd solids, creating what I call a “concentration trap.” Fresh cheese hits around 1,280 particles per kilogram, while raw milk starts at about 350 particles per kilogram. What’s particularly fascinating is how this affects different products. High-butterfat items, such as aged cheddars and specialty cheeses—the ones that command premium prices—are showing the highest contamination levels. It’s like the microplastics have an affinity for the very products we’re trying to position as premium in the marketplace.
Microplastic contamination levels (particles per kilogram) increase across dairy products with processing intensity.
Where This Gets Real for Your Operation
Let’s talk business impact, because that’s what matters when you’re running a plant. According to recent work from PwC, approximately 80% of consumers are willing to pay more for sustainably produced goods, despite inflation impacting household budgets. That’s not just a nice-to-have statistic; it’s a market signal we can’t ignore.
I was talking to a plant manager in Wisconsin last month (can’t name names, but it’s a mid-sized operation processing about 2.8 million pounds of milk annually), and he told me something that stuck: “We spent twenty years perfecting our aging process, and now we’re discovering we might be concentrating contaminants right along with flavor compounds.”
Here’s what’s happening in our plants every day. Mechanical wear on plastic liners, seals, and films creates microscopic debris. Heat from pasteurization—especially the extended holding times we use for some specialty products—accelerates plastic degradation. Then there’s airborne contamination settling on exposed products, particularly in facilities where air filtration systems haven’t been updated in the last five years.
The FAO’s Food Safety Division has been documenting this across multiple regions, and what they’re finding aligns with reports I’m getting from colleagues in the Midwest, California’s Central Valley, and even operations in Vermont. It’s not isolated to a single region or type of facility.
The Technology Response: What’s Actually Working
Advanced Filtration Gets Real
Here’s where things get interesting—and expensive. Advanced filtration is no longer just a theory. I’ve seen plants achieve better than 95% microplastic removal using properly configured microfiltration, ultrafiltration, and reverse osmosis systems. The key phrase there is “properly configured.” You can’t just bolt on a filter and expect miracles.
A facility in New York, where I consulted last year, invested in bio-based filtration using chitosan and alginate beads. They’re seeing selective microplastic capture rates that honestly surprised me—around 87% removal for particles in the 50-150 micron range, according to research published in International Publications. The interesting part? Their product quality metrics actually improved because they were removing other contaminants simultaneously.
The Promise of Bio-Based Media
Bio-based filtration materials, such as chitosan and alginate, are gaining significant traction due to their ability to capture microplastics selectively. What’s exciting is that these materials offer a natural and sustainable approach to contamination control—something that resonates with both processors and consumers who are increasingly conscious of environmental impact.
AI Detection Changes the Game
PlasticNet and similar systems are reducing lab identification time from 4-6 hours to approximately 20 minutes, with accuracy rates exceeding 95%. Real-time monitoring during processing is becoming a reality, not just a concept from trade show demos.
But let’s be honest about the investment. Industry consensus suggests payback periods range from 18 to 36 months, depending on your scale and current contamination levels. That plant in Wisconsin? They spent six months just deciding whether to retrofit existing lines or build new ones. It’s not a decision you make over coffee.
Regulatory Reality: EU vs. US Approaches
What’s creating urgency is the regulatory landscape, and it’s developing differently on both sides of the Atlantic. The EU took the lead with Regulation 2023/2055, establishing strict limits on synthetic polymer microparticles across various industries. Phase-in periods vary by product category, but the direction is clear: intentionally added microplastics are getting banned, and contamination thresholds are getting tighter.
The US approach is more measured but equally inevitable. The FDA’s current position is that existing contamination levels don’t demonstrate health risks, but they’re quietly building enforcement frameworks. What’s telling is their recent guidance suggesting that environmental contamination—not packaging migration—is the primary source of microplastics in food. That puts the focus directly on processing environments and equipment.
For operations with international markets, the smart play is to align with EU standards now. Managing multiple compliance frameworks can become expensive quickly, and the EU requirements are likely to become the global baseline anyway.
Financial Reality: Making the Numbers Work
Class III milk prices hit $18.82 per hundredweight in June 2025—not spectacular, but stable enough to support capital investment planning. Feed costs are projected to ease with record corn crops, but here’s the thing: contamination control is becoming as fundamental as temperature control or sanitation protocols.
I’ve been tracking implementation costs across different facility sizes, and the numbers are starting to make sense. The key is understanding that this isn’t just about compliance—it’s about protecting the brand trust and product quality we’ve all worked so hard to build.
What’s Working in the Field
The most successful implementations I’ve seen share common elements. They start with comprehensive audits of plastic contact points—not just the obvious ones, but also everything from milk lines to packaging equipment. One facility discovered that its biggest contamination source was worn conveyor belt components that hadn’t been replaced in eight years.
Rather than trying to upgrade everything at once, successful operations prioritize based on contamination risk and available capital. Most start with high-risk areas, such as aging rooms, cutting equipment, and packaging lines. The key is systematic implementation, not a dramatic overhaul.
Staff training is crucial. The facilities that achieve the best results invest heavily in training their teams to identify contamination sources and properly maintain new equipment. It’s not just about installing technology; it’s about changing how we think about plastic in our operations.
Regional Variations: What I’m Seeing Across Different Markets
What’s interesting is how this challenge manifests differently across regions. California operations dealing with drought conditions are experiencing higher contamination rates, possibly due to more aggressive water recycling. Midwest facilities with older infrastructure are encountering more wear-related contamination. Northeast operations focusing on artisanal products are discovering that traditional aging methods need to be updated for modern contamination realities.
The regulatory response varies, too. Some state agencies are already requiring contamination monitoring, while others are taking a wait-and-see approach. Vermont’s Agency of Agriculture has been particularly proactive, while regulations in other states lag behind market demands.
The Bottom Line: Where We Go from Here
Look, microplastic contamination isn’t some theoretical future problem. It’s currently affecting product integrity and potentially damaging brand trust. The solutions exist, the technology works, and the business case is getting stronger every quarter.
If you haven’t already, start with a comprehensive audit of plastic contact points throughout your processing lines. You’ll probably find more than you expect. Then take a hard look at your current filtration and detection capabilities. Are they adequate for what we’re dealing with now, or are you still operating with yesterday’s standards?
Develop a phased implementation plan that strikes a balance between investment and operational realities. Prioritize the highest-risk contamination points first, and build from there. The processors who are getting ahead of this curve are positioning themselves for long-term competitive advantage.
This isn’t going away. Managing microplastics effectively is becoming as fundamental to quality assurance as managing any other contamination risk. The question isn’t whether you’ll need to address this—it’s whether you’ll lead or follow.
Your move.
Complete references and supporting documentation are available upon request by contacting the editorial team at editor@thebullvine.com.
Learn More:
Dairy Farms’ Hidden Problem: The Alarming Truth About Plastic Waste – Practical strategies for auditing feed-bag wrap, silage film and liner use; demonstrates how small tweaks in disposal and recycling cut on-farm waste bills by up to 30% while reducing contamination risk.
Every week, thousands of producers, breeders, and industry insiders open Bullvine Weekly for genetics insights, market shifts, and profit strategies they won’t find anywhere else. One email. Five minutes. Smarter decisions all week.
Everyone says A2’s just hype. Tell that to farmers banking 100% premiums on milk yield.
EXECUTIVE SUMMARY: Look, I’ve been watching this A2 thing for years, and here’s what changed my mind – the premium isn’t going anywhere, and the science finally backs it up. We’re talking 50-100% premiums that are holding steady even with everything else falling apart in commodity markets. China’s A2 segment jumped 14% just in the first half of 2025, now claiming 20% of their infant formula market value… that’s real structural demand, not some health fad.The kicker? Most Holstein herds are already testing 50-60% A2 genetics – you might be sitting on premium milk and selling it commodity. At $25-40 per head for genomic testing, you’re looking at potentially discovering a revenue stream that California producers are already riding to $8-9 per gallon. With USDA operating loans at 5.000% and consumer premiums this strong, this isn’t about chasing trends anymore – it’s about capturing value that’s already there.
KEY TAKEAWAYS
Test your genetics first – Most Holstein herds hit 50-60% A2 genetics naturally; at $25-40/head testing costs versus 50-100% milk premiums, your ROI calculation is simple math that works in today’s tight margin environment.
Start with segregation strategy – Wisconsin’s MilkHaus Dairy is processing just 100 of their 360 cows separately for A2 cheese production, proving you don’t need full herd conversion to tap premium markets in 2025.
Stack the sustainability angle – Traditional A2 breeds like Jerseys show better feed efficiency, positioning farms for both A2 premiums and emerging carbon credit programs as USDA pilots recognize breed efficiency metrics.
Build direct-to-consumer channels – Vermont Jersey operations are pulling premium pricing on A2 raw milk and aged cheeses to Boston markets, while California organic A2 hits $8-9/gallon – direct sales bypass commodity pricing entirely.
Time your conversion with financing – At current 5.000% USDA operating rates, conversion financing is more accessible than it’s been in years, but processing capacity for segregated A2 milk is tightening across regions.
You know what caught my attention at the last World Dairy Expo? Three different producers – completely unrelated, from Wisconsin to New Zealand – all mentioned they’re testing their herds for A2 genetics. That’s when you know something has shifted from a trend to a serious business opportunity.
If there’s one topic dominating dairy discussions lately, it’s A2 milk. What started as a niche health trend has evolved into something that’s genuinely transforming our perspective on premium positioning. With conventional milk struggling in commodity markets and consumers willing to pay 50-100% premiums for A2 products, this is no longer just marketing hype.
A2 milk is projected to become a $7.62 billion global market by 2034. That’s not wishful thinking from market researchers – that’s real money flowing through real supply chains, and it’s becoming clear that dismissing this as just another fad would be a serious mistake.
Your A2 Quick Reference Guide
Market Reality Check: Global A2 market projected to exceed $7.6B by 2034, with consumer premiums holding steady at 50-100% over conventional milk
Science Getting Clearer: While cognitive claims remain weak, peer-reviewed studies now confirm digestive benefits linked to gut microbiota changes
Strategy is Everything: Success depends on genetic testing, long-term breeding strategy, and – this is crucial – securing access to segregated processing
Start Local First: Evaluate your regional processors and direct-to-consumer opportunities before making major investments
The Numbers That Actually Matter
What strikes me about these market projections is how they’re playing out in real time. China’s A2 market tells the story perfectly:
China’s A2 protein segment grew 14% in just the first half of 2025 and now accounts for 20% of their total infant formula market value. When discussing a competitive market, capturing one-fifth of the total value isn’t just a matter of consumer preference – that’s structural demand.
The premium positioning is holding too. Even with all the economic uncertainty we’ve been dealing with, consumers are still paying premiums of 50-100% over conventional milk. That’s exactly the kind of value-added positioning we’ve been discussing as needed in this industry for years.
Here’s what’s fascinating, though – many A2 buyers don’t even have digestive issues with regular milk. They’re paying more because they believe it’s better milk. This represents exactly the kind of premium positioning that can actually stick.
What’s Actually Happening in Science
The biochemistry behind A2 milk is legitimate, even if some of the health claims can be somewhat exaggerated. When you’re dealing with conventional milk – the A1 beta-casein variety that most of our Holsteins produce – digestion releases this peptide called beta-casomorphin-7 (BCM-7).
Here’s where it gets interesting: research shows this peptide can actually cross the blood-brain barrier and interact with opioid receptors in our central nervous system. While this biochemical interaction is confirmed, it’s crucial to note that large-scale human studies haven’t substantiated the marketing claims linking it to conditions like autism or cognitive decline.
That’s not small stuff when you think about it. We’re talking about a food component that can literally reach the brain.
Now, before anyone gets carried away, most of the cognitive claims you see splashed across A2 marketing materials are still pretty thin on human clinical trials. But the digestive benefits? Those are starting to look solid.
What strikes me about recent work published in PLOS ONE is how concrete the results were. Two weeks of A2 milk consumption led to significant changes in gut microbiota – we’re talking about increases in beneficial bacteria like Bifidobacterium longum and Blautia wexlerae. These aren’t just random microbes; they’re directly linked to better nutrient processing and reduced gut inflammation.
Participants who typically experienced digestive discomfort with regular milk showed notable improvements with A2 milk consumption. From a market positioning standpoint, this is compelling stuff – actual functional benefits you can point to.
The Genetic Reality Check
Here’s where breed choice really matters in this whole A2 conversation. Most producers I talk to are surprised when they learn where their herds actually stand genetically.
According to recent work from Dr. John Lucey at the University of Wisconsin’s Center for Dairy Research, “Most U.S. Holsteins produce a mixture of the two, often a 50-50 or 60-40 split, depending on where the genetic lines came from. Guernsey, Jersey, and Brown Swiss tend to produce mostly A2.”
That breed difference alone changes your whole timeline and strategy. If you’re running Holsteins, you’re starting from a different place than someone with a Jersey herd. It’s not just about the genetics – it’s about understanding what you’re working with.
The testing itself costs around $25-40 per animal to determine your current status. That’s not nothing when you’re talking about a 300-cow herd, but it’s the kind of investment that makes sense when you’re looking at those premium opportunities.
What’s particularly noteworthy is how this plays out across different regions. In the Upper Midwest, I’m seeing Holstein herds that test surprisingly high for A2 genetics – sometimes 60-70% – likely due to specific breeding lines that came through certain AI companies. Meanwhile, down in the Southeast, some Jersey herds are testing lower than expected, which suggests there’s more A1 genetics circulating in those bloodlines than people realize.
The Next Frontier: Connecting A2 to Carbon and Policy
Here’s something that’s flying under the radar but shouldn’t be – the intersection of A2 genetics and sustainability is creating a potential triple-win scenario that smart producers are already positioning for.
Traditional A2 breeds, such as Jerseys and Guernseys, often have better feed conversion rates, which translates to lower methane production per pound of milk. With carbon pricing becoming a reality through programs like California’s LCFS expansion and the EU’s Green Deal, which is pushing sustainability metrics, a double premium opportunity may be emerging.
The new USDA carbon credit pilot programs are starting to recognize these breed efficiencies. Operations that can document both A2 genetics and improved feed efficiency might qualify for additional incentives by 2026. Initial word from extension specialists suggests that farms documenting both A2 genetics and carbon efficiency could receive stacked premiums.
I’ve been hearing from processors in the Northeast who are starting to ask about both A2 genetics and carbon footprint data. That’s a trend that’s expected to accelerate, especially as more retailers make sustainability commitments. With the EU’s Green Deal pushing sustainability metrics and New Zealand implementing their emissions pricing scheme, there’s a real question about positioning A2 milk within these new frameworks.
The methane credit angle is particularly interesting. Some of the same breeds that naturally produce more A2 milk also tend to be more efficient feed converters, lower methane per pound of milk. As carbon pricing becomes more of a reality (and it’s coming, whether we like it or not), we’re looking at a potential convergence where A2 genetics, carbon efficiency, and premium positioning all align.
The Conversion Challenge – What It Actually Takes
Converting to A2 production is a significant operational commitment, not as simple as flipping a switch. Here’s what you’re really looking at:
Investment Reality: The real cost is time and a multi-generational breeding strategy. From industry observations, you’re looking at several generations to achieve high A2A2 frequencies – the exact timeline depends heavily on your starting genetics and breed composition.
Processing Bottleneck: Access to segregated processing facilities is, in fact, the biggest challenge. I’ve talked to producers with beautiful A2 herds who ended up stuck selling into commodity markets because they couldn’t secure premium outlets.
Financing Actually Looks Good: Current USDA Farm Service Agency operating loans are running at 5.000% as of July 2025, which makes conversion financing accessible for qualified operations. That’s more reasonable than the higher rates we saw a couple of years back.
Here’s the thing, though – and this is where I see producers getting tripped up – you can’t just think about the genetics. The infrastructure piece is massive. You need separate tanks, separate trucks, and separate processing lines… or, at the very least, processing partners who can handle the segregation requirements.
Real Operations Making It Work
What’s working? Direct-to-consumer operations are absolutely crushing it. Let me tell you about operations that are getting it right across different regions:
MilkHaus Dairy in Fennimore, Wisconsin, is testing about 100 of their 360-head Holstein herd for A2 genetics. They’re housing those A2 cows separately, keeping the milk completely segregated, and processing it into cheese at local plants. Now they’re selling 12 different cheese flavors nationwide through their online store. The genius part? They’re not trying to convert their whole herd – they’re just maximizing the value of what they’ve got.
Two Guernsey Girls Creamery in Freedom, Wisconsin, took a different approach. They broke ground on a small bottling and cheese-making facility in late 2020, opened it in summer 2021, and now process all their milk on-site. Pasteurized white milk, chocolate milk, cheese curds – all A2, all local, all profitable. What started as a 4-H project has grown into a thriving farmstead operation.
But it’s not just Wisconsin. In California, I’ve been hearing from producers in the Central Valley who are pairing A2 genetics with organic certification – apparently, this combination is hitting a sweet spot with Bay Area consumers, who are willing to pay serious premiums. “We’re seeing $8-9 per gallon for A2 organic,” one Fresno County producer told me last month. “That’s game-changing money.”
Meanwhile, in Vermont, there’s a Jersey operation that has gone full A2 and direct-to-consumer. They’re selling A2 raw milk permits and A2 aged cheeses to the Boston market – completely different approach than what we’re seeing in the Midwest, but it’s working for their customer base.
The key here – and this is what I keep telling producers – is understanding that success often depends more on market positioning and consumer education than just having the genetics. These operations work directly with consumers, educating them about the differences and building brand loyalty.
Regional Patterns That Are Actually Emerging
The A2 opportunity isn’t uniform across regions, and that’s something you really need to factor into your planning. What works in Wisconsin might not work in California, and what sells in Australia definitely won’t automatically work in Iowa.
Here’s what I’m seeing in different regions: Upper Midwest operations with established local markets are doing well with direct sales. The cheese culture up there really helps – consumers understand premium dairy products. West Coast producers are finding success pairing A2 with organic certification to tap into that California wellness market.
However, what’s interesting is that I’m hearing from Northeast producers who are struggling with the infrastructure piece more than expected. Processing capacity for segregated A2 milk is tighter than anticipated, especially in Vermont and New York. One producer in the Hudson Valley told me they’re trucking A2 milk three hours to find a processor who can handle the segregation requirements.
Southeast operations? They’re dealing with entirely different challenges. The consumer demand is there, but the genetic starting point is often lower than expected. Heat stress is also affecting A2 conversion timelines in ways that Northern operations don’t have to consider.
What’s fascinating is how weather patterns are also affecting this. The drought conditions we’ve been seeing in parts of the West are actually pushing some producers toward A2 conversion because they’re already having to make genetic decisions about their herds – might as well optimize for premiums while you’re at it.
What This Means for Your Operation
The cognitive benefits everyone’s talking about? The science isn’t there yet. However, the market opportunity is real, and consumer willingness to pay premiums remains strong, even amid the ongoing economic challenges.
If you’re considering A2 conversion, start with genetic testing to understand your baseline. Don’t rush into wholesale changes – gradual conversion through selective breeding spreads your investment while you build market relationships. The sweet spot seems to be operations over 200 cows, where you can absorb conversion costs across larger production volumes.
Here’s what I’d recommend: evaluate your local market access first. Do you have processing facilities that can maintain A2 segregation? Are there premium retailers interested in carrying your product? Can you build direct-to-consumer channels?
But honestly? The most important thing is to be realistic about timelines. This isn’t a quick pivot. If you’re serious about A2, you’re looking at a long-term strategy – breeding decisions today based on where you think the market will be in 2030.
And here’s something else to consider… the regulatory landscape is shifting. With sustainability requirements tightening and carbon accounting becoming more standard, A2 genetics might end up being just one piece of a broader premium positioning strategy. The producers who are thinking ahead are already connecting A2 to metrics for feed efficiency, methane reduction, and soil health.
The Bottom Line
The combination of documented gut health benefits, resilient premium pricing, and developing infrastructure creates a compelling and tangible opportunity. What’s particularly exciting is how this aligns with the broader sustainability conversation. We’re potentially looking at a convergence where A2 genetics, carbon efficiency, and premium positioning all intersect.
This isn’t about jumping on the latest trend – it’s about positioning your operation for long-term success in an evolving premium dairy market. The question isn’t whether A2 milk will succeed – it’s whether you’re positioned to capture your share of this expanding opportunity.
The producers who are succeeding aren’t just chasing the A2 premium – they’re building integrated strategies that position them for whatever comes next. That’s the real lesson here.
Complete references and supporting documentation are available upon request by contacting the editorial team at editor@thebullvine.com.
Learn More:
12 Things You Need to Know About A2 Milk – Reveals foundational knowledge and practical implementation strategies for A2 conversion, including breed selection criteria and cost-benefit analysis that complements your premium positioning decisions with actionable baseline intelligence.
Every week, thousands of producers, breeders, and industry insiders open Bullvine Weekly for genetics insights, market shifts, and profit strategies they won’t find anywhere else. One email. Five minutes. Smarter decisions all week.
What if everything you’ve heard about immigration “killing” family farms is completely backwards? The data tells a different story entirely.
You know what gets me fired up at these? Listening to producers blame immigrant workers for killing the family farm when the real culprit is sitting right there in the economics. And honestly? After diving deep into the latest research, the data tells a completely different story than what we’re hearing in the local coffee shops or on the online chat groups.
The Thing About Blaming Immigration… It Just Doesn’t Add Up
I’ve been covering this industry for almost two decades, and I can’t tell you how many times I’ve heard the same refrain: “Illegal immigration killed the family dairy farm.” And look, I get it. When you’re watching neighbors sell out and consolidation happening all around you, it’s natural to want someone to blame.
The Economic Catastrophe of Losing Immigrant Dairy Workers
However, what really struck me when I began examining the comprehensive analysis is that immigrant workers currently produce 79% of America’s milk supply. And if we lost that workforce tomorrow? The economic modeling from Texas A&M shows milk prices would spike 90.4% and crater the entire industry by $16 billion based on half the immigrant workforce being potentially illegal.
That’s not exactly the profile of an industry being “killed” by immigration. That’s an industry that’s become completely dependent on it.
What keeps me up at night (and should keep you up too) is this: while we’ve been focused on the wrong enemy, the real forces reshaping dairy have been quietly restructuring everything around us. The producers who figure this out first? They’re the ones who’ll be writing the checks to buy out their neighbors in the next wave.
When 15,866 Farms Vanish in Five Years, Follow the Money
The numbers are absolutely brutal, and they’re accelerating. According to the USDA Census of Agriculture data, we lost 15,866 dairy farms between 2017 and 2022—that’s more than three operations closing every single day. I remember driving through central Wisconsin last fall, seeing “For Sale” signs where there used to be active dairies. It’s heartbreaking, but it’s also revealing.
Here’s what really gets your attention, though: while farms were disappearing, total milk production actually increased by 5%, from 215.5 billion pounds in 2017 to 226.4 billion pounds in 2022. Do the math. Fewer farms producing more milk means somebody has figured out how to make this process pencil out at a massive scale.
The geographic story is fascinating, too. Traditional dairy states are getting absolutely hammered—Wisconsin lost 2,740 farms, Pennsylvania lost 1,570, and New York lost 1,260. Meanwhile, states such as Texas, Idaho, and New Mexico are seeing significant investment in new facilities.
This isn’t random. It’s strategic capital following the most profitable opportunities. And the smart money? It’s not chasing labor arbitrage—it’s chasing pure economies of scale.
I was talking to a banker friend who specializes in dairy financing, and he put it bluntly: “The middle is disappearing. You’re either getting really big or you’re getting out.” The data backs this up completely.
Where the Action Really Is: The Structural Shift
The Great Consolidation: Only mega-dairies with 2,500+ cows grew in numbers while smaller operations vanished at unprecedented rates between 2017-2022
Herd Size
2017 Farms
2022 Farms
Change
Milk Share 2022
Under 100 cows
28,141
16,334
-42.0%
7%
100-499 cows
8,868
5,889
-33.6%
15%
500-999 cows
1,580
1,025
-35.1%
10%
1,000-2,499 cows
1,000
900
-10.0%
22%
2,500+ cows
714
834
+16.8%
46%
Source: USDA Census of Agriculture compilation
What strikes me about this data is how stark the bifurcation has become. We’re not talking about a gradual evolution—this is a fundamental restructuring where only the 2,500+ cow operations actually grew in numbers.
The Real Economics: Why Size Became Everything (And It’s Not Pretty)
The Economics of Scale: Large dairy farms operate with a crushing $16.50 per hundredweight cost advantage over small operations – the real force driving consolidation
Here’s where the conventional wisdom about immigration falls apart completely. According to a comprehensive USDA Economic Research Service analysis, farms with 2,000+ cows have production costs averaging $23.06 per hundredweight, while farms with 100-199 cows face costs of $32.83. That’s nearly a $10 difference per cwt.
Think about what that means in today’s market. With current milk prices hovering around break-even levels for most operations, this cost differential becomes absolutely critical. I’ve seen operations that were barely breaking even suddenly find themselves underwater when you factor in these structural differences.
If you’re milking 150 cows producing 60 pounds per day each, that cost differential is costing you about $27,000 annually compared to your large-scale neighbors. Over five years? That’s $135,000 in competitive disadvantage that has absolutely nothing to do with labor costs.
Why Size Matters: Cost Structure by Farm Size
Herd Size
Total Cost/cwt
Feed Costs
Labor Costs
Other Operating & Capital Costs
Net Return
10-49 cows
$37.00
$14.50
$12.00
$10.50
-$10.90
50-99 cows
$33.10
$13.80
$9.50
$9.80
-$7.20
100-199 cows
$28.10
$12.90
$6.50
$8.70
-$2.60
200-499 cows
$25.20
$12.50
$4.80
$7.90
-$0.10
500-999 cows
$23.00
$12.10
$3.50
$7.40
+$1.80
1,000-1,999 cows
$21.60
$11.80
$2.80
$7.00
+$3.00
2,000+ cows
$20.50
$11.50
$2.20
$6.80
+$4.00
But here’s the real eye-opener—and this surprised me when I first saw the breakdown: when you dig into non-feed costs, the difference between efficient and inefficient operations isn’t just a few bucks. According to the analysis spanning 2016-2022, while the difference in feed costs between the most and least efficient farms was $2.50 per cwt, the gap of non-feed expenses was a staggering $16.50 per cwt.
Capital costs, equipment, technology, compliance… these fixed expenses get spread across much larger volumes on mega-dairies. For smaller herds (under 1,000 cows), non-feed costs actually exceed feed costs. Your biggest expense isn’t what goes into the cow—it’s everything else. And that’s where the real consolidation pressure lives.
Dr. Mark Stephenson at the University of Wisconsin puts it this way: “The economics are pretty unforgiving. When your fixed costs are higher than your variable costs, you’re in a structurally disadvantaged position in a commodity market.”
The Labor Cost Misconception: Why That $10 Gap Isn’t About Cheap Wages
You might be looking at that nearly $10 per cwt labor cost difference between small and large herds and thinking, “Well, of course—immigrant workers accept lower wages.” But honestly? That assumption gets the story completely backwards.
Here’s what’s really happening with labor costs across different farm sizes:
Herd Size
Labor Cost/cwt
Primary Labor Type
Actual Dynamics
10-49 cows
$12.00
Mostly unpaid family labor
High “cost” due to opportunity value
500-999 cows
$3.50
Mix of hired and family
Transition to paid workforce
2,000+ cows
$2.20
Primarily hired labor
Scale efficiency with higher wages
Large Farms Actually Pay More, Not Less
The data flips the conventional assumption on its head. Large farms that employ the most immigrant workers are actually paying higher cash wages, not lower ones. Recent analysis shows median wages for dairy workers increased 33.7% between 2019 and 2022, far outpacing the national median wage increase of 7.4%. These wage increases are happening primarily on the large-scale operations that dominate milk production.
Where the Real Cost Difference Comes From
The labor cost gap stems from three fundamental factors that have nothing to do with wage suppression:
Scale Efficiency: Large farms spread their labor costs across vastly more milk production. A single worker on a 2,000-cow operation manages far more production than a worker on a 100-cow farm—it’s pure productivity math.
Labor Structure Differences: Small farms rely heavily on unpaid family labor, which economists count as an opportunity cost. When USDA calculates that $12.00/cwt labor cost for small farms, most of it represents what family members could earn working elsewhere, not actual cash wages paid.
Operational Productivity: Research consistently shows that larger operations achieve higher labor productivity per cow. It’s not about paying workers less—it’s about systems that allow each worker to manage more animals effectively.
The Availability Reality
The bigger issue isn’t wage levels—it’s workforce availability. The industry turned to immigrant labor not because it was cheaper, but because it was the only workforce available and willing to do demanding, year-round dairy work. One Vermont farmer reported receiving applications from only two native-born workers compared to 150 immigrants over a 20-year period.
This labor cost differential reflects economic efficiency, not exploitation. If anything, the consolidation pattern we’re seeing isn’t driven by a race to the bottom on wages—it’s driven by fundamental productivity advantages that make large operations more efficient at converting labor input into milk output.
The Labor Reality: Why Immigration Became Essential, Not Destructive
Now let’s talk about what’s really happening with labor, because this is where the narrative gets completely turned around. Research consistently shows that immigrant workers make up 51% of the dairy workforce, but here’s the critical detail: farms employing immigrant labor produce 79% of the nation’s milk supply.
This isn’t about wage suppression—it’s about availability and willingness to do the work. I know a Vermont farmer who told me that over the past 20 years, he received applications from exactly two native-born workers, compared to 150 immigrants. The domestic workforce simply isn’t showing up for these jobs.
And wages have been rising substantially. The median advertised wage for meat and dairy workers increased 33.7% between 2019 and 2022, far outpacing the national median wage increase of 7.4%. Labor now accounts for 18% to 25% of total operating costs.
Here’s what should concern every strategic planner: the industry has become completely dependent on a workforce that exists in legal limbo. The H-2A guest worker program? It’s designed for seasonal work, not the 365-day reality of dairy farming. The industry adapted by hiring workers who were available and willing.
What’s fascinating—and honestly alarming—is the economic modeling from the 2015 Texas A&M University study that shows what happens if we lose this workforce. We’re talking about 2.1 million fewer dairy cows, 48.4 billion pounds less milk production annually, and 7,011 dairy farms forced to close. Even a 50% reduction would result in a 45.2% spike in milk prices and cost the economy $16 billion.
One large-scale producer in Idaho told me recently, “People don’t understand—we’re not replacing American workers. We’re filling jobs Americans won’t take. And if this workforce disappeared tomorrow, we’d have dead cows within 48 hours because there’s nobody else to milk them.”
The Technology Factor: Why Capital Requirements Keep Climbing
While everyone’s been debating immigration, technology has been quietly reshaping what it takes to compete. I’ve watched operations install DeLaval VMS robotic milking systems that can reduce direct milking labor by as much as 60%—but they cost over $ 200,000 per unit. The efficiency gains are immediate, but so are the capital requirements.
This creates what researchers call a “technological treadmill”—farms must continuously invest in new systems to remain competitive, but the capital requirements keep rising. The operations that get this balance right? They’re using technology not to replace immigrant workers, but to optimize their productivity.
What’s particularly noteworthy is how this plays out regionally. In California’s Central Valley, you’ll see operations running fully automated feeding systems alongside skilled immigrant workers managing cow health and breeding. It’s not an either/or proposition—it’s about optimization.
Here’s the thing, though: only well-capitalized operations can afford these investments. A single robotic milking unit costs more than many small farms gross in a year. This widens the competitive gap even further.
The Processor Pull: How Downstream Changes Drive Everything
Here’s another force reshaping the industry that has nothing to do with immigration: processor consolidation. According to industry analysis, just three major cooperatives—Dairy Farmers of America, Land O’Lakes, and California Dairies—now handle over 80% of the nation’s milk marketing.
These processors need massive, consistent volumes. New processing plants require millions of pounds of milk per day to operate efficiently. From a logistical standpoint, it’s far more efficient to contract with a dozen 5,000-cow dairies than 500 smaller operations.
I was at a dairy conference in Wisconsin last year where a DFA representative candidly admitted: “We’re building plants that need 4-5 million pounds per day. We can’t deal with 200 small farms—we need 10 large ones.”
This “processor pull” creates powerful incentives for farm-level consolidation. I’ve seen it happen firsthand in regions where a new mega-processing plant opens—suddenly, there’s pressure on every farm in the area to either scale up or get squeezed out.
What Other Countries Are Doing (And Why It Matters)
What’s particularly interesting is how other major dairy countries are handling similar pressures. Canada’s supply management system presents a fascinating contrast—by controlling production through quotas and managing imports, they’ve maintained more stable pricing and slowed consolidation compared to the pure market approach in the United States.
New Zealand consolidated earlier but maintained more cooperative processing structures. The European Union provides more direct support for smaller farms through environmental programs tied to sustainability goals. Australia is experiencing similar consolidation, but with different labor dynamics due to its geographic isolation.
What strikes me about the international context is that the U.S. approach—relying heavily on immigrant labor while maintaining policy uncertainty—is actually unique among developed dairy economies. And arguably more risky. Countries like Denmark and the Netherlands have invested heavily in automation and environmental sustainability, positioning themselves for long-term competitiveness in ways that go beyond pure scale.
This matters because global dairy markets are increasingly interconnected. When New Zealand experiences a drought or the EU changes its environmental regulations, it affects milk prices in the country. Understanding these dynamics helps explain why simply reverting to “how things used to be” isn’t a viable strategy.
The Environmental Reality Nobody Talks About
Here’s something that’s becoming increasingly important but doesn’t receive enough attention: environmental sustainability is becoming a major factor in the dairy industry’s future. Large-scale operations actually have some advantages here—they can afford advanced manure management systems, precision nutrient application, and energy-efficient technologies.
But there’s a catch. Consumer demand for sustainable dairy products is growing, often favoring smaller, more transparent operations. I’ve seen mid-sized farms in Vermont and upstate New York finding success by positioning themselves as environmentally responsible alternatives to both industrial operations and imported products.
Climate change is also reshaping where dairy farming is economically viable. Heat stress in traditional dairy regions, such as Wisconsin and Pennsylvania, is becoming more severe, while some northern regions are becoming increasingly attractive. This geographic shift is another factor driving consolidation patterns.
The seasonal reality is becoming increasingly challenging. Extreme weather events—whether it’s the polar vortex hitting the upper Midwest or heat domes over California—are testing operational resilience in ways that favor larger, more diversified operations with better infrastructure.
Quick Wins for Different Operation Sizes
Let me get practical for a minute. Based on current industry trends and the economic realities we’ve discussed, here’s what makes sense for different types of operations:
If you’re running 100-500 cows: Focus on milk quality premiums immediately—there’s money on the table most producers aren’t capturing. Explore value-added opportunities within 18 months, not five years from now. Consider cooperative processing partnerships, where you can maintain some independence while gaining the benefits of scale. And honestly? Evaluate organic transition economics seriously, because the premium is real and growing.
I know a 300-cow operation in Vermont that transitioned to organic three years ago. They’re now getting $45 per cwt while their conventional neighbors are struggling at $21. The transition wasn’t easy, but the math works.
If you’re running 500-2,000 cows, You’re in the challenging middle ground. Invest in selective automation—feeding and monitoring systems provide the biggest bang for your buck. Strengthen your processor relationships now, while you still have options. Consider geographic expansion versus local intensification carefully, because land costs vary dramatically by region. And develop immigration compliance programs immediately—this is no longer optional.
If you’re running 2,000+ cows: Accelerate technology adoption across all systems. Diversify your processing relationships to avoid being dependent on a single buyer. Invest heavily in labor retention programs, as turnover is a costly expense. And seriously consider vertical integration opportunities—controlling more of your supply chain reduces risk.
The Future: What’s Really Coming
Here’s what I think happens next, and I’ve been tracking these trends for the better part of two decades. The industry is continuing to bifurcate into two completely different businesses. One is high-volume, technology-intensive, professionally managed—think of it as manufacturing milk. The other is value-added, locally focused, and relationship-based—more akin to artisanal production.
The middle ground—traditional commodity farming at moderate scale—becomes increasingly untenable. Not because of immigration, but because of the economic fundamentals that make the costs unsustainable.
The Brutal Reality: Milk Price Volatility Crushes Small Farms
Current market projections show challenges ahead. Feed costs remain volatile, labor availability continues to tighten, and consumer expectations around sustainability are rising. The operations that adapt to these realities will be the ones writing the next chapter.
What This Really Means for Your Operation
The narrative that immigrant labor “killed” the evidence doesn’t support the traditional American dairy farm. What we’re seeing is economic inevitability driven by structural forces much bigger than labor costs.
Immigrant workers didn’t kill the family dairy farm—they’ve been keeping the lights on while economic forces determine who survives consolidation. The presence of this workforce didn’t cause small farms to fail; rather, its availability allowed large farms to succeed in a market that demanded scale.
The real threat to the current U.S. dairy industry—and to the stability of the nation’s milk supply—is not the presence of this workforce, but the profound economic and operational risk posed by its potential removal. According to the Texas A&M analysis, losing this workforce would result in $16 billion in economic damage.
The farms that survive and thrive will be those that recognize these realities and adapt accordingly. That means making strategic decisions about scale, technology investment, labor management, and market positioning based on economic factors, not political considerations.
While everyone else is fighting yesterday’s battles, the smart money is already preparing for tomorrow’s opportunities. The question isn’t whether consolidation will continue—it’s whether you’ll be a consolidator or get consolidated.
Because honestly? The producers who understand what’s actually driving these changes are the ones positioning themselves to write the next chapter of American dairy farming. And that story will be about adaptation, not blame.
Discussion Starters for Your Next Producer Meeting:
How has your cost structure changed over the past five years, and what’s driving the biggest increases? Are you seeing the same labor availability challenges in your region? What technology investments are you considering, and what’s holding you back? How are you preparing for continued consolidation in your area?
These aren’t easy questions, but they’re the right ones. Because the future of dairy farming won’t be determined by who we blame for the past—it’ll be shaped by who’s smart enough to adapt to what’s actually happening.
KEY TAKEAWAYS
Scale Economics Are Everything: Farms with 2,000+ cows operate at $23.06/cwt while 100-199 cow operations face $32.83/cwt costs—that $27,000 annual disadvantage for a 150-cow herd adds up to $135,000 over five years. Start calculating your true non-feed costs per cwt immediately and compare against these benchmarks to see where you really stand in 2025’s unforgiving market.
Technology Investment Pays Off: Robotic milking systems reduce direct labor by 60% with 7-10 year payback periods, while automated feeding cuts feeding labor 40% with 5-8 year ROI. Evaluate selective automation for feeding and monitoring systems first—they give the biggest bang for your buck and help you compete with mega-dairies on efficiency metrics.
Immigration Compliance Is Risk Management: With immigrant workers producing 79% of US milk supply, losing this workforce would spike retail prices 90.4% and cost the economy $16 billion according to Texas A&M research. Implement robust I-9 compliance programs now and consider labor-saving technology as insurance against workforce disruptions in today’s volatile policy environment.
Processor Consolidation Demands Volume: Just three cooperatives control 80% of milk marketing, and new processing plants need millions of pounds daily to operate efficiently. Strengthen your processor relationships immediately while you still have options, or explore value-added opportunities that let you escape the commodity price cycle entirely.
EXECUTIVE SUMMARY
You know what’s been driving me crazy at these industry meetings? Everyone’s pointing fingers at immigrant labor for the death of small dairies when the numbers tell a completely different story. The real killer isn’t immigration—it’s a brutal $10 per hundredweight cost disadvantage that makes smaller farms economically impossible to sustain. We lost 15,866 dairy farms between 2017 and 2022, but here’s the kicker: milk production actually increased 5% during that same period. Only operations with 2,500+ cows grew in numbers, jumping from 714 to 834 farms, and they now control 46% of all US milk production. The consolidation everyone’s seeing? It’s pure economics—large farms spread their massive overhead costs across millions more pounds of milk, while smaller operations are drowning in fixed expenses that exceed even their feed costs. Instead of fighting the wrong battle, progressive producers need to understand these economic realities and position themselves accordingly… because the farms that adapt to this new reality are the ones writing the checks to buy out their neighbors.
Complete references and supporting documentation are available upon request by contacting the editorial team at editor@thebullvine.com.
Learn More:
Winning the Workforce War: How Top Dairies Are Solving Labor Shortages in 2025 – Practical strategies for reducing 38.8% turnover rates through structured training programs, creative compensation packages, and strategic automation investments that deliver measurable ROI while addressing the labor dependency highlighted in the consolidation analysis.
5 Technologies That Will Make or Break Your Dairy Farm in 2025 – Demonstrates how smart calf sensors, robotic milkers, and AI-driven analytics deliver measurable ROI within 7 months while addressing labor shortages and efficiency challenges that drive the consolidation forces discussed in the main analysis.
The Sunday Read Dairy Professionals Don’t Skip.
Every week, thousands of producers, breeders, and industry insiders open Bullvine Weekly for genetics insights, market shifts, and profit strategies they won’t find anywhere else. One email. Five minutes. Smarter decisions all week.
Why did the world’s largest dairy company choose NY over 49 other states? The answer affects your milk check.
EXECUTIVE SUMMARY: You know what’s wild? Foreign processors are paying premium prices for exactly what we’ve been giving away cheap for years—high-component milk. Lactalis just dropped $75 million on two New York plants, and they’re offering $0.85 per hundredweight above base for high-solids milk… that’s an extra $180 to $220 monthly per 100 cows for farms hitting 4.1% protein and 3.8% fat. While our domestic processors are playing it safe, this French company’s betting big on automation that cuts labor costs by 23% and export markets where mozzarella futures are holding above $1.80 per pound. The kicker? They only need 85% capacity utilization to turn profit while greenfield projects need 95%. Here’s the thing—they’re not just buying processing capacity, they’re buying relationships with 236 regional farms already locked into component-based contracts. You should be asking your processor what they’re doing to compete with this kind of forward thinking.
KEY TAKEAWAYS
Component optimization pays immediately: Farms delivering 4.1% protein are earning $180-220 extra monthly per 100 cows compared to commodity pricing—start genetic selection for protein TODAY and negotiate component premiums in your next contract renewal
Automation skills = job security: New dairy positions starting at $68K require technical training, not just farm experience—encourage your kids to get mechatronics or food science certificates because the $90K management roles won’t go to traditional ag backgrounds
Export-ready processors offer price stability: Operations with international market access buffer domestic volatility better than local-only plants—evaluate your processor’s export capabilities when your contract comes up for renewal this fall
Regional capacity constraints drive premiums: Northeast processing runs at 94% capacity during peak months, creating bottlenecks that boost spot pricing—consider diversifying your processor relationships while regional infrastructure catches up
Foreign investment changes the competitive landscape: Lactalis gets 37M lbs capacity for $2.03/lb while US companies spend $2.85/lb on greenfield projects—this efficiency advantage means better farmer pricing and you need processors who can compete
Lactalis Group—the French dairy powerhouse that’s quietly become the world’s largest—just announced they’re dropping $75 million into two New York processing facilities. Buffalo receives $60 million, while Little Walton receives $15 million, and the entire project is expected to be completed by late 2027.
Now, I’ve been tracking foreign money flowing into U.S. dairy for years, and this move? It tells us more about where our industry’s headed than most people realize. When you’ve a company with that kind of global reach making a bet of this size on American processing capacity… well, somebody sees something we might be missing.
What’s Actually Happening in Upstate New York
The investment breakdown is quite strategic when you examine it closely.
Buffalo’s mozzarella operation takes on the heavy lifting—six massive 50,000-pound cheese vats, robotic palletizers, and separation equipment that’ll increase their annual output by 37 million pounds. That’s serious volume in the specialty cheese game.
The Walton facility? It’s been cranking out Breakstone’s products since 1882—hard to believe that operation’s still running, right? They’re getting modern fillers, HEPA filtration systems, and automation that’ll boost cottage cheese production by 30%.
What strikes me about this allocation is its remarkable targeting. They’re not just throwing money at capacity—they’re investing in specific product lines where demand is strongest.
According to recent analysis from Cornell’s dairy program, this kind of targeted capacity expansion typically signals confidence in export market stability. After the volatility we’ve seen in 2025, that confidence is… well, it’s either very smart or very risky.
Why Your Butterfat Numbers Should Care
The thing about mozzarella futures right now—they’re trading at $1.85 to $1.92 per pound.
Chicago Mercantile Exchange data shows 12-month forward contracts holding above $1.80. That’s not an accident; that’s export demand keeping prices supported when domestic consumption has been… let’s call it unpredictable.
What’s particularly interesting is that Lactalis already has the distribution infrastructure to move this extra cheese internationally. Most domestic processors are still figuring out export logistics, but these guys? They’ve got networks in place that took decades to build.
The cottage cheese angle is fascinating, too. Maybe tells us something about where consumer preferences are heading.
Retail sales are up 23% year-over-year—everyone’s chasing protein these days—but here’s what most people don’t realize: shelf life matters more than you’d think in the economics of cultured products. The new systems will push cottage cheese shelf life from 14 to 21 days, and those extra seven days completely change distribution economics.
Cornell’s Andrew Novakovic, who knows dairy economics better than just about anyone, shared with me recently that this investment structure should yield about 11.3% IRR over 15 years. That’s assuming 85% capacity utilization, which is refreshingly conservative compared to some of the pie-in-the-sky projections we’ve been seeing.
The Numbers Moving Your Milk Check
What’s got me excited—and a little concerned—is how this affects the 236 regional dairy farms already supplying these plants.
We’re talking about 800 million pounds of milk annually. Unlike some of these greenfield projects that need to build supply chains from scratch, Lactalis already has established those farmer relationships.
The component premium structure they’re running is where things get interesting.
They’re offering $0.85 per hundredweight above base pricing for high-solids milk, and from what I’m seeing, that’s becoming the new normal across the Northeast.
I’ve been reviewing farm business records from the region, and operations delivering 4.1% protein and 3.8% fat are earning an additional $180 to $220 per month, per 100 cows, compared to commodity pricing. That’s real money, especially when you’re dealing with the feed costs we’ve been seeing.
Sarah Thompson from Rabobank’s food finance team shared some interesting data recently about facilities investing in robotic systems. They’re seeing 23% lower labor costs per unit while maintaining quality consistency that actually justifies premium pricing.
This matters because—and I can’t stress this enough—labor’s been our industry’s biggest headache for the past few years. Every operation I visit is struggling to find good people.
What This Automation Wave Really Means
The technical specifications for Buffalo’s expansion are worth exploring.
That continuous cheese belt operates at 8,200 pounds per hour with pH monitoring every 30 seconds. The precision they’re achieving—moisture content within a 0.2% tolerance—gives them a cost advantage of approximately $0.03 per pound over batch processing.
Multiply that by their projected throughput, and you’re looking at $1.1 million in annual savings. However, here’s the thing that keeps me up at night: this level of automation completely changes the job market.
The 50+ new positions they’re creating?
Thirty-two production roles starting at $52,000 to $67,000, twelve technical specialists at $68,000 to $89,000, and eight management positions hitting $90,000 to $125,000.
That’s not your grandfather’s dairy plant workforce—these are jobs that require technical training, not just strong backs.
Why Foreign Money Sees What We Don’t
Here’s what I find curious, and it’s something that’s been bugging me for months.
While competitors like Chobani are spending $1.2 billion on entirely new facilities, Lactalis is getting 37 million pounds of additional capacity for $75 million. That’s $2.03 per pound of capacity, compared to the industry average of $2.85.
Smart money? Or just a different strategy? I’m thinking of smart money, especially when considering the risk profile.
Metric
Lactalis Expansion
Industry Average (Greenfield)
Cost per lb of Capacity
$2.03
$2.85
Breakeven Utilization
85%
95%
The data tells the story pretty clearly. Greenfield projects need 95% utilization to hit profitability targets. Lactalis’s expansion approach only needs 85% to generate acceptable returns.
The timing isn’t random either. USDA Foreign Agricultural Service data shows U.S. cheese exports hit 95.5 million pounds to Mexico alone in Q1 2025, and European supply constraints are creating sustained demand that most domestic processors can’t easily tap into.
What’s particularly noteworthy—and this is where foreign ownership becomes a real advantage—is that Lactalis doesn’t have to build export channels from scratch. They’ve a distribution infrastructure that domestic companies would spend years and millions of dollars trying to replicate.
Regional Realities Nobody Talks About
The current situation with Northeast dairy is that we’re operating at 94% processing capacity during peak months.
That creates bottlenecks that push up spot pricing, which looks good for producers in the short term but creates supply chain stress that eventually bites everybody.
Dick Parsons at University of Vermont extension has been tracking this, and his calculations suggest we need 25 to 30 million pounds of additional regional capacity annually just to maintain competitive milk pricing for producers. This Lactalis investment gets us part of the way there, but it’s not a complete solution.
Current corn prices of $4.20 per bushel are supporting favorable processing margins at present, but USDA forecasts suggest that we could see 15-20% increases in feed costs through 2026.
Lactalis is attempting to hedge this risk with fixed-price milk contracts, which lock in component premiums at $0.45 per protein point above 3.2%. From what I’m seeing across New York and Vermont, that’s becoming standard practice.
The days of spot market milk pricing are… well, they’re not over, but they’re definitely changing.
The Export Picture That Changes Everything
What’s really fascinating—and a little scary—is how dependent this whole investment thesis is on export markets holding up.
Food and Agricultural Policy Research Institute projections suggest trade policy uncertainty could impact export profitability by 8-12%. We’re not immune to political winds, and that could change the math on all these investments pretty quickly.
Remember what happened to dairy exports during the trade disputes of 2018-2019? Yeah, exactly.
But here’s the thing… Lactalis isn’t just betting on exports. They’re betting on the American dairy industry’s ability to compete globally based on quality and consistency. And honestly? That’s a bet I’m comfortable making, even if the politics get messy.
Technology That Actually Makes Sense
The robotic palletizing and automated cheese belts aren’t just about cutting labor costs, although the 18% reduction per pound produced is significant.
What’s really valuable is the consistency. Food safety, quality control, and traceability —everything that keeps plant managers awake at night—get a lot easier when robots do the heavy lifting.
In an industry where one contamination event can destroy decades of brand equity, that consistency is worth more than the labor savings.
The six new 50,000-pound vats in Buffalo represent a significant engineering achievement. Continuous production cycles, closed-loop CIP systems, automated separation… this is 2025 dairy processing, not the 1990s batch operations most of us grew up with.
What I’m Watching For
New York’s Empire State Development is backing this with $1.3 million in performance-based tax credits, which indicates that the state views this as more than just corporate welfare.
Cornell Cooperative Extension’s economic modeling indicates every dollar of processor investment generates $1.47 in regional economic activity. Not bad multipliers for rural New York, especially considering the numerous dairy communities that have been struggling with population loss and economic decline.
However, what I’m really watching for is how this investment affects processor-producer relationships in the region. Are we witnessing the beginning of a consolidation wave where smaller regional processors are being squeezed out? Or is this just healthy competition that ultimately benefits producers?
The Bigger Picture We Can’t Ignore
The competitive landscape is becoming increasingly complex, and that’s not necessarily a bad thing.
While everyone is focused on the mega-projects—Chobani’s Idaho facility and Fairlife’s Webster plant—Lactalis is playing a different game. They’re maximizing existing infrastructure where the milk supply is proven and the workforce is trained.
Less exciting than ribbon cuttings, but probably smarter business in an industry where demand can shift faster than capacity can respond.
The risk calculation here is what really gets my attention. This isn’t just about processing capacity; it’s about positioning for whatever comes next in global dairy markets.
Given the volatility we’ve seen in everything from feed costs to export demand, that positioning might be more important than the investment itself.
Bottom Line: What This Means for Your Operation
Here’s what every producer needs to understand about this Lactalis move:
Component Premiums Are Non-Negotiable: When processors invest in vat capacity over fluid handling, they’re telling you exactly what they value. If you’re not already optimizing genetics and nutrition for butterfat and protein, you’re leaving money on the table. I’m talking real money—$180 to $220 per month per 100 cows.
Automation is Reshaping the Workforce: The next generation of dairy jobs requires technical skills, not just agricultural knowledge. If you’ve kids considering a career in the industry, encourage them to explore mechatronics, food science, and automation training. The $68,000 to $89,000 technical specialist positions aren’t going to your nephew, who’s good with his hands—they’re going to kids with certificates and degrees.
Export Readiness Offers Better Price Stability: Processors with international market access can buffer domestic volatility better than those focused purely on local markets. When evaluating milk marketing agreements, consider your processor’s ability to pivot to export channels. It’s the difference between riding out downturns and getting crushed by them.
Foreign Investment Brings Both Opportunity and Risk: Yes, you gain reliable processing capacity and potentially better pricing, but you’re also betting your operation’s future on multinational corporations whose strategic priorities can shift in response to global market conditions. That’s not necessarily a bad thing, but it’s something to be aware of.
Regional Capacity Matters More Than Ever: With processing running at 94% capacity during peak months, having adequate regional infrastructure affects everyone’s milk pricing, not just the farms directly supplying expanding facilities. This is why investments like Lactalis’s matter to every producer in the region.
The fundamental question facing every dairy producer right now isn’t whether foreign investment in U.S. processing is good or bad—it’s how to position your operation to benefit from these changes while managing the risks that come with increased market consolidation.
What I know for certain is this: the dairy industry of 2025 looks fundamentally different from even five years ago, and investments like this Lactalis project are both a symptom and a cause of that transformation.
The producers who understand these dynamics and adapt accordingly will thrive. Those who don’t… well, that’s a conversation nobody wants to have.
However, it’s the conversation we need to have, because the decisions being made in boardrooms, from Paris to Buffalo, will determine what American dairy looks like for the next decade. And frankly, I’d rather we be part of that conversation than be its victims.
Complete references and supporting documentation are available upon request by contacting the editorial team at editor@thebullvine.com.
Learn More:
Digital Dairy: The Tech Stack That’s Actually Worth Your Investment in 2025 – Reveals practical strategies for calculating technology ROI and implementing automation systems that deliver measurable returns, helping you avoid costly mistakes while maximizing investment benefits like Lactalis achieved.
Every week, thousands of producers, breeders, and industry insiders open Bullvine Weekly for genetics insights, market shifts, and profit strategies they won’t find anywhere else. One email. Five minutes. Smarter decisions all week.
Belarus’s state-backed genomic program threatens 50% price premiums by 2030.
EXECUTIVE SUMMARY: The A2 milk gold rush you’re betting your herd conversion on is about to face its biggest threat yet—and it’s coming from an unexpected player. Belarus has launched a state-funded program targeting 70% A2 beta-casein production by 2030, threatening to commoditize a market currently delivering 50%+ retail premiums. With the global A2 sector projected to explode from $4.0 billion to $11.1 billion by 2030, this isn’t just another breeding program—it’s a calculated national strategy to capture commodity-scale market share. While genomic testing costs have dropped to $5-40 per animal and elite A2A2 semen ranges $10-75 per straw, the real cost could be the erosion of premium margins that justify your conversion investment. Research shows A2 milk reduces gastrointestinal discomfort and beneficial gut microbiota shifts, validating the science behind the trend. However, the Belarus gambit exposes the fundamental vulnerability of building premiums on non-proprietary genetic markers that any state-backed competitor can replicate. Before you commit another dollar to A2 conversion, demand long-term contracts with guaranteed price floors—because the rules of this game are changing faster than you think.
KEY TAKEAWAYS
Secure Contract Protection Before Converting: Demand guaranteed price floors and duration commitments from processors before investing in A2 conversion, as Belarus’s commodity approach could compress the 50%+ retail premiums currently justifying herd transition costs within the next 5 years.
Prioritize Genetic Merit Over A2 Status: Focus on bulls ranking above 3000 GTPI that happen to be A2A2 rather than selecting lower-merit sires solely for A2 genetics—Semex reports over 230 high-ranking Holstein A2A2 bulls available, proving you don’t need to sacrifice productivity for the trait.
Time Your Market Entry Strategically: Early A2 adopters may capture better premiums before commoditization accelerates, but late entrants risk investing in expensive herd conversions just as state-backed producers flood markets with lower-cost A2-rich products.
Build Defensible Value Propositions: Processors must accelerate brand differentiation beyond simple A2 claims through attribute stacking (A2 + organic, A2 + grass-fed) to create premium positions that transcend commodity competition from state-funded operations.
Monitor Global Supply Chain Disruption: Belarus already supplies 94% of Russia’s dairy imports and targets China’s rapidly growing A2 infant formula market—track their export expansion as an early indicator of when commodity A2 pricing pressure will hit your local market.
Belarus has launched a comprehensive state-funded genetics initiative targeting A2A2 milk production by 2030, representing a calculated strategy to capture market share in the rapidly expanding global A2 sector. The program, directed by the National Academy of Sciences, aims to develop milk containing 70% A2 beta-casein content—a strategic threshold that avoids the economic inefficiencies of complete herd conversion while achieving commercial A2-rich milk production.
But here’s the million-dollar question: What happens when a state-backed entity enters a market built on premium pricing?
Program Economics: Measured Investment Strategy
The Belarusian approach demonstrates a sophisticated understanding of breeding economics. Rather than pursuing absolute genetic purity, the 70% target allows retention of genetically superior A1A2 animals while achieving commercial viability. This strategy could reduce conversion costs by approximately 40% compared to complete herd replacement programs.
The economic rationale centers on accessing premium market segments where A2 milk commands significant retail premiums. Current market analysis indicates that the global A2 milk sector was valued at $15.4 billion in 2024 and is projected to reach $50.9 billion by 2033. Other estimates suggest growth from $2.4 billion in 2024 to $5.4 billion by 2034. However, Belarus’s commodity-focused approach could accelerate market commoditization, potentially eroding the very premiums that justify initial investment.
Technical Implementation: Accelerated Genetics Through State Coordination
The program leverages Belarus’s existing artificial insemination infrastructure and centralized breeding records system. As of January 2025, Belarus operates nearly 3,000 dairy farms, with 56% classified as modern high-tech complexes. This infrastructure provides the necessary technical foundation for large-scale genetic conversion.
The breeding strategy employs exclusive A2A2 bull usage, ensuring all offspring receive at least one A2 allele. Mathematical modeling suggests that achieving a 40% A2A2 population density, combined with 60% A1A2 animals, would yield the target 70% A2 protein content in pooled milk—a pragmatic compromise that enables market entry without incurring extreme culling costs.
Risk Assessment: Implementation Challenges
Industry geneticists identify several implementation risks that could compromise program success. Genetic drag represents the primary technical concern—intensive focus on A2 status may negatively impact other economically vital traits if superior A1-carrying sires are excluded from breeding programs.
Market dynamics present additional vulnerabilities. The initiative’s viability depends entirely on sustained A2 price premiums, which Belarus’s own commodity production could help erode.
Are we watching the beginning of the end for easy A2 premiums?
Execution risks include the logistical complexity of coordinating thousands of farms toward unified genetic objectives within an aggressive timeline. While Belarus plans to modernize and build 450 dairy farms by 2027, the scale and speed requirements present unprecedented challenges for centralized agricultural planning.
Belarus’s entry strategy poses direct challenges to established premium players, such as The a2 Milk Company and Nestlé, whose business models depend on maintaining significant price differentials. The state-backed approach enables aggressive pricing strategies that branded competitors cannot easily match.
The program validates broader industry trends toward the commoditization of the A2 trait. Major genetics suppliers, including ABS Global and Semex, now offer extensive A2A2 sire catalogs, with Semex reporting over 230 high-ranking Holstein bulls with a GTPI of more than 3000 that carry the A2A2 genotype. ABS Global prominently features A2A2 as a “Specialist Symbol” in its sire directories, demonstrating that elite A2 genetics are now mainstream and widely available.
The export strategy initially focuses on securing Russian market dominance—Belarus supplied 94% of Russia’s dairy imports in 2024, totaling 953,000 tonnes—before targeting high-growth Asian markets. In 2024, Belarusian dairy exports surged 17.5% to $3.4 billion, with the a2 protein segment growing 14% in China’s infant formula market and representing 20% of market value.
Industry Adaptation: Strategic Positioning
For dairy producers considering A2 conversion, the Belarus initiative signals both opportunity and caution. Recent research has demonstrated that A2 milk consumption leads to beneficial shifts in gut microbiota, including increases in Bifidobacterium and Blautia. Furthermore, prolonged A2 milk consumption has been shown to reduce symptoms compared to conventional milk in lactose malabsorbers. This validates the A2 trend and may encourage processor premiums.
However, long-term commoditization risks require careful contract negotiation with guaranteed price floors and duration commitments.
Genetic selection strategies should prioritize bulls that rank highly on economic indexes, which happen to be A2A2, rather than compromising overall genetic merit for A2 status alone. This approach maintains herd profitability while positioning for market transitions.
Processing companies face strategic decisions regarding supply chain positioning. Early A2 market entrants must accelerate brand differentiation beyond simple A2 claims—combining traits like A2 + organic or A2 + grass-fed to create defensible value propositions that transcend commodity competition.
Market Outlook: Navigating Transition Dynamics
The Belarus program represents a fundamental shift in A2 market dynamics, regardless of ultimate success. The transition from premium-branded ingredients to standard specification mirrors historical patterns in organic and lactose-free segments.
The global A2 milk market is projected to grow at a compound annual growth rate (CAGR) of 14.21% through 2033, with the Asia-Pacific region maintaining dominance due to high consumer awareness and demand in countries such as China, India, and Australia. However, the commoditization pressure from state-backed producers threatens to compress the premium margins that have driven this growth.
How will your operation adapt to this new reality?
Bottom Line: Strategic Takeaways
For Dairy Producers:
Demand long-term contracts with guaranteed price floors before investing in A2 conversion
Prioritize overall genetic merit over A2 status alone when selecting sires—focus on bulls with high economic indexes that happen to be A2A2
Consider the timing—early movers may capture better premiums before commoditization accelerates
For Processors:
Accelerate brand differentiation beyond simple A2 claims through attribute stacking
Secure key markets before low-cost competitors establish footholds
Optimize supply chains for potential margin compression scenarios
For the Industry: The Belarus initiative demonstrates how state-directed agricultural policy can disrupt established market structures, particularly in segments built on non-proprietary genetic markers. Belarus may not achieve its 2030 target completely, but the attempt alone signals the end of easy A2 premiums and the beginning of a more competitive, commodity-driven market phase.
The A2 gold rush isn’t over—but the rules of the game are changing fast.
Complete references and supporting documentation are available upon request by contacting the editorial team at editor@thebullvine.com.
Learn More:
New Zealand’s Dairy Revolution: The Imperative for a Strategic A2 Beta Casein Policy – Reveals how New Zealand’s strategic A2 transition reached 84% A2 beta-casein by 2025, offering actionable policy frameworks and market positioning strategies that complement Belarus’s state-backed approach with proven competitive advantages in Asian markets.
From Saving a Baby’s Life to Transforming Your Dairy Herd: The Gene Editing Revolution is Here – Demonstrates how CRISPR gene editing technology could efficiently convert A1 cows to A2 milk production, providing cutting-edge alternatives to traditional breeding methods that could accelerate the genetic transformation Belarus is attempting through conventional genomic selection.
Every week, thousands of producers, breeders, and industry insiders open Bullvine Weekly for genetics insights, market shifts, and profit strategies they won’t find anywhere else. One email. Five minutes. Smarter decisions all week.
UK dairy revolutionaries ditch processors, capture 300% profit margins through direct-sales vending. Your feed efficiency means nothing if processors own your margins.
Executive Summary: While you’re optimizing feed conversion ratios and chasing genomic gains, UK farmers are solving the real problem—processor dependency that’s stealing your profits. UK milk vending operations are delivering £1.20-£1.60 per litre while traditional wholesale contracts squeeze farmers at 43.69p per litre—a staggering 300% pricing premium that’s transforming farm economics. With 400 machines now operating nationwide and 12-month ROI periods on £30,000 investments, this isn’t diversification—it’s liberation from commodity pricing. While North American producers face regulatory barriers with 20 US states prohibiting raw milk sales and Canada’s supply management blocking direct sales entirely, UK farmers operate in a framework that enables direct-consumer innovation. The brutal truth? Your superior butterfat percentages and lower somatic cell counts won’t save you if processors capture all the value—time to evaluate whether you’re building your operation or subsidizing theirs.
Key Takeaways
Direct-Sales ROI Destroys Traditional Expansion Models: £30,000 vending setups deliver 12-month payback periods compared to decades for conventional capacity expansion, with farmers achieving 60-80 pence per litre margins versus single-digit pence through processor contracts
Value-Added Products Drive Exponential Returns: Flavoured milkshakes generate 40-50% higher per-litre revenues than base milk, with successful operations increasing average customer spend from £3.50 to £7.00 through comprehensive farm retail offerings that bypass traditional distribution entirely
Technology Integration Enables 24/7 Autonomous Revenue: Modern vending systems with IoT connectivity and contactless payments processing 85% of transactions create self-contained retail operations immune to processor capacity constraints and transport disruptions affecting conventional supply chains
Processor Disintermediation Transforms Farm Economics: Operations achieve sustainable 200-300% pricing premiums over wholesale rates while maintaining competitive positioning against premium supermarket brands, proving that controlling your supply chain beats optimizing for someone else’s profit margins
Global Regulatory Comparison Reveals UK’s Strategic Advantage: Unlike restrictive frameworks in Canada’s supply management system and fragmented US state regulations, UK’s permissive direct-sales environment enables farmer-led innovation that North American producers can only dream about
Here’s the brutal truth your processor doesn’t want you to hear: UK farm-gate prices dropped to 43.69 pence per litre in April 2025—down 2.6% from March—while smart vending operators across the country are banking £1.20-£1.60 per litre. That’s not evolution, folks. That’s revolution.
Look at the numbers. Four hundred forty producers (5.8%) left the industry between April 2023 and 2024, reducing Great Britain’s producer count to approximately 7,130 operations. The survivors? They’re facing a stark choice: stay trapped as price-takers in a commodity squeeze, or break free and become price-setters through direct consumer engagement.
This isn’t just another diversification trend rolling through the countryside. This is the blueprint for breaking free from processor dependency—and it’s already delivering 12-month ROI periods for operators brave enough to challenge the status quo.
The Processor Disintermediation Wave You Can’t Ignore
Let’s cut through the industry noise for a minute. Sure, milk volumes hit 1,396 million litres in April 2025, but here’s what really matters—who’s controlling the margins? The global milk vending market, valued at $152 million in 2025, is projected to reach $265.1 million by 2033 with a 7.2% compound annual growth rate.
What This Actually Means for You: Every machine that goes up represents another farmer who looked at their processor contract and said, “enough.” They’ve claimed ownership of their product’s final value, rather than handing it over to middlemen.
Those 400 machines now operating nationwide? They’re not just dispensers sitting in farm yards. They’re declarations of independence from a supply chain that’s kept farmers as commodity producers for generations. When processor margins consistently exceed farmer margins, something’s fundamentally broken. Smart operators are fixing it.
Technology Investment Reality Check: £30,000 to Freedom
Here’s where traditional thinking gets dangerous. Yes, complete setup costs typically reach £30,000 for vending machine and pasteurization combinations. But here’s the question processors are praying you never ask: How many years of 43p per litre milk does it take to generate the cash flow that vending operators achieve in just 12 months?
The Math They Don’t Want You to See:
Traditional margin: Single-digit pence per litre
Vending margin: 60-80 pence per litre after costs
ROI timeline: 12 months for vending vs. decades for traditional capacity expansion
Now, The Milk Station Company supplies roughly 75% of UK vending machines, but honestly? The real innovation isn’t in the hardware—it’s in the mindset shift from commodity production to premium retail positioning.
Current Market Dynamics: Why Now Is Your Moment
The industry consolidation creating today’s crisis? That’s tomorrow’s opportunity for operators who see what’s coming. With butterfat at 4.29% and protein at 3.41% in April 2025, you’ve got quality metrics that support premium positioning strategies. Yet most farmers let processors train them to ignore this advantage.
Global Context Reality:The United States prohibits raw milk sales in 20 states, while Canada operates near-total prohibition on private raw milk sales. Meanwhile, UK farmers are operating in a regulatory environment that actually enables direct sales innovation. Most just stay chained to processor contracts anyway.
This isn’t a coincidence—it’s a competitive advantage hiding in plain sight.
Value Engineering Beyond the Commodity Trap
Here’s What Processors Fear Most: Farmers discovering that flavoured milkshakes generate 40-50% higher per-litre revenues than base milk. Think about this: a 500ml milkshake selling for £1.80 delivers £3.60 per litre equivalent—more than eight times current farm-gate prices.
Successful operations routinely see average customer spend jump from £3.50 to £7.00 after introducing comprehensive retail offerings. This isn’t just about milk anymore. It’s about transforming from commodity supplier to destination retailer.
The Cooperative Response: First Milk’s Strategic Pivot
Even traditional cooperatives see the writing on the wall. First Milk’s Golden Hooves brand, launched in 2022, now provides member farmers with branded vending machines and regenerative agriculture messaging.
The Strategic Implication: When cooperatives start competing with their own wholesale model, you know the game has changed. The question isn’t whether direct sales will grow—it’s whether you’ll be leading this charge or watching from the sidelines.
International Regulatory Comparison: UK’s Hidden Advantage
While only 124 farms in England are registered for raw milk sales, the UK’s framework enables innovation that’s impossible elsewhere. Georgia became the 31st state to allow raw milk sales in 2023, but 20 US states still prohibit raw milk sales entirely.
Your Competitive Reality: You’re operating in a jurisdiction that enables direct-sales innovation while most global producers face regulatory barriers. That’s not luck—that’s strategic positioning most farmers aren’t exploiting.
UK Regulatory Framework: Clear Pathways vs Global Restrictions
The UK’s approach gives you clear pathways for farm diversification through direct milk sales. Raw milk producers just need to register with the Food Standards Agency and implement solid food safety management plans. You can sell directly from farms, through farm-run delivery services, or at registered farmers’ markets.
Compare that to Canada’s supply management system, which effectively blocks on-farm vending by requiring all milk to be processed through licensed processors. The regulatory comparison reveals exactly why UK adoption is accelerating, while North American penetration remains stagnant.
The Distribution Disruption Accelerating
The vending model cuts right through the traditional supply chain—farmer-hauler-processor-packager-distributor-retailer becomes a simple cow-to-consumer transaction. This disintermediation transforms farmers from commodity producers into brand owners, manufacturers, and retailers, granting them total control over pricing and positioning.
Real-World Evidence: Look at Midtown Milkhouse’s expansion into Booths supermarkets. They’re scaling beyond farm-gate sales while maintaining premium pricing and sustainable packaging that processors simply can’t replicate.
Modern vending systems pack IoT connectivity for remote monitoring and contactless payment systems, handling 85% of transactions. Advanced models, such as the MOD 400 and MOD 600, offer multiple 200-litre tanks with automatic changeover functions that minimize downtime.
Operational Reality:High-temperature, short-time pasteurization equipment costs £6,000-15,000 but delivers the food safety compliance that’s essential for premium positioning—the same compliance processors use to justify their massive margins.
Market Saturation vs. Market Development
With approximately 400 machines nationwide serving the UK’s retail milk market, penetration remains minimal. Global market projections indicate compound annual growth rates of 6.6-8.1%, suggesting significant expansion potential beyond the early adopter crowd.
Strategic Question: In a consolidating industry that loses 440 producers annually, will you continue to compete for processor table scraps or claim your share of the premium direct-sales market?
The Latest: Why Traditional Distribution Is Becoming Obsolete
Here’s what the data confirms: UK vending operations are achieving sustainable pricing premiums of 200-300% over wholesale rates, while farm-gate prices remain 14% higher than in April 2024, despite recent declines. Post-pandemic consumer behavior shows a lasting preference for local provenance and sustainable packaging solutions.
Industry Reality Check:Global market projections indicate compound annual growth rates of 7.2% through 2033, while traditional processor margins continue to squeeze primary producers. This technology trend represents fundamental shifts that empower farmers through precision agriculture integration, while challenging processor-dominated supply chains.
Bottom Line: This direct channel delivers instant cash flow and greater business resilience, with ROI frequently achieved within 12 months. The question isn’t whether direct-to-consumer dairy will grow—it’s whether you’ll build your operation around processor dependency or consumer engagement.
The revolution is happening. The only question left is which side of the disruption you’ll choose.
Complete references and supporting documentation are available upon request by contacting the editorial team at editor@thebullvine.com.
Learn More:
UK Dairy Farmers start selling fresh milk from 24-hour vending machines – Demonstrates how to implement vending operations through real farmer case studies, revealing practical strategies for setup, customer acquisition, and operational management that delivered immediate profitability during pandemic disruptions.
5 Technologies That Will Make or Break Your Dairy Farm in 2025 – Exposes five breakthrough technologies beyond vending that deliver measurable ROI within 12 months, providing the complete automation roadmap that transforms traditional operations into profit-maximizing, tech-enabled enterprises for sustained competitive advantage.
The Sunday Read Dairy Professionals Don’t Skip.
Every week, thousands of producers, breeders, and industry insiders open Bullvine Weekly for genetics insights, market shifts, and profit strategies they won’t find anywhere else. One email. Five minutes. Smarter decisions all week.
Stop chasing milk yield records. China’s $198M loss proves volume-first thinking destroys profits—optimize cost efficiency instead.
EXECUTIVE SUMMARY: The dairy industry’s long-held assumption that maximizing milk production per cow equals maximum profits has been catastrophically disproven by China’s $198 million dairy collapse. Despite achieving impressive yields of 11,000-12,000 kg per cow and hitting 85% dairy self-sufficiency two years early, China’s largest producers are hemorrhaging billions because they optimized for the wrong metric. Modern Dairy posted a staggering RMB 1.417 billion loss in 2024, while raw milk prices crashed by 17% as production costs nearly doubled in New Zealand due to its dependency on imported feed. The brutal math reveals China’s fatal flaw: production surged 31.6% while consumption grew only 3.3%, creating a 27-month consecutive price decline that’s destroying margins industry-wide. Meanwhile, New Zealand’s “inefficient” 4,500 kg per cow system maintains the world’s lowest production costs at US$0.37 per liter compared to China’s US$0.48+ per liter. This crisis highlights how volume-obsessed operations often sacrifice profitability per dollar invested—the only metric that truly matters for long-term survival. Every dairy operation needs to immediately calculate its true cost per unit of milk solids and evaluate whether it is optimizing for profitable efficiency or excessive volume.
KEY TAKEAWAYS
Cost Structure Beats Volume Every Time: New Zealand’s pasture-based system produces 400 kg of milk solids at US$0.37 per liter while China’s high-input model costs US$0.48+ per liter—proving that operations above US$0.48 per liter are in the danger zone regardless of impressive per-cow yields.
Feed Dependency Creates Structural Disadvantage: China’s reliance on imported feed for over 50% of production costs demonstrates why operations should evaluate feed conversion ratios against domestic feed availability rather than chasing maximum DMI through expensive supplements.
Market Diversification Trumps Volume Optimization: With China’s infant formula imports declining 37.1% between 2021 and 2024 and the demographic winter reducing the number of children aged 0-3 from 47 million to 28 million, smart operations are pivoting to premium products that command price premiums of 60% or more, rather than focusing on commodity volume.
Geopolitical Risk Now Exceeds Production Risk: New Zealand captured 46-51% of China’s import market through FTA access while U.S. exports collapsed under 125% tariffs, proving that diversified market portfolios and political risk management are now as critical as genetic merit and feed efficiency.
Robotic Milking ROI Requires Strategic Focus: Before investing $150,000-$250,000 per robot, operations must evaluate whether automation optimizes profit per dollar invested or just automates volume-obsessed thinking—China’s high-tech approach is proving that maximum throughput doesn’t equal maximum profitability.
What if the dairy industry’s obsession with maximizing milk per cow is actually destroying profitability? China’s spectacular dairy implosion has just shattered one of agriculture’s most sacred assumptions: that higher production automatically equals higher profits. With Modern Dairy posting catastrophic losses of RMB 1.417 billion (USD 198.4 million) for 2024, and raw milk prices crashing 17% in a single year, the world’s largest dairy market has proven that volume-first thinking is financially catastrophic.
This isn’t just China’s problem—it’s a wake-up call for every dairy operation worldwide.
The Volume Trap: Why China’s Production Success Became Its Biggest Failure
Here’s the story nobody saw coming: China actually won the production game. They hit their ambitious 2025 target of 41 million tons two years early, achieved 85% dairy self-sufficiency, and built some of the most technologically advanced dairy operations on the planet. Their elite farms are cranking out 11,000-12,000 kg per cow annually—numbers that would make any consultant drool.
So why are they hemorrhaging billions?
The answer reveals everything wrong with conventional dairy thinking. While China focused on maximizing milk production per cow through expensive imported feed and intensive systems, it created production costs nearly double those of pasture-based competitors, such as New Zealand. New Zealand’s pasture-based system achieves a five-year average total cost of production of US$0.37 per liter, compared to around US$0.48 per liter for other regions.
But here’s where it gets really brutal. While raw milk production surged 31.6% between 2018 and 2024, per capita dairy consumption grew by merely 3.3% in the same period. You don’t need an economics degree to see the problem—they built a production Ferrari without checking if anyone wanted to buy gas.
The Perfect Storm That Nobody Predicted
Three devastating forces hit China’s dairy market simultaneously, and each one exposes a flaw in volume-first thinking:
Economic headwinds crushed consumer spending. With the Consumer Price Index falling 0.7% in February 2025 and youth unemployment reaching record highs, Chinese families are cutting dairy purchases first. When you’re optimizing for maximum volume instead of profitable efficiency, you can’t adapt to demand shocks.
Demographics turned brutal. China’s birth rate decreased from 10.48% in 2019 to 6.77% in 2024, with the number of children aged 0-3 years dropping from over 47 million to just under 28 million. The infant formula market, which had driven premium dairy demand, collapsed, with China’s infant formula imports declining 37.1% between 2021 and 2024.
The cost structure was backwards from day one. China copied America’s high-input, confinement model without America’s cheap feed base. With over 50% of production costs tied to imported feed, they built a system that could never compete on cost, exactly the wrong foundation for a volume-focused strategy.
The Price Collapse That’s Rewriting the Rules
The numbers tell a story that should terrify every volume-obsessed operation. As of May 2024, dairy producers in China experienced a 27-consecutive-month, year-over-year decline in milk prices due to overproduction.
Let that sink in: 27 straight months of falling prices.
Raw milk prices crashed from a peak of 4.38 yuan per kilogram in 2021 to just 3.14 yuan by late 2024. However, here’s the kicker—current prices have fallen to 2.6 yuan per kilogram, while feeding costs alone average 2.2 yuan per kilogram. They’re essentially paying to give milk away.
The financial carnage is historic. Mengniu Dairy saw its net profit plummet by 97.8% in 2024, falling to approximately RMB 105 million (USD 14.7 million). Modern Dairy’s loss of RMB 1.417 billion represents more than just bad luck—it’s evidence that their entire business model was fundamentally flawed.
The Desperate Powder Play That’s Making Everything Worse
Here’s where the crisis becomes almost comical in its predictability. Faced with a daily surplus, Chinese processors convert an average of 20,000 tons of raw milk into powder every single day, accounting for about 25% of their total milk collection.
Sounds logical, right? Convert perishable milk into storable powder. Except there’s one tiny problem: with production costs around 35,000 yuan per ton and selling prices of only 15,000-19,000 yuan, processors lose more than 10,000 yuan for every ton of powder they produce.
Think about that business model for a second. They’re deliberately producing a product that loses money on every unit, hoping to make it up in volume. It’s the volume-first mentality taken to its logical, devastating conclusion.
Why Robotic Milking Might Be the Next Volume Trap
Now here’s where this gets uncomfortable for North American producers. The global milking robot market reached $2.98 billion in 2024 and is projected to hit $3.39 billion in 2025, with North America holding 30.8% market share. The sales pitch is always the same: automate to increase efficiency and maximize production.
But what if we’re making the same mistake as China?
Robotic systems are designed to maximize throughput, not optimize profitability per unit of milk. While these systems reduce labor hours by 20-40%, they often increase total production costs through higher capital depreciation, maintenance, and electricity expenses. Projections indicate that by 2025, 70% of Northwestern European cows will be milked by automated systems, whereas China’s adoption rate remains under 15%. However, China’s high-tech, high-cost approach is incurring significant financial losses.
Before you invest $150,000-$250,000 per robot, ask yourself this: Are you optimizing for the right metric, or are you just automating the same volume-obsessed thinking that destroyed China’s profitability?
The Strategic Alternative: Think Like New Zealand
Michigan operates 243 robotic milking units across 55 farms, and the successful operations share one critical insight: they focus on strategic facility design and cow traffic optimization rather than maximum throughput. They’re not trying to milk more cows faster—they’re trying to milk the right number of cows more profitably.
That’s the difference between automation as a tool and automation as a crutch for a flawed strategy.
The Geopolitical Reality Nobody Talks About
China’s crisis has revealed something that challenges everything we thought we knew about global competition: political relationships now matter more than production efficiency.
New Zealand dominates China’s market not because it is the most efficient producer, but because it has tariff-free access through its Free Trade Agreement. They captured 46-51% of China’s total dairy import volume in 2024 and control 92% of China’s WMP imports and 68% of SMP imports. Meanwhile, U.S. SMP exports to China effectively ceased, falling to zero in February 2025 for the first time since the 2019 trade war.
Here’s the uncomfortable truth: when tariffs hit 125% and non-tariff barriers create welfare losses six times greater than official tariffs, your cost advantage becomes meaningless overnight.
The Smart Money Is Moving
While everyone was competing for China’s shrinking market, smart operators began diversifying. Southeast Asia projects a 3.14% CAGR, while the Middle East/North Africa region shows a 4.6% CAGR, offering profit margins 15-20% higher and payment terms 30-45 days faster than those in China.
U.S. dairy export forecasts for fiscal year 2025 are raised by $100 million to $8.5 billion, but the growth isn’t coming from China—it’s coming from markets that actually want what we’re selling at prices that make sense.
The Value Revolution That’s Already Happening
Here’s the part that gives me hope: not all of China’s market is collapsing. While sales of regular pure milk fell 8.6% in 2024, organic pure milk and A2 milk grew by 0.2% and 5.7% respectively, commanding price premiums of over 60%.
The lesson is crystal clear: consumers will pay for value, but they won’t pay premium prices for commodity products just because you produced them expensively.
What This Means for Your Operation
The farms that will thrive in this new reality are those that optimize for profit per unit rather than volume per cow. Instead of asking “How can I produce more milk?” start asking “How can I produce the right milk at the right cost for the right market?”
Calculate your true cost per unit of milk solids. If you’re above US$0.48 per liter, you’re in China’s danger zone. Use the cost methodology that shows New Zealand’s structural advantage at US$0.37 per liter.
Before your next expansion decision, challenge yourself with these questions:
Can your operation maintain profitability in a scenario where China’s milk price declines by 28%?
Are you investing in volume capacity or profit-generating efficiency?
Do you have market diversification beyond geopolitically volatile trade partners?
The Bottom Line: Efficiency Beats Volume Every Time
China’s $198 million lesson is both painful and straightforward: a volume-first approach can undermine profitability when it overlooks cost structure and market realities.
New Zealand’s “inefficient” system maintains the world’s lowest production costs and highest returns on investment because they optimizes for the right metrics. They produce less milk per cow but more profit per dollar invested.
The future belongs to operations that optimize total system profitability rather than maximum per-cow production. Build cost structures that remain profitable during periods of price volatility, rather than maximizing output during favorable conditions.
Your action plan starts now: Contact your regional USDA export specialist to explore diversified markets with verified growth potential. Shift toward premium products that command price premiums rather than commodity volume. Most importantly, evaluate every production investment against profit per dollar rather than volume per cow.
The controversial truth that will separate winners from losers: In the post-China dairy market, efficiency beats volume, diversification beats dependency, and profit per dollar invested beats milk per cow every single time.
Don’t let China’s expensive education become your own. The biggest opportunities in dairy often lie behind the most significant conventional wisdom failures, and China’s volume-obsessed collapse has just revealed which approach actually works.
Complete references and supporting documentation are available upon request by contacting the editorial team at editor@thebullvine.com.
5 Technologies That Will Make or Break Your Dairy Farm in 2025 – Provides evidence-based ROI analysis for smart sensors, robotic milkers, and AI systems, helping operators invest in profit-generating automation rather than volume-obsessed technology that mirrors China’s costly mistakes.
The Sunday Read Dairy Professionals Don’t Skip.
Every week, thousands of producers, breeders, and industry insiders open Bullvine Weekly for genetics insights, market shifts, and profit strategies they won’t find anywhere else. One email. Five minutes. Smarter decisions all week.
Component premiums crush volume myths—genomic testing delivers 150% ROI while butterfat hits 4.33%. Time to ditch the 30,000-lb obsession?
Executive Summary: The dairy industry’s sacred cow of volume production is officially dead, and component optimization is banking producers an extra $400+ per cow annually while their neighbors chase meaningless milk pounds. U.S. dairy exports surged 13% to $3.83 billion in 2025’s first five months, driven by butterfat tests hitting 4.33%—the highest in a decade—while genomic testing accelerated genetic gains from $37 to $85 per cow annually, delivering 150-200% ROI. With cheese block prices swinging between $1.72/lb and the $1.60s, dry whey breaking $0.60/lb, and the DMC program extended through 2031, producers focusing on component premiums are out-earning volume chasers by $0.75-$1.25/cwt. Meanwhile, global competitors like Mexico are targeting 80% dairy self-sufficiency by 2030, and China maintains 84% tariffs on U.S. dairy, forcing American producers to maximize efficiency or risk acquisition. The brutal truth: operations still chasing 30,000-pound herds while ignoring genomics will become acquisition targets by 2027. It’s time to audit your breeding program, genomic testing strategy, and component optimization—because the window for strategic positioning is closing fast.
Key Takeaways
Component Revolution Pays: Butterfat optimization delivers $315+ per cow annually as tests hit 4.33% (up from 3.8% in 2015), while genomic testing costs below $60/animal generate 150-200% ROI through accelerated genetic gains now worth $85 per cow versus $37 pre-genomics.
Export Opportunities Explode: U.S. dairy exports jumped 13% to $3.83 billion in 2025’s first five months, with cheese exports hitting record 113.4 million pounds monthly, creating massive revenue opportunities for component-focused operations while volume producers struggle with commodity pricing.
Technology Adoption Separates Winners: Health monitoring sensors achieve 91% ROI success with 2.1-year payback periods, while feed efficiency innovations deliver $0.27/cow/day improvements, giving progressive operations $0.75-$1.25/cwt advantages over reactive competitors.
Policy Stability Rewards Strategic Planning: DMC extension through 2031 provides unprecedented risk management certainty, while updated FMMO composition factors (3.3% protein, 6% other solids) starting December 2025 will further reward high-solids herds already maximizing component premiums.
Global Competition Demands Efficiency: With Mexico targeting dairy self-sufficiency and China maintaining punitive tariffs, American producers must optimize genomic selection, component production, and operational efficiency—or face acquisition by operations that already have.
While your neighbors chase milk pounds, the smart money is banking component premiums that could add $ 400 or more per cow this year. Here’s what separates the winners from the losers in 2025’s market chaos.
The dairy markets just delivered a week that’ll separate the strategic operators from the reactive ones. Cheese block prices rocketed to $1.72/lb before crashing into the $1.60s during choppy, holiday-shortened trading. But here’s what most producers missed: this wasn’t just market noise—it was a signal that the fundamental rules of dairy profitability have permanently changed.
More telling? Dry whey finally punched through the $0.60/lb threshold after what felt like an eternity stuck in the $0.50s. When co-product values break out in this manner, it’s because processors are shifting their entire production strategies. And if you’re not paying attention to these signals, you’re about to get left behind.
Production Numbers That Actually Matter—If You Know How to Read Them
Let’s cut through the USDA statistical soup and focus on what’s really moving the needle. U.S. milk production rose 1.6% in May 2025, with the 24 major dairy states producing 19.1 billion pounds. But here’s the kicker most analysts missed: production per cow averaged 2,125 pounds in the major producing states, seven pounds above May 2024.
Total cheese production hit 1.23 billion pounds in March 2025, up 1.4% from March 2024 and 9.8% above February 2025. Butter production totaled 229 million pounds in March, up 8.6% year-over-year and nearly 13% from February. This isn’t just a statistical anomaly; it’s processors scrambling to absorb the butterfat tsunami that’s flooding the system.
Ready to admit your breeding program is stuck in 2015? Because the component revolution isn’t coming—it’s here. Butterfat tests hit 4.33% in March 2025, while protein tests reached 3.36%. Despite modest increases in milk production, calculated milk solids production has surged, creating a fundamental shift in what cows produce and how producers are compensated for it.
The number of milk cows in the U.S. reached 9.45 million head in May, with Texas and Idaho leading year-over-year growth. Michigan continues to deliver the highest average production per cow at 2,400 pounds, followed by Texas at 2,275 pounds. These numbers tell the story of an industry that’s fundamentally changing its approach to profitability.
Export Performance Reveals the Brutal Truth About Global Competition
U.S. dairy exports in May were valued at $794.8 million, a 13% increase from May 2024. Dairy exports during the first five months of 2025 were valued at $3.83 billion, up 13% from the first five months of 2024. But before you start celebrating, here’s the reality check: we’re winning despite ourselves, not because of superior strategy.
Cheese exports during May totaled 113.4 million pounds, up 7% from May 2024 and the highest volume of cheese exports ever in a single month. Leading markets for U.S. dairy exports during the January-May period included Mexico at $1.04 billion (up 10%), Canada at $571.4 million (up 21%), and Japan at $252.9 million (up 39%).
The export picture gets complicated fast when you factor in trade tensions. China imports faced 84% tariffs on U.S. goods, with exports to China at $214.3 million (down 5%) during the first five months of 2025. With duties on Mexico (25%), Canada (25%), and China (125%) unaffected by the 90-day tariff pause, U.S. dairy exporters face significant challenges.
Washington Finally Delivers—But There’s a Catch
The House Agriculture Committee’s reconciliation proposal extends the Dairy Margin Coverage (DMC) program through 2031. But here’s what the press releases didn’t tell you: this extension comes with upgrades that fundamentally change how risk management works.
The DMC program helps dairy producers manage the financial impacts of fluctuating milk prices and feed costs, with payments triggered when the margin between All-Milk price and average feed price falls below chosen coverage levels. The proposal also bases the program’s production history calculation on a farmer’s highest production year out of 2021, 2022, or 2023, better reflecting recent on-farm production levels.
The bill also funds mandatory USDA dairy processing plant cost surveys every two years, which will better inform future make allowance conversations. Translation: no more waiting decades for pricing formulas to catch up with economic reality.
FMMO Reforms: Winners, Losers, and What You Need to Know
Beginning June 1, 2025, updated FMMO pricing formulas went into effect—the first major revision since 2008. Updated make allowances include cheese at $0.2519 per pound, butter at $0.2272 per pound, and nonfat dry milk at $0.2393 per pound. Class I differentials were increased with location-specific values.
The changes revert the base Class I skim milk price formula to the higher of the advance Class III and Class IV prices, rather than using the average of the two. Updated skim milk composition factors, with 3.3% protein and 6% other solids, will be implemented on December 1 to minimize complicating risk management positions.
However, what most producers overlooked is that these changes will initially reduce farmer milk checks; however, the market-driven price increases are currently overpowering the calculation-driven price decreases. Understanding these changes, particularly those affecting Class III and IV prices, will be crucial for effective price risk management strategies.
The Genomics Revolution That’s Separating Winners from Losers
Here’s a number that should make you uncomfortable: the dairy industry has surpassed 10 million genomic tests, with wide adoption accelerating genetic gains from $37 to $85 per cow annually—a 129% increase. It took only 11 months for dairy farms to submit 1 million genomic tests from March 2021 to February 2022.
Dr. Jonathan Lamb, a New York dairy farmer, reported that his first and second lactation cows completed lactations averaging 5% butterfat, while fifth and greater lactation cows ranged from 3.5% to 4.4% butterfat content. This powerful data from 3,367 completed lactations demonstrates how genetics and genomics have created a seismic shift in butterfat production, representing levels not seen before in the history of U.S. Holsteins.
Federal Milk Marketing Order data shows butterfat percentages climbed from 3.8% in March 2015 to 4.33% in March 2025. The data surge is enabling more accurate predictions and greater genetic gains for farms that are smart enough to utilize them.
Trade Uncertainties That Could Change Everything Overnight
The 90-day tariff pause expires July 9th, and the implications for dairy trade are staggering. Tariffs on imports from Mexico (25%), Canada (25%), and China (125%) remain in force. Most tariffs that wiped out $10 trillion in global equity value have been paused for 90 days, but the latest announcement is unlikely to sweeten U.S. dairy exporters.
China is the third biggest export market for U.S. dairy, with 385,485 metric tons of goods worth $584 million exported in 2024. The timing couldn’t be worse, as U.S. dairy imports declined 13% in May to $377.8 million—the lowest monthly value since December 2023.
The BRICS threat adds another layer of complexity. Countries such as Brazil and India are major dairy producers and significant competitors in global markets. An additional 10% tariff on BRICS-aligned nations could reshape trade flows in ways that either benefit U.S. exporters or trigger retaliatory measures.
Weather Delivers Mixed Messages About Feed Costs
According to the May 27, 2025, U.S. Drought Monitor, moderate to exceptional drought covers 26.1% of the United States, down from 31.0% on the April 29 map. The worst drought categories (extreme to exceptional drought) decreased from 7.8% last month to 6.9%.
Approximately 80.7 million people are currently living in drought-affected areas, a monthly decrease of 16.1 million people. The USDM reported reductions or improvements in drought across large portions of the Plains, Northeast, and Southeast.
But here’s the reality check: improved weather doesn’t automatically translate to lower feed costs. Market dynamics, export demand, and ethanol production all influence grain prices independent of growing conditions.
What This Really Means for Your Operation
Let’s face it—most dairy producers are still operating as if it were 2015. They’re chasing milk volume while the smart money banks component premiums. Butterfat production grew 3% in January 2025, 4% in February, and 2.8% in March compared to the same months last year, while milk production grew less than 1%.
Per capita butter consumption climbed to 6.5 pounds in the latest USDA data—the highest level since 1965, when the U.S. had 195 million people compared to 345 million this year. Butter now absorbs 18% of the U.S. milk supply on a milkfat basis—up from 16% in 2000, while cheese has moved from 38% to 42% of the U.S. milkfat supply.
The U.S. imported a record 172 million pounds of butter and anhydrous milkfat in 2024, up from 10 million pounds in 2010. The U.S. is importing nearly 8% of its milkfat needs, demonstrating a significant opportunity for domestic butterfat production growth.
The Bottom Line: Adapt or Get Acquired
This week crystallized several trends that will define dairy markets through the rest of 2025 and beyond. Cheese price volatility reflects tighter supply-demand balances that favor producers willing to market their products strategically rather than simply shipping them to the plant. Dry whey’s breakout signals that co-product values are finally responding to global demand shifts that have been building for months.
DMC coverage through 2031 means your primary safety net is locked in for the entire payback period on major capital investments—planning certainty the industry hasn’t enjoyed in decades. However, this stability comes at a price: you can no longer blame policy uncertainty for failing to invest in genetic, technological, and efficiency improvements.
The July 9th deadline will reveal whether the Trump administration’s negotiating strategy produces meaningful trade agreements or triggers a tariff war that reshapes global dairy flows for years to come. Either way, the operations positioned for component optimization and export opportunities will capture the lion’s share of whatever profits remain.
Here’s the uncomfortable truth: farms still chasing 30,000-pound herds while ignoring genomics will be acquisition targets by 2027. The technology revolution separating progressive operations from reactive competitors accelerates daily. Every month of delayed integration allows competitors to compound their advantages, which become exponentially harder to overcome.
The window for strategic positioning is closing fast. Those who adopt component optimization, precision agriculture, and genomic selection today will establish lasting competitive advantages that compound over generations. The question isn’t whether you can afford to make these changes—it’s whether you can afford not to.
Complete references and supporting documentation are available upon request by contacting the editorial team at editor@thebullvine.com.
5 Technologies That Will Make or Break Your Dairy Farm in 2025 – Exposes cutting-edge innovations including smart calf sensors reducing mortality 40% and precision feeding systems cutting waste, showing exactly which technologies deliver fastest payback for competitive advantage.
The Sunday Read Dairy Professionals Don’t Skip.
Every week, thousands of producers, breeders, and industry insiders open Bullvine Weekly for genetics insights, market shifts, and profit strategies they won’t find anywhere else. One email. Five minutes. Smarter decisions all week.
Gates’ $840M synthetic dairy bet isn’t your farm’s death sentence, it’s your feedstock opportunity. Smart operators pivot now for 2-3x ROI.
EXECUTIVE SUMMARY: While most farmers panic about synthetic dairy disruption, the smartest operators are positioning themselves to profit from Bill Gates’ $840 million investment wave targeting our record-breaking 227.8 billion pound annual milk production. Current butterfat levels consistently above 4%, the highest in USDA history since 1924, create the exact peak performance conditions that make synthetic alternatives economically attractive to investors. Precision fermentation companies need massive carbohydrate inputs, creating immediate feedstock partnership opportunities for corn and soy producers who can command 2-3x premiums over traditional animal feed markets. With Class III milk hitting $24-25/cwt, high prices are simultaneously funding your competition while providing the capital needed for strategic positioning. The four verified adaptation pathways, feedstock partnerships (2-3 year ROI), processing infrastructure integration (12-18 month ROI), premium differentiation (3-5 year ROI), and component optimization (1-2 year ROI), offer concrete alternatives to commodity competition.Stop viewing synthetic dairy as an existential threat and start evaluating which strategic pathway positions your operation to capture value from the industry’s $3.5 billion transformation.
KEY TAKEAWAYS
Feedstock Revenue Opportunity: Precision fermentation requires 25x less feedstock than conventional dairy but pays 2-3x premiums for food-grade carbohydrates, your corn yields averaging 175 bushels per acre could pivot to high-value sugar production with verified 2-3 year ROI timelines.
Component Premium Strategy: High-value proteins like lactoferrin sell for $800-$1,000 per kilogram where fermentation struggles to compete, focus breeding decisions on components commanding premiums while current butterfat levels above 4% create clear differentiation from synthetic alternatives.
Infrastructure Partnership Path: Following Australia’s Norco model, dairy cooperatives can leverage existing pasteurization, packaging, and distribution networks for synthetic protein processing, verified 12-18 month ROI with immediate revenue diversification opportunities.
Market Stratification Reality: Synthetic dairy targets high-volume, low-margin ingredient production first, escape the commodity trap by positioning for the low-volume, high-margin experiential food market where authenticity commands 25-40% higher margins through artisanal processing and direct-to-consumer marketing.
Strategic Timing Advantage: With $25/cwt milk providing capital reserves and synthetic companies still struggling to achieve 50g/L yield targets needed for cost competitiveness, you have 2-3 years to implement strategic positioning before technology reaches price parity with conventional dairy.
What if the technology making butter from thin air just became more economically viable than your 9.45 million-cow national herd producing at record levels? With US milk production hitting 227.8 billion pounds annually and butterfat content reaching historic 4.0+ levels according to USDA data, Bill Gates’ strategic investments through Breakthrough Energy Ventures aren’t targeting a struggling industry – they’re challenging dairy farming at its absolute peak performance.
The $3.5 Billion War Chest: Gates’ Multi-Pronged Disruption Strategy
Here’s what most coverage misses about Gates’ approach: it’s not a single bet on synthetic dairy, but a sophisticated three-pronged strategy to transform the entire food system. Breakthrough Energy Ventures, with over $3.5 billion in committed capital, reveals a pragmatic approach embracing both radical disruption and sustainable augmentation of existing agriculture.
Thesis 1: Radical Disruption – BEV’s $33 million investment in Savor represents the most audacious bet. This California startup has developed a thermochemical process that creates butter-like fats directly from carbon dioxide and hydrogen, bypassing biological systems. Gates’ personal endorsement – stating he “couldn’t believe I wasn’t eating real butter” because “chemically it is” the real thing – serves as powerful market validation.
Thesis 2: Platform Technology Expansion – The strategy extends beyond dairy. BEV led a $20 million Series A in C16 Biosciences, producing sustainable palm oil alternatives via precision fermentation, and invested in BIOMILQ, culturing human mammary cells for breast milk production. These investments demonstrate confidence in fermentation as a versatile platform applicable across fats, oils, and proteins.
Thesis 3: Sustainable Augmentation – Simultaneously, BEV invested $12 million in Rumin8, an Australian startup creating feed additives that reduce cattle methane emissions by up to 95%. This pragmatic approach improves conventional dairy’s sustainability while betting on its replacement.
The Numbers Don’t Lie: Traditional Dairy Peak Performance Creates Vulnerability
US dairy farmers are crushing it right now. May 2025 USDA data shows national milk production jumped 1.6%, with major producing states hitting 19.1 billion pounds. Production per cow averaged 2,125 pounds, led by Michigan’s 2,400 pounds per cow.
But here’s the strategic blindspot: for the first time in USDA history, dating back to 1924, every month of 2024 stayed above 4% butterfat. This isn’t incremental improvement – it’s peak biological performance creating the exact conditions synthetic alternatives need to compete.
Think about your highest-producing cow delivering 100+ pounds daily. She’s also your biggest metabolic disorder risk because she’s operating at maximum capacity with zero margin for error. The US dairy industry is that cow right now.
The Commercial Reality: From Lab to Supermarket Shelves
The technology isn’t theoretical anymore. Perfect Day has successfully obtained FDA “no questions letters” for their microbially-produced whey proteins, clearing regulatory pathways for commercial use. The company has raised nearly $840 million total, with their January 2024 pre-Series E round of $90 million explicitly earmarked to “drive to profitability” and prove “unit economics.”
Commercial products are already on supermarket shelves:
General Mills launched Bold Cultr cream cheese using Perfect Day’s whey
Unilever incorporated the protein into Breyers ice cream
Mars launched a CO2COA chocolate bar using precision-fermented whey
These aren’t pilot programs – they’re commercial products validating the B2B ingredient strategy.
The Economics: Why $25 Milk Accelerates Your Replacement
Recent Class III prices hitting $24 in September 2024 had producers celebrating. But here’s the brutal economic reality: high milk prices don’t protect you from synthetic alternatives – they accelerate their development.
When milk hits $25/cwt, an $80 million fermentation facility producing 10,000 metric tons annually suddenly becomes economically justifiable. The industry’s techno-economic analysis shows companies must achieve a 50g/L yield (titer) to become cost-competitive with conventional dairy proteins. Most are struggling to reach 25g/L consistently, but every 2x increase in titer creates a corresponding 2x decrease in cost of goods sold.
Translation: High prices that boost short-term profitability are simultaneously funding long-term competition.
According to Good Food Institute polling, consumer awareness of precision fermentation remains extremely low – only 13% of American adults have heard of it. Despite this unfamiliarity, 39% of Americans find precision-fermented dairy appealing, with 29% willing to try and 21% ready to purchase.
The generational divide is stark:
Millennials: 36% interested
Gen Z: 32% interested
Baby Boomers: 21% interested
The most effective messaging uses “animal-free” terminology and emphasizes producing “the same proteins” found in conventional dairy. However, a critical challenge exists: because proteins are molecularly identical to cow’s milk, they trigger the same allergic reactions, creating dangerous potential confusion between “animal-free” and “allergen-free.”
Four Strategic Pathways Forward (With Verified ROI Data)
Option 1: Feedstock Partnership (ROI: 2-3 years)
Precision fermentation requires massive carbohydrate inputs – 25 times less feedstock than conventional dairy farming, but at higher quality standards. Current corn yields averaging 175 bushels per acre could pivot to food-grade sugar production, commanding 2-3x premiums.
Following Australia’s Norco model, which partnered with CSIRO to form Eden Brew for precision-fermented proteins, cooperatives can leverage existing processing facilities. Your pasteurization, packaging, and distribution networks become more valuable, not less.
High-value proteins like lactoferrin sell for $800-$1,000 per kilogram, price points where fermentation struggles to compete. Focus breeding decisions on components commanding premiums and harder for synthetics to replicate cost-effectively.
The Environmental Reality Check: Conditional Benefits
Life Cycle Assessments consistently show precision-fermented dairy components offer 72-97% GHG reduction, up to 99% land use reduction, and 81-99% water consumption reduction compared to conventional dairy. However, these benefits depend entirely on renewable energy use.
A coal-powered fermentation facility has a worse carbon footprint than pasture-based operations. The high energy intensity of purification processes makes overall sustainability contingent on grid decarbonization and circular feedstock sourcing.
The Regulatory Battle: More Than Just Labeling
The National Milk Producers Federation argues vehemently that using dairy terms like “milk” and “butter” on non-animal products violates FDA standards of identity. They actively lobby for strict enforcement and support the bipartisan DAIRY PRIDE Act.
The FDA faces a difficult position. January 2025 draft guidance on plant-based alternatives expressly excludes “animal proteins produced by microflora,” signaling these products require separate consideration. This regulatory uncertainty creates both risk and opportunity for positioning.
The Bottom Line: Peak Performance Makes You a Target
Synthetic dairy companies raised nearly $840 million not to compete with struggling farmers, but to capture market share from an industry producing 227.8 billion pounds annually at record component levels. Your current success makes you an attractive target and provides resources for strategic adaptation.
The farms thriving in 2030 won’t ignore synthetic dairy or panic about it. They’ll recognize disruption as an expansion opportunity and position accordingly, while milk prices and production performance provide capital to invest.
Your critical next move: Audit your current positioning this month. Are you trapped in commodity production or positioned for premium markets? The precision fermentation alliance represents a $3.5 billion bet that the future belongs to those who can produce components without biological constraints.
The question isn’t whether you’ll survive this change. It’s whether you’ll profit from the market stratification it creates – high-volume, low-margin ingredient production (where synthetics will dominate) versus low-volume, high-margin experiential foods (where authentic dairy thrives).
The synthetic dairy revolution isn’t your death sentence – it’s your call to evolve from dairy farming to dairy value creation.
Complete references and supporting documentation are available upon request by contacting the editorial team at editor@thebullvine.com.
Brown Foods’ UnReal Milk Set to Disrupt Dairy Industry – Demonstrates how cellular agriculture technology producing complete milk creates different competitive pressures than precision fermentation, helping you evaluate which emerging technologies pose the greatest threats and opportunities.
The Sunday Read Dairy Professionals Don’t Skip.
Every week, thousands of producers, breeders, and industry insiders open Bullvine Weekly for genetics insights, market shifts, and profit strategies they won’t find anywhere else. One email. Five minutes. Smarter decisions all week.
Lactalis’s $2.1B yogurt grab triggers protein gold rush—but smart farmers know when premiums turn toxic. Your 90-day window starts now.
EXECUTIVE SUMMARY: While every dairy publication celebrates protein premiums reaching $15.89 per kilogram versus $12.68 for butterfat, here’s what they’re not telling you: when all farms chase the same 3.5-3.8% protein targets, those 25% premiums evaporate faster than morning dew. Lactalis’s General Mills acquisition creates immediate opportunities—every 0.1% protein increase adds $6,570 monthly to a 1,000-cow operation’s revenue—but also sets up the industry’s next commodity trap. Canadian data reveals ultra-filtration demands specific milk characteristics that only sophisticated nutrition programs can deliver consistently, while research confirms optimal dietary protein at 16.5% versus the 18-19% most farms still feed. The three-way processor war between Lactalis, Danone, and Chobani creates a 90-day decision window ending September 2025, but smart operators understand that today’s protein premiums could become tomorrow’s table stakes. Global market analysis shows European production declining 0.2% while U.S. output grows 0.5%, creating short-term advantages for component-focused operations. The uncomfortable truth: producing high-protein milk costs real money through feed efficiency programs, genomic testing, and amino acid balancing—and when every competitor optimizes for the same targets, margins compress. Stop chasing yesterday’s premiums and start positioning for the post-protein economy before your neighbors flood the market.
KEY TAKEAWAYS
Component Economics Reality Check: Canadian processors already demonstrate the protein premium ceiling—$15.89/kg protein commands just 25% premium over butterfat, but achieving consistent 3.5-3.8% protein requires expensive feed modifications and sophisticated amino acid balancing that many operations underestimate at $200-400 per cow annually.
The 90-Day Opportunity Window: Lactalis’s Q4 2025 reformulation timeline creates immediate processor contract opportunities, but genomic testing data reveals only 30% of current herds can consistently deliver target protein levels without major nutritional program overhauls costing $50,000-$150,000 for 500-cow operations.
Feed Efficiency Breakthrough Strategy: USDA research confirms 16.5% dietary protein versus typical 18-19% levels reduces nitrogen waste while maintaining milk yield, but implementing rumen-protected amino acid programs delivers 12% higher milk solids and 8% lower feed costs only when properly managed through precision nutrition protocols.
Market Saturation Warning Signal: When three processors controlling 60% of yogurt sales converge on identical high-protein formulations, basic economics suggests premium compression—smart operators should evaluate protein optimization ROI against alternative value-added strategies like organic certification or direct-to-consumer channels before market saturation occurs.
Technology Investment Calculus: Precision agriculture tools including genomic testing and automated feed systems deliver measurable returns (17% output boost for 250-cow herds without facility expansion), but the window for capturing maximum protein premiums narrows as adoption accelerates and component-specific contracts become commodity requirements rather than premium opportunities.
While you were worrying about feed costs, Lactalis just dropped $2.1 billion to buy General Mills’ entire U.S. yogurt business and triggered the most aggressive protein reformulation war in dairy history. Here’s what the mainstream press isn’t telling you about the upstream tsunami heading straight for your bulk tank, and why your protein percentage just became more valuable than your butterfat.
Let’s cut through the corporate speak. This isn’t just another acquisition. Lactalis completed this deal on June 30, 2025, instantly controlling approximately 20% of the U.S. yogurt market and creating a three-way death match with Danone and Chobani that will fundamentally alter how processors value your milk.
But here’s the kicker everyone’s missing: the real story isn’t happening in boardrooms, it’s happening in your feed bunk.
The $15.89 Question: Why Protein Just Beat Butterfat
Think protein premiums are just marketing hype? Canadian processors already pay $15.89 per kilogram for protein versus $12.68 for butterfat in Class 4(a) milk used for yogurt manufacturing. That’s a 25% premium that’s about to go mainstream across North America.
Here’s why: Lactalis isn’t just buying brands, they’re buying the reformulation playbook. The company has already perfected the “high-protein, low-sugar” formula with siggi’s and Stonyfield Organic. Now they’re applying that same science to mass-market Yoplait and Go-Gurt.
The math is brutal but simple: Modern yogurt reformulation demands milk with 3.5-3.8% protein to achieve ultra-filtration efficiency targets necessary for high-protein yogurt production. Current data shows producer milk averaged just 3.36% protein in March 2025. See the gap? That’s your opportunity, if you move fast.
But nobody’s telling you that when every farm chases the same protein targets, those premiums could evaporate faster than morning dew.
What They’re Not Telling You About Ultra-Filtration Reality
The industry loves talking about “ultra-filtered milk,” but here’s the uncomfortable truth about the processing requirements. Ultra-filtration technology retains larger protein molecules while removing water, lactose, and minerals. This process has significant potential in the dairy industry for separating milk proteins and improving product quality.
The reformulated Yoplait Protein line hitting shelves delivers 15 grams of protein with only 3 grams of total sugar, achieved through ultra-filtered milk and strategic sweetener selection. That protein concentration demands milk with naturally higher protein content to achieve cost-effectiveness.
Here’s what processors aren’t advertising: ultra-filtration works best with milk that already has optimal protein ratios. However, the technology requirements create significant technological and financial barriers to entry, inherently favoring large, well-capitalized global players like Lactalis and Danone, who can afford the manufacturing equipment and scientific research.
Translation: the protein arms race isn’t just reshaping your milk check, it’s consolidating the entire industry around players with the deepest pockets.
The Feed Efficiency Revolution You’re Missing (And Its Hidden Costs)
Most dairy nutritionists are still overfeeding crude protein because that’s how we’ve always done it. Research from USDA’s Agricultural Research Service confirms optimal dietary protein levels around 16.5% versus the 18-19% commonly fed, and this lower level minimizes nitrogen pollution without compromising milk yield.
But here’s where it gets expensive: Nitrogen Use Efficiency (NUE) isn’t just environmental compliance, it’s profit optimization with real costs. Every gram of dietary nitrogen converted to milk protein instead of urinary waste improves your component profile, but achieving higher protein levels often necessitates more expensive protein-rich feeds, which increase overall production costs.
Smart operators are implementing amino acid balancing rather than crude protein dumping. Rumen-protected amino acids target specific protein synthesis pathways, boosting milk protein percentage while reducing total feed protein requirements. But here’s the reality check: these advanced nutritional strategies add their own layer of cost and complexity.
The question nobody’s asking: Are the protein premiums sustainable when feed costs to achieve them keep climbing?
The Market Saturation Risk Everyone’s Ignoring
While North American producers debate protein premiums, let’s examine the global context that could reshape everything. The North American yogurt market is projected to grow from $16.1 billion in 2025 to $18.84 billion by 2030, a compound annual growth rate of just 3.20%.
That’s steady growth, but here’s the concerning trend: European milk deliveries are forecast down 0.2% in 2025 due to environmental regulations and tight margins, while U.S. production increases 0.5% to 226.2 billion pounds. When global supply patterns shift and every U.S. producer optimizes for protein, basic economics suggests those premiums face downward pressure.
Consumer demand data validates the protein focus: 71% of U.S. adults report actively trying to consume more protein. But consumer trends are notoriously fickle. Remember when fat-free everything dominated grocery shelves? Markets that reward specific attributes eventually become saturated with those attributes.
The Federal Milk Marketing Order Reality Check
Updated FMMO composition factors reward farmers producing milk with 3.3% protein and 6.0% other solids versus previous assumptions of 3.1% protein and 5.9% other solids. This regulatory change creates immediate financial incentives aligned with processor reformulation demands.
Seven of the 11 FMMOs are “multiple component orders,” where you receive payment based on actual pounds of solids delivered. Translation: component optimization becomes directly profitable, not just theoretically beneficial.
But here’s the regulatory risk nobody’s discussing: Federal pricing mechanisms can change. What happens to your protein-focused nutrition program if FMMO formulas shift again? The same regulatory system that creates today’s protein incentives could eliminate them tomorrow.
The Technology Investment Calculus (With Real ROI Numbers)
Genomic testing reached 1 million samples in just 11 months, compared to 13 years for the first 5 million tests. This acceleration enables 70% accuracy in identifying high-protein genetics at birth rather than waiting for lactation performance.
For expansion-minded operations: 250-cow herds using genomic testing and precision nutrition boost output 17% without adding facilities. The ROI math is straightforward when protein premiums justify technology investments.
But let’s talk about the reality of implementation. Producing high-protein milk presents complex challenges for dairy farmers, creating a dilemma that balances profit with agronomic, biological, and environmental costs. The historical practice of overfeeding crude protein has been linked to negative effects on cow fertility and reproductive performance, as elevated blood urea nitrogen can alter the uterine environment and compromise embryo survival.
Are you prepared for the fertility challenges that come with aggressive protein pushing?
The Supply Chain Disruption Nobody Sees Coming
The demand for compositionally specific milk has significant implications for the logistics of the dairy supply chain. As processors increasingly require milk with particular attributes, the traditional model of pooling commodity milk is becoming insufficient.
This shift necessitates greater segregation in the supply chain to keep different types of milk separate from farm to plant. It also requires more sophisticated and frequent testing at multiple points to accurately verify component levels.
Lactalis’s new distribution center in Illinois is designed to receive and manage products from ten different production facilities, each with its own unique inputs and outputs. This scale of logistical complexity creates inherent tension between consumer demand for higher protein content at affordable prices and the very real biological, environmental, and economic limits of dairy farming.
The Bottom Line: Move Fast, But Watch Your Back
Lactalis’s acquisition creates a 90-day decision window. Q4 2025 reformulation deadlines mean processor contracts requiring component specifications will be finalized by September 2025.
The convergence is undeniable: consumer health trends, processor consolidation, regulatory changes, and global trade dynamics all reward operations producing consistently high-protein milk. But here’s what the protein premium advocates won’t tell you: when all major competitors converge on the “high-protein, low-sugar” formula, the very attributes that once commanded premium prices risk becoming commoditized.
The uncomfortable truth? Every 0.1% protein increase adds approximately $6,570 monthly to a 1,000-cow operation’s revenue when processors pay protein premiums. However, producing high-protein milk costs money through feed efficiency programs, genomic testing, component monitoring, and amino acid balancing.
The protein war just escalated from skirmish to full combat. Lactalis didn’t spend $2.1 billion to play nice with commodity milk pricing. They’re betting the farm, literally your farm, on protein concentration becoming the new industry standard.
Here’s the strategic question: Are you optimizing for today’s protein premiums, or positioning for tomorrow’s market reality when those premiums face inevitable compression from oversupply?
The processors who’ll dominate 2025 already understand this reality. The farmers who’ll prosper are those who adapt their production systems thoughtfully, balancing protein optimization with operational sustainability and market risk management.
Industry analyst commentary confirms the trend: “Lactalis’s reformulation timeline means mainstream yogurt will compete directly with Greek varieties on protein content. Farmers who understand these requirements first will capture the highest component returns as three major processors compete for suitable milk supplies”.
The protein economy is here. The question isn’t whether you’ll participate, it’s whether you’ll profit sustainably from it.
Complete references and supporting documentation are available upon request by contacting the editorial team at editor@thebullvine.com.
Learn More:
Protein Sweet Spot: How 160g Crude Protein Maximizes Dairy Farm Profits – Reveals the precise feeding strategy that delivers 1-2 cents per liter savings while optimizing protein content, showing exactly how to implement cost-effective nutrition programs that support premium component pricing.
Every week, thousands of producers, breeders, and industry insiders open Bullvine Weekly for genetics insights, market shifts, and profit strategies they won’t find anywhere else. One email. Five minutes. Smarter decisions all week.
Canadian dairy farmers achieve 10,400 kg milk yields with 0.191 debt ratios while “free market” systems require $33B bailouts. Time to rethink everything?
What if everything the dairy industry believes about free markets is actually subsidized fiction? While economists preach the gospel of deregulation and “competitive markets,” Canadian dairy farmers are achieving something that exposes the entire free-market narrative as carefully constructed theater. According to the USDA’s 2025 Farm Sector Income Forecast, U.S. dairy operations are projected to receive massive government support, while Canadian supply-managed farmers saw their cash receipts increase by 3.9% for unprocessed milk in 2024, with projections for another 3.0% growth in 2025, without a single bailout dollar.
Here’s the uncomfortable truth that free market advocates desperately want buried: Canada’s supposedly “outdated” supply management system is quietly delivering everything economists promised deregulation would provide—and doing it better than every single subsidized “free market” dairy system on the planet.
Think of it this way: if your nutritionist promised a balanced ration but delivered 40% spoiled feed instead, you’d fire them immediately. Yet when it comes to dairy policy, we keep trusting systems that require Chapter 12 family farm bankruptcies up 55% in 2024 while calling them “free markets.”
Comparative Analysis of Global Dairy System Performance Metrics
This isn’t theoretical economics—this is about measurable outcomes that would make any farm consultant recommend the Canadian model: debt-to-equity ratios of 0.191 versus New Zealand’s 47.4% debt-to-asset ratio, bankruptcy rates so low they’re not tracked as economic indicators, and milk yields projected at 10,400 kg per cow while maintaining financial stability that makes American volatility look like feeding different rations every day.
Financial stability comparison between Canadian supply management and free market systems
Why This Matters for Your Operation
If you’re evaluating long-term sustainability strategies for your dairy operation, the data from 2020-2025 provides a clear framework for understanding what policy stability can deliver versus the hidden costs of “free market” volatility.
Immediate Impact Assessment:
Can you plan facility upgrades 5-7 years in advance with confidence?
Do you know your milk price within 2% twelve months ahead?
Can you make genetic decisions based on 10-year projections?
Are your neighbors competitors or collaborators in market stability?
Canadian farmers answer “yes” to all four. How many can you answer affirmatively?
The Free Market Myth: What Multi-Billion Dollar Bailouts Really Tell Us
Let’s start with a feed analysis that’ll make free market purists as uncomfortable as a Holstein in 100°F weather: there are no free dairy markets. Anywhere.
The Multi-Billion Dollar Subsidy Reality Check
The United States—the poster child for dairy deregulation—operates through massive government intervention. According to USDA’s 2025 enrollment announcement, the Dairy Margin Coverage (DMC) program provides producers with price support to help offset milk and feed price differences, while the 2025 Farm Sector Income Forecast projects cash receipts from milk sales at $52.1 billion, up $1.4 billion from 2024 due to higher prices and quantities sold.
But here’s where the numbers get really interesting. The USDA has raised its 2025 milk production forecast to 227.3 billion pounds, up 0.4 billion pounds from the previous forecast, with the average all-milk price expected to reach $21.60 per hundredweight, a $0.50 increase from last month’s projection. Yet this “stability” comes through constant government intervention rather than market mechanisms.
Meanwhile, Canadian dairy farmers operating under supply management experienced minimal price volatility, with adjustments so predictable they’re essentially noise in the system, allowing farmers to plan breeding programs and facility investments years in advance, like having a feed contract locked in at harvest time.
The Australian Catastrophe: When “Pure” Markets Become Exploitation
Want to see what happens when free market ideology meets reality? According to industry analysis, 55% of Australian dairy producers are considering exiting the industry altogether, with farmers reporting earnings as low as $2.46 per hour following 10-15% farmgate price cuts.
Australia has lost 80% of its dairy farms since 1980, creating what researchers call “dairy deserts” where entire rural communities have collapsed. This isn’t market efficiency—it’s legalized destruction. Imagine if your feed supplier had monopoly power and decided to cut payments by 15% while your costs increased 40%. That’s exactly what Australian farmers face under “competitive” markets.
The European Subsidy Shell Game
The European Union operates under the Common Agricultural Policy (CAP)—one of the world’s largest subsidy programs, accounting for 31% of the total EU budget, with €387 billion allocated for 2021-2027. Recent EU reports call for a “major overhaul” of this system, acknowledging that “business as usual is not an option” due to “multiple crises” affecting farmers.
Here’s the critical question every dairy policy expert should ask: If these systems are so “efficient,” why do they require constant taxpayer bailouts to prevent total collapse?
Performance Comparison: The Numbers Don’t Lie
Global Dairy Systems Performance Comparison: Key Financial and Environmental Metrics
System Performance Metric
Canada (Supply Managed)
USA (“Free Market”)
Australia (Deregulated)
New Zealand (Export-Focused)
Farm Bankruptcy Trend
Negligible (not tracked as significant)
Up 55% in 2024
55% considering industry exit
High debt stress indicators
Price Volatility
Minimal adjustments (<1% annually)
Constant forecast revisions ($21.10 to $23.05 range)
10-15% cuts in a single season
Wide forecast ranges ($8-11/kgMS)
Average Debt-to-Asset Ratio
~16% (sustainable levels)
Variable with rising stress
Rising bankruptcy risk
47.4% (high leverage)
Government Support Required
Transparent, finite compensation
Massive ongoing bailouts (DMC, ECAP)
Minimal but ineffective
Minimal direct support
Production Stability
3% growth projected
Volatile boom-bust cycles
30-year production low
Export-dependent volatility
Rural Community Impact
96 cows average (family scale)
357 cows average (consolidation pressure)
80% farm loss since 1980
Intensification pressures
By the Numbers: Canada’s Silent Performance Revolution
The data tells a story that should make every agricultural economist reconsider their textbooks. While free market systems create boom-bust cycles that destroy farm families, Canada’s supply management delivers something revolutionary: consistent success across the entire sector.
Financial Stability That Actually Works
According to Canada’s supply management framework, approximately 12,000 dairy farms were operating under the system as of 2018, representing about 12% of all Canadian farms but delivering remarkable stability. These operations maintain debt levels around 16% of total assets, compared to the financial stress indicators seen elsewhere.
Compare this to the U.S., where Chapter 12 family farm bankruptcies increased by 55% in 2024 compared to 2023. The American system produces cash receipts forecast at $52.1 billion for 2025, up from $45.9 billion in 2023—impressive numbers that mask the underlying volatility destroying individual operations like a silage pile that looks good on the surface but is rotting underneath.
The Productivity Paradox That Destroys Free Market Myths
Critics claim supply management stifles productivity, but Canada’s milk yield projections of 10,400 kg per cow match Denmark’s world-class output. The U.S. projects milk per cow at approximately 11,000 kg with a national milking herd of 9.410 million head—higher individual productivity achieved through a system requiring massive government subsidies.
According to McKinsey’s 2025 dairy industry survey, approximately 80 percent of leaders expect volume growth greater than 3 percent over the next three years, with 54 percent of dairy company leaders already using AI in pricing and manufacturing optimization. The difference? Canadian farmers can invest in these technologies strategically rather than desperately during crises.
Why This Matters for Your Operation: Technology Investment Framework
The stability of supply management creates unique opportunities for strategic technology investments. While volatile markets force reactive spending, stable systems enable proactive planning, like the difference between buying equipment during a planned upgrade cycle versus emergency replacement.
Technology investment advantage showing how price stability enables faster ROI on dairy innovations
ROI Calculation Example Based on Industry Data:
Robotic milking system cost: $200,000-300,000
Payback period under stable pricing: 7-10 years with predictable returns
Payback period under volatile pricing: 15+ years or never due to uncertainty
Canadian advantage: Predictable income streams enable financing and long-term planning
According to research, Canadian farms strongly adopt capital-intensive technologies like robotic milking systems, now used for 17% of the nation’s tested dairy cows. This steady investment is facilitated by the predictable returns of the supply management system, which de-risks long-term capital expenditures.
The Hidden Costs of ‘Free’ Markets: A Multi-Billion Dollar Shell Game
Here’s where the free market myth completely collapses—like a poorly formulated TMR that looks cheap until you calculate the real cost per pound of milk produced. Those “cheap” dairy products come with massive hidden costs that consumers never see at checkout.
The True Subsidy Math That Changes Everything
While Canadian farmers receive transparent compensation through finite programs, the U.S. system operates through massive, often hidden interventions. The DMC program acts as a permanent safety net, while emergency programs provide additional billions in crisis response.
Dr. Marin Bozic, the University of Minnesota dairy economist, notes that “direct payments to crop producers rarely translate to lower feed costs for livestock operations. The subsidy gets capitalized into land values and farm equity rather than leading to lower commodity prices,” meaning the supposed benefits don’t even reach dairy farmers effectively.
Environmental efficiency comparison highlighting Canadian dairy’s world-leading carbon footprint
Environmental Externalities: The True Cost of “Efficiency”
Metric
Canada
Global Average
Best Practice
Worst Practice
GHG Emissions (kg CO2/L)
0.94
2.5
0.8
6.7
Water Use (L/L milk)
8.5
15.2
7.0
35.0
Land Use (m2/L)
1.2
2.8
1.0
8.5
Energy Use (MJ/L)
2.1
4.2
1.8
9.5
Canadian dairy farmers have achieved one of the world’s lowest carbon footprints at 0.94 kg of CO2-equivalent per liter of milk, with this footprint decreasing by 9% between 2011 and 2021. This improvement occurred within a stable policy framework that enables consistent environmental investment, like having a long-term nutrition plan versus constantly changing rations based on market panic.
Research examining environmental impacts shows that demand for dairy products has resulted in 1 billion hectares being used to feed dairy animals globally, with intensification pressures creating significant negative externalities in export-focused systems.
The Social Cost of “Market Efficiency”
Canada’s system preserves approximately 12,000 dairy farms with an average herd size of 96 cows, compared to the U.S. average of 357 cows. This difference represents thousands of additional family operations that support local communities, equipment dealers, veterinarians, and rural infrastructure, like the difference between a diversified feed supply network versus a few mega-suppliers.
Why Supply Management Delivers What Free Markets Promise but Can’t Provide
Here’s the fundamental irony that should embarrass every free market economist: Canada’s “rigid” supply management system actually delivers the benefits that free market theory promises but rarely provides—efficiency, innovation, consumer value, and economic stability.
Real Innovation Under Stability
The stability of the Canadian system enables strategic technology adoption rather than crisis-driven investment. According to industry analysis, dairy leaders are increasingly focusing on AI implementation, with 54% already using AI in pricing, manufacturing optimization, and supply chain management. The financial predictability allows for genetic strategies spanning multiple generations rather than short-term survival decisions.
Current breeding trends show Canadian dairy farmers adopting genomic selection strategies that optimize for balanced performance indices, like building a herd for long-term profitability rather than chasing peak production numbers that might not be sustainable.
Market Power Balance That Prevents Exploitation
Canada’s supply management system operates through provincially-regulated producer marketing boards, giving farmers legal mechanisms for countervailing power against processors. This prevents the kind of exploitation seen in Western Australia, where just three processors control the entire market and suppress farmgate prices 30% below national averages.
What would happen to your operation if your processor suddenly cut payments by 30% while your costs stayed the same? That’s exactly what “free market” farmers face when processors have monopoly power.
Why This Matters for Your Operation: Strategic Planning Framework
For operations evaluating long-term viability under different policy systems:
Stability Assessment Checklist:
✓ Income Predictability: Can you forecast cash flow 12+ months ahead?
✓ Investment Confidence: Can you justify long-term facility upgrades?
✓ Genetic Strategy: Can you plan breeding programs across generations?
✓ Market Relationship: Do you have negotiating power with processors?
✓ Crisis Resilience: Can you weather market downturns without government bailouts?
Canadian farmers check all boxes. Free market operations struggle the most.
Global Lessons: The 2025 Stress Test Results
The 2020-2025 period provided a clear lesson for dairy policy makers worldwide: stability isn’t the enemy of efficiency—it’s efficiency’s most critical component.
Crisis Response: The Real-World Test
According to research on COVID-19 impacts, while U.S. farmers faced massive disruptions leading to widespread milk dumping, Canada’s centrally coordinated quota system provided crucial tools to rebalance supply with demand. It’s like comparing two feeding programs during a feed shortage: one system panics and wastes resources, while the other adjusts systematically to optimize available inputs.
Technology Adoption Under Different Systems
McKinsey’s survey reveals that dairy leaders plan to increase investments in product and manufacturing innovation, with AI rising in priority by 20 percentage points to 24% of respondents. The stability of Canada’s system enables consistent technology investment, while volatile markets create feast-or-famine cycles that undermine long-term competitiveness.
Food Security as a Strategic Asset
By design, supply management ensures Canada’s domestic self-sufficiency in dairy, a significant strategic asset. Export-dependent systems like New Zealand, which exports 95% of its dairy production, remain vulnerable to trade disruptions and global market volatility.
Implementation Framework: What Change Looks Like
For Policymakers Considering System Reform:
Phase 1: Foundation Building (Years 1-2)
Establish cost-of-production pricing mechanisms based on verified input costs
Create quota allocation frameworks with transparent distribution
Develop producer marketing board structures with legal countervailing power
Phase 2: Power Balancing (Years 3-5)
Implement collective bargaining systems to prevent processor exploitation
Strengthen antitrust enforcement in the processing sector concentration
Create transparent subsidy reporting to replace hidden bailout spending
Phase 3: Optimization (Years 5-7)
Develop predictable adjustment mechanisms for long-term planning
Enable strategic investment cycles rather than crisis-driven spending
Create new entrant support programs to address succession challenges
Cost-Benefit Analysis Framework:
Initial Setup Costs: Offset by elimination of crisis intervention spending
Consumer Price Impact: Transparent pricing versus hidden subsidy costs
Producer Stability: Measurable through bankruptcy rate reduction
Rural Community Preservation: Quantifiable through farm number maintenance
Why This Matters for Your Operation: Action Items
Immediate Assessment Steps:
Calculate Your Volatility Cost: Track how much you spend on risk management versus stable system farmers
Evaluate Investment Delays: List facility upgrades postponed due to price uncertainty
Assess Processor Relationships: Determine if you have meaningful negotiating power
Analyze Crisis Vulnerability: Review your operation’s dependence on government programs
Compare Technology Adoption: Benchmark your innovation investment against stable system operations
Strategic Questions for Operation Evaluation:
How much would guaranteed pricing 12 months ahead change your investment decisions?
What technology upgrades would you pursue with predictable cash flow?
How would stable neighbor relationships change your operation planning?
What would the elimination of bankruptcy risk mean for your family’s future?
The Bottom Line: Challenging Sacred Cow Economics
The evidence from 2020-2025 demolishes the free market orthodoxy that has dominated dairy policy discussions for decades. When total economic, social, and environmental costs are honestly calculated, Canada’s supply management system demonstrates superior outcomes across every meaningful metric: farm financial health, price stability, environmental performance, rural community preservation, and total economic efficiency.
While American dairy farmers face Chapter 12 bankruptcies, up 55%, and Australian producers report 55%, considering the industry’s exit, Canadian dairy farmers are planning their next generation of genetic improvements and facility upgrades. While “free market” systems require tens of billions in taxpayer bailouts and create environmental disasters, Canada’s managed system provides stable incomes and world-leading environmental performance.
The Real Challenge to Industry Leaders
Here’s your challenge as industry leaders: Demand honest accounting of total dairy system costs, including hidden subsidies, environmental damage, and social disruption. Question the assumptions underlying your industry’s policy positions. And ask yourself this fundamental question: If your current system requires constant government bailouts to prevent widespread failure, is it really a “free market” at all?
The Implementation Reality Check
For operations serious about long-term sustainability:
Immediate Term (1-6 months): Document your operation’s exposure to price volatility and calculate the true cost of uncertainty
Medium Term (6-18 months): Evaluate technology investments that require stable returns for viability
Long Term (2-5 years): Assess breeding and facility strategies that depend on predictable income streams
The Future of Dairy Policy
The Canadian model offers a roadmap for sustainable dairy policy in an increasingly volatile world. The question isn’t whether other countries will learn from a system that’s been quietly outperforming free market ideology for decades—it’s whether they’ll have the courage to challenge their own sacred cow economics before it’s too late.
Because sometimes, the most radical thing you can do in a chaotic world is choose stability, just like choosing proven genetics over flashy new bloodlines that haven’t been tested across multiple lactations.
The data is clear. The choice is yours. But remember: every day you delay addressing systemic instability is another day your operation remains vulnerable to forces that Canadian farmers learned to manage decades ago.
KEY TAKEAWAYS
Financial Resilience Advantage: Canadian dairy farmers maintain 16% debt-to-asset ratios with negligible bankruptcy rates, while U.S. operations face 55% increased Chapter 12 filings in 2024—proving predictable milk pricing enables strategic investment over survival mode
Technology ROI Optimization: Supply management’s price stability delivers 7-10 year payback periods on robotic milking systems (now serving 17% of Canadian tested dairy cows) versus 15+ years under volatile markets, enabling proactive precision agriculture adoption rather than crisis-driven upgrades
Hidden Cost Reality Check: “Free market” milk carries $0.20-$0.29 per liter in taxpayer subsidies when emergency bailouts and support programs are calculated, making Canada’s transparent pricing more economically honest than systems requiring constant government intervention
Environmental Efficiency Leadership: Canadian dairy operations achieve world-leading 0.94 kg CO2-equivalent per liter carbon footprint—48% below global averages—while maintaining financial stability that enables consistent sustainability investments versus boom-bust environmental spending cycles
Strategic Planning Capability: Canadian farmers can forecast facility upgrades 5-7 years ahead with milk price adjustments under 1% annually, compared to USDA price forecasts swinging from $21.10 to $23.05 per hundredweight—enabling genetic strategies spanning multiple lactations rather than short-term survival decisions
EXECUTIVE SUMMARY
What if everything the dairy industry believes about “free markets” is actually subsidized fiction that’s bankrupting farmers worldwide? While economists preach deregulation gospel, Canadian supply-managed farmers achieved 10,400 kg per cow milk yields—matching Denmark’s world-class output—with debt-to-equity ratios of just 0.191 compared to New Zealand’s dangerous 47.4%. Meanwhile, Chapter 12 farm bankruptcies surged 55% in the U.S. during 2024, exposing the brutal reality behind “competitive” dairy markets that actually require $33.1 billion in annual taxpayer bailouts. The evidence from 2020-2025 demolishes free market orthodoxy: Canada’s “rigid” system delivers superior financial stability, environmental performance (0.94 kg CO2-equivalent per liter versus 2.5 kg global average), and strategic technology adoption (17% robotic milking versus crisis-driven investment cycles elsewhere). This comprehensive analysis of six major dairy systems reveals that stability isn’t the enemy of efficiency—it’s efficiency’s most critical component, enabling 7-year ROI on robotic systems versus 15+ years under volatile pricing. Every dairy policy maker and farm operator needs to evaluate whether their current system delivers predictable planning horizons or just masks market failure with hidden subsidies.
Complete references and supporting documentation are available upon request by contacting the editorial team at editor@thebullvine.com.
Learn More:
Supply Management – A Canadian’s Perspective – Discover how supply management actually works in practice from a Canadian dairy farmer’s firsthand experience, revealing why production discipline eliminates the need for subsidies and crisis interventions that plague volatile markets.
5 Technologies That Will Make or Break Your Dairy Farm in 2025 – Explore how robotic milkers, AI analytics, and smart sensors deliver 20% yield increases and 40% mortality reductions, demonstrating why stable income systems enable strategic tech adoption over crisis-driven purchases.
The Sunday Read Dairy Professionals Don’t Skip.
Every week, thousands of producers, breeders, and industry insiders open Bullvine Weekly for genetics insights, market shifts, and profit strategies they won’t find anywhere else. One email. Five minutes. Smarter decisions all week.
To provide the best experiences, we use technologies like cookies to store and/or access device information. Consenting to these technologies will allow us to process data such as browsing behavior or unique IDs on this site. Not consenting or withdrawing consent, may adversely affect certain features and functions.
Functional
Always active
The technical storage or access is strictly necessary for the legitimate purpose of enabling the use of a specific service explicitly requested by the subscriber or user, or for the sole purpose of carrying out the transmission of a communication over an electronic communications network.
Preferences
The technical storage or access is necessary for the legitimate purpose of storing preferences that are not requested by the subscriber or user.
Statistics
The technical storage or access that is used exclusively for statistical purposes.The technical storage or access that is used exclusively for anonymous statistical purposes. Without a subpoena, voluntary compliance on the part of your Internet Service Provider, or additional records from a third party, information stored or retrieved for this purpose alone cannot usually be used to identify you.
Marketing
The technical storage or access is required to create user profiles to send advertising, or to track the user on a website or across several websites for similar marketing purposes.
To provide the best experiences, we and our partners use technologies like cookies to store and/or access device information. Consenting to these technologies will allow us and our partners to process personal data such as browsing behavior or unique IDs on this site and show (non-) personalized ads. Not consenting or withdrawing consent, may adversely affect certain features and functions.
Click below to consent to the above or make granular choices. Your choices will be applied to this site only. You can change your settings at any time, including withdrawing your consent, by using the toggles on the Cookie Policy, or by clicking on the manage consent button at the bottom of the screen.
Functional
Always active
The technical storage or access is strictly necessary for the legitimate purpose of enabling the use of a specific service explicitly requested by the subscriber or user, or for the sole purpose of carrying out the transmission of a communication over an electronic communications network.
Preferences
The technical storage or access is necessary for the legitimate purpose of storing preferences that are not requested by the subscriber or user.
Statistics
The technical storage or access that is used exclusively for statistical purposes.The technical storage or access that is used exclusively for anonymous statistical purposes. Without a subpoena, voluntary compliance on the part of your Internet Service Provider, or additional records from a third party, information stored or retrieved for this purpose alone cannot usually be used to identify you.
Marketing
The technical storage or access is required to create user profiles to send advertising, or to track the user on a website or across several websites for similar marketing purposes.


 The Sunday Read Dairy Professionals Don’t Skip.
 The Sunday Read Dairy Professionals Don’t Skip.