GDT up 6.7%, Class III stuck at $14.59. Is this rally real—or a head-fake you’ll regret chasing before April?
Executive Summary: The early 2026 GDT rally looks impressive—up 6.7% on February 3 with SMP surging 10.6%—but your milk check is still anchored to $14.59 Class III, the lowest since July 2023. At the same time, US milk production is running about 4.6% above a year ago, and New Zealand and EU collections are also climbing, so the supply wall hasn’t gone away. The buying burst from China, the Middle East, and Algeria is largely seasonal, tied to Ramadan and Easter, which means it can mask the underlying imbalance for a few auctions without actually fixing it. Powders look closest to a genuine reset after dropping to value territory late in 2025, while butterfat’s 8.8% bounce is a small blip against a 35–40% price break and a decade of genetically driven fat growth that’s still flooding the system. In this environment, your safest 90‑day play is to treat the rally as a potential head-fake: secure DMC coverage before the February 26 deadline, push Q2–Q3 Class III hedge coverage toward roughly 60–70% if you’re light, and build working capital toward about $500/cow before committing to major capital projects. Any expansion math should be run at $17 Class III, not today’s bounce, and held until the April 7 and 21 GDT auctions show whether prices can hold once holiday demand fades. Those two April sales, along with US milk growth, CME NDM holding above $1.40, and whether Fonterra nudges its forecast higher, are the signals that’ll tell you if this rally has real legs or was just a very expensive head-fake.
Three consecutive Global Dairy Trade gains to open 2026 have producers asking the same question: Is this the recovery we’ve been waiting for, or a seasonal head-fake that punishes anyone who bets on its continuation?
For operations staring at January milk checks based on $14.59 Class III—the lowest since July 2023—the answer shapes every decision over the next 90 days. The February 3 GDT auction delivered a 6.7% index jump, with skim milk powder surging 10.6% to $1.39/lb on an NDM-equivalent basis. CME spot NDM hit $1.5375/lb the same day, its strongest start since 2011, and up 31% year-to-date.
Here’s the tension: US milk production grew 4.6% year-over-year in December, according to USDA; the dairy herd sits at 9.57 million head (the highest since 1993); and Fonterra held its farmgate forecast at NZ$8.50-$9.50/kgMS despite the rally. The supply side isn’t confirming what demand is signaling.
The Head-Fake Setup: Who’s Buying and Why
The demand shift between December and February was dramatic. Three buyer groups drove the surge:
Middle East: Reportedly doubled GDT participation from approximately 11% to 21%, according to analyst estimates—their highest share in two years—driven by Ramadan preparation beginning late February.
China: Returned as active purchasers after months of cautious observation, accounting for an estimated 44% of volume sold at the January 6 auction based on analyst tracking.
Algeria: The ONIL tender in January moved significant volumes of WMP and SMP, re-establishing global price benchmarks after weeks of volatility.
Katie Burgess of Ever.ag captured the core dynamic: global milk powder prices remain “very highly correlated,” so what happens at GDT in New Zealand directly influences US pricing. That correlation is holding. CME spot NDM now trades at roughly a 10% premium to GDT SMP equivalent, suggesting both domestic and export demand are active simultaneously. USDA’s weekly Dairy Market News confirms “tight spot inventories” and “strong international interest.”
But Fonterra’s decision to hold—not raise—its price forecast tells you what the largest dairy exporter sees in its collection data. New Zealand season-to-date milk flows are running 2.6% above last year, and their full-season forecast was raised to 1,545 million kgMS in November. The supply wall that drove nine consecutive GDT declines through late 2025 hasn’t disappeared. It’s temporarily obscured by compressed seasonal demand.
Why This Head-Fake Looks Different: The Supply Collision
The conventional read on this rally goes something like: “Prices found a floor, buyers returned, the market is rebalancing.”
That assumes supply and demand are moving toward equilibrium. The data says otherwise.
US milk production grew 4.5-4.6% year-over-year in both November and December 2025, per USDA. The January WASDE raised the 2026 production forecast by 200 million pounds to 234.3 billion—up 3.2 billion pounds from 2025. EU milk output posted its strongest growth since 2017 in October 2025, running 5% above year-ago levels according to Eurostat. Rabobank analyst Michael Harvey noted that what made the late-2025 decline unusual wasn’t weak demand—GDT bidder participation stayed above 150—but a “supply collision” where multiple exporting regions flooded the market simultaneously.
What’s happening now isn’t rebalancing. It’s seasonal demand compression meeting a temporary shift in buyer psychology. Purchasers who depleted inventories waiting for the bottom are scrambling to cover positions before Ramadan and Easter. When that seasonal window closes in April, supply fundamentals reassert themselves.
Head-Fake Math: Margins, Heifers, and Timing Traps
The immediate margin picture remains tough despite the GDT rally. USDA’s December 2025 All-Milk Price came in at $19/cwt, down 70¢ from November. January erodes by another $1/cwt-plus because Class III ($14.59) and Class IV ($13.55) prices are the lowest since July 2023 and February 2021, respectively. For operations in the Upper Midwest and similar regions—where many herds break even in the mid-$16/cwt range based on regional benchmarking data—Q1 2026 milk checks are already underwater.
The futures market sees improvement ahead, with Class III contracts trading in the $17-18/cwt range for Q2-Q3 2026 on CME. But here’s where the timing trap for expansion kicks in.
Replacement heifers currently run $3,000-$4,000/head according to USDA livestock data, versus $1,800 in 2023. A 100-heifer expansion now costs $120,000-$220,000 more in heifer costs alone than it would have two years ago—and those heifers won’t hit the milking string for 27-30 months. Market conditions will shift multiple times before the genetics purchased today reach the bulk tank. Producers running that heifer math are finding the rally looks different than it feels.
A December 2025 Bullvine analysis examined the expansion timing gap: operations expanding at 80% barn capacity with intact working capital face dramatically better outcomes than those expanding at 95% capacity with depleted reserves. This rally creates exactly the psychological conditions that lead producers to expand from weakness rather than strength.
Cost Category
2023 Cost (100-Head)
2026 Cost (100-Head)
Cost Increase
Replacement Heifers
$180,000 ($1,800/hd)
$350,000 ($3,500/hd)
+$170,000
Feed Costs (27-mo to freshening)
$81,000 ($810/hd)
$95,000 ($950/hd)
+$14,000
Facility/Equipment Allocation
$125,000
$160,000
+$35,000
Interest Carry (2-yr avg on capex)
$18,000 (5.5% rate)
$28,000 (7.2% rate)
+$10,000
TOTAL EXPANSION COST
$404,000
$633,000
+$229,000 (+57%)
The Butterfat Head-Fake: Why Components Tell a Different Story
Product category behavior reveals which segments are genuinely rebalancing versus catching temporary bids. At the February 3 GDT auction, SMP led at +10.6% while butter rose 8.8% to $5,773/MT. That might look like broad-based strength. Context says otherwise: butter dropped roughly 35-40% from its May 2025 peak to December’s lows on GDT. The 8.8% bounce doesn’t erase that collapse.
The structural problem for butterfat is genetic. US butterfat production grew approximately 30% from 2011 to 2024, outpacing overall milk production growth. Corey Geiger of CoBank put it directly: “This isn’t a demand issue. It’s clearly a ‘We’re supplying way too much.'” Holsteins averaged a 45-lb butterfat rollback in the April 2025 CDCB evaluation—significantly higher than 2020 levels. The cows producing today’s oversupply are already in herds, and some geneticists project genetic selection could push average butterfat content toward 5% within the decade.
SMP tells a different story. Prices genuinely reached value territory at late-2025 lows ($1.18/lb equivalent on GDT), triggering buying that appears more structural than seasonal. Both CME and GDT powder markets are moving in sync, domestic inventories remain tight, and the US has regained export competitiveness after losing Asia market share to New Zealand in 2023-2024.
For hedging decisions, this divergence matters. Butter exposure carries a higher reversal risk post-Easter; powder positions have better structural support—though still vulnerable to the production surge.
Four Paths If This Is a Head-Fake
DMC Enrollment (Deadline: February 26, 2026)
USDA’s Tier 1 coverage was expanded to 6 million pounds for 2026, and analysts expect payments early this year amid current margin compression. The multi-year commitment option (2026-2031) locks in a 25% premium discount per FSA program terms.
Trade-off: You’re paying premiums through 2031 even if margins recover strongly. But current signals don’t support betting on a rapid recovery. Use the University of Tennessee DMC calculator to optimize coverage level for your production history.
Hedging Coverage
Risk management advisors often suggest 60-70% coverage at elevated premium levels for Class III, keeping 25-30% open for potential upside. Options (puts/put spreads) preserve participation if the rally extends, versus futures that lock you out of gains. Lock feed costs through Q2—corn near $3.90/bu on CME represents favorable input pricing regardless of milk price direction.
Trade-off: Over-hedging costs you if this rally proves structural; under-hedging hurts if April auctions give back Q1 gains.
Capital Allocation
Lender reports indicate many producers are prioritizing paying down loans and building working capital over expansion. That’s the right read for this environment. Many advisors suggest targeting working capital at $500-550/cow before committing to expansion. Defer major capital projects until post-April GDT results confirm whether the rally has structural support.
Expansion Timing
Wait for post-holiday GDT auctions (April 7 and April 21) before committing. Test project economics at $17/cwt Class III, not current rally prices. Don’t expand from a position where depleted reserves require the rally to continue.
Four Indicators: Head-Fake or Real Recovery?
Indicator
“Recovery Has Legs”
“Head-Fake Confirmed”
GDT Post-Holiday (Apr 7, 21)
Prices hold within 3% of March highs
Drop 6%+ from March levels
US Milk Production
Growth moderates to <2.5% YoY by the March report
Continues at 4%+ YoY
CME Spot NDM
Holds above $1.40/lb through April
Falls below $1.25/lb
Fonterra Forecast
Raises above NZ$9.50
Holds or cuts below $8.50
The April 7 and April 21 auctions are the critical test per GDT’s published calendar. That’s when Ramadan and Easter demand releases. If prices hold, it’s fundamentals. If they crash, the head-fake is confirmed.
What This Means for Your Operation
Enroll in DMC by February 26. The expanded Tier 1 coverage and current margin compression make this a defensive baseline regardless of rally outlook.
If you’re hedged below 50% for Q2-Q3, the current rally provides an opportunity to add coverage. Target 60-70% total to balance protection with upside participation.
If you’re considering expansion, run your economics at $17/cwt Class III—not current futures—and don’t commit until April GDT results confirm or deny structural support.
The critical threshold: working capital around $500/cow before any major capital deployment. Below this, use the rally to strengthen reserves rather than expand commitments.
If you’ve been assuming the supply surge would self-correct through lower prices driving exits, check whether your region is actually seeing herd contraction. National USDA data shows the opposite.
Red flag: Any expansion plan that requires Class III to stay above $18/cwt carries an elevated risk given the current production trajectory.
Key Takeaways
The rally is real, but likely a seasonal head fake. Three consecutive GDT gains driven by Ramadan/Easter buying and inventory restocking—not structural rebalancing of a 4.6% US production surge.
April auctions are your decision point. The post-holiday GDT events (April 7 and 21) will reveal whether demand can absorb the supply wall. Don’t make irreversible commitments before then.
Butterfat and powder are telling different stories. SMP shows signs of genuine value buying; butter’s 8.8% bounce doesn’t offset a 35-40% collapse driven by structural genetic oversupply.
Use the rally to strengthen the position, not bet on continuation. Build working capital, add hedging coverage, pay down debt. The producers who maintain optionality will outperform those who commit prematurely.
The Bottom Line
The producers who navigate the next 90 days successfully won’t be the ones who correctly called the market’s direction. They’ll be the ones who kept their options open while others locked themselves into bets they couldn’t afford to lose.
Every cycle looks obvious in hindsight. Where does your operation sit on the spectrum between building reserves and betting on continuation?
Complete references and supporting documentation are available upon request by contacting the editorial team at editor@thebullvine.com.
Learn More
Squeezed Out? A 12-Month Decision Guide for 300-1,000 Cow Dairies – Gain a concrete roadmap for navigating high replacement costs and component shifts. This guide breaks down robotic milking ROI and identifies specific management cuts that protect your cash flow when margins tighten.
Join over 30,000 successful dairy professionals who rely on Bullvine Weekly for their competitive edge. Delivered directly to your inbox each week, our exclusive industry insights help you make smarter decisions while saving precious hours every week. Never miss critical updates on milk production trends, breakthrough technologies, and profit-boosting strategies that top producers are already implementing. Subscribe now to transform your dairy operation’s efficiency and profitability—your future success is just one click away.
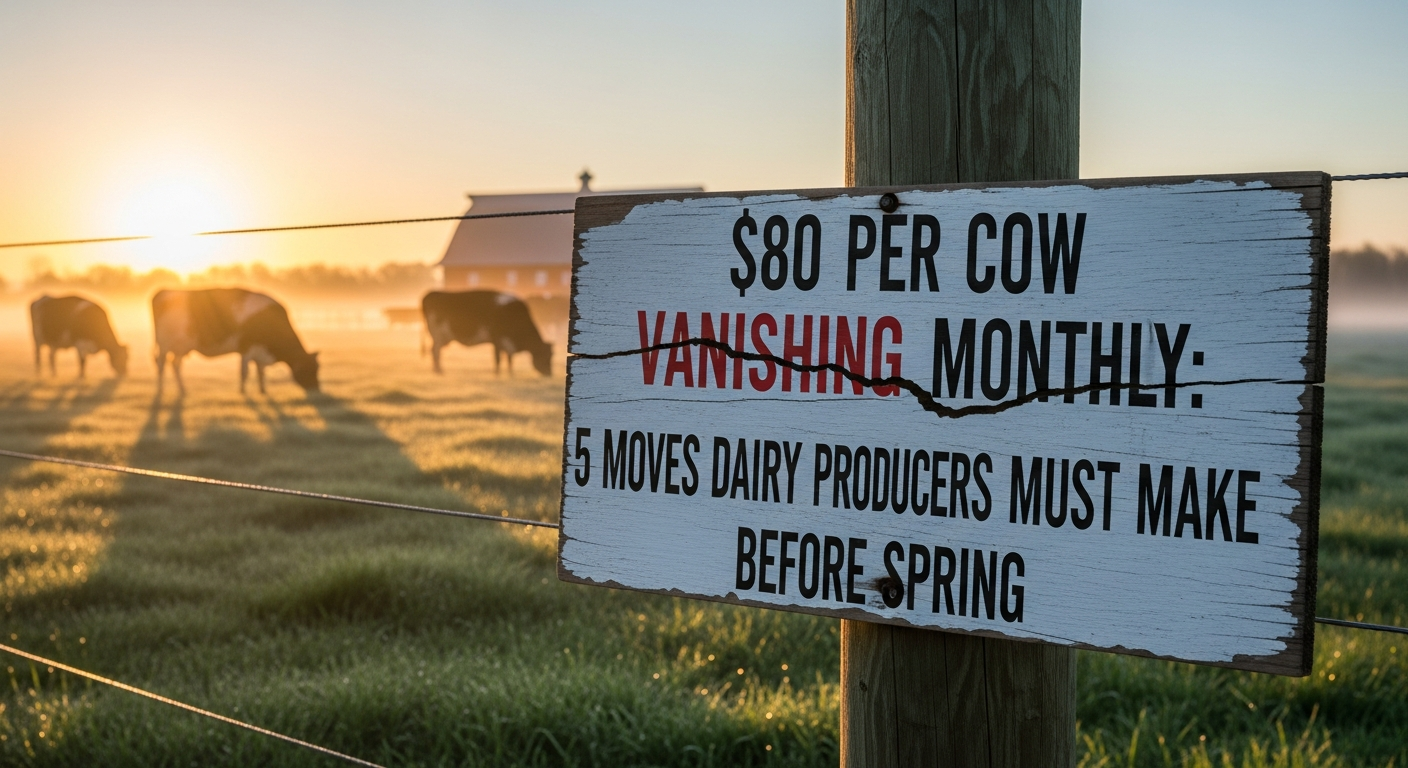
You’re bleeding $80/cow every month, and the industry just added 211,000 more cows to make it worse. 5 moves to make before spring.
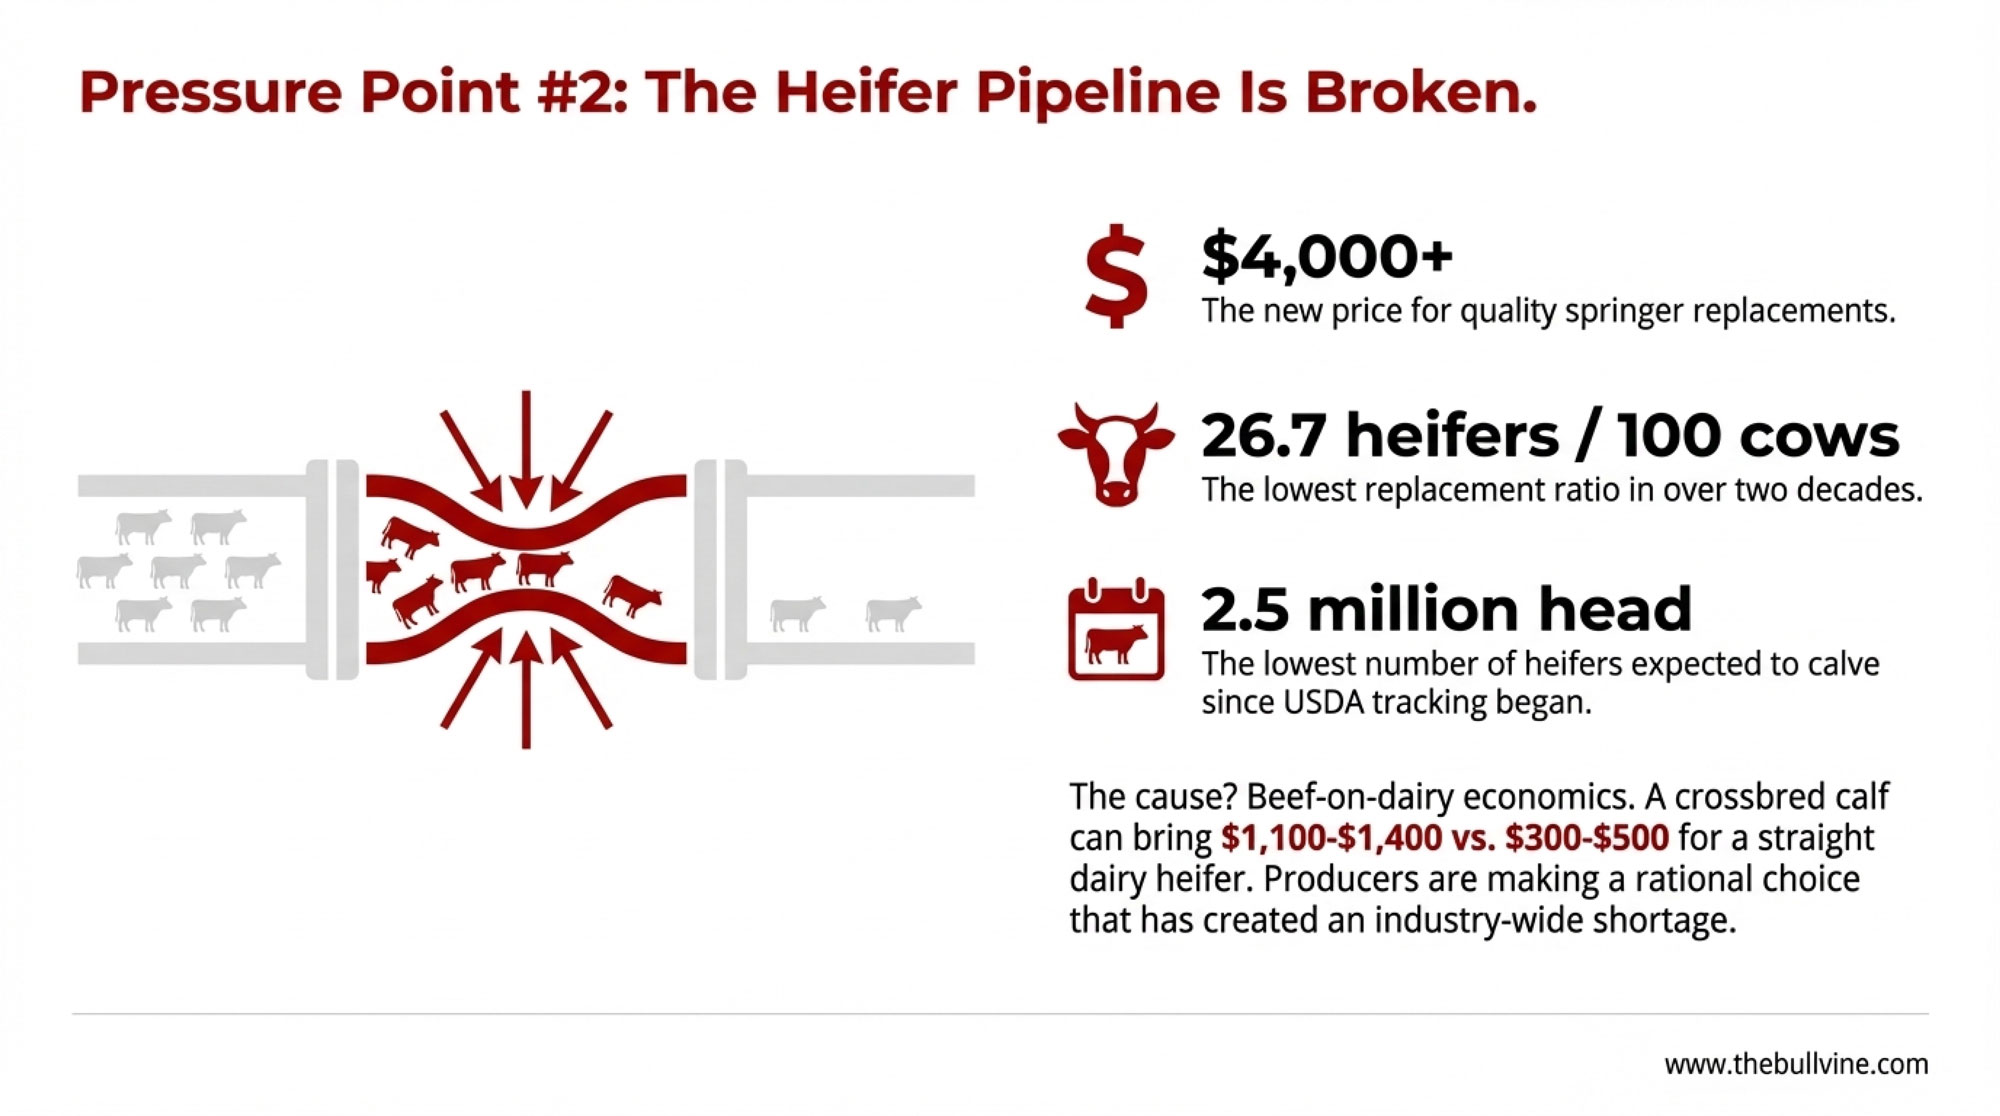
Executive Summary: Every month you wait, you’re losing $80 per cow. Class III has crashed from $20 to $15.86 since spring—and the industry just added 211,000 cows to make sure it stays there. California’s rapid H5N1 recovery, surging EU production, and strong New Zealand output have created a global oversupply that isn’t easing anytime soon. Need replacements? Quality springers now cost $4,000-plus amid the tightest heifer pipeline in 20 years. Add $4.40 corn to the equation, and margins are getting crushed from every angle. Here’s what’s actually driving the squeeze—and five specific moves to protect your operation before spring.
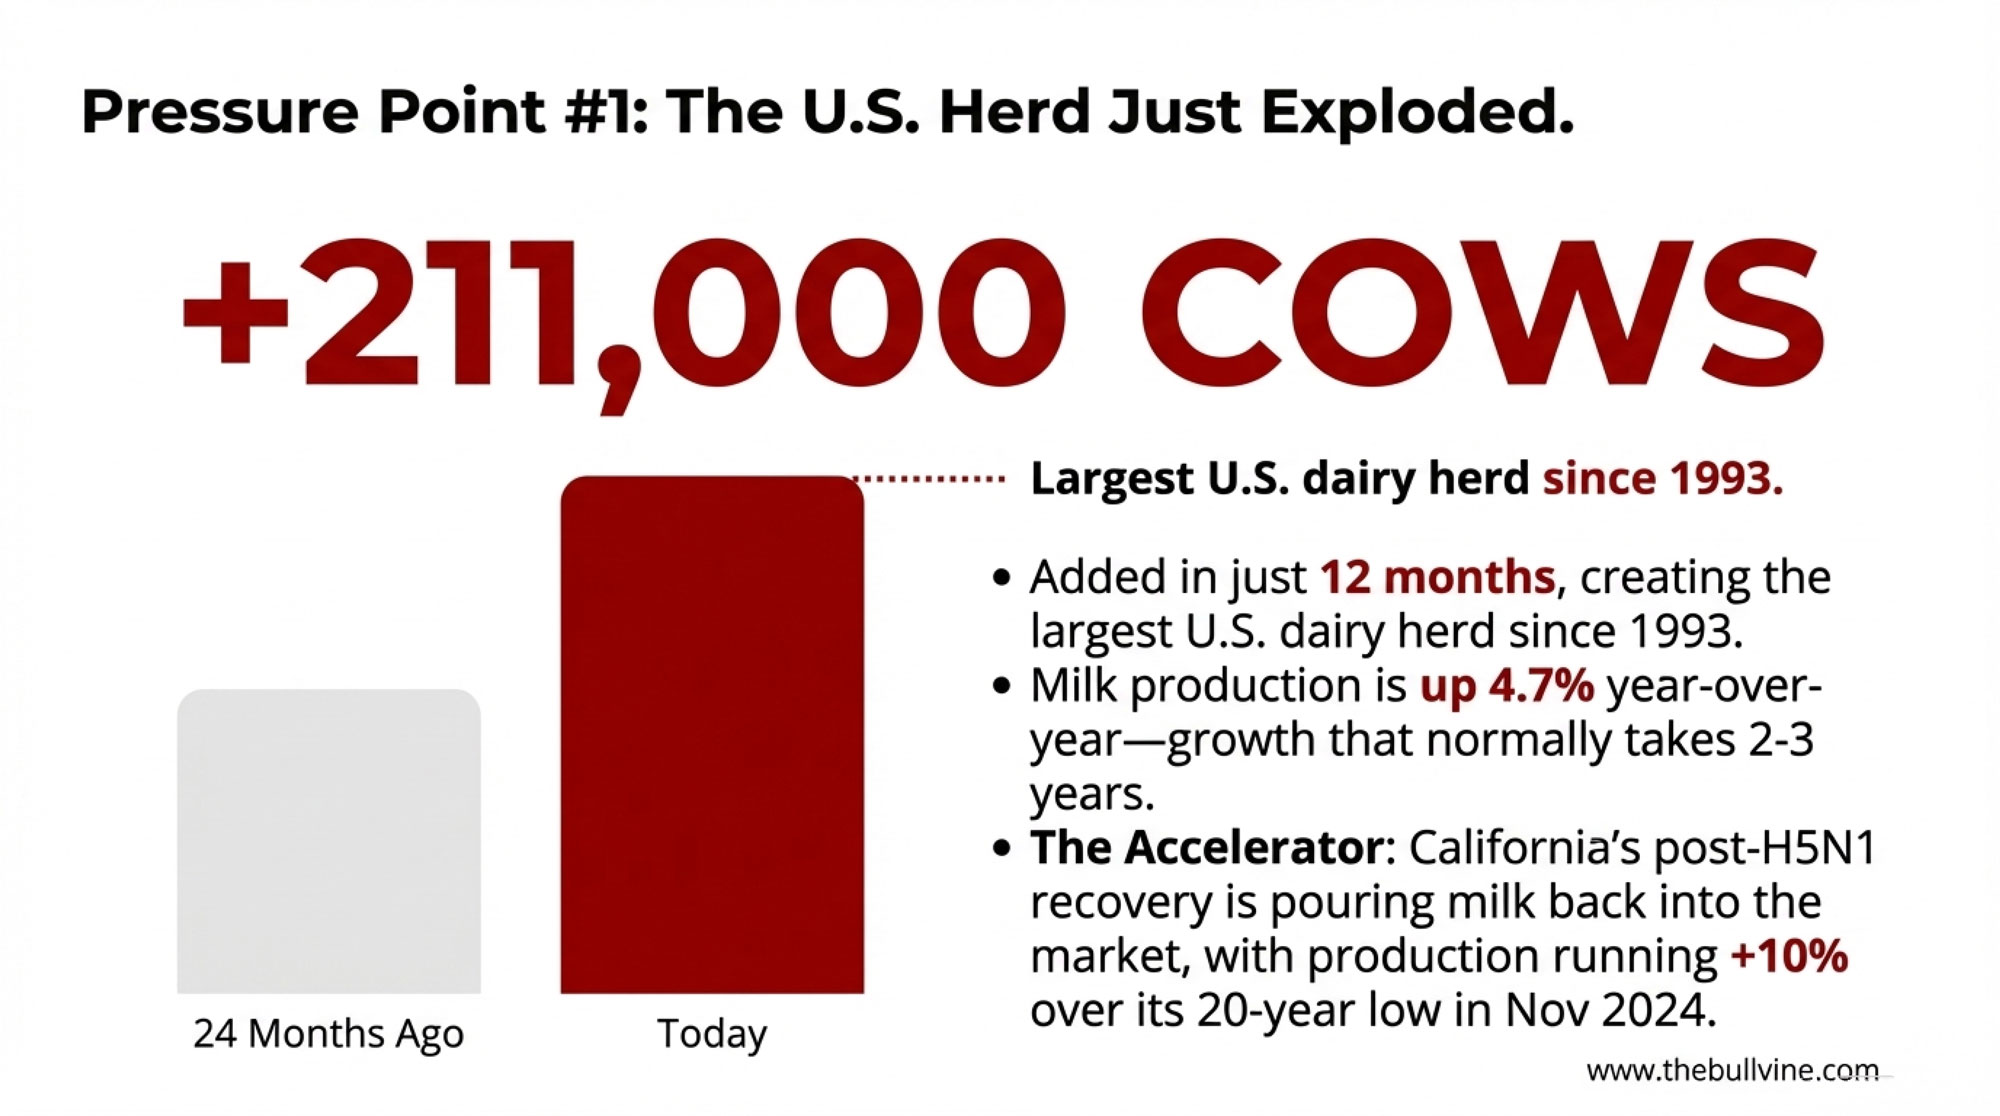
The U.S. dairy industry just added 211,000 cows in 12 months—the largest herd since 1993, according to USDA NASS—at the exact moment Class III prices dropped from $20 to $15.86 per hundredweight. Meanwhile, anyone trying to expand is staring at $4,000 springers and the tightest heifer supply in two decades. That collision of forces is going to define 2026 economics for operations of every size, whether you’re milking 80 cows in Vermont or 8,000 in the Central Valley.
Let me walk through what the numbers actually show and what the producers who are navigating this successfully are doing differently.
The Production Surge Nobody Can Ignore
USDA NASS confirmed that November 2025 milk production in the 24 major states hit 18.1 billion pounds—a 4.7% jump from the prior year. Nationwide, we’re looking at 18.8 billion pounds, up 4.5% year-over-year. For context, that’s the kind of production growth that typically takes two to three years to accumulate. We got it in twelve months.
And California’s recovery has accelerated the math. After H5N1 hammered the state through late 2024 and into 2025—federal livestock program records indicate roughly 75% of commercial herds experienced infections at some point—production is now running more than 10% above year-ago levels. November 2024 represented a 20-year production low for California. The turnaround has happened faster than most analysts expected, and all that milk is flowing back into national markets.
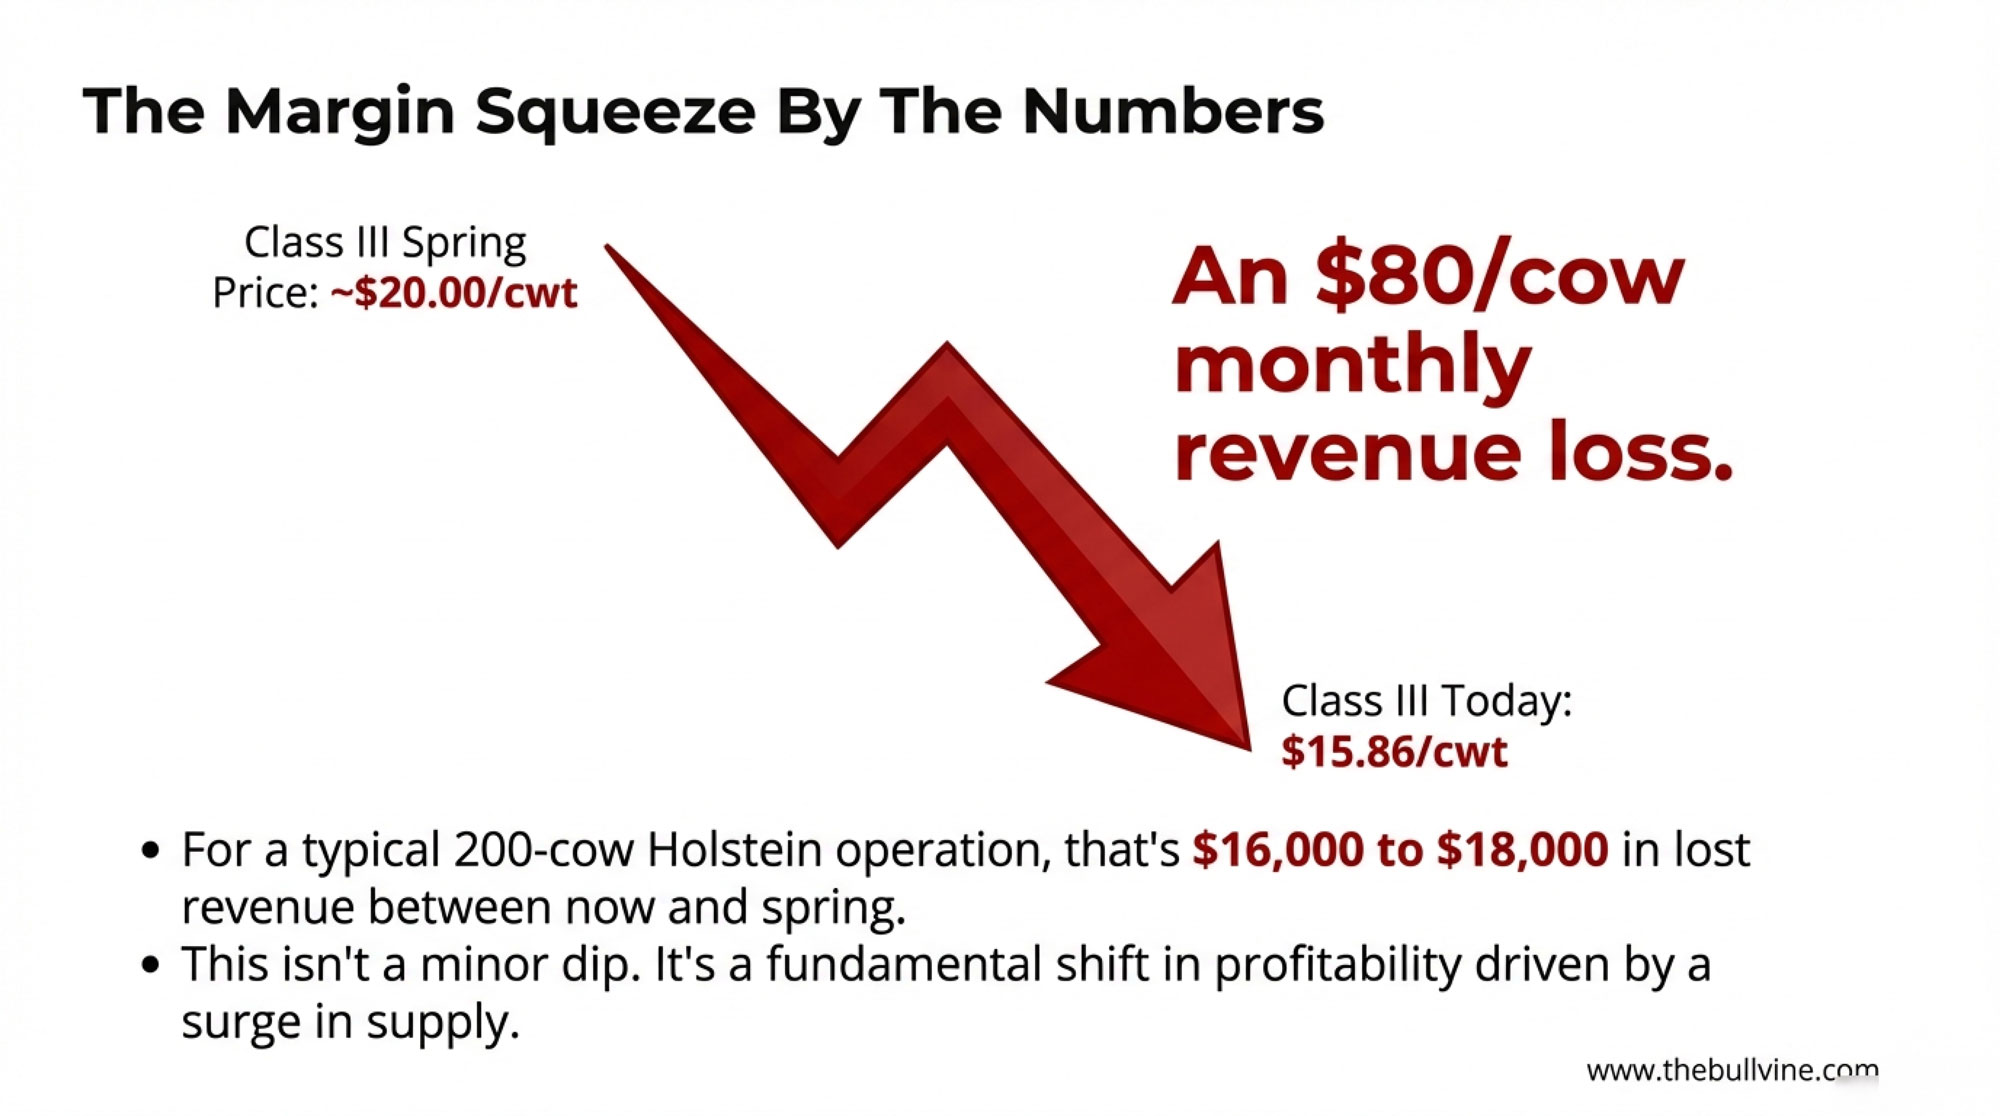
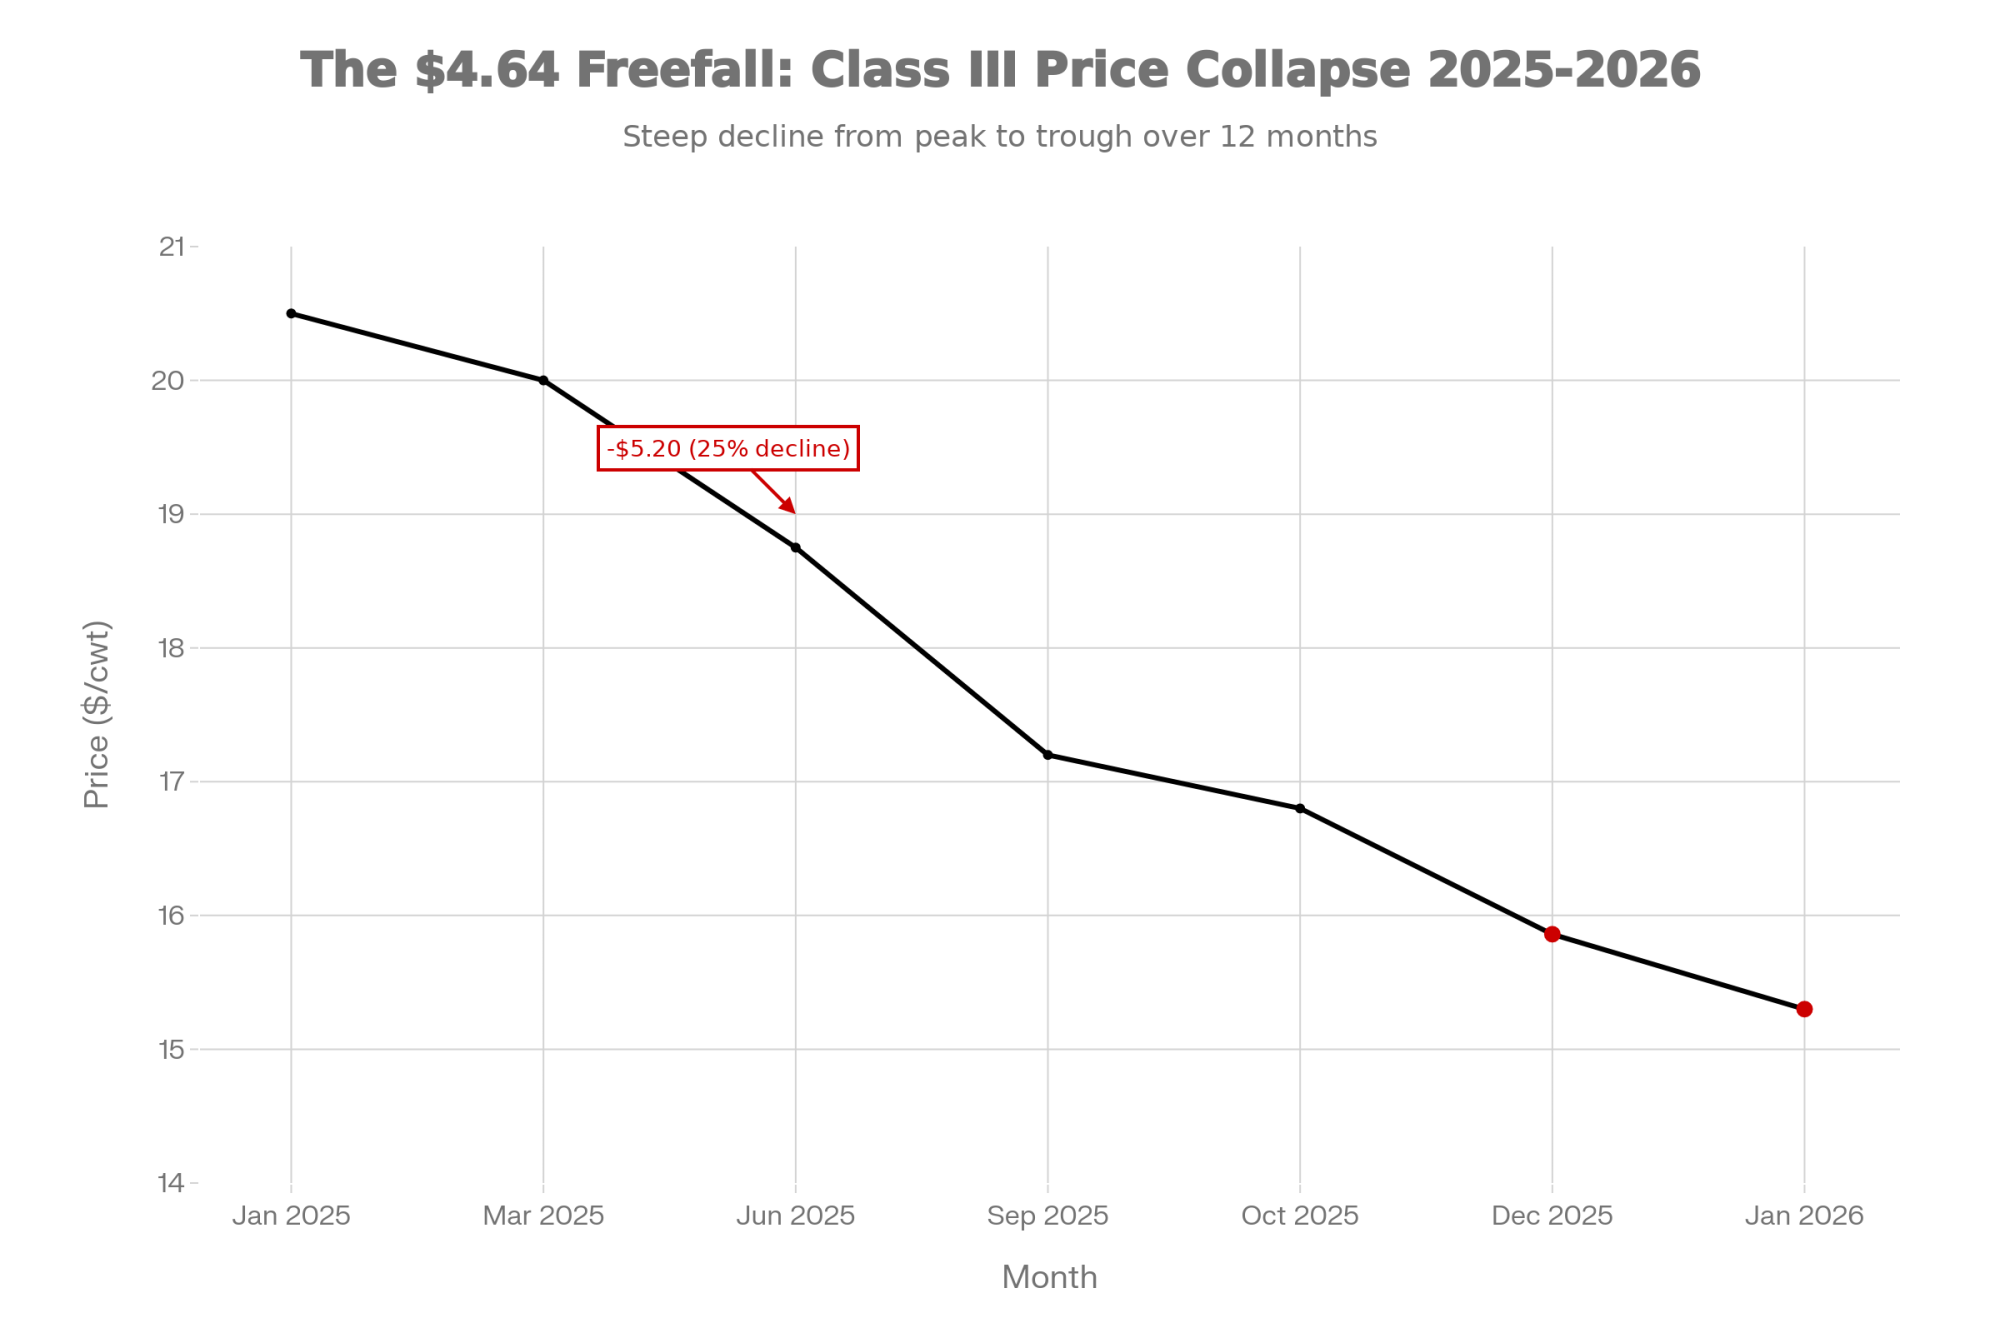
Class III milk prices have collapsed from $20.50 to $15.30 per hundredweight in just 12 months—a 25% decline that’s costing dairy producers $80-90 per cow monthly across all operation sizes
Here’s what this means for your check: at $15.86 Class III versus $18.50 three months ago, that’s roughly $80-90 per cow per month in lost revenue for a typical Holstein operation. On a 200-cow herd, you’re looking at $16,000-18,000 less coming in between now and spring—assuming prices don’t drop further.
Herd Size
Monthly Loss ($80/cow)
Spring Loss (3 months)
Annual Impact
50 cows
$4,000
$12,000
$48,000
100 cows
$8,000
$24,000
$96,000
200 cows
$16,000
$48,000
$192,000
500 cows
$40,000
$120,000
$480,000
1,000 cows
$80,000
$240,000
$960,000
2,500 cows
$200,000
$600,000
$2,400,000
The Heifer Bottleneck Is Real
This is the constraint that will shape expansion decisions over the next three years, so let’s dig into it.
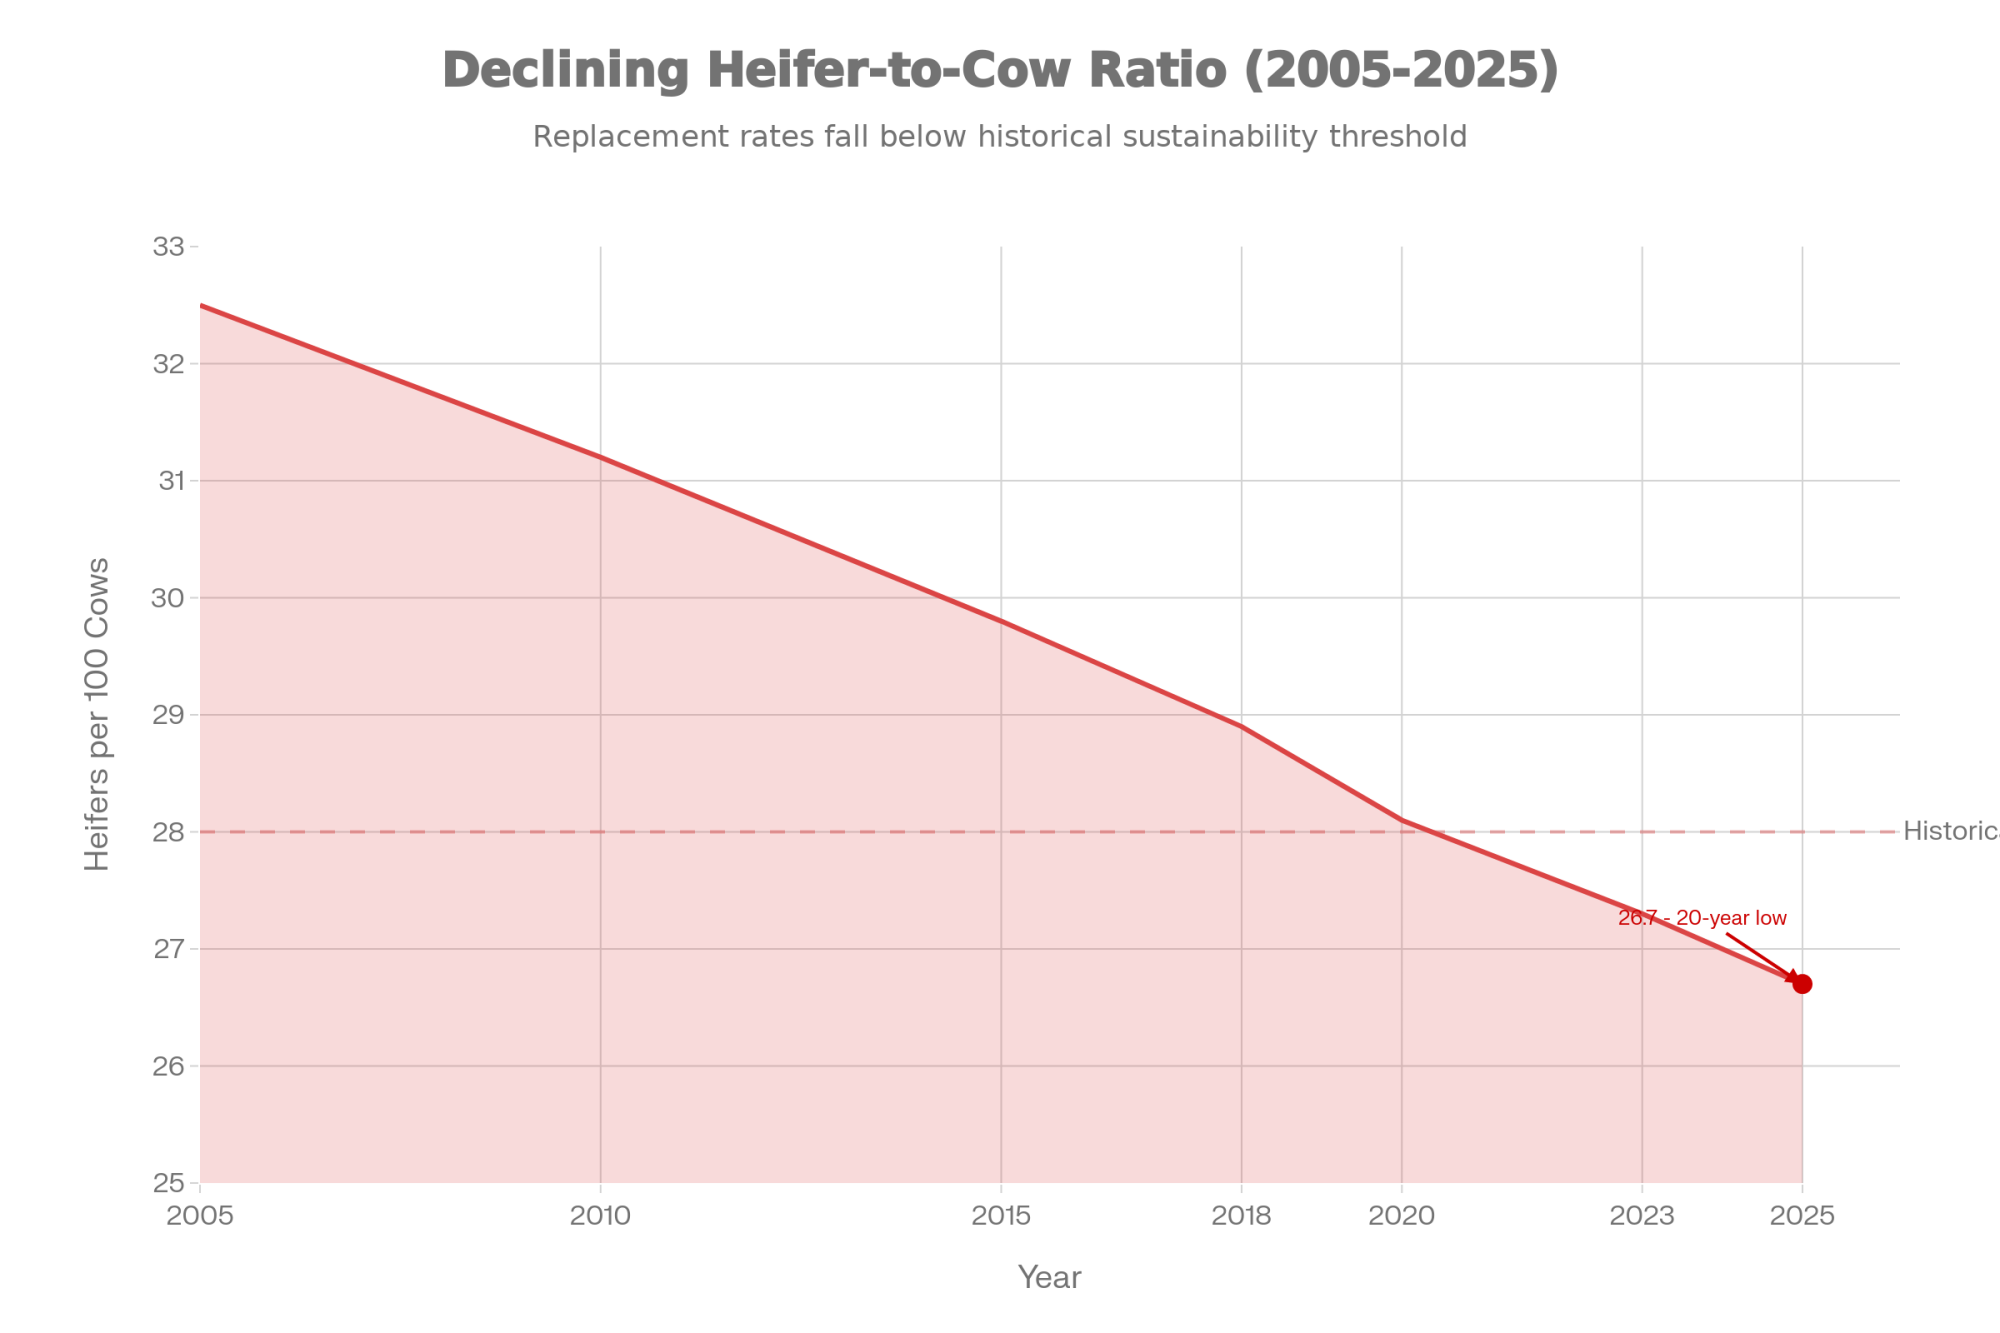
USDA data shows approximately 26.7 heifers expected to calve per 100 milk cows—the lowest ratio in at least two decades. Total dairy heifers expected to calve in 2025? Just under 2.5 million head, the lowest since USDA began tracking this metric.
The heifer-to-cow ratio has declined to a 20-year low of 26.7 per 100 cows, creating a replacement crisis that explains why quality springers now cost $4,000+ and why expansion-minded producers need to source animals immediately
The economics driving this aren’t mysterious. Ag Proud market reports show beef-cross calves bringing $1,100-1,400 at many auctions, sometimes higher for well-bred Angus or Limousin crosses. Straight dairy heifers? Often $300-500 unless they come from high-genomic programs with strong marketing. When beef-on-dairy creates that much value differential, producers make rational decisions about their breeding programs.
I was talking with a Wisconsin producer last month who’s running about 70% beef semen across his herd. His logic is straightforward: the premium on those crossbred calves more than offsets the cost of purchasing replacements when he needs them. For his operation and cash flow, that math works.
Metric
Beef-Cross Calf
Raise Own Dairy Heifer
Buy Springer
Calf Sale Value
$1,250
$400
N/A
Heifer Raising Cost (to calving)
$0 (sold)
$2,200
$0
Purchase Price (springer)
N/A
N/A
$4,000
Net Economics per Head
+$1,250
-$1,800
-$4,000
Value Differential
Baseline
-$3,050 vs beef
-$5,250 vs beef
A Northeast producer I know takes the opposite approach—she’s kept her replacement program intact because she doesn’t want to be buying springers at $4,000 when she needs them. Her calculation: the heifer she raises for $2,200 all-in is worth $1,800 more than the one she’d have to buy.
Both strategies can pencil out. The question is which matches your operation’s cash flow, facilities, and expansion timeline.
The practical implication: quality springer replacements now command $3,500-4,000 or more in many markets. If you’re planning any expansion over the next 18-24 months, heifer sourcing needs to be part of your planning conversation this month. The animals aren’t available in the numbers we’ve historically seen.
Global Oversupply Compounds the Problem
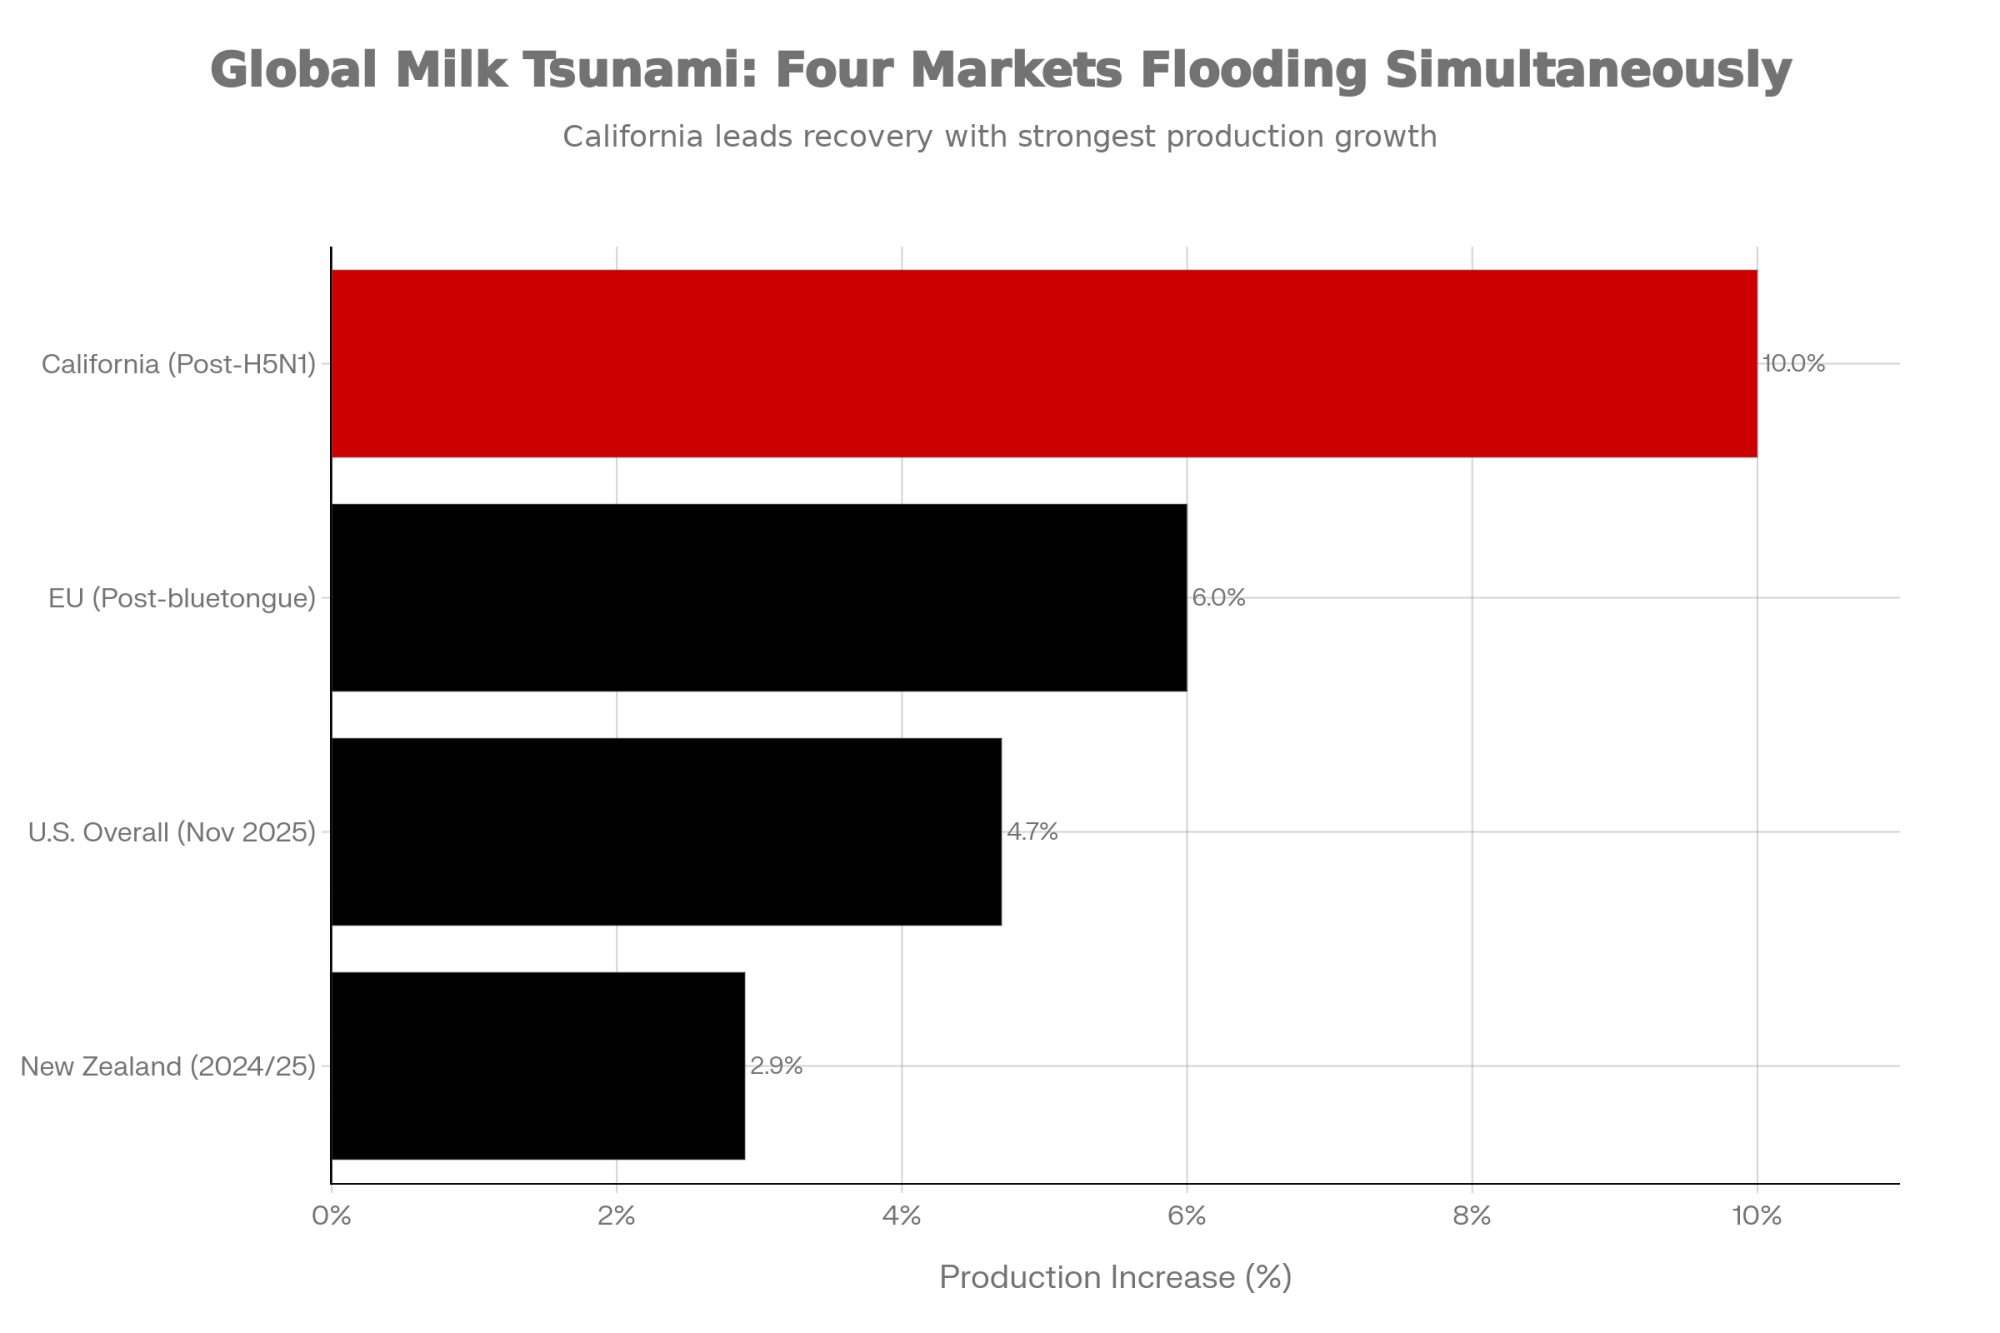
Four major dairy-producing regions are simultaneously flooding global markets with increased production—California up 10%, EU up 6%, U.S. overall up 4.7%, and New Zealand up 2.9%—creating synchronized oversupply that’s crushing milk prices worldwide
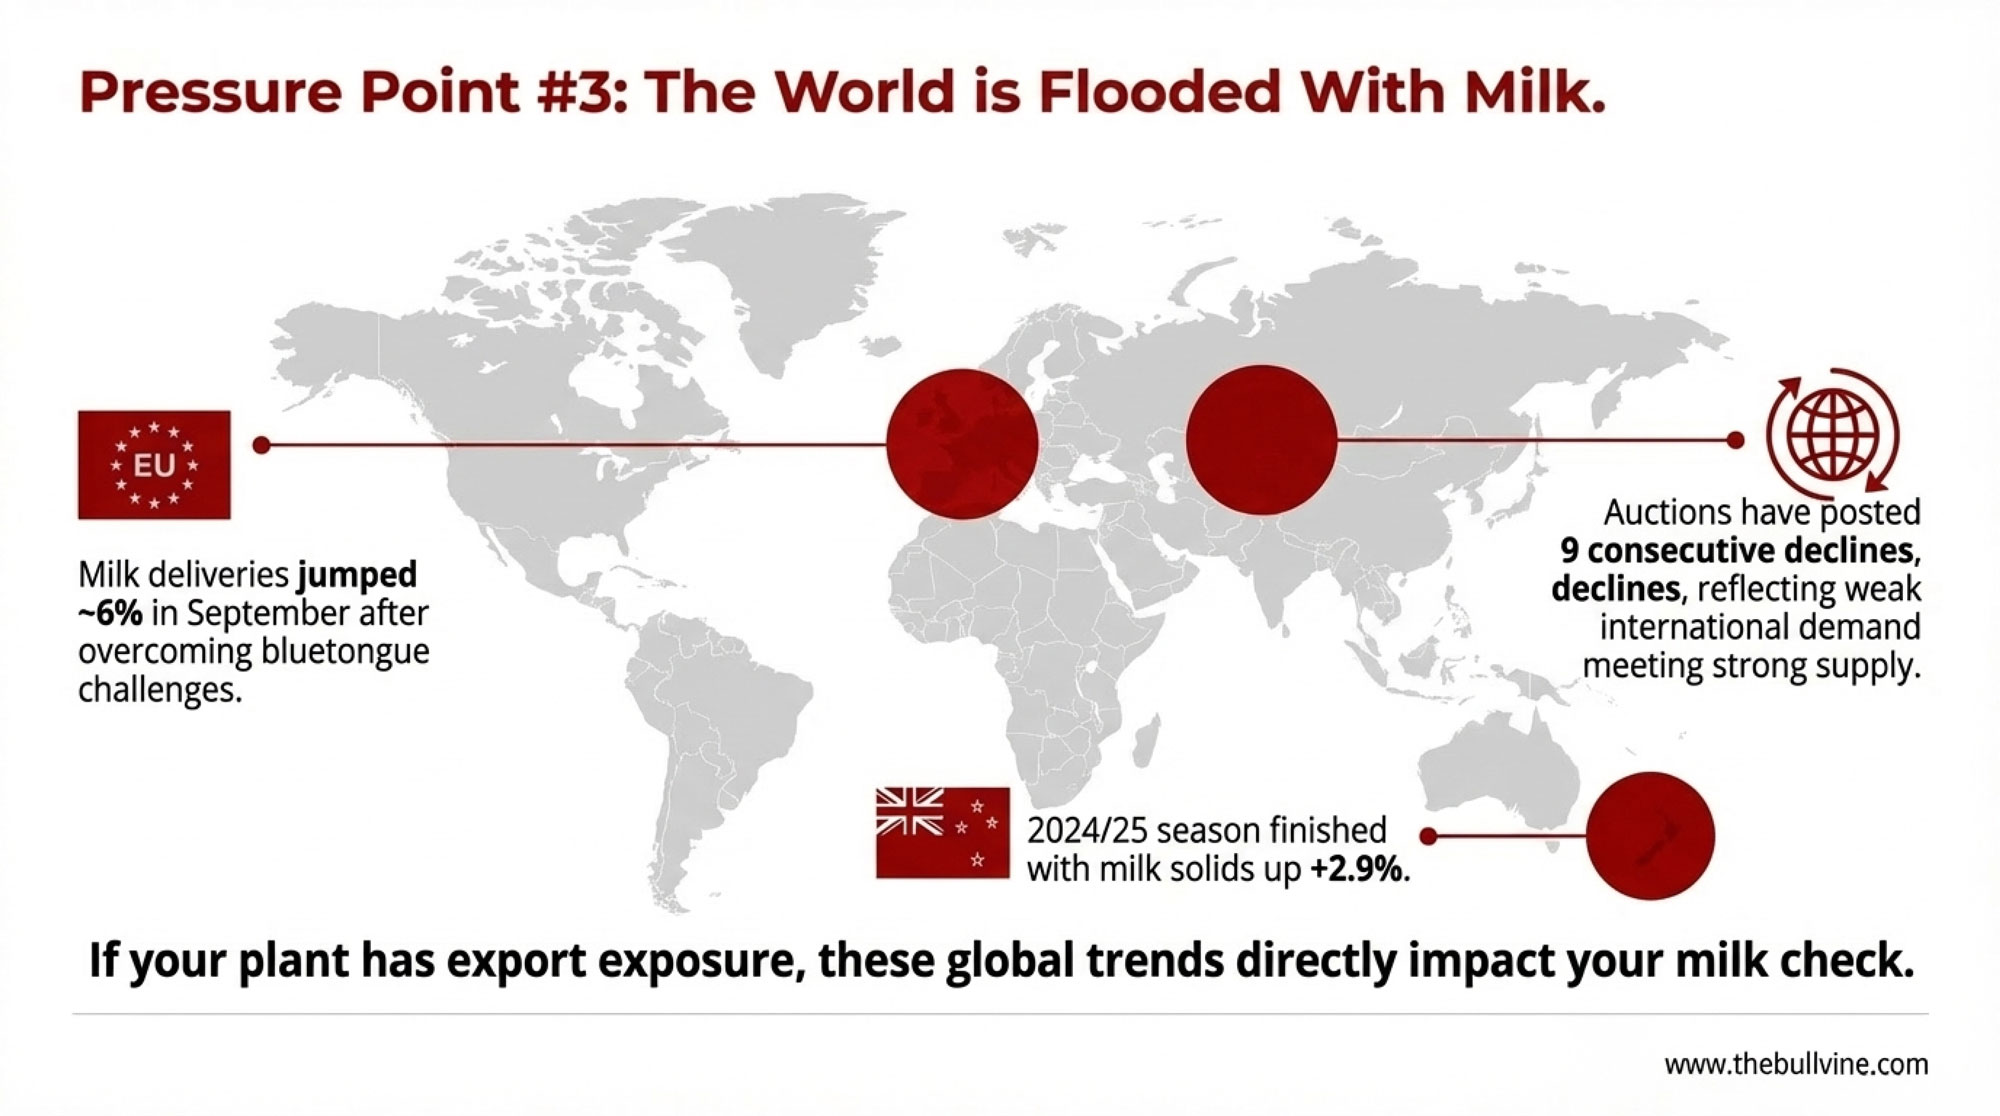
It’s not just U.S. production running hot. The latest AHDB market review shows EU milk deliveries jumped around 6% in September after the bloc worked through its bluetongue challenges. DairyNZ and LIC statistics show that New Zealand’s 2024/25 season finished with total milk solids production up 2.9% to 1.94 billion kilograms.
The Global Dairy Trade auctions have posted nine consecutive declines now, reflecting strong global supply meeting softer demand from key importing regions. If you’re shipping to a plant with export exposure—and that includes many operations in Wisconsin, Idaho, and the Southwest—those GDT results eventually flow back into your mailbox price.
For Canadian producers watching from across the border, the U.S. production surge creates its own dynamics. American oversupply tends to intensify pressure on USMCA access negotiations and affects cross-border pricing signals, even within the quota system.
California’s role amplifies these dynamics domestically. The state produces roughly 18% of U.S. milk, but here’s what really matters for price discovery: California Dairies Inc. alone churns over 480 million pounds of butter annually (about 23% of U.S. production), and the state manufactures the largest share of nonfat dry milk powder in the country. When California production swings, commodity pricing moves for everyone.
The Butter Paradox
Here’s something that looks like good news until you understand what’s actually happening.
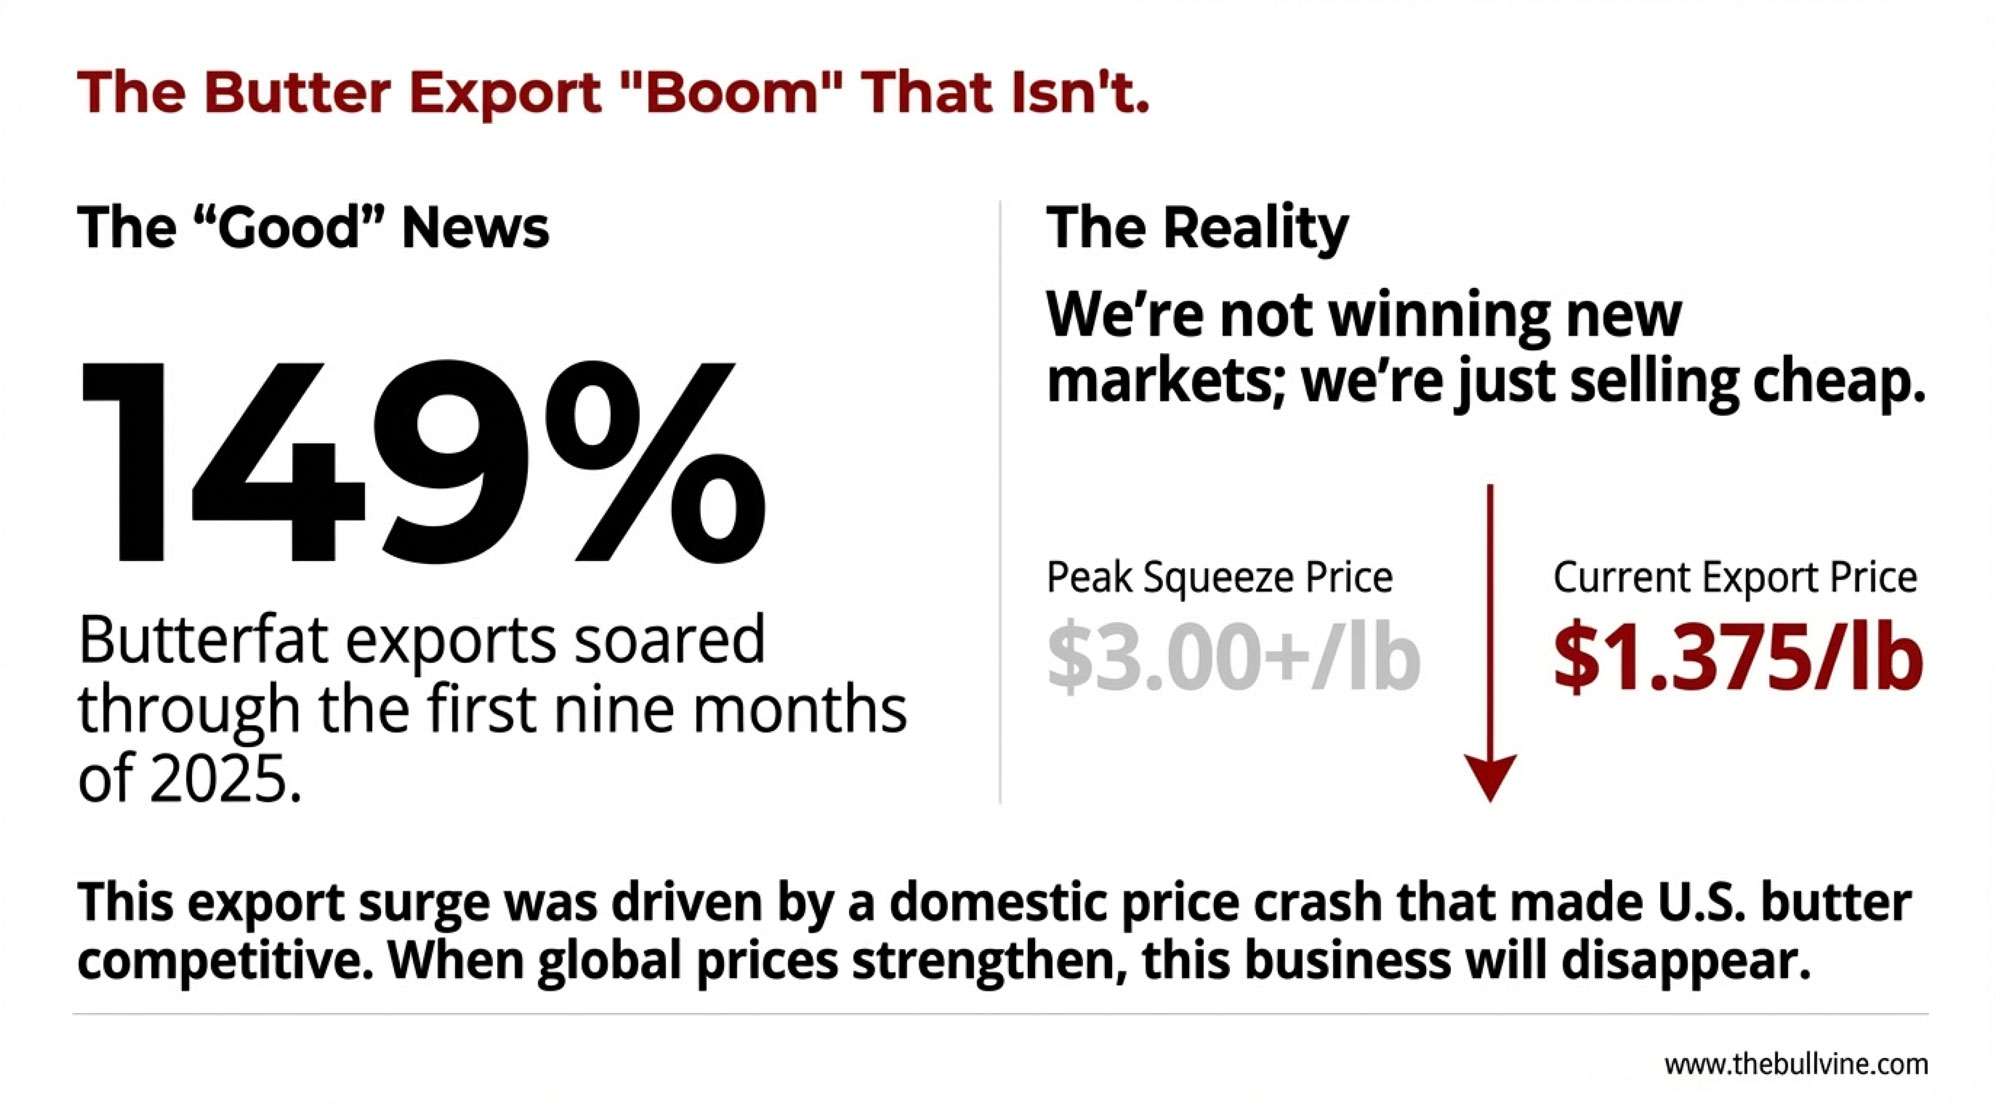
USDEC data shows butter exports surged in 2025. January alone was up 41% year-over-year, and through the first nine months, total butterfat exports soared 149%.
Sounds great, right? Here’s the catch: U.S. prices had dropped enough to compete in markets we typically can’t reach. Brownfield Ag News reports CME spot butter trading around $1.375 to $1.40 per pound as we moved into January—a long way from the $3.00-plus prices we saw during the supply squeeze.
We were essentially selling butter globally because domestic prices made us competitive, not because we’d developed new market access. That’s fundamentally different from export growth driven by structural demand improvement. When global prices strengthen, that business disappears.
Cheese Exports: The Genuine Bright Spot
If you’re looking for actual strength in the dairy complex, cheese exports tell a legitimately positive story.
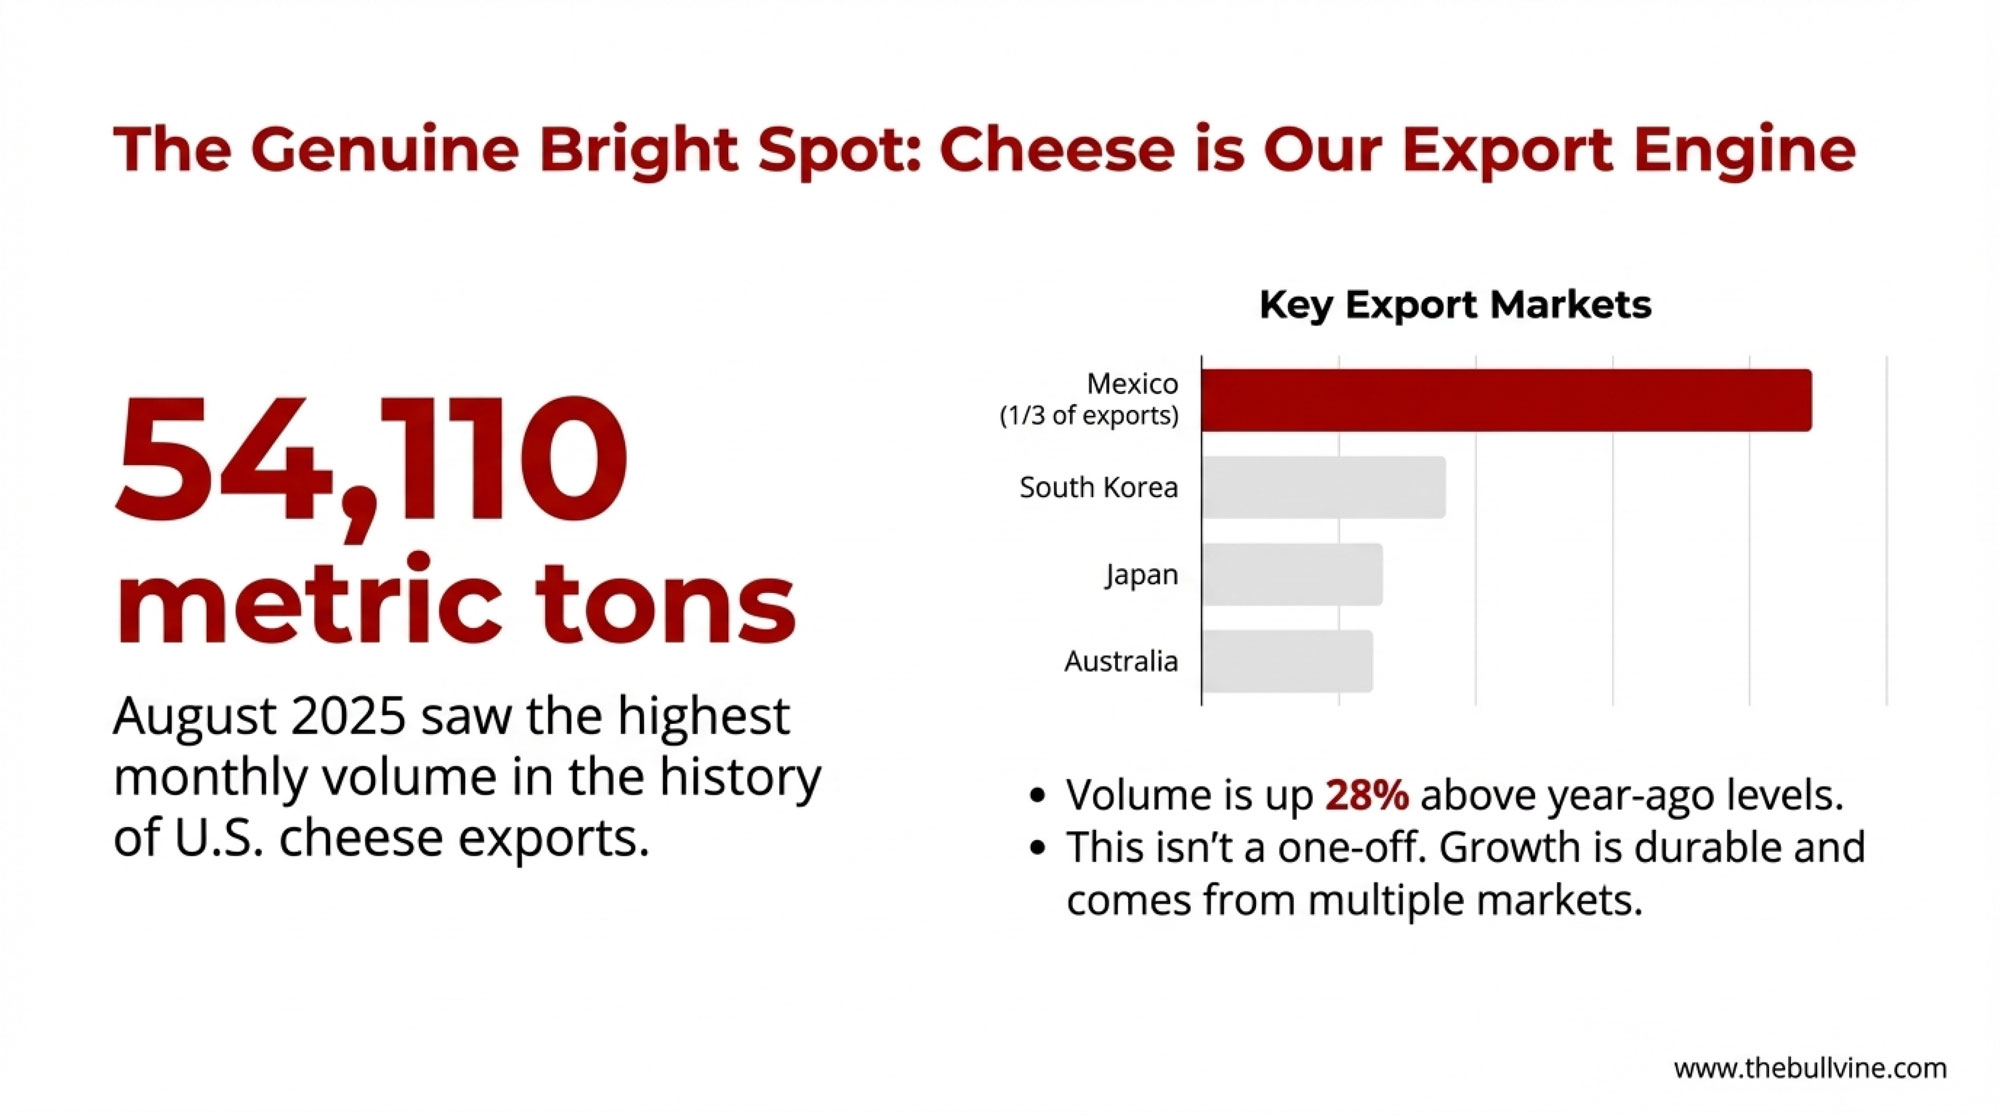
USDEC confirmed that August 2025 reached 54,110 metric tons—the highest monthly volume in the history of U.S. cheese exports. That’s 28% above year-ago levels, and the growth has come from multiple markets rather than depending on any single buyer.
Mexico remains our foundation, accounting for roughly a third of total U.S. cheese exports, according to USDEC trade data. But South Korea, Japan, and Australia all posted strong growth in the first half of 2025. The fundamentals here—growing global demand, improved U.S. product quality, established market relationships—look durable.
One constraint worth watching: USTR data shows USMCA quota utilization is still around 42%, suggesting meaningful upside if Canadian market access improves. That’s a trade policy question beyond any individual producer’s control, but it represents real unrealized potential.
The GLP-1 Demand Question
GLP-1 drugs have some dairy economists predicting significant demand shifts. The actual data tells a more nuanced story, concerning in specific categories but not the catastrophe some suggest.
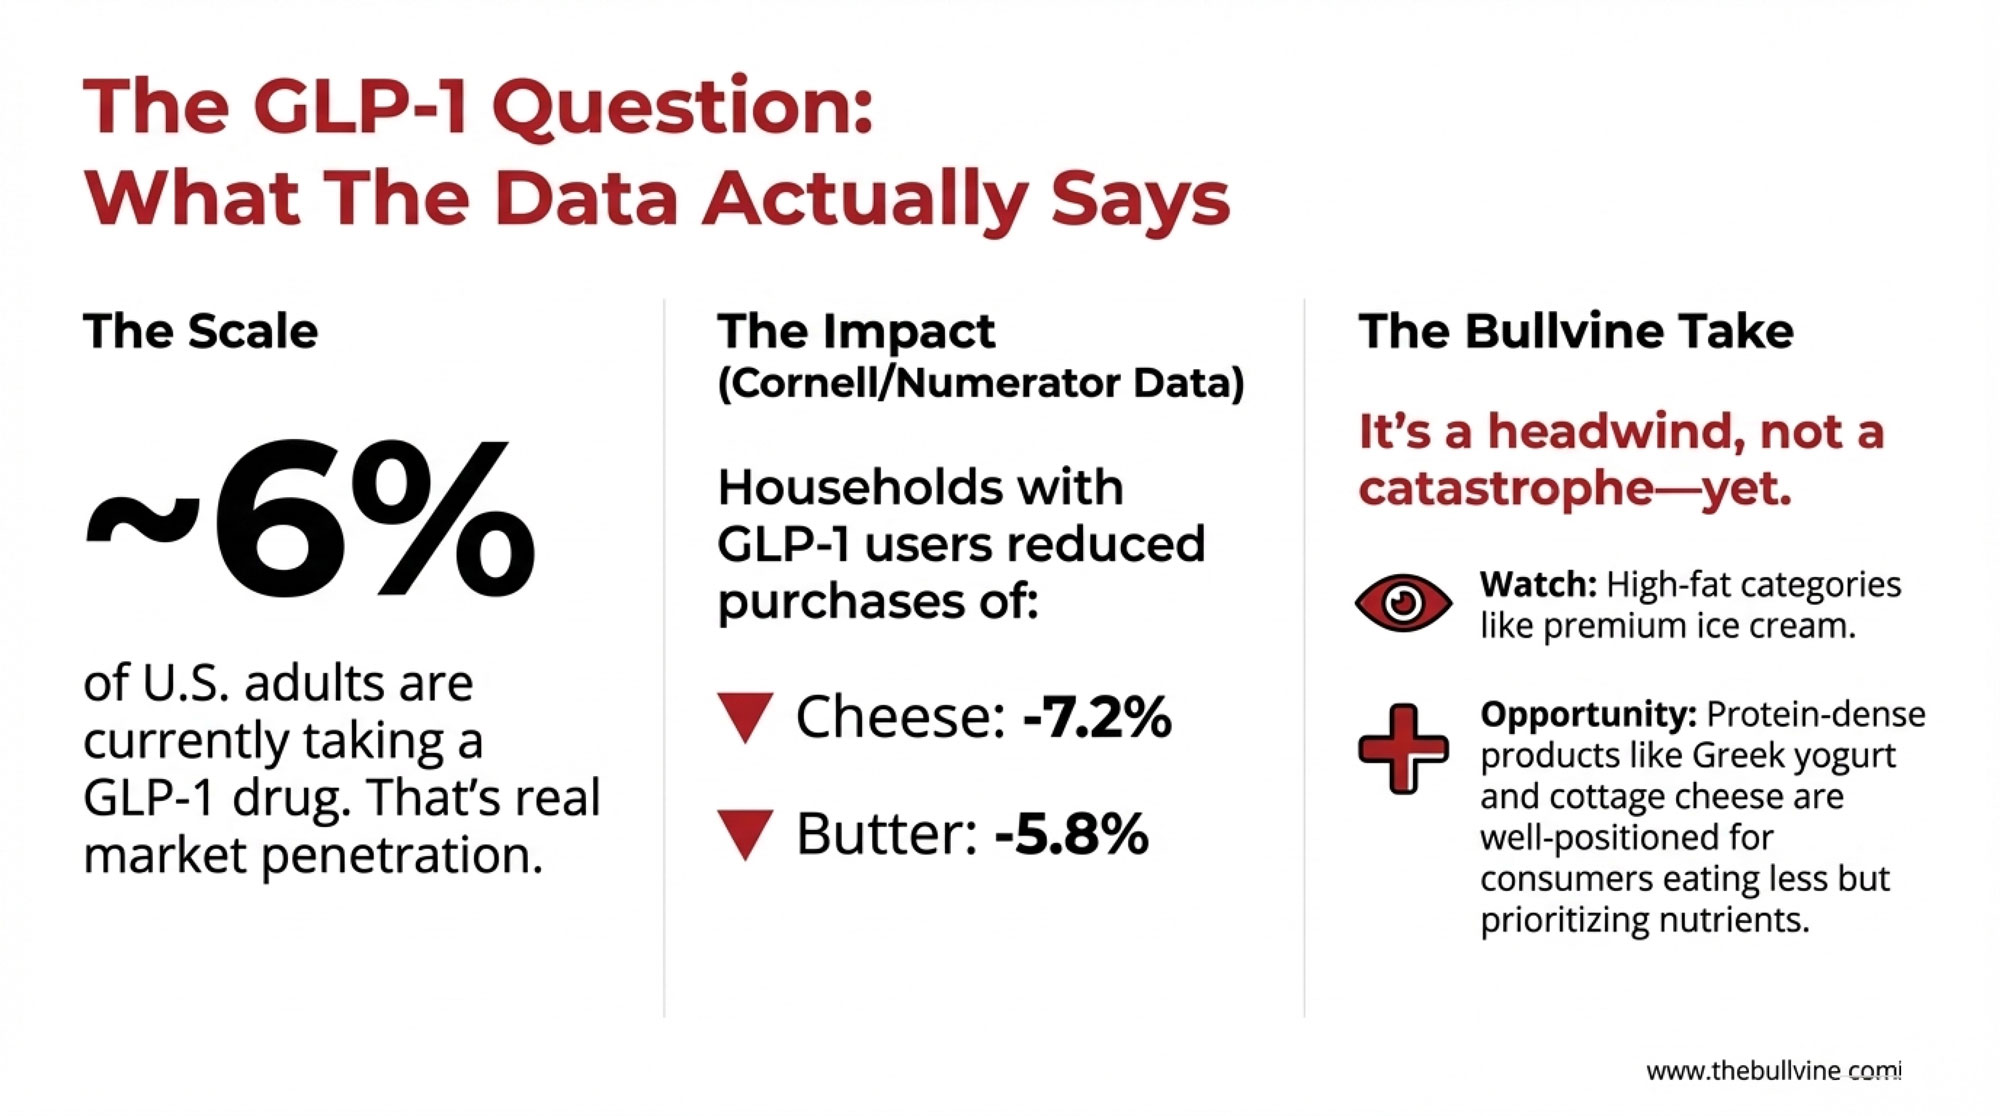
Kaiser Family Foundation polling indicates about 12% of American adults have used a GLP-1 medication at some point, with roughly 6% currently taking one. That’s real market penetration.
Cornell University and Numerator recently published detailed grocery purchasing data on this population. Households with GLP-1 users reduced cheese purchases by 7.2% and butter by 5.8%. They cut sweet bakery items and cookies by 6-11% across categories.
Here’s how I’d frame this practically: it matters, but it’s not an existential threat—yet. The protein density of dairy actually positions products like Greek yogurt and cottage cheese favorably for consumers who are eating less but prioritizing nutrient-dense foods.
Where I’d watch more carefully is high-fat categories. If GLP-1 adoption reaches the 15-24% levels Morgan Stanley projects for the early 2030s, premium ice cream and butter-heavy applications could face meaningful headwinds. Worth factoring into long-term product mix thinking, but not a reason to panic about 2026.
Current Price Reality
Let’s be direct about where we are.
According to USDA’s official Class and Component Price announcements, December Class III came in at $15.86/cwt—January futures point to the low-to-mid $15 range. That’s the math when production expands as quickly as it has.
The Class III to Class IV spread has been particularly notable. December showed Class III at $15.86 versus Class IV at $13.64—a $2.22 gap favoring cheese markets over butter and powder. If you’re a Class IV shipper, you’ve felt that spread directly in your check. Geography and market assignment matter more than usual right now.
On the feed side, corn has been trading around $4.40 per bushel according to Trading Economics futures data. USDA projects an average farm price around $4.00 for the 2025/26 marketing year, which would provide some relief—but that’s not guaranteed.
What to Do Before Q2
Based on the data and the producer conversations I’ve been having, here are five moves worth considering before spring:
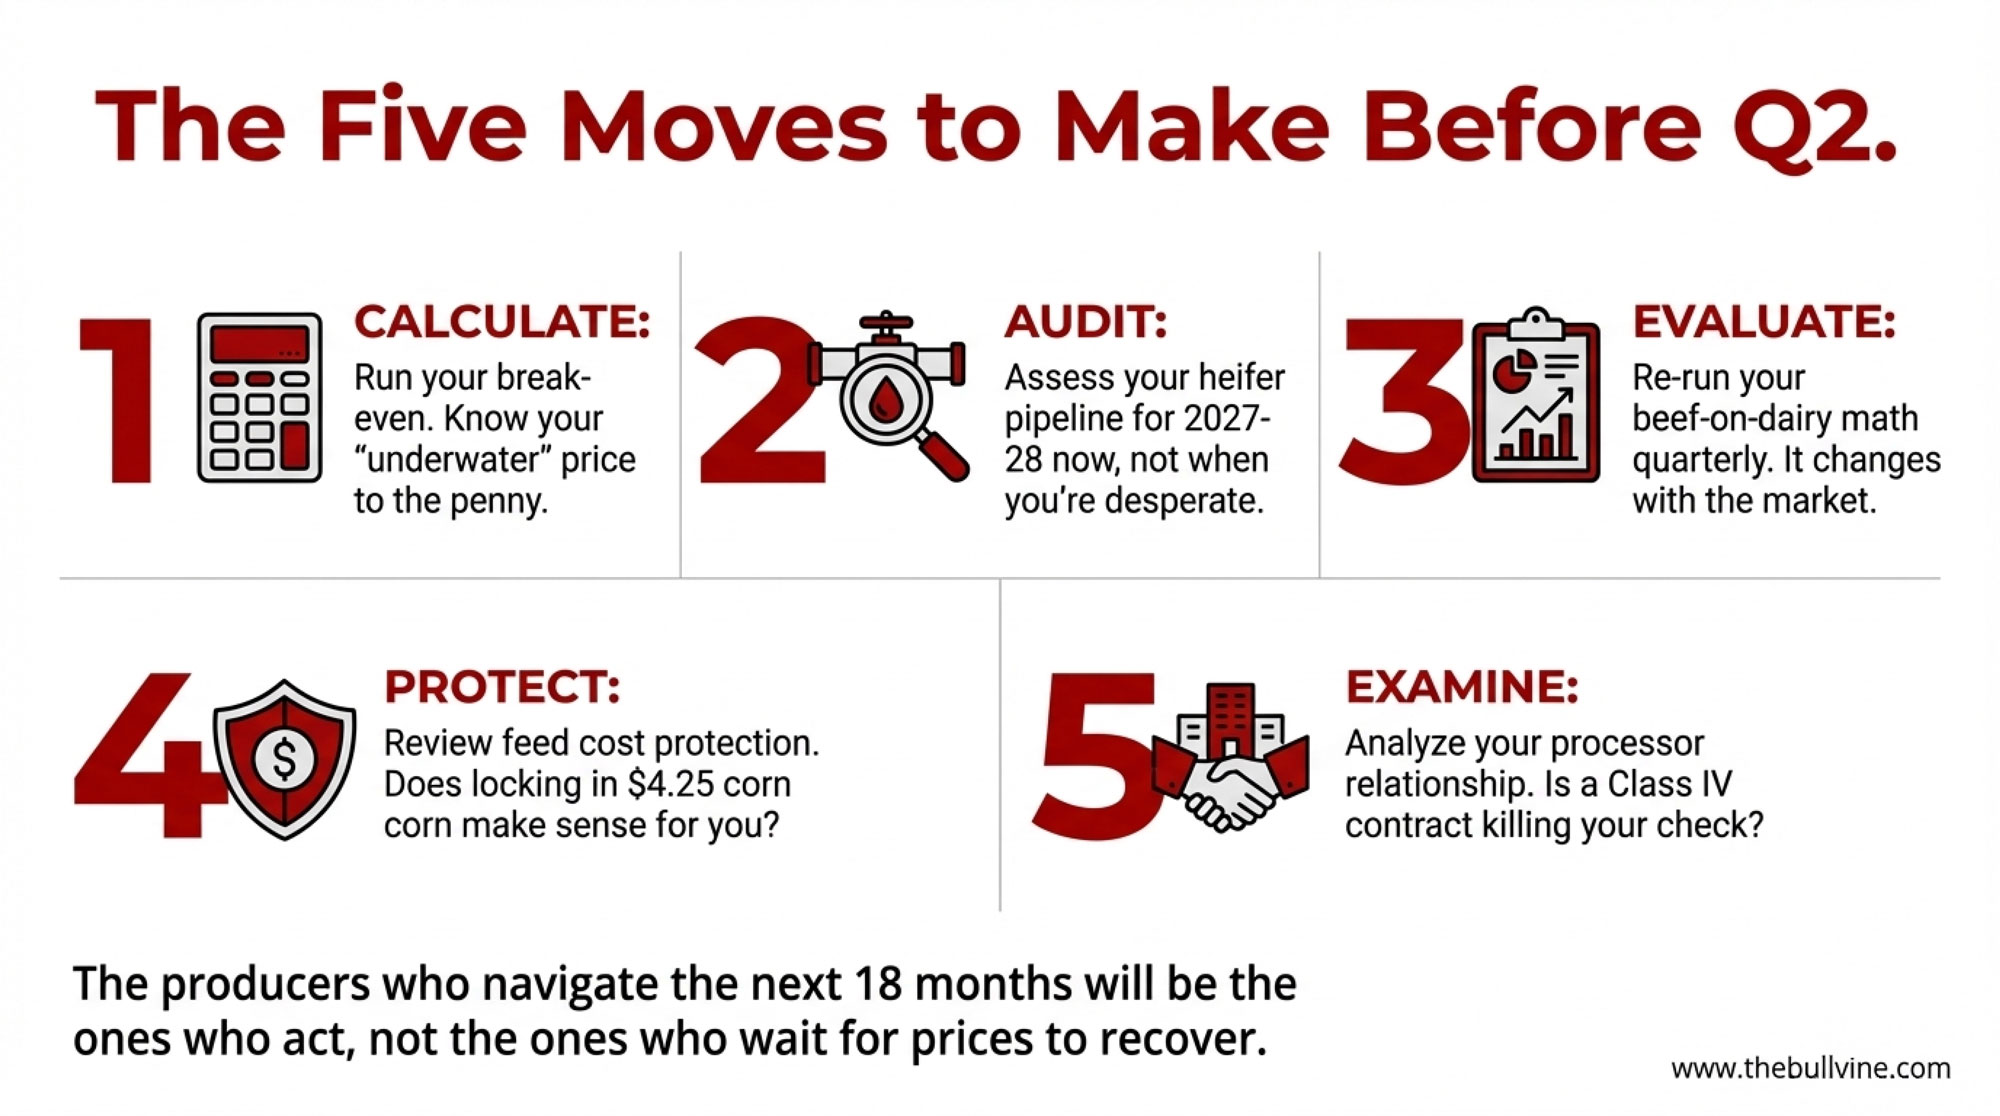
Run your break-even calculation this week. Know exactly what Class III price puts you underwater. If you haven’t updated this math since prices were $20, you’re operating blind. Have contingency triggers ready—what do you cut first at $15? At $14?
Audit your heifer pipeline now. Calculate your replacement availability for the 2027-2028 calving. If you’re below 28 heifers per 100 cows, start sourcing conversations immediately. Set a price ceiling before you need animals urgently—desperation buying at $4,500 in twelve months is a lot more expensive than planned purchasing at $3,800 today.
Evaluate your beef-on-dairy math quarterly. The premium calculation shifts with calf prices and heifer availability. A 70% beef semen strategy that worked at $1,400 crossbred calves might need adjustment if those prices soften. Don’t set-and-forget your breeding program.
Review feed cost protection. With corn at $4.40 and possible relief toward $4.00, evaluate whether forward contracts make sense for Q1-Q2 before spring planting volatility. Locking in $4.25 corn looks smart if prices spike; it looks expensive if they fall to $3.80. Know your risk tolerance.
Examine your processor relationship. If you’re Class IV-dependent and watching checks come in $2.20 below Class III equivalents, it’s worth exploring whether component shipping options or processor alternatives exist in your region. Not every operation has flexibility here, but some do and aren’t using it.
The Bottom Line
The operations that navigate the next 12-18 months successfully won’t be the ones waiting for prices to recover on their own. They’ll be the ones who used this window to lock in replacement animals before the shortage intensifies, controlled feed costs where possible, and knew their break-even to the penny.
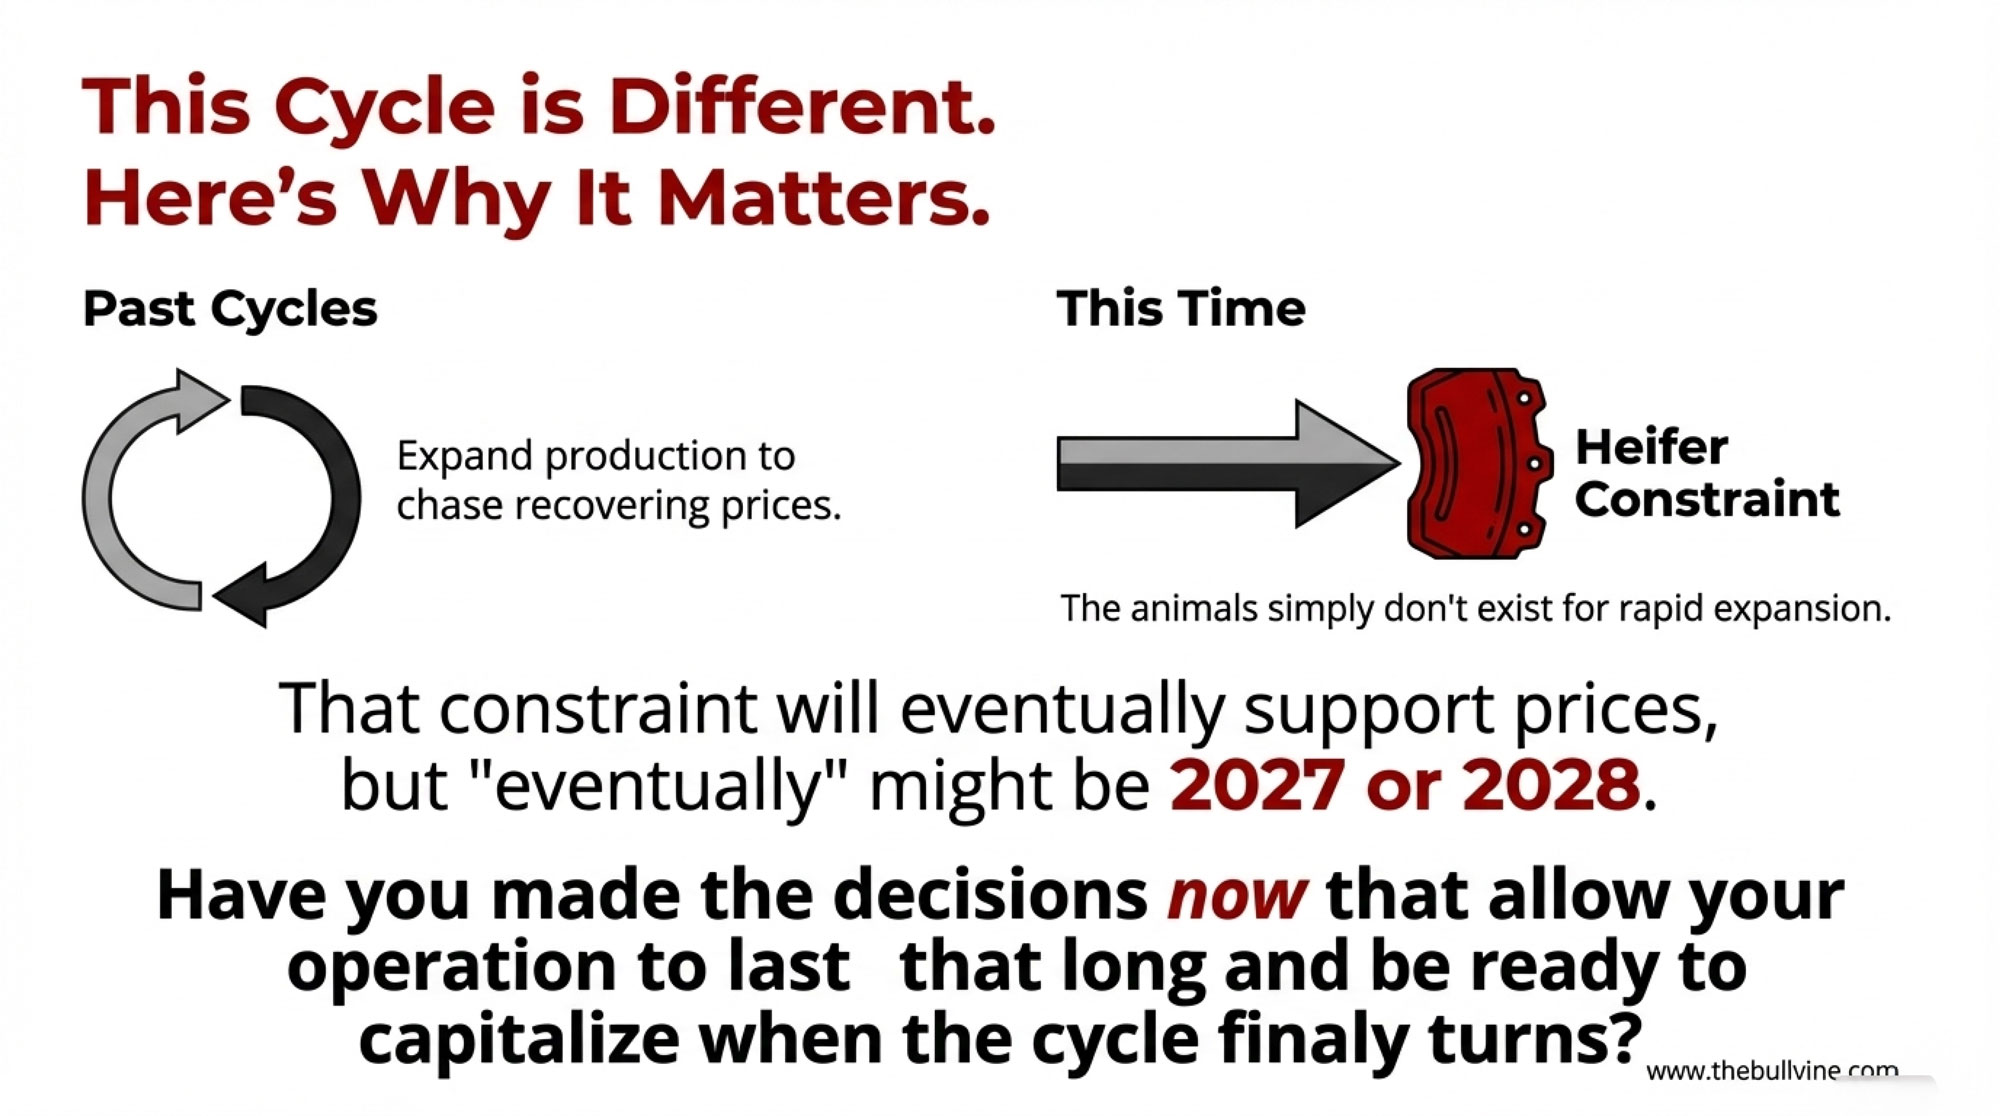
Dairy has always been cyclical. Strong production, recovering global supply, and moderating prices—we’ve been through this pattern before. What’s different this time is the heifer constraint underneath it all. The industry can’t simply expand out of tight margins when replacement animals don’t exist.
That constraint will eventually support prices. But “eventually” might be 2027 or 2028. The question is whether your operation’s financial position lets you wait that long—and whether you’re taking the steps now that position you to expand when the cycle turns.
The fundamentals of dairy demand remain constructive. Protein consumption is growing. Convenience continues driving category growth. Despite years of plant-based competition, real dairy holds its market share.
Those realities matter. But so does the math of $15.86 Class III with $4.40 corn and $4,000 springers. The producers who acknowledge both—the long-term demand strength and the short-term margin pressure—are the ones making decisions right now that they won’t regret in 2027.
Key Takeaways
You’re bleeding $80/cow monthly — Class III crashed to $15.86; that’s $16,000 vanishing from a 200-cow herd before spring
211,000 cows added in 12 months — Largest U.S. herd since 1993; prices won’t recover until supply corrects
Springers hit $4,000+ — Tightest heifer pipeline in 20 years; replacement economics have flipped
Global milk keeps flooding in — California +10%, EU +6%, New Zealand +3%; no relief coming in 2026
5 moves to make now — Know your break-even, source heifers before desperation, reassess beef-on-dairy, lock feed, review your processor
Complete references and supporting documentation are available upon request by contacting the editorial team at editor@thebullvine.com.
Learn More
Beef-on-Dairy’s $6,215 Secret: Why 72% of Herds Are Playing It Wrong – Master the precise breeding ratiostop-tier herds use to thrive and secure an immediate cash flow advantage. This breakdown arms you with the math to capture $700 premiums per calf without sacrificing your future replacement pipeline.
The 90-Day Dairy Pivot: Converting Beef Windfalls into Next Year’s Survival – Convert fleeting beef premiums into long-term resilience before the 2026 market shift hits your balance sheet. This analysis delivers the component-focused economic strategy and processor relationship audit required for survival in a $17 milk environment.
Join over 30,000 successful dairy professionals who rely on Bullvine Weekly for their competitive edge. Delivered directly to your inbox each week, our exclusive industry insights help you make smarter decisions while saving precious hours every week. Never miss critical updates on milk production trends, breakthrough technologies, and profit-boosting strategies that top producers are already implementing. Subscribe now to transform your dairy operation’s efficiency and profitability—your future success is just one click away.
Dec 15: Germany’s butter -9.3%. Chicago cheese at 18-month low. NZ powder is falling. Every dairy market crashed the same week—despite record exports. What broke, and what’s next for your operation
Executive Summary: Record dairy exports should lift prices—instead, every global market crashed simultaneously the week ending December 15, 2025, revealing that fundamental pricing mechanisms have broken. U.S. cheese shipments hit all-time highs while CME prices fell to 18-month lows; European butter dropped 5.8%; powder weakened globally. The paradox persists because cheap feed costs ($4.40 corn) enable production growth despite distressed milk prices—the normal supply response isn’t working. Worse, processors worldwide are simultaneously shifting from butter into cheese, creating concentrated inventory that will mature in Q2 2026 precisely when the spring flush arrives—a collision that could severely pressure spot milk prices. This signals a structural reset, not a cyclical downturn: operations must rebuild for sustained viability at $15-16 milk through cost efficiency, component optimization, balance sheet strength, and strategic feed hedging. The industry emerging from this transition will operate under fundamentally different economics than those of the past decade.
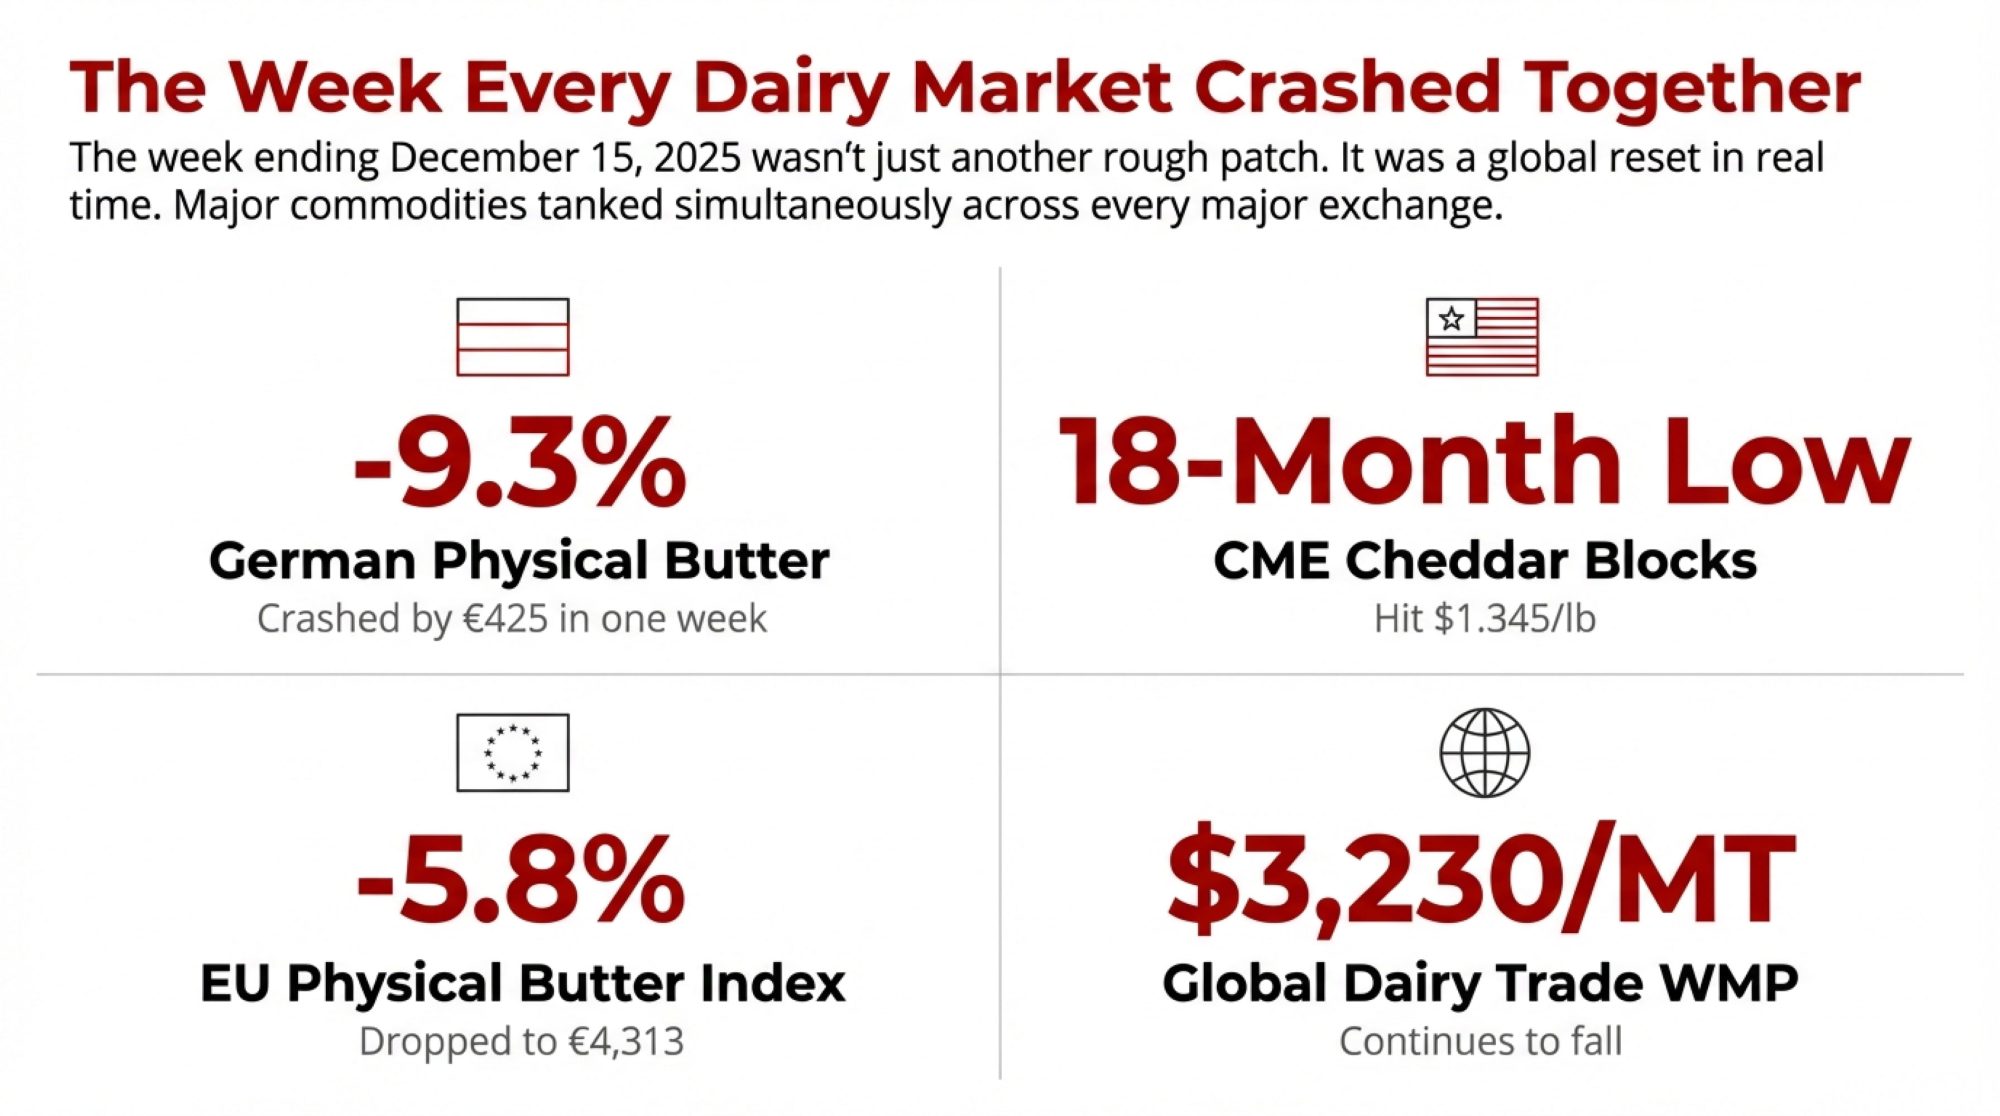
You probably felt it in your milk check before you saw it in the data. But here’s what actually happened the week ending December 15, 2025: butter futures crashed 3.6% in Leipzig to €4,314. EU physical butter dropped 5.8% to €4,313. Whole Milk Powder on the Global Dairy Trade fell to $3,230 per metric tonne. And CME Cheddar blocks hit $1.345 per pound—the lowest since July 2023. When every major commodity tanks simultaneously across every major exchange, we’re not looking at another rough patch. We’re watching the global dairy industry reset itself in real time.
Market/Product
Price (Week of Dec 15)
Weekly Change
Significance
German Butter
€4,150/tonne
-€425 (-9.3%)
Steepest weekly crash
EU Physical Butter (avg)
€4,313/tonne
-€251 (-5.8%)
18-month low
CME Cheddar Blocks
$1.345/lb
-4.1%
Lowest since July 2023
Global Dairy Trade WMP
$3,230/tonne
-3.8%
Sustained weakness
Dutch Butter
€4,070/tonne
-€250 (-5.8%)
Export benchmark falls
EEX Butter Futures (Leipzig)
€4,314/tonne
-3.6%
Futures signal no recovery
EU Young Gouda
€2,961/tonne
-34.3% YoY
Near five-year lows
EU Mild Cheddar
€3,248/tonne
Just €4 above 5-yr low
Testing historical floor
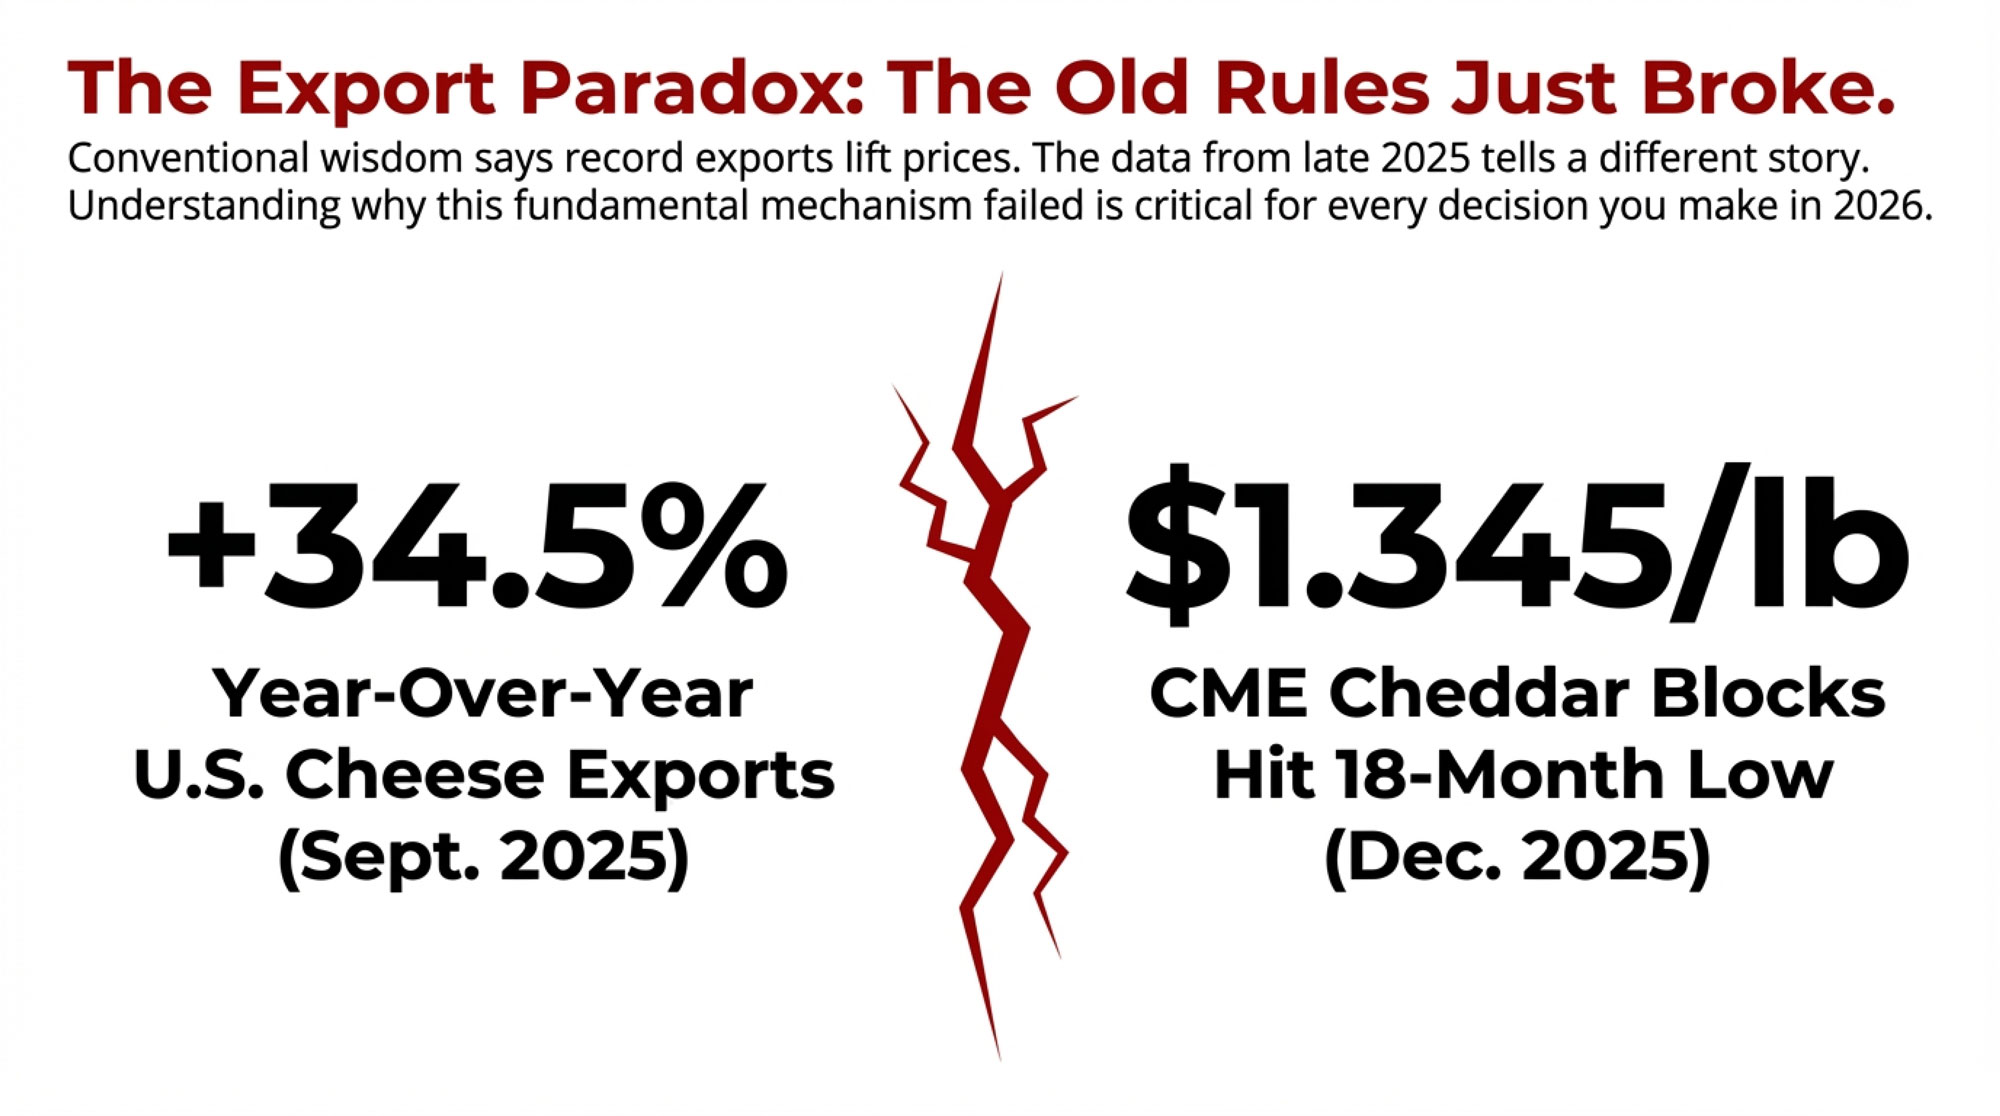
Here’s the part that should really get your attention: U.S. cheese exports hit 116.5 million pounds in September—up 34.5% from the previous year and representing the highest daily average on record, according to the U.S. Dairy Export Council. Record exports should be lifting prices, not coinciding with an 18-month low. That mechanism just broke, and understanding why matters for every decision you’re making about 2026.
Month
U.S. Cheese Exports (Million lbs) – Left Axis
CME Cheddar Blocks ($/lb) – Right Axis
Mar 2025
95.2
$1.62
Apr 2025
98.7
$1.58
May 2025
102.3
$1.54
Jun 2025
107.8
$1.49
Jul 2025
110.5
$1.46
Aug 2025
113.2
$1.41
Sep 2025
116.5
$1.38
Dec 2025
118.8 (est)
$1.345
A Brief Look Back: Context for What We’re Seeing
Before diving into current dynamics, it’s worth understanding that synchronized global dairy price collapses of this magnitude are relatively rare. The last time we saw coordinated weakness across multiple regions and products simultaneously was during the 2014-2016 period, when a combination of Russian import bans, a slowdown in Chinese demand, and the removal of European quotas created a global surplus that took nearly two years to work through. That episode saw U.S. Class III milk drop from over $24/cwt in 2014 to under $14 in 2016.
What eventually resolved that situation was a combination of weather-driven production disruptions (the 2016 New Zealand drought), gradual demand recovery in Asia, and ultimately, many smaller farms exiting the industry entirely. The recovery wasn’t quick, and the industry that emerged on the other side looked structurally different—more consolidated, more efficient, and arguably more vulnerable to the kind of dynamics we’re seeing today.
When the Safety Valves Stop Working
For as long as most of us have been in this industry, global dairy markets have operated with a kind of built-in equilibrium. When prices drop in one region, traders buy there and sell elsewhere, which lifts the cheap market and cools the expensive one. If a U.S. product is discounted, exports surge until domestic prices align with international benchmarks. It’s the arbitrage mechanism that keeps regional markets from getting too far out of whack.
What’s striking about mid-December is how that mechanism appears to have stopped functioning.
Looking at the data from European exchanges, German physical butter crashed by €425 in a single week—that’s a 9.3% drop—settling at €4,150. The weekly EU dairy quotations showed Dutch butter at €4,070, down €250. Yet French butter actually firmed €200 to €4,720. So you’ve got a €650 per tonne spread between French and Dutch butter, which shouldn’t persist in an integrated market.
At the same time, the Singapore Exchange was seeing pressure across its dairy complex despite solid trading volumes of 18,915 tonnes for the week. And back in the States, CME Cheddar blocks are sitting at $1.345 per pound—the lowest we’ve seen since summer 2023.
When these markets all move down together like this, it tells you the buyers are either already full or they’re waiting for even lower prices. That’s a fundamentally different dynamic than we’re used to seeing. What we’re watching is the global dairy complex running out of capacity to absorb current production levels at anything close to recent historical prices.
Why Production Keeps Growing Despite Terrible Prices
In a typical cycle, you’d expect falling prices to trigger pretty predictable responses. Farmers cull marginal cows, dial back feed inputs where it makes sense, and overall production gradually contracts. That supply reduction creates scarcity, and prices eventually recover. It’s the classic pattern the industry has relied on for generations.
That’s not what’s happening, and here’s why it matters.
The USDA’s December World Agricultural Supply and Demand Estimates held 2025 U.S. milk production steady at 115.70 million tonnes—still up 2.4% from 2024. They lowered the 2026 projection slightly, from 117.15 to 117.05 million tonnes, citing reduced dairy cow inventory offsetting per-cow production gains. But even with that downward revision, we’re still looking at 1.2% growth in 2026.
Think about that for a minute. Even with prices at distressed levels across multiple product categories, American milk production is forecast to keep expanding.
And if you want to understand why, take a look at what’s happening in feed markets. The December USDA grain outlook shows March 2026 corn futures trading around $4.405 per bushel, with projected ending stocks of 2.03 billion bushels. That’s the highest level in seven years and 32% greater than last season. The agency actually raised its corn export forecast to 3.2 billion bushels—that’s up 12% from last year’s record—yet domestic supplies remain massive. Soybean meal closed the week at $302 per ton, down $5.40.
What this creates is production that stays high because historically cheap feed costs insulate producers from the full pain of low milk checks. When you run the income-over-feed-cost calculations—and I know most of you do this weekly if not daily—many operations can still pencil out positive margins even with Class III in the mid-$15s. That math keeps marginal cows in the herd even when finished product prices are screaming oversupply.
I was looking at numbers from a 500-cow Wisconsin operation recently that illustrates this perfectly. With corn at $4.40, their feed costs are down 18% from last year. That keeps their IOFC positive at $16.50 milk, even though that’s $3 below what they budgeted for 2025. So the economic signal telling them to cut back gets overwhelmed by the reality that they’re still cash-flow positive on a monthly basis.
Period
Feed Cost
Other Costs
Milk Price
IOFC Margin
Q4 2023
$10.20
$7.50
$19.80
$9.60
Q1 2024
$9.80
$7.60
$18.50
$8.70
Q2 2024
$9.20
$7.70
$17.90
$8.70
Q3 2024
$8.90
$7.80
$17.20
$8.30
Q4 2024
$8.40
$7.90
$16.80
$8.40
Q1 2025
$7.80
$8.00
$16.20
$8.40
Q4 2025
$7.20
$8.10
$15.90
$8.70
Here’s something else worth noting: the USDA report mentions explicitly that winter weather isn’t the constraint it used to be, particularly in the Midwest. Modern housing systems mean operations in Wisconsin, Michigan, and Minnesota can maintain high production levels regardless of what’s happening outside. Better ventilation, more sophisticated environmental controls—which is great for consistency and animal welfare, but it also makes production less responsive to price signals.
The Export Picture Gets Complicated
Here’s where things get really interesting, and why the volume numbers deserve a closer look.
September numbers from the U.S. Dairy Export Council showed cheese exports up 34.5% year-over-year to 116.5 million pounds—the highest daily average shipments on record. Butter exports were 2.7 times larger than the previous year. Whey powder exports hit their highest level since March 2023, up 8.3%.
You’d think those export numbers would support domestic prices. When foreign buyers aggressively purchase U.S. products, that should create competition for available inventory. But that’s not what we’re seeing. Strong export volumes are coinciding with some of the weakest domestic prices in years.
What this tells you is that the industry is exporting what it has to produce to keep processing plants running at capacity. These modern cheese plants have massive fixed costs and debt service obligations. You can’t afford to run at 70% capacity—your cost per unit skyrockets. So you run full-throttle and discount product to move volume into export channels.
And here’s where the story gets more nuanced. While cheese exports are at record levels, nonfat dry milk exports collapsed 18.5% year over year in September, hitting an eight-month low. Even sales to Mexico—and Mexico has been one of our most reliable powder markets—dropped 17.3%. When you can’t move powder to Mexico, that tells you demand is genuinely soft across categories.
The cheese export story breaks down in interesting ways by region. Mexico remains the dominant market, which makes sense given proximity and trade relationships. But what’s notable is that Australia has become the third-largest destination for U.S. cheese. USDEC data shows Australia has already imported more U.S. cheese in 2025 than in any previous year on record, and we’ve still got three months of shipments to count.
This matters because it represents a shift in the Australian dairy sector. Chronic drought conditions and herd contraction have pushed Australia from being a dairy-surplus nation to one that’s increasingly dependent on imports. U.S. cheese is essentially backfilling the gap left by shrinking Australian milk production.
The challenge with this dynamic is sustainability. Mexico is buying finished U.S. cheese because, at current prices, it’s cheaper than importing powder and manufacturing cheese themselves. Australia is buying because they don’t have enough domestic milk. Neither situation represents organic demand growth driven by expanding consumption—they’re opportunistic purchases driven by price dislocations and supply shortfalls elsewhere.
When those conditions change—and at some point they will—it raises legitimate questions about where all that U.S. cheese production capacity is directed.
Europe’s Markets Fragment Under Pressure
The European physical spot markets during the week of December 10 showed how extreme stress can break down normally efficient trading systems, and it’s worth understanding these dynamics because they affect global price relationships.
The weekly EU dairy quotations showed the aggregate butter index down 5.8% to €4,313. But that overall number hides some significant regional variations. German butter crashed €425 per tonne in a single week—that 9.3% decline—settling at €4,150. Dutch butter, which tends to serve as a key pricing benchmark for export markets, fell €250 to €4,070. Yet French butter actually firmed €200 to €4,720.
So you’ve got a €650 per tonne spread between French and Dutch butter. That’s roughly a 16% price difference for essentially the same commodity in neighboring countries with no trade barriers. Under normal circumstances, traders would move product to capture that arbitrage opportunity, and the spread would compress.
The persistence of this spread likely reflects panic selling in the German and Dutch markets—processors liquidating inventory to generate cash flow—while France’s unique regulatory structure (particularly the Loi EGalim laws that protect farmer margins) and strong domestic preference for high-quality branded butter with protected designations create price support that can’t be easily arbitraged away.
Meanwhile, the European cheese complex is testing historical support levels. The EEX European Weekly Cheese Index shows Mild Cheddar trading at €3,248—just €4 above its five-year low. Cheddar Curd sits at €3,221, €27 above its five-year floor. Young Gouda has fallen to €2,961, down 34.3% year-over-year.
When you’ve got multiple cheese varieties simultaneously trading within pennies of multi-year lows during what should be a seasonally firm period—pre-holiday demand, typically lower winter milk production—it signals fundamental oversupply rather than temporary weakness. The market is grinding against production costs, and may already be below them for higher-cost operators.
The Strategic Pivot Creating Future Pressure
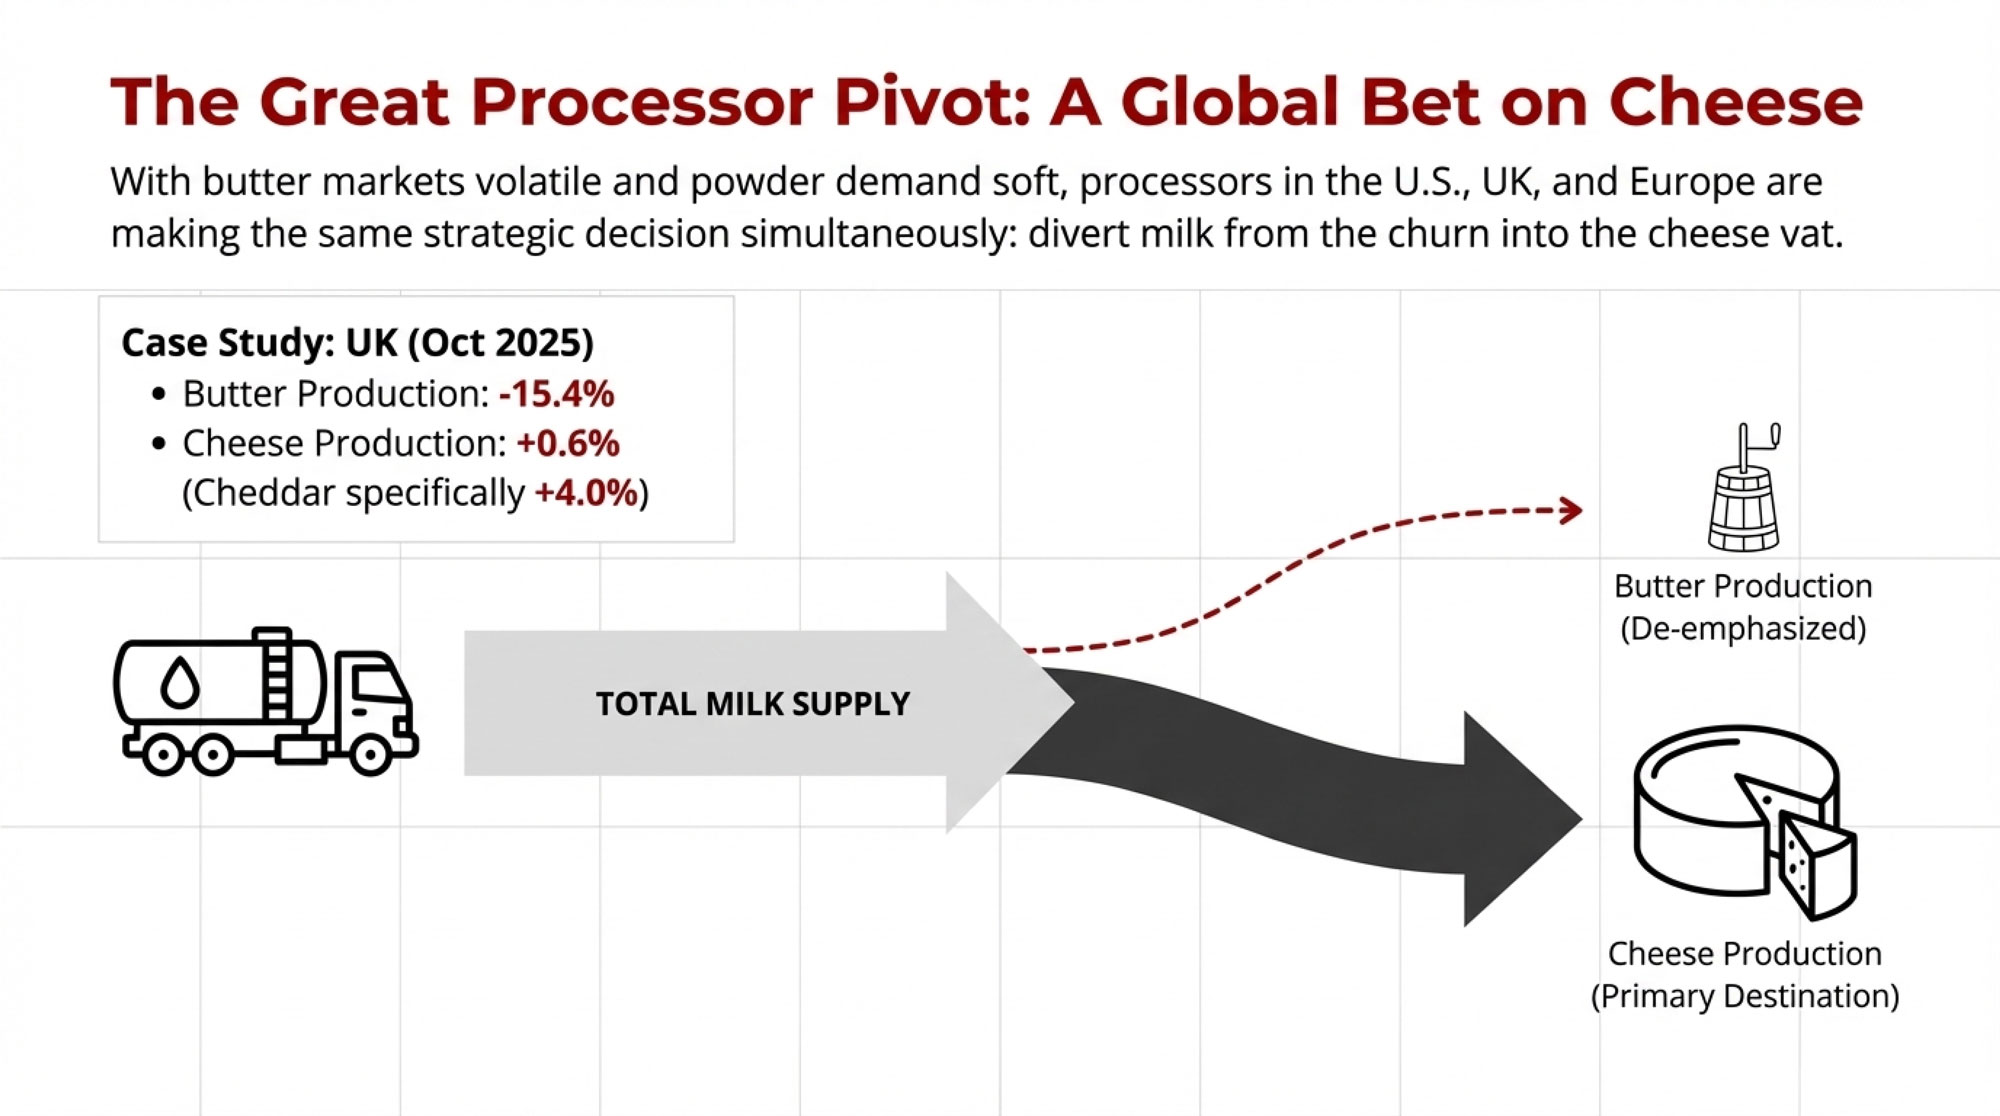
One pattern emerging from the data that has real implications for 2026 is a simultaneous shift by processors across multiple countries away from butter production and toward cheese.
UK production statistics from DEFRA for October 2025 tell the story: butter production down 15.4% year-over-year while cheese production increased 0.6%, with Cheddar specifically up 4.0%. You’re seeing similar dynamics in U.S. processing facilities—milk diverted from volatile butter markets into cheese vats.
The logic makes sense on paper. Butter is highly price-sensitive and difficult to store long-term without incurring significant cold-storage costs. Cheese, particularly aged varieties like Cheddar, can sit in inventory for 6 to 12 months as it matures. From a processor’s perspective, cheese acts as a kind of financial buffer—you can convert today’s surplus milk into a solid commodity and hope that by the time it’s ready for market, prices will have improved.
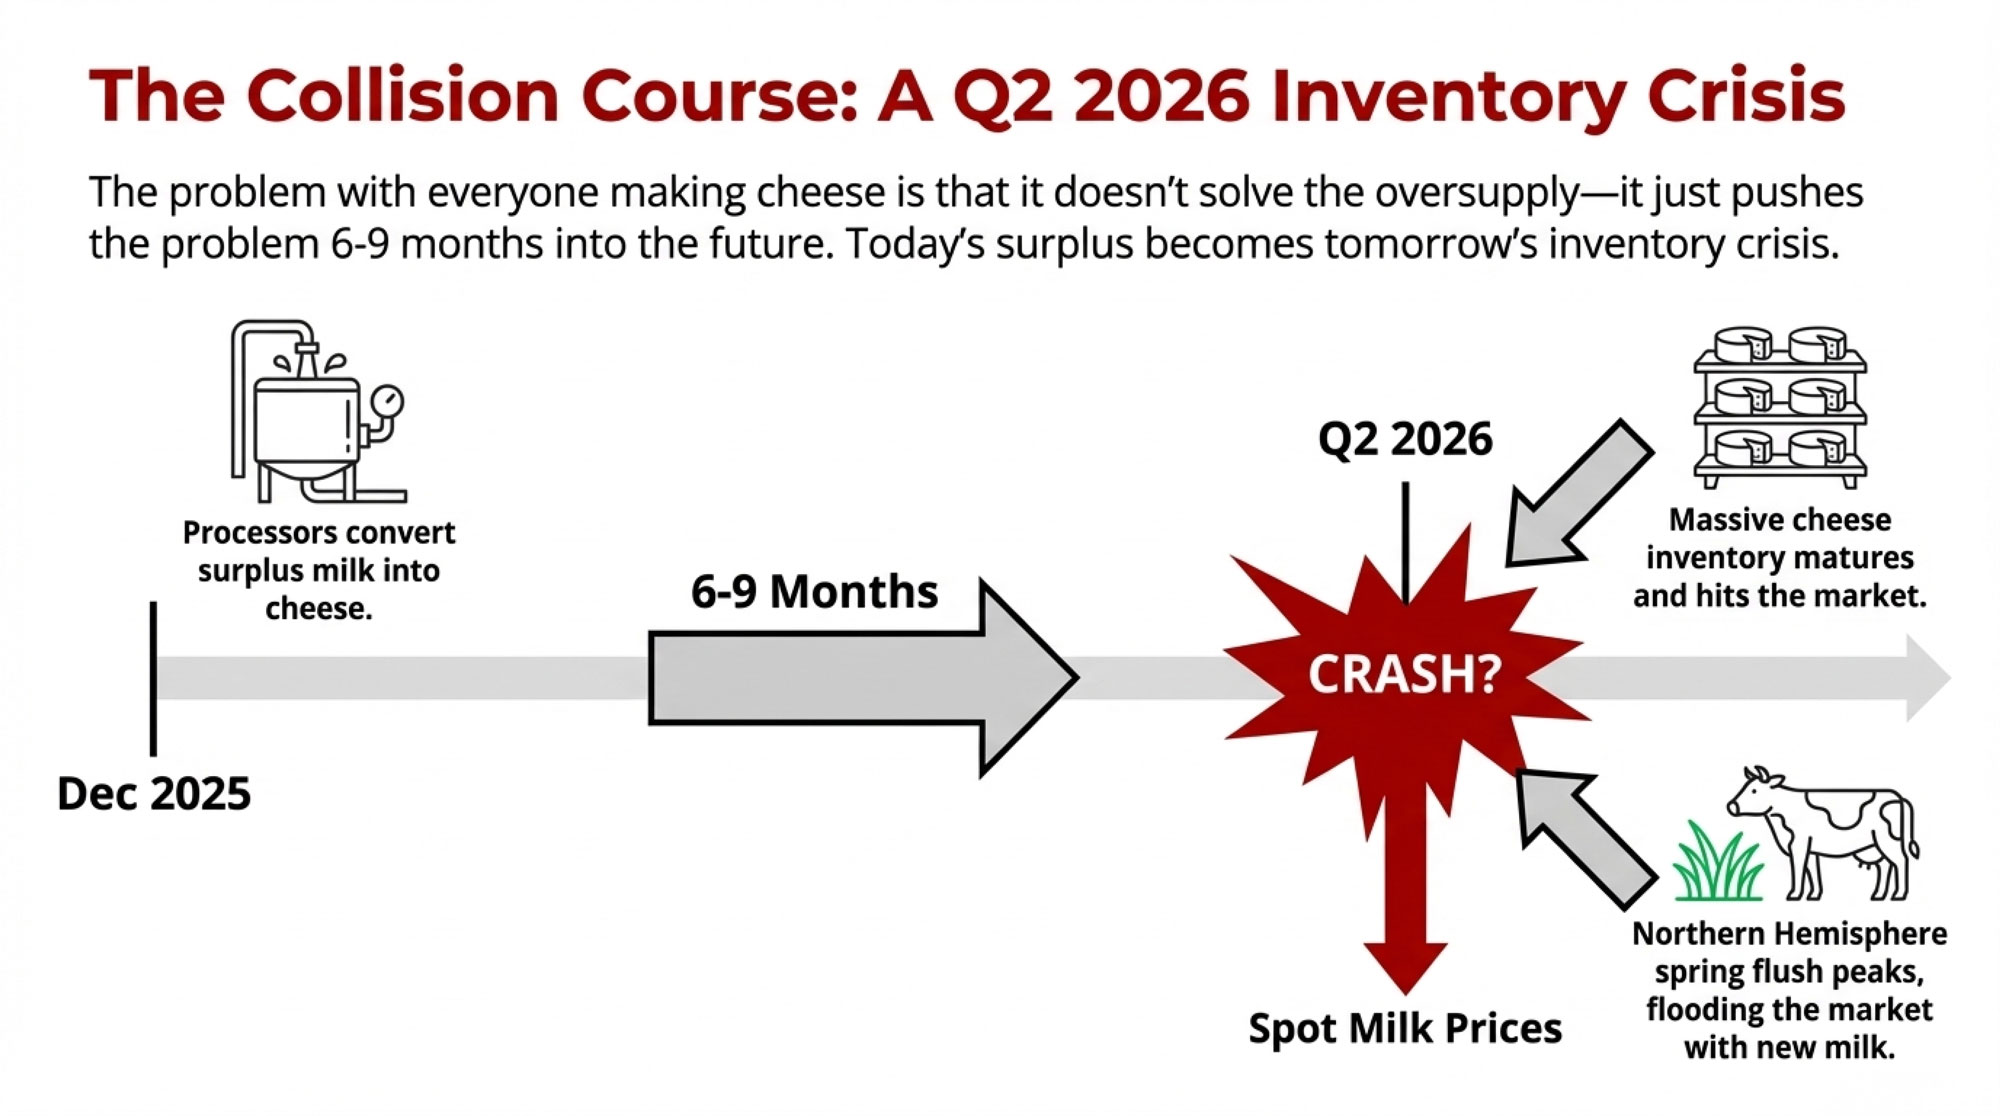
The complication is that when processors in the U.S., UK, and EU all make the same decision simultaneously, they shift oversupply in time and concentrate it into a single product category.
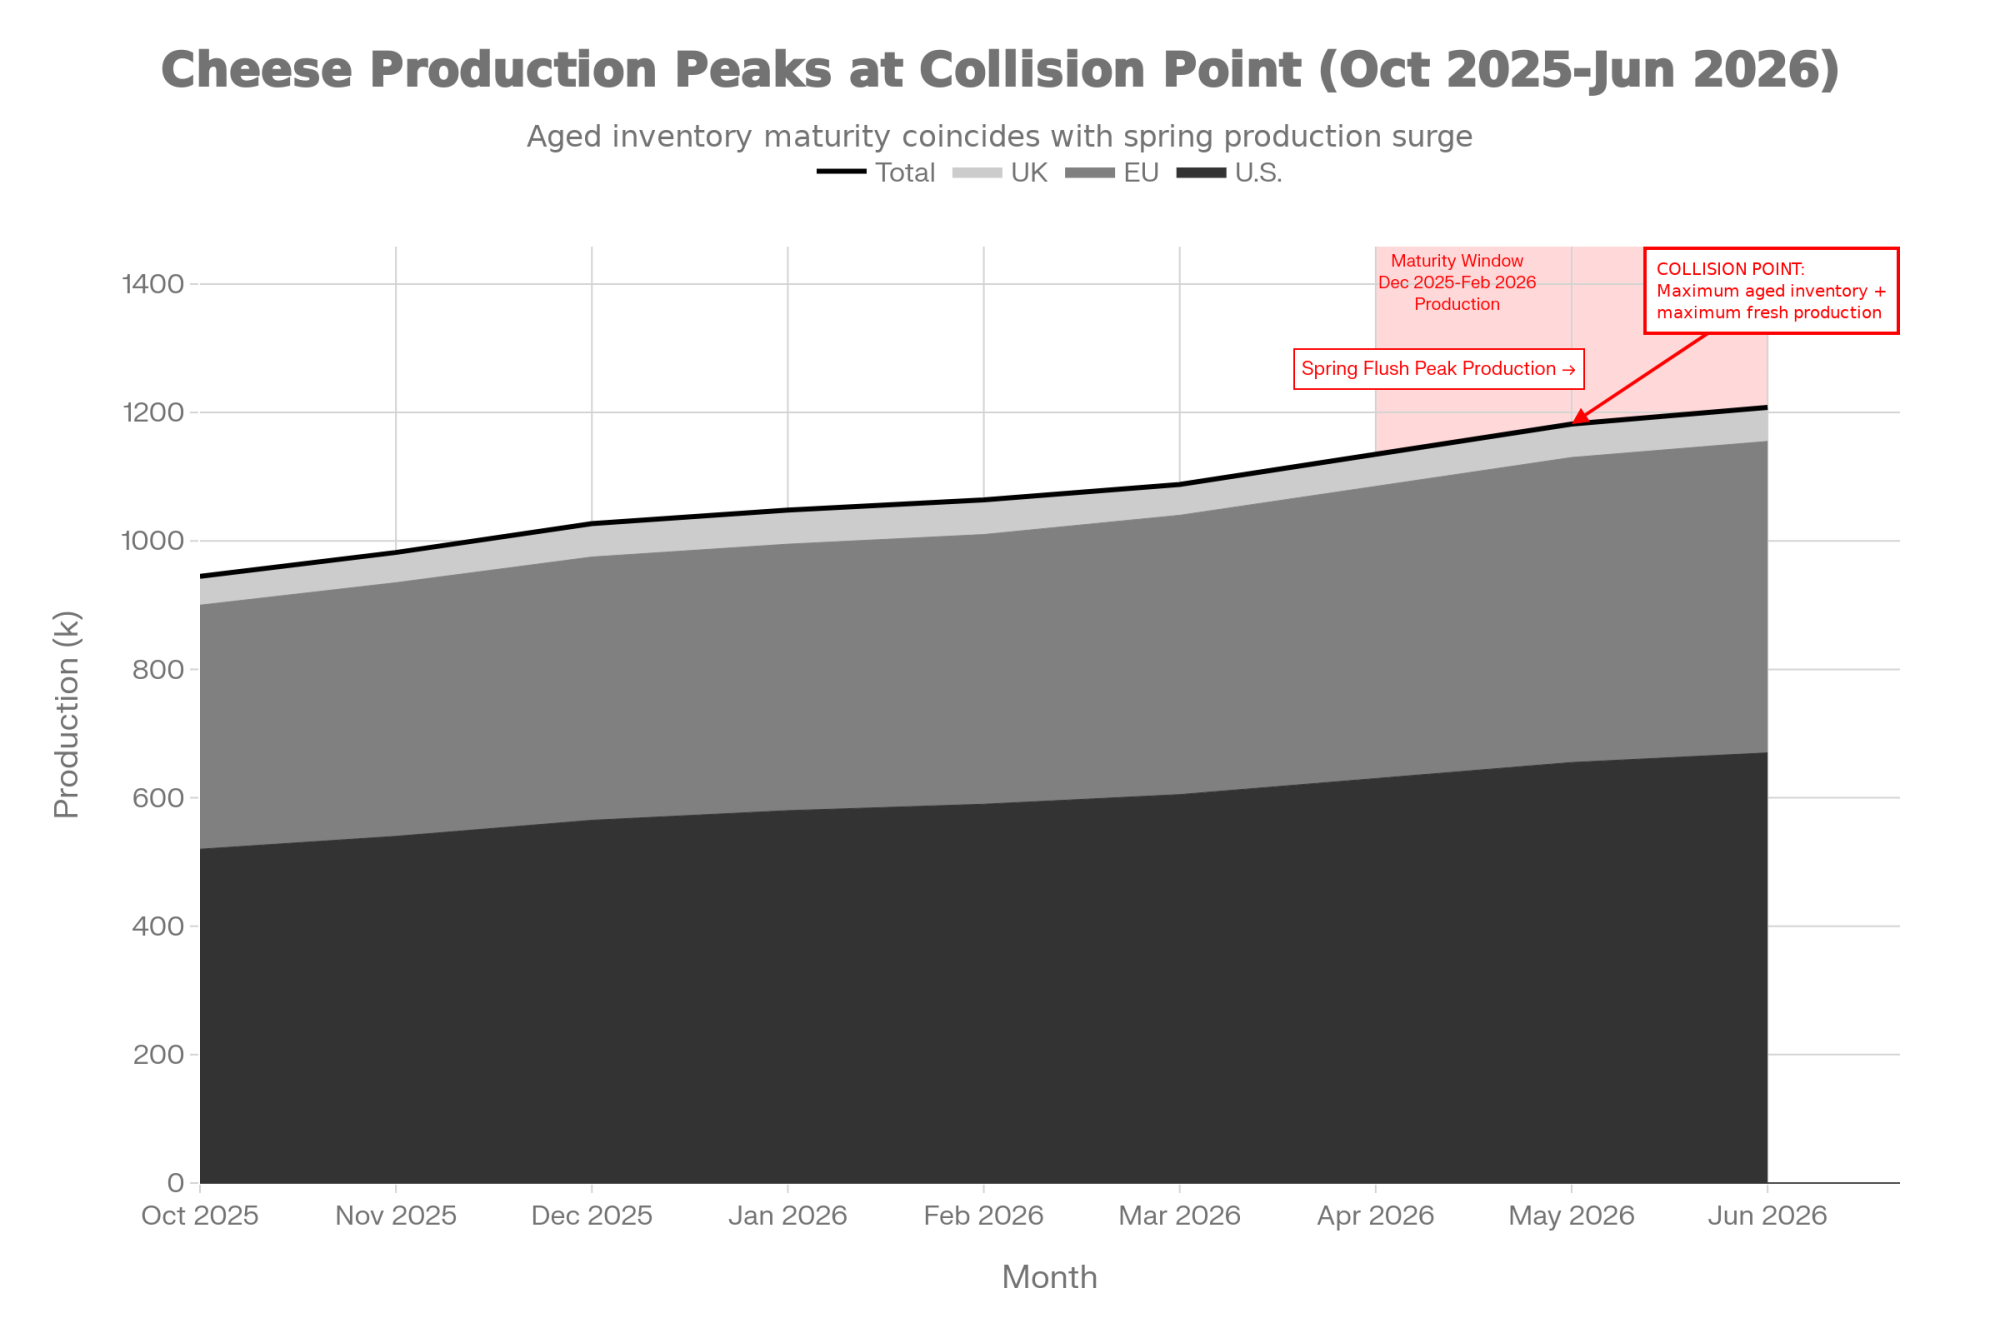
All that cheese being produced right now in December 2025 will mature and need to move to market in mid-2026—right around the time the Northern Hemisphere spring flush begins, bringing another seasonal surge in milk production. If export warehouses in key markets like Mexico and Australia are already well-stocked from late 2025’s record shipments, buyer demand could slow just as supply peaks.
Month
U.S. Cheese Production
EU Cheese Production
UK Cheese Production
Total Industry Production
Oct 2025
520
380
45
945
Nov 2025
540
395
47
982
Dec 2025
565
410
52
1,027
Jan 2026
580
415
53
1,048
Feb 2026
590
420
54
1,064
Mar 2026
605
435
48
1,088
Apr 2026
630
455
50
1,135
May 2026
655
475
52
1,182
Jun 2026
670
485
53
1,208
This creates what you might call borrowed demand—the cheese you’re making today to avoid the butter price collapse will need to clear the market in six months. If prices haven’t recovered by then, given the volume being produced across multiple regions, you’ve delayed the problem and possibly intensified it by concentrating everyone’s surplus into the same product at the same maturity window.
What Futures Markets Are Signaling
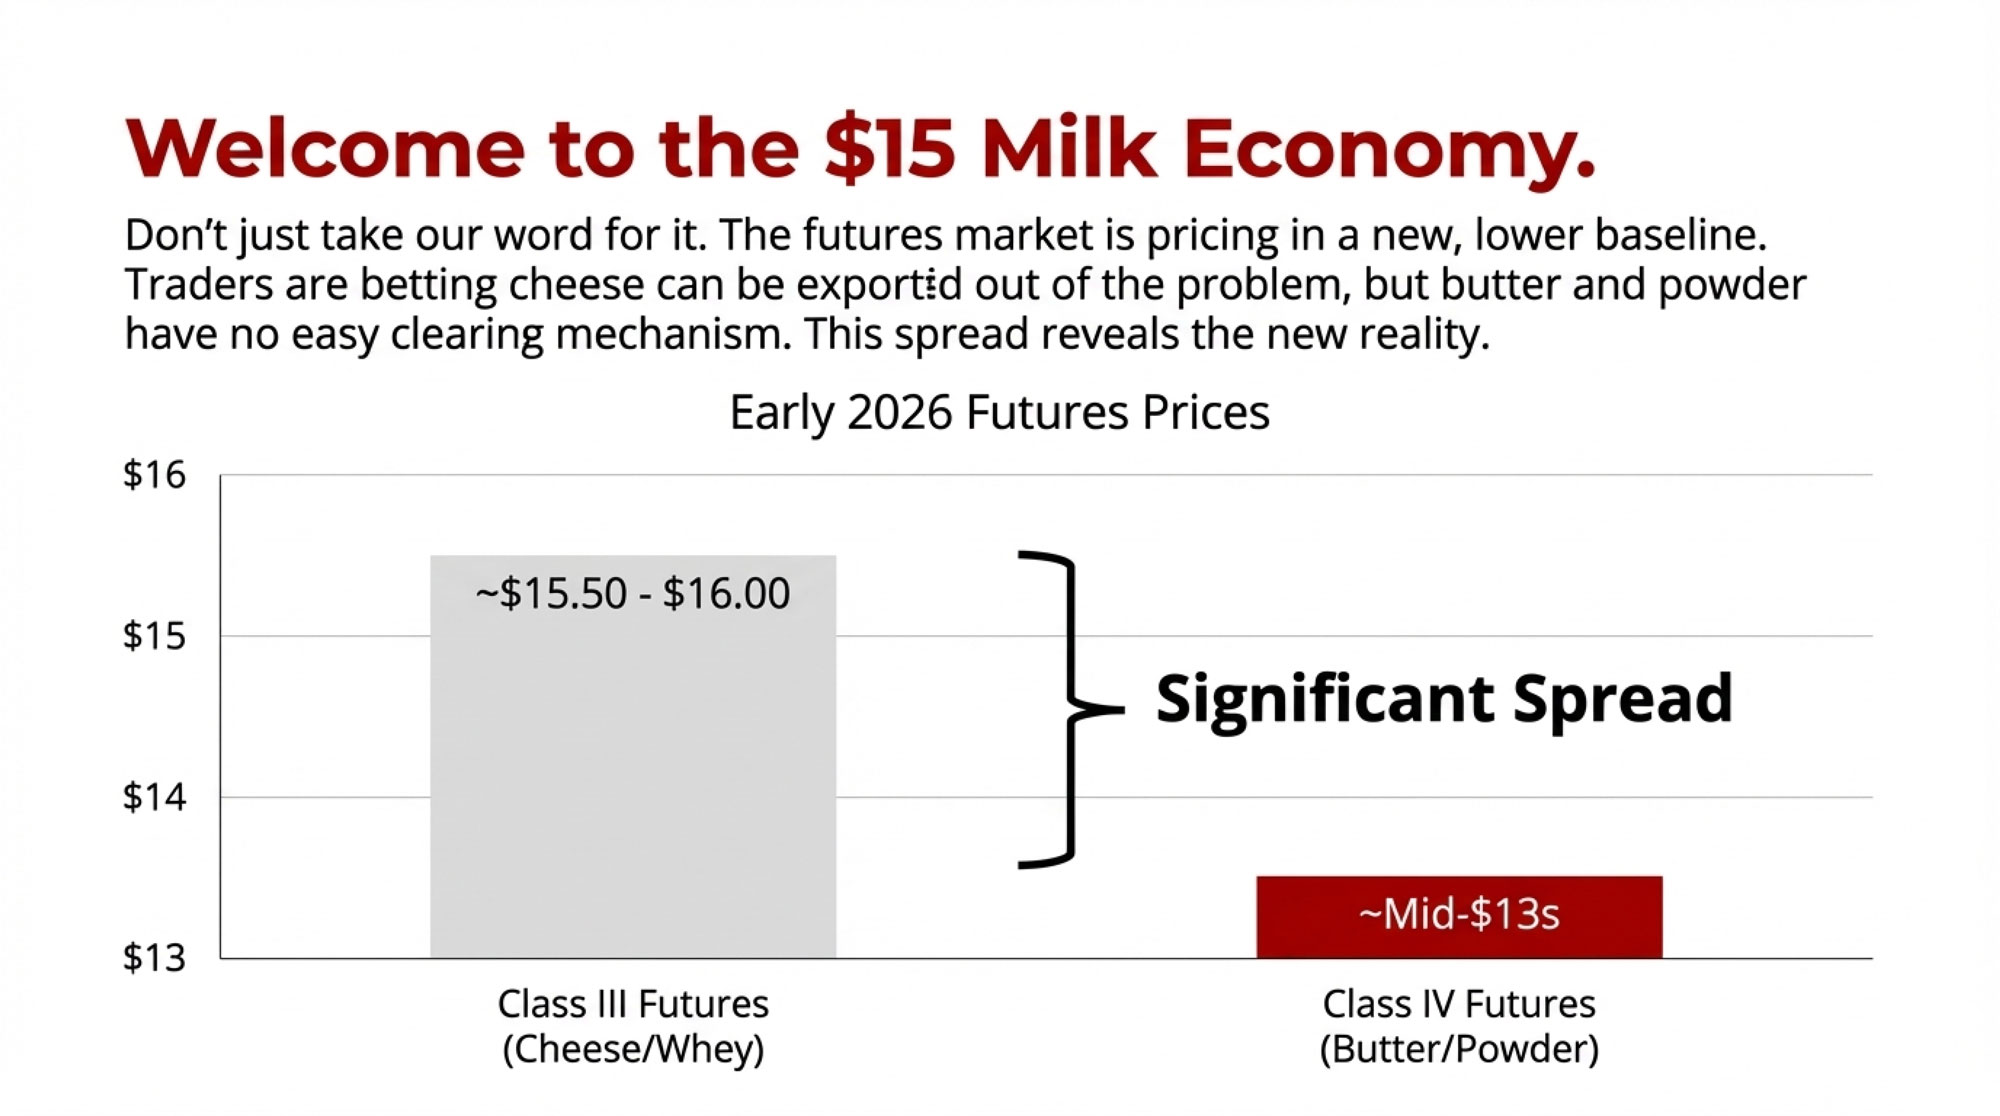
Despite the physical market’s weakness, there’s a notable divergence in how futures markets are pricing the outlook for different milk classes, and it’s worth understanding what that spread reveals about traders’ expectations.
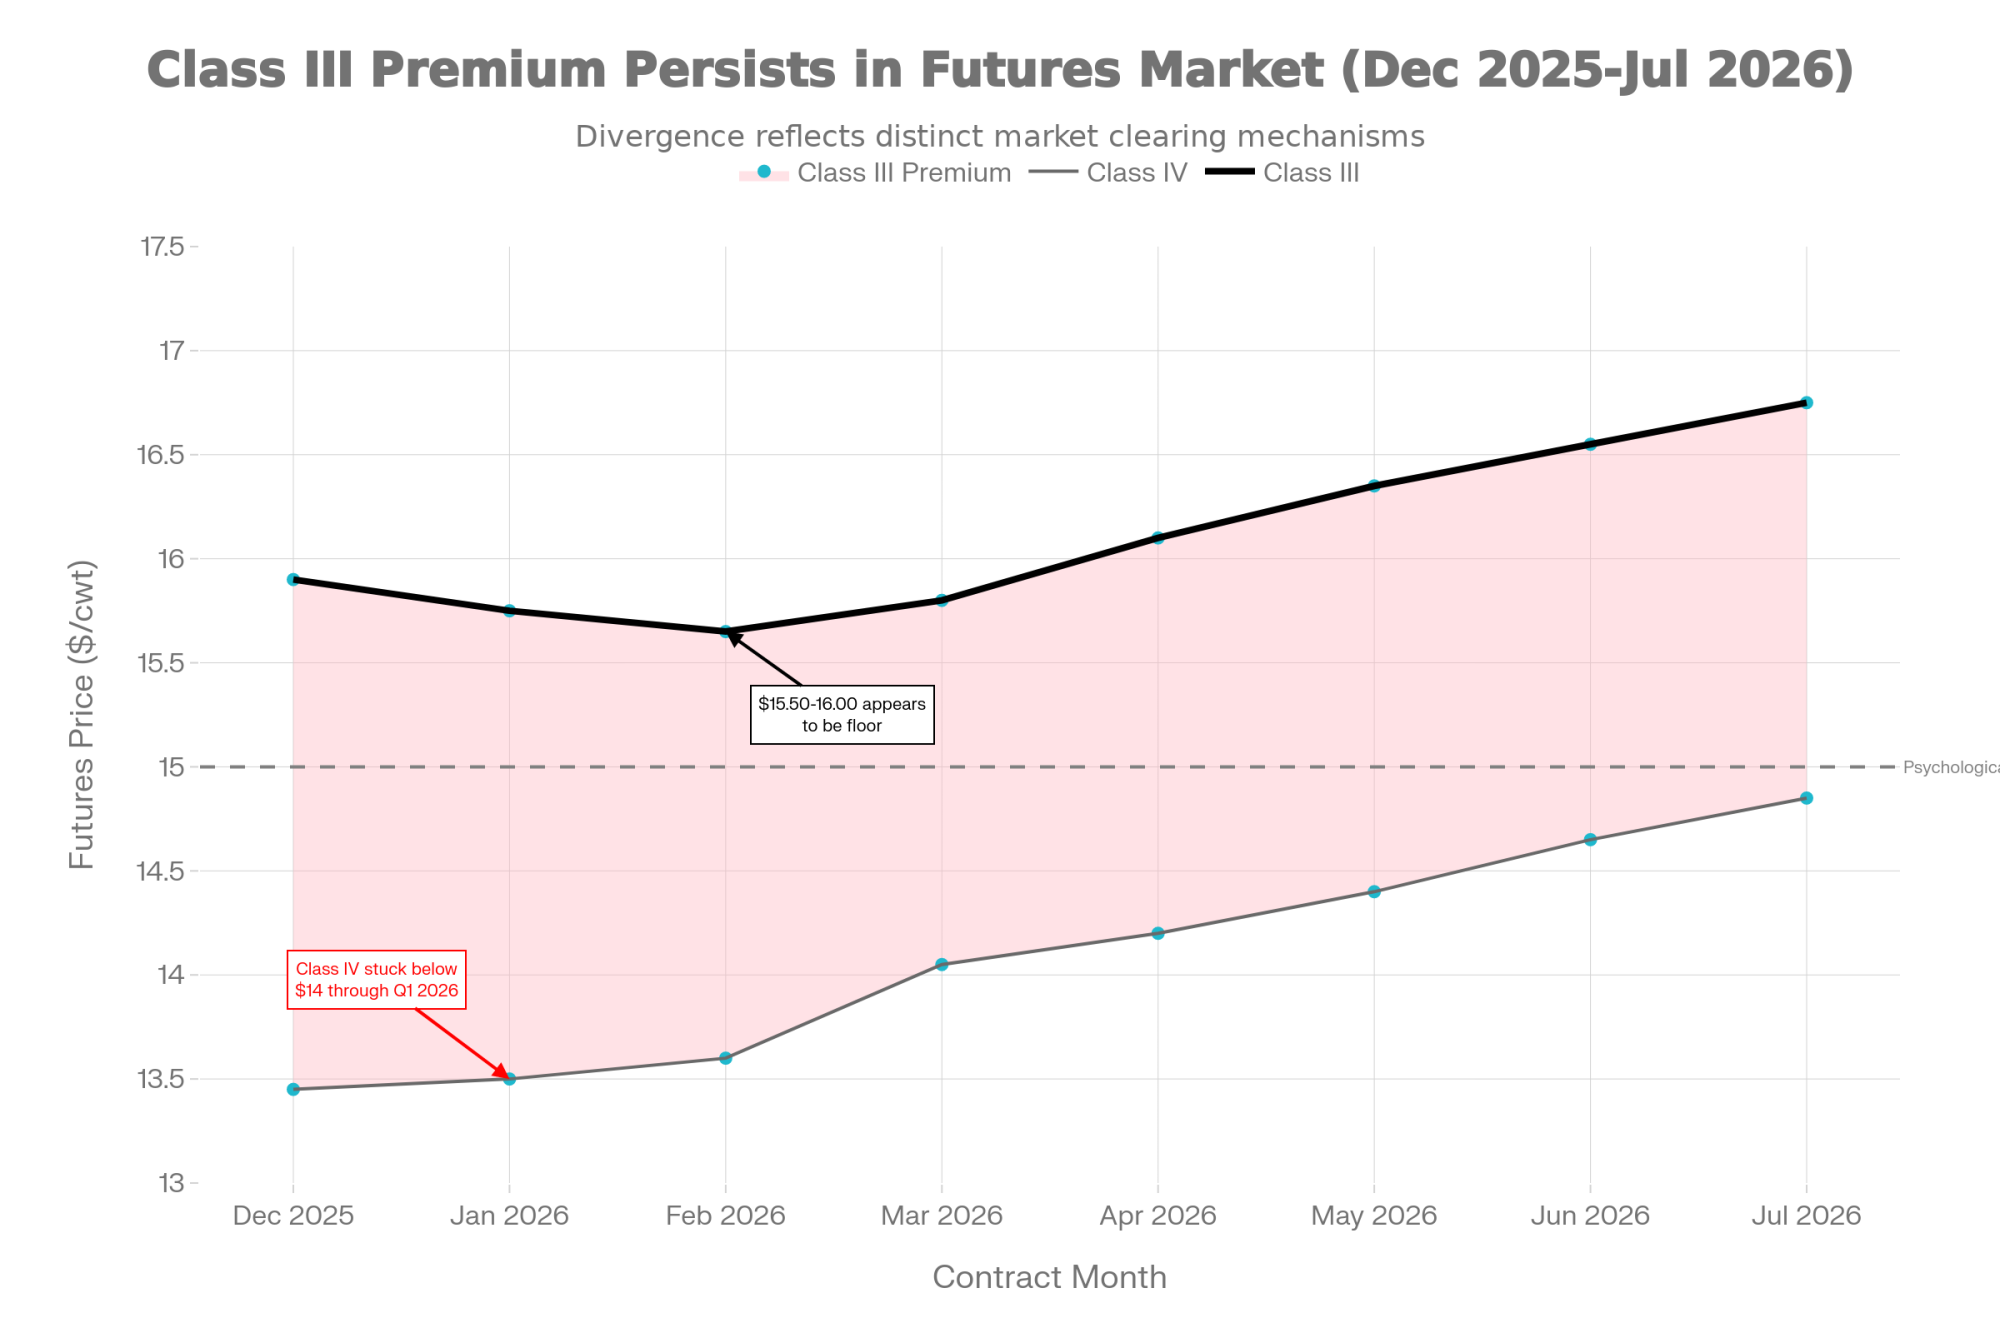
CME Class III futures for December 2025 fell 12 cents during the week to settle at $15.90 per hundredweight. But deferred 2026 contracts showed some resilience. The market seems to be betting that somewhere around the $15.50-16.00 range represents something close to a floor—that at these levels, demand will kick in enough and production will slow enough to stabilize things.
Class IV futures—driven by butter and nonfat dry milk prices—remain stuck in the mid-$13s through early 2026. The futures curve doesn’t show Class IV climbing above $14 until March at the earliest.
This spread reveals how traders are thinking about clearing mechanisms for different product categories. They’re betting that cheese can be cleared through aggressive export pricing, despite concerns about inventory. The record U.S. shipment volumes support that view. But they see no similar clearing mechanism for butter and powder, where domestic consumption is relatively fixed, and export competition from New Zealand and Europe remains intense.
Month
Class III Futures
Class IV Futures
Dec 2025
$15.90
$13.45
Jan 2026
$15.75
$13.50
Feb 2026
$15.65
$13.60
Mar 2026
$15.80
$14.05
Apr 2026
$16.10
$14.20
May 2026
$16.35
$14.40
Jun 2026
$16.55
$14.65
Jul 2026
$16.75
$14.85
Another factor supporting Class III that is often overlooked is the relative strength in the dry whey market. While butter and cheese prices are under serious pressure, whey is showing some resilience. The EU weekly quotation showed whey firming €15 to €989 per tonne, now up 12.6% year-over-year—making it the only major dairy commodity showing positive year-over-year performance in European markets. U.S. whey powder exports jumped 8.3% in September, with strong sales to China and Vietnam.
Because the Class III formula includes both cheese and whey components—specifically cheese price times 9.6 plus whey price times 5.9—the strength in whey provides a mathematical floor that Class IV doesn’t have. Even if cheese prices stay depressed, firm whey values help support the overall Class III calculation.
The question is whether futures traders are correctly assessing the inventory risk. If those strong cheese export numbers reflect stockpiling by buyers taking advantage of low prices rather than genuine ongoing consumption demand, then the apparent clearing mechanism could weaken in Q2 2026, just when the spring flush and all that aged cheese hit the market simultaneously.
The Feed Cost Variable Worth Watching
While most market signals point toward continued pressure through early 2026, there’s one variable that could shift the equation, and it’s worth keeping on your radar: what happens in grain markets.
The current dairy situation is enabled by historically low corn and soybean meal prices. As long as those input costs stay depressed, the income-over-feed-cost margins for many operations remain positive enough to justify maintaining production even with low milk prices.
But grain markets can turn quickly. The USDA is forecasting massive corn ending stocks, but those projections assume reasonably normal weather conditions. If drought develops in Brazil or Argentina during their growing season—December through March—grain prices could spike. The soybean complex, in particular, is trading with skepticism about Chinese demand. U.S. commitments to export soybeans through early November were running 40% lower than the prior year.
If China steps back into the market aggressively, or if South American weather turns problematic, soybean meal could rally from current levels near $300 per ton to $350 or higher fairly quickly. That kind of move would change the feed cost equation that’s currently supporting milk production despite low prices.
A grain rally might trigger a supply response driven by economics rather than operational necessity. If feed costs spike while milk prices stay low, you’d see the cull rate accelerate. That would tighten milk supplies before the spring flush, which might prevent some of the more challenging scenarios being discussed for Q2.
The complication, of course, is that this kind of adjustment through higher input costs isn’t exactly a rescue—it would address the oversupply by further pressuring margins. But it might be one of the few mechanisms left that can trigger a meaningful supply response.
Looking Ahead to Spring 2026
As we look toward the next few months, there are several scenarios worth considering, and I think it’s important to think through both the optimistic case and the more challenging possibilities.
The optimistic case would be that export demand continues absorbing U.S. cheese at roughly current volumes, European production contracts modestly as various forecasts suggest, New Zealand’s season ends normally, and the market finds a new equilibrium at these lower price levels without major disruption. Farmers who can operate profitably at Class III in the $15-16 range continue; those who can’t gradually exit through normal business cycles. It’s a slow grind, but it avoids a crisis.
The challenge with that scenario is that it assumes multiple things align favorably simultaneously, and it doesn’t fully account for the inventory dynamics building in the cheese complex.
A more complete assessment acknowledges that we’re heading into Q2 2026 with several risk factors converging. The spring flush will bring seasonal increases in production—that’s biology; you can’t avoid it. Cheese produced in late 2025 and early 2026 will be maturing and needing to move to market. And if export warehouses in key markets are already well-stocked from late 2025’s record shipments, buyer demand could slow as supply peaks.
In that scenario, cold storage space becomes a limiting factor. Processors would face pressure to either move product into lower-value channels—such as converting aged cheese into processed cheese ingredients—or implement supply management measures. Spot milk prices could come under significant pressure in some regions.
Whether these dynamics develop into a more serious situation depends on variables we can’t yet fully predict—export demand patterns, weather affecting production, and policy responses. But the risk is substantial enough that operations should plan for various scenarios rather than assume conditions will improve on their own.
What This Means for Your Operation
So, where does all this leave us? I think there are some practical considerations worth thinking through, and they vary depending on your role in the industry.
For Producers:
The evidence suggests we’ve moved beyond a typical cyclical downturn. Relying on historical price recovery patterns to guide current decision-making carries real risk.
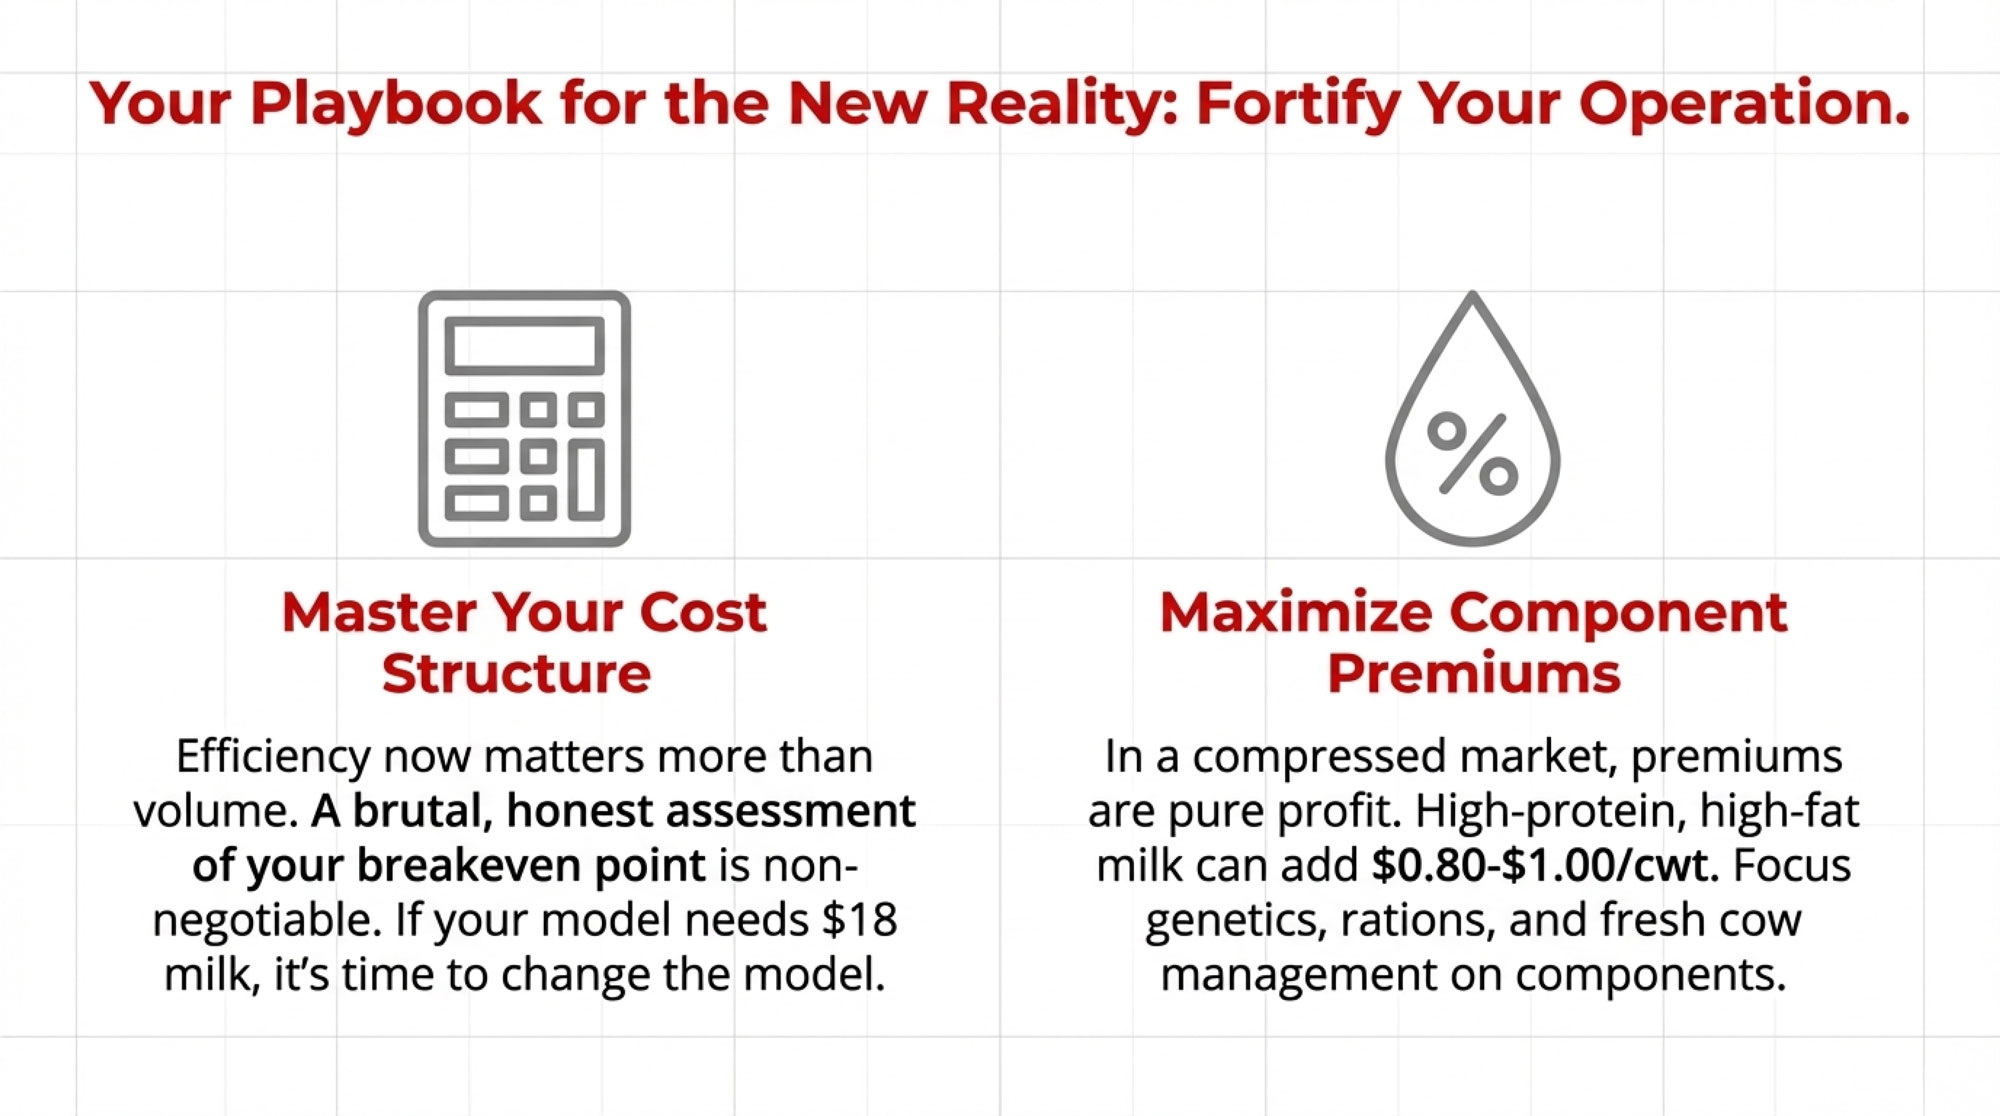
The most important focus right now is cost structure. In a market where establishing a lower baseline price, efficiency matters more than production volume. A realistic assessment of your operation’s true breakeven point is critical. If your business model requires $18-19 milk to be profitable, fundamental changes may be necessary because the market is signaling that $15-16 could be the range for extended periods.
Component quality is becoming increasingly important in compressed markets. When commodity prices are under pressure, the premiums for high-protein, high-fat milk become proportionally more valuable. Fresh cow management, ration formulation, and genetic selection decisions that maximize components—all of this can add meaningful value when the base price is low. I’ve seen operations in the Upper Midwest boost their component checks by 80 cents to a dollar per hundredweight through focused attention to butterfat and protein levels, and that differential matters more than ever in this environment.
Focus fresh cow management; optimize rations for fat/protein; select genetics for components
Add $0.80-1.20/cwt to milk check
High Priority
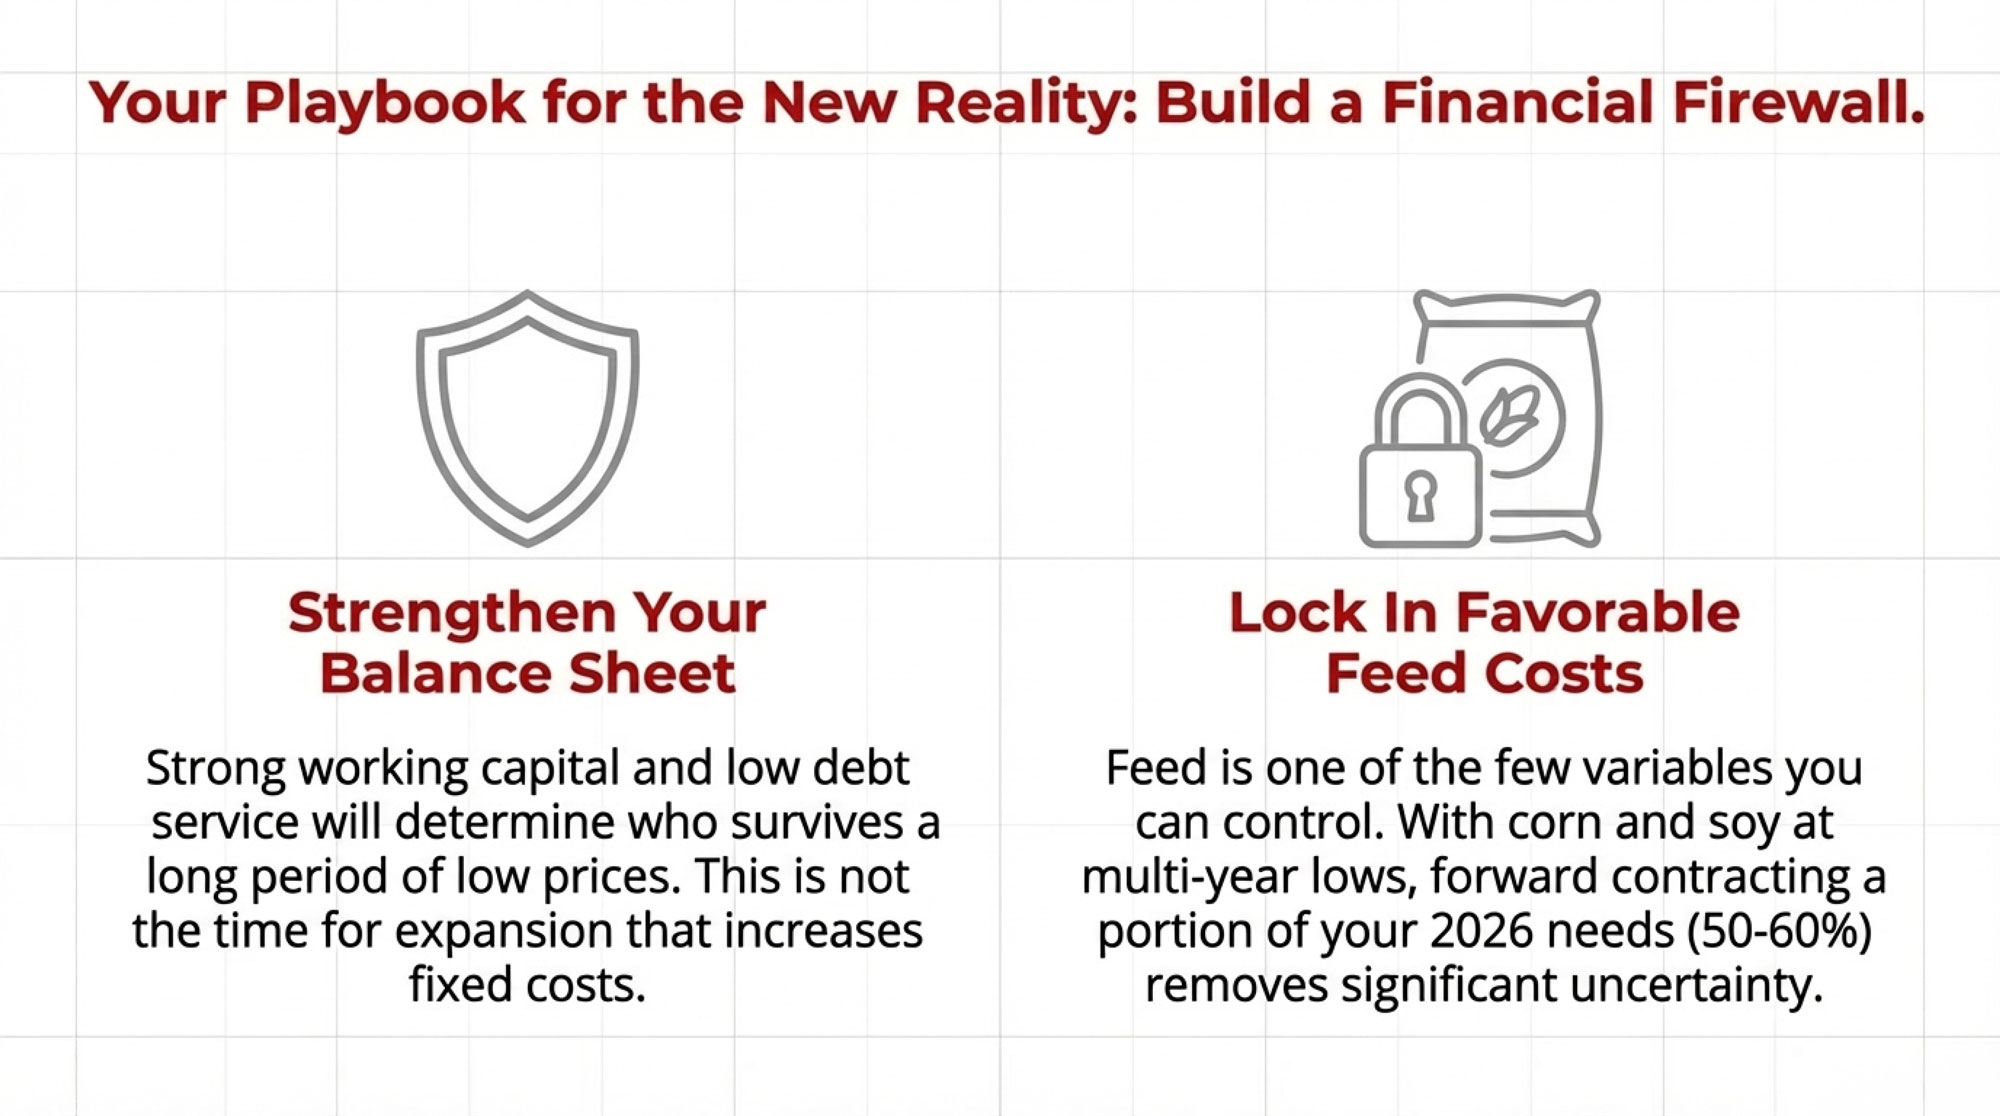
Balance Sheet Resilience
Build working capital reserves; defer non-critical capital projects; restructure high-interest debt
Survive 6-12 months low prices
Critical Action
Feed Cost Management
Forward contract 50-60% of corn/soy needs through summer 2026 at current lows ($4.40 corn)
Lock controllable cost advantage
High Priority
Risk Management Tools
Implement Dairy Revenue Protection or LGM; set minimum price floors for Q2-Q3 2026
Protect against worse-case scenarios
Recommended
Balance sheet resilience will be critical heading into 2026. Operations with stronger working capital and lower debt service obligations will be better positioned to navigate extended low prices. This may not be the optimal time for major expansion projects or capital spending that increases fixed costs. I know that’s difficult advice when you’ve got planned improvements or a son or daughter wanting to come back to the farm, but timing matters.
Feed cost management deserves attention. With corn and soybean meal at multi-year lows, locking in favorable input costs for at least a portion of needs provides one of the few controllable variables in the current environment. Even partial coverage—50-60% of expected needs—can provide meaningful protection if grain markets rally. Some Northeast operations I’m familiar with are forward contracting corn through summer 2026 to remove at least that uncertainty from their planning.
For Processors:
Inventory management has moved from routine practice to strategic necessity. The industry-wide shift toward cheese production requires realistic planning for when and where that inventory will clear. Frank conversations with customers about forward commitments and careful evaluation of speculative inventory positions are warranted, given uncertainty about the timing of price recovery.
Export channel diversification matters more in volatile markets. Heavy reliance on one or two markets—particularly those that may be engaging in stockpiling rather than steady consumption—creates vulnerability if buying patterns shift.
Processing flexibility offers strategic advantages. Assets that can shift between products as market conditions change provide more options than single-purpose facilities in volatile environments. I recognize that’s easier said than done when you’ve got specialized equipment and a trained workforce, but it’s worth considering in future capital planning.
For the Broader Industry:
The synchronized weakness across global markets raises questions about coordination and supply discipline. Without mechanisms to better align supply with realistic demand expectations, these boom-bust cycles may become more frequent and severe. This doesn’t necessarily mean government intervention, but it might involve processors implementing more structured base-excess programs or cooperatives taking stronger action to manage supply.
Export infrastructure and market development will become increasingly critical if the U.S. continues to position itself as a large-scale global supplier. This means sustained investment in logistics, market access, technical assistance to importing countries, and trade relationships that can reliably absorb substantial volumes.
Better market intelligence and information sharing could help prevent simultaneous strategic pivots that amplify imbalances. If processors in different regions had better visibility into global production decisions, they might make different product-mix choices. Industry associations and market data services have a role in providing that transparency.
The Bottom Line
The week of December 15, 2025, may mark a transition point—when global dairy markets shifted from familiar cyclical volatility into something more structural and challenging to navigate.
The traditional mechanisms that historically dampened these cycles are evolving. Smaller farms that used to exit during downturns and help tighten supply represent a declining share of production. Regional markets that operated somewhat independently are increasingly interconnected and moving together. Feed costs, which tend to move inversely with milk prices and provide a natural hedge, are currently low, removing that counterbalance.
What’s emerging is a more consolidated, more efficient production system that responds to price signals differently than in previous decades. Large operations with modern facilities and low per-unit costs can remain profitable at price levels that would have historically triggered widespread exits. That’s economically efficient in many ways, but it also means markets may need to fall further and stay low longer to trigger the supply response needed to rebalance.
For all of us navigating this transition, the fundamental challenge is to build operations and business models that remain viable at these new baseline prices rather than relying on assumptions of a return to historical averages. The traditional wisdom that low prices eventually cure low prices still holds. The cure is working—you can see it in the data. But the adjustment period may be longer than in previous cycles required.
These are sending clear signals about the current supply-demand balance. The question facing every operation is how to adapt business strategies and risk management approaches to this evolving reality while maintaining the flexibility to capitalize on opportunities as they develop.
Market data referenced in this analysis comes from the European Energy Exchange (EEX), Singapore Exchange (SGX), Global Dairy Trade platform, CME Group, USDA World Agricultural Supply and Demand Estimates (WASDE), U.S. Dairy Export Council (USDEC), UK Department for Environment, Food & Rural Affairs (DEFRA), and European Commission weekly dairy quotations for the period ending December 15, 2025.
Key Takeaways:
The Export Paradox: Record U.S. cheese exports (+34.5%) met 18-month price lows as every global dairy market crashed simultaneously the week of December 15—revealing fundamental pricing mechanisms have broken.
Why Supply Won’t Self-Correct: Cheap feed ($4.40 corn, $302 soy meal) keeps income-over-feed-cost positive at $15-16 milk, preventing the production cuts that normally cure oversupply.
Q2 2026 Inventory Collision: Processors globally are shifting from butter to cheese simultaneously. This inventory matures in spring 2026, precisely when the flush hits—creating a potential crisis for spot milk prices.
This Is a Reset, Not a Cycle: Class III holding near $16 while Class IV languishes in mid-$13s signals new baseline economics. Operations must be built for sustained viability at these levels, not temporary survival.
Immediate Producer Priorities: (1) Cost structure over production volume, (2) Maximize component premiums—they matter most in compressed markets, (3) Strengthen balance sheets before spring, (4) Lock feed costs now via forward contracting.
Complete references and supporting documentation are available upon request by contacting the editorial team at editor@thebullvine.com.
Join over 30,000 successful dairy professionals who rely on Bullvine Weekly for their competitive edge. Delivered directly to your inbox each week, our exclusive industry insights help you make smarter decisions while saving precious hours every week. Never miss critical updates on milk production trends, breakthrough technologies, and profit-boosting strategies that top producers are already implementing. Subscribe now to transform your dairy operation’s efficiency and profitability—your future success is just one click away.
Are you leaving money on the table by ignoring real-time milk data? Let’s fix that.
EXECUTIVE SUMMARY: This year’s markets are forcing us to take the basics seriously. Here’s something that’ll grab your attention: just 10% better feed efficiency can add over $100 per cow annually to your bottom line. That’s real money we’re talking about, Milk yield improvements through genomic testing? You’re not just throwing darts anymore — you’re making calculated moves. Farms around the globe that’ve embraced these tools are actually squeezing out better margins despite rising feed costs. The Journal of Dairy Science and USDA data back this up. With milk prices fluctuating as they are, adapting isn’t optional anymore. To stay profitable, you need to get ahead in genetics and feed efficiency now. Don’t wait — farm profits sure won’t.
KEY TAKEAWAYS
Boost feed efficiency by 10% using precision feeding tech — that translates to $100+ extra per cow in 2025 margins. Get a feed analysis this week to spot where you’re losing money.
Leverage genomic testing to improve milk yield by up to 15% over traditional herds. Contact your breeding consultant tomorrow to discuss a tailored genetic plan.
Monitor your milk-to-feed ratio monthly — target 1.8 or above to protect margins when prices get volatile. Track this through your DHI reports starting now.
Stay ahead of export demand by adjusting production to seasonal swings. Review USDA export data quarterly so you’re not caught off guard.
Apply for those Dairy Business Innovation Alliance grants — up to $100K for efficiency projects that pay back in 1-2 years. Begin your application this month if you haven’t already started. The bottom line? Markets are rewarding the prepared and punishing those who wait. These aren’t just nice-to-have improvements anymore — they’re survival tools for 2025 and beyond.
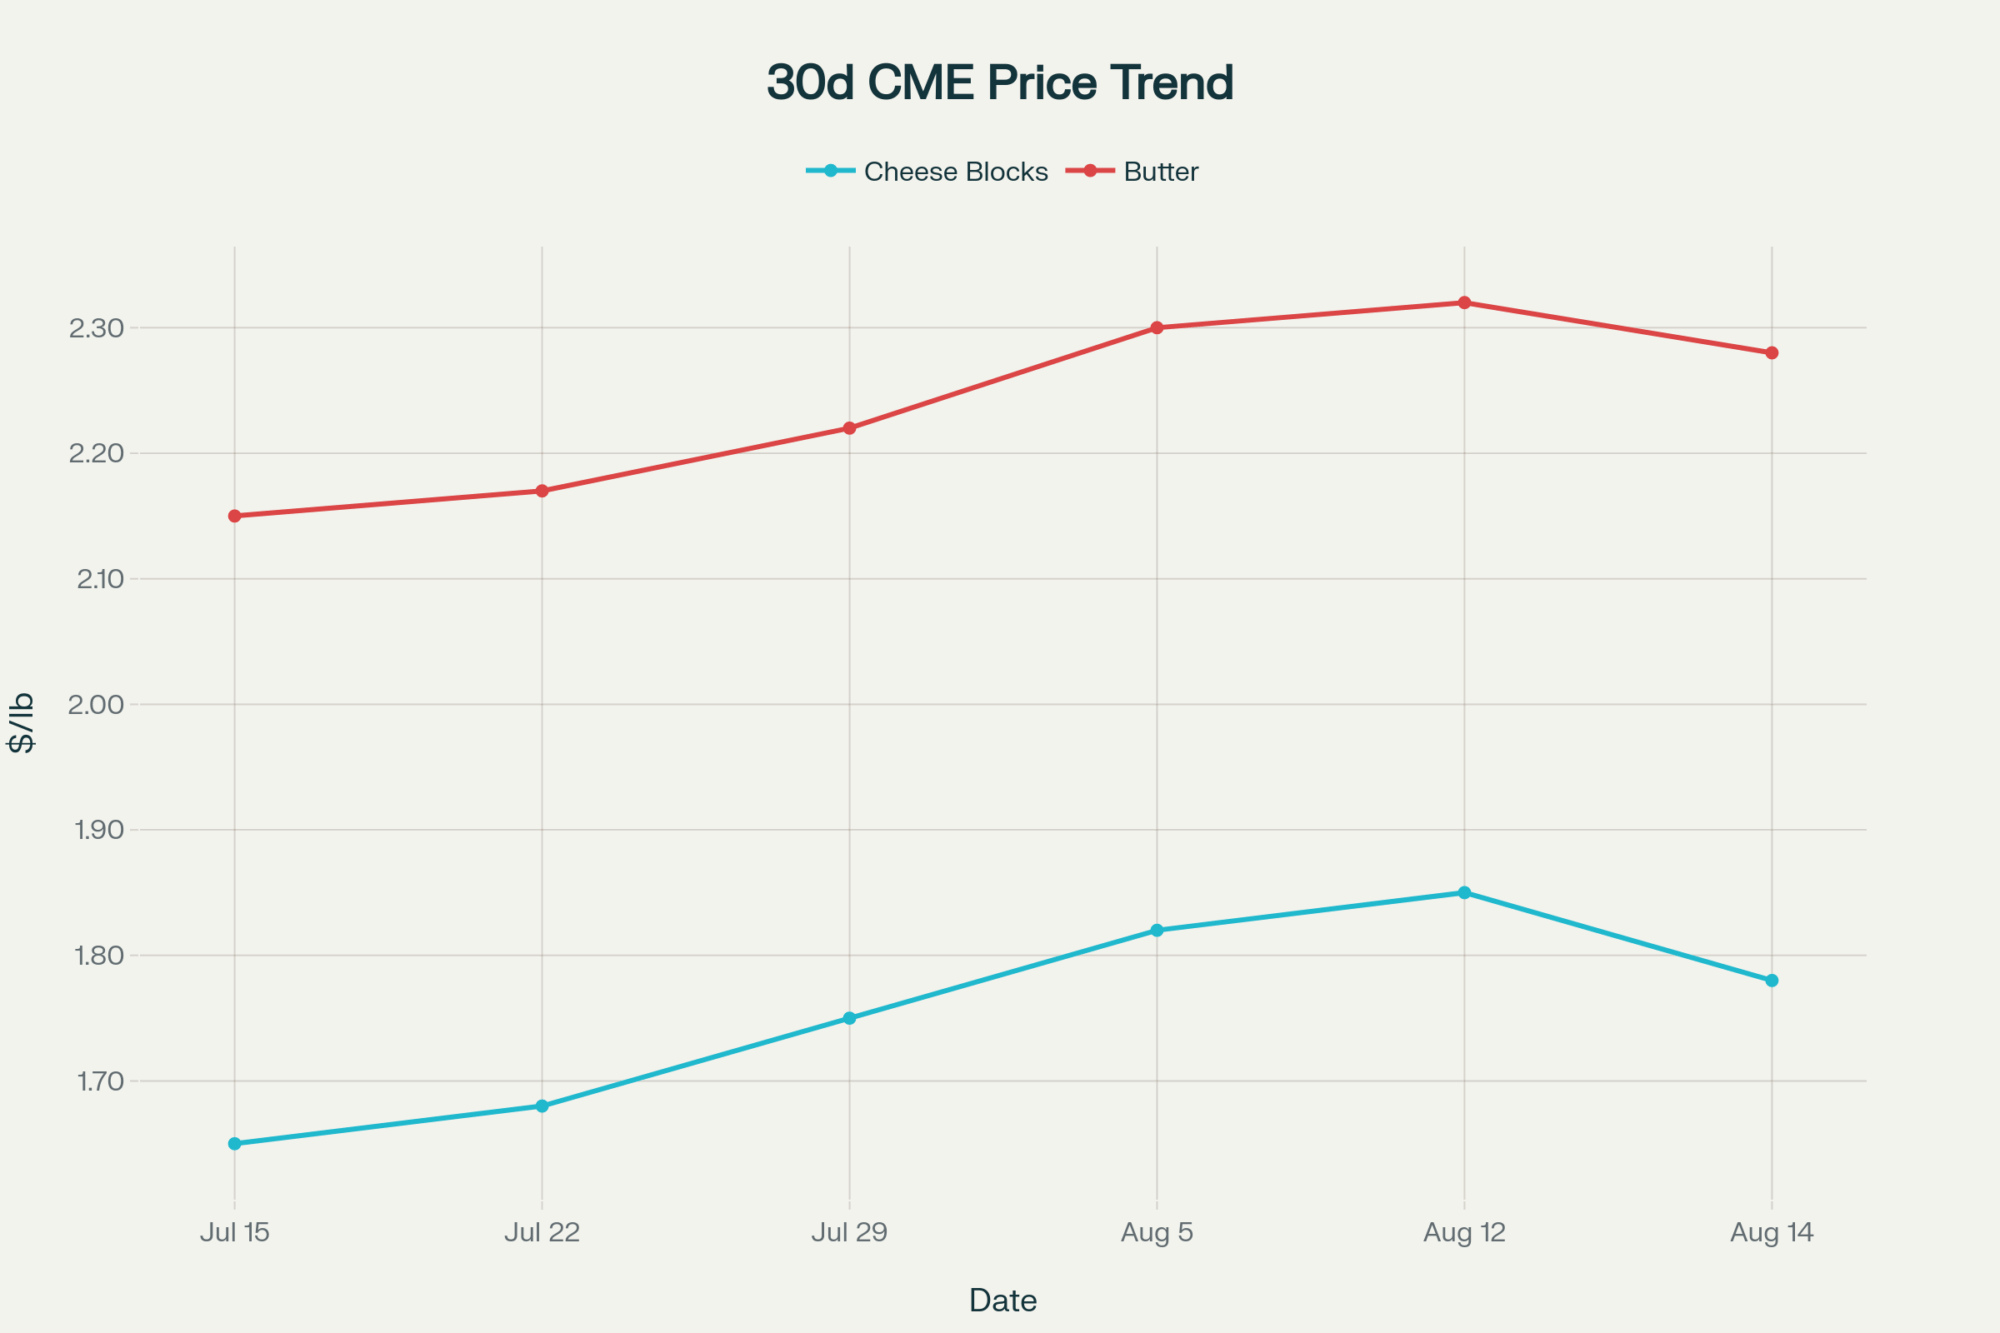
The thing about today’s cheese market moves? They’ve shaken up what was shaping up to be a pretty steady run for Class III prices this summer. Cheese blocks? They dropped 10¢, slicing through the optimism like a wire through butterfat. Moments like this get your attention fast — especially when you’re counting every cent on the farm.
But butter? Butter’s steady, hanging in there even though the weekly numbers show some softness creeping in. What strikes me is how exports keep bolstering these prices — like a sturdy fence you can lean on when the wind howls. Lock in those profits when you can, especially on cheese, because these swings aren’t waiting around.
Let’s get real with the numbers farmers actually care about — none of that finance jargon that’ll put you to sleep.
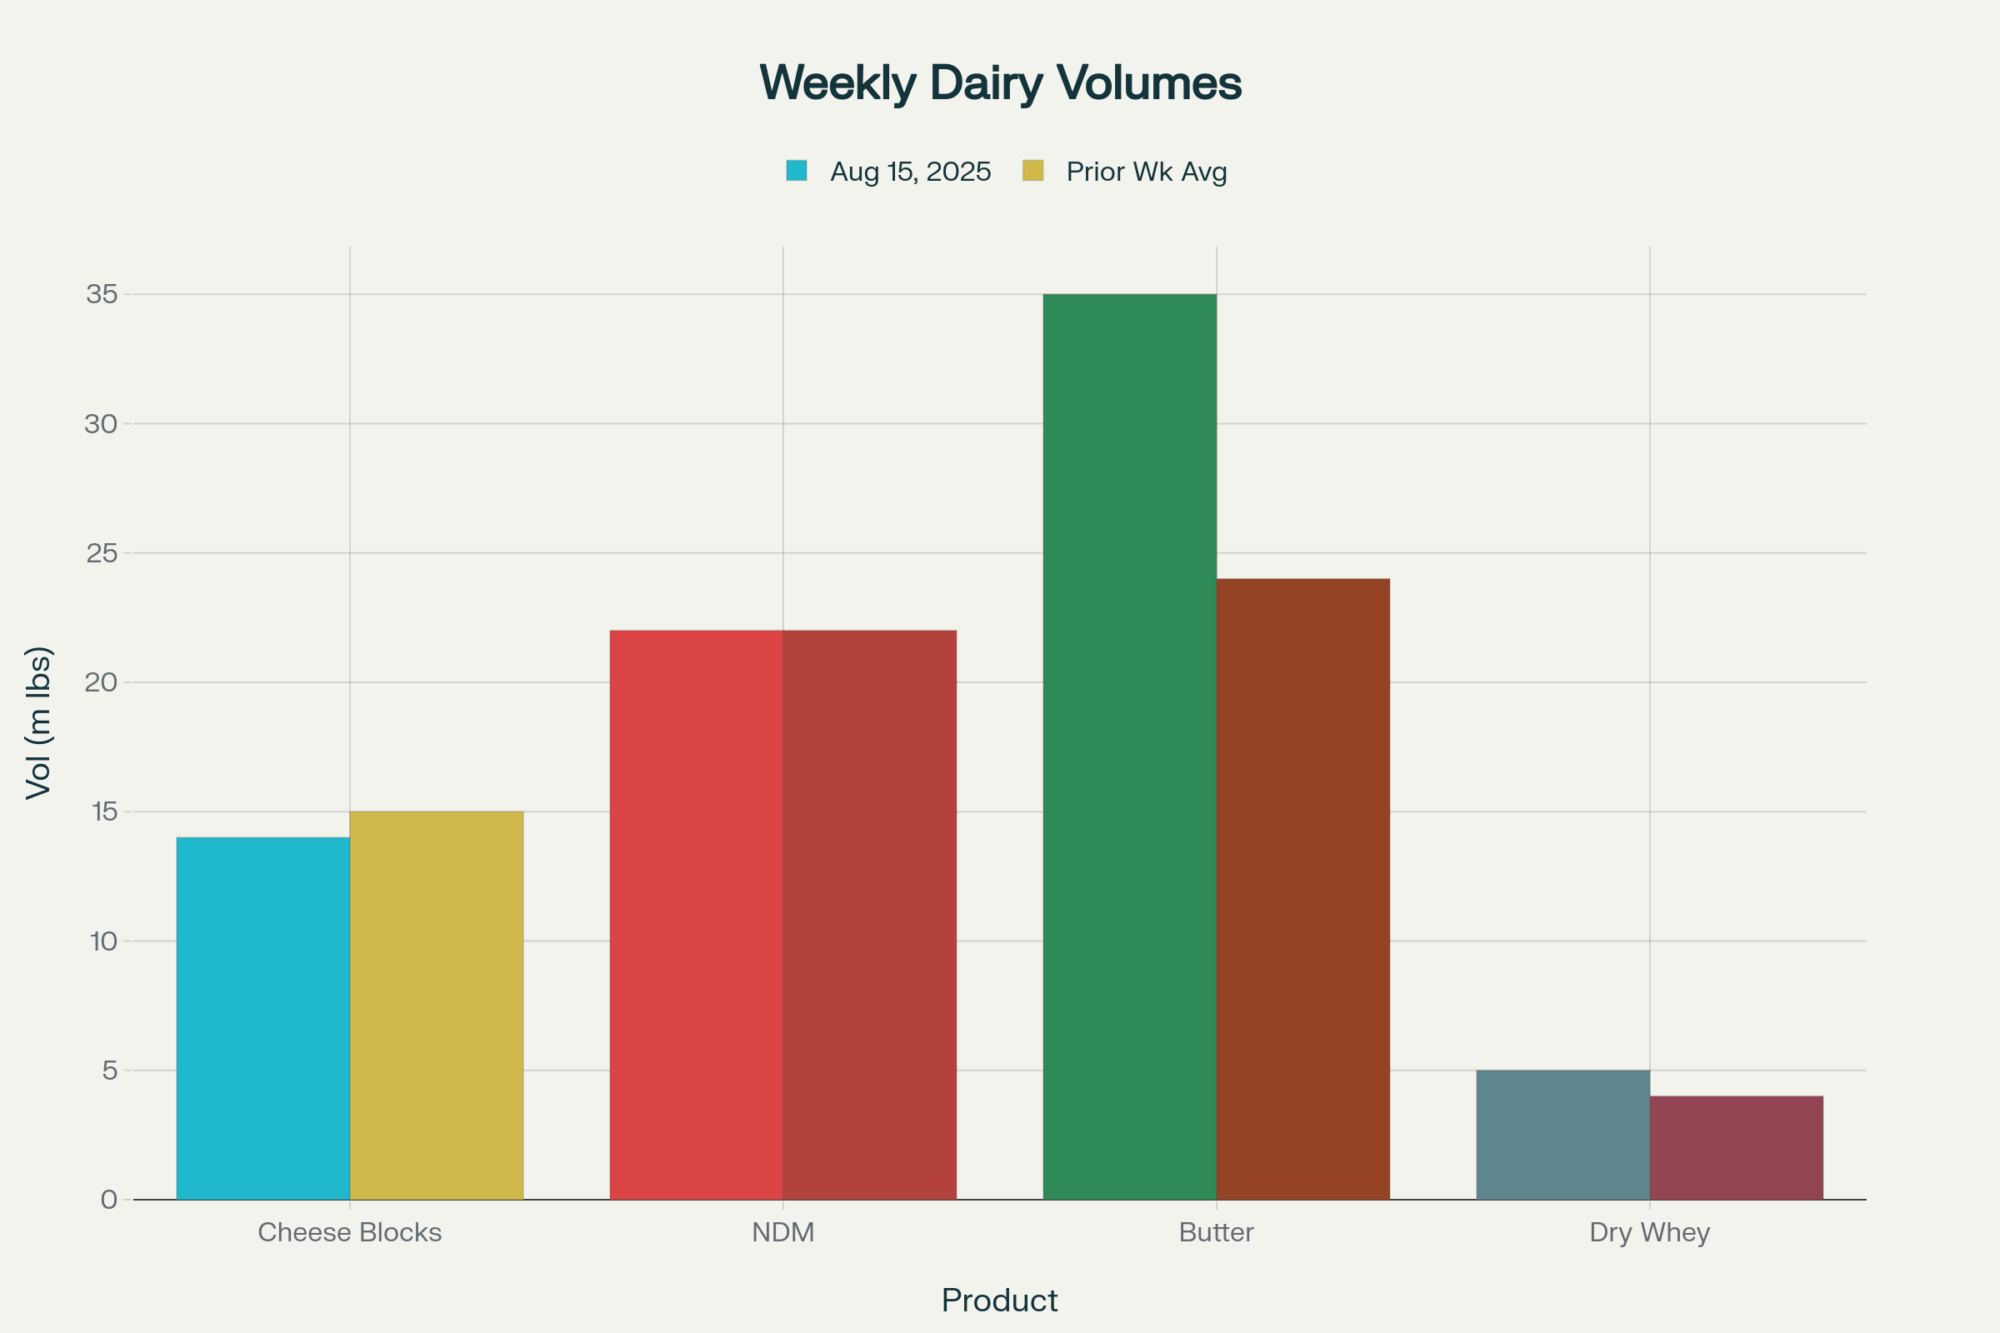
Weekly volume comparison for key CME dairy products, week ending August 15, 2025
Market Snapshot & What It Means to Your Farm
Product
Price
Change
Weekly Trend
Farm Impact
Cheese Blocks
$1.78/lb
-10¢
+2.1%
Today’s drop could reduce your milk checks by about 60¢/cwt, based on the latest Class III formula weightings.
Cheese Barrels
$1.83/lb
-4¢
+2.9%
A softer drop here, but just as much a signal of jitters.
Butter
$2.28/lb
Unchanged
-4.8%
Standing firm for now, though weekly softness rings alarms for Class IV pricing.
NDM Grade A
$1.26/lb
-0.5¢
-1.4%
Steady as the export bookings hold strong.
Dry Whey
$0.60/lb
-1¢
+5.6%
Minor pullback, but the weekly trend says it’s riding high.
Here’s what’s interesting: while cheese blocks saw a gain earlier this week, padding that weekly climb to 2.1%, today’s sharp 10-cent pullback feels like the market taking a breath — a sprint, then a pause, if you will. Real markets don’t operate in a straight line.
That late-day selling? Probably some profit-taking and hedging ahead of reports. Only a handful of loads changed hands, but that’s enough to send a signal.
Butter has been more active this week, a sign that exports are still fueling interest. Cheese? Traders are a little more hesitant.
30-Day Price Trends: Cheese and Butter
This shows the gradual rise with today’s bump downward — a sign the market’s keeping everyone on their toes.
How Are We Doing Globally?
No matter how tight things look here, it’s a global market. Our butter prices are about a dollar cheaper than those in Europe and New Zealand, and NDM prices are comparable. That helps us stay competitive on exports — the lifeblood of our market.
Product
U.S. Price
Europe Price
New Zealand Price
Butter
$2.28/lb
~$3.20/lb
~$3.29/lb
NDM
$1.26/lb
~$1.08/lb
~$1.26/lb
California farms face higher feed and energy costs — an extra 15 to 25 cents per cwt — because water’s expensive and drought has tightened availability. That’s pushing folks to double down on water-saving tech and efficiency tweaks.
This August’s heatwave is another story — the Southwest’s dealing with stressed cows and chipped feed quality, which is cutting milk production there somewhat. Meanwhile, the Upper Midwest has been fortunate with timely rain, which has improved forage and sustained production.
Exports: Where The Pressure and Opportunity Meet
Exports stay strong. USDA’s Foreign Agricultural Service shows cheese shipments up roughly 25% year-over-year through June. Mexico remains a solid top customer, while Southeast Asia and the Middle East emerge as new markets. But the EU and Australasia aren’t giving up any ground.
China’s ramping up selective butter imports even as their milk production slips — something to watch.
And USDA keeps the 2025 all-milk price pegged near $22 per cwt, with Class III and IV futures about $17.40 and $18.54. Locking prices ahead feels smart.
If you’re considering investments or diversification, consider grants like those offered by the Dairy Business Innovation Alliance. They’re offering up to $100,000 for efficiency and modernization projects.
Dairy-beef crosses and automation technologies — such as feeders and meters — are becoming increasingly vital for managing the fluctuations.
What It Means for You
Markets are swinging — today’s cheese price pullback is proof. If you can, lock in your prices to protect your margins.
Know your local reality: feed costs and weather conditions differ widely by region, so tailor your plan to your specific farm.
Keep an ear on global trade moves and currency shifts. That’s the tune your milk check dances to.
The bottom line? This industry rewards the prepared and punishes the complacent. Today’s moves are just another reminder that having a plan — and sticking to it — beats hoping prices will always go your way.
Complete references and supporting documentation are available upon request by contacting the editorial team at editor@thebullvine.com.
Cracking the Code: The Unseen Financial Power of A2 Milk in Your Herd – For a tactical edge, this piece reveals how to leverage genetic selection for A2 milk to unlock new revenue streams and increase herd value. It offers a practical guide to capitalizing on a high-demand consumer trend.
The Digital Cow: How Big Data is Revolutionizing Dairy Farming – Looking to the future, this article explores how innovative data analytics and AI are transforming herd management. It demonstrates how to turn farm data into predictive insights for boosting efficiency, health, and your overall bottom line.
Join the Revolution!
Join over 30,000 successful dairy professionals who rely on Bullvine Weekly for their competitive edge. Delivered directly to your inbox each week, our exclusive industry insights help you make smarter decisions while saving precious hours every week. Never miss critical updates on milk production trends, breakthrough technologies, and profit-boosting strategies that top producers are already implementing. Subscribe now to transform your dairy operation’s efficiency and profitability—your future success is just one click away.
EXECUTIVE SUMMARY: The dairy industry’s obsession with feed cost management is dangerously misguided when Class III futures crater 28 cents while corn sits comfortably below $4.50/bushel. This comprehensive CME market analysis reveals how 25 block cheese trades with zero bids created a $1.27 weekly Class III collapse, pushing income-over-feed costs below $12/cwt despite historically favorable grain prices. The brutal math exposes a 20% margin compression driven entirely by milk price destruction, not input inflation—contradicting decades of conventional wisdom that positions feed cost hedging as the primary risk management tool. Global demand destruction is overriding domestic supply fundamentals, with Mexican buyers becoming “price-selective” on $2.47 billion in annual purchases while U.S. component-adjusted production surges 3.0% year-over-year. FMMO reforms effective June 1st are creating structural pricing advantages for butterfat producers, with Class IV projected to outperform Class III by $0.60/cwt in 2026. Progressive producers implementing Dairy Revenue Protection within 48 hours and optimizing for 4.50%+ butterfat levels will capture $0.75-$1.50/cwt premiums while competitors cling to outdated volume-focused strategies.
KEY TAKEAWAYS
Immediate DRP Implementation Delivers Crisis Protection: With Class III below $17.00/cwt and further weakness projected, establishing Dairy Revenue Protection floors within 48 hours protects against $1.25-$1.75/cwt additional losses through August 2025—far exceeding potential feed cost savings
Butterfat Optimization Captures Structural Premium: Target 4.50%+ butterfat levels to access $0.75-$1.50/cwt premiums as Class IV prices maintain $0.60/cwt advantage over Class III in 2026 projections, reversing traditional protein-focused strategies
Component-Focused Production Trumps Volume Strategy: U.S. milk shows 3.0% component-adjusted growth versus 1.6% volume growth, yet cheese prices collapse—proving market values manufacturing solids over raw gallons, demanding strategic breeding and nutrition shifts
Regional FMMO Advantages Create Geographic Arbitrage: June 1st reforms increased Northeast Class I differentials to $5.10/cwt while manufacturing regions face relative disadvantages—strategic location evaluation now delivers measurable pricing benefits
Trading Pattern Analysis Reveals Market Paralysis: 25 block trades with zero bids versus 6 barrel bids with zero offers signals bifurcated cheese market requiring sophisticated risk management beyond traditional spot price monitoring
Class III milk futures plunged $0.28/cwt as cheese blocks collapsed 5.50¢ and barrels fell 4.25¢, extending a brutal week that’s pushing farm margins below break-even levels. With July Class III now at $16.98/cwt and income-over-feed costs projected to slip below $12/cwt through August, immediate risk management action is critical.
Today’s Price Action & Farm Impact
Product
Closing Price
Daily Change
Weekly Trend
Direct Impact on Farmers
Cheese Blocks
$1.5950/lb
-5.50¢
-10.0¢ (-5.8%)
Severe Class III pressure continues
Cheese Barrels
$1.6150/lb
-4.25¢
-11.2¢ (-6.5%)
Amplifies protein value destruction
Class III (JUL)
$16.98/cwt
-$0.28
-$1.27 (-7.0%)
Milk checks under severe pressure
Class IV (JUL)
$18.83/cwt
-$0.22
-$0.44 (-2.3%)
Butterfat premium maintaining
Butter
$2.5350/lb
+1.00¢
+0.56¢ (+0.2%)
Modest support for Class IV
NDM Grade A
$1.2500/lb
-1.00¢
-1.88¢ (-1.5%)
Export demand softening
Dry Whey
$0.5725/lb
+0.25¢
+1.81¢ (+3.3%)
Protein markets holding better
Market Commentary: Today’s cheese rout extends what’s becoming a devastating June for Class III valuations. Block cheese has now shed over 15¢ in two weeks, with domestic buyers reportedly “gone dark” as they await further price declines. The 25 trades in blocks today show active selling pressure, while the complete absence of bids signals market participants are stepping aside until this correction finds a floor.
Enhanced Trading Activity Analysis
Detailed Market Depth Snapshot (June 24, 2025):
Product
Trades
Bids
Offers
Bid-Ask Environment
Market Sentiment
Cheese Blocks
25
0
2
Sellers Only – No buying interest
Panic selling
Cheese Barrels
5
6
0
Buyers Only – No selling interest
Distressed demand
Butter
0
2
2
Balanced but inactive
Cautious neutrality
NDM Grade A
1
0
1
Minimal activity
Disinterest
Dry Whey
2
3
2
Modest interest both sides
Stable engagement
Critical Market Signal: The stark contrast between blocks (25 trades, 0 bids) and barrels (5 trades, 6 bids, 0 offers) reveals a bifurcated cheese market. Block cheese is experiencing liquidation selling with no buying interest, while barrel cheese shows distressed demand with buyers present but no willing sellers. This unusual pattern suggests different end-user dynamics and potential processing disruptions affecting specific cheese formats.
The Brutal Math: Despite corn trading well below $4.50 and soybean meal under $300/ton, income-over-feed costs are projected to crash below $12/cwt from March through August 2025. This represents a devastating 20% margin compression for most operations, driven entirely by collapsing milk prices rather than input cost inflation.
Production & Supply Insights
Production Surge Continues: U.S. milk production reached 19.9 billion pounds in May 2025, up 1.6% year-over-year, marking the second consecutive month of significant gains. The U.S. dairy herd expanded to 9.45 million head, the highest since August 2021.
Component Quality Rising: Fat content reached 4.31% (up 1.7% year-over-year) while protein climbed to 3.34% (up 1.2% year-over-year). Farmers are producing the highest-quality milk in years, yet the market is punishing them with lower prices – a clear signal that demand destruction is overpowering supply-side quality improvements.
Market Fundamentals Driving Prices
Domestic Demand Crisis: Retail cheese buyers have “gone dark,” holding off purchases while waiting for further declines. Domestic cheese consumption dropped 56 million pounds in Q1 2025, while weak restaurant traffic continues dampening foodservice demand.
Global Context – Mixed International Signals: Mexico remains the largest U.S. dairy export market at $2.47 billion, but Mexican buyers are “becoming more selective on pricing”. Mexico’s dairy demand was previously expected to grow 2% year-over-year in 2024, reaching over 30.4 billion pounds, but this growth is now showing signs of price sensitivity that could impact U.S. exports.
Federal Milk Marketing Order Impact Analysis
FMMO Reforms Creating New Regional Dynamics: The June 1, 2025 FMMO changes are introducing significant regional price variations:
FMMO Region
Previous Class I Differential
New Class I Differential
Impact on Regional Pricing
Northeast (Boston)
$4.10/cwt
$5.10/cwt
+$1.00/cwt premium increase
Cuyahoga County
$2.00/cwt
$3.80/cwt
+$1.80/cwt premium increase
Upper Midwest
Lower differentials
Moderate increases
Regional competitiveness shifts
Key Regional Implications: The “higher-of” Class I pricing formula restoration and increased Class I differentials are creating new regional advantages for fluid milk producers. Areas with high Class I utilization will see improved pricing, while manufacturing-focused regions may face relative disadvantages as cheese markets collapse.
Forward-Looking Analysis
USDA Projections vs. Current Reality: USDA raised its 2025 milk production forecast to 227.3 billion pounds (up 0.4 billion pounds) with an all-milk price expectation of $21.60/cwt. However, with July Class III futures at $16.98/cwt, current market conditions suggest these projections may prove optimistic.
The 2026 Outlook: USDA projects milk production will grow further to 227.9 billion pounds in 2026, with the all-milk price averaging slightly lower at $21.15/cwt. Class IV prices are consistently projected to exceed Class III prices in 2026, reinforcing the butterfat premium strategy.
Southwest Expansion Creating Logistics Crisis: Texas milk production jumped 10.6% year-over-year, with the state adding 50,000 cows in 12 months. This rapid expansion is outpacing regional processing capacity, creating transportation bottlenecks while the trucking industry faces a record 80,000 driver shortage nationally.
Upper Midwest Processing Surge: New cheese facilities are adding 360 million pounds of annual capacity in the Upper Midwest. While positive long-term, this timing couldn’t be worse for current oversupply conditions, potentially intensifying the cheese market collapse.
Actionable Farmer Insights
Immediate Risk Management – Next 48 Hours Critical:
Implement DRP Coverage NOW: With Class III below $17.00 and further weakness likely, establish Dairy Revenue Protection floors for Q3/Q4 production immediately
Component Focus: Target butterfat levels of 4.50% or higher to capture $0.75-$1.50/cwt premiums as Class IV maintains relative strength
Regional Strategy: Evaluate FMMO benefits – farms in high Class I utilization areas may see improved pricing from recent reforms
Cash Flow Planning:
Prepare for milk checks $2.00-$3.00/cwt below budget through August
Lock favorable feed prices through forward contracts while corn remains below $4.50/bu
Establish credit lines before margins deteriorate further
Industry Intelligence
FMMO Reforms Adding Structural Changes: The June 1st Federal Milk Marketing Order changes represent the most comprehensive overhaul in over two decades. Key impacts include:
Updated make allowances that will generally decrease component values
Return to “higher of” Class I pricing providing support for fluid milk producers
Class I differentials increased nationwide, with significant regional variations
Processing Investment vs. Market Reality: Over $8 billion in new processing investments are coming online, with significant cheese capacity additions. This creates a dangerous timing mismatch – new supply hitting markets just as demand falters.
The Bottom Line
Today’s cheese market collapse represents a fundamental demand destruction event occurring while production reaches new highs. The stark trading patterns – 25 block trades with zero bids versus 6 barrel bids with zero offers – signal a bifurcated market in crisis.
With domestic buyers on strike and export markets becoming price-selective, traditional outlets for excess U.S. milk production are failing simultaneously. The recent FMMO reforms provide some regional relief for Class I producers, but manufacturing-focused operations face an extended period of margin compression.
Immediate Action Required: Farmers have roughly 48 hours to establish DRP protection before further Class III deterioration locks in devastating Q3 margins. Focus on butterfat optimization and regional advantages from FMMO changes – this margin compression cycle will separate survivors from casualties.
The convergence of maximum supply, minimum demand, and structural market changes creates unprecedented challenges. Those who adapt quickly to component-focused production, aggressive risk management, and regional optimization strategies will emerge stronger.
Complete references and supporting documentation are available upon request by contacting the editorial team at editor@thebullvine.com.
Join over 30,000 successful dairy professionals who rely on Bullvine Weekly for their competitive edge. Delivered directly to your inbox each week, our exclusive industry insights help you make smarter decisions while saving precious hours every week. Never miss critical updates on milk production trends, breakthrough technologies, and profit-boosting strategies that top producers are already implementing. Subscribe now to transform your dairy operation’s efficiency and profitability—your future success is just one click away.
Supply-demand collision accelerates: 7.25¢ cheese drop signals $1.75/cwt Class III pressure. Why waiting on “forecasts” kills margins.
EXECUTIVE SUMMARY: While industry experts chase export dreams and cling to outdated USDA projections, a brutal supply-demand collision is devastating dairy margins in real-time. Our comprehensive CME analysis reveals block cheese has collapsed 7.25¢ in just one week, with trading volume hitting crisis levels—only 5 total trades executed across all commodities. With U.S. milk production surging 1.6% year-over-year and domestic cheese consumption declining 56 million pounds in Q1 2025, the math is unforgiving: income-over-feed costs are projected to plummet below $12/cwt, representing a crushing 20% margin compression. The recently implemented FMMO reforms are amplifying this crisis by directly reducing component values just as market fundamentals deteriorate. Global dairy trade is contracting 0.8% while U.S. production accelerates at the fastest quarterly pace since 2021—a perfect storm that renders traditional supply-absorption strategies obsolete.Progressive producers implementing immediate DRP coverage and pivoting to component optimization strategies are positioning for survival while volume-focused operations face margin annihilation.
KEY TAKEAWAYS
Immediate Risk Management Imperative: Implement DRP coverage for Q3/Q4 production within 48 hours—the cheese market collapse signals potential $1.25-1.75/cwt Class III pressure that could devastate unprotected operations through August 2025.
Component Strategy Transformation: Target butterfat levels of 4.50%+ to capture $0.75-$1.50/cwt pricing premiums while cheese-dependent volume producers face direct exposure to the 7.25¢ weekly block cheese decline and institutional liquidation.
Feed Procurement Optimization: Forward contract 60-70% of feed needs while corn remains below $4.60/bushel—projected record 15.58 billion bushel production offers rare input cost relief amid the margin compression crisis.
Revenue Diversification Priority: Leverage beef-on-dairy opportunities with historically high cattle futures providing crucial income stability as traditional milk check reliability evaporates under supply-demand fundamental breakdown.
Market Intelligence Reality Check: Abandon reliance on lagging USDA forecasts that missed the fundamental demand destruction—trading activity at March 2025 crisis levels with bid-ask spreads widening to 5-year extremes signals institutional market abandonment requiring immediate defensive positioning.
Market reality check: Today’s 1.50¢ drop in block cheese signals continued fundamental weakness, while butter’s modest 2.50¢ gain provides little relief for overall milk checks. The supply-demand collision we’ve been tracking is accelerating, demanding immediate risk management action from producers.
Today’s Price Action & Farm Impact
Product
Price
Daily Change
Weekly Trend
Impact on Farmers
Cheese Blocks
$1.6500/lb
-1.50¢
-7.25¢
Class III pressure intensifying
Cheese Barrels
$1.6575/lb
No Change
-7.94¢
Weak demand signals persist
Butter
$2.5250/lb
+2.50¢
-2.44¢
Limited Class IV support
NDM Grade A
$1.2600/lb
No Change
-0.88¢
Export demand is steady but fragile
Dry Whey
$0.5700/lb
No Change
+1.56¢
Protein markets holding
Enhanced Trading Activity Analysis
Critical Market Signals from the Trading Floor:
Bid-Ask Spread Analysis:
Cheese Blocks: 7 bids vs three offers – buyers stepping aside amid price uncertainty
Butter: Strong interest with eight bids vs four offers, indicating underlying support
NDM: No bids or offers – market participants awaiting direction
Dry Whey: Balanced activity (2 bids, two offers) showing stable protein demand
Volume Breakdown:
Total daily volume: Only five trades across all commodities – extremely light activity
Butter led with three trades, and cheese blocks managed two trades
Zero trading in barrels, NDM, and whey indicates market paralysis in key sectors
Historical Context: Current trading volumes represent the lowest daily activity since March 2025, when block cheese hit similar technical support levels at $1.72/lb. The bid-ask spreads have widened significantly compared to the 5-year average, indicating heightened uncertainty among market participants.
Market Sentiment & Industry Voice
Current Market Pulse: The dairy trading community exhibits extreme caution, with institutional buyers notably absent from the market. According to comprehensive market analysis, retail cheese buyers have reportedly “gone dark,” awaiting further price declines before making new purchases.
Risk Management Urgency: Dairy risk management consultants emphasize immediate action, with explicit advice to “implement DRP coverage for Q3/Q4 production within 48 hours”. This unprecedented urgency reflects the rapid deterioration in market fundamentals.
Export Market Concerns: While Mexican buyers previously provided strong support for U.S. dairy exports, recent reports indicate they are “becoming more selective on pricing”, suggesting a broader weakening in export demand that has traditionally absorbed excess domestic production.
Feed Cost & Margin Analysis
Current Feed Situation:
Corn (July): $4.185/bushel – favorable for dairy operations
Soybean Meal (July): $282.30/ton – manageable protein costs
Milk-to-Feed Ratio: Under severe compression following the cheese price collapse
Historical Perspective: Current corn prices represent a 37% decline from 2023 highs of $6.54/bushel, providing significant input cost relief. However, USDA projections for a record 2025 corn production of 15.58 billion bushels suggest continued downward pressure on feed costs.
Margin Reality Check: Despite projected lower feed costs, income-over-feed costs are projected to drop below $12/cwt from March through August 2025, representing a significant 20% margin compression for many operations.
Production & Supply Insights
Supply Surge Confirmed: U.S. milk production reached 19.9 billion pounds in May 2025, up 1.6% year-over-year, with the national dairy herd expanding to 9.45 million head. This represents the addition of 114,000 head compared to May 2024.
Regional Production Impacts:
Upper Midwest: Comfortable temperatures maintaining steady output, though NOAA data indicates temperatures 3-5°F above normal could lead to 8-12% production losses
California: Production steady despite heat concerns, but recovering from HPAI impacts that affected late 2024 performance
Critical Supply Projection: RaboResearch forecasts a substantial 1.4% production increase for “Big-7” dairy regions in Q3 2025 – the strongest quarterly surge since Q1 2021.
Market Fundamentals Driving Prices
Domestic Demand Crisis:
Retail cheese buyers have “gone dark,” awaiting further price declines
Domestic cheese consumption declined by 56 million pounds in Q1 2025
Weak restaurant traffic continues to dampen overall demand
Export Market Fragility: Despite strong Q1 2025 export performance exceeding $3 billion, momentum is slowing with key concerns:
Mexican buyers are becoming more selective on pricing
Only 8% of U.S. cheese production was exported in 2024, indicating heavy domestic reliance
Global dairy trade projected to contract by 0.8% in 2025
Processing Capacity Surge: New facilities are expected to contribute an additional 360 million pounds of cheese annually by the end of 2025, requiring substantial demand increases to avoid oversupply.
Forward-Looking Analysis & Risk Factors
Class III Futures Alert: June Class III futures at $18.67/cwt appear disconnected from spot market reality. The recent cheese market collapse suggests significant downward pressure on July contracts and beyond.
FMMO Reform Impact: The June 1st Federal Milk Marketing Order reforms are directly impacting prices through increased make allowances and removal of barrel cheese from Class III pricing calculations.
Weather & Seasonal Risks:
NOAA forecasts well above-average temperatures across most of the Lower 48 for June 2025
Drought conditions are expected to persist in the Pacific Northwest, Northern Plains, and California
Above-normal temperatures could trigger 8-12% production losses in key regions
Visual Market Analysis Recommendations
Suggested Chart Enhancements:
Price Volatility Index: 30-day rolling volatility for cheese blocks showing current levels vs historical percentiles
Regional Heat Map: Milk production by state with temperature overlays showing stress factors
Margin Compression Timeline: Income-over-feed costs trending from 2024 highs to projected 2025 lows
Export Dependency Chart: Percentage of production exported by product category with trend lines
Actionable Farmer Insights
Immediate Actions Required:
Risk Management: Implement Dairy Revenue Protection (DRP) coverage for Q3/Q4 production within 48 hours
Component Optimization: Target butterfat levels of 4.50% or higher for $0.75-$1.50/cwt pricing advantage
Beef-on-Dairy: Leverage historically high beef prices through beef-cross programs
Feed Procurement: Forward contract 60-70% of feed needs while corn remains below $4.60/bushel
Strategic Positioning:
Diversify processor relationships to reduce export market exposure
Focus on milk component production over volume
Implement comprehensive feed efficiency programs for $0.75-$1.25/cwt cost reduction
Regional Market Spotlight: Upper Midwest Focus
Wisconsin-Minnesota Production Hub: Current comfortable temperatures have maintained steady milk output and kept components stable, with cream supplies plentiful. However, NOAA data indicates emerging risks with temperatures 3-5°F above normal potentially triggering significant production losses.
Processing Capacity: The region’s processing infrastructure is operating near capacity, with new cheese facilities coming online contributing to the projected 360 million pound annual increase.
Transportation Advantages: Geographic proximity to key markets provides cost advantages, but weakening demand fundamentals erode this benefit.
Industry Intelligence
FMMO Changes in Effect: Major reforms effective June 1st are altering milk pricing dynamics with increased make allowances decreasing component values and removing barrel cheese from Class III calculations.
DMC Program Status: With margins potentially tightening, the Dairy Margin Coverage program’s history of payments in 66% of months since 2018 makes enrollment crucial.
Global Context: The FAO Dairy Price Index averaged 153.5 points in May 2025, up 21.5% year-over-year, but U.S. markets are rapidly decoupling from global strength.
The Bottom Line
Today’s continued weakness in cheese markets, particularly the 7.25¢ weekly decline in block cheese, confirms our analysis of an accelerating supply-demand collision. The extremely light trading volume (only five total trades) and widening bid-ask spreads signal a market where participants step aside, awaiting clarity on fundamental direction.
Critical Actions:
Implement DRP coverage immediately for Q3/Q4 production
Optimize for milk components, especially butterfat
Forward contract feed needs while prices remain favorable
Diversify revenue streams through beef-on-dairy opportunities
The confluence of rising milk production, weakening domestic demand, volatile export markets, and FMMO reform impacts creates a perfect storm requiring proactive risk management. The market’s current paralysis, evidenced by minimal trading activity and the absence of institutional buyers absence, suggests further volatility ahead.
Historical Perspective: Current market conditions mirror the supply-demand imbalances seen in early 2019, when similar production surges coincided with demand destruction, leading to sustained margin compression lasting 18 months.
Complete references and supporting documentation are available upon request by contacting the editorial team at editor@thebullvine.com.
Learn More:
Protecting Your Dairy’s Bottom Line: Essential Risk Management Approaches for 2025 – Demonstrates how to layer financial protections through DMC, DRP, and forward contracts while implementing biosecurity protocols that prevent HPAI outbreaks, providing tactical frameworks for the immediate risk management actions emphasized in today’s market analysis.
Digital Dairy: The Tech Stack That’s Actually Worth Your Investment in 2025 – Practical guide to implementing predictive analytics for milk component optimization and feed efficiency systems that reduce costs 5-10%, providing the technological foundation needed to execute the component-focused strategies essential for surviving today’s volatile market conditions.
Join the Revolution!
Join over 30,000 successful dairy professionals who rely on Bullvine Weekly for their competitive edge. Delivered directly to your inbox each week, our exclusive industry insights help you make smarter decisions while saving precious hours every week. Never miss critical updates on milk production trends, breakthrough technologies, and profit-boosting strategies that top producers are already implementing. Subscribe now to transform your dairy operation’s efficiency and profitability—your future success is just one click away.
Stop trusting cash market rallies alone. Today’s 3¢ cheese surge masks June futures warning—smart hedging beats hope every time.
EXECUTIVE SUMMARY: The dairy industry’s biggest mistake? Believing cash market strength guarantees sustained profitability. Today’s explosive 3.00¢ cheese block rally to $1.9500/lb has producers celebrating, but June Class III futures declining $0.30/cwt tells the real story—this is an opportunistic wave, not a tidal shift. With feed costs dropping 7.50¢ on corn and milk-to-feed ratios approaching 2.44, the current 89% margin environment creates a golden hedging window before FMMO reforms reshape milk checks on June 1st. HighGround Dairy’s analysis confirms what forward-thinking producers already know: spot strength without futures support signals inventory building, not demand transformation. The winners? Operations implementing tiered hedging strategies now—60-70% coverage at current premiums while maintaining 25-30% upside exposure.Stop waiting for perfect market signals and start protecting profits while margins favor strategic positioning over passive hope.
KEY TAKEAWAYS
Strategic Hedging Opportunity: Current Class III futures trading $1.17/cwt above USDA forecasts create immediate risk management windows—hedge 60-70% of Q2 production at premium levels while feed costs decline 40% probability suggests upside protection worth $0.50-$1.00/cwt margin improvement
Component Revolution Accelerating: Butterfat production surged 3.4% year-over-year with average tests reaching 4.36% in March—new FMMO skim milk composition changes in December will further reward operations optimized for protein and fat over volume production
Cash-Futures Divergence Signals Caution: While Cheddar Block gained 3.00¢ today, June futures declined $0.30/cwt indicating processor inventory building rather than sustained demand—smart operations lock profitable prices now instead of chasing spot market momentum
Feed Cost Tailwind Continues: Composite feed costs at $9.02/cwt with July corn dropping to $4.5075/bushel creates favorable 2.44 milk-to-feed ratio environment—operations should hedge feed costs given 40% probability of price increases while building cash reserves during this margin-positive cycle
FMMO Reform Reality Check: June 1st “higher-of” Class I pricing and updated make allowances will reshape milk checks across all Federal Orders—producers must analyze their specific utilization patterns now and adjust hedging strategies based on Class III vs Class IV futures positioning
Cheddar blocks surged 3.00¢ to $1.9500/lb while nonfat dry milk gained 1.50¢, signaling stronger May milk checks ahead. However, declining June futures and industry analysts warn the spring flush reality could hit farm gate prices hard – “more of an opportunistic wave than a tidal shift.”
Today’s Price Action & Farm Impact
Product
Price
Daily Change
Weekly Change
Impact on Farmers
Cheddar Block
$1.9500/lb
+3.00¢
+3.00¢
Significant boost to Class III outlook
Cheddar Barrel
$1.8650/lb
NC
NC
Stable support, but block-barrel spread widens
Butter
$2.5250/lb
+0.50¢
+0.25¢
Supports Class IV strength, component premiums
NDM Grade A
$1.2850/lb
+1.50¢
+1.50¢
Positive for Class IV, export demand is stable
Dry Whey
$0.5700/lb
+1.50¢
+1.50¢
Class III support, but supply pressures remain
Market Commentary: Today’s standout performer was Cheddar Block cheese, which jumped 3.00¢ to settle at $1.9500/lb with active trading of 16 loads. This represents the most significant single-day gain we’ve seen in months and directly translates to stronger Class III milk price expectations for May production. The robust NDM performance, gaining 1.50¢ to $1.2850/lb, indicates healthy demand for skim-solids products.
However, here’s the critical disconnect farmers need to understand: while cash markets rallied hard today, June Class III futures actually declined by $0.30/cwt to $19.34. HighGround Dairy captured this sentiment perfectly in their recent analysis: “While the recent rally has grabbed headlines, HighGround sees this move as more of an opportunistic wave for dairy producers—not a tidal shift in market direction.”
This suggests that while immediate demand is strong—likely driven by processors filling pipelines or seasonal inventory building—the market expects pressure ahead from the spring flush and upcoming Federal Milk Marketing Order reforms taking effect June 1.
Feed Cost & Margin Analysis
Current Feed Landscape (Futures Pricing):
Feed Component
May 28 Price
Daily Change
Risk Scenario Impact
Corn (July)
$4.5075/bu
-7.50¢
Favorable trend
Soybeans (July)
$10.7700/bu
-10.75¢
Margin supportive
Soybean Meal (July)
$293.80/ton
-$2.20
Cost pressure easing
Estimated Composite Feed
$9.02/cwt
—
Below $9.50 threshold
Milk-to-Feed Ratio: Based on the estimated May All-Milk Price of $22.00/cwt, the current milk-to-feed ratio sits at approximately 2.44. While this is just below the healthy 2.5 threshold, it represents a significant improvement from the 1.73 ratio we saw in January 2024.
Risk Scenario Analysis:
Scenario 1: Feed Cost Spike (40% probability)
Corn rises to $5.00+/bushel from the current $4.51 level
Estimated impact: -$0.50 to -$1.00/cwt reduction in milk price competitiveness
Producer action: Consider hedging 60-70% of feed needs at current favorable levels
Scenario 2: Continued Feed Decline (35% probability)
Producer action: Maintain current purchasing strategy, build cash reserves
Market Fundamentals Driving Prices
Domestic Demand: Butter stocks in April were 7% lower than April 2024 despite active churning, indicating strong domestic and export off-take. The food service sector continues recovering, with stakeholders anticipating positive contributions from the upcoming holiday weekend.
Export Markets: January 2025 dairy export values surged 20% year-over-year to a record $714 million, primarily driven by butterfat exports up 41%. However, the Chinese situation remains challenging, with retaliatory tariffs of 84-125%, essentially shutting U.S. suppliers out of a market that accounted for 43% of lactose exports.
Supply Factors: The industry is investing over $8 billion in new processing capacity through 2026, adding roughly 55 million pounds per day of processing capability. These investments, particularly cheese-focused plants, drive demand for component-rich milk and create regional supply-demand imbalances.
Forward-Looking Analysis & Risk Assessment
Futures Reality Check:
Class III (June): $19.34/cwt (-$0.30) – Trading $1.17/cwt above USDA’s annual forecast
Class IV (June): $18.48/cwt (+$0.24)
Cheese (June): $1.9880/lb (-$0.0230)
The divergence between today’s strong cash performance and declining June futures signals market caution about the immediate future. This creates a strategic window for producers to evaluate hedging opportunities.
Risk-Weighted Recommendations: Based on current market conditions and probability assessments, implement tiered hedging strategies:
60-70% coverage at current premium levels for Class III milk
25-30% exposure to potential upside from export demand scenarios
Feed cost hedging for key input costs given a 40% probability of price increases
FMMO Impact Analysis: The June 1st reforms will fundamentally reshape milk pricing. Key changes include:
Return to the “higher-of” Class I pricing formula
Updated make allowances reducing Class III and Class IV prices initially
Regional variations based on fluid milk utilization patterns
Regional Market Spotlight: Upper Midwest Under Pressure
Wisconsin and Minnesota are experiencing the full force of the spring flush, with robust milk flow creating an oversupply situation. Spot milk prices trading $4.25/cwt under class indicate processors have ample supply relative to immediate demand.
This regional abundance contrasts sharply with capacity-constrained areas and highlights why some Upper Midwest producers feel pressure despite positive market fundamentals. The situation demonstrates the critical importance of transportation logistics in connecting surplus milk to processing demand.
Industry Intelligence & Market Sentiment
Processing Expansion: Major investments from Walmart ($350M), Fairlife ($650M), and Chobani ($1.2B) are creating new demand centers and competition for milk supplies. These facilities primarily focus on cheese production, reinforcing the component value trend.
Market Participant Insights: Industry analysts note the complexity of current market dynamics. While cash markets show strength, futures caution reflects deeper concerns about seasonal supply patterns and regulatory uncertainties.
Technology Integration: Smart dairy technologies are becoming profitability drivers rather than just efficiency tools, with AI-powered systems delivering measurable ROI within months of implementation.
Actionable Farmer Insights
Pricing Strategies: Today’s strong cheese performance creates an opportunity to forward contract portions of upcoming production. With June futures showing caution and trading at significant premiums to USDA forecasts, locking in profitable prices now provides revenue certainty.
Risk Management: The favorable margin environment makes this an ideal time to build cash reserves and explore risk management tools. Consider implementing the tiered hedging approach:
Immediate action: Hedge 60-70% of next quarter’s production at current premium levels
Feed strategy: Lock in corn and soybean meal prices, given 40% probability of increases
Long-term planning: Maintain 25-30% exposure for potential export upside
Component Focus: Continue optimizing genetics and nutrition for higher butterfat and protein content. The upcoming FMMO changes will further reward component-rich milk, and today’s strong cheese and NDM prices reflect this market preference.
The Bottom Line
Today’s cheese rally signals genuine demand strength, but smart farmers won’t ignore the warning signs from June futures and industry analysts. HighGround Dairy’s assessment that this represents “an opportunistic wave rather than a tidal shift” perfectly captures the need for strategic positioning.
The combination of strong cash markets, declining feed costs, and favorable margins creates opportunities—but the upcoming FMMO reforms and spring flush reality require strategic hedging rather than passive optimism. Current futures trading at premiums to USDA forecasts presents what analysts call a “golden window” for risk management.
Strategic Action Plan:
Hedge 60-70% of upcoming production at current premium levels
Lock in feed costs for 6-month coverage given a 40% spike probability
Build cash reserves during this favorable margin environment
Optimize components for the new FMMO reward structure
Focus on component optimization, build strategic processor relationships, and use this margin environment to strengthen your operation’s financial position. The dairy industry is rewarding forward-thinking producers while leaving volume-focused operations behind.
Ready to optimize your risk management strategy? Contact our market analysts to develop a hedging plan that maximizes profit potential while protecting against downside volatility in this transformed market environment.
April 2025 Dairy Risk Management Calendar – Reveals strategic timing for risk management decisions during the spring flush, including component-focused culling strategies and export opportunity windows that help navigate the current margin squeeze with actionable monthly planning guidance.
The Future of Dairy Farming: Embracing Automation, AI and Sustainability in 2025 – Demonstrates how cutting-edge automation and AI technologies transform dairy operations for long-term profitability, featuring whole-life monitoring systems and robotic solutions that enhance both efficiency and component optimization strategies.
Join the Revolution!
Join over 30,000 successful dairy professionals who rely on Bullvine Weekly for their competitive edge. Delivered directly to your inbox each week, our exclusive industry insights help you make smarter decisions while saving precious hours every week. Never miss critical updates on milk production trends, breakthrough technologies, and profit-boosting strategies that top producers are already implementing. Subscribe now to transform your dairy operation’s efficiency and profitability—your future success is just one click away.
Are you ready for the USDA’s new Federal Milk Marketing Order reforms? Find out how these changes could impact your dairy farm. Stay prepared for what’s coming!
Imagine waking up to a world where the regulations governing your milk prices have changed, and you only have a few days to voice your concerns. This is the reality for dairy producers in the United States. The USDA has proposed new Federal Milk Marketing Order (FMMO) pricing formulae, a decision that could reshape the dairy industry’s future. Understanding the potential impact is not just important; it’s crucial. ‘Any dairy farmer who feels these changes might affect them should consider what they mean—not just in terms of price fluctuations but also the potential unintended consequences,’ stated a representative from the USDA. The 60-day public feedback period ends on September 13, 2024. This is your chance to make your voice heard. Don’t miss the opportunity to influence a decision shaping your future. So, what does this mean for you? Let’s delve into the details.
The Future of Milk Pricing: Your Voice Matters as USDA’s Deadline Approaches
The USDA has recently unveiled its recommended judgment on the new Federal Milk Marketing Order (FMMO) pricing formulae. This crucial information has sparked widespread interest in the dairy business. As we approach theSeptember 13, 2024 deadline, stakeholders have a unique opportunity to shape the future. This public comment phase is not just important; it’s pivotal. It empowers industry participants to influence the final decision, whether it becomes part of government directives or operates independently. After reviewing these comments, the USDA will determine the changes to the milk price environment. Your voice matters. Your input can make a difference.
Brace Yourself! Significant Changes to Milk Pricing Ahead
The proposed reforms carry significant direct implications for the sector. These early effects will primarily manifest in price changes, potentially impacting producers and handlers pooled under the FMMO system. The potential impact of these changes cannot be overstated.
Increased Milk Prices Updating the milk composition parameters will increase milk pricing in specified orders. Higher expected component levels in skim milk, such as 3.1% protein, 5.9% other solids, and 9% nonfat solids, will raise costs by 3.3%, 6%, and 9.3%, respectively. This mainly helps farmers by increasing the price of their milk.
Elimination of Cheddar Barrel Price Removing the 500-pound barrel cheddar cheese price from the protein pricing calculation might raise the Class III milk price. If barrels had not been included in the calculation, the average Class III price would have been 47 cents higher during the last five years.
Decreased Milk Prices Due to Allowance Adjustments Increasing the make allowances reduces milk pricing. If the new USDA-recommended making allowances had been in force from 2019 to 2023, the average Class III milk price would have been 89 cents per hundredweight (cwt) cheaper, while Class IV would have been 74 cents per cwt lower.
Higher Base Class I Skim Milk Prices Reverting to the “higher of” technique for calculating introductory Class I skim milk pricing will likely raise prices. Over the last five years, this proposed regulation would have resulted in a Class I pricing 21 cents more per cwt than the present “average of” scheme.
Impact of Class I Differentials Modifying the Class I differential map increases complexity. While it may initially raise milk costs, the extent and effect differ by farm and county. Changes to the difference map may affect where milk is exported, causing additional milk production and driving down prices.
These fundamental consequences, whether higher or lower milk prices, will elicit a wave of reactions from farmers and processors, making it critical to keep aware and active in this changing market.
The Underrated Consequence: Beyond Immediate Price Shifts
The objective complexity stems from the secondary impacts of the USDA’s proposed adjustments.
To grasp the possible hazards and rewards, go beyond the immediate price changes and study the more significant effects.
The broader ramifications include:
Inconsistent milk flows due to skewed Class I differential maps.
Poor investment decisions in processing are driven by fluctuating make allowances.
Lower incentives for increasing protein and solids production in specific orders.
Persistently high prices that hurt global competitiveness.
These consequences have the potential to drastically change the dairy business environment, influencing everything from milk prices to worldwide competitiveness. As a result, while assessing the new pricing formulae, carefully consider these possible collateral impacts. This insight might be the difference between successful change and unexpected consequences.
Decoding USDA’s Proposed Changes
Milk Composition Factors The USDA advises changing the milk composition variables to 3.3% natural protein, 6% other solids, and 9.3% nonfat solids. This adjustment addresses the increasing trend in milk component levels. This change will cause increased milk prices in locations where payments are based on fixed assumptions about these characteristics. While this benefits cheese makers by allowing them to create more cheese from high-component raw milk, fluid milk producers may struggle to pass on these costs due to the nature of liquid milk production.
Surveyed Commodity Products The USDA suggests eliminating the 500-pound barrel cheddar cheese price from calculations and instead relying entirely on the 40-pound block cheddar price. Historically, decreased barrel prices have often reduced the protein price of Class III milk. Eliminating barrels from the equation will likely hike Class III pricing, with an average rise of 47 cents over the last five years.
Class III and Class IV Formula Factors The USDA’s new formula components include higher make allowances for cheese, butter, nonfat dry milk, and dry whey, as well as a minor rise in butterfat recovery and yield. This significant step accommodates growing production costs while lowering milk payouts. If these concessions had been in effect from 2019 to 2023, the Class III pricing would have been 89 cents cheaper, while the Class IV price would have been 74 cents lower per hundredweight. This update supports dairy groups’ suggestions while balancing conflicting ideas.
Base Class, I Skim Milk Price The “higher of” method for determining the introductory Class I skim milk price, along with a Class I extended shelf life (ESL) adjustment, is intended to assure higher pricing during times of price divergence between Class III and Class IV. Historically, employing the “higher of” approach would have raised Class I pricing by 21 cents in the last five years. The innovative ESL adjustment aims to lessen price volatility and better correlate it with ESL milk market realities.
Class I and Class II Differentials The USDA advocates for an updated Class I differential map that reflects current market conditions and milk-producing areas. This would give more meaningful incentives for efficient milk movement from surplus to deficit areas while avoiding excessive hardship for regions dealing with rising production prices. The USDA expects the dairy market to become more balanced and responsive by updating these maps.
A 2019 Lesson: When ‘Well-Intentioned’ Goes Awry
Consider the 2019 Class I milk price formula modification from a real-world perspective. Initially, the adjustment seemed simple: switch from the “higher” price to the “average of” Class III and IV skim milk pricing, with a 74-cent increase. It was supposed to stabilize and make prices more accessible to hedgers, but it did not work out as expected.
The unanticipated market disruptions caused by COVID-19 put a kink in this otherwise well-intended adjustment. Strong price fluctuations and a significant gap between Class III and IV resulted in extraordinary volatility. The result? Producers’ pay rates are far lower than they would have earned under the prior arrangement.
For example, Class IV prices fell at the height of the pandemic, although Class III prices rose owing to increased demand for cheese and butter over fluid milk. The “average of” calculation, tied to trailing Class IV prices, produced smaller rewards than the “higher of” approach. Unintended repercussions resulted in an average deficit, considerably affecting manufacturers’ bottom lines.
This historical lesson emphasizes a vital point: changes to the FMMO may have long-term consequences that affect market stability and producer livelihoods. These instances highlight the significance of carefully considering possible secondary consequences alongside fundamental price swings.
Real-world examples demonstrate that well-intentioned regulatory changes may occasionally result in less-than-ideal consequences, emphasizing the need for thorough study and feedback during decision-making.
Ripple Effects: How Federal Order Changes Could Reshape the Dairy Landscape
When evaluating the impact of changes to Federal Milk Marketing Orders (FMMOs), it is critical to examine the ripple effects. For example, changing the Class I differential map might affect milk flow between areas. Suppose particular places become more appealing owing to increasing differentials. In that case, milk distribution may alter in ways not justified by actual demand or production capacity. This might result in inefficiencies, with milk being delivered farther than required, raising costs and environmental implications.
Investment in processing facilities is another primary sector impacted by these developments. Adjusting allowances to reflect current production costs may encourage processors to invest in new technologies and facilities. On the other hand, if these allowances do not keep up with actual expenses, investment may stall, possibly impeding industry innovation and development. This balance is critical for sustaining a dynamic and adaptive processing industry.
Global competitiveness is the most significant strategic factor. The US dairy sector’s capacity to compete worldwide depends on competitive pricing structures in international markets. If our milk costs are artificially increased, our goods will become less appealing to overseas customers. On the other hand, competitive pricing can open up new markets while expanding current ones, boosting economic development and industry stability. The fragile balance has significant consequences for the future of dairy production and processing in the United States.
Are You Ready to Make Your Voice Heard?
The USDA’s public comment period is your opportunity to affect the future of milk prices. This is a critical moment to speak out and share your thoughts. Whether you’re a producer, processor, or just interested in dairy, speaking out now may help influence the ultimate decision. Remember that the deadline is September 13. Please don’t pass up this chance to significantly affect the future of our industry.
The Bottom Line
As we navigate these revolutionary times in the dairy sector, it is critical to remember the larger picture. The USDA’s proposed revisions are intended to modernize the Federal Milk Marketing Order (FMMO) system, update critical formulae, and remove previously undetected inefficiencies. While the main price effects may seem insignificant, we must consider the indirect consequences. These may significantly impact anything from milk flow and processing investment to worldwide competitiveness and overall market health.
Finding a balance is essential to solving the problem. We must guarantee that changes promote a fair, efficient market for farmers, processors, and consumers. The secondary impacts, albeit more difficult to forecast, will substantially impact the industry’s long-term survival. By carefully evaluating these possible consequences, we can build a future in which the US dairy sector flourishes and successfully fulfills local and global demands.
So, as you prepare to speak out during the public comment period, examine the more significant implications of these proposed changes. A thoughtful approach to modernization may pave the way for long-term prosperity and stability in our sector. Your contribution is crucial to ensuring that the future of dairy farming is as solid and resilient as the hardworking people who power it.
Key Takeaways:
The USDA has released new FMMO price formulas; feedback is due by September 13.
Changes affect more than just milk prices—they impact milk flow, plant investment, and global competitiveness.
Updates include new milk composition parameters and removing 500-pound barrel cheddar cheese from pricing calculations.
Reverting to the “higher of” method could raise Class I skim milk prices and influence exports and production costs.
Careful evaluation of these changes is essential for the U.S. dairy industry’s growth and ability to meet local and global demands.
Summary:
Significant changes are on the horizon, and it’s time to pay attention. The USDA has released new recommendations for Federal Milk Marketing Order (FMMO) price formulas, and the impact goes far beyond just a bump or drop in milk prices. With a deadline of September 13 for public feedback, now is your chance to voice your concerns and shape the future of milk pricing. This isn’t just about immediate price shifts—long-term consequences could affect everything from milk flow and plant investment to global competitiveness. The proposed reforms include updating milk composition parameters, increasing milk pricing in specified orders, and removing 500-pound barrel cheddar cheese from the protein price calculation. The new USDA-recommended make allowances could have significantly altered Class III and IV milk prices. Reverting to the “higher of” method for calculating introductory Class I skim milk pricing could raise prices, potentially affecting milk exports, causing additional milk production, and driving down prices. By carefully evaluating these possible consequences, the US dairy sector can flourish and fulfill local and global demands. Ready to dive in and make your voice heard?
Bullvine Daily is your essential e-zine for staying ahead in the dairy industry. With over 30,000 subscribers, we bring you the week’s top news, helping you manage tasks efficiently. Stay informed about milk production, tech adoption, and more, so you can concentrate on your dairy operations.
Explore the factors behind May’s exceptional dairy margins reaching $10.52 per cwt amid elevated feed prices. What were the consequences for indemnity payments, and how are dairy producers faring as a result?
The Dairy Margin Coverage (DMC) program has demonstrated remarkable resilience, showcasing a robust dairy market as May’s margins soared to $10.52 per cwt—the highest since November 2022. Despite escalating feed prices, the absence of indemnity payments for the third consecutive month underscores the industry’s ability to weather economic challenges and emerge stronger. This should reassure stakeholders about the stability of the dairy industry.
On June 28, the USDA National Agricultural Statistics Service (NASS) released its Agricultural Prices report. This report helps calculate the feed costs used to determine the May Dairy Margin Coverage (DMC) program margins and indemnity payments. The information provided by NASS shows essential trends and changes in the dairy industry and is a valuable resource for stakeholders.
In May, income over feed cost was $10.52 per hundredweight (cwt), the highest margin since November 2022. This high margin indicates an excellent economic situation for dairy producers despite the ongoing rise in feed prices.
May’s Feed Cost Analysis Reveals a Multifaceted Picture of Rising Expenses Across Key Feed Components
Feed Component
Price
Change from April
Change from May 2023
Alfalfa hay
$276 per ton
Up $16
Down $41
Corn
$4.51 per bushel
Up 12 cents
Down $2.03
Soybean meal
$388.65 per ton
Up $30.97
Down $34.93
May’s feed cost analysis reveals rising expenses across key feed components. Alfalfa hay averaged $276 per ton, up $16 from April but $41 lower than last year, reflecting complex market dynamics.
Corn prices rose to $4.51 per bushel, an increase of 12 cents from April but down $2.03 from May 2023, highlighting broader market changes.
Soybean meal cost $388.65 per ton in May, up $30.97 from April but down $34.93 from last year, indicating decreased cost pressures compared to the previous year.
Total feed costs, calculated using the DMC formula, reached $11.48 per cwt of milk sold, a 58-cent rise from April. The strong milk market has helped dairy producers maintain favorable margins despite higher feed costs.
May Marks a Robust Rebound in Milk Prices, Led by Upper Midwest States’ Surge
State
May 2024 Price ($/cwt)
April 2024 Price ($/cwt)
Change ($/cwt)
South Dakota
23.00
19.40
+3.60
Minnesota
22.90
19.50
+3.40
Iowa
22.80
19.60
+3.20
Wisconsin
22.70
20.00
+2.70
Florida
24.80
24.80
0.00
The U.S. average all-milk price for May rose to $22 per cwt, the highest since January 2023 and a notable rebound. This $1.50 increase from April is $2.90 higher than last year, highlighting a more robust market for dairy producers.
Upper Midwest states saw significant increases. South Dakota plunged to $23 per cwt, up $3.60 from April. Minnesota, Iowa, and Wisconsin followed with notable rises of $3.40, $3.20, and $2.70 per cwt, respectively.
These improvements were driven by a rally in Class III milk prices, reflecting favorable market conditions and positive changes for many dairy producers. This should instill a sense of optimism in stakeholders about the dairy industry’s future.
A Period of Financial Resilience: How Dairy Producers Are Navigating Feed Price Volatility with Robust Margins
Substantial income over feed costs has provided dairy producers with a crucial buffer against volatile feed prices. Despite the increased costs, robust milk prices have maintained positive margins, essential for sustaining operations. This impressive financial resilience should instill confidence in stakeholders about the stability of the dairy industry.
The lack of indemnity payments for the third month in a row highlights the solid financial footing of many producers. Producers have navigated without needing supplemental assistance with income over feed costs above the DMC program’s top coverage level. Year-to-date, indemnity payments for those enrolled in the 2024 program have remained steady at $4,270, indicating a stable period.
Even with rising feed prices, this sustained period of favorable margins bodes well for the industry. It allows producers to reinvest in their operations and prepare for future market uncertainties. As margins remain strong with predictions for further improvements, the outlook for dairy producers looks promising.
A Promising Horizon for Dairy Margins: Projected Stability and Growth
The future for dairy margins looks promising. Per the DMC online decision tool forecast on June 28, margins are expected to stay strong, exceeding $12 per cwt for the rest of the year. This positive outlook relies on stable feed costs and a favorable all-milk price, expected to be above $21 per cwt through December.
October is projected to achieve the highest margin in the program’s history at $13.74 per cwt. This forecast indicates potentially excellent income over feed cost margins, reminiscent of strong financial performance in early 2022. However, market conditions can change, which could affect these predictions.
The Bottom Line
Despite elevated feed costs, the dairy sector maintains resilience with favorable margins and strong milk prices. May 2024’s income over feed cost was $10.52 per cwt—the highest since November 2022. South Dakota led the Upper Midwest price surge at $23 per cwt. This strength has negated the need for indemnity payments, though producers watch market trends closely. Projections suggest continued strong margins, potentially matching 2022 levels. The June margin, to be announced on July 31, will shed more light on the dairy sector’s financial outlook.
Key Takeaways:
No indemnity payments for the Dairy Margin Coverage (DMC) program were issued for the third consecutive month.
Income over feed costs remains favorable for dairy producers despite rising feed prices.
May’s income over feed cost was $10.52 per hundredweight (cwt), the largest margin since November 2022.
Average milk price in May was $22 per cwt, representing an increase of $1.50 from April and $2.90 from the previous year.
Highest price improvements were recorded in the Upper Midwest states, with South Dakota leading at $23 per cwt.
Feed costs have increased across all components: corn, alfalfa hay, and soybean meal.
The May DMC total feed cost was $11.48 per cwt, up 58 cents from April.
Despite these feed cost increases, strong milk prices have maintained robust margins for producers.
Year-to-date indemnity payments are unchanged at $4,270 for producers enrolled in the 2024 program period.
Predicted margins are expected to be strong for the remainder of the year, potentially matching 2022 values.
Summary:
The Dairy Margin Coverage (DMC) program has reached its highest margin since November 2022, indicating an excellent economic situation for dairy producers despite the ongoing rise in feed prices. The absence of indemnity payments for the third consecutive month reassures stakeholders about the dairy industry’s ability to weather economic challenges and emerge stronger. The USDA National Agricultural Statistics Service (NASS) released its Agricultural Prices report on June 28, which helps calculate feed costs used to determine the May Dairy Margin Coverage (DMC) program margins and indemnity payments. In May, income over feed cost was $110.52 per hundredweight (cwt), the highest margin since November 2022. May marked a robust rebound in milk prices, driven by a rally in Class III milk prices, reflecting favorable market conditions and positive changes for many dairy producers. Substantial income over feed costs has provided dairy producers with a crucial buffer against volatile feed prices, maintaining positive margins essential for sustaining operations.
Uncover the factors behind the low Class III milk prices and delve into practical measures to enhance milk protein and butterfat content. What strategies can producers and processors implement for adaptation?
The U.S. dairy industry faces a critical challenge: persistently low Class III milk prices. These prices, which comprise over 50% of the nation’s milk usage and are primarily used for cheese production, are vital for the economic stability of dairy farmers and the broader market. The current price indices reveal that Class III milk prices align with the average of the past 25 years, raising concerns about profitability and sustainability. This situation underscores the urgent need for all stakeholders in the dairy industry to come together, collaborate, and explore the underlying factors and potential strategies for improvement.
Class III Milk Prices: A Quarter-Century of Peaks and Troughs
Over the past 25 years, Class III milk prices have fluctuated significantly, reflecting the dairy industry’s volatility. Prices have hovered around an average value, influenced by supply and demand, production costs, and economic conditions.
In the early 2000s, prices rose due to increased demand for cheese and other dairy products. However, the 2008 financial crisis led to a sharp decline as consumer demand dropped and exporters faced challenges.
Post-crisis recovery saw gradual price improvements but with ongoing unpredictability. Stability in the mid-2010s was periodically interrupted by export market changes, feed cost fluctuations, and climatic impacts on milk production. Increased production costs from 2015 to 2020 and COVID-19 disruptions further pressured prices.
In summary, while the average Class III milk price may seem stable over the past 25 years, the market has experienced significant volatility. Understanding these trends is not just important; it’s critical for navigating current pricing issues and strategizing for future stability. This understanding empowers us to make informed decisions and take proactive steps to address the challenges in the dairy industry.
The Core Components of Class III Milk Pricing: Butterfat, Milk Protein, and Other Solids
Examining Class III milk prices reveals crucial trends. Due to high demand and limited supply, butterfat prices have soared 76% above their 25-year averages. Meanwhile, milk protein prices have dropped by 32%, impacting the overall Class III price, essential for cheese production. Other solids, contributing less to pricing, have remained stable. These disparities call for strategic adjustments in pricing formulas to better align with market conditions and ensure sustainable revenues for producers.
Dissecting the Price Dynamics of Butter, Cheese, and Dry Whey in Class III Milk Pricing
The prices of butter, cheese, and dry whey are crucial to understanding milk protein prices and the current state of Class III milk pricing.
Butter prices have skyrocketed by 70% over the 25-year average due to increased consumer demand and tighter inventories. This marks a significant shift from its historically stable pricing.
Cheese prices have increased slightly, indicating steady demand both domestically and internationally. This trend reflects strong export markets and stable milk production, aligning closely with historical averages.
In contrast, dry whey prices have remained steady, reflecting its role as a stable commodity in the dairy sector—consistent demand in food manufacturing and as a nutritional supplement balances any supply fluctuations from cheese production.
Together, these trends showcase the market pressures and consumer preferences affecting milk protein prices. Understanding these dynamics is critical to tackling the broader challenges in Class III milk pricing.
Decoding the USDA Formula: The Intricacies of Milk Protein Pricing in Class III Milk
Understanding Class III milk pricing requires examining the USDA’s formula for milk protein. This formula blends two critical components: the price of cheese and the butterfat value of cheese compared to butter.
Protein Price = ((Cheese Price – 0.2003) x 1.383) + ((((Cheese Price – 0.2003) x 1.572) – Butterfat Price x 0.9) x 1.17)
The first part, ((Cheese Price—0.2003) x 1.383) depends on the cheese market price, which has been adjusted slightly by $0.2003. Higher cheese prices generally boost milk protein prices.
The second part, ((((Cheese Price – 0.2003) x 1.572) – Butterfat Price x 0.9) x 1.17), is more intricate. It adjusts the cheese price by 1.572, subtracts 90% of the butterfat price, and scales the result by 1.17 to match industry norms.
This formula was based on the assumption that butterfat’s value in cheese would always exceed that in butter. With butterfat fetching higher prices due to increased demand and limited supply, the formula undervalues protein from cheese. This mismatch has led to stagnant protein prices despite rising butter and cheese prices.
The formula must be reevaluated to align with today’s market, ensuring fair producer compensation and market stability.
Unraveling the Web of Stagnant Pricing in Class III Milk
Stagnant pricing in Class III milk can be traced to several intertwined factors. Inflation is a key culprit, having significantly raised production costs for dairy farmers over the past 25 years—these increasing expenses span wages, health premiums, utilities, and packaging materials. Yet, the value received for Class III milk has not kept pace, resulting in a perceived price stagnation.
Another factor is the shift in the value relationship between butterfat and cheese. Historically, butterfat’s worth was higher in cheese production than in butter, a dynamic in the USDA pricing formula for milk protein. Today’s market conditions have reversed this, with butterfat now more valuable in butter than in cheese. Consequently, heavily based on cheese prices, the existing formula must adapt better, contributing to stagnant milk protein prices.
Also impacting this situation are modest increases in cheese prices compared to the substantial rise in butterfat prices. The stable prices of dry whey further exert minimal impact on Class III milk prices.
Addressing these challenges requires a multifaceted approach, such as reconsidering USDA pricing formulas and strategically managing dairy production and processing to align with current market realities.
Class III Milk Producers: Navigating Low Prices through Strategic Adaptations
Class III milk producers have adapted to persistently low prices through critical strategies. Over the past 25 years, many have expanded their herds to leverage economies of scale, reducing costs per gallon by spreading fixed costs over more milk units.
Additionally, increased milk production per cow has been achieved through breeding, nutrition, and herd management advances. Focusing on genetic selection, high-productivity cows are bred, further optimizing dairy operations.
Automation has also transformed dairy farming, with robotic milking systems and feeding solutions reducing labor costs and improving efficiency. These technologies help manage larger herds without proportional labor increases, counteracting low milk prices.
Focusing on higher milk solids, particularly butterfat, and protein, offers a competitive edge. Producers achieve higher milk quality by enhancing feed formulations and precise nutrition, yielding better prices in markets with high-solid content.
An Integrated Strategy for Optimizing Class III Milk Prices
Improving Class III milk prices requires optimizing production and management across the dairy supply chain. Increasing butterfat levels in all milk classes can help align supply with demand, especially targeting regions with lower butterfat production, like Florida. This coordinated effort can potentially lower butterfat prices and stabilize them.
Balancing protein and butterfat ratios in Class III milk is crucial. Enhancing both components can increase cheese yield efficiency, reduce the milk needed for production, and lower costs. This can also lead to better control of cheese inventories, supporting higher wholesale prices.
Effective inventory management is critical. Advanced systems and predictive analytics can help producers regulate supply, prevent glutes, and stabilize prices. Maintaining a balance between supply and demand is crucial for the dairy sector’s economic health.
These goals require collaboration among producers, processors, and organizations like Ohio State University Extension, which provides essential research and services. Modernizing Federal Milk Marketing Orders (FMMO) to reflect current market realities is also vital for fair pricing.
Addressing Class III milk pricing challenges means using technology, improving farm practices, and fine-tuning the supply chain. Comprehensive strategies are essential for price stabilization, benefiting all stakeholders.
Strategic Collaborations: Empowering Stakeholders to Thrive in the Class III Milk Market
Organizations and suppliers play a critical role in optimizing Class III milk prices. Entities like Penn State Extension, in collaboration with the Pennsylvania Department of Agriculture and the USDA’s Risk Management Agency, offer valuable resources and guidance. These organizations provide educational programs to help dairy farmers understand market trends and best practices in milk production.
The Ohio State University Extension and specialists like Jason Hartschuh advance dairy management and precision livestock technologies, sharing research and providing hands-on support to enhance milk production processes.
The FMMO (Federal Milk Marketing Order) modernization process aims to update milk pricing regulations, ensuring a more equitable and efficient market system. Producers’ participation through referendums is crucial for representing their interests.
Processors should work with packaging suppliers to manage material costs, establish contracts to mitigate financial pressures and maintain stable operational costs.
These collaborations offer numerous benefits: improved milk yield and quality, better financial stability, and a balanced supply-demand dynamic for butterfat and protein. Processors benefit from consistent milk supplies and reduced production costs.
In conclusion, educational institutions, agricultural agencies, and strategic supply chain collaborations can significantly enhance the Class III milk market, equipping producers and processors to handle market fluctuations and achieve sustainable growth.
The Bottom Line
The low-Class III milk prices, driven by plummeting milk protein prices and stagnant other solids pricing, highlight an outdated USDA formula that misjudges current market conditions where butterfat is valued more in butter than in cheese. Compared to the past 25 years, inflation-adjusted stagnation underscores the need for efficiency in milk production via larger herds, higher yields per cow, and automation.
To address these issues, increasing butterfat and protein levels in Class III milk will improve cheese yield and better manage inventories. Engaging organizations and suppliers in these strategic adjustments is crucial. Fixing the pricing formula and balancing supply and demand is essential to sustaining the dairy industry, protecting producers’ economic stability, and securing the broader dairy supply chain.
Key Takeaways:
Class III milk, primarily used for cheese production, constitutes over 50% of U.S. milk consumption.
Despite an increase in butterfat prices by 76%, milk protein prices have plummeted by 32% compared to the 25-year average.
The USDA formula for milk protein pricing is a critical factor, with its reliance on cheese and butterfat values leading to current pricing challenges.
Inflation over the last 25 years contrasts sharply with stagnant Class III milk prices, necessitating strategic adaptations by producers.
Key strategies for producers include increasing butterfat levels, improving protein levels, and tighter inventory management for cheese production.
Collaborations between producers and processors are essential to drive changes and stabilize Class III milk prices.
Summary:
The U.S. dairy industry is grappling with a significant challenge: persistently low Class III milk prices, which account for over 50% of the nation’s milk usage and are primarily used for cheese production. These prices align with the average of the past 25 years, raising concerns about profitability and sustainability. Over the past 25 years, Class III milk prices have fluctuated significantly, reflecting the dairy industry’s volatility.
In the early 2000s, prices rose due to increased demand for cheese and other dairy products. However, the 2008 financial crisis led to a sharp decline as consumer demand dropped and exporters faced challenges. Post-crisis recovery saw gradual price improvements but with ongoing unpredictability. Stability in the mid-2010s was periodically interrupted by export market changes, feed cost fluctuations, and climatic impacts on milk production. Increased production costs from 2015 to 2020 and COVID-19 disruptions further pressured prices.
The core components of Class III milk pricing include butterfat, milk protein, and other solids. Butterfat prices have soared 76% above their 25-year averages due to high demand and limited supply, while milk protein prices have dropped by 32%, impacting the overall Class III price, essential for cheese production. Other solids, contributing less to pricing, have remained stable.
Understanding the price dynamics of butter, cheese, and dry whey in Class III milk pricing is crucial for navigating current pricing issues and strategizing for future stability. Butter prices have skyrocketed by 70% over the 25-year average due to increased consumer demand and tighter inventories. Cheese prices have increased slightly, indicating steady demand both domestically and internationally, while dry whey prices have remained steady, reflecting its role as a stable commodity in the dairy sector.
Understanding Class III milk pricing requires examining the USDA’s formula for milk protein, which blends two critical components: the price of cheese and the butterfat value of cheese compared to butter. This formula undervalues protein from cheese, leading to stagnant protein prices despite rising butter and cheese prices. The formula must be reevaluated to align with today’s market, ensuring fair producer compensation and market stability.
The stagnant pricing in Class III milk can be attributed to several factors, including inflation, the shift in the value relationship between butterfat and cheese, and modest increases in cheese prices. To address these challenges, a multifaceted approach is needed, such as reconsidering USDA pricing formulas and strategically managing dairy production and processing to align with current market realities.
Class III milk producers have adapted to persistently low prices through critical strategies, such as expanding herds to leverage economies of scale, increasing milk production per cow through breeding, nutrition, and herd management advances, and focusing on higher milk solids, particularly butterfat, and protein. This has led to better control of cheese inventories, supporting higher wholesale prices.
Improving Class III milk prices requires optimizing production and management across the dairy supply chain. Balancing protein and butterfat ratios in Class III milk is crucial, as it can increase cheese yield efficiency, reduce milk needed for production, and lower costs. Effective inventory management is essential, and advanced systems and predictive analytics can help producers regulate supply, prevent glutes, and stabilize prices.
Collaboration among producers, processors, and organizations like Ohio State University Extension, which provides essential research and services, and modernizing Federal Milk Marketing Orders (FMMO) to reflect current market realities is also vital for fair pricing. Comprehensive strategies are essential for price stabilization, benefiting all stakeholders.
Organizations and suppliers play a critical role in optimizing Class III milk prices. Entities like Penn State Extension, in collaboration with the Pennsylvania Department of Agriculture and the USDA’s Risk Management Agency, offer valuable resources and guidance to dairy farmers. They provide educational programs to help dairy farmers understand market trends and best practices in milk production.
The FMMO modernization process aims to update milk pricing regulations, ensuring a more equitable and efficient market system. Producers’ participation through referendums is crucial for representing their interests. Processors should work with packaging suppliers to manage material costs, establish contracts to mitigate financial pressures, and maintain stable operational costs.
In conclusion, educational institutions, agricultural agencies, and strategic supply chain collaborations can significantly enhance the Class III milk market, equipping producers and processors to handle market fluctuations and achieve sustainable growth. The low-Class III milk prices, driven by plummeting milk protein prices and stagnant other solids pricing, highlight an outdated USDA formula that misjudges current market conditions where butterfat is valued more in butter than in cheese.
Explore how robust Class III Milk prices and soaring whey and cheese demand influence dairy margins in June. What role will Mexico’s demand play in shaping future trends?
June experienced stable dairy margins, notably increasing during the spot period due to high Class III Milk prices. This rise provided much-needed support in an otherwise flat margin trend. The resilience in Class III Milk prices was crucial in maintaining market stability during the volatile spot period. While margins remained steady, the strong demand for Class III Milk underscores market forces and exciting potential growth areas for industry stakeholders.
Understanding the Forces Behind Rising Class III Milk Prices
Month
Class III Milk Price (per cwt)
Change from Previous Month
January
$18.50
+0.25
February
$19.00
+0.50
March
$19.75
+0.75
April
$20.00
+0.25
May
$20.25
+0.25
June
$20.30
+0.05
Dairy farmers and market analysts have noticed rising Class III milk prices. Strong cheese and whey demand are key drivers.
Cheese Demand: Mexico’s appetite for U.S. cheese has surged, reflected in record-setting exports. This strong demand directly impacts Class III milk prices since cheese production relies heavily on this milk.
Whey Demand: Whey is also seeing renewed interest. Tight whey powder inventories pushed prices to their highest since February, increasing Class III milk prices further. This 30% price spike underscores whey’s significant role in future milk contracts.
These factors and slower shipments to China and Southeast Asia have shifted focus to Mexico, bolstering demand and sustaining high-Class III milk prices. Understanding this helps you see the link between dairy product demand and milk pricing.
Navigating Recent Trends in the Whey Market
Month
Spot Whey Price (per lb)
Price Change (cents)
April 2023
$0.37
–
May 2023
$0.44
+7
June 2023 (first half)
$0.48
+4
Let’s examine the recent trends in the whey market. Over the past two months, whey prices have surged by about 30%, or 11 cents, significantly impacting the dairy sector.
This increase is primarily due to tighter whey powder inventories, highlighting how low stock levels push prices higher. On the demand side, renewed strength, especially from key markets, has also bolstered whey prices.
The ripple effects of this price surge are evident in the Class III futures market, contributing to a notable gain of about 66 cents. This showcases whey’s importance in shaping Class III Milk prices and influencing dairy margins.
Given the current scenario, it is imperative for those involved in the dairy industry, including producers and traders, to remain vigilant. A comprehensive understanding of these trends can significantly aid in navigating the market and making informed decisions.
The Unwavering Impact of Mexican Demand on U.S. Cheese Prices
Product
April 2022 (million pounds)
April 2023 (million pounds)
Change (%)
Total Dairy Exports to Mexico
124.6
142.9
14.7%
Cheese Exports to Mexico
32.6
38.0
16.6%
Butter Production
197.4
207.8
5.3%
Cheese Production
1,166.1
1,187.0
1.8%
Mozzarella Production
383.6
407.1
6.1%
Cheddar Production
332.4
303.8
-8.6%
Cheese demand plays a pivotal role in the dairy market, mainly thanks to Mexico’s strong appetite for U.S. cheese, which has led to record-high prices. In April, cheese exports to Mexico hit 38 million pounds, highlighting this continued trend.
This demand positively impacts not just cheese but the entire U.S. dairy sector. Higher cheese prices contribute to rising Class III Milk prices, offering stability to dairy margins even as shipments to markets like China and Southeast Asia slow down.
It’s essential to remain aware of potential changes, such as economic fluctuations in Mexico, that could affect future demand. For now, Mexico’s consistent cheese demand supports strong U.S. dairy margins.
U.S. dairy exports to Mexico surged in April, hitting 142.9 million pounds—up 18.3 million from last year. Cheese exports set a new record at 38 million pounds, surpassing the previous high in February. This highlights Mexico’s vital role in the U.S. dairy market, as exports to China and Southeast Asia slow.
With 30% of U.S. dairy exports going to Mexico, their market’s demand significantly supports American dairy prices.
In April, the U.S. shipped 142.9 million pounds of dairy products to Mexico, up 18.3 million from last year. This was the second-highest monthly export level on record. Cheese exports alone hit a record 38 million pounds, showing strong demand for U.S. dairy.
Since early 2023, demand from China and Southeast Asia has decreased, but Mexico has helped fill the gap. This demand has been crucial in stabilizing prices and preventing a potential downturn.
Mexican demand plays a vital role in U.S. dairy exports. As shipments to other regions slow, this strong market helps maintain prices despite external challenges.
Claudia Sheinbaum’s presidential win has raised questions about the Mexican Peso and future U.S. dairy exports. Analysts worry her socialist policies could weaken the Peso, which dropped 5% in two days, reaching its lowest since October 2023. This devaluation might make U.S. dairy products pricier for Mexican buyers, possibly reducing demand. With 30% of U.S. dairy exports going to Mexico, a prolonged weak Peso could impact the U.S. dairy market. Exporters may need to find new markets or tweak pricing to keep their foothold in Mexico.
April’s Dairy Production: Butter’s Rise and Cheese’s Mixed Signals
Month
Price (cents/lb)
January
250
February
255
March
260
April
265
May
270
June
275
In April, butter output reached 207.8 million pounds, marking a 5.3% increase from the previous year. On the other hand, cheese production showed a mixed pattern. Total cheese output was up by 1.8%, reaching 1.187 billion pounds. However, within this category, mozzarella production surged by an impressive 6.1%. Cheddar cheese output saw a decline of 8.6% compared to last year.
Strategic Moves: Leveraging Historical Margins for Future Gains
Intelligent investors are extending coverage in deferred marketing periods to leverage strong margins. By locking in positions at or above the 90th percentile of the past decade, they’re ensuring stability and profitability despite market fluctuations. This proactive strategy, backed by historical data, helps make informed strategic decisions.
The Bottom Line
June’s Dairy Margin Watch highlights critical market drivers. Class III Milk prices remain high due to solid cheese demand and tighter whey powder supplies. Increased U.S. dairy exports to Mexico also play a crucial role despite potential economic concerns following recent political changes. April’s dairy production data shows a rise in butter output but mixed cheese production signals.
Understanding these can help dairy producers make intelligent decisions to protect margins. Now is an excellent time to consider leveraging historically strong margins by extending coverage in deferred periods. Stay proactive and informed.
For tailored strategies, consider subscribing to the CIH Margin Watch report. Visit www.cihmarginwatch.com
Key Takeaways:
Welcome to this month’s Dairy Margin Watch. Here are the key takeaways from the latest trends and developments shaping the dairy market:
Class III Milk prices remain strong due to robust demand for cheese and whey.
CME spot whey prices have surged by 30% over the past two months, reaching their highest level since February.
U.S. dairy exports to Mexico saw a significant increase, with cheese exports setting new records.
Concerns arise over the potential impact of recent political changes in Mexico on the value of the Peso and subsequent dairy demand.
April’s dairy production statistics reveal a rise in butter output, but mixed signals for cheese production, particularly a decline in Cheddar output.
Strategic coverage in deferred marketing periods is crucial to leverage historically strong margins.
Summary:
June’s dairy margins increased significantly due to high Class III Milk prices, which were crucial for maintaining market stability during the volatile spot period. Key drivers of rising milk prices include cheese demand and whey demand, with Mexico’s appetite for U.S. cheese leading to record-setting exports. Whey demand is also seeing renewed interest, with tight whey powder inventories pushing prices to their highest since February. Mexican demand plays a pivotal role in the dairy market, mainly due to Mexico’s strong appetite for U.S. cheese, leading to record-high prices. In April, cheese exports to Mexico reached 38 million pounds, highlighting this continued trend. However, Claudia Sheinbaum’s presidential win has raised questions about the Mexican Peso and future U.S. dairy exports, as analysts worry that her socialist policies could weaken the Peso, making U.S. dairy products pricier for Mexican buyers and potentially reducing demand. Understanding these factors can help dairy producers make intelligent decisions to protect margins and leverage historically strong margins by extending coverage in deferred periods.
To provide the best experiences, we use technologies like cookies to store and/or access device information. Consenting to these technologies will allow us to process data such as browsing behavior or unique IDs on this site. Not consenting or withdrawing consent, may adversely affect certain features and functions.
Functional
Always active
The technical storage or access is strictly necessary for the legitimate purpose of enabling the use of a specific service explicitly requested by the subscriber or user, or for the sole purpose of carrying out the transmission of a communication over an electronic communications network.
Preferences
The technical storage or access is necessary for the legitimate purpose of storing preferences that are not requested by the subscriber or user.
Statistics
The technical storage or access that is used exclusively for statistical purposes.The technical storage or access that is used exclusively for anonymous statistical purposes. Without a subpoena, voluntary compliance on the part of your Internet Service Provider, or additional records from a third party, information stored or retrieved for this purpose alone cannot usually be used to identify you.
Marketing
The technical storage or access is required to create user profiles to send advertising, or to track the user on a website or across several websites for similar marketing purposes.
To provide the best experiences, we and our partners use technologies like cookies to store and/or access device information. Consenting to these technologies will allow us and our partners to process personal data such as browsing behavior or unique IDs on this site and show (non-) personalized ads. Not consenting or withdrawing consent, may adversely affect certain features and functions.
Click below to consent to the above or make granular choices. Your choices will be applied to this site only. You can change your settings at any time, including withdrawing your consent, by using the toggles on the Cookie Policy, or by clicking on the manage consent button at the bottom of the screen.
Functional
Always active
The technical storage or access is strictly necessary for the legitimate purpose of enabling the use of a specific service explicitly requested by the subscriber or user, or for the sole purpose of carrying out the transmission of a communication over an electronic communications network.
Preferences
The technical storage or access is necessary for the legitimate purpose of storing preferences that are not requested by the subscriber or user.
Statistics
The technical storage or access that is used exclusively for statistical purposes.The technical storage or access that is used exclusively for anonymous statistical purposes. Without a subpoena, voluntary compliance on the part of your Internet Service Provider, or additional records from a third party, information stored or retrieved for this purpose alone cannot usually be used to identify you.
Marketing
The technical storage or access is required to create user profiles to send advertising, or to track the user on a website or across several websites for similar marketing purposes.


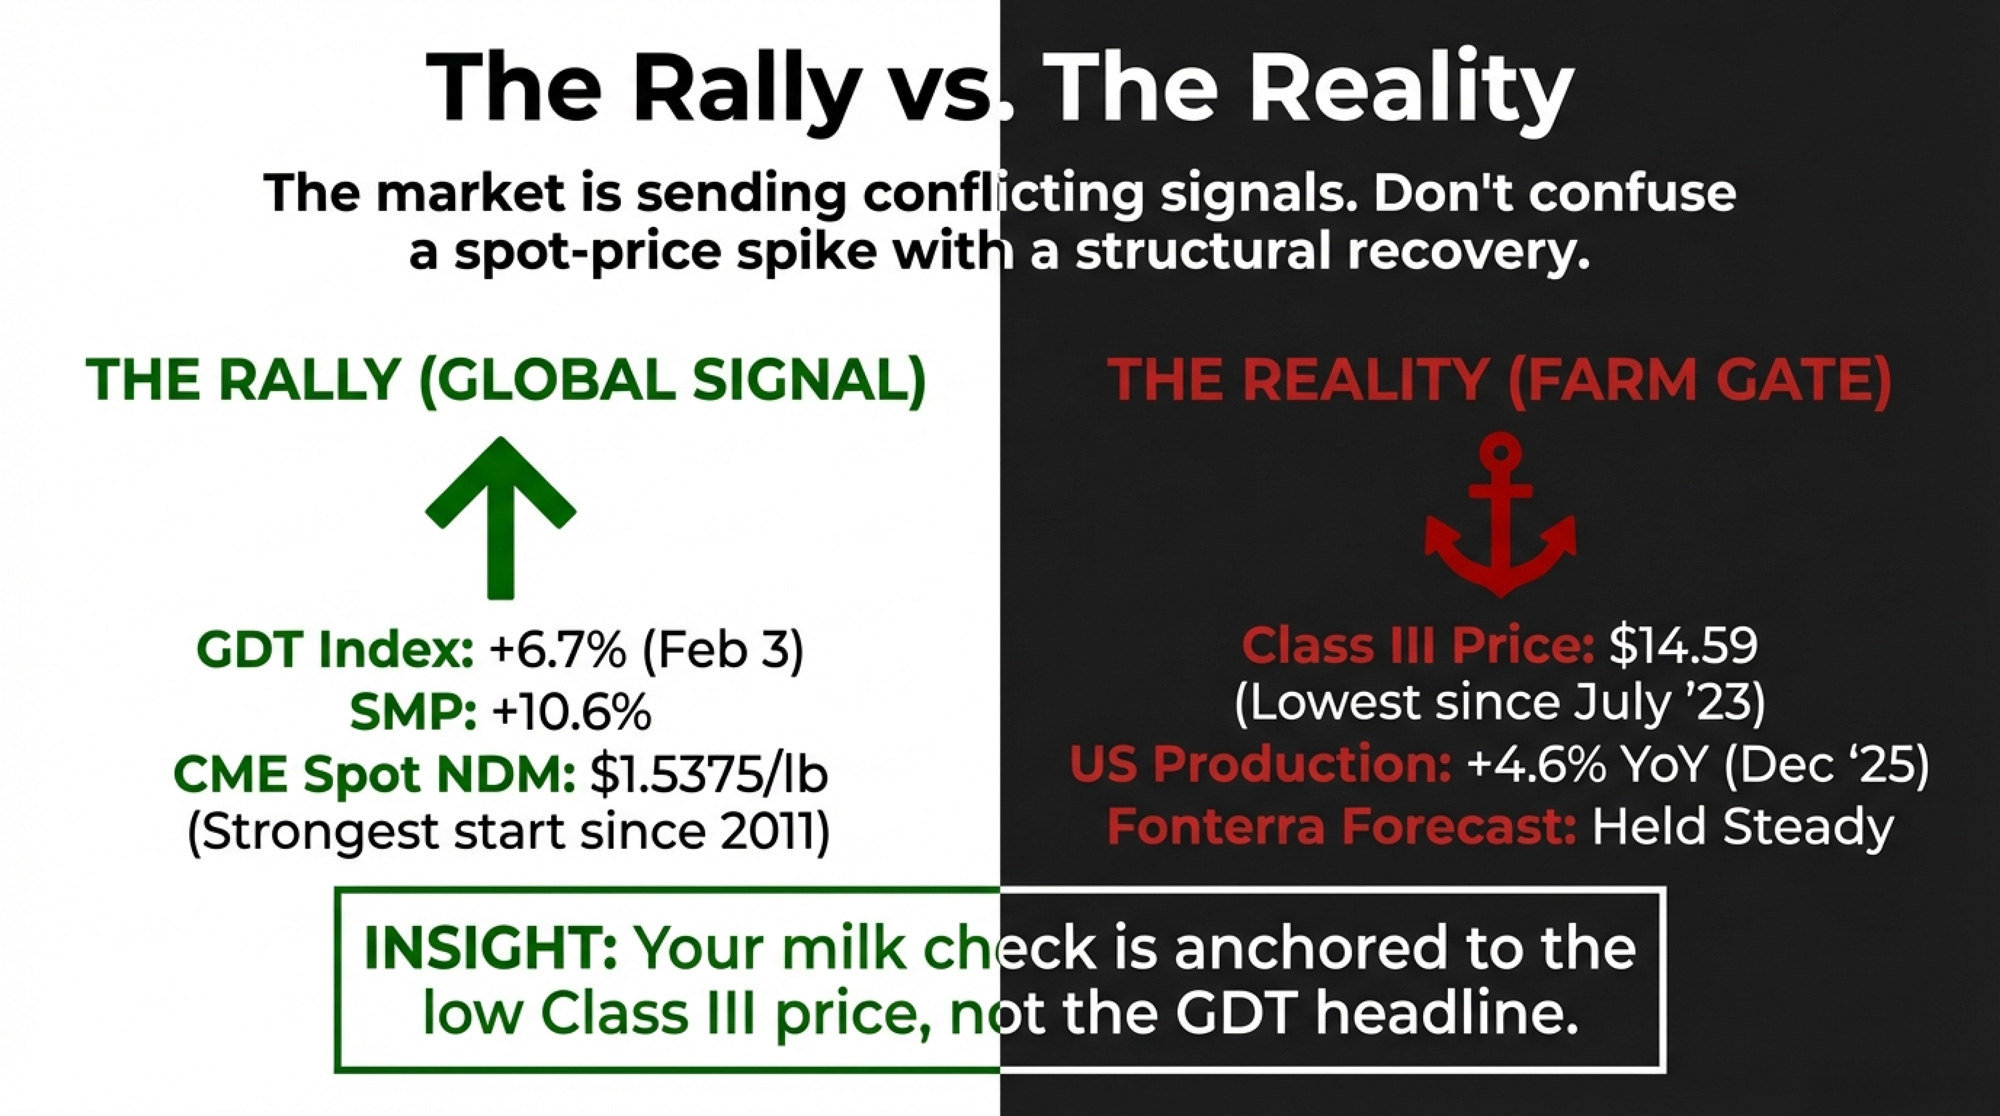
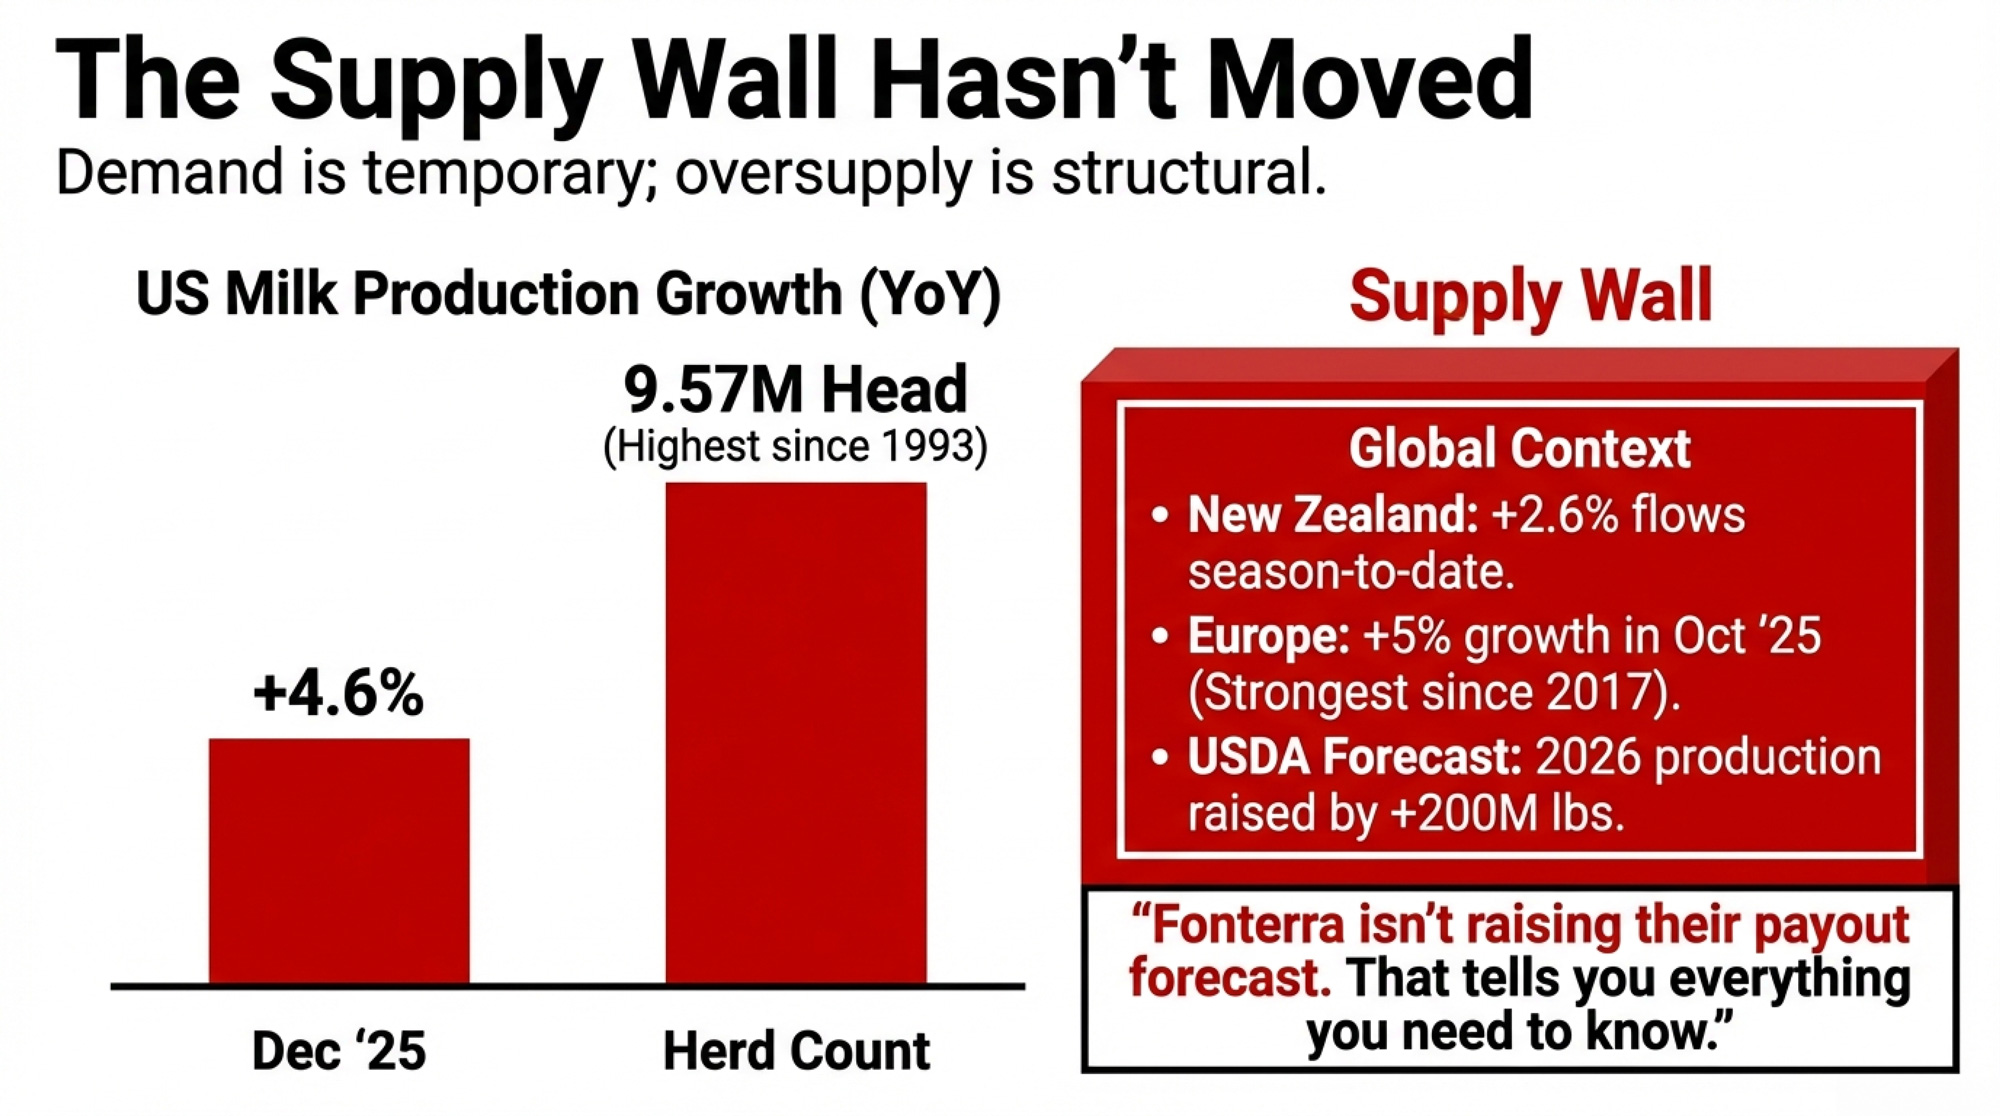
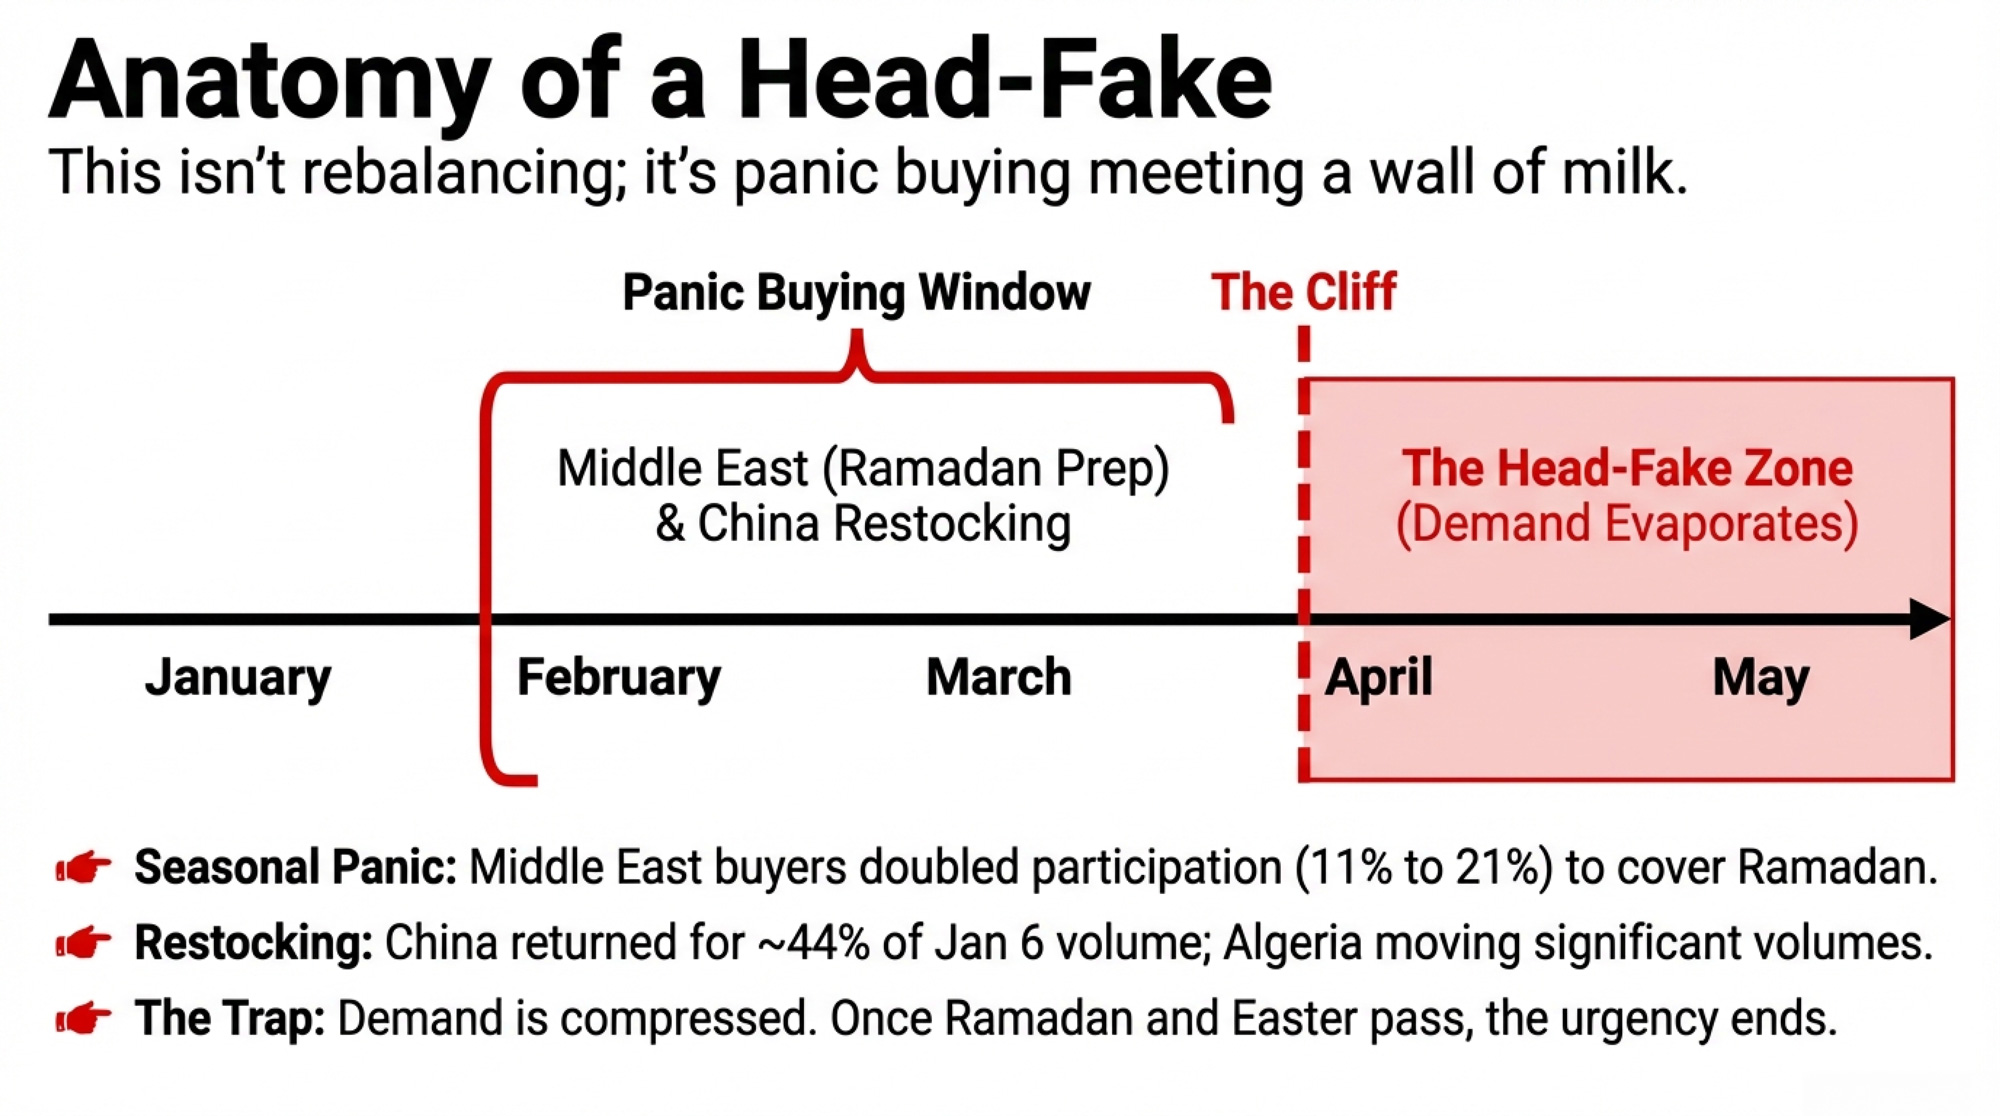
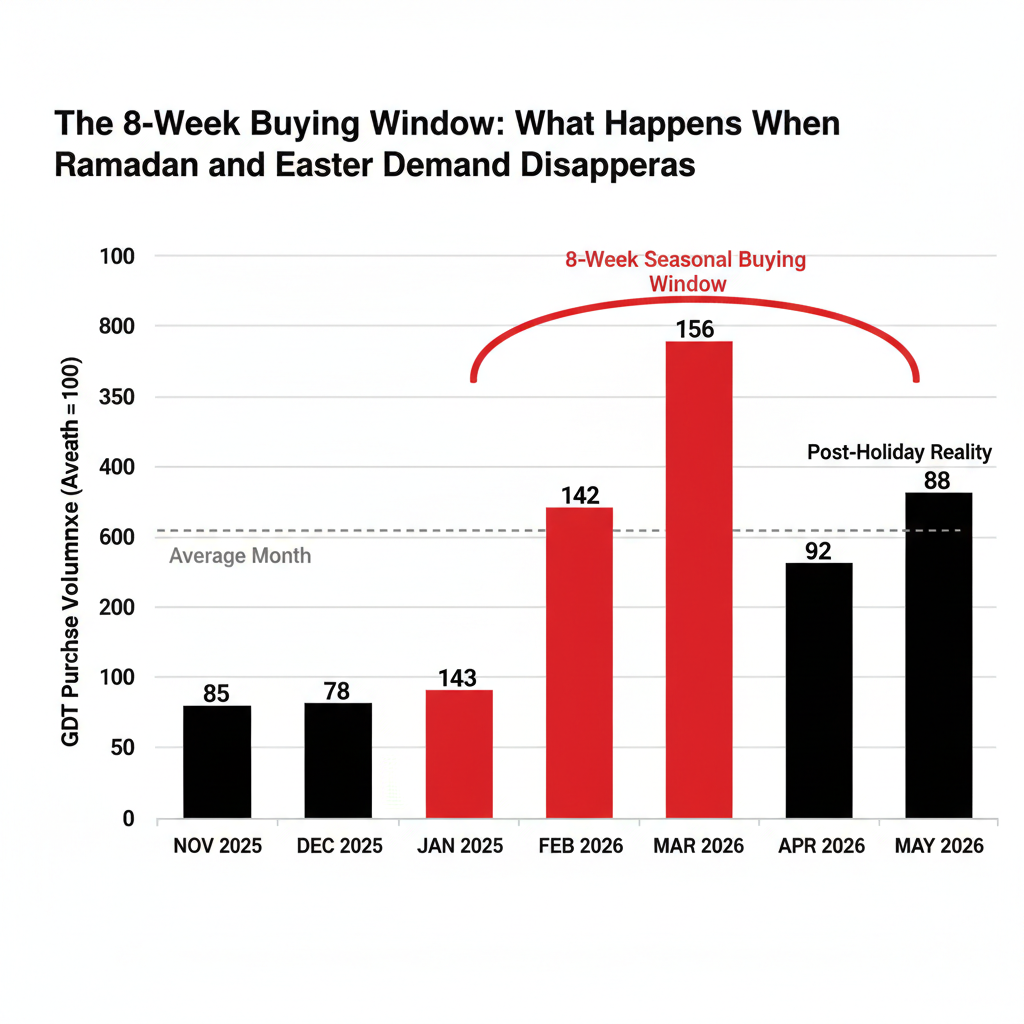
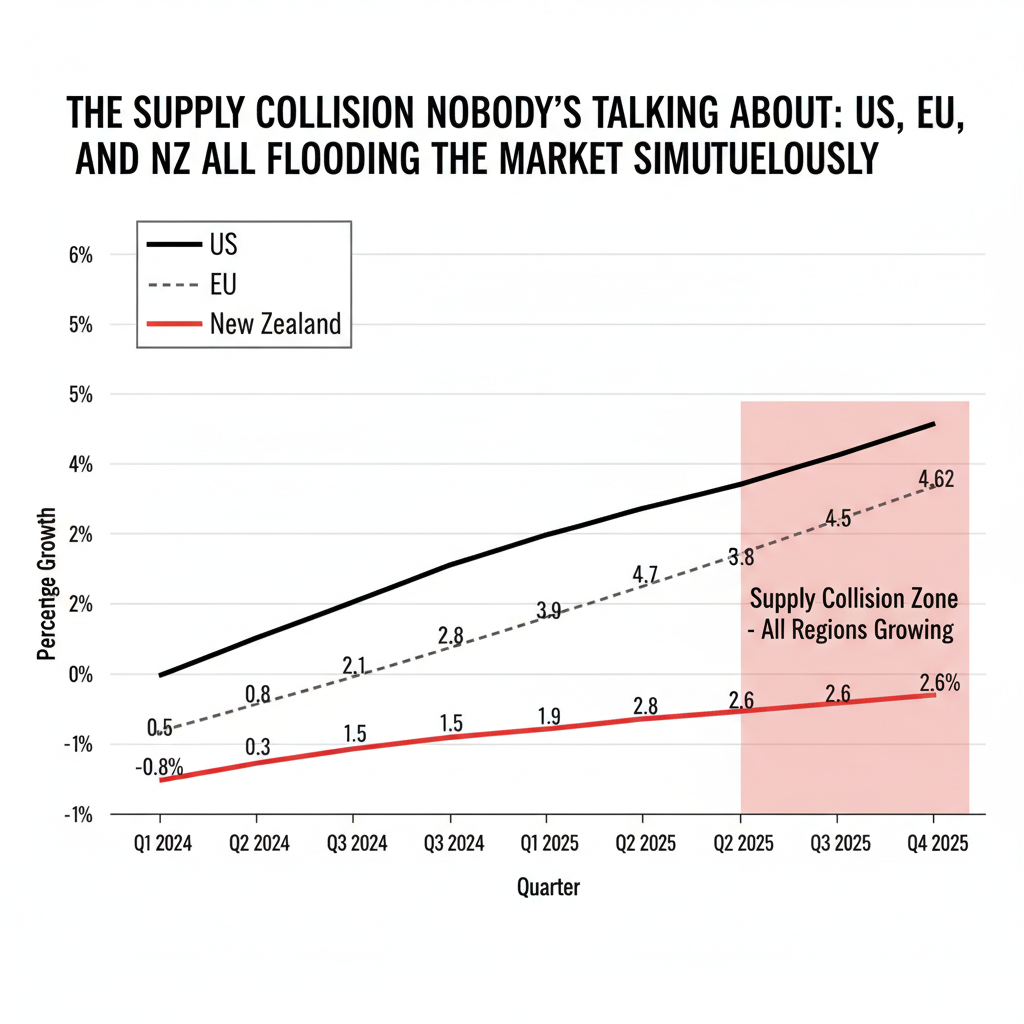
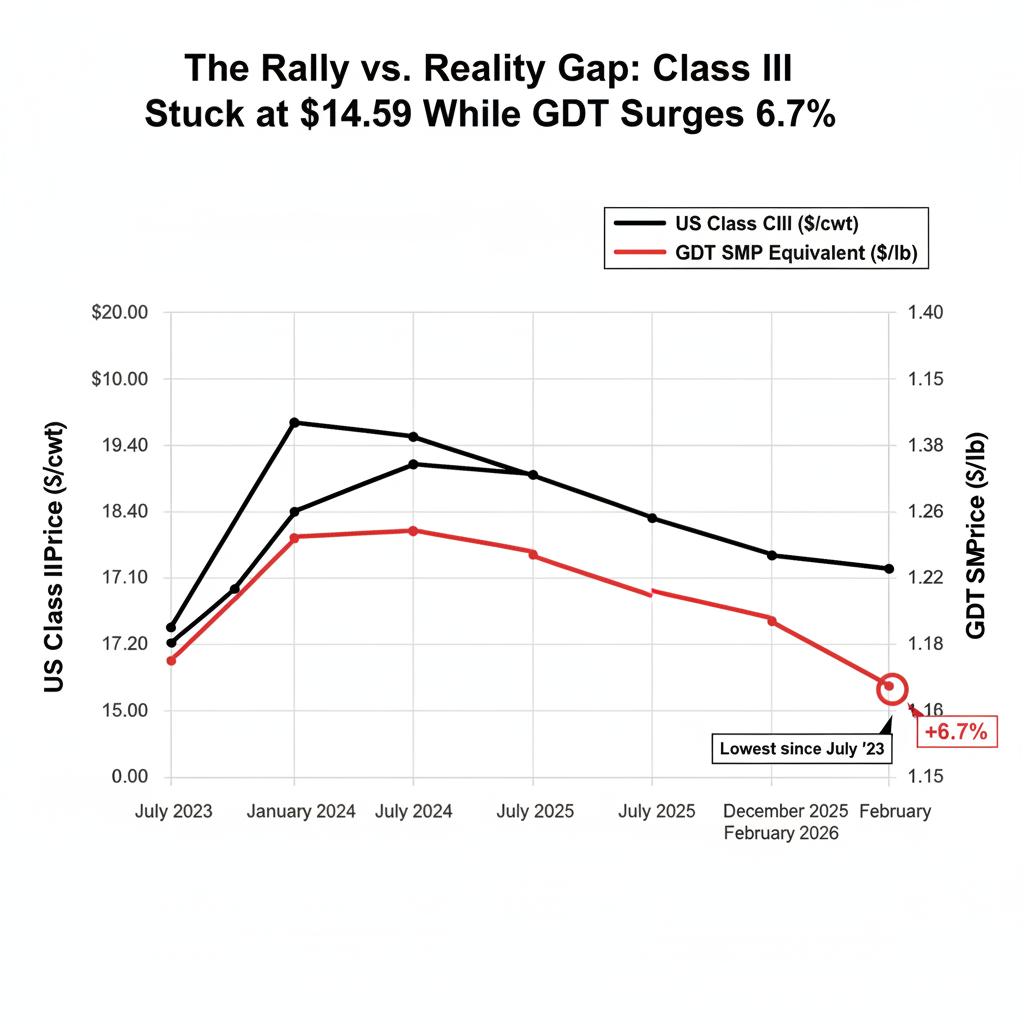
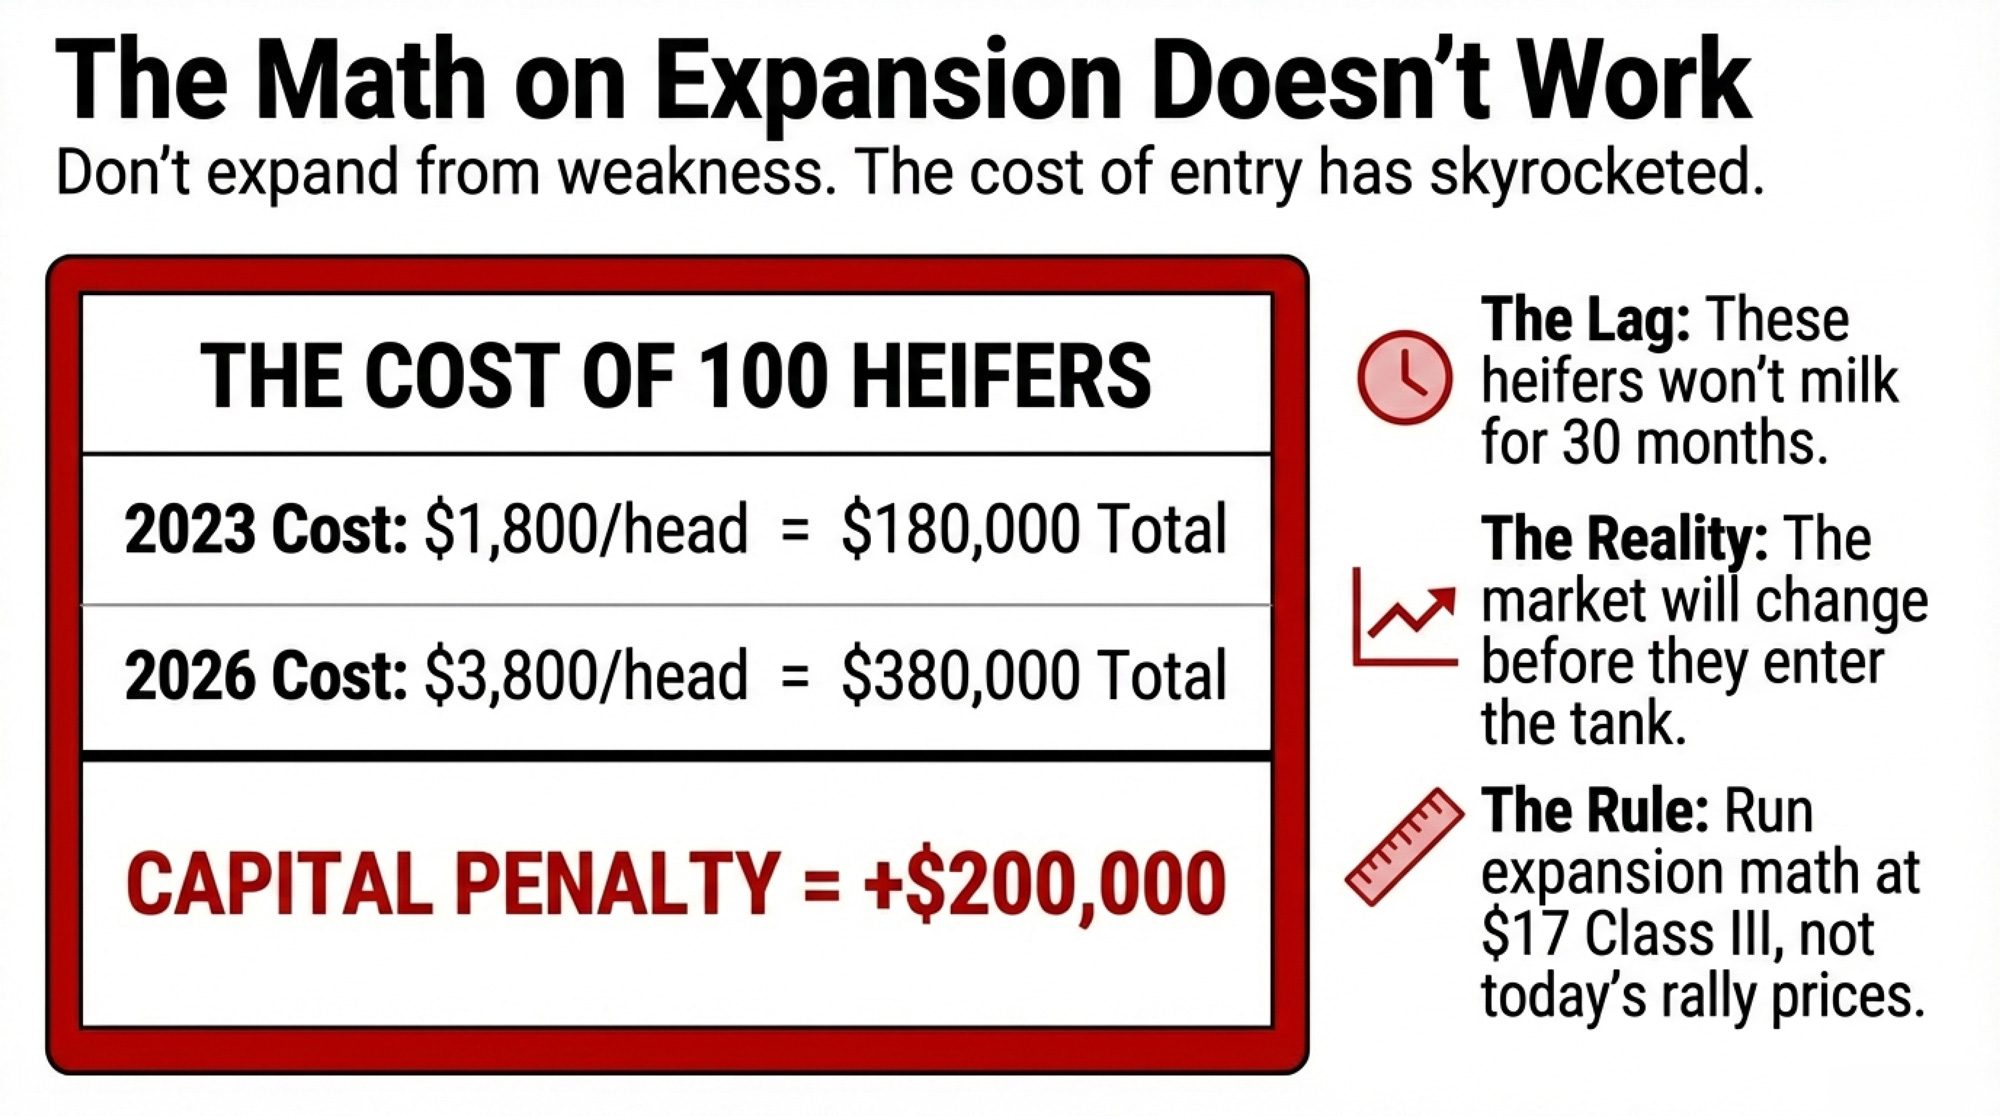
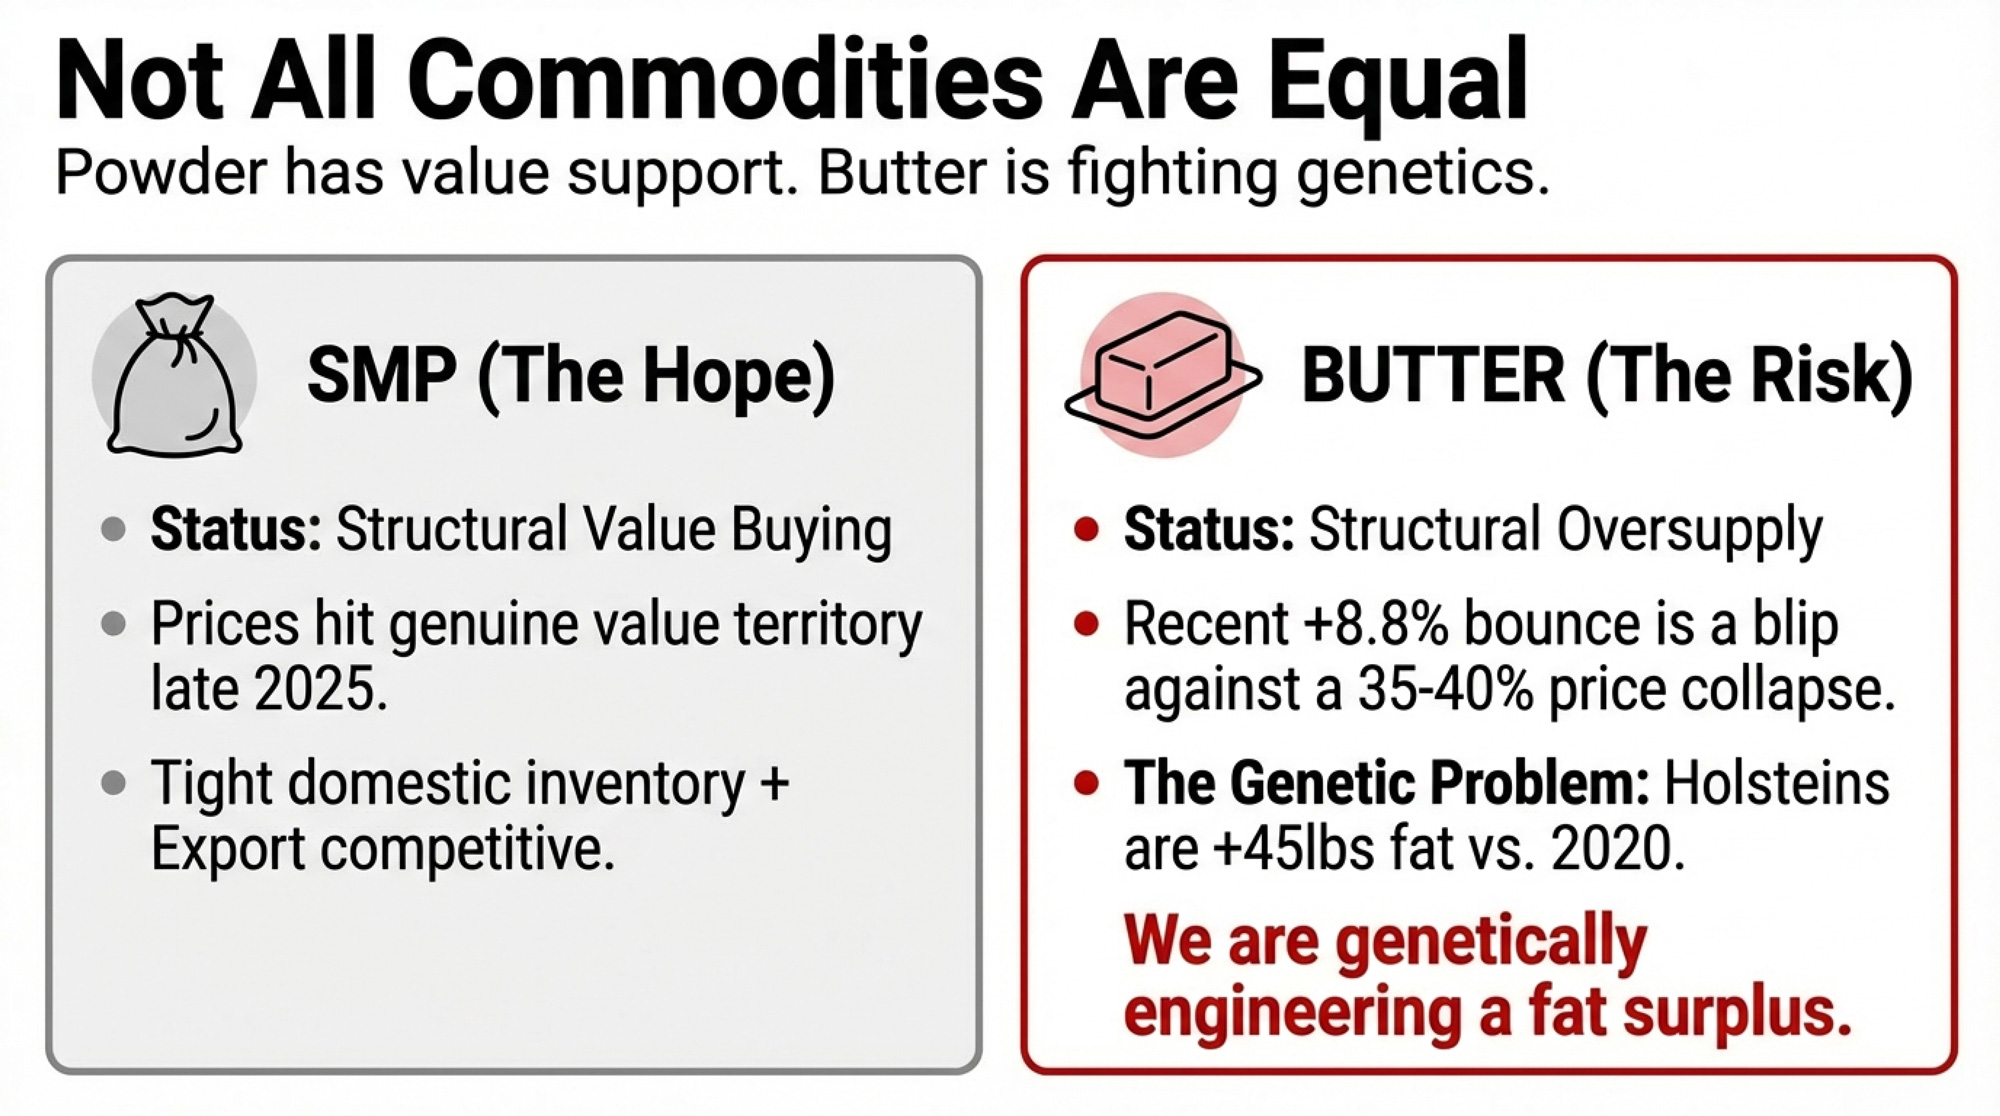
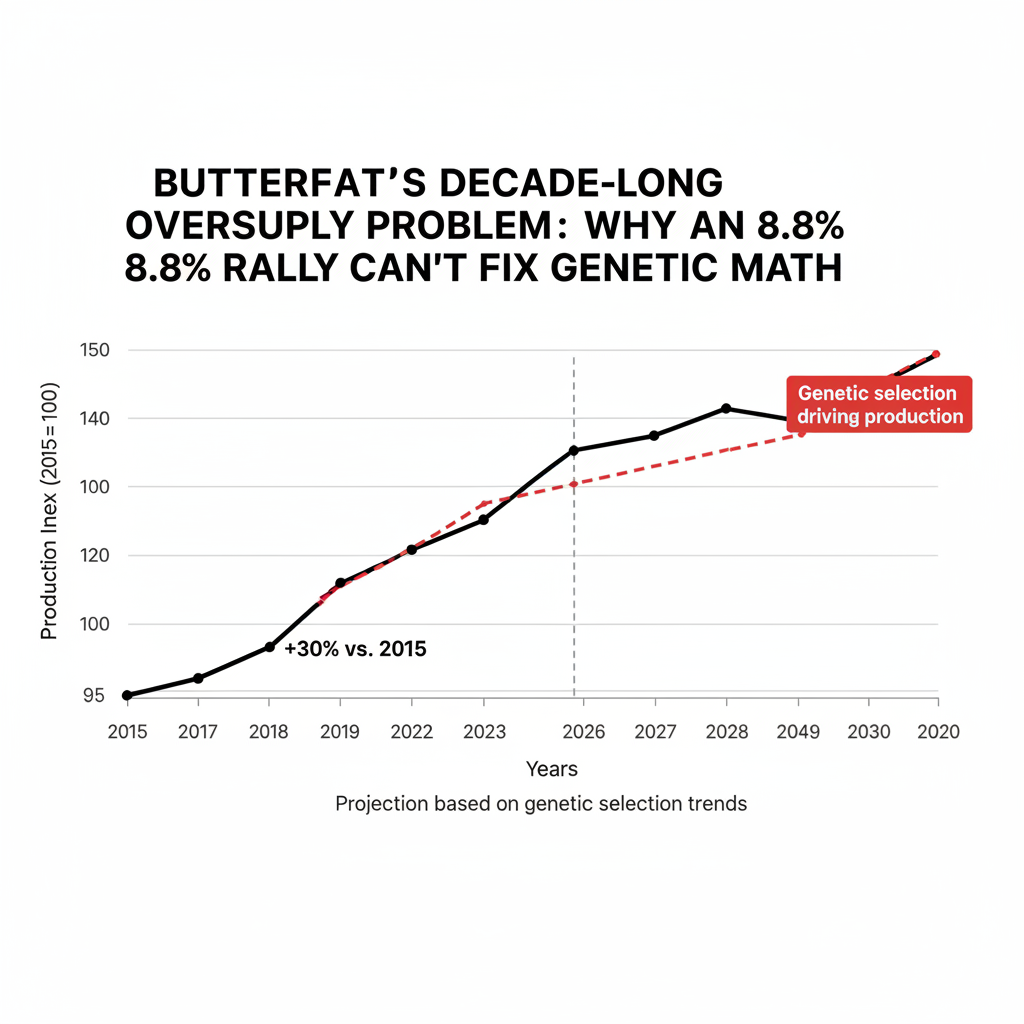
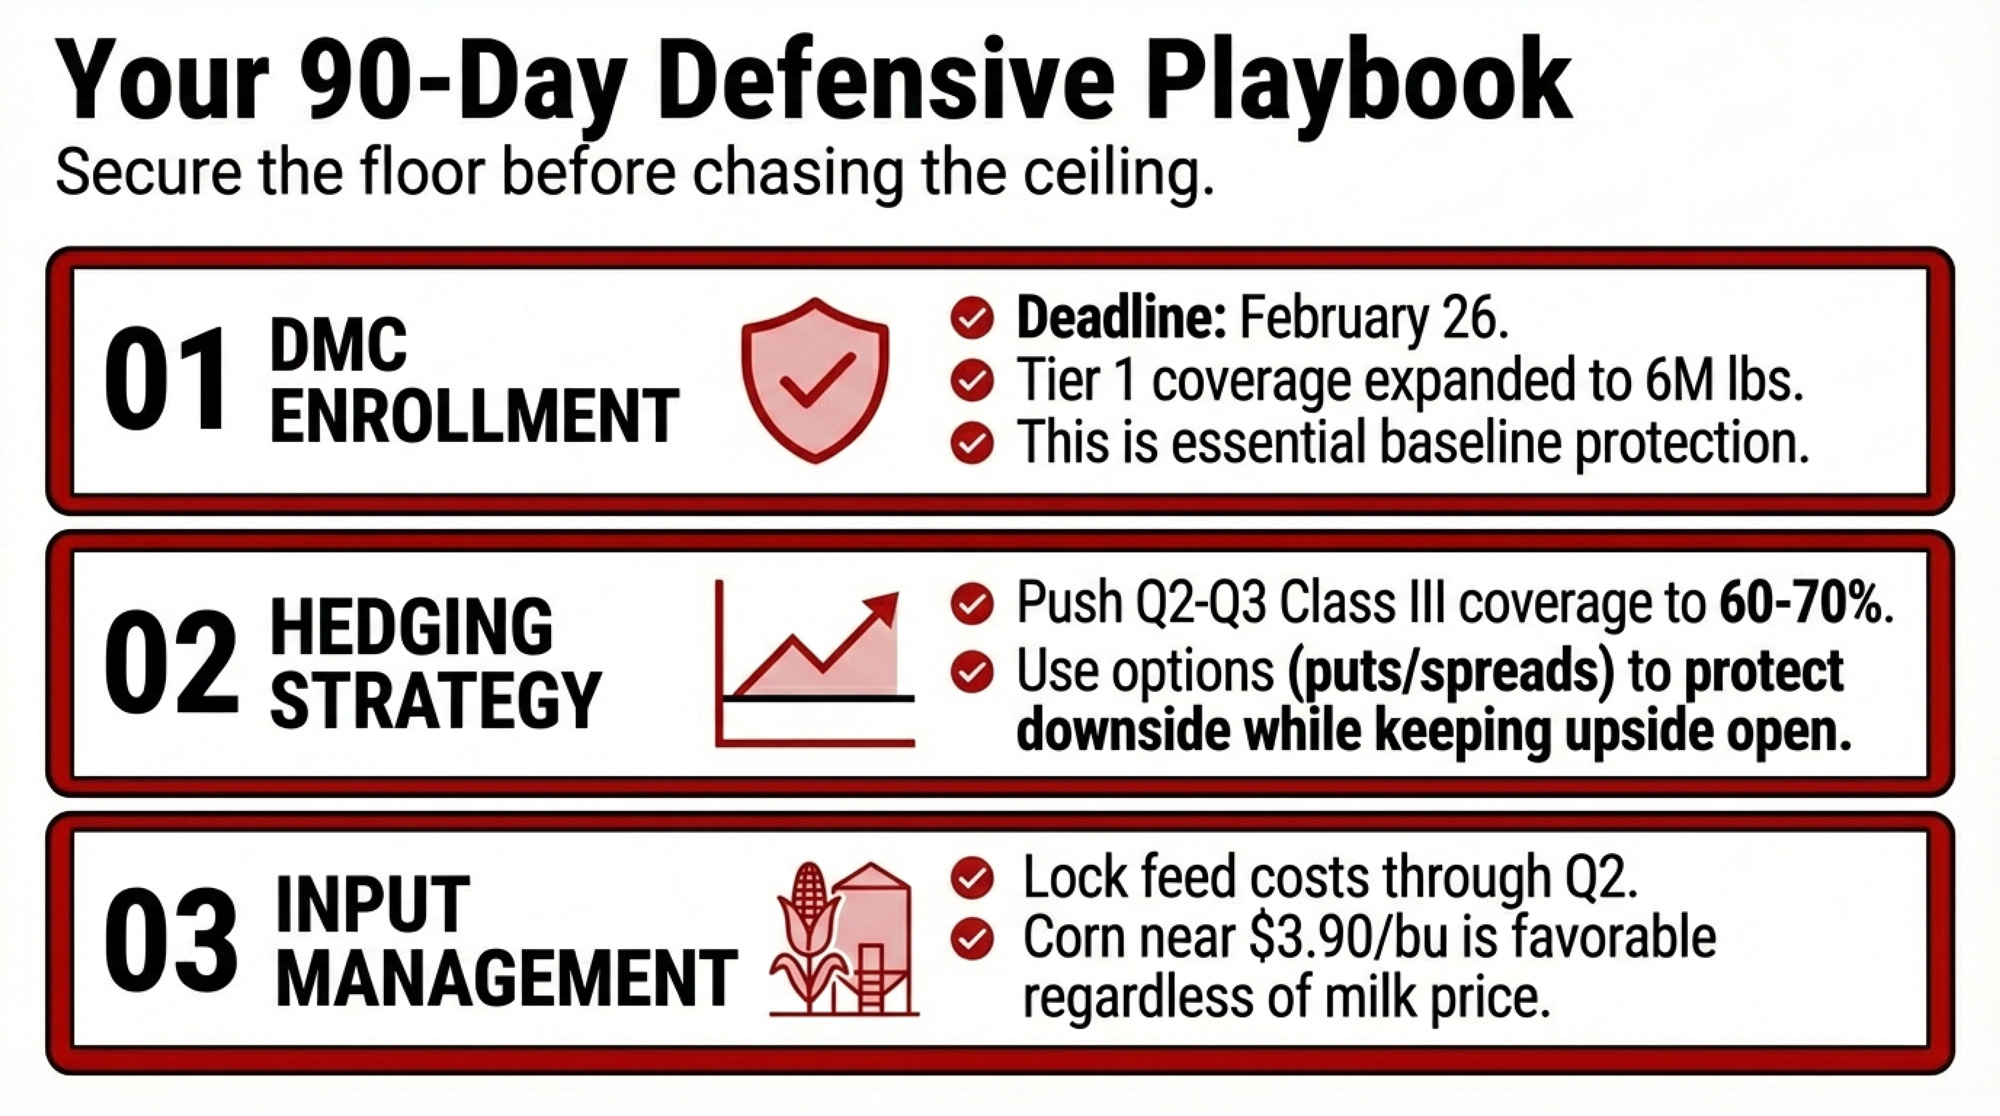
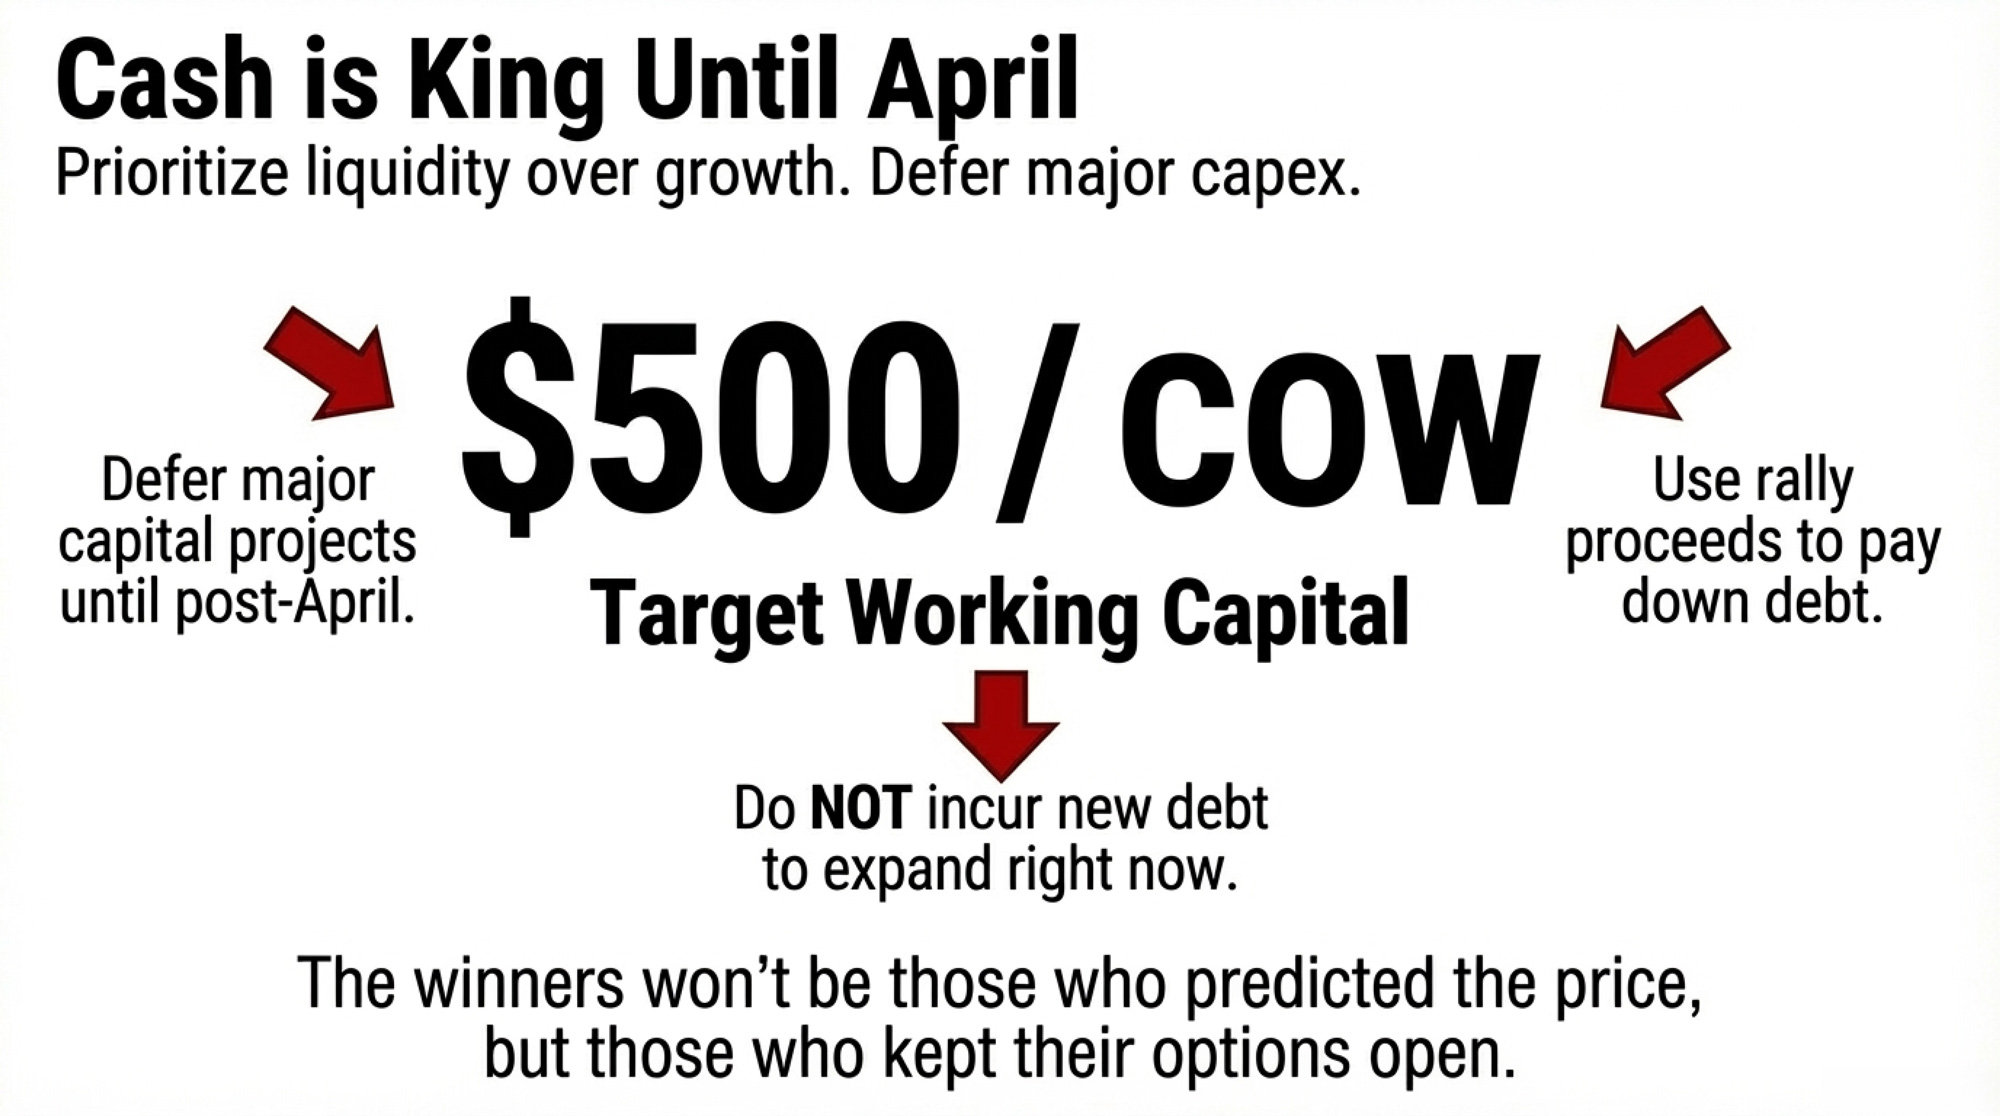
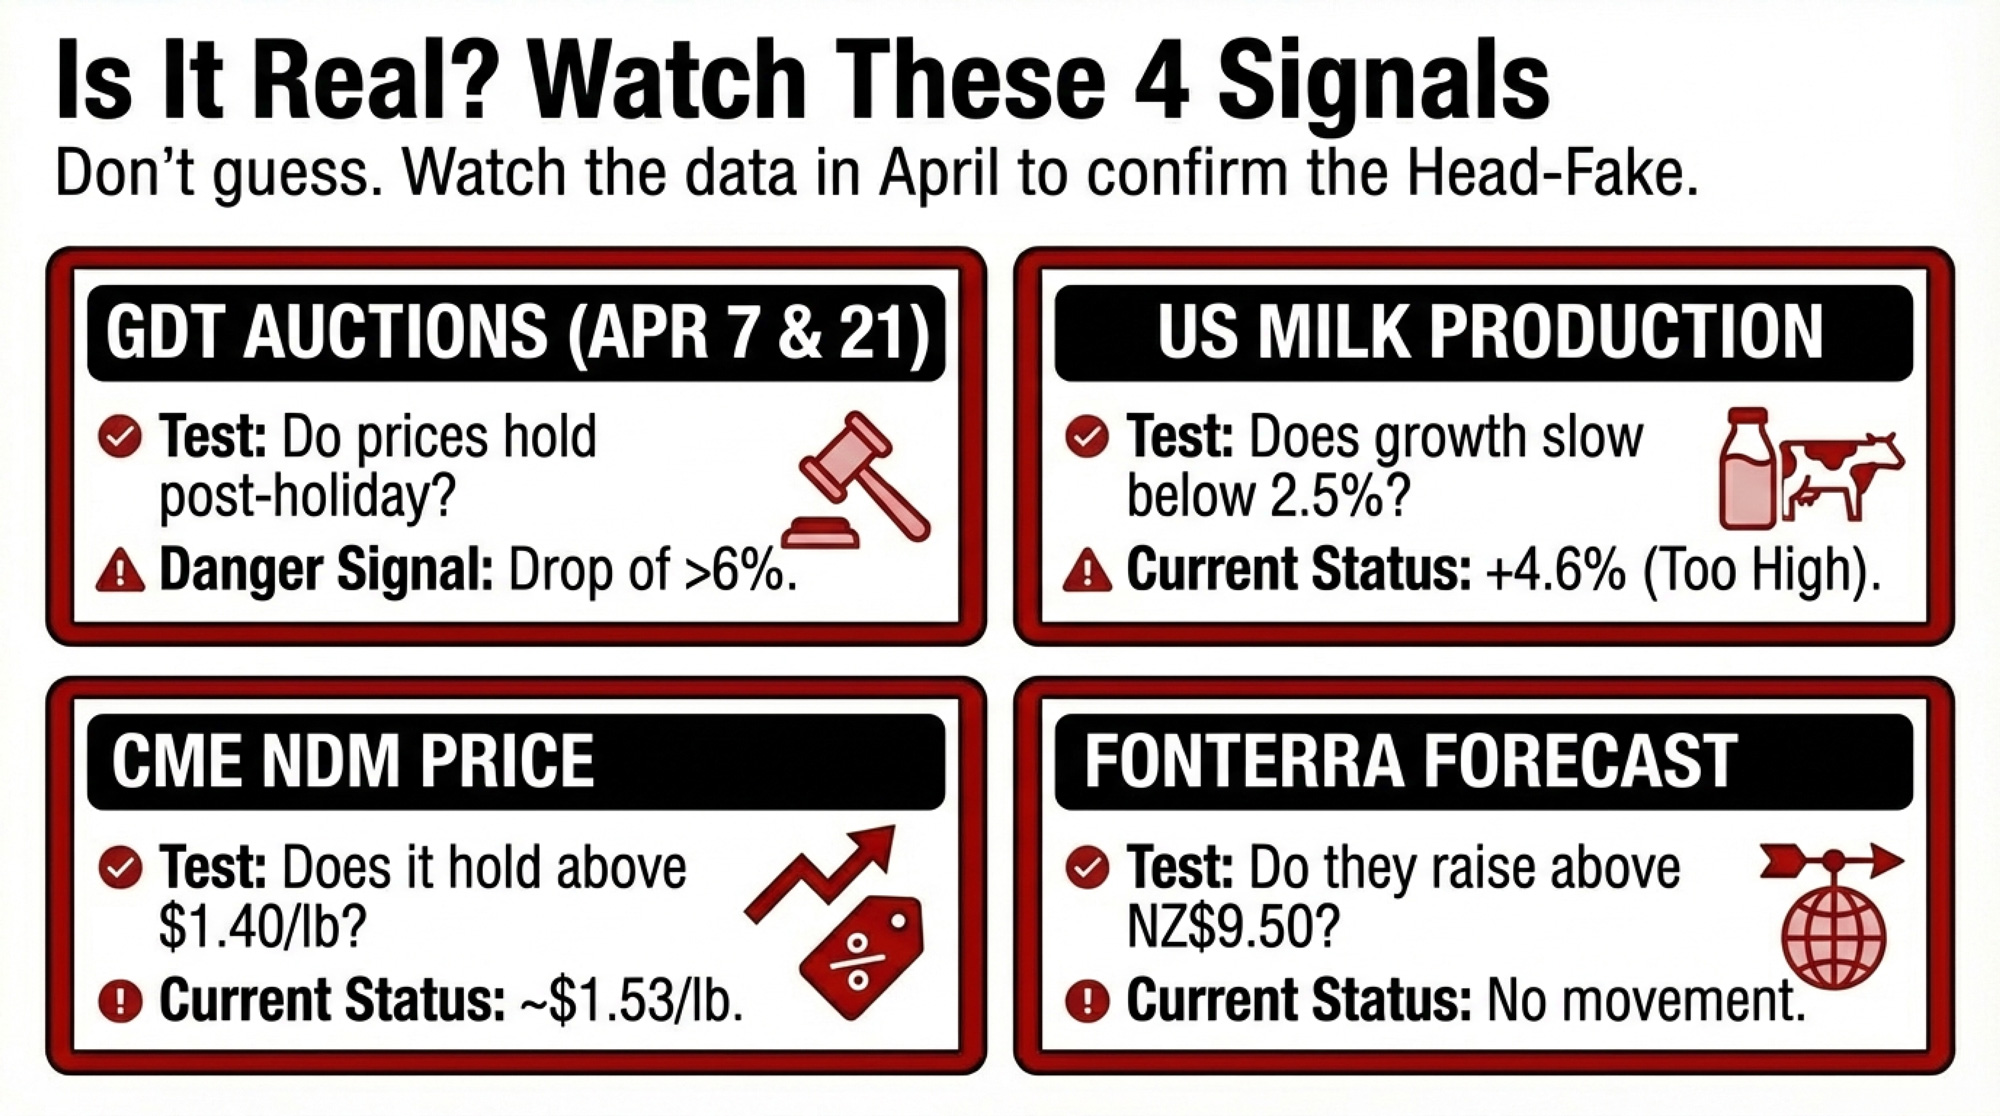
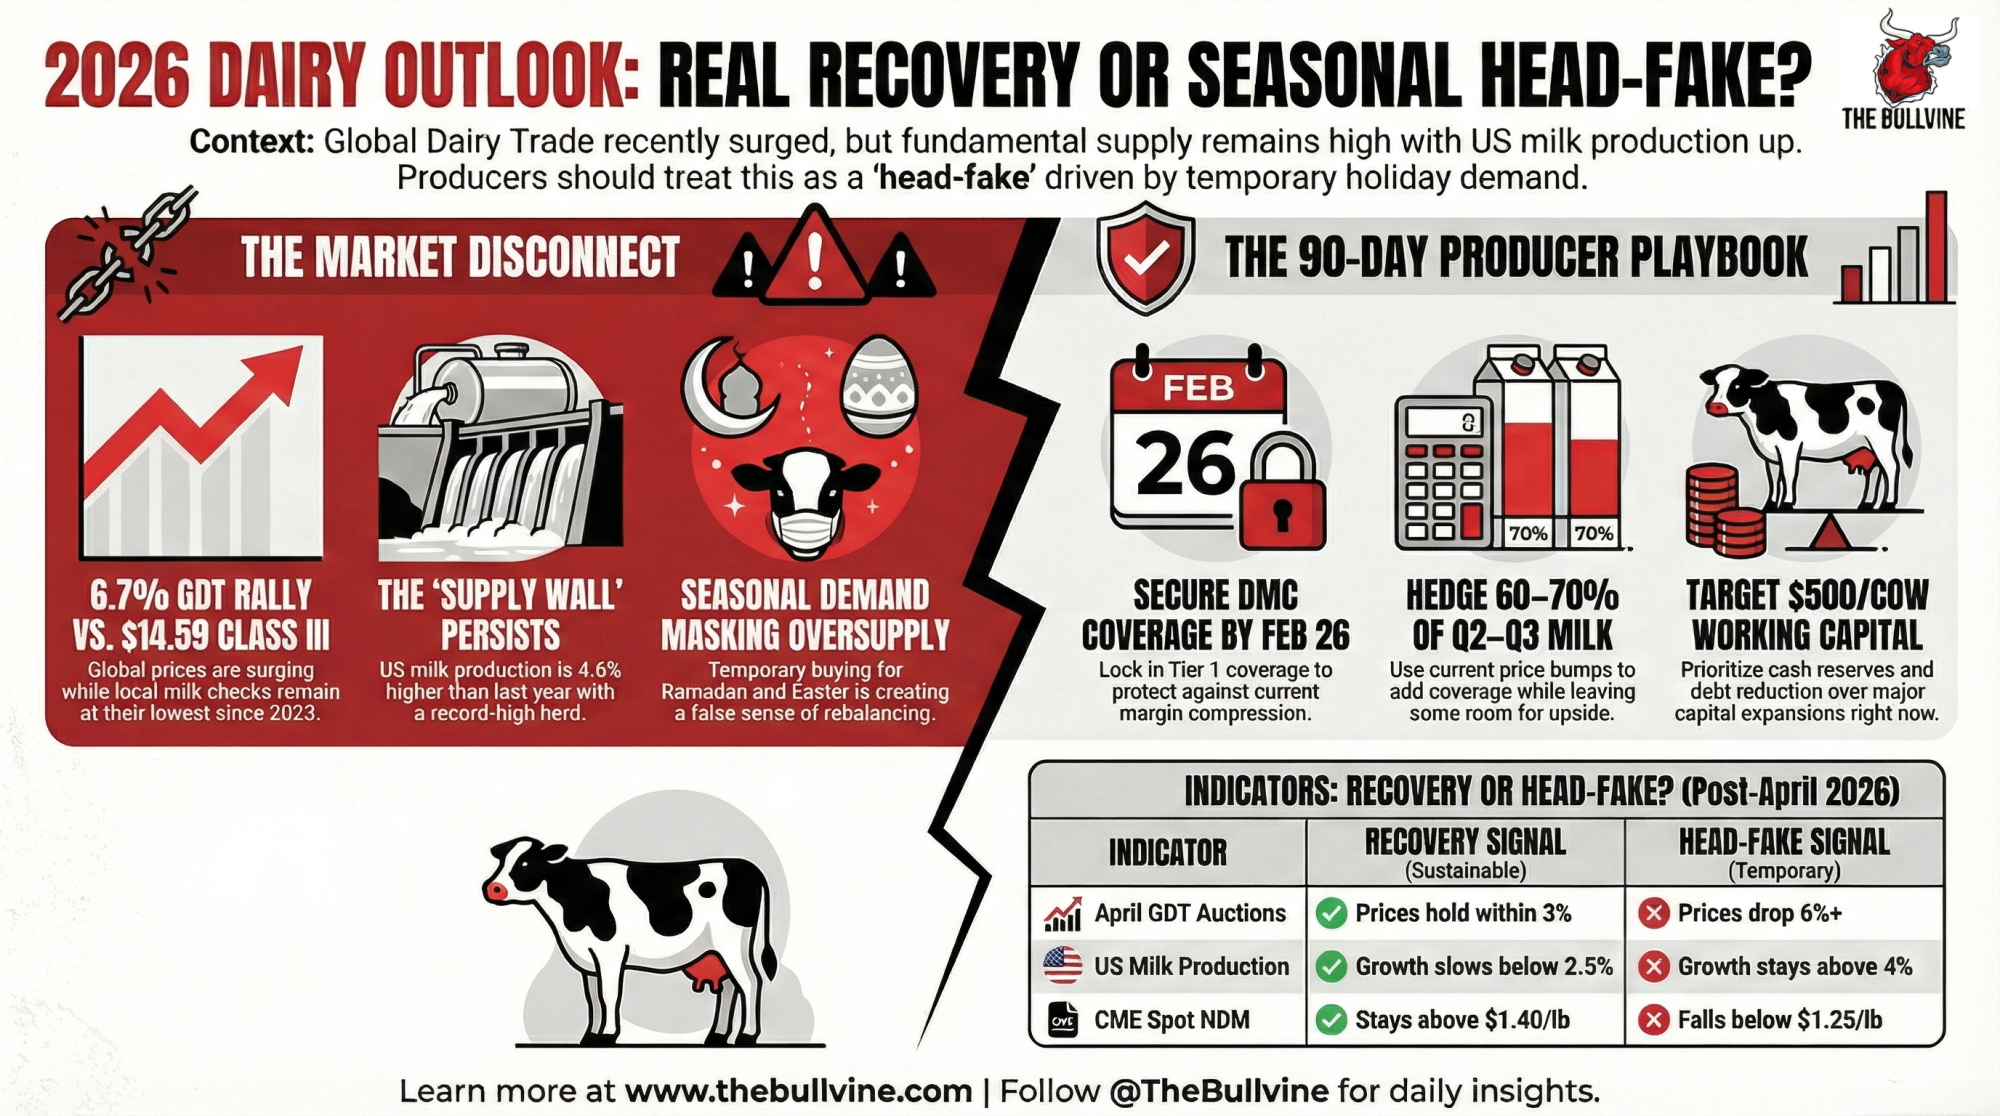
 Join the Revolution!
 Join the Revolution!