Archive for Class III milk price

$15 Pizza. 73-Cent Milk Check. The Real Super Bowl Score for Dairy Farmers.

America eats 29 million pounds of cheese today — and the FMMO make allowance ensures your share keeps shrinking.

EXECUTIVE SUMMARY: Americans are tearing into an estimated 29 million pounds of cheese today — six times normal daily volume — and the dairy farmer’s cut of a $15 Super Bowl pizza is 73 cents at January’s Class III price of $14.59/cwt. USDA’s June 2025 make allowance increases widened that gap, diverting an additional 85–93 cents per hundredweight from producer pools to processors and pulling $337 million from farm-level revenue in the first 90 days alone, per the American Farm Bureau Federation’s analysis. The demand story is real; the margin story isn’t. Illinois FBFM data shows dairy operations lost $409 per cow in 2024 on a total economic cost basis — even with per capita cheese consumption hovering near all-time highs. Wisconsin producer Mike Yager calculated the make allowance hit on his 275-cow Mineral Point operation at roughly $55,868 per year in value that now stays with the processor, and says no new premiums have materialized to offset it. If your cash costs are above $17.50/cwt and your order’s blend is anywhere near Class III, your working capital is eroding monthly — and tonight’s pizza binge won’t change that.  The lever that matters now: ensuring USDA’s mandatory biennial processor cost surveys — authorized under the One Big Beautiful Bill Act signed July 4, 2025 — launch on a concrete timeline and include mozzarella, the dominant Super Bowl cheese, which is currently excluded entirely from USDA pricing surveys.”

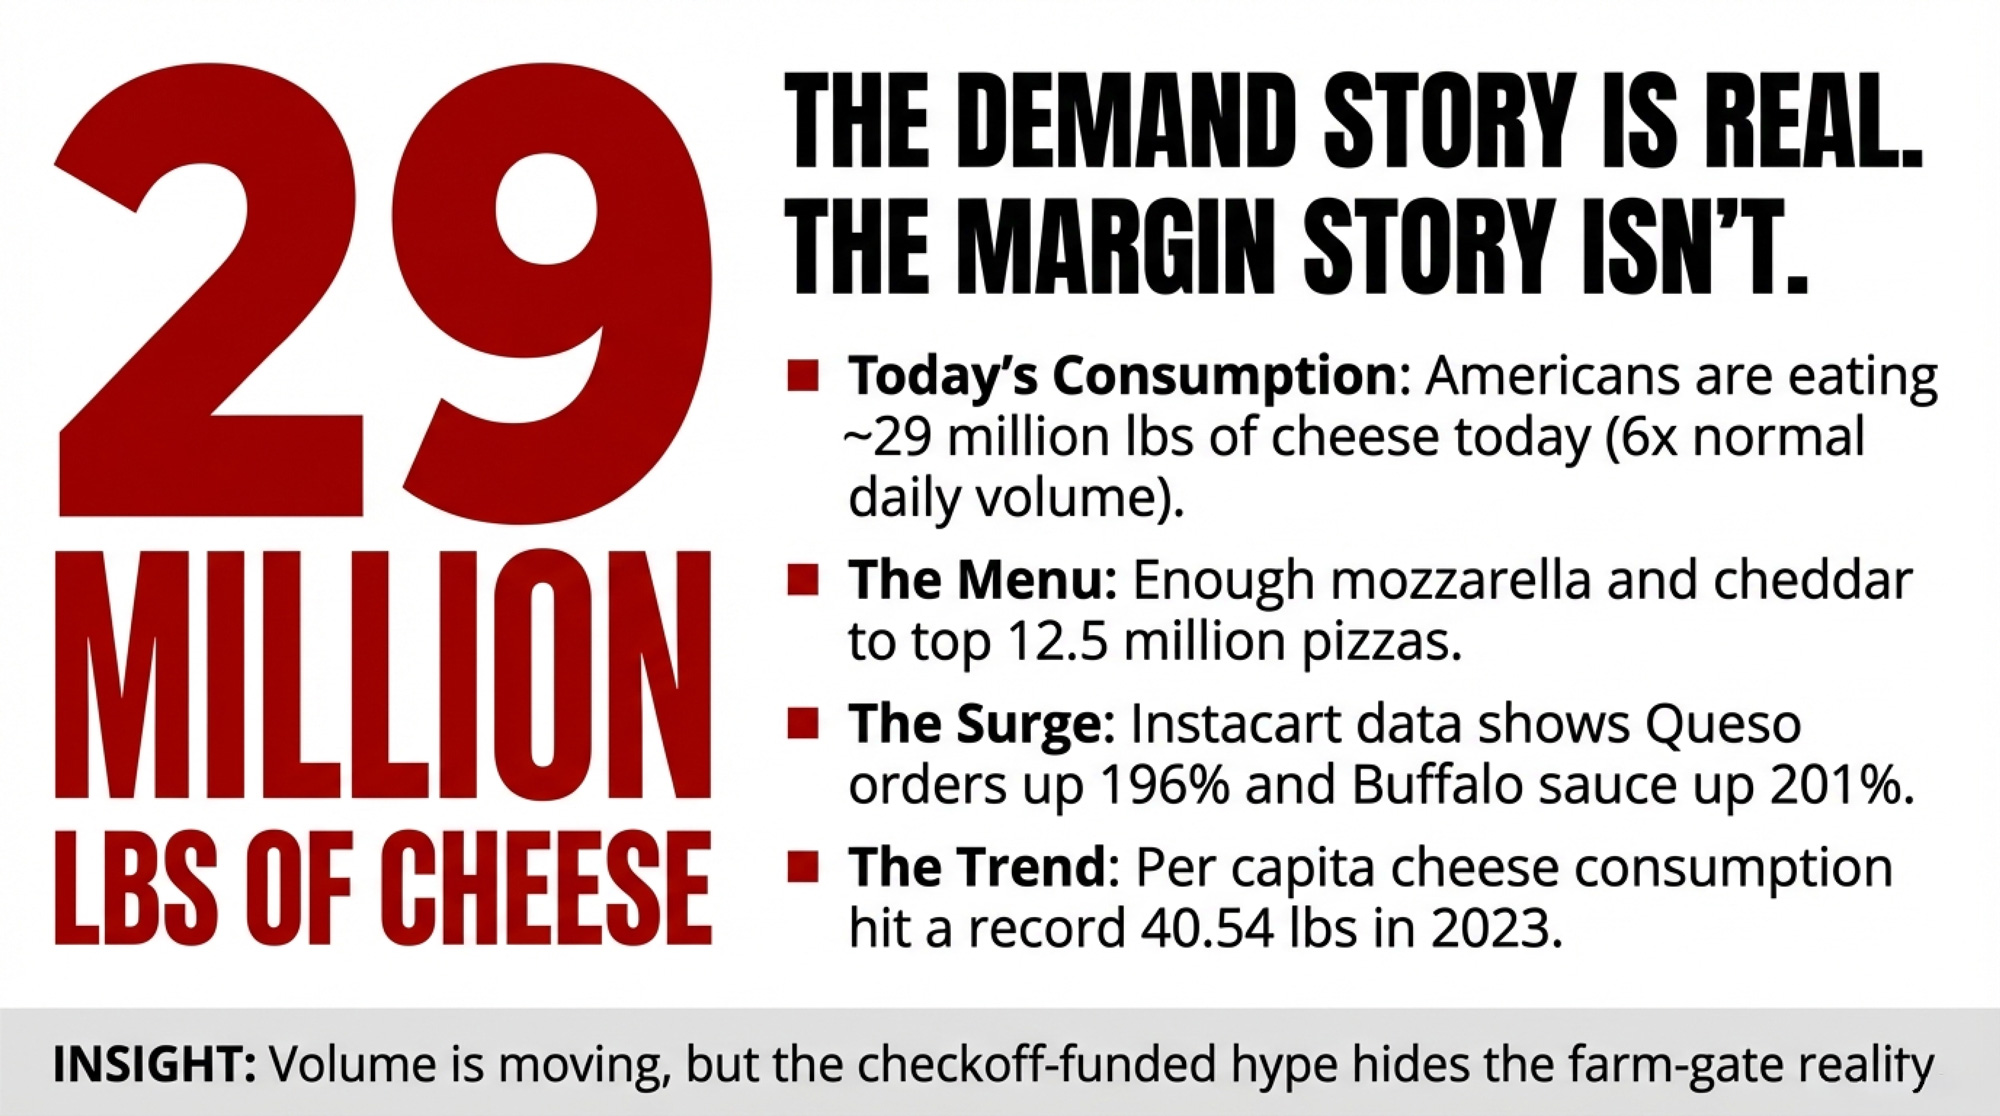
Right about now, Americans are tearing into an estimated 29 million pounds of cheese. That’s the number Dairy Farmers of Wisconsin — the checkoff-funded marketing organization funded by farmers themselves — projects for Super Bowl Sunday, roughly six times what the country consumes on a normal day. Enough mozzarella, cheddar, pepper jack, and queso to top 12.5 million pizzas, fill millions of nacho platters, and anchor every cheese board from Seattle to Miami. Instacart’s 2026 Super Bowl data shows just how dairy-heavy the day has become: queso orders surged 196% and buffalo sauce — the stuff that goes on wings destined for ranch and blue cheese dip — jumped 201% during game week. 

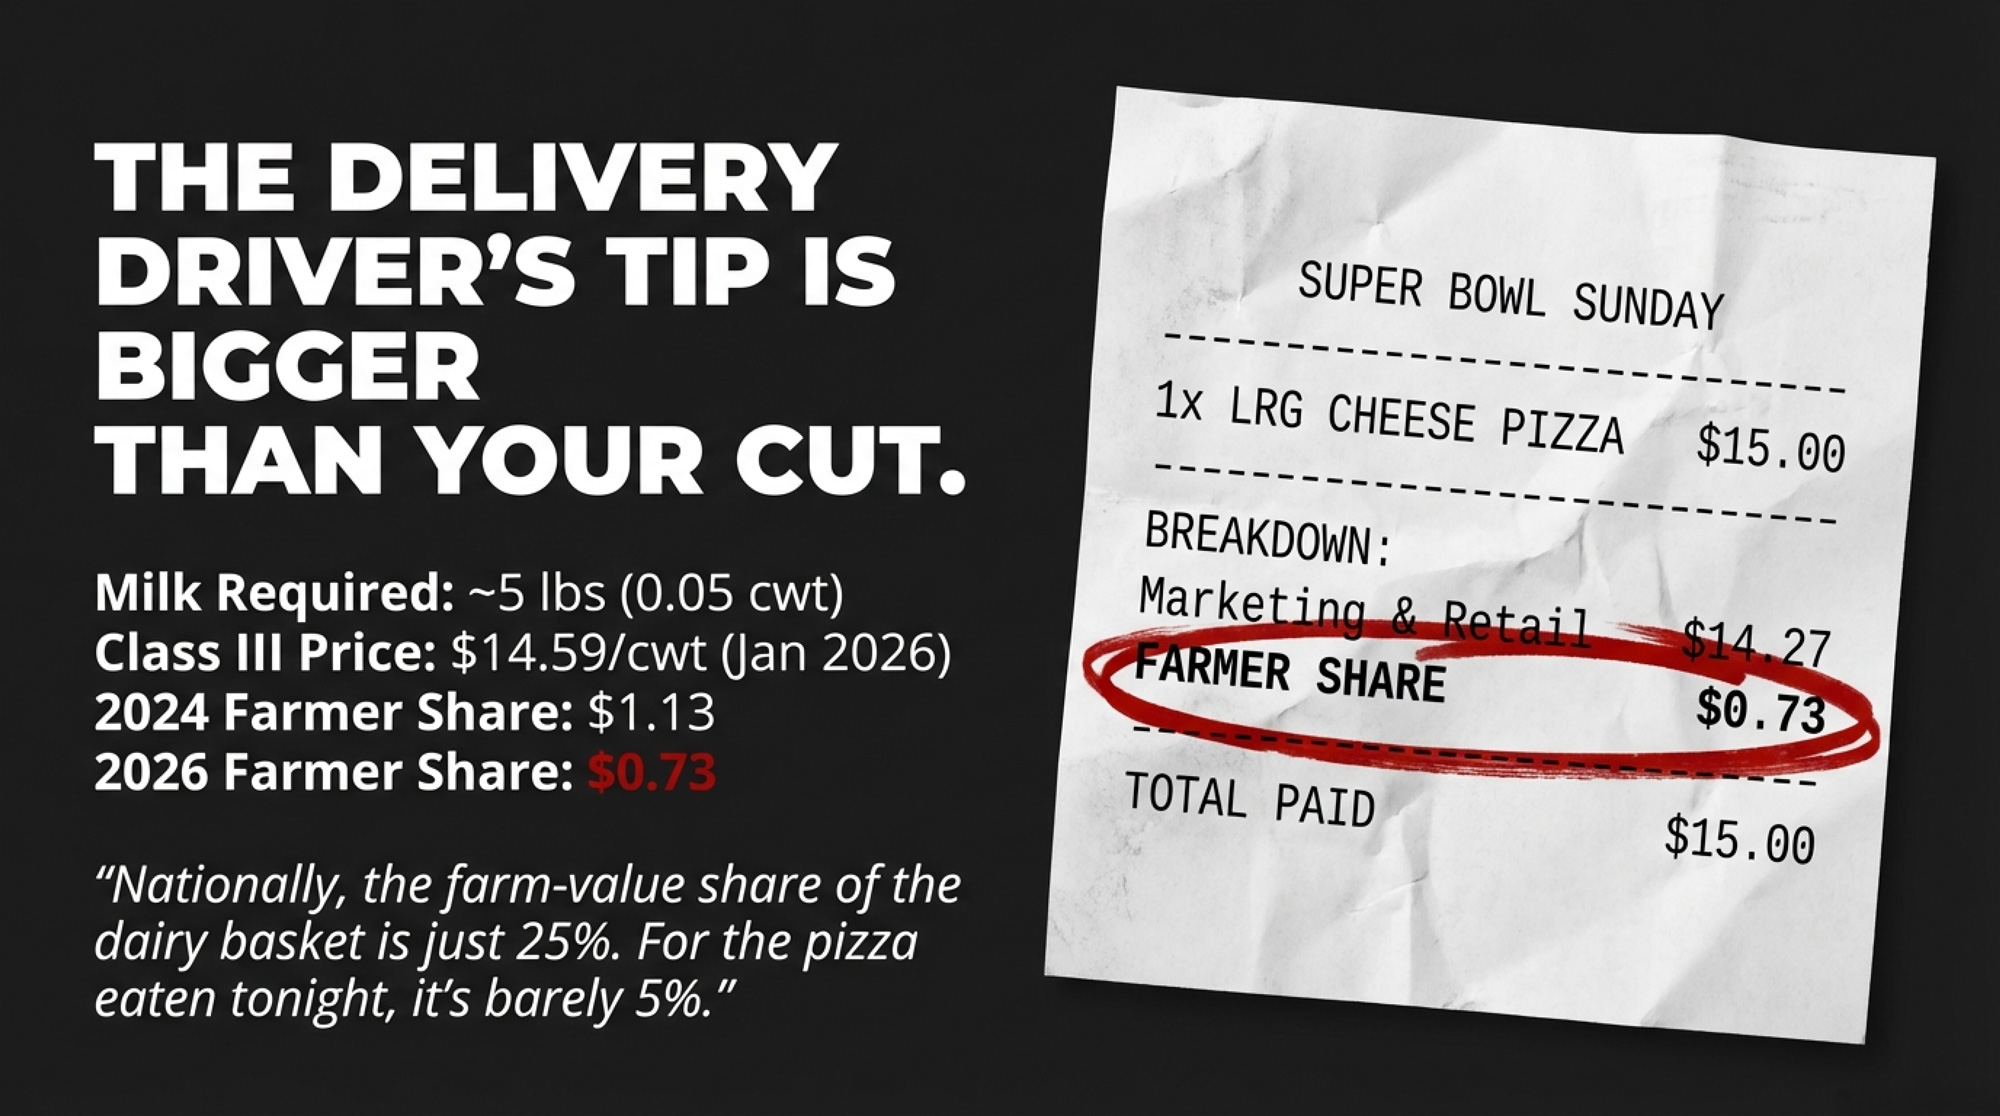
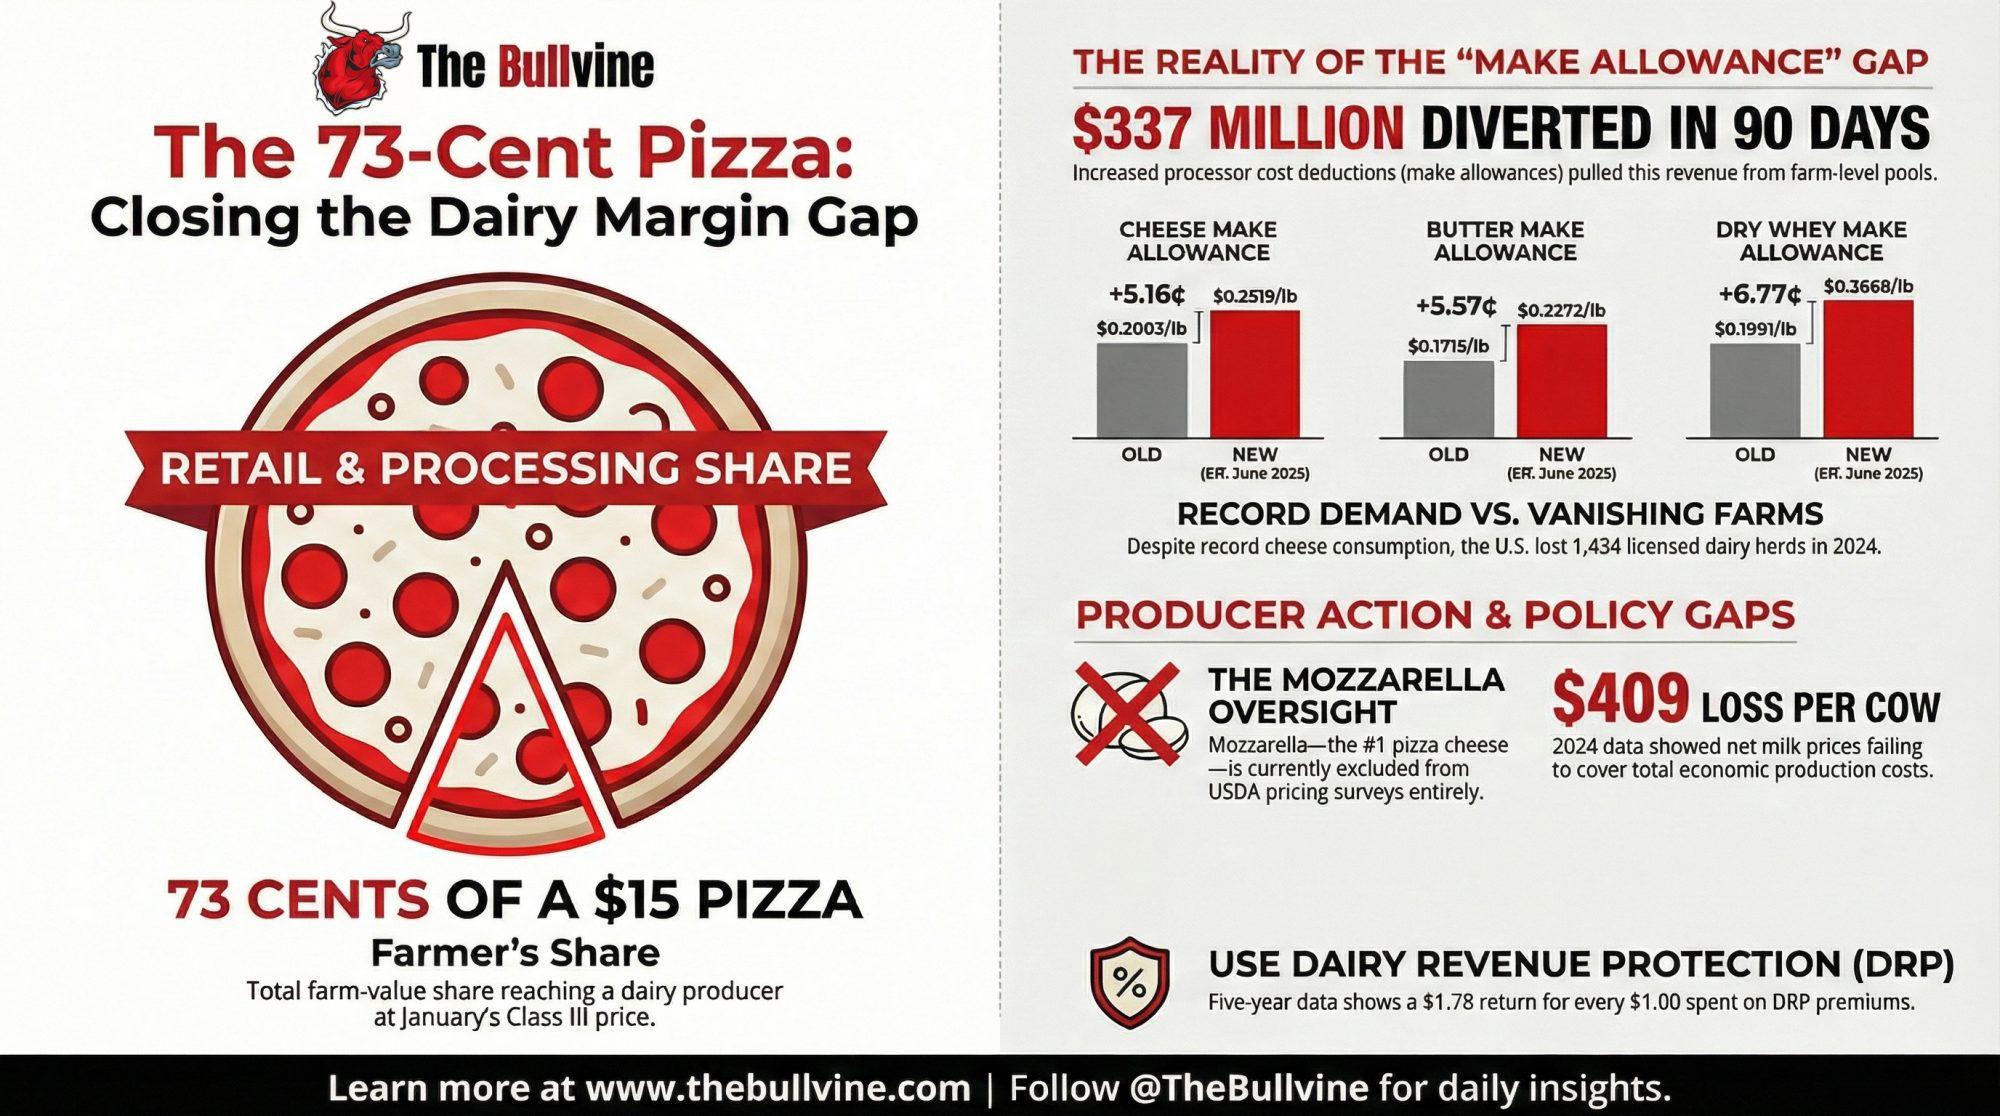
Here’s the kicker: the same farmers who pay into that checkoff fund to promote cheese are getting about $0.73 of farm value on a $15 pizza when January’s Class III sits at $14.59 per hundredweight. If February futures hold near $15.92, that climbs to about 80 cents. Either way, the delivery driver’s tip is almost certainly larger. The FMMO formula is supposed to connect consumer demand with farm-gate value. Super Bowl Sunday is Exhibit A for why it doesn’t. 

The Demand Is Real — the Margin Isn’t

That volume translates to real dollars at retail — just not at the farm gate. Wells Fargo’s Agri-Food Institute pegs the average 10-person Super Bowl party spread at about $140 in 2026, up just 1.6% from last year — below the 2.4% food-at-home CPI. Frozen pizza prices actually fell 0.6% year over year. For consumers, dairy-heavy game-day food is a bargain. 

Those party-spread prices reflect a deeper pattern. Per capita total cheese consumption hit a record 40.54 pounds in 2023 — the third straight record year, according to USDA ERS data published in late 2024. Then, in 2024, it slipped to the lowest level since 2021, per the ERS’s January 2026 update — the first year-over-year decline since at least 2013. Even at record or near-record consumption, the economics at the farm gate keep tightening. 

A note on the 29-million-pound figure: this is a promotional estimate from a checkoff-funded organization, not an independently audited figure. It’s been used for at least the 2024 and 2025 Super Bowls; no 2026-specific update had been published at the time of writing. Treat it as a credible industry estimate, not a USDA-verified statistic.

Following 73 Cents from the Pizza Box to the Bulk Tank

A standard large pizza uses roughly half a pound of mozzarella. Industry yield runs about 10 pounds of milk per pound of cheese. One pizza, therefore, requires approximately 5 pounds of milk — or 0.05 hundredweight.

0.05 cwt × $14.59/cwt (January 2026 Class III, USDA AMS) = $0.73

At 2024’s all-milk price of $22.55 per hundredweight (USDA ERS annual data), that same pizza returned about $1.13 to the farm — still under 8% of the retail price. As of January 2026, Class III levels are barely 5%. 

USDA ERS published its 2024 farm-to-retail price spread data in June 2025. Nationally, the farm-value share of the dairy product basket was 25 percent, up from 23 percent in 2023. For cheddar specifically, the farm value was $1.80 per pound against a retail price of $5.66 — a 32 percent farm share. Butter fared better at 57 percent. But cheese — which is what’s disappearing tonight — sits squarely in that one-quarter-to-one-third zone. 

The farmer’s share of a $15 Super Bowl pizza: 73 cents. The delivery driver’s tip is almost certainly larger.

PeriodFarm Value ($)Processor/Retail ($)Class III ($/cwt)
Jan 20260.7314.2714.59
Feb 2026 Futures0.8014.2015.92
2024 Average1.1313.8722.55

That’s what happens when the formula pays everyone else first and hands you what’s left

How the FMMO Make Allowance Sets Your Price Before Game Day

On June 1, 2025, USDA raised the make allowances embedded in all 11 Federal Milk Marketing Orders—the first update since the FMMO system was consolidated in January 2000. These are the processing cost deductions that come off wholesale commodity prices before any value reaches producers. 

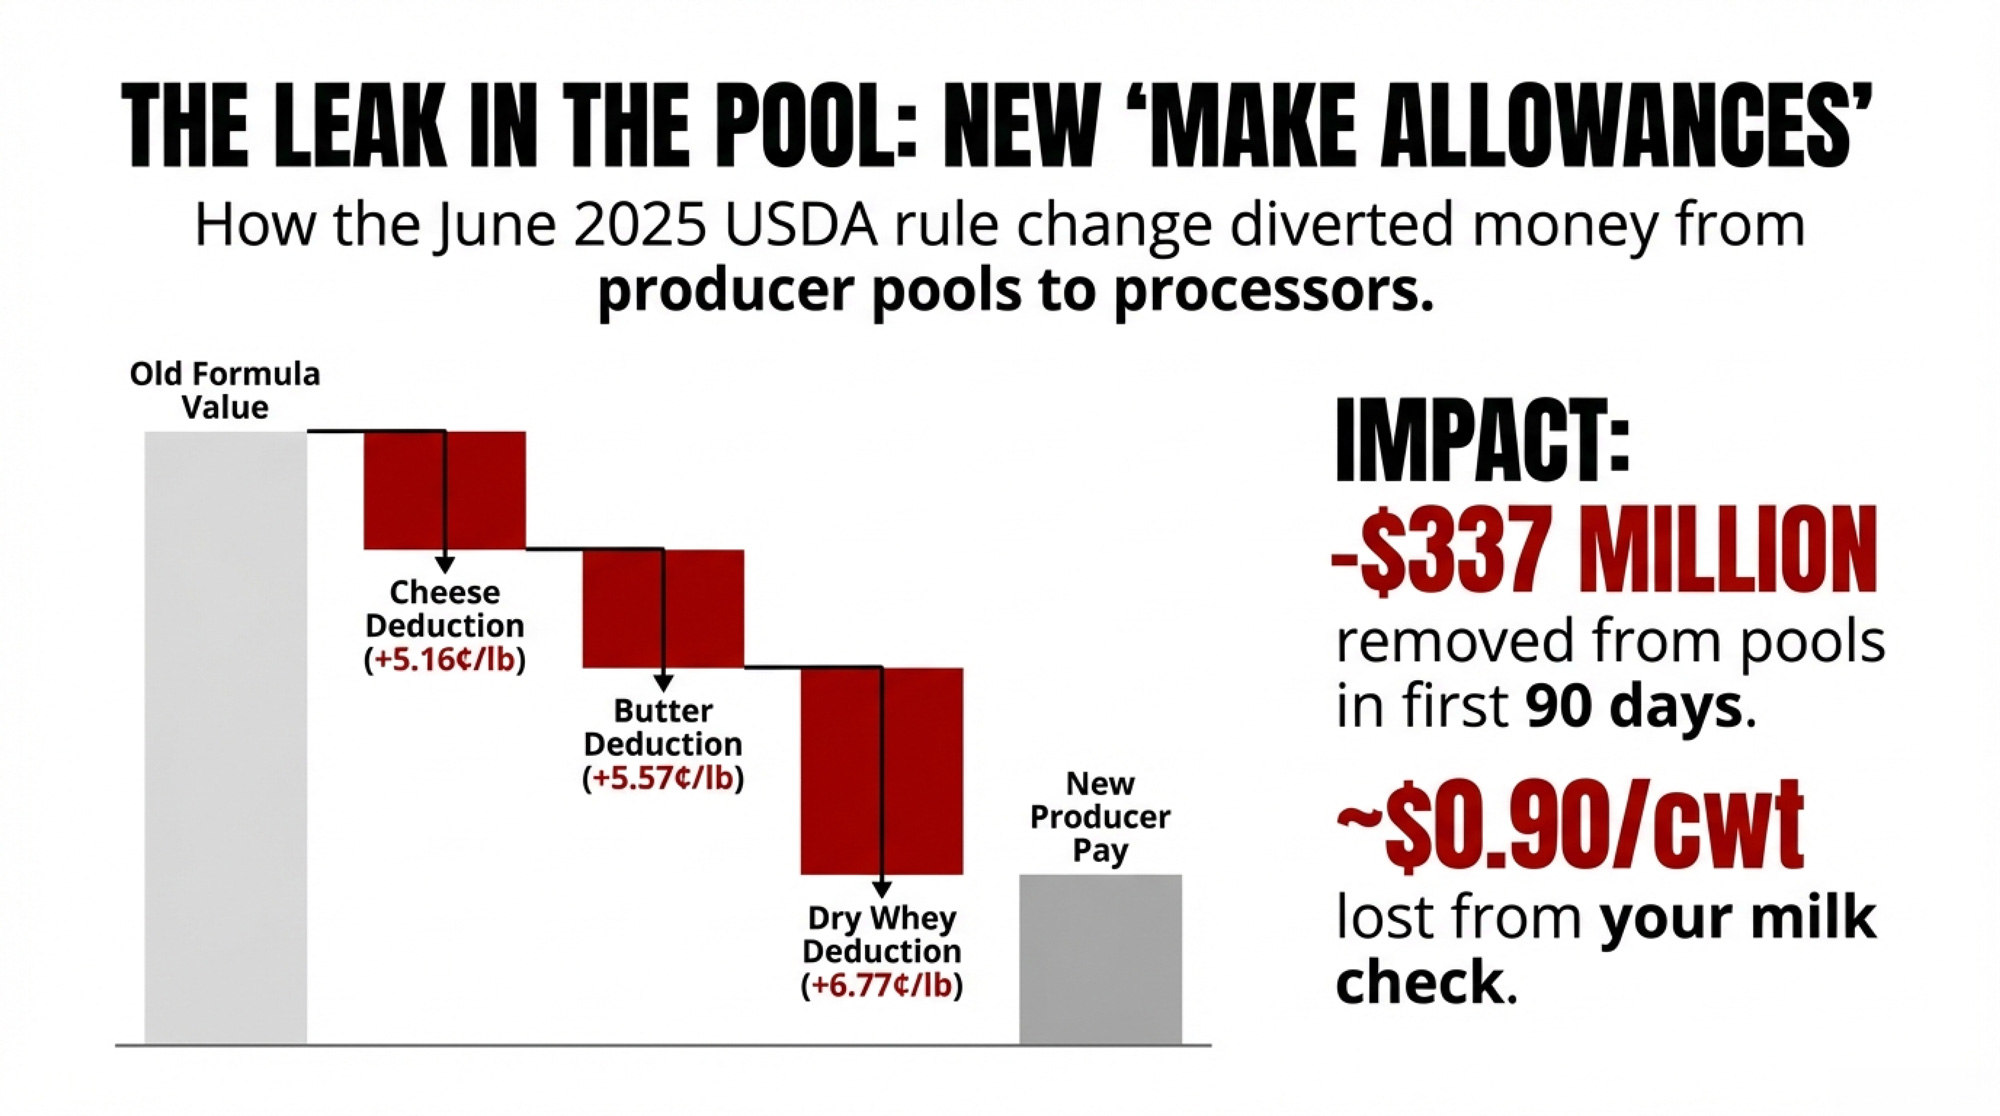
The American Farm Bureau Federation’s Danny Munch calculated the early damage: class price reductions ranging from 85 to 93 cents per hundredweight, pulling roughly $337 million out of combined producer pool values in just the first 90 days (AFBF Market Intel, September 21, 2025). As Munch told RFD-TV: “Dairy farmers were most concerned about the impact of increased make allowances because they reduce the price farmers receive, and were based on incomplete data during the hearing process”. 

ProductOld Make Allowance ($/lb)New Make Allowance ($/lb)Increase (¢/lb)Impact
Cheese$0.2003$0.25195.16¢Directly hits Super Bowl cheese
Butter$0.1715$0.22725.57¢Record high costs
Nonfat Dry Milk$0.1678$0.23937.15¢Highest increase
Dry Whey$0.1991$0.26686.77¢Wings & dip tax

Source: USDA Final Rule on FMMO Amendments, effective June 1, 2025

Take cheese at $1.60 per pound on the CME. Under the old formula, $1.3997 per pound flowed into Class III component values ($1.60 minus $0.2003). Under the new formula, only $1.3481 does ($1.60 minus $0.2519). That extra 5.16 cents per pound never hits the pool—it stays with the processor as cost recovery.

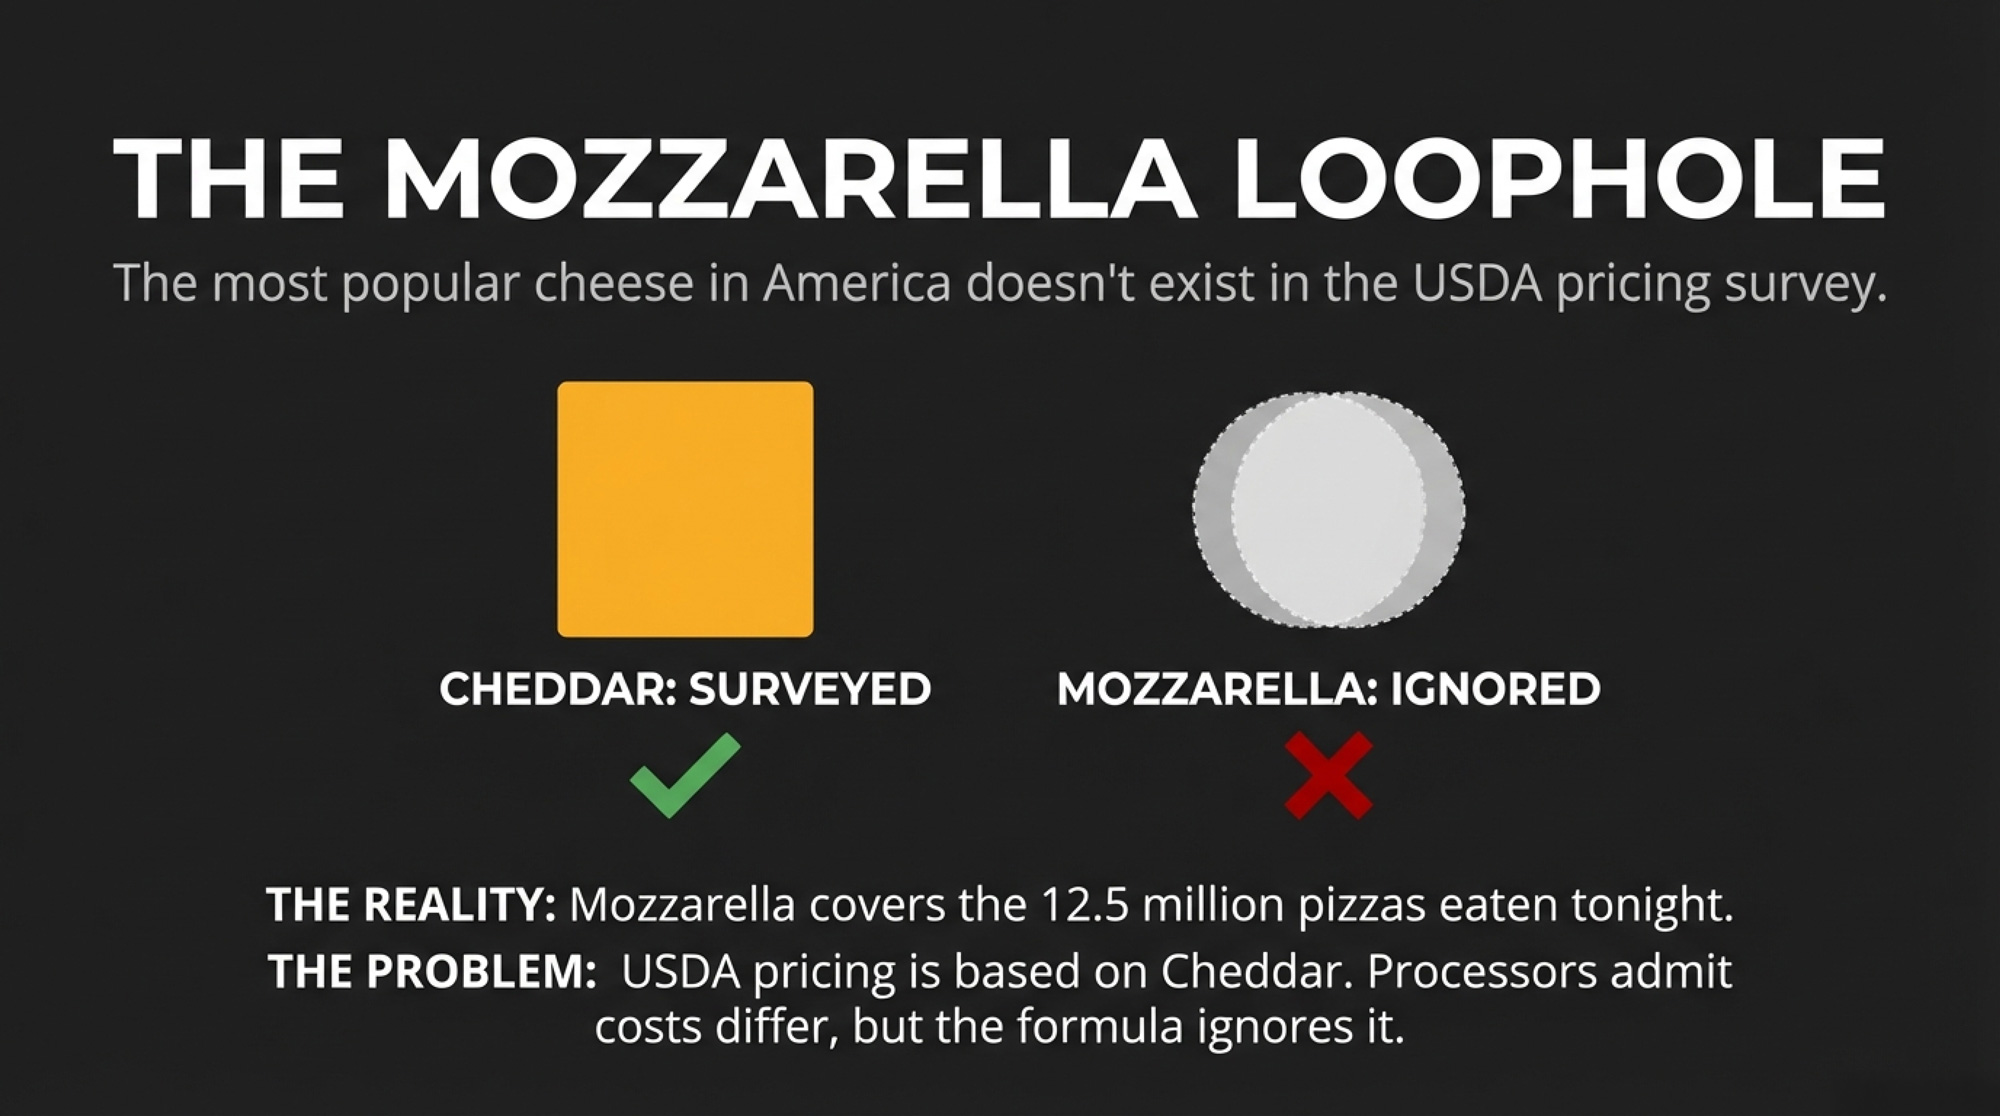
Here’s a detail that should land hard on Super Bowl Sunday: mozzarella — the single most consumed cheese in America, the cheese on every one of those 12.5 million pizzas tonight — is currently excluded from USDA’s pricing surveys and formula pricing entirely. The cheese-making allowance was set using cheddar processing cost data. Processors testified during the FMMO hearing that mozzarella processing costs differ from cheddar, yet the USDA doesn’t track them separately. The dominant game-day cheese is priced off a formula that doesn’t account for how it’s actually made. 

Processor costs are genuinely higher than they were in 2000 — energy, labor, and packaging all climbed. But AFBF argues the adjustments “must be grounded in comprehensive, mandatory and independently audited surveys” and warns there is “some likelihood that USDA’s changes will unfairly penalize dairy farmers by overstating processing costs”. The data the USDA used were self-selected and self-reported by processors and were not independently verified. 

So when 29 million pounds of cheese disappear tonight, every pound carries that larger deduction. And every hundredweight behind it pays the farmer less than it did a year ago — even if the block price on the CME hasn’t moved.

How Pizza Chains Lock In Their Price While You Ride the Cycle

Domino’s, Pizza Hut, and the major frozen pizza brands don’t buy mozzarella on the spot market in February. They negotiate supply contracts months in advance — typically locking prices or establishing cost-plus formulas that insulate them from short-term CME volatility. 

Tonight’s Super Bowl surge was priced into processor order books weeks or months ago. The demand spike is real, but it doesn’t create upward spot-market pressure that would flow back through Class III into your milk check. By the time 29 million pounds of cheese hits the coffee table, the price was already set. And by the time Americans order those 12.5 million pizzas tonight, Yager’s January milk check was already settled.

You’re selling milk into a Class III formula that resets monthly based on USDA commodity surveys. If CME blocks rally in February, you might see a modest lift in your March check. If they don’t, you won’t — regardless of how many pizzas Americans ordered tonight.

Record Cheese, Vanishing Farms: The Demand Paradox

Americans have never eaten more cheese over a sustained period than they did from 2021 through 2023 — three consecutive record years, peaking at 40.54 pounds per capita in 2023. And yet U.S. dairy farms keep closing at an accelerating rate.

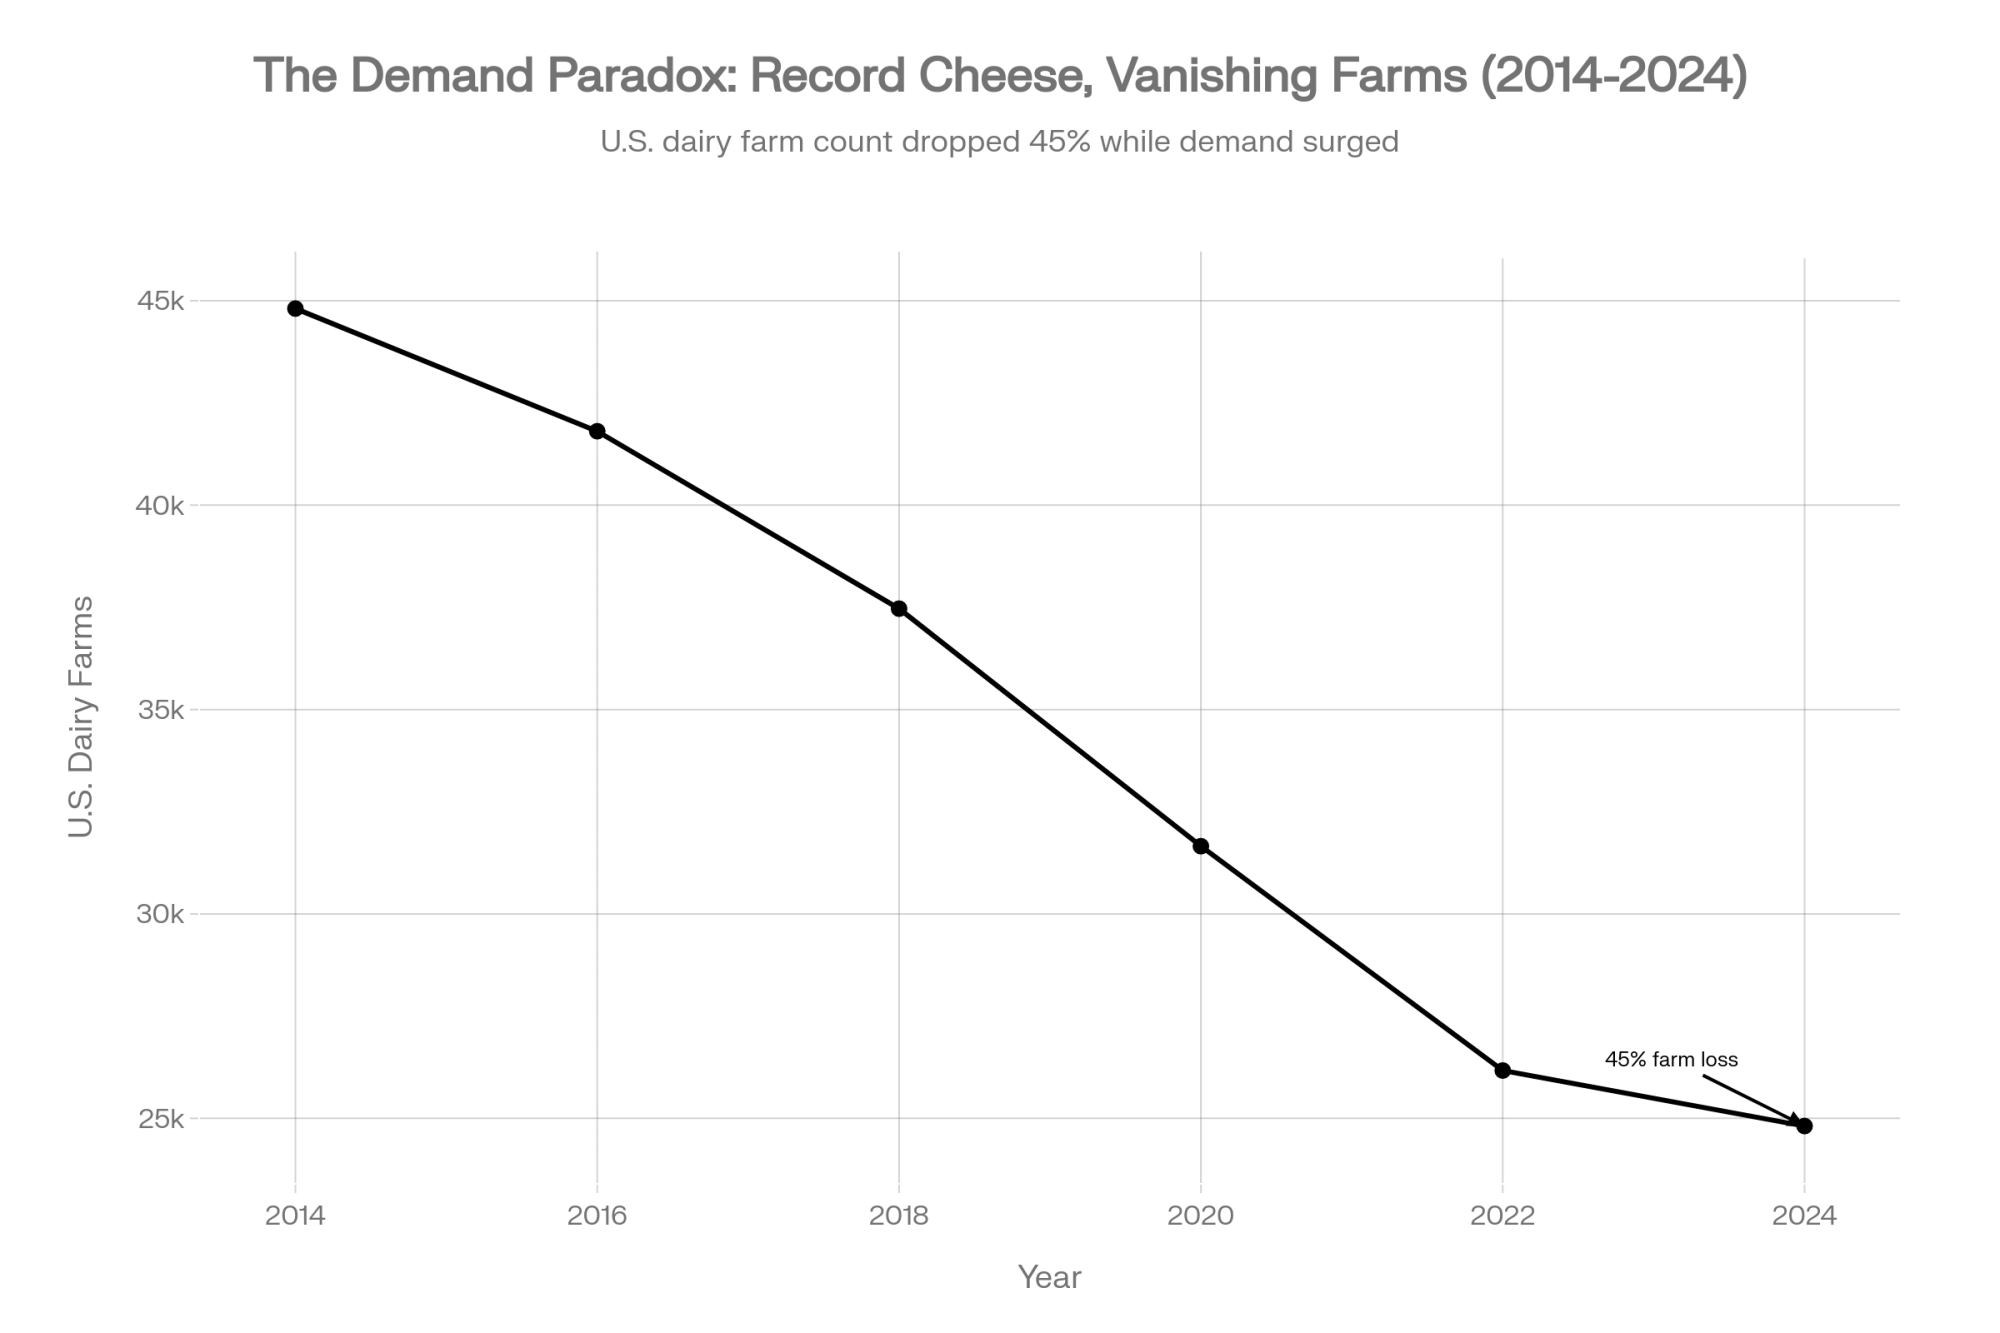
The numbers are stark. USDA NASS data shows the U.S. lost 1,434 licensed dairy herds in 2024 alone — a 5.5% decline in a single year, bringing the national total to 24,811 farms. That’s down from 44,809 just a decade earlier — a 45% loss since 2014. And 86% of the 2024 decline was concentrated in the Midwest and Eastern states: Wisconsin lost 400 herds, Minnesota and New York shed a combined 315, and Pennsylvania dropped another 90. 

RegionFarms Lost (2024)% of National LossImpact
Wisconsin40027.9%Worst hit
Minnesota18012.5%Severe
New York1359.4%Severe
Pennsylvania906.3%Major
Other Midwest/East42929.9%Critical belt
Western States20014.0%Growing regions
Total U.S.1,434100.0%5.5% decline

The Bullvine reported in October 2025 that 1,420 American dairy farms had exited in the prior year. If that pace continued or accelerated, The Bullvine estimated the 2025 total could approach 2,800 closures — though the actual figure depends on how many operations secured financing versus being forced out. Cornell’s Dr. Andrew Novakovic put it bluntly: “What took ten years then is happening in two or three now” (The Bullvine, November 2025). 

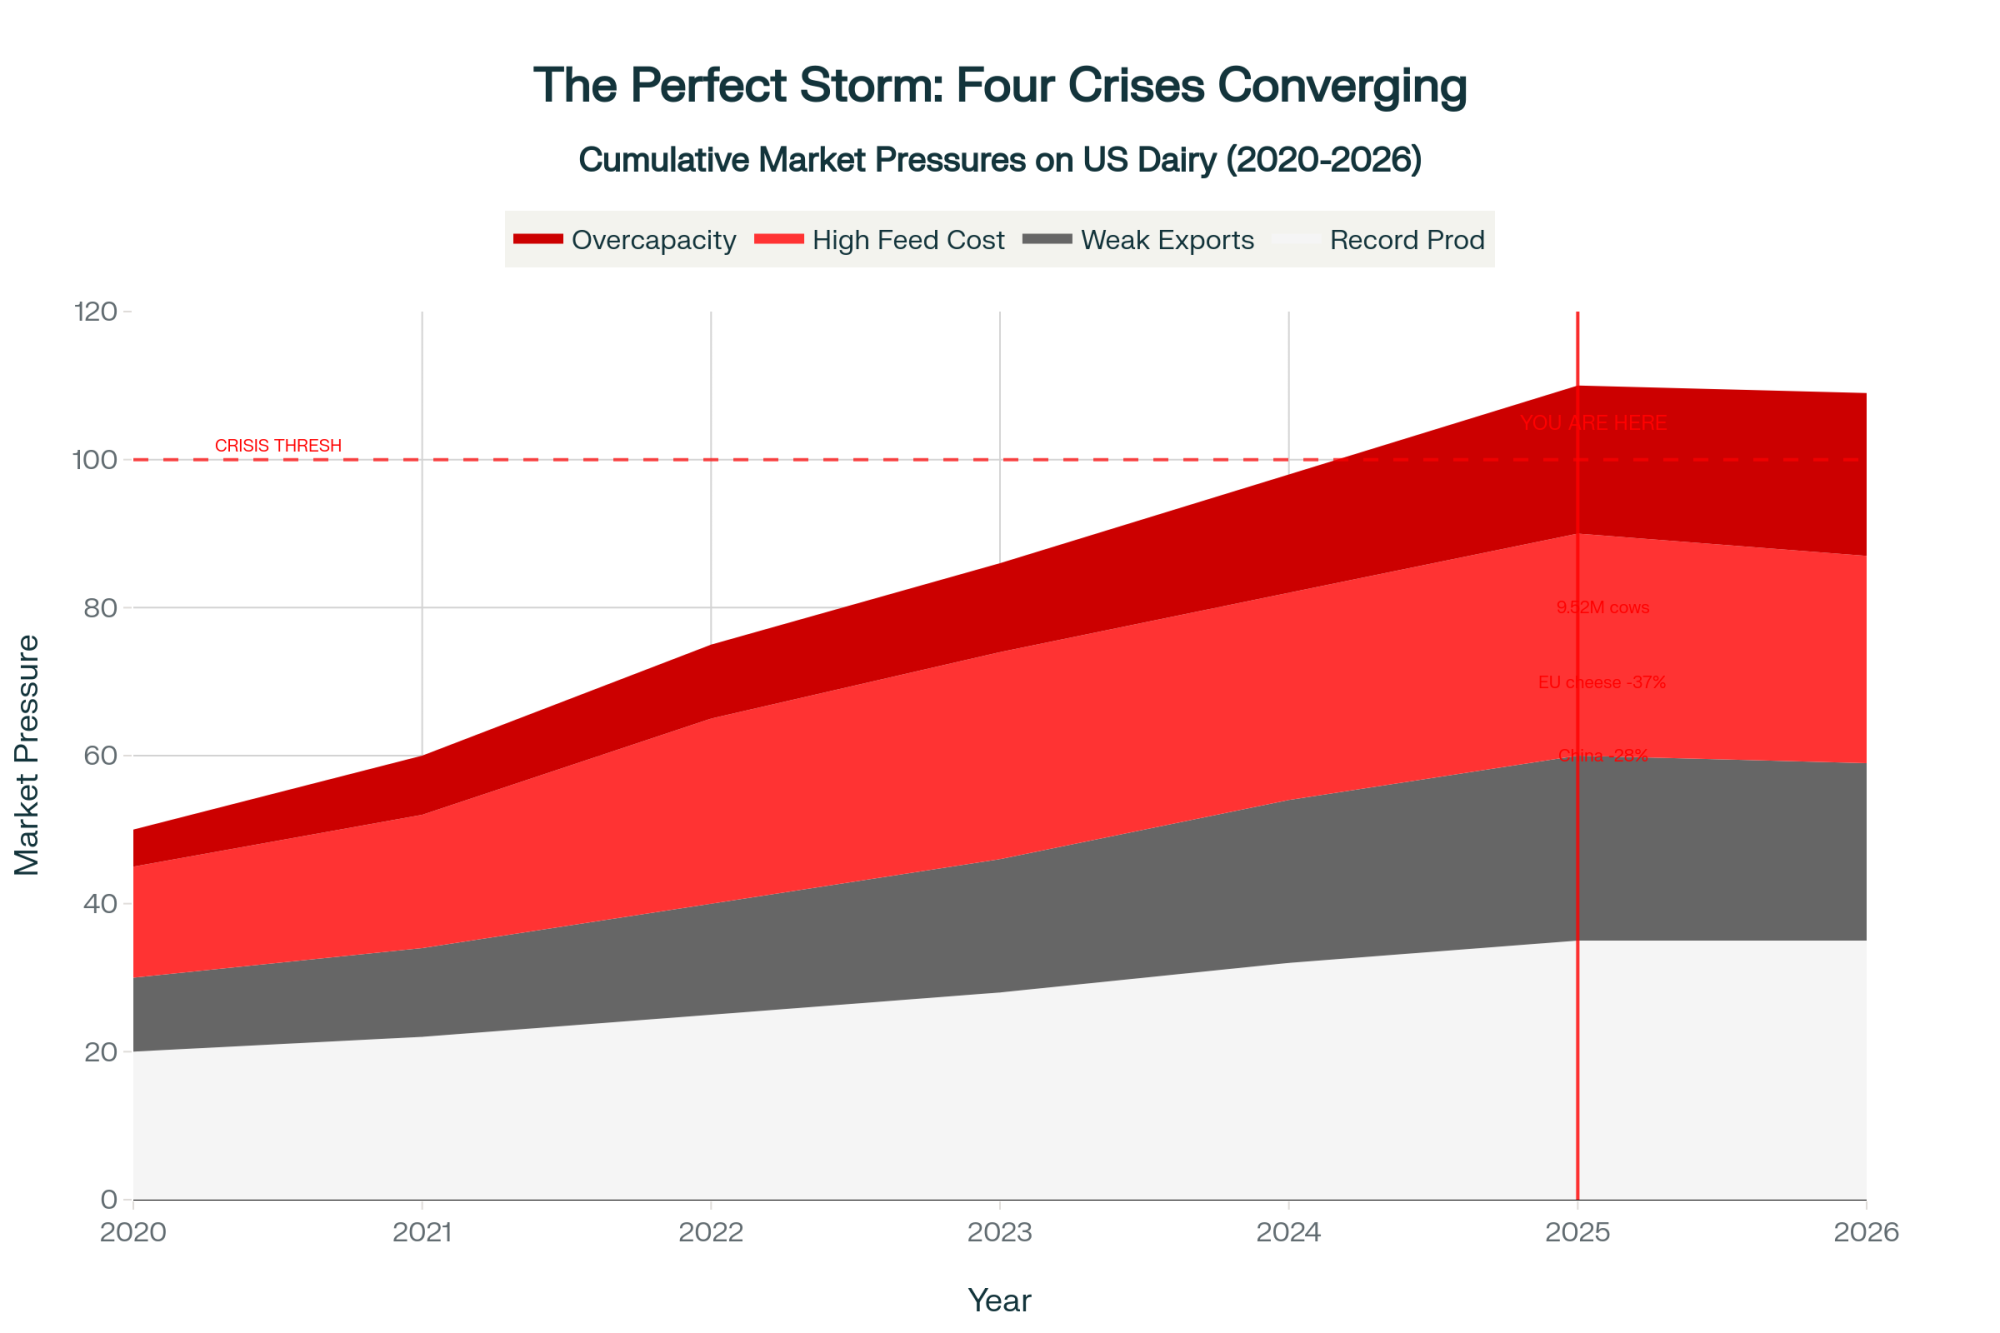
Processing capacity, meanwhile, is expanding in the opposite direction. Hilmar Cheese opened a $600 million facility in Dodge City, Kansas, in March 2025, specializing in American-style cheese in 40-pound commercial blocks and employing nearly 250 people. Great Lakes Cheese announced a $185 million expansion in Abilene, Texas, in 2024. These plants are designed to run for decades. And every one of them operates under the wider make allowances that took effect last June. 

The View from Two Federal Orders

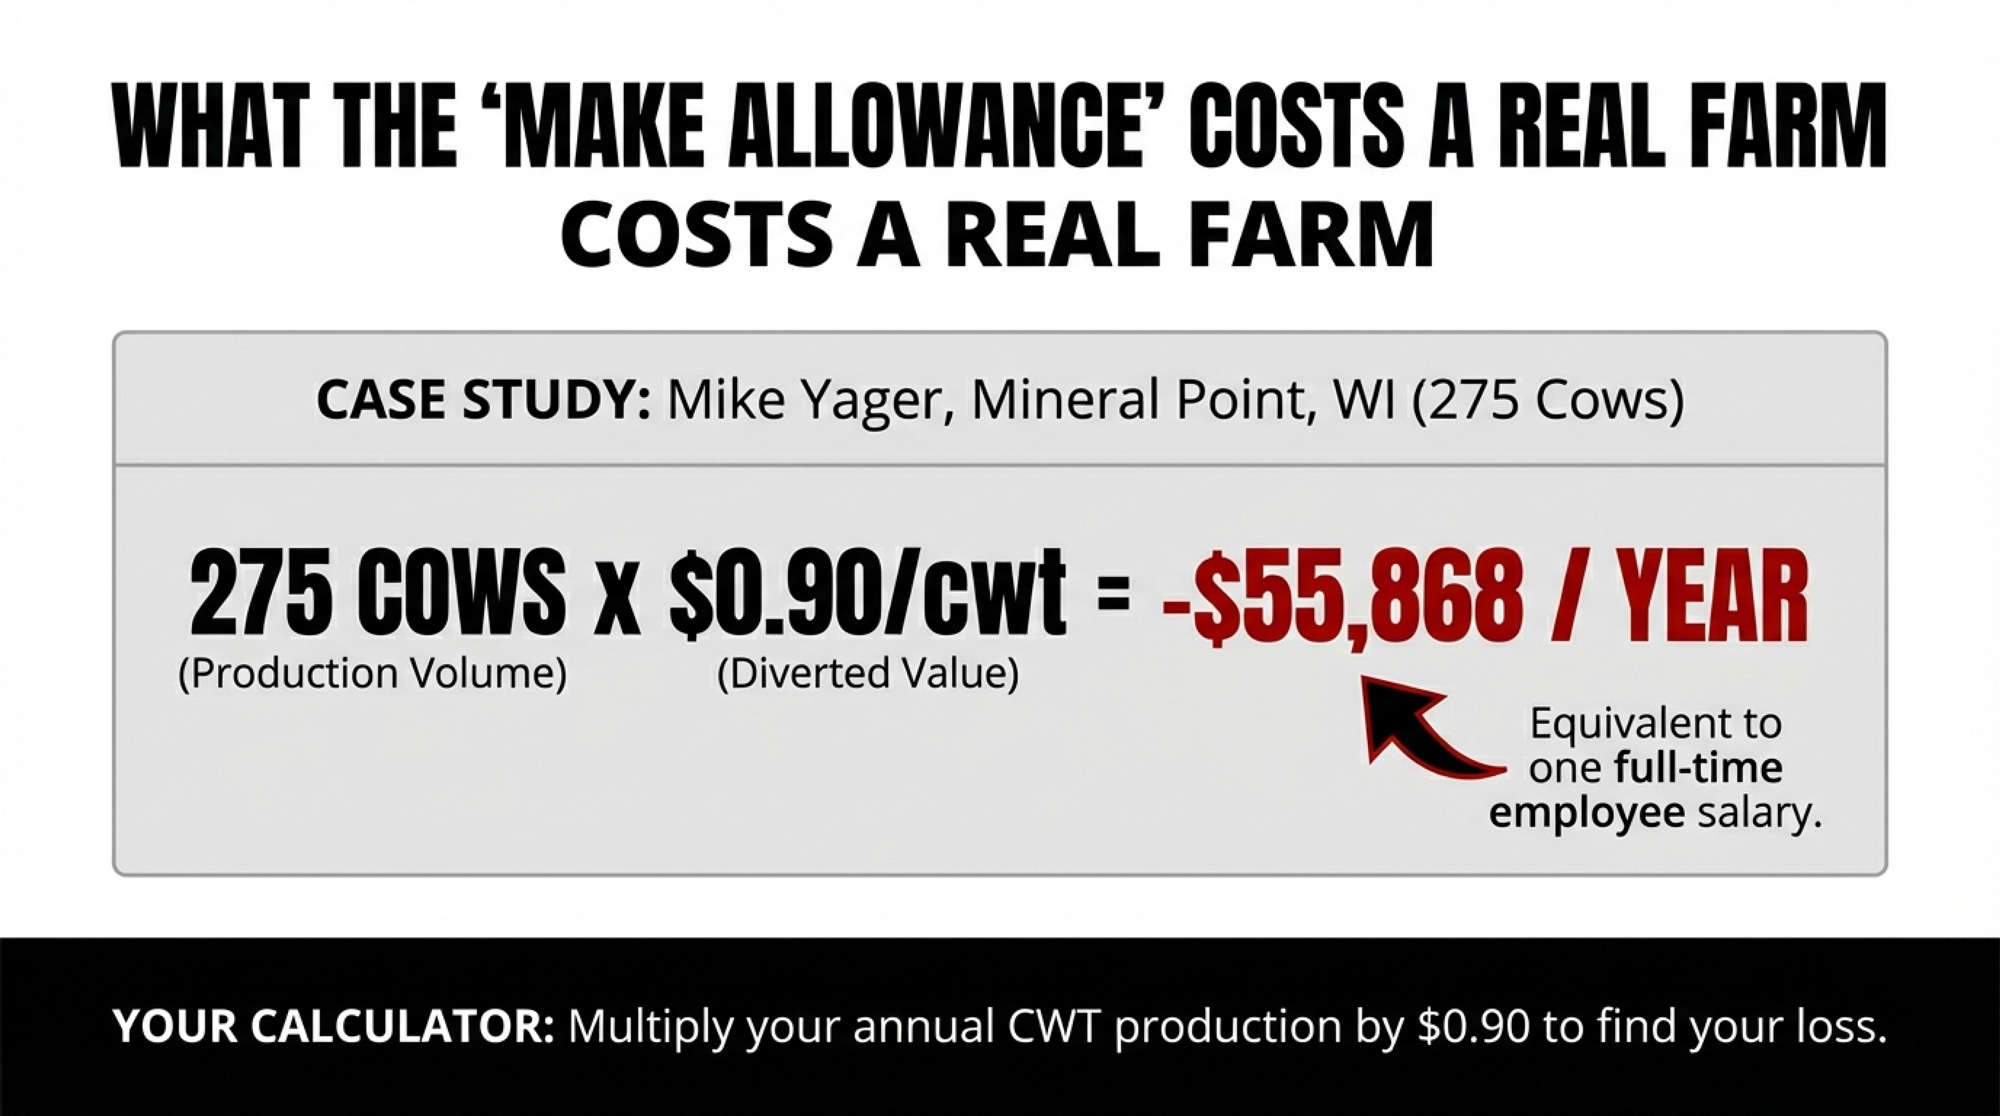
Mike Yager milks 275 Holsteins and grows feed crops near Mineral Point, Wisconsin — squarely in Federal Order 30, the Upper Midwest. When the make allowance increases hit last June, he did his own calculation: that additional 90 cents per hundredweight amounts to roughly $55,868 per year for an average-sized Wisconsin dairy in value that now stays with the processor instead of reaching the bulk tank. To estimate your own hit: multiply your total hundredweight shipped per year by $0.90. A 500-cow herd shipping around 110,000 cwt annually loses roughly $99,000 in pool value. 

Herd SizeAnnual Shipment (cwt)Annual Loss from Make AllowanceMonthly Impact
Mike Yager (275 cows)62,076$55,868$4,656
Average WI (500 cows)110,000$99,000$8,250
Large (1,000 cows)220,000$198,000$16,500
Mega (5,000 cows)1,100,000$990,000$82,500

“We as dairy farmers don’t see it on our milk checks. But via the new make allowances, we are losing out on 90 cents per hundredweight additional money that the processors are now receiving.” — Mike Yager, Brownfield Ag News, November 2025 

For his operation, that deficit is roughly equivalent to an employee’s salary. And so far, he says, no added premiums have materialized to offset the loss. 

The regional numbers vary, but no federal order escaped the hit. In the Northeast, the Milk Dealers and Distributors Industry Association warned during FMMO hearings that reduced minimum prices would be “particularly problematic” amid “widespread and accelerating exit of Northeast dairy farmers” — and could push the milkshed past a point of no return. Calvin Covington estimated Southeast orders will see the largest net benefit from updated Class I differentials — an average $1.42/cwt increase, but only on Class I volume. For Upper Midwest producers like Yager, where the blend skews heavily toward Class III, the make allowance hit lands harder, and the Class I differential cushion is thinner. 

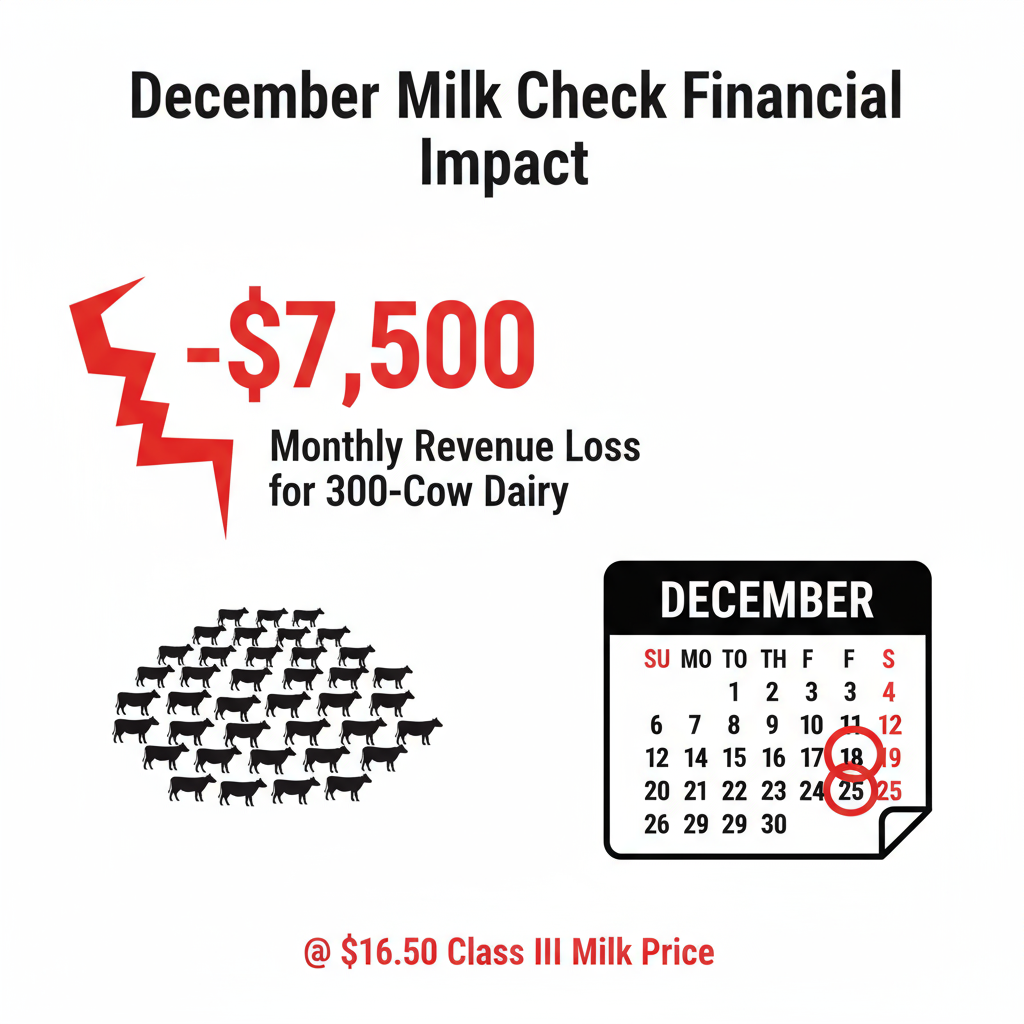
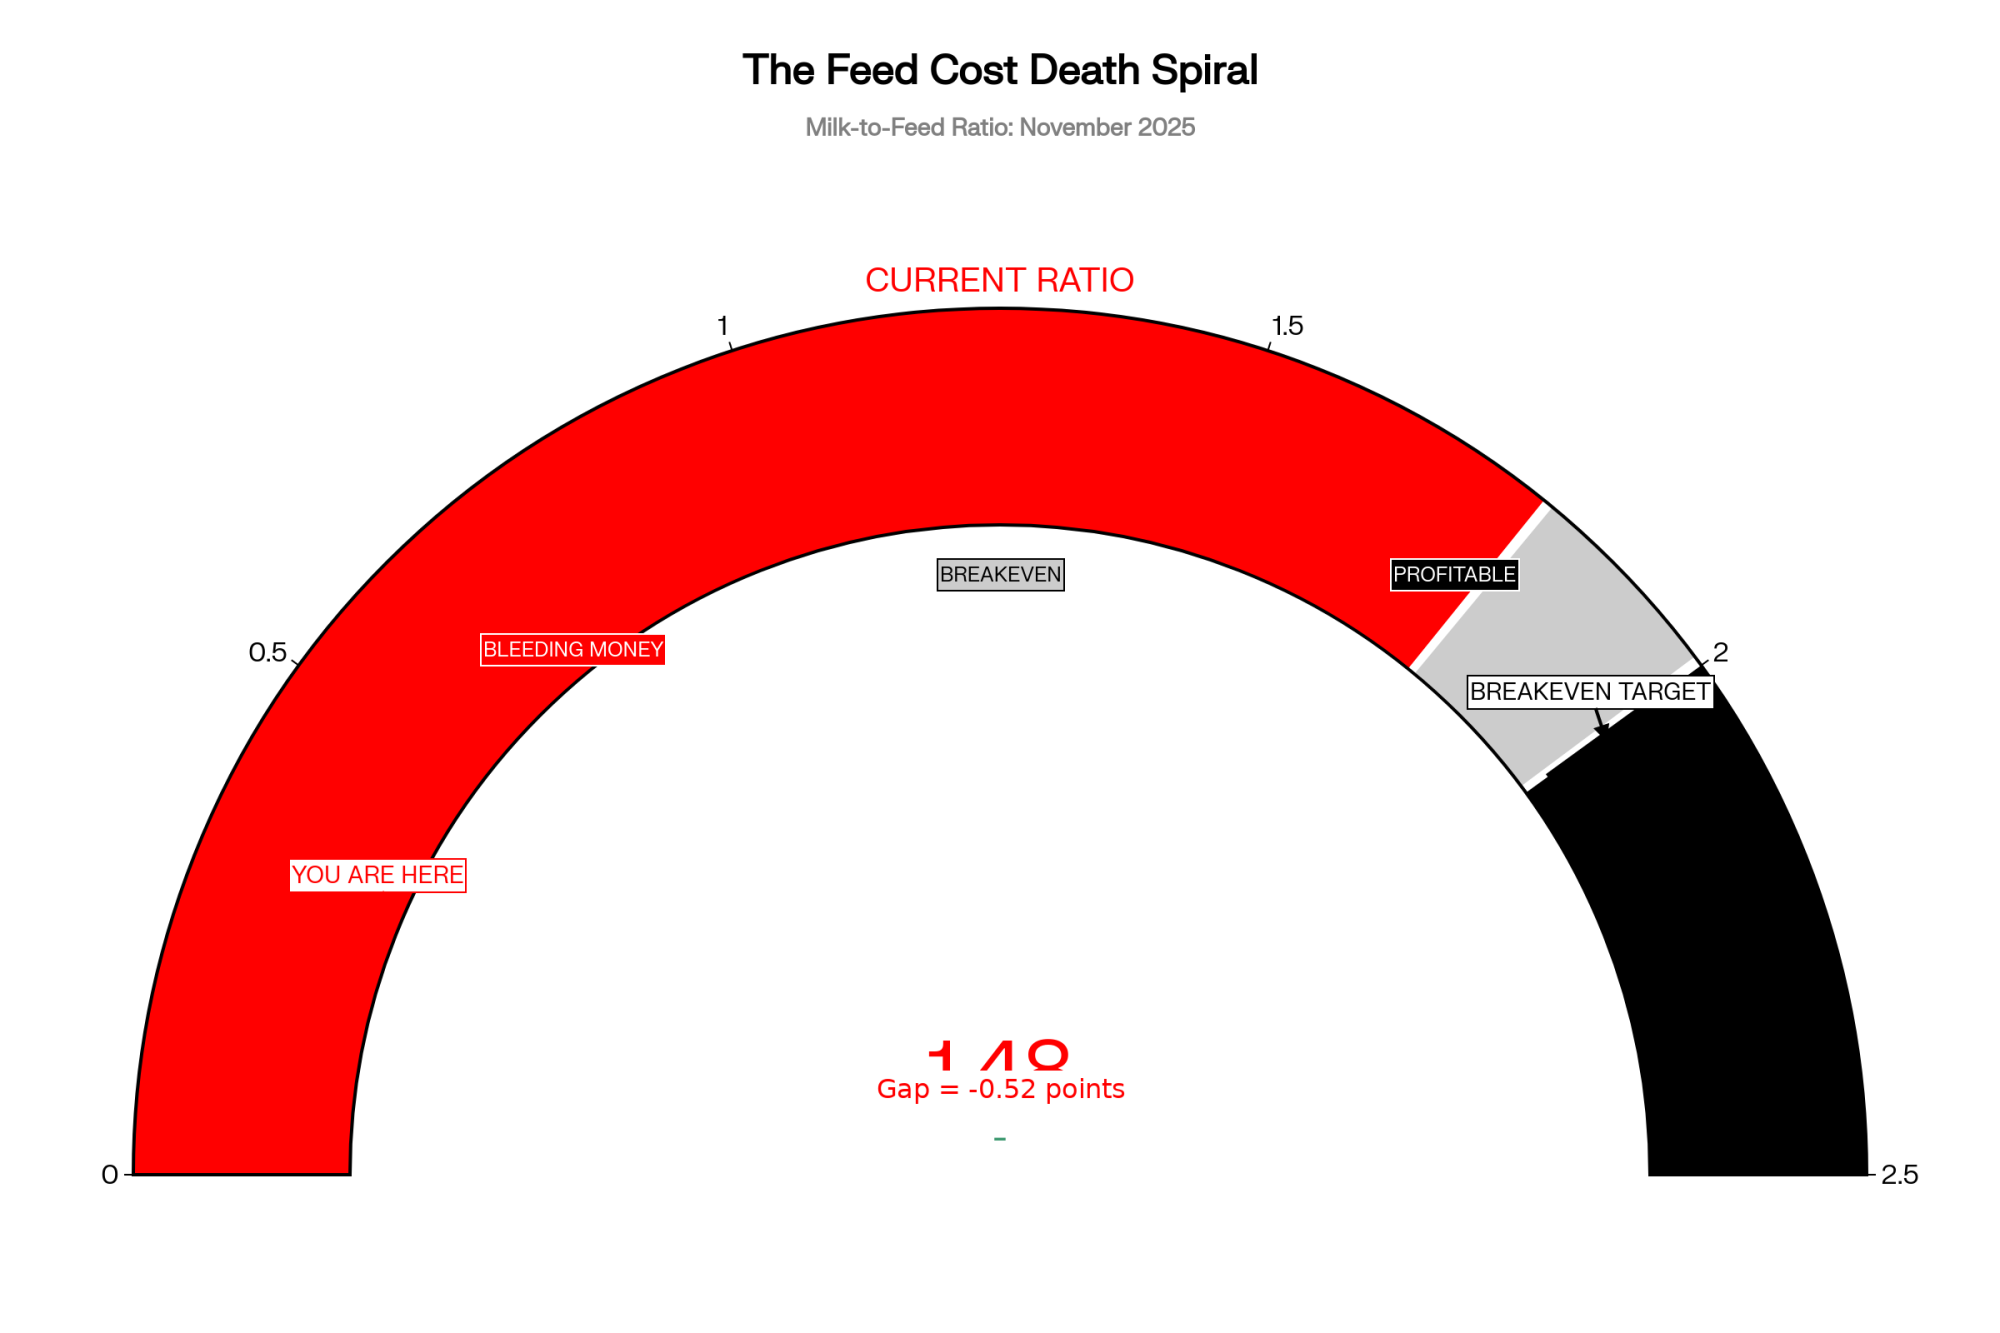
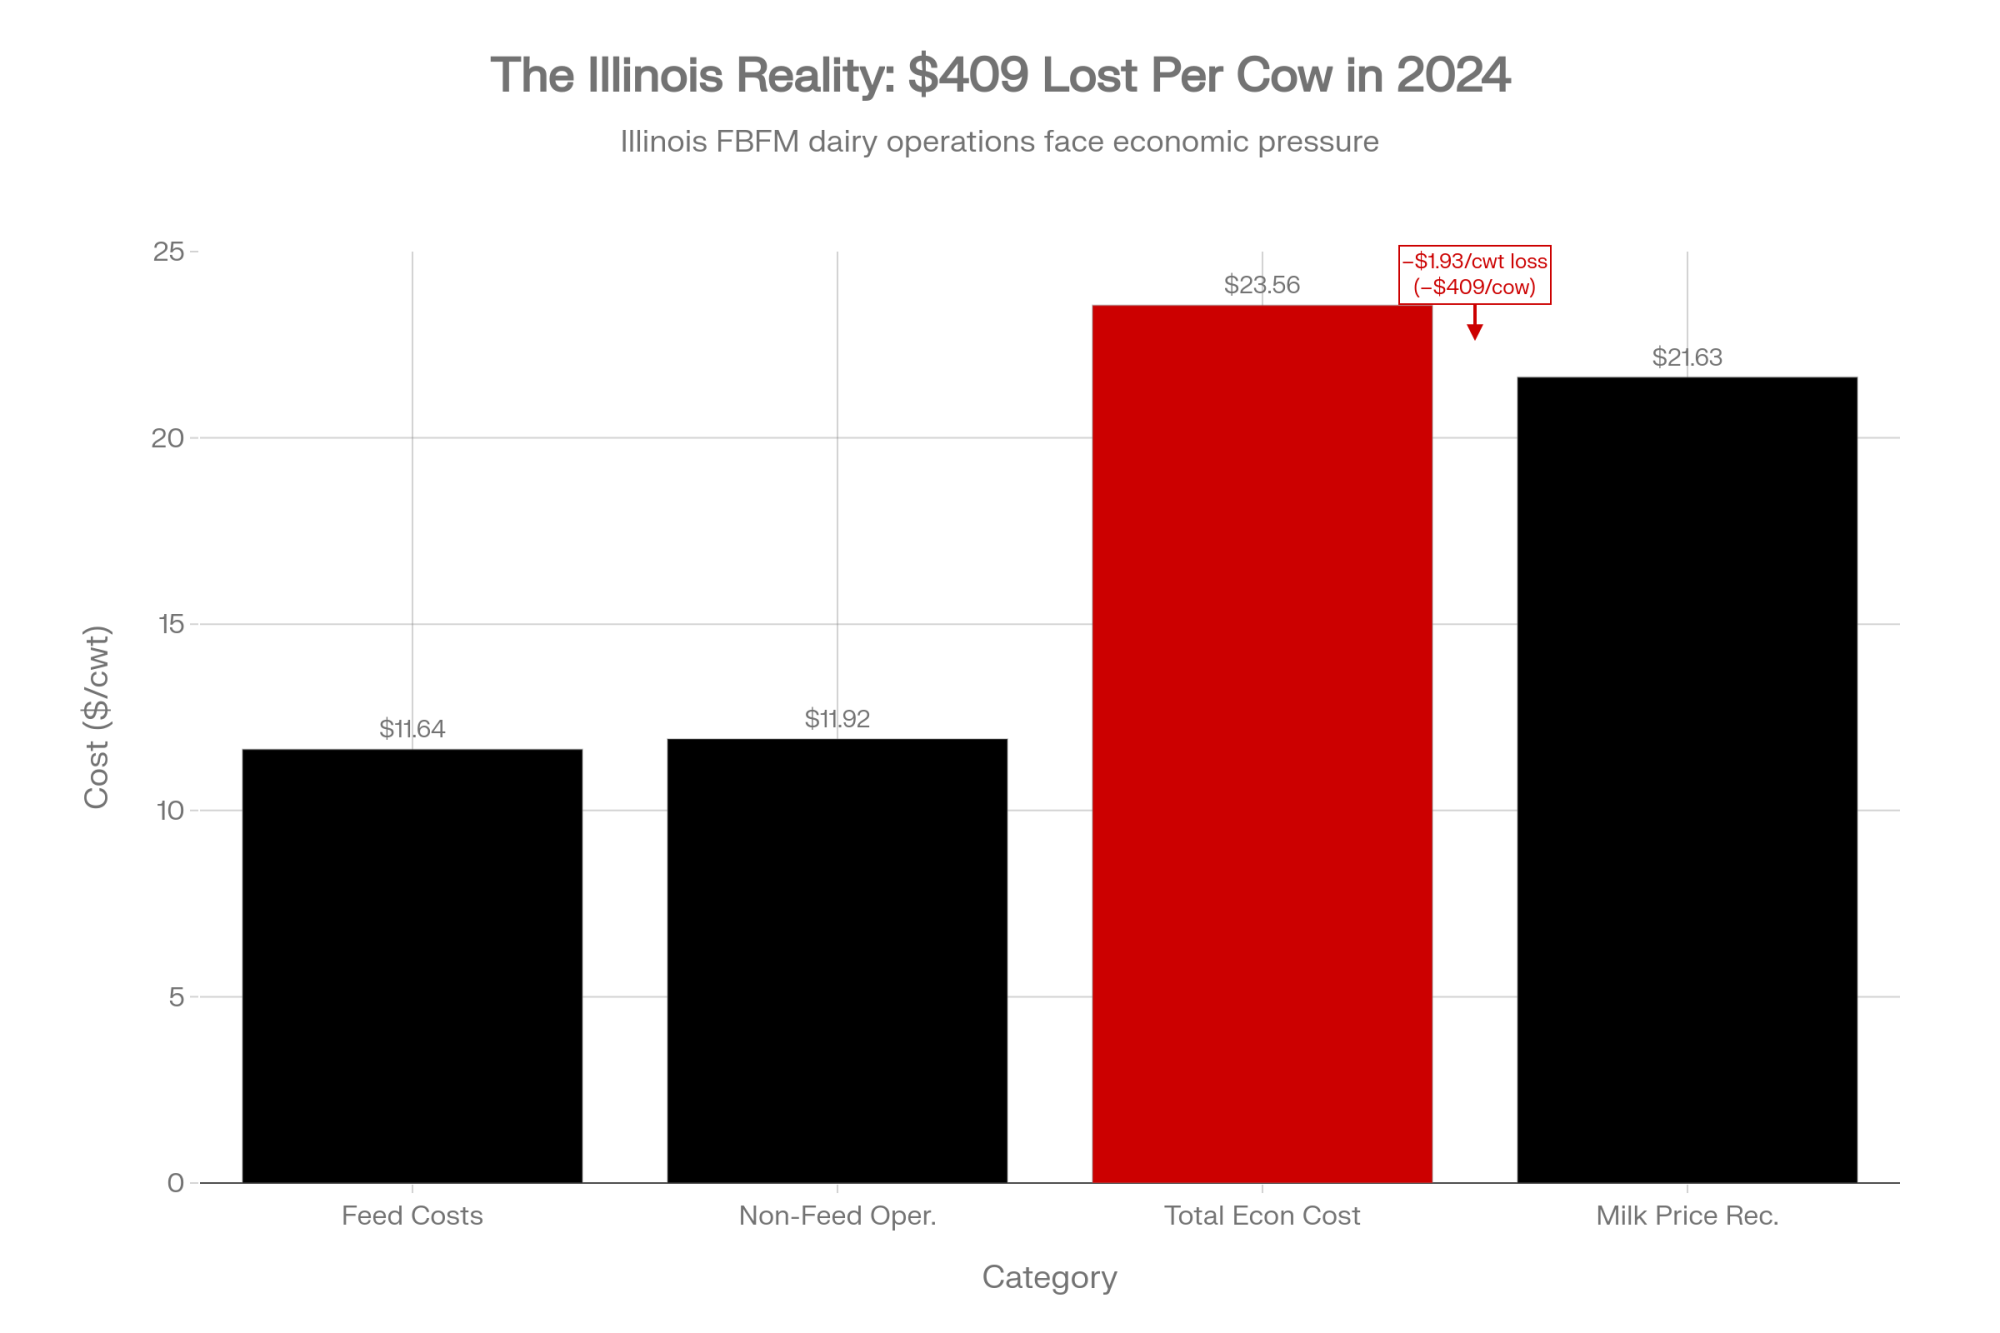
Illinois Farm Business Farm Management data tells the broader story. The 2024 numbers showed an average net milk price of $21.63 per hundredweight against total economic costs of $23.56 — a loss of $1.93/cwt, or negative $409 per cow for the year. Feed costs averaged $11.64/cwt, and nonfeed costs hit a record $11.92/cwt. SDA ERS’s January 2026 Livestock, Dairy, and Poultry Outlook forecasts the 2026 all-milk price at $18.25 per hundredweight, down from $21.15 in 2025 — a decline of nearly $3.00/cwt, or roughly 14% ​. That’s a wider drop than feed cost savings can absorb.” This is the single most important factual correction in this draft.

If you’re on a component order running 4.0% butterfat and 3.3% protein, there is a premium above the Class III floor — but it’s thinner than you might assume. At January 2026 component prices (butterfat at $1.4525/lb, protein at $2.1768/lb, other solids at $0.4448/lb — per USDA AMS), a hundredweight at those test levels returns roughly $15.53in component value (assuming 5.7% other solids, standard for Holstein herds), about $0.94 above the $14.59 Class III. That’s real money. But the make allowance still comes off the top of every component calculation before those prices are set. High components help. They don’t fix the formula. 

What This Means for Your Operation

This isn’t a guilt trip. It’s a math problem — and the math has specific levers you can pull.

  • Pull your last 12 months of milk checks and calculate your true net effective price — not the blend, not the gross, but what actually hit your account after deductions, hauling, and co-op assessments. USDA ERS data shows the national dairy farm-value share was 25% of the retail dollar in 2024. If your net is more than $1.50 below the FMMO blend minimum published by your order, you need to understand why. 
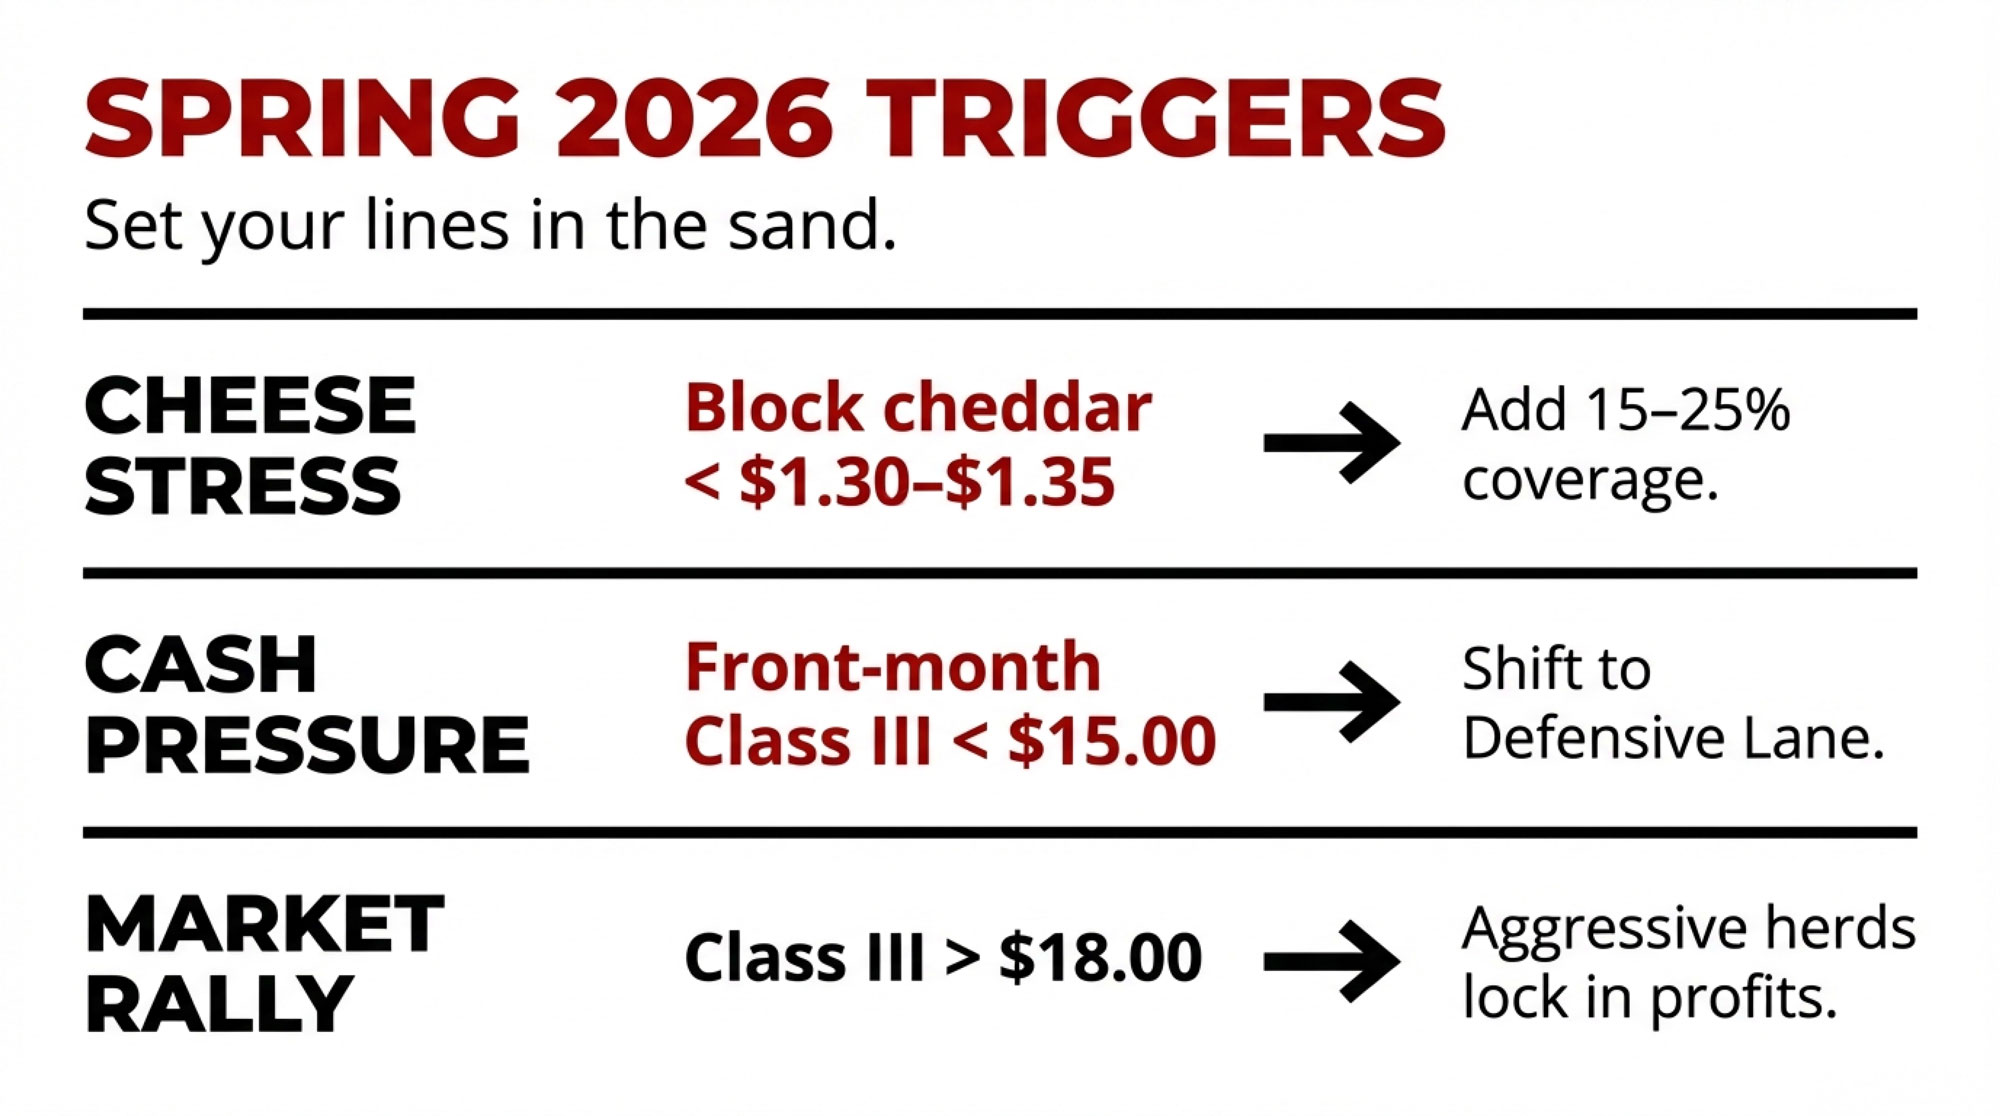
  • Know your breakeven in Class III terms. Illinois FBFM data pegged total economic costs at $23.56/cwt for 2024, with feed and cash operating costs at $17.43/cwt. Your costs vary by region, herd size, and feed situation — but if your cash costs are above $17.50/cwt and January’s $14.59 Class III is anywhere near your order’s blend, your working capital is eroding monthly. That’s the conversation to have with your lender this month, not in May. 
  • Talk to your crop insurance agent about Dairy Revenue Protection for Q2 and Q3 2026. HighGround Dairy’s five-year analysis found that for every $1.00 spent on DRP premiums, producers received $1.78 in return on average — a net benefit of $0.23/cwt after premiums. Coverage booked three quarters out returned the highest average net benefit at $0.30/cwt, despite higher premiums. With February 2026 advanced cheese prices at $1.4078/lb and butter at $1.4201/lb (USDA AMS, February 4, 2026), markets are signaling continued softness — exactly the environment where DRP has historically paid off. The trade-off is real: DRP premiums are a cash cost that hits quarterly, whether you need the coverage or not, and if milk rallies above coverage levels, you’ve paid for protection you didn’t use. But at current futures, the odds favor the buyer. If you haven’t locked Q3 2026 yet, that window is still open. 
  • Push USDA to launch mandatory processor cost surveys—and include mozzarella. Congress has already acted: the One Big Beautiful Bill Act, signed July 4, 2025, mandates biennial cost-of-production surveys covering cheese, butter, and nonfat dry milk processors, with $9 million appropriated for the program. But AFBF’s Danny Munch warns the timeline remains unclear. “They’re going to have to set up a methodology. They’re going to have to have staff and researchers set aside for this,” Munch told Brownfield Ag News at World Dairy Expo. “I don’t expect it to happen anytime soon”. And even when data comes in, there’s no automatic adjustment — a full FMMO hearing would still be required to change make allowances. The gap to push on: the survey covers cheese, butter, and NFDM, but does not explicitly name mozzarella — the single largest-volume cheese in America and the backbone of tonight’s pizza consumption. Push your co-op and trade organization to demand that mozzarella be included in the USDA’s survey methodology before it’s finalized. USDA’s FMMO modernization referendum was approved across all 11 orders in January 2025, with pricing amendments effective June 1, 2025.
  • Request one competitive price comparison from an alternative buyer. If you ship to a large co-op, call an independent or a smaller cooperative and ask what they’d pay for your components. Yager’s experience is telling: the fear of being dropped keeps many farmers from asking tough questions about premiums. You don’t have to switch — switching carries real risk, including loss of hauling routes, potential basis penalties during transition, and relationship capital that’s hard to rebuild. But knowing you have options strengthens every negotiation you stay in. And if you’re exploring farmstead cheese or on-farm retail, start with no more than 10–20% of your production; the capital and compliance costs catch more operations than the margins do. 

The Three Numbers That Matter Monday Morning

  • 73 cents — the farm share of a $15 Super Bowl pizza at January’s Class III. Your actual loss from the make allowance increase scales with production: multiply your annual hundredweight shipped by $0.90. Nationally, the farm-value share of all dairy products at retail was 25% in 2024. 
  • 29 million pounds of cheese was priced into processor contracts weeks ago. Game-day demand doesn’t create spot-market pressure that flows back to your bulk tank. The consumption is real; the price signal to producers is at best muted.
  • Mozzarella — tonight’s dominant cheese — isn’t even in the USDA pricing survey. The make allowance was set on cheddar data. Until the survey includes the cheeses that actually drive demand, the formula will keep underpricing your contribution to the products consumers want most. 

Beyond the Final Whistle

Seventy-three cents on a fifteen-dollar pizza. That’s the current system’s answer to record demand. It matters that dairy farmers built what’s on every table in America tonight — and it matters more that the pricing formula doesn’t reflect it.

Yager’s math is blunt: the make allowance increase alone costs an average-sized Wisconsin dairy enough to fund a full-time employee — and so far, no premiums have shown up to replace it. In the Northeast, state industry groups have warned that continued milkshed contraction threatens the infrastructure supporting all small-scale agriculture in rural New England. Novakovic says the consolidation cycle is compressing a decade into two or three years. Whether the system changes fast enough to slow that compression is the open question — and 2,800 farms may not get to wait for the answer. 

Pull your numbers this week. If your net effective price is more than $1.50 below the published FMMO blend, call your field rep before March—and then call the people who claim to speak for you and ask one specific question: what are they doing to ensure USDA’s mandatory processor cost surveys include mozzarella and launch before the next make-allowance fight. The gap between what consumers pay and what you receive won’t close on its own.

Complete references and supporting documentation are available upon request by contacting the editorial team at editor@thebullvine.com.

Learn More

Join the Revolution!

Join over 30,000 successful dairy professionals who rely on Bullvine Weekly for their competitive edge. Delivered directly to your inbox each week, our exclusive industry insights help you make smarter decisions while saving precious hours every week. Never miss critical updates on milk production trends, breakthrough technologies, and profit-boosting strategies that top producers are already implementing. Subscribe now to transform your dairy operation’s efficiency and profitability—your future success is just one click away.

NewsSubscribe
First
Last
Consent

Same Cows, $15,000 Apart: Class III Milk Price, DRP, and Your Spring 2026 Risk Plan

Same cows, same milk, $15,000 apart. This spring, Class III won’t decide your future—your DRP and risk plan will.

Executive Summary: Class III and Class IV price swings are quietly putting five‑figure gaps between herds that look almost identical on paper. Using current USDA class prices and the latest 2026 milk production forecast, this piece shows how the same 500‑cow herd can end up roughly $10,000–$15,000 apart in a month, just on pooling and price exposure.It then sorts risk management into three simple lanes—defensive, balanced, and aggressive—with practical DRP and Class III options ideas, suggested coverage ranges, and clear cheese/Class III triggers for when to act. The article also walks through five numbers you’ll want on paper before you call your DRP agent: production, components, basis, utilization mix, and break‑even. If you’re planning for Spring 2026, it’s built to help you move from watching Class III to running a risk plan that actually fits your herd.

You know that feeling when Class III is up on the screen, but your milk check sure doesn’t look like it got the memo? You’re not alone. A lot of 400–800 cow herds are finding that when the Class III/Class IV spread opens up, two 500‑cow dairies with very similar cows, butterfat levels, and fresh cow management can still end up thousands of dollars apart each month, just because their milk is pooled and used differently.

What I want to walk through here is a simple, practical playbook for Spring 2026: three risk “lanes,” five numbers you need in front of you, and some Dairy Revenue Protection (DRP) timing and price triggers that actually help you decide, not just worry.

How the Class III/Class IV Spread Quietly Moves Your Milk Check

Let’s start with what the numbers really look like. USDA’s own class price reports make it pretty clear the spread between Class III and Class IV moves around more than most of us would like. For example, in February 2025, the USDA reported Class III and Class IV milk prices of 20.18 and 19.90 dollars per hundredweight, respectively. So in that month, Class III had a small edge. 

By October 2025, those class prices had shifted again. USDA’s Announcement of Class and Component Prices shows a Class III price of 16.02 dollars per hundredweight and a Class IV price of 14.30 dollars per hundredweight, giving Class III about a 1.72‑dollar advantage. So the story isn’t “Class IV always wins” or “Class III always wins.” The point is that the relationship between the two can change within a year, and your pay price rides on how your milk is used. 

Here’s an easy way to picture it. Say you’ve got a 500‑cow Holstein herd averaging about 60 pounds per cow per day. That’s roughly:

  • 500 cows × 60 lb = 30,000 lb per day
  • 30,000 lb × 30 days ≈ 900,000 lb per month
  • 900,000 lb ÷ 100 = 9,000 cwt per month

Now imagine two different pools:

  • One is effectively 70% cheese (Class III) and 30% butter‑powder (Class IV).
  • The other is closer to 25% Class III and 75% Class IV.

If Class III is a couple of dollars higher than Class IV for a stretch, that cheese‑heavy pool is going to capture a lot more of that value. A 2‑dollar spread on 9,000 cwt is 18,000 dollars on paper. Even if only part of that makes it into your final mailbox price because of pooling and adjustments, you can see why it’s realistic for two similar 500‑cow herds, sitting in two different utilization situations, to be ten‑plus thousand dollars apart in some months. The cows don’t know it, but the blend sure does.

Uniform prices tell the same story in a different way. USDA’s 2025 uniform milk price tables show that the monthly uniform price at 3.5% butterfat can differ by more than a dollar per hundredweight between some Federal Orders, depending on class utilization and the month. Industry coverage of those uniform prices in late 2025 noted that when class prices fell together, all 11 orders saw lower uniform prices, but the actual level on the milk check still varied by order and utilization mix. On 9,000 cwt, a 1‑dollar uniform price gap is 9,000 dollars before you even talk about premiums or penalties. 

And here’s something that’s easy to miss: the FMMO numbers are useful, but they’re still averages. Your co‑op’s monthly statement will often show how your specific pool and plant mix are behaving, and that’s the document you really want to study alongside the federal reports.

The bottom line: you don’t control the spread. You don’t control how your co‑op pools. But you do control how much of your business is exposed to that spread, and that’s where this risk “lane” idea comes in.

Three Risk Lanes: Which One Looks Most Like You?

What I’ve found, sitting at kitchen tables in Wisconsin and the Northeast, is that most herds don’t need a PhD in futures. They need an honest look at their balance sheet and a simple way to decide how much downside they can live with. When you do that, most 400–1,000 cow dairies fall into one of three lanes:

  • Defensive: “We really can’t afford a bad quarter.”
  • Balanced: “Let’s protect the downside, but don’t cap all the upside.”
  • Aggressive: “Feed’s lined up, equity’s good, we’ll ride more risk.”

Here’s an illustrative snapshot for that 500‑cow, 2.7‑million‑lb‑per‑quarter herd:

StrategyProduction CoveredPremium Commitment*Floor StrengthUpside ExposureBest Fits
Defensive65–70%HigherNear sustainable break‑even~30–35%Tight cash, higher leverage
Balanced40–50%ModerateGood, but not maximum~50–55%Moderate leverage, modest reserves
Aggressive20–25%LowDisaster‑only~75–80%Strong equity, feed locked, higher risk

*Premium commitment here is total premiums over several months as a rough share of gross milk revenue, not a quote.

A quick way to check your lane:

  • Defensive herds have less than 6 months of cash cushion, debt-to-asset ratios around 50–60%, and a genuinely scary outlook if one quarter goes badly.
  • Balanced herds have six to twelve months of operating cushion, manageable debt, and enough breathing room to absorb a tough quarter without the banker reaching for the restructuring file.
  • Aggressive herds have strong equity, feed covered through the next harvest at tolerable prices, and enough cash flow to ride out a bad quarter or two without forced cow sales.

What’s interesting is that no lane is “right” or “wrong.” They just come with different trade‑offs. More coverage buys stability but trims upside. Less coverage keeps upside but magnifies the swings. In many cases, producers I work with aim to keep at least 15–20% of production covered with something—DRP, deep out‑of‑the‑money puts, or a mix—just as catastrophic protection. It’s the rest of the milk where the lane really shows up.

If You’re Defensive: “We Can’t Afford a Bad Quarter”

Let’s talk about the herd that’s built new facilities, maybe added robots, and is carrying more debt than they’re comfortable with. If one really bad quarter would have your lender asking hard questions, you’re in the defensive lane, whether you feel like a risk‑taker or not.

You probably recognize yourself if:

  • Your cash cushion is under six months of expenses.
  • Debt‑to‑asset is 50–60% or more.
  • Your sustainable break‑even is at least in the mid‑15‑dollar range, once you account for all costs.
  • A quarter of low prices isn’t just “tight,” it’s a survival issue.

In this lane, it generally makes sense to cover about 65–70% of your projected production. For that 500‑cow herd producing about 2.7 million pounds a quarter, that’s roughly 1.8–1.9 million pounds insured in some way.

A practical defensive toolkit often includes:

  • DRP at around 90% coverage using Class Pricing that leans toward Class III if your plant is largely cheese‑focused. 
  • At‑the‑money or slightly out‑of‑the‑money Class III put options on part of that same milk to pull your effective floor closer to your sustainable break‑even once you factor in basis and component premiums.

The catch with going defensive:

  • DRP coverage is more expensive, net, at higher coverage levels because subsidy percentages are smaller.
  • You’re deliberately giving up some upside in exchange for a tighter floor.
  • You’ll feel the premium cost in a good year—but you’ll sleep better in a bad one.

What DRP materials and risk‑management guides consistently show is that premium subsidies are relatively larger at lower coverage levels and smaller at higher coverage levels, so an 80% policy usually has a larger subsidy share than a 95% policy. That’s why your out‑of‑pocket cost per insured hundredweight rises as you push coverage closer to 95%. 

What I’ve seen in many Wisconsin and Minnesota operations is that herds who accept the premium cost and stick to a consistent DRP and options plan tend to have calmer conversations at the bank when cheese and class prices fall than those who keep riding everything on the cash market. The year might still be tough, but the floor does its job.

If that sounds like you, here’s what this means in practical terms:

  • Your main question isn’t, “Where’s Class III going?” It’s, “What’s the lowest mailbox price we can live with and still pay the bills and keep the lender comfortable?”
  • If your sustainable break‑even is around 16 dollars per hundredweight and a quarter, and a 14‑dollar Class III would put you in real trouble, then your structures need to focus on keeping realized prices above that danger zone, not chasing every rally.
  • Once Q2 Class III futures sit 1.50–2.00 dollars above your sustainable break‑even for a while, you can justify easing off new coverage on part of your milk and letting some upside run. Until then, your priority is staying in business, not maximizing upside.

If You’re Balanced: “Protect the Downside, Don’t Miss the Rally”

A lot of progressive herds fall into this middle lane. You’ve tightened costs, you know your numbers, and your debt and cash position give you room, but you’re not interested in gambling.

You’re probably here if:

  • You’ve got six to twelve months of operating cushion.
  • Debt service fits comfortably into your cash flow most years.
  • You accept that you won’t call the top or the bottom.
  • You want real downside protection, but also want to participate when Class III runs.

In this lane, covering about 40–50% of your projected production often makes sense. For that same 500‑cow example, that’s roughly 1.1–1.4 million pounds hedged, with 1.3–1.6 million pounds left open.

The balanced toolkit usually has two pieces:

  • Slightly out‑of‑the‑money Class III puts—say, in the mid‑15 to low‑16‑dollar range if Q2 futures are in the mid‑16s—on around one‑third to two‑fifths of your milk. That way, a 1.50–2.00‑dollar slide in Class III starts to trigger protection, but you still fully enjoy a strong rally.
  • DRP at 80–85% coverage on another slice of milk as a safety net. Because DRP subsidies are generally more generous at these coverage levels than at 90–95%, the net cost per hundredweight on that insured volume is more manageable. 

In this setup, the options tend to do the heavy lifting for routine price swings, while DRP is there for the really ugly quarters.

For your herd, this lane means:

  • You’re trading moderate premiums for a decent floor and lots of upside.
  • A bad quarter still hurts, but it doesn’t put the whole operation at risk.
  • It helps to define a couple of simple triggers, so you’re not guessing in the heat of the moment:
    • If CME block cheddar sits under roughly 1.30–1.35 dollars per pound for several trading sessions, that’s usually a sign the cheese market is under real stress. In that situation, many balanced or aggressive herds add another 15–25% coverage via DRP or puts. 
    • If front‑month Class III slips under about 15.00 dollars per hundredweight, that’s a reasonable point to shift your posture a little more defensive and protect more of your production.

If You’re Aggressive: “Feed’s Locked, We’ll Ride It”

Then there are the herds that have built equity and efficiency over time and are in a position to withstand more volatility. In these dairies, feed is often locked at a decent price, the cows are producing well, and the balance sheet can take a punch without panic.

You’re in this camp if:

  • Your equity position is strong, and leverage is modest.
  • Feed costs are locked in through the next crop year at levels that still leave a margin.
  • You can live through a bad quarter or two without emergency financing, forced cow sales, or putting off critical maintenance.
  • You genuinely think the current weakness in cheese and Class III is overdone and want more upside exposure.

In this lane, you’re often only covering about 20–25% of projected production, leaving 75–80% to float with the market. For our 500‑cow example, that’s around 500,000–700,000 pounds covered and 2 million pounds uncovered.

The typical aggressive toolkit:

  • A modest DRP policy at 80% coverage on a slice of milk as “disaster insurance.” Because this is the lowest coverage level, it tends to carry a smaller net premium per hundredweight and still gives you something if prices collapse. 
  • Deep out‑of‑the‑money Class III puts—maybe around 14.50–15.00 dollars per hundredweight—that don’t cost much and only kick in if we get a serious wreck.

The trade‑off is pretty straightforward. You’re spending less on premiums, you’ve got maximum upside, but you’re also accepting that a routine 1‑dollar slide in Class III will hit you harder. That only works if your equity, cash flow, and feed position can legitimately handle that risk.

So it’s worth being blunt here: if your balance sheet isn’t genuinely strong, this lane isn’t a badge of honor, it’s just unnecessary risk. Plenty of good operators have gotten hurt by trying to be aggressive when the books said they should’ve been balanced or defensive.

If you are in a position to ride in this lane, it really pays to write down your “I’m wrong” lines:

  • Maybe you decide that if block cheese breaks 1.35 dollars per pound and stays below there for a week, you immediately add 20–25% more coverage.
  • Or you say that if front‑month Class III trades under 15.00 dollars per hundredweight, you’ll move yourself back toward a balanced posture and start building floors.

What’s encouraging is that when aggressive herds set those lines in advance and stick to them, they’re not just guessing. They’re managing risk, even if it’s a higher‑octane version.

DRP and Class III Options: Different Tools, Same Job

It’s easy to get stuck in debates about DRP versus futures and options, almost like it’s a philosophical choice. In practice, they’re just two tools in the same box. The real question is which mix fits your risk lane and your comfort level.

Dairy Revenue Protection is a USDA‑backed insurance program that lets you insure quarterly milk revenue. You pick a coverage level—anywhere from 80% to 95%—and choose between Class Pricing and Component Pricing. Under Class Pricing, your guarantee is based on a mix of Class III and Class IV futures, as you choose. Under Component Pricing, it’s based on futures‑derived butterfat and protein values and your declared component levels. 

Those guarantees are settled against published quarterly revenue indexes specific to your state or region. And because DRP is a federal program, premiums are partially subsidized. The key thing the program documents and industry overviews agree on is that subsidy percentages are higher at lower coverage levels and smaller at higher coverage levels, which is why an 80% policy usually has a lower net cost per insured hundredweight than a 95% policy. 

Class III put options are different. When you buy a put, you’re buying the right (but not the obligation) to sell Class III futures at your chosen strike. There’s no subsidy, and you need a futures/options account, plus some discipline around margin and position management. But the flexibility is hard to beat: you pick the strike, you pick the months, and on that hedged milk you keep all the upside above your floor.

So in many Midwestern dairies, the practical split looks like this:

  • Use DRP—particularly at 80–85% coverage—as relatively simple, subsidized, disaster‑style coverage on at least part of your milk.
  • Layer in Class III puts for the portion where you want a clear floor but don’t want to give up upside, especially in the balanced and aggressive lanes.

Five Numbers You Really Want in Front of You

Here’s something you probably know already from dealing with lenders and nutritionists: the better your numbers, the better the advice you get. Risk management’s no different. Before you call your DRP agent or broker, having these five numbers written down changes the conversation.

1. Projected Quarterly Production

Look back at the last three to six milk checks and average your monthly pounds shipped. Multiply by three to get a starting point for the next quarter. Then adjust for what’s actually happening on your farm:

  • Are you freshening more heifers?
  • Did you change your transition period management?
  • Are you switching to or from a dry lot system?
  • Is a new robotic box coming online?

You don’t need to be exact, but you do need an honest estimate.

2. Butterfat and Protein Averages

Pull your last several milk checks or DHIA tests and take the average butterfat and protein levels. If you’re considering DRP Component Pricing, those declared component levels should reflect the milk you actually ship. DRP resources make it clear that indemnities under Component Pricing are based on futures‑derived component values and your declared quantities, so over‑declaring components can come back to bite you if you don’t hit those numbers in the tank. 

High‑component herds that consistently run above the regional average often like Component Pricing because it lets them insure the value they’re producing. Herds with more variable components often lean toward Class Pricing because they’re not betting on precise tests every quarter.

3. Basis to Class III or Class IV

Basis is one of those words that makes people’s eyes glaze over, but it’s just the difference between the futures‑based price (Class III or IV) and your mailbox price.

For each of the last few months:

  • Take your net milk pay and divide by pounds shipped, then divide by 100 to get your mailbox price per hundredweight.
  • Look up the USDA Class III and Class IV prices for that month. 
  • Subtract Class III (or IV) from your mailbox price.

If your mailbox price has been running, say, about 0.30 dollars per hundredweight over Class III, and you buy puts with a 16.00‑dollar strike, your “real” floor before premiums and fees is closer to 16.30 dollars. That basis number helps you judge whether the protection you’re buying lines up with your actual risk.

4. Class III/Class IV Utilization Mix

This one’s easy to overlook, but it matters. In the U.S. marketing orders, different plants and co‑ops have different utilization mixes—some are heavily cheese‑weighted, others lean more toward butter‑powder. Federal Order documents and policy briefs on current and proposed marketing order reforms spell out just how different those mixes can be between areas. 

A simple call to your co‑op or plant rep with a question like, “Roughly what percentage of our pooled milk ends up in Class III products versus Class IV?” can give you a ballpark figure. And just as important, take a good look at your co‑op’s own monthly statement; that’s often the clearest picture of how your actual milk is being used and paid for, beyond the FMMO averages.

If your herd is effectively 65% Class III‑driven and you structure DRP as if you were a 50/50 Class III/Class IV herd, the policy won’t track your milk check as well as it could.

5. Break‑Even Milk Price

Finally, you need at least a rough survival break‑even and a sustainable break‑even.

  • Survival break‑even covers feed, power, essential repairs, and the minimum debt service to keep the doors open.
  • Sustainable break‑even adds in full debt service, family living, and enough capital replacement that the operation can keep going long term.
Herd ScenarioSustainable Break-Even ($/cwt)$1.00/cwt Drop = Monthly Loss$2.00/cwt Drop = Monthly Loss$3.00/cwt Drop = Monthly Loss
300-cow herd, 36 lbs/cow/day$16.25 (RED)$16,200/month$32,400/month (RED)$48,600/month
500-cow herd, 60 lbs/cow/day$15.75 (RED)$27,000/month$54,000/month (RED)$81,000/month
800-cow herd, 68 lbs/cow/day$15.00$36,480/month$72,960/month$109,440/month
Industry Median Break-Even (2024 USDA ERS)$15.50$25,920/month$51,840/month$77,760/month

A quick back‑of‑the‑envelope calculation is to total your annual cash costs and divide by your annual production (in cwt). It’s not perfect, but if it shows your sustainable break‑even is around 16 dollars per hundredweight, you now know that a 14‑dollar Class III “floor” isn’t really protection. It’s just a more predictable way to lose money.

In DRP and risk management meetings across the Midwest, it’s common to hear agents say that the producers who walk in with these five numbers tend to walk out with coverage structures that fit their lane. The ones who don’t bring numbers usually end up talking about feelings, not risk.

Timing and Triggers: Managing Spring 2026 Without Staring at the Screen All Day

If there’s one thing many of us have learned the hard way, it’s that risk management is as much about timing as it is about tools. You don’t have to watch the market all day. But you do want a few dates and signals written down so you can act on your plan, not your emotions.

How DRP Sales Windows Actually Work

DRP isn’t like corn insurance, where you have one big sales closing date. According to the 2026 DRP Basic Provisions, coverage is sold during specific “sales periods,” and sales are suspended on days when major USDA reports, such as Milk Production and Cold Storage, are released. That means you can buy coverage at multiple points, but not every single day. 

Practically speaking:

  • Q2 2026 endorsements (April–June milk) will mostly be written in the late‑January to March window, outside of those report days. 
  • Q3 2026 endorsements (July–September milk) will mostly be written in the April–June window, again avoiding report days.

So instead of waiting for a single “deadline,” you’re better off deciding in January and April what your lane is, how much milk you want covered, and what coverage levels make sense. Then it’s just a matter of working with your agent during an open sales period.

Watching USDA Production and Stocks

It’s worth noting that USDA’s January 2026 WASDE forecast bumped expected 2026 U.S. milk production up to about 234.3 billion pounds, roughly 3.2 billion pounds more than 2025, which works out to about 1.4% growth. On paper, that doesn’t sound huge, but as many of us have seen, an extra 1–2% milk floating around in a flat demand environment can put real pressure on prices. 

When you pair that with the monthly Milk Production report and the Cold Storage report—especially for cheese and butter inventories—you get a reasonable sense of whether the market is starting to back up or tighten. That can help you decide when to be more defensive and when you can afford to lighten up.

Simple Price Triggers That Help You Act

Most of the herds I talk to don’t want a complicated market model. They just want a few lines in the sand that tell them when it’s time to add coverage or lock in more upside. Here are three that can work as a starting point:

Signal / TriggerLevel (Approx.)Market ConditionDEFENSIVE Lane ActionBALANCED / AGGRESSIVE Lane Action
CME Block Cheddar< $1.30–$1.35/lb for 3+ sessionsCheese market in real stressADD 15–25% coverage immediately via DRP or Class III puts. Do not wait.Monitor closely; consider 10–15% extra coverage if sustained below $1.33/lb.
Front-Month Class III Futures< $15.00/cwtCash market under heavy pressureSHIFT POSTURE DEFENSIVE on 20–30% of unprotected milk.Add DRP or puts without delay.Tighten stops; add 15–25% coverage. This is your warning line.
Front-Month Class III Futures> $18.00/cwt for 2+ weeksRally is real and sustainedMonitor for profit-taking. Keep current coverage. Let upside run.Lock in a slice of gains; protect half your upside with tight stops or modest puts. Consider locking 10–15% at high prices.
USDA Milk Production Forecast1.5%+ YoY growth; cheese stocks risingOversupply buildingAssume downside risk increases Q2–Q3; add 20–30% coverage now while prices near seasonal highs.Add 10–15% defensive coverage on forward Q3 milk. Plan for lower Q3 prices.

These aren’t magic numbers. They’re practical guardrails. The real key is writing down, ahead of time, what each of those triggers will mean for you so you’re not trying to invent a plan on a bad Monday morning.

So What Does This Actually Mean for Your Dairy?

USDA’s current outlook, as summarized in late‑January 2026, is a year with a bit more milk and lower average prices than 2025. At the same time, the official class price series shows that the Class III/Class IV relationship can swing enough within a year to move your milk check by meaningful amounts, especially if your herd is tied heavily to cheese or butter‑powder. 

You don’t get to choose whether that spread exists. But you do get to choose how much of your herd’s future you leave riding on it.

If you’re in the defensive lane, your job this spring is to:

  • Get those five numbers—production, components, basis, utilization mix, and break‑even—on paper.
  • Work with your DRP agent to price 85–90% coverage on 60–70% of your Q2 milk, using Class Pricing that matches your actual exposure.
  • Layer in near‑the‑money Class III puts on part of that volume, so your effective floor comes closer to your sustainable break‑even.

If you’re in the balanced lane, your focus is to:

  • Use DRP at 80–85% coverage on 20–25% of your production as disaster coverage.
  • Use slightly out‑of‑the‑money Class III puts on another 20–30%, so you’ve got a reasonable floor with upside.
  • Put your cheese and Class III price triggers in writing and decide, ahead of time, how much extra coverage you’ll add when those lines get crossed.

If you’re in the aggressive lane and your numbers truly support it, you can:

  • Keep coverage lighter—say 20–25% of production with DRP at 80% or deep out‑of‑the‑money puts—to guard against a real crash.
  • Be honest about your “I’m wrong” lines on cheese and Class III and commit—with your family or business partners—to changing lanes if those lines are crossed.
  • And just as important, make sure your balance sheet is strong enough that you’re not turning your livelihood into a bet you can’t afford to lose.

And there’s one more step that’s worth taking this week, no matter which lane you’re in:

  • Pull your last six months of milk checks and calculate your basic basis and break‑even.
  • Put a ten‑minute weekly price check (cheese, Class III, Class IV) on your calendar.
  • Talk through your lane with whoever else has a stake in the dairy—family, partners, key employees—so everyone understands the plan.

In a 2025–26 world where USDA expects higher milk production and lower prices, and where the Class III/Class IV spread can change direction more than once a year, hoping the market behaves isn’t a strategy. Your balance sheet—not your opinion of cheese—is what should pick your lane. 

The goal isn’t to guess exactly where Class III will be in June. It’s to decide what you can live with now, set your floors accordingly, and make sure the market doesn’t get the final say on whether your dairy makes it through the next year.

Key Takeaways

  • Same cows, big gap: Class III/IV spread and pooling differences alone can put two similar 500‑cow herds $10,000–$15,000 apart in a single month.
  • Pick your lane: defensive herds should cover 65–70% of production, balanced herds 40–50%, and aggressive herds 20–25%—based on cash, leverage, and risk tolerance, not feelings.
  • DRP at 80–85% coverage offers the best subsidy‑to‑protection trade‑off for most operations; add Class III puts when you want a tighter floor with upside intact.
  • Know your numbers: projected production, component averages, basis, utilization mix, and break‑even should be on paper before you call your DRP agent.
  • Set triggers, not hopes: decide now what cheese price and Class III levels will make you add protection—so you’re acting on a plan, not reacting to a bad Monday.

Complete references and supporting documentation are available upon request by contacting the editorial team at editor@thebullvine.com.

Learn More

Join the Revolution!

Join over 30,000 successful dairy professionals who rely on Bullvine Weekly for their competitive edge. Delivered directly to your inbox each week, our exclusive industry insights help you make smarter decisions while saving precious hours every week. Never miss critical updates on milk production trends, breakthrough technologies, and profit-boosting strategies that top producers are already implementing. Subscribe now to transform your dairy operation’s efficiency and profitability—your future success is just one click away.

NewsSubscribe
First
Last
Consent

November 12 Market Shock: Cheese Crashes to $1.55 as Milk Heads for $16 – Your Action Plan Inside

Warning: Today’s cheese collapse confirms what smart money already knows – milk’s heading for $16. Action plan inside.

Executive Summary: Today’s 8-cent cheese collapse to $1.5525 sent an unmistakable message: the U.S. dairy industry has entered a margin crisis that smart money says could stretch into 2027. With Europe undercutting our prices by 10 cents, Mexico pulling back orders, and domestic production inexplicably up 4.2%, we’re producing into a black hole. The numbers are sobering – Class III milk heading for $16.50 means your January check drops $3/cwt, translating to $7,500 less monthly revenue for a typical 300-cow operation. At these prices, even well-run dairies lose $1,500 daily. But here’s what 30 years in this industry has taught me: the operations that act decisively in the first 90 days of a crisis are the ones that survive. Those waiting for markets to ‘come back’ typically don’t make it. Your December milk check isn’t just a number anymore—it’s a referendum on whether your operation has what it takes to weather the storm ahead.

Dairy Margin Management

Today’s Market Summary Table

ProductCloseChangeTrading Activity
Cheese Blocks$1.5525/lb↓ $0.084 trades ($1.5775-$1.6275)
Cheese Barrels$1.6450/lb↓ $0.03No trades
Butter$1.5000/lbUnchanged3 trades ($1.49-$1.50)
NDM$1.1575/lb↑ $0.0025No trades
Dry Whey$0.7500/lbUnchangedNo trades

You know that sinking feeling when you check the CME report and see red numbers everywhere? That’s exactly what happened today. Block cheese crashed 8 cents to close at $1.5525 per pound—and here’s what’s interesting, it happened on relatively heavy trading with four separate transactions recorded by the Chicago Mercantile Exchange spanning from $1.5775 to $1.6275, according to today’s CME cash market report. Barrels weren’t far behind, falling 3 cents to $1.6450, though notably without any recorded trades.

What I’ve found particularly telling is how butter stayed frozen at $1.50 with three trades in a tight range, while nonfat dry milk barely budged, climbing just a quarter-cent to $1.1575 with zero trading activity. Days like this tell us something important about where we’re headed. And honestly? It’s time we had a serious conversation about what this means for your December milk check.

Reading the Tea Leaves in Today’s Trading Patterns

Here’s something many of us miss when we just glance at the closing prices—the bid-ask spreads are telling a much bigger story. You probably know this already, but when the gap between what buyers are willing to pay and what sellers are asking widens dramatically, it usually means traders can’t agree on where prices should settle.

Today’s cheese block market saw those four trades bouncing between $1.5775 and $1.6275, but—and this is crucial—CME floor sources report that we had only one bid against one offer at the close. That’s not healthy price discovery; that’s a market running on uncertainty. In my experience working with Chicago traders, when you see heavy block volume with falling prices but no barrel activity, it often means processors are dumping inventory before year-end accounting.

The 8-Cent Collapse Captured: From $1.64 trading range into $1.55 settlement across four institutional block trades. This waterfall pattern signals that major traders are repricing dairy fundamentals downward—the classic setup for extended weakness.

The weekly totals back this up dramatically: 14 block trades this week versus zero for barrels, according to CME weekly volume data. You know what really concerns me? The order book shows just one bid each for blocks and barrels, creating virtually no floor under this market. Compare that to butter, where we’re seeing four offers—sellers everywhere, but buyers have vanished. It’s worth noting that this setup typically precedes another leg lower, especially when remaining buyers finally capitulate.

How Global Markets Are Boxing Us In

So here’s where things get complicated—and you’ve probably noticed this in your own export conversations if you’re dealing with cooperatives. European butter futures trading at €5,070 per metric ton on the European Energy Exchange work out to about $2.29 per pound at current exchange rates. That’s now competitive with our prices, and according to USDA Foreign Agricultural Service data, they’re capturing business we desperately need.

What I find particularly troubling is New Zealand’s positioning on the NZX futures exchange. Their whole milk powder at $3,440 per metric ton signals aggressive pricing to capture Asian market share, based on Global Dairy Trade auction results. And with EU skim milk powder at €2,075 per metric ton—that’s about $1.04 per pound—they’re undercutting our NDM by over 10 cents. In many cases, that’s enough to make a U.S. product completely uncompetitive globally.

Now, Mexico has traditionally been our safety net. USDA trade data shows they account for about 25% of U.S. dairy exports. But here’s what’s changed: the peso weakened by 8% against the dollar this quarter, and according to Conasupo (Mexico’s national food agency), domestic production is ramping up. Several processors I’ve talked with in Wisconsin report Mexican buyers are pulling back on November purchases.

Southeast Asia was supposed to pick up that slack, but USDA attaché reports from Vietnam and Indonesia indicate those markets are currently oversupplied with cheaper product from New Zealand and Europe. And the dollar… well, that’s another story entirely. Federal Reserve data shows it’s near 52-week highs, and research from the International Dairy Federation shows that every 1% rise in the dollar index typically drops our dairy exports by 2-3%.

Feed Markets: The Silver Lining Gets Thinner

Here’s one bright spot, though it’s getting dimmer by the day. According to CME futures settlements, December corn closed at $4.3550 per bushel, with March futures at $4.49. That’s manageable. Soybean meal’s recovery to $322 per ton from Monday’s $316.80 keeps feed costs somewhat reasonable, based on CBOT trading data.

But—and this is a big but—the milk-to-feed ratio is deteriorating fast. Cornell’s Dairy Markets and Policy program calculates that at current prices, income over feed costs could drop below $8 per hundredweight by January. University of Wisconsin Extension analysis confirms that for most operations, that’s below breakeven.

The regional differences are striking, too. USDA Agricultural Marketing Service basis reports show Midwest producers near corn country seeing sub-$4 local cash prices. Meanwhile, California Department of Food and Agriculture data indicates that West Coast producers are facing $5-plus delivered corn. For hay, USDA’s Agricultural Prices report puts the national average at $222 per ton, but Western Premium Alfalfa runs $280 and up according to the latest USDA hay market news.

Production Growth: The Numbers We Can’t Ignore

USDA’s National Agricultural Statistics Service finally released that delayed September milk production report on November 10th, and the numbers are… well, they’re sobering. Twenty-four state production hit 18.3 billion pounds, up 4.2% year-over-year. The national herd added 235,000 cows over the past year, while production per cow jumped 30 pounds to 1,999 pounds per month.

What’s really eye-opening is where this growth is concentrated. Kansas leads with 21.1% growth, South Dakota’s up 9.4%—those new processing plants that Dairy Foods magazine has been covering are pulling massive expansion. Looking at efficiency gains, Michigan State University Extension reports their state’s cows are averaging 2,260 pounds per month. That’s 260 pounds above the national average.

The 261-Pound Survival Gap: Michigan’s elite herds average 2,260 lbs/month while national average sits at 1,999. That efficiency gap translates to $15/day cost per marginal cow. When Class III drops to $16.50, every pound counts—operations with production per cow below 1,950 face economic extinction.

The combination of improved genetics—documented in Journal of Dairy Science studies—optimized nutrition protocols from land-grant university research, and modernized facilities, as tracked by Progressive Dairy, has pushed biological limits higher than we thought possible. Here’s the reality check from talking with nutritionists: when your neighbors are achieving these yields, you either match them or risk getting priced out.

Remember all those cheese plants that broke ground in 2023? Kansas Department of Agriculture confirms three major facilities, Texas Department of Agriculture lists two, and South Dakota’s Governor’s Office announced another two. We’ve added 10 billion pounds of annual processing capacity since 2023, according to estimates from the International Dairy Foods Association. These plants have 20-year USDA Rural Development financing that requires running near capacity—this structural oversupply won’t resolve quickly.

The Structural Trap: Four new cheese plants in 2023 plus six more in 2024-2025 added 10 billion pounds of capacity. These debt-financed facilities must operate near 95% utilization to service 20-year USDA Rural Development loans. Current market demand: 46 billion pounds. Result: 5+ billion pounds annual oversupply locked in through 2030. Price recovery impossible without facility closures—and that doesn’t happen voluntarily.

What This Means for Your December Check

Let’s talk straight about where Class III milk is headed. With November futures already at $17.16 on the CME and December futures implying further weakness according to today’s settlements, several dairy economists I respect are projecting $16.50 or lower by January.

December Check Reckoning: A 300-cow operation at $16.50 Class III faces $7,500 monthly revenue loss. That’s $900 daily. January will be worse.

At $16.50 Class III with current feed costs, the University of Minnesota’s dairy profitability calculator shows the average 100-cow dairy loses about $1,500 per day. If we hit spring flush with these prices… well, that’s going to force some tough culling decisions. Today’s spot prices, when run through USDA’s Federal Milk Marketing Order formulas, translate to January milk checks down $2.50 to $3.00 per hundredweight from October.

For a 300-cow dairy shipping 65,000 pounds daily, that’s $7,500 less monthly revenue. Farm Credit Services reports from the Midwest indicate banks are already tightening credit as dairy loan portfolios deteriorate. The Federal Reserve’s October Agricultural Credit Survey shows agricultural loan demand rising while repayment rates fall—if you haven’t locked in operating lines for 2026, today’s price action just made that conversation much harder.

What’s particularly concerning is that our traditional escape route isn’t available. USDA Foreign Agricultural Service data shows China’s imports down 18% year-over-year, Mexico’s pulling back, as I mentioned, and Southeast Asian markets are oversupplied. Without export demand absorbing 15-20% of production—which has been the historical average according to U.S. Dairy Export Council analysis—domestic markets face crushing oversupply through 2026.

Tomorrow Morning’s Practical Action Plan

So what do we do about all this? Here’s my thinking on practical steps based on conversations with risk management specialists and successful producers who’ve weathered previous downturns.

On the hedging front, if we get any bounce above $17.00 for Q1 2026 Class III, I’d seriously consider locking it in. Several commodity brokers I trust are recommending ratio spreads—selling two February $16 puts to buy one February $18 call, which limits your downside while maintaining upside potential. For feed, the consensus among grain merchandisers is to buy March corn under $4.40 and meal under $320 while you can.

Operationally, extension dairy specialists are unanimous: it’s time for aggressive culling. Penn State’s dairy management tools show that every marginal cow below 60 pounds per day is costing you money at these prices. Push breeding decisions to maximize beef-on-dairy premiums while they last—Superior Livestock Auction data shows those crossbred calves bringing $200 to $300 premiums.

Review every feed ingredient for substitution opportunities. University of Wisconsin research demonstrates that optimizing your grain mix can save $5 per ton without sacrificing production—that equals $50,000 annually for a 500-cow dairy. And here’s something many producers hesitate to do but really should: schedule that lender meeting now, before year-end financials force their hand.

Prepare cash flow projections showing survival through $16 milk—Farm Financial Standards Council guidelines suggest they need to see that you’ve faced reality. Several ag finance specialists recommend considering sale-leaseback arrangements on equipment to generate working capital before values drop further.

The 90-Day Reckoning: From November 12 market shock through February 10, every day counts. The red danger zone shows when critical decisions must occur. Operations that delay past December 15 face compromised options by January spring flush. Historical dairy downturns show: decisive action in days 1-90 determines survival probability. The clock started November 12.

The Bottom Line

You know, I’ve been through the 2009 crisis, the 2015-2016 downturn, and 2020’s volatility. What we’re seeing today isn’t just another cycle. Today’s 8-cent cheese collapse, combined with global oversupply data and production growth trends, confirms the U.S. dairy industry faces what could be a two-year margin squeeze.

Looking at the fundamentals—global markets oversupplied according to Rabobank’s latest dairy quarterly, domestic demand softening per USDA disappearance data, and production still growing at 3-4% annually—prices have further to fall before this corrects. The harsh reality, according to agricultural economists at several land-grant universities, is that we could see 5-10% of operations exit by the end of 2026.

Your December milk check has become more than a financial report—it’s a survival test. But here’s what’s encouraging from studying previous downturns: operations that adapt quickly, that make hard decisions now rather than hoping for recovery, those are the ones that emerge stronger. The question facing every producer tonight is simple but profound: will your operation be among the survivors?

What I’ve learned from 30 years of watching these cycles is that the difference between those who make it and those who don’t often comes down to acting decisively in moments like this. Tomorrow morning, when you’re doing chores, think about which camp you want to be in. Then act accordingly.

Key Takeaways

  • This isn’t a blip—it’s a reckoning: Today’s 8-cent cheese crash to $1.5525 with only one bid standing confirms we’re entering a 2-year margin squeeze. Class III hits $16.50 by January.
  • The world has turned against U.S. dairy: Europe’s 10 cents cheaper, Mexico’s pulling back, and our 4.2% production growth is flooding a shrinking market. Exports can’t save us this time.
  • Efficiency gaps will force consolidation: When Michigan averages 2,260 lbs/cow and you’re at 1,900, the math is fatal—every marginal cow costs you $15 daily at these prices.
  • Your banker already knows: Today’s CME report just flagged every dairy loan in America. Schedule that meeting now with realistic projections, not wishful thinking.
  • History’s lesson is clear: In 2009 and 2015, farms that acted decisively in the first 90 days survived. Those that waited for “normal” to return didn’t make it. Which will you be? 

Learn More:

Join the Revolution!

Join over 30,000 successful dairy professionals who rely on Bullvine Weekly for their competitive edge. Delivered directly to your inbox each week, our exclusive industry insights help you make smarter decisions while saving precious hours every week. Never miss critical updates on milk production trends, breakthrough technologies, and profit-boosting strategies that top producers are already implementing. Subscribe now to transform your dairy operation’s efficiency and profitability—your future success is just one click away.

NewsSubscribe
First
Last
Consent

November 3 CME: Cheese Collapses 10¢ on Ghost Town Trading

Cheese tanked. Buyers ghosted. Farmers bleeding. Welcome to Monday in dairy.

EXECUTIVE SUMMARY: You know something’s broken when cheese crashes 10¢ on just TWO trades—that’s exactly what happened today, taking $1/cwt straight out of December milk checks. But here’s what really hurts: the Class III-IV spread hit $3.19, meaning your neighbor shipping Class III is making $45,000 more annually than Class IV shippers on the same-sized farm. We’ve got 9.52 million cows out there—most since 1993—flooding a market where Europe’s selling cheese 37% cheaper and China’s buying less. At $13.90 Class IV against $320/ton feed, even efficient operations are bleeding $2/cwt. The farms that’ll survive are doing three things right now: locking any Class III over $17, cutting cow numbers 15%, and banking six months of operating capital—because this isn’t a correction, it’s a reckoning that’ll last into 2026.

Dairy Market Analysis

What I’ve found is these aren’t just price moves anymore—they’re survival signals. Here’s what shifted at Chicago today:

ProductToday’s CloseChangeFarm Impact
Cheese Blocks$1.6650/lb-10.25¢December checks drop ~$1.00/cwt
Cheese Barrels$1.7500/lb-5.50¢Processors drowning in inventory
Butter$1.5775/lb-3.25¢Class IV trapped at breakeven
NDM$1.1300/lb-0.25¢Export competitiveness fading
Dry Whey$0.7100/lbNo changeThe only bright spot holding

Now, what’s really telling here—and you probably noticed this too—is the volume. Or lack thereof, I should say. Nine trades total across all products. Nine! I’ve seen more action at a Tuesday card game in Ellsworth.

November 3 CME dairy price collapse shows cheese blocks plummeting 10¢ on just two trades while seven sellers found no buyers—a market not trading but capitulating in a vacuum of demand.

When blocks drop a dime on just two trades, it means the price is falling without any real buying support. Those seven offers stacked up? That’s sellers lined up at the door with no buyers in sight. The market isn’t trading; it’s collapsing in a vacuum.

Why This Class Spread Breaks Farms

You know, I’ve been tracking these markets since the ’90s, and this $3.19 gap between Class III at $17.09 and Class IV at $13.90… it’s something else entirely. Three Wisconsin cooperative fieldmen I talked with this morning—all asking to stay anonymous, naturally—painted the same picture: their Class IV shippers are hemorrhaging cash.

“Members are culling anything that looks sideways,” one told me. And at $13.90, even efficient operations lose two bucks per hundred minimum.

Here’s what makes this worse than 2016’s collapse, if you can believe it: feed costs then were 40% lower. The CME futures data shows December corn at $4.3475 a bushel and soybean meal above $320 a ton. You do that math—it doesn’t work.

The $3.19/cwt Class III-IV spread translates to a staggering $45,000 annual income gap between identical 200-cow farms—same work, vastly different survival odds.

Regional Pain Points

Wisconsin’s Double Whammy: So Wisconsin’s most recent production data—this is for September, released in October—shows 2.76 billion pounds according to USDA NASS. But here’s the kicker: regional premiums flipped from plus 40¢ in January to minus 15¢ now. That’s a 55-cent swing nobody budgeted for. And meanwhile, local plants are running four-day weeks, while Texas adds 5 million pounds of daily capacity? That’s not a market; it’s a massacre.

Texas Keeps Growing: What’s encouraging for them—not so much for us up north—is that Texas grew 10.6% year-over-year with 50,000 new cows added by April 2025. Their breakeven point is around $14.50, which means they’re still profitable while Upper Midwest farms bleed out. Different labor costs, different feed sourcing… it’s almost like two separate industries now.

California’s H5N1 Factor: Nearly 1,000 confirmed dairy herd cases across 16 states according to USDA APHIS data, with California ground zero. Production down 1.4%—and ironically, that’s the only thing keeping cheese from hitting $1.50.

The Global Picture Nobody Wants to See

Looking at this from 30,000 feet, as they say, we’re seeing convergence of every bearish factor possible. New Zealand’s production is up 2.8% according to Fonterra’s latest data from the Weekly Global Dairy Market Recap. European cheese crashed 37% year-over-year—and when EU product trades at €2,088 per metric ton, why would anyone buy American?

Four converging crises—record production, collapsing exports, crushing feed costs, and new processing overcapacity—have pushed market pressure 10% beyond crisis threshold, with no relief until 2026 at earliest.

China’s pulling back too—total imports up just 6% through July, but that’s still 28% below their 2021 peaks. They’re cherry-picking what they need: whey up, everything else sideways or down. And Mexico, our biggest customer? They’ve been discussing dairy self-sufficiency targets for 2030. That could mean 230,000 metric tons of powder exports are potentially gone.

A StoneX trader told me Friday—and I think he nailed it—”The U.S. is the Cadillac in a world shopping for Chevys.”

Feed Markets: The Other Shoe Dropping

The milk-to-feed ratio tells the whole story: 1.48 right now. You need 2.0 for decent margins, generally speaking, and 1.8 to break even.

At 1.48 milk-to-feed ratio versus the 2.0 needed for profitability, dairy farmers are bleeding $2/cwt even before paying labor, vet bills, or utilities—a 26% shortfall with no end in sight.

December corn at $4.3475 offers no relief. Western Wisconsin hay dealers? They want $280 a ton delivered for decent mixed—if they’ll even quote you. The latest WASDE Report mentions the U.S.-China trade deal promising 25 million tonnes annually, but you know, that’s maybe next year, not this month’s certain.

Processing Plants Playing Different Games

So here’s what really gets me: three cheese plants just announced 400 million pounds of new capacity for 2026. Hilmar’s Texas facility cranks up in January—5 million pounds daily. Meanwhile, Wisconsin plants run four-day weeks, managing inventory.

How’s that make sense? Well, it doesn’t—unless you realize processors profit on volume, not price. They don’t really care if cheese is $1.60 or $2.10. They care about throughput. More milk equals more margin dollars even at lower percentages. But farmers? We need price, not volume. That fundamental disconnect… that’s what’s killing us.

What Smart Operations Do Now

Here’s what the survivors are telling me, and it’s worth noting these aren’t the guys complaining at the coffee shop—these are the ones actually making it work:

Lock anything over $17 for Class III immediately. One large Wisconsin producer locked 40% of his Q1 production last week at $17.20. As he put it, “I’m not swinging for fences anymore. Singles keep you in the game.”

Cull deep, cull strategically. With springers at $2,100, that third-lactation cow with feet issues? She’s worth more as beef. Several nutritionists report their clients running 15% lower numbers—on purpose.

Component premiums still matter. Dry whey holding at 71¢ means protein still pays. Farms maximizing components—and you know who you are—they’re seeing 30-40¢ more per hundredweight. Not huge, but it’s something.

Rethink expansion completely. Pete Johnson, who ships direct to a cheese plant, told me something interesting: “My neighbor’s co-op pays $1.40 more in premiums, but after deductions, we net about the same. Difference is, I can walk if needed.”

Cooperatives Scrambling for Answers

You know, DFA’s base-excess programs start December 1st, cutting deliveries 5% from last year. Land O’Lakes is paying 25¢ per somatic cell under 100,000—quality over quantity, finally.

What’s interesting is Cornell research shows non-co-op handlers paying 37% quality premiums versus co-ops at 29%. But co-ops counter with competitive premiums, keeping members from jumping. Mixed signals everywhere you look.

The Six-Month Survival Test

Let me be straight with you: if you’re shipping Class IV milk right now, you need at least 6 months of cash reserves. December checks—and I hate to be the bearer of bad news—will drop $1.00 to $1.50 per hundredweight from November based on current futures.

The Federal Order reform coming January 1st? It’ll shift maybe 30¢ from Class I to manufacturing. That’s like putting a Band-Aid on an amputation, honestly.

California’s methane rules adding 45¢ per hundredweight compliance costs starting July… USDA projecting 230 billion pounds production for 2025 in their October forecast… We don’t need more milk, folks. We need less.

The Bottom Line

You know, standing here looking at these numbers, I keep remembering what my dad used to say: “The cure for low prices is low prices.” Eventually, enough producers quit, supply tightens, and prices recover. But how many good families lose everything getting there?

Today’s 10¢ cheese crash wasn’t a correction—it was capitulation. Blocks at $1.67 with seven offers stacked and two lonely bids? That’s not a market; it’s a distress sale. The funds have bailed, end users are covered, and producers… well, we’re holding the bag.

If you’re planning an expansion, stop. Those new parlor dreams? Shelve them. With 9.52 million cows out there—the highest since 1993, according to USDA data—we’re looking at 6 to 12 months before any real relief.

The farms that’ll make it through are the ones acting now: cutting costs aggressively, optimizing components over volume, maintaining working capital for the storm ahead. Everyone else? Well, auction barns are busy again for a reason.

Your November milk check just got lighter—that’s the reality. Tomorrow morning in the parlor, before dawn breaks and that first cup kicks in, ask yourself this: Am I farming to live, or living to farm?

Because at these prices, you better know the answer. 

KEY TAKEAWAYS: 

  • Ghost Town Trading: Cheese crashed 10¢ on just TWO trades today—when seven sellers can’t find buyers, your December check loses $1/cwt
  • Tale of Two Farms: Identical 200-cow operations, but Class III shippers bank $45,000 more annually than Class IV neighbors—same work, vastly different pay
  • Perfect Storm Brewing: Record 9.52M U.S. cows flooding markets while EU cheese trades 37% cheaper and Mexico eyes dairy independence by 2030
  • The $2/cwt Bleed: At $13.90 Class IV milk vs $320/ton feed, even top-tier operations lose money before paying labor, vet, or utilities
  • Survival Playbook: Winners are doing three things NOW—locking any Class III over $17, strategically culling 15% of herds, and banking 6+ months operating capital for the long winter ahead

Complete references and supporting documentation are available upon request by contacting the editorial team at editor@thebullvine.com.

Learn More:

Join the Revolution!

Join over 30,000 successful dairy professionals who rely on Bullvine Weekly for their competitive edge. Delivered directly to your inbox each week, our exclusive industry insights help you make smarter decisions while saving precious hours every week. Never miss critical updates on milk production trends, breakthrough technologies, and profit-boosting strategies that top producers are already implementing. Subscribe now to transform your dairy operation’s efficiency and profitability—your future success is just one click away.

NewsSubscribe
First
Last
Consent

Weekly Global Dairy Market Recap: Monday, November 3, 2025: European Cheese Crashes 37% as Class Spread Hits Historic High

European cheese crashed 37% year-over-year, and the Class III-IV spread reached a farm-killing $3.50/cwt.

Executive Summary: Global dairy markets are in freefall. European cheese crashed 37% year-over-year, GDT auctions fell for the fifth straight week, and the Class III-IV spread exploded to a farm-killing $3.50/cwt—your Class III neighbor is now making $3,800 more per month than you. Milk production is surging everywhere (New Zealand +2.8%, UK +7.5%, U.S. herd at 32-year high) while demand craters, with only whey (+2.2%) and China’s premium dairy pivot offering hope. The Trump-Xi deal promises 25 million tonnes of annual soybean purchases to ease feed costs, but it won’t save commodity producers. Bottom line: If you’re shipping Class IV at $13.90 while others get $17.40 for Class III, you’re losing $45,000 annually. The farms that survive will be those that act now to lock in Class III, optimize components, and abandon the volume-at-any-cost mentality that’s driving this market into the ground.

Global Dairy Markets

Global dairy markets delivered another week of painful reality checks. European cheese posted annual declines of more than 30%. The fifth straight GDT auction decline confirmed what you already know—there’s too much milk chasing too few buyers. Meanwhile, the Class III-IV spread hit $3.50/cwt, meaning your neighbor shipping Class III milk is making $3,800 more per month than you are if you’re stuck in Class IV.

European Futures: Butter Holds, Everything Else Slides

Key Takeaway: European traders moved 2,620 tonnes last week, but the real story is powder weakness (-1.3%) while whey bucked the trend (+2.2%)—a clear signal that protein derivatives are the only bright spot.

EEX recorded 524 lots of trading activity, with Tuesday’s 925-tonne session marking the week’s peak. The breakdown tells you everything about market sentiment:

  • Butter futures only dropped 2.0% to €5,093/tonne
  • SMP futures weakened 1.3% to €2,161/tonne
  • Whey futures climbed 2.2% to €1,007/tonne

That whey strength? It’s your lifeline. Strong protein derivative demand for feed and nutrition applications is keeping values supported while everything else crumbles.

Singapore Exchange: New Zealand’s Spring Flush Hits Hard

Key Takeaway: SGX traders moved 17,020 tonnes, but WMP prices fell for the fifth straight week to $3,523/tonne—Fonterra’s 2.8% production increase is flooding the market.

The numbers paint a clear oversupply picture:

  • WMP: Down 0.7% to $3,523/tonne
  • SMP: Flat at $2,591/tonne
  • AMF: Up 0.2% to $6,677/tonne
  • Butter: Down 1.3% to $6,339/tonne

Here’s what matters for your operation: Fonterra’s September collections hit 179 million kgMS (+2.8% YoY), with season-to-date volumes running 3.0% ahead. When New Zealand pumps out milk like this, global prices have nowhere to go but down.

European Cheese Collapse: The 30% Massacre

European Cheese Markets in Historic Freefall

Key Takeaway: European cheese prices aren’t just weak—they’re in historic freefall. Every major variety is down 30%+ year-over-year, and buyers know more pain is coming.* The weekly damage was brutal:

  • Cheddar Curd: Crashed €113 to €3,388 (-33.6% YoY)
  • Mild Cheddar: Plunged €206 to €3,430 (-33.3% YoY)
  • Young Gouda: Trading at €2,909 (-37.2% YoY)
  • Mozzarella: Down €105 to €2,823 (-36.2% YoY)

Why should you care? Because European processors are bleeding cash—paying €520/tonne for milk while selling Gouda at €400/tonne. That math doesn’t work. Something’s got to give.

GDT Auction: Fifth Straight Decline Says It All

Fifth Consecutive GDT Decline Confirms Bearish Reality

Key Takeaway: *The GDT Pulse auction delivered another gut punch—WMP at $3,560 and SMP at $2,530 represent 13-month lows. Buyers have zero urgency. The PA092 results confirmed what everyone fears:

  • WMP: $3,560/tonne (down $90 from two weeks ago)
  • SMP: $2,530/tonne (down $55 from prior pulse)
  • Total volume: Only 2,612 tonnes with 41 bidders

That’s five consecutive declines. The message? Global buyers are sitting on their hands, waiting for even lower prices.

Global Production: Everyone’s Making More Milk

Key Takeaway: From New Zealand (+2.8%) to Poland (+5.7%) to the UK (+7.5%), milk is flowing everywhere except where you need it—into buyer demand.

Southern Hemisphere Springs Forward

  • New Zealand: 316.3 million kgMS season-to-date (+3.0%)
  • Australia (Fonterra): 23.4 million kgMS YTD (+3.0%)
  • Argentina: September production surged 9.9% YoY

Northern Hemisphere Piles On

  • UK: September hit 1.28 million tonnes (+7.5% YoY)
  • Poland: 1.11 million tonnes in September (+5.7% YoY)
  • Ireland: November 2024 exploded 34% higher
  • USA: Herd at 9.52 million cows—highest since 1993

CME Markets: The Class Spread That’s Killing Farms

Historic Class III-IV Spread Creates $3,800 Monthly Winners and Losers

Key Takeaway: The $3.50/cwt Class III-IV spread isn’t just a number—it’s the difference between profit and loss for thousands of dairy farms.*Here’s your Friday closing reality check:

Winners:

  • Cheddar Barrels: $1.8050 (+3.5¢)
  • Dry Whey: $0.7100 (+2¢)—nine-month high
  • Class III November: $17.40/cwt

Losers:

  • NDM: $1.1325 (-2.75¢)
  • Butter: $1.6100 (barely holding)
  • Class IV November: $13.90/cwt

Do the math: If you’re shipping 3 million pounds monthly, that $3.50 spread means $3,800 less in your milk check compared to your Class III neighbor. That’s a new pickup truck disappearing every year.

Feed Markets: China Deal Sparks Soybean Rally

Key Takeaway: Soybeans hit $11/bushel on China’s promise to buy 12 million tonnes immediately plus 25 million tonnes annually—but will they follow through?

The Trump-Xi meeting delivered feed market fireworks:

  • Soybeans: Surged 60¢ to $11.00/bushel (15-month high)
  • Soybean Meal: Jumped $27 to $321.40/ton
  • Corn: Up 8¢ to $4.31/bushel

Treasury Secretary Bessent’s announcement sounds impressive, but here’s the reality: Those Chinese purchase commitments are still below pre-trade war levels. Don’t count your feed savings yet.

Trade Breakthroughs: Southeast Asia Opens Doors

Key Takeaway: New agreements with Malaysia, Cambodia, Thailand, and Vietnam eliminate dairy tariffs—finally giving U.S. exports a fighting chance against New Zealand and Australia.

President Trump’s Asian tour delivered real results:

  • Malaysia: Eliminates all dairy tariffs, recognizes U.S. standards
  • Cambodia: Zero tariffs on all U.S. dairy products
  • Thailand: Framework covers 99% of goods (dairy included)
  • Vietnam: Preferential access for substantially all dairy

Why this matters: Vietnam imported $668 million in dairy through August 2025, but U.S. suppliers captured only $22 million due to tariff disadvantages. These deals level the playing field.

China’s Premium Pivot: The $150,000 Opportunity

Key Takeaway: China’s 18% surge in premium dairy imports versus 12% declines in commodity products isn’t a blip—it’s a structural shift that rewards quality over quantity.

The numbers tell the story:

  • Cheese imports: +13.5% YoY
  • Butter imports: +72.6% YoY
  • Skim milk powder: Significant retreat

For a 500-cow operation optimized for components and premium channels, this shift could mean $150,000+ in additional annual revenue. The question is: Are you positioned to capture it?

The Bottom Line: Survival Mode Until Spring

Here’s your reality: Global milk production is overwhelming demand, and it’s not stopping. The Class III-IV spread is creating massive inequities between farms. European cheese markets are in freefall with no floor in sight. Your only bright spots? Whey strength and potential Chinese premium demand.

Three moves to make this week:

  1. Lock in Class III if you can—that $3.50 spread won’t last forever
  2. Review your component optimization—premium markets are your escape route
  3. Don’t forward contract cheese—European prices prove there’s more pain coming

The market’s sending clear signals: Commodity dairy is dead money. Premium products and value-added channels are your survival strategy. The farms that adapt to this reality will still be here in 2027. The ones that don’t? They’ll be someone else’s expansion.

What’s your move? The clock’s ticking, and every month at $13.90, Class IV is another month closer to the edge. 

Complete references and supporting documentation are available upon request by contacting the editorial team at editor@thebullvine.com.

Learn More:

Join the Revolution!

Join over 30,000 successful dairy professionals who rely on Bullvine Weekly for their competitive edge. Delivered directly to your inbox each week, our exclusive industry insights help you make smarter decisions while saving precious hours every week. Never miss critical updates on milk production trends, breakthrough technologies, and profit-boosting strategies that top producers are already implementing. Subscribe now to transform your dairy operation’s efficiency and profitability—your future success is just one click away.

NewsSubscribe
First
Last
Consent

CME Dairy Market Report October 30, 2025: Today’s Historic Class Price Gap Is Creating $3,800 Monthly Winners and Losers

Two identical farms. One gets $17.81/cwt today. The other? $13.75. The ONLY difference: where their milk truck goes.

Executive Summary: Today’s dairy market delivered a brutal verdict: if your milk goes to cheese, you’re winning at $17.81/cwt – but if it’s heading to powder, you’re bleeding money at $13.75. This historic $4 gap means identical farms are now separated by $3,800 per 100 cows per month, and NDM’s collapse today (seven sellers, zero buyers) signals it’s getting worse. While cheese held firm above $1.82, powder crashed by 2.25 cents amid intensifying European competition and weakening global demand. Feed costs keep climbing – corn hit $4.35/bu, soybean meal $308/ton – squeezing everyone’s margins, but only cheese producers have the pricing power to survive. The industry’s geographic revolution accelerates as Texas adds 50,000 cows and builds massive new plants while California and Wisconsin struggle with regulations and aging infrastructure. Smart operators are locking in Q1 2026 Class III near $18 and making hard decisions about their future – because in this market, standing still means falling behind.

Dairy Class Price Gap

Let me tell you what’s happening in the dairy markets today —and, more importantly, what it means for your next milk check. We saw cheese prices hold steady above $1.82, which is good news if you’re shipping to a cheese plant. But if your milk’s going into powder? That 2.25-cent drop in NDM to $1.14 is going to sting. This growing divergence between Class III and Class IV prices — now nearly $4 per hundredweight — is creating clear winners and losers depending on where your tanker is unloaded.

Looking at today’s trading, what’s interesting here is the complete absence of action in cheese despite decent bid support. No trades in blocks or barrels isn’t unusual after a week-long rally, but the seven offers stacked up against zero bids in NDM? That tells you everything about where sentiment is heading for powder markets.

Two Identical Farms, One Brutal Verdict: The $3,800 monthly gap reveals how processor relationships now matter more than production efficiency—cheese-bound operations at $17.81/cwt are winning while powder-plant farmers bleed at $13.75/cwt.

Today’s Price Action — What These Numbers Mean for Your Farm

ProductPriceToday’s MoveWeekly TrendReal Impact on Your Farm
Cheese Blocks$1.8250/lbUnchangedUp 1.4%Holding firm above $1.82 keeps Class III near $17.80
Cheese Barrels$1.8200/lbUnchangedUp 1.4%Steady demand supporting the cheese complex strength
Butter$1.5725/lb+1.75¢Down 0.1%Small bounce won’t offset NDM weakness for Class IV
NDM Grade A$1.1400/lb-2.25¢Up 3.4%Sharp drop pulls November Class IV below $14
Dry Whey$0.7000/lbUnchangedUp 3.2%Steady support for Class III other solids value
Market Sentiment Splits Violently: Cheese’s steady climb to $1.83 contrasts with NDM’s freefall to $1.14—today’s seven sellers against zero buyers signals powder markets haven’t found bottom yet, widening the Class III/IV chasm to historic levels.

The cheese market’s taking a breather after climbing steadily all week. With blocks and barrels both parked above $1.82, processors seem content with their inventory levels heading into the November holiday demand. That’s actually constructive for maintaining these price levels.

But here’s where it gets concerning — NDM dropping 2.25 cents on heavy offers and absolutely no buying interest. When you see seven sellers trying to unload product with no takers, that’s a market looking for a floor. This weakness directly hits anyone shipping to butter-powder plants, pulling that November Class IV price down toward $14 or potentially lower.

From the Trading Floor — Reading Between the Lines

Bid/Ask Dynamics Tell the Story

The order book today painted two very different pictures. Cheese showed balance with just two bids and two offers on blocks, nothing on barrels — that’s a market comfortable with current levels. But NDM? Zero bids against seven offers is about as bearish as it gets. As one Chicago floor trader told me this morning, “Nobody wants to catch a falling knife in powder right now.”

Trading volumes stayed extremely light — only two loads of butter actually changed hands. The lack of cheese trades doesn’t worry me; it’s normal consolidation. But NDM’s inability to attract even a single bid at progressively lower prices? That suggests we haven’t found the bottom yet.

Volume Patterns and Market Mechanics

What caught my attention was the timing of those NDM offers. They started appearing early and kept building throughout the session, with sellers growing increasingly anxious as the day wore on. The price had to drop 2.25 cents just to clear the board, and even then, no actual trades occurred — just a lower posted price trying to entice buyers who weren’t there.

Where We Stand Globally — And Why It Matters

You want to know why NDM’s struggling? Look at global prices. U.S. NDM at $1.14 per pound is now squeezed between New Zealand at roughly $1.15 and Europe, sitting around $1.00 (based on current exchange rates). That 14-cent premium over European powder is killing our competitiveness in key export markets like Mexico and Southeast Asia.

The real opportunity — and I’ve been saying this for weeks — is in butter. At $1.5725, we’re trading at a massive discount: 89 cents below Europe and $1.40 below New Zealand. Yet nobody’s stepping up to arbitrage this gap. Either U.S. butter is about to rally hard, or global prices are set for a major correction. Something’s got to give.

Market Inefficiency or Warning Signal? The $1.40 butter discount to New Zealand defies arbitrage logic—either U.S. prices are set to rally hard, or global markets face a major correction. Smart money is watching this gap obsessively.

According to Rick Naerebout, CEO of the Idaho Dairymen’s Association, “We’re seeing strong interest from international buyers for U.S. butter at these levels, but the logistics of securing a consistent supply through Q1 2026 is holding back larger commitments.”

Feed Costs Keep Creeping Higher

Your feed bills aren’t doing you any favors right now. December corn futures closed at $4.3450 per bushel, up 6.5 cents this week. December soybean meal hit $308.70 per ton, gaining $11.

For a typical Upper Midwest dairy running a standard TMR, you’re looking at an extra $0.15-0.25 per cow per day in feed costs from this week’s rally alone. With the milk-to-feed ratio barely treading water, these incremental cost increases are directly eating into your already thin margins.

Dr. Bill Weiss from Ohio State’s dairy nutrition program notes, “The projected feed cost index for 2025 sits at 92, suggesting an 8% decrease from 2024 levels, but current futures pricing indicates that relief may not materialize until late Q1 2026.”

Production Reality Check — Where the Milk’s Coming From

USDA’s latest projections have milk production at 230.0 billion pounds in 2025 and 231.3 billion pounds in 2026 — both revised upward from previous estimates. But here’s what matters: where that milk’s being produced and who’s got the processing capacity to handle it.

The geographic shift is striking. Texas posted a jaw-dropping 10.6% surge in April 2025, hitting 1.511 billion pounds. Idaho’s up 4.2% at 1.471 billion pounds. Meanwhile, California’s still recovering from H5N1 impacts, down 1.4%, and Wisconsin — the traditional dairy heartland — barely grew at 0.1%.

This isn’t just statistics; it’s a fundamental realignment of the U.S. dairy industry. Texas added 50,000 cows in the past year. Idaho gained 28,000. Kansas jumped 16,000. These states are building new processing capacity to match — Leprino’s massive cheese plant in Lubbock will process a million pounds daily when it opens in 2025.

The Geographic Revolution Is Here: Texas’s 50,000-cow expansion and Idaho’s 28,000 additions expose the brutal reality—dairy’s future belongs to states with water rights, minimal regulations, and new $11B processing infrastructure, not nostalgic traditions.

What’s Really Driving These Markets

Domestic Demand Dynamics

Holiday cheese demand is providing the floor under current prices. Retailers are actively building inventory for Thanksgiving promotions, keeping both block and barrel prices well-supported above $1.82. Food service demand remains steady, according to several major processors I spoke with this week.

But butter’s a different story. Inventories appear more than adequate for holiday baking needs. As one major retailer’s dairy buyer put it, “We’re covered through New Year’s at current consumption rates. No need to chase prices higher.”

Export Markets — The Pressure Points

U.S. Dairy Export Council data shows we’re in a knife fight with the EU for market share in Mexico. Today’s NDM price drop was necessary to stay competitive. But the bigger story is Southeast Asia, where demand continues to grow at 4-6% annually, according to recent USDEC reports.

The massive butter discount to global prices should be creating export opportunities, but logistics remain challenging. “We need consistent supply commitments through Q2 2026 to make these international contracts work,” notes a major exporter who requested anonymity.

Forward Markets and What They’re Telling Us

November Class III futures settled at $17.81 yesterday — today’s stable cheese market keeps that outlook intact. November Class IV at $14.02 faces more downward pressure after today’s NDM drop, potentially testing below $14.

Looking ahead, markets are pricing Class III around $17.30 for Q4 2025 and $16.85 for the first half of 2026. Class IV projections sit at $16.00 for Q4 and $15.75 for H1 2026. This persistent $1.50+ spread between Class III and Class IV isn’t going away anytime soon.

USDA’s all-milk price forecast for 2025 sits at $21.35 per hundredweight, with 2026 projected at $20.40 — both recently revised downward due to growing milk supplies and moderate demand growth.

From the Farm — Producer Perspectives

“We’re holding our own with these cheese prices, but barely,” says Jim Henderson, who milks 450 cows near New Glarus, Wisconsin. “Feed costs keep nibbling away at margins. If Class III drops below $17.50, we’ll have to make some hard decisions about culling.”

Down in Texas, the mood’s different. “We’re expanding,” states Maria Rodriguez, managing a 2,500-cow operation outside Dalhart. “With Leprino coming online next year, we need the milk ready. These prices work for us with our cost structure.”

In Pennsylvania, third-generation dairyman Tom Mitchell is more cautious: “I’m locking in 30% of my Q1 2026 milk at $18.85 Class III. After what we went through in 2023, I’m not taking chances. Better to know your margin than hope for higher prices.”

Regional Spotlight: The Changing Landscape

Wisconsin and Minnesota — The traditional dairy heartland is holding steady but not growing. Corn harvest is complete with good yields, helping stabilize the local feed basis. Cheese plants are operating at capacity due to holiday orders. Spot milk premiums remain steady, reflecting balanced supply-demand dynamics. The real concern? Younger producers are questioning long-term viability with these margins.

Texas and the Southwest — This is where the action is. With Cacique’s Amarillo facility now operational and Leprino’s Lubbock plant set to come online in 2025, processing capacity is finally catching up with production growth. Land values of $6,000-$8,000 per acre remain reasonable compared to traditional dairy regions. Water availability varies by location, but it hasn’t yet constrained growth.

California — Still recovering from H5N1 impacts and facing ongoing water challenges. The proposed Dairy Order requiring nitrogen discharge limits of 10 milligrams per liter will add costs. As dairy farmer John Silva near Tulare explains, “Between water regulations, air quality rules, and labor laws, it’s getting harder to compete. Some neighbors are selling to almond growers.”

Idaho — Continuing its steady expansion, with milk production up 4.2% year-over-year. The state now ranks fourth nationally, accounting for 7.5% of total U.S. production. Processing capacity remains the constraint, but several expansion projects are in the planning stages.

Three Market Scenarios for Next Week

Bull Case (25% probability): Cheese breaks above $1.85 on strong holiday orders, pulling Class III toward $18.50. Export buyers finally move on discounted butter, sparking a rally above $1.65. This scenario requires an unexpected surge in demand or a production disruption.

Base Case (60% probability): Cheese consolidates between $1.80 and $1.85. NDM continues sliding toward $1.10. Butter stays range-bound $1.55-1.60. Class III pays $17.50-18.00, while Class IV pays $13.75. Feed costs remain elevated.

Bear Case (15% probability): Cheese breaks below $1.80 on profit-taking. NDM accelerates decline toward $1.05. Growing milk supplies overwhelm demand. Class III drops toward $17, Class IV toward $13.50. This requires significant demand destruction or a major production surge.

What Farmers Should Do Now

Price Risk Management Lock in 25-30% of Q1 2026 milk production through Class III futures near $18. Use Dairy Revenue Protection for catastrophic coverage below $16. Consider collar strategies to maintain upside while protecting downside — buying $17 puts while selling $19 calls, for instance.

Feed Strategy Book 40-50% of Q1 2026 corn needs at current levels. Soybean meal showing concerning strength — if you lack coverage through winter, act before it breaks $320/ton. Watch South American weather closely; any production issues there will drive prices higher.

Operational Decisions With the massive Class III/IV spread, every percentage point of protein and fat matters. Work with your nutritionist to fine-tune rations. Consider genomic testing to identify your highest component producers. Cull decisions should factor in not just production but component quality.

Cash Flow Planning. That gap between Class III and Class IV means uneven milk checks depending on your plant’s utilization. Budget conservatively. Build working capital while cheese prices hold. Consider equipment purchases now rather than waiting for potentially tighter margins in 2026.

Industry Intelligence — What’s Coming Down the Pike

Federal Order Reform Impact The comment period for FMMO reform closes soon. Key proposals include updating milk component values, revising Class I pricing, and adjusting make allowances. “These changes could shift milk values by $1-2 per hundredweight once implemented,” notes Dr. Marin Bozic, dairy economist at the University of Minnesota.

Processing Capacity Expansion Beyond Leprino: In Texas, significant capacity is coming online. Chobani’s $500 million Idaho expansion, Select Milk’s powder facility upgrades, and multiple smaller cheese plants across the Midwest. The industry’s investing over $11 billion in new capacity through 2026, according to the International Dairy Foods Association.

Technology Adoption: Robotic milking systems are no longer just for small farms. Several 1,000+ cow operations are installing robots, citing labor savings and improved cow health. “The payback’s under five years at current milk prices,” reports one Wisconsin producer who installed 24 robots last year.

The Brutal Mathematics of Plant Relationships: That ‘small’ $3,800 monthly difference compounds into $45,600 annually—enough to fund expansion, hire workers, or justify switching processors. This chart is why powder-plant farmers are calling cheese plants this week.

The Bottom Line — Context for Today’s Market

Today was a pause day after cheese’s weeklong rally. That’s normal, healthy even. The stability above $1.82 suggests these levels are sustainable through holiday demand.

But NDM’s accelerating weakness is concerning. This isn’t just market noise — it reflects fundamental oversupply in global powder markets and weak demand from key importers. When you can’t find a single bid at progressively lower prices, more downside usually follows.

The growing spread between Class III and Class IV — now approaching $4 per hundredweight — creates distinct winners and losers. If you’re shipping to a cheese plant, you’re in decent shape. Butter-powder plants? That’s a different story entirely.

Compared to last October, we’re in a better position on cheese but significantly worse on powder and butter. This divergence isn’t resolving anytime soon. Success in this environment requires active management — of price risk, feed costs, and operational efficiency. The days of riding market waves without a strategy are over.

What’s clear is that the U.S. dairy industry is undergoing fundamental restructuring. Production is shifting to states with fewer regulatory constraints and newer infrastructure. Traditional dairy regions face mounting challenges. Processing capacity is playing catch-up to this geographic realignment.

Smart money’s positioning for this new reality. The question is: are you adapting fast enough to thrive in tomorrow’s dairy industry, or are you hoping yesterday’s strategies will somehow work in tomorrow’s markets? 

Key Takeaways: 

  • The $45,600 Question: Same milk, same work, but cheese-bound farms earn $17.81/cwt while powder operations bleed at $13.75 – your plant relationship now matters more than your production efficiency
  • NDM’s Zero-Bid Disaster: Today’s seven sellers vs zero buyers signals something darker – U.S. powder can’t compete with Europe’s $1.00/lb pricing, and the gap’s widening
  • Geographic Exodus Accelerates: Texas added 50,000 cows while California lost 8,000 – follow the milk to states with water rights, sane regulations, and new $11B in processing capacity
  • Feed Math That Kills: At $4.35 corn and $308 soy meal, you need $18+ milk to maintain 2019 margins – only cheese producers have a shot
  • Your 72-Hour Decision: Lock in 30% of Q1 2026 at $18+ Class III before smart money takes it all – standing still in this market means falling behind

Complete references and supporting documentation are available upon request by contacting the editorial team at editor@thebullvine.com.

Learn More:

Join the Revolution!

Join over 30,000 successful dairy professionals who rely on Bullvine Weekly for their competitive edge. Delivered directly to your inbox each week, our exclusive industry insights help you make smarter decisions while saving precious hours every week. Never miss critical updates on milk production trends, breakthrough technologies, and profit-boosting strategies that top producers are already implementing. Subscribe now to transform your dairy operation’s efficiency and profitability—your future success is just one click away.

NewsSubscribe
First
Last
Consent

When Milk Checks Shrink, Pay Attention: What’s Coming in September

3.4% milk surge, but your check’s down $1.50. Here’s why.

EXECUTIVE SUMMARY: Listen, here’s what’s really going on with your milk check: July Class III dropped to $17.32/cwt—that’s $1.50 less than June, and butter just took a 13.5¢ dive in one day. Meanwhile, we’re pumping out 3.4% more milk than last year across the top 24 states… so yeah, there’s way more milk chasing fewer buyers. China’s playing a different game now—they’re buying smart, not desperate. Europe’s keeping more product at home because their internal prices are sky-high. What does this mean for you? Simple: how you hedge your bets and protect your feed costs just became make-or-break decisions. Time to get serious about locking in those income-over-feed margins before this gets worse.

KEY TAKEAWAYS

  • Watch those block prices like a hawk — when cheddar drops below $1.80, your protein payouts take a beating. Use this as your trigger for futures positions.
  • Stack your protection tools — combine Dairy Revenue Protection with CME options for 6-12 months out. It’s not optional anymore in this market.
  • The global game changed — U.S. milk up 3.4%, China buying selectively, Europe exporting less. These aren’t temporary blips—adjust accordingly.
  • Tighten up now, not later — every percentage point you gain in feed efficiency matters more when spot markets are sliding. Small improvements = big dollars.
  • Keep your banker happy — Rural Mainstreet Index is falling, covenants are tightening. Solid liquidity keeps you in the game when volatility hits.

That sinking feeling’s back. USDA locked July’s Class III price at $17.32/cwt, down $1.50 from June — a clear sign September checks are heading lower. Add a brutal week of market carnage, capped by a 13.5¢ plunge in butter, and the message for producers is stark: brace yourself.

The numbers that matter (and they’re not pretty)

On August 27, CME spot trading told a tough story: butter dropped to $2.05/lb, down 13.5 cents, and cheddar blocks slid to $1.76, down 5 cents. For farms working cheese-heavy contracts, this math is brutal. Blocks below $1.80 drag protein payouts down, and butter can only mop up so much.

Class III milk prices and spot butter prices from March to August 2025 showing recent downward trends

The supply story that’s keeping me up nights

June milk production from the 24 major dairy states hit 18.5 billion pounds, up 3.4% year-over-year—the biggest jump since 2021. Dairy cow inventories rose by 146,000 head, with much of the growth concentrated in Texas, Idaho, Kansas, and South Dakota, which added 140,000 head combined. That’s a flood of milk chasing thinner buyer demand.

June milk production by major US dairy states for 2024 and 2025 showing 3.4% overall increase

The global mess we can’t ignore

China used to be our safety valve, but the game has changed. Their import appetite hasn’t vanished—in fact, imports were up for five straight months to start 2025. The real story is a structural crisis in domestic production, leading to selective, strategic buying rather than panic purchases. They’re targeting specific needs, which means they’re no longer absorbing global oversupply the way they once did. USDA’s China Dairy Annual tells the story.

Europe isn’t easing the pressure. Although Brussels’ July outlook indicates that milk deliveries are holding steady, soaring internal prices have made European products less competitive on the global stage. However, butter and powder exports are forecasted to decline in 2025, resulting in more products staying close to home rather than easing global market pressure. The Brussels July Outlook has the details.

At the August 6 Global Dairy Trade auction, about 37,000 tons changed hands. Buyers acted with discipline, not panic.

Don’t bet the farm on butter

Industry analysts called the butter market “murky.” And the August 27 drop to $2.05 confirmed their concerns. Cream is abundant, churns are stable, and butter premiums just aren’t enough to prop up payouts when cheddar keeps sliding.

The banker conversation nobody wants

The Rural Mainstreet Index numbers continue to fall, reflecting growing lender caution. Covenants are tightening, and lenders are cutting slack. Hitting a $1.50 monthly drop in Class III milk and a sharp decline in butter rings loud warning bells.

While USDA’s ERS projects 2025 milk prices near $22.00/cwt, that forecast doesn’t reflect today’s mailbox realities.

What the smart money’s doing

The smart operators aren’t just relying on milk prices—they’re locking in income-over-feed margins. They’re layering Dairy Revenue Protection, LGM-Dairy, and CME options strategies to secure coverage for 6 to 12 months out.

One Wisconsin farmer said it best: “Blocks at $1.76 and butter at $2.05 don’t pencil like June. We hedged early and tightened shrink before the checks showed the damage.”

Your move

The best bet? Watch blocks stay above $1.80 and butter steady for several weeks. That’s your early sign that things might shift.

But the longer story is about patience. China’s strategic buying, Europe’s pricing challenges, and the U.S.’s milk surge signal a longer adjustment phase.

Defend your margins, trim waste, and maintain a close liquidity position.

The operations that survive this intact will be well-positioned to capitalize on the upside when things finally turn. The difference between thriving and surviving will be decided by the risk management decisions you make in the next 90 days. Make sure you’re on the right side of that divide.

Bottom line? September’s gonna be rough, but the smart money is already positioning for 2026. Don’t get caught flat-footed.

Time to make some calls and lock in those margins. Your future self will thank you.

Recovery? More likely a 2026 story than a late 2025 one.

Complete references and supporting documentation are available upon request by contacting the editorial team at editor@thebullvine.com.

Learn More:

Join the Revolution!

Join over 30,000 successful dairy professionals who rely on Bullvine Weekly for their competitive edge. Delivered directly to your inbox each week, our exclusive industry insights help you make smarter decisions while saving precious hours every week. Never miss critical updates on milk production trends, breakthrough technologies, and profit-boosting strategies that top producers are already implementing. Subscribe now to transform your dairy operation’s efficiency and profitability—your future success is just one click away.

NewsSubscribe
First
Last
Consent
Send this to a friend