The Reynolds family bet half their Idaho farm on dairy. An Oregon neighbor did everything “right” and still bleeds cash. The gap? Up to $600,000 a year in geography, not effort.
Executive Summary: You’re not imagining it — Idaho’s dairy families aren’t just getting lucky, they’re starting every year about $600,000 ahead of similar herds in Oregon and Washington because of feed, labor, and plant math they don’t control. Through the Reynolds family’s R 7 Dairy and the Kircher/Bansen Forest Glen operations, you see how cheap hay, no ag overtime, and billion-dollar-class processing investments in Idaho created a structural edge of $3.10–$4.25/cwt, while Darigold’s $300 million Pasco overrun and $4.00/cwt deductions pushed many Washington members into survival mode. Even a 2,200-cow organic A2 Jersey herd with grazing, a digester, and strong contracts can’t fully outrun a bad zip code once organic feed, overtime rules, and processor margins stack up. This piece doesn’t stop at sympathy; it gives you three concrete paths in a high-cost state — spend millions on robots and automation, pivot hard into ultra-premium contracts, or plan a relocation/exit on your terms instead of the bank’s. It also shows how CDCB’s 2025 Net Merit update — more weight on Feed Saved and fat, less on protein — quietly shifts sire selection from “nice to have” traits to survival filters if you’re fighting high costs. In plain language, it explains why geography now sets your floor, why management and genetics still decide your ceiling, and what decisions you actually have left if your zip code is working against you.
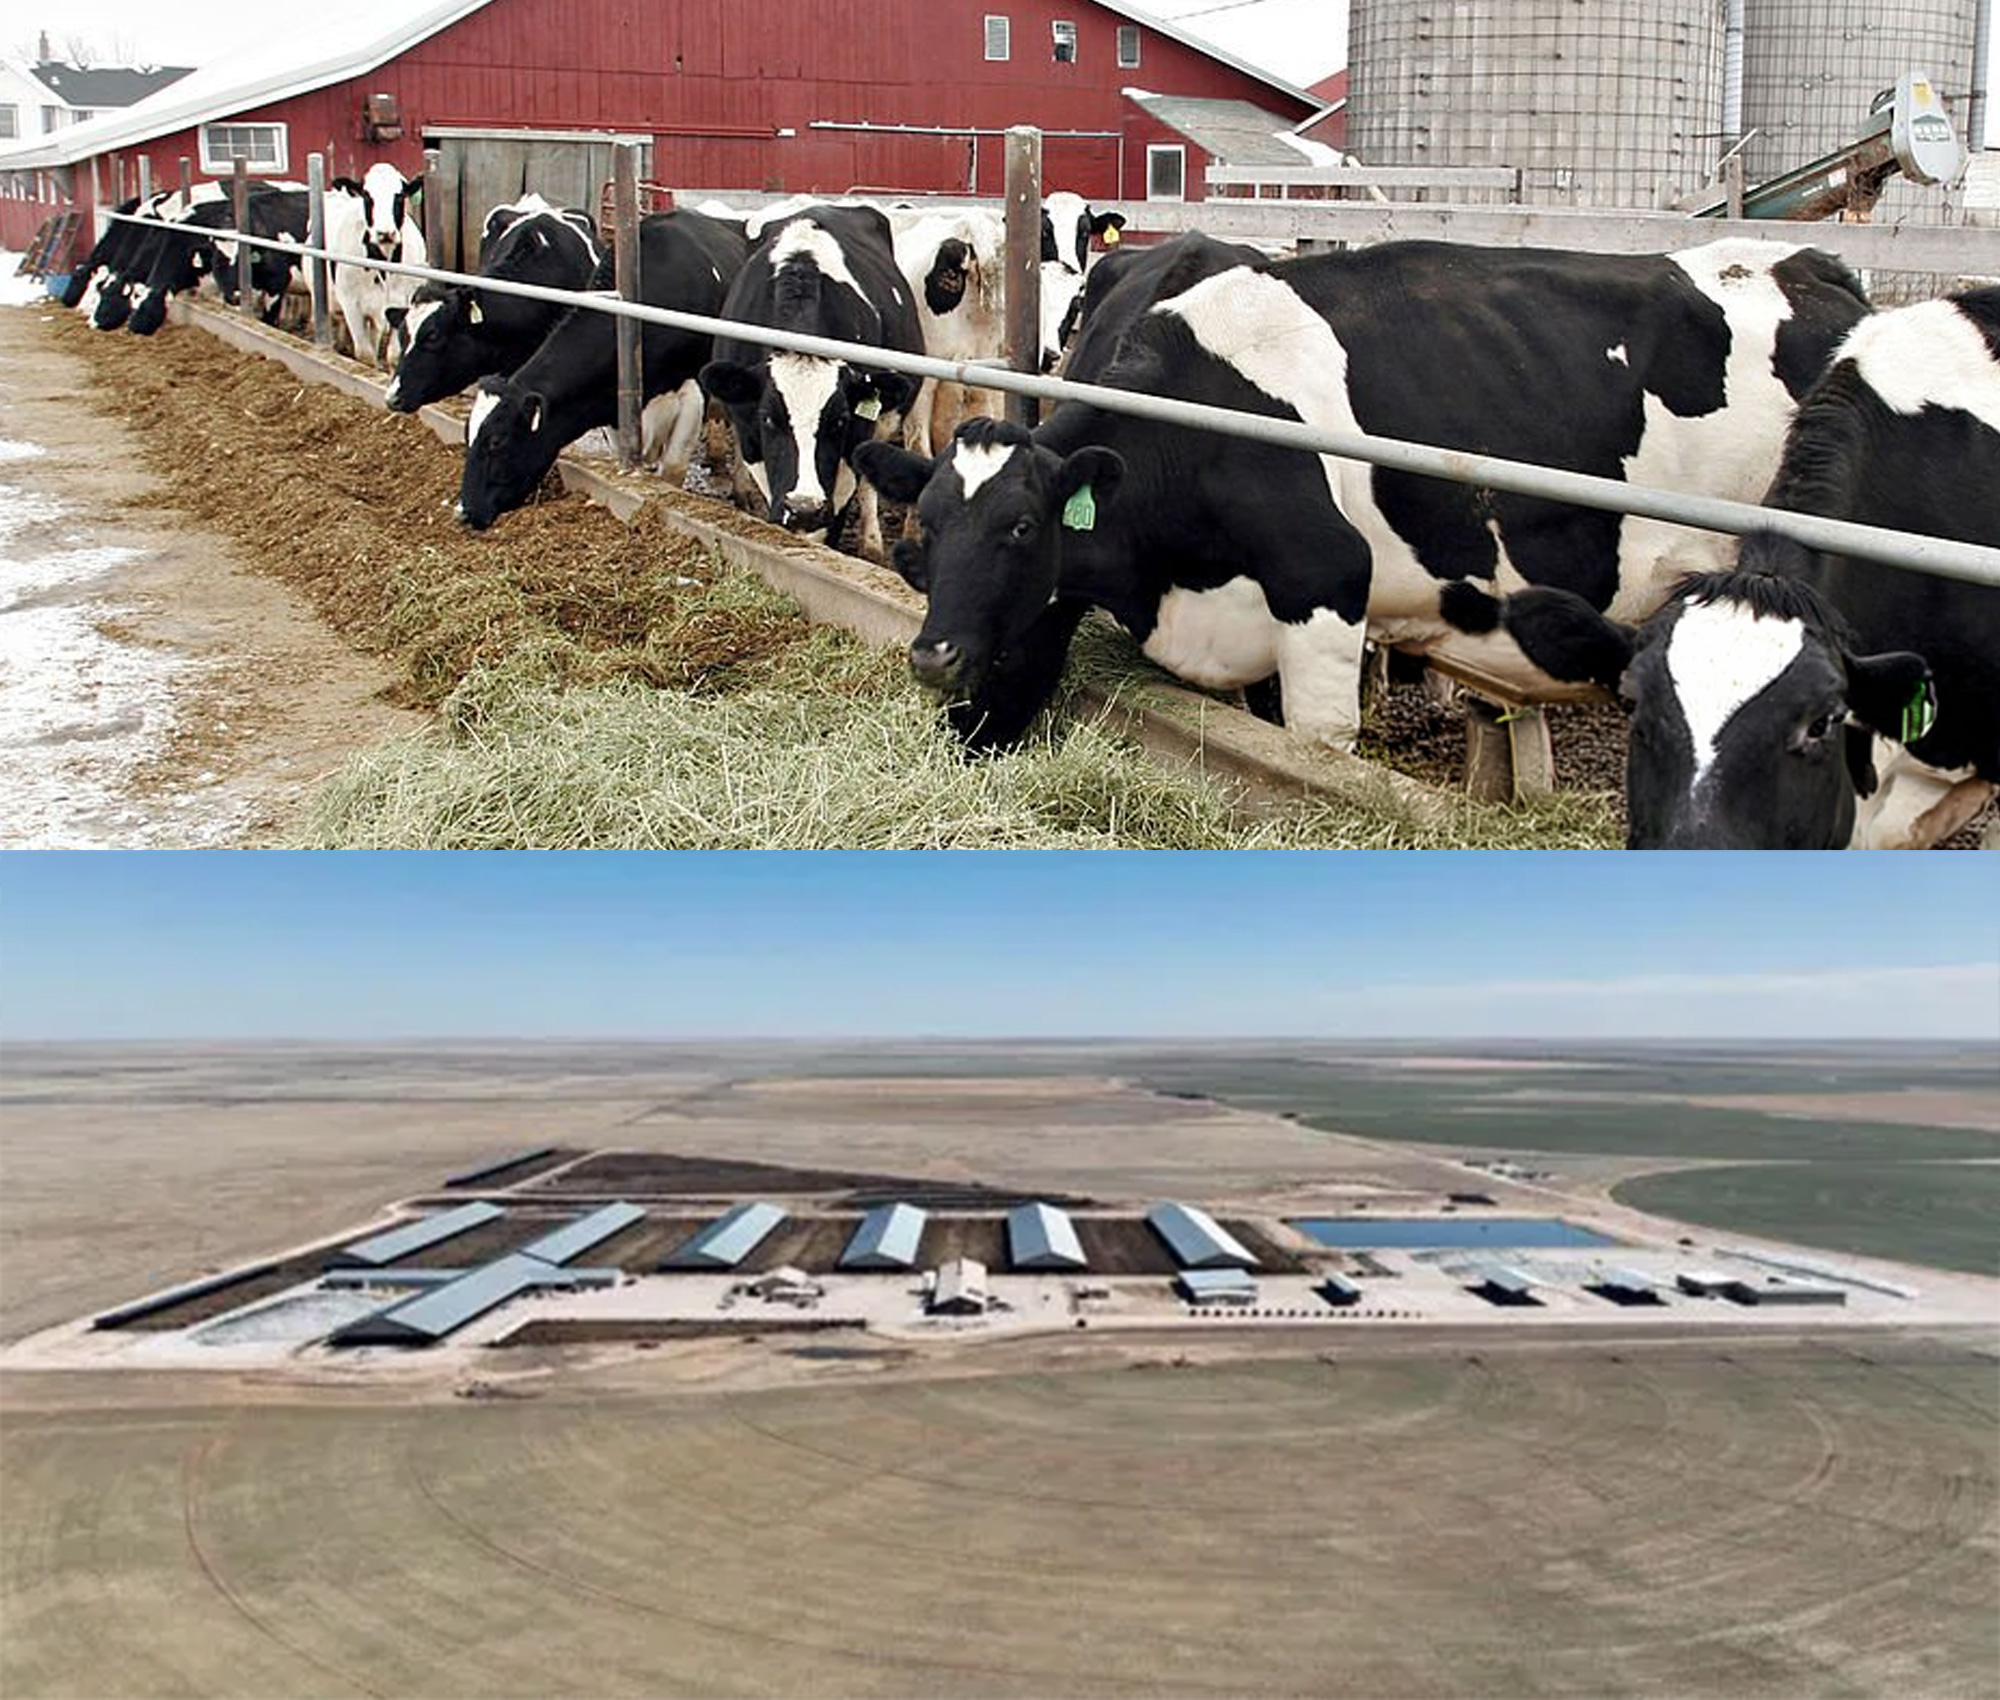
Dave Reynolds didn’t come from dairy. He came from row crops — 2,200 acres of sweet corn seed, silage, wheat, barley, sugar beets, and alfalfa near Kuna, Idaho. He was, by his own admission, “less comfortable with animals.” But his son Tyler took dairy science courses at the University of Idaho and saw what his father couldn’t: the crops they already grew were essentially a dairy ration in the ground. The cows were the missing piece.
When a small dairy nearby went to auction in 2012, every established operator in the valley passed. “For the big dairymen, it was way too old, way too little,” Dave told Capital Press (May 28, 2025). Tyler convinced his father to buy in anyway. They named the dairy R 7 — for the seven members of the Reynolds family.
Today, R 7 Dairy milks more than 700 cows, and dairy accounts for “over half of our business,” Tyler said. “If you include the byproduct beef calves off of it, it’s stronger than that.”
Three hundred miles west in Dayton, Oregon, Robert Kircher and farm owner Dan Bansen run Forest Glen Farms — 2,200 Jersey cows across two operations, certified organic since 1997, shipping specialty milk to Nancy’s Probiotic Foods and Costco’s A2 program. They manage over 1,000 acres of irrigated pasture and 2,000 acres of organic cropland. A 370-kilowatt anaerobic digester generates 3.1 million kilowatt-hours a year for Portland General Electric. By every operational measure, Forest Glen is a textbook.
Here’s what Kircher told Capital Press: “It’s been pretty tough. We’re getting near to what we were seeing pricewise in 2014. But 10 years ago, all your costs were a lot lower.”
The gap between these two operations isn’t inside the parlor. It’s everything outside it.

Idaho’s $3.87 Billion Flywheel
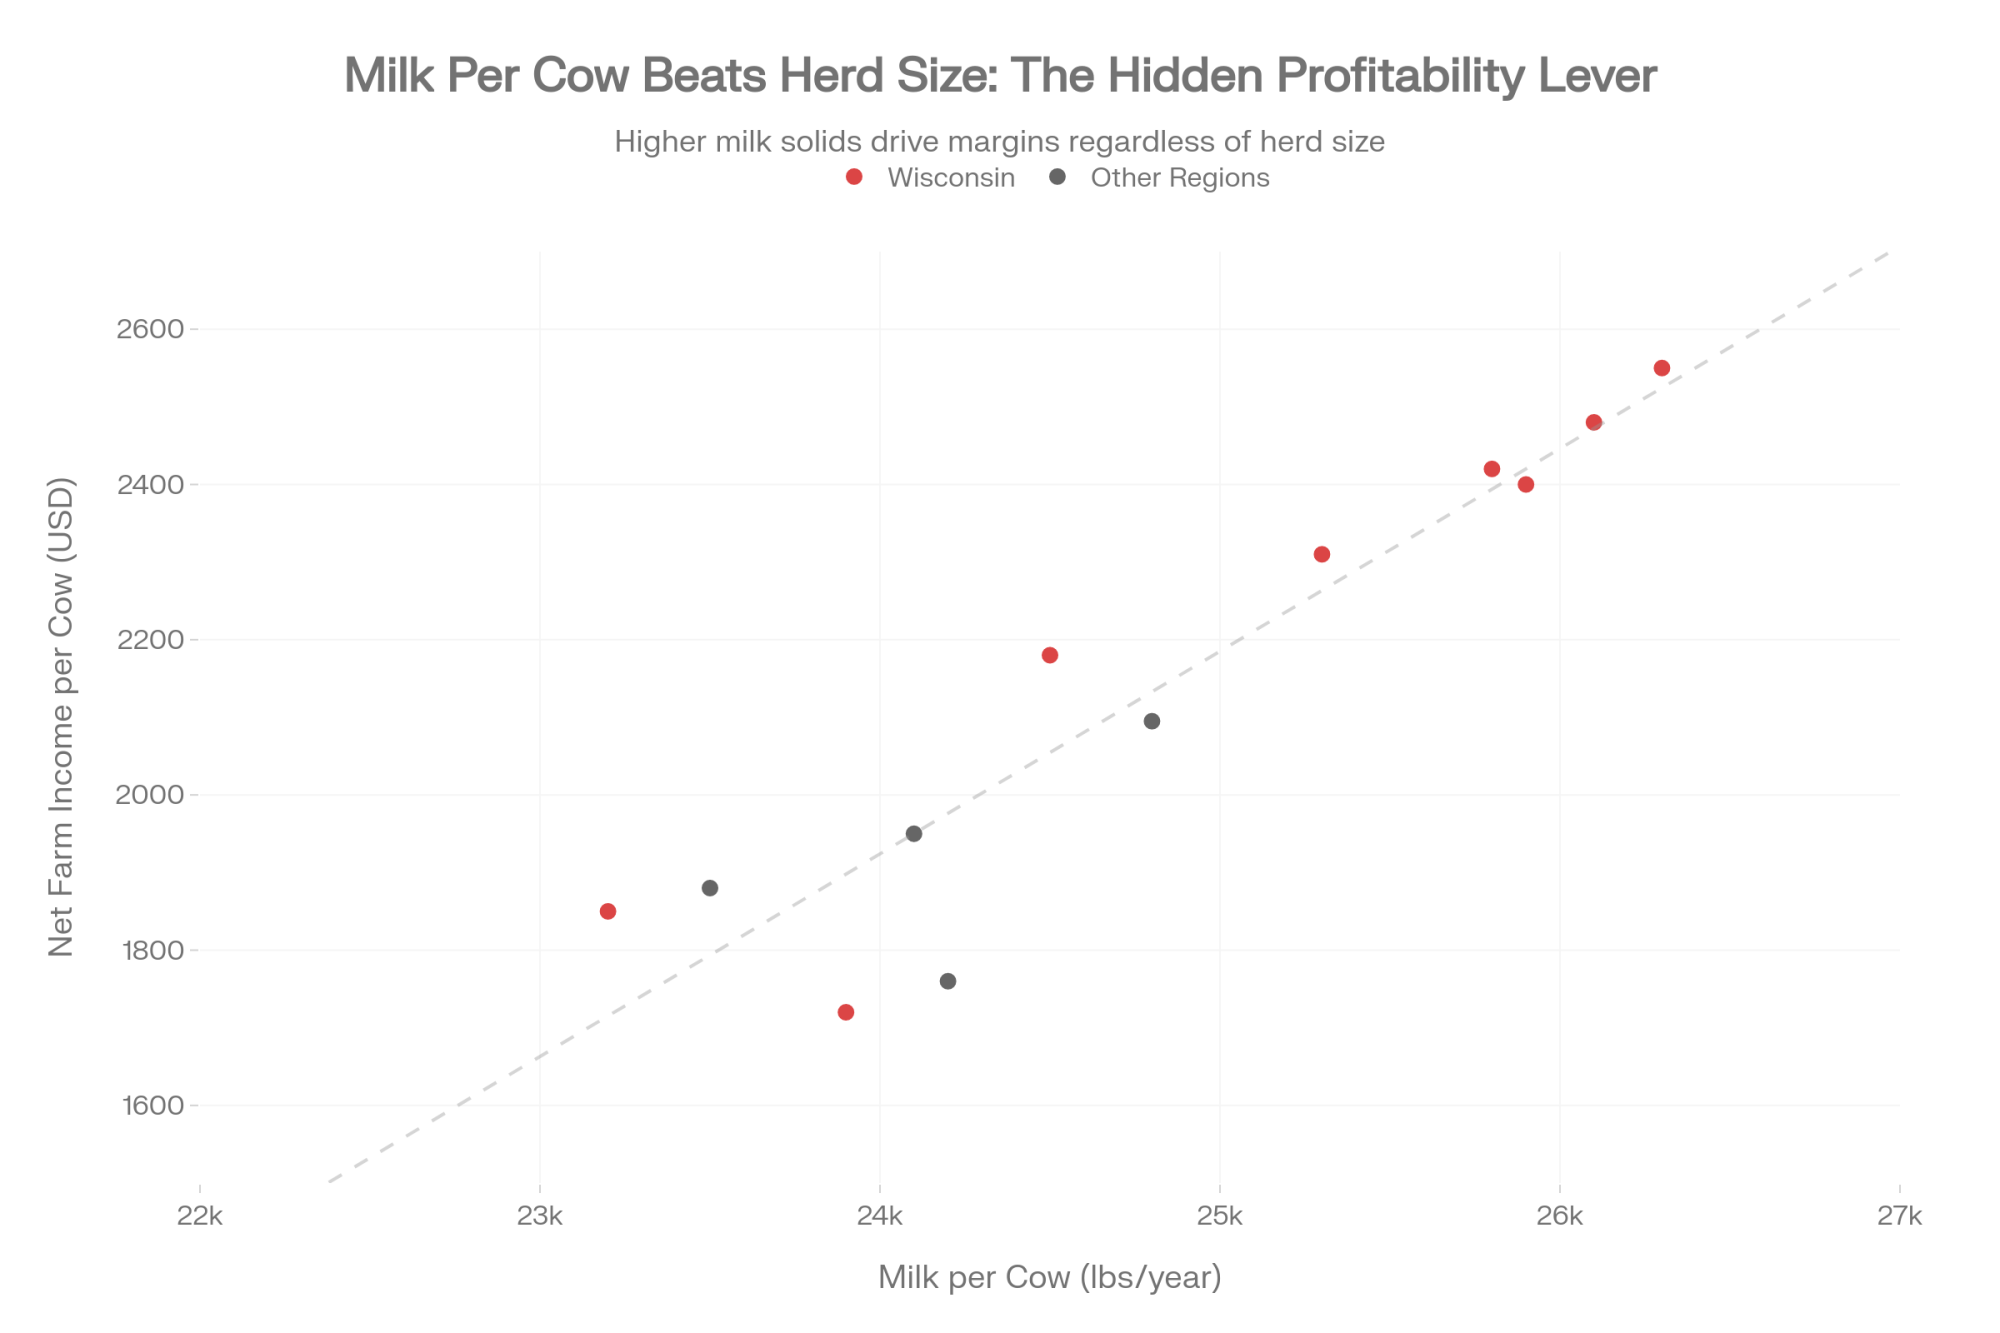
Idaho generated $3.87 billion in dairy farm-gate receipts in 2024 — up 12% from $3.46 billion the year before, according to USDA data cited by the Idaho Farm Bureau (September 2025). Idaho produced 17 billion pounds of milk from 671,000 cows, averaging 25,375 pounds per head — roughly 1,200 pounds above the national per-cow average of 24,178 pounds. Through the first half of 2025, Idaho milk output ran about 7% ahead of the prior year, according to the Idaho Dairymen’s Association.
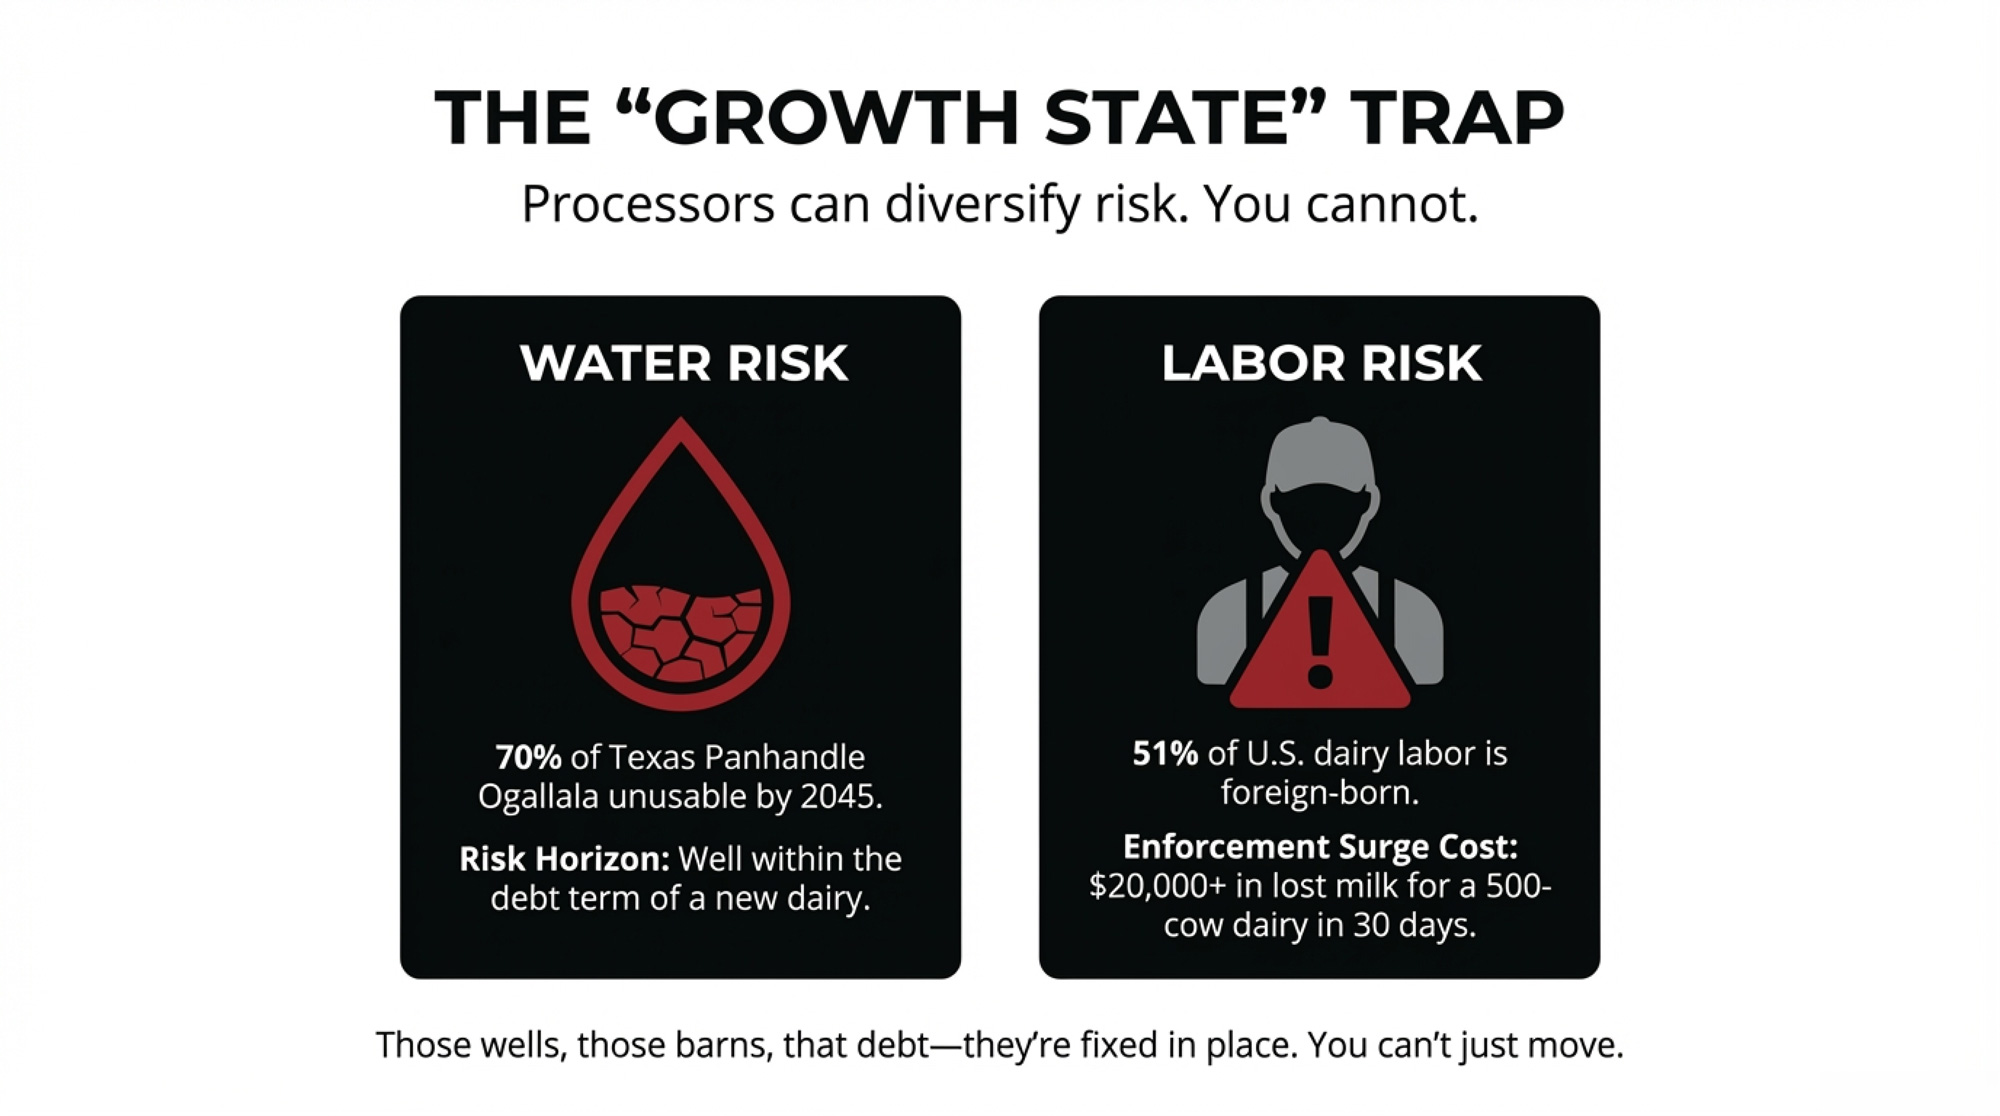
Texas edged past Idaho for the #3 national production slot in 2024. Rick Naerebout, CEO of the Idaho Dairymen’s Association, told Capital Press he’s confident Idaho will reclaim it — pointing to water constraints already limiting Texas expansion.
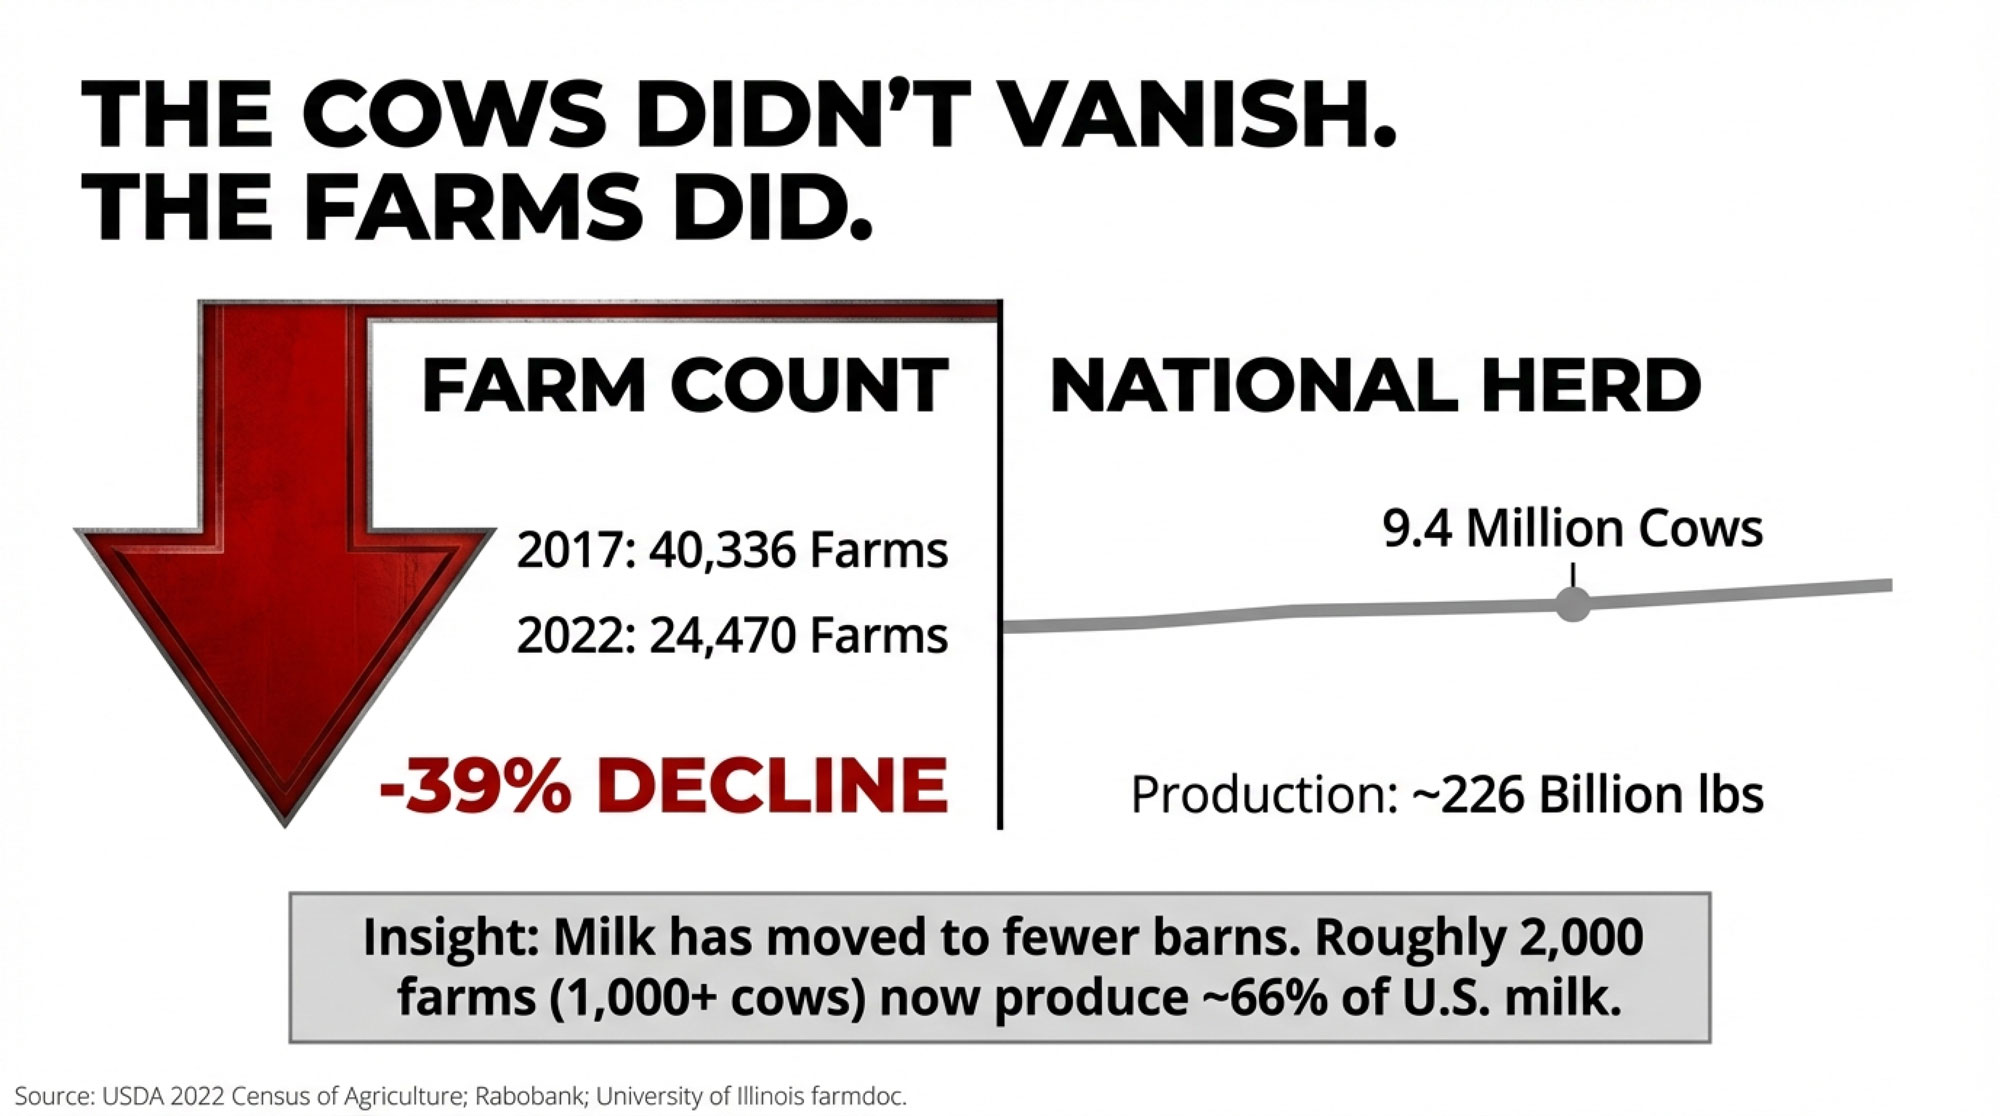
The West Coast tells a different story. California’s production dipped in 2024, partly from H5N1 disruptions. Oregon’s output fell 4% to 2.5 billion pounds, cow numbers dropped to 117,000, and the state’s milk value sat at $596 million. U.S. total production was 225.9 billion pounds — down 2% — even as total milk value rose 11% to $50.9 billion.
The Feed Gap No Nutritionist Can Close
You already know feed is your biggest cost. What you might not know is how wide the regional spread has gotten.
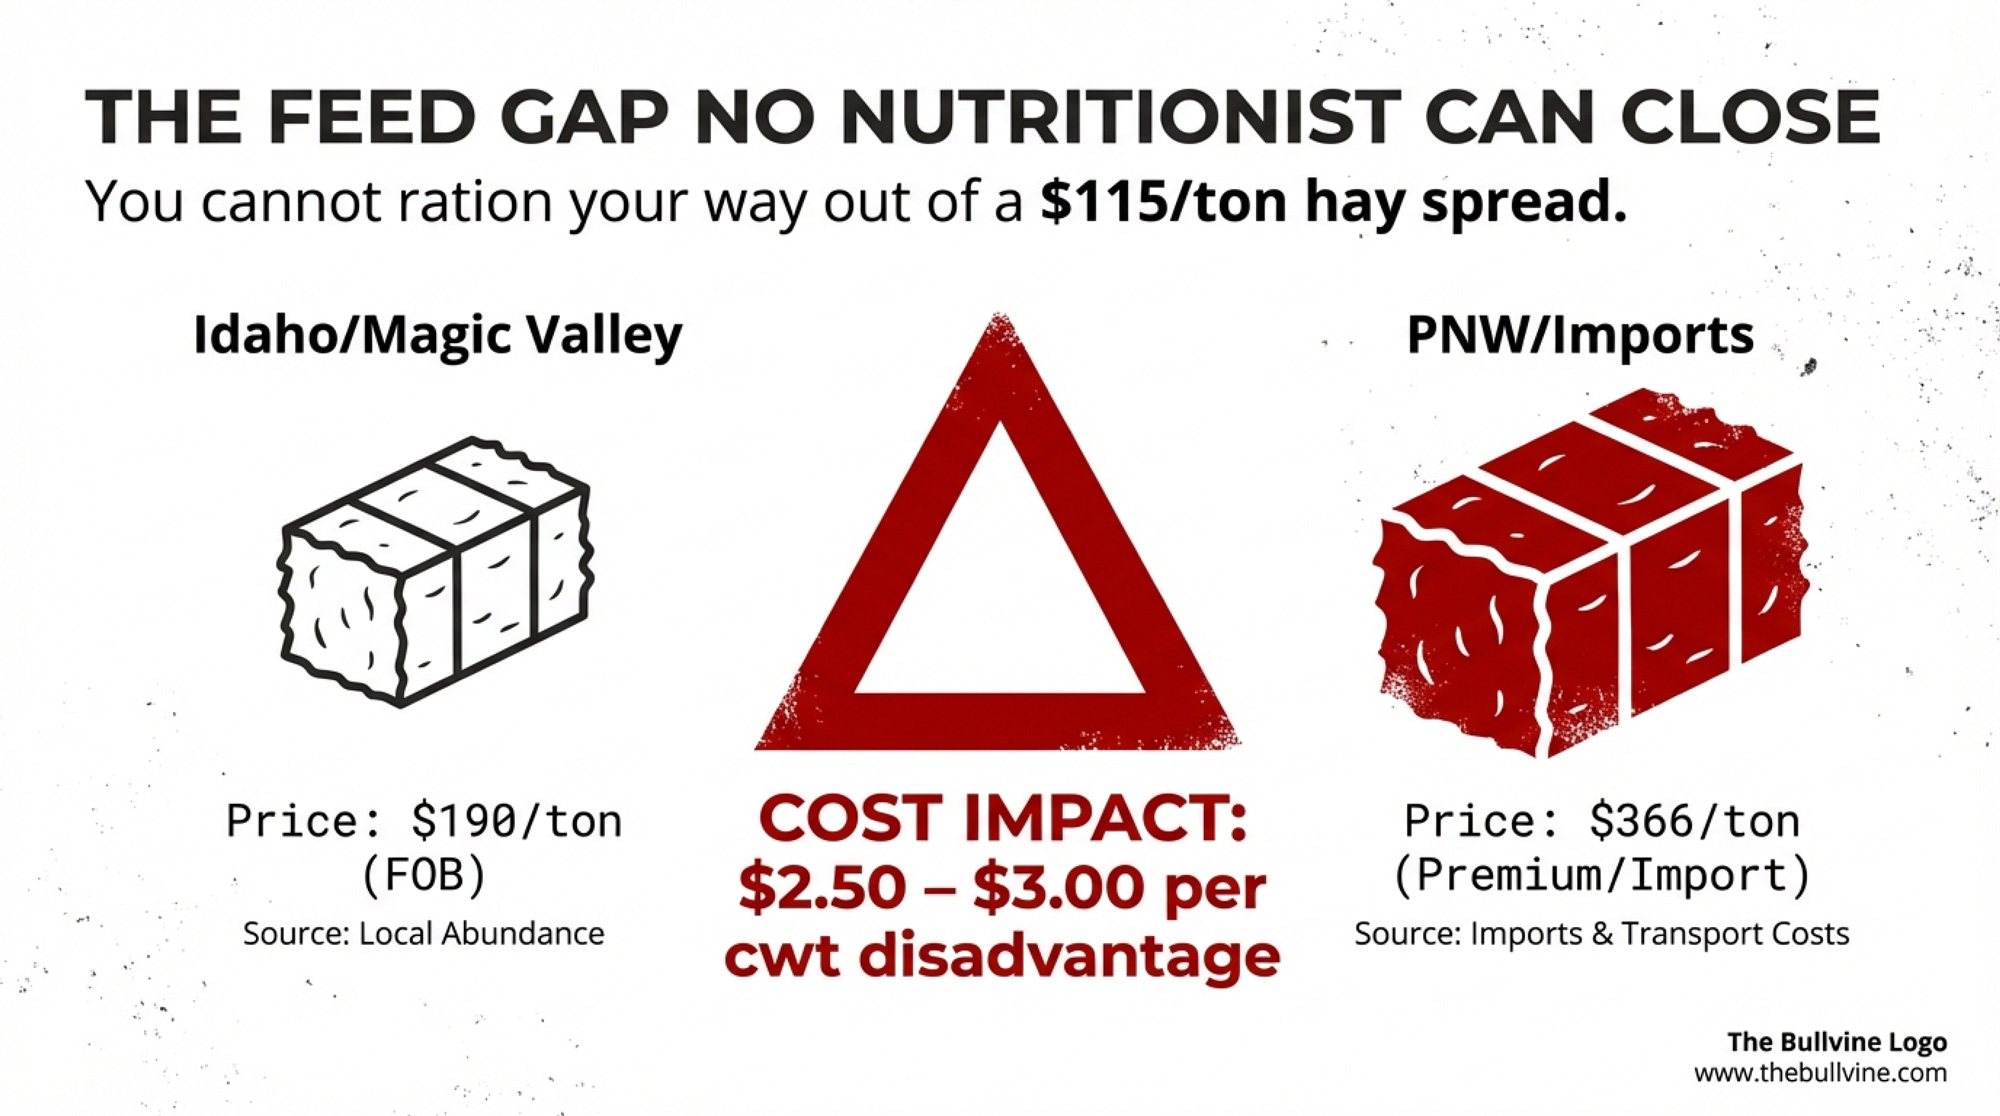
National alfalfa hay averaged about $172 per ton in September 2024 (Hoard’s Dairyman, December 2024). The USDA Direct Hay Report showed Good-quality Idaho alfalfa at $190 per ton FOB in late 2025 (USDA AMS, January 4, 2026). For context, NASS reported the 2024 Idaho alfalfa average at $153 per ton — the $190 spot price reflects seasonal and quality variations in the January market. At the Wolgemuth Hay Auction in Leola, Pennsylvania, premium alfalfa/grass mix sold at $320 to $405 per ton — averaging $366 — while premium straight alfalfa brought $305 to $330 (USDA AMS Hay Auction Report #1725, January 14, 2026).
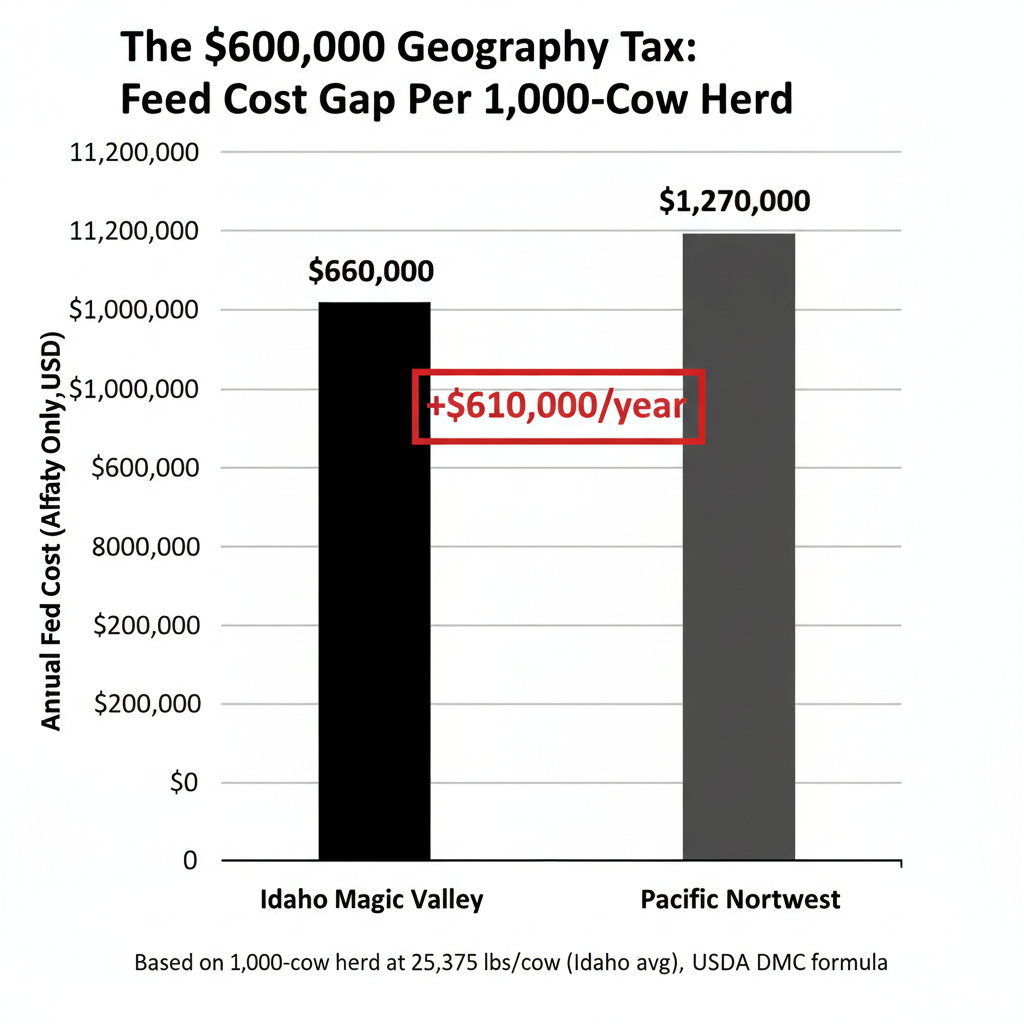
| Idaho (Magic Valley) | Pennsylvania (East) | Gap | |
| Alfalfa hay, $/ton | $190 FOB | $305–$405 (avg $366) | $115–$215/ton |
| Source | USDA AMS Direct Hay, January 4, 2026 | USDA AMS Auction #1725, January 14, 2026 | |
| Hay cost impact per cwt milk (DMC formula: 0.0137 tons alfalfa/cwt) | ~$2.60 | ~$5.01 | $2.50–$3.00/cwt |
| Annual cost, 1,000-cow herd (at Idaho avg 25,375 lbs/cow) | ~$660,000 | ~$1,270,000 | >$600,000/year |
Run that spread through the DMC formula — corn at 1.0728 bushels, soybean meal at 0.00735 hundredweight, alfalfa at 0.0137 tons per hundredweight of milk — and the hay component alone creates a feed cost gap of $2.50 to $3.00 per cwt.
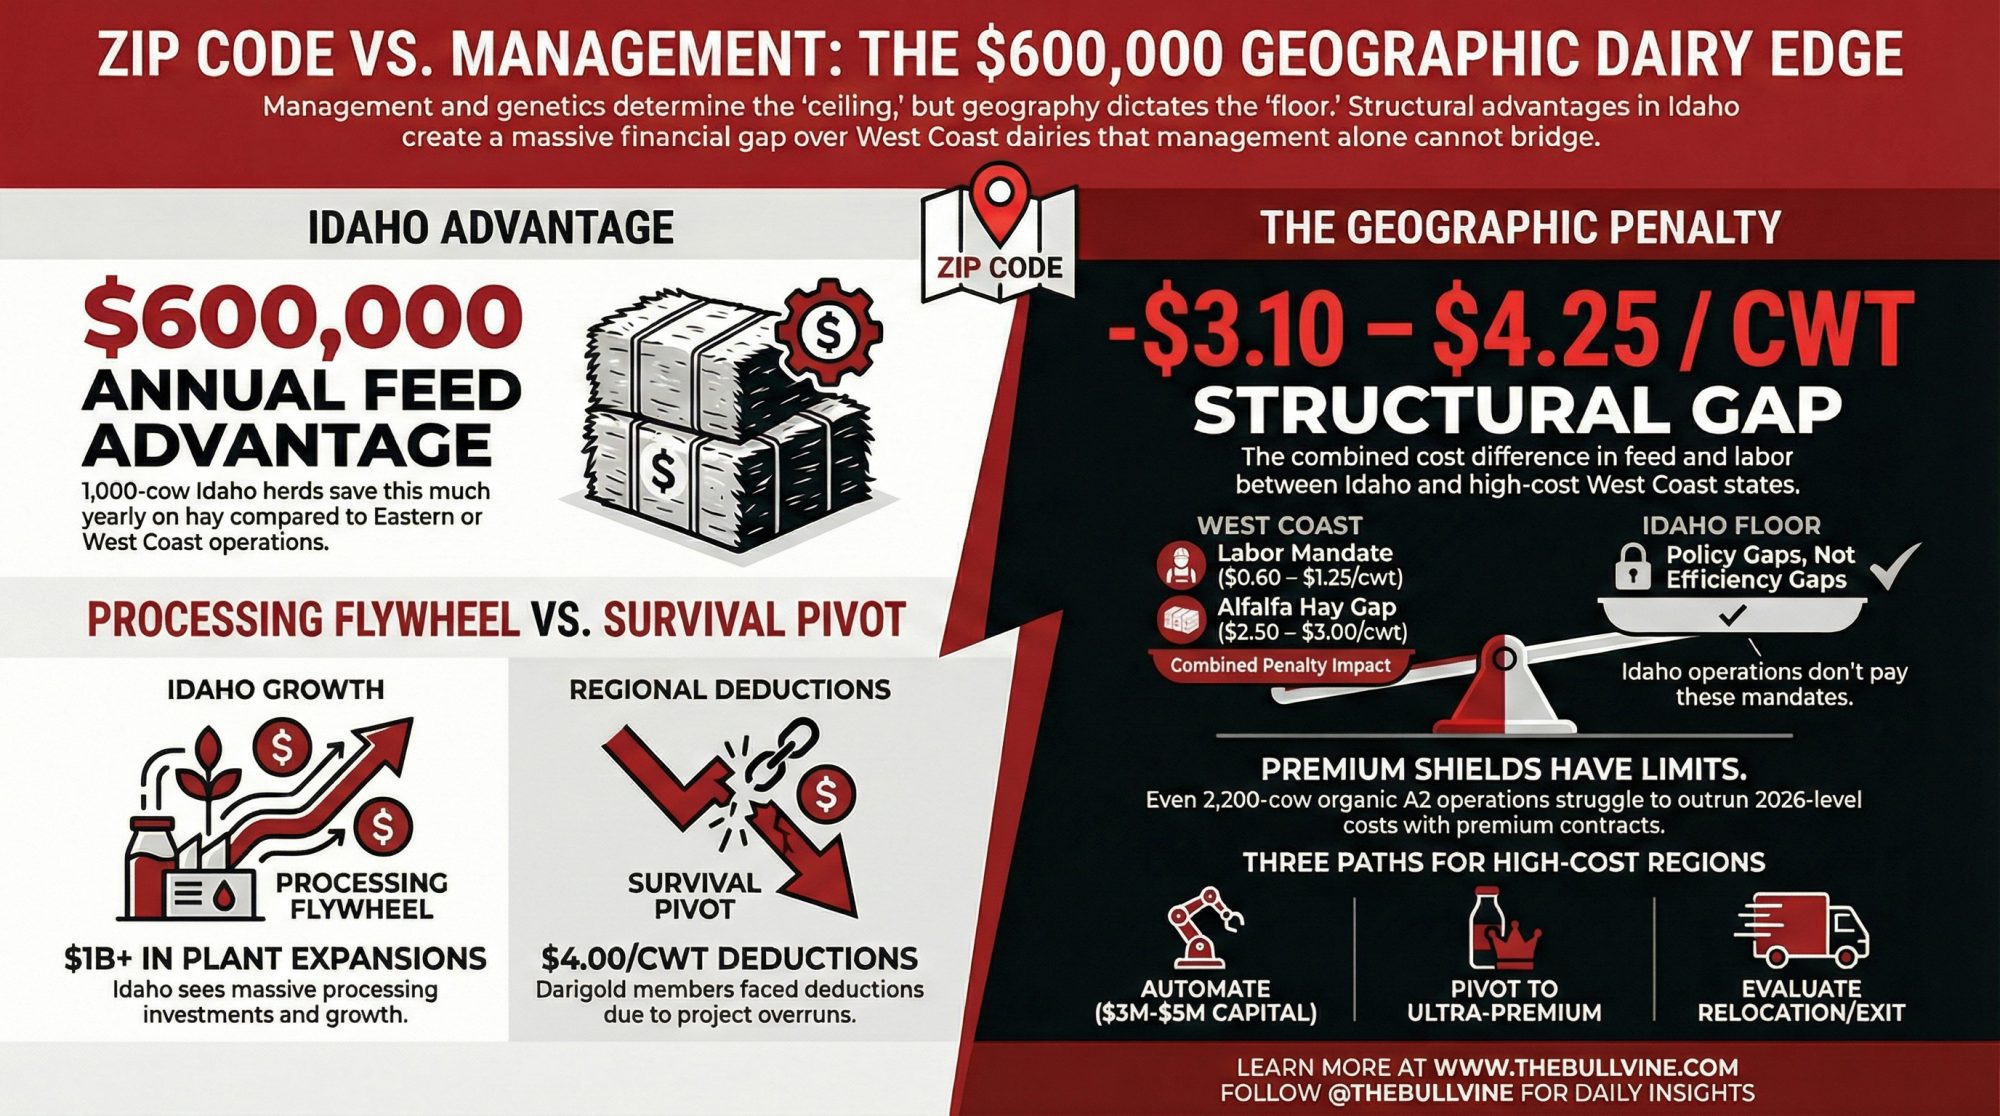
For a 1,000-cow dairy producing at Idaho averages (253,750 cwt annually), that translates to north of $600,000 in additional feed costs for the same operation parked in the wrong geography.
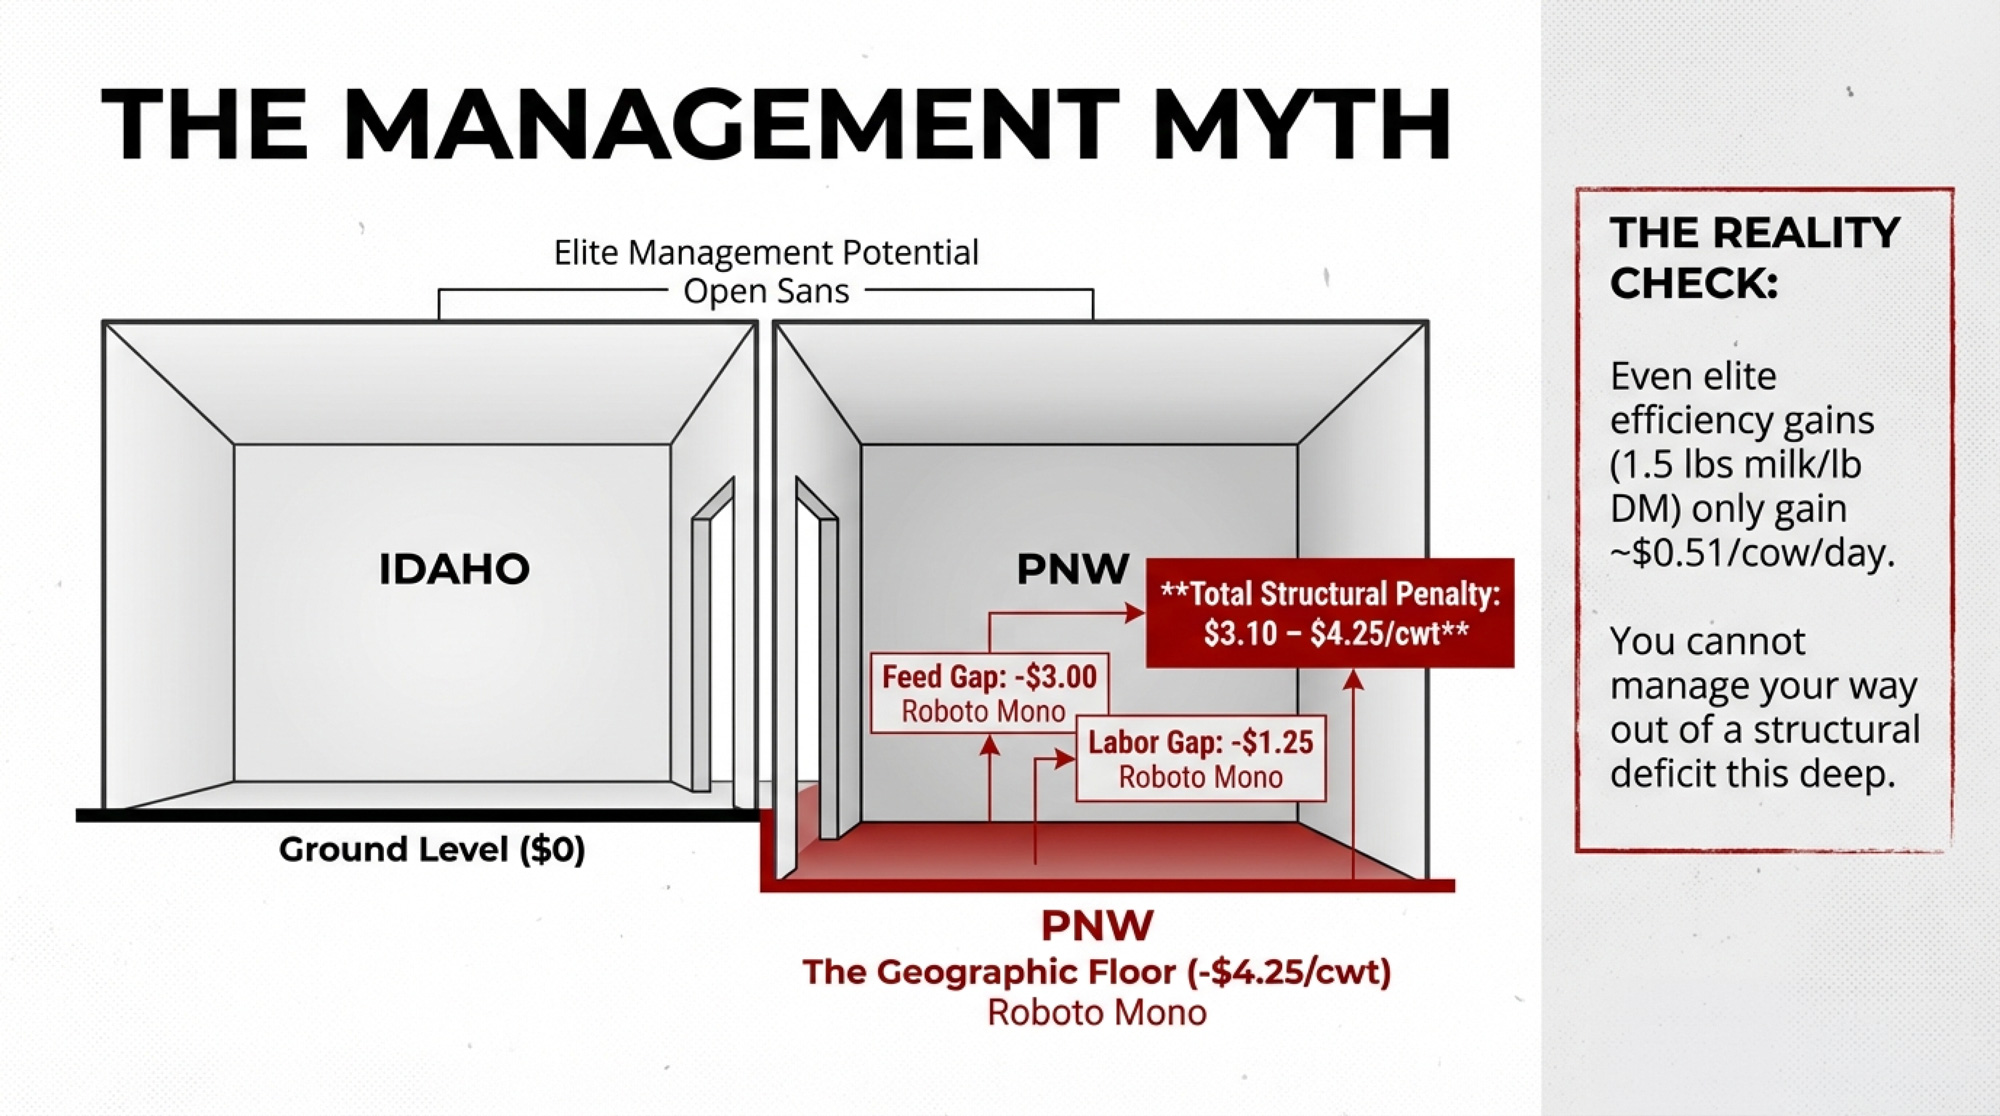
University of Illinois dairy scientist Mike Hutjens has benchmarked the value of pushing feed efficiency from 1.4 to 1.5 pounds of milk per pound of dry matter — a genuinely elite gain — at about $0.51 per cow per day, or $186 per cow per year. Real money. Also, less than a third of the per-cow geographic penalty. You can run the tightest ration in Oregon and still lose on feed to an average operation in Jerome.
Labor Law: The Advantage You Can’t Out-Manage
Idaho’s agricultural workers are exempt from overtime under the federal Fair Labor Standards Act, and Idaho imposes no state-level overtime mandate.
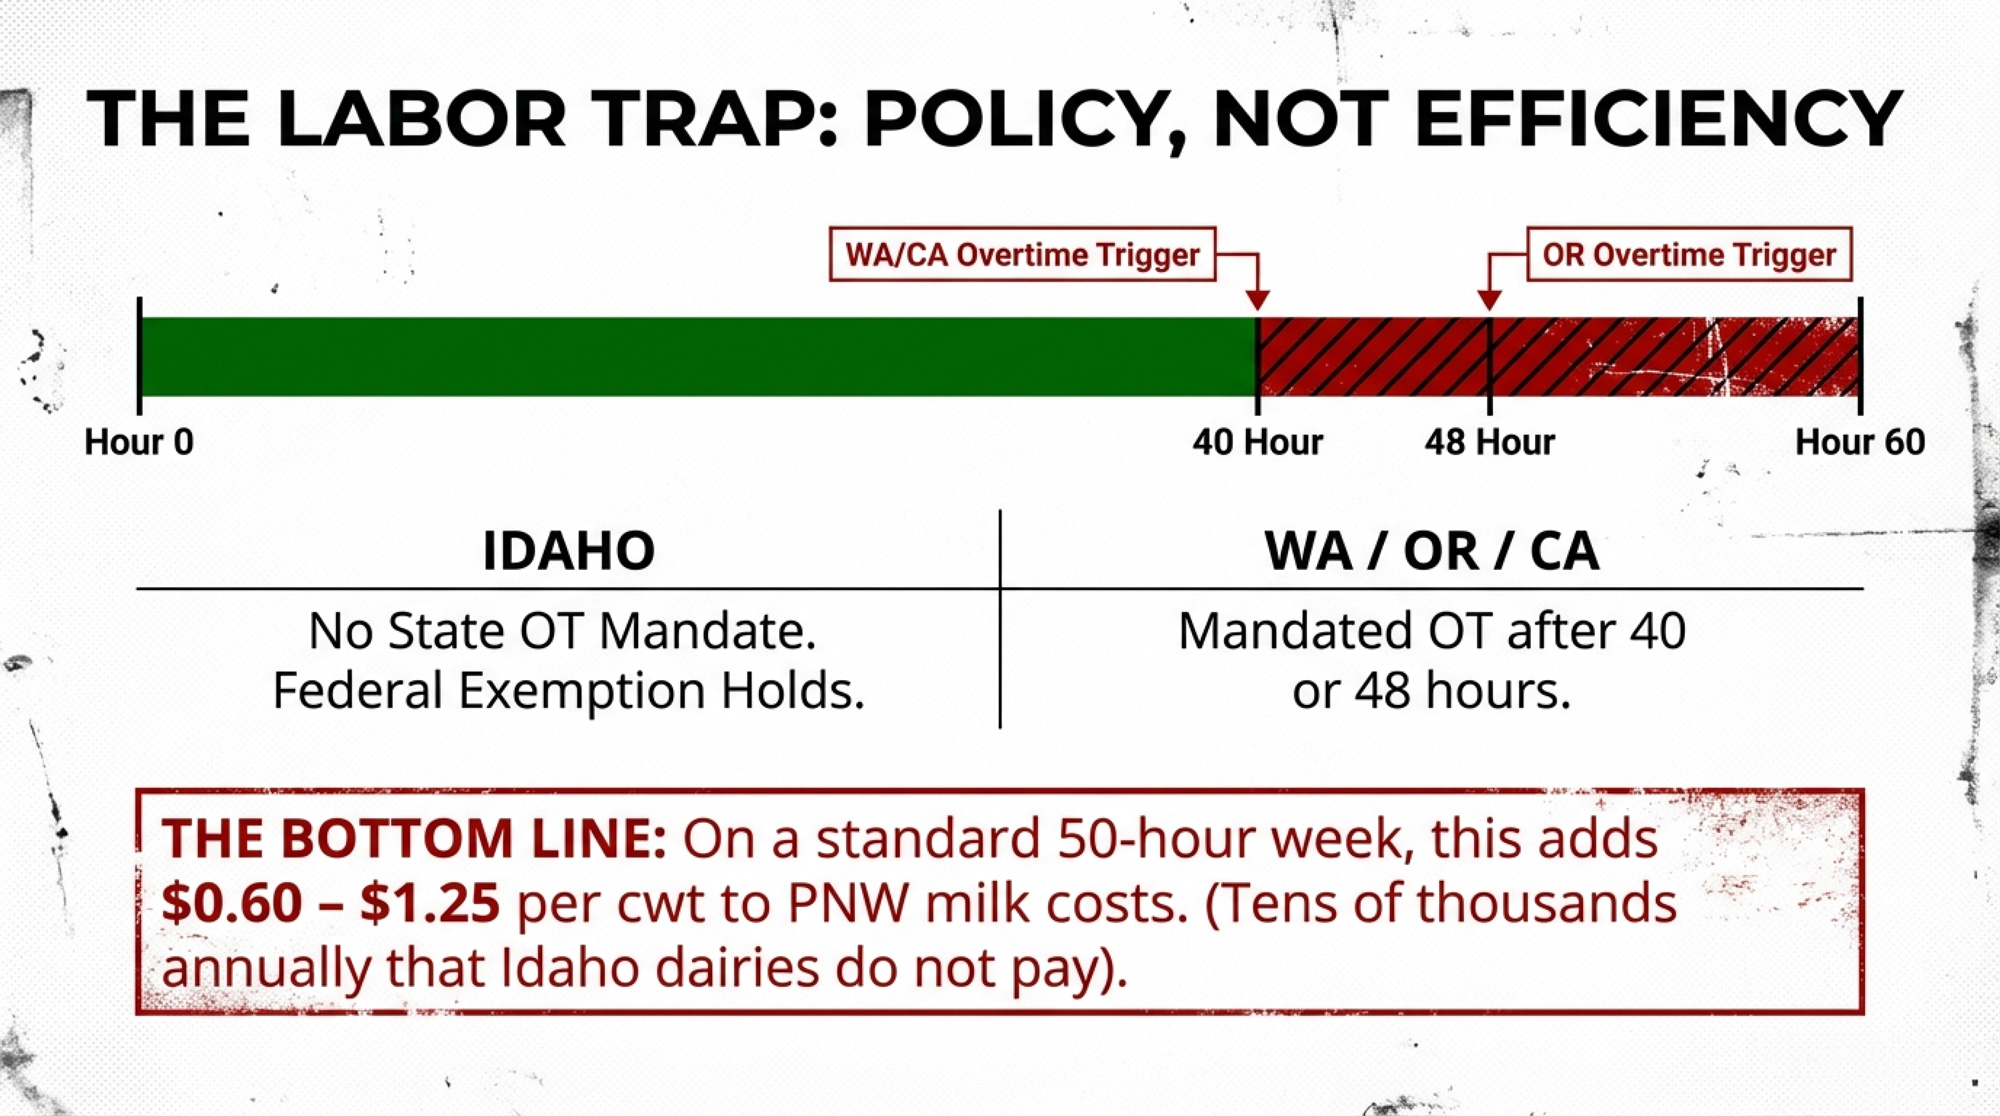
That’s not the case next door. California has required ag overtime after 40 hours per week since 2022 for large operations under AB 1066. Washington requires ag overtime after 40 hours — dairy workers have been covered since the state Supreme Court’s Martinez-Cuevas v. DeRuyter Brothers Dairy ruling in November 2020, and all other ag workers since January 2024 under ESSB 5172. Oregon’s House Bill 4002, signed in 2022, currently sets the threshold at 48 hours, dropping to 40 in January 2027 (Oregon Bureau of Labor and Industries).
On a dairy where most employees work 50- to 55-hour weeks, the differential adds roughly $0.60 to $1.25 per cwt. That range is consistent with a Washington-focused study published in Choices (AAEA), which found that dairy farm total wages increased by more than 7% under a 48-hour threshold and by 12% under a 40-hour threshold. Cornell’s Dairy Farm Business Summary documented total labor cost at $3.08/cwt after New York’s 60-hour overtime threshold took effect in 2020, with total wages up 15.9% due to combined minimum wage increases and overtime costs (EB2021-06, October 2021). For Jason and Eric Vander Kooy, milking 1,400 cows near Mount Vernon, Washington, the overtime differential on 50-hour workweeks translates to tens of thousands of dollars annually that an identical Idaho operation simply doesn’t pay. That’s a policy gap, not an efficiency gap.
Worth watching: the federal Fairness for Farm Workers Act has been reintroduced in multiple Congresses (2019, 2021, 2023) to eliminate the FLSA ag overtime exemption. It has failed to advance each time. Moving the other direction, the Protect Local Farms Act (H.R. 240), introduced in January 2025, would pre-empt any state overtime law below 60 hours for ag workers. Neither has passed. For now, the advantage holds.
Stack feed on top of labor. Combined structural disadvantage for the wrong geography:
The Geographic Penalty
Hay component gap: $2.50–$3.00 per cwt
Labor mandate gap: $0.60–$1.25 per cwt
Total structural disadvantage: $3.10–$4.25 per cwt
Before you’ve touched a management lever, hired a consultant, or upgraded a single piece of equipment.
| Cost Factor | Idaho | Pacific Northwest | Gap (PNW Penalty) |
|---|---|---|---|
| Alfalfa hay, $/ton | $190 FOB | $305–$405 (avg $366) | +$115–$215/ton |
| Ag overtime rules | Exempt (federal) | Required after 40–48 hrs | +$0.60–$1.25/cwt |
| Feed cost impact, $/cwt | ~$2.60 | ~$5.01 | +$2.50–$3.00/cwt |
| Total structural penalty, $/cwt | Baseline | — | +$3.10–$4.25/cwt |
| Annual cost, 1,000-cow herd | Baseline | — | +$600,000–$800,000/yr |
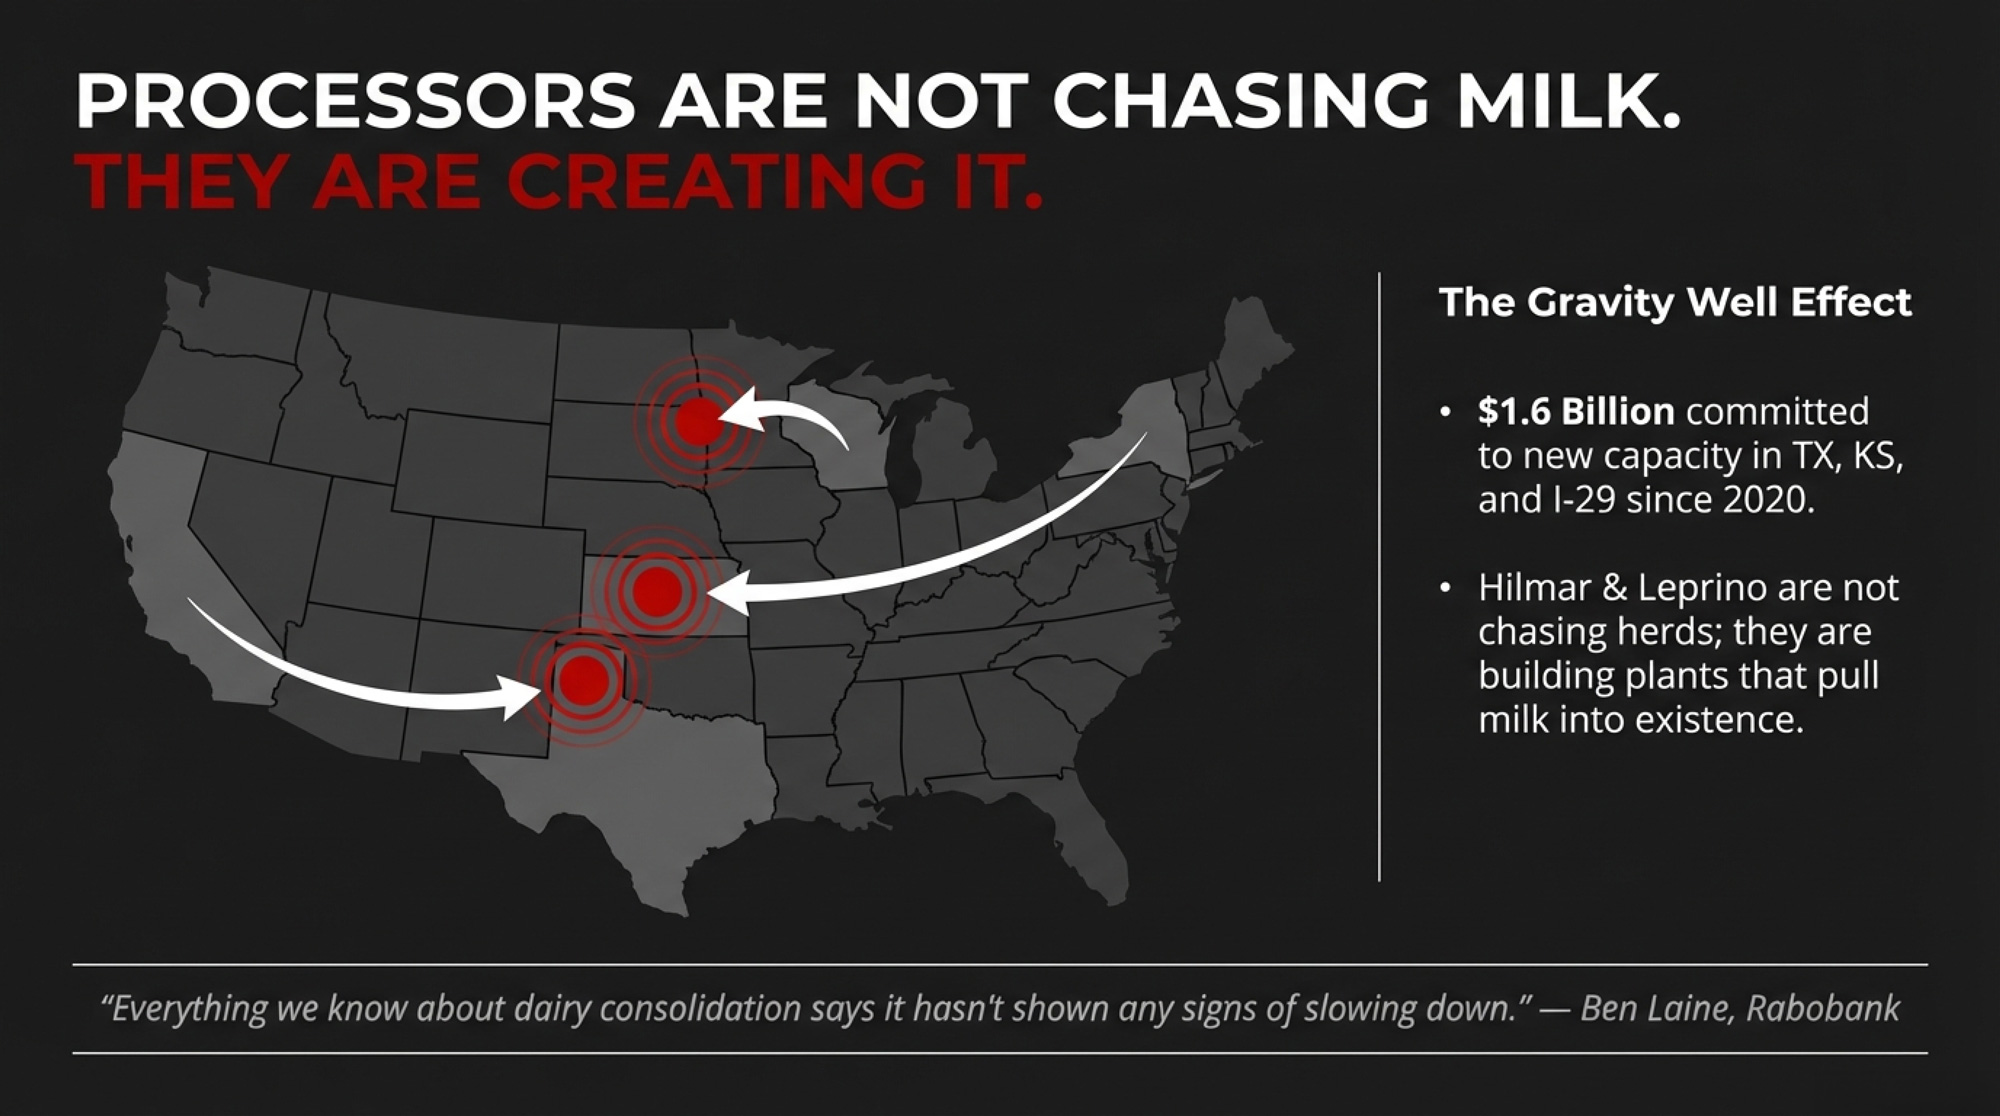
When Processors Pick Your State
Cheap feed and favorable labor law attracted cows to Idaho. Cows attracted processors. Processors attracted more cows. That flywheel now spins at a pace no other Western region can match.
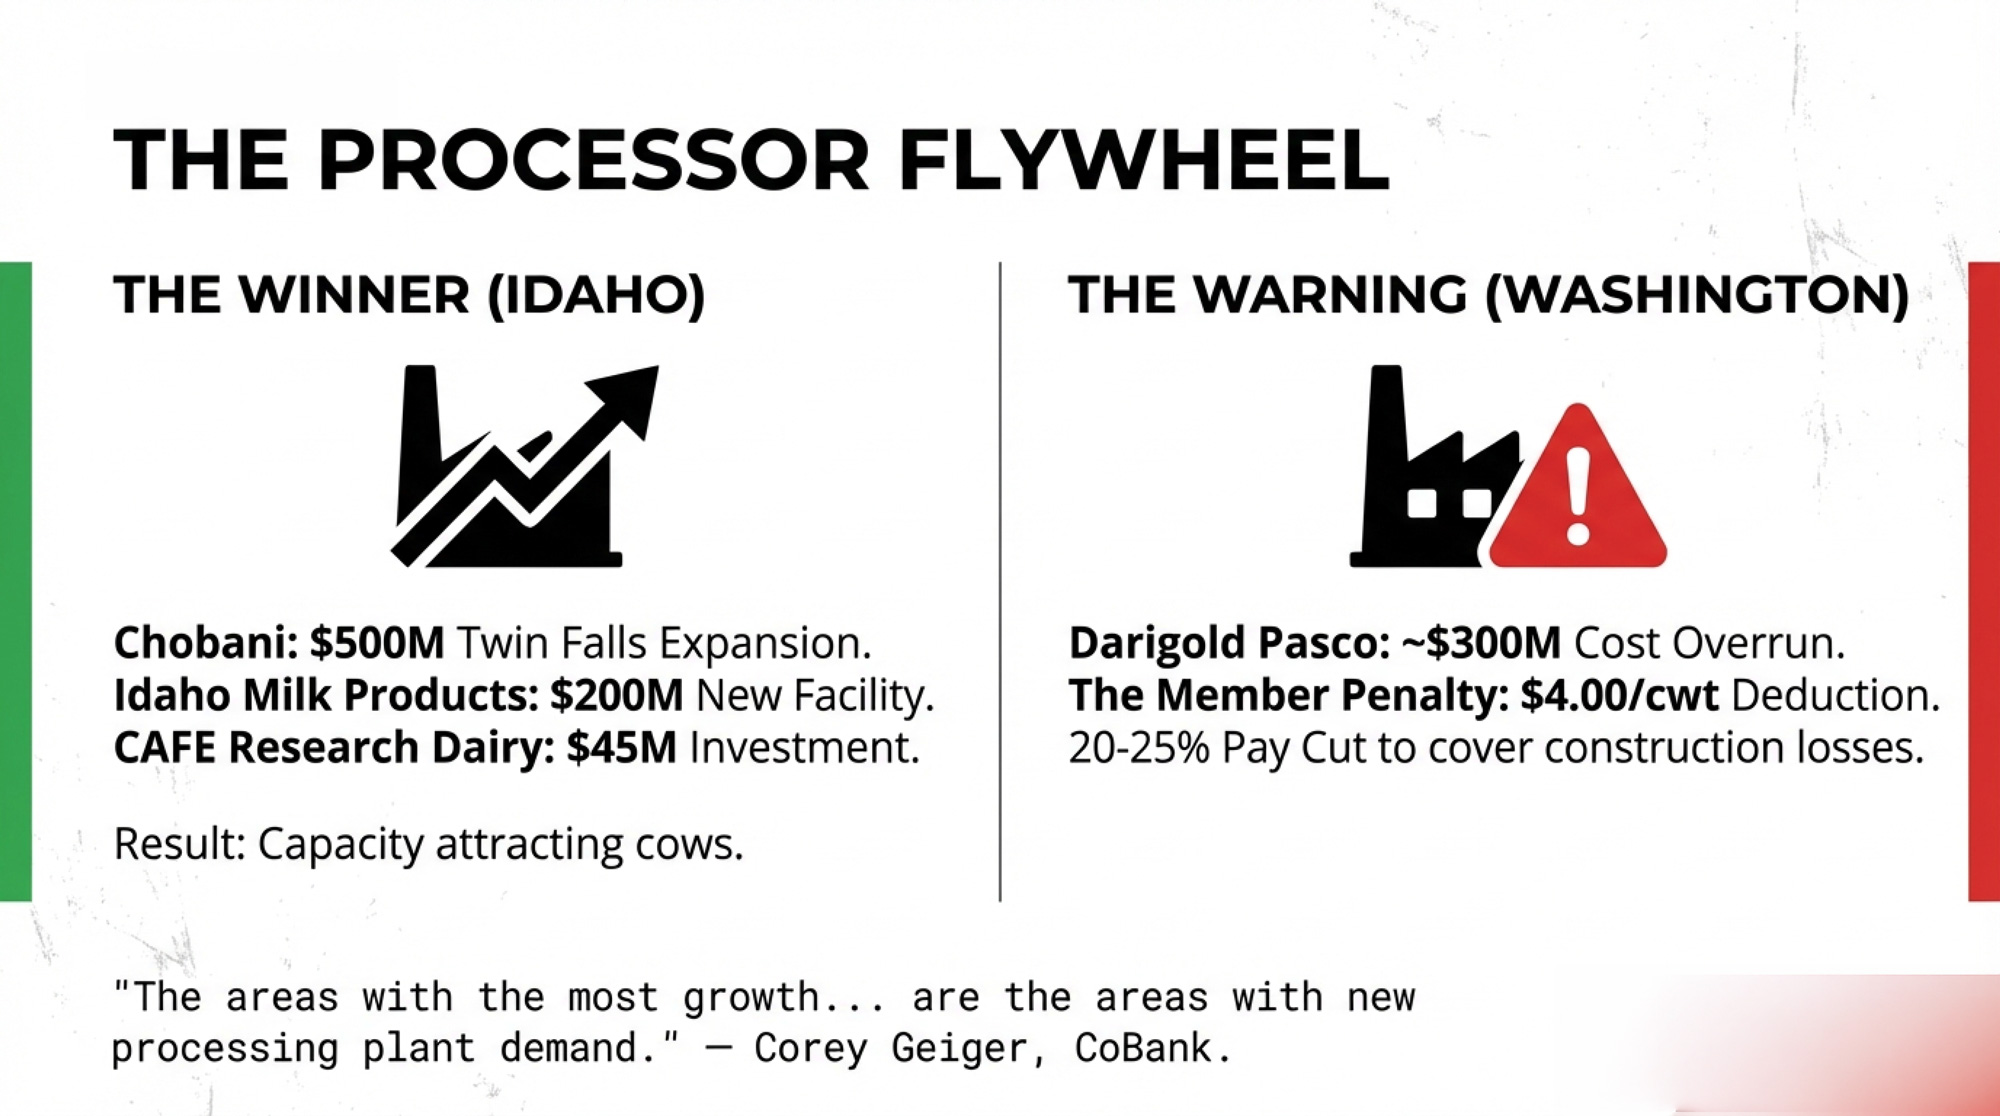
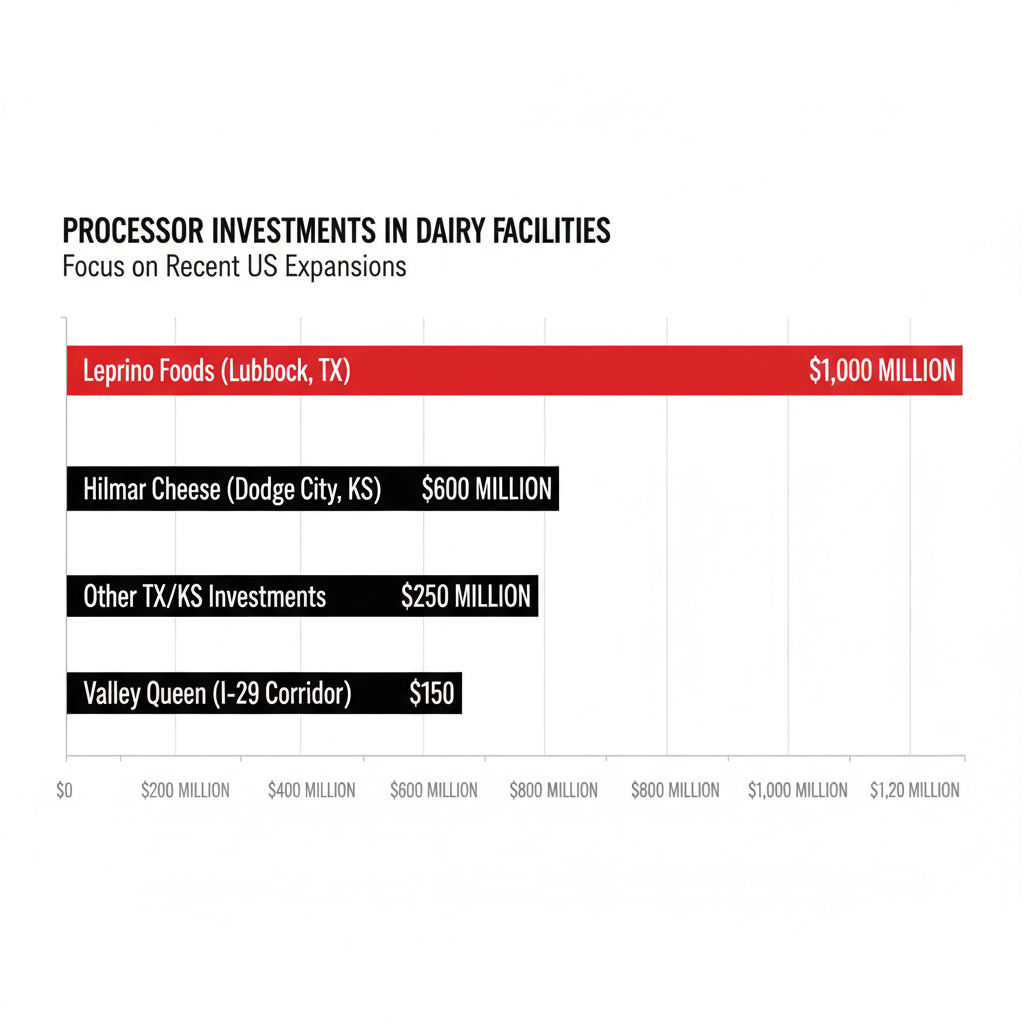
Chobani’s $500 million Twin Falls expansion, announced in March 2025, increases plant capacity by 50% — adding over 500,000 square feet to bring the facility to 1.6 million square feet with 24 production lines. Idaho Milk Products is building a $200 million facility in Jerome. High Desert Milk invested $50 million in 2021. And the University of Idaho’s $45 million CAFE research dairy — billed as the nation’s largest — occupies 640 acres near Rupert in Minidoka County and began milking its first cows in early 2026, with a rotary parlor built to handle up to 4,000 head and plans to ramp to 2,000–2,500 long-term.
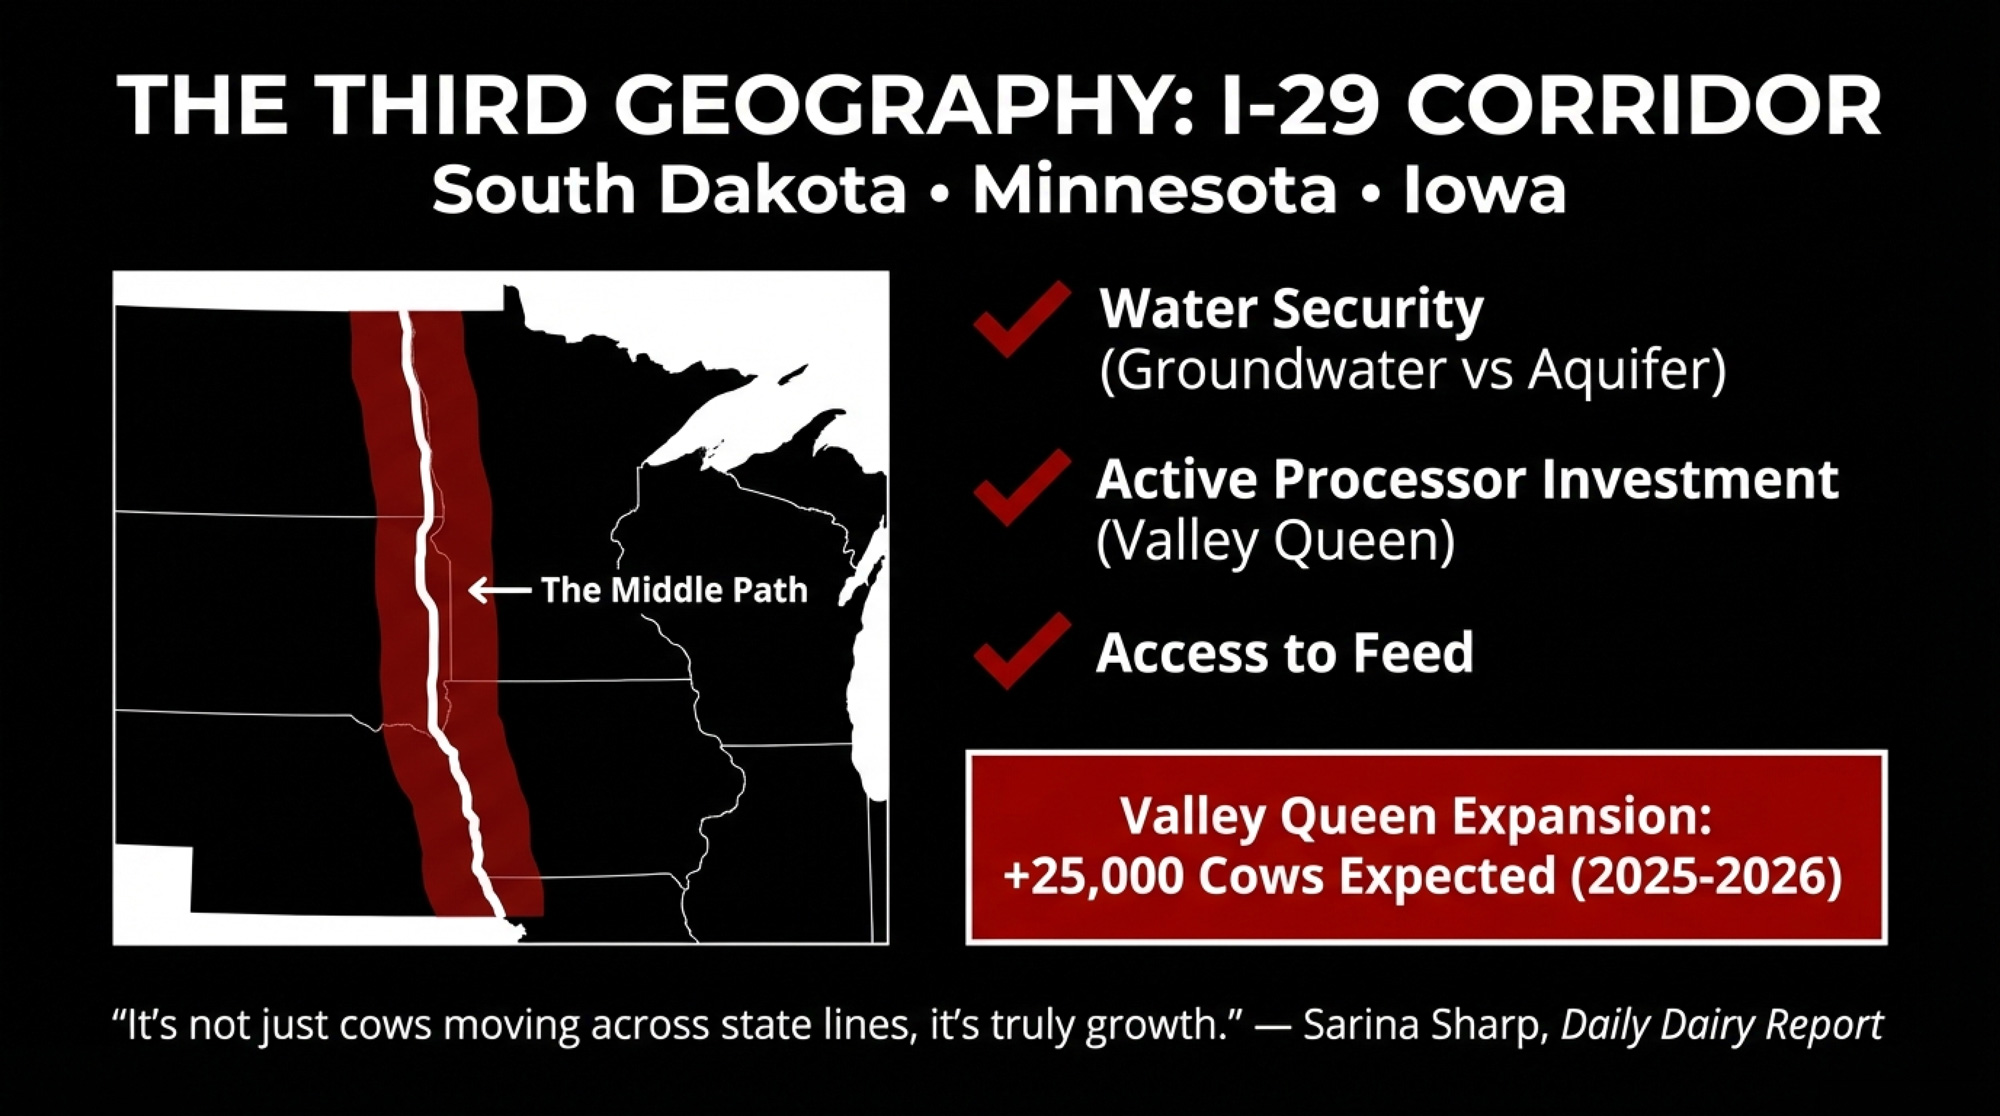
Corey Geiger with CoBank put it plainly in July 2025: “The big growth has been coming in Texas, Idaho, Kansas, and South Dakota. That’s most of the growth areas with new dairy processing assets coming online.” The areas with the most growth in milk production aren’t the areas with the highest milk prices — they’re the areas with new processing plant demand.
Now flip the flywheel.
The Darigold Wreck
Darigold’s Pasco, Washington, plant was budgeted at $600 million when the cooperative broke ground in September 2022, promising to “preserve the legacy of nearly 350 multigenerational farms” (Darigold/NDA press release, July 2021). It didn’t go that way. Capital Press reported the plant ran approximately $300 million over budget, citing people familiar with the matter (May 1, 2025). The Chronline characterized the total investment at $900 million (June 4, 2025). Darigold acknowledged cost overruns, blaming inflation, supply-chain issues, changes to building codes, and project complexity.
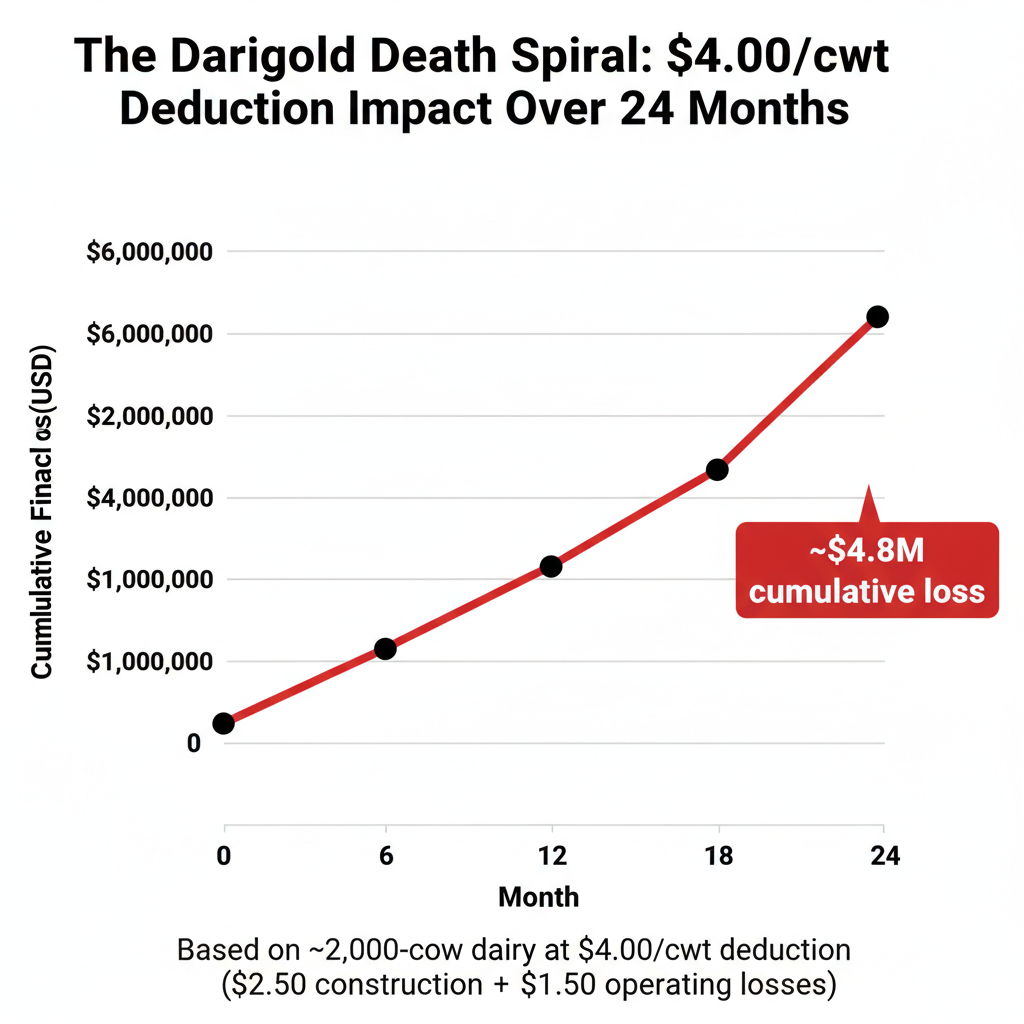
To cover the shortfall, Darigold imposed a $4.00/cwt deduction on member milk checks — a 20% to 25% cut — for its roughly 250 current members across Washington, Oregon, Idaho, and Montana, down from the nearly 350 cited at the time of the groundbreaking. The breakdown: $2.50 per cwt for construction costs and $1.50 for operating losses, beginning with an initial $1.50 reduction at the end of 2023.
The damage to individual operations has been severe. Dan DeRuyter, milking in Yakima County, Washington, told Capital Press the deductions cost his operation “almost $5 million in the past two years.” John DeJong, whose family shipped to Darigold for 75 years, said it “eliminated investment” and put his dairy in “survival mode.” Jason Vander Kooy laid out his three options: “It’s either we go organic, go on our own, or close the doors” (Capital Press, May 28, 2025).
The 500,000-square-foot plant started taking milk in early June 2025 and began producing powdered milk and butter by August, with a second dryer slated for year’s end. It can process up to 8 million pounds of milk a day. Some of the operations that financed the overrun won’t be around to ship to it.
The Organic Shield — and Its Limits
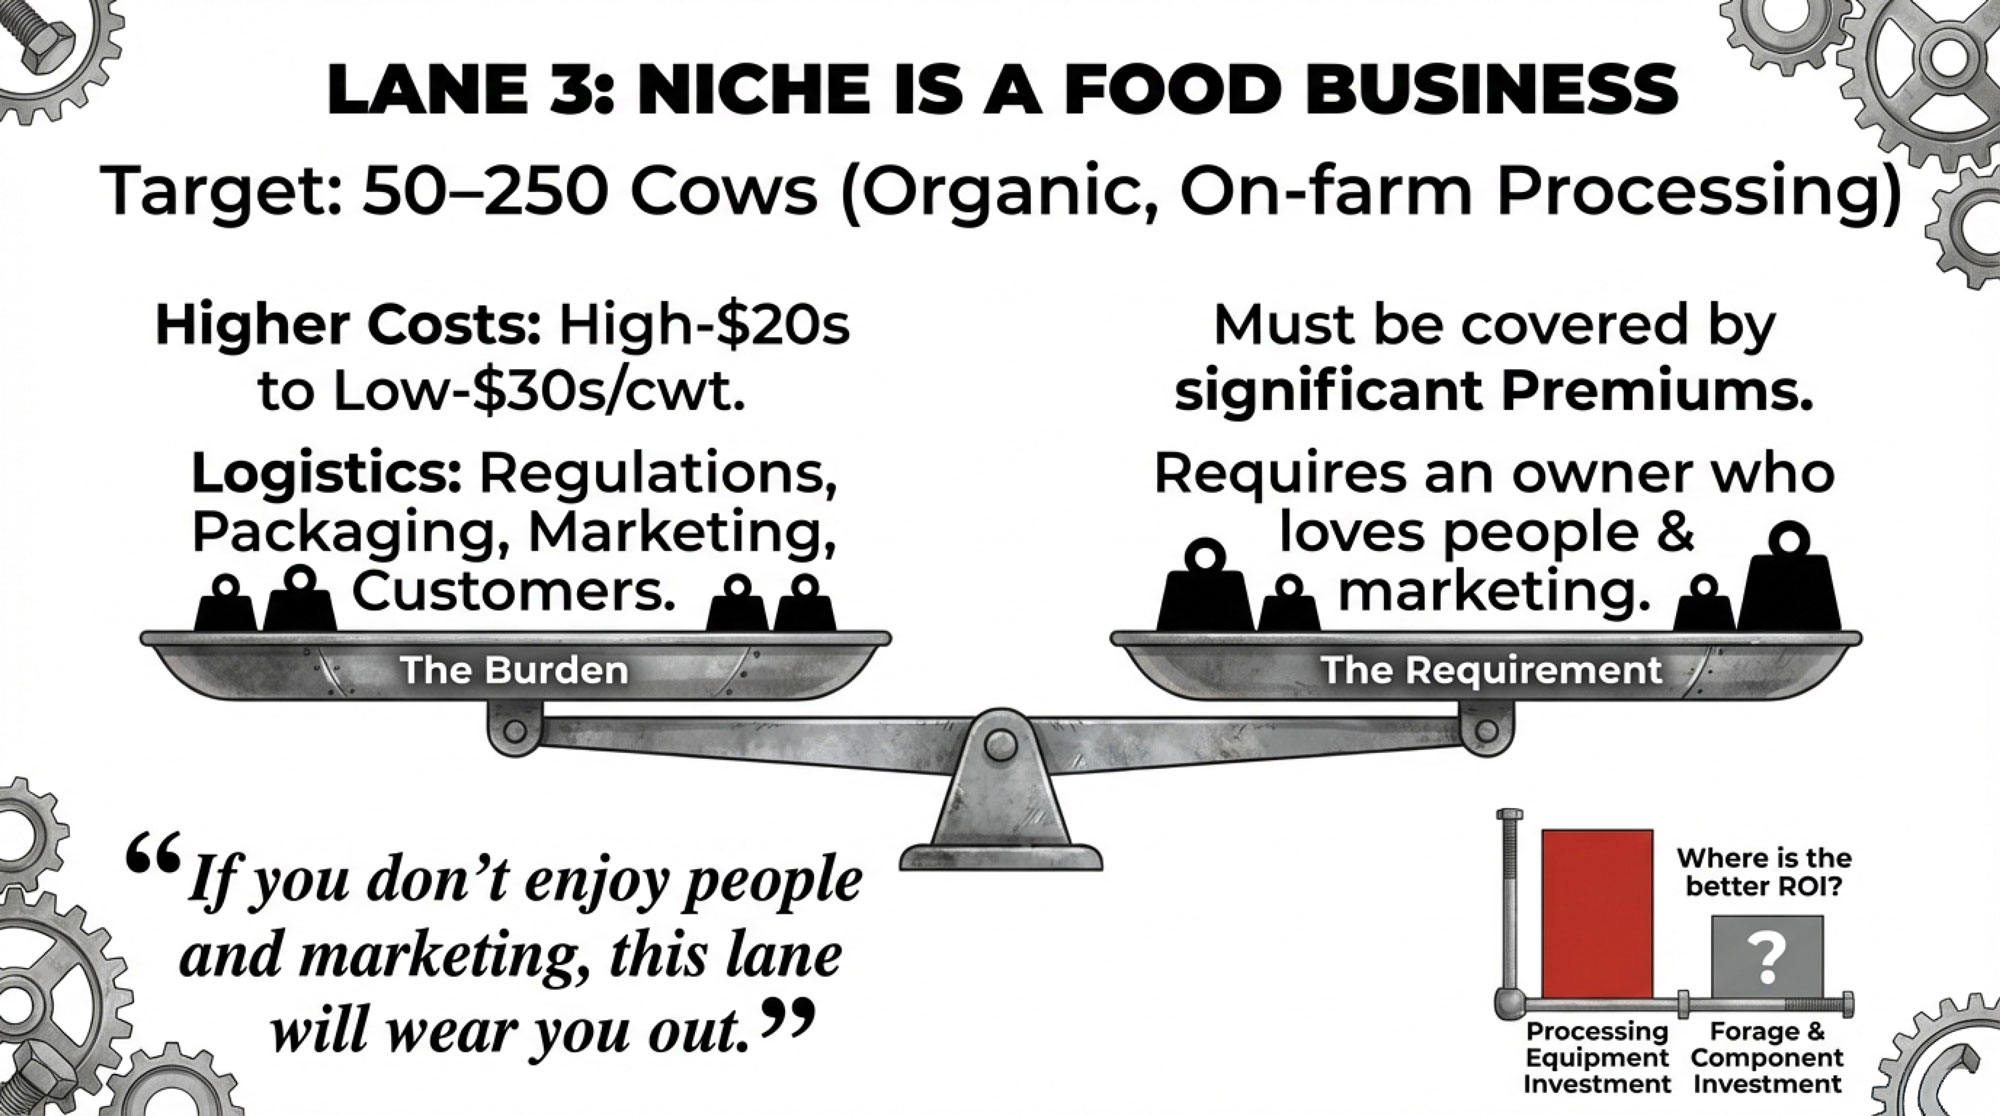
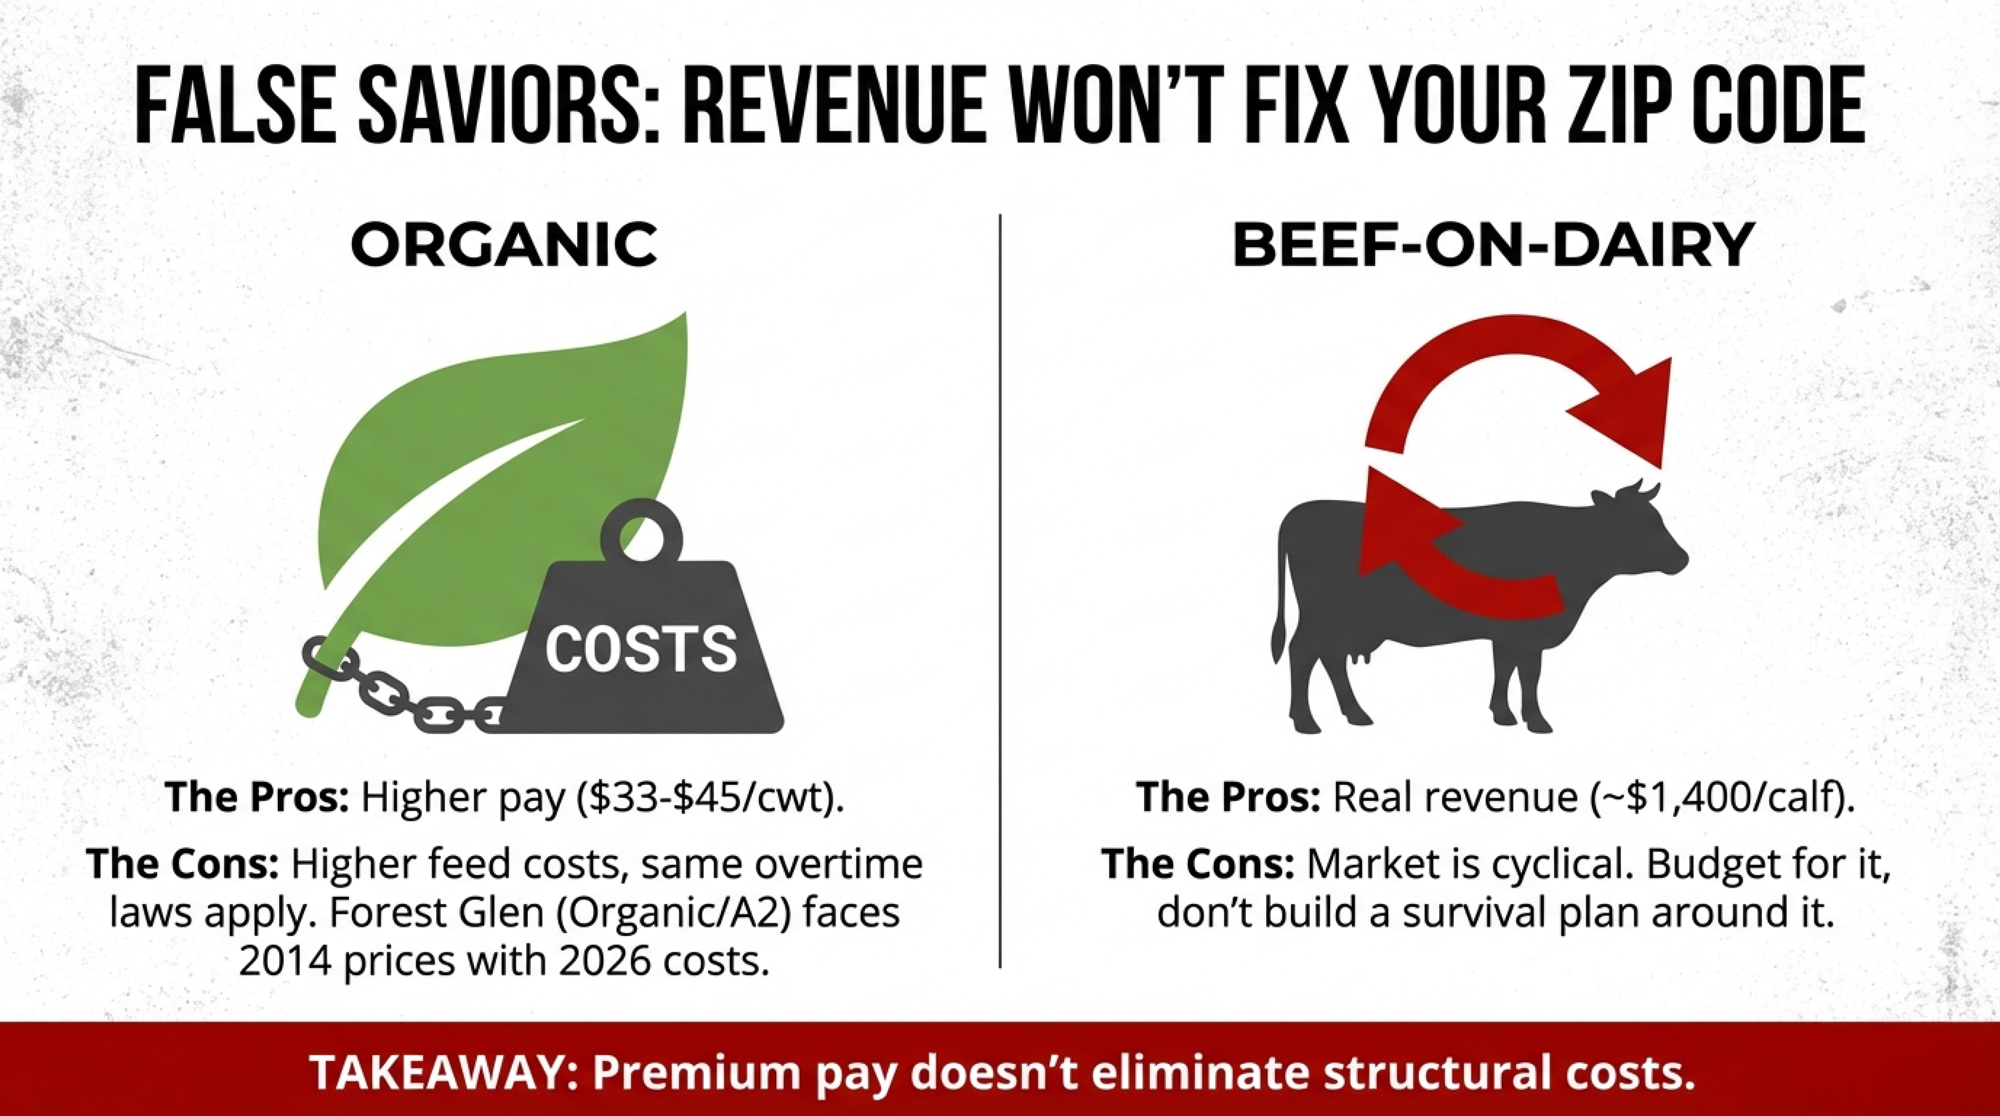
Forest Glen represents the supposed answer for high-cost regions. Premium products. Contracted buyers. Revenue above the commodity floor.
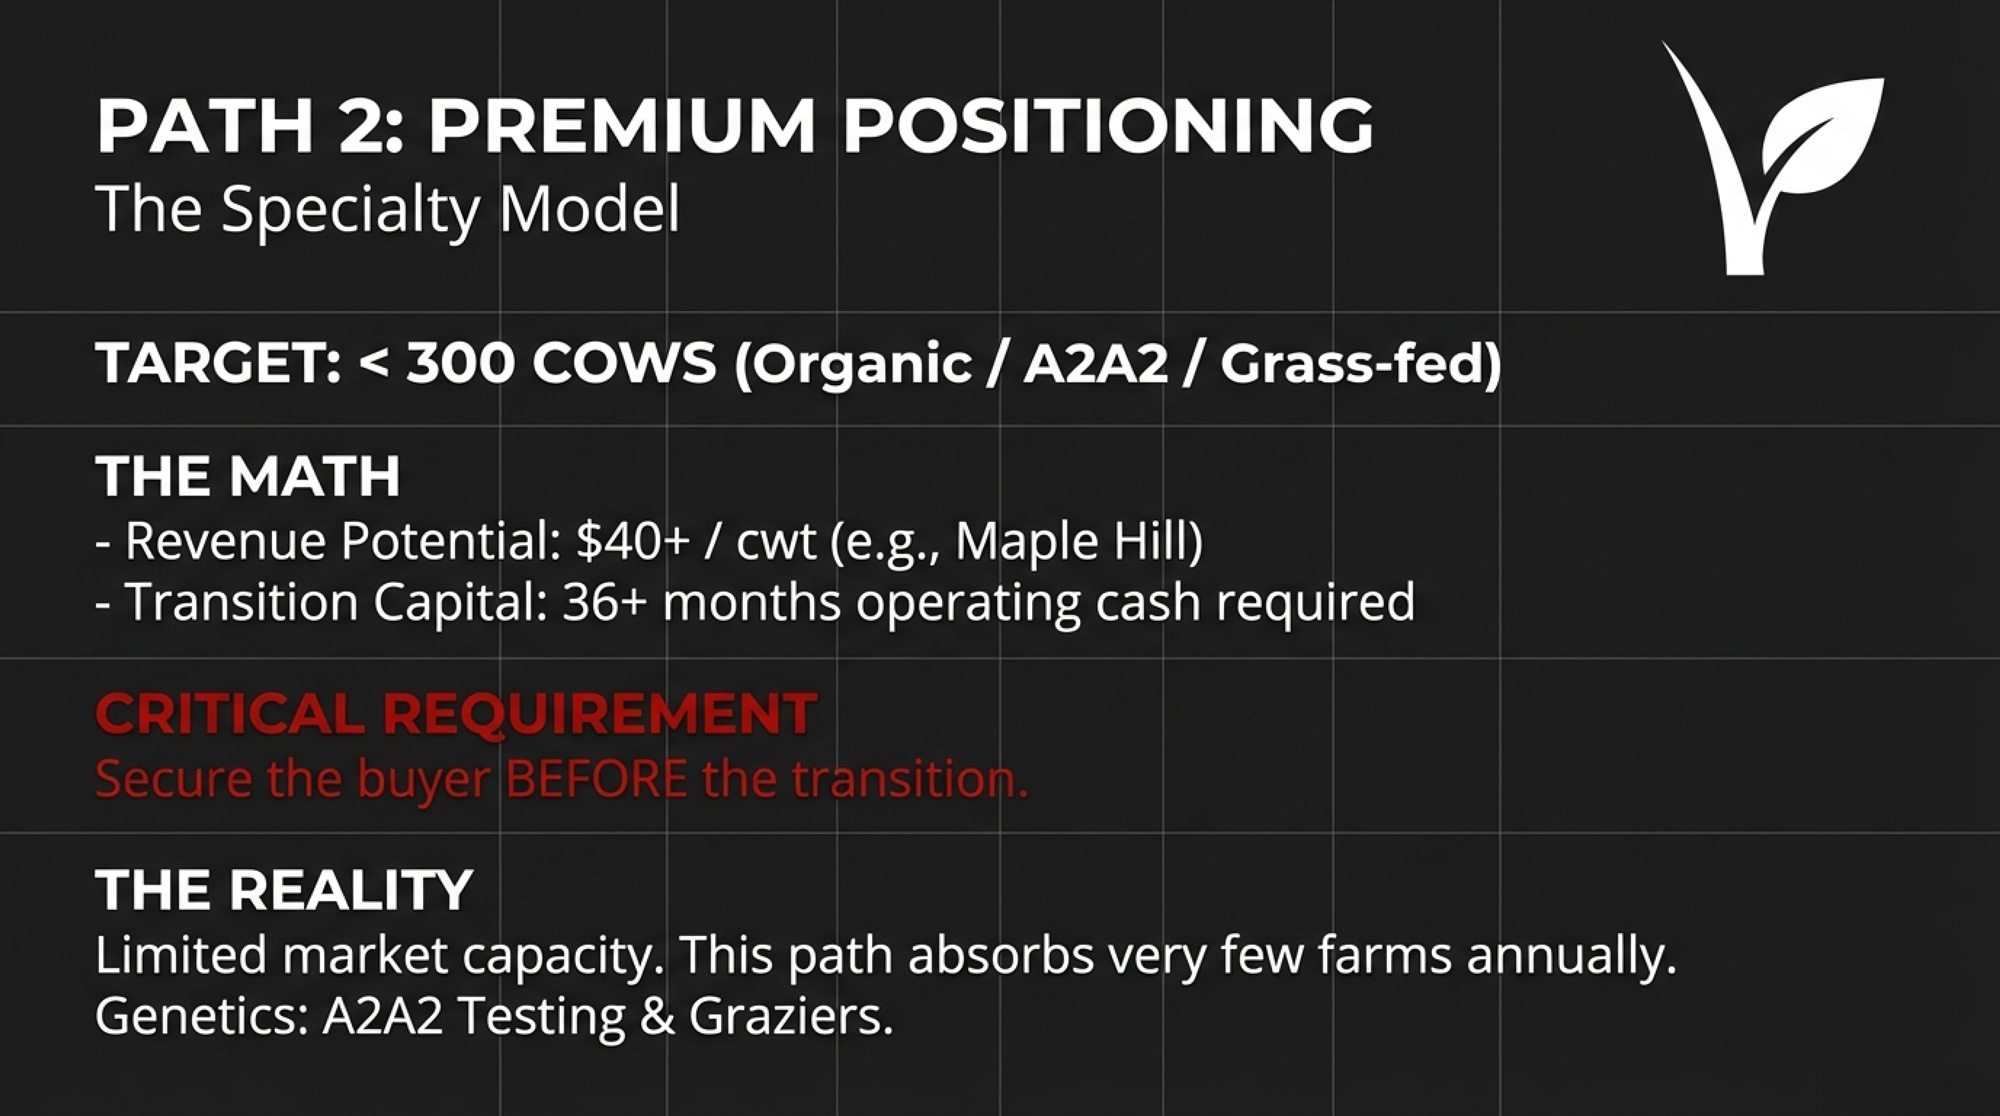
Organic pay prices vary widely by buyer and program. The Northeast Organic Dairy Producers Alliance reported 2025 farm-gate pay prices ranging from $33 to $45 per cwt for grain-and-pasture-fed dairies, with grass-fed certified operations pulling $36 to $50 per cwt and spot organic loads exceeding $50 per cwt in tight markets. That’s well above the conventional all-milk price — USDA’s ERS Livestock, Dairy, and Poultry Outlook projected the 2026 all-milk average at $18.25 per cwt (January 16, 2026), while the January 2026 WASDE pegged 2026 Class III at $16.35 per cwt, down 70 cents from the prior month’s estimate. Nancy’s Probiotic Foods, based at Springfield Creamery in Springfield, Oregon — a family operation since 1960 — gives Forest Glen a contracted home for organic Jersey milk. The Costco A2 program taps into a market Grand View Research valued at $4 billion in 2024, and projects will reach $11.2 billion by 2030.
So why has the last decade been “pretty tough”?
Because premium pay doesn’t eliminate costs. Organic feed costs more. Three thousand acres of organic cropland take intensive management. Oregon’s overtime rules apply to organic dairies the same as to conventional ones. And the processor captures the bulk of the retail premium — organic farm-gate prices typically land at less than a third of what consumers pay at the shelf. With national organic retail whole milk cresting above $5.00 per half gallon for the first time in April 2025, even a $45/cwt farm-gate check captures a fraction of what the product is worth at the register.
The Kirchers and Bansen make it work because they started nearly 30 years ago, run 2,200 cows to spread overhead, and stack revenue streams beyond milk: registered Jersey genetics, digester electricity, and composted fiber sold to Willamette Valley vineyards as mulch. That’s not a model you replicate from a standing start in 2026.
| Revenue/Cost Item | Conventional (PNW) | Organic (PNW) | Net Advantage |
|---|---|---|---|
| Milk price, $/cwt | $18.25 (2026 proj.) | $45.00 (high-end) | +$26.75/cwt |
| Organic feed premium, $/cwt | Baseline | +$8.00–$12.00 | –$8.00–$12.00/cwt |
| Overtime labor penalty, $/cwt | +$0.60–$1.25 | +$0.60–$1.25 | No change |
| Geographic penalty (vs. Idaho), $/cwt | +$3.10–$4.25 | +$3.10–$4.25 | No change |
| Beef-on-dairy calf revenue, per head | ~$1,400 | ~$1,400 | No change |
| Net organic advantage after penalties | — | — | +$6.50–$15.15/cwt |
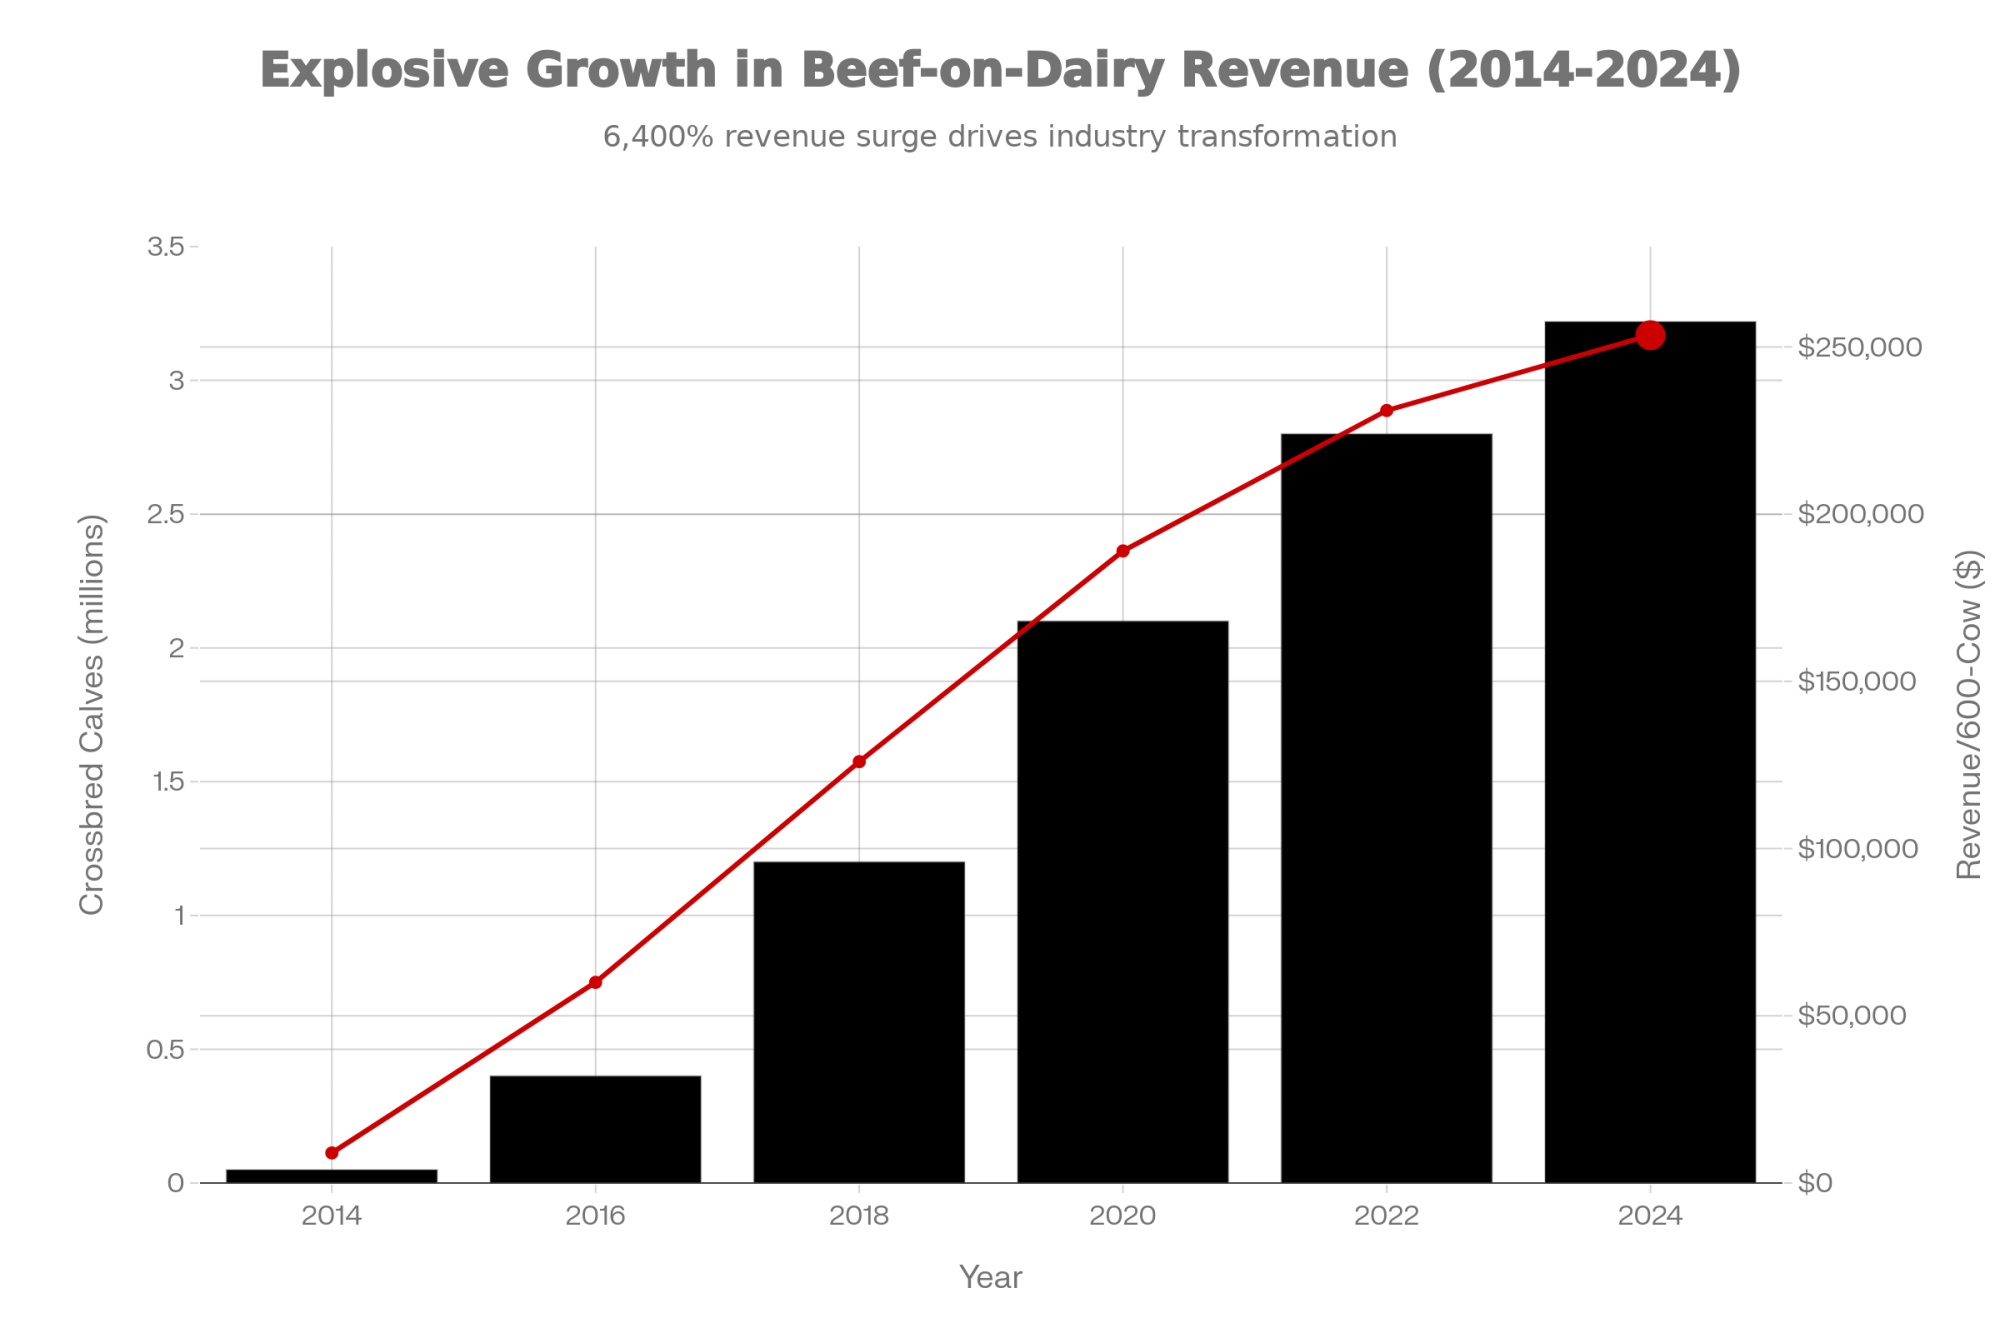
Beef-on-Dairy: Real Revenue, Real Ceiling
Tyler Reynolds told Capital Press that including beef byproduct makes dairy’s share of his revenue “stronger than” half. Stewart Kircher was equally direct: “The impact on the beef market is huge from dairies.”
Day-old beef-on-dairy crossbred calves averaged about $1,400 per head in 2025, according to Laurence Williams, dairy-beef cross development lead at Purina — up from roughly $650 three years earlier (Dairy Herd Management, September 2025). Phil Plourd, president of Ever.Ag Insights, expects financial incentives to “continue to lean toward beef-on-dairy activity, even if it’s not quite as lucrative as today.”
That revenue is real. It’s also cyclical. Budget for it. Don’t build a survival plan around it.
Geography Sets the Floor. Management Sets the Ceiling.
A fair objection to this piece: if geography is the whole game, why do some Idaho dairies fail while some Oregon dairies survive?
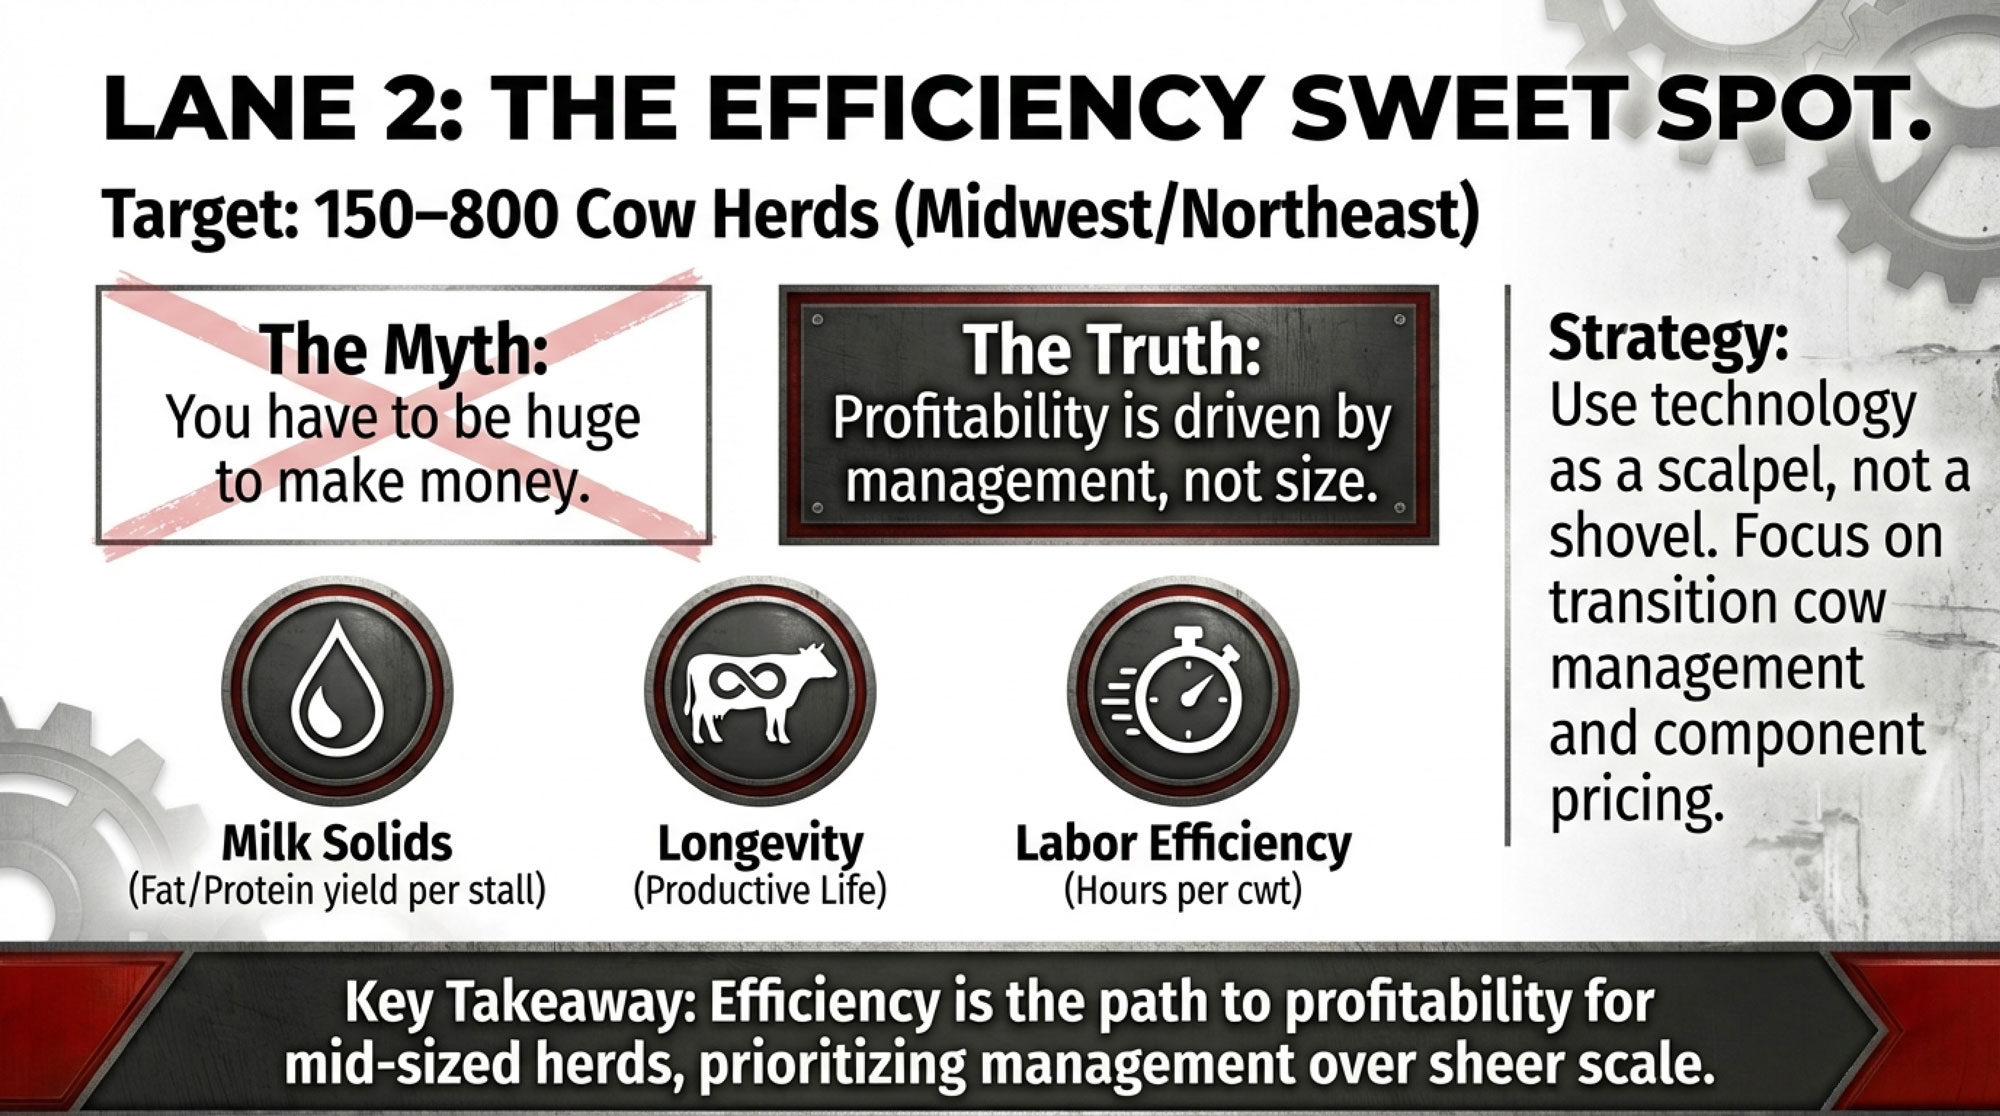
Because geography doesn’t replace management — it determines where management has room to work. Tyler Reynolds didn’t just happen to sit on cheap hay. He recognized the dairy ration built into his family’s crop rotation, bought into a facility every big operator passed on, and built a beef-on-dairy revenue stream that pushes his dairy share past 50%. The structural advantage gave him the floor. His decisions were built on top of it.
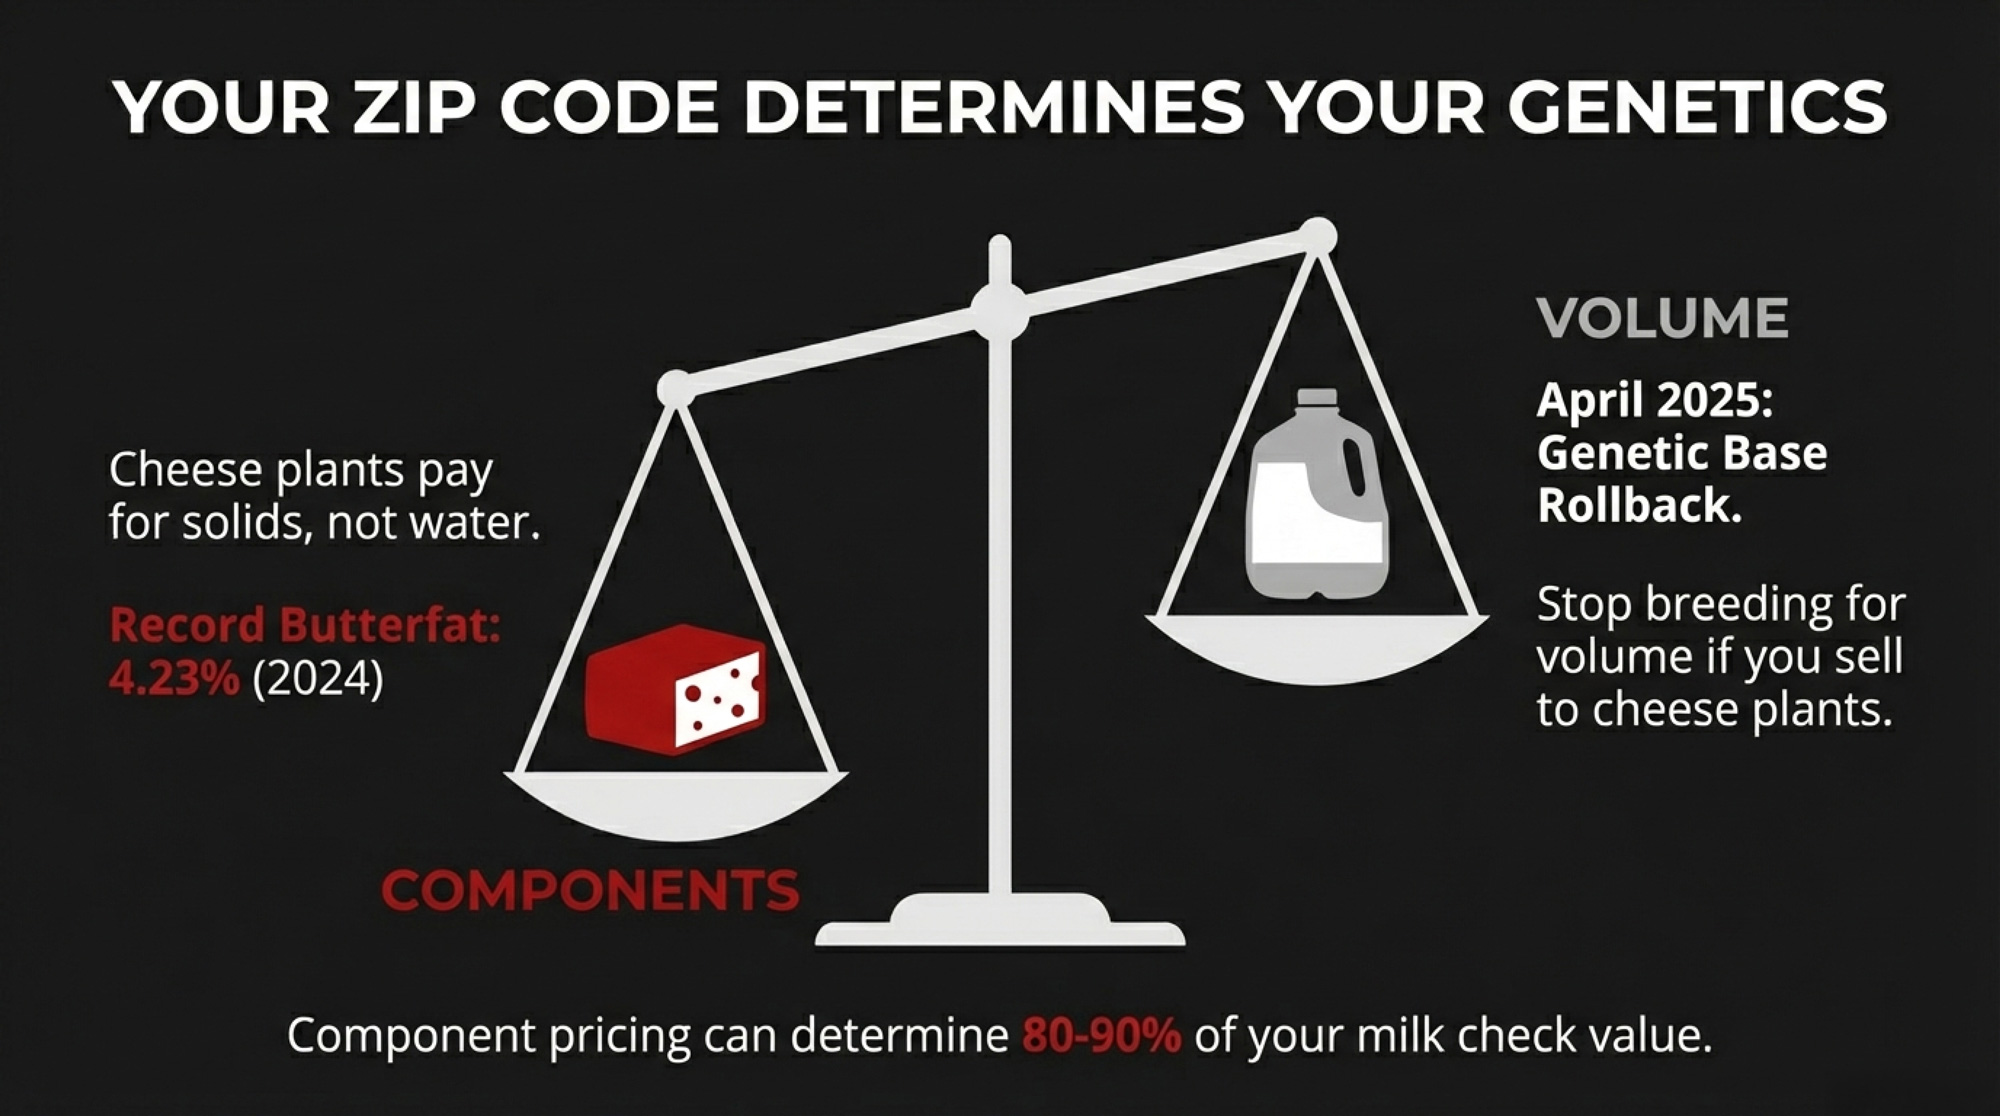
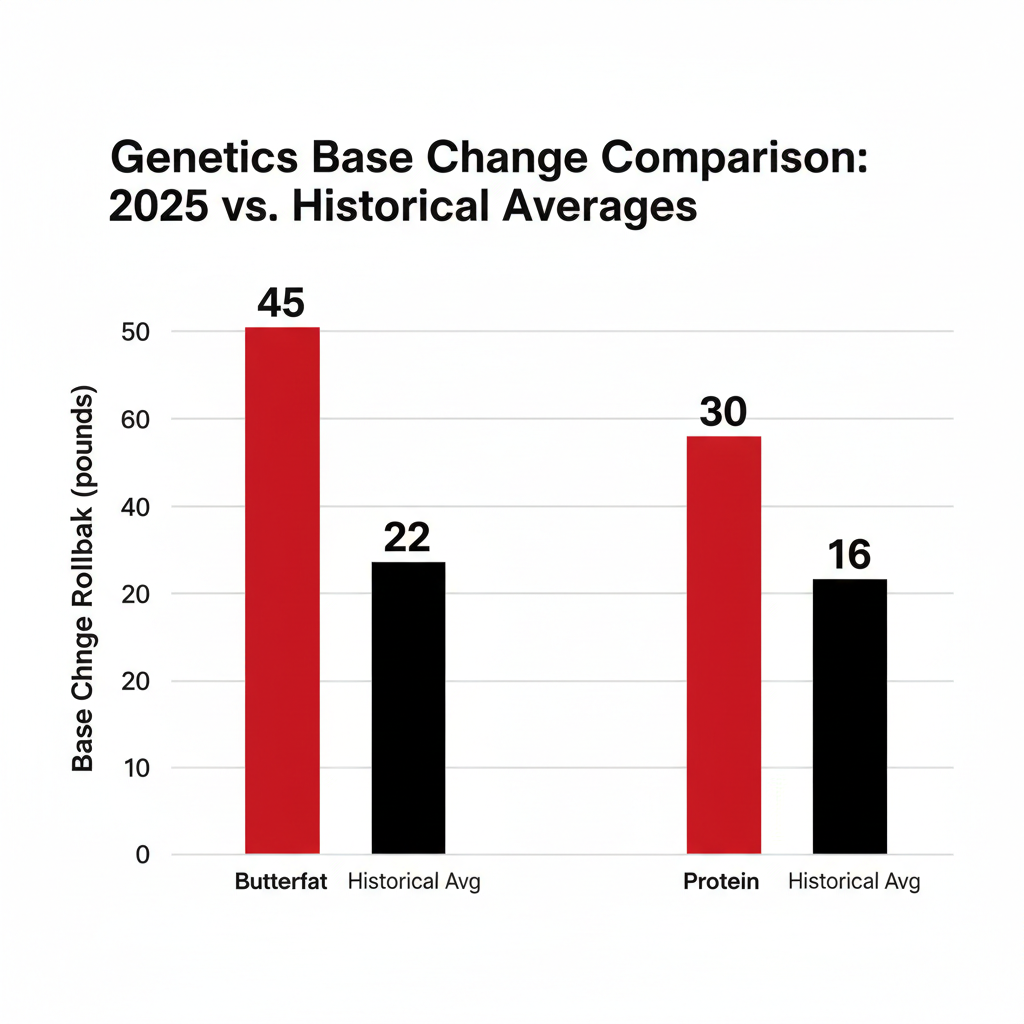
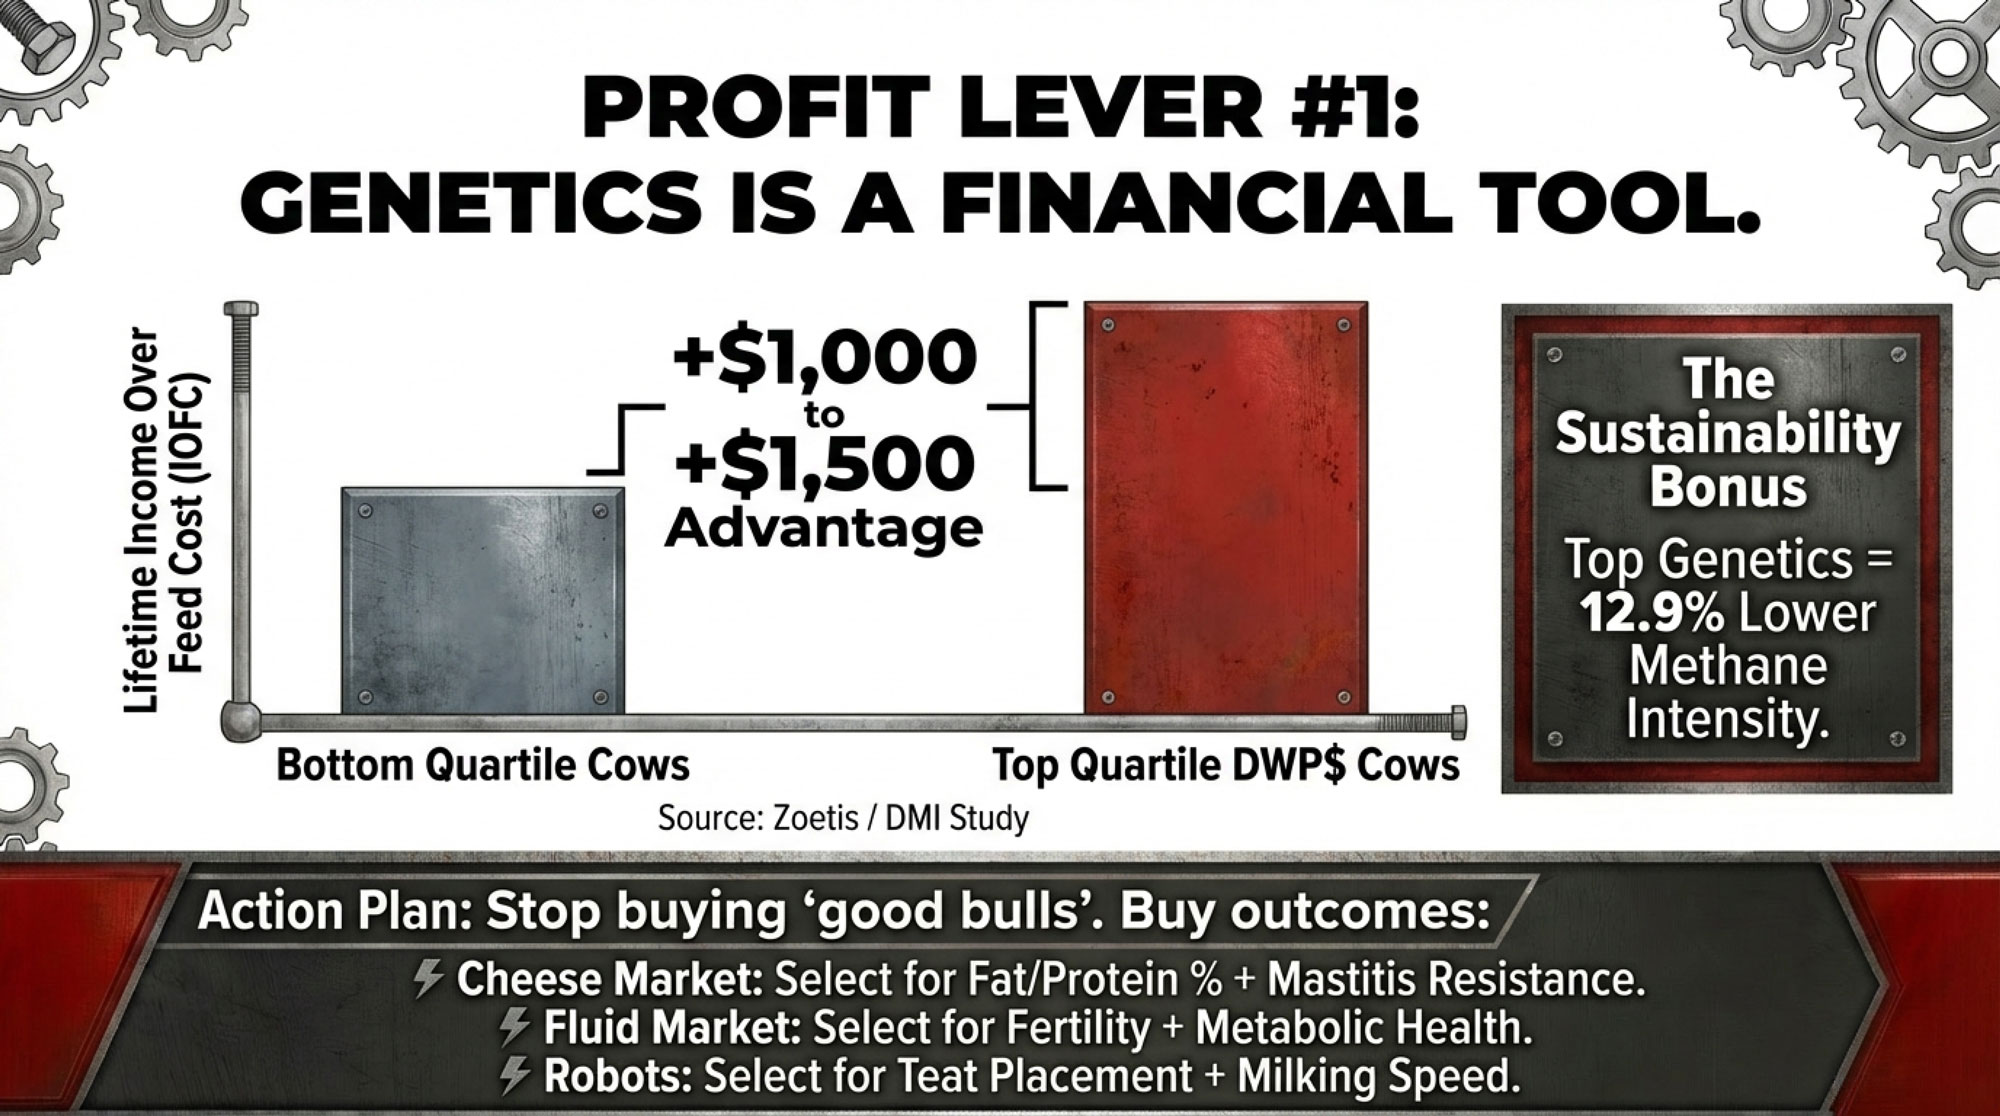
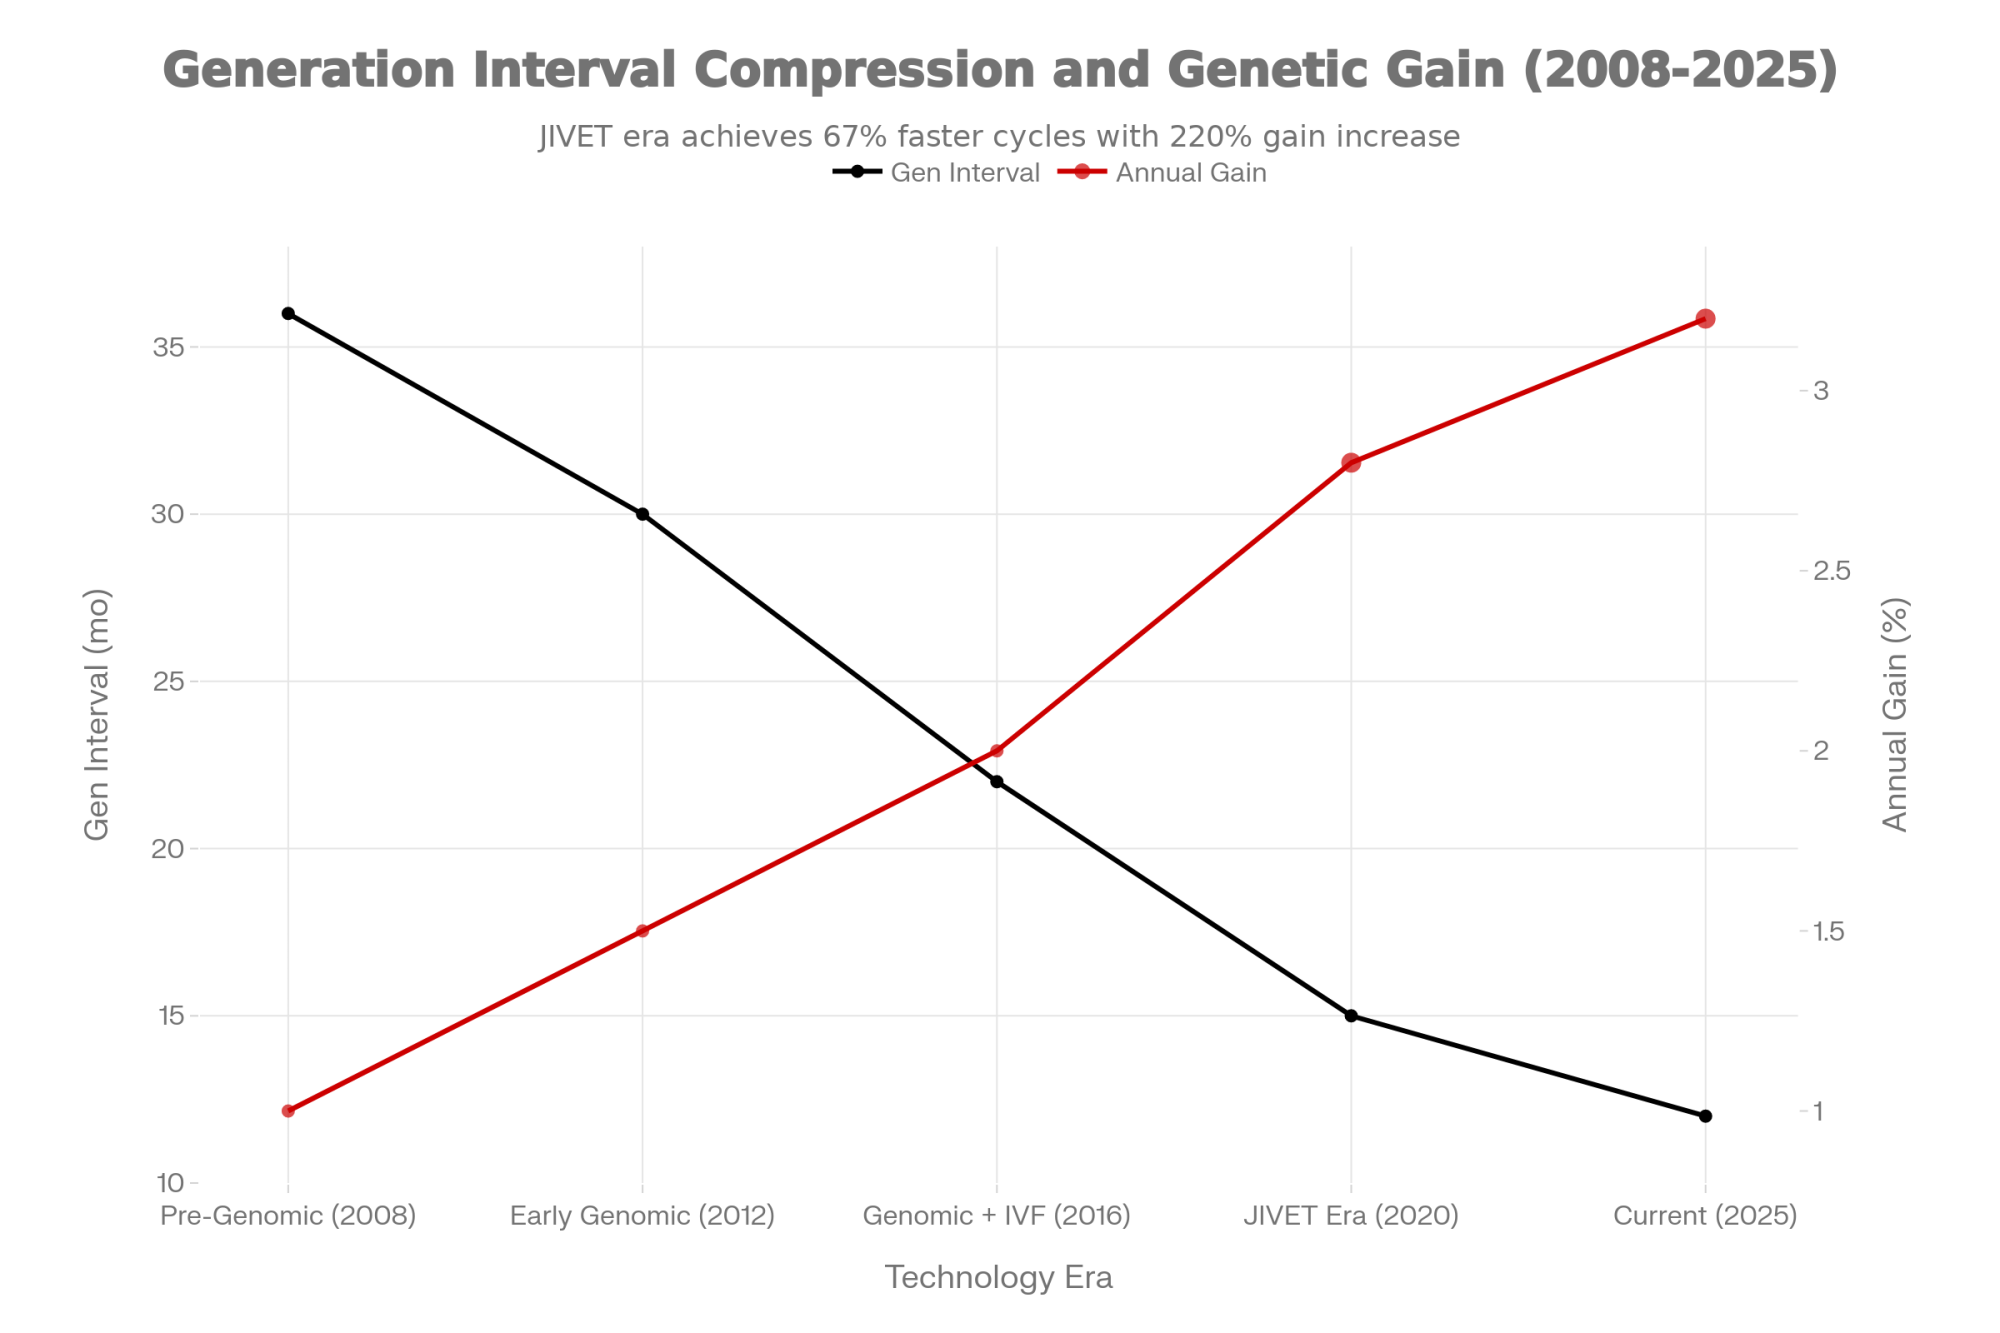
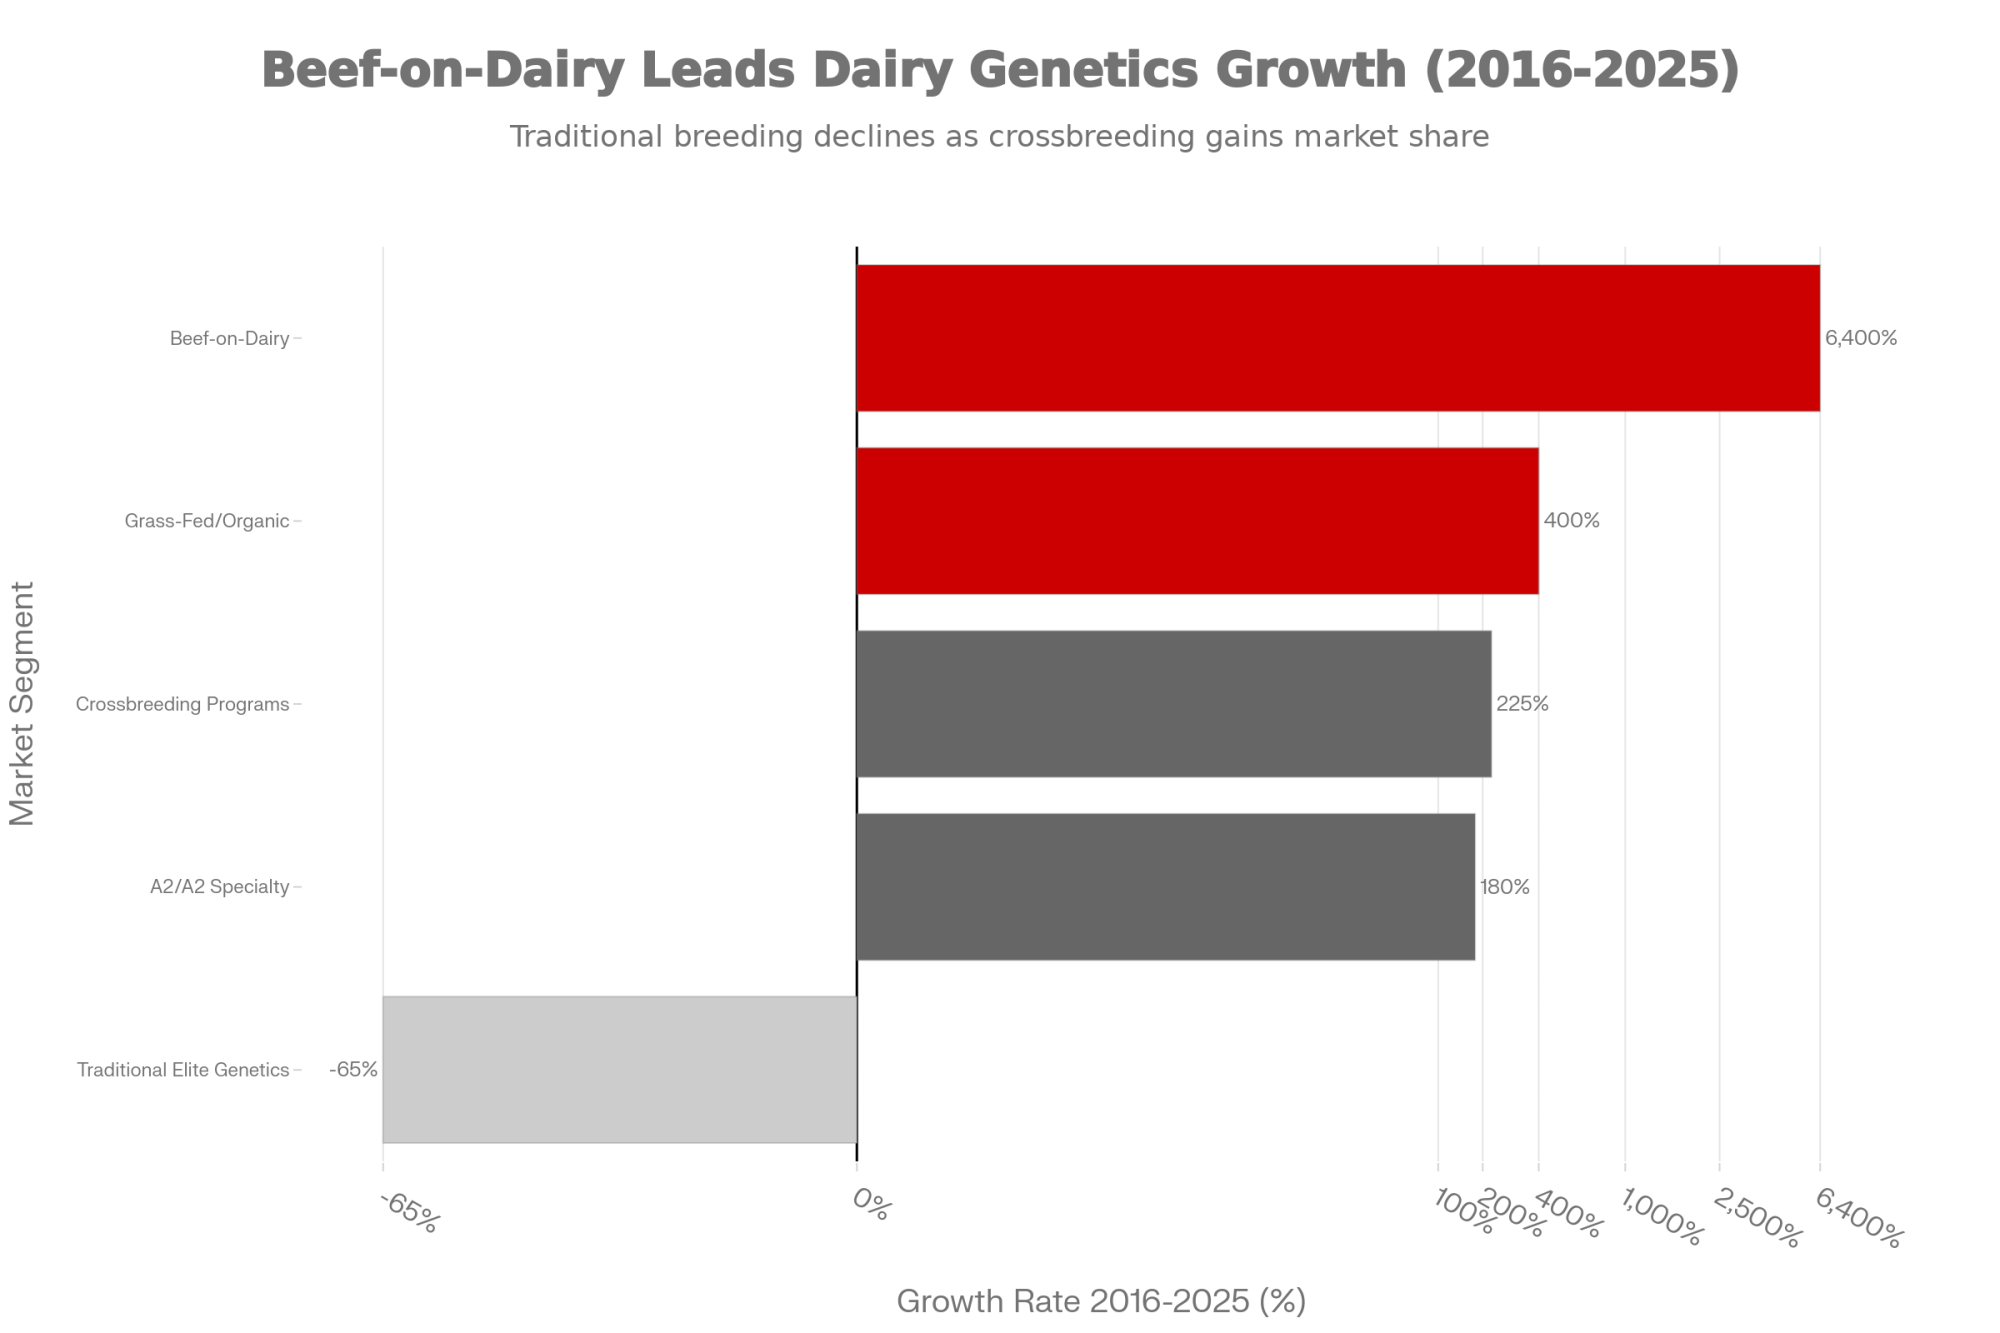
The same is true on the genetics side. CDCB’s April 2025 Net Merit update increased emphasis on Feed Saved from 12.0% to 17.8% and boosted butterfat from 28.6% to 31.8%, while protein dropped from 19.6% to 13.0%. In high-cost regions where every cent per cwt matters, that shift isn’t academic — it’s survival math. Producers who can’t win on geography are increasingly breeding for components and feed efficiency to close the gap from the cow side, selecting bulls for traits that directly address the structural disadvantage their zip code creates.
But here’s the honest truth: even with elite genetics and Net Merit optimization, the cost gap narrows by hundreds of dollars per cow. The geographic penalty runs into the thousands. Management and genetics are the ceiling. Geography is the floor. And when the floor is $3.10 to $4.25 per cwt below your neighbor’s, the ceiling starts a lot higher, too.
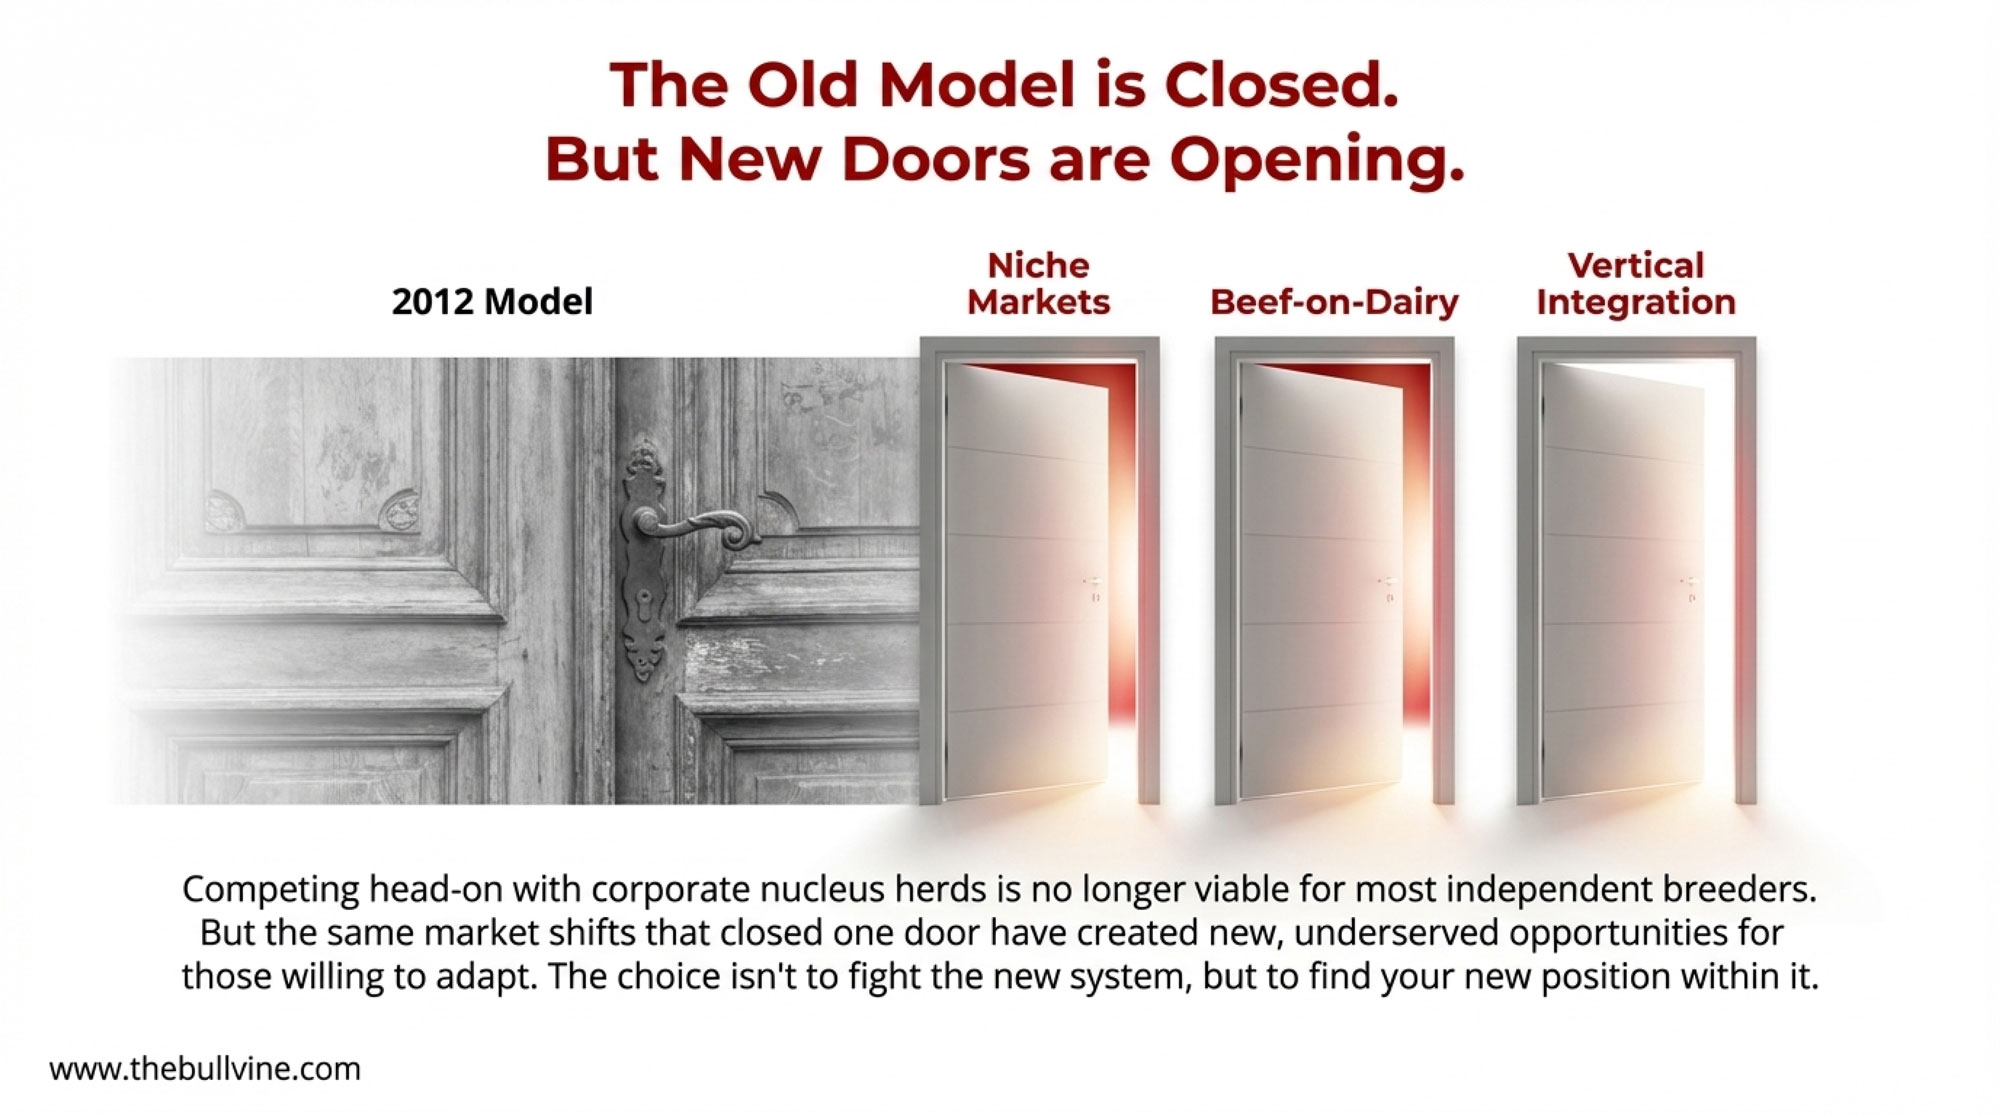
What This Means for Your Operation
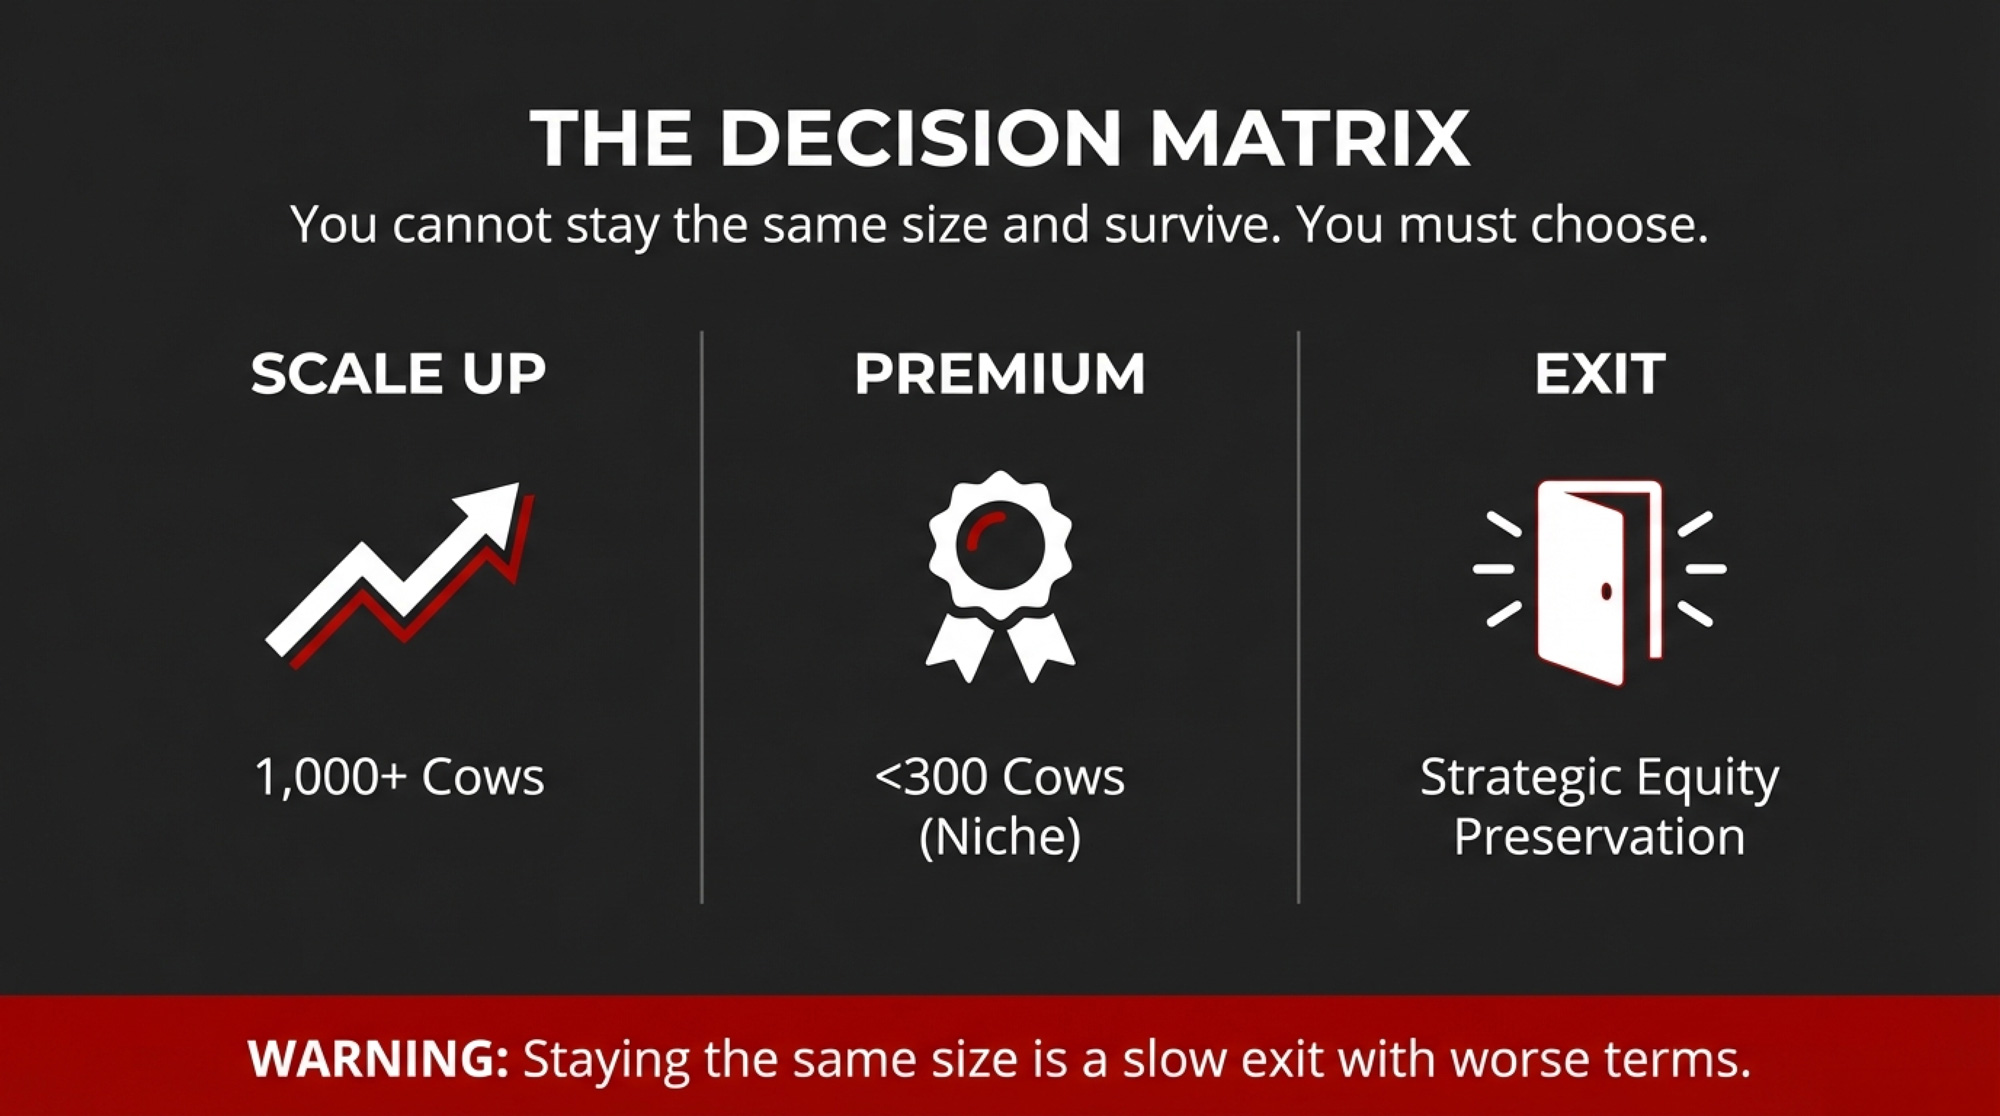
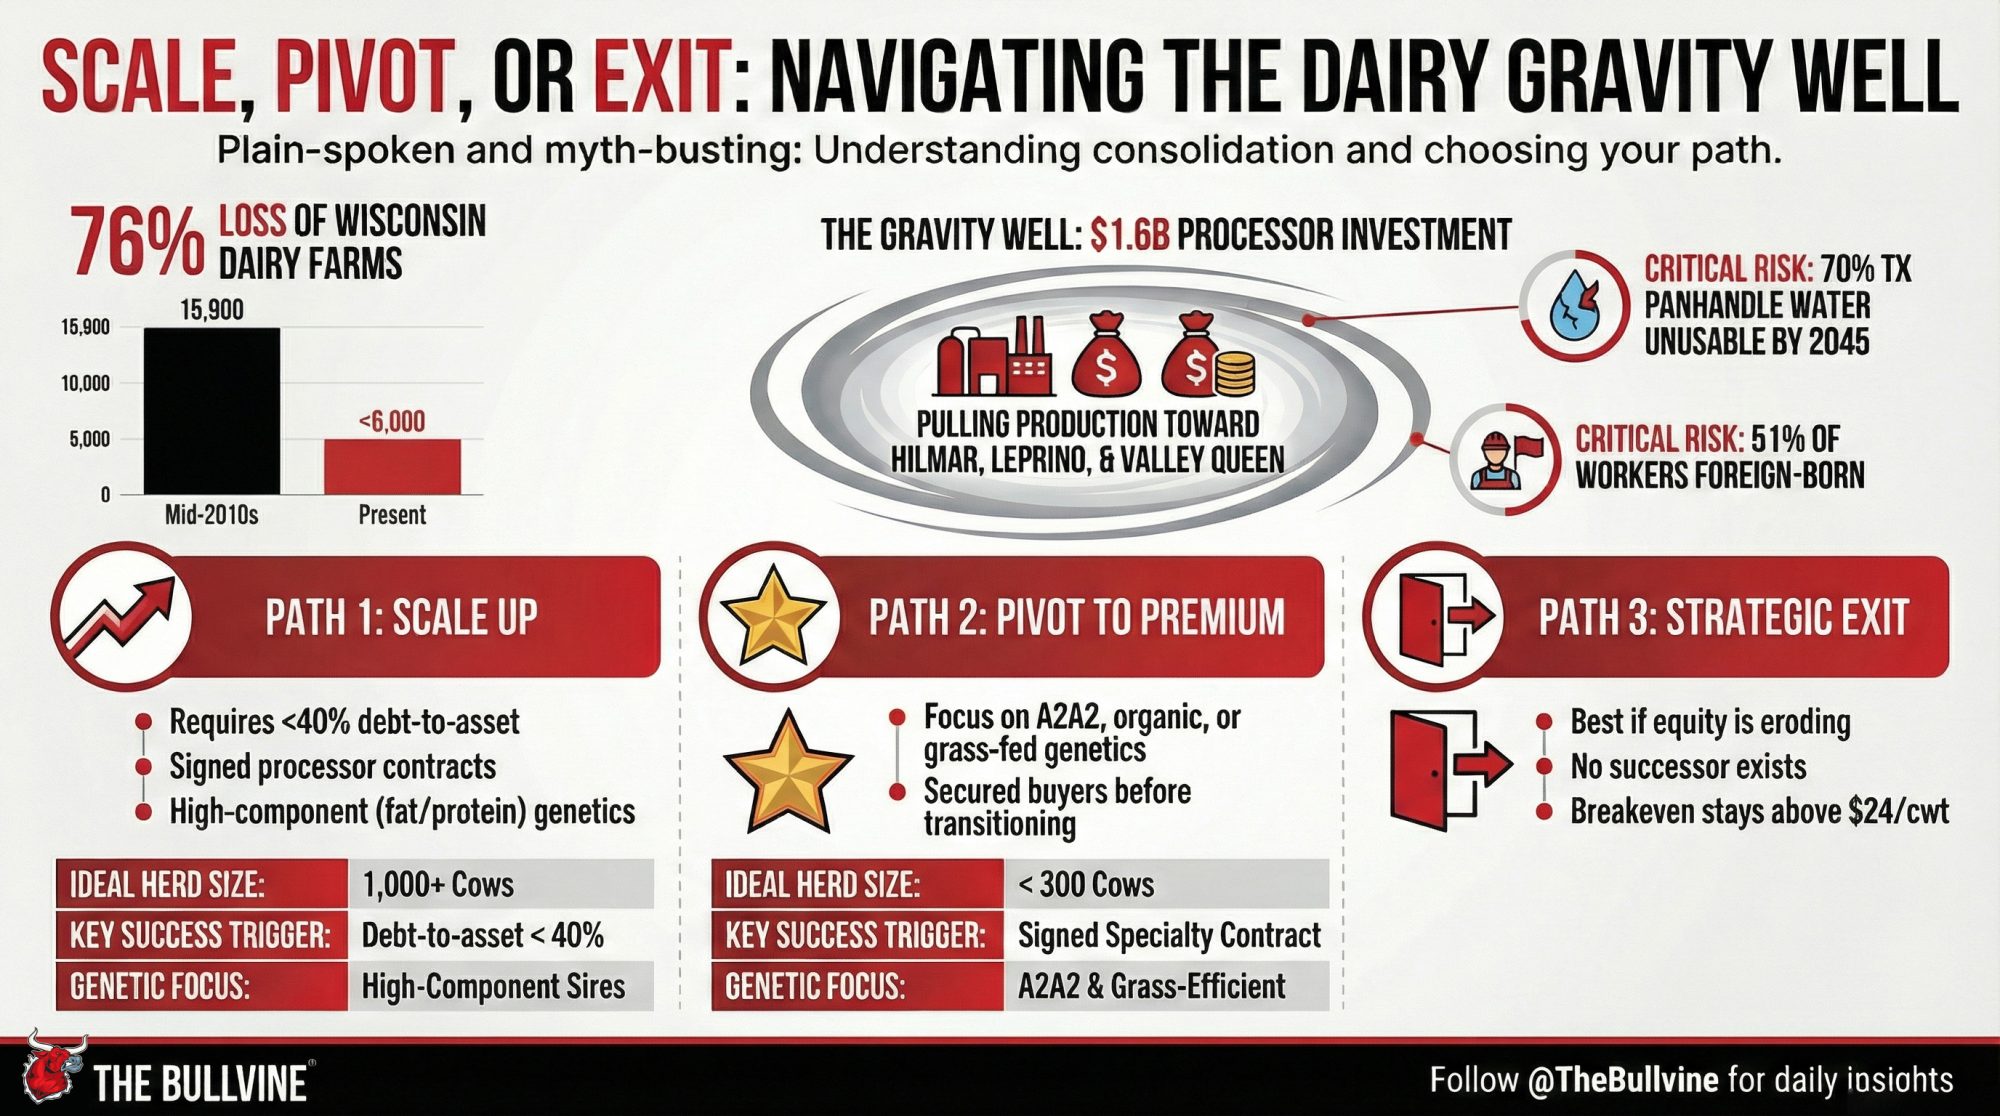
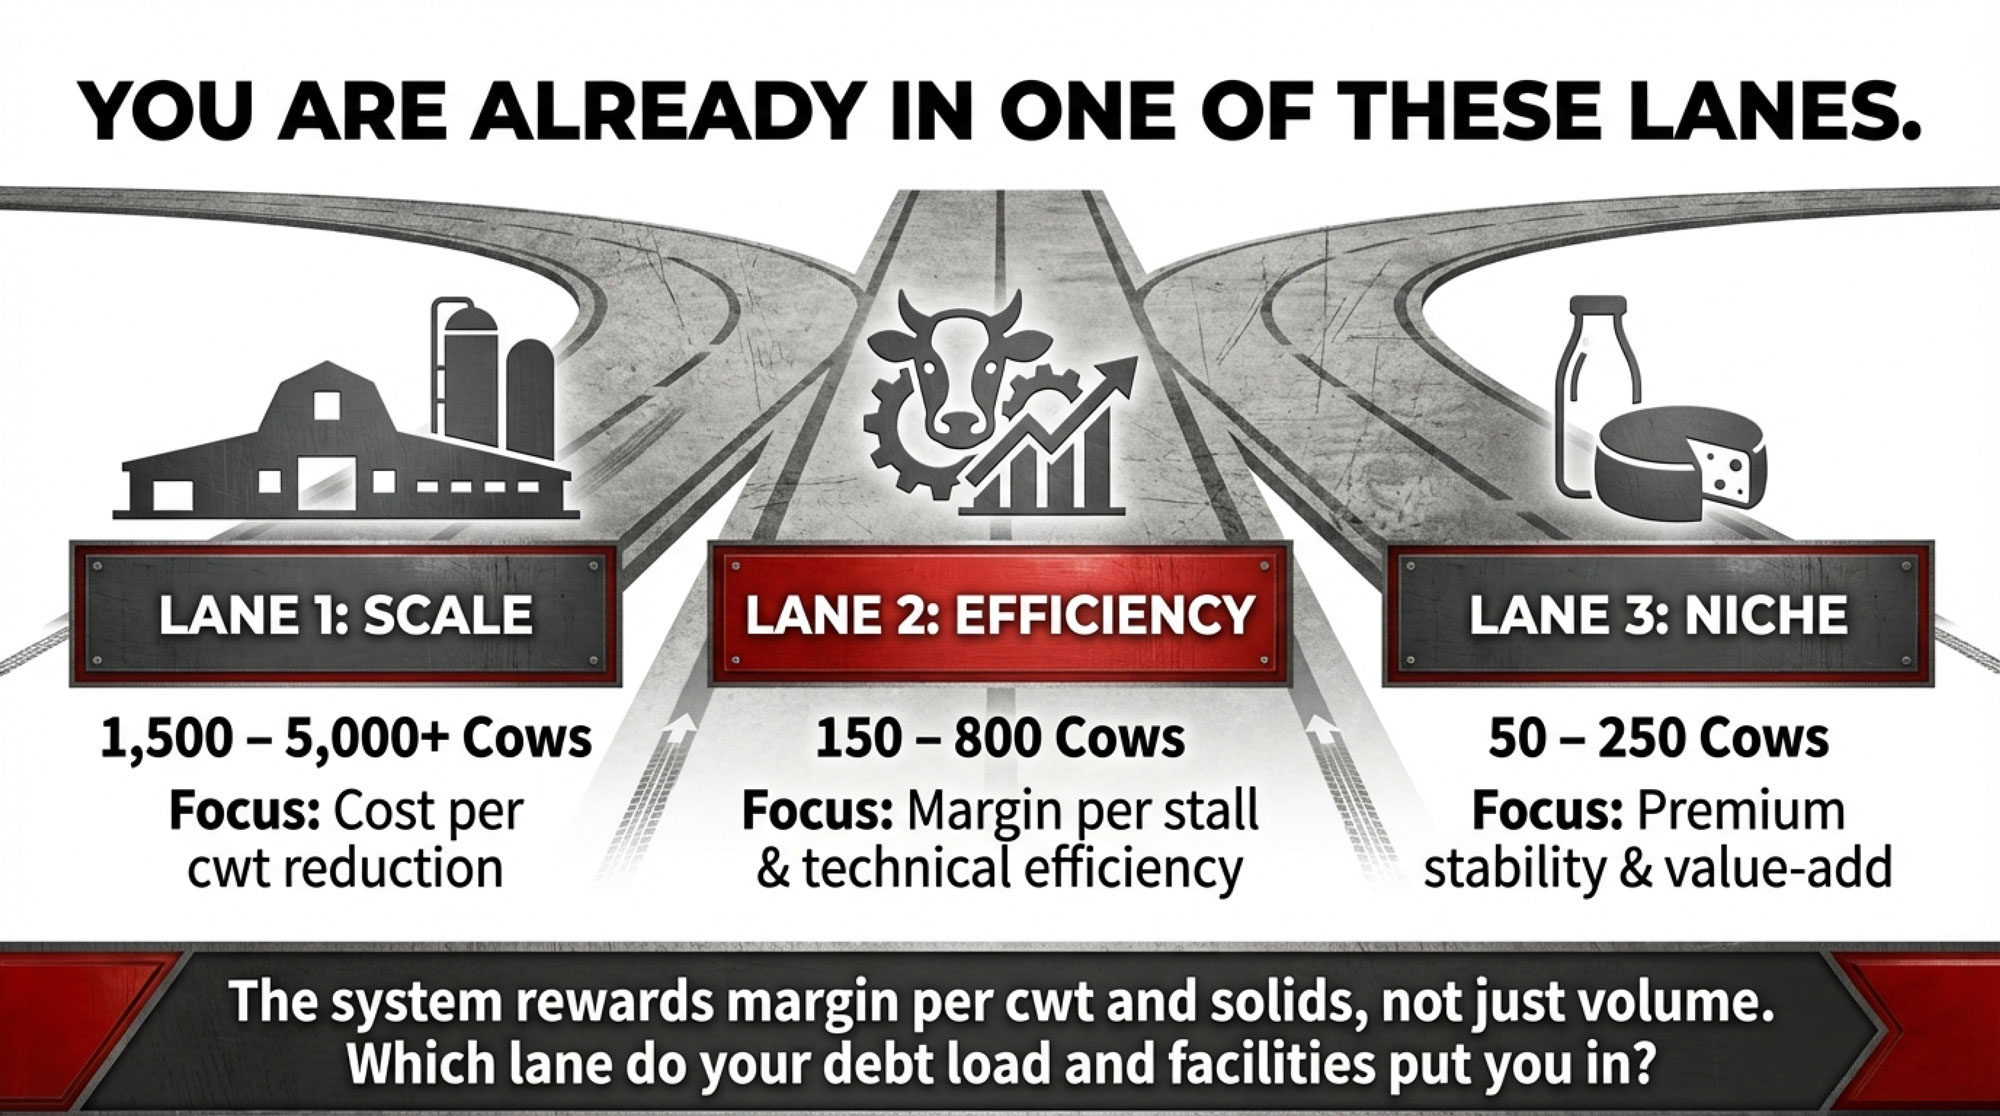
If you’re milking in Oregon, Washington, or another region where the structural math works against you, the data points to three paths. None is painless.
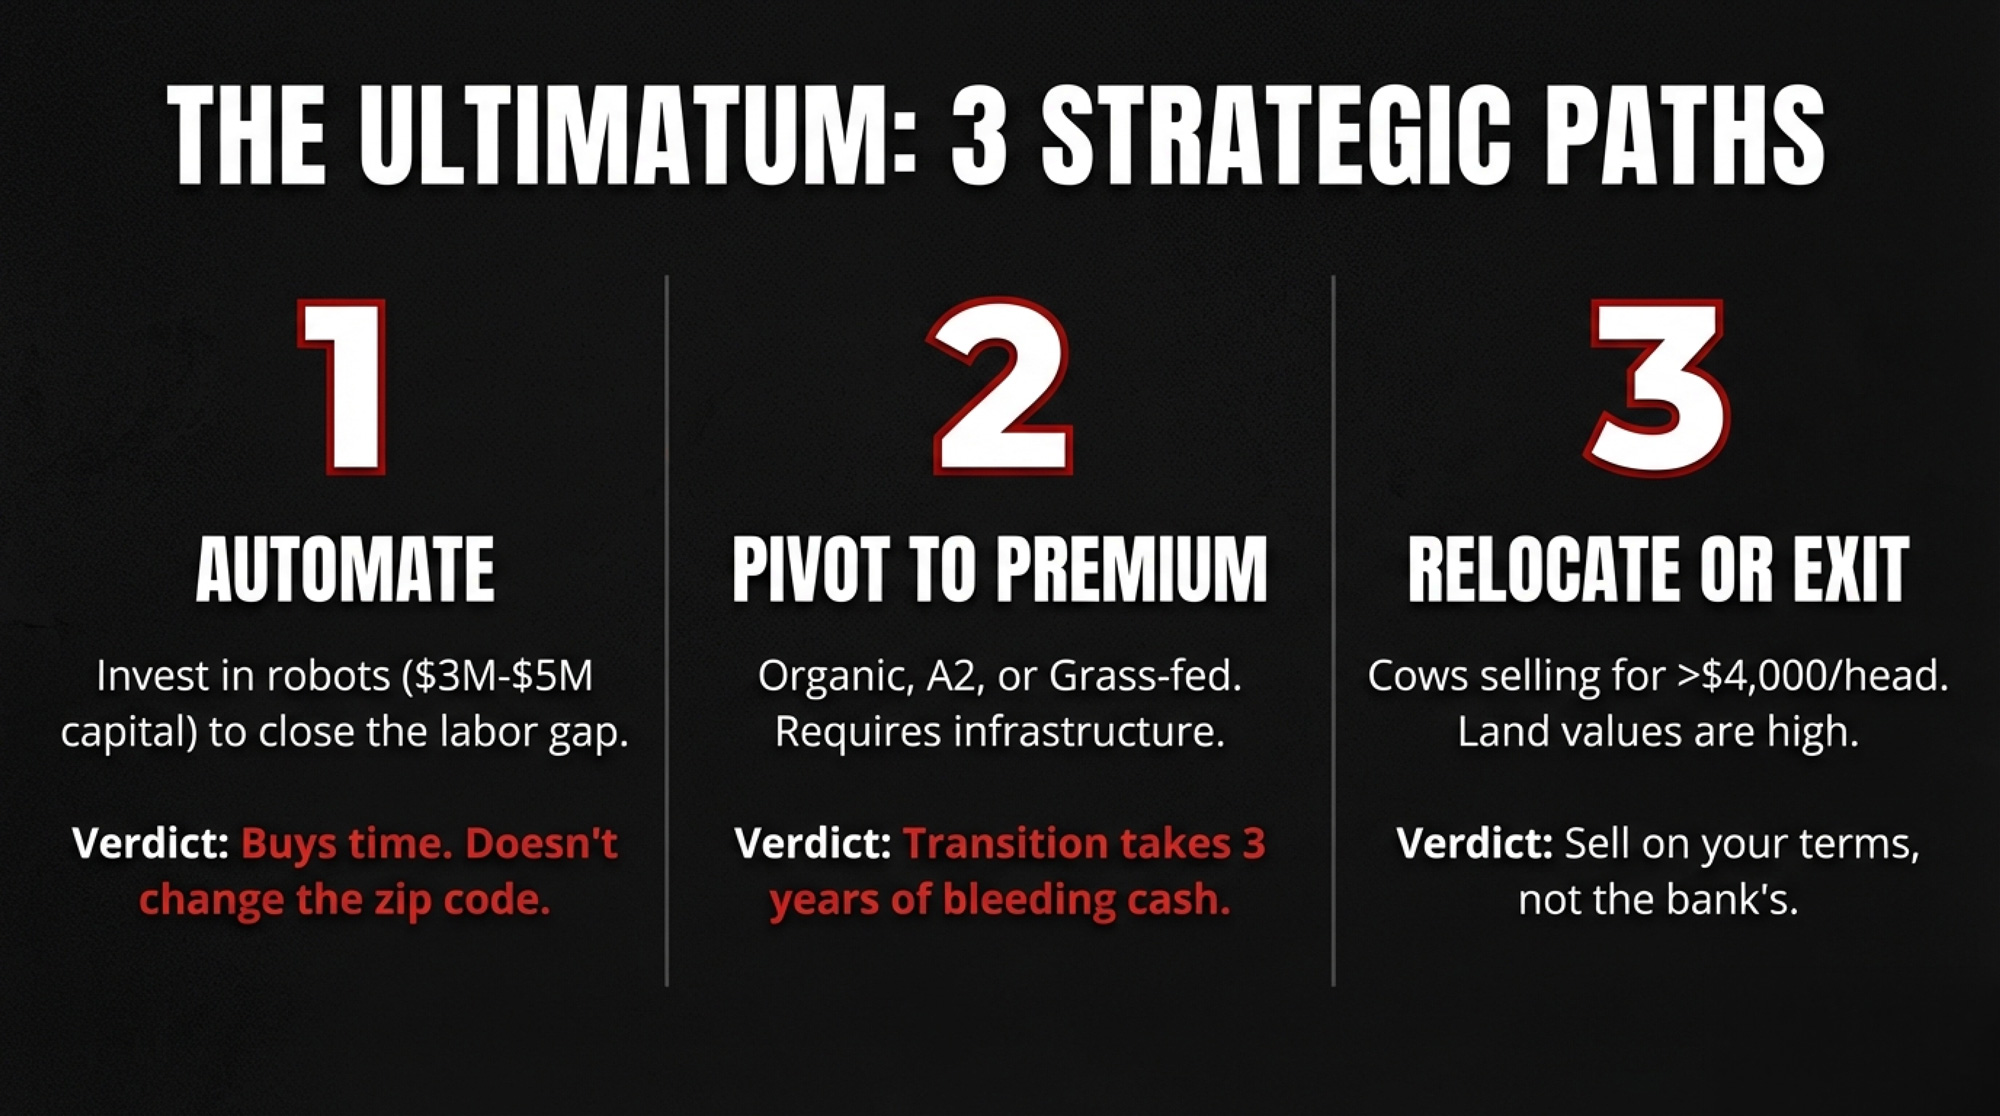
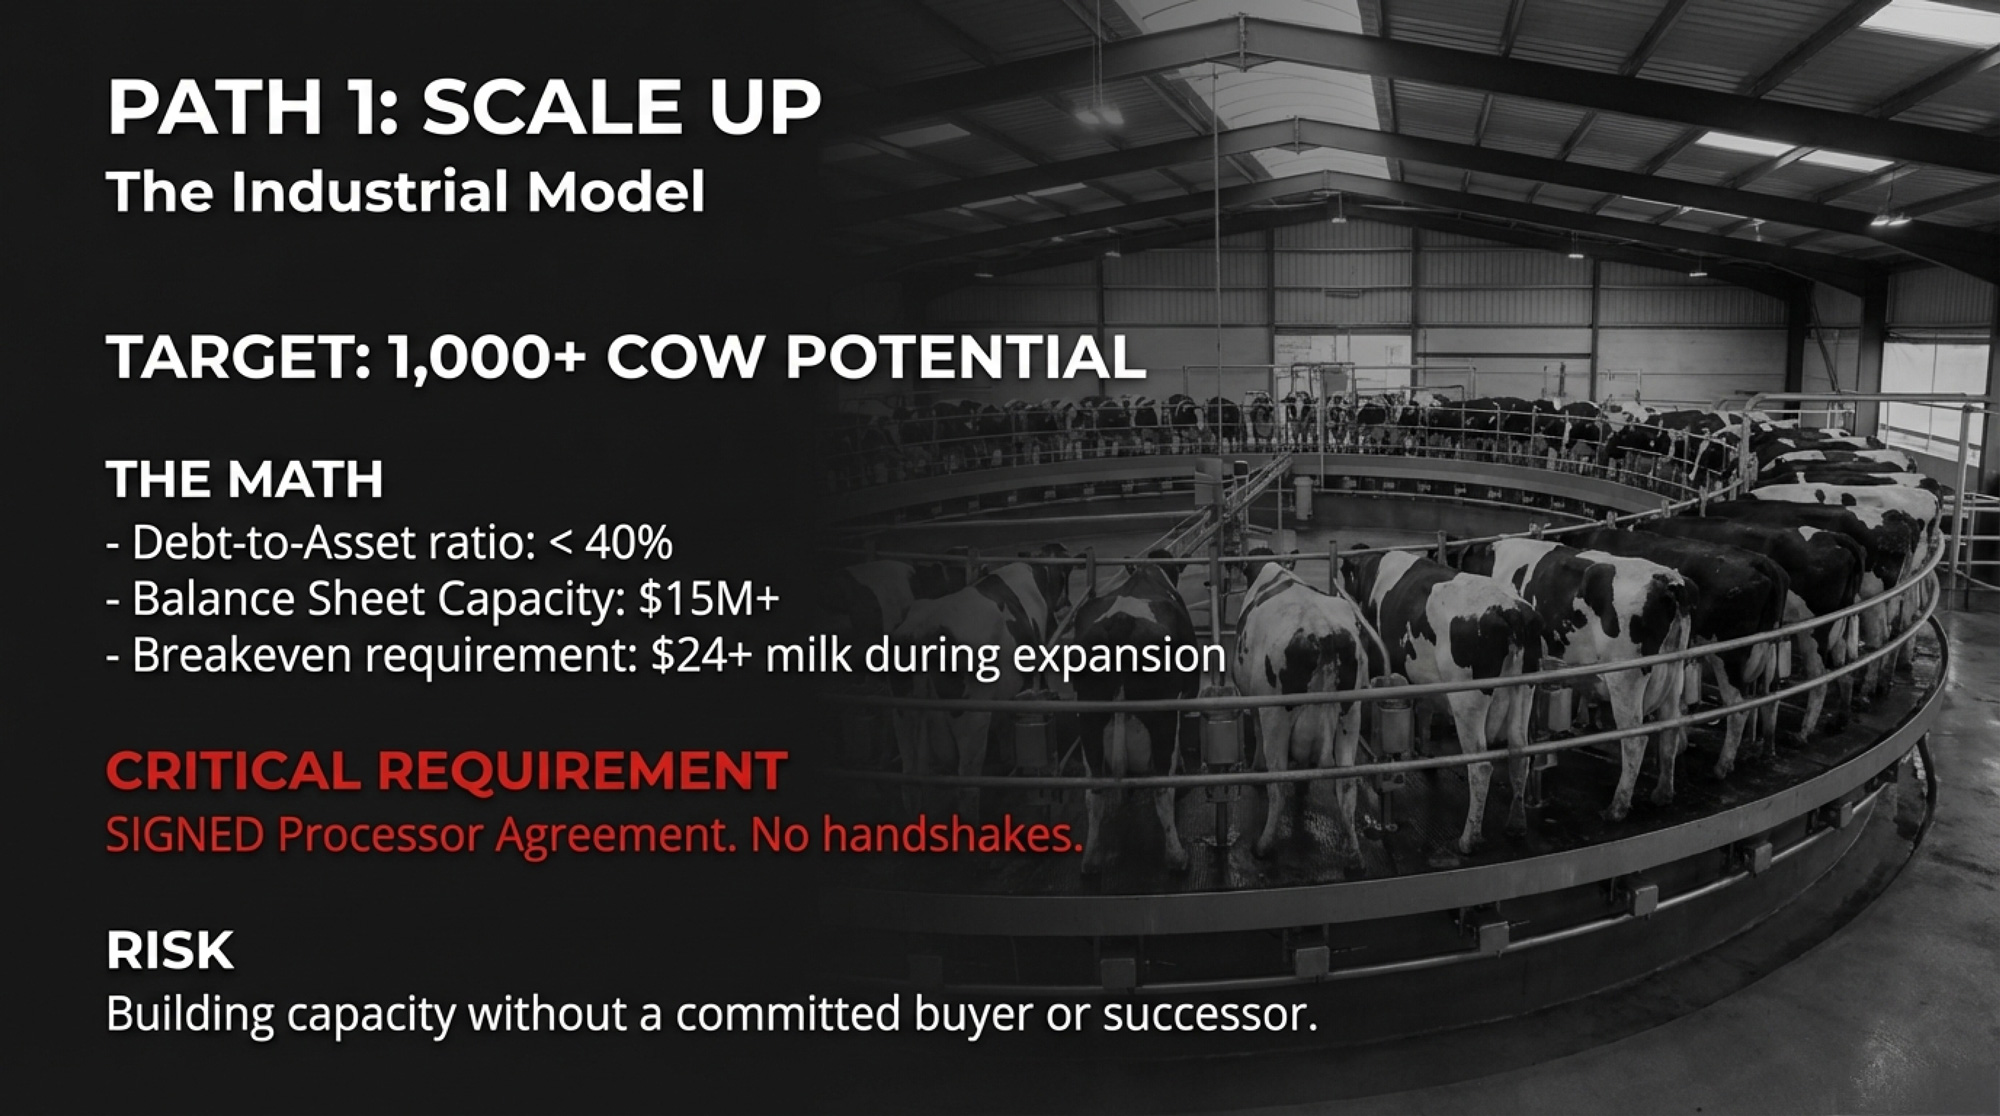
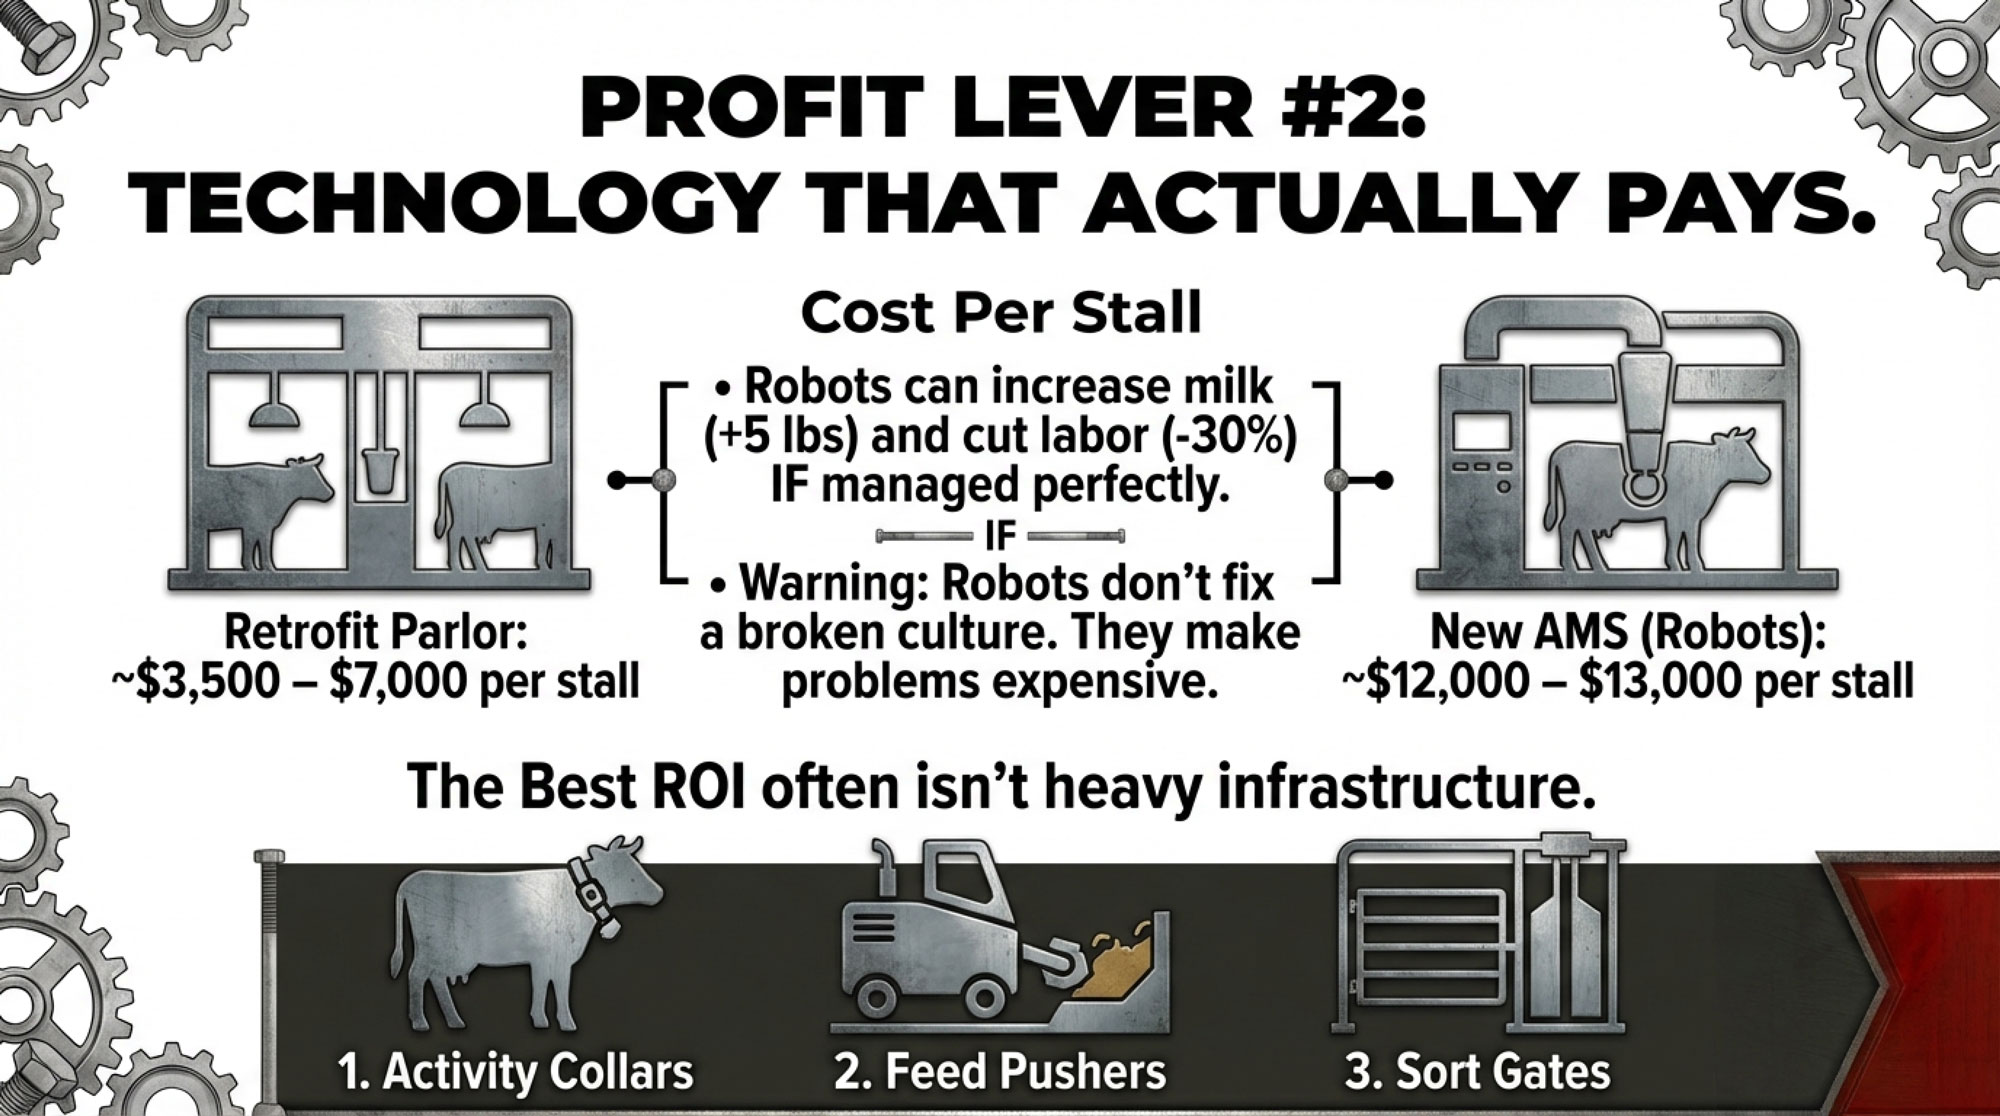
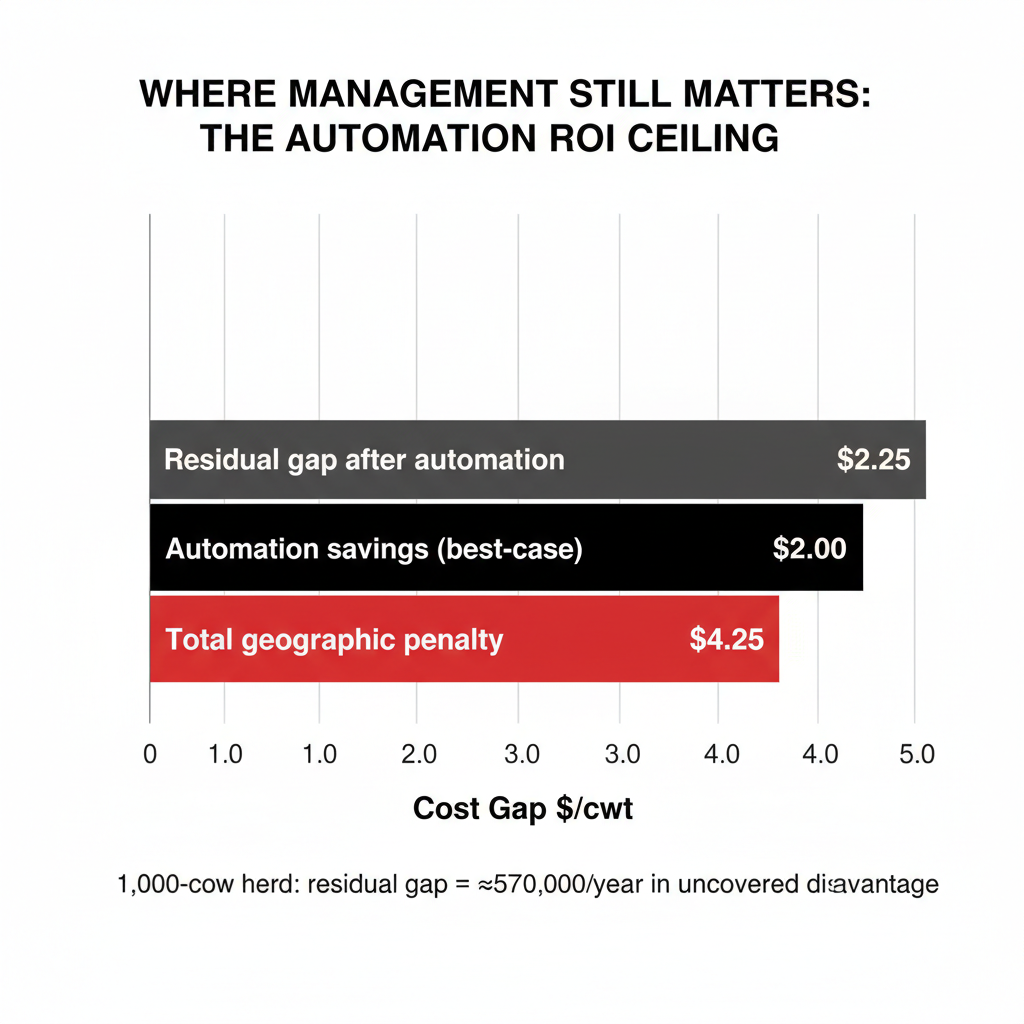
Automate and stay. Robotic milking and precision feeding can tighten the gap — current systems run $200,000–$300,000 per unit, each handling 50–80 cows. For a 1,000-cow herd, that’s $3–$5 million in capital. Even in the best-case, automation roughly closes a third to half of the $3.00–$4.00/cwt structural gap. Automation buys time. It doesn’t change the zip code.
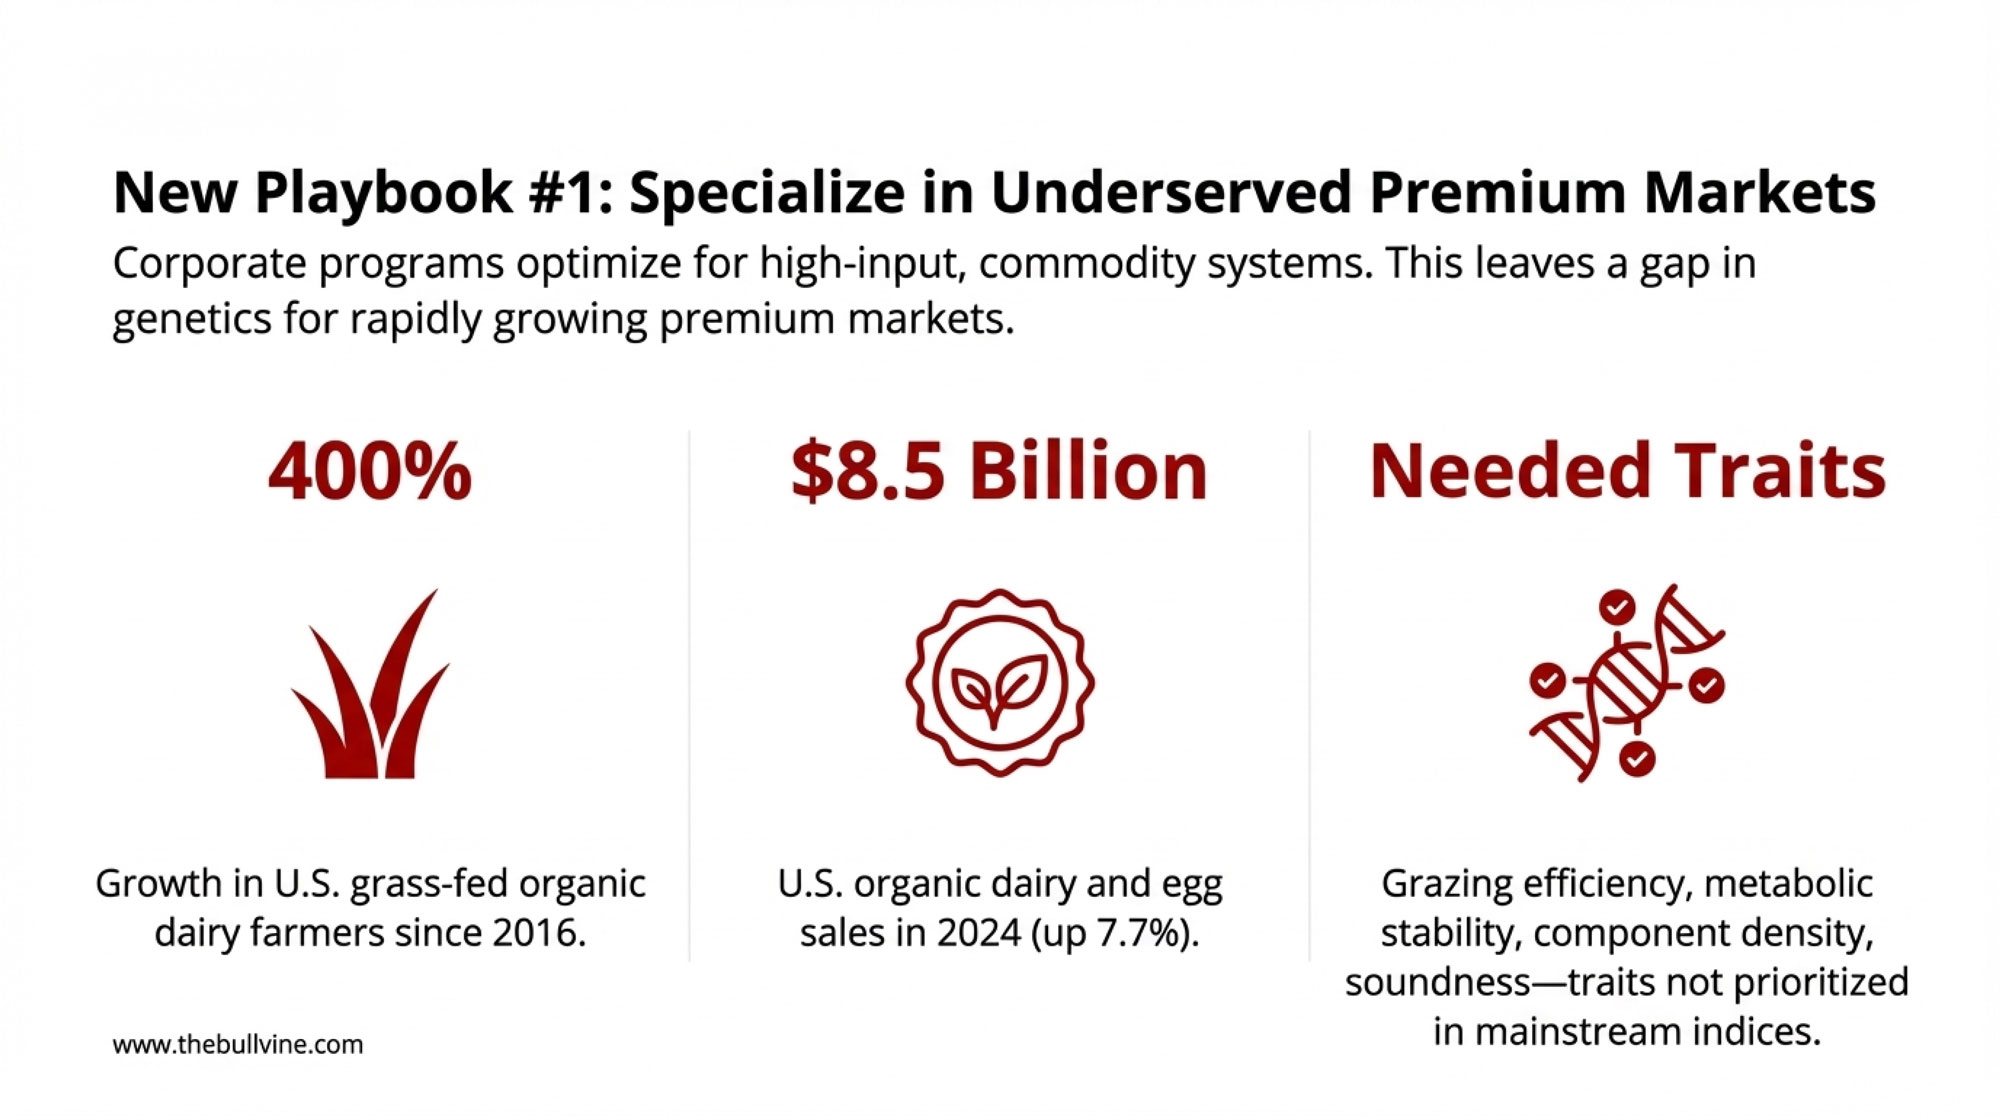
Pivot to premium. Organic, A2, grass-fed — they all pay more. Forest Glen proves it works at scale with the right starting conditions: established certification, Jersey genetics, contracted buyers, stacked revenue. If you don’t already have most of that infrastructure, the three-year organic transition means three years of organic-level costs on conventional-level checks. Run that math to the penny before you commit.
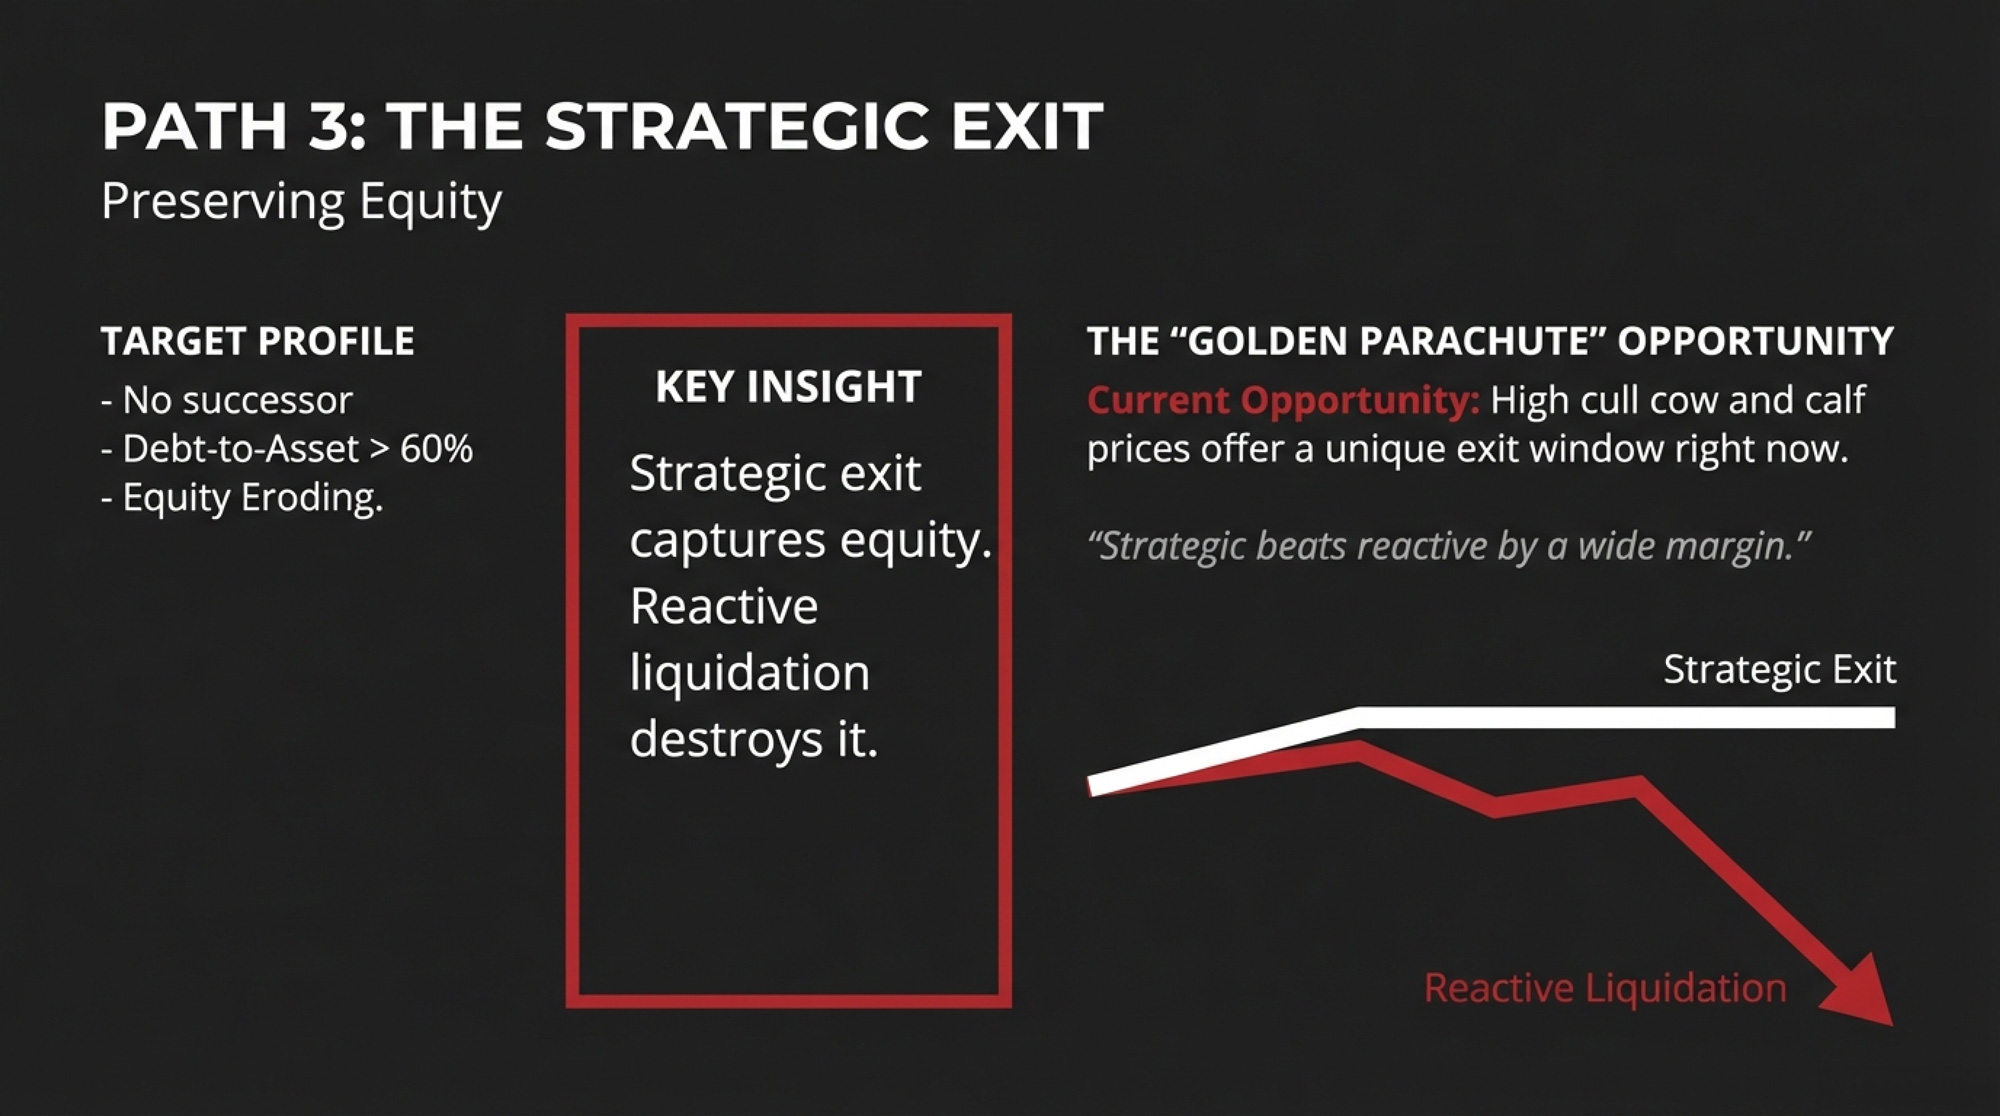
Evaluate dairy relocation — seriously. Current asset markets favor sellers. USDA’s July 2025 data puts the national average replacement dairy cow at $3,010 per head, with Idaho at $3,050 and Wisconsin at $3,290. Mike North of Ever.ag told Brownfield in January 2025 that Pacific Northwest animals were moving at “north of $4,000 an animal.” But Idaho farmland in the Magic Valley runs $12,000–$18,000 per acre, with cash rent at $300–$390 in top dairy counties (NASS, 2022). You’re not moving into bargain country. If you’re seriously weighing dairy relocation, run the full capital budget — land, facilities, permits, disruption costs — not just the per-cwt savings on feed and labor.
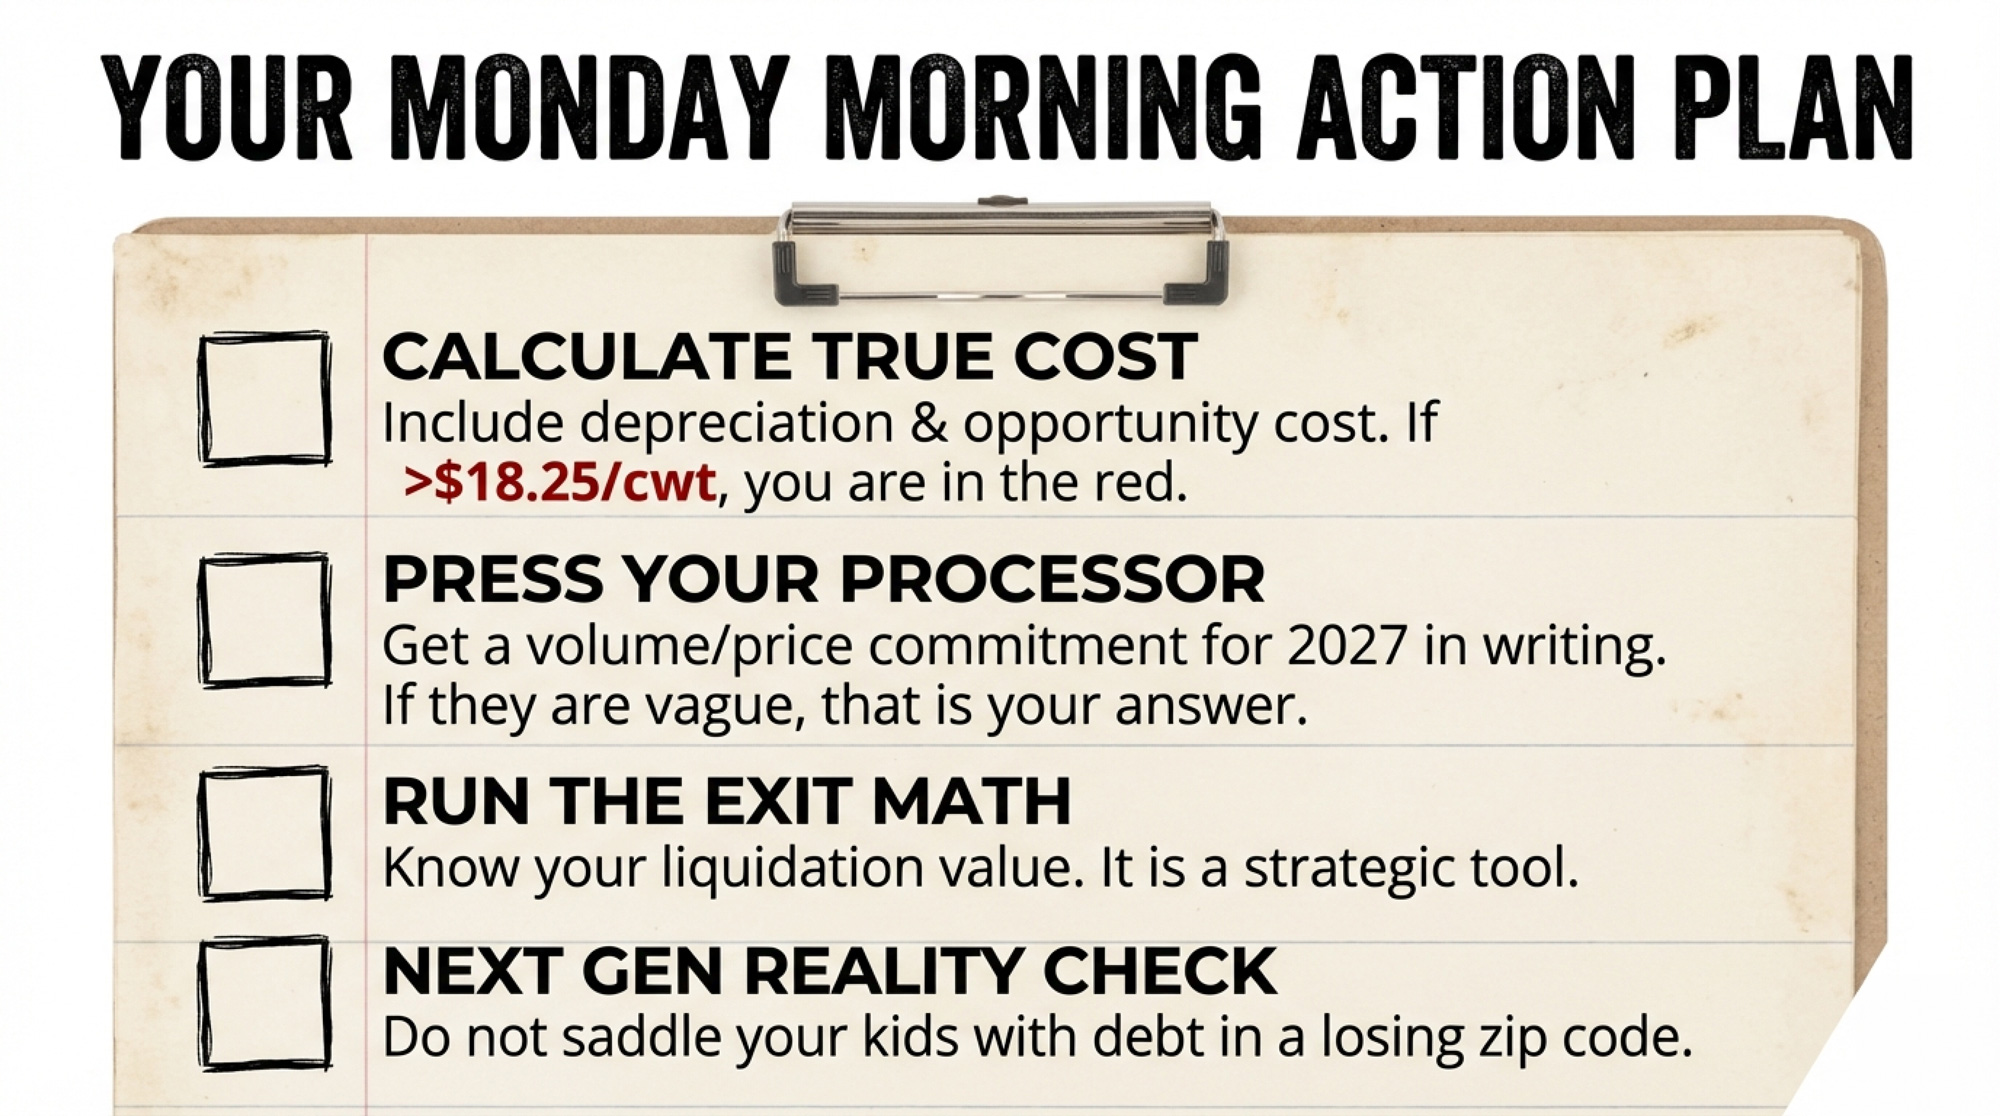
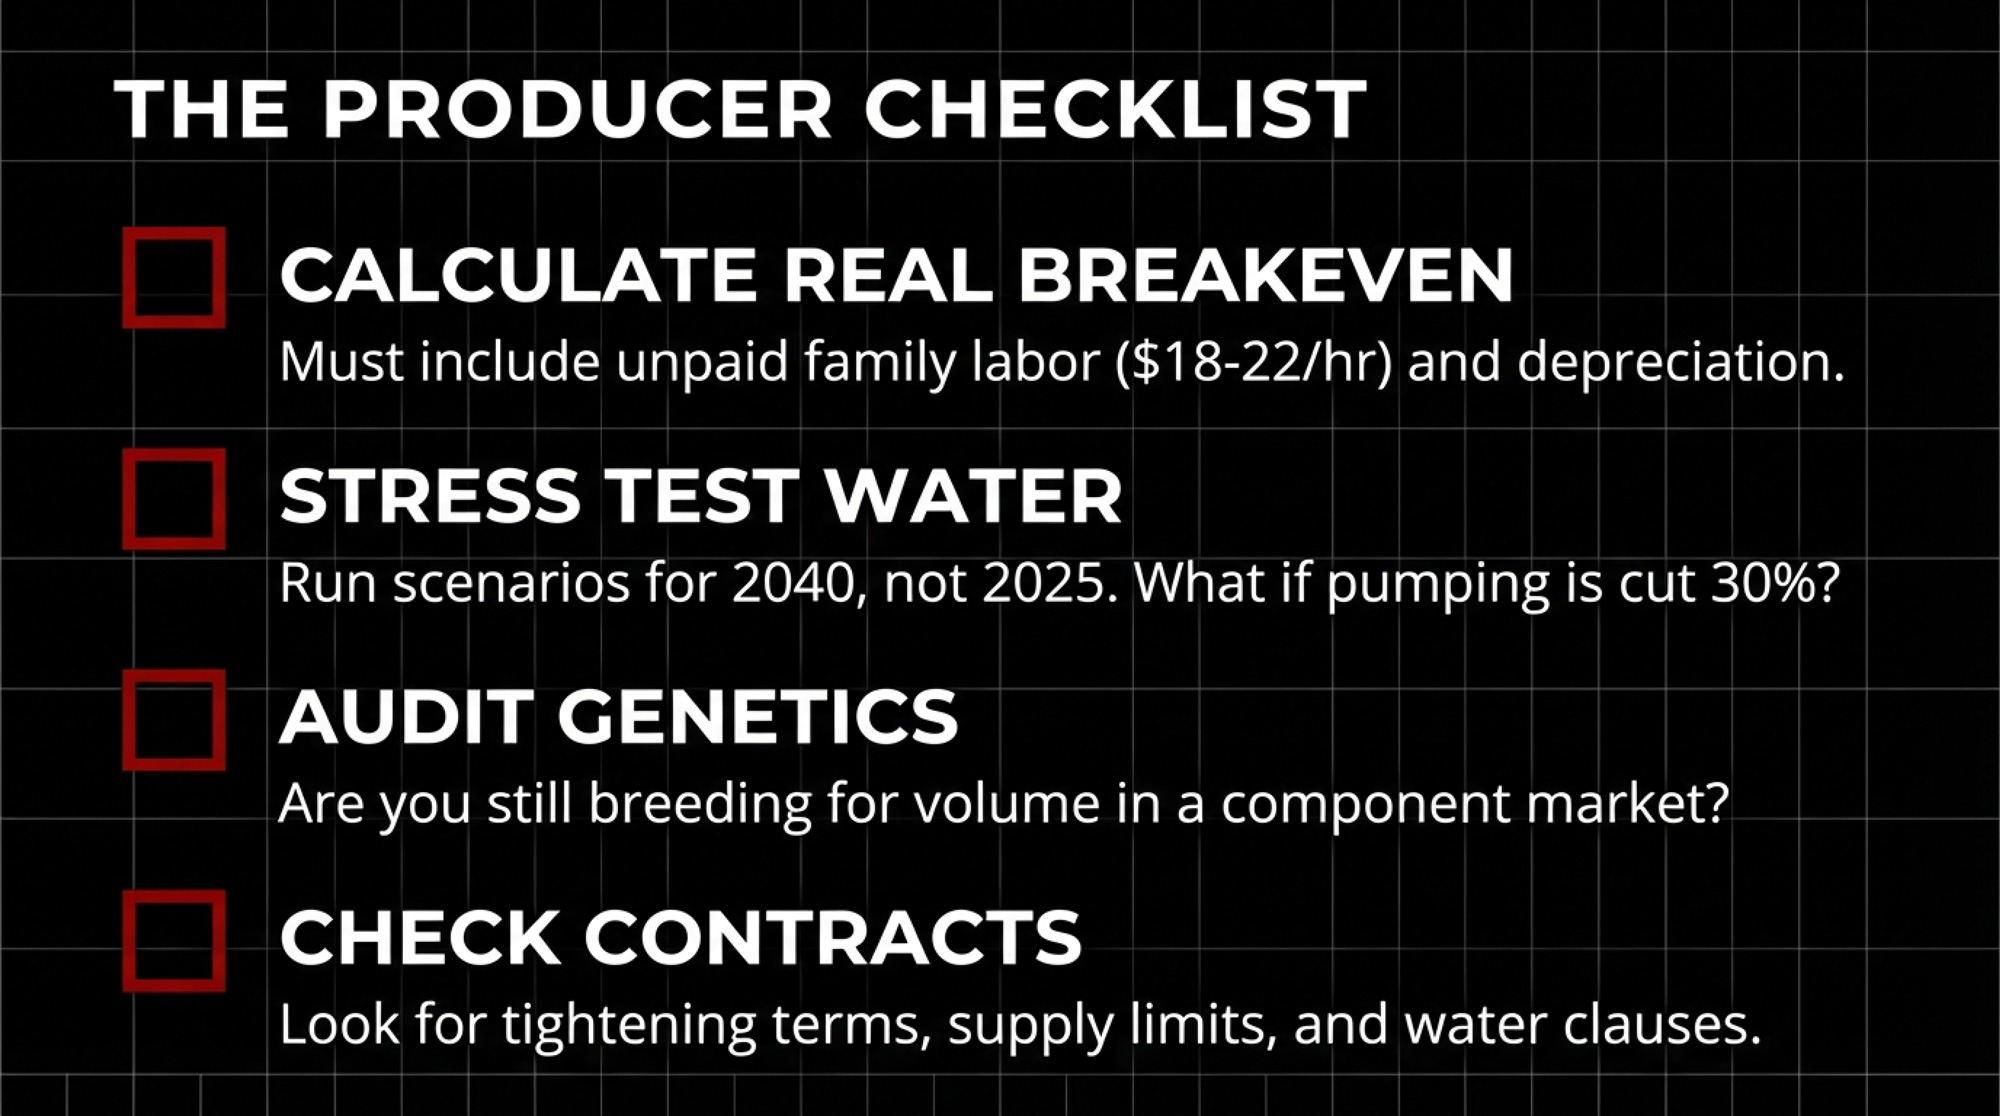
Whatever path fits, do these things now:
- Run your actual cost of production per cwt. Include depreciation, family labor at market rates, and the opportunity cost of equity. USDA ERS’s January 2026 outlook projects 2026 all-milk at $18.25/cwt, but Class III futures have slid to $16.35, and CME block cheddar just hit $1.2825 — its lowest since May 2020. If your all-in cost exceeds $18.25, you’re farming upside down. If it exceeds $16.35, the market is telling you something louder.
- Ask your processor one question—and get it in writing. Will they commit to your volume in 2027 at a price that covers your production costs? Tyler Reynolds is “hoping to expand, but the creamery hasn’t committed.” If the answer is vague, it’s an answer.
- Run the exit math even if you never use it. Every year you farm at a loss, you’re spending a six-figure piece of your family’s net worth on the choice to keep milking in a place the economics have moved past. That might be the right call. It should be a deliberate one.
- Factor in the next generation before you commit capital. Rick Naerebout shared that Idaho loses about 10% of its dairy membership a year, often because “the next generation, they see the parents struggling, so they’re not going to continue with farming.” That’s true everywhere. If your kids aren’t in, an expansion note is a bet with no one to carry it.
| Scenario | Annual Operating Loss | 5-Year Net Worth Impact | Exit Option: Sale Value (Today) | Expansion Option: Debt + Loss |
|---|---|---|---|---|
| Baseline (break-even) | $0 | $0 | — | — |
| Survival mode | –$100,000/year | –$500,000 | Preserve equity, redeploy | –$500K equity + $0 debt |
| Structural disadvantage | –$200,000/year | –$1,000,000 | Preserve equity, redeploy | –$1M equity + $3–$5M expansion debt |
| Darigold scenario | –$300,000/year | –$1,500,000 | Preserve equity, redeploy | –$1.5M equity + $3–$5M expansion debt |
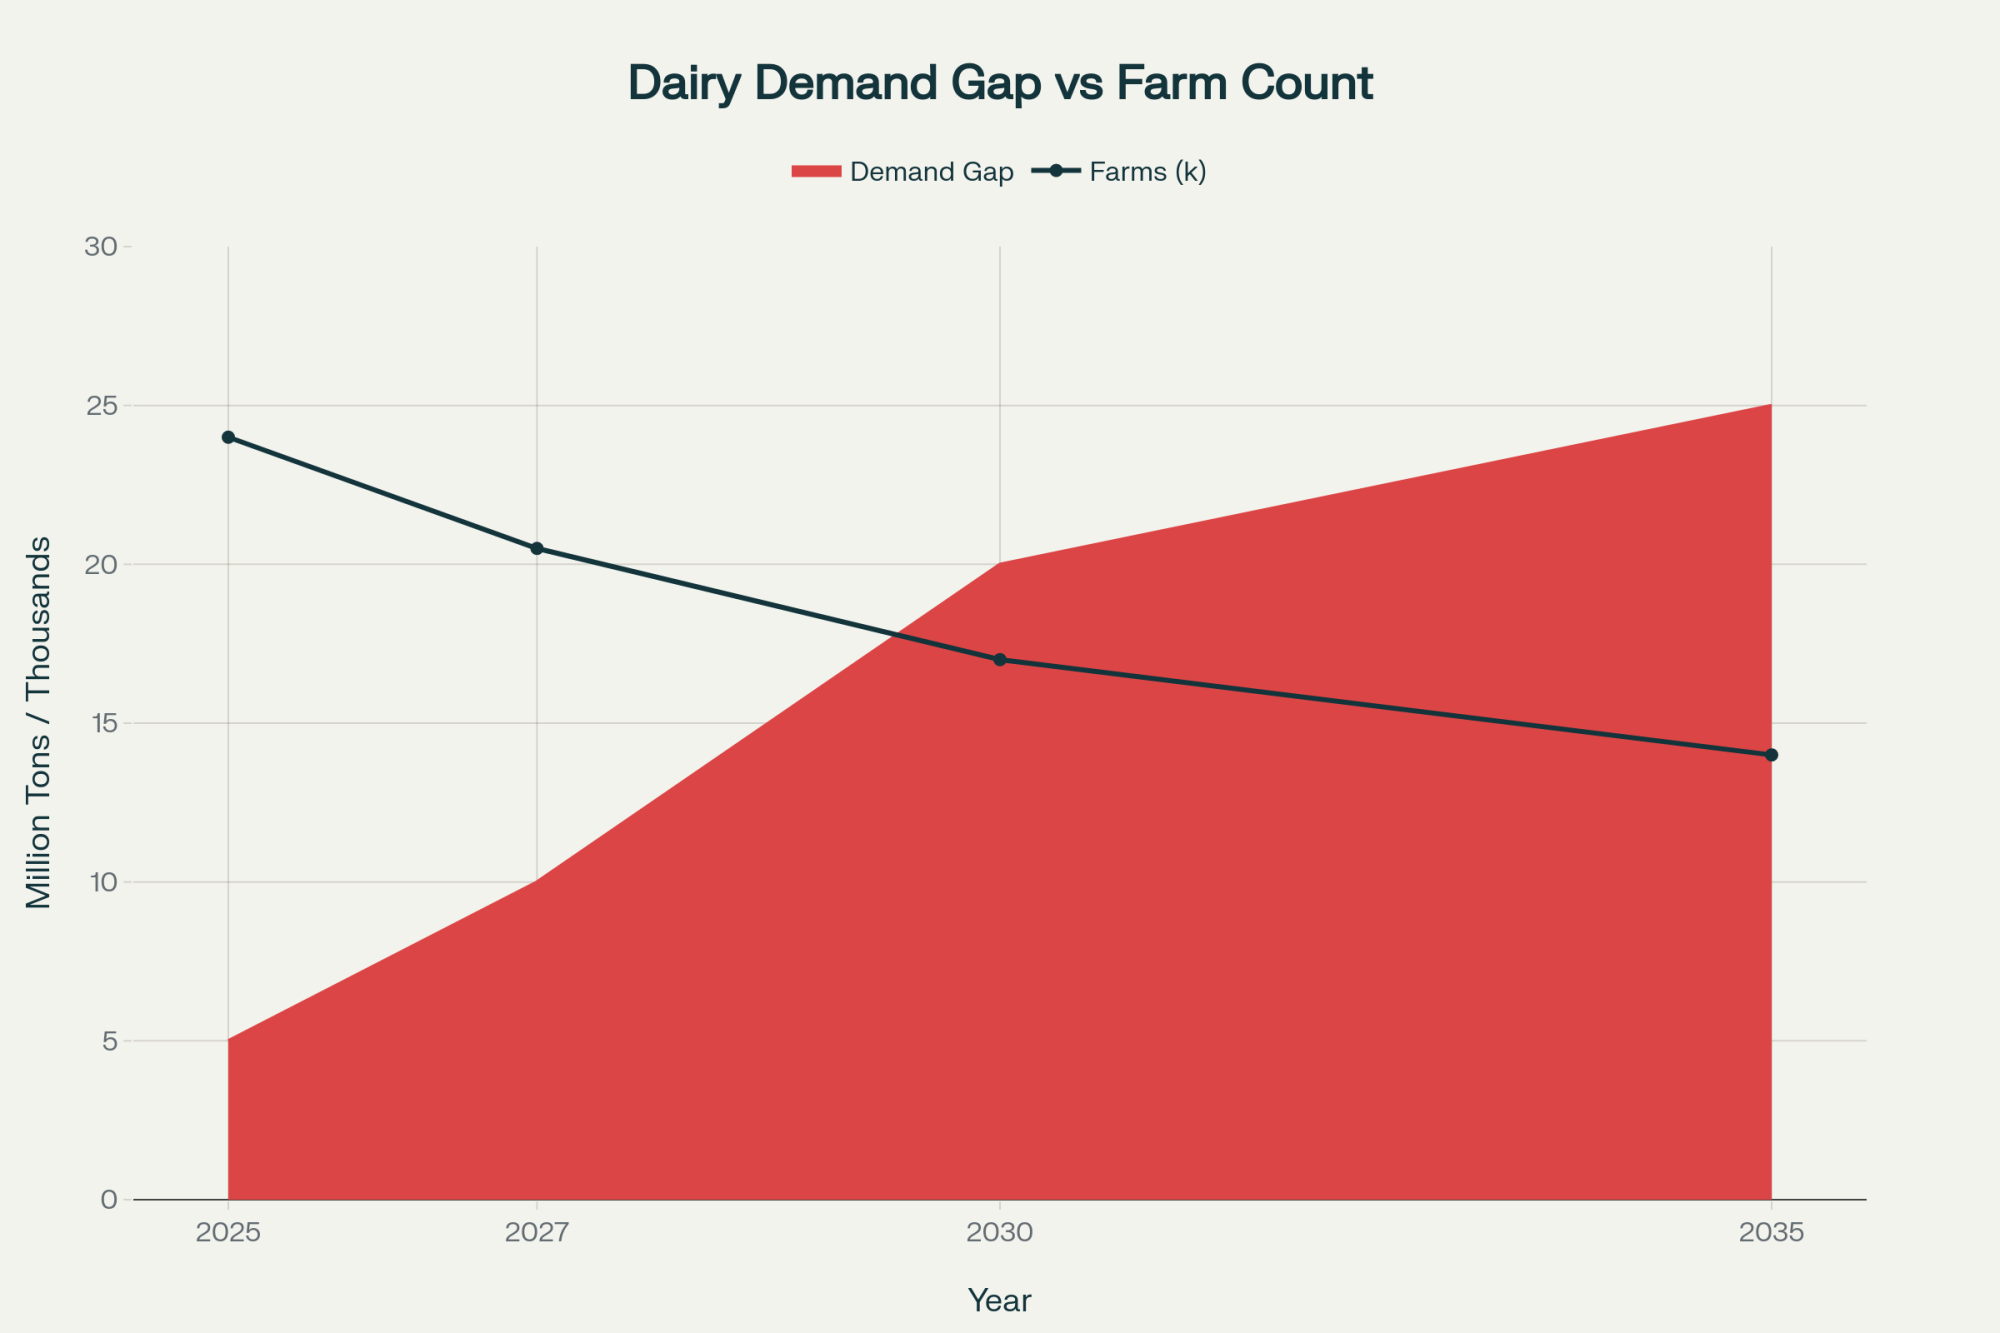
The Gap That Isn’t Going Away
What separates the Reynolds family’s trajectory from the Kirchers’ decade of tough economics isn’t effort, intelligence, or cow quality. It’s the cost of hay, the labor code, and the processing flywheel — three forces no individual farmer chose but every individual farmer lives with.
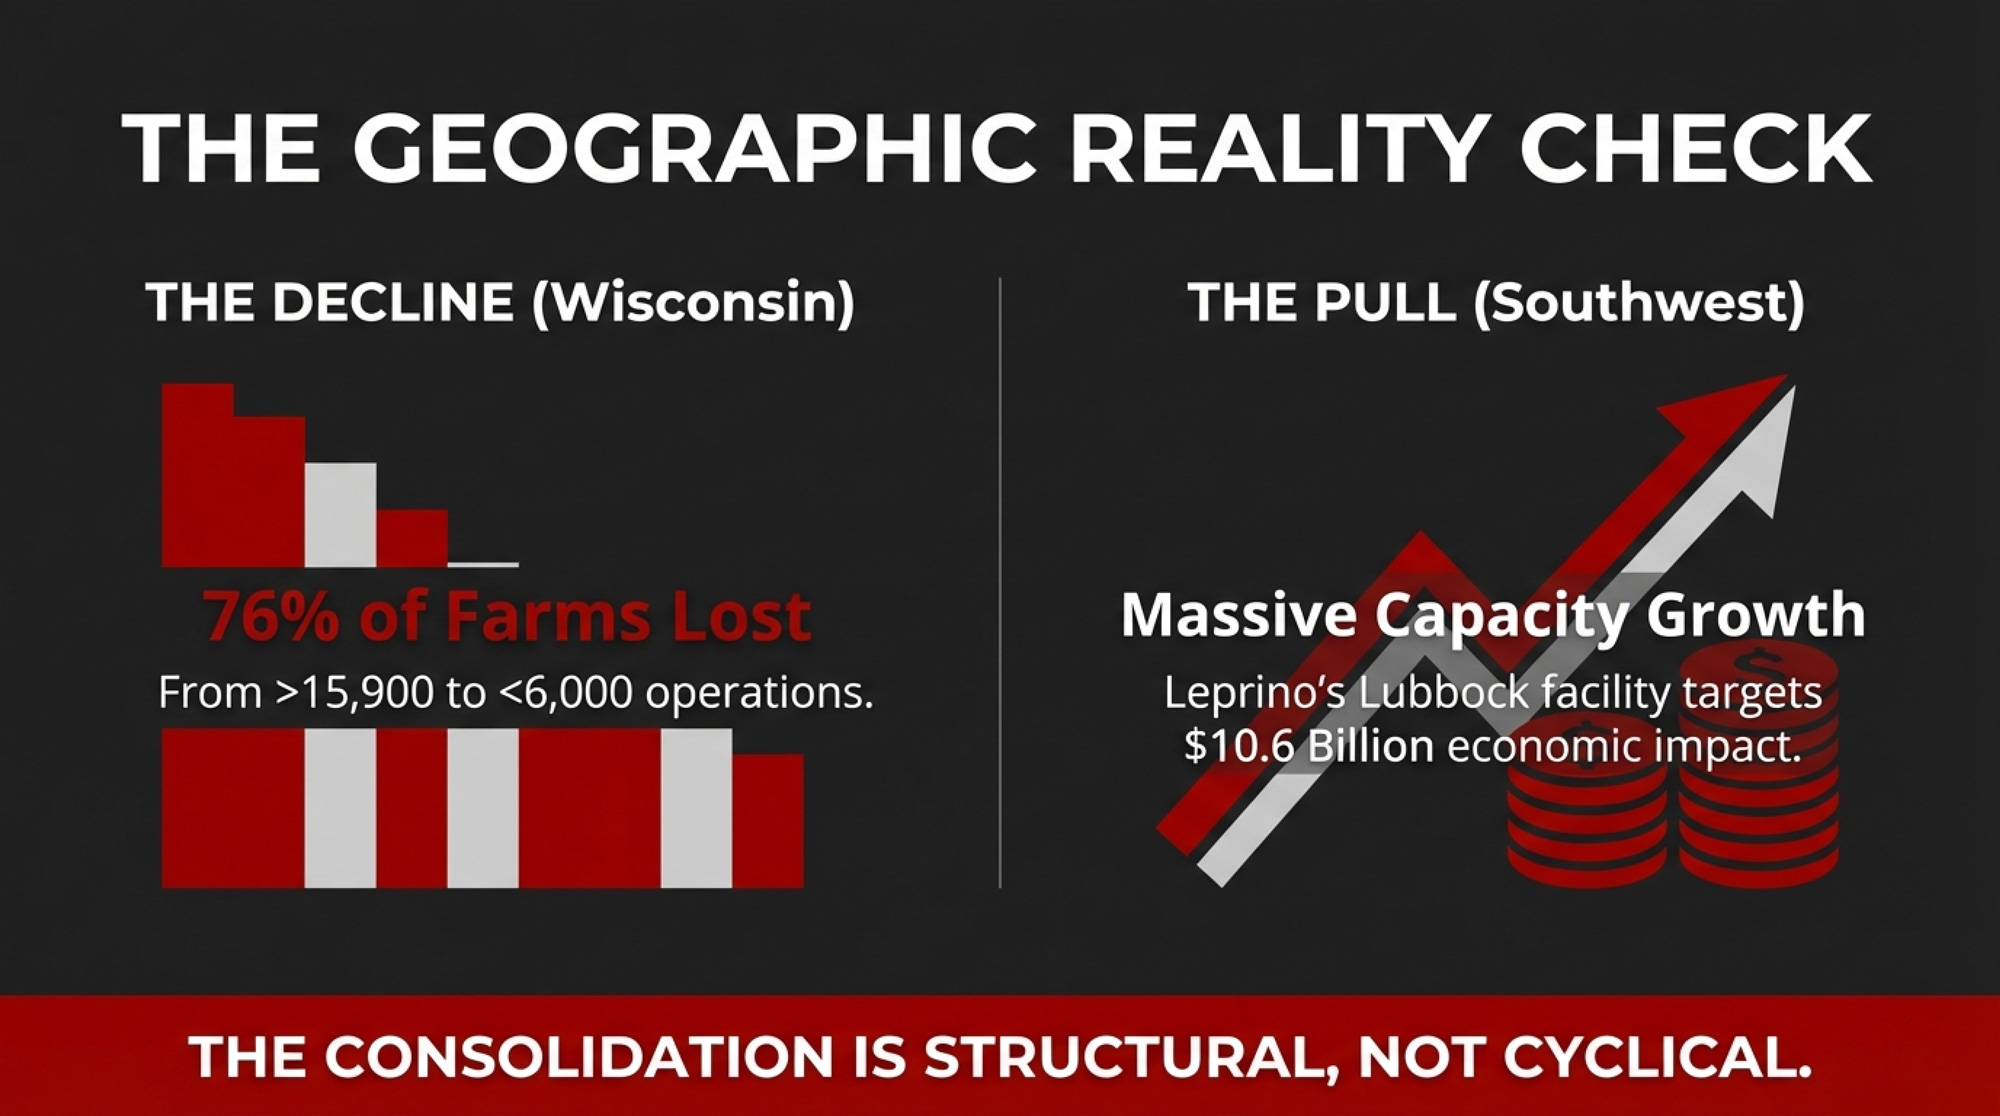
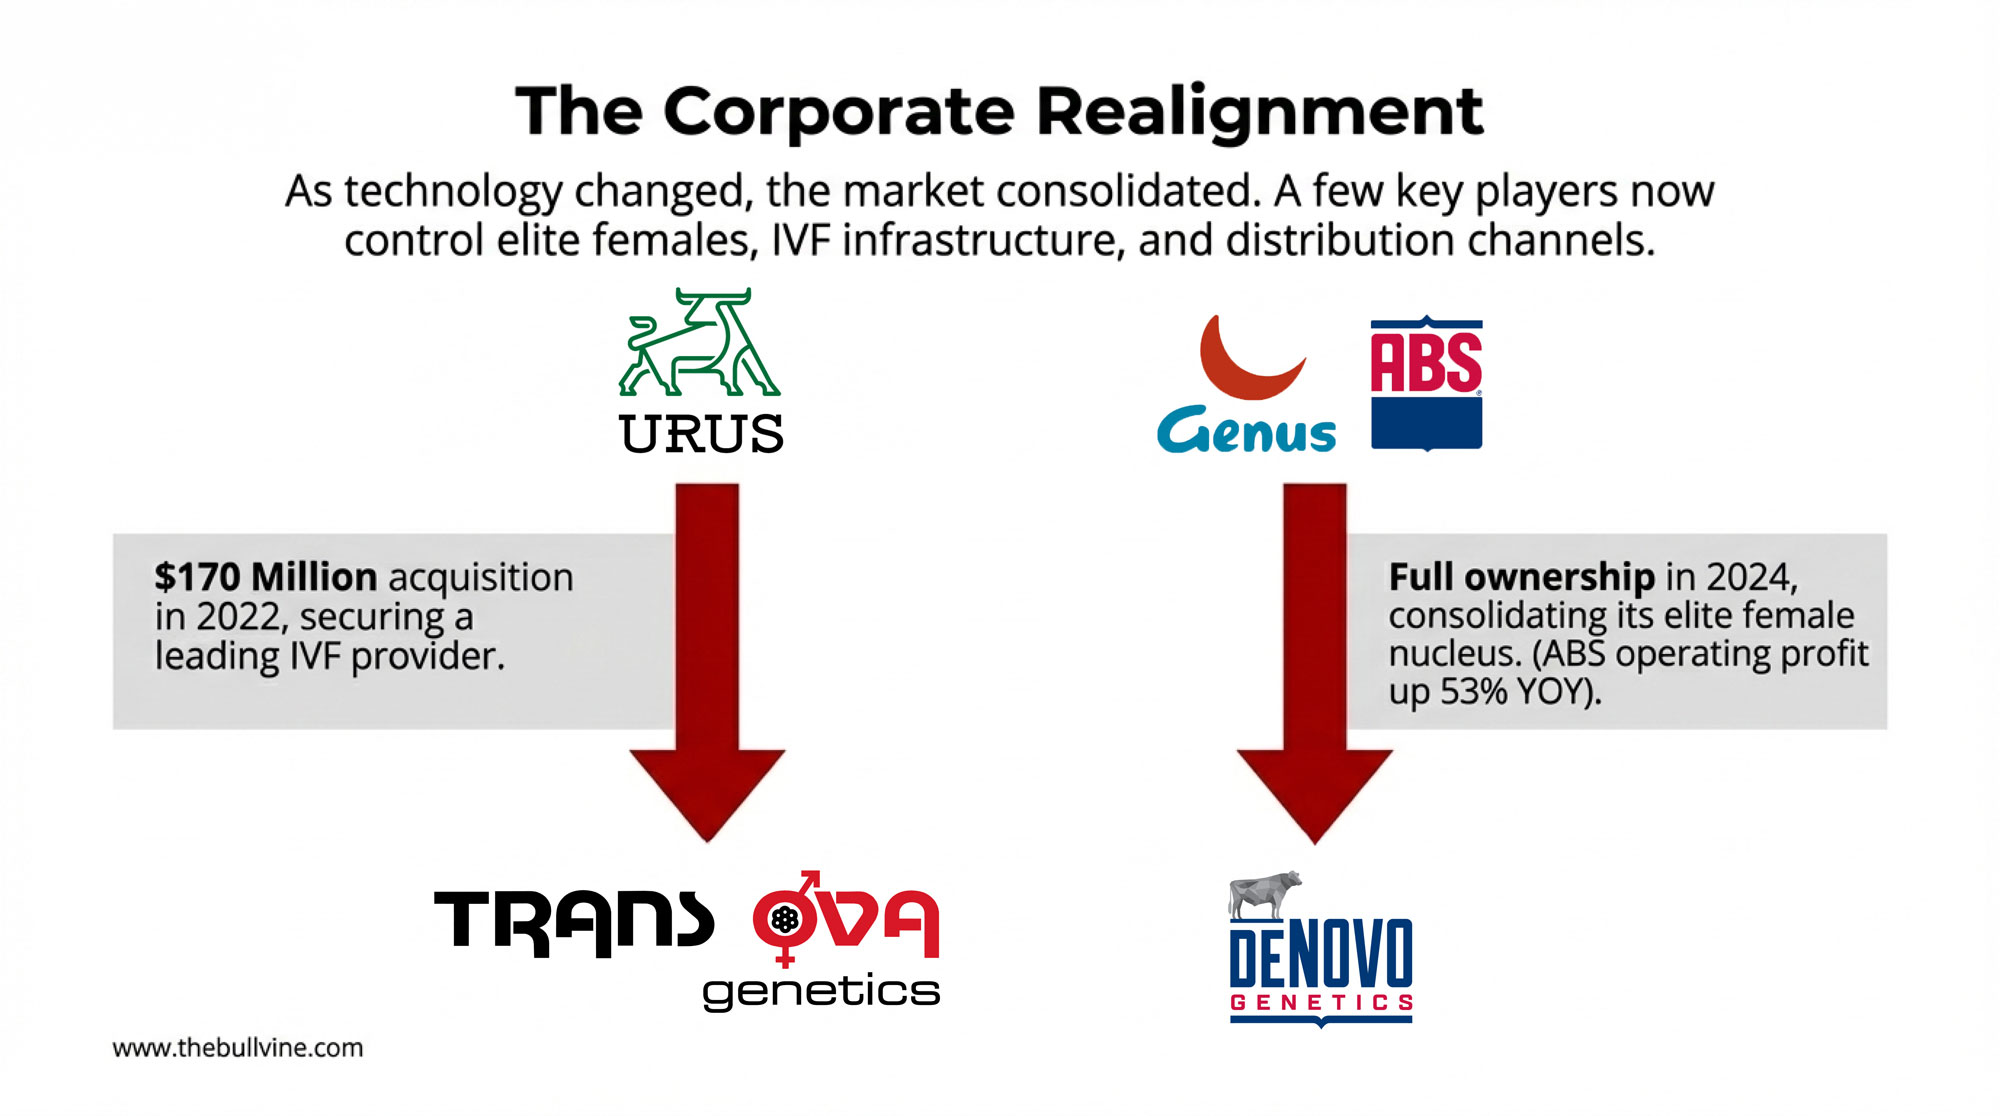
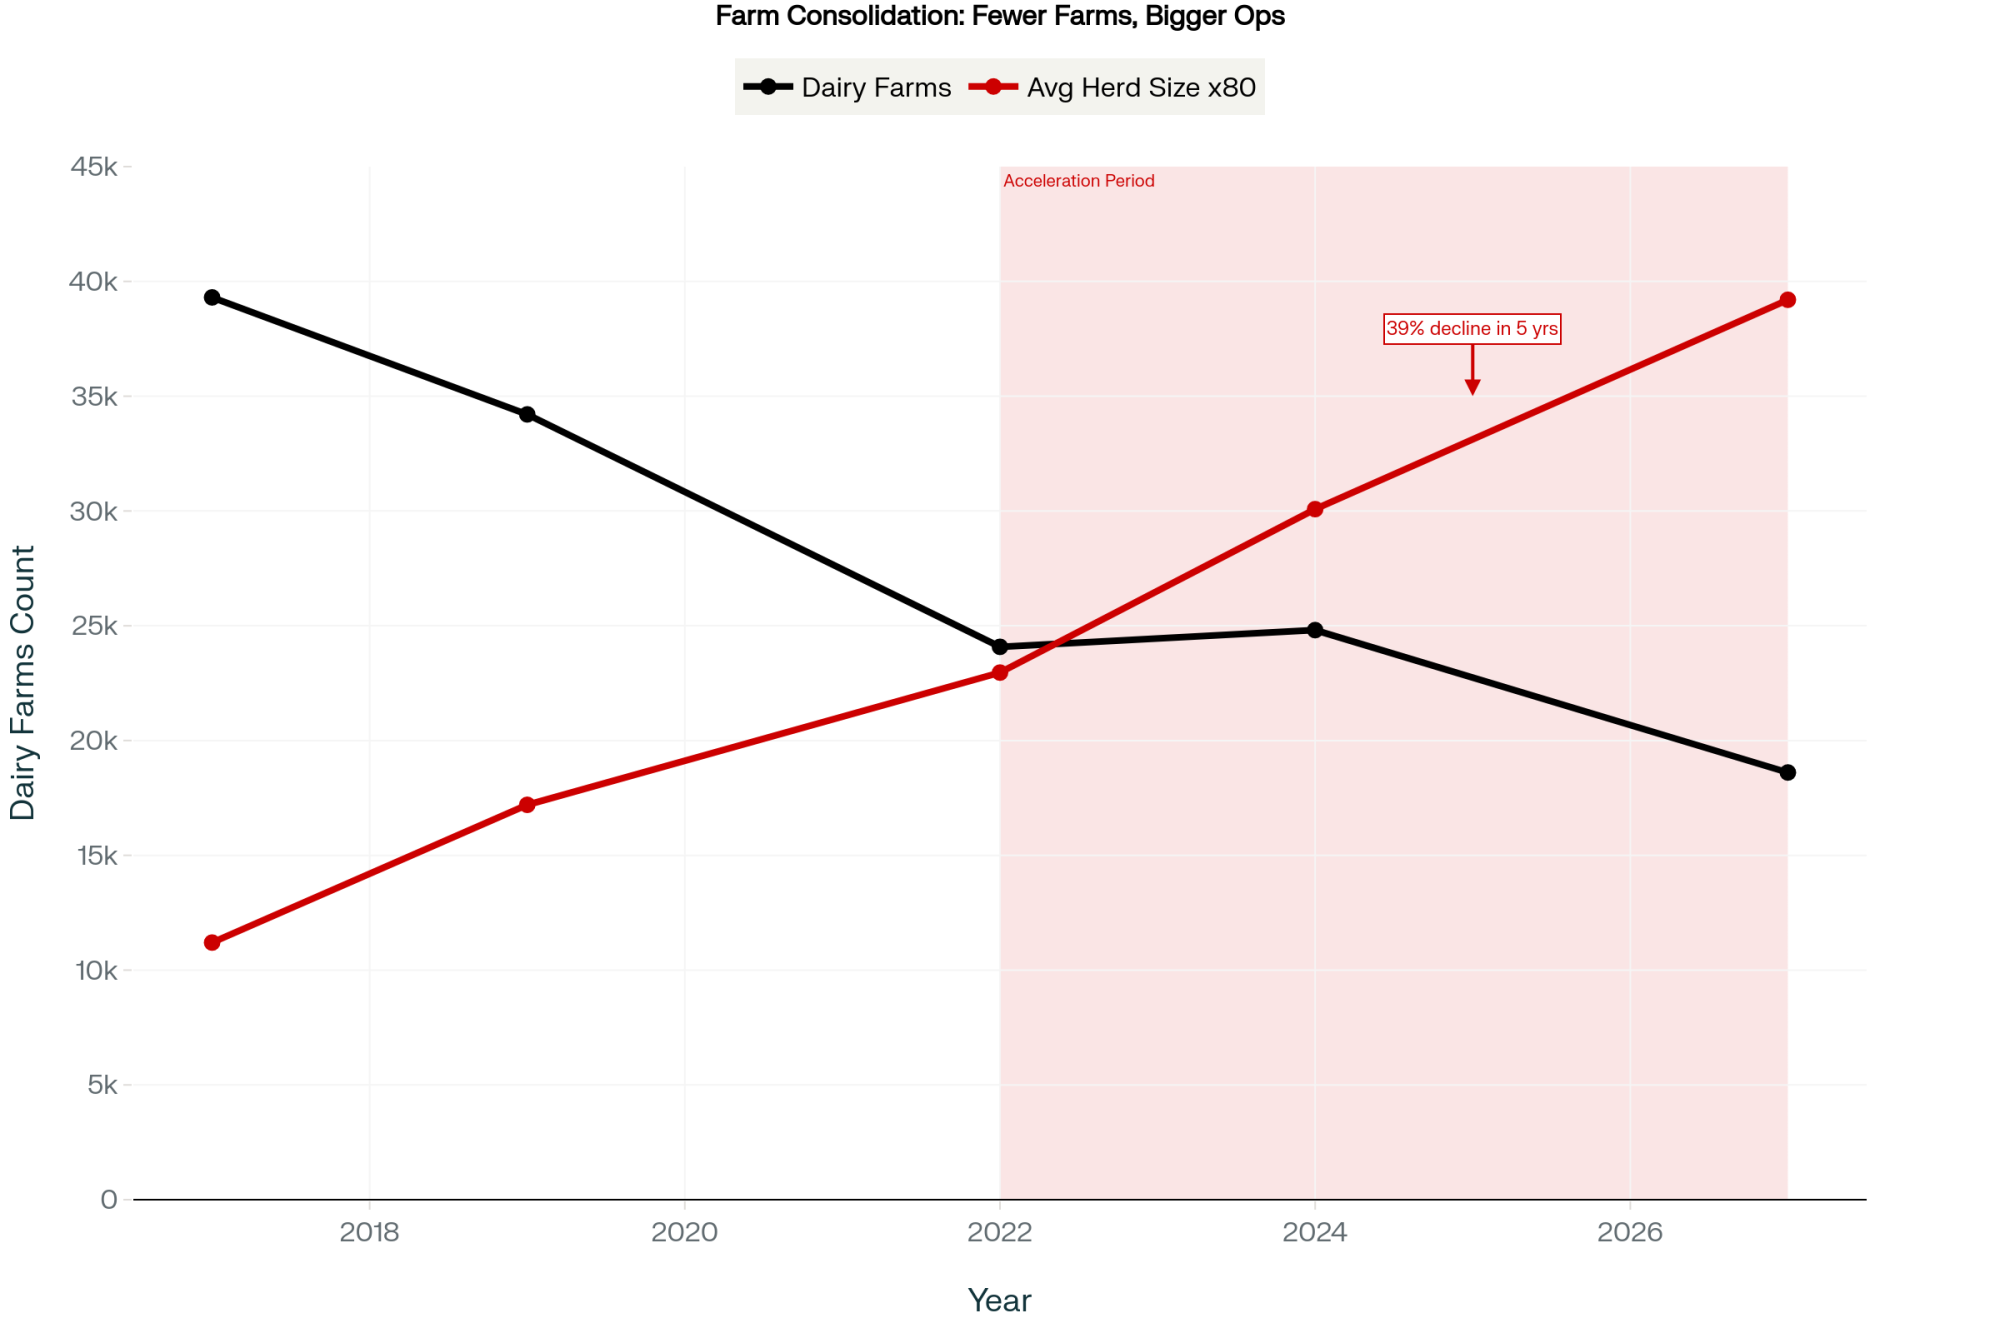
That’s the real driver behind dairy consolidation in the West — the gap between regions now exceeds the gap between the best and worst operators within a region. As far back as 2019, Rick Naerebout wrote in Hoard’s Dairyman that Idaho’s 10 largest owners/partnerships milked 32% of the state’s cows, and the top 20 milked 47%. Those shares have almost certainly grown since. The farms that survive and the farms that grow aren’t necessarily the best-managed ones. They’re the ones sitting on the right side of the structural math.
The numbers don’t care about legacy.
Jason Vander Kooy, watching what he estimates as a decline from around 80 dairy farms in Skagit Valley to roughly 10 over the past two decades, put it in terms that cut through any spreadsheet: “We can trace back dairy farming in our family before Christopher Columbus in Europe. I don’t want to be the last generation, so we’re going to make a go of it” (Capital Press, May 28, 2025).
The families who make their next move based on where the structural math is going — not where their grandfather’s fence line sits — are the ones who’ll still be milking in 2035.
Dig in, pivot, or move. But whatever you do, do it on purpose.
Key Takeaways
- Where you milk now matters as much as how you milk: Idaho’s cheap hay and no ag overtime create a $3.10–$4.25/cwt advantage — over $600,000/year on a 1,000-cow herd in feed and labor alone.
- Processors are picking winners and losers: Idaho adds capacity with Chobani, Idaho Milk Products, High Desert Milk, and CAFE, while Darigold’s $300 million Pasco overrun and $4.00/cwt deductions pushed many Washington members into survival mode.
- Premium doesn’t erase geography; Forest Glen’s 2,200-cow organic A2 Jersey herd with grazing, contracts, and a digester still fights 2014-level milk prices under 2026-level costs.
- If you’re in a high-cost region, your real choices are to invest heavily in automation, double down on ultra-premium contracts, or design a relocation/exit plan now instead of letting the bank decide later.
- Genetics is no longer a side note: CDCB’s 2025 Net Merit shift toward Feed Saved and fat turns sire selection into a survival tool for high-cost herds, not just a way to chase show-ring banners.
Complete references and supporting documentation are available upon request by contacting the editorial team at editor@thebullvine.com.
Learn More
- Feed Smart: Cutting Costs Without Compromising Cows in 2025 – Stop throwing money into the manure pit with imprecise rations. This guide arms you with 2025 price forecasts and a true-cost calculation framework to slash feed expenses by 10% without sacrificing your peak milk curve.
- The Bullvine Dairy Curve: 15,000 U.S. Farms by 2035 and Under 10,000 by 2050 – Who’s Still Milking? – Don’t let the consolidation curve choose your future for you. This deep dive exposes the “15,000 farm” reality and delivers the strategic roadmap needed to position your equity for 2035 survival or a profitable exit.
- The Next Frontier: What’s Really Coming for Dairy Cattle Breeding (2025–2030) – Capture the 20% premiums offered by emerging “designer milk” markets. See how CRISPR and genomic markers for immunity can turn your herd into a high-margin lab that beats commodity price cycles and structural cost gaps.
 Join the Revolution!
 Join the Revolution!
Join over 30,000 successful dairy professionals who rely on Bullvine Weekly for their competitive edge. Delivered directly to your inbox each week, our exclusive industry insights help you make smarter decisions while saving precious hours every week. Never miss critical updates on milk production trends, breakthrough technologies, and profit-boosting strategies that top producers are already implementing. Subscribe now to transform your dairy operation’s efficiency and profitability—your future success is just one click away.