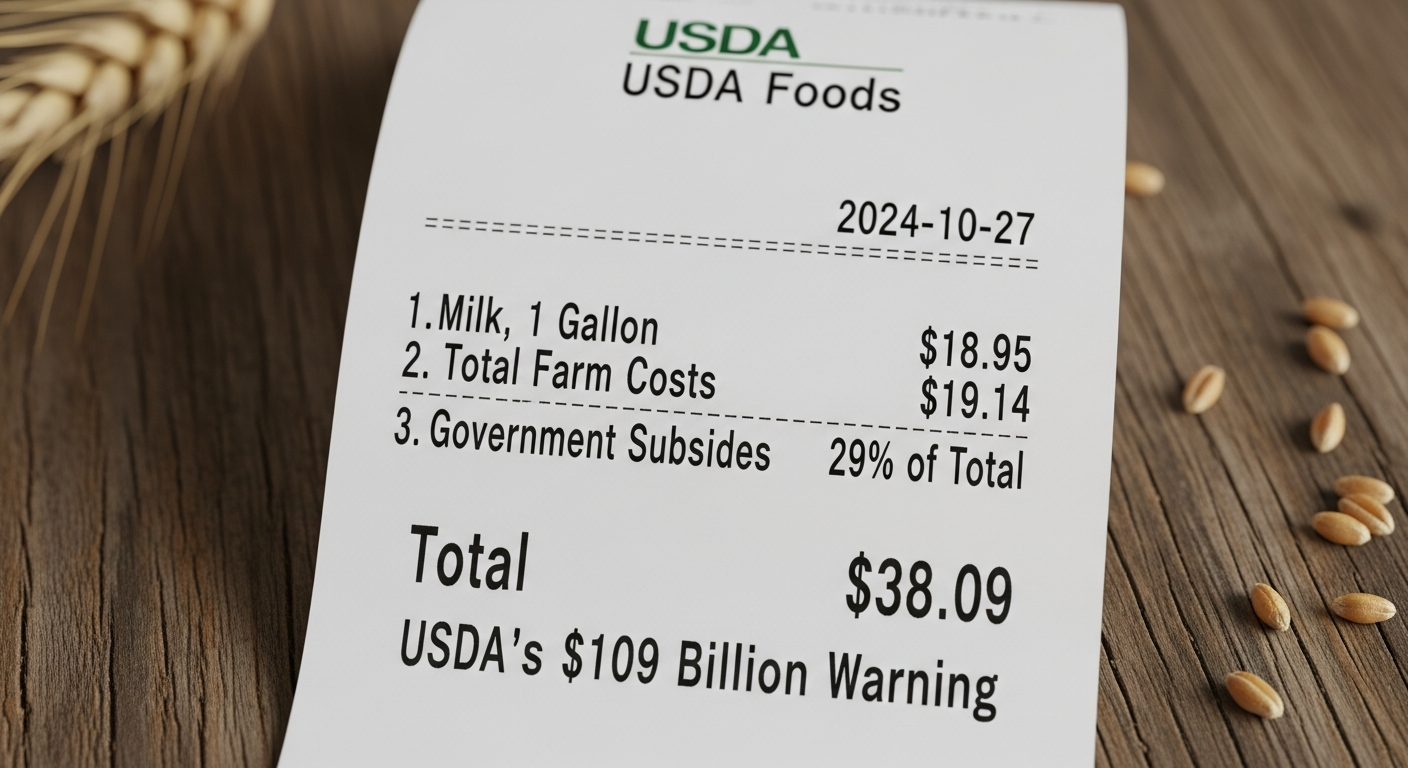
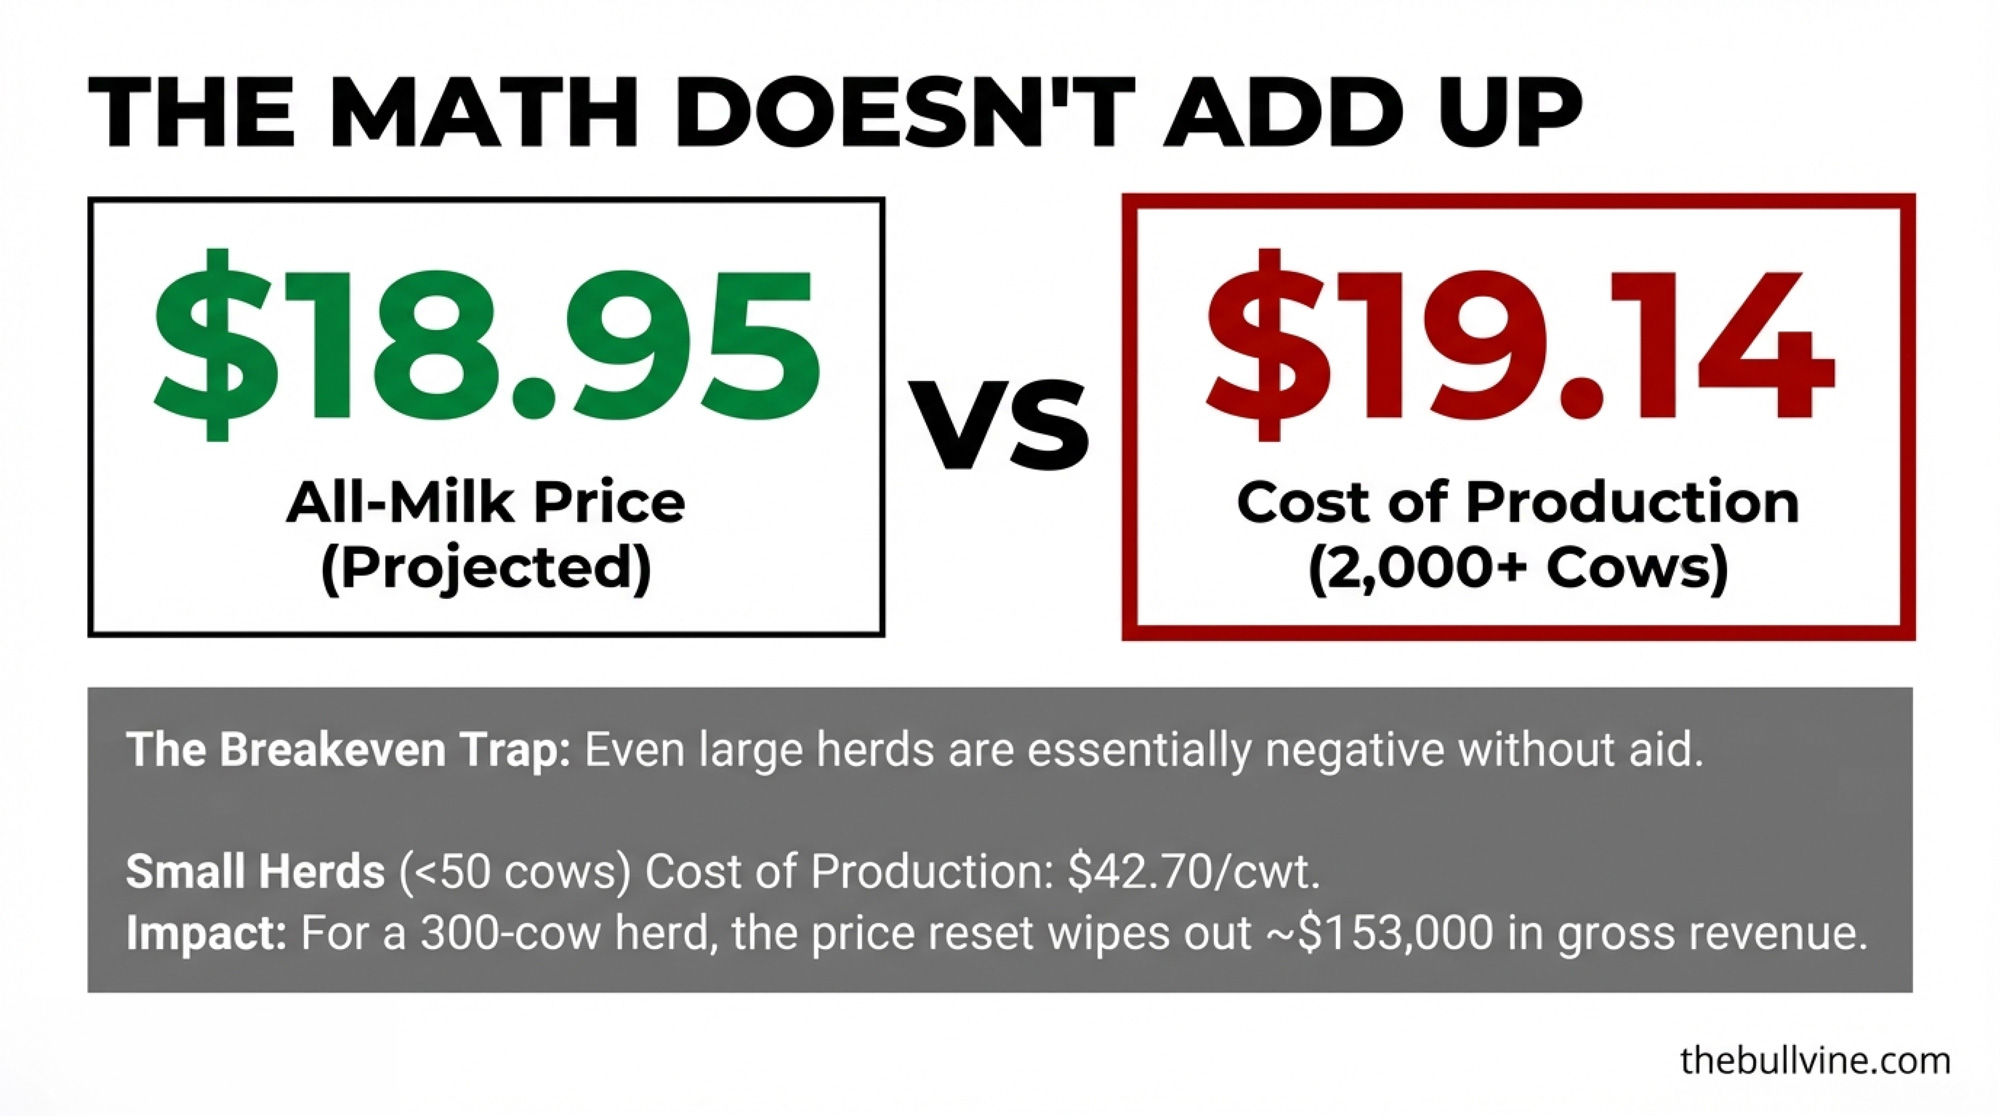
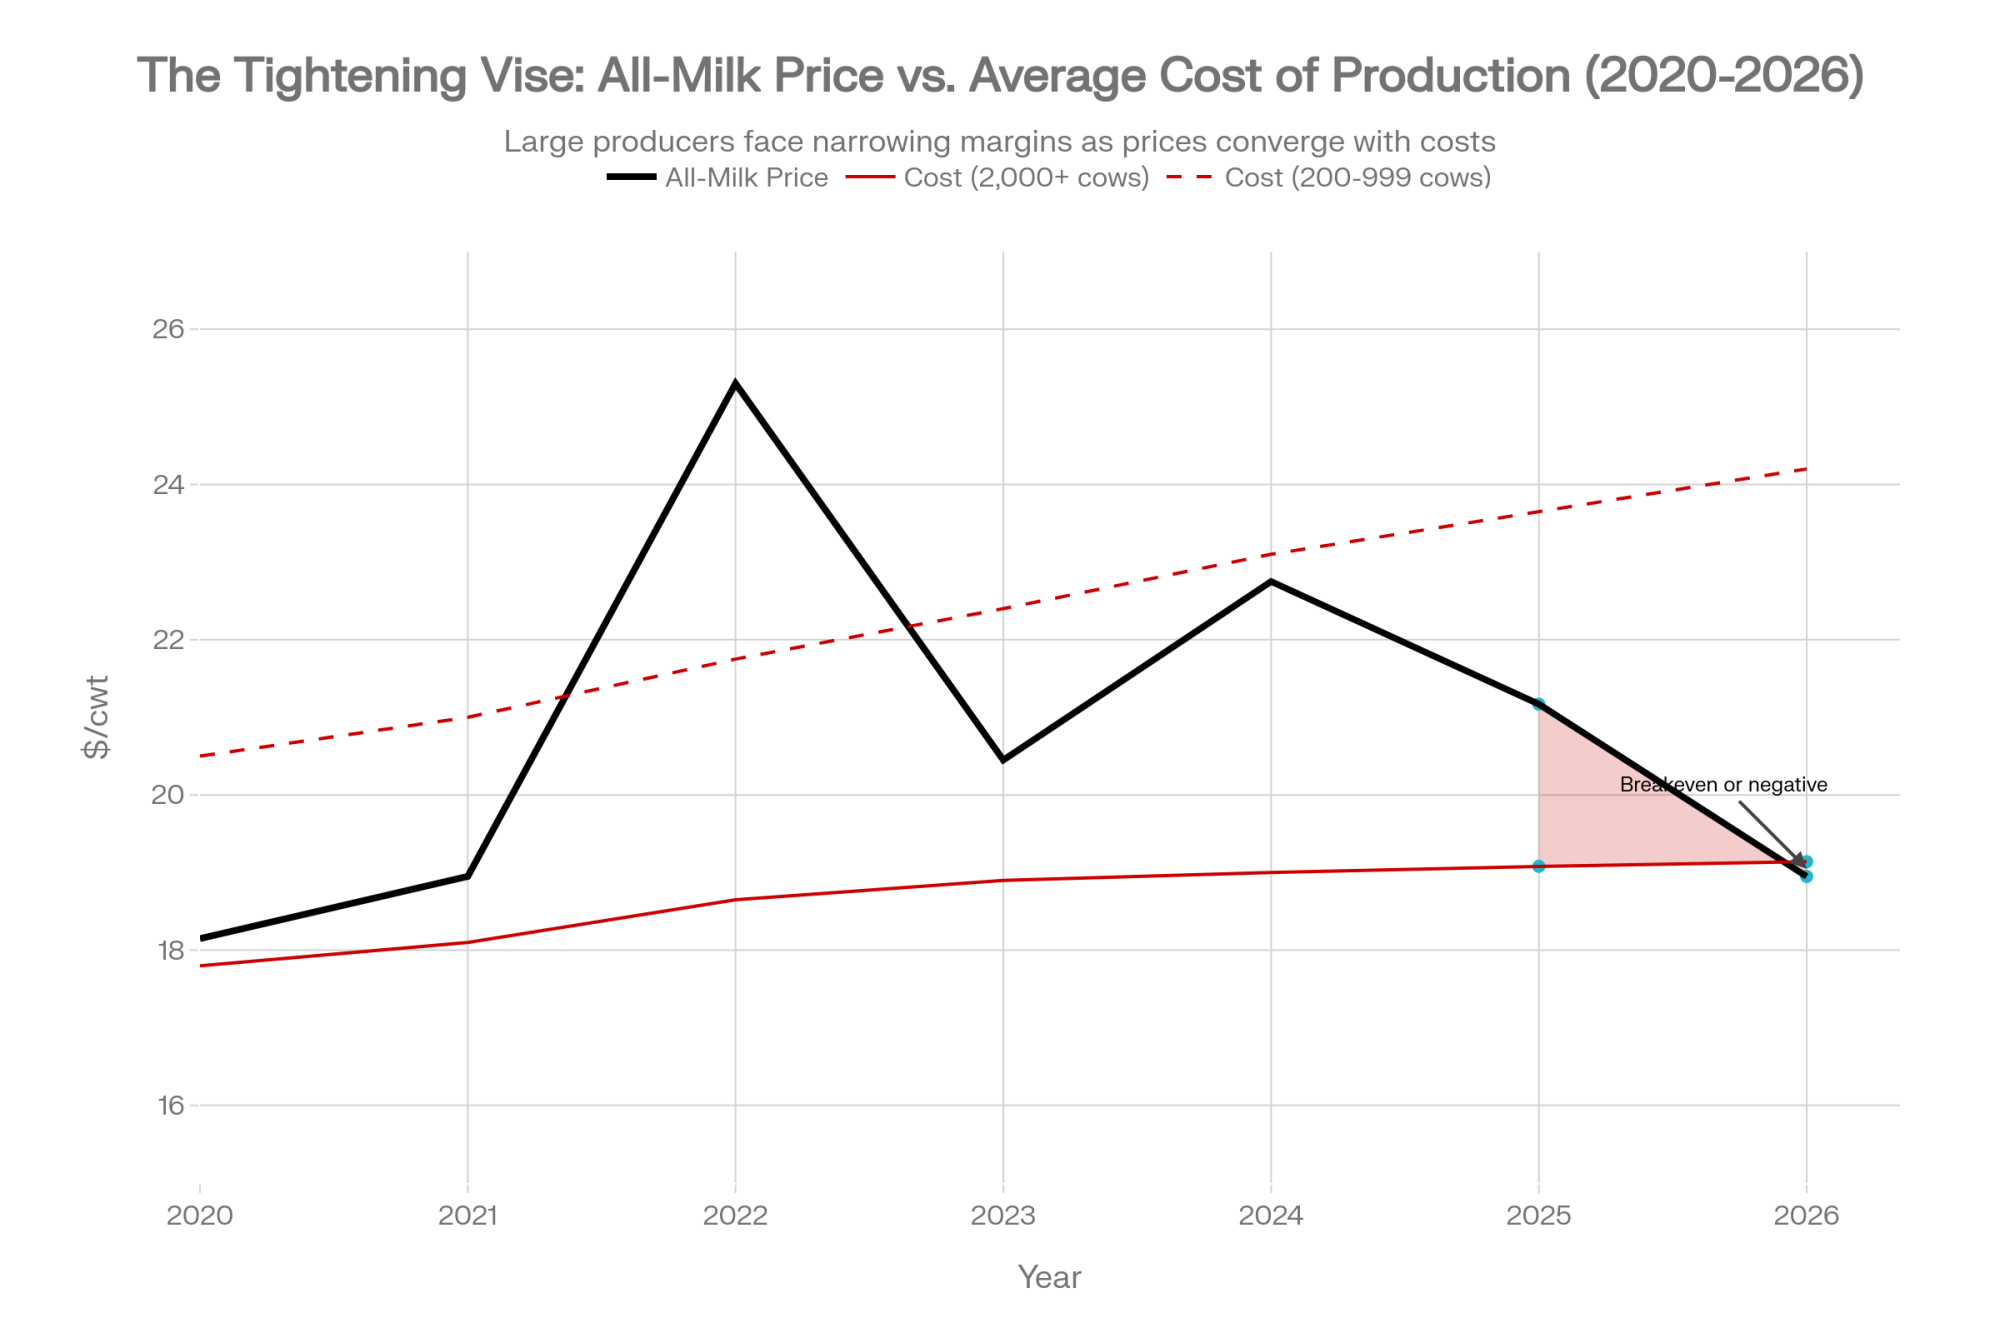
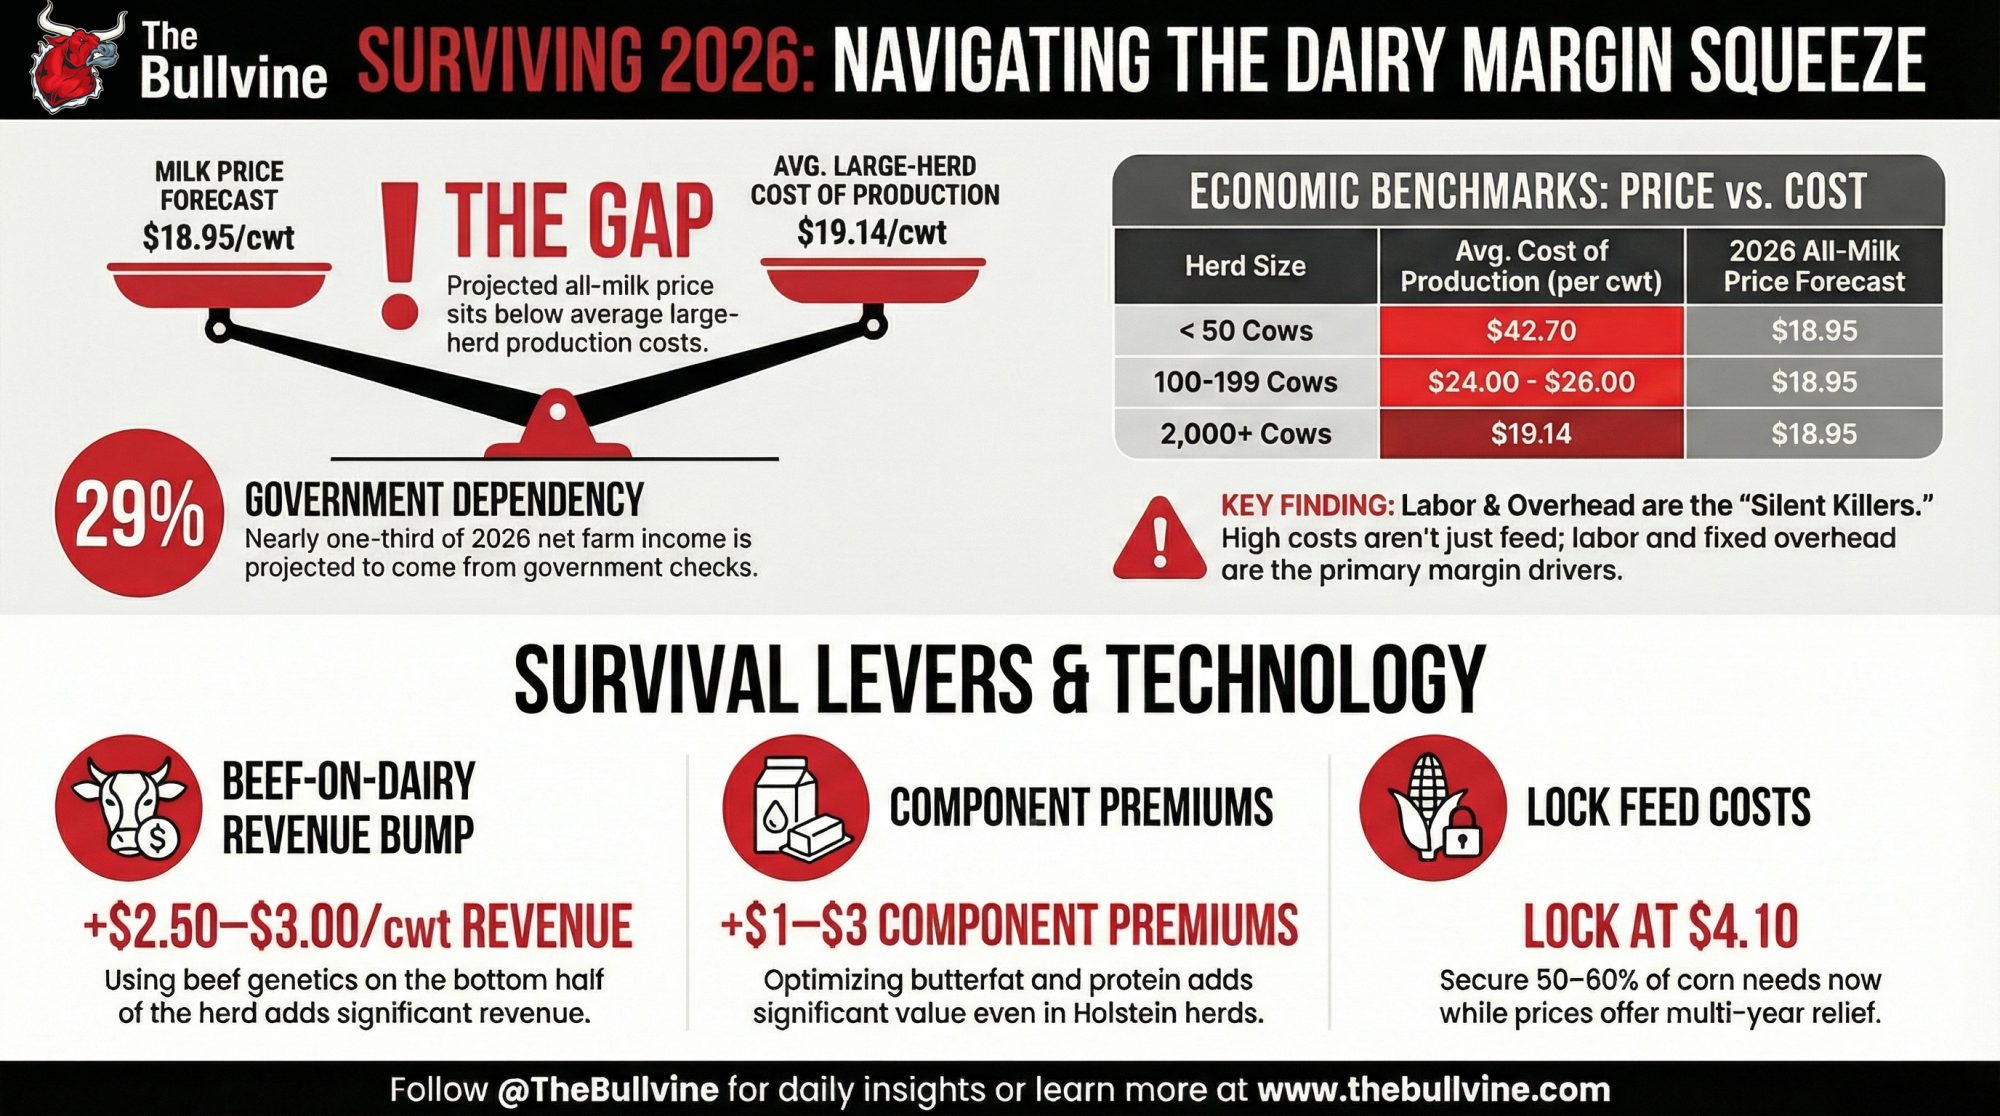
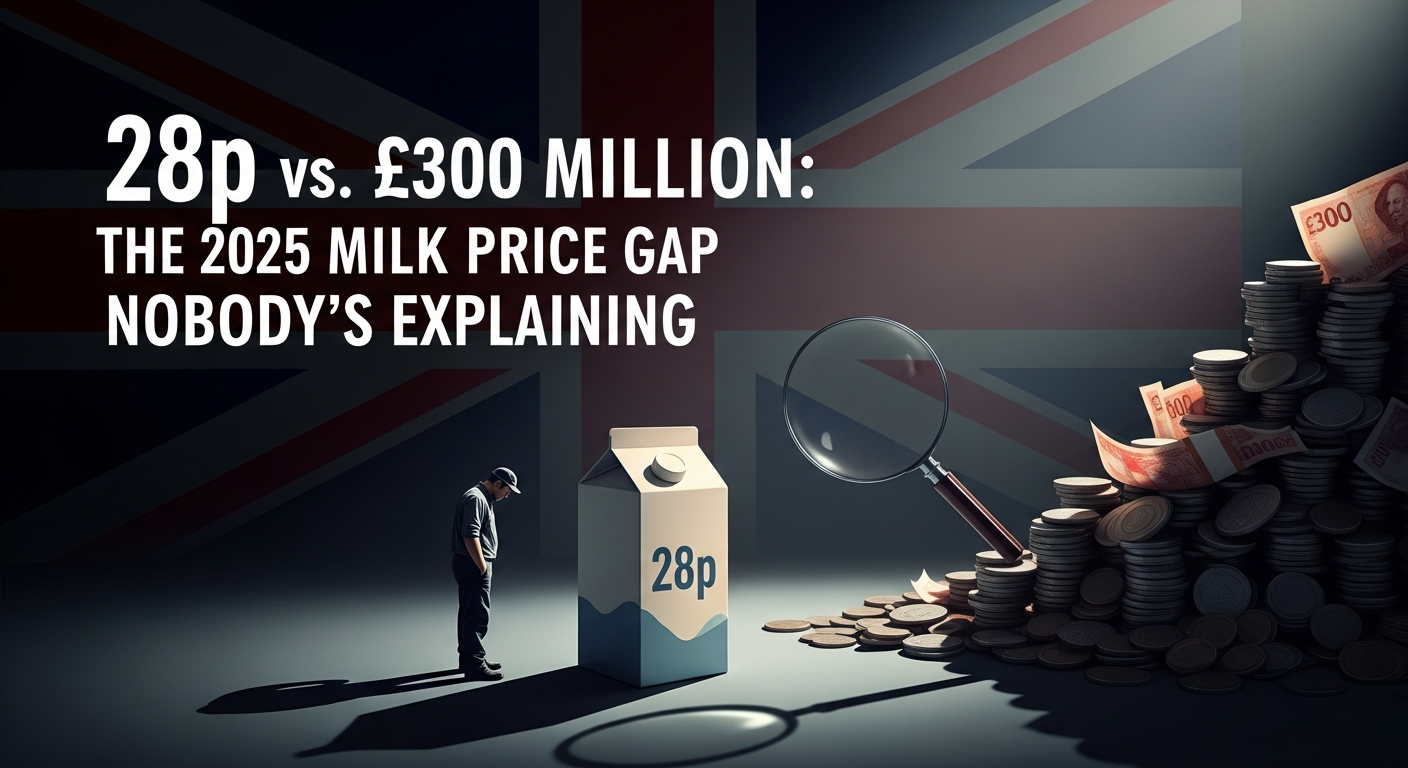
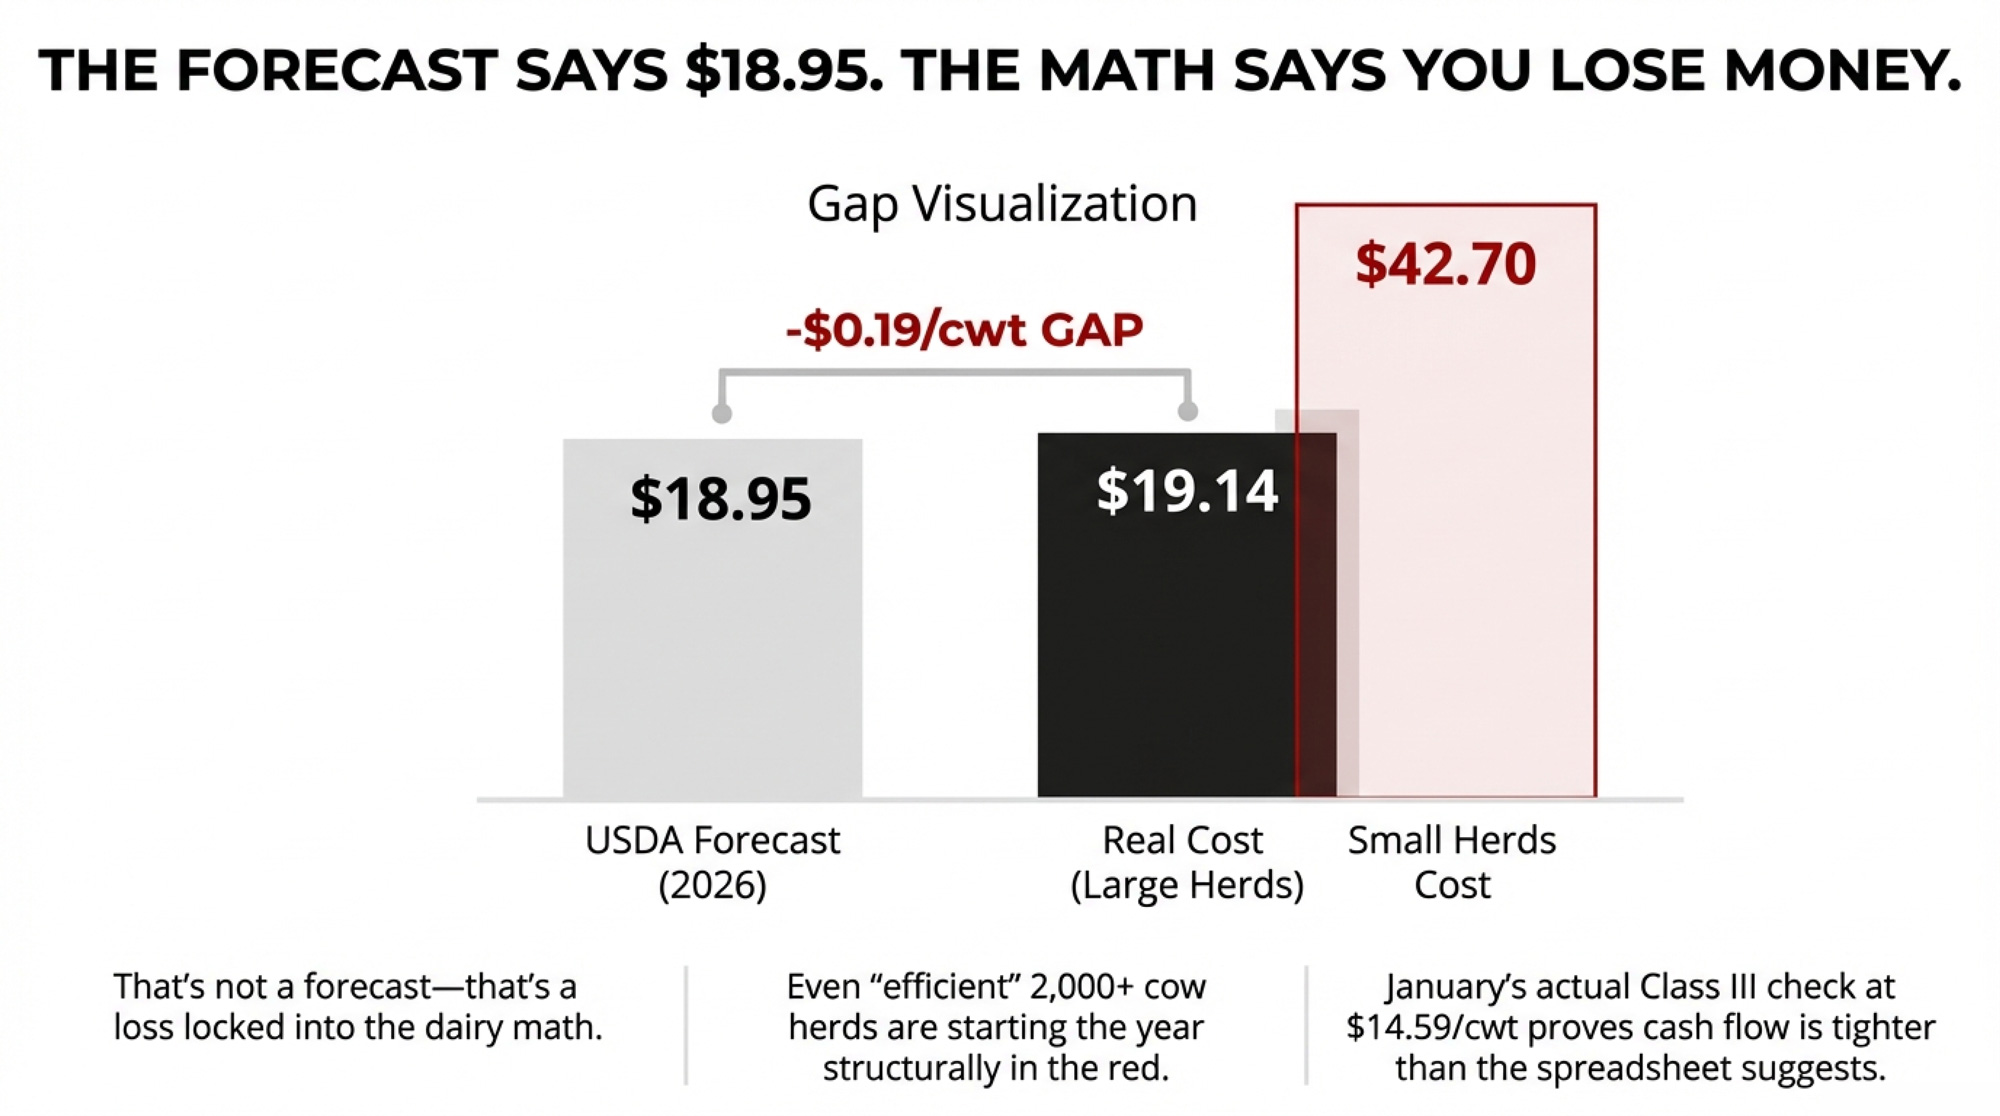
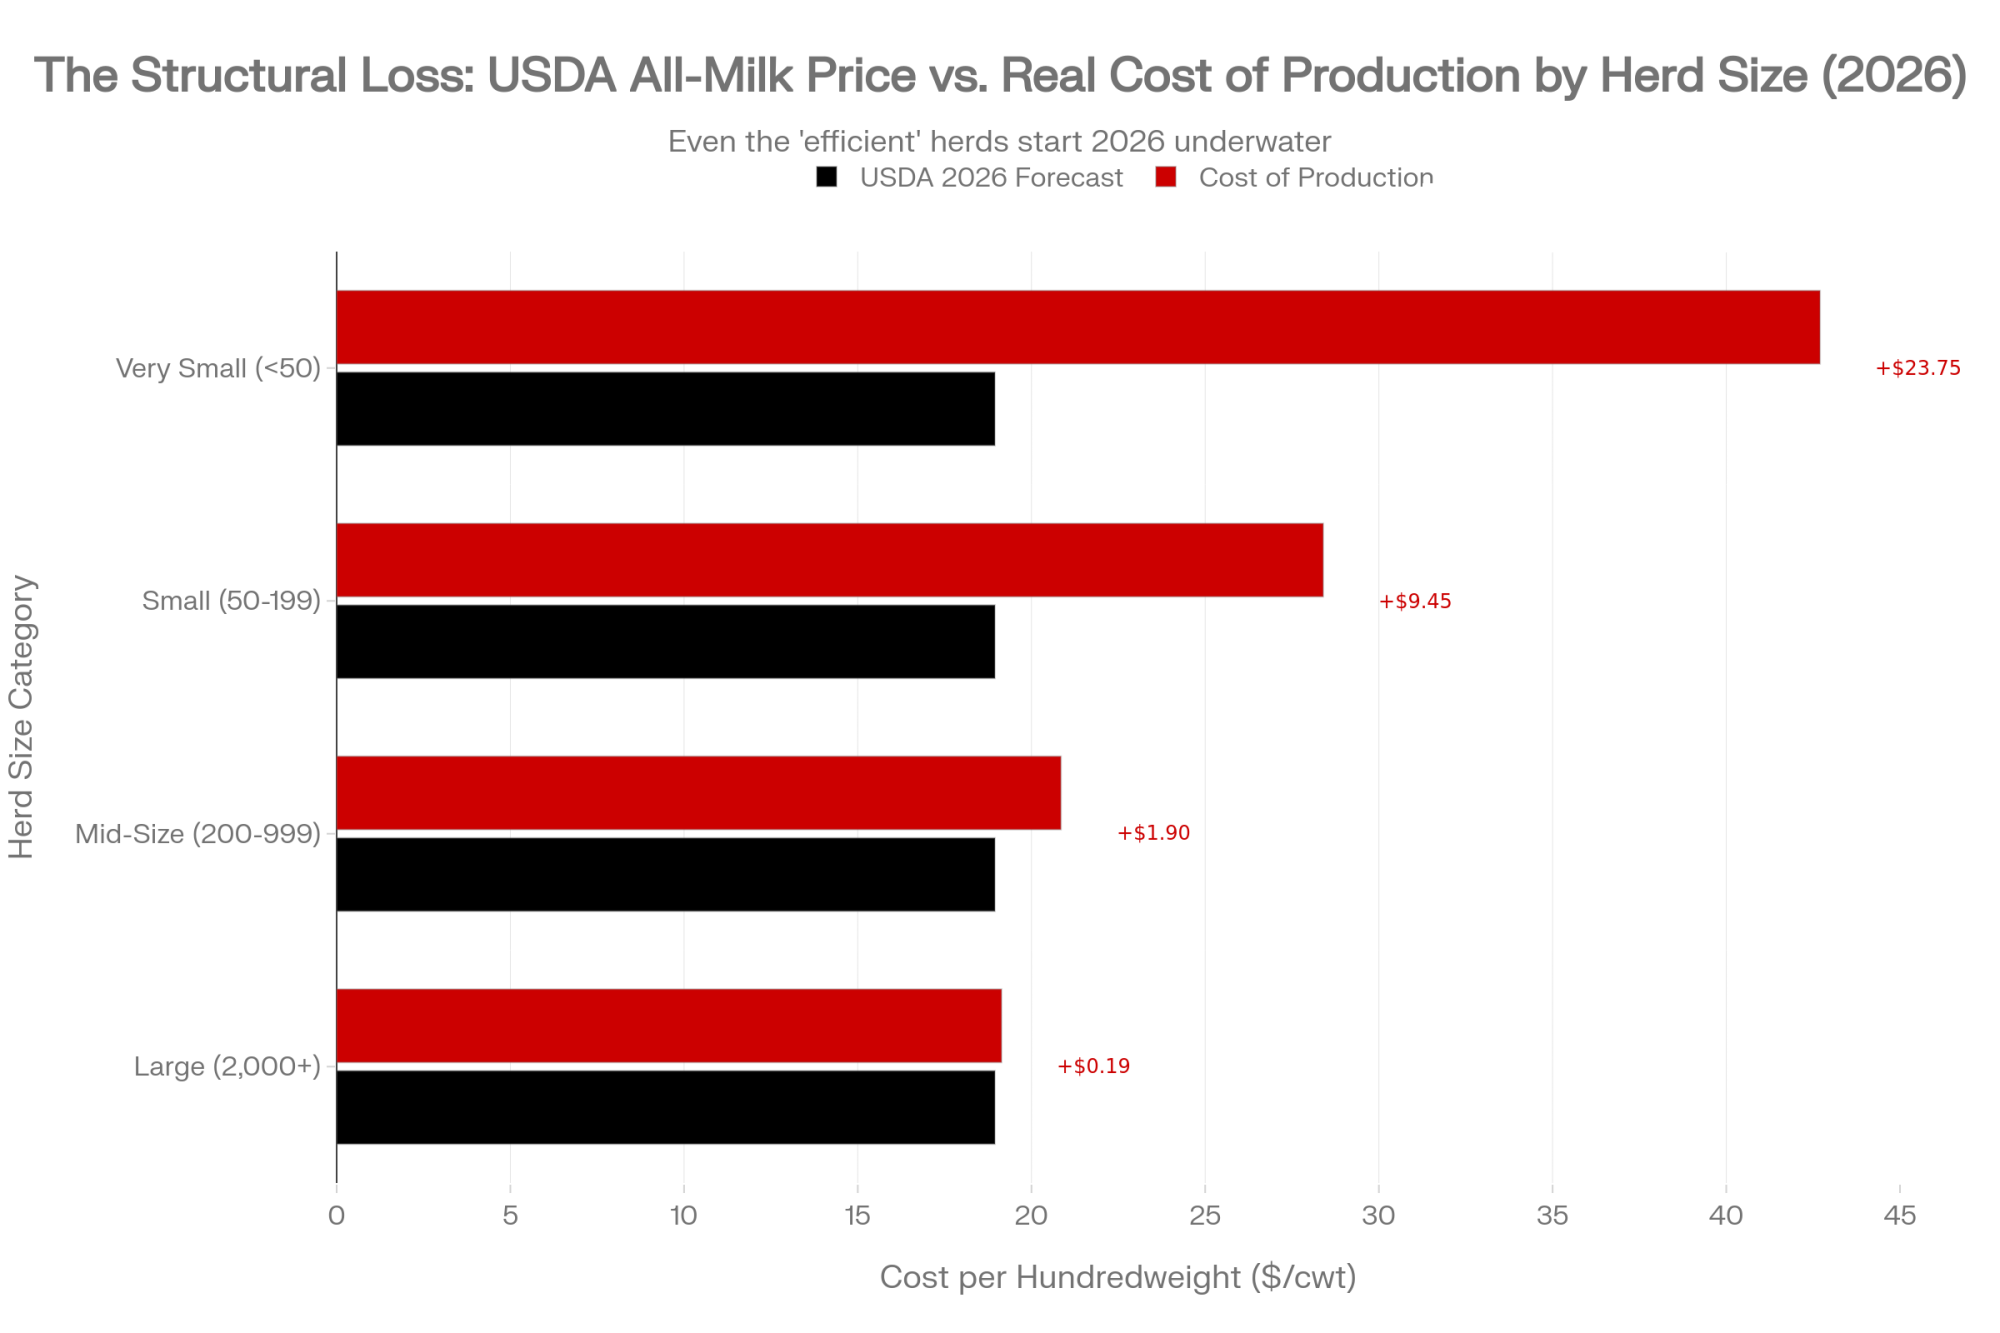
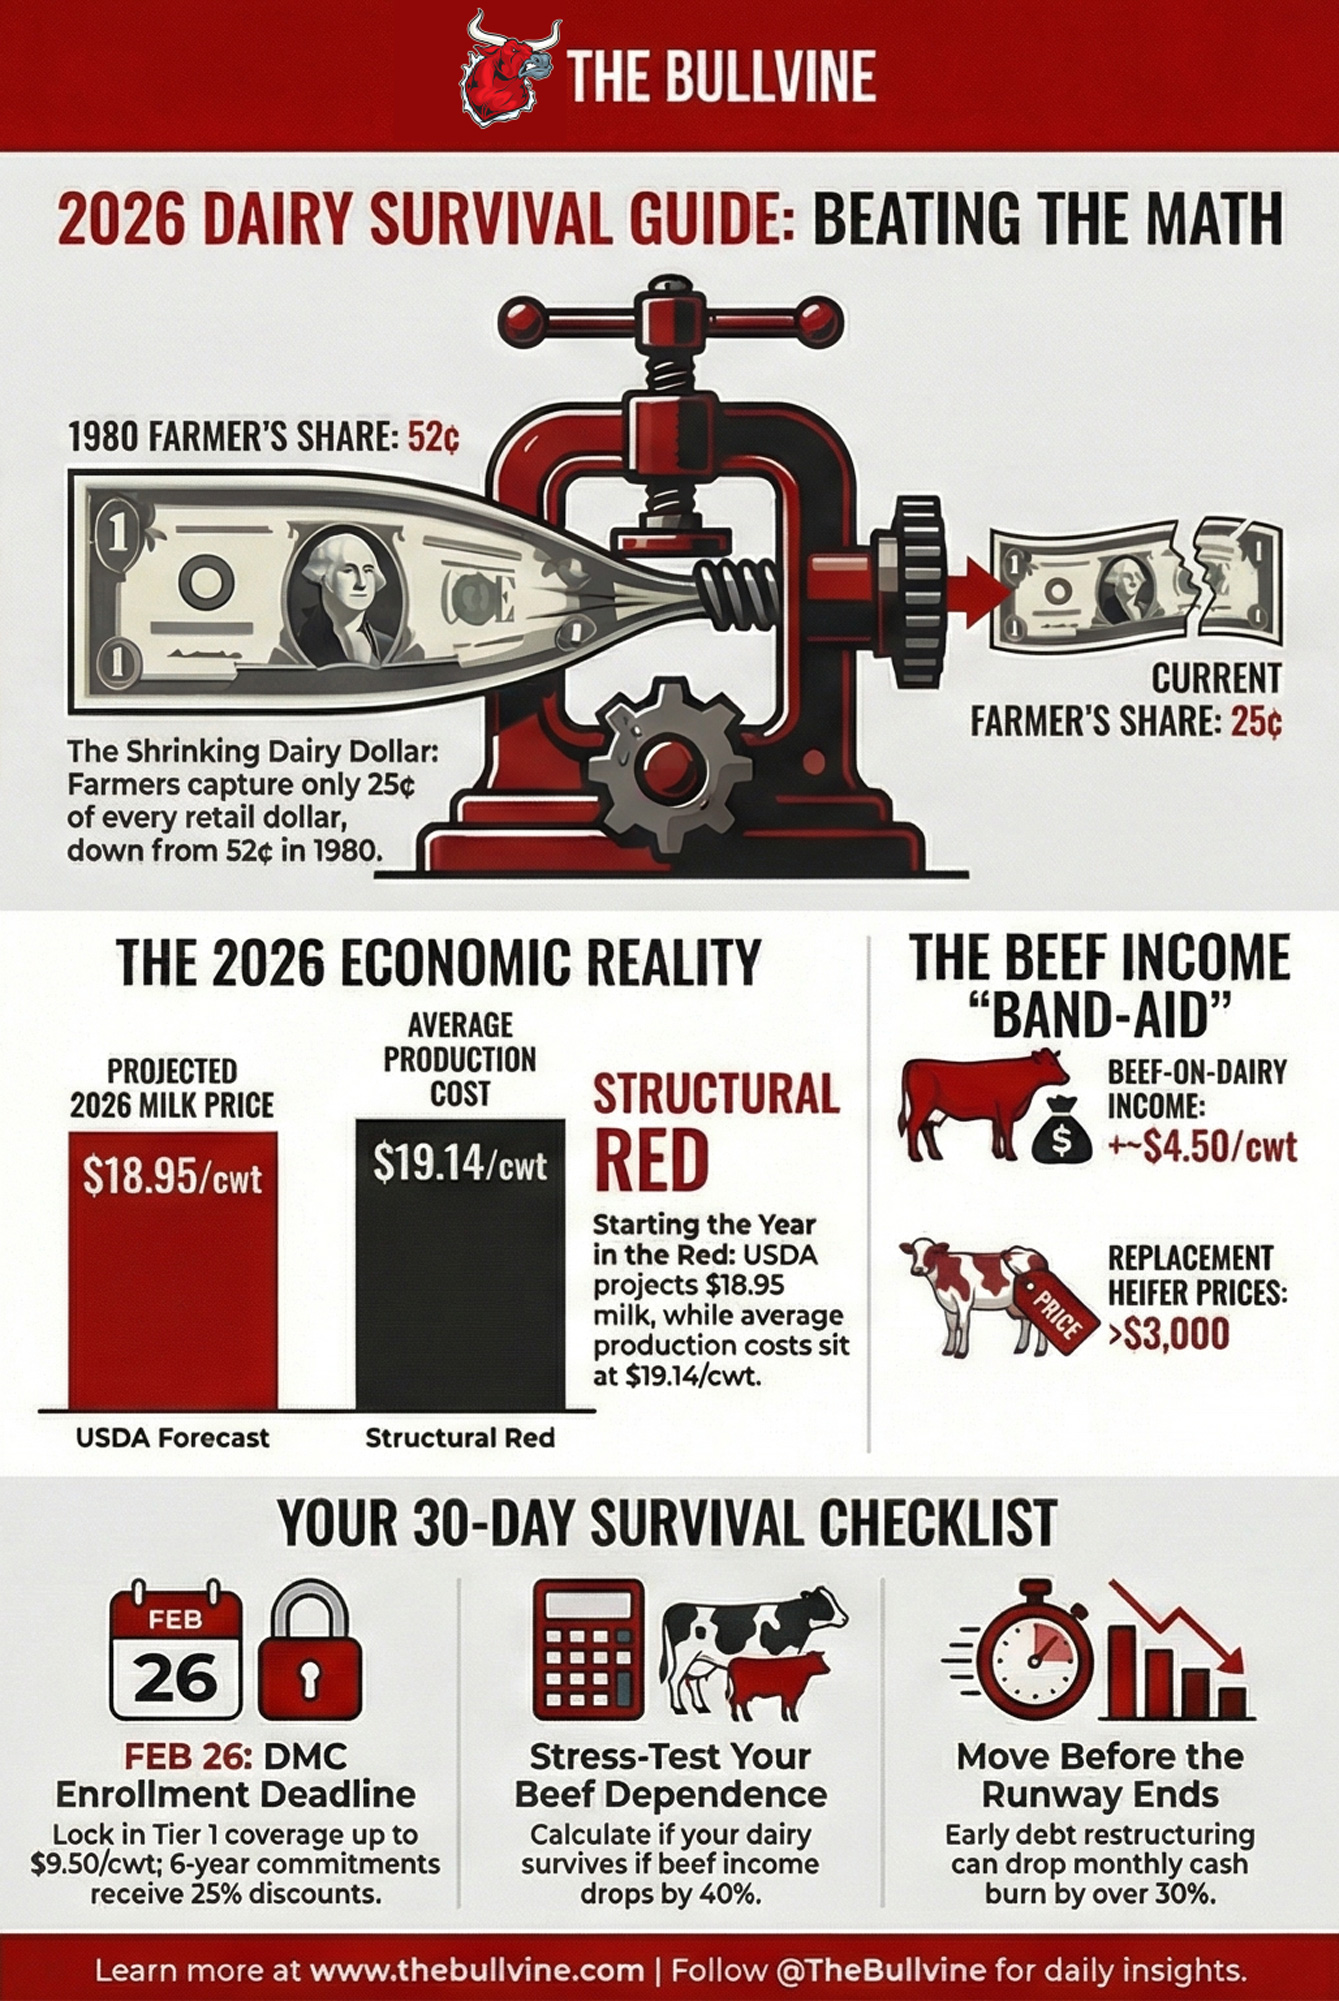
USDA says 2026 milk is $18.95. ERS says your costs are $19.14. That’s not a forecast — that’s a loss locked into the dairy math.
Executive Summary: USDA’s February WASDE now projects $18.95/cwt all‑milk for 2026, but ERS cost‑of‑production numbers still put average 2,000‑plus cow herds at $19.14/cwt and the smallest herds near $42.70/cwt, so a lot of dairies are starting the year structurally in the red. January’s actual Class III check at $14.59/cwt explains why your cash flow feels even tighter than the forecast suggests. At retail, a gallon of whole milk still sits around $4.05, with farmers getting only 25¢ of the dairy dollar and an opaque $2.40–$2.80 slice going to processing and retail that the Gillibrand‑Collins Fair Milk Pricing for Farmers Act tries to drag into the light. For many herds, beef‑on‑dairy calf and cull checks worth about $4.50/cwt are what plug the hole, even as they drain the replacement pipeline and push heifer prices over $3,000/head. The article uses a 550‑cow Wisconsin dairy to show how an honest cost‑of‑production run, fast culling decisions, and debt restructuring turned an 11‑week runway into something survivable. Then it hands you a four‑lane playbook — tighten components, lock in DMC/DRP, get in front of your lender, or consider exiting while asset values hold — with clear thresholds and stress‑tests so you can see, in dollars, which path actually fits your operation.
⚠️ DMC ENROLLMENT CLOSES FEBRUARY 26 — 15 DAYS FROM TODAY
Tier 1 coverage is now available up to 6 million pounds at $9.50/cwt. A six‑year commitment (2026–2031) under the One Big Beautiful Bill Act (OBBBA) cuts your premiums by 25%. That cap covers roughly a 270‑cow herd at 22,000 lbs/cow. If you’re eligible and not enrolled yet, you’re on the clock.
Source: USDA Farm Service Agency, Secretary Rollins’ Jan. 12 announcement, farms.com, and Penn State/Extension enrollment summaries.
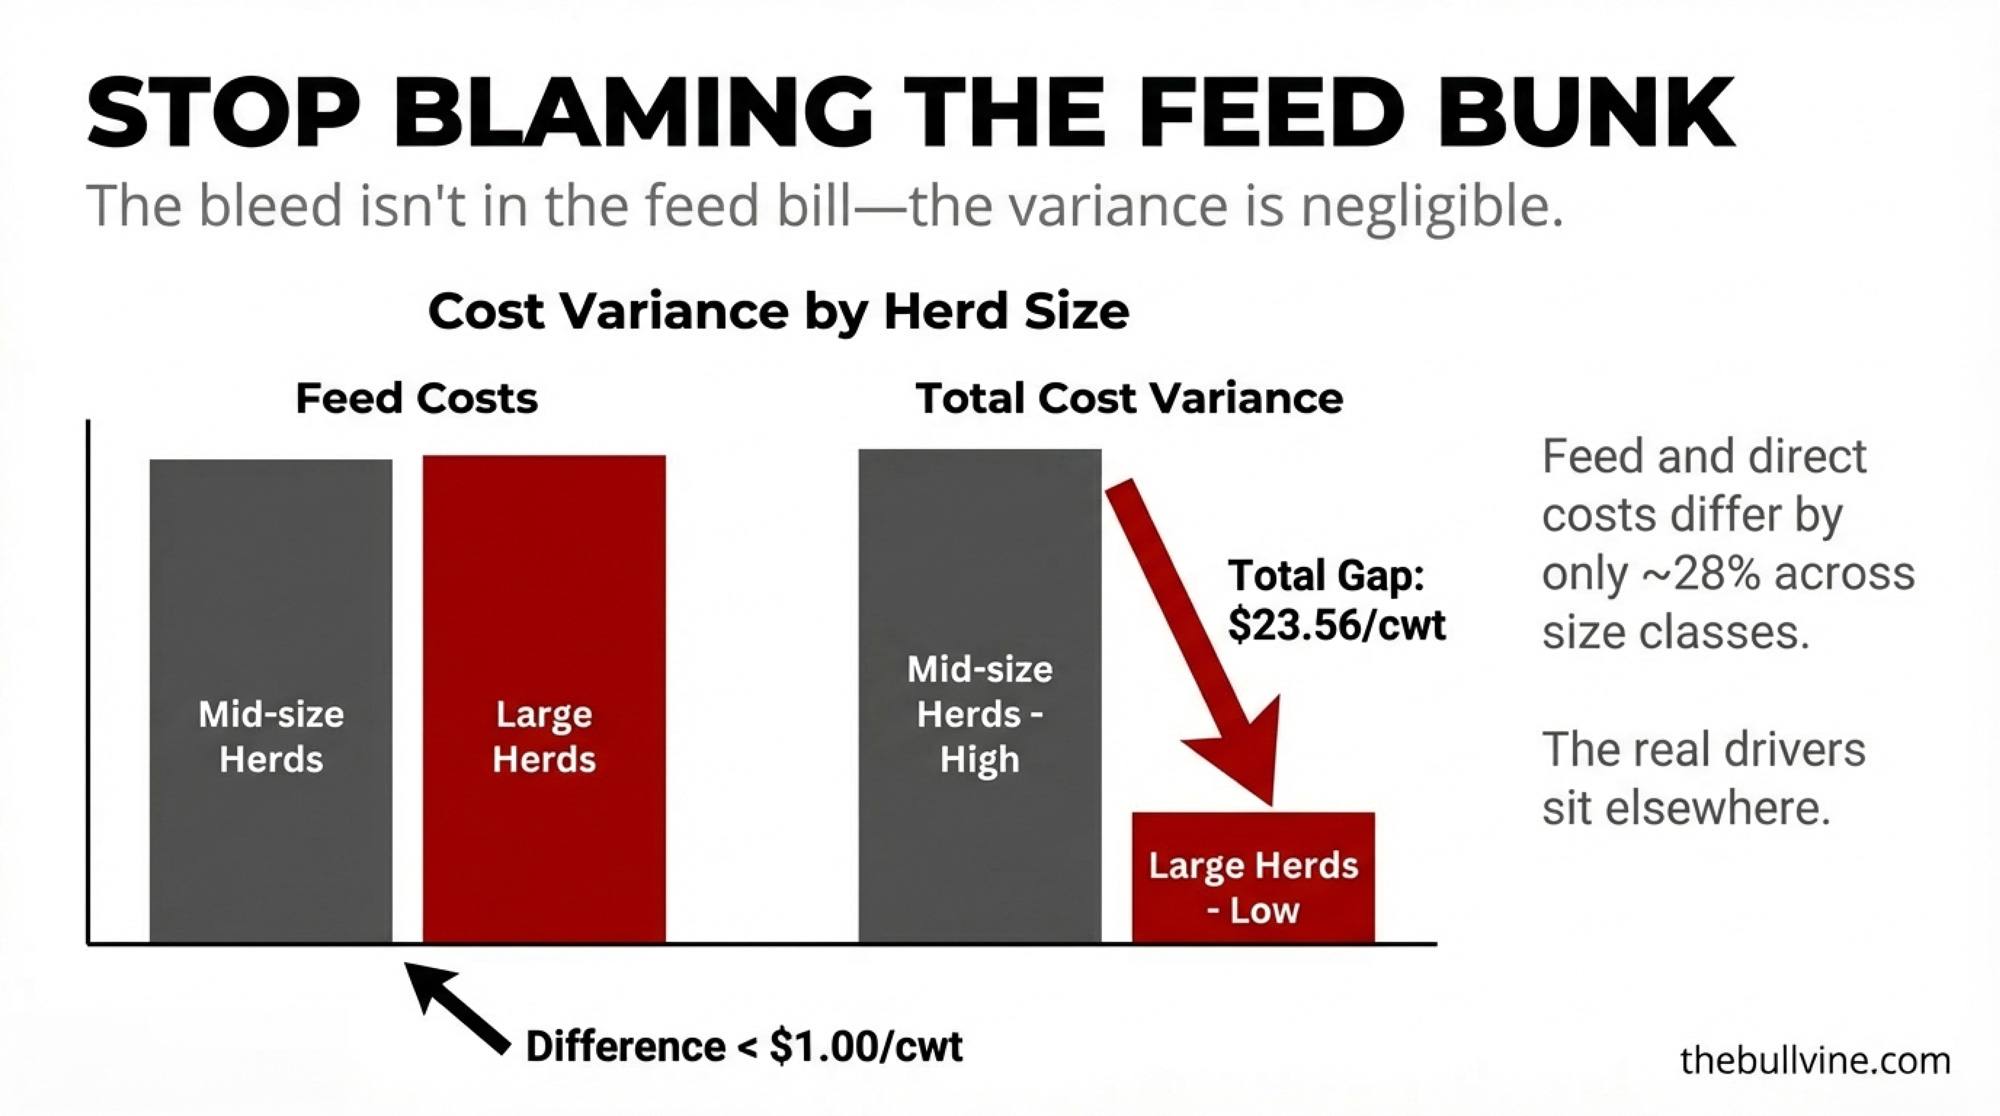
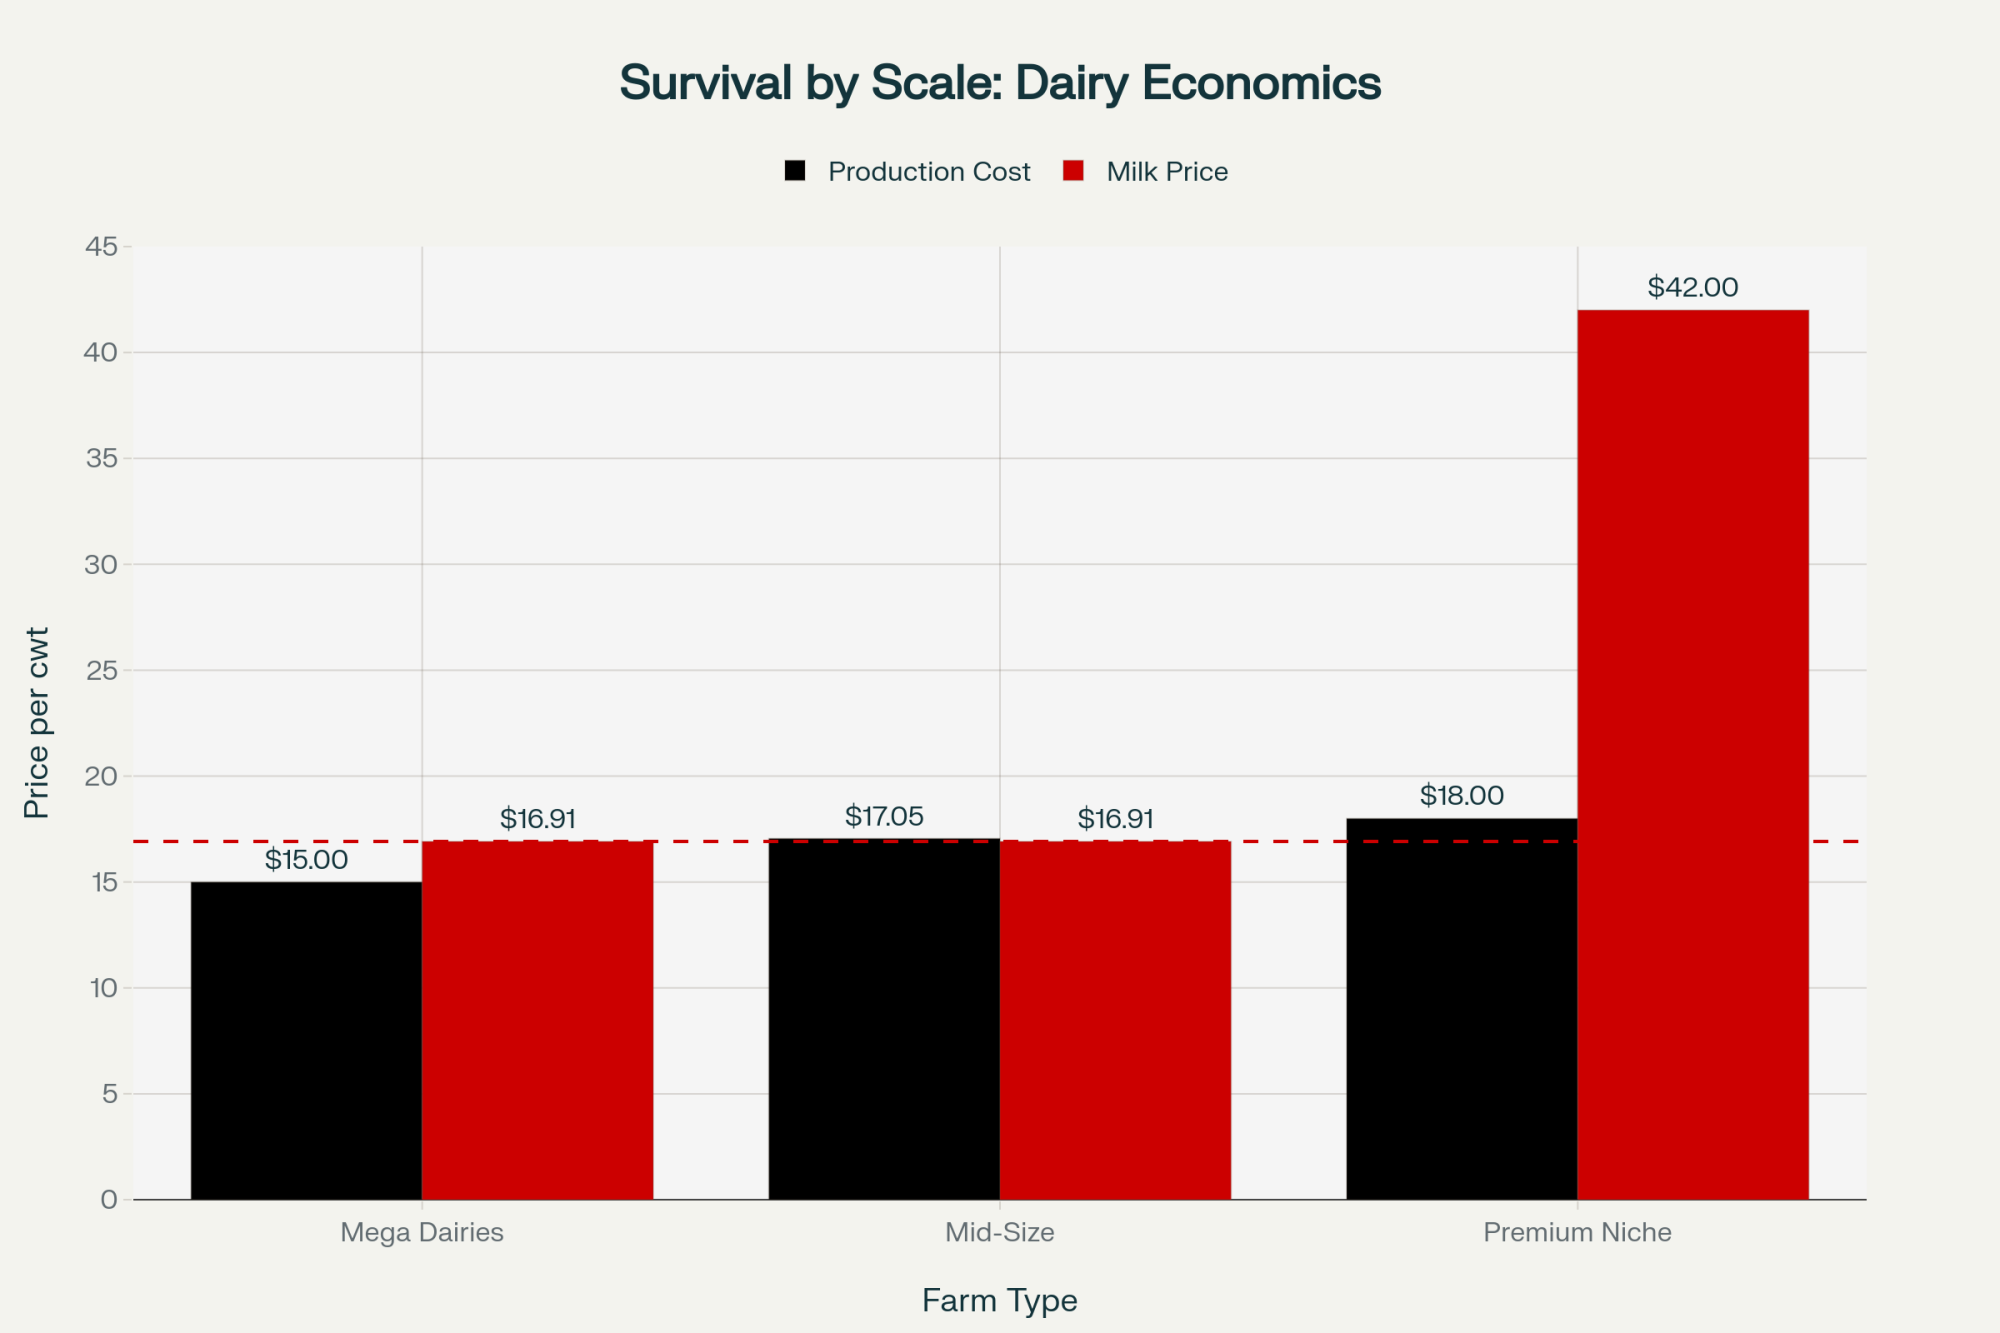
USDA’s February 10 WASDE briefing shows the 2026 all‑milk price at $18.95/cwt, down $2.22/cwt from the revised 2025 average of $21.17/cwt. That’s roughly $153,000 in lost gross milk revenue for a 300‑cow herd shipping 69,000 cwt a year. The same USDA‑ERS data behind that WASDE also say this: on a full‑cost basis, even the biggest, “efficient” herds average 19¢/cwt above the new all‑milk price, while sub‑50‑cow herds sit more than $23/cwt higher than that $18.95.
The $4.05 Gallon and the Broken Price Signal
Here’s the number that should make you stop and stare for a second.
The national average price of a gallon of whole milk in December 2025 was $4.05, essentially unchanged from four years earlier. Over that same period, food‑at‑home prices climbed about 23%, according to BLS CPI data. Eggs jumped. Beef jumped. Milk stayed pinned. Consumers got a better deal on your product than on almost anything else in the grocery store.
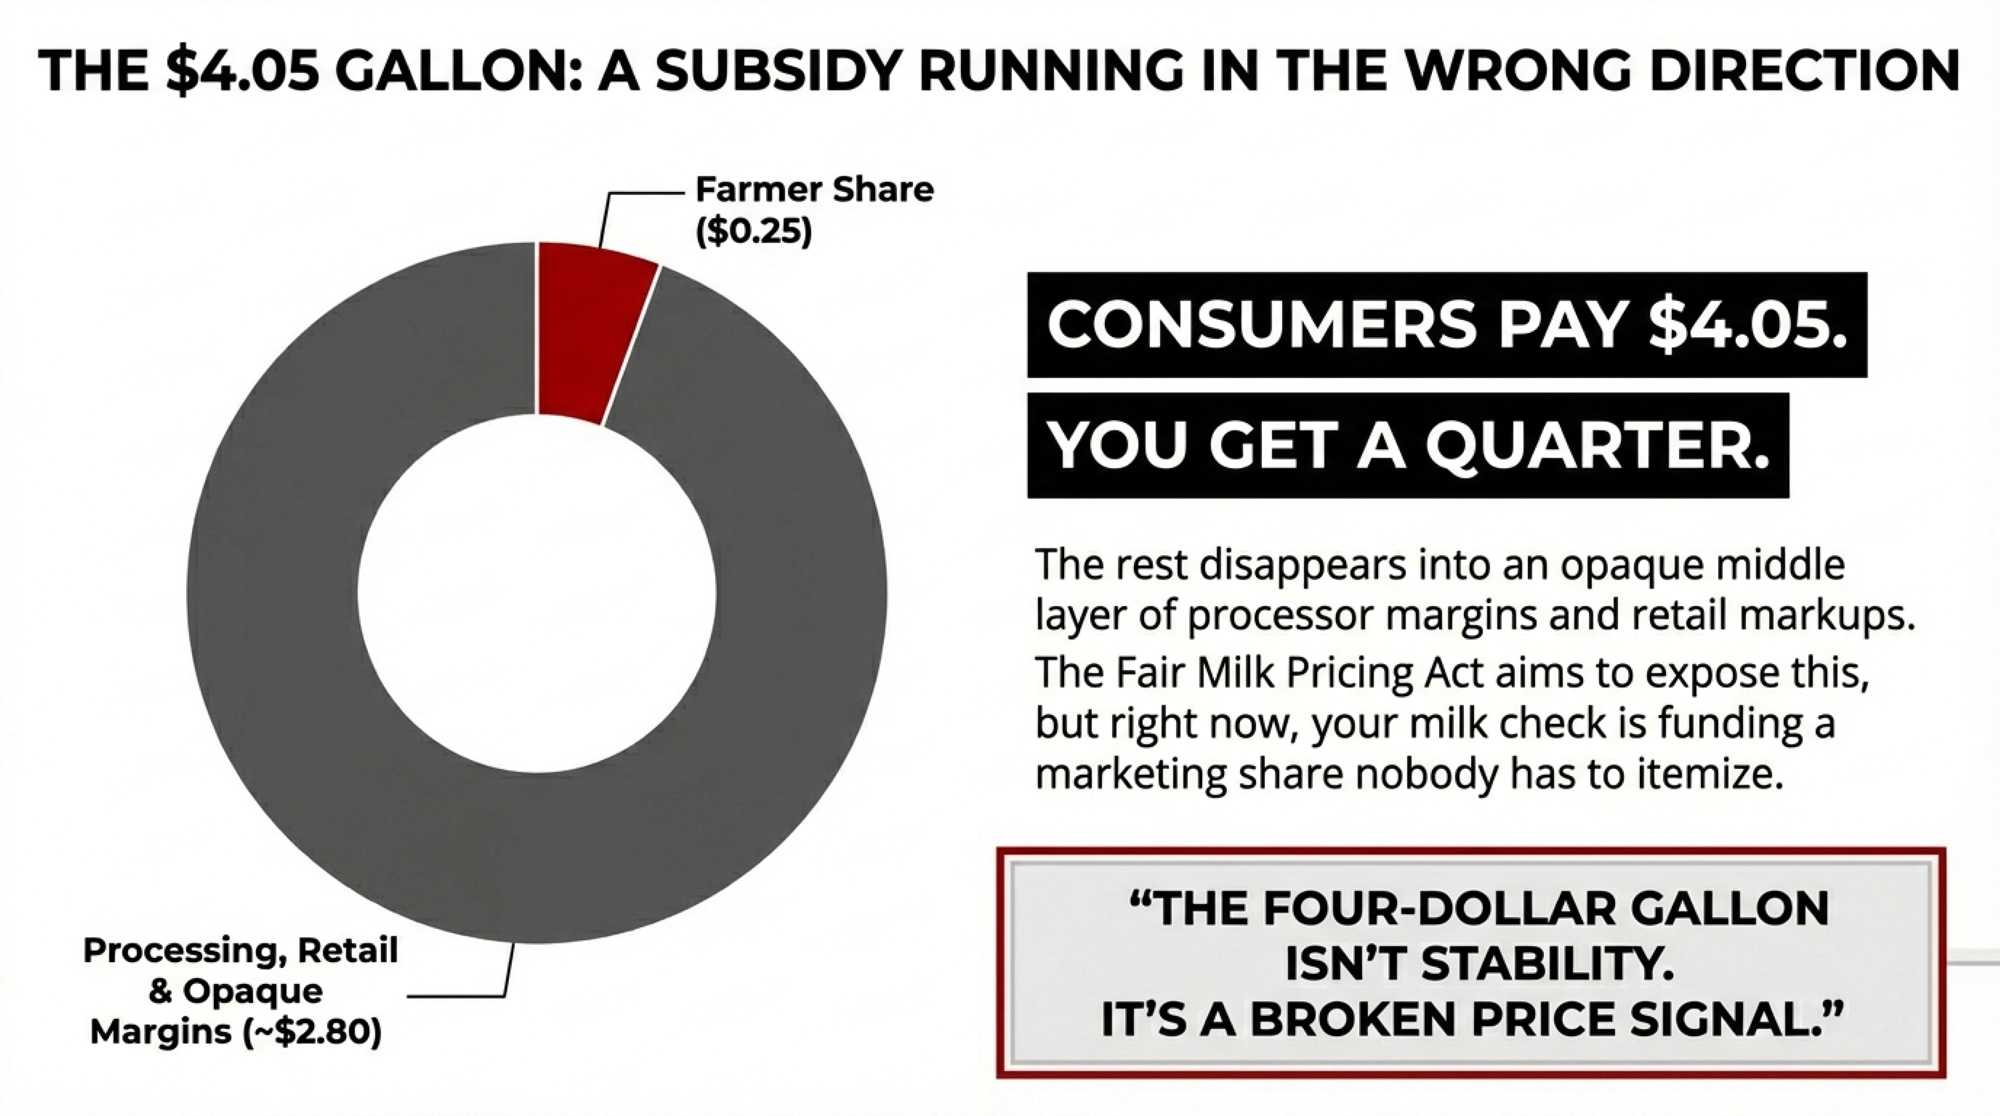
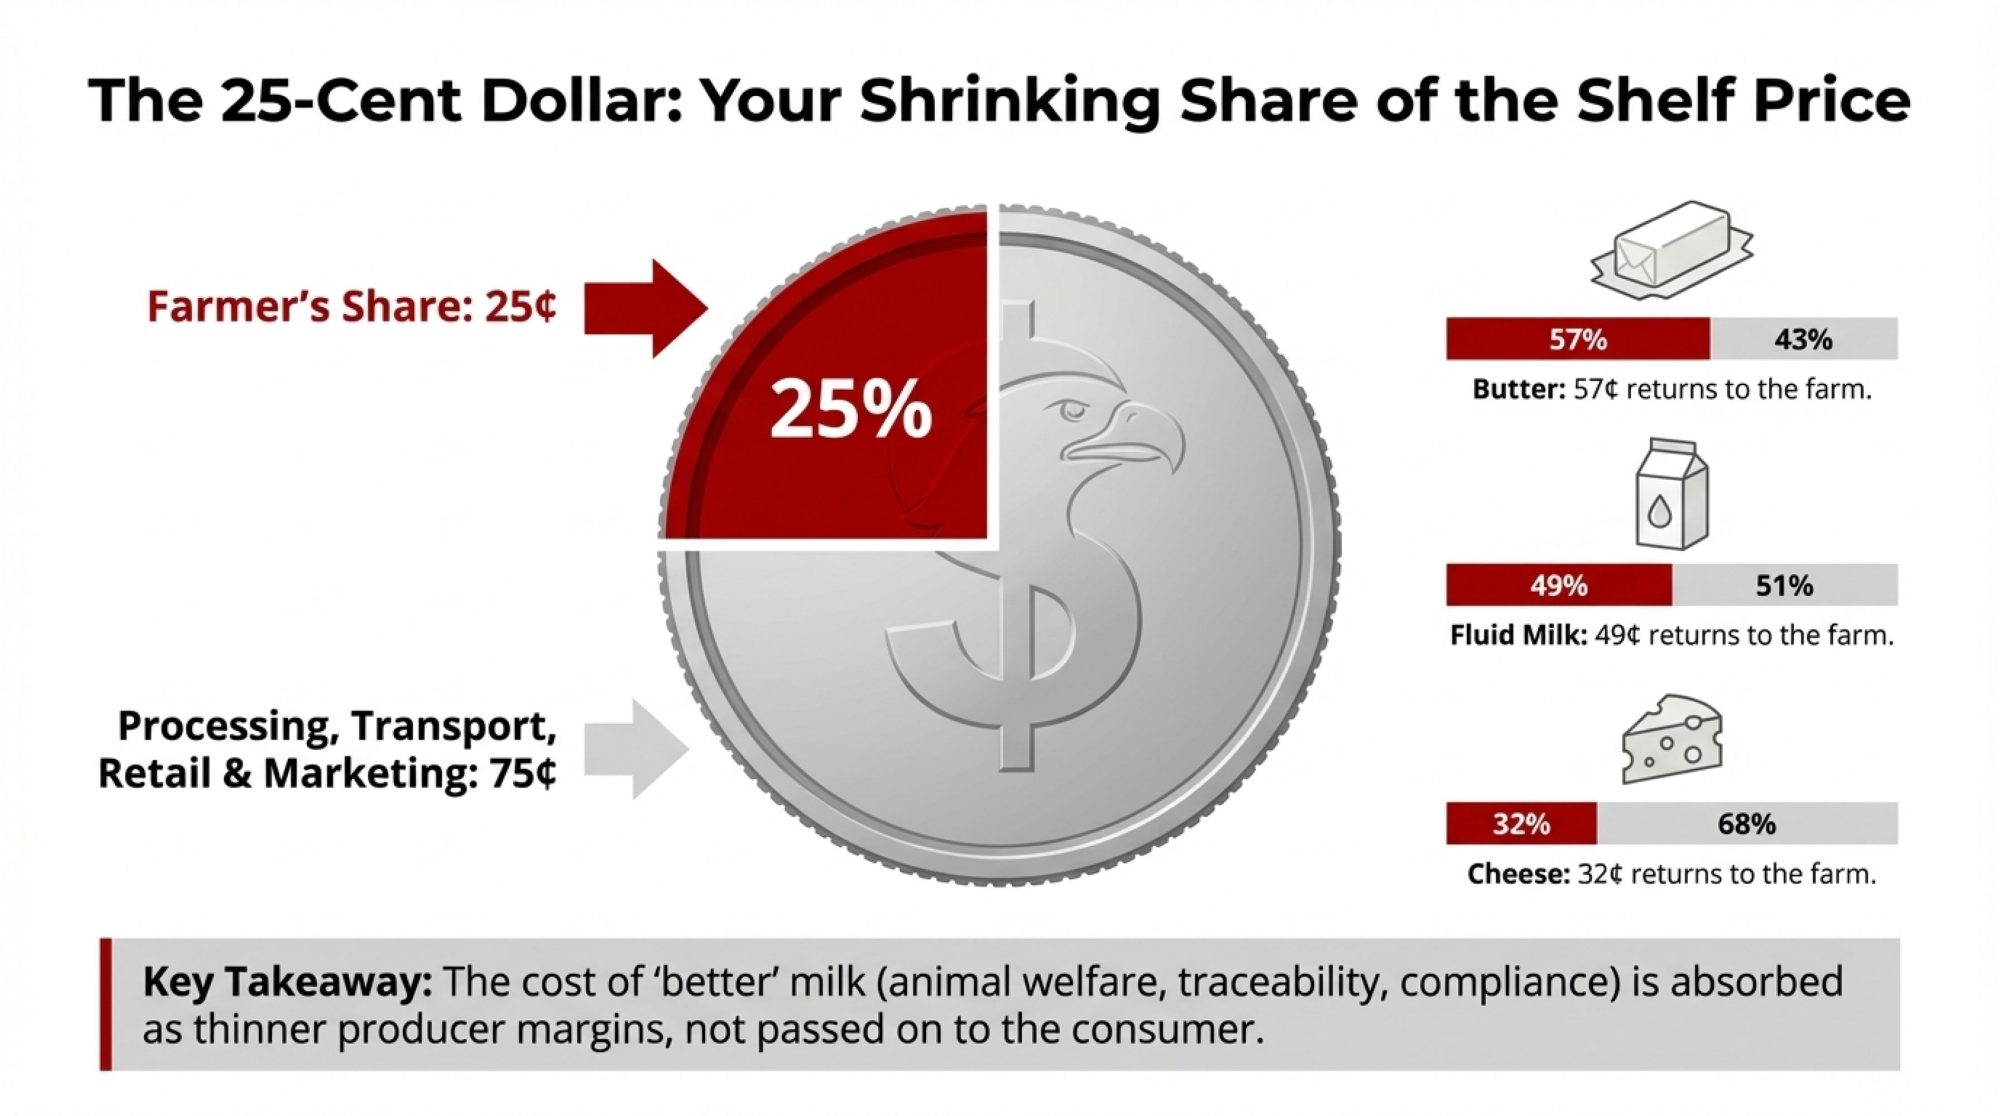
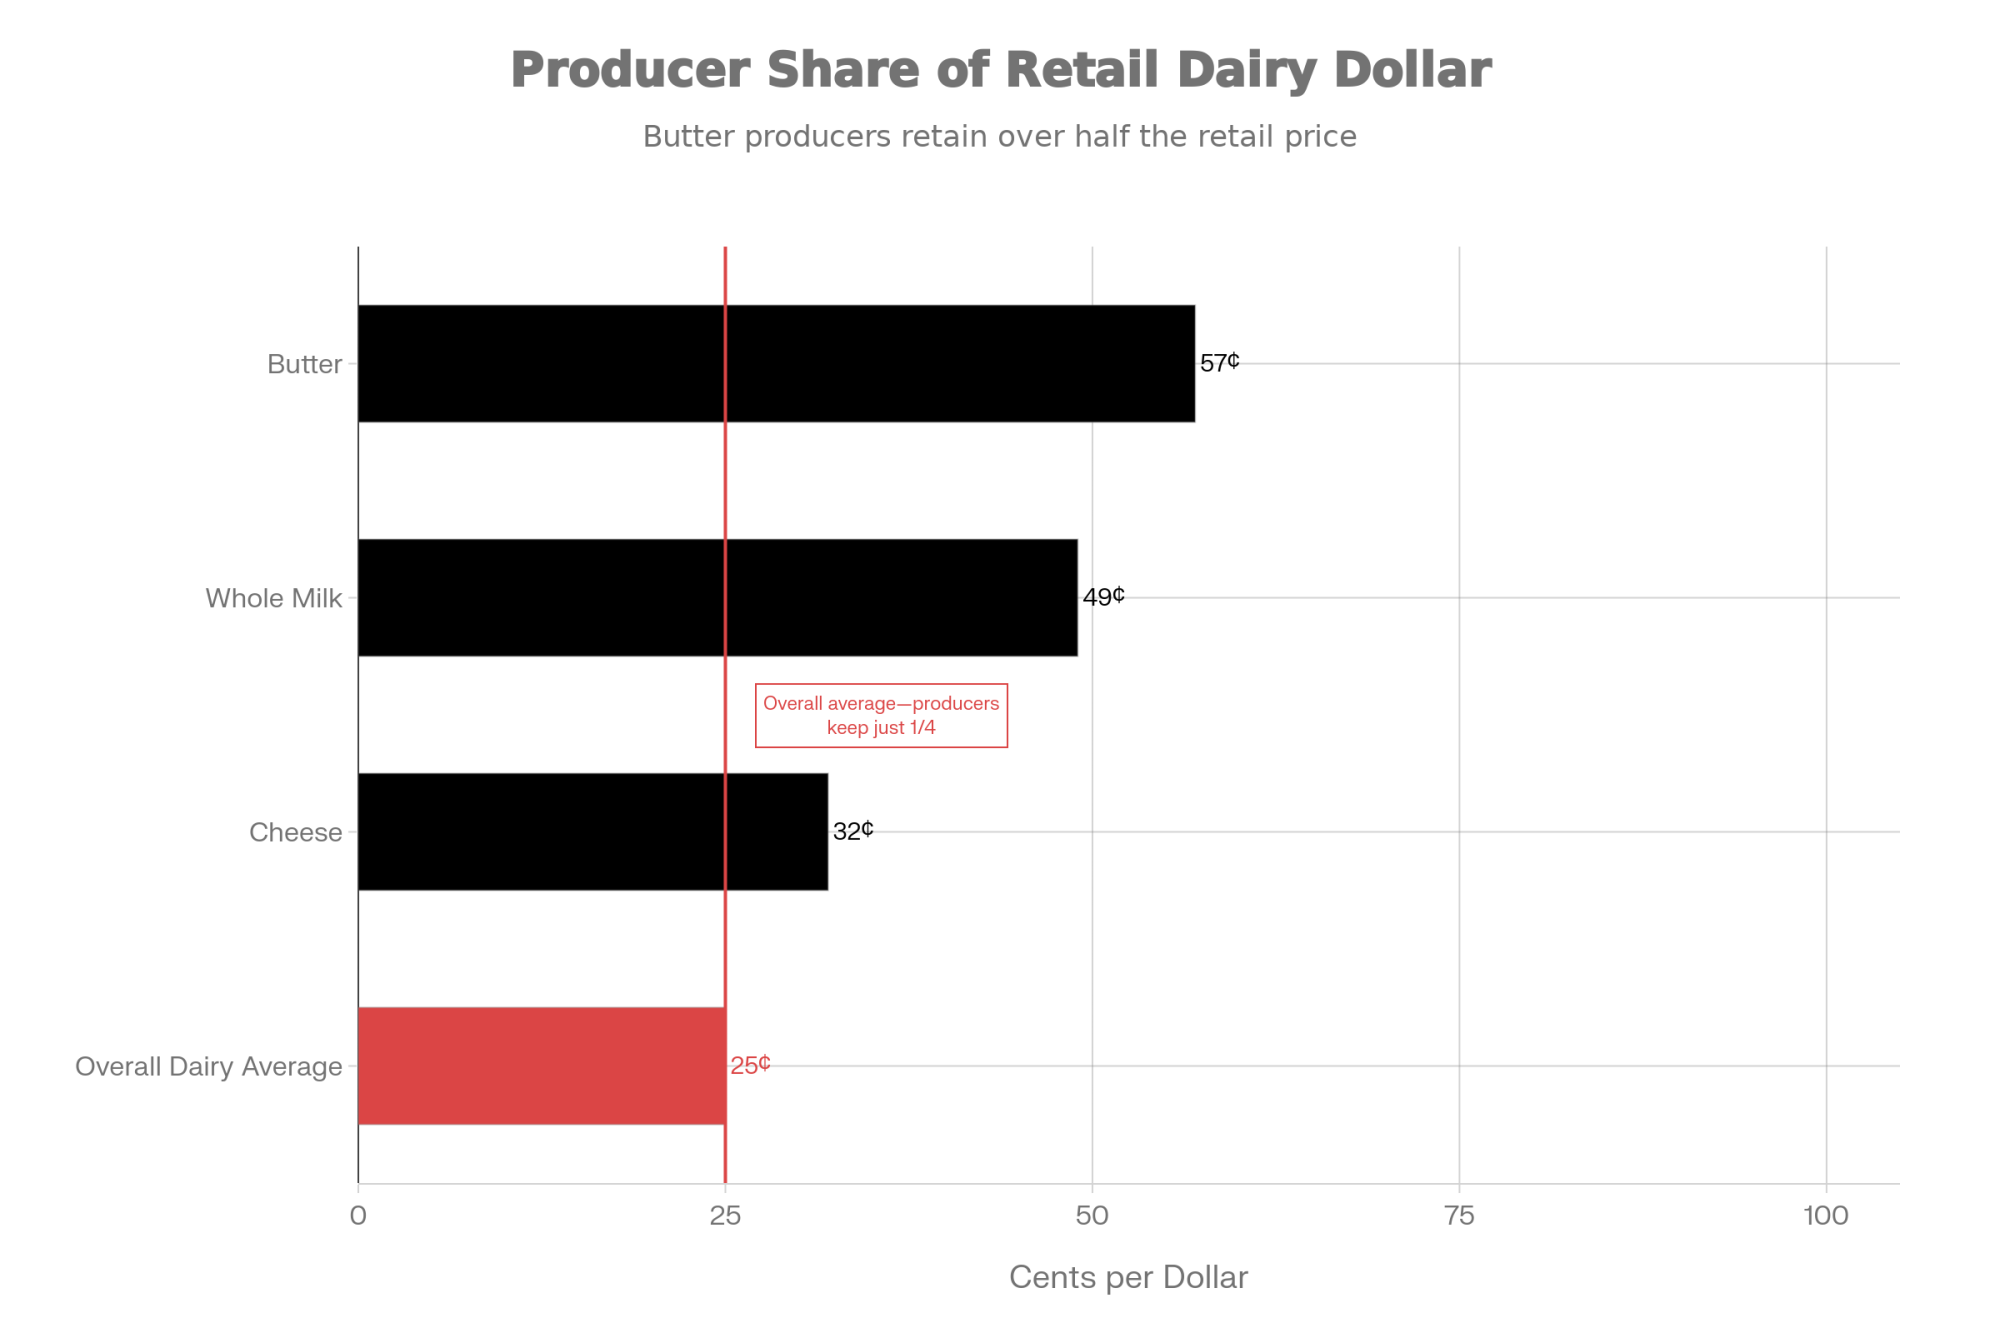
USDA’s Economic Research Service tracks how that retail dollar gets split. In 2024, dairy farmers captured 25¢ of every retail dairy dollar, up a bit from 23¢ in 2023 but down from 28¢ in 2022. Back in 1980, the farm share sat near 52¢; by 1999, it was around 32¢. For fluid milk specifically, ERS pegs the 2024 farm share at 49%. With the 2026 all‑milk forecast now at $18.95, that share is drifting toward the low 40s.
Here’s how your slice of that $4.05 gallon changes at three price points:
Your share of the $4.05 gallon (fluid milk)
| Price Scenario | Farm Value per Gallon | Your Share | Goes to Processing & Retail |
| 2025 all-milk avg ($21.17/cwt) | $1.82 | 44.9% | $2.23 |
| 2026 all-milk forecast ($18.95/cwt) | $1.63 | 40.2% | $2.42 |
| Jan 2026 Class III actual ($14.59/cwt)* | $1.25 | 31.0% | $2.80 |
*Class III is always lower than the all‑milk blend, which includes Class I & II. January’s all‑milk will be higher than $14.59, but the direction is the same. Farm values converted at 1 gallon ≈ 8.6 lbs; all‑milk and Class III from USDA WASDE/AMS, retail from BLS.
That bottom row is the punch in the gut. At January’s actual Class III, $2.80 of every $4.05 gallon goes to processing and retail. And here’s the part that should bother you: ERS only tells you the farm share versus “marketing share” — it doesn’t break that $2.80 into processor margins, retail markups, transportation, or packaging. It’s one big opaque slice.
2025 will be remembered as a year of “margin capture through arbitrage in the middle of the supply chain. Dairy markets worked—just not for dairy farmers. Senators Kirsten Gillibrand (D‑NY) and Susan Collins (R‑ME) responded by introducing the Fair Milk Pricing for Farmers Act (S.581) in February 2025, which would require audited dairy processor cost surveys every two years under the Agricultural Marketing Act of 1946. Until something like that passes, your milk check is funding a mid‑chain marketing share nobody has to itemize.
That’s not a neutral market adjustment. It’s a price discovery system that keeps the shelf price stable, preserves every margin between your bulk tank and the dairy case, and hands the entire “flex” to your end of the deal. The four‑dollar gallon isn’t stability. It’s a subsidy running in the wrong direction.
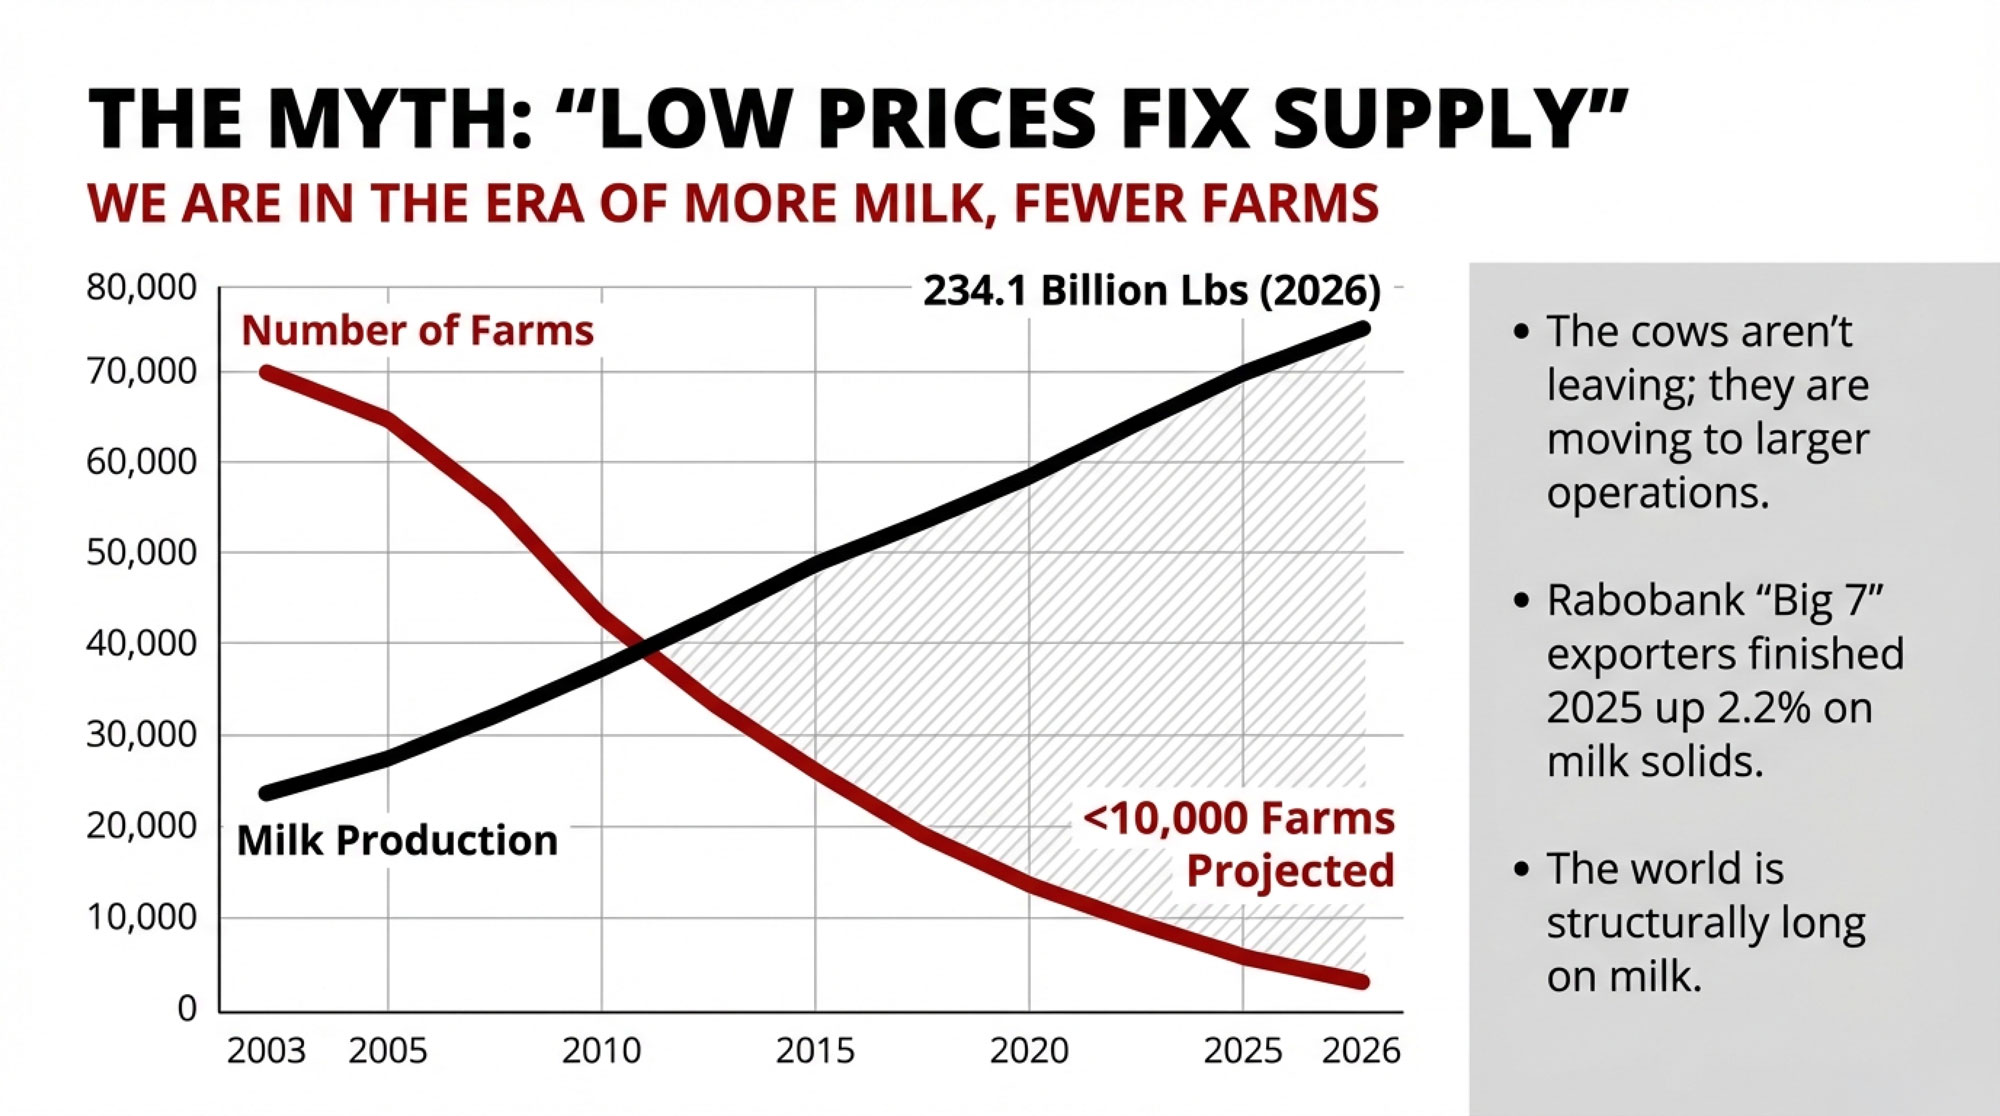
The 234.5‑Billion‑Pound Elephant in the Room
So if the money’s not showing up in your milk check, where is all this milk coming from?
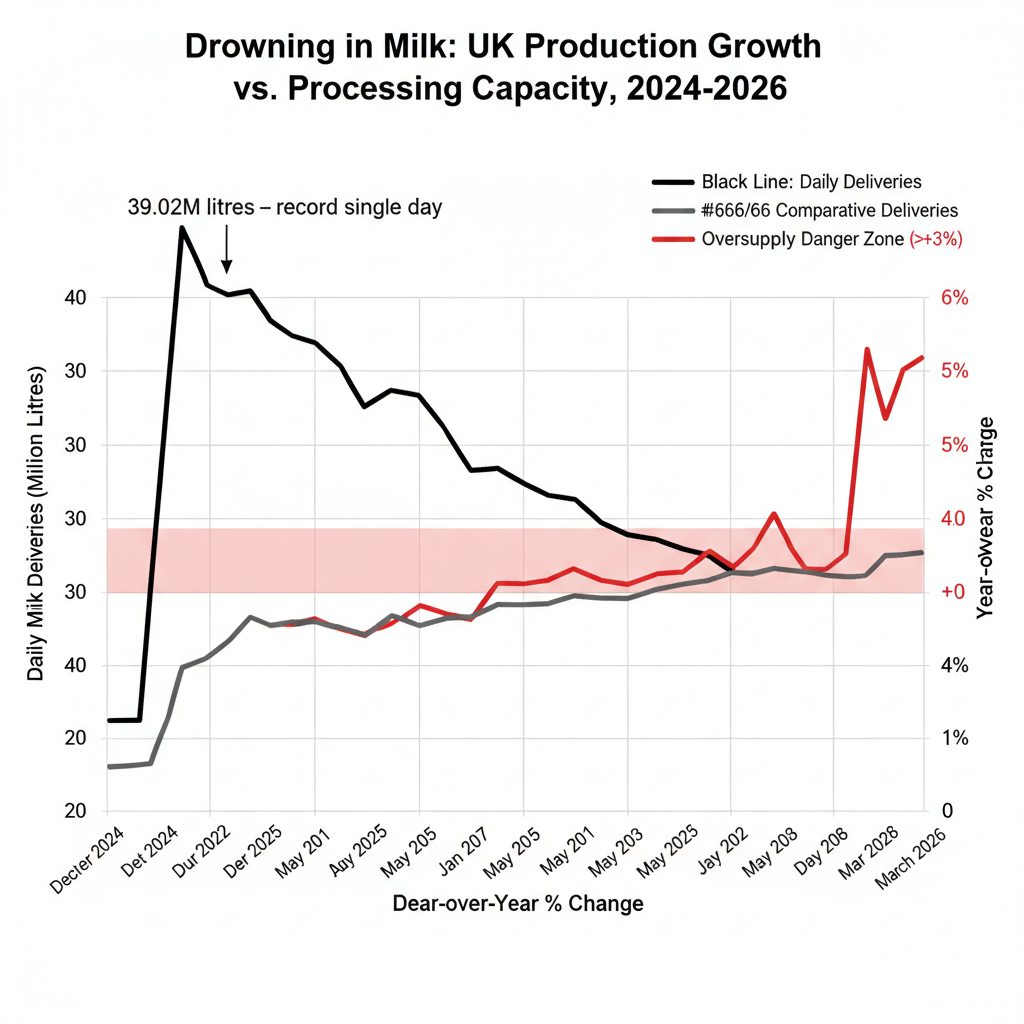
USDA’s January Livestock, Dairy, and Poultry Outlook had 2026 milk output at 234.3 billion pounds on 9.555 million head, averaging 24,520 lbs/cow. The February WASDE nudged that up to 234.5 billion pounds, citing a slightly larger herd and continued productivity gains. November 2025 production was already running 4.5% above the prior year, with 211,000 more cows on feed and per‑cow output up 2.1%.
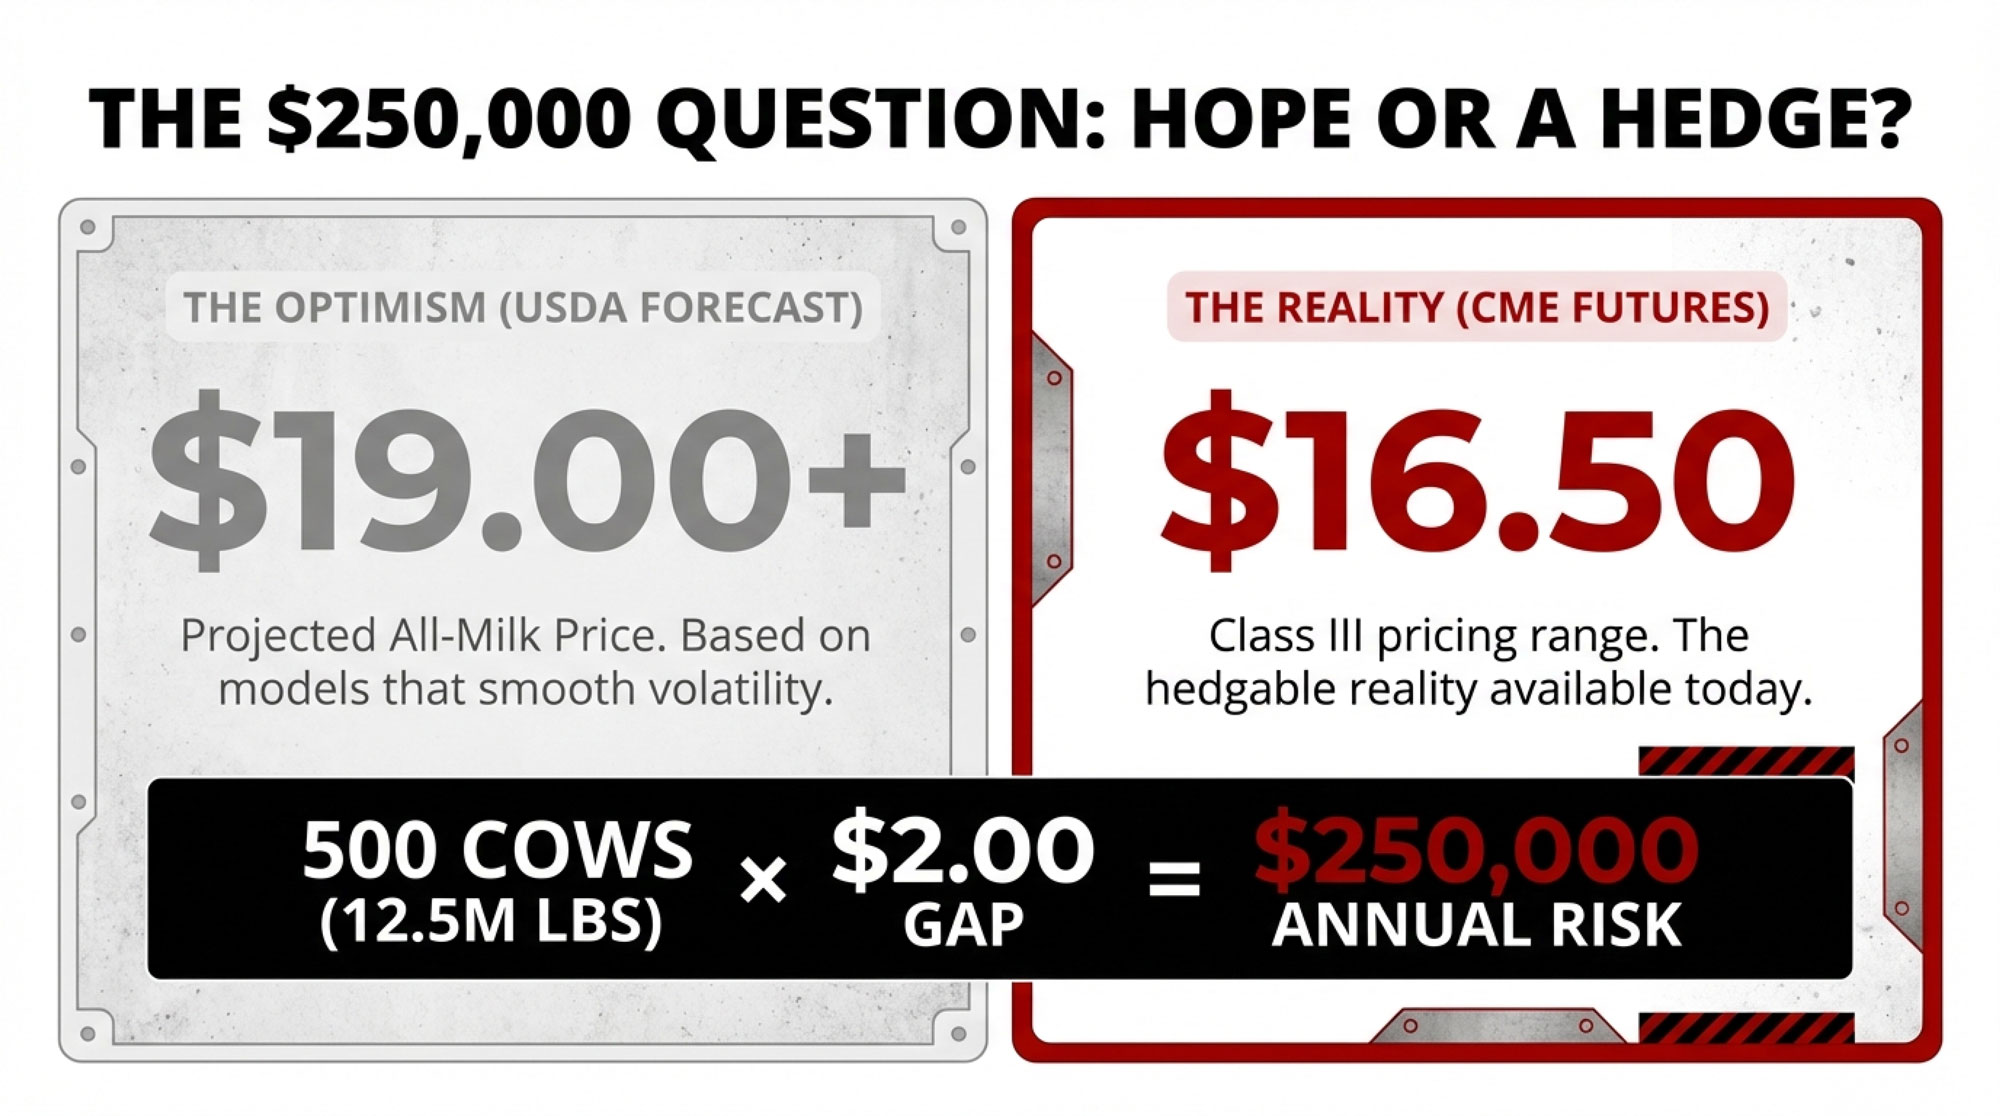
On the consumer side, that $4.05 national average hides a range from roughly $3.50/gallon in parts of the Midwest to more than $4.80 in some Northeast urban markets. The 2022 annual average peaked closer to $4.20 after mid‑year spikes above $4.30, then slid back and basically flat‑lined. And as we outlined in “USDA Says $18, Futures Say $16: The $150K Gap That’s Rewriting 2026 Dairy Budgets,” spot and futures markets have consistently priced a weaker Class III than USDA’s annual averages suggest.
The February WASDE bumped all‑milk to $18.95 and Class III to $16.65/cwt, up 30¢ from January’s $16.35 forecast. But January’s actual Class III was still $14.59, and December’s was $15.86. That means the back half of 2026 has to do a lot of heavy lifting to deliver the annual average USDA now has in its spreadsheet.
How This Lands on a Real Operation
Let’s bring this down to barn level.
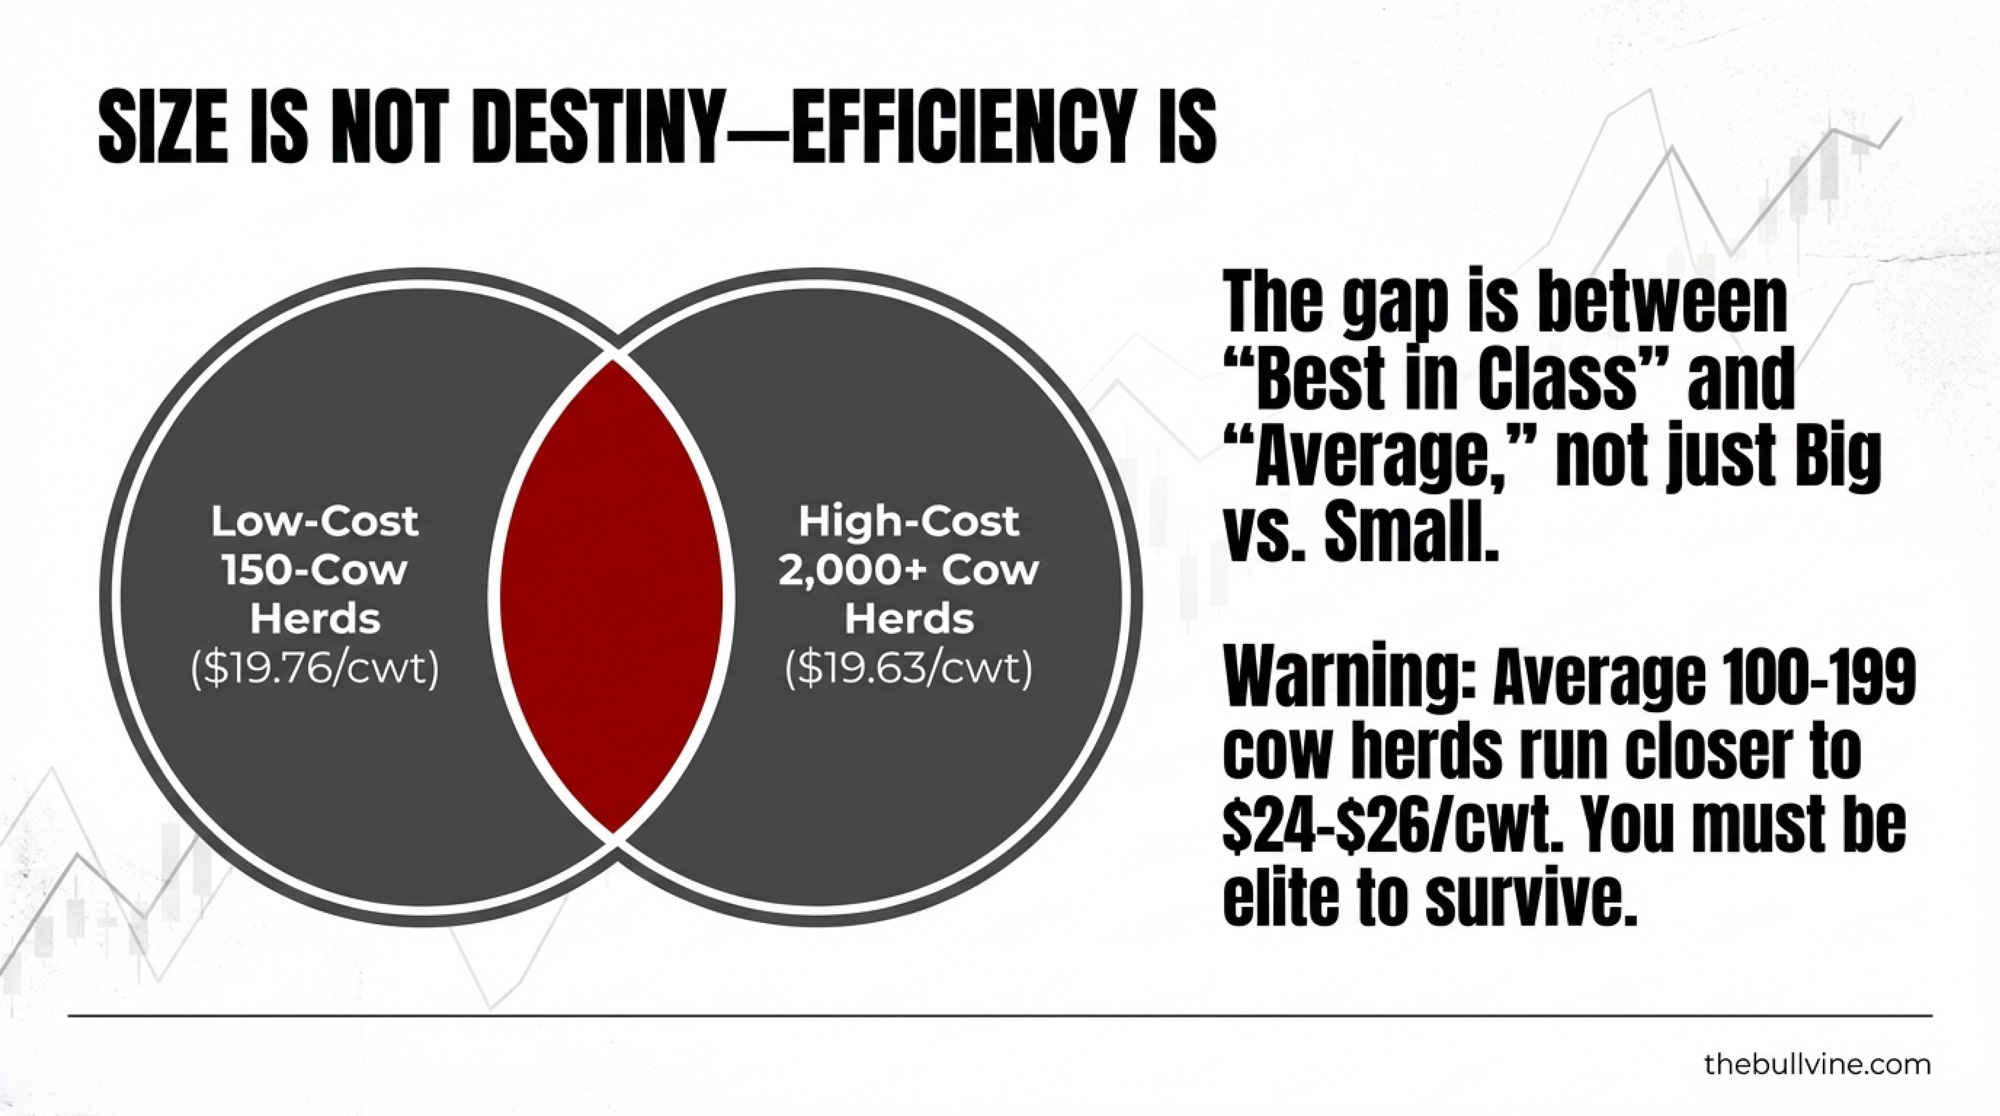
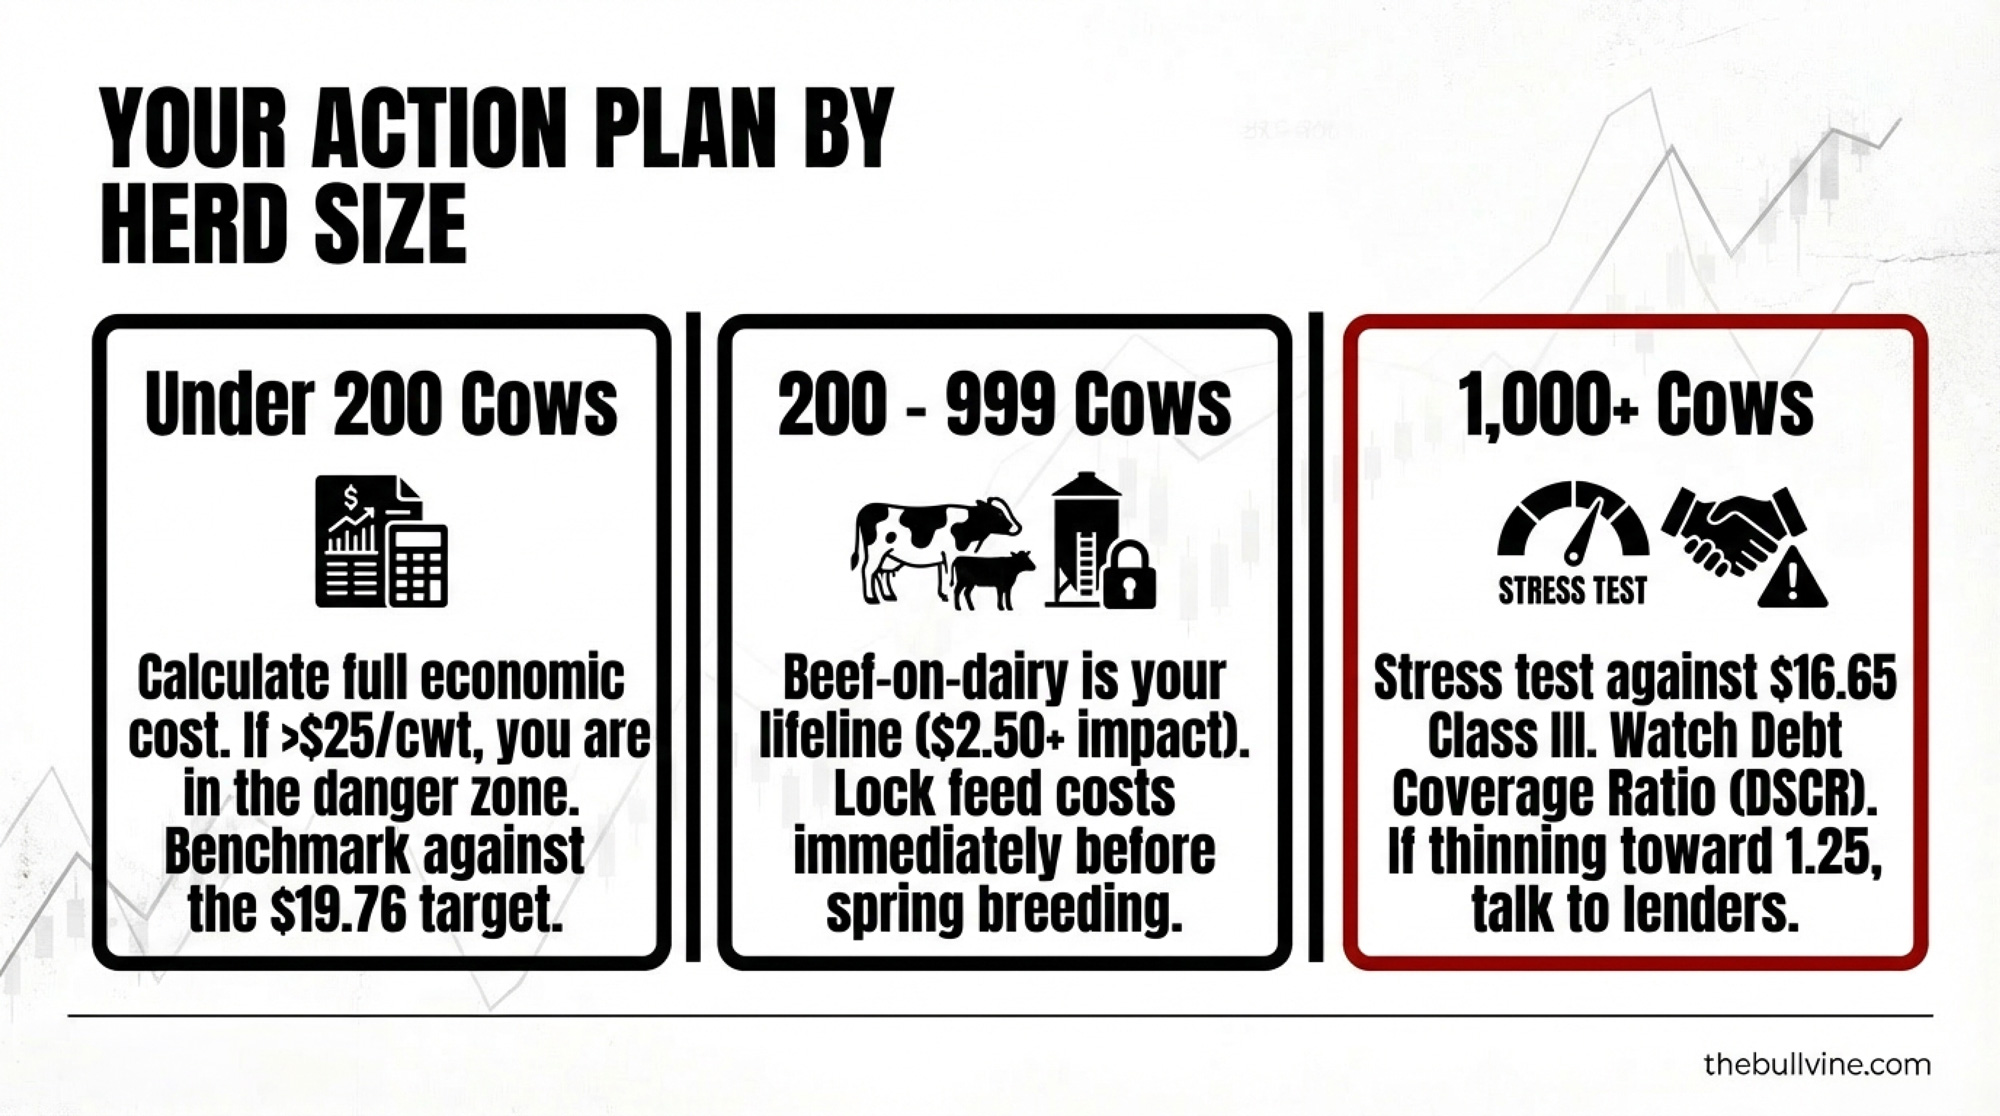
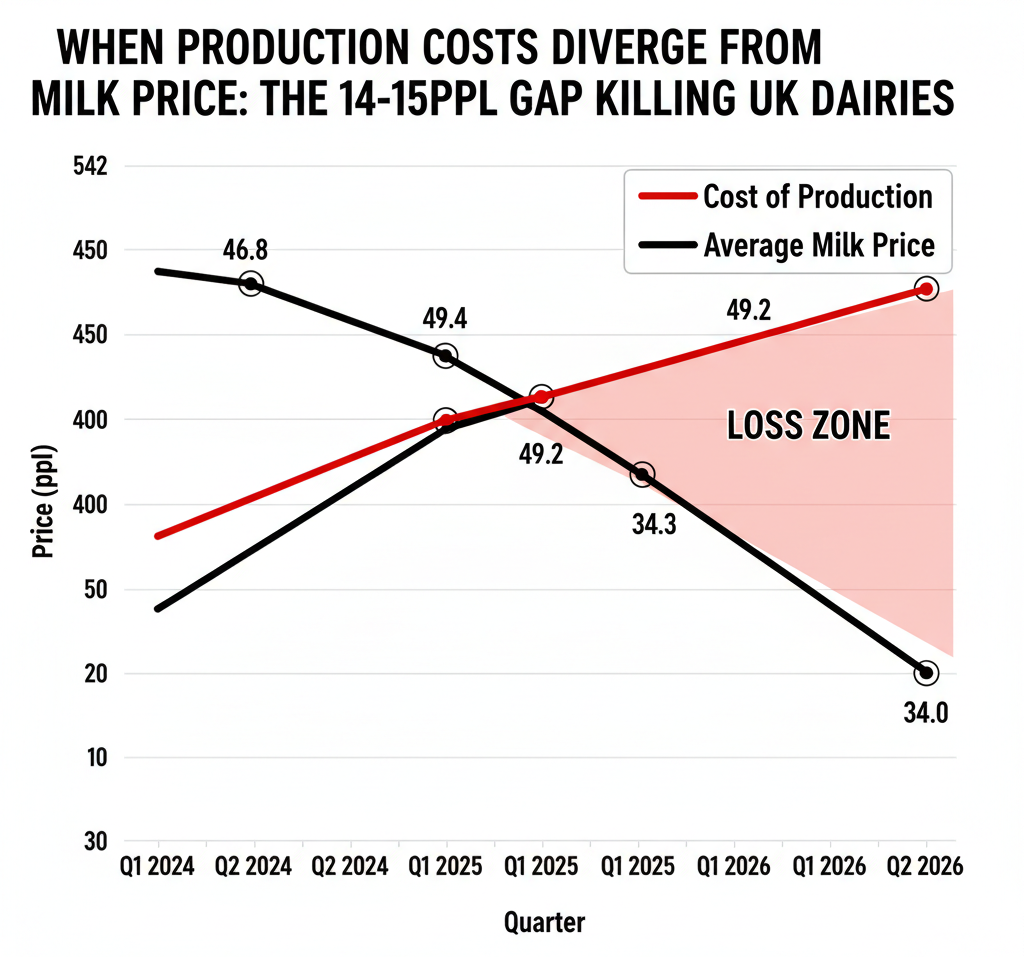
A 550‑cow Wisconsin dairy recently sat down with a farm financial counselor through an Extension‑affiliated program and pulled a full cost‑of‑production analysis. The producer thought his all‑in cost was about $17.25/cwt. When the spreadsheet included market‑rate family labor, real depreciation, current interest on all repriced debt, and health insurance, the true number came back at $18.75/cwt — right in line with UW Extension’s $18–$19/cwt benchmarks for mid‑size herds in the region. That $1.50 gap represented roughly $200,000 in annual losses he hadn’t really accounted for.
The cash‑flow picture was worse. Total liquidity: $227,000. Monthly burn at current prices: about $21,000. That’s eleven weeks of runway, not the five or six months he’d been carrying in his head.
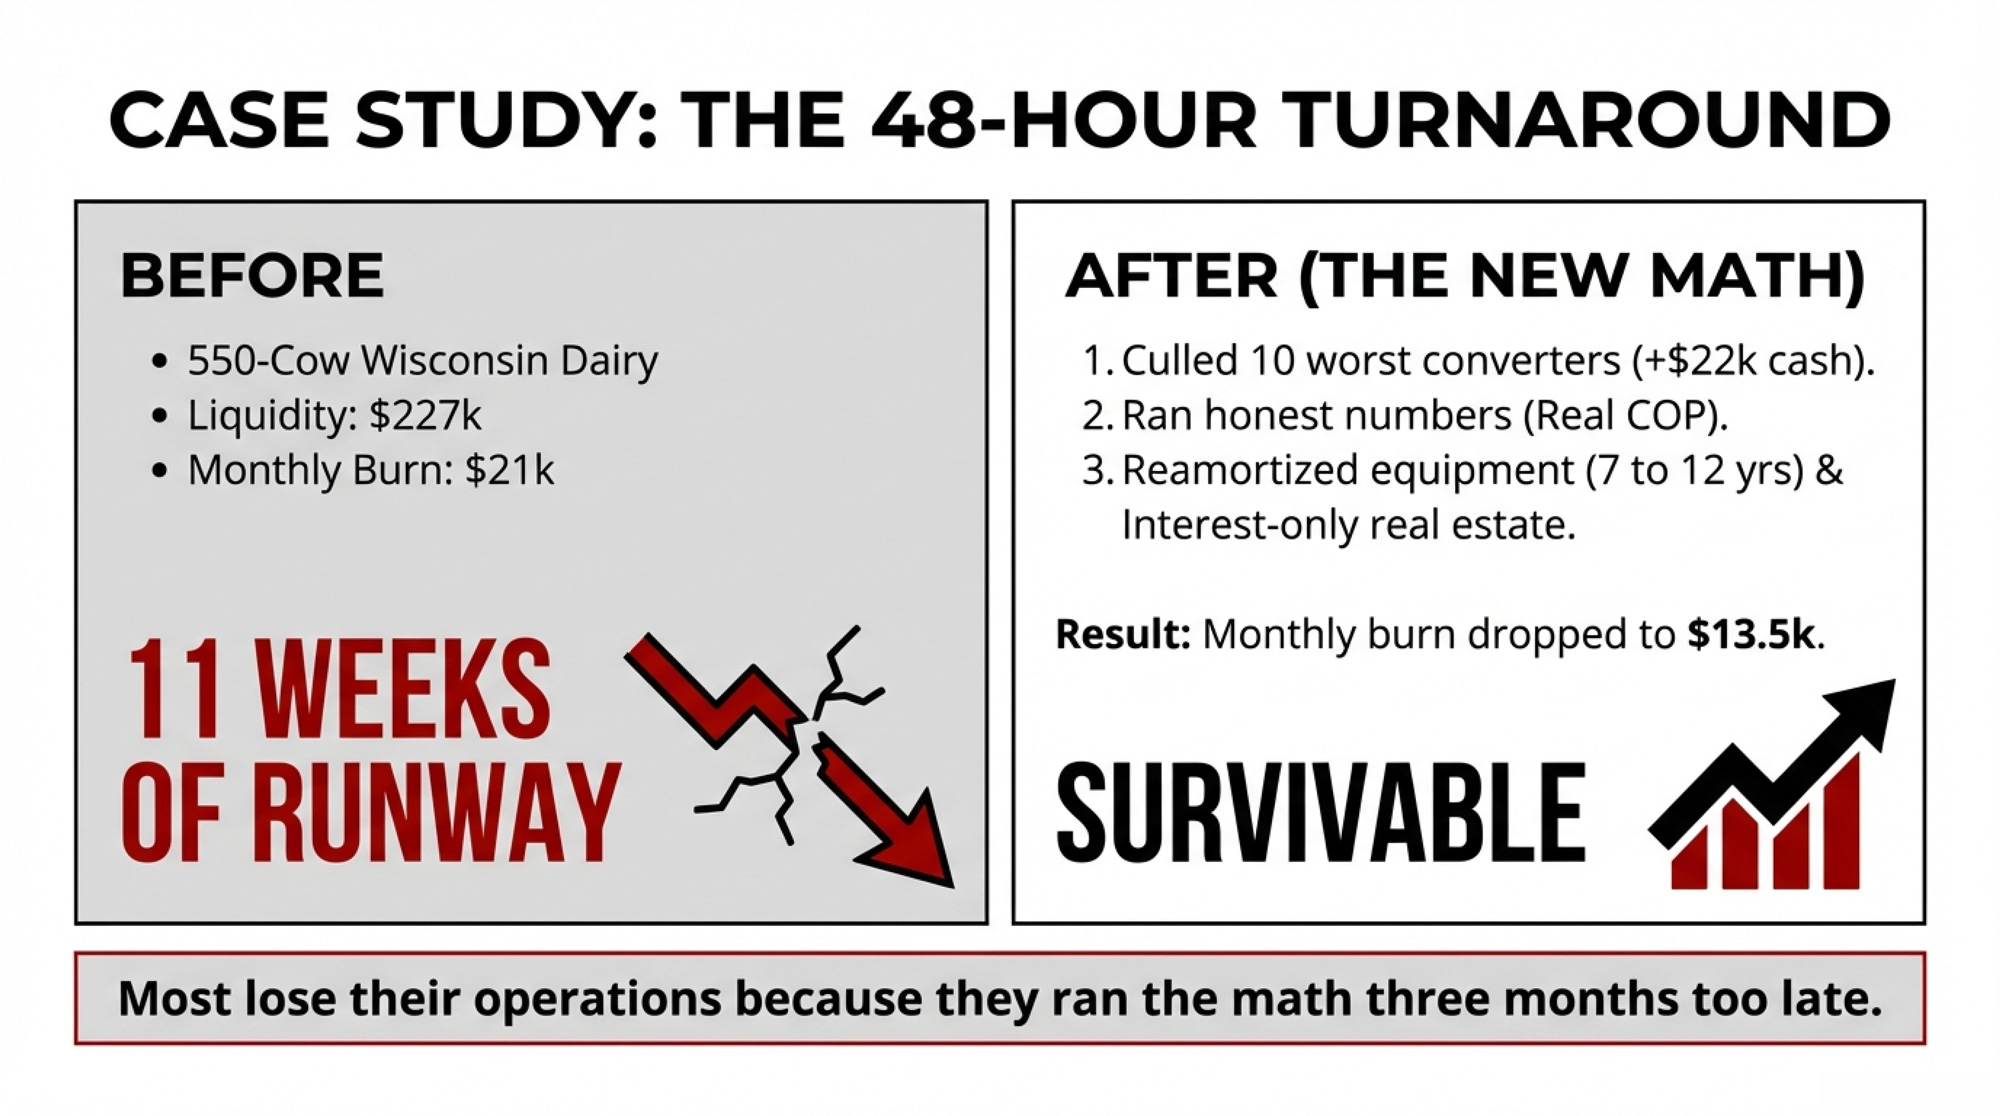
Here’s what changed everything. Within 48 hours, he:
- Culled his 10 worst feed‑to‑milk converters, bringing in roughly $22,000 in cash and cutting daily feed cost by about $85.
- Walked into his lender’s office with a 12‑month projection at $18/cwt and a real cost‑of‑production sheet.
- Negotiated reamortization on equipment debt (from seven years to twelve) and four months of interest‑only on real estate.
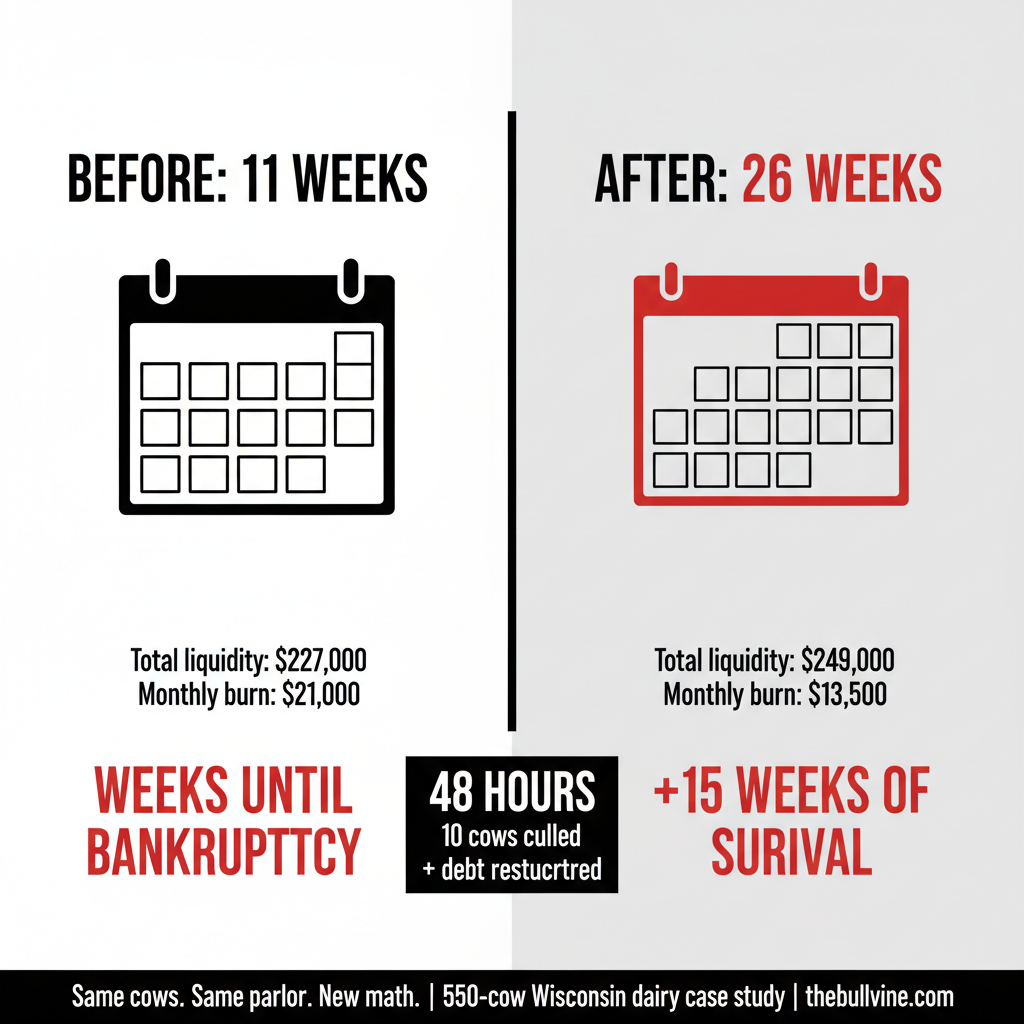
The lender said yes. Monthly burn dropped from $21,000 to roughly $13,500. Same cows. Same parlour. New math.
That 48‑hour response is the difference between survival and bankruptcy in this kind of year. Not new genetics. Not a magic ration. Not a unicorn contract. Just running the real numbers, believing what they tell you, and moving beforethe runway disappears.
Most producers who lose their operations in a down cycle don’t lose them because the math was impossible. They lose them because they ran the math three months too late. The difference between “tight but okay” and “weeks from the wall” is often just one honest accounting exercise.
The Beef Check Holding It All Together
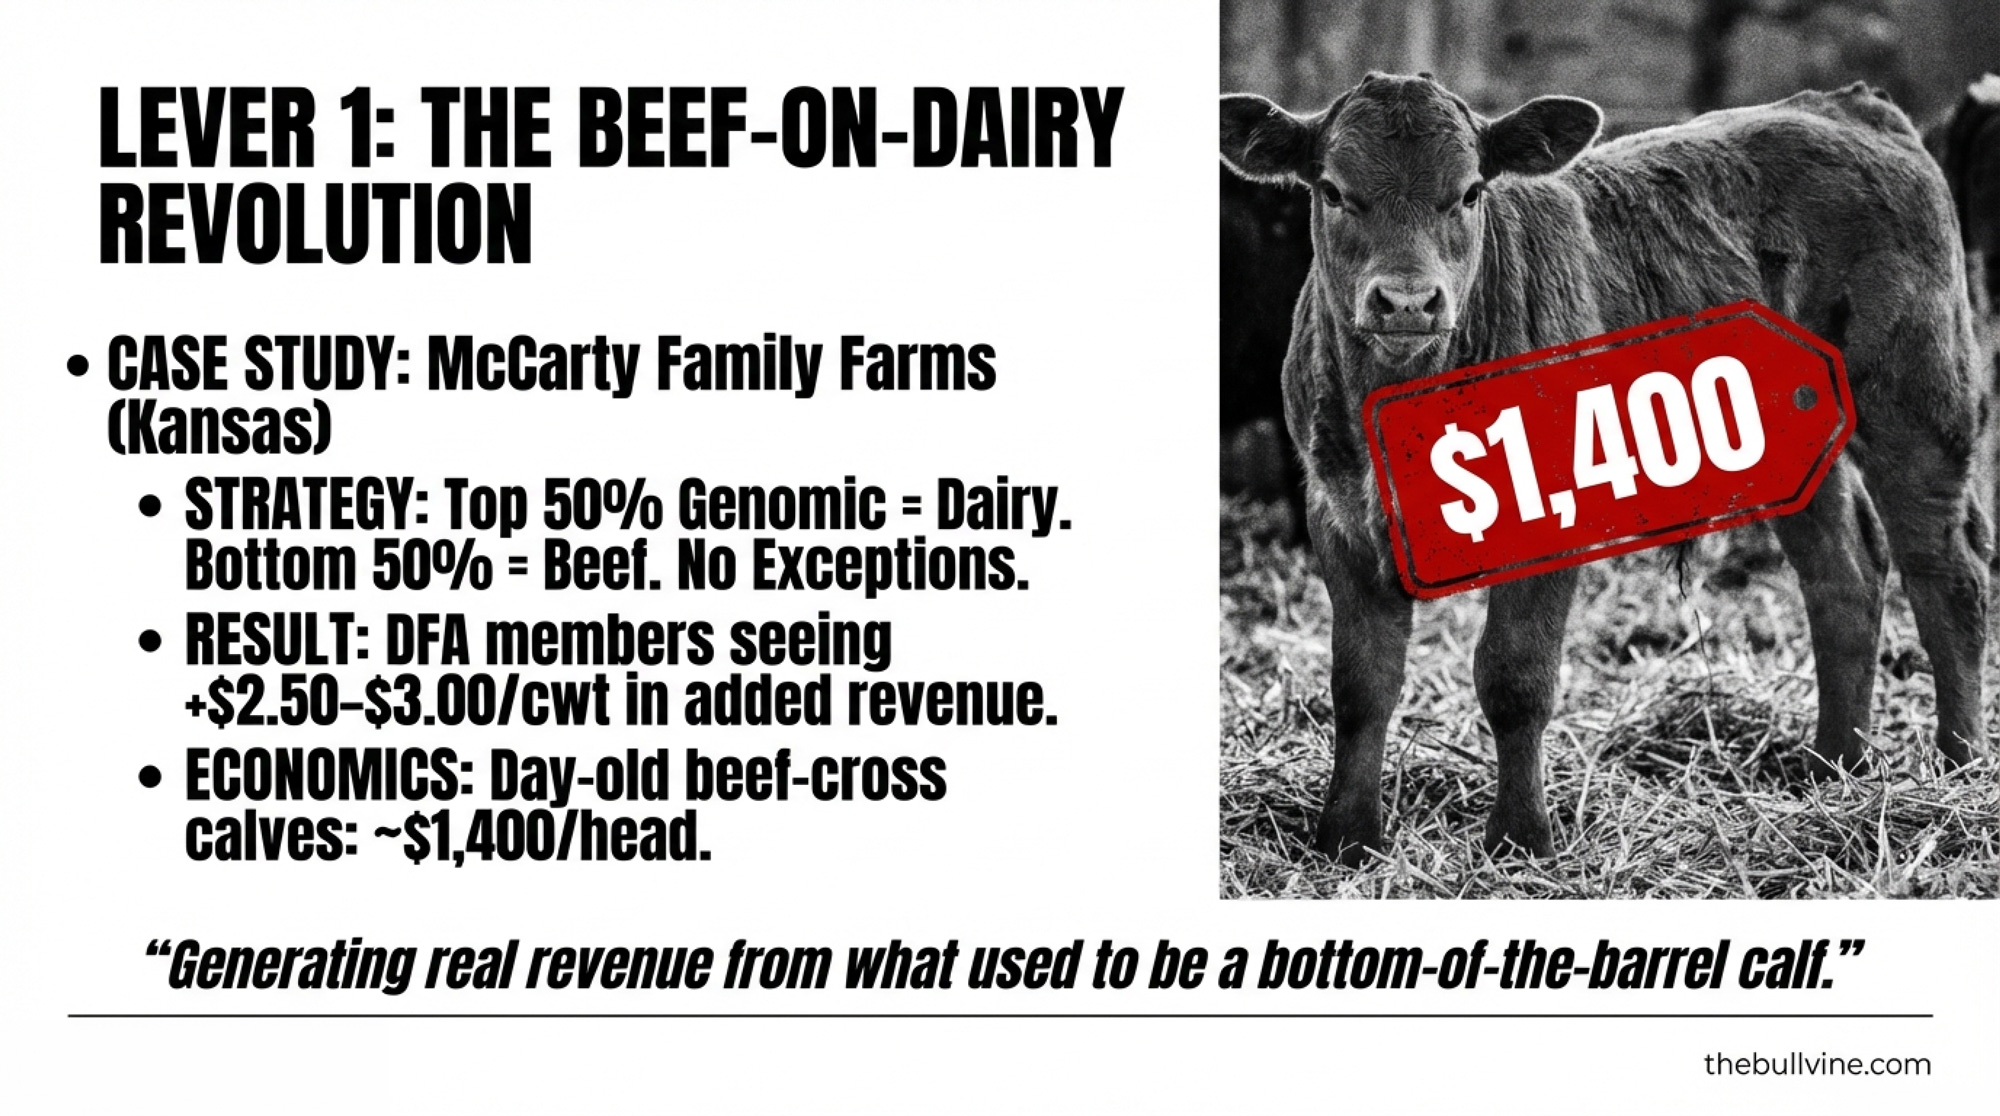
On a growing number of dairies, the milk margin alone isn’t keeping the lights on. Beef is.
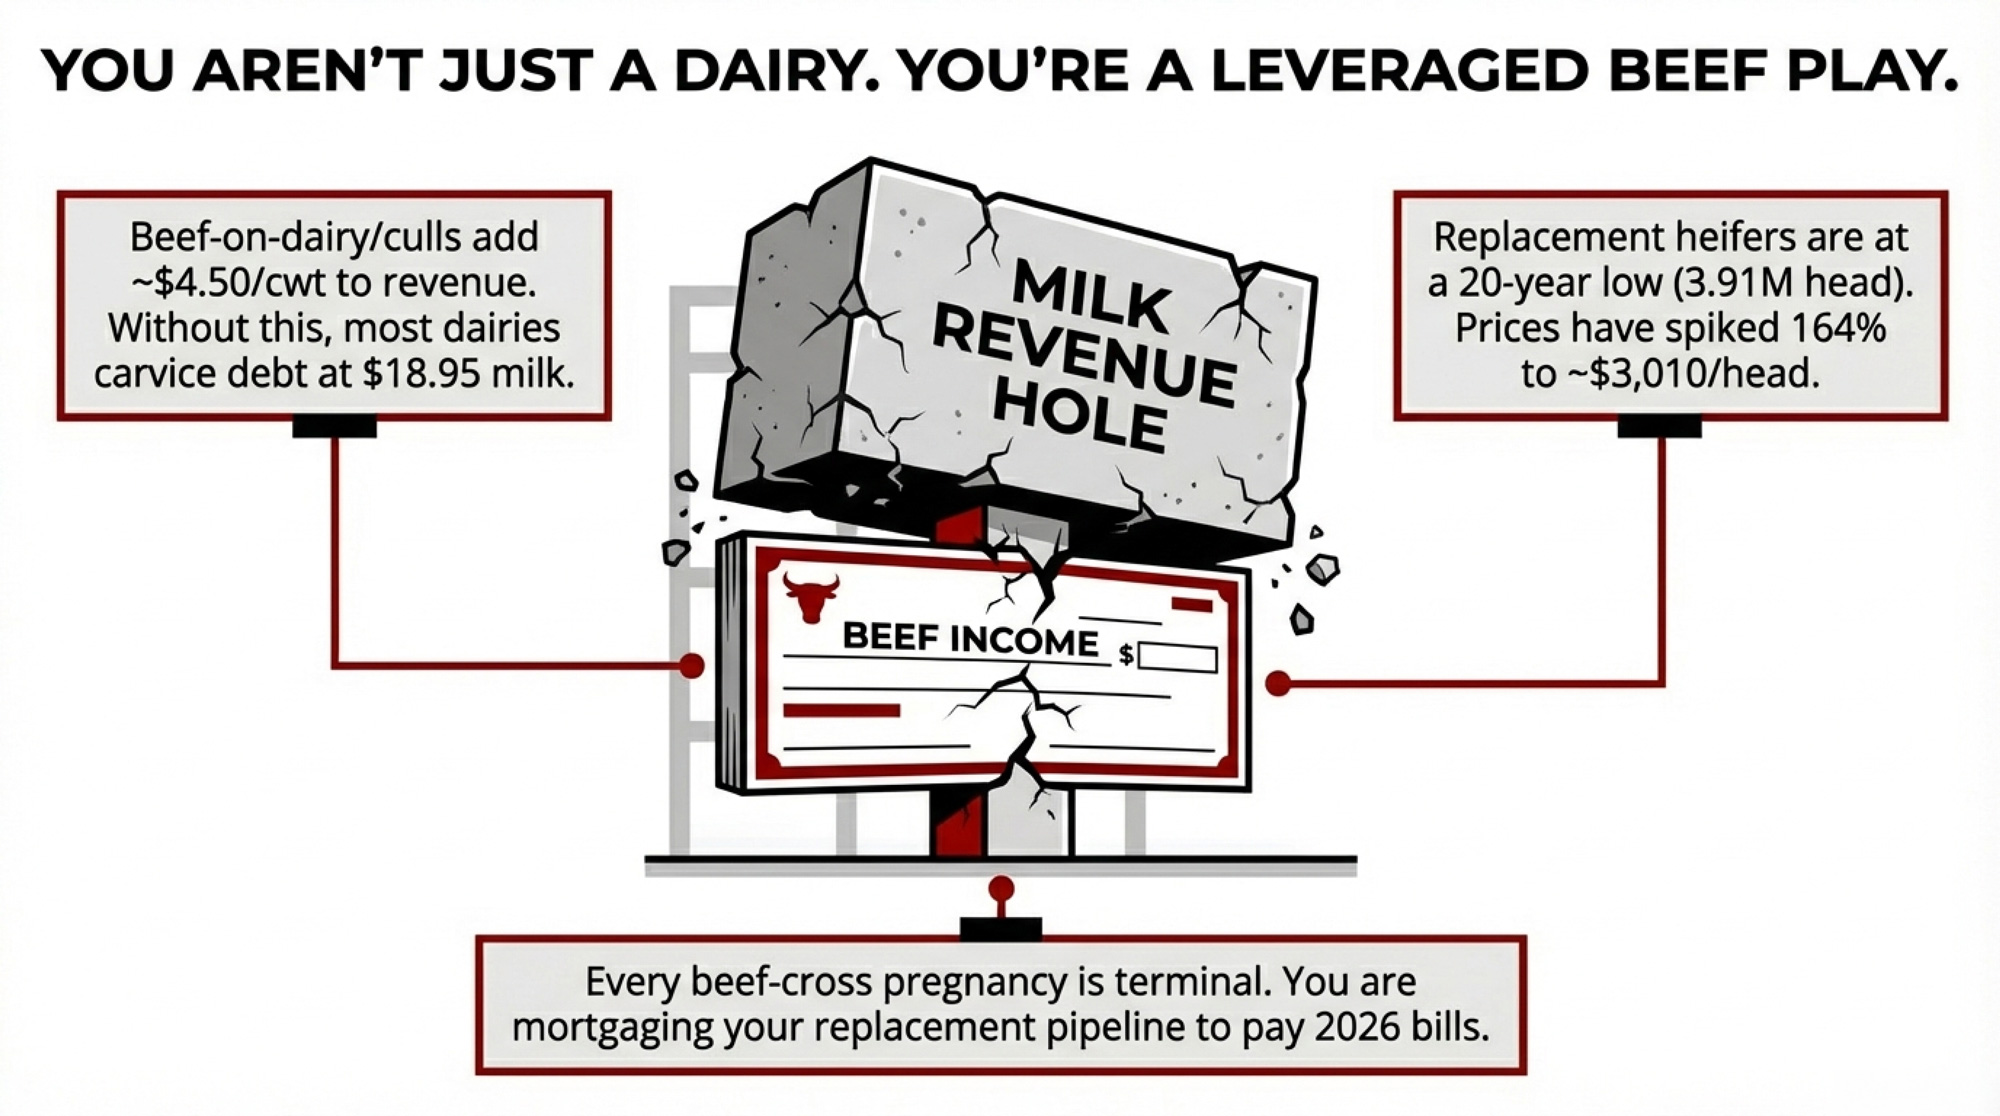
High Ground Dairy’s October 2025 analysis — based on a representative 1,000‑cow model — estimates beef‑related income north of $4.50/cwt of milk shipped, with seven of the next twelve months projected above $5.00/cwt. Those forward numbers are modeled, not guaranteed, but they reflect what you’ve seen in your own calf checks and cull slips.
On that 300‑cow herd shipping 69,000 cwt, $4.50/cwt in beef income adds up to about $310,000 a year — coming from the cattle market, not the milk market. Strip it out and ask honestly whether your milk margin alone services your current debt with all‑milk at $18.95 and Class III at $16.65.
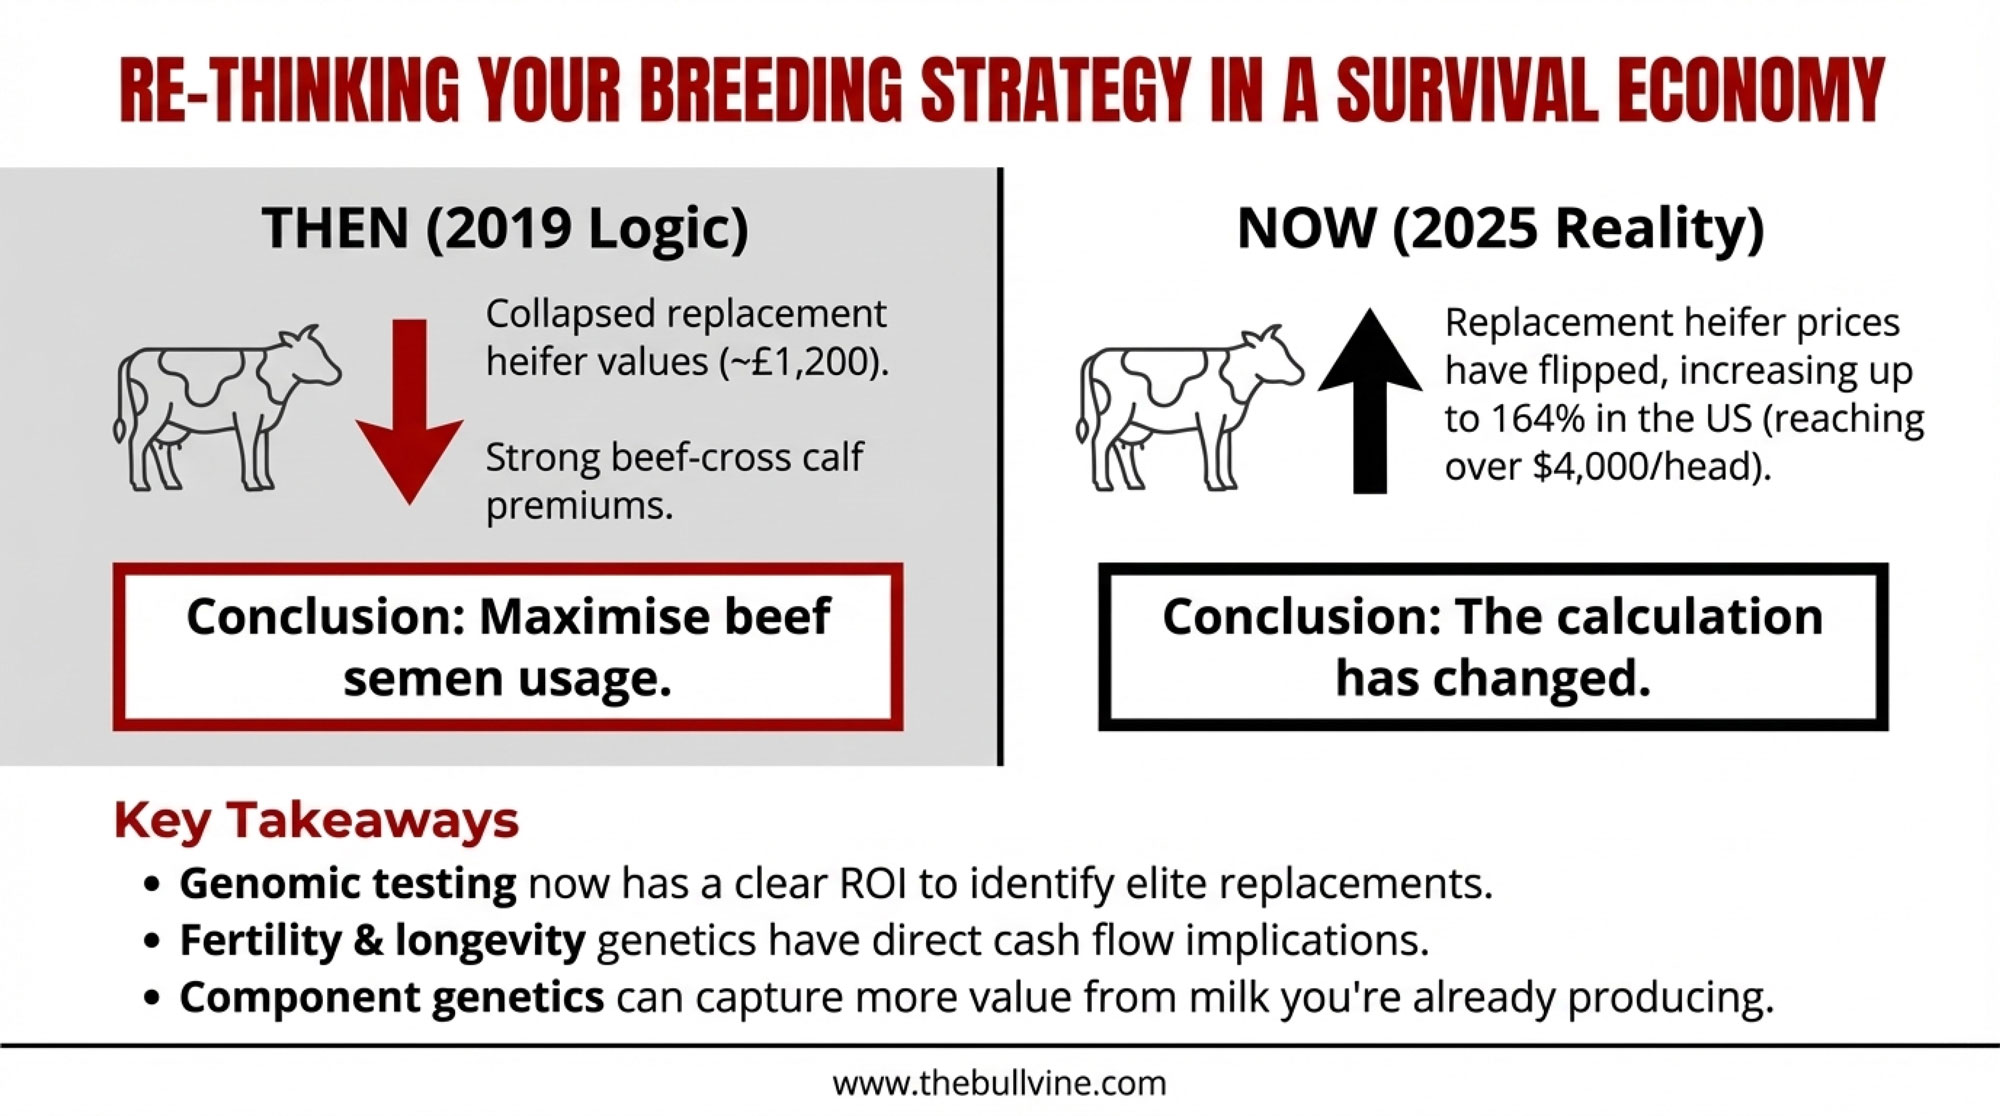
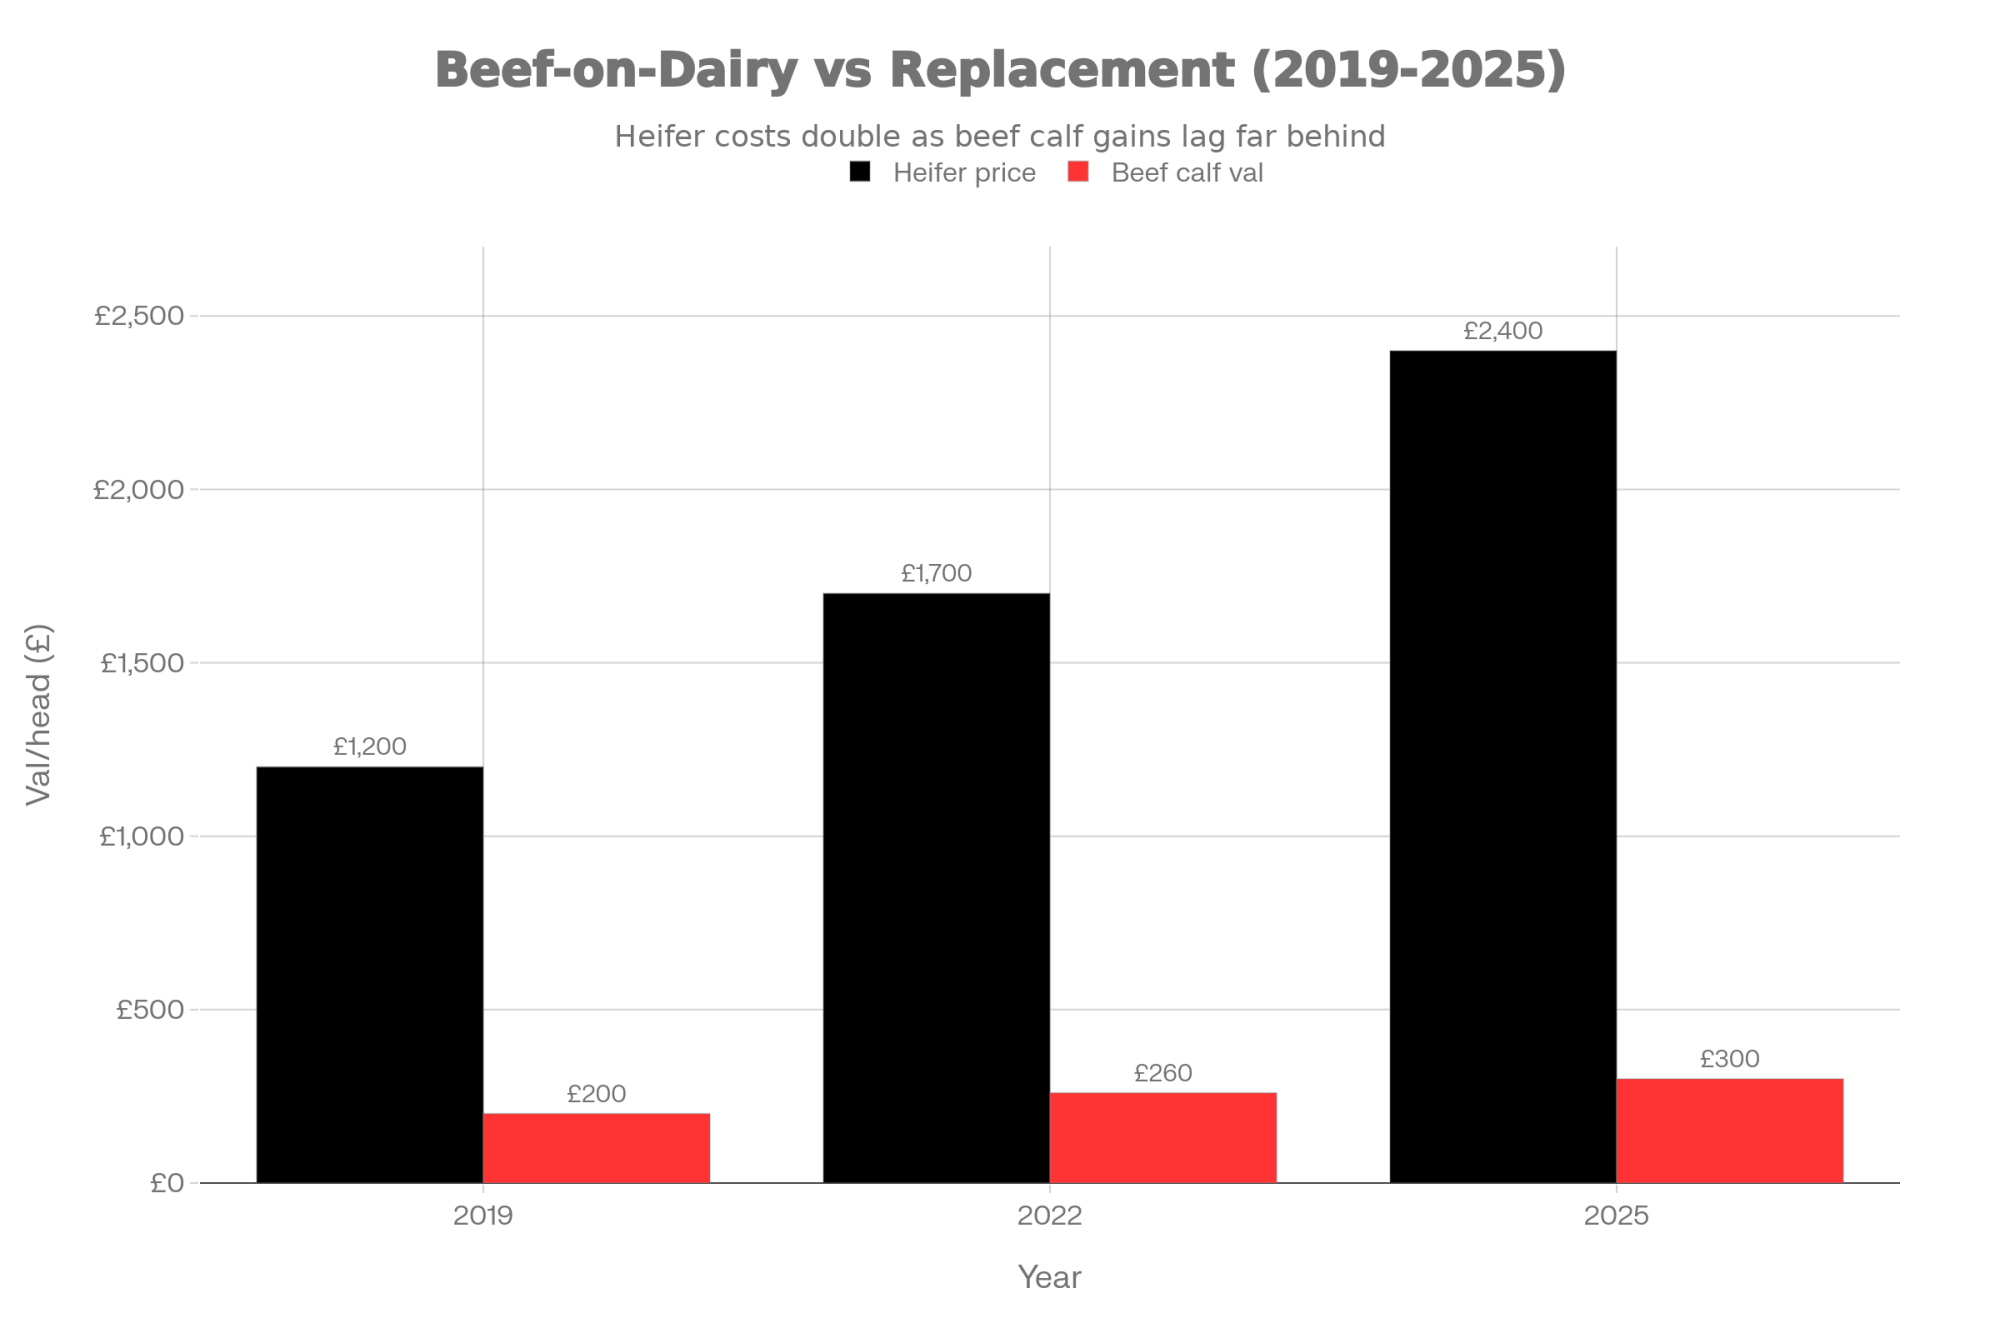
That beef check didn’t come free. CoBank’s August 2025 Knowledge Exchange report, authored by Corey Geiger and drawing on NAAB data, notes that beef semen sales into dairy nearly tripled from 2.5 million units in 2017 to 7.9 million in 2024. Conventional dairy semen sales fell hard over the same period.
Every beef‑cross pregnancy is terminal. No heifer behind it.
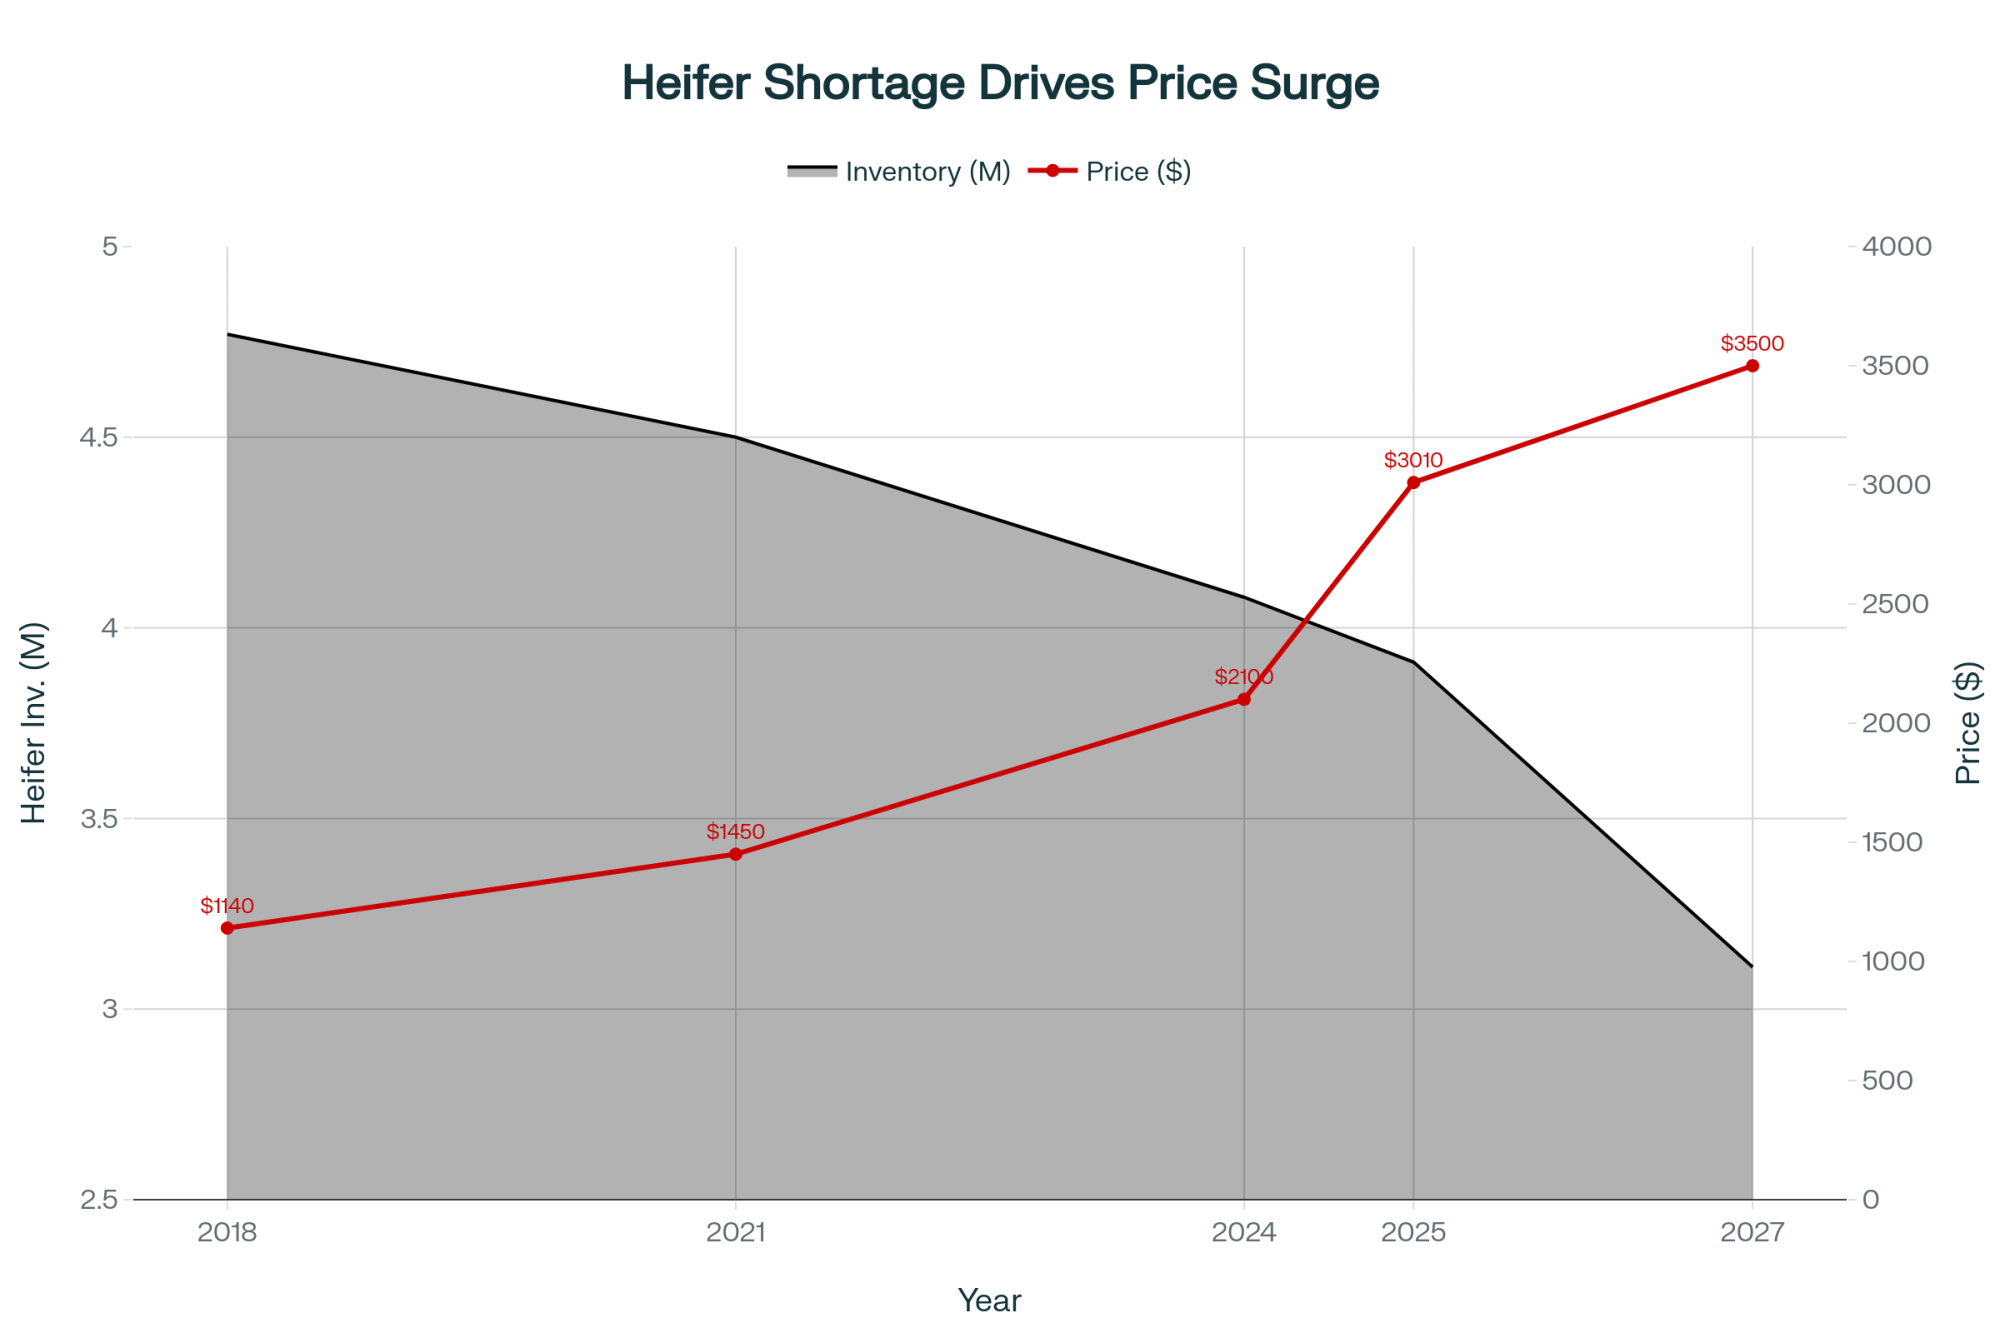
USDA’s January 2025 Cattle report shows dairy replacement heifers at a 20‑year low of 3.91 million head, down 18% from 2018. Geiger’s analysis highlights how that shortage shows up in prices: average dairy heifer values of $3,010/head in July 2025, up 164% from $1,140 in April 2019, with top sales in California and Minnesota clearing above $4,000/head. CoBank projects the heifer inventory will shrink by another 800,000 head over the next two years before stabilizing.
So yes, the beef check is saving a lot of balance sheets in 2026. It’s also mortgaging your replacement pipeline for the next three to four years.
When Beef Softens—Stress‑Testing the Safety Net
Cattle markets move in cycles. CattleFax’s outlook at CattleCon 2026 in Nashville earlier this month put the average 2026 fed steer price at $224/cwt, roughly steady with 2025, and cull cows around $155/cwt. COO Mike Murphy called current levels “near cyclical highs” and described a slow, measured expansion phase, as high input costs and producer demographics cap herd rebuilding.
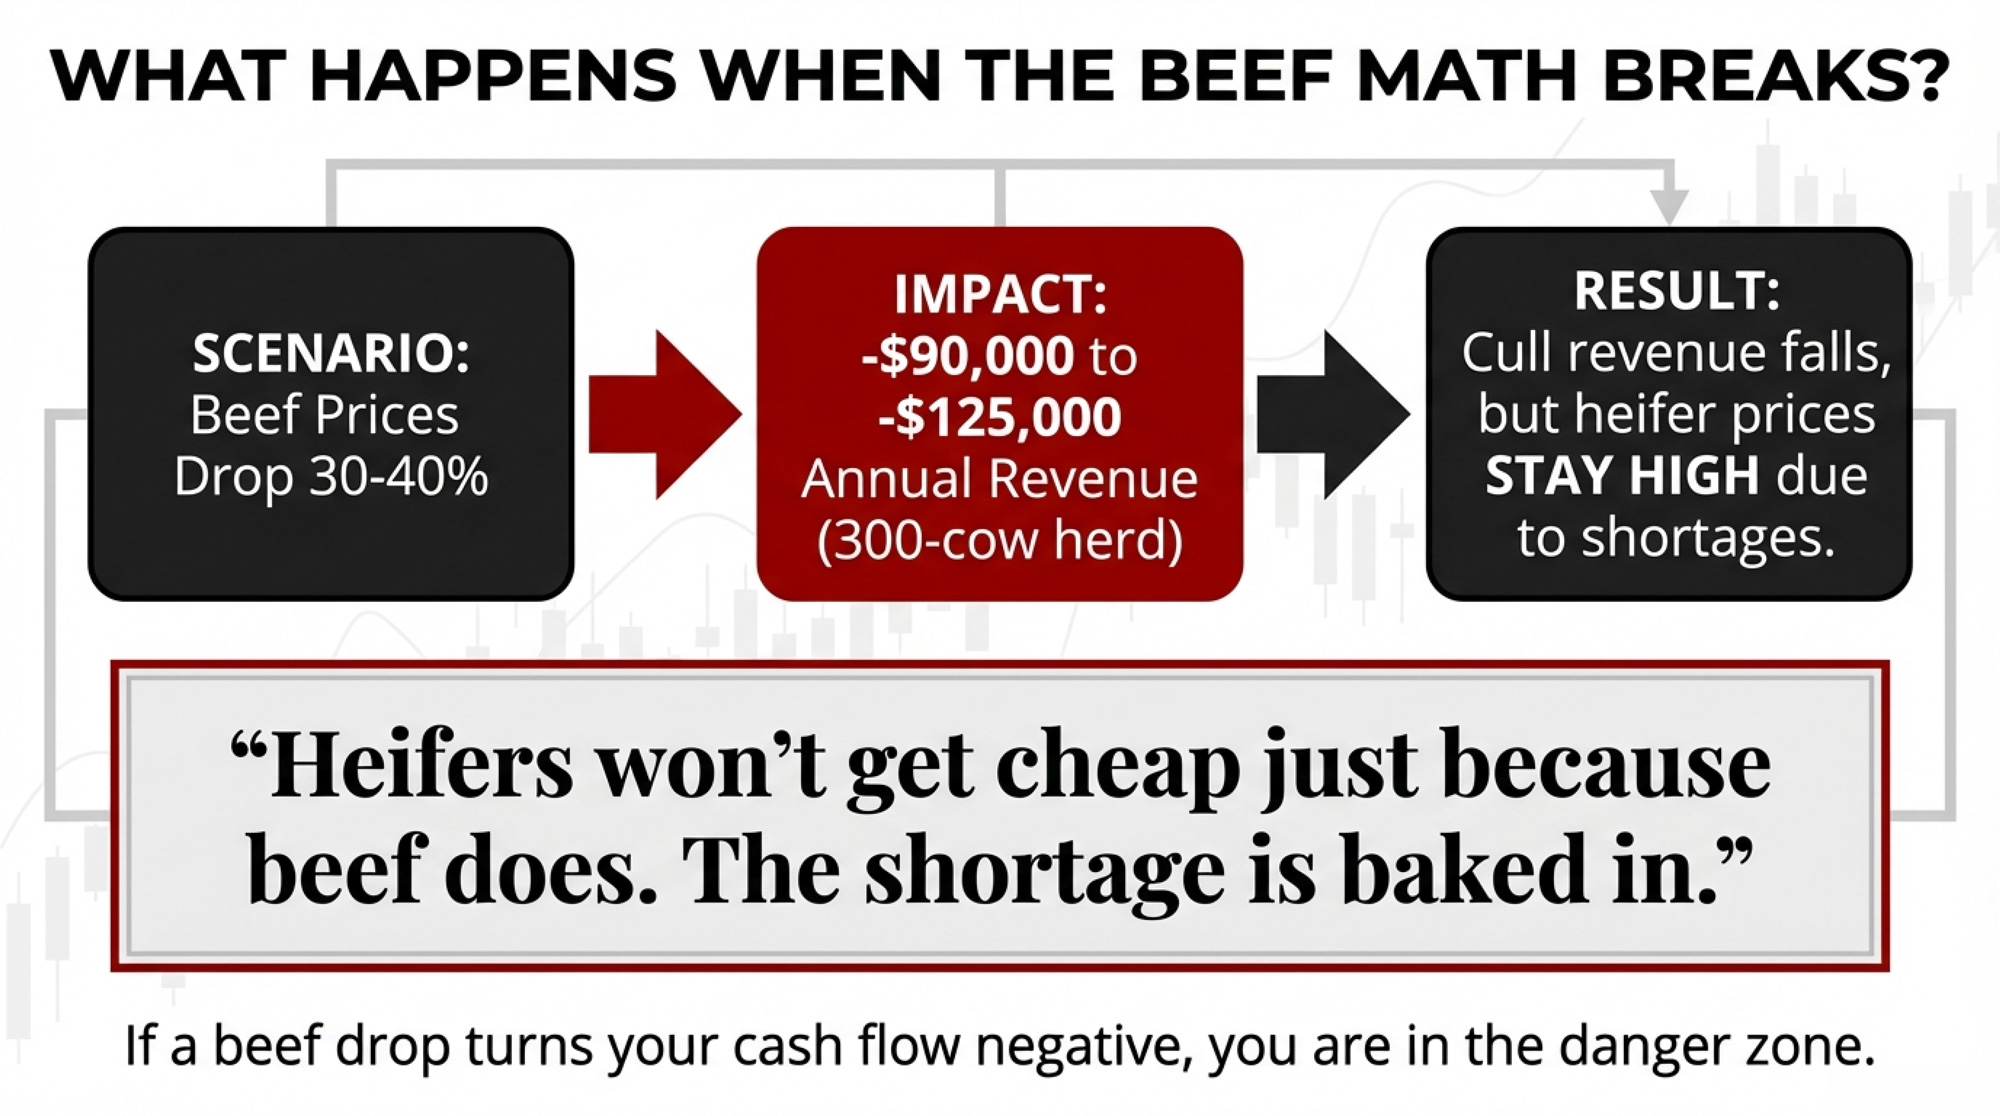
That suggests beef could stay supportive through 2026. But that’s not an excuse to skip the stress test.
A 30–40% drop in beef prices — well within range for a down cycle — would shave roughly $90,000–$125,000 off that $310,000 in annual beef revenue on a 300‑cow herd. You’d feel it on both sides: beef‑on‑dairy calf checks shrink, and cull revenue falls, while replacement heifers remain tight and expensive. Heifers won’t suddenly get cheap just because beef does; the structural shortage is baked in.
CoBank’s August 2025 work also points out that dairy producers have effectively “hoarded” about 611,600 cows from slaughter since Labor Day 2023, compared to the trend. If beef softens enough that everyone starts shipping at once, those cows hit the rail together — and the cull market falls harder. That’s how a softening beef market can turn from a warning sign into a full‑on margin squeeze.
The Canada Contrast
North of the border, the Canadian Dairy Commission boosted the farm‑gate milk price 2.3255% effective February 1, 2026. The CDC’s formula is straightforward: half the change in indexed cost of production (up 2.7%) plus half the change in CPI (up 1.9%).
Two pieces of that matter if you’re milking cows in the U.S.:
- When beef revenue is strong, it flows into Canada’s COP index as an offset, dampening their milk price increases. When beef weakens, the formula moves in the other direction. The system self‑corrects.
- The CDC cost formula includes feed, labor, and energy. DMC only looks at feed. Every non‑feed cost that’s blown out since 2022 — labor, interest, insurance, repairs — is invisible in your U.S. safety net.
Of course, Canada’s stability comes at a high price. Ontario quota traded above $24,000 per kilogram of butterfat per day in 2025. That locks out new entrants and caps growth. But if the question is whether you can make a five‑year investment decision without guessing where Class III will land next January, the Canadian model offers something the U.S. structure doesn’t: a rulebook.
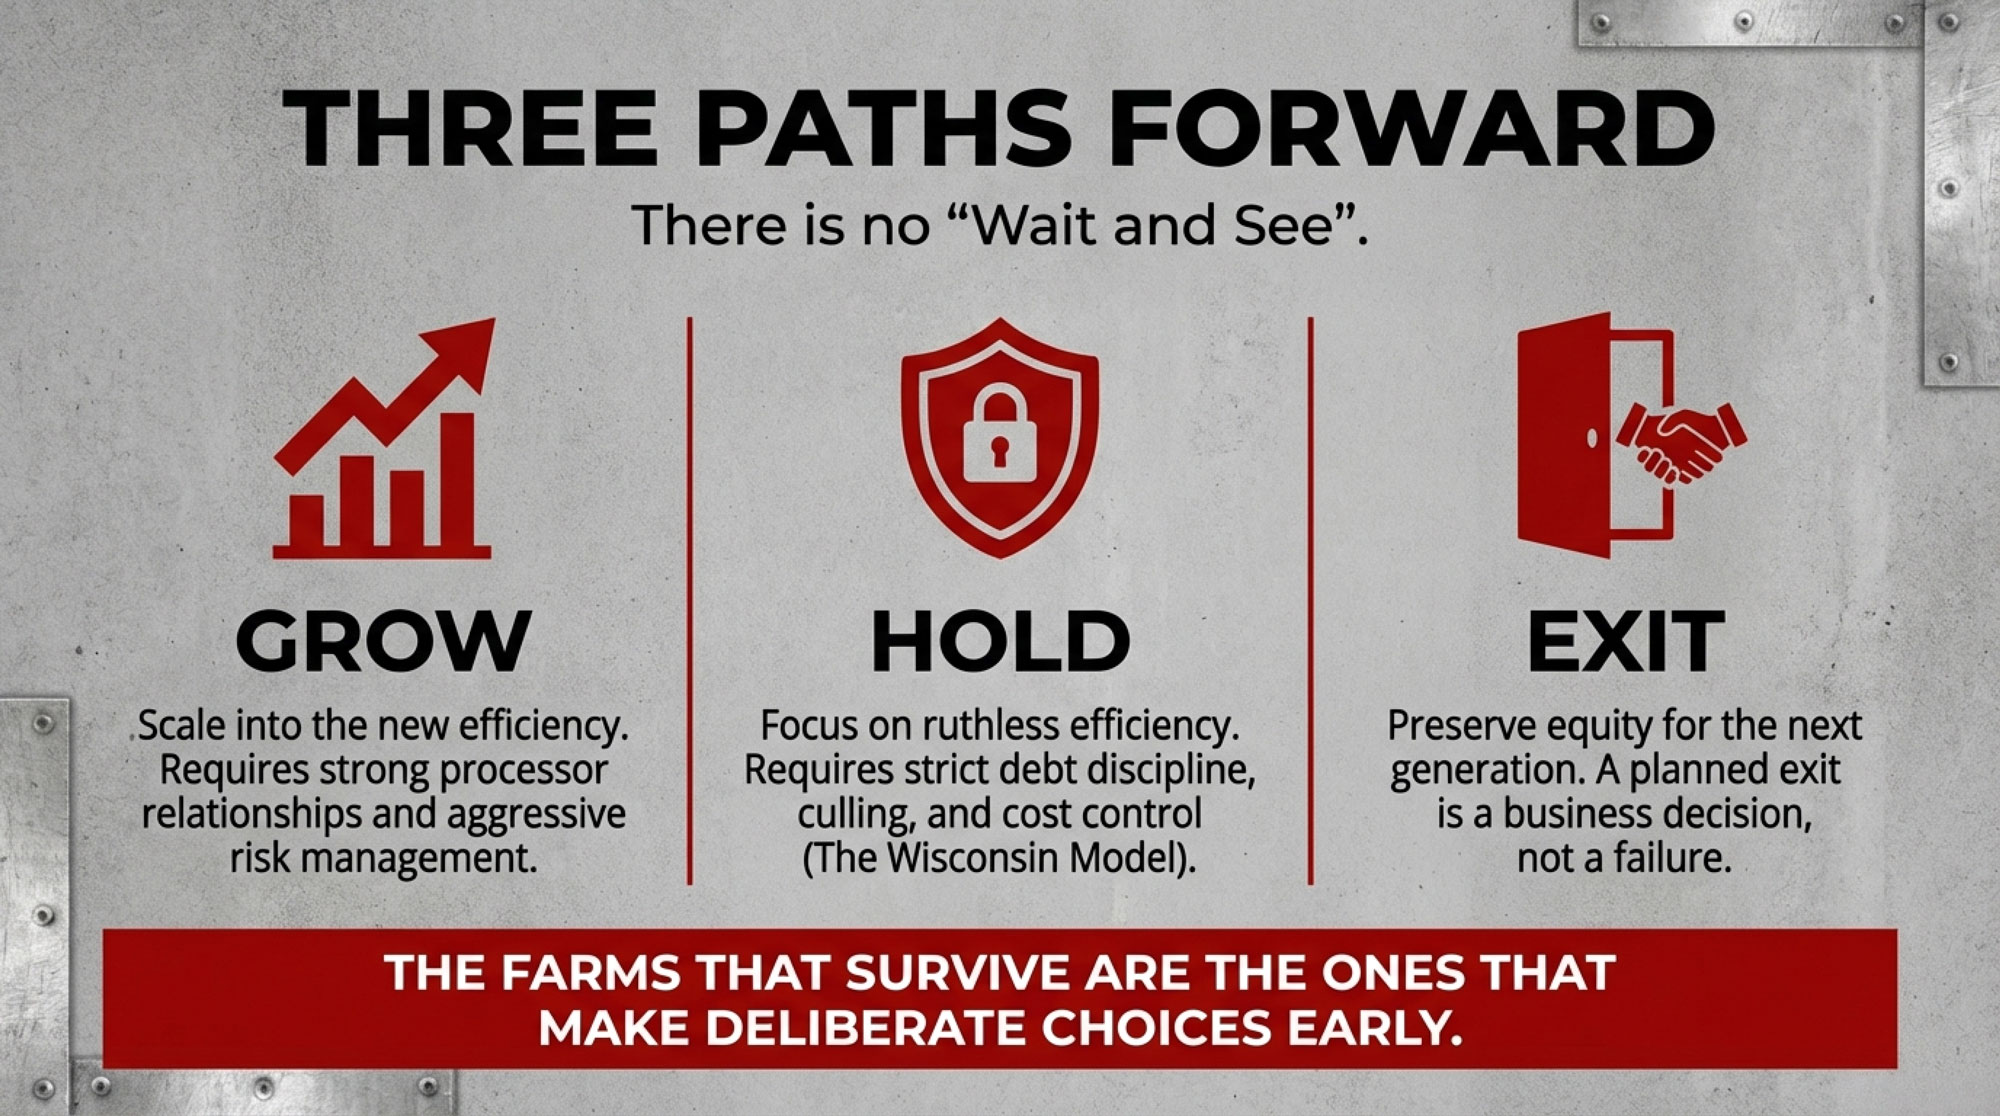
Four Paths—and What Each One Costs
| Strategy | Upfront Cost / Action | Monthly Cash Impact | Long-Term Trade-off | Best Fit If… |
|---|---|---|---|---|
| Component Optimization | Ration/genetics adjustment | +$0.58/cwt (down from +$0.98 in 2025) | Feed cost now, fat revenue later—only if BF price recovers | Your plant pays component premiums & you can wait for BF rebound |
| DMC/DRP Enrollment (by Feb 26) | Premium ~$1,500–$3,000/yr for $9.50 Tier 1 (25% discount if 6-yr commit) | +$0.30–$0.60/cwt margin support (feed only) | Doesn’t cover labor, debt, energy squeeze | You’re ≤270 cows, feed is your main cost pressure, & you’re not enrolled |
| Lender Restructuring | Time + full COP analysis | −$2,390/mo (example: $500k note, 7→12 yr) | +$115,600 extra interest over loan life | Cash flow is tight (<6 mo runway) but operation is viable at $18–$19 milk |
| Strategic Exit | Appraisal, auction, legal fees | Lump-sum: cull/heifer/land at current highs | You’re out of dairy | 3-yr projection at $18.95 milk leaves you with less equity than exiting now |
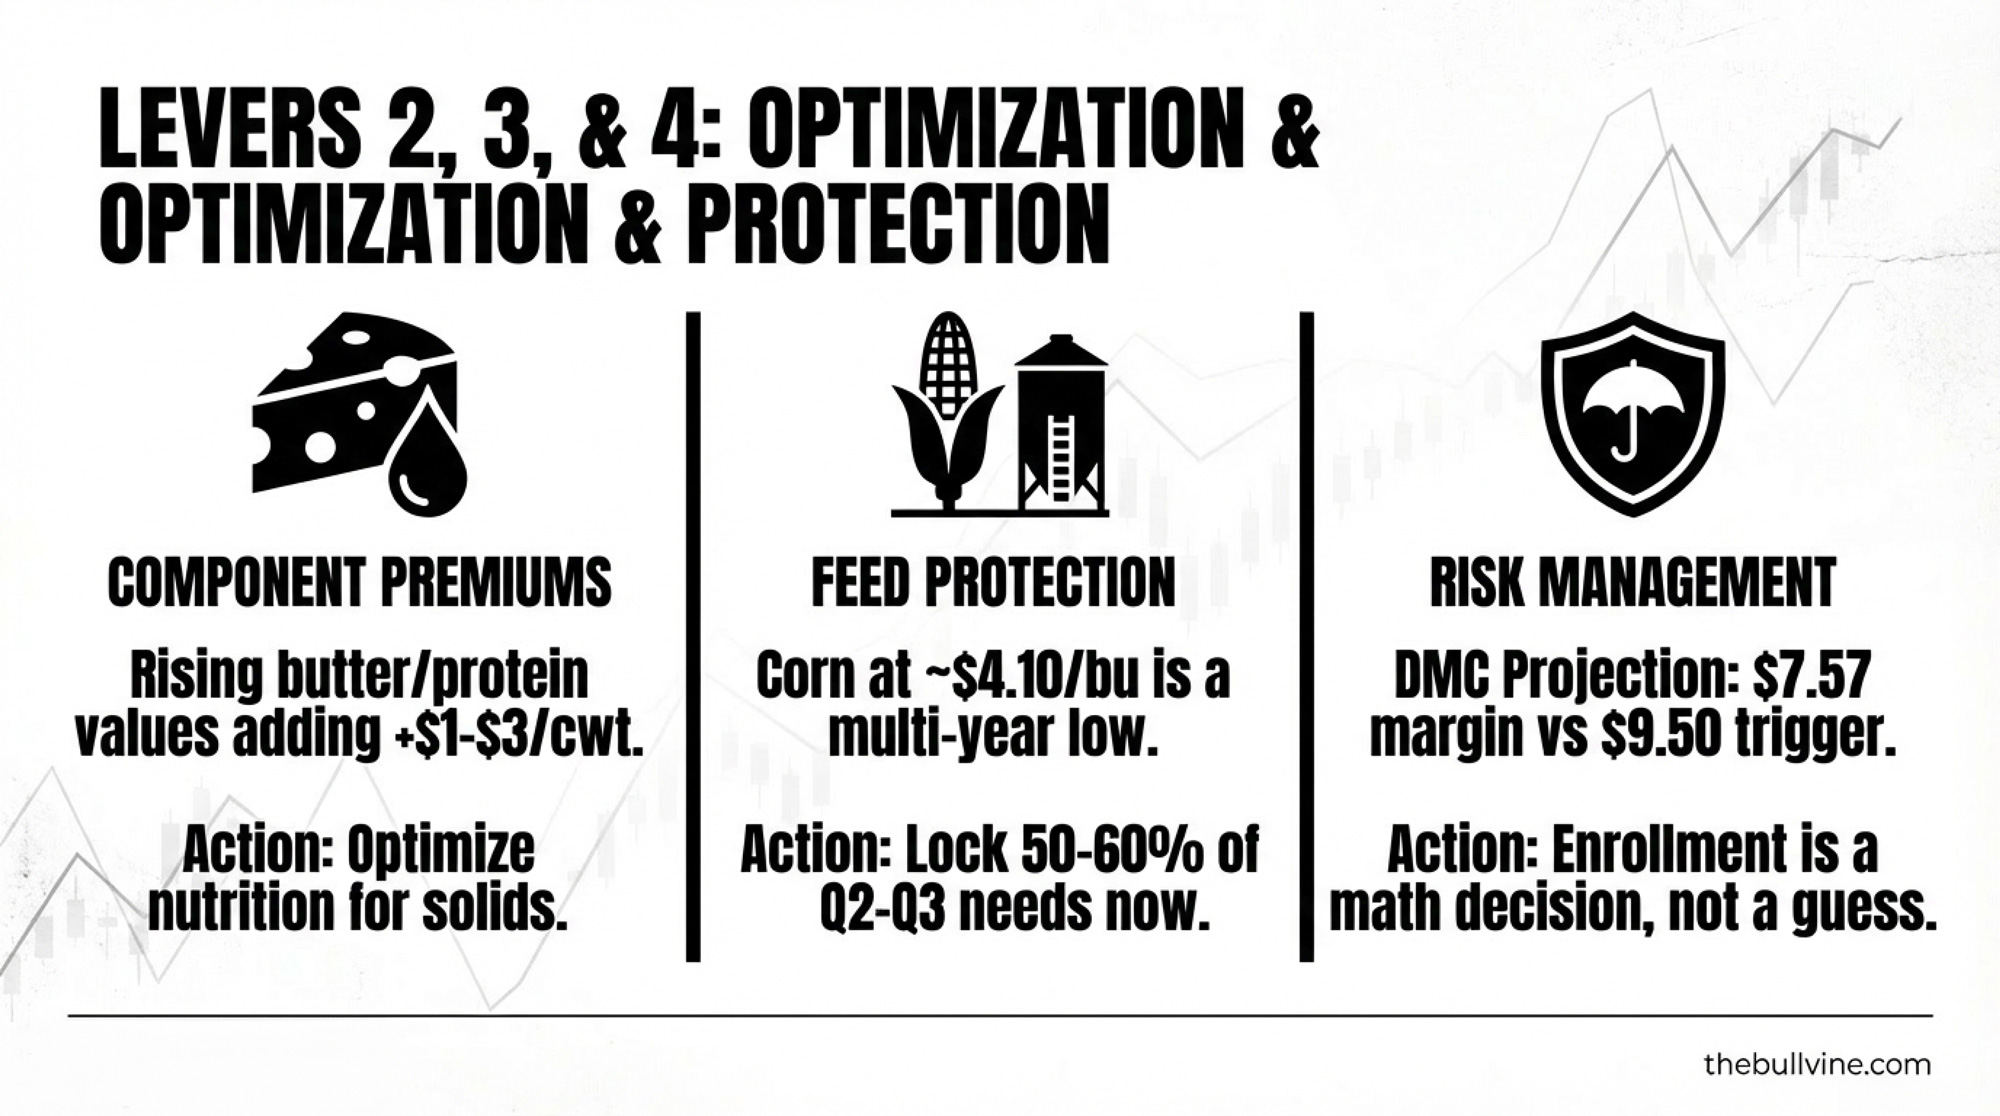
1. Component Optimization
Breeding and feeding for butterfat has been the go‑to growth lane. But the payoff depends entirely on when you’re selling that fat.
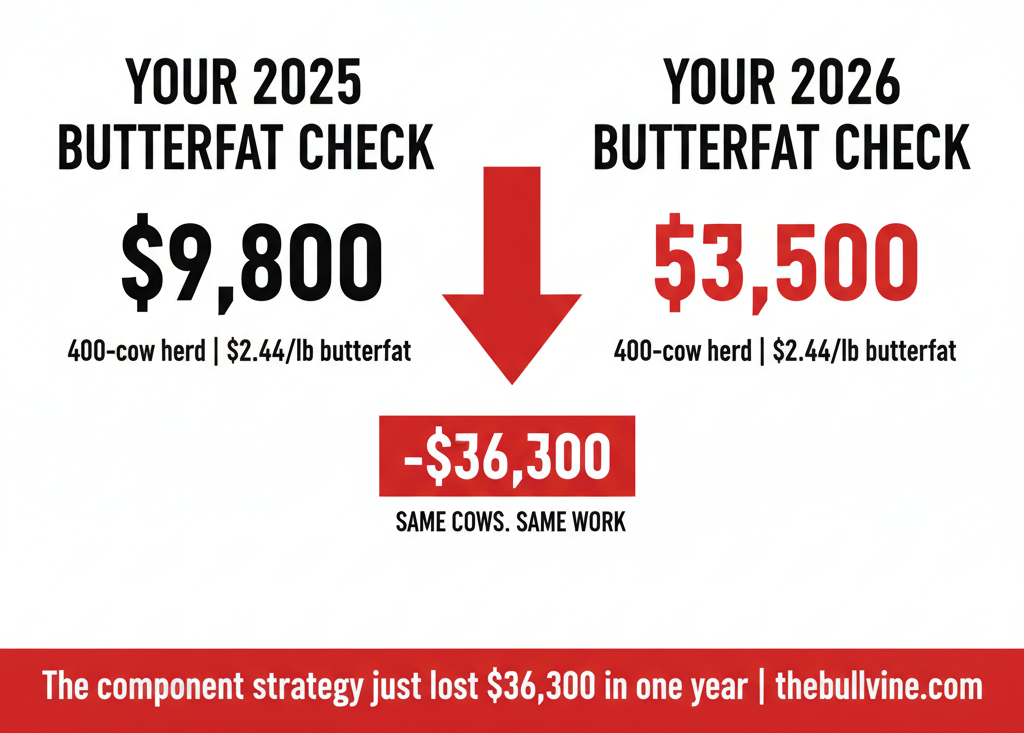
Butterfat premium: same herd, two prices
(400‑cow herd, 23,000 lbs/cow, 3.8% → 4.2% BF = 36,800 extra lbs fat/year)
| Metric | 2025 Average | January 2026 | Change |
| FMMO butterfat price | $2.44/lb | $1.4525/lb | −40% |
| Extra fat revenue | $89,800/yr | $53,500/yr | −$36,300 |
| Revenue gain per cwt shipped | $0.98/cwt | $0.58/cwt | −$0.40/cwt |
Source: USDA AMS CLS‑0126 (Feb 4, 2026) and 2025 monthly component price averages.
If you’re still budgeting on 2025 butterfat prices, you’re overstating your 2026 margin by about $0.40/cwt before you even start the mixer. If your plant pays on straight hundredweight with no component bonus, the math is even uglier—you’re carrying the extra feed cost without seeing the fat check.
Trade‑off: Components still matter, but the days of butterfat bailing out every hole in the budget are on pause until that $/lb recovers.
2. Risk Management Enrollment—Before February 26
This one’s on a hard deadline.
The One Big Beautiful Bill Act (OBBBA) reinstated the Dairy Margin Coverage program for 2026–2031 and expanded Tier 1 coverage to 6 million pounds of production history at up to $9.50/cwt margin coverage. Producers who lock in all six years get a 25% premium discount, according to the University of Minnesota Extension’s January 27 enrollment guide. Production history is based on your highest marketings from 2021, 2022, or 2023.
Six million pounds covers roughly a 270‑cow herd at 22,000 lbs/cow. Everything above that needs to be managed with DRP, futures, or options. LRP can backstop your calf and cull revenue.
Trade‑off: DMC only sees feed costs. If your margin squeeze is coming from debt service, labor, or energy, DMC checks help the feed side, but don’t fix the whole picture. Minnesota producers should also look hard at the state’s DAIRI program, which ties about $3 million in state funds to DMC participation.
3. Lender Engagement—Early, With Real Numbers
The Wisconsin producer’s experience is the template.
Showing up with a full cost‑of‑production sheet, a 12‑month cash flow at $18–$19 milk, and a specific restructuring ask is a completely different conversation than showing up after you’ve bounced a check.
Reamortization math: $500,000 note at 7.5%
| Metric | 7-Year Term | 12-Year Term | Difference |
| Monthly payment | $7,670 | $5,280 | −$2,390/mo (−31%) |
| Annual debt service | $92,040 | $63,360 | −$28,680/yr |
| Total interest paid | $144,200 | $259,800 | +$115,600 |
You buy yourself $2,390/month of breathing room. It costs you about $115,600 in extra interest over the life of the loan. That’s the price of survival time. It might be the smartest money you ever “spend” — or a trap that keeps you grinding at breakeven for another decade.
4. Strategic Exit While Asset Values Hold
Cull cows are still historically strong. Heifers are historically tight. Land values in a lot of dairy regions are still holding.
That convergence won’t last forever. A controlled dispersal while beef and heifer markets stay firm may protect more family equity than grinding through three more years of thin or negative margins.
Trade‑off: Put hard numbers on “stay” vs. “go.” If a realistic three‑year plan at $18.95 all‑milk and $16.65 Class III leaves you with less net worth than exiting this year at today’s cull, heifer, and land prices, you’re not just hanging on — you’re burning equity.
What This Means for Your Operation
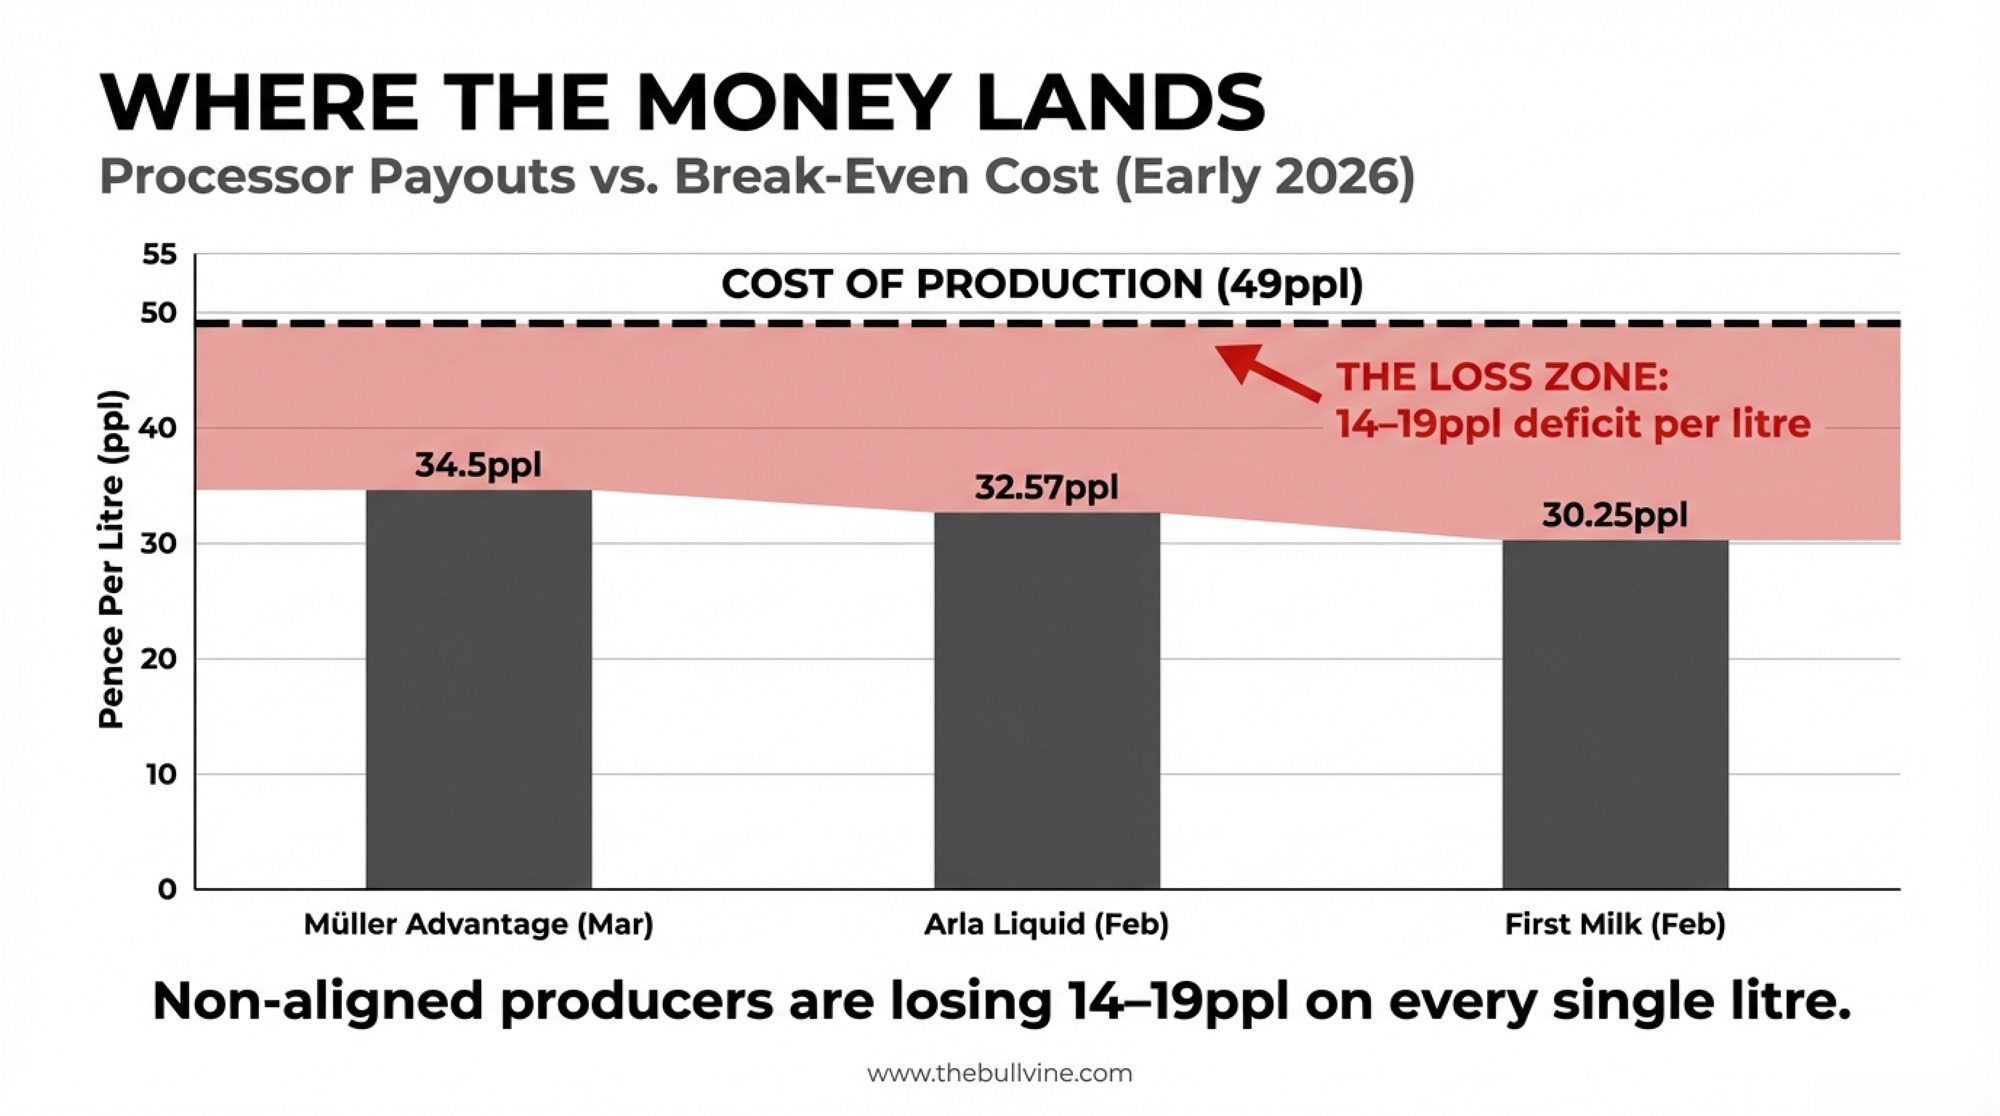
- Pull your full economic cost of production this month. Include market‑rate family labor, depreciation, interest at current rates, and insurance. If you’re a mid‑size Upper Midwest herd and your real COP is above $19/cwt, the new $18.95 all‑milk forecast still leaves you below water on a full‑cost basis, even before you stress‑test beef.
- Re‑run your 2026 plan at $18.95 all‑milk and $16.65 Class III. Use the February WASDE numbers, not January’s $18.25. Then layer in what you’ve actually been paid so far — January’s $14.59 Class III and your local basis. If your DSCR drops below 1.0 in that scenario, the lender conversation needs to happen in the next 30 days, not after planting.
- Enroll in DMC before February 26 if you’re eligible. At $9.50/cwt, Tier 1 on 6 million pounds with a 25% premium discount is cheap margin insurance for the feed side of your budget. DMC won’t solve your whole problem, but it’s a mistake to leave it on the table if you qualify.
- Stress‑test your dependence on the beef check. Take your last 12 months of calf and cull revenue per cwt. Knock it down 40%. If your operation swings from positive to negative cash flow on that single change, you’re not just a dairy — you’re a leveraged beef play.
- Reprice your component strategy at January 2026 values. Don’t carry 2025’s $2.44/lb into a world where butterfat is paying $1.45/lb. If your component‑chasing feed cost doesn’t pencil at $0.58/cwt extra revenue, adjust the ration or the breeding plan.
- Count your runway honestly. Total cash + undrawn operating line, divided by true monthly burn rate, gives you months of runway. Under six months means it’s time to call the lender, the nutritionist, and your Extension economist. Under three months means you’re in triage.
Key Takeaways
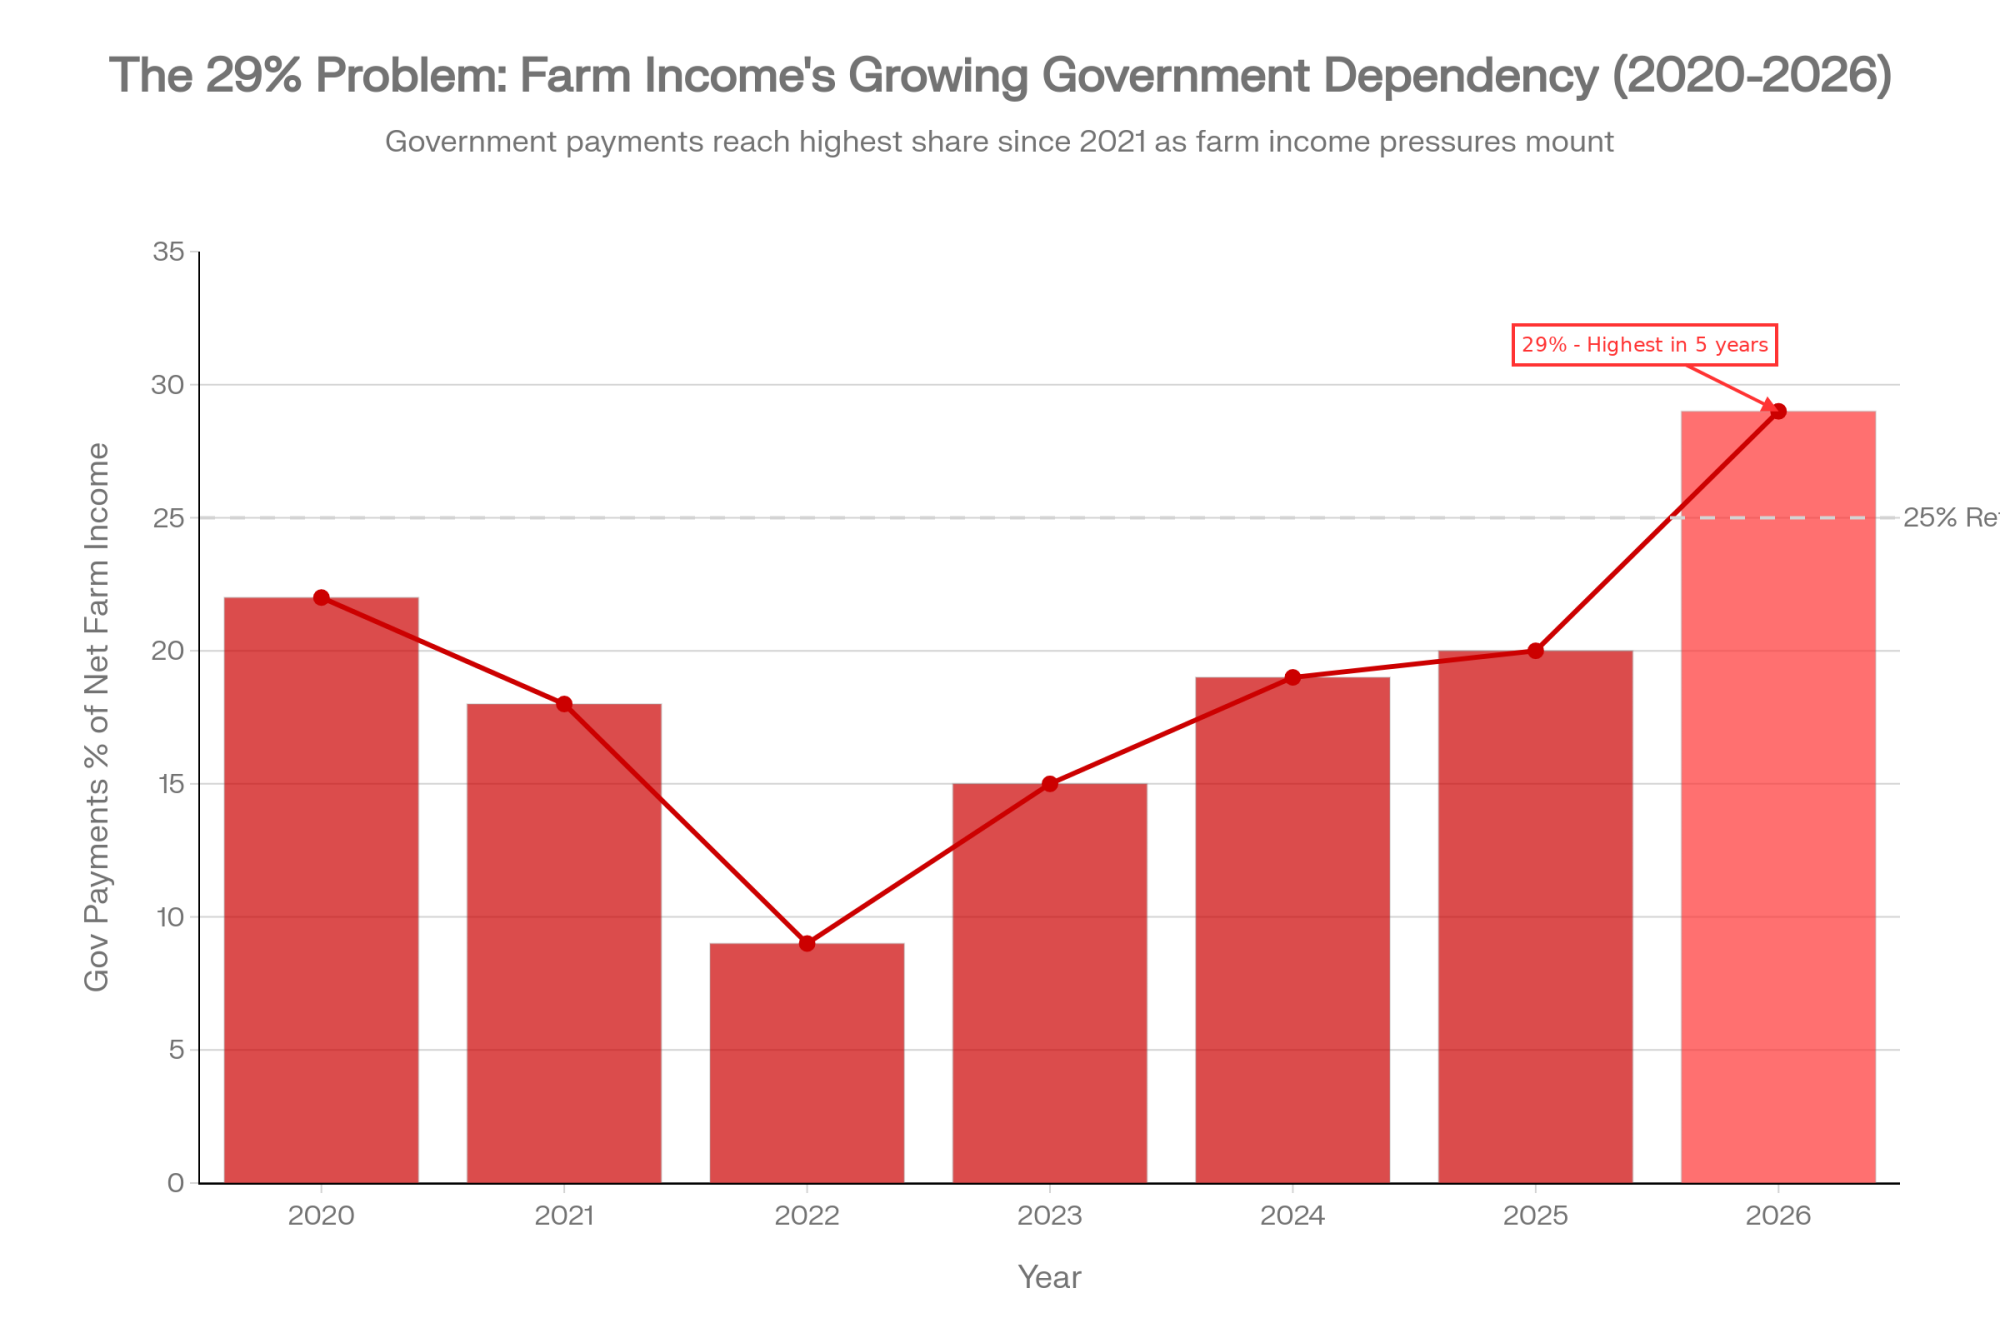
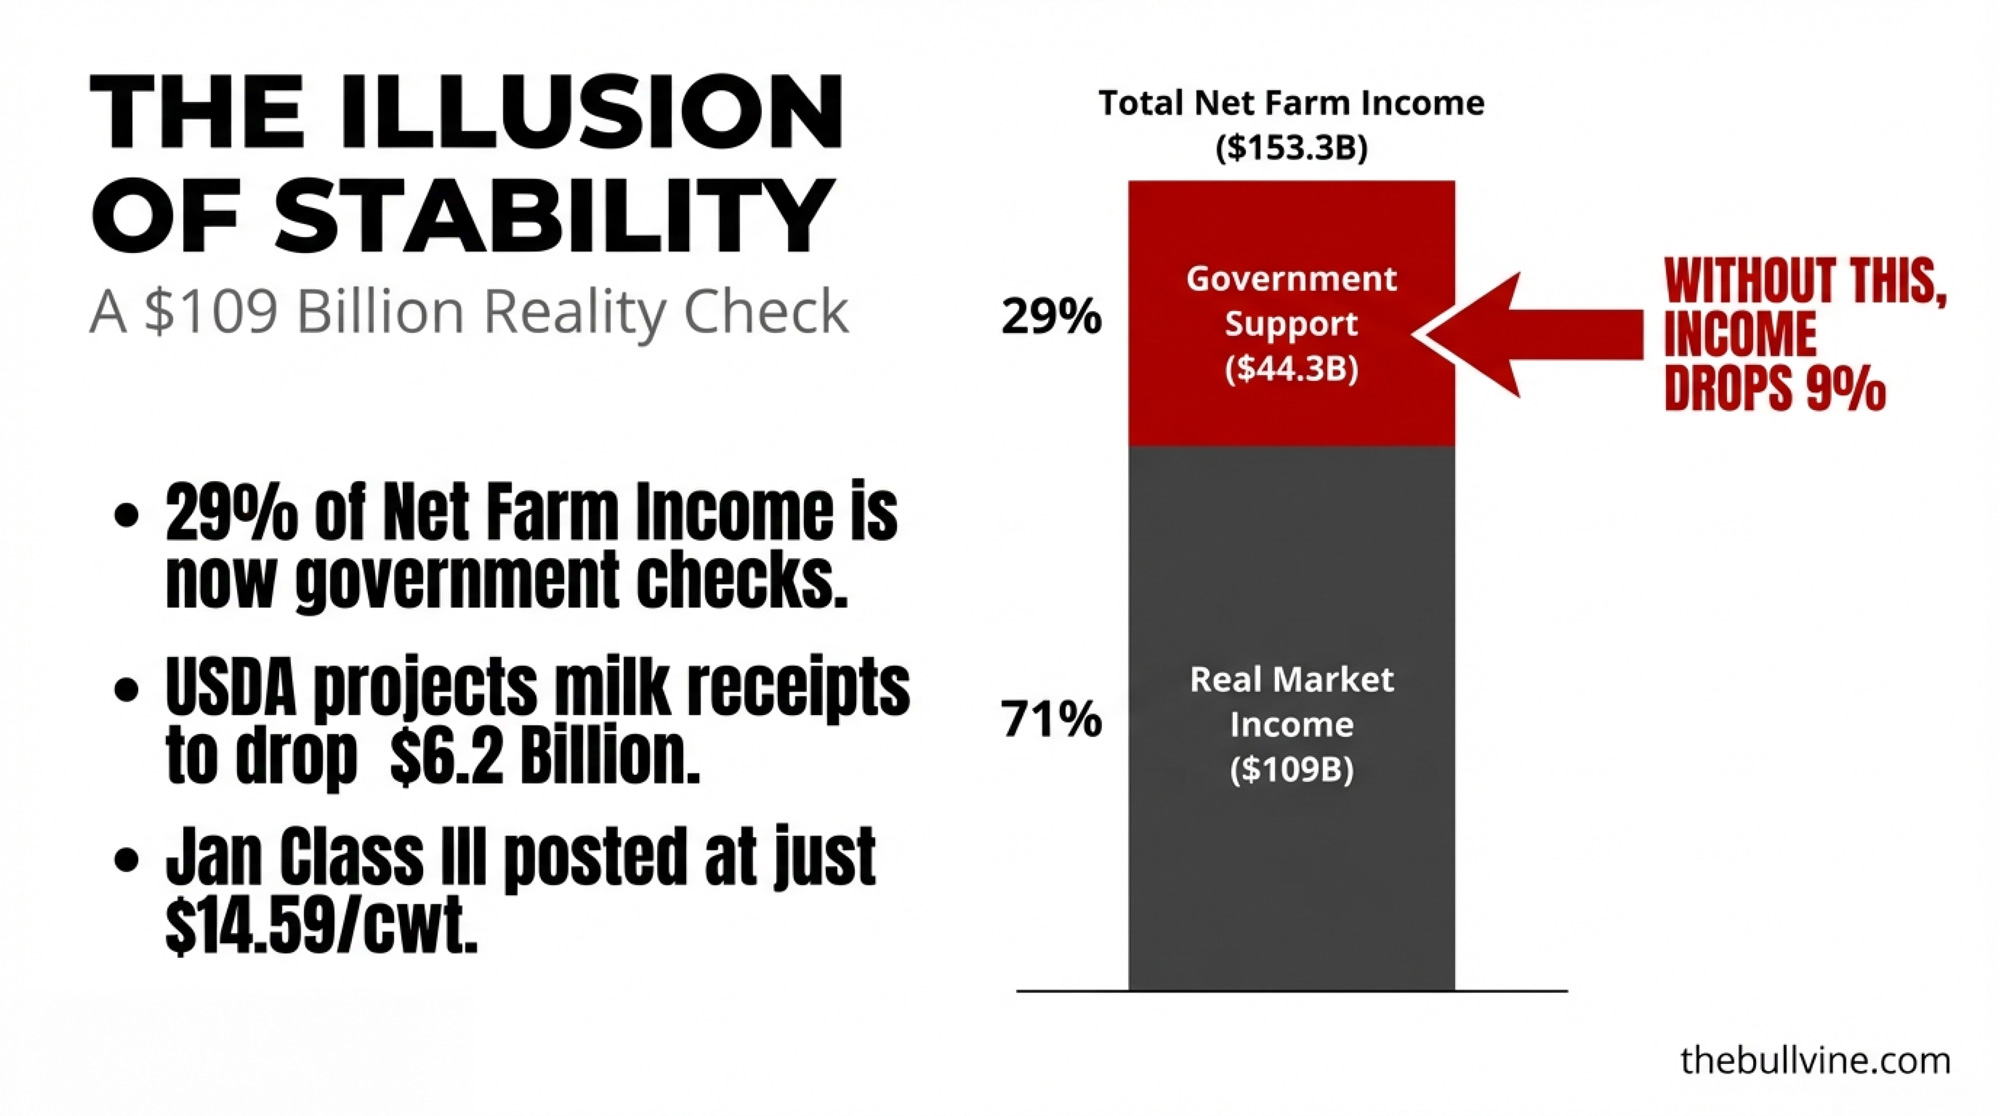
- USDA’s February WASDE raised the 2026 all‑milk forecast to $18.95/cwt, but ERS puts average 2,000‑plus cow herds at $19.14/cwt and the smallest herds near $42.70/cwt. That means even the “efficient” size class is essentially breakeven on a full‑cost basis. 1
- January’s actual Class III at $14.59/cwt and December’s $15.86 are still well below the new annual averages. If your budgets quietly assume the back half of 2026 will bail out the first half, you’re betting against recent history.
- Dairy farmers’ share of the retail dairy dollar slipped from 28¢ in 2022 to 25¢ in 2024, while the average gallon price stayed near $4.05. Consumers didn’t feel the pain; the middle of the chain kept its cut; your share shrank.
- The beef check is doing more work than most producers are comfortable admitting. High Ground Dairy’s model shows $4.50+/cwt in beef income, and CoBank’s data tell you that money came from a replacement pipeline that’s now 800,000 heifers short and 164% more expensive.
- The decisions you make in the next 30 days — DMC enrollment, lender conversations, cull strategy, and whether to chase components at 2026 prices — matter more than whether USDA’s March WASDE adds or subtracts another 25¢. You don’t control the forecast. You do control how quickly you move when the math changes.
The Bottom Line
Where does your real breakeven sit against $18.95 all‑milk and $16.65 Class III, and how many months of runway do you have if beef softens and Class III spends more time in the mid‑fourteens than USDA’s spreadsheet suggests? That’s the comparison worth making before you load tomorrow morning’s first unit.
If you or someone you know in agriculture is experiencing stress or crisis, confidential support is available 24/7: the Suicide and Crisis Lifeline (call or text 988); the Farm Aid Hotline (1‑800‑FARM‑AID); or the AgriStress Helpline, Canada (1‑866‑267‑6255).
Complete references and supporting documentation are available upon request by contacting the editorial team at editor@thebullvine.com.
Learn More
- The 90-Day Reckoning: What Your Milk Check Is Really Saying About 2026 – Stop guessing your liquidity and master the “burn rate” calculation that separates survival from insolvency. This breakdown arms you with a 90-day tactical roadmap to overhaul cash flow before interest rates and low Class III prices exhaust your credit.
- 2026 Dairy Rally Or Dead-Cat Bounce? The Risk and Margin Math Behind Today’s Wall of Milk – Expose the global “wall of milk” that could turn early-2026 rallies into a trap for the unprepared. This analysis delivers the long-range economic foresight needed to protect your equity against massive processing shifts and fragile international demand.
- Dairy’s Bold New Frontier: How Forward-Thinking Producers Are Redefining the Industry – Weaponize the 15-20% productivity gains found in “connected barns” where AI and robotics finally break the labor squeeze. This guide reveals how forward-thinking producers are using technology to thrive in a high-cost environment that punishes traditional management habits.
 The Sunday Read Dairy Professionals Don’t Skip.
 The Sunday Read Dairy Professionals Don’t Skip.
Every week, thousands of producers, breeders, and industry insiders open Bullvine Weekly for genetics insights, market shifts, and profit strategies they won’t find anywhere else. One email. Five minutes. Smarter decisions all week.