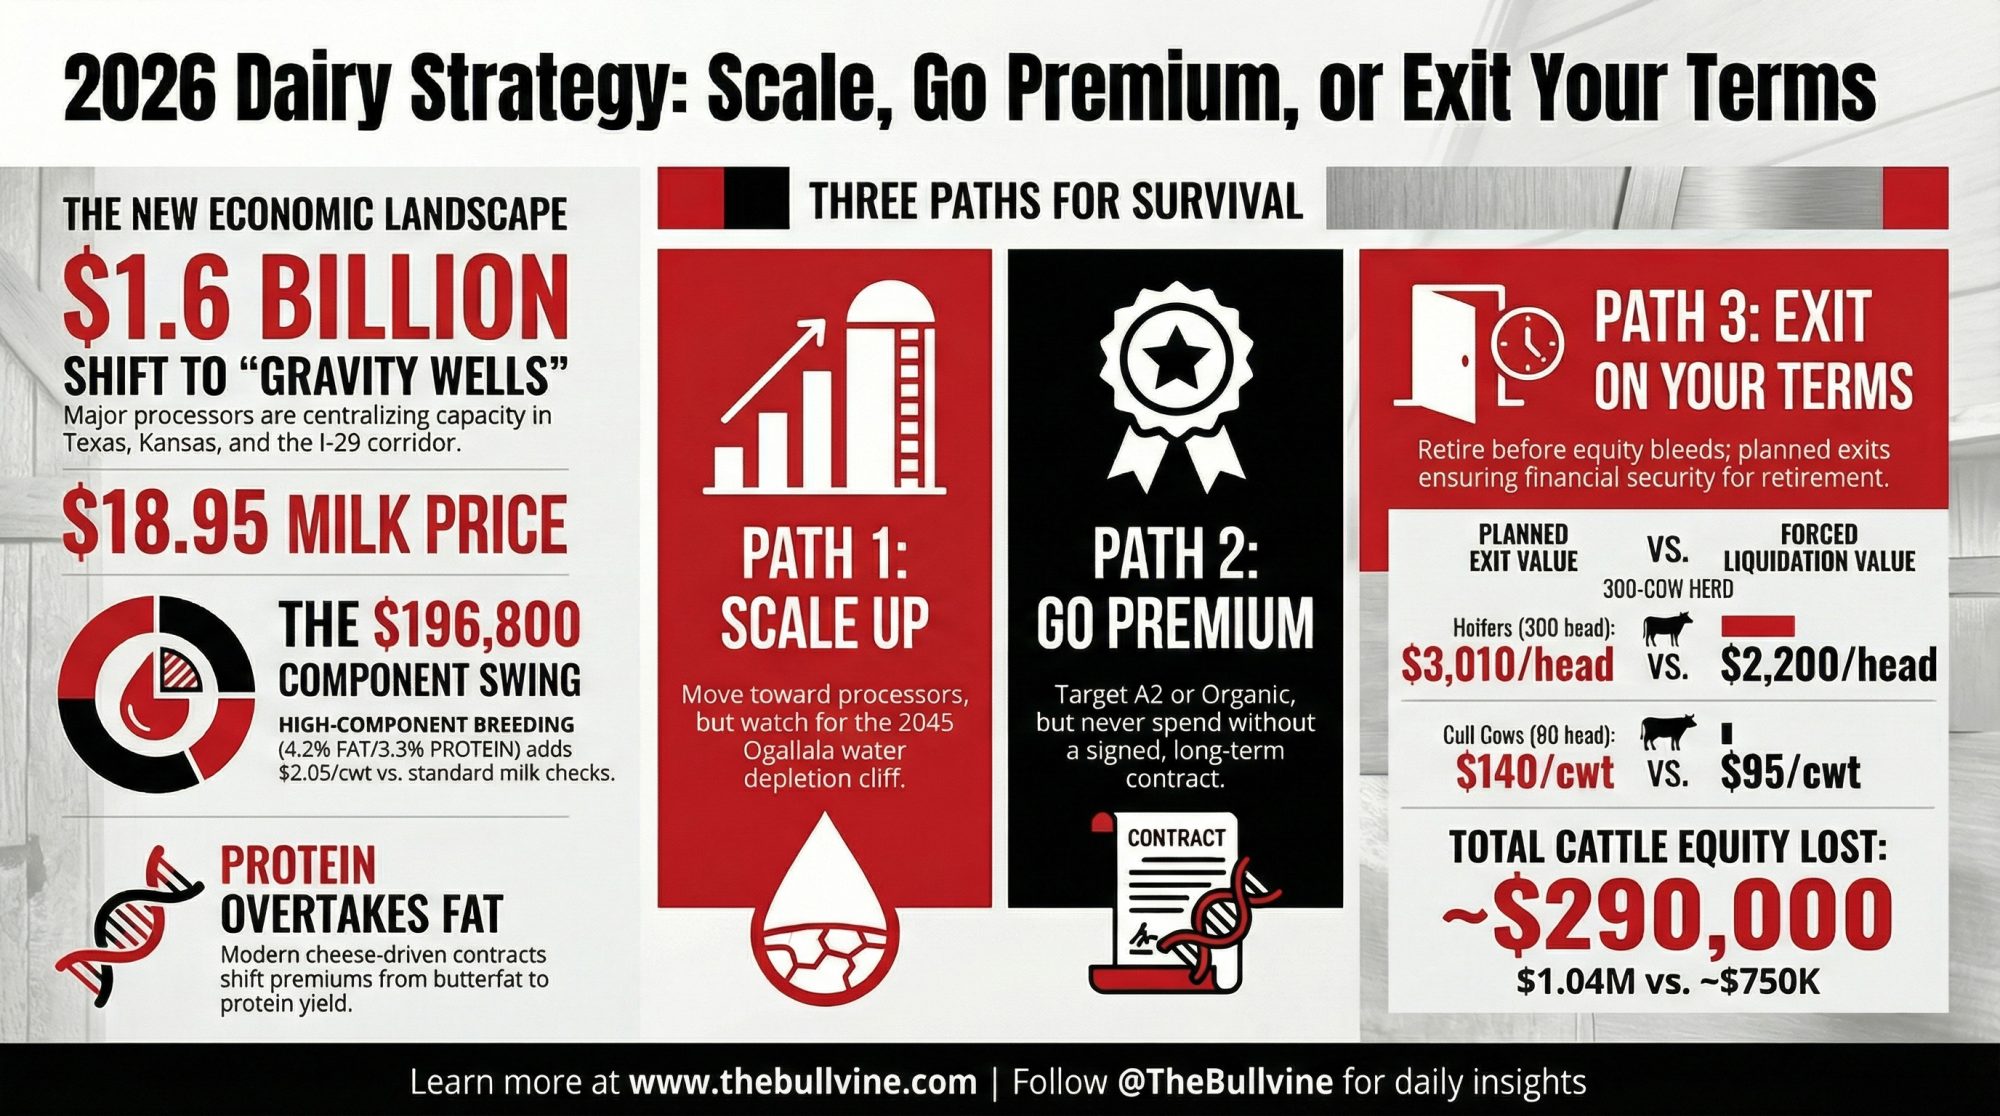
Processors just bet $1.6B you’ll chase their cheese plants. At $18.95 milk, mid-size dairies really face only three choices: scale, go premium, or exit.
Executive Summary: Processors have poured about $1.6 billion into new cheese plants in Texas, Kansas, and the I‑29 corridor, just as Wisconsin has lost roughly 76% of its dairy farms since the mid‑2010s. At $18.95/cwt all‑milk, many 300–500 cow herds are staring at $100,000–$300,000 in annual losses once you put realistic labor and depreciation into the breakeven. This analysis shows how a 400‑cow herd can swing nearly $200,000/year on the same milk simply by shifting into component‑driven contracts that reward 4.2% fat and 3.3% protein. It then walks through the only three paths that really remain for most mid‑size dairies in 2026: scale up around gravity‑well cheese plants, lock in a premium contract (organic/A2) before spending, or exit on your own terms before equity disappears. Water limits on the Ogallala, heavy reliance on immigrant labor, and a looming shift from butterfat to protein premiums all tilt the table in different ways depending on your zip code. If you own or manage a mid‑size herd, this piece gives you the barn math, contract questions, and risk signals you need to decide whether your future is scale, premium, or a controlled exit.
For mid-size dairies, the numbers are brutal. Since 2020, three processors have committed roughly $1.6 billion to cheese capacity in Texas, Kansas, and the I-29 corridor, while Wisconsin has lost about 76% of its dairy farms since the mid-2010s, dropping from over 15,900 operations to fewer than 6,000. USDA’s February 2026 WASDE pegs the all-milk price at $18.95/cwt, down $2.22 from last year’s revised average of $21.17. Those two curves — processor expansion and farm attrition — are not random.
Ben Laine, now senior dairy analyst at Terrain, shared, “If you’re building new cheese plants and you need to fill them with milk, you’re going to pay what it takes to get the milk in there… It’s going to be a bit more of a seller’s market for milk. So, producers might be able to negotiate and move around, and that’s not something they’ve had in a long time.”
That’s the optimistic read. The cautious one is simple: those plants will fight hard for milk from the most reliable, scalable suppliers. If your breakeven sits above $20–$22/cwt, you’re not automatically at the front of that line.
Processors Chose First. You Followed.
The usual story says producers drove the geographic shift — families chasing cheaper land and gentler regulations. The timeline says the plants made the first move.
Hilmar Cheese didn’t go to Dalhart, Texas, because there was an ocean of milk sitting there in 2006. The region’s dairy presence was modest when they broke ground. By 2014, the local herd had grown more than tenfold. Former CEO John Jeter described Dalhart as having a growing milk supply and a stable regulatory environment — not a huge supply, a growing one. Hilmar bet on the future milk it knew would follow its stainless steel.
The same pattern shows up in Kansas. When Hilmar announced its $600 million Dodge City, Kansas, cheese plant in 2021, Kansas Dairy CEO Janet Bailey said the facility would help the state’s dairy industry expand and encourage producers to be innovative. Future tense again. Leprino Foods’ roughly $1 billion Lubbock, Texas, complex follows the same script, with phases coming online through 2026 and an estimated $10.6 billion in economic impact for Texas over the next decade.
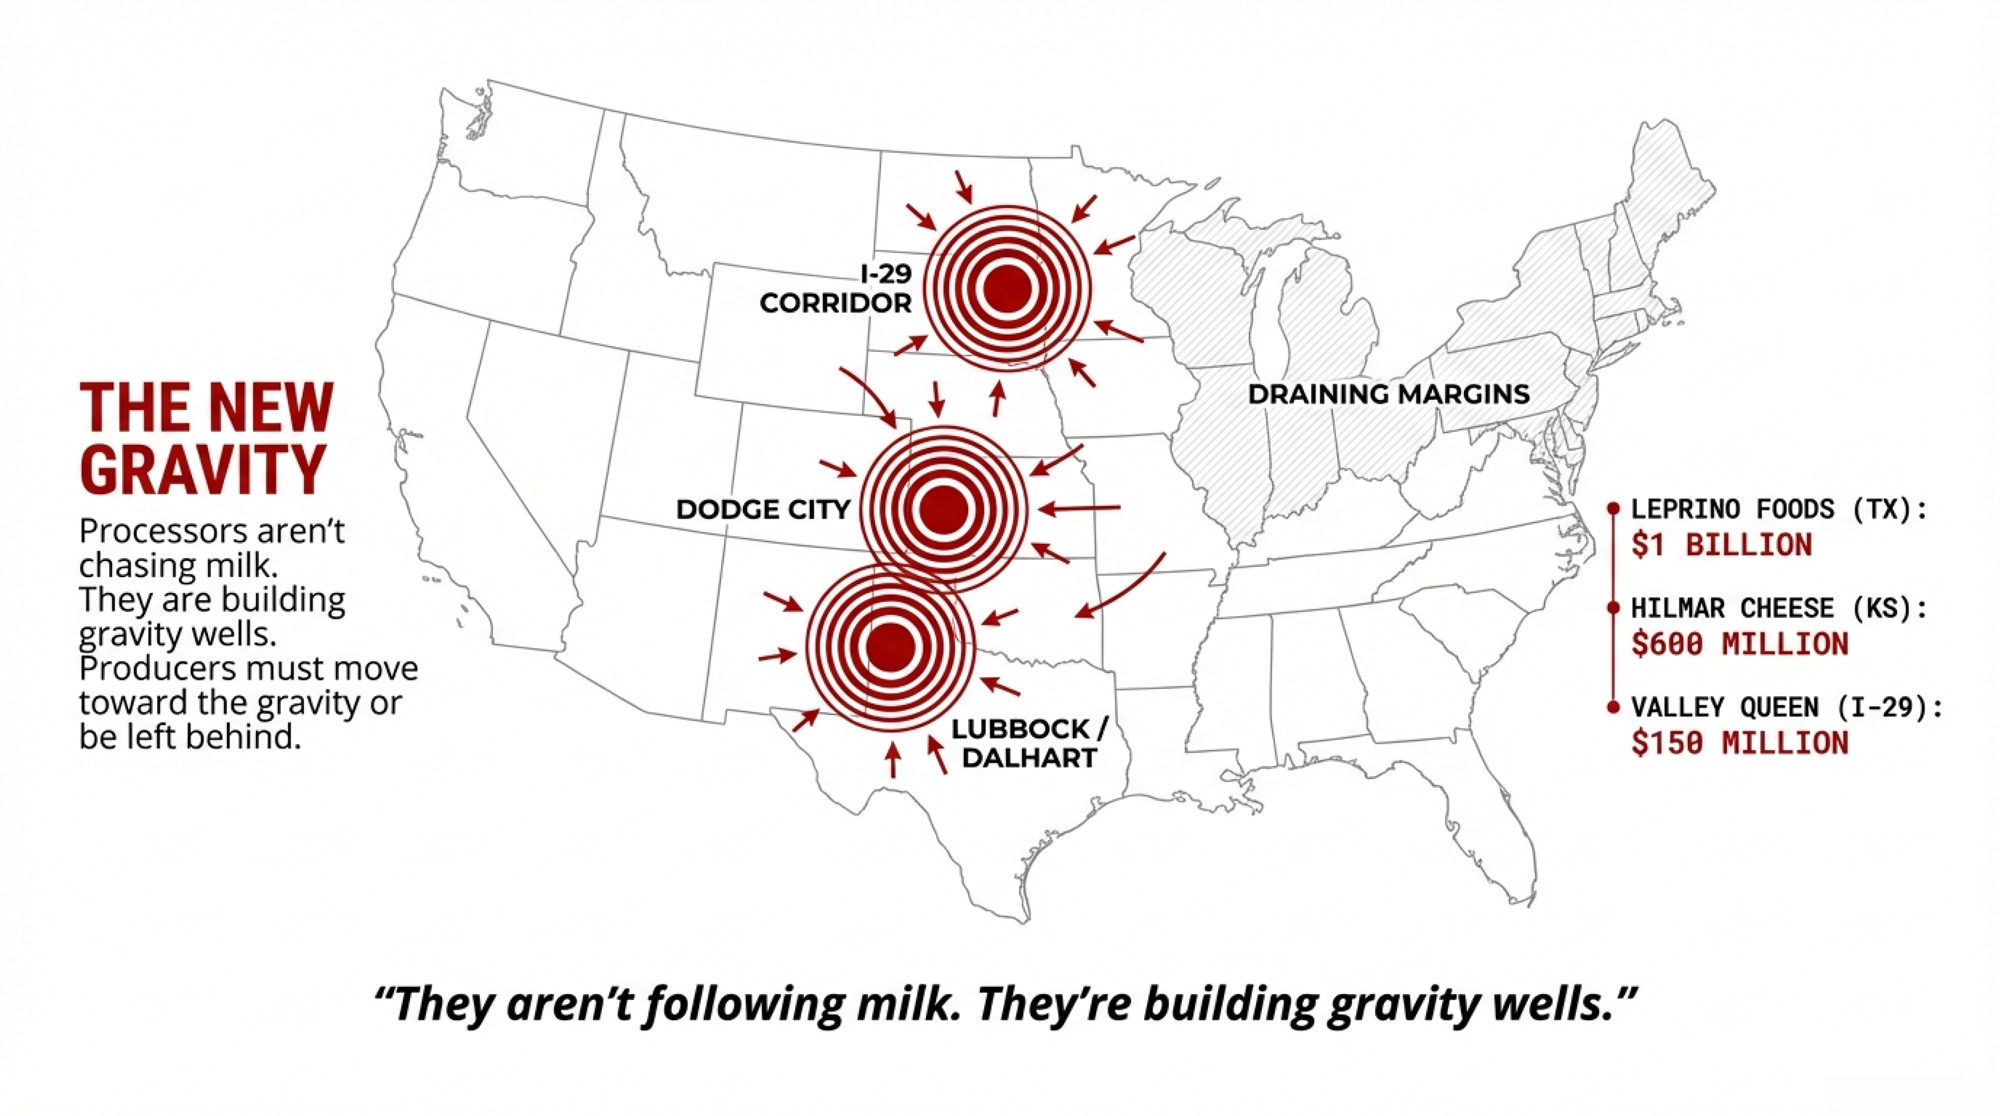
Here’s the processor scorecard:
| Facility | Investment | Projected Cow Additions | Key Risk Factor |
| Leprino Foods (Lubbock, TX) | $1,000 million | ~40,000+ head (est.) | Ogallala: 70% unusable by ~2045 |
| Hilmar Cheese (Dodge City, KS) | $600 million | ~25,000+ head (est.) | Moderate Ogallala stress |
| Other TX/KS cheese investments | $250 million | ~15,000+ head (est.) | Water + 51% immigrant labor |
| Valley Queen (I-29 Corridor) | $150 million | ~25,000 head (2025–26) | Slots filling fast; low milk prices |
They aren’t following milk. They’re building gravity wells. And milk — and producers — move toward gravity.
Why the I-29 Corridor Is Suddenly a Growth Magnet
Not every dollar is heading southwest. Along the I-29 corridor — South Dakota, Minnesota, Iowa — the dairy map is being redrawn just as quietly.
Evan Grong, Valley Queen’s sales manager for dairy ingredients, told Dairy Herd in May 2023: “We attribute the current and projected growth in the I-29 region primarily to access to feed production, abundant groundwater, and dairy processing investments.” Valley Queen’s expansion alone expects approximately 25,000 additional cows in 2025 and 2026.
Sarina Sharp, with the Daily Dairy Report, told Brownfield Ag News in October 2022: “So that is Iowa, South Dakota, and Minnesota — there they are growing milk production, and they are growing processing capacity. New dairies are coming in, and it’s not just cows moving across state lines, it’s truly growth.”
The contrast is sharp:
- Unlike the Ogallala-dependent Panhandle, the I-29 region isn’t sitting on a rapidly draining aquifer.
- Unlike Wisconsin, the corridor has processors actively courting volume rather than telling farms there’s no room on the route.
If you’re looking at a relocation or expansion, it can feel like a “get in while there’s room” middle path. But as Sharp herself noted in February 2026, most major expansions that coincided with new processing plant growth have already been completed, and low December/January milk prices are making producers “think twice” about putting money down for a big expansion.
[INTERNAL LINK: news/1-6b-to-texas-and-kansas-76-of-wisconsin-farms-gone-scale-up-go-premium-or-get-out] → Suggested anchor text: “Our original breakdown of $1.6B to Texas/Kansas and the 76% drop in Wisconsin farm numbers digs deeper into how we got here.”
The Growth-State Trap: Water, Labor, and Asymmetry
On paper, growth states look unbeatable. Cheaper ground. Warmer winters. New cheese plants are hungry for milk. But two of the pillars under that advantage — water and labor — are much shakier than the investment headlines suggest.
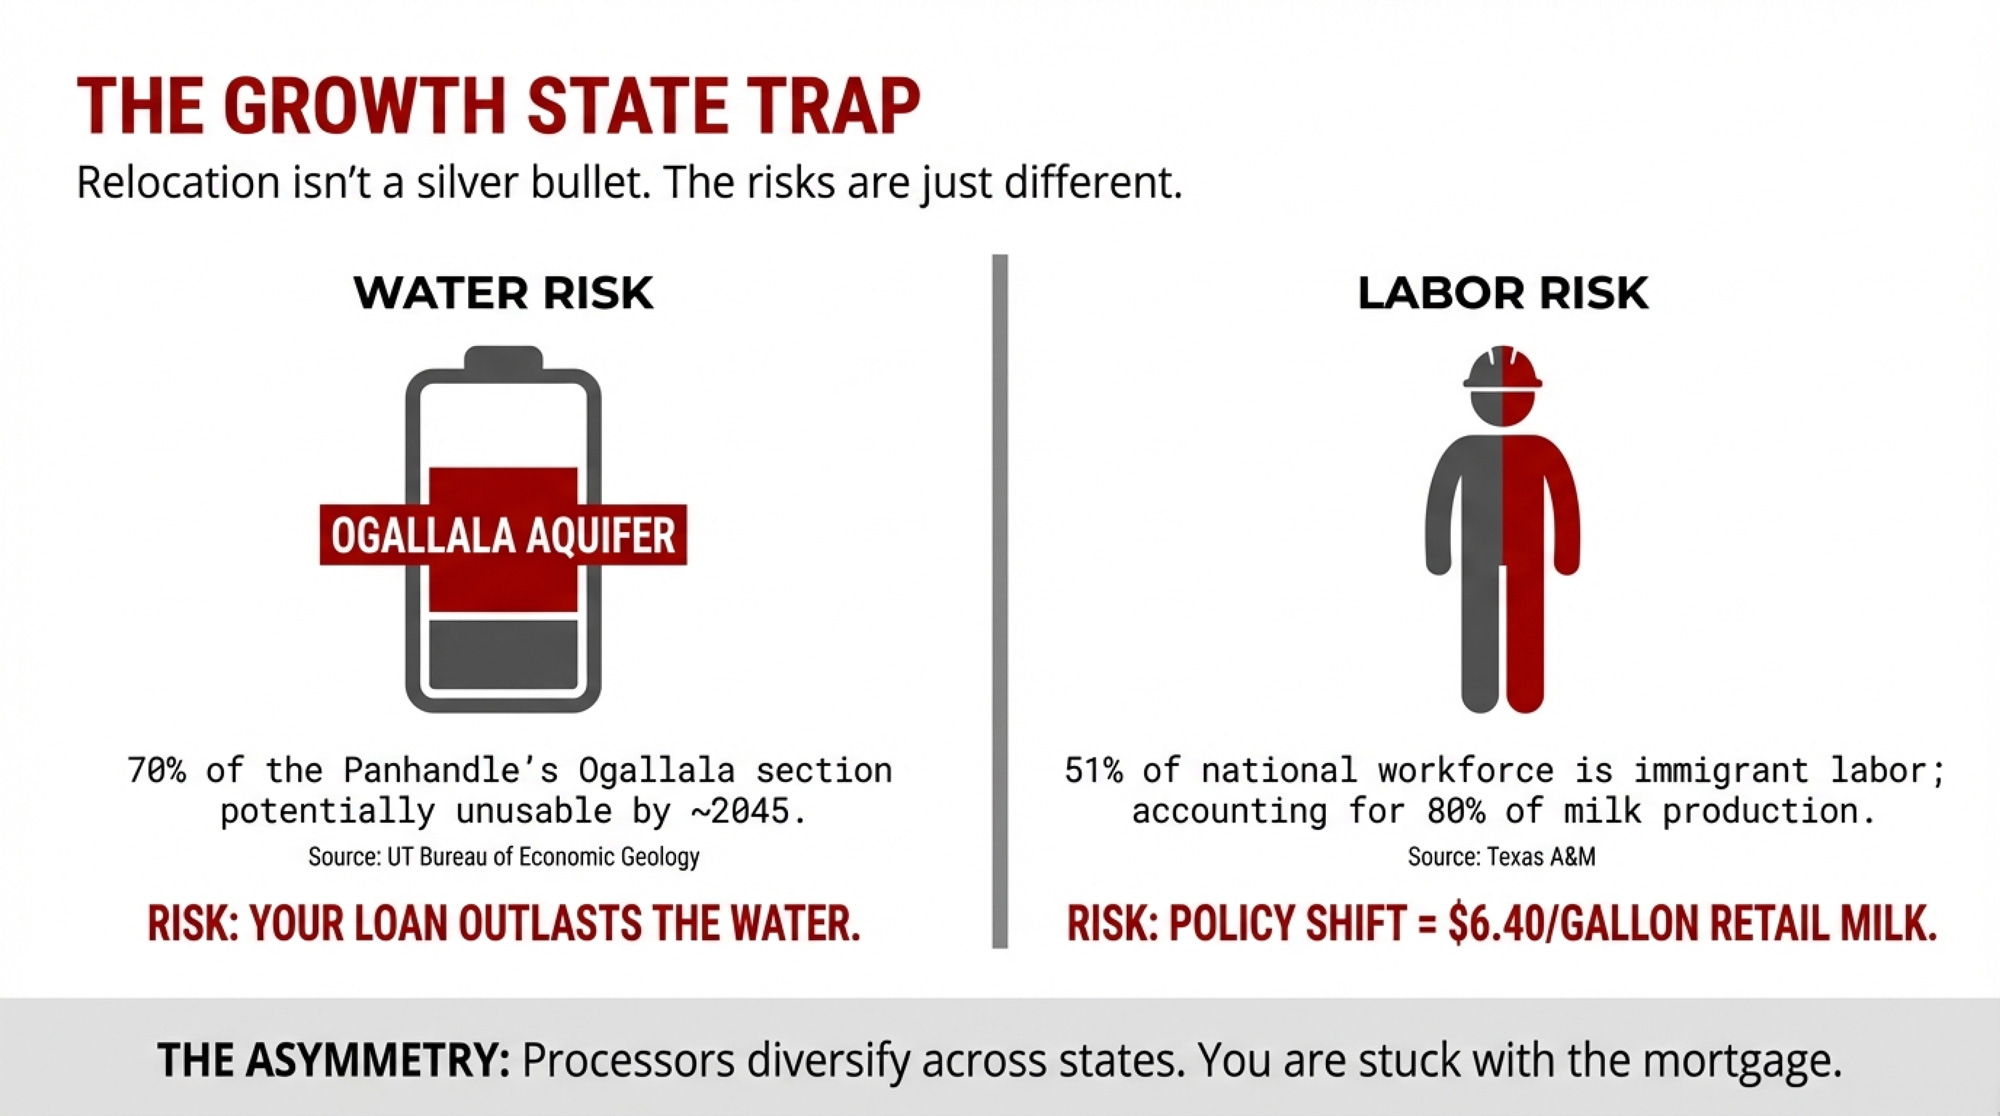
Water: The Ogallala Clock Is Ticking
The Ogallala Aquifer underlies the Texas Panhandle and western Kansas — exactly where a lot of the new stainless steel has landed or is landing. Texas accounts for roughly 62% of total Ogallala depletion despite sitting on only part of the aquifer’s footprint, according to USGS and Texas Water Development Board data. A University of Texas Bureau of Economic Geology projection suggests that up to 70% of the Panhandle’s Ogallala section could become unusable within about 20 years at current pumping rates.
If you break ground on a new 4,000-cow unit in 2026 on that footprint, that 20-year horizon takes you to the mid-2040s — right inside the lifespan of your wells, your loans, and your next generation’s mortgage.
Labor: 51% of the Workforce, 80% of the Milk
The labor math is just as stark. A 2015 NMPF-commissioned study conducted by Texas A&M AgriLife Research found that about 51% of dairy farm workers nationwide were immigrants, and that farms employing immigrant labor accounted for roughly 80% of U.S. milk production. Texas A&M’s economic modeling suggested that a complete loss of immigrant labor would mean a $32 billion hit to the U.S. economy, 208,000 fewer jobs, and retail milk prices potentially doubling to around $6.40 per gallon.
An earlier 2009 version of the study, using a smaller industry base, projected 4,532 farm closures and a 61% increase in retail milk prices if immigrant labor disappeared. The dependence hasn’t gone down since; if anything, consolidation has concentrated that risk.
In Wisconsin, a 2023 UW-Madison School for Workers survey estimated that immigrant labor accounts for roughly 70% of the state’s dairy workforce. Governor Tony Evers told Wisconsin news outlet WLUK: “If suddenly those people disappear, I don’t know who the hell is going to milk the cows.”
The Asymmetry That Matters
Processors can spread their risk. Leprino runs facilities across multiple states. Hilmar operates in California, Texas, and soon Kansas. If water regulation tightens or labor enforcement ramps up in one region, they shift volume elsewhere or take a write-down.
You can’t move a 4,000-cow Panhandle dairy built to service one contract. The wells, the manure system, the concrete: fixed. The contract term? Usually not as long as the debt.
| Risk Factor | Texas Panhandle | Western Kansas | I-29 Corridor |
| Ogallala depletion | Up to 70% potentially unusable by ~2045 | Moderate-to-high stress | Not Ogallala-dependent |
| Labor dependency | 51% immigrant nationally | Same national exposure | Same national exposure |
| Processor diversification | Multi-state (Hilmar, Leprino) | Same | Regional (Valley Queen) |
| Producer risk | Fixed assets, 15–25 yr debt | Same | Same |
That doesn’t mean “Don’t go.” It means go in with both eyes open, and don’t let a processor’s confidence substitute for your own risk math.
[INTERNAL LINK: news/dairy-cows-bleeding-margins-the-2026-math] → Suggested anchor text: “For a deeper dive on how water and labor risk are showing up in 2026 margins, see ‘Dairy Cows, Bleeding Margins: The 2026 Math.'”
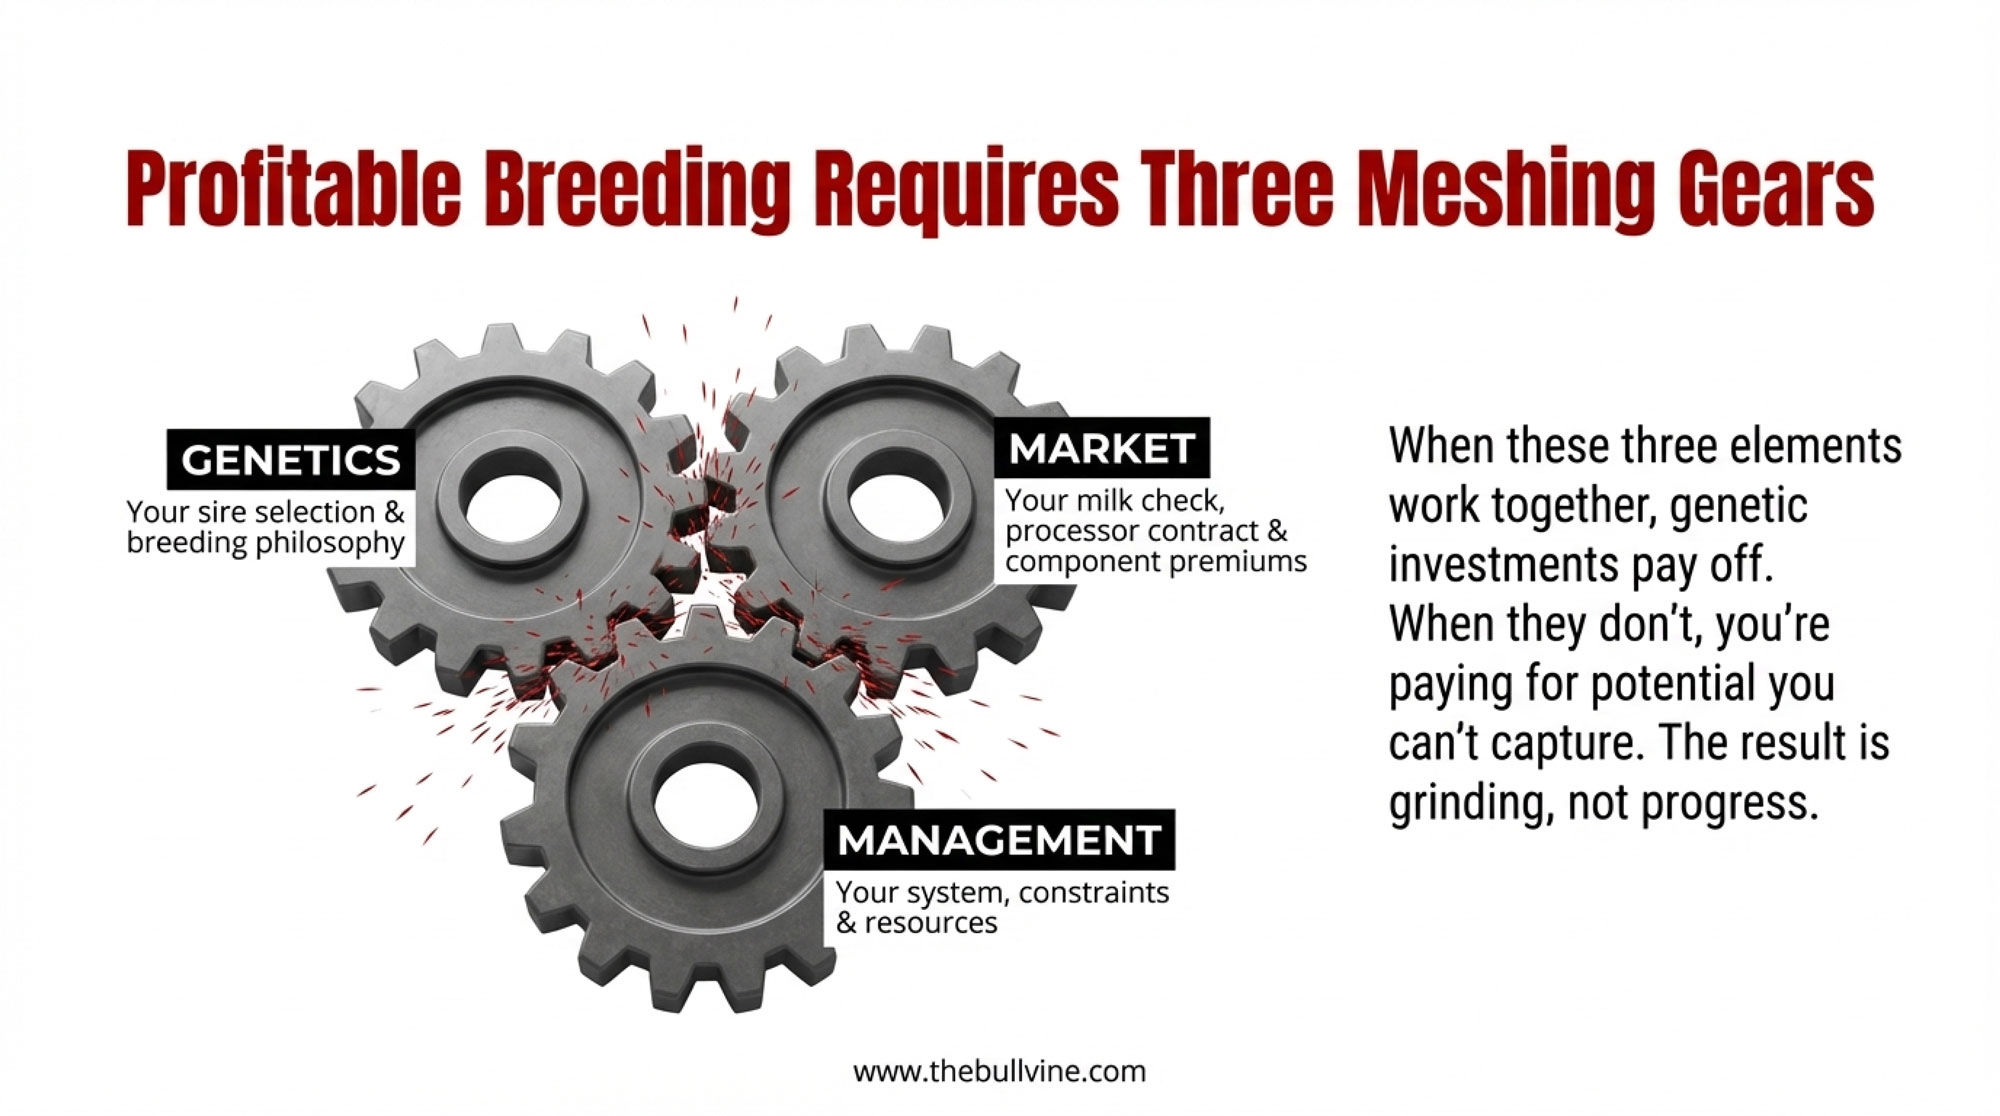
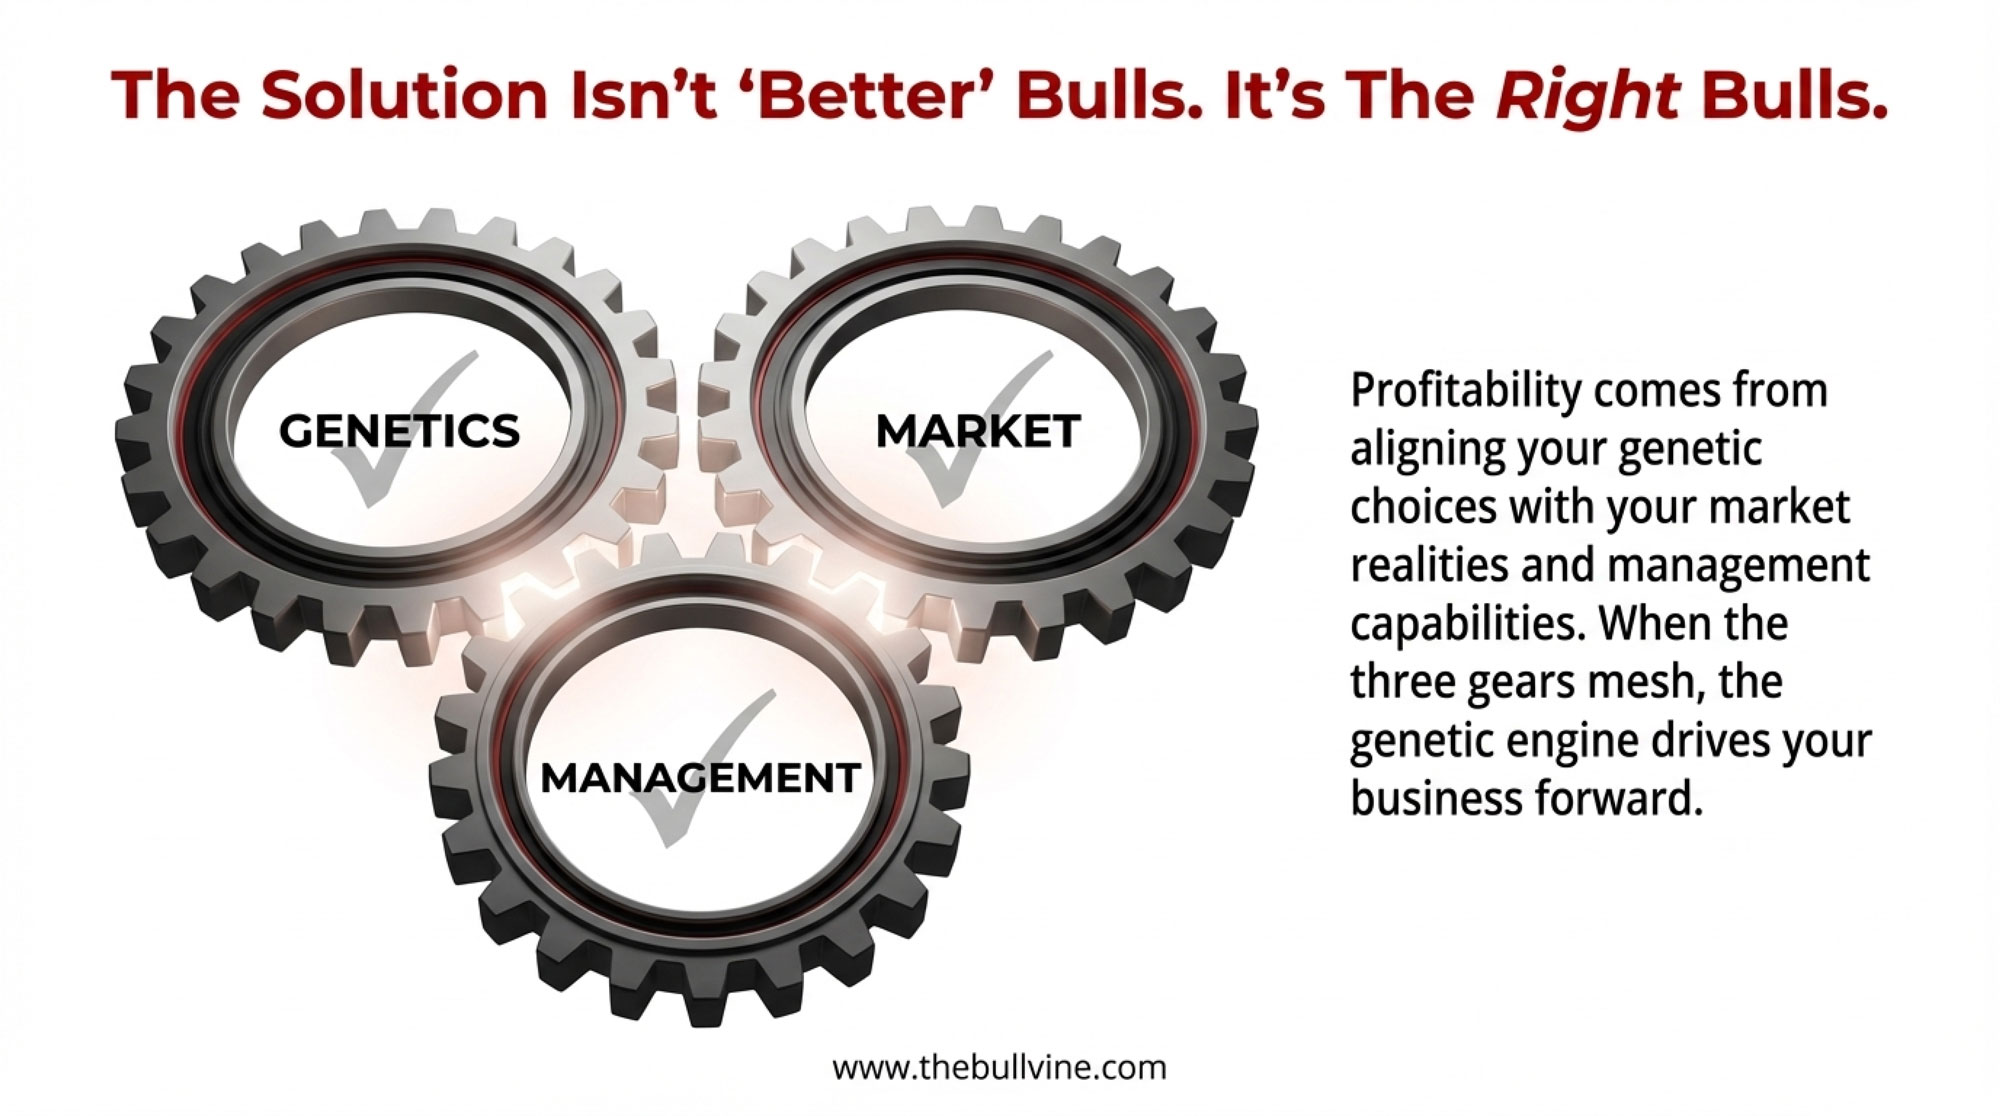
Your Zip Code Now Dictates Your Genetics
Where you farm increasingly determines what genetics you need, because it determines how your milk check is built.
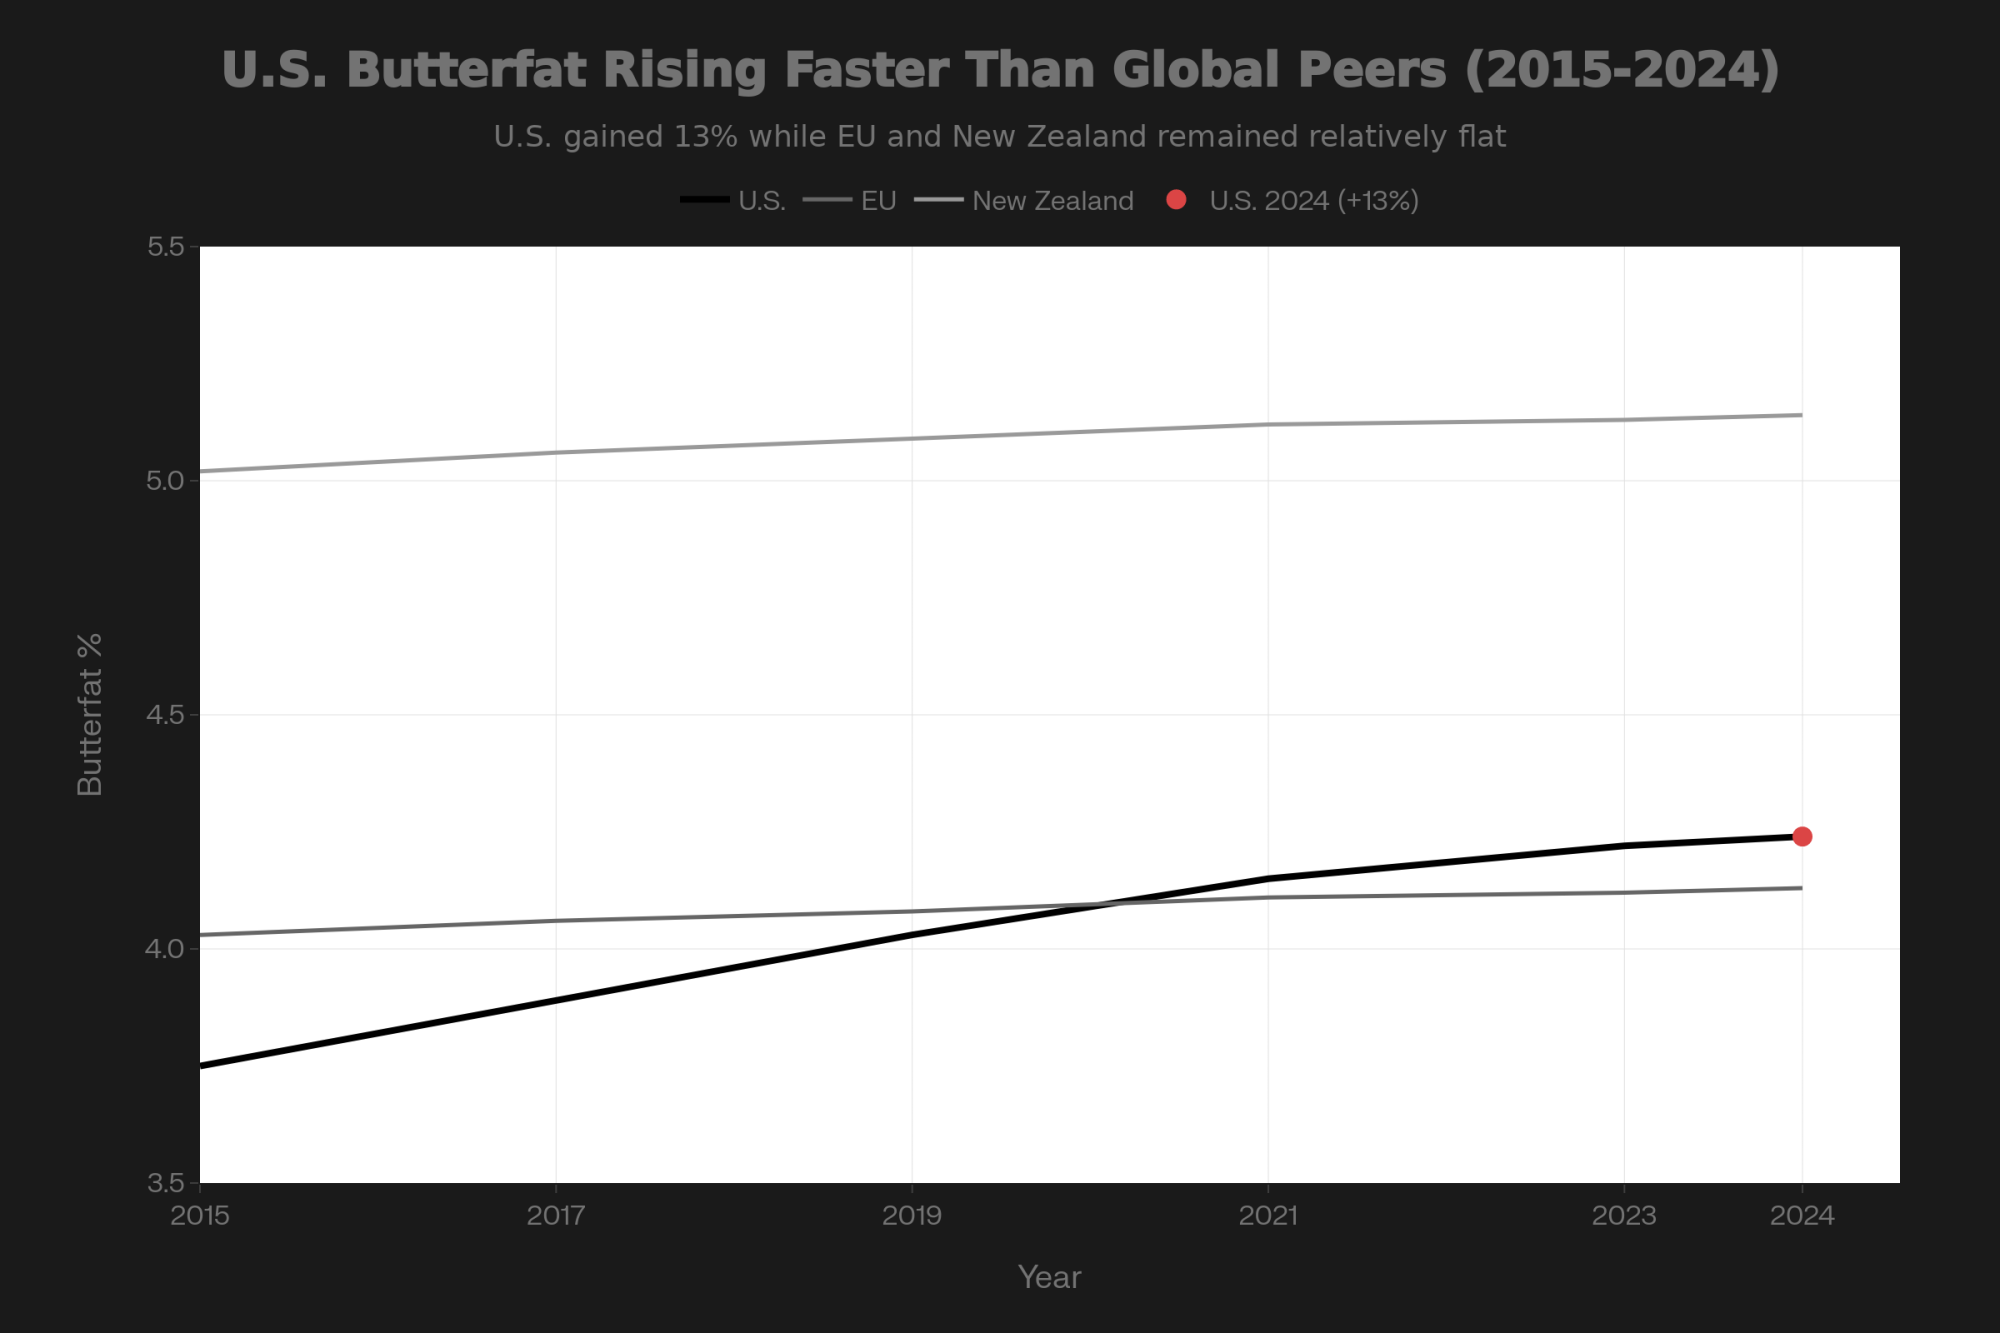
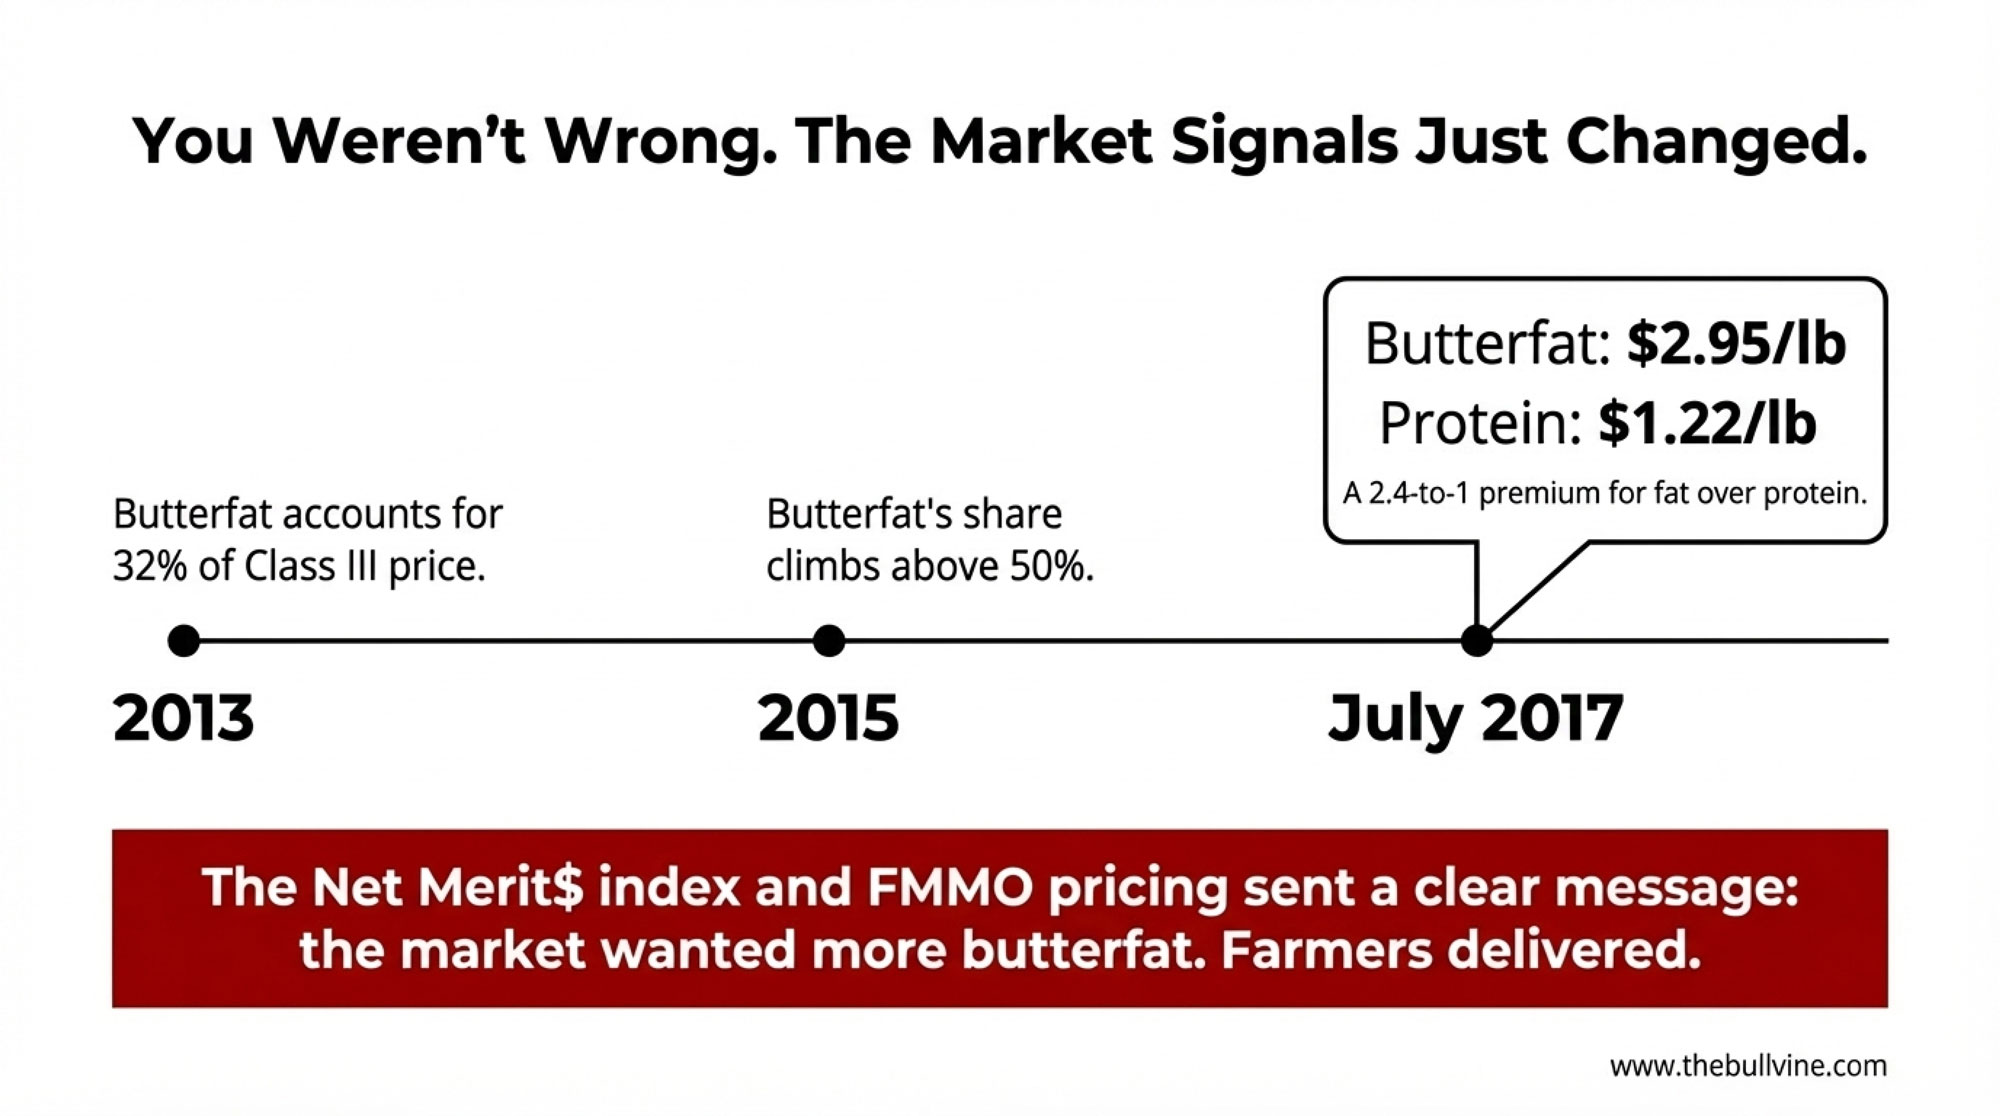
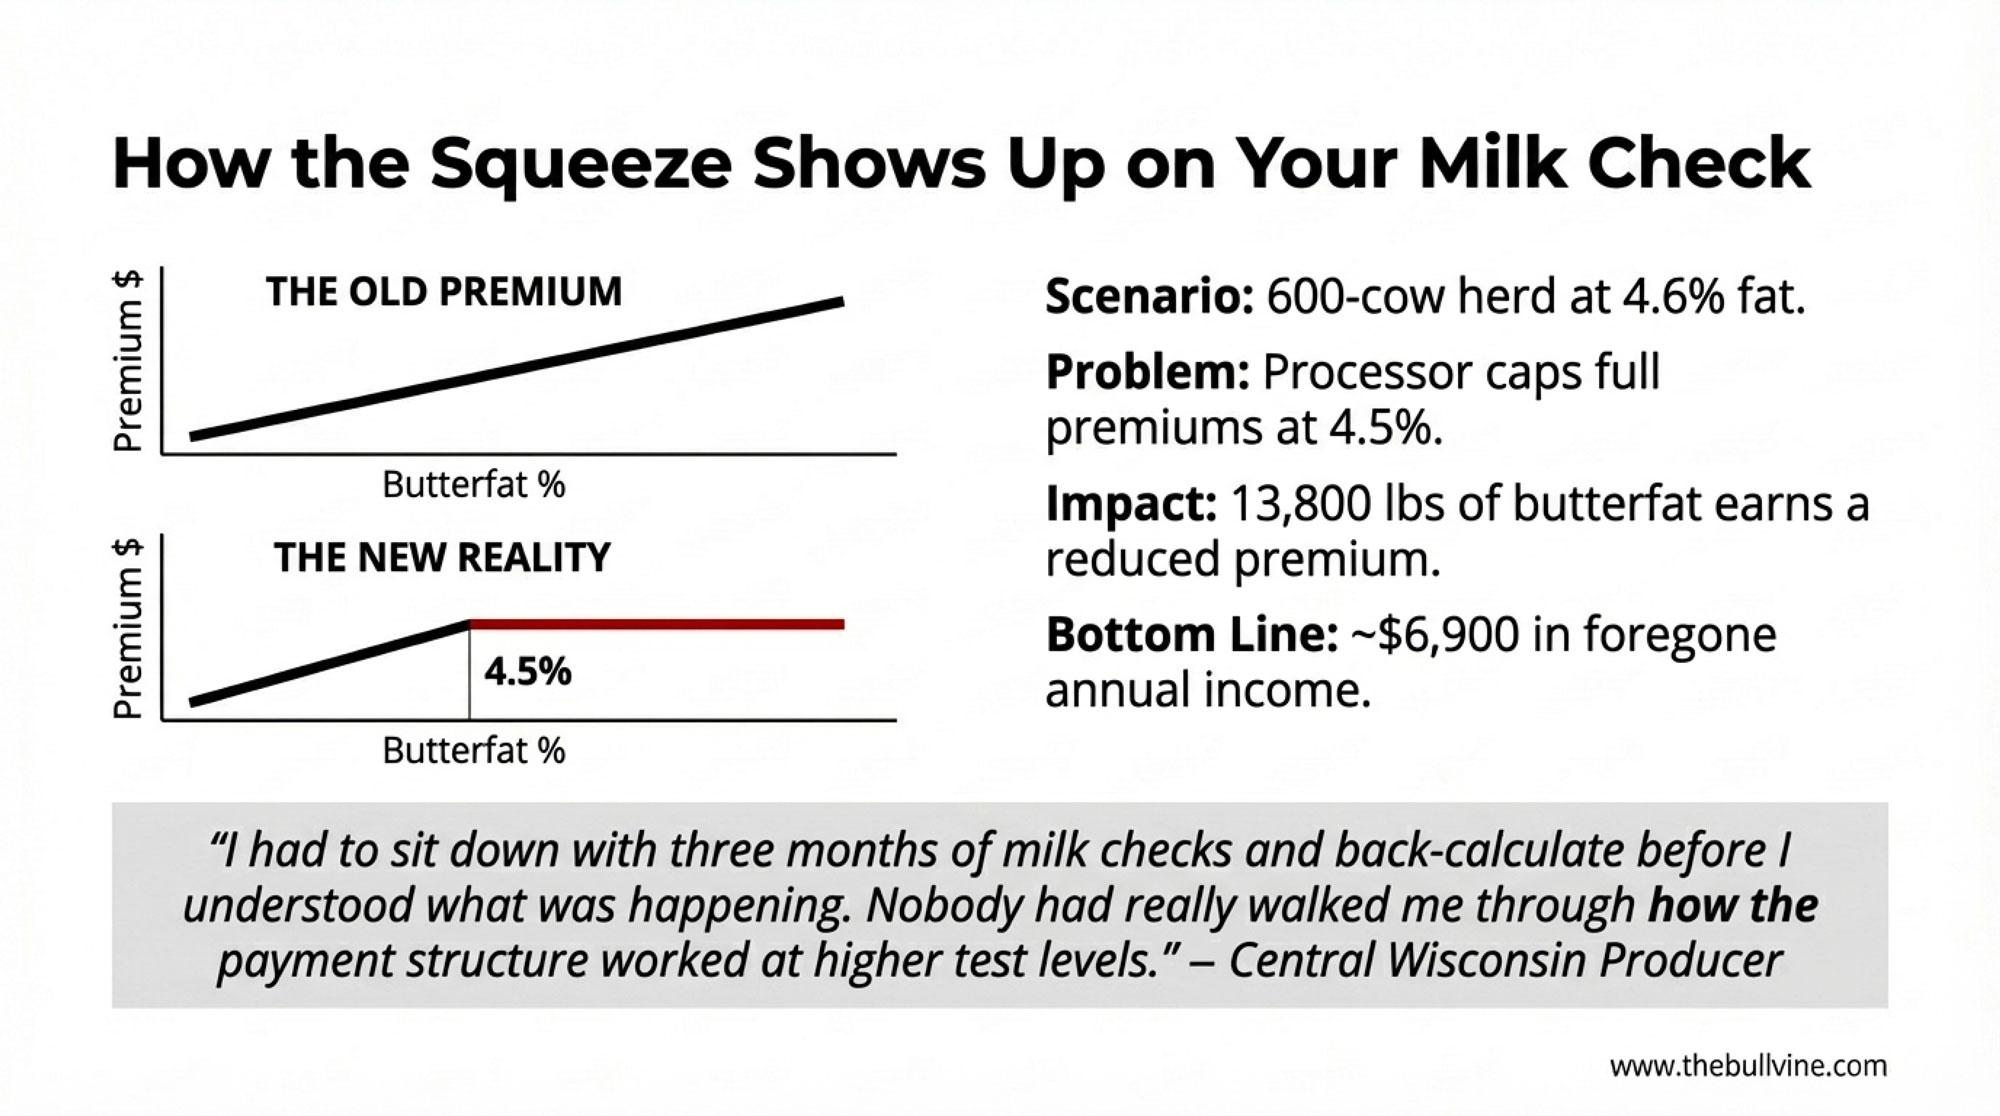
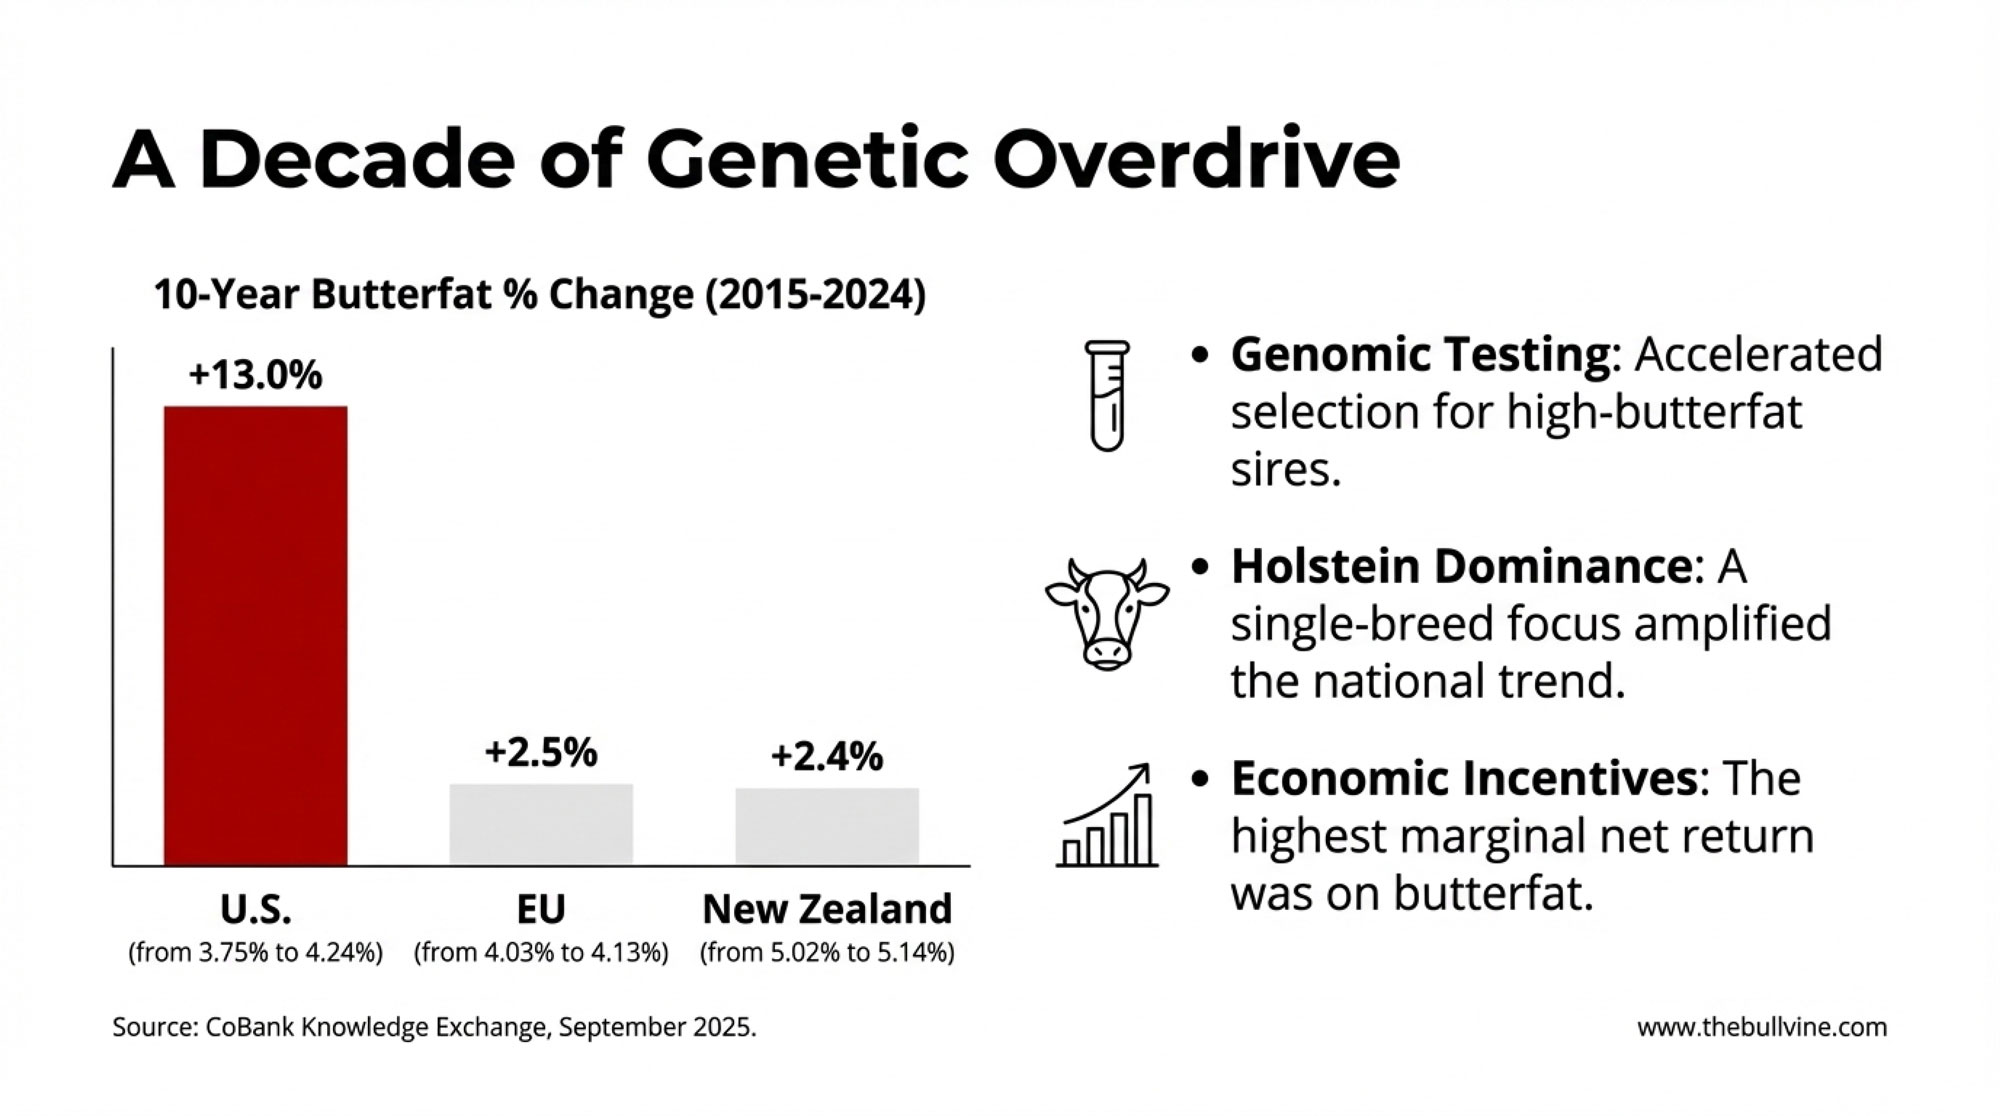
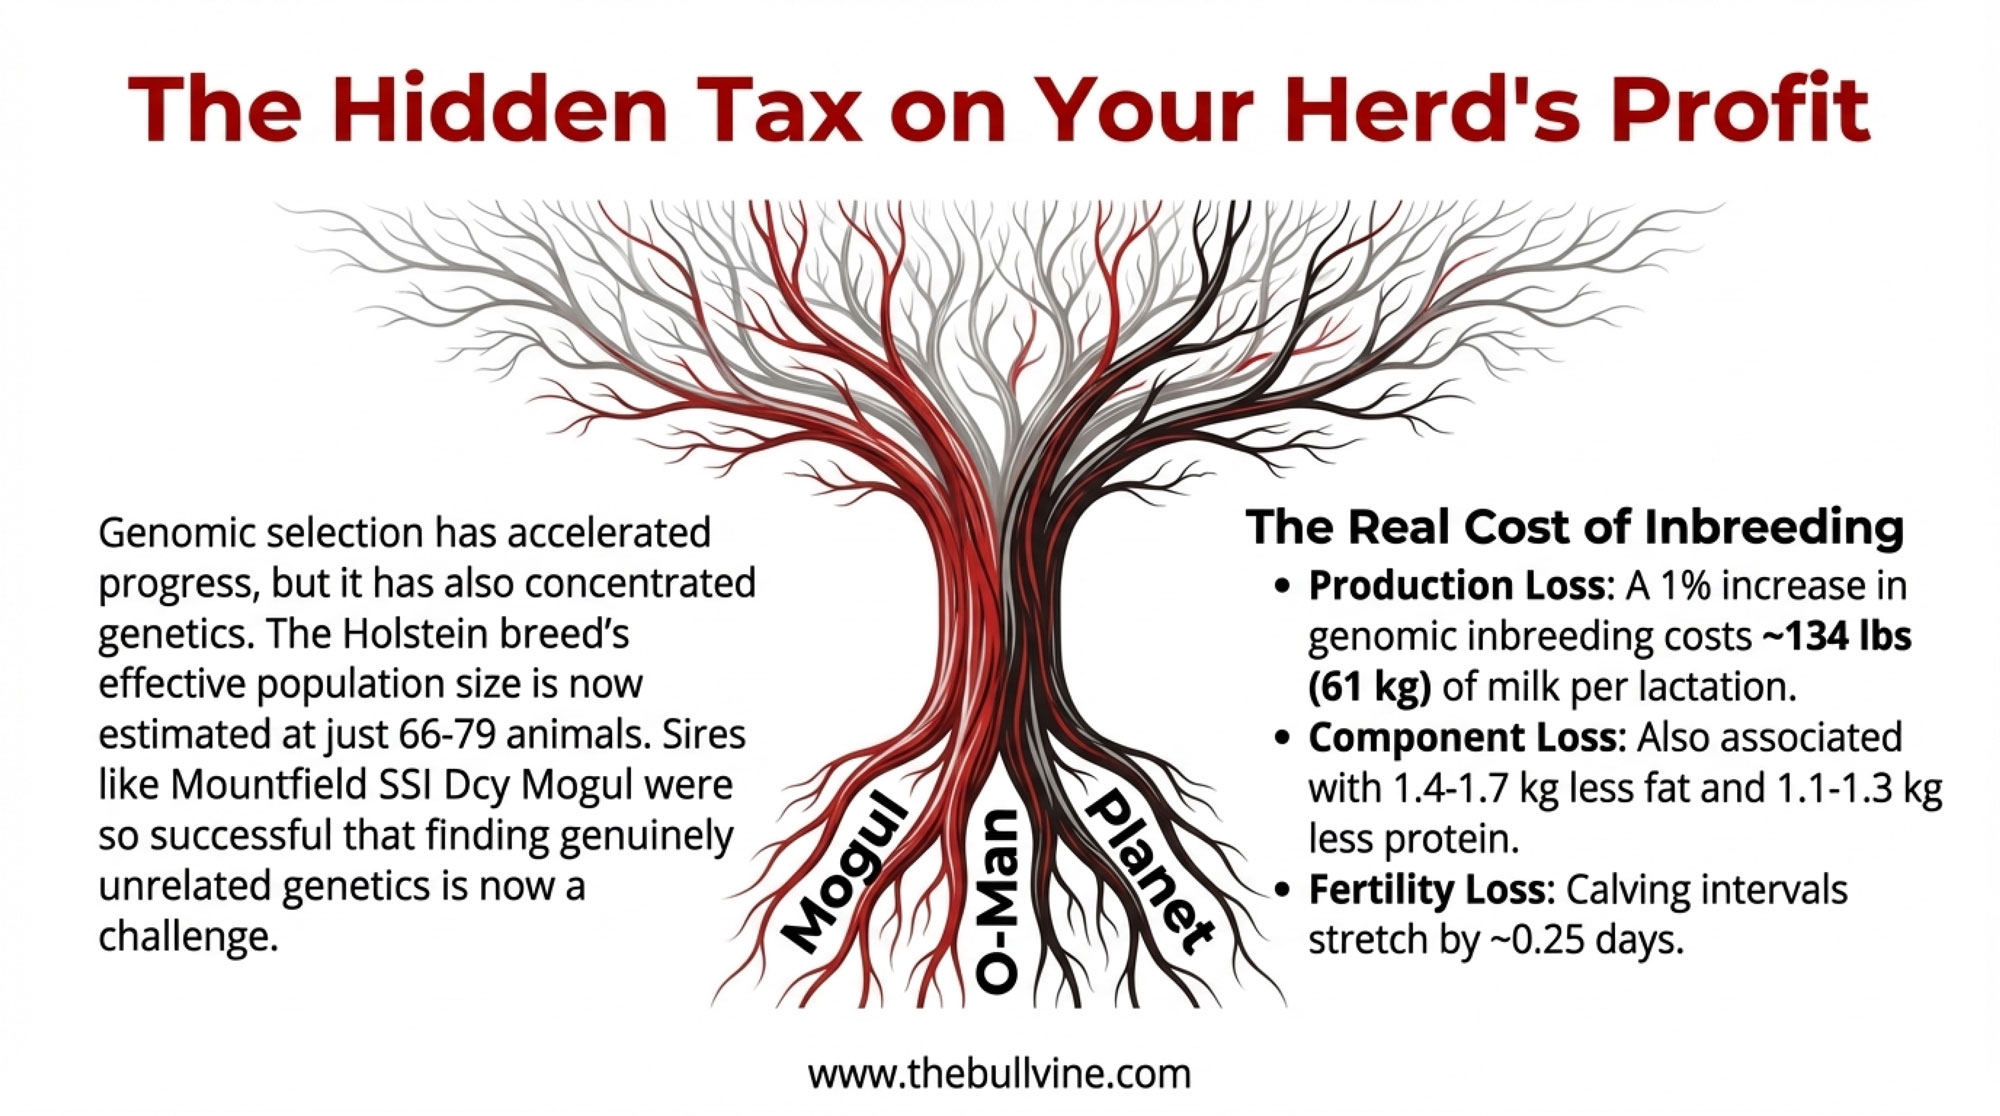
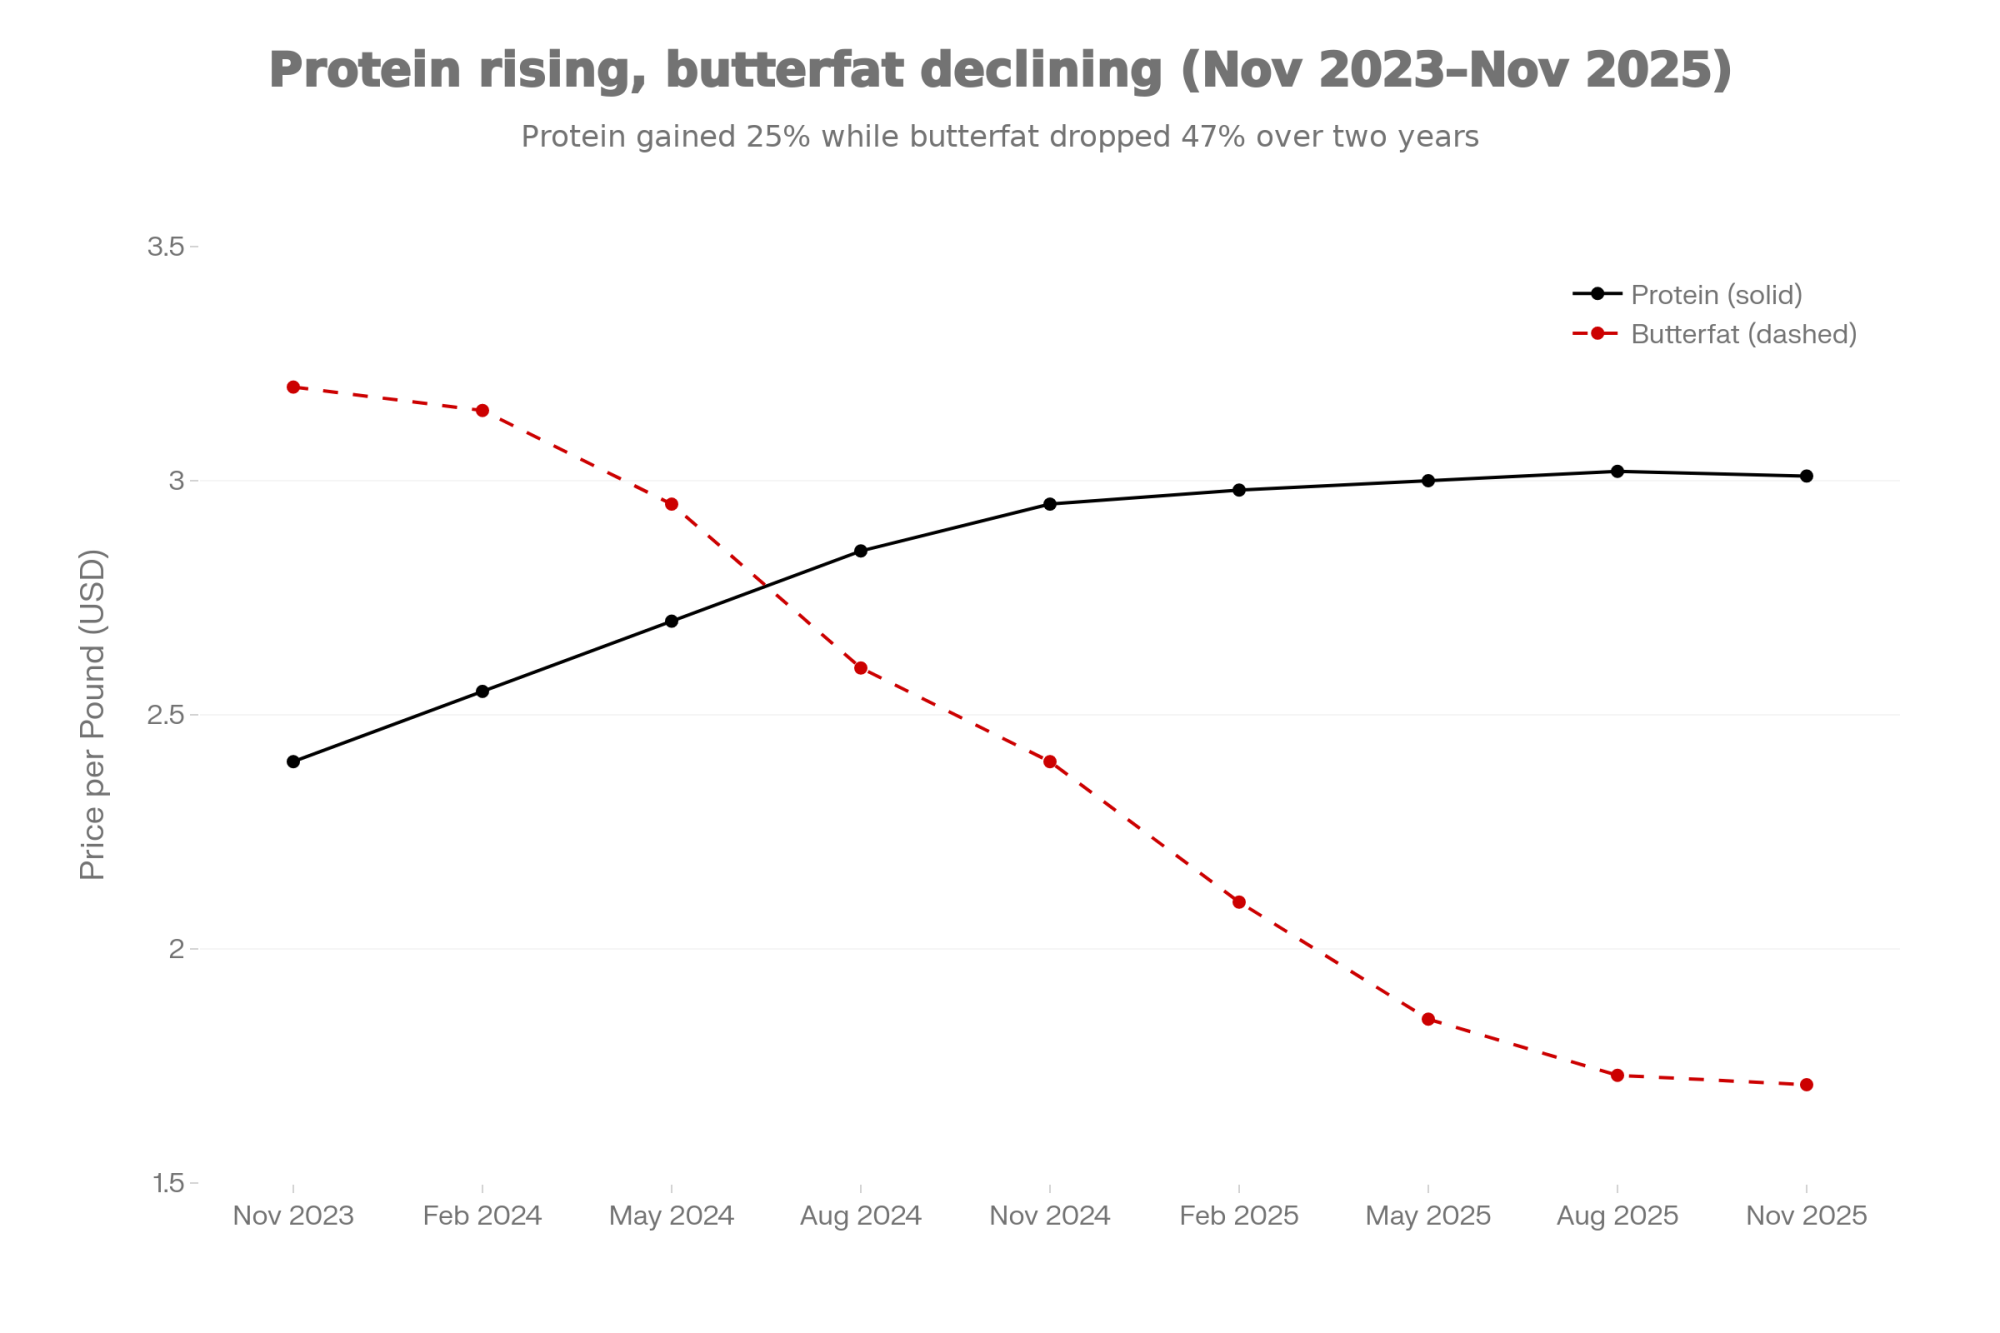
Gravity-well dairies feeding Hilmar and Leprino cheese plants are breeding hard for components, not sheer volume. CoBank’s March 2025 Knowledge Exchange report, “Unprecedented Genetic Gains Are Driving Record Milk Components,” by lead dairy economist Corey Geiger and analyst Abby Prins, documented that U.S. butterfat reached a record 4.23% in 2024, while protein was 3.29%. The April 2025 Holstein base change was the biggest in history. Geiger told Brownfield Ag News: “Butterfat in Holsteins will shift by 45 pounds, and protein by 30 pounds, and that butterfat number’s almost double any number that’s taken place in the past.” brownfieldagnews
For component-priced milk, the message was clear: cows are fatter on paper than they used to be. Future dollars will chase the next increment of fat and protein, not the old base.
As Geiger put it in that same CoBank report: “There’s a clear financial incentive for producers given that multiple component pricing programs place nearly 90% of the milk check value on butterfat and protein.” DFA’s Corey Gillins reports that rising component values are currently adding about $1–$3/cwt across their membership, depending on region and plant.
In that world, solids are the product. Water is freight.
Premium-channel operations feel this differently. MilkHaus Dairy in Fennimore, Wisconsin, for example, tests about 100 of their 360 Holsteins for A2 genetics, housing them separately to produce multiple cheese varieties sold in more than 180 Hy-Vee stores and through their own channels. Components still matter — but the contract is driven by A2, local story, and branded cheese, not just fat and protein yield.
What Does $18.95 Milk Really Mean for a 400-Cow Wisconsin Herd?
USDA’s Economic Research Service released detailed cost-of-production estimates in August 2024, based on 2021 ARMS dairy survey data. For herds in the 200–999 cow bracket, the national average total cost landed around $16.90/cwt — but that average is heavily weighted toward larger, more efficient herds at the top end of the bracket.
Hoard’s Dairyman, working off the same dataset, found that low-cost producers in the 100–199 cow class came in around $19.76/cwt, essentially matching the average 2,000-cow operation at $19.14/cwt. In other words, a lean 150-cow herd can run with a typical 2,000-cow unit on cost — but that’s the low-cost subset, not the median neighbor down the road.
So where does that leave a realistic 400-cow Wisconsin herd that values family labor at $20/hour and books depreciation at replacement cost instead of whatever’s left on the last accountant’s worksheet? Most honest budgets put full-economic breakeven in the $20–$22/cwt range.
Let’s walk it:
- Herd size: 400 cows
- Annual production: 240 cwt/cow/year (roughly 24,000 lbs)
- Total cwt: 96,000 cwt/year
- All-milk price: $18.95/cwt
At a $20/cwt breakeven: margin = −$1.05/cwt, or −$100,800/year
At a $22/cwt breakeven: margin = −$3.05/cwt, or −$292,800/year
That’s six figures of red ink either way.
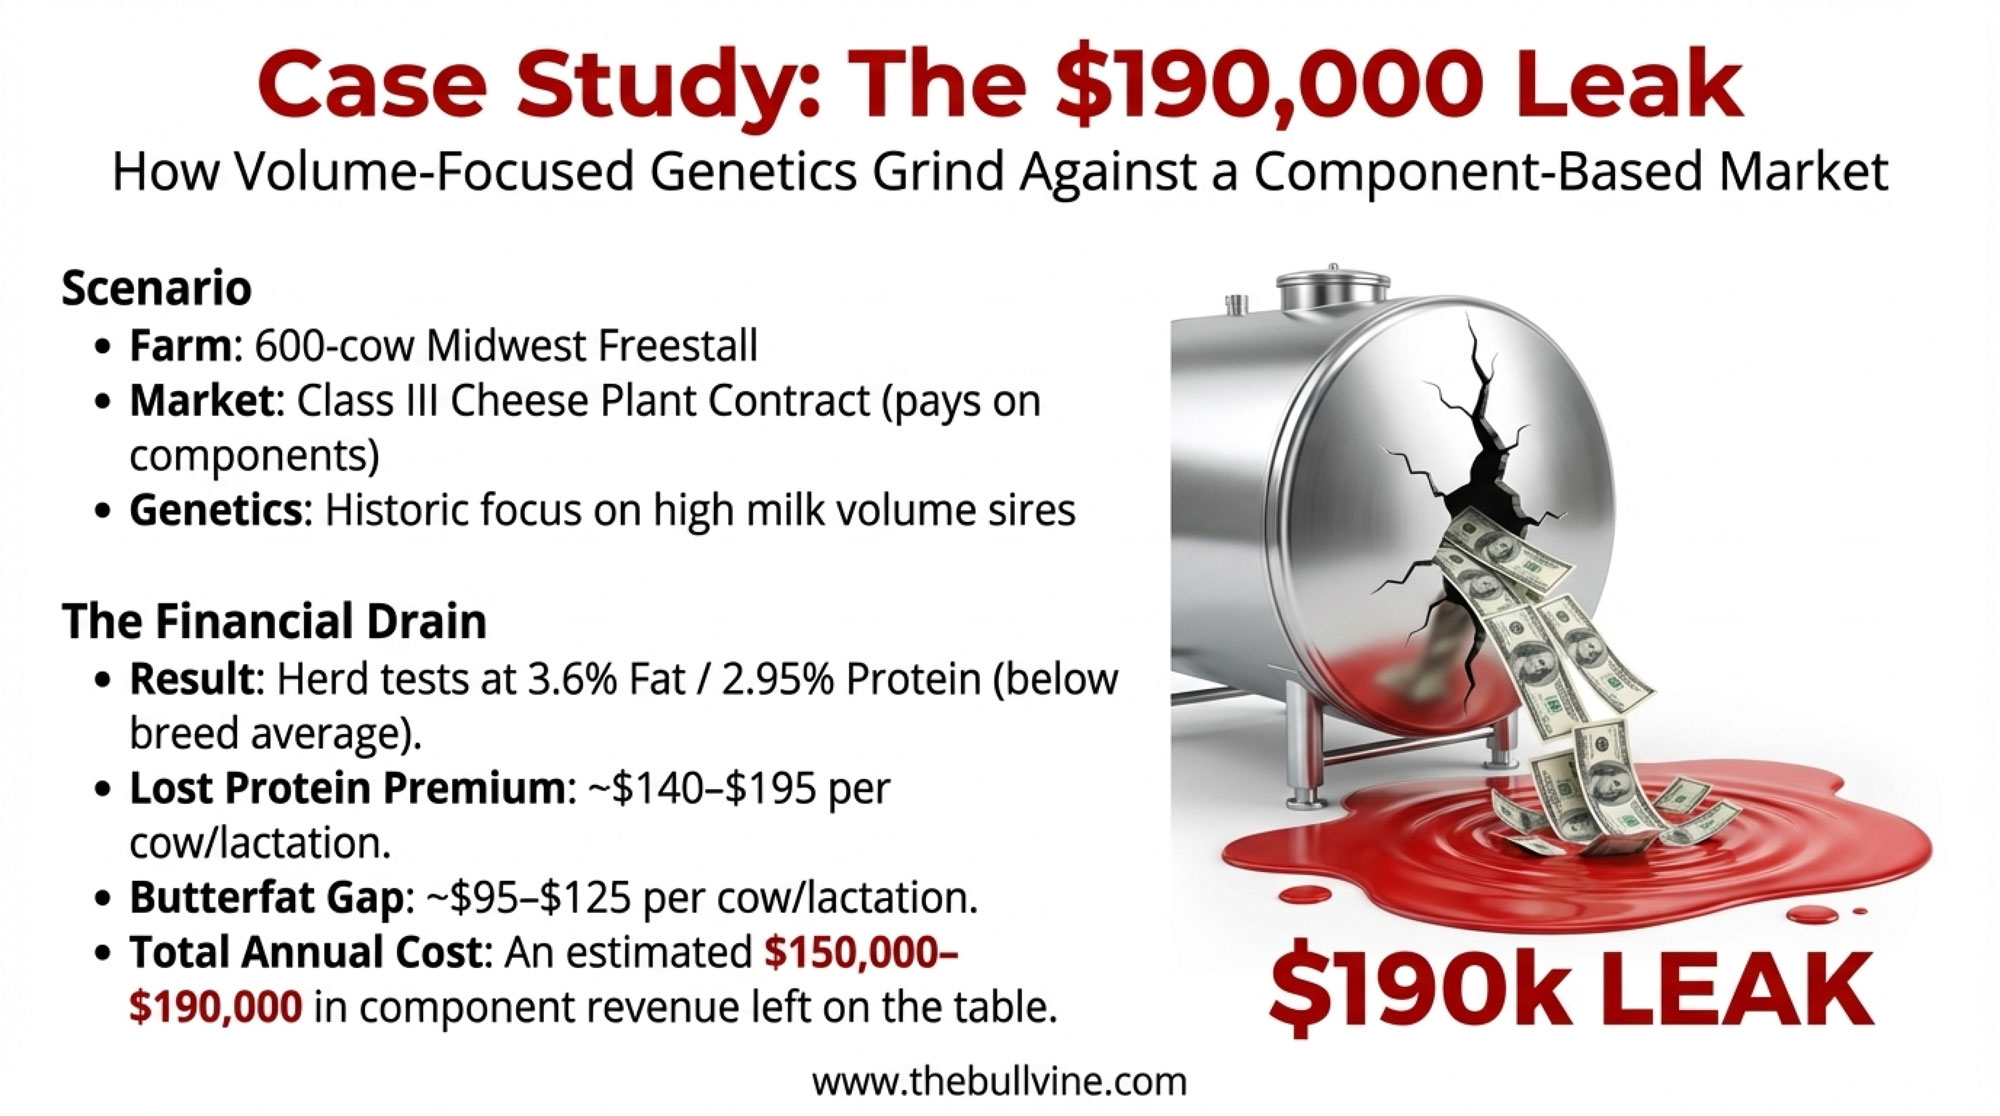
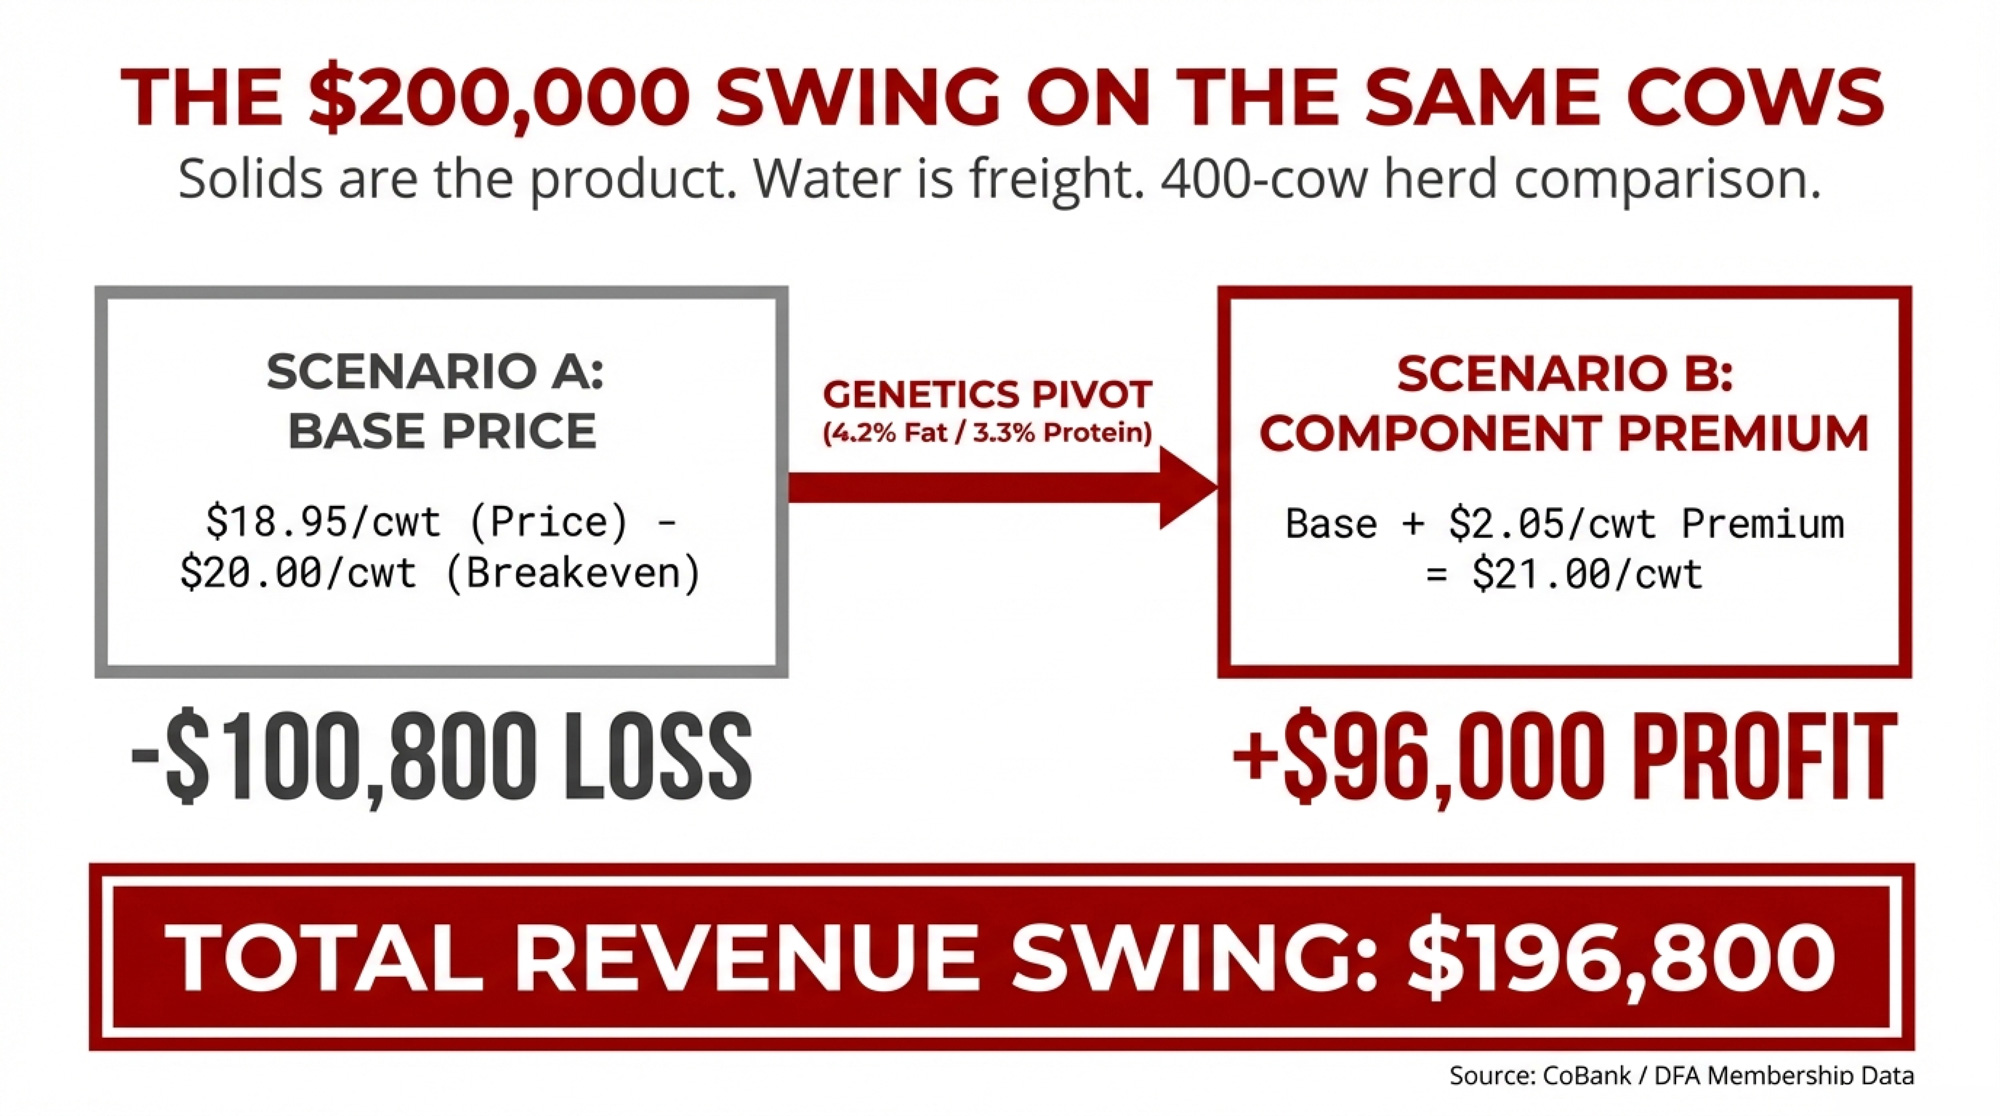
How Components Flip the Math
Now say that same 400-cow herd ships to a cheese plant, paying aggressively for components. They’ve been breeding for solids, and the herd averages 4.2% butterfat and 3.3% protein — achievable with a focused component strategy in Holsteins in 2026.
DFA’s Corey Gillins reports that component premiums are currently lifting checks by roughly $1–$3/cwt across their membership. Split the difference: $2.05/cwt as a realistic mid-range premium for a high-component herd.
- Base all-milk: $18.95/cwt
- Component premium: +$2.05/cwt
- Effective price: $21.00/cwt
At a $20/cwt breakeven: margin = +$1.00/cwt, or +$96,000/year
At a $22/cwt breakeven: margin = −$1.00/cwt, or −$96,000/year
The component swing here is $2.05/cwt — exactly $196,800/year on 96,000 cwt.
Same cows. Same parlor. Same weather. Just a different milk check structure and a genetics program that lines up with it.
Three Real Paths: Scale Up, Go Premium, or Exit On Your Terms
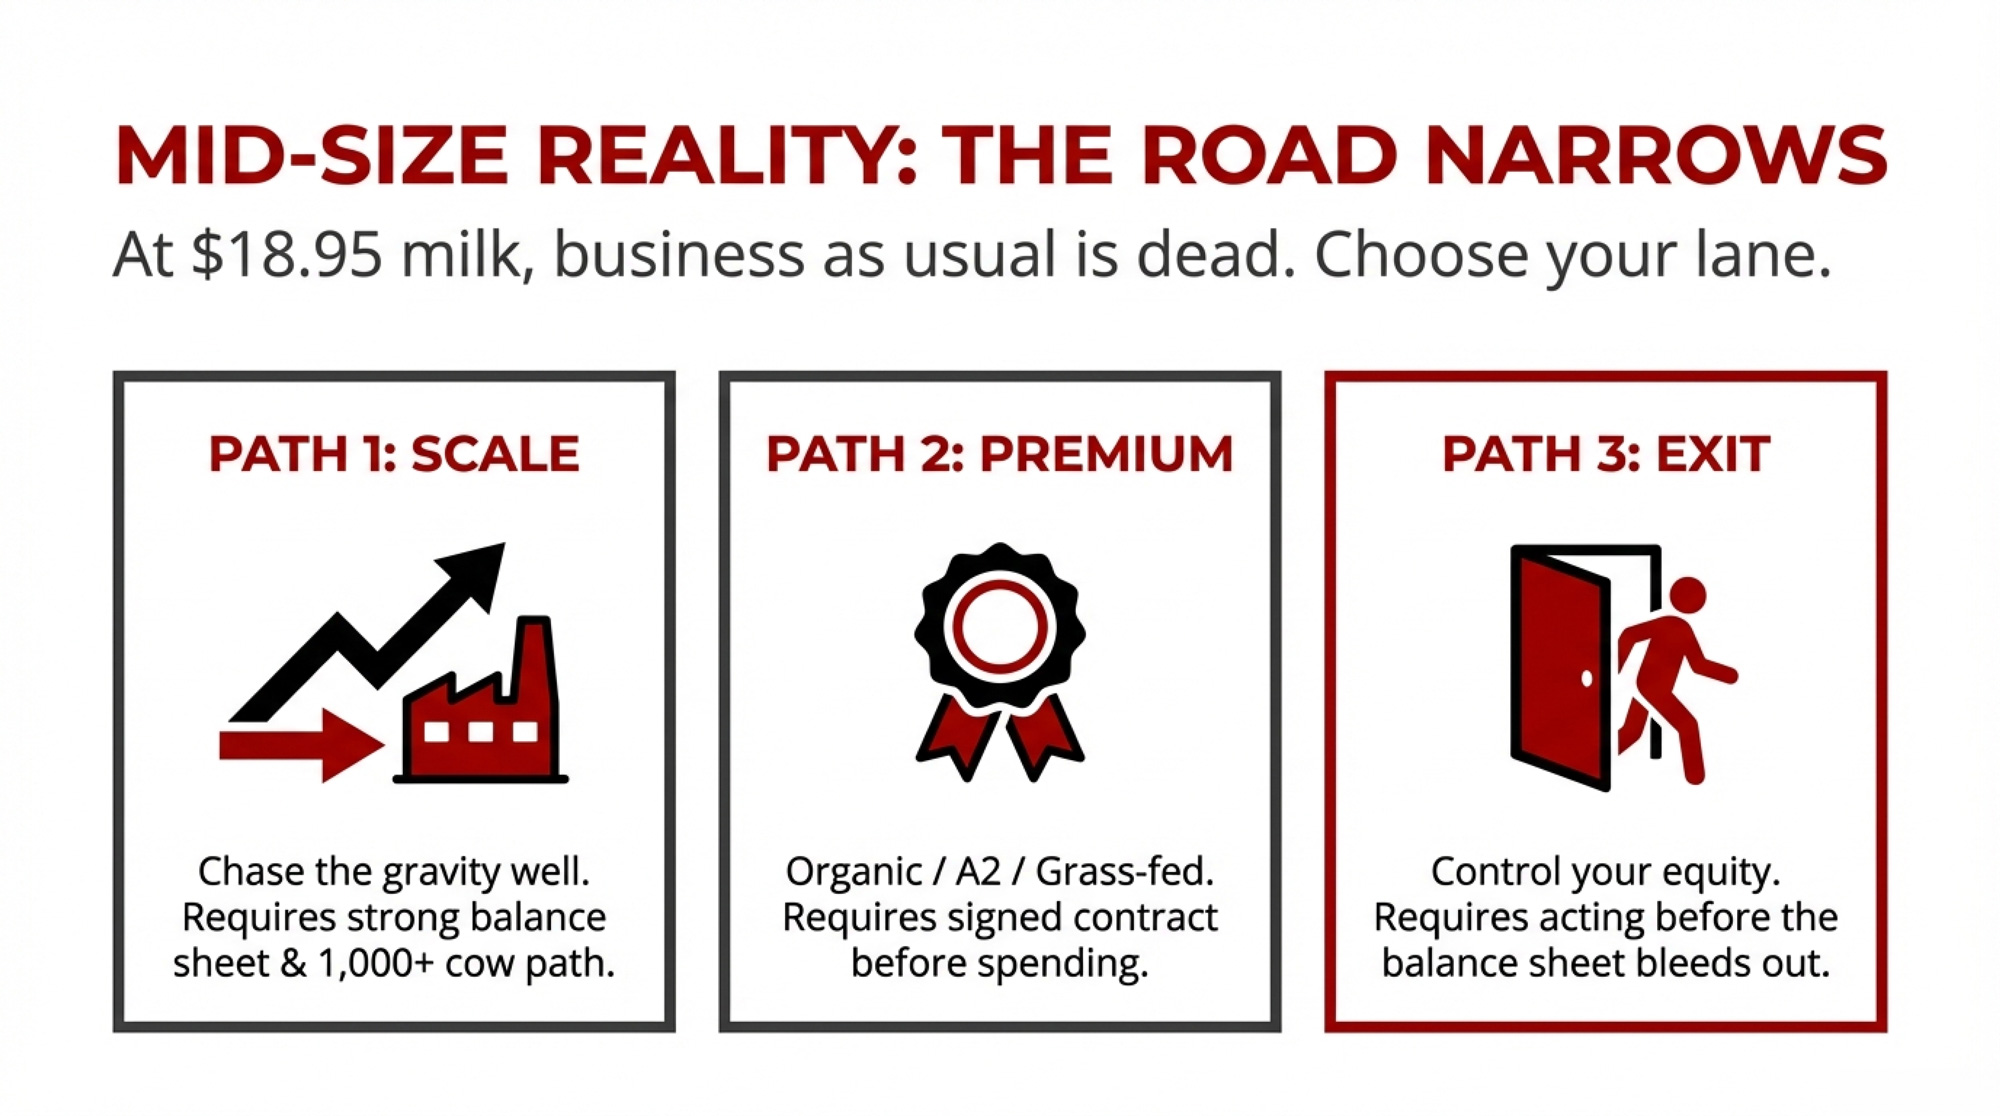
Most mid-size herds staring at $18.95 milk are not really looking at 10 options. The road narrows to three.
Path 1: Scale Up — If the Balance Sheet Can Carry It
This is for you if you’re already at 500+ cows with a credible path to 1,000+, your debt-to-asset ratio is below 40%, you’re under about 55 with a committed successor, and you can secure a signed processor agreement.
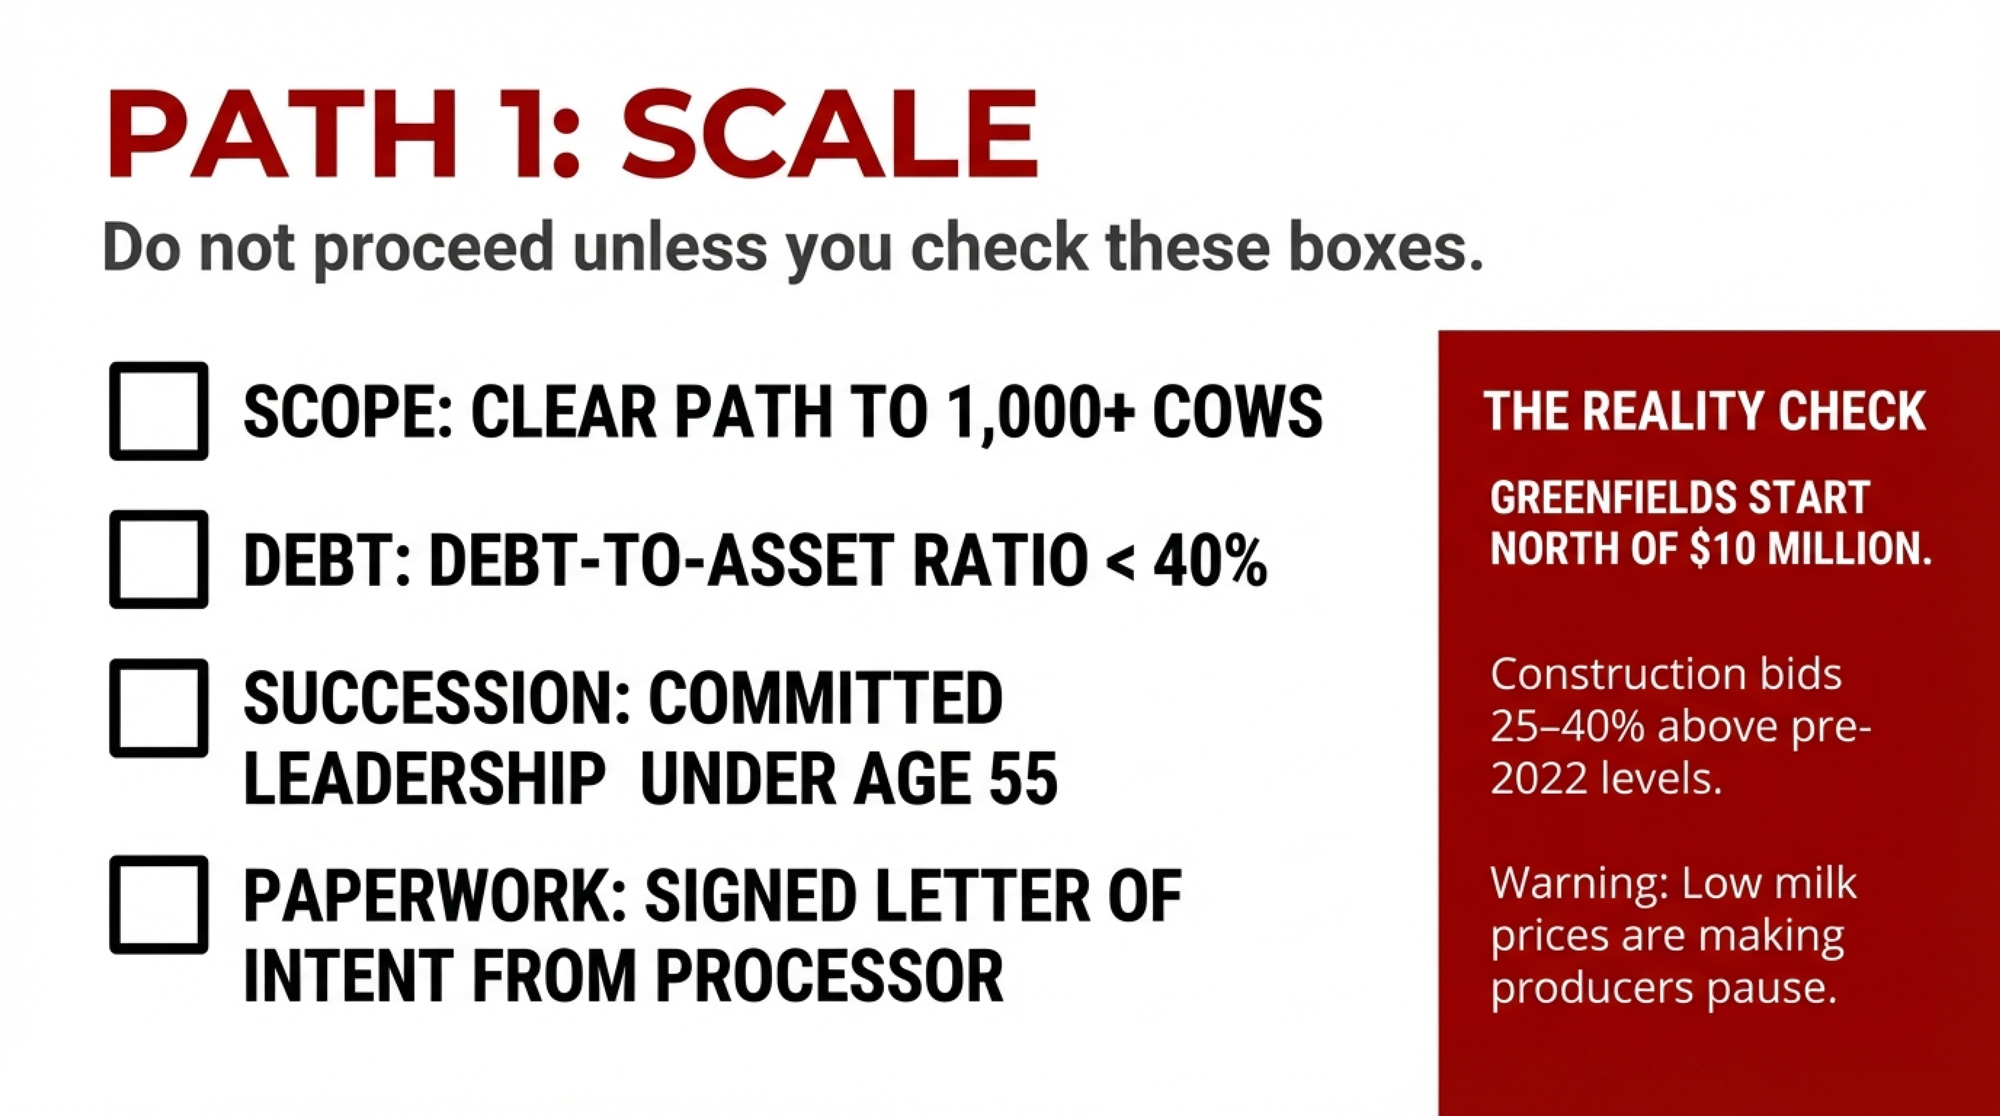
The capital is serious. A Bullvine analysis of expansion economics (May 2025) found that even a 250-cow expansion — land at the national average of $5,570/acre, facilities, and cattle at recent replacement heifer prices of $2,660–$4,000/head — stacked to $4+ million before a single new cow was milked. UW Extension’s 2022 building cost estimates put freestall barn costs at $3,000–$3,500/stall and robot milking facilities at $14,000–$15,000/stall. With construction bids running 25–40% above pre-2022 benchmarks, according to Progressive Dairy’s contractor survey, a 500-to-1,000-cow greenfield build-out realistically starts north of $10 million once you add land, milking center, manure storage, and cattle.
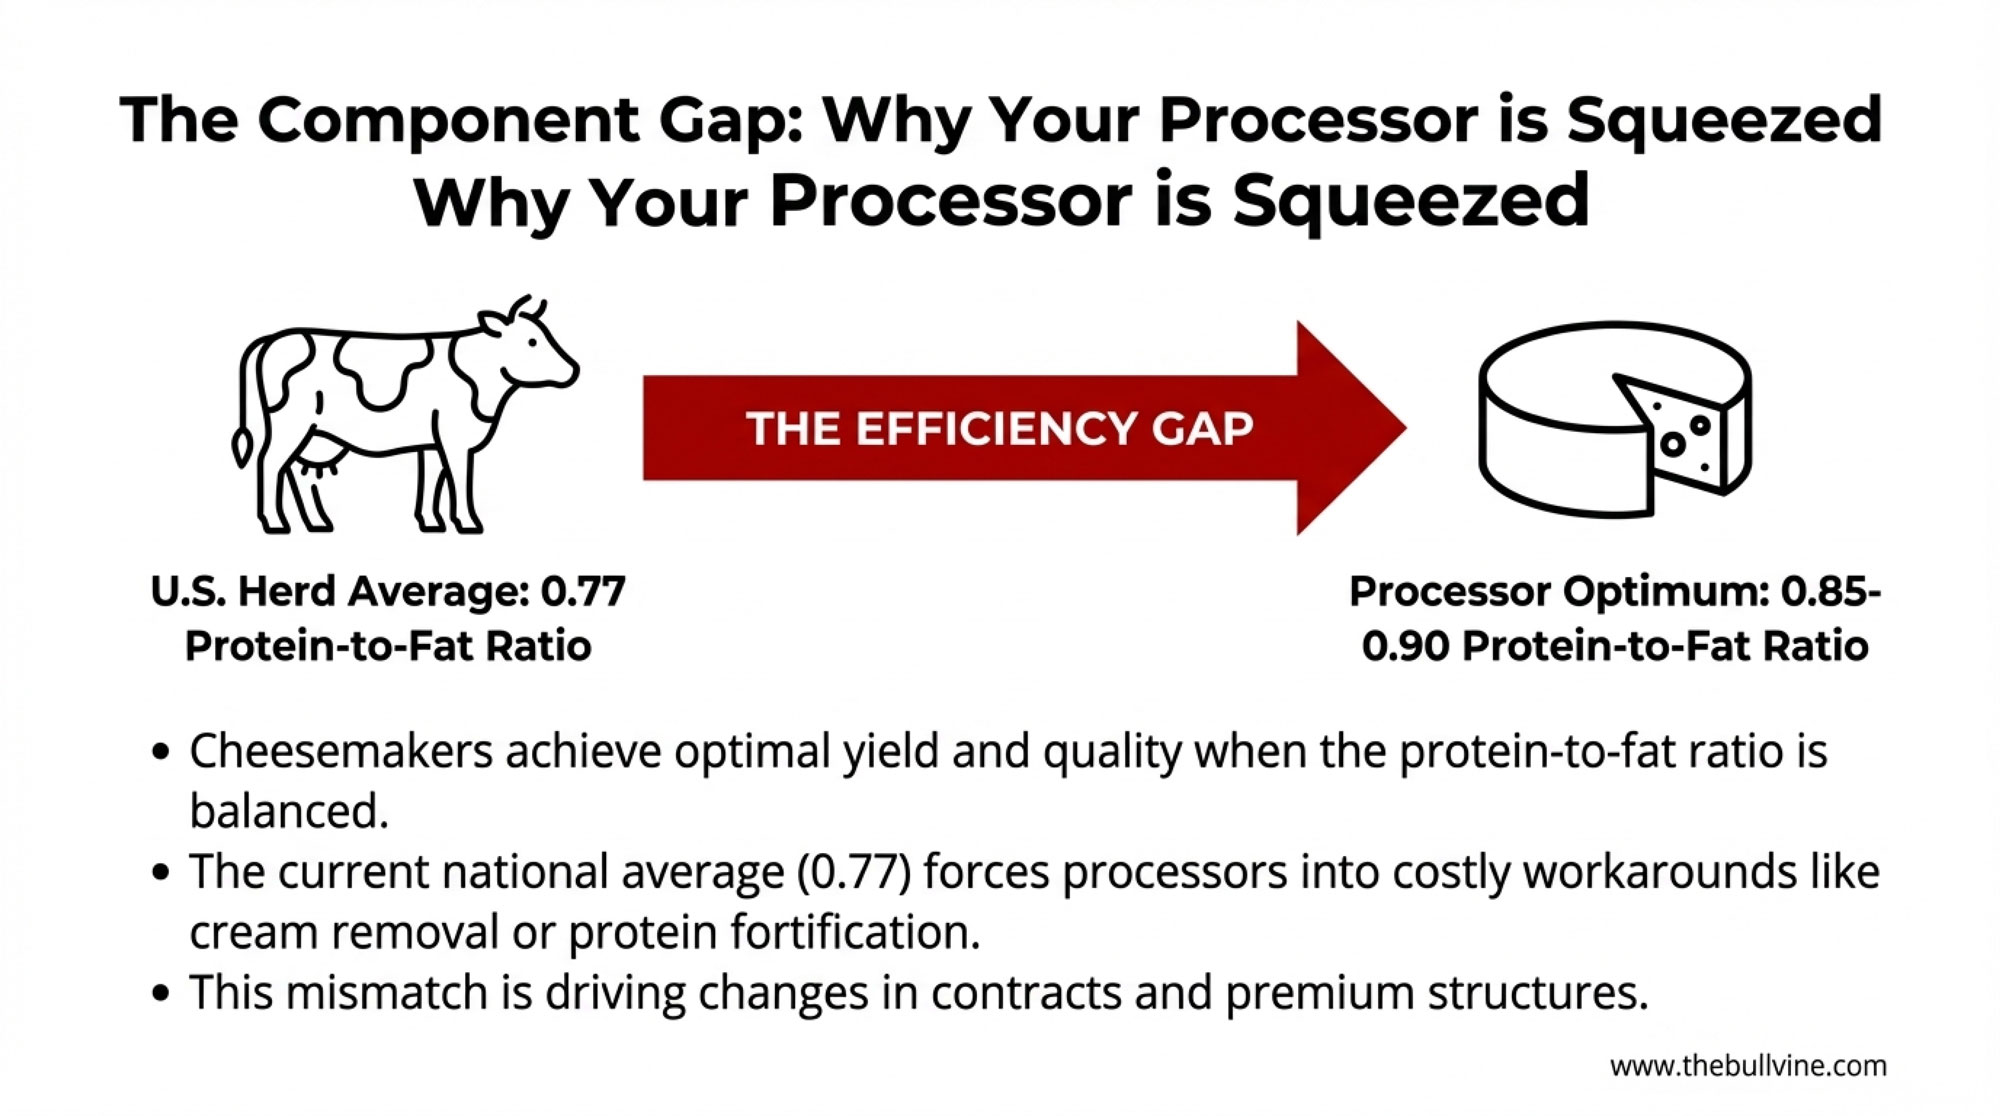
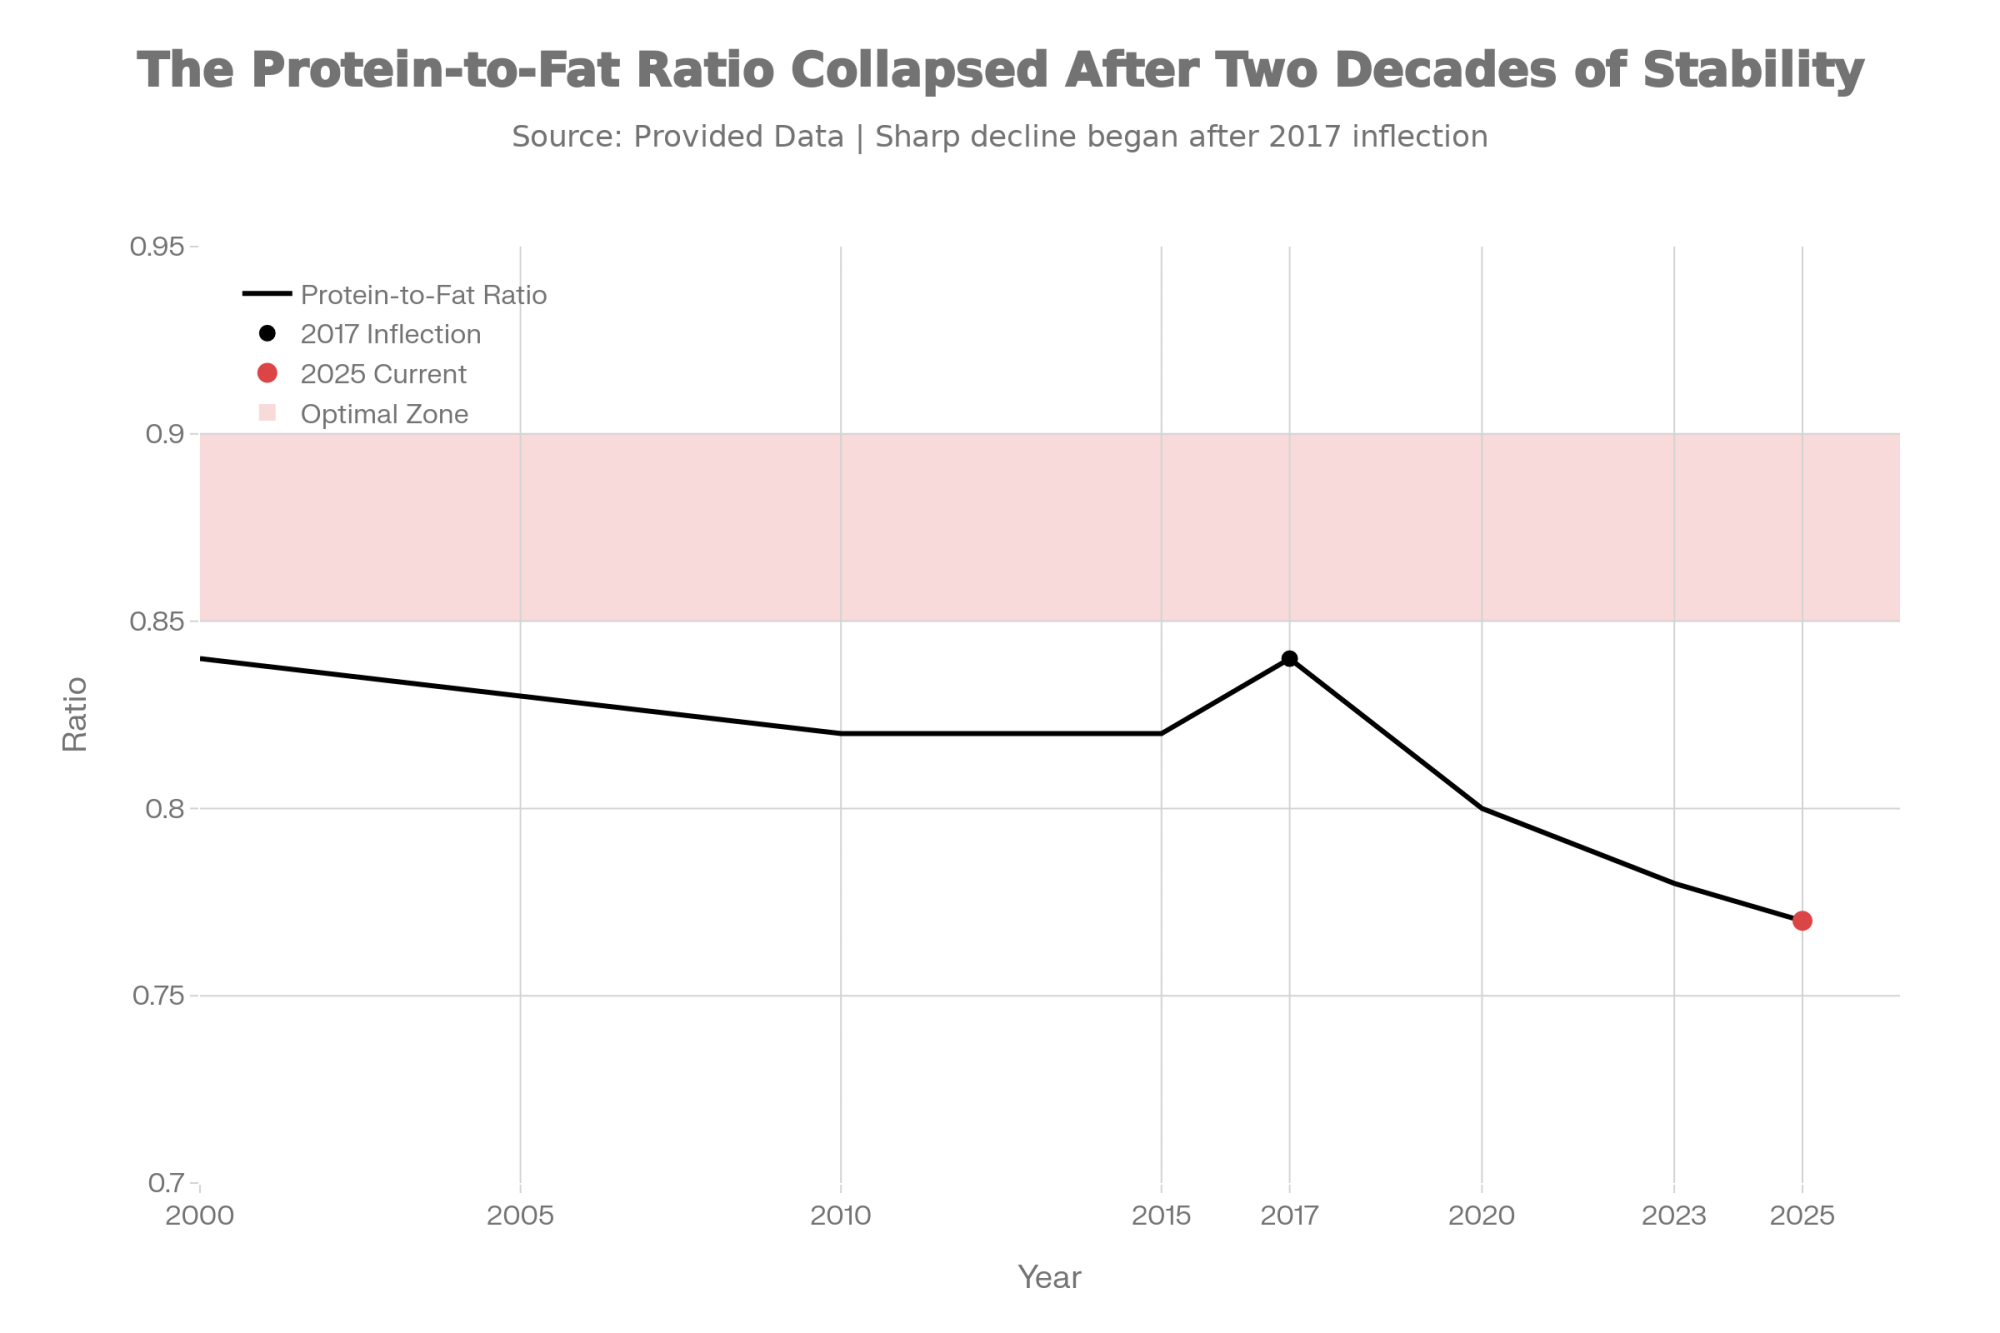
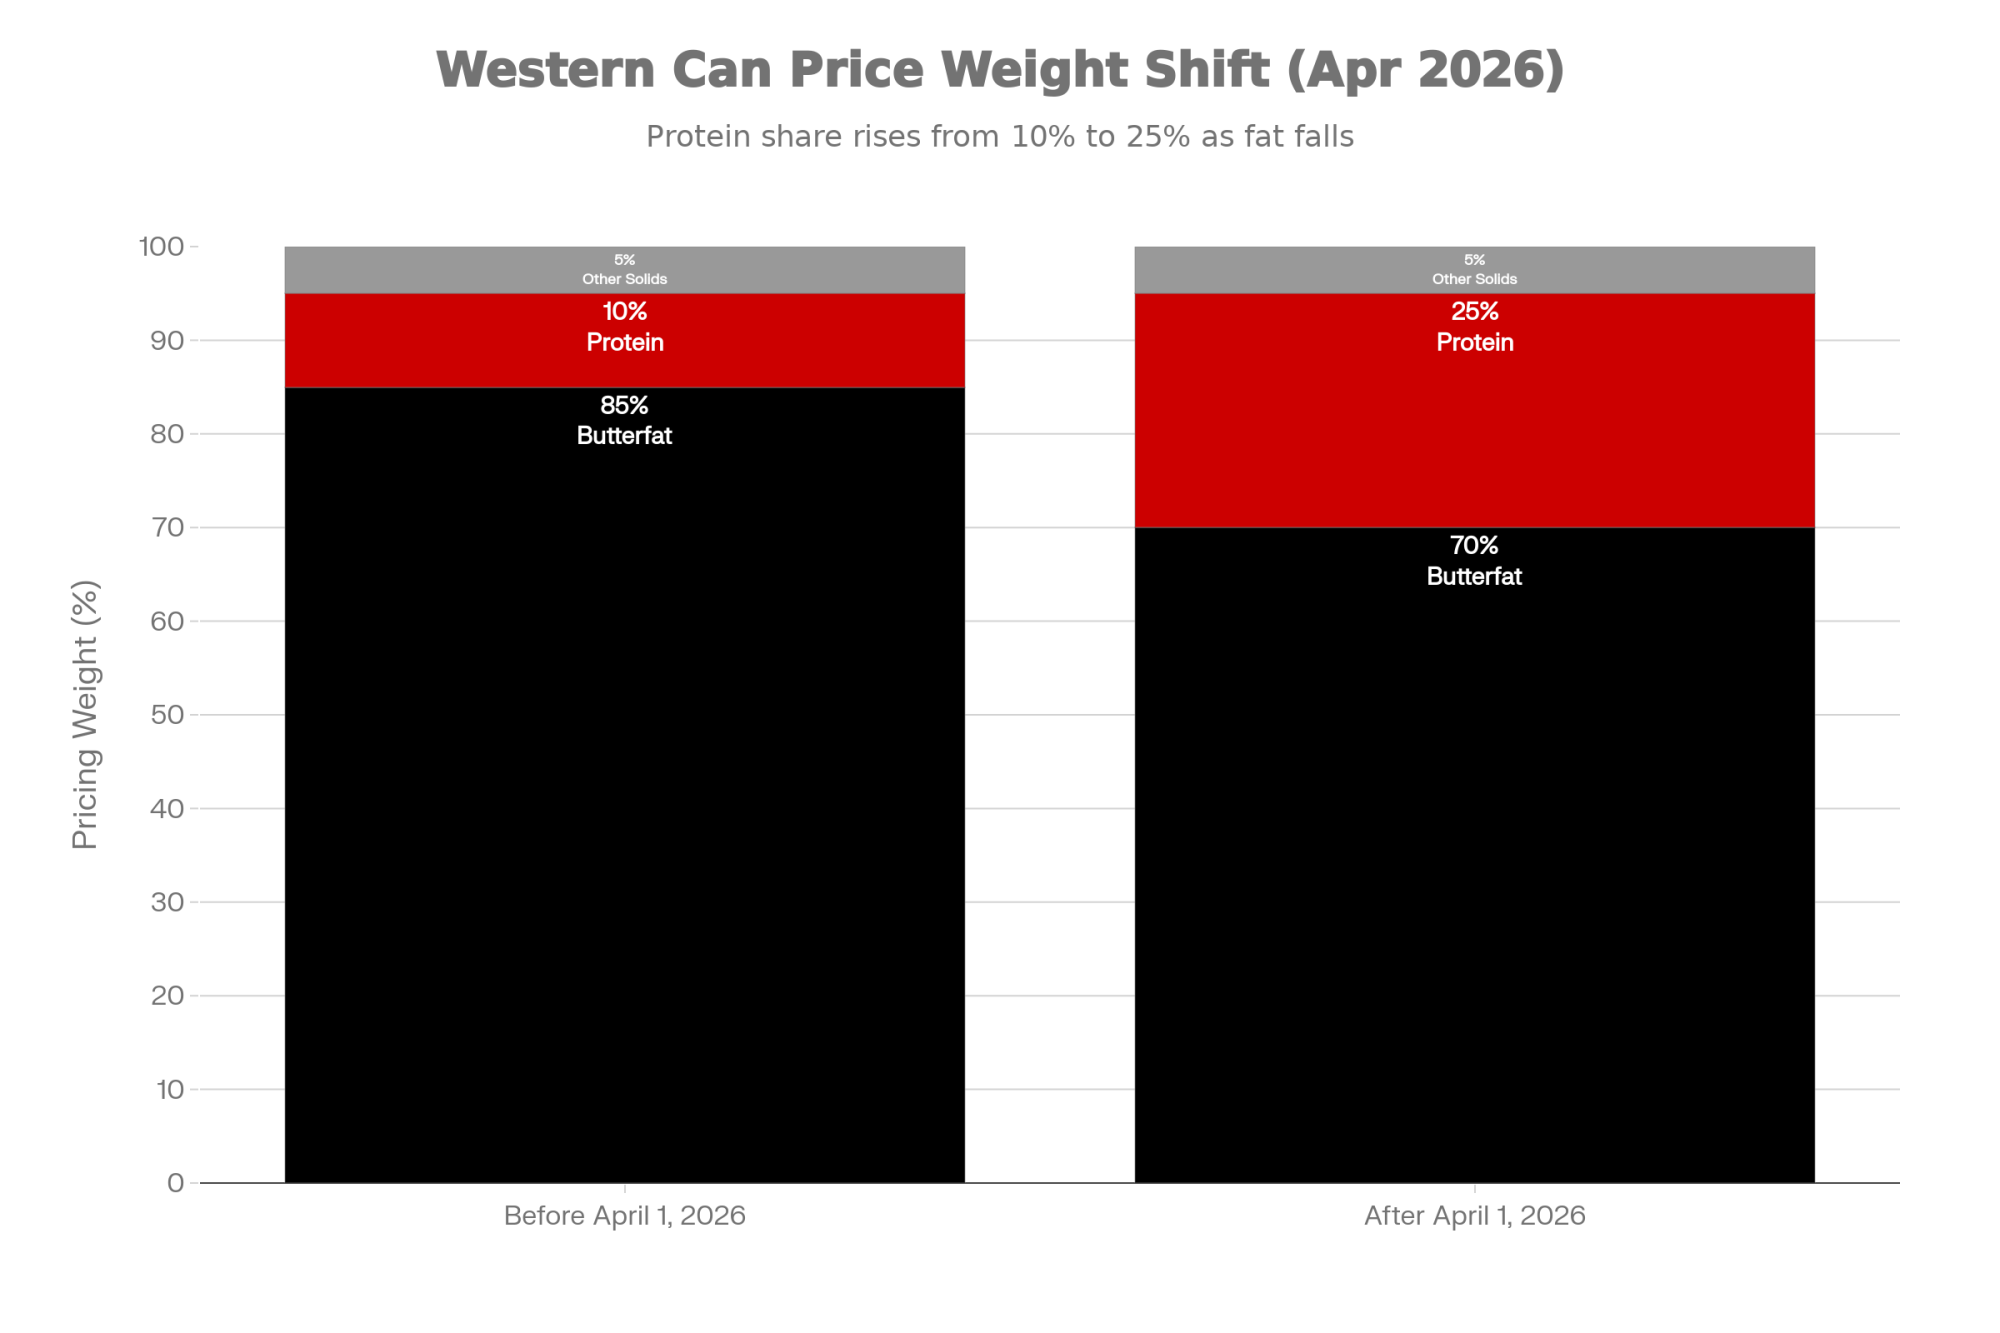
And there’s a genetics wrinkle. CoBank’s September 2025 Knowledge Exchange report, “While U.S. Leads Milk Component Growth, Butterfat May Be Growing Too Fast,” warned that cheesemakers strive for a protein-to-fat ratio near 0.80, and anything significantly lower “can reduce cheese quality and compromise production yields.” Geiger told Brownfield in October 2025: “Eight of the last ten years, butterfat led milk checks. We are going to see a reversal of that this fall. Protein will take over the pole position on milk checks because we need more of it.”
30-day check: Secure a letter of intent from your target plant that spells out the base price, component premiums, and volume expectations.
90-day check: Stress-test your cash flow at $18/cwt for 12 months. January 2026 Class III settled around $14.59, so that downside isn’t hypothetical.
Path 2: Go Premium — If You Can Lock the Contract First
This path works best with 300 cows or fewer, 2+ acres of pasture per cow, and a premium contract locked in beforeyou start spending.
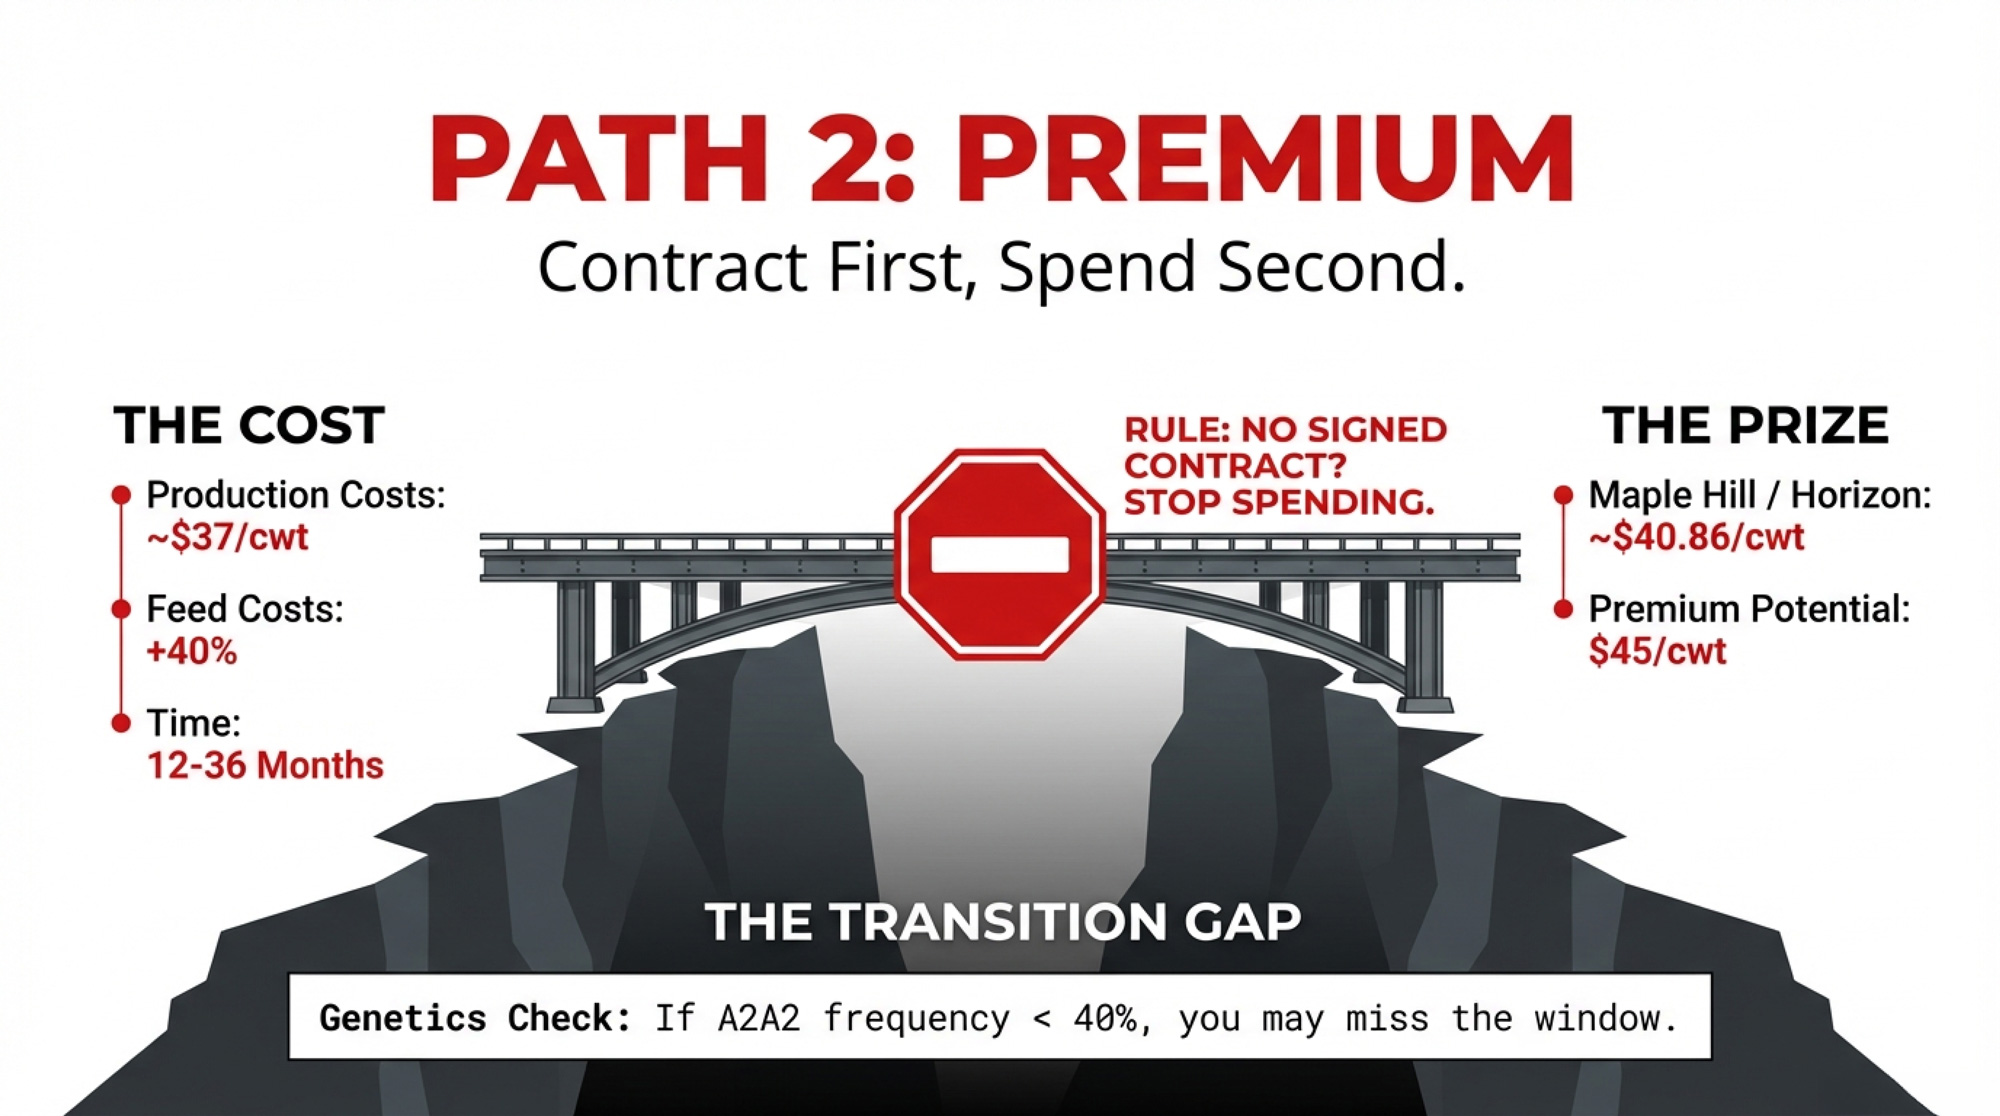
On the organic/grass-fed side, the numbers can get eye-popping. Maple Hill Creamery raised its base to about $40.86/cwt by July 2025, with quality premiums pushing checks toward $45/cwt for farms over 30,000 lbs monthly volume, according to NODPA’s Ed Maltby. Horizon Organic has offered up to $45/cwt in New York, with signing bonuses layered on.
Those checks are real. But so are the costs. NODPA’s Ed Maltby told Dairy Reporter in 2022 that organic production costs in the Northeast were averaging around $37/cwt, with purchased feed running at least 40% higher than conventional, and a three-year transition period that creates a significant income gap before premium checks start flowing. At $40–$45/cwt on the revenue side, today’s premiums finally pencil for qualifying farms — but the slots are limited, the standards are rigid, and the transition window is expensive.
30-day check: Pull your latest genomic or A2 test results. If your herd’s A2A2 frequency is below 40%, a full A2 push might not pencil within the contract window.
90-day check: Model the full transition timeline (12–36 months for organic), including lost conventional premiums during transition, feed cost increases of 40%+, and the lag before premium checks show up.
365-day check: If you don’t have a signed contract by then, stop spending for that premium channel.
Path 3: Exit On Your Terms — Before the Equity Bleeds Out
This is the path nobody wants to talk about at the coffee shop. But it’s where more mid-size herds are quietly ending up.

It fits when you’re past 55 with no committed successor, your breakeven is above $24/cwt and not trending down, and your debt-to-asset ratio has climbed past 60%.
The difference between a planned exit and a forced one is measured in equity:
| Asset | Planned Exit | Forced Exit | Equity Gap |
| Heifers (300 head) | $3,010/head | ≈$2,200/head | −$243,000 |
| Culls (80 head, 1,300 lbs) | $140/cwt | $95/cwt | −$46,800 |
| Combined | ≈$290,000 |
That’s nearly $290,000 gone — on cattle alone — if you sell into a weaker market or under duress.
Red flag: If your 18-month cash flow projection shows cumulative losses exceeding 15% of equity, you’re already in the danger band where lenders start quietly moving you from “client” to “risk.”
365-day check: If you’ve crossed that 15% threshold and have no successor, your default path is already Path 3. The only question is whether you control the timing.
| Path | If This Is You | 30-Day Check | 90-Day Check | 365-Day Check |
| Path 1: Scale Up | 500+ cows, debt-to-asset <40%, under 55, committed successor | Secure letter of intent from target plant (base + component premiums) | Stress-test cash flow at $18/cwt for 12 months | If breakeven >$24/cwt with no improvement, Path 1 isn’t yours |
| Path 2: Go Premium | 300 or fewer cows, 2+ acres pasture per cow | Pull genomic/A2 test results. If A2 frequency <40%, stop | Model full transition: 12–36 months, feed costs +40%, lag before premium checks | No signed contract by day 365? Stop spending for that channel |
| Path 3: Exit On Terms | Past 55, no successor, breakeven >$24/cwt, debt-to-asset >60% | Pull 18-month cash flow projection | Check equity burn. Losses >15% of equity? You’re in the danger band | If you’ve crossed 15% threshold, default path is already exit |
| Capital Reality Check | All paths | 500→1,000 cow expansion: $10M+ greenfield | Organic transition: $37/cwt costs, 40% higher feed | Planned vs. forced exit: $290K equity gap on 300-cow herd |
What Signals Should Dairy Producers Watch in 2026?
There are a few signals worth tracking closely before you commit hard to any of these three paths.
- Immigration reform has real momentum. Senate Agriculture Committee Chairman John Boozman (R-AR) told AgWeb in January 2026: “We said we could not do reform because the border was not secure, and it wasn’t.” He indicated that with the border situation changed, visa program reform is now on the table. If year-round ag visas open by 2027–2028, the labor cost gap between regions shrinks.
- Groundwater rules are tightening. Watch counties like Dallam, Hartley, and Moore in Texas, plus western Kansas groundwater districts. If pumping caps or metering requirements tighten on new wells, your 2026 expansion penciling may not hold in 2036.
- Contract language is drifting. Shorter contract terms, stricter quality specs, or new water-efficiency clauses are not paperwork details. They’re how processors quietly move more structural risk onto you.
- Protein is taking over from fat. CoBank’s Geiger was explicit in October 2025: “Protein will take over the pole position on milk checks because we need more of it.” If your herd’s protein is weak relative to fat, that premium shift matters.
- Spring flush will pressure prices. The national herd was up about 202,000 head year-over-year in Q4 2025, pushing more milk into the system. January’s DMC margin clocked in at $7.57/cwt, which is $1.93 under the $9.50 top-tier trigger. Those checks help, but they don’t fix a structural cost problem.
What This Means for Your Operation
You don’t control Hilmar, Leprino, or Valley Queen. You do control how honestly you read your own numbers.
- Pin down your real breakeven. Don’t benchmark off the national $16.90/cwt average for 200–999 cow herds — that’s production-weighted toward bigger units. Use your own books with family labor at $18–22/hour and depreciation at replacement value. If your full-economic breakeven is north of $22/cwt, Path 1 (Scale) probably isn’t yours.
- Test your component readiness. Pull your latest DHIA test. If you’re nowhere near 4.2% fat and 3.3% protein, you’re not positioned to grab a $2.05/cwt component lift tomorrow. Above 4.0/3.2? You’re in the conversation. Below that? Plan on 18–24 months of genetics and management work to climb.
- Model your operation at $18/cwt for six months. If that scenario puts you past a 15% equity burn or pushes your debt-service coverage ratio below your lender’s requirements, the current structure isn’t sustainable without changes.
- If you’re flirting with growth states, run the 2040 water scenario. Don’t just ask, “Can I pump today?” Ask, “What happens if my allocation is cut 30–40% halfway through the loan?”
- If you’re eyeing a premium contract, don’t spend a dollar without a signed agreement. Maple Hill and Horizon are paying $38–$45/cwt in some regions — but organic production costs average around $37/cwt in the Northeast, and the three-year transition means years of conventional-priced milk before premium checks start.
- If you’re over 55 and have no successor, set a date for your exit. Look at cattle prices, heifer values, land comps, and your loan schedule. The planned vs. forced gap on a 300-cow herd is roughly $290,000 in cattle equity alone.
- Use DMC to buy time, not to hide from reality. January’s $7.57 DMC margin will send checks to those enrolled at the $9.50 level. That’s breathing room, not a business model.
Key Takeaways
- The $2.05/cwt component swing on a 400-cow, 96,000-cwt herd equals about $196,800/year. If you ship to a cheese plant and aren’t breeding for solids, you’re leaving a six-figure line item on the table.
- If your breakeven sits above $24/cwt with no clear plan to get it back under $22, the exit math is already running in the background. On a 300-cow herd, the difference between a planned and forced exit is roughly $290,000 in cattle equity alone.
- Processor confidence doesn’t validate your expansion. Hilmar, Leprino, and Valley Queen can diversify across regions. A new 2,000-cow unit tied to a single plant in a single stressed aquifer can’t.
- Protein is about to overtake fat on your milk check. CoBank’s Geiger says it’s already happening this fall. If your breeding plan hasn’t caught up, your milk check will tell you.
- Water, labor, and genetics are structural, not cyclical. They won’t fix themselves in the next price rally. If your five-year plan doesn’t account for them, it’s not really a plan.
The Bottom Line
Pull your latest DHIA test, your actual debt-to-asset, and your processor contract terms. Those three numbers tell you which path is still open.
Complete references and supporting documentation are available upon request by contacting the editorial team at editor@thebullvine.com.
Learn More
- The $212,000 Bulk Tank Lie Hitting Upper Midwest Dairies – Arms you with a step-by-step playbook to stress-test your component revenue against the latest FMMO reforms. This breakdown reveals why chasing high test percentages could be costing your operation six figures in lost component pounds.
- Beyond Efficiency: Three Dairy Models Built to Survive $14 Milk in 2026 – Delivers a strategic roadmap for the next three to five years by exposing the structural shift toward mega-scale and premium diversification. It helps you position your operation to survive a permanent low-margin landscape.
- Breeding Into a Moving Market: What Butterfat’s Crash Reveals About Dairy’s Genetic Timing Problem – Exposes the dangerous “timing gap” between today’s genetic selection and tomorrow’s market reality. This analysis delivers the insight needed to stop chasing yesterday’s premiums and start breeding for the 2030 component demand.
 The Sunday Read Dairy Professionals Don’t Skip.
 The Sunday Read Dairy Professionals Don’t Skip.
Every week, thousands of producers, breeders, and industry insiders open Bullvine Weekly for genetics insights, market shifts, and profit strategies they won’t find anywhere else. One email. Five minutes. Smarter decisions all week.