3 out of 4 dairies bred beef-on-dairy. Now 800,000 heifers are missing, and replacements are $3,010 a head. Where does your herd sit in that math?
Executive Summary: If you chased beef‑on‑dairy premiums in 2022–23, you’re now buying replacements in a world where heifer prices jumped from $1,140 in 2019 to $3,010 in mid‑2025 and often top $4,000 in high‑demand regions. At the same time, U.S. replacement inventories have dropped to their lowest level since 1978, leaving roughly 800,000 “missing” heifers across 2025–2026 and making it harder—and more expensive—to keep herds at size. For a 200‑cow herd turning over 35–38% per year, that shift alone can mean an extra $126,000–$144,000 in replacement capital over the next two years if you have to buy those animals instead of calving them in. This piece breaks your options into four concrete paths—breeding rebalance, reduced culling, strategic exit, and processor lock‑in—and spells out where each helps, where it backfires, and the thresholds (like an 18% pregnancy rate or culling below 30%) that should force a rethink. It also links your barn‑level math to the bigger picture: beef‑on‑dairy calves now account for 12–15% of fed beef harvests, and roughly $10 billion in new dairy plants are scheduled to come online by 2027, keeping processor demand for reliable milk flows high even as replacements stay tight. The goal is simple: give you enough numbers and clear decision rules to decide whether your 2026 breeding sheet keeps you in the group processors treat as long‑term partners—or in the group scrambling for $3,000+ heifers with everyone else.
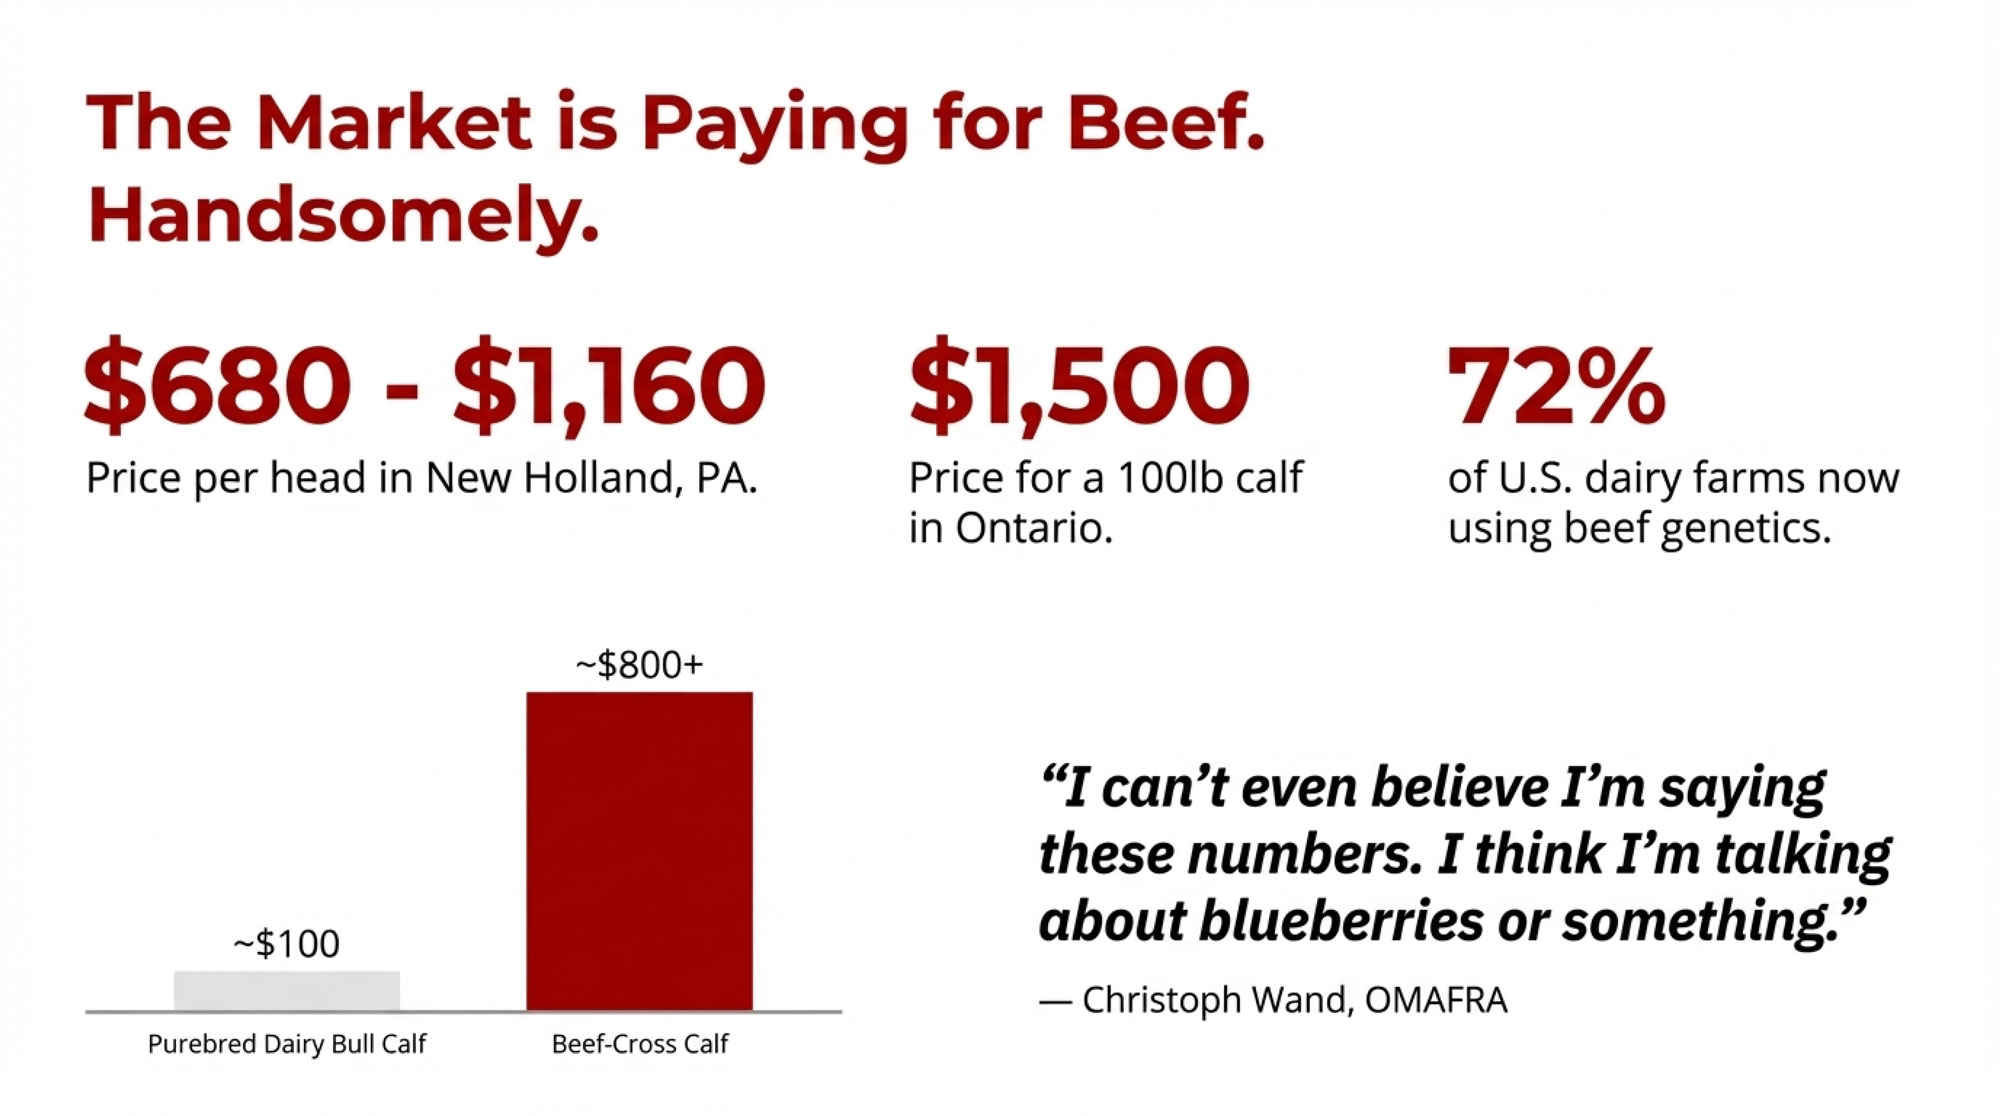
Ken McCarty of McCarty Family Farms still remembers trying to sell Holstein bull calves: “Two for $5″—with no takers. That painful baseline explains why dairy producers didn’t hesitate when beef-on-dairy calves started bringing $600, then $1,000, then $1,400 per head. The math seemed obvious. The check was immediate.
But it wasn’t free money. It was a deferred bill. And that bill has arrived.
CoBank data shows replacement heifer prices climbed from $1,140 per head in April 2019 to $3,010 by July 2025—with top-quality animals in California and Minnesota auction barns commanding $4,000 or more. USDA’s January 30, 2026, cattle inventory report confirmed the national herd continues to contract. For operations that bred heavily to beef in 2022 and 2023, the pipeline is now empty. For those who maintained balance, a window is opening.
The Scale Nobody Predicted
The adoption curve was staggering. Beef semen sales into dairy herds grew from 1.2 million units in 2010 to 9.4 million units by 2023—roughly 84% of which went into dairy cows, according to a 2024 Purina survey. That same survey found almost three-fourths of U.S. dairy farmers are now actively crossbreeding using beef genetics, with another 16% considering it.
CattleFax puts the production numbers in starker terms: beef-on-dairy calf production jumped from 50,000 head in 2014 to 3.22 million in 2024, with projections reaching 5–6 million head by 2026. These crossbred cattle now account for 12–15% of fed beef harvests.
Every one of those calves was a dairy heifer that wasn’t born.
The Pipeline Math That’s Already Locked In
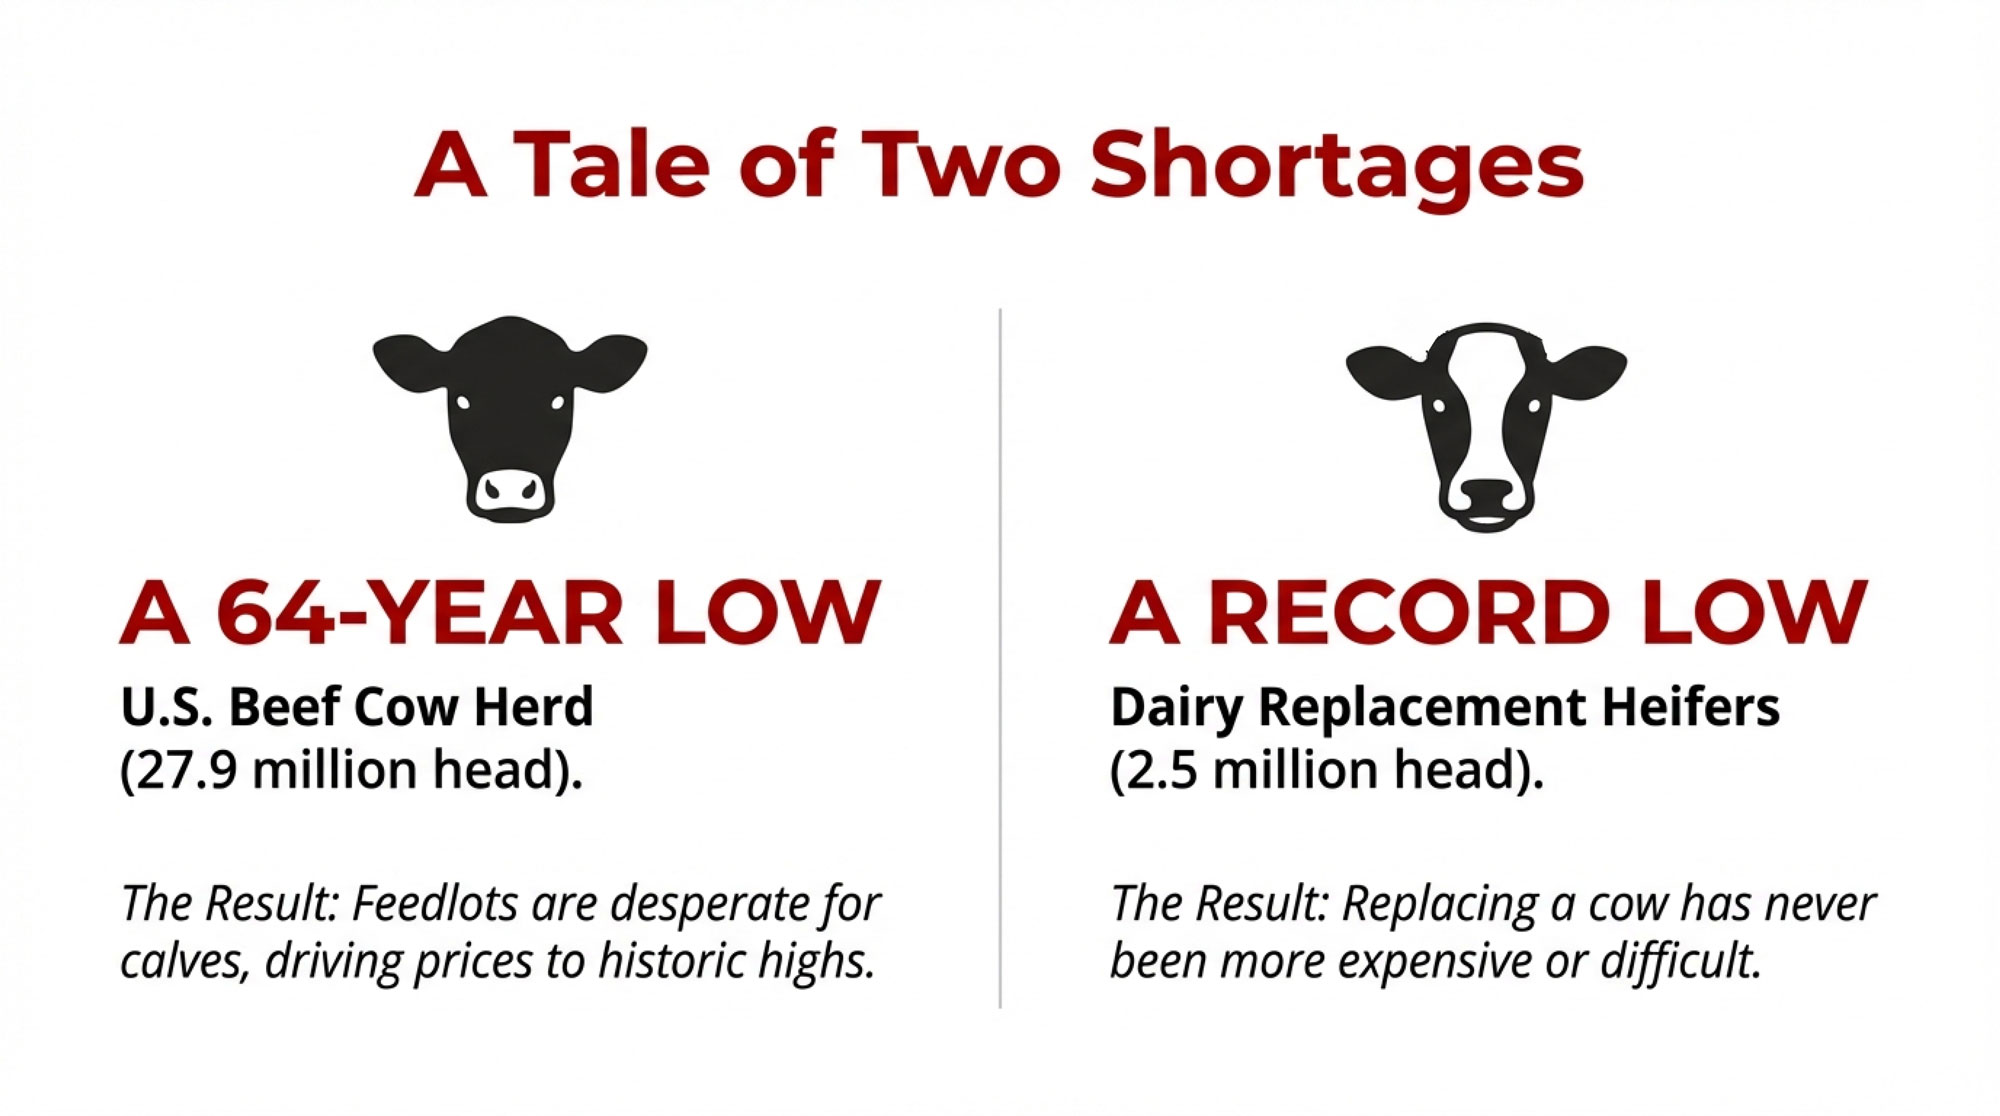
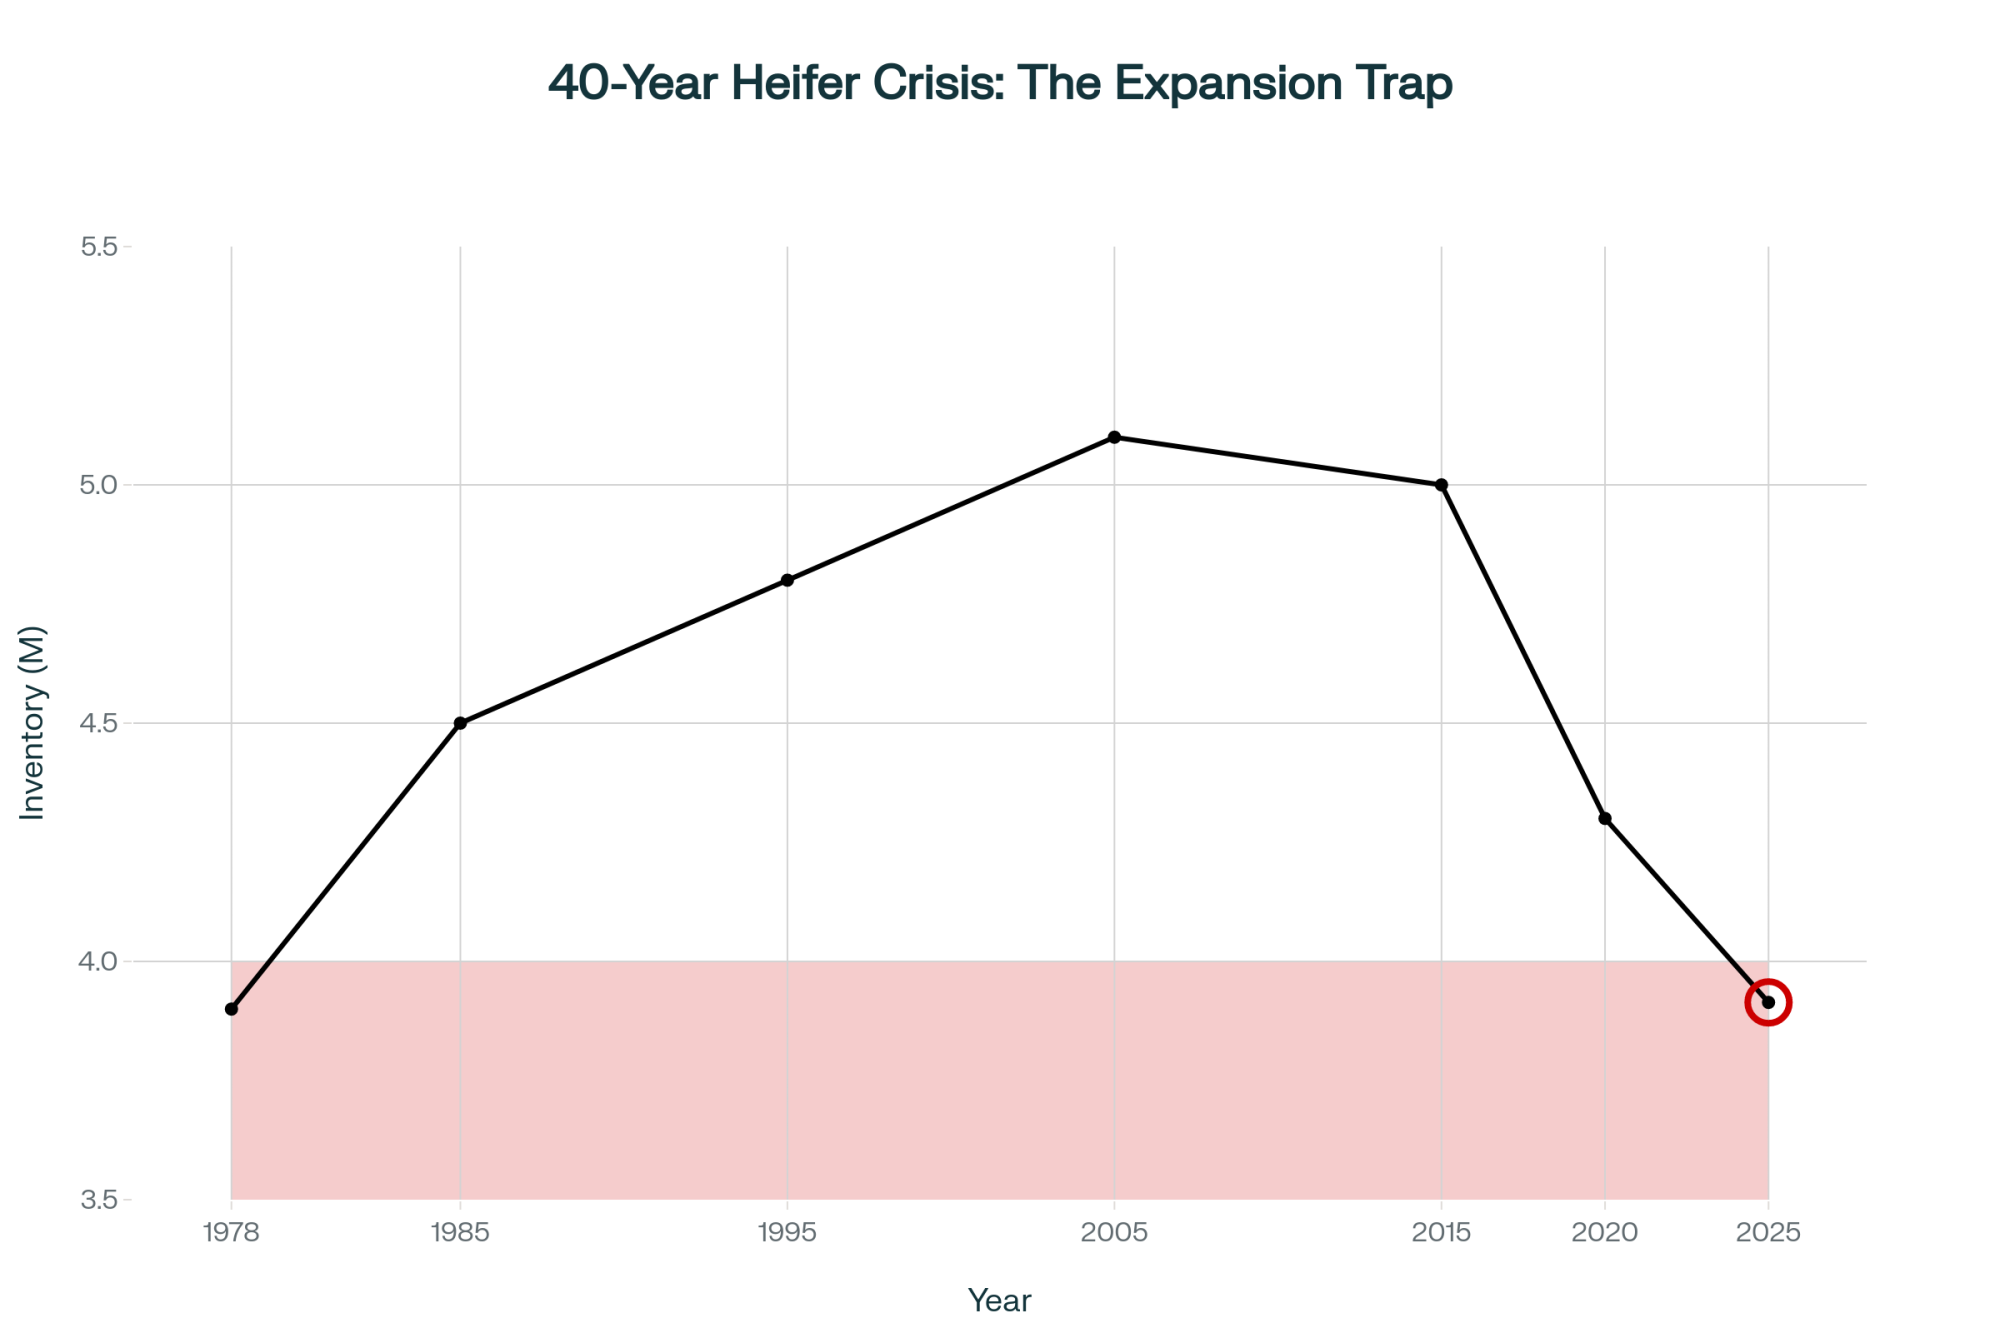
Sarina Sharp at the Daily Dairy Report flagged in early 2024 that dairy heifer inventories had declined for six consecutive years. USDA’s January 2025 snapshot put milk replacement heifers at 3.914 million head—the lowest since 1978, a full 18% below 2018 levels.
CoBank economist Corey Geiger quantified the gap in an August 2025 report: 357,490 fewer dairy heifers available in 2025, then 438,844 fewer in 2026. Add those up. That’s roughly 800,000 missing replacements across a two-year window. And as Geiger commented: “We don’t see a rebound until 2027, and that will be up 285-thousand, but you’ve got to remember, that’s going to be after 800-thousand fewer heifers”.
Regional variation tells its own story. Wisconsin replacement values jumped 43% year-over-year between October 2023 ($1,990) and October 2024 ($2,850), according to USDA data. Yet Wisconsin actually gained 10,000 heifers while Texas lost 10,000 head. “Watch” on the Northwest (Idaho/Washington), where prices have reportedly hit that $4,000+ “north of the border” threshold. That divergence comes down to processor relationships and infrastructure, not just breeding decisions.
The Beef-on-Dairy Miscalculation
Here’s what producers believed: beef-on-dairy premiums were an additive income. Extra revenue layered on top of normal operations without meaningful trade-offs.
Here’s what actually happened.
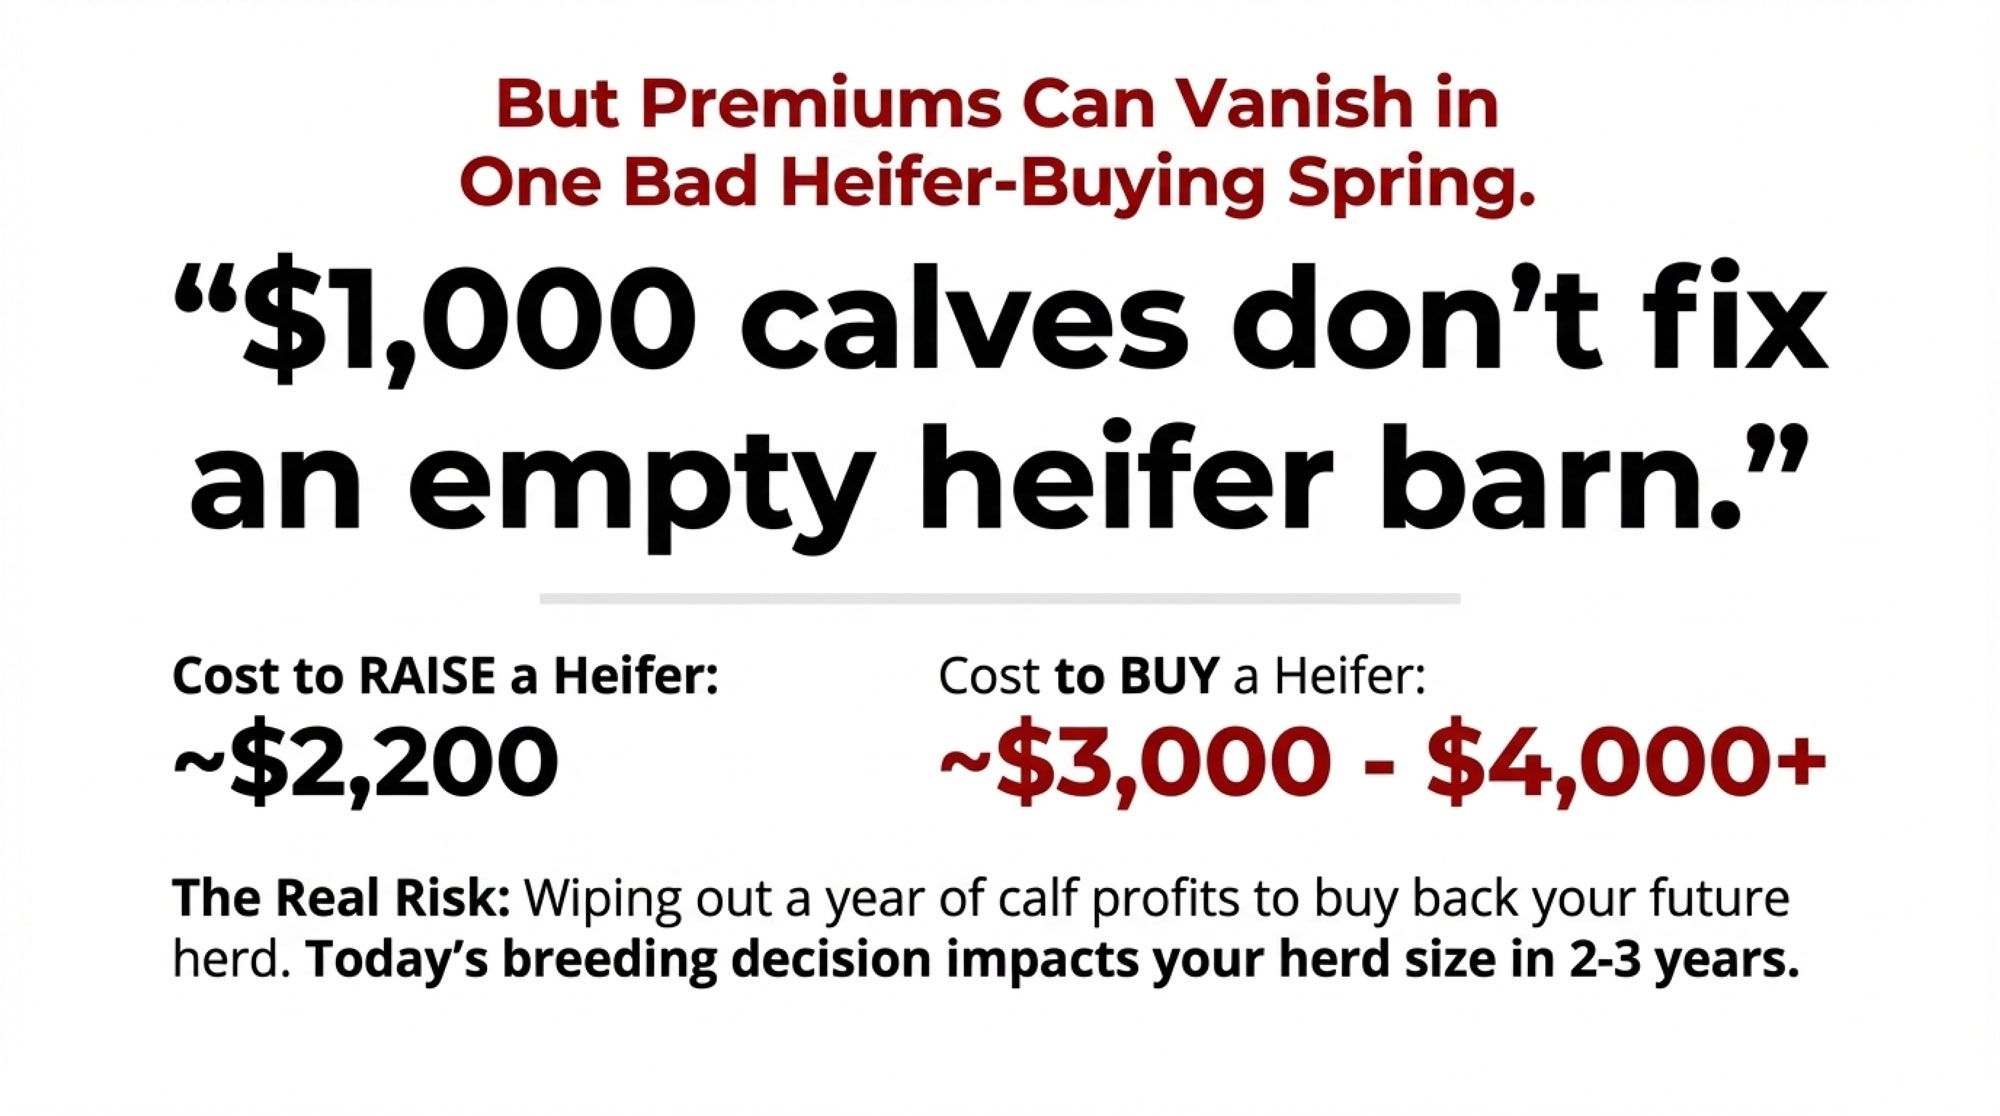
When beef-on-dairy calves climbed toward the $1,400 average that Purina’s Laurence Williams cited by 2024-2025, producers weren’t making a one-time decision. They were depleting a pipeline that takes three-plus years to rebuild. Every beef breeding looked like a $900 gain. What nobody penciled in was the replacement heifer that wouldn’t exist three years later—an animal that now costs $1,870 more than it did in 2019.
CoBank’s analysis is blunt: from conception to a cow in the milk string is a “three-plus year proposition”. You can’t undo aggressive beef breeding quickly.
And the 2024 NAAB semen sales data reveals how producers tried to have it both ways. Gender-sorted dairy semen surged 17.9%—an additional 1.5 million units. But beef semen held steady at 7.9 million units. No retreat.
How This Lands on Real Operations
When Mike North of Ever.Ag started seeing two-to-three-day-old beef-cross calves bringing $1,000, his framing captured the logic perfectly: “Why feed an animal for 18 months when the money’s sitting there at day three?”
But North also flagged the inflection point when the math flipped: “Some animals moving in the northwest last week were north of $4,000 an animal. That’s a pretty tall price, and so now, guess what? We’re seeing people starting to switch some of their breeding back to that replacement animal”.
One Minnesota producer’s current allocation illustrates the hedging strategy most operations have adopted: 10% of cows bred to sexed semen, while the rest go to beef; for heifers, 50% bred to sexed semen, while the other half go to beef. That’s not a correction—it’s a bet that partial measures will thread the needle.
Meanwhile, culling rates have collapsed. Dairy farmers have sent 611,600 fewer cows to slaughter since Labor Day 2023, according to CoBank’s analysis of USDA data. That keeps milk flowing but ages the herd.
Running the Numbers: Gross Premium vs. Net Replacement Cost
Here’s the full picture for a typical 200-cow Holstein operation in the Upper Midwest:
The spread:
Beef-cross premium over Holstein bull: ~$750-$1,200/head (2024-2025 market)
Incremental heifer cost increase (2019 vs 2025): ~$1,870/head at national averages
The math: If your replacement ratio means 1.5-2 beef breedings per “lost” heifer, and premiums average $900, you’ve captured $1,350-$1,800 in gross premium. But across the industry, the collective shift toward beef breeding drove replacement heifer costs up $1,870 per head. For a 200-cow operation needing 70-80 replacements annually (35-38% turnover), that gap represents $126,000-$144,000 in additional replacement capital over 24 months—if you can find animals to buy at all.
Metric
Value
Notes
Herd Size
200 cows
Typical Upper Midwest operation
Annual Replacement Rate
35-38%
70-76 replacements needed yearly
Beef-Cross Premium (2024-25)
$750-$1,200/head
Average $900 across regions
Gross Premium Captured
$1,575/replacement
Assumes 1.75 breedings per heifer @ $900
Heifer Cost Increase (2019-2025)
+$1,870/head
From $1,140 to $3,010 national average
Net Gap per Replacement
-$295/head
Premium didn’t cover cost inflation
Total Additional Capital (24 months)
$126,000-$144,000
For 140-152 replacements over 2 years
Critical Time Horizon
2026-2027
When depleted 2022-23 pipeline hits
And here’s the kicker: The $10 billion in new dairy plants are set to come online through 2027, meaning processor demand for milk will keep climbing even as replacement supply stays pinched.
Four Paths Forward—And Where Each Can Backfire
Chris Wolf’s Michigan State analysis of 14,824 farm records found that performance variation among small farms is 38% farm-related compared to only 15% for large farms. Your response to this crisis matters more at 200 cows than at 2,000.
Path 1: Breeding Rebalance
Path 2: Reduce Culling
Path 3: Strategic Exit
Path 4: Processor Lock-In
Best for
Herds that can still course-correct the pipeline
Healthy older cows; buys time
Monthly losses; owners near retirement
Stable herds that can prove supply
Requires
Genomic testing ($15-45/head); sexed dairy on top 35-40%
Transition management; accept lower avg production
Honest market assessment before values erode
Documented 24-month replacement pipeline
⚠️ Backfire risk
Below 18% pregnancy rate, can’t maintain pipeline AND premiums
Failing to deliver on the supply commitment damages the relationship
Key threshold
21-day pregnancy rate ≥20% for optimal beef allocation
Monitor herd age distribution and SCC quarterly
Compare current liquidation value vs. projected 2027 value
Can you document pipeline sustainability?
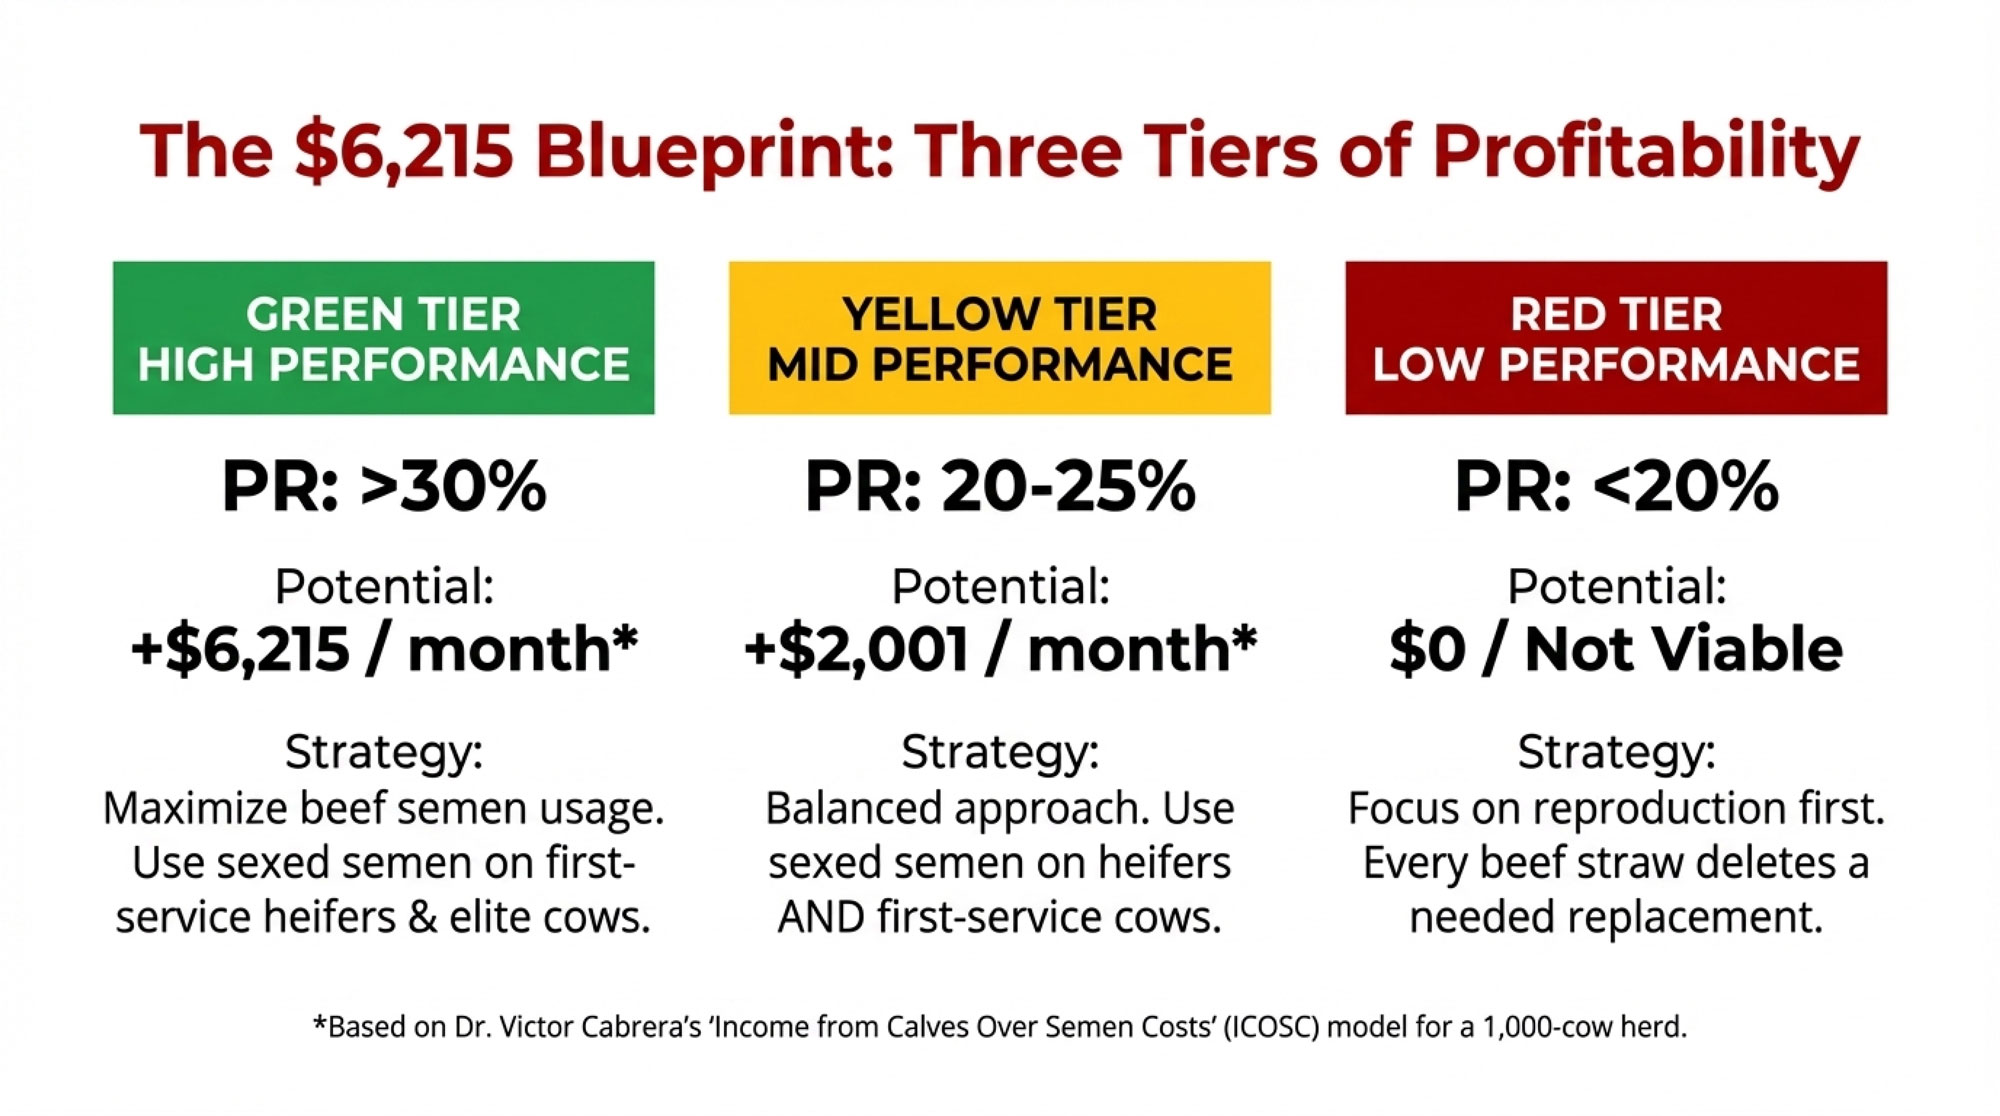
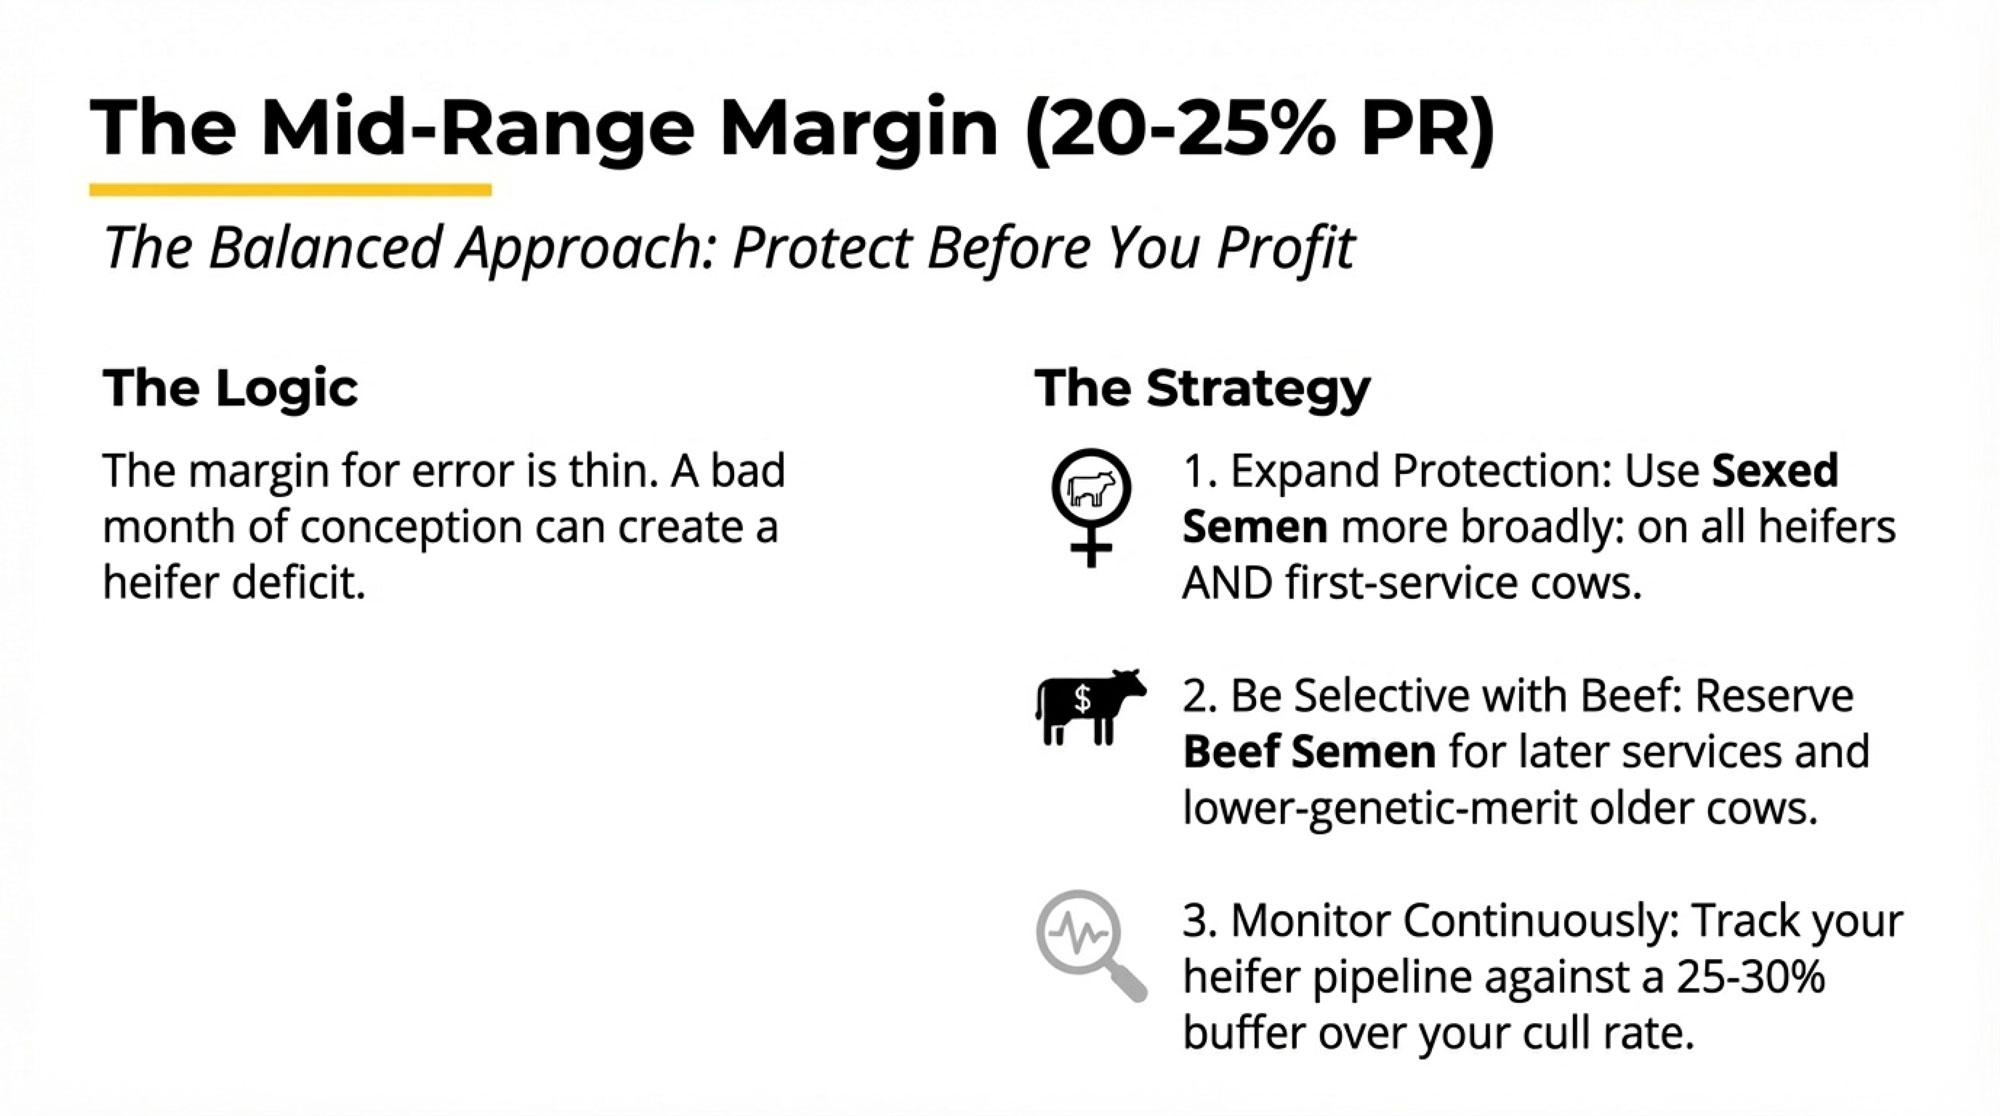
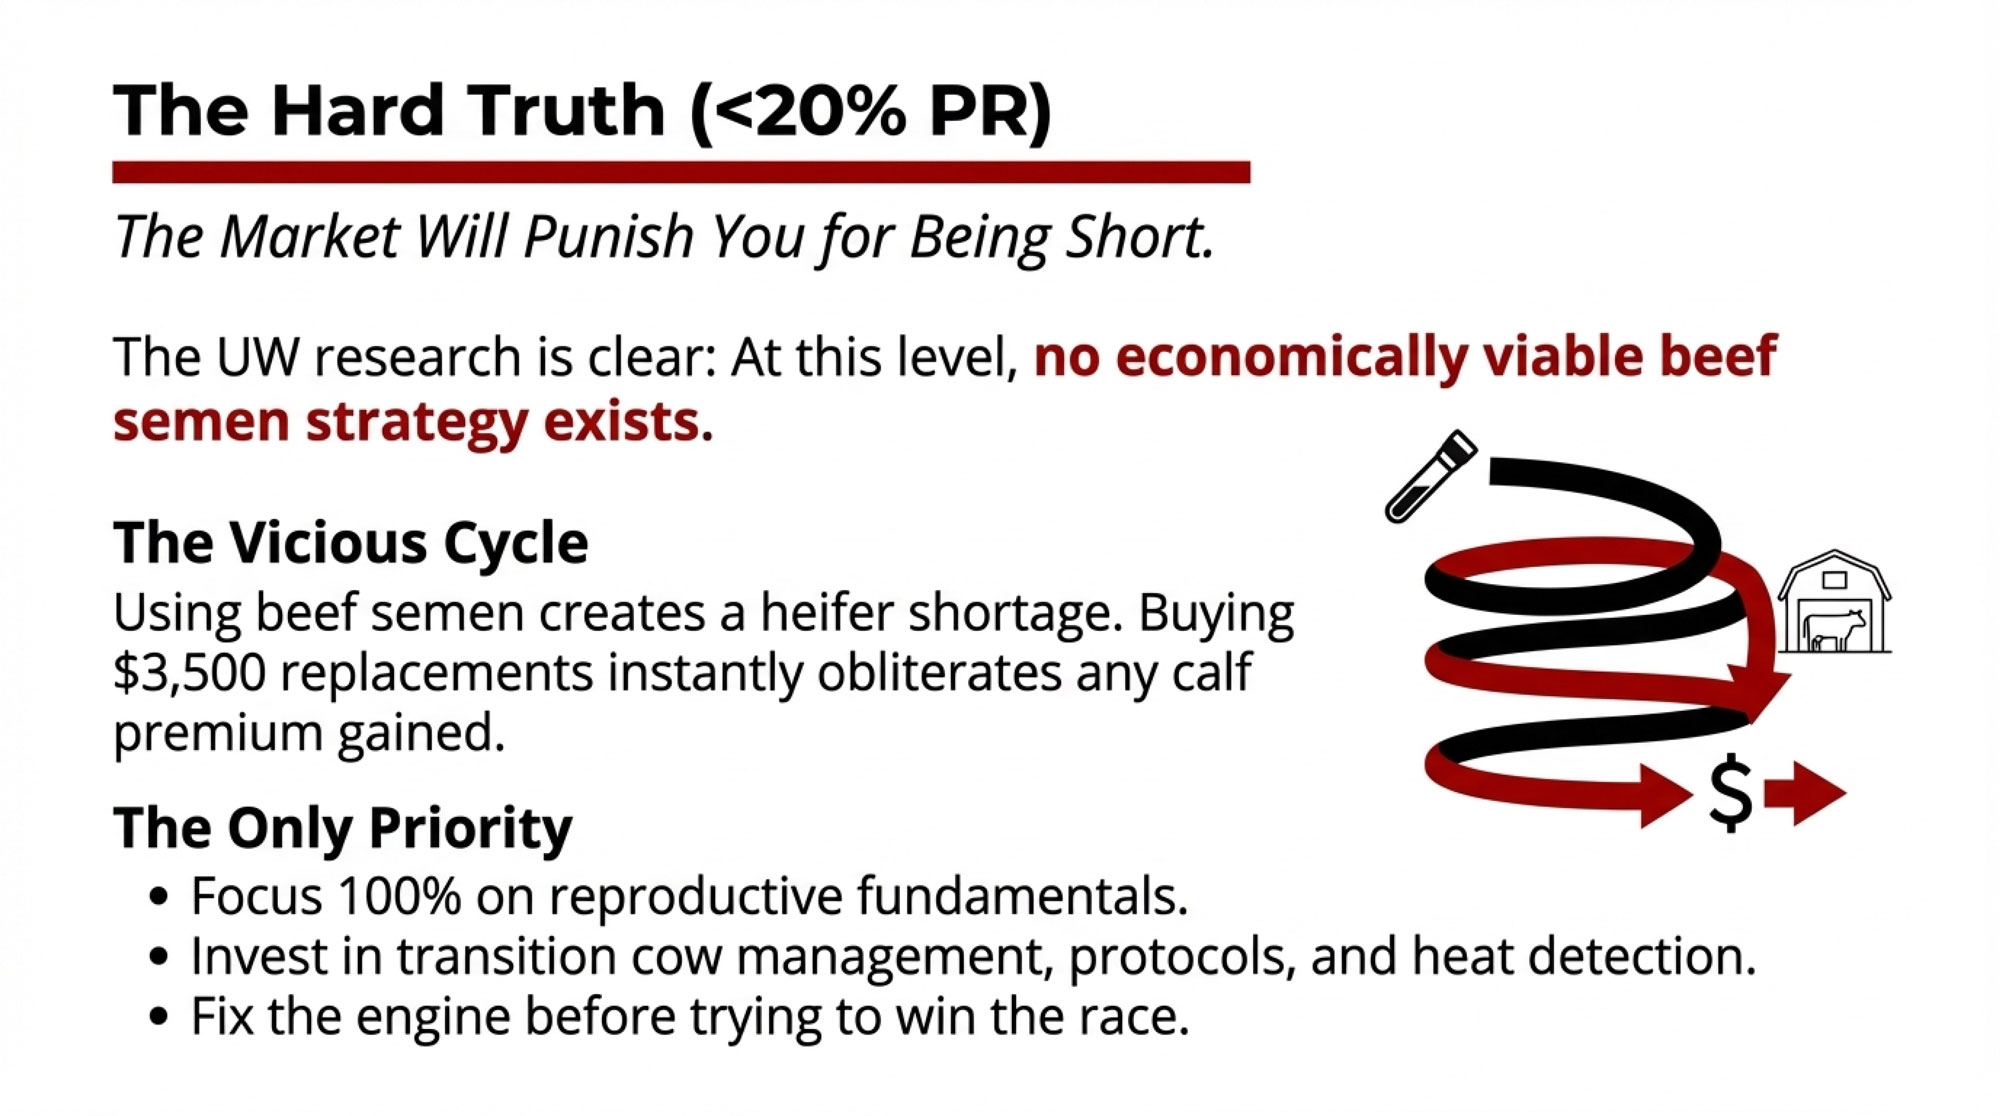
Path 1 is where the Journal of Dairy Science analysis matters most: beef semen becomes economically optimal when crossbred calf price hits at least 2x dairy calf price, AND herd achieves ~20% 21-day pregnancy rate. ⚠️ Below 18%, limit beef allocation to 50% maximum. Only about 10% of Florida producers use genomic testing, per University of Florida estimates—adoption rates vary significantly by region.
Path 2 carries a hidden cost. Retaining older cows often means rising somatic cell counts, which can erode quality premiums from your processor—compounding financial strain at exactly the wrong time. Worse, when a wave of retained cows exits simultaneously, you’ve traded a gradual shortage for a cliff.
Path 3 isn’t a failure. With beef cattle prices at record highs, liquidating today captures significantly more equity than waiting until the shortage resolves. ⚠️ Waiting preserves optionality but erodes equity if exit becomes forced rather than chosen.
Path 4 is the angle most producers haven’t considered. Strong signals suggest processors expecting 2-3% milk supply growth and getting 0.4% are becoming choosy about who they keep. If you can document pipeline sustainability, you may find yourself first in line for favorable contract terms as competitors struggle to guarantee supply.
Signals to Watch
Heifer inventory trajectory. CoBank projects inventories won’t normalize until 2027 at the earliest. Watch USDA semi-annual reports for evidence that national heifer numbers have stopped declining.
Regional price spreads. The gap between Wisconsin’s $2,850 and Northwest prices “north of $4,000” reflects infrastructure differences, not just supply. Where does your region sit?
Your own replacement math. How many dairy heifer pregnancies must you generate annually to maintain herd size at the target age structure? If you don’t know that number, you can’t evaluate your breeding allocation.
What This Means for Your Operation
Calculate the real cost, not the gross premium. The $900 beef-cross check was real income—but if replacement costs have jumped $1,500+ per head since 2022, determine whether premiums actually offset that increase or simply deferred it
Run your replacement pipeline projection: at current breeding allocation and reproductive performance, will you have the heifers you need in 2028?
If “hard to breed” or “lower producing” remain your primary beef allocation criteria, the room for instinct-based allocation has narrowed sharply
Check your culling rate—if you’ve dropped below 30%, you’re likely masking a shortage rather than solving it—and check your SCC trends while you’re at it
Ask your processor what they value. If you can demonstrate a documented 24-month replacement pipeline, you may be in a stronger negotiating position than you realize
Opportunity signal: Balanced breeding programs with adequate heifer inventory could mean more favorable processor contracts as competitors struggle to guarantee supply
Key Takeaways
The 800,000-head shortage is locked in through 2026. Breeding decisions made today won’t produce milking cows until 2028-2029. The next 18 months are about managing what’s already baked in.
Don’t confuse gross premium with replacement reality. Across the industry, the collective shift drove replacement costs up $1,870 per head. For operations now buying replacements, the premium captured doesn’t come close to covering the increase in costs.
The 18% pregnancy rate threshold matters. Below that level, aggressive beef allocation creates unavoidable replacement shortfalls regardless of premium levels.
$10 billion in new dairy plants through 2027 means processor demand for milk keeps climbing while replacement supply stays pinched. Processors are likely choosing partners rather than just buying milk.
The Bottom Line
The operations that survive this won’t be those who avoided beef-on-dairy—many of the largest, most sophisticated dairies bred heavily to beef. They’ll be the ones who tracked replacement pipeline math while capturing premiums, rather than assuming the check today wouldn’t create a bill tomorrow.
Where does your operation sit on that spectrum—and what does your 2026 breeding sheet say about the answer?
Complete references and supporting documentation are available upon request by contacting the editorial team at editor@thebullvine.com.
High-Value Crosses: The Next Phase of the Beef-on-Dairy Revolution – Breaks down advanced terminal crossbreeding strategies that maximize carcass value without sacrificing your herd’s future. It delivers the blueprints for “Elite Beef” programs that command significantly higher premiums than standard auction barn crosses.
Join the Revolution!
Join over 30,000 successful dairy professionals who rely on Bullvine Weekly for their competitive edge. Delivered directly to your inbox each week, our exclusive industry insights help you make smarter decisions while saving precious hours every week. Never miss critical updates on milk production trends, breakthrough technologies, and profit-boosting strategies that top producers are already implementing. Subscribe now to transform your dairy operation’s efficiency and profitability—your future success is just one click away.
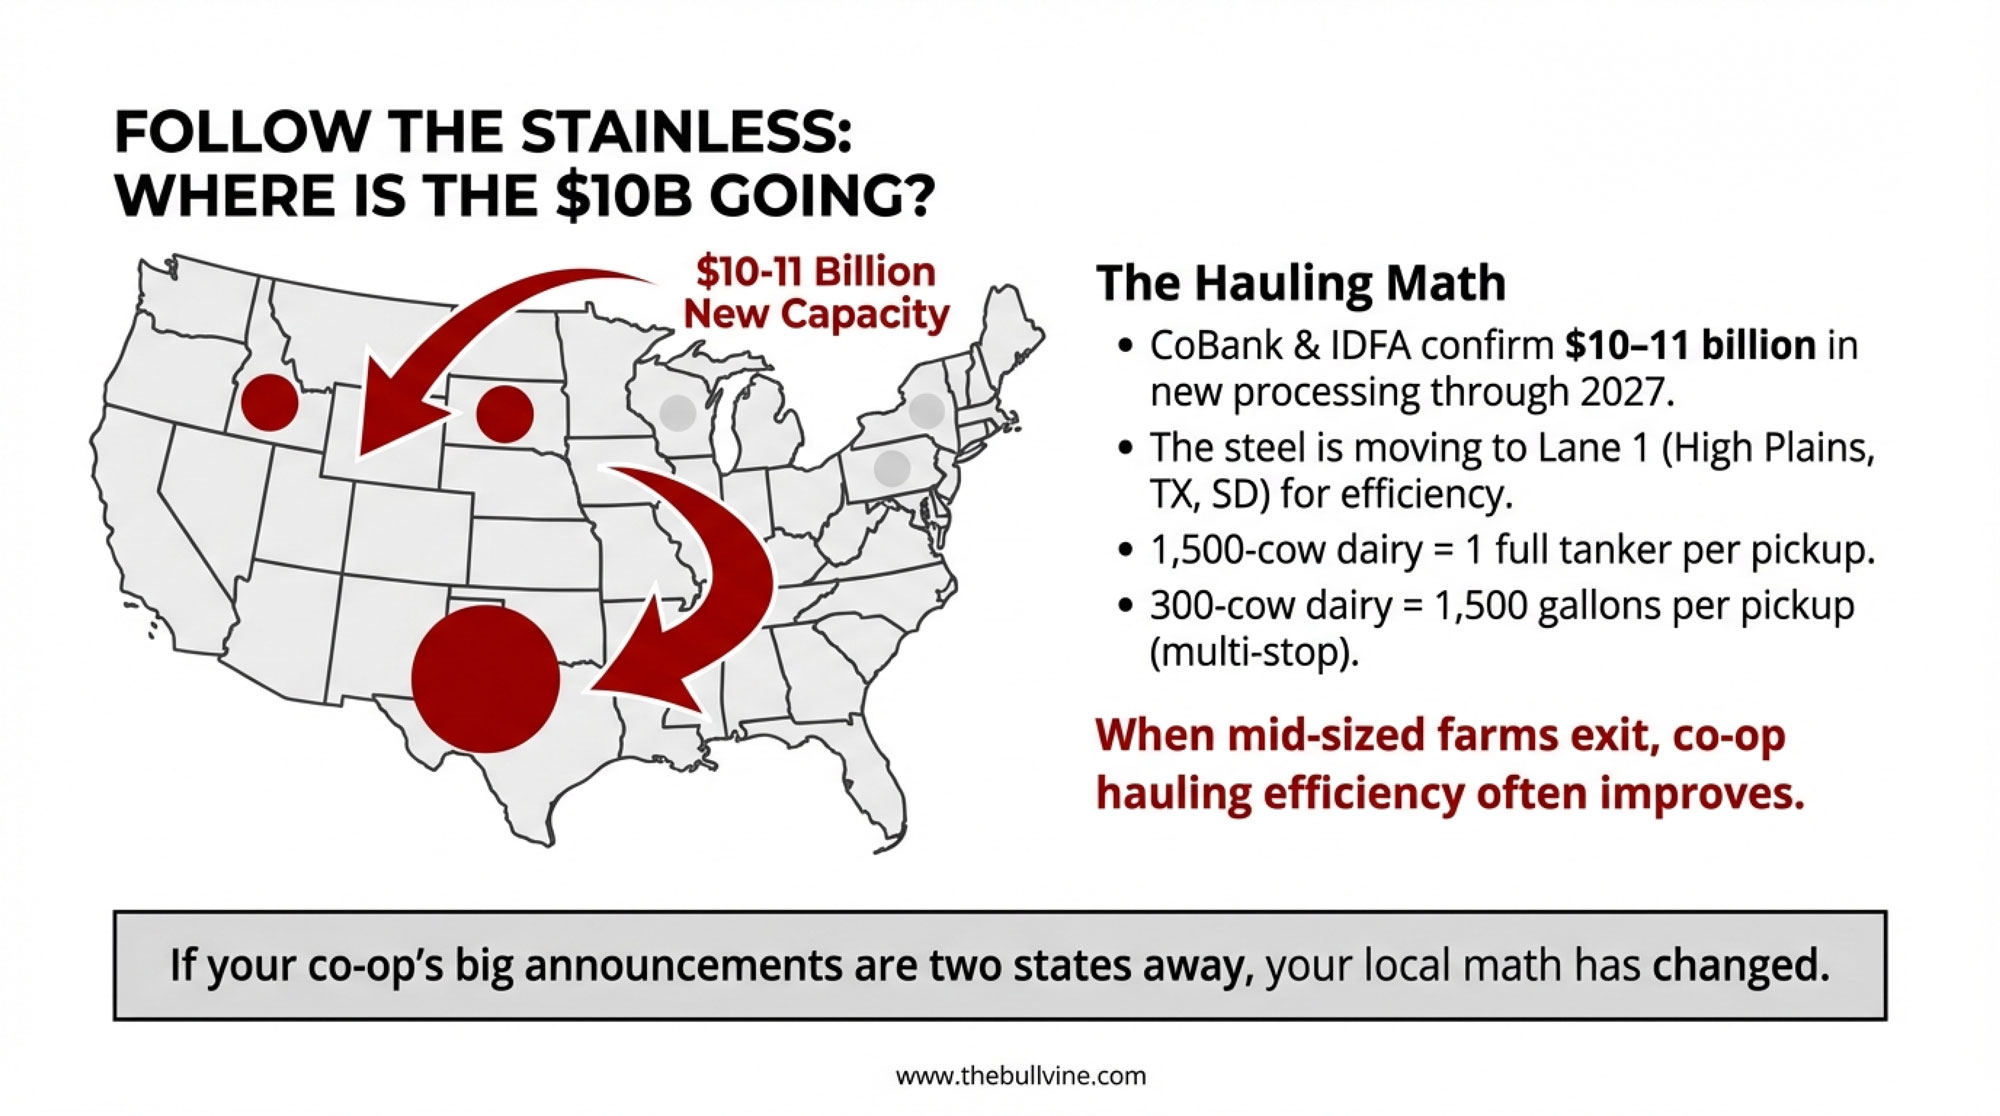
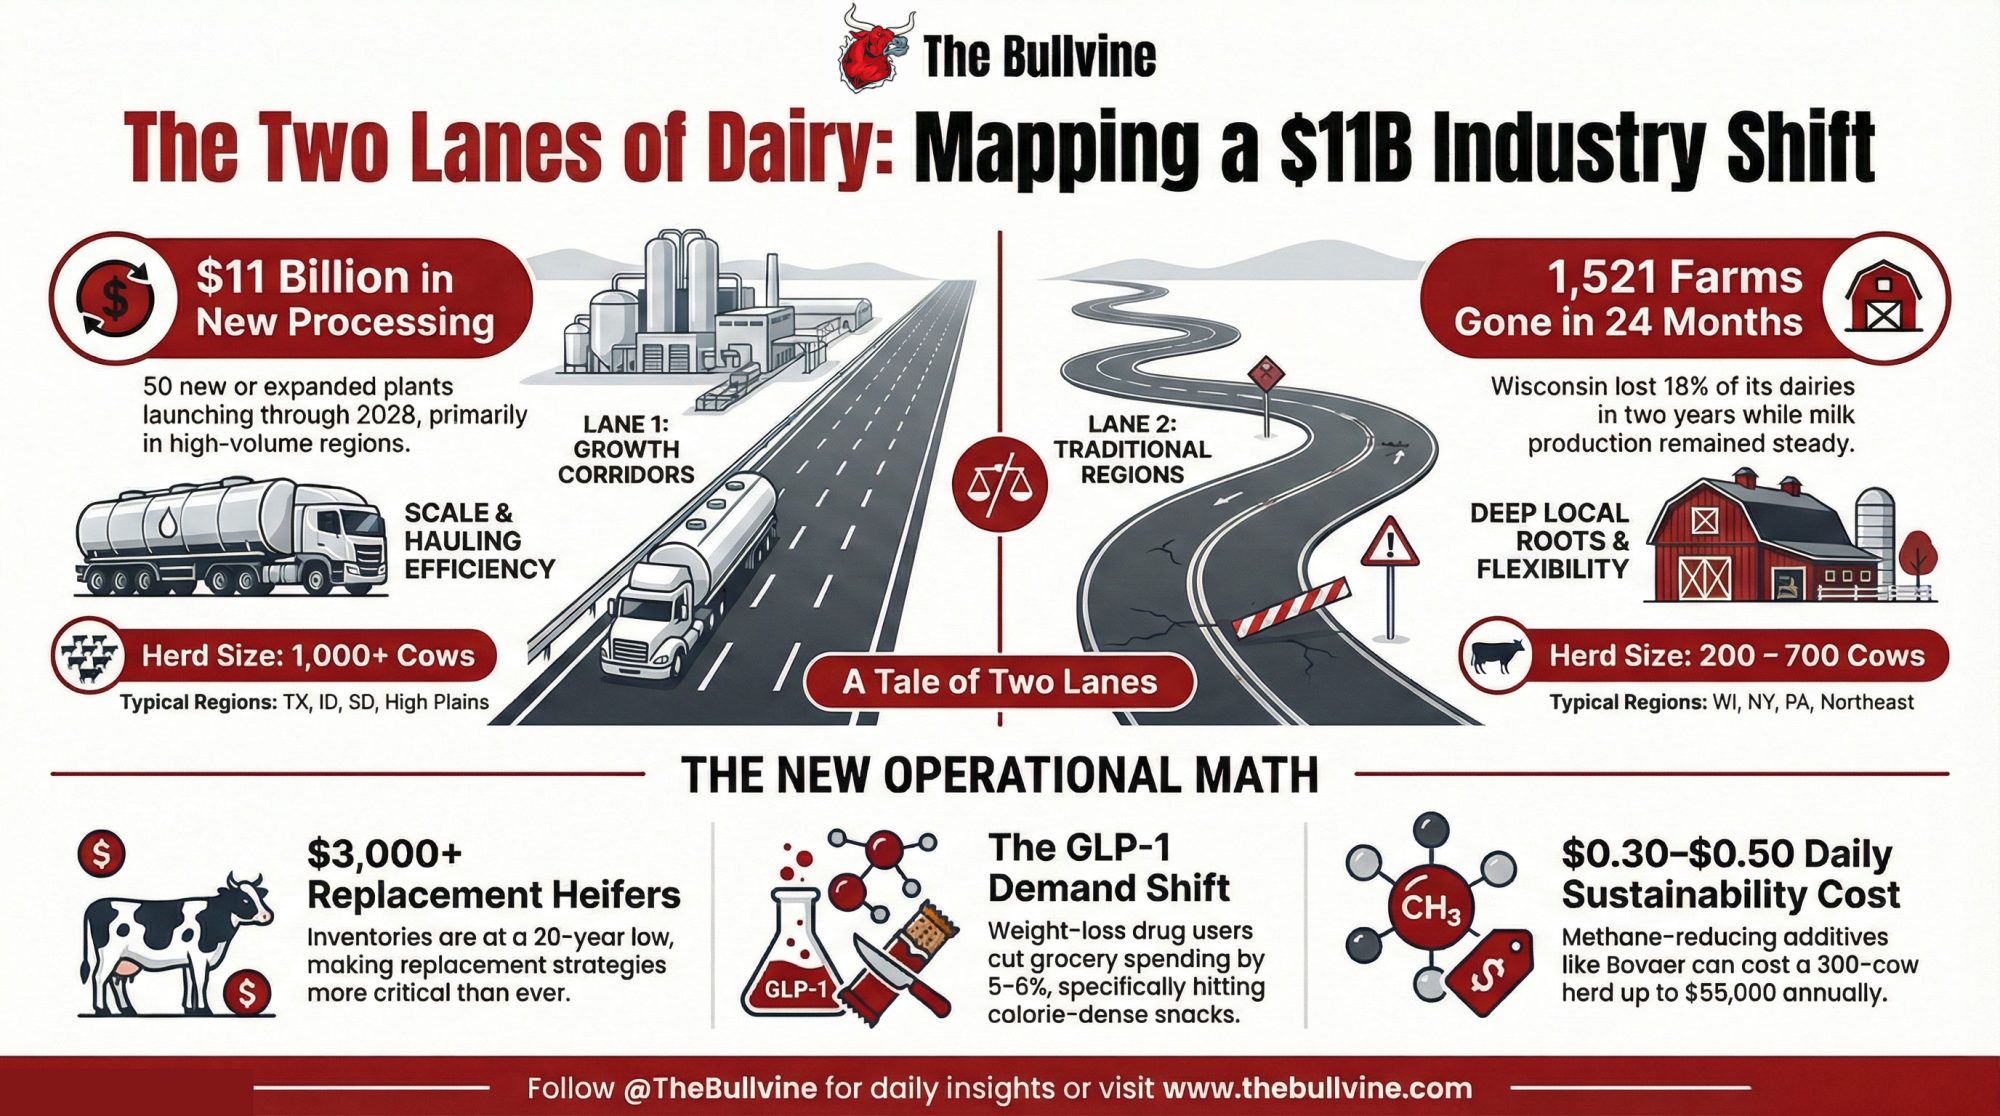
Dairy just sorted itself into two lanes. $10B in new plants is flowing to one. The other lost 1,521 farms while milk output held steady. Where does a 300-cow herd fit? Let’s map it.
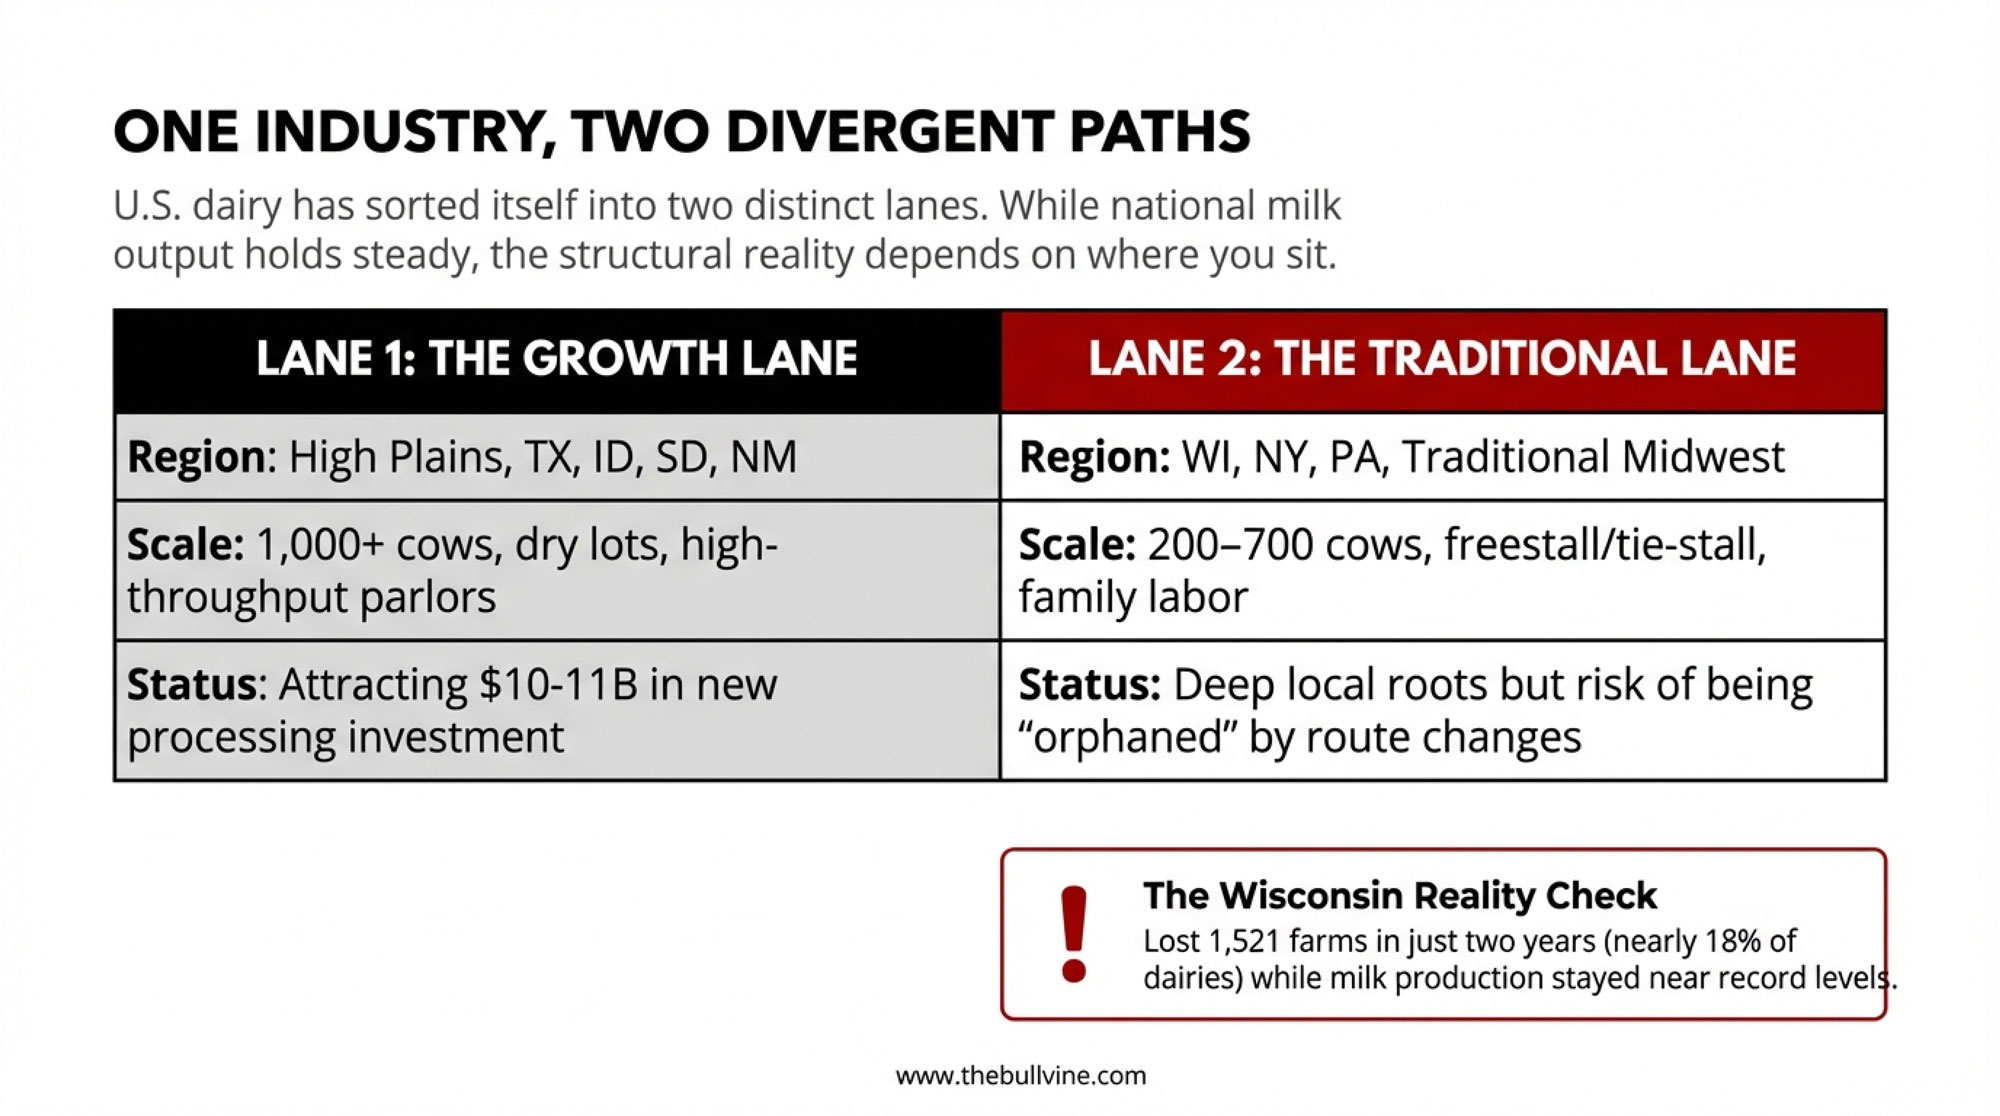
EXECUTIVE SUMMARY: U.S. dairy has sorted into two lanes—and most 300-cow herds didn’t pick theirs. Lane 1 (large operations in Texas, Idaho, the High Plains) is pulling $10-11 billion in new processing investment, per CoBank and IDFA data. Lane 2 (mid-sized family dairies in Wisconsin, New York, the traditional Midwest) watched 1,521 farms disappear in two years while milk output held steady. The pressure is structural, not cyclical: heifer inventories at a 20-year low, bred replacements topping $3,000, GLP-1 drugs shifting grocery spending, and sustainability mandates like Bovaer adding $0.30-0.50/cow/day. Here’s the playbook—stress-test your margins against hard scenarios, map your processing exposure, calibrate beef-on-dairy carefully, vet sustainability contracts like any major deal, and have the family conversation about whether staying, growing, or a well-timed exit is your version of winning. The math is uncomfortable. But it’s yours to run.
If you sit around enough kitchen tables in Wisconsin, New York, Pennsylvania, or Minnesota, you start to hear a very different conversation than the one you get on the conference stage.
On stage, the slides say U.S. dairy is strong, national milk volumes are holding, and there’s a massive wave of new stainless going into places like South Dakota and the Texas Panhandle. And you know what? Those slides aren’t wrong.
CoBank’s dairy economists peg new U.S. dairy processing investment at about $10 billion expected to come online through 2027, much of it in large cheese, powder, and beverage plants anchored in high‑volume regions. The International Dairy Foods Association announced in October 2025 that processors are investing more than $11 billion in 50 new or expanded plants across 19 states between 2025 and early 2028.
Region
2025 ($B)
2026 ($B)
2027 ($B)
Total ($B)
Texas Panhandle / High Plains
3.5
4.2
2.8
10.5
Idaho / Western Growth
1.2
1.5
0.9
3.6
Wisconsin / Northeast / Traditional
0.3
0.5
0.4
1.2
But over coffee, the conversation sounds more like this:
“Given everything that’s changed—markets, plants, even what people eat now—does it really make sense for us to keep milking 250 or 400 cows? Or are we better off stepping out while we still have something solid to pass on?”
You can’t answer that honestly without stepping back and looking at how the whole system has shifted. So let’s walk through the big pieces together, then bring it right back to a farm that probably looks a lot like yours.
Five Big Forces Hitting Mid‑Sized Dairies Right Now
Year
Farms
Milk Production (B lbs/yr)
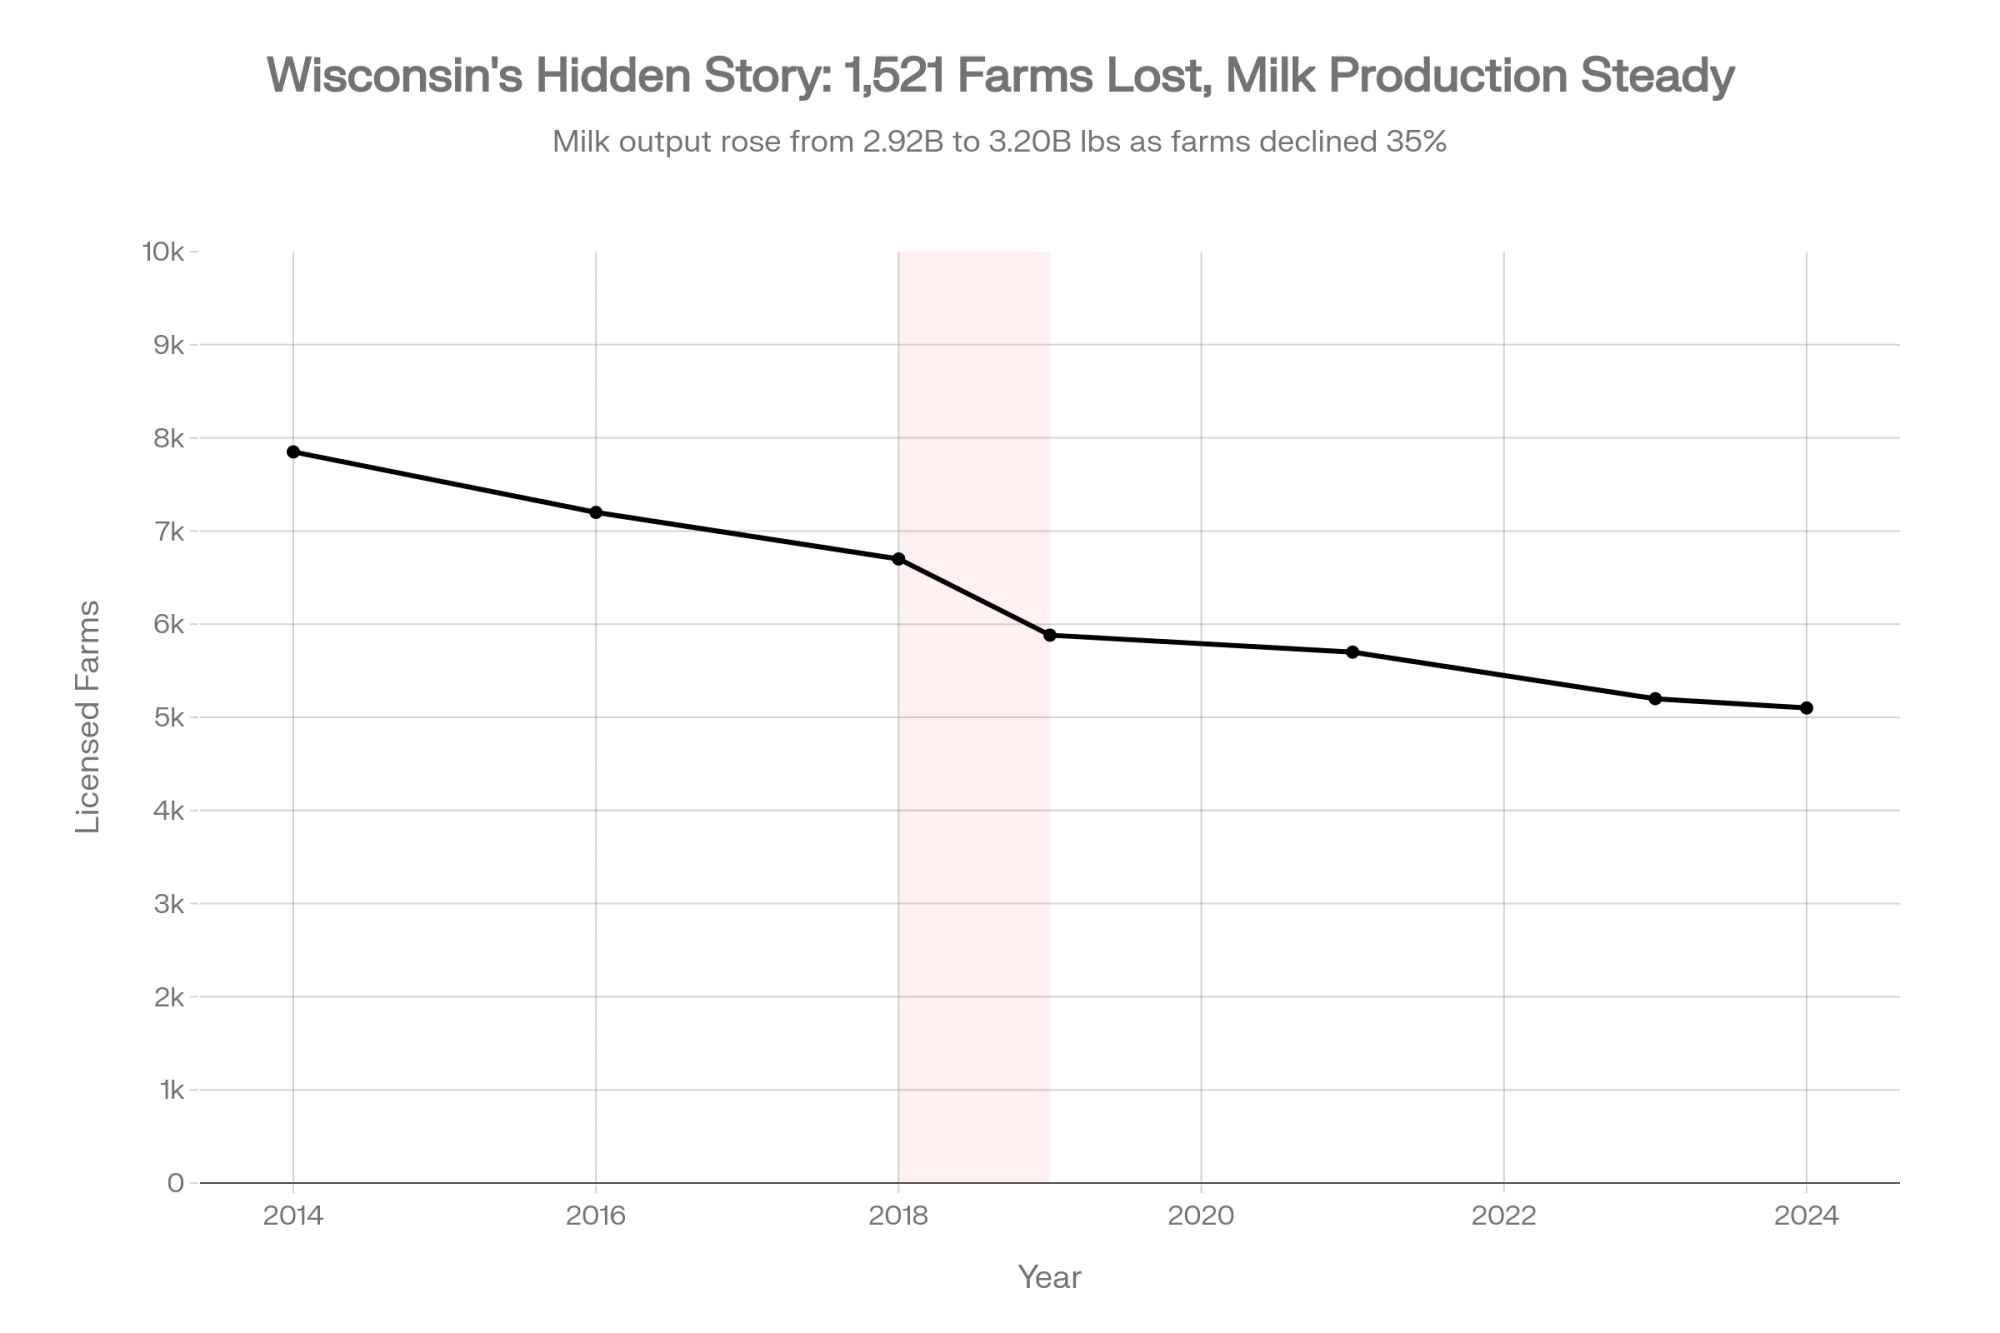
2014
7,850
2.92
2016
7,200
3.04
2018
6,700
3.11
2019
5,882
3.15
2021
5,700
3.18
2023
5,200
3.22
2024
5,100
3.20
Here’s the quick snapshot before we dig in:
Processing geography is shifting. That $10–11 billion in new capacity? It’s heavily concentrated in growth regions—the High Plains, Texas Panhandle, parts of the West and Upper Midwest—where large herds and cheap land can feed big plants efficiently.
Farm numbers are dropping fast, even when milk holds. In Wisconsin alone 818 licensed dairy farms disappeared in 2019—over 10% of the state’s dairies in a single year. Farm Progress adds that 703 farms shut down in 2018, bringing the two‑year total to 1,521 farms gone—nearly 18% of Wisconsin’s dairies—while milk production stayed near record levels.
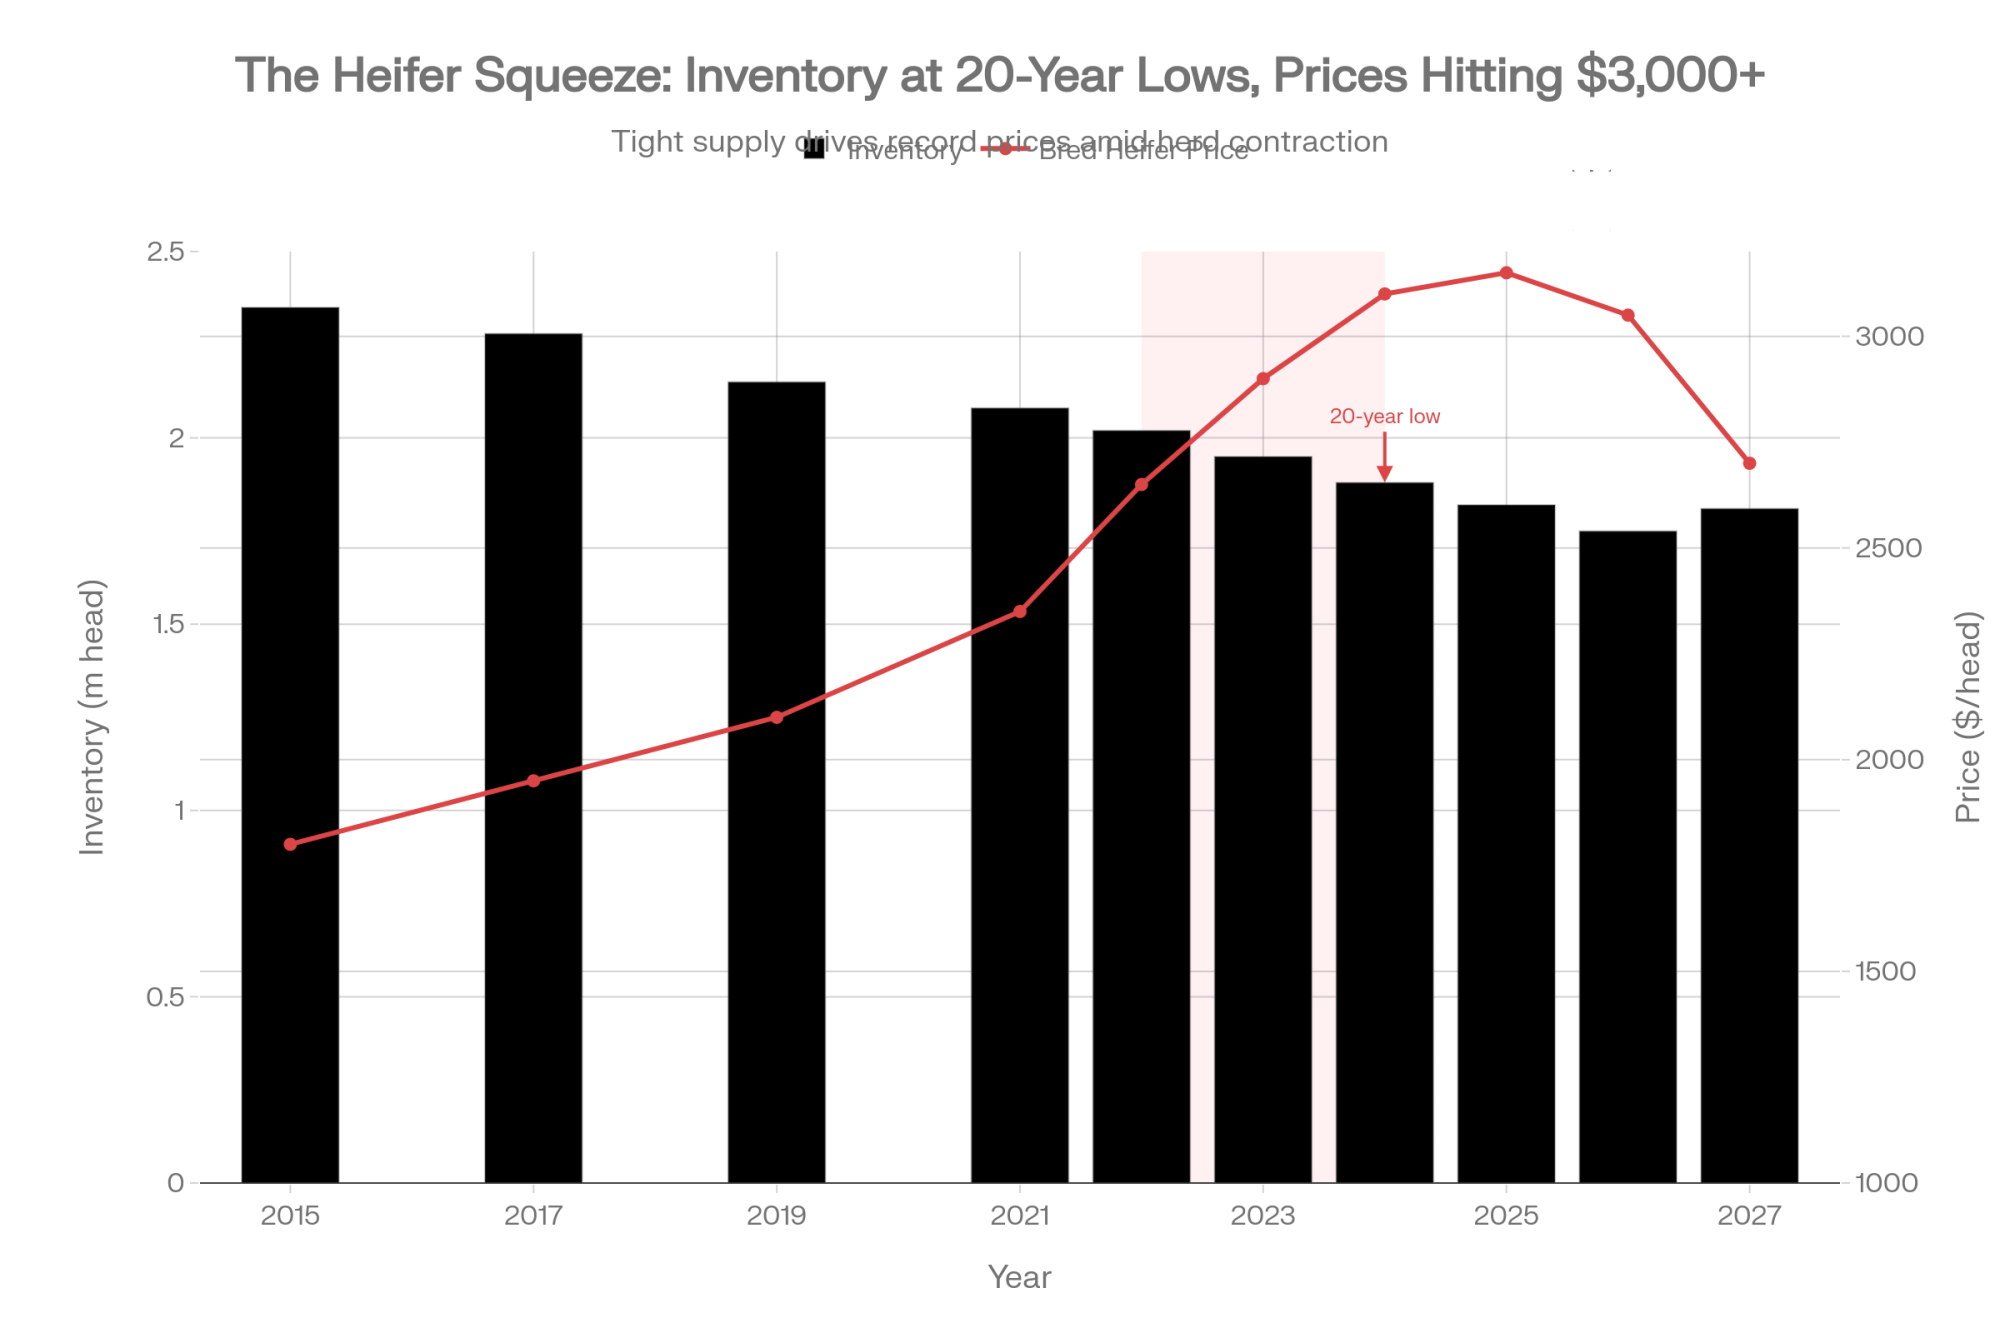
Replacement heifers are tight and expensive. U.S. replacement heifer inventories have fallen to about a 20‑year low. CoBank’s modeling projects an additional 800,000‑head decline over the next two years before a rebound in 2027. And bred heifer prices? They’ve climbed well above $3,000 per head in many markets.
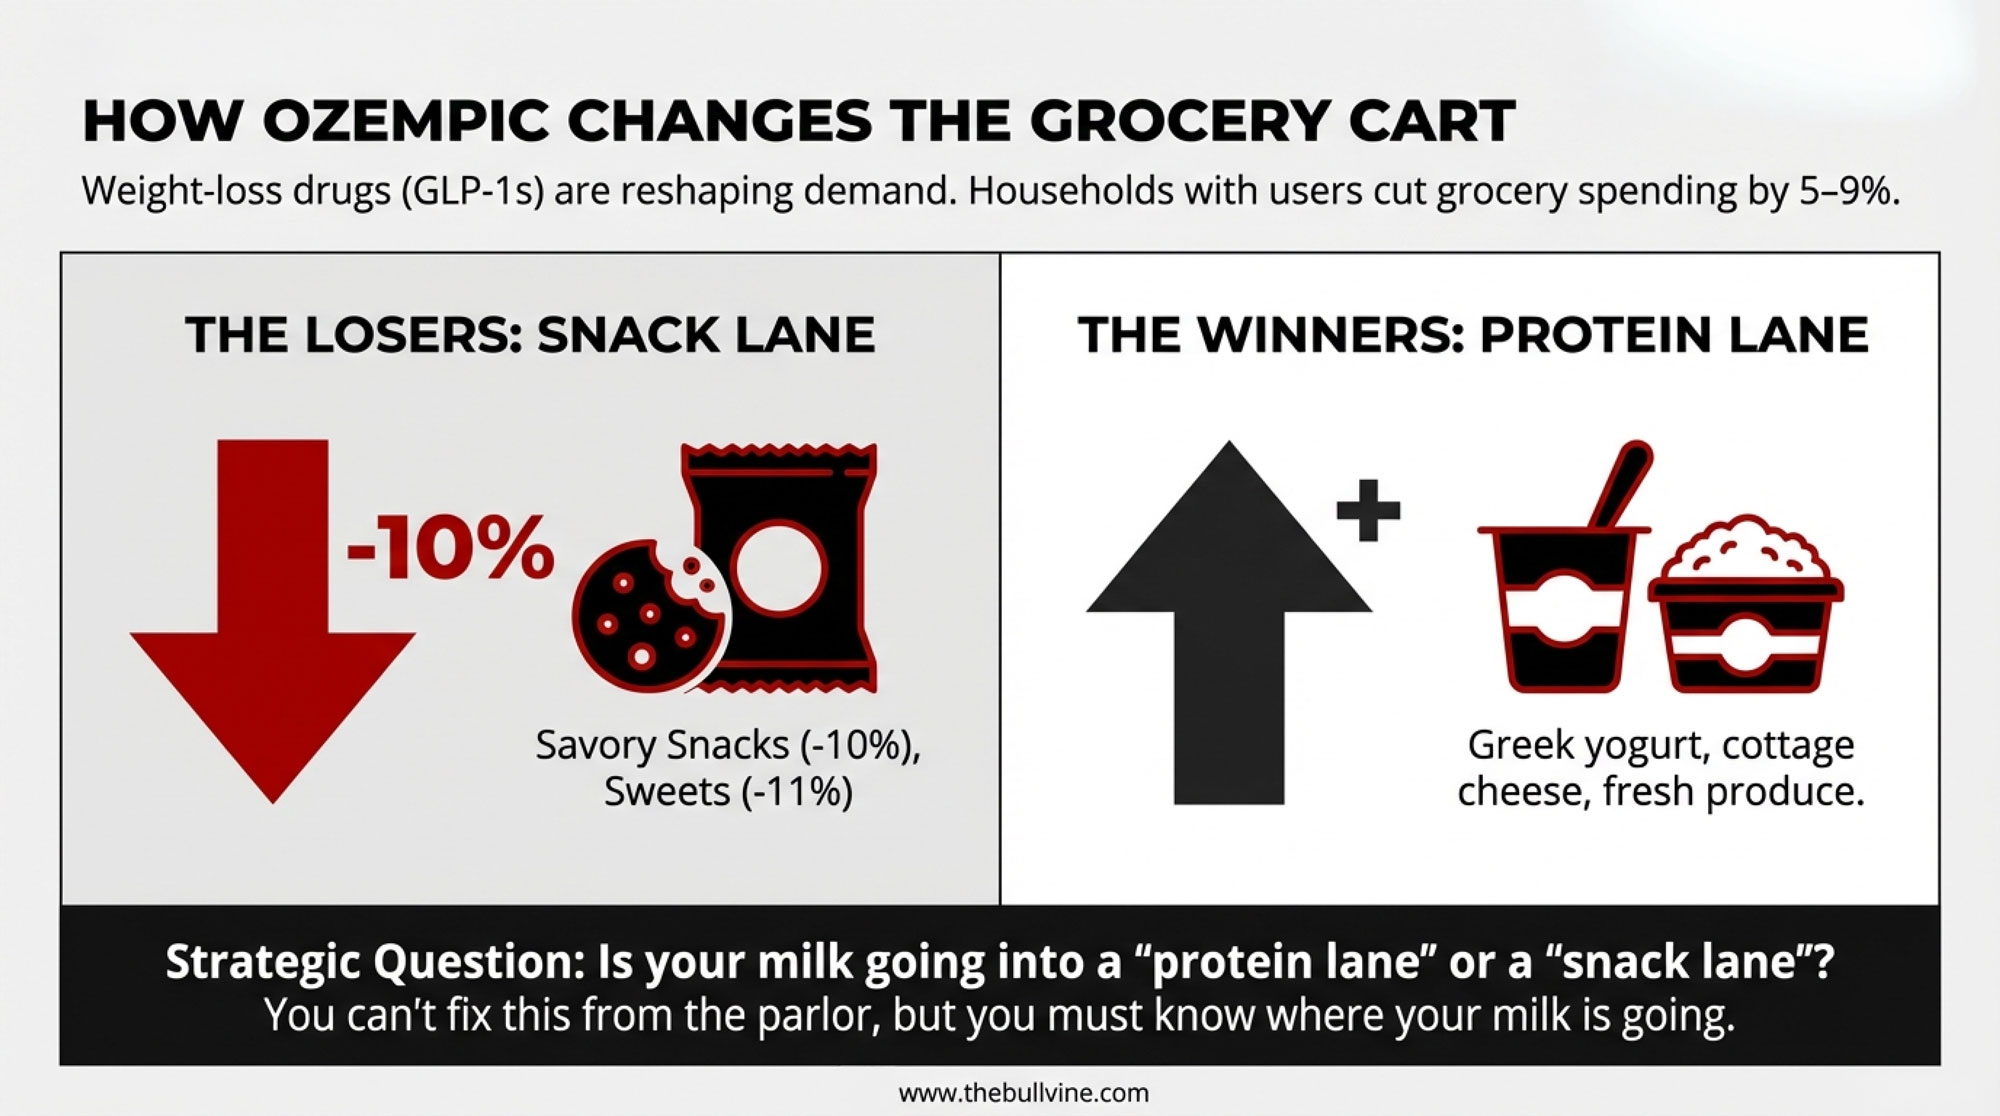
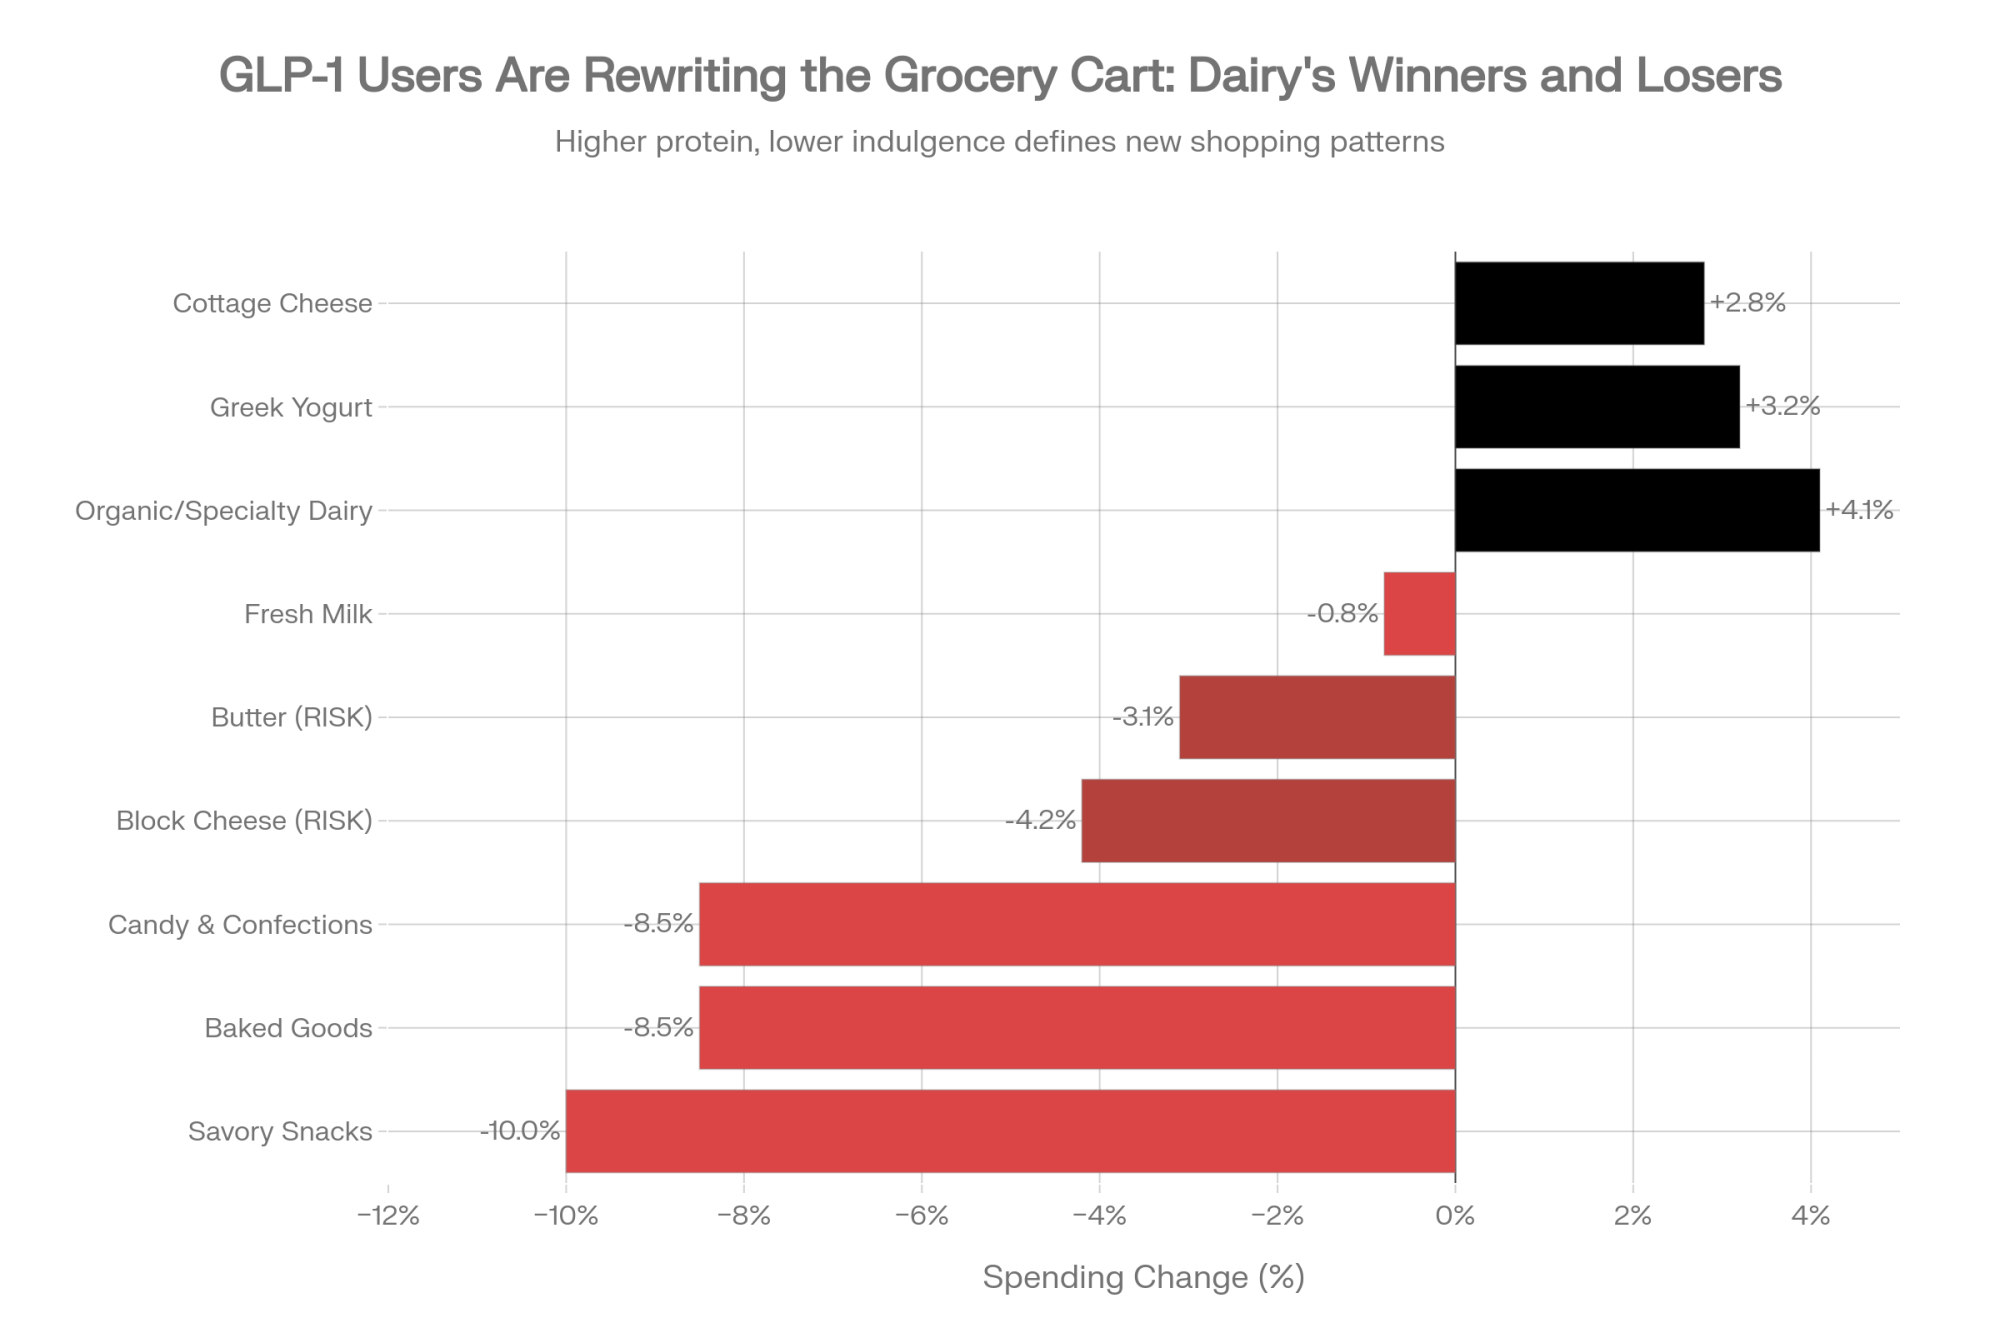
GLP‑1 weight‑loss drugs are changing grocery carts. A Cornell University–Numerator study found that households with a GLP‑1 user cut grocery spending by about 5–6% within six months, with higher‑income households cutting nearly 9%. The biggest reductions hit calorie‑dense, processed items—spending on savory snacks, baked goods, and cookies dropped between 6.7% and 11.1%.
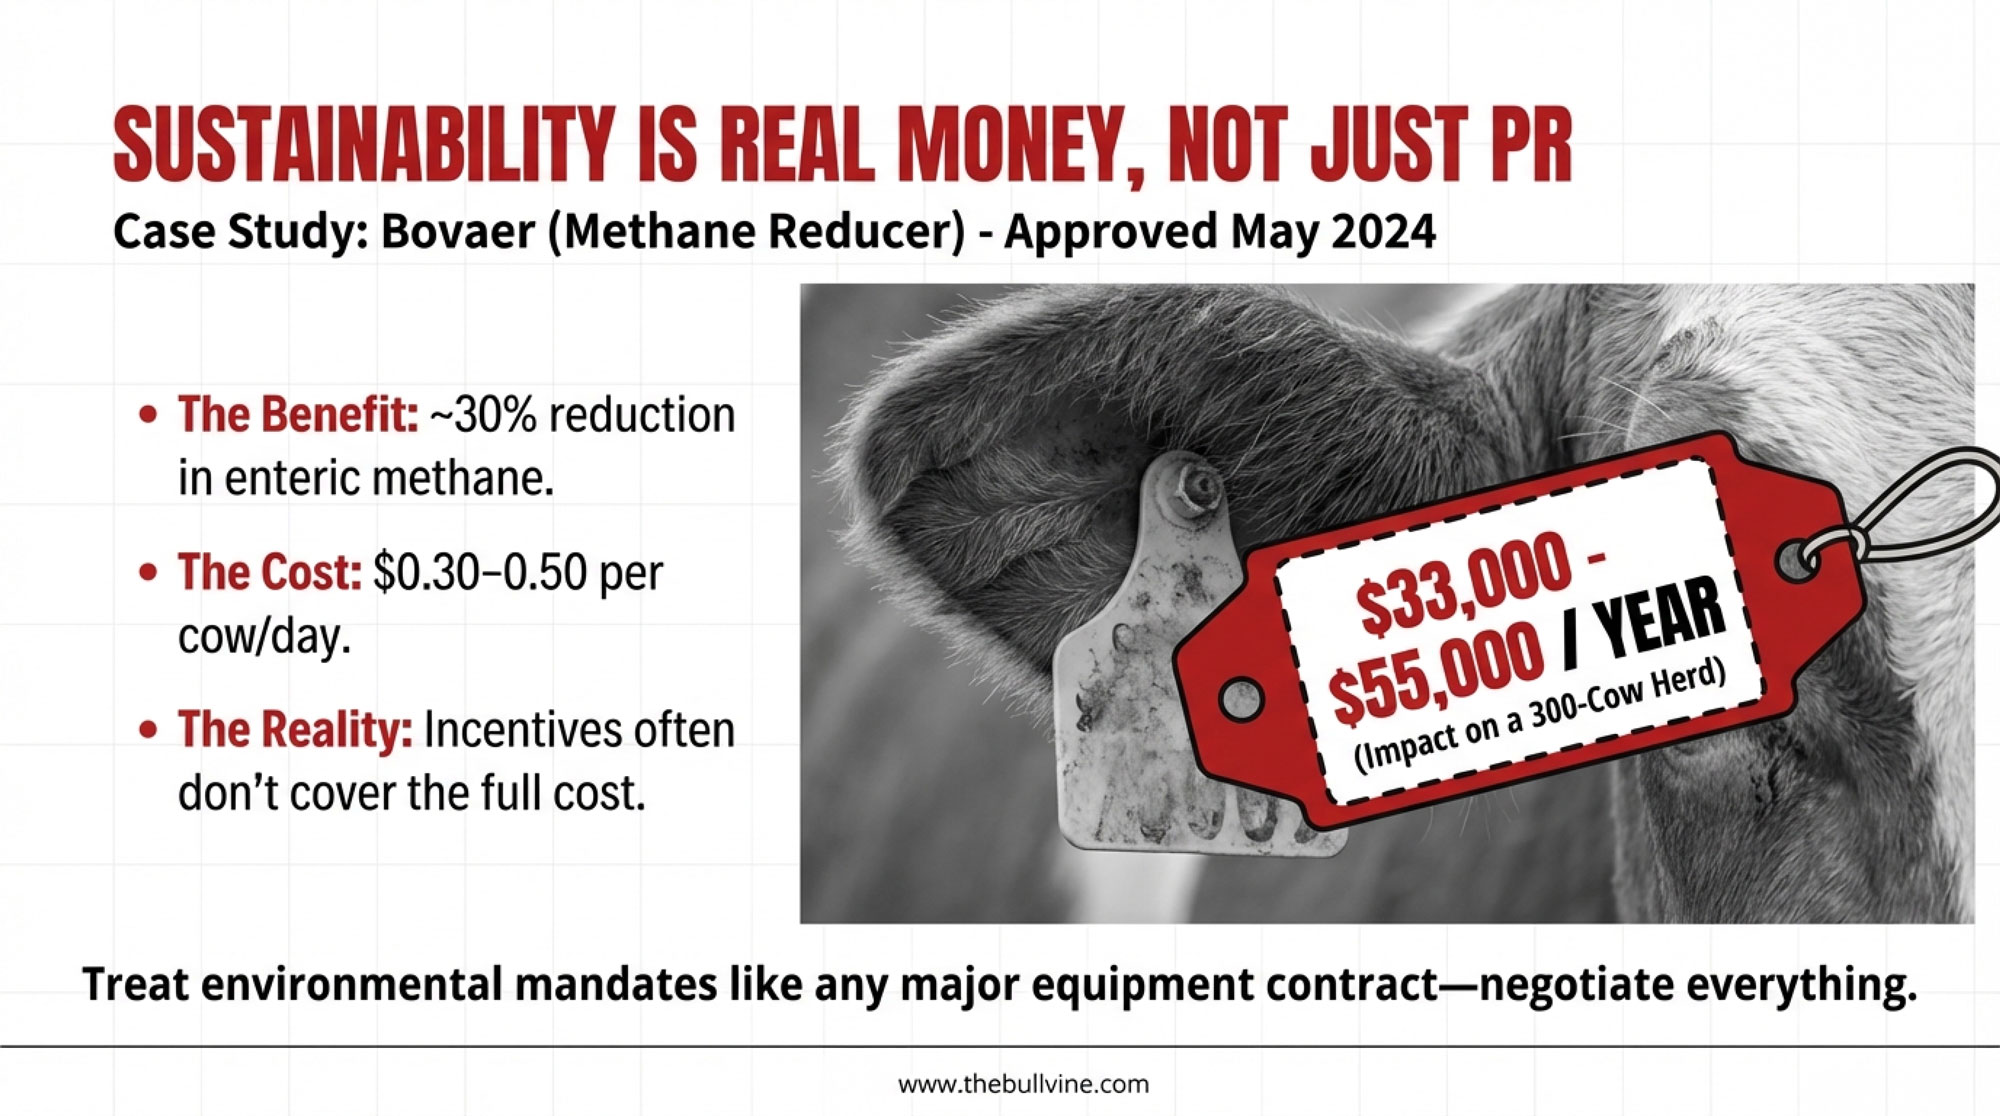
Sustainability is real money now. The FDA approved Elanco’s methane‑reducing feed additive Bovaer for U.S. dairy cattle in May 2024. Studies show it can cut enteric methane emissions by about 30%—roughly 1.2 metric tons of CO₂‑equivalent per cow per year. But it’s not free. Independent technical reviews and industry coverage suggest early commercial costs tend to fall in the $0.30–0.50 per cow per day range, depending on region and feeding system.
Those are the big gears turning while you’re focused on butterfat levels, fresh cow management through the transition period, and whether that next heifer pen will be full.
Two Lanes, One Industry: Where Does Your Herd Really Fit?
You’ve probably noticed this yourself: U.S. dairy has quietly split into two main “lanes,” even though nobody formally labeled them that way.
Lane
Typical Regions
Herd Size
Housing & Systems
Key Upside
Key Risk
Lane 1
Texas Panhandle, eastern New Mexico, Idaho’s Magic Valley, eastern South Dakota
1,000+ cows
Dry lot systems, high‑throughput parlors
Scale, hauling efficiency, tight and fit with the new capacity
Dependence on large‑plant contracts
Lane 2
Wisconsin, New York, Pennsylvania, Vermont, broader Northeast/Upper Midwest
200–700 cows
Freestall or tie‑stall, family plus small hired teams
Deep local roots, flexible management
Risk of being “orphaned” by route changes
Lane 1: Big herds in growth corridors
In one lane, you’ve got the big outfits—often 1,000 cows and up—in places like the Texas Panhandle, eastern New Mexico, Idaho’s Magic Valley, and eastern South Dakota. They run dry lot systems or hybrid housing, big parlors, and high daily ship volumes.
CoBank and IDFA data show that much of that $10–11 billion in new processing capacity is landing in exactly these regions. From the processor’s point of view, that makes sense. Fewer farms, bigger loads, more predictable butterfat and protein flows for specific product specs and export programs.
Lane 2: Mid‑sized family barns in traditional regions
In the other lane are the herds many of us grew up around: 200–700 cows, freestall or tie‑stall barns, double‑8 or double‑12 parlors, family labour plus a handful of employees.
Take Wisconsin as the clearest example. Using National Ag Statistics Service data, reported that the state lost 818 licensed dairy farms in 2019—over 10% in a single year. The decline was the largest in state history.
In addition, 703 farms shut down in 2018, bringing the two‑year total to 1,521 farms—nearly 18% of Wisconsin’s dairies—while milk production stayed near record levels as larger herds added cows and pushed components.
So at the state level, the narrative is “Wisconsin dairy is holding its own.” At the township level, it’s more like, “We’ve lost a third of the trucks that used to go past this mailbox.”
If you’re milking 300 cows in Marathon County or 450 in northern New York, you’re in that second lane whether you chose it or not. And the system treats you differently than it treats a 3,000‑cow dry lot in the Panhandle.
What Co‑ops and Plants Are Really Optimizing For
You probably already sense this from watching milk routes in your area, but it’s worth laying out the math plainly.
When Associated Milk Producers Inc. announced in late 2019 that it would discontinue production at its Arlington, Iowa, nonfat dry milk plant and its Rochester, Minnesota, cheese plant, AMPI pointed straight at lower regional milk production and the long‑term loss of dairy farms as key reasons.
Their statement noted that Minnesota had lost 40% of its dairy farms since 2008, and Iowa has lost 50% during that same period.
Here’s the part that stings but tracks with every hauling study:
A 300‑cow freestall might add 1,500–2,000 gallons per pickup.
A 1,500‑cow dairy can fill a tanker—or more—from one driveway.
When several mid‑sized farms exit, and their volume consolidates onto larger herds, a co‑op’s per‑unit hauling cost and plant efficiency can actually improve, even as rural communities feel hollowed out.
Here’s the blunt reality: if your co‑op’s last three big announcements were about plants two states away, they’re telling you something about where they see their future milk coming from. It’s frustrating, but it’s not random.
GLP‑1 Weight‑Loss Drugs: The New Demand Wildcard
Now let’s step off the farm for a minute. GLP‑1 medications—Ozempic, Wegovy, Mounjaro, and similar—started as diabetes drugs, but their use for weight loss has exploded.
Industry tracking suggests approximately 15 million U.S. adults were using GLP‑1 medications by 2023, and clinical reviews show these drugs can cut daily calorie intake by around 20%.
Cornell University and Numerator linked shoppers’ survey‑reported GLP‑1 use to their actual grocery purchases. The study found that households with a GLP‑1 user cut grocery spending by about 5–6% within 6 months of starting the medication, roughly $ 400 per year on average, and by 9% for higher‑income households.
The biggest cuts landed on calorie‑dense, processed categories. Spending on savory snacks fell by about 10%, while categories like baked goods and cookies saw reductions of 6.7% to 11.1%.
Category
Average Household Spending Change
% Change
Milk Relevance
Savory Snacks (chips, crackers, popcorn)
−$24 to −$32
−10.0%
High—processed milk/whey used
Baked Goods (cookies, cakes, pastries)
−$18 to −$26
−6.7% to −11.1%
High—butter, milk powder, butterfat
Candy & Confections
−$12 to −$18
−8.5%
Moderate—dairy ingredients
Block Cheese (cheddar, American, processed)
−$8 to −$14
−4.2%
HIGH RISK—commodity pressure
Butter (salted, unsalted)
−$6 to −$10
−3.1%
HIGH RISK—indulgence category
Greek Yogurt (high-protein)
+$4 to +$8
+3.2%
WINNER—protein focus aligns
Cottage Cheese (high-protein)
+$3 to +$5
+2.8%
WINNER—protein focus aligns
Fresh Milk (milk, cream, fresh dairy)
−$2 to +$1
−0.8% to +0.5%
Neutral to slight decline
Organic/Specialty Dairy
+$6 to +$10
+4.1%
WINNER—premium positioning
Meanwhile, yogurt and fresh produce saw modest increases.
What does this mean for your milk? If most of your production ends up in commodity cheese blocks and butter, GLP‑1 makes those categories a little more crowded. If it’s heading into high‑protein dairy—Greek yogurt, cottage cheese, protein drinks—you’re closer to where the growth is.
You can’t fix GLP‑1 from the parlor. But you can understand where your milk is going and whether that’s a “protein‑forward” lane or an indulgence lane.
When Plants Move, the Local Math Changes
You don’t need a consultant to tell you that when a local plant closes or changes hands, everything around it feels it. We’ve already talked about AMPI’s closures and the logic behind them.
Economic impact work for USDA and state ag departments has consistently shown that every dairy cow supports multiple off‑farm jobs—feed, vet, fuel, trucking, processing, retail. When processing capacity leaves a region, that ripple shrinks.
Meanwhile, the fresh steel is going into places that CoBank and IDFA keep pointing to: South Dakota, Texas, New Mexico, Idaho, parts of Kansas, and the Upper Midwest, where milk production is rising and component‑rich milk can efficiently fill new plants.
Cows follow plants, and plants follow cows—it’s a feedback loop.
For a 300‑cow family dairy in Marathon County or northern Pennsylvania, the processing map now matters almost as much as your soil map. If your buyer is putting new capital into your region, that’s one kind of future. If most of their big announcements are two or three states away, that’s another.
Sustainability and Bovaer: Real Emission Cuts, Real Costs
Let’s talk sustainability, because it’s showing up in almost every processor and retailer playbook now.
Bovaer is one of the most talked‑about tools on the enteric methane side. In May 2024, the FDA completed its review and approved Bovaer for use in U.S. dairy cows.
Elanco’s data shows that feeding one tablespoon per lactating dairy cow per day can reduce methane emissions by about 30%—roughly 1.2 metric tons of CO₂‑equivalent per cow per year.
On cost, the picture is still evolving. Independent technical reviews, including Dellait’s analysis and industry coverage, suggest early commercial costs tend to fall in the $0.30–0.50 per cow per day range, depending on region and feeding system.
On a 300‑cow herd, that works out to roughly $33,000–$55,000 per year before any incentives.
Some co‑ops and processors are offering payments tied to documented methane reductions, and a few early pilots show those can offset part of the cost—especially for larger herds or brand‑aligned programs. But in many cases, the net benefit to a 250–600‑cow herd is still very case‑by‑case.
What’s encouraging is that not all sustainability steps look like pure cost. Extension work on energy efficiency, manure storage, and nutrient management shows that improving fans and pumps, optimizing manure handling, and tightening nutrient management plans can lower energy bills, reduce purchased fertilizer, and sometimes improve milk quality at the same time.
The big takeaway? Treat sustainability offers like any other major business contract: get the full cost per cow and per hundredweight, understand how incentives are calculated and how long they last, and talk to producers already in the program before you sign.
Beef‑on‑Dairy: Great Tool, Dangerous Autopilot
Most of you have already seen the beef‑on‑dairy story firsthand. A decade ago, Holstein bull calves in many Midwest barns weren’t worth the time it took to haul them. Today? That’s changed.
In 2024–2025, newborn beef‑on‑dairy cross calves have often sold in the $600–$900 range in the Midwest and Western markets, with some lots hitting or exceeding $1,000 when beef supplies are especially tight.
Compared to the $50–$150 Holstein bull calves many of us remember, that’s a different world entirely.
Here’s the catch. As more producers bred a high share of cows to beef, replacement heifer inventories dropped.
CoBank’s 2025 report concludes that U.S. replacement heifer numbers have already fallen to a 20‑year low and could shrink by another 800,000 head across the next two years before recovering in 2027.
Year
Heifer Inventory (M head)
Bred Heifer Price ($/head)
2015
2.35
$1,800
2017
2.28
$1,950
2019
2.15
$2,100
2021
2.08
$2,350
2022
2.02
$2,650
2023
1.95
$2,900
2024
1.88
$3,100
2025E
1.82
$3,150
2026E
1.75
$3,050
2027E
1.81
$2,700
During the same period, bred heifer prices have spiked “well above $3,000 per head” and in some cases significantly more.
So if a 320‑cow herd runs several years of aggressive beef‑on‑dairy use without a disciplined replacement plan, it can easily end up short on heifers and forced to buy back in at a painful price.
What farmers are finding is that beef‑on‑dairy works best as a controlled tool:
Set your replacement target. Use your actual cull rate, age at first calving, and herd size to calculate how many heifers you truly need each year. Many herds land near 30–36 replacements per 100 cows per year, depending on goals and longevity.
Use sexed dairy semen and genomics where they pay. Focus dairy semen on your top‑end cows and heifers—animals that will move butterfat performance, protein yield, and health traits in the right direction for your market.
Then layer beef‑on‑dairy on the rest. Once you’ve covered replacements, you can confidently use beef semen on the remainder to capture calf premiums without jeopardizing your future herd.
It’s like balancing protein and energy in a ration. Pushing beef semen to the max without watching replacement numbers might feel good in the short term, but the payback can hurt.
Canada’s Supply Management: Different Rules, Different Outcomes
Whenever the conversation gets tough in U.S. barns, someone inevitably says, “Canada doesn’t seem to be going through this the same way. What are they doing differently?”
Statistics Canada census data shows that Canadian dairy farm numbers have declined while average herd sizes have grown—a pattern similar to the U.S., but from a different starting point and under different rules.
Western Canada tends toward larger freestall herds while Québec maintains many smaller, tie‑stall family dairies.
Canadian dairy operates under supply management: production quotas, farmgate prices set by cost‑of‑production formulas, and import controls that cap foreign dairy entering the market. That framework has helped maintain relatively stable farmgate milk prices and a higher proportion of mid‑sized family dairies than in the U.S.
Could the U.S. copy that model? Realistically, not quickly. The U.S. sector is far larger, heavily involved in export markets, and bound by trade agreements that assume relatively open dairy trade.
The point here isn’t that one country is “right” and the other “wrong.” It’s that the rules you play under matter a lot. Canadian mid‑sized herds operate in a structure designed to support them. U.S. mid‑sized herds operate in a structure that rewards volume, efficiency, and export competitiveness.
The Human Load: When the System Sits on People
Under all these numbers are people—families, hired teams, neighbors.
In 2023 that farmers may face a suicide rate roughly 3.5 times higher than the general U.S. population, citing CDC‑linked occupational mortality data.
The National Rural Health Association and Senator Chuck Schumer’s office have both cited similar figures based on CDC research. Rural Minds, a nonprofit focused on rural mental health, notes that suicide rates in rural areas climbed significantly faster than in metro areas over the past two decades.
You see that in real life when a neighbor sells out under pressure or when a family member quietly struggles.
What’s encouraging is that more support is becoming available. Rural Minds maintains directories of confidential mental‑health and stress resources for farm families, and the Farm Aid hotline (1‑800‑FARM‑AID) connects farmers to local financial, legal, and crisis support.
Many states now have dedicated farm stress lines and behavioral‑health programs through their departments of agriculture and extension systems.
Reaching out for that kind of help is not a sign you “can’t handle it.” It’s part of taking care of yourself and the business in an industry where the pressures are structurally high.
Back at the 320‑Cow Freestall: What Do You Actually Do With This?
Let’s bring this down to the barn level.
Picture a fairly typical operation in central Wisconsin or upstate New York: about 320 cows in a freestall barn, a double‑8 or double‑12 parlor, corn silage and alfalfa on a few hundred acres, butterfat performance around 3.9–4.2% with solid protein test, shipping to a co‑op that’s already changed plant destinations once or twice in the past decade, and one or two younger family members quietly wrestling with whether to come home full‑time.
Here are five practical steps that kind of herd—and many like it—can take using the “uncomfortable math” instead of being blindsided by it.
1. Run a real stress test, not just a hope test
Sit down with your lender or advisor and run a few realistic stress scenarios:
Milk price in the mid‑teens for 12–18 months.
Beef‑on‑dairy calf prices are dropping 30–50% from current highs.
A methane‑reduction requirement adding $0.30–0.50 per cow per day without guaranteed long‑term premiums.
On 320 cows, that additive alone could run $35,000–$58,000 per year. If you’ve been selling 80–100 beef‑cross calves at $800 and the market falls back toward $500–600, you could be looking at $16,000–$24,000 less revenue from calves.
When you spread those costs and revenue hits over your annual milk shipped, it can easily move your effective margin by $0.50–$1.00 per cwt, depending on production.
Scenario
Milk Price
Beef Calf Price
Bovaer Adoption
Replacement Heifer Shortage
Annual Margin Impact
Margin/cwt vs. Baseline
Baseline (Normal)
$18.50
$800
None
None
$52,000
+$0.80
Scenario 1: Mild Stress
$17.00 (−$1.50)
$700 (−$1,100)
Optional
None
$38,500
+$0.59 (−$0.21)
Scenario 2: Moderate Stress
$16.00 (−$2.50)
$550 (−$22,500)
Mandated ($0.40/day)
5 heifers forced to buy @ $3,100
$19,200
+$0.30 (−$0.50)
Scenario 3: Hard Stress
$15.00 (−$3.50)
$450 (−$31,500)
Mandated ($0.50/day)
10 heifers forced to buy @ $3,100
−$8,900
−$0.14 (−$0.94)
Scenario 4: Structural Crisis
$14.50 (−$4.00)
$400 (−$36,000)
Mandated ($0.50/day)
15 heifers forced to buy @ $3,100
−$61,500
−$0.95 (−$1.75)
Some families will find they’re more resilient than they feared. Others may realize that one hard cycle like that would dramatically change their options.
2. Map your marketing and processing exposure
Just like you map soil types and yield history, sketch out your marketing picture:
How many serious buyers exist within a practical hauling radius for your size?
Which plants have closed, reduced capacity, or changed ownership within that radius over the past 10–15 years?
Where are your co‑op’s and main buyer’s latest big processing investments—locally, or in other states?
If you’re located near multiple growing plants, you’ve got a different risk profile than if you’re in a region with flat or shrinking capacity.
3. Calibrate beef‑on‑dairy as a tool, not autopilot
The starting point is knowing your true replacement needs. Work with your records, your cull rate, and extension benchmarks to set a realistic target.
Use sexed dairy semen and genomic testing where they actually pay—on the top tier of cows and heifers that will move your components and herd health the right way. Once those replacement slots are safely covered, assign beef semen to the rest.
Over‑raising heifers ties up capital, but under‑producing replacements pushes you into a high‑priced replacement market like the one we’re in now.
4. Approach sustainability projects like any other major contract
When someone pitches you a sustainability project—Bovaer, a digester, a low‑carbon milk program—try to approach it like you would a custom harvesting contract or a parlor upgrade.
Questions to put on paper:
What’s the total cost per cow and per hundredweight, including product, equipment, extra labour, data collection, and verification?
How exactly are incentives or premiums calculated, and how long are they guaranteed?
Can you talk one‑on‑one with two or three producers already in the program to hear what works and what surprised them?
5. Make space for the family conversation about “what’s next.”
Most multi‑generation 250–600‑cow farms will eventually have to sit down and talk about who really wants to be on the farm in 5, 10, or 15 years, what level of debt and volatility everyone is willing to live with, and what “winning” means: staying roughly the same size, expanding, diversifying, or planning an orderly exit.
Many farm families are discovering that having a neutral third party—a mediator, succession planner, or extension specialist—at the table helps those conversations stay constructive. fb
I’ve heard from families in Wisconsin and New York who decided that selling a 280‑cow herd while land values were strong and equity was intact was their version of success. They’d run the numbers, talked with their kids, and realized they could leave with their health and their equity—and, for them, that felt like winning.
That won’t be the right path for everybody. Some will grow, some will pivot, some will partner, some will exit.
Your Next Three Moves
The math in this piece isn’t meant to scare you into any particular decision. It’s meant to show you the landscape clearly so you can choose your path with your eyes open.
If you take nothing else from this:
Run the uncomfortable stress test and write down the results. Not in your head—on paper or in a spreadsheet, with real numbers.
Decide whether you’re playing in Lane 1 or Lane 2—and whether that matches your long‑term goal. If there’s a mismatch, that’s the conversation to have next.
Make a timeline for a real family conversation, with outside help lined up if you need it. Succession planning isn’t about giving up. It’s about choosing your terms.
Doing nothing is also a decision—it just hands the timing and terms to markets, processors, and lenders.
The uncomfortable math is a planning tool, not a verdict. The decision about whether to stay, grow, partner, or step away while you’re still on your feet—that still belongs to you, your family, your cows, and your land.
KEY TAKEAWAYS
Two lanes, diverging fast: Lane 1 (1,000+ cow herds) is pulling $10-11B in new plants. Lane 2 (mid-sized dairies in WI, NY, PA) lost 1,521 farms in two years while milk output held steady.
Heifer trap is set: 20-year-low inventory. 800,000 more head gone by 2027. Bred replacements topping $3,000. Beef-on-dairy without a replacement plan backfires hard.
GLP-1 is sorting winners: Users cut grocery spending 5-6%—snacks down 10%, sweets down 11%. Greek yogurt and cottage cheese are gaining popularity. Know where your milk lands.
Sustainability has a price tag: Bovaer cuts methane 30% but costs $0.30-0.50/cow/day ($33K-55K/year for 300 cows). Incentives rarely cover it. Negotiate like it’s a major contract.
This is structural, not cyclical: Stress-test your margins. Map your processing exposure. Decide if staying, growing, or exiting on your terms is the win.
Complete references and supporting documentation are available upon request by contacting the editorial team at editor@thebullvine.com.
The $11 Billion Reality Check: Why Dairy Processors Are Banking on Fewer, Bigger Farms – Expose the hidden processor contracts that have already locked in 80% of future milk supply. You’ll gain the strategic clarity to navigate the permanent structural shift toward high-volume corridors before the December 2026 repositioning window slams shut.
5 Technologies That Will Make or Break Your Dairy Farm in 2025 – Slash your fresh cow treatment costs by 40% and reclaim your sleep with AI-powered sensors that catch health crises a week early. This breakdown reveals the specific ROI of autonomous systems that turn your herd into a self-monitoring profit engine.
Join the Revolution!
Join over 30,000 successful dairy professionals who rely on Bullvine Weekly for their competitive edge. Delivered directly to your inbox each week, our exclusive industry insights help you make smarter decisions while saving precious hours every week. Never miss critical updates on milk production trends, breakthrough technologies, and profit-boosting strategies that top producers are already implementing. Subscribe now to transform your dairy operation’s efficiency and profitability—your future success is just one click away.
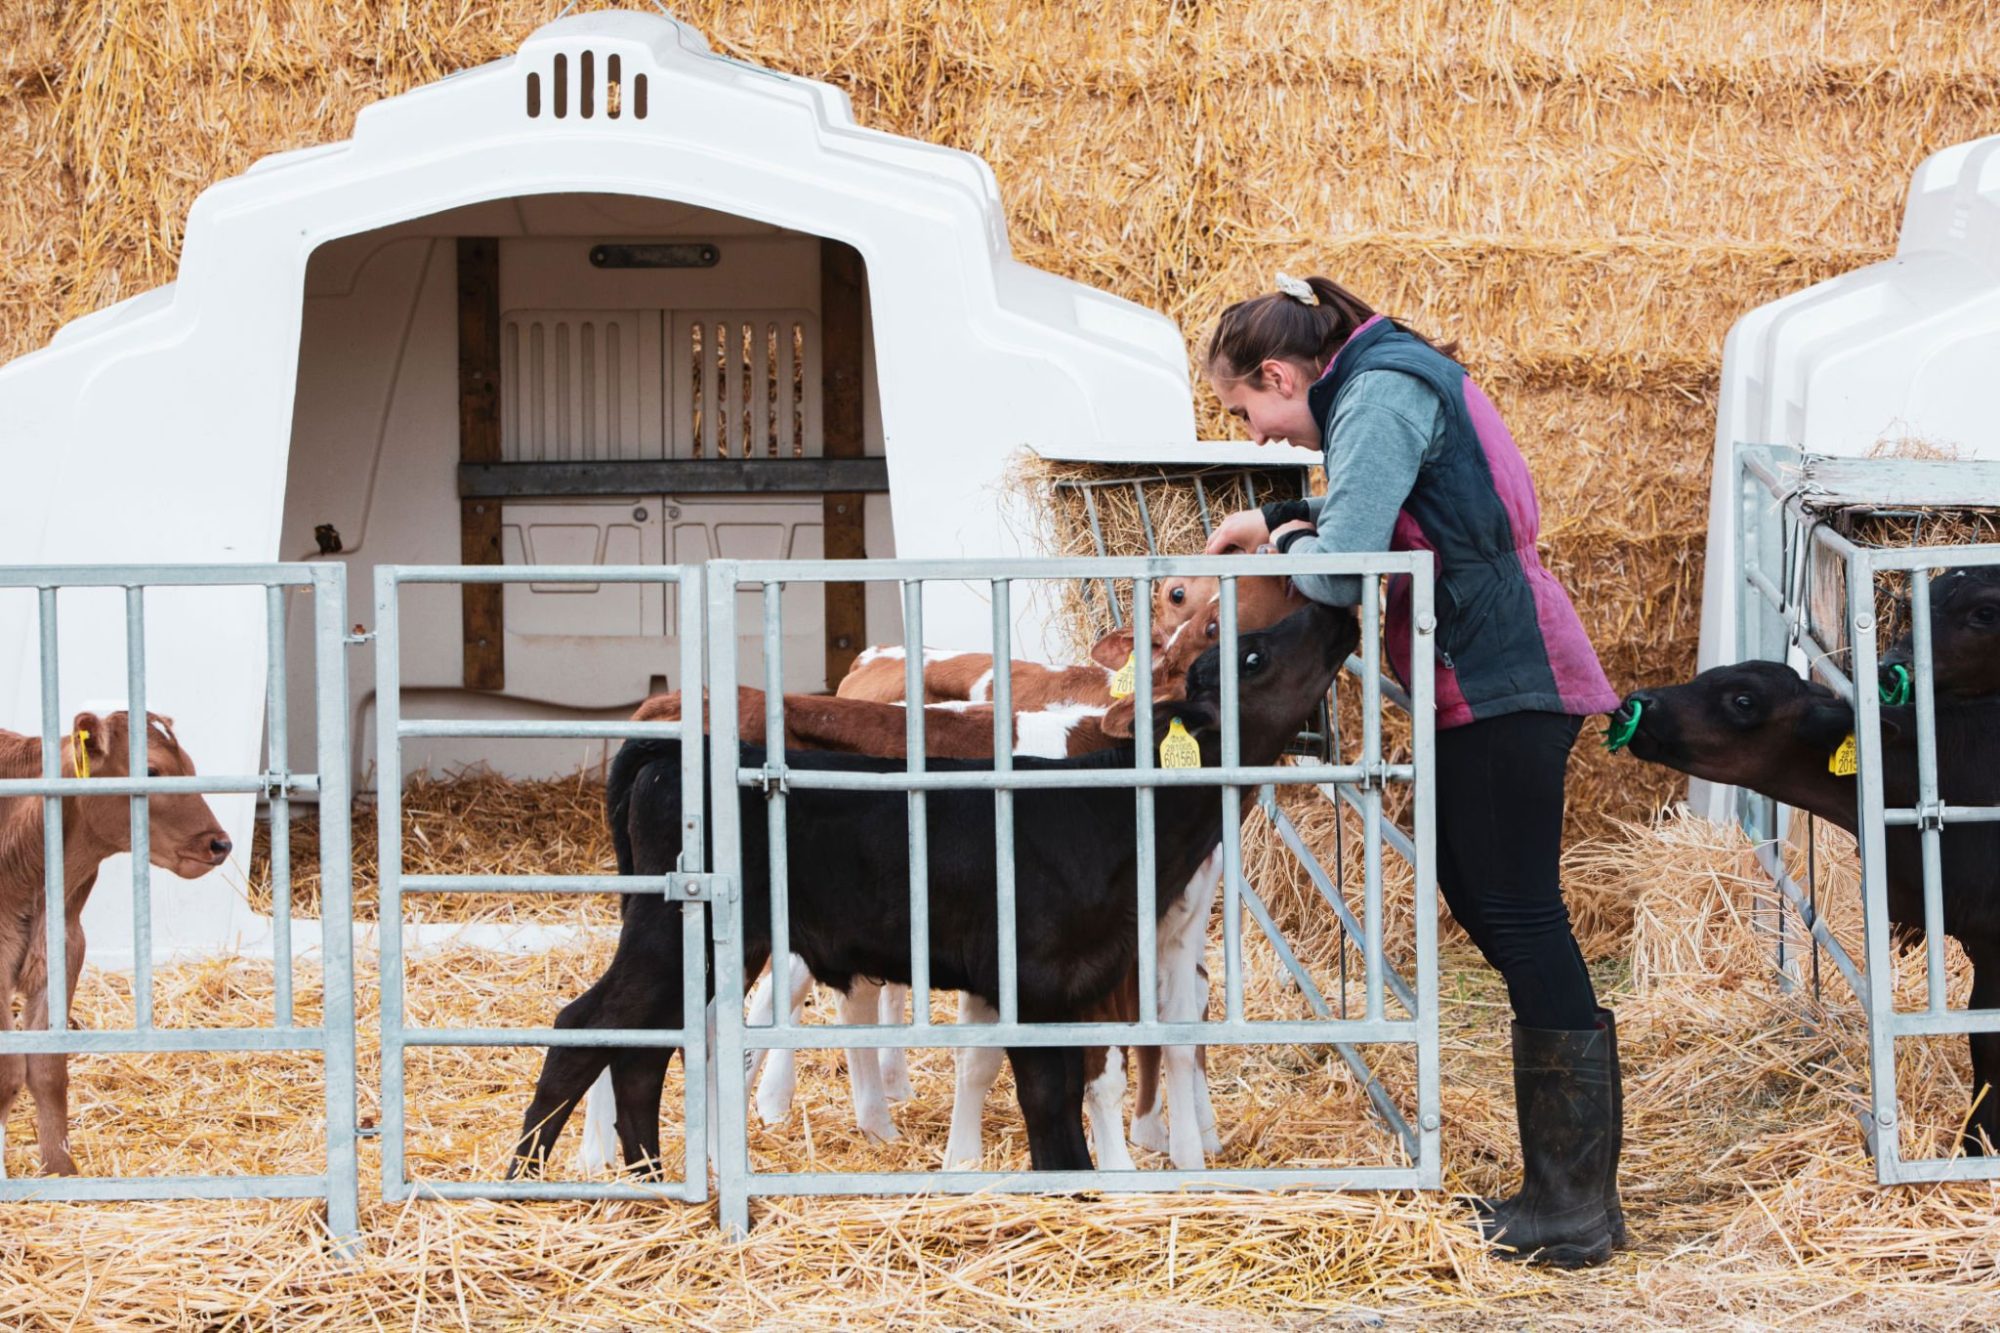
Sick calves can drain $27,000/year from your herd. By 2026, genomics will let you stop breeding them. Here’s the playbook.
EXECUTIVE SUMMARY: USDA research now confirms what many producers have long suspected: calf scours and respiratory disease are partly genetic—and by 2026, you’ll be able to select against them. The numbers are hard to ignore. Sick calves can drain $27,000 a year from a 1,000-cow herd, while wrong breeding calls leave another $30,000-plus on the table in missed beef-on-dairy premiums and wasted heifer slots. With replacements at a 20-year low, beef-cross calves topping $1,000, and heifers costing north of $2,500 to raise, every semen straw now carries real economic weight. This article lays out a five-step breeding playbook—genomic testing, rule-based beef-versus-dairy decisions, calf-health sire screening, calving-pressure management, and ongoing market adjustments—that forward-thinking herds are already putting to work. Producers who start now can realistically expect to shift $50,000 or more in annual herd economics within 18-24 months.
You know how the talk goes once the parlor’s washed down and the coffee’s on. Somebody mentions a nasty run of scours or a bunch of calves that just won’t quit coughing in the group pen, and five minutes later, you’re into genomics, beef‑on‑dairy, heifer prices, and whether some cows should ever see a dairy straw again. That’s not small talk anymore. That’s survival planning.
What’s interesting right now is that the genetics and the economics are finally lining up with what a lot of you have been seeing in your own hutches. Some cow families just throw tougher calves. Others seem to live in the treatment book every winter. And those sick calves quietly eat money long before they get a chance to show what they can really do on butterfat performance, fertility, or longevity.
At the same time, beef‑on‑dairy has turned into serious money in a lot of sale barns and contract deals, right when replacement heifers have slid to the lowest levels we’ve seen in about 20 years and gotten expensive to either raise or buy. A 2025 CoBank report describes US dairy heifer inventories as sitting at roughly a 20‑year low and projects they could tighten by as much as 800,000 head before gradually rebounding after 2027 as roughly 10 billion dollars of new processing capacity comes online and needs milk. Analysts used USDA Cattle Inventory data to show that the number of dairy heifers over 500 pounds dropped from about 4.76 million in 2018 to roughly 4.06 million by early 2024—almost a 15% decline in the pool of future milkers.
Put all of that together, and the question changes from “How do we get fewer sick calves?” to something a lot sharper:
Which calves do you actually want to be making in 2026—and which ones are you better off never creating in the first place?
Let’s walk through what the newest science says about calf‑health genetics, how it connects to beef‑on‑dairy money and replacement economics, and what a practical breeding plan looks like on real dairies.
Looking at This Trend: What the New Calf‑Health Genetics Actually Show
If you’re going to let genetics influence how you think about scours and pneumonia, the first question is simple: are these traits heritable enough to move the needle?
A 2025 paper in the Journal of Dairy Science from USDA’s Animal Genomics and Improvement Laboratory went straight at that. The team led by geneticists Babu Neupane, PhD, and John B. Cole, PhD, pulled producer‑recorded calf health data from the National Cooperator Database and built what’s probably the most comprehensive calf‑health dataset we’ve ever seen for North American Holsteins and Jerseys.
Here’s what they worked with:
207,602 calf records for diarrhea between 3 and 60 days of age.
681,741 records for respiratory disease between 3 and 365 days.
Calves born from 2013 to 2024, with about 97.5% of the data coming from Holsteins and Jerseys.
When they summarized those records, they found that 14.46% of calves had a recorded case of diarrhea in that 3‑ to 60‑day window, and 16.05% had a recorded respiratory case between 3 and 365 days. If you’ve ever watched a damp March wind whistle through hutches in Wisconsin or Ontario, those numbers probably sound about right. Scours tends to bully the youngest calves; as they get older, respiratory problems slowly take over.
On the genetic side, they estimated heritabilities of 0.026 (2.6%) for resistance to diarrhea and 0.022 (2.2%) for resistance to respiratory disease. That’s modest, but it’s right in line with what’s been reported for cow‑health traits like clinical mastitis, metritis, and ketosis that we already include in Net Merit, Pro$, and other indexes. In plain language: calf‑health traits behave like other health traits we’re already comfortable breeding for.
Trait
Heritability
Similar Industry Trait
Top 5% Sires (% Healthy Calves)
Bottom 5% Sires (% Healthy Calves)
Practical Implication
Diarrhea Resistance
2.6%
Clinical Mastitis (1.5%–3%)
88%
71%
17 percentage-point spread; top sires prevent ~200+ sick-calf events per 1,000 calves born
Respiratory Resistance
2.2%
Ketosis (1–2%)
88%
70%
Same order of magnitude; respiratory RBV predicts > 1 fewer pneumonia case per 10–12 calves
Cow Mastitis
1.5%–3%
Industry standard
~85%
~72%
Calf-health heritability is comparable to traits we’ve been selecting on for 20+ years
Genetic Correlations
0.0 to -0.1
Low cross-trait pull
N/A
N/A
Improving calf health does not sacrifice milk, fat, protein, or fertility gains
What’s encouraging is that when USDA‑AGIL ran genomic evaluations for these traits, the genomic predictions were noticeably more reliable than simple parent averages, particularly for young bulls with no daughter data yet. They also found that genetic correlations between calf‑health traits and most other traits—production, fertility, cow health—were low, with only a modest link between diarrhea and respiratory resistance and very little pull against milk or component traits. That matters. It means you can add calf‑health traits into a balanced index without giving up the gains you’re making in milk, fat, protein, or cow fitness.
USDA‑ARS and the Council on Dairy Cattle Breeding (CDCB) have been presenting this work through ICAR and industry meetings. The consistent message has been that these calf‑health traits are ready for inclusion in US national genetic evaluations for Holsteins and Jerseys as soon as data quality and validation milestones are met, with 2026 targeted as the window for implementation. The exact month depends on final testing and governance, but the direction is clear.
So, from a genetics point of view, we’re not talking about “maybe someday” anymore. These are real traits with real proofs coming.
What Sick Calves Really Cost: From $25 Per Case to $27,000 Per Year
You probably don’t need a scientist to tell you that sick calves are expensive, but it helps to put some hard numbers behind your gut feel.
A 2023 study in JDS Communications examined health costs at 16 certified organic Holstein dairies in the US. The researchers, including Laura C. Hardie, MSc, used on‑farm treatment records and standardized cost estimates for veterinarian time, medications, and producer labor.
On the calf side, they found average direct costs of:
25.21 dollars per case of scours.
56.37 dollars per case of respiratory disease.
Those figures are just what you can see on the invoice—vet visits, drugs, and some labor. They don’t include slower growth, extra days on milk replacer or starter, extra days to breeding, or the way a rough start can nibble away at first‑lactation milk and component performance. Reviews on calf health and heifer rearing, along with herd‑level calf‑health investigations, keep showing what many of you have already noticed: calves that get hammered early often lag behind, even when they survive and make it into the milk string.
So it’s reasonable—based on those cost estimates and the documented performance impacts—to say that a serious pre‑weaning disease episode can trim a few hundred dollars off a heifer’s lifetime economic value on many farms once you add up treatment, extra rearing time, and lost milk later on. The exact figure will move with your feed costs, labor rate, housing system, and milk price, but the order of magnitude is real.
If you want to see how that plays out across a herd, let’s do some simple math. Picture a 1,000‑cow dairy calving about 900 heifers a year. Say 15% of those calves—135 animals—have a significant scours or respiratory event. If you assign a conservative 200‑dollar economic hit per case, combining Hardie’s direct treatment costs with some allowance for long‑term performance losses, you end up at:
135 calves × 200 dollars ≈ 27,000 dollars per year in calf‑health‑related losses.
Cost Component
Amount (USD)
Percentage of Total
Direct Vet & Drug Costs
5,100
19%
Producer Labor (extra time)
4,050
15%
Slow Growth & Extended Rearing
8,100
30%
Lost First-Lactation Milk/Components
9,750
36%
Total
$27,000
100%
That’s not a published national average—it’s a realistic illustrative example built from current cost data and what we know about early‑life disease. On herds with higher disease burden, more expensive inputs, or longer rearing periods, that number can easily climb into the higher tens of thousands.
And that’s before you count the extra time and stress your team spends on repeated treatments and nursing fragile calves through bad weather.
So when we say calf health isn’t a “minor line item,” that it’s a major factor in your annual profit and loss, that’s the level of math we’re talking about.
Beef‑on‑Dairy and Tight Heifer Numbers: Why Every Calf Turned Strategic
Now layer the beef‑on‑dairy story and the heifer shortage on top of that.
On the beef side, you’ve watched this play out: the US beef cow herd has been slow to rebuild, and beef supplies have been tight enough that packers and feedlots are looking harder at dairy‑origin cattle, especially high‑health dairy‑beef cross calves. At the same time, dairy herds have become much more consistent with reproduction—timed AI, sexed semen, improved fresh cow management through the transition period—so you have more control over whether a given pregnancy is a “dairy heifer” or a “beef‑on‑dairy” calf.
Economists who work with both dairy and beef have been frank about the impact. In a 2025 interview, Mike North, an economist and risk‑management advisor with Ever.Ag, who works with many Midwest dairies, explained that beef‑on‑dairy breeding programs are generating “upwards of two and a half dollars per hundredweight in revenue back to the farm just in beef breeding” on some operations. In that same segment, he pointed out that in the current market environment, it’s not unusual to see a well‑bred, three‑day‑old dairy‑beef cross calf bring more than 1,000 dollars at certain sales, which really changes how that calf looks compared to a straight Holstein bull calf.
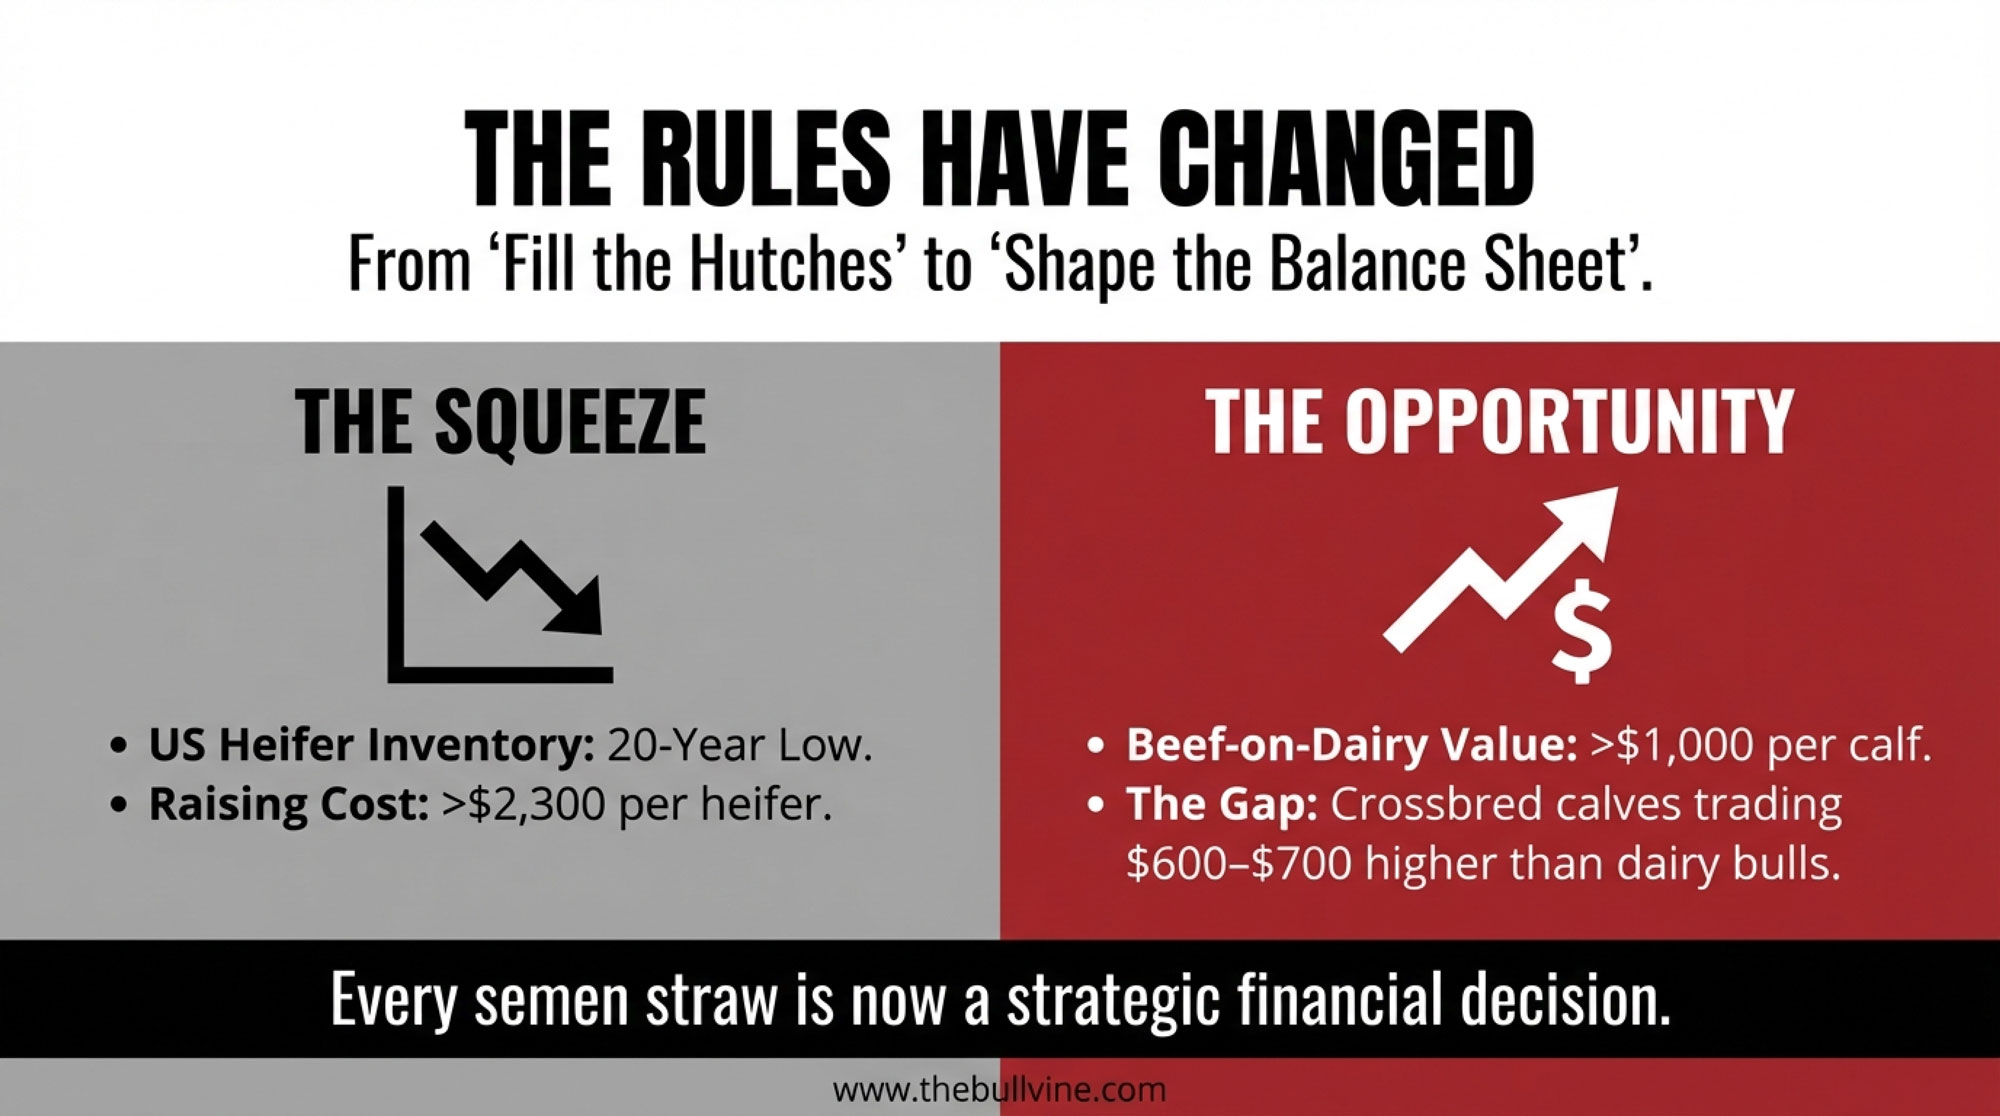
On the replacement side, CoBank’s 2025 heifer‑inventory analysis describes a sector at a “unique inflection point,” with dairy heifer numbers already at a 20‑year low and not expected to rebound until around 2027, as new processing plants draw more milk and heifer demand slowly pulls numbers up again. USDA Cattle Inventory reports shows that heifers over 500 pounds dropped from roughly 4.76 million in 2018 to 4.06 million in early 2024, while noting that stronger milk prices and processing expansion could drive replacement values higher. At the same time extension economists have pointed out that the total cost to raise a replacement heifer—from birth to first calving—often sits somewhere between 1,600 and 2,400 dollars under pre‑inflation conditions, with more recent budgets and Canadian/US benchmarking suggesting that on many units today, full economic rearing cost runs in the 2,300–3,000‑dollar range per head once you factor in feed, labor, housing, and overhead.
So across North America right now:
Dairy‑beef cross calves commonly bring a few hundred dollars more than straight Holstein bull calves at auction, with recent reports showing crossbred calves trading around 600–700 dollars in some Midwest sales while conventional bull calves lag behind.
In certain barns and weeks, especially in strong markets, three‑day‑old beef‑on‑dairy calves have topped 1,000 dollars.
Replacement heifers are scarce and expensive by historic standards, with multiple analyses pointing to rearing costs comfortably north of 2,000 dollars per head and market values for springers often pushing into the upper‑2,000 to 3,000‑dollar range in tight regions.
This development suggests that calves have shifted from “fill the hutches” to “shape the balance sheet.” Whether a pregnancy produces a dairy heifer or a dairy‑beef calf now has a direct and significant impact on both your future herd and your short‑term cash flow.
What Farmers Are Finding: A Five‑Step Breeding Framework That Actually Works
Looking at this trend across herds in Ontario, Wisconsin, California, and the Northeast, what I’ve noticed is that the operations making this work aren’t doing anything mystical. They’re just being very deliberate and consistent.
Most of them follow some version of a five‑step framework:
Use genomics to see which cow families are truly driving your herd.
Make a clear, rule‑based beef‑versus‑dairy decision for each breeding.
For dairy matings, add calf‑health genetics to your sire criteria as those proofs become available.
Factor in gestation length and calving pressure so you don’t overload high‑stress windows.
Re‑run the economics regularly as calf prices, heifer values, and milk markets move.
Let’s unpack that in barn‑level terms.
Step 1: Use Genomics to See Which Families to Grow—and Which to Let Go
Most herds that are serious about this are genomic‑testing their heifer calves, and some have also done a one‑time pass on younger cows to avoid missing high‑value animals that might be hiding behind older genetics.
A good real‑world example comes from a 5,000‑cow Holstein herd in the western US profile in 2024. The dairy, managed by veterinarian and producer Dr. Sergio Lopes, began genomic testing heifers in 2016 when they realized they were simply overrun with replacements and needed a better way to decide which heifers were truly worth raising.
Genomic results showed them a few things very quickly:
Some cows they had always considered “average” based on current production actually had very strong genetic merit.
Some of their highest‑producing cows were benefiting more from management and environment than genetics.
There were identification problems—wrong semen recorded, calves linked to the wrong dams—that genomics helped uncover and correct.
After a couple of years of working with the data, Lopes said they were confident enough to change their breeding strategy completely. They dropped conventional semen, used sexed dairy semen only on their best families, and bred the rest to beef. Today, they have a background of roughly 12,000 dairy‑beef cross animals tied to their 5,000‑cow dairy and partner herds, with beef calves and fed cattle now a major income stream alongside milk.
On a 300‑ to 600‑cow family herd—say a free‑stall in Wisconsin or a tie‑stall in Ontario—the same pattern shows up on a smaller scale. Producers genomic‑test their heifer calves, rank them on the index that matters most—Net Merit, TPI, Pro$, LPI, maybe with extra weight on health—and discover they have:
A top group, often the top 20–30%, they absolutely want to build daughters and granddaughters from.
A middle group they can flex up or down based on heifer inventory and cash flow.
A bottom group that’s tough to justify raising to calving when replacements are expensive, and barn space is tight.
Once you see your herd laid out like that, it becomes a lot easier to say, “These families deserve sexed semen and more daughters,” and “These cows can contribute better through beef‑cross calves than through more low‑merit heifers.”
Step 2: Make Beef‑Versus‑Dairy Decisions Simple and Rule‑Based
Once you’ve got a handle on your cow families, the next step is to stop making beef‑versus‑dairy calls on the fly in the parlor and start following a simple rule you can execute every week.
A rule that’s working on a lot of herds looks something like this:
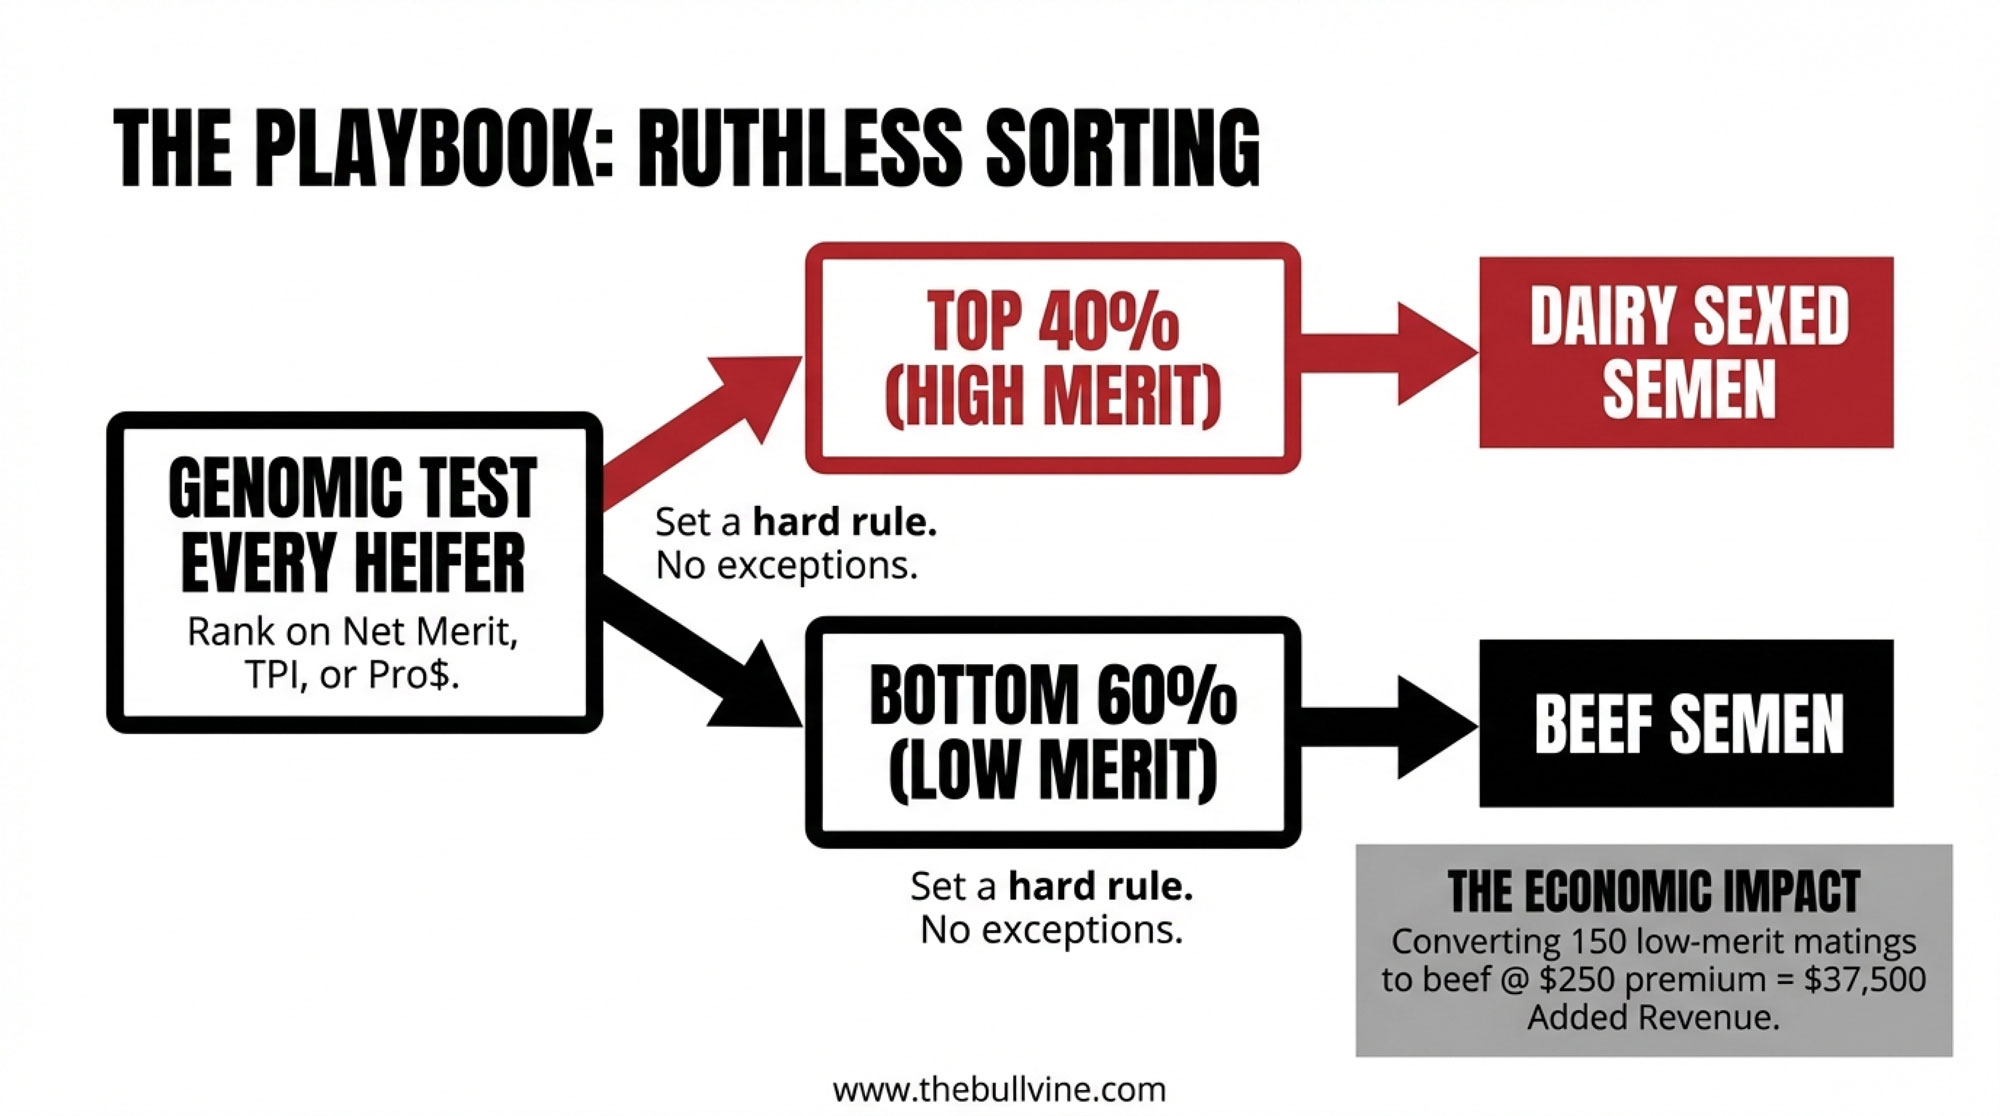
First‑ and second‑lactation cows whose most recent heifer ranks in the top 40% of your genomic list get bred to dairy semen, often sexed.
Cows whose daughters fall below that line, plus older cows without strong family backing, get bred to beef.
When herds stick to that for a full year, they usually end up with roughly 30–40% of cows getting dairy semen and 60–70% getting beef. That mix often covers replacement needs—because dairy semen is concentrated on the right cows—while generating a steady stream of well‑bred dairy‑beef calves.
Here’s where the big math starts to bite in your favor. In many Midwestern markets right now, it’s common to see a beef‑on‑dairy calf sell for a few hundred dollars more than a straight Holstein bull calf. For example, in early 2024, it was reported that crossbred calves were selling for around 675 dollars per head in some US sales, while conventional Holstein bull calves lagged far behind, and noted that “beef on dairy” was becoming a “big money” factor in the heifer shortage conversation. If you take 150 matings that would have produced low‑merit dairy calves and, instead, flip them to beef‑on‑dairy matings with a 250‑dollar average premium, you’re looking at:
Even if you trim that for calf‑price volatility or the occasional calf that doesn’t quite hit the premium, you’re still talking about tens of thousands of dollars per year from one simple change in breeding policy.
And on the cost side, you’re not spending all the feed, bedding, labor, and barn space to raise heifers from those bottom families. Long‑term work out of places like Cornell, Penn State, and western Canadian benchmarking suggests that when you spread all the costs out, total rearing cost per dairy heifer—from birth to first calving—often sits in the 2,000–3,000‑dollar range once you include feed, bedding, labor, health, and overhead, with the exact figure depending on system (confinement, pasture, dry lot) and region. So not raising heifers that were never likely to pay you back is a big part of this story, too.
Step 3: Add Calf‑Health Genetics to Your Dairy Sire List
Now bring calf‑health genetics back into the picture.
We’ve already seen that calf diarrhea and respiratory disease are heritable and can be evaluated genomically. Canada gives us a clear preview of how those traits can look in practice.
In August 2025, Lactanet—the national genetics and data organization for Canadian dairy producers—launched a Holstein calf‑health genetic evaluation that combines recorded cases of respiratory disease from birth to 180 days and diarrhea from birth to 60 days. The new trait is expressed as a Relative Breeding Value (RBV) centered at 100 with a standard deviation of 5. Higher RBVs indicate sires whose daughters are more likely to stay free of recorded calf‑health events in that early‑life window.
Lactanet geneticist Colin Lynch, MSc, explained in that a five‑point increase in calf‑health RBV corresponds to about 5.4% more healthy calves with no recorded diarrhea or respiratory problems. Their analysis showed that, among proven sires, the top 5% for calf‑health traits had around 88% healthy daughters, while the bottom 5% averaged closer to 70–71% healthy daughters—depending on whether you’re looking at diarrhea or respiratory disease. In real‑world terms, that’s the difference between a family where “most calves just start and go” and one where you feel like you’re forever pulling buckets and syringes.
Sire Rank
% Calves NO Diarrhea
% Calves NO Respiratory Disease
Combined Healthy Rate (Est.)
Per 100 Calves: Sick Events
Economic Cost per Cohort (100 calves)
Top 5%
92%
90%
~88%
~12 sick calves
$2,400 in direct treatment + losses
Middle 50%
87%
84%
~80%
~20 sick calves
$4,000 in treatment + losses
Bottom 5%
82%
76%
~70%
~30 sick calves
$6,000+ in treatment + losses
Spread (Top vs. Bottom)
+10 pts
+14 pts
+18 pts
+18 more sick calves
+$3,600 annually per 100-calf cohort
Here’s how herds are starting to use that kind of information:
For heifers and first‑calf cows, they insist on bulls that meet their production and cow‑health criteria and also clear a minimum calf‑health RBV. Bulls with poor calf‑health scores simply don’t get used on young animals.
For older cows, calf‑health RBV becomes a tie‑breaker among bulls with similar milk, components, fertility, and cow‑health profiles.
In regions with tough winter respiratory seasons—Wisconsin, Minnesota, Quebec, Northern New York—some producers are deliberately matching higher calf‑health bulls to matings that will calve into late winter and early spring, when pneumonia risk is highest.
Of course, these evaluations live or die on the quality of the health records behind them. A 2023 Canadian Journal of Animal Science case study on calf respiratory illness and diarrhea recording in Ontario found that the share of milk‑recorded herds logging calf disease rose from 2.6% in 2009 to 11.1% in 2020, but also pointed out several places where data can be lost or misclassified between the farm and the national database. Neupane and Cole have likewise emphasized in USDA‑ARS communications that clear, consistent on‑farm recording of calf health is critical if we want reliable calf‑health proofs.
So one very practical step you can take this year—before US calf‑health numbers even hit your AI catalogs—is to tighten how you record scours and pneumonia. Sit down with your vet, agree on what counts as a case, and make sure those events get logged consistently in your herd software. That way, when calf‑health proofs land, you can trust them more and know your herd is contributing good data.
Step 4: Factor in Gestation Length and Calving Pressure
You don’t need a statistician to tell you that what you do with calving‑ease and gestation length can make or break certain months. Stack too many long‑gestation, big‑calf bulls on heifers or smaller cows that all calve in a tight two‑week window, and you’ll see it in stillbirths, tough pulls, exhausted staff, and shaky fresh cow performance through the transition period.
Most modern proofs include calving‑ease and stillbirth rates, and many now list gestation length as well. Genetic evaluation organizations like CDCB and Lactanet have been gradually building more of these functional traits into their indexes and tools. They may not be as glamorous as milk or fat numbers, but they matter a lot when you’re planning calving pressure.
What farmers are doing, once they’ve set beef‑versus‑dairy and calf‑health rules, is using calving‑ease and gestation length as the next filter:
In herds with heavy winter or early‑spring calving in the Northeast, Great Lakes, and Upper Midwest, producers keep a short list of easy‑calving, shorter‑gestation bulls for dairy matings that will calve into February and March, when calving barns and fresh pens are under the most stress.
In Western dry lot systems, where summer heat is the big enemy, producers avoid long‑gestation bulls on matings that would calve into the hottest weeks and lean instead on sires with moderate gestation and favorable calving‑ease profiles.
You don’t need a complicated spreadsheet to manage this. Just mark a handful of bulls as “tight‑window sires” based on calving‑ease, gestation length, and acceptable production and health traits, and use them where the calendar and weather suggest you can’t afford added calving problems.
Step 5: Keep Re‑Running the Math as Markets Move
The last step—and this is the one that never really ends—is to keep re‑checking whether your thresholds still make sense as markets and costs move around.
Calf prices rise and fall with the beef cycle. Replacement heifer values swing with inventory, feed costs, and interest rates. Milk prices and component premiums fluctuate with supply, demand, and processor product mix. The herds that keep these breeding strategies working don’t treat them as set‑and‑forget decisions.
In practical terms, that looks like:
Watching local calf prices at sale barns, through order buyers, and with any calf contracts, so you know the current spread between dairy bull calves and dairy‑beef calves.
Tracking replacement heifer prices through USDA Cattle on Feed and Cattle Inventory reports, CoBank and other industry analysis, and local auctions, and comparing those numbers against your estimated cost per raised heifer.
Adjusting your beef‑versus‑dairy cutoff as those numbers shift. When dairy‑beef calves are bringing strong premiums and replacements are expensive, a lot of herds are comfortable breeding only the top 30% of cows and heifers (by genomic merit) to dairy semen; if the spread shrinks or they need more replacements, they might widen that to 40%.
One helpful thing about the new calf‑health traits is that USDA‑AGIL has designed them to slot into the same kind of multi‑trait indexes we already use. Because genetic correlations between calf‑health traits and production or fertility are low, you can improve calf health without sacrificing milk, components, or cow survival, as long as you keep using balanced indexes instead of chasing single traits.
What Year One Really Feels Like on the Farm
On a PowerPoint slide, all of this looks tidy. On your own farm, Year One feels a little different.
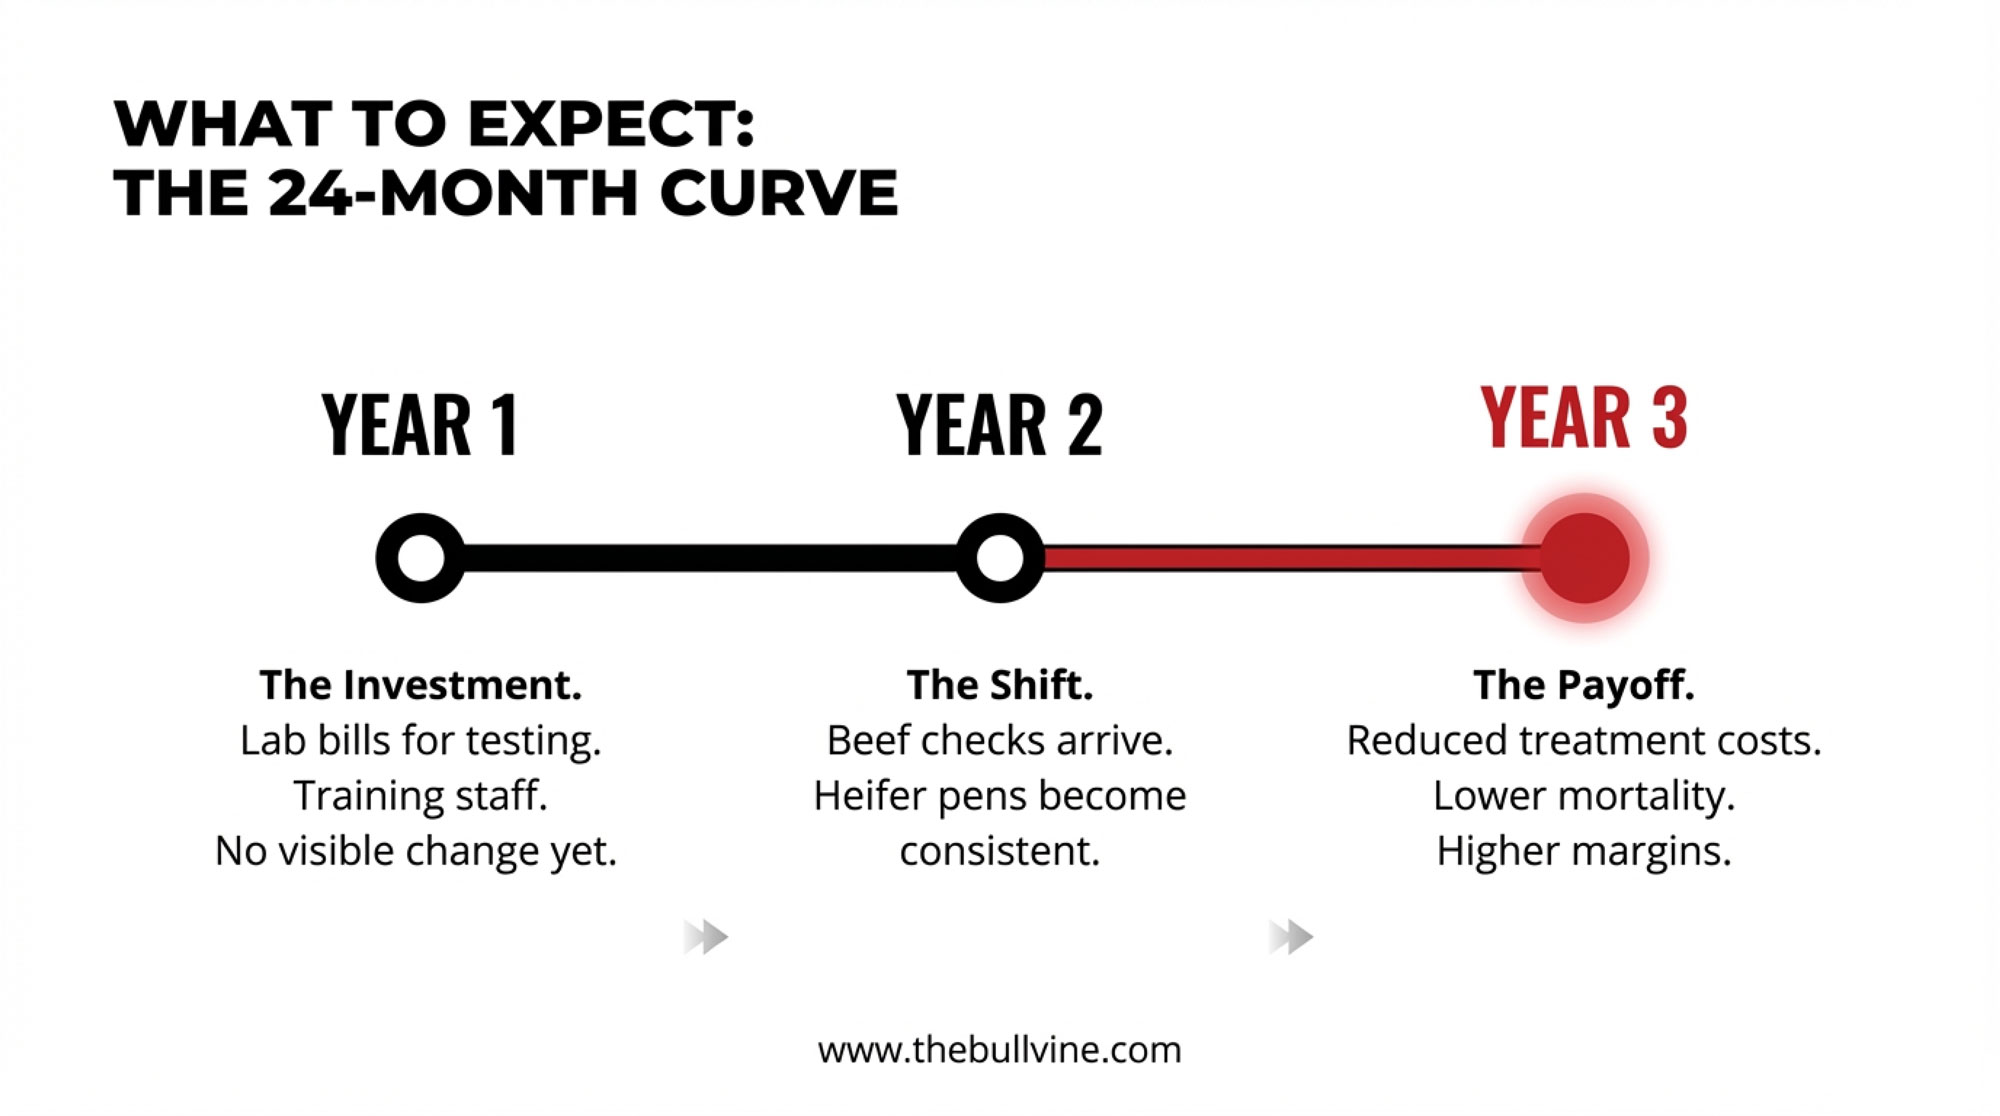
At the start, it’s mostly invoices and extra work:
You’re genomic‑testing heifer calves, and the lab bills arrive long before any calves from your new breeding plan hit the ground.
You’re tightening up calf‑health recording with your vet and staff, which means training, more detailed entries, and a few evenings spent cleaning up your database.
You’re adjusting semen orders—more sexed semen on the top families, more beef semen on the bottom end, fewer “just in case” dairy breedings on cows that were never likely to give you high‑value daughters.
In the calf barn, nothing magical happens overnight. Your heifer pens still look full. Calf checks look familiar. It’s easy to wonder if the effort and expense are worth it.
By mid‑year, a few things usually start to shift:
You may find yourself selling or culling more lower‑merit heifers earlier—especially if you’re long on replacements—which frees up feed, bedding, and barn space.
Pregnancies conceived under the new beef‑versus‑dairy rules are in gestation, but only a handful of calves have actually hit the ground.
On paper, your breeding lists and heifer rankings make more sense. In the parlor and calf barn, daily routines feel largely unchanged.
Late in Year One and into Year Two is where most producers say they start to feel real differences:
Beef‑on‑dairy calves begin arriving as a more uniform, intentional group. You see stronger buyer interest, better feedback from feedlots, and often better average prices.
Your heifer pens gradually tilt toward a more consistent, higher‑index group instead of a random mix of stars and passengers. When those heifers freshen, you notice differences in how they come through the transition period and what they do in first‑lactation milk and components.
If you’ve matched genetics with solid colostrum management, good housing and ventilation, and steady fresh cow management, you often see calf treatment rates and pre‑weaning mortality start to trend in the right direction, similar to what regional calf‑health and barn‑fogging projects have reported when calf environments improve.
Producers highlighted in university extension projects tend to say the same thing: these strategies pay, but the payoff shows up over 18–24 months, not two pay periods. So if you’re going to go down this road, it really helps to think in years instead of months.
Looking Ahead: Getting Ready for Calf‑Health Proofs in the US
Looking at where this is heading, timing matters if you want to be ready.
The USDA‑AGIL work in the Journal of Dairy Science has already shown that calf diarrhea and respiratory traits can be evaluated at a national genomic scale, with usable heritabilities and low correlations with other key traits. USDA‑ARS publications and ICAR genetic evaluation reports have laid out the models and confirm that these calf‑health traits are being prepared for inclusion in US national evaluations for Holsteins and Jerseys.
The Council on Dairy Cattle Breeding has indicated, through meetings and industry communications, that the goal is to add calf‑health traits to the US genetic evaluation system in 2026, once data quality, validation, and governance steps are complete. The exact date will depend on final testing, but the intent is clear enough that seedstock suppliers and AI companies are already watching those traits closely.
Meanwhile, Canada is already using calf‑health RBVs in everyday breeding decisions. Lactanet launched the trait in 2025 and is working it into the Lifetime Performance Index (LPI) and other tools, so Canadian producers now see calf‑health expectations right alongside production, fertility, and cow‑health numbers when picking sires.
If you think about how quickly somatic cell score, daughter fertility, and cow‑health traits became “just part of the proof” once they were introduced, it’s reasonable to expect something similar with calf health. Early on, there will probably be bulls that are quietly excellent on calf‑health traits without a big semen price premium for that advantage. Over time, as more herds use those bulls and see calf‑barn results, market demand and pricing will adjust.
The herds that stand to benefit most from the early years of calf‑health proofs are the ones that:
Already genomic‑test most or all of their heifer calves.
Already have a written rule for which cows get dairy semen and which get beef.
Already work from weekly breeding lists and can easily add one more column when calf‑health numbers show up.
A Practical Game Plan for 2025–2026
If you’re thinking, “This all adds up, but what do I actually do next?”, here’s a straightforward plan you can take back to the office or kitchen table.
1. Build your information base.
Genomic‑test your next one or two calf crops so you can see how big the gap really is between your best and worst heifers on your preferred index.
Sit down with your veterinarian and team and define what counts as a reportable scours case and a pneumonia case on your farm, then make sure those cases are consistently recorded in your herd software.
2. Put a simple beef‑versus‑dairy rule on paper.
For example: “Only cows whose most recent heifer ranks in the top 40% genomically get dairy semen; the rest get beef.”
Plan to revisit that 40% threshold once a year based on calf‑price spreads, replacement heifer values, and your own heifer needs.
3. Talk with your AI and genetics partners about calf‑health traits.
Ask when they expect US calf‑health proofs to show up in their catalogs and computerized mating programs.
Identify a short list of bulls that fit your production and cow‑health goals and are also likely to be above average on calf‑health traits once those numbers are official.
4. Build a weekly breeding list.
Include cows eligible to breed, days in milk, parity, last calving date, and the genomic rank or index of their most recent heifer.
Mark each cow as “dairy” or “beef” based on your rule, then assign bulls from a short list that meet your criteria for production, components, fertility, cow health, calf health (once proofs are live), calving ease, and gestation length.
5. Track a few key metrics over the next 24 months.
Calf diarrhea and respiratory treatment rates, ideally by season.
Pre‑weaning mortality.
Age at first calving for heifers bred under the new system.
First‑lactation milk and component yield, and major health events in that first lactation.
Number and average sale price of beef‑on‑dairy calves.
Total heifer inventory and your best estimate of cost per raised heifer.
If you’re tracking those numbers, you’ll be able to tell whether genomics, beef‑on‑dairy, and calf‑health traits are actually changing the economics on your own farm—not just in theory, but in your barn with your markets.
Different Regions, Different On‑Ramps—Same Core Question
It’s worth saying that not every region, or every herd size, is going to use these tools in exactly the same way.
In Wisconsin, Minnesota, and the Upper Midwest, long winters and naturally ventilated barns make respiratory disease a constant battle. Research supported by the Northern New York Agricultural Development Program and Cornell PRO‑DAIRY has shown that improvements in ventilation, barn‑fogging protocols, and calf‑barn layout can significantly reduce respiratory problems, with scours most common early in the rearing period and pneumonia more common later. Producers there are now layering calf‑health genetics on top of these management changes.
In Ontario and Quebec, where Lactanet calf‑health RBVs are already available, and LPI updates have brought more health and functional traits into the mix, many herds are simply adding calf health to breeding programs that already lean heavily on genomics.
In Western dry lot systems, such as those in California and the Southwest, heat and dust are greater challenges than cold. Work comparing confinement, dry‑lot, and pasture‑based heifer systems has shown that dry‑lot and pasture can lower some costs but demand strong management of shade, airflow, and group size. Producers there are combining calf‑health genetics with shade structures, better airflow, and early‑detection technologies for respiratory disease, plus close relationships with beef buyers who value uniform, high‑health dairy‑beef calves.
On smaller family herds in the Northeast or Great Lakes region, the most realistic first step might be to genomic‑test one year’s worth of heifers, use those results to decide which families get sexed dairy semen and which get beef, and then let the AI company’s mating program start incorporating calf‑health traits as they come into US proofs.
Different barns. Different weather. Different processor relationships and quota setups. But underneath all that, the strategic question you’re trying to answer is the same.
The Bottom Line
When you strip the jargon away, here’s where all of this leads.
We now have solid data showing that calf diarrhea and respiratory disease are common, costly, and heritable enough to improve through genetics. The same infrastructure that gave us cow‑health traits in our indexes is being used to bring calf‑health traits into US proofs, with Canada already showing how calf‑health RBVs can fit alongside production, fertility, and cow‑health information on a bull card.
We also have economic work on calf health, heifer rearing, and calf markets, telling us that:
Direct treatment costs per sick calf stack up quickly.
Serious early‑life disease can pull heifers off their full potential in growth, age at first calving, and first‑lactation performance.
Dairy‑beef cross calves can be a bright spot in the check when milk prices soften.
Replacement heifers are expensive enough that raising the wrong ones is a luxury most farms can’t really afford right now.
The tools—genomics, beef‑on‑dairy, calf‑health proofs—are all coming together just as those pressures peak. And you don’t need a PhD to use them. A simple, consistent five‑step approach—test, sort, decide beef vs dairy, add calf health and calving‑ease filters, and keep re‑running the math—will get you most of the way there.
What I’ve noticed, looking at both the research and what’s happening in real barns, is that we’re moving from a world where calf health was “just management” to one where genetics, markets, and management are all pulling in the same direction.
So maybe the real question for 2026 isn’t “Should I genomic‑test?” or “Should I try beef‑on‑dairy?” Those are just tools.
The bigger question—the one that can easily swing tens of thousands of dollars a year on many dairies—is this:
Given your barns, your local markets, your cash‑flow reality, and the calf‑health genetics coming into proofs, which calves do you truly want more of—and which calves are you better off never making in the first place?
If your breeding plan can answer that clearly, and you’re willing to line up your genetics, your fresh cow management, and your calf program behind that answer, then the next few years offer a real chance to tilt the math of your dairy in your favor quietly.
KEY TAKEAWAYS
Calf-health proofs hit US genetics in 2026. USDA data on 680,000+ calves confirms scours and respiratory resistance are heritable—and selectable.
Sick calves drain $27,000/year from a 1,000-cow herd. That’s treatment, slower growth, and daughters that never reach their genetic potential.
The breeding math has changed. Beef-cross calves are topping $1,000. Heifers cost $2,500+ to raise. Replacements just hit a 20-year low. Every straw matters.
Five steps shift the money your way. Genomic-test heifers. Set a hard beef-versus-dairy rule. Screen bulls for calf health. Manage calving pressure. Re-check the economics quarterly.
Act now, bank returns in 18-24 months. Herds implementing this playbook today can realistically add $50,000+ to their bottom line.
Complete references and supporting documentation are available upon request by contacting the editorial team at editor@thebullvine.com.
Join over 30,000 successful dairy professionals who rely on Bullvine Weekly for their competitive edge. Delivered directly to your inbox each week, our exclusive industry insights help you make smarter decisions while saving precious hours every week. Never miss critical updates on milk production trends, breakthrough technologies, and profit-boosting strategies that top producers are already implementing. Subscribe now to transform your dairy operation’s efficiency and profitability—your future success is just one click away.
64-year low in beef cows. $1,100 dairy-cross calves. 2.5 million replacement heifers. Do the math.
You know how these conversations unfold at producer meetings. Walk into a barn office in Jefferson County, Wisconsin, and somebody’s showing you a $1,100 average on their Angus cross calves. Drive an hour north, and another producer’s working through why he came up short on replacement heifers last spring.
The difference between those two outcomes usually comes down to whether the breeding strategy actually fits the herd’s reproductive performance. That’s precisely what Dr. Victor Cabrera and his team at the University of Wisconsin-Madison have been quantifying—and more recent industry data confirms just how significant this opportunity has become for operations that approach it thoughtfully.
What the Wisconsin Research Reveals
Dr. Cabrera published foundational research in JDS Communications that developed a decision-support model to calculate what he calls “income from calves over semen costs.” His team tested 30 different breeding strategies across three levels of reproductive performance. The results tell you exactly where your herd stands:
High Performance (~30% pregnancy rate): $6,215/month Using sexed semen on first-service heifers, then beef semen on adult cows. Produces adequate replacements while generating substantial calf income for a 1,000-cow herd.
Mid Performance (~20% pregnancy rate): $2,001/month. Requires more sexed semen deployment—on heifers and first-service primiparous cows—before safely shifting to beef semen elsewhere. Still meaningful, but the economics shift considerably.
Low Performance (<20% pregnancy rate): $0 — Not Viable. No economically viable strategy for the use of beef semen exists at this level. These herds struggle to produce enough replacements even under conventional breeding.
The $6,215 performance gap: Wisconsin research reveals high-performing herds (30%+ pregnancy rate) generate 3x more monthly beef-dairy income than mid-tier operations—while low performers can’t viably deploy beef semen at all
That last finding doesn’t get enough attention. It’s not meant to discourage lower-performing herds—it points toward where to focus first. Reproductive fundamentals lay the foundation for beef-on-dairy strategies.
How Widespread Has Adoption Become?
The pace of change since that 2021 research has been remarkable. According to the National Association of Animal Breeders data, domestic beef semen sales to dairy operations reached 7.9 million units in 2023—representing 31% of total semen sales to dairy. A 2024 survey conducted by Purina found that 80% of dairy farmers now receive a premium for beef-on-dairy calves, with reported revenues of $350 to $700 per head above purebred dairy calves.
Farm Bureau data indicates that 72% of dairy farms are now using beef genetics on at least part of their herd—a dramatic shift from just a few years ago. Ohio State University economists estimate that beef-on-dairy could account for 15% of total cattle slaughter by 2026, up from essentially zero a decade ago.
What’s interesting is how this has evolved from an experimental strategy into standard practice for many operations. The question isn’t really whether to participate anymore—it’s how to do it without compromising your replacement pipeline.
Current Market Context
What’s shifted dramatically since the foundational research is the magnitude of the calf price premium. Dr. Cabrera’s original model used a baseline of $225 for beef-cross calves. Current conditions look quite different.
New Holland (PA): $680 to $1,160 per head for beef-cross calves at 60-100 pounds, according to USDA-verified auction reports.
Wisconsin markets: $680 to $1,100 per head for comparable calves.
Ontario: approximately $15 per pound—or $1,500 for a 100-pound calf, as reported by Christoph Wand, OMAFRA’s Livestock Sustainability Specialist, at Ontario Dairy Days earlier this year.
“I can’t even believe I’m saying these numbers,” Wand remarked. “I think I’m talking about blueberries or something.”
Why such strong premiums? The U.S. beef cow herd hit a 64-year low in early 2025 according to USDA data, and industry analysts don’t expect a meaningful recovery before 2028. Feedlots need calves, and beef-on-dairy crossbreds are filling that supply gap.
A recent analysis in Choices Magazine notes that crossbred calves achieve higher quality grades than traditional dairy steers, increasing profitability at the feedlot level and supporting premium pricing for dairy producers.
Markets cycle. These premiums won’t last forever. But the structural dynamics—a multi-year timeline for beef herd rebuilding—suggest the opportunity window remains open for operations ready to act on it.
The Replacement Question
This is where thoughtful planning separates sustainable programs from cautionary tales. A Wisconsin producer who’s been running beef-on-dairy for three years now shared an observation that stuck with me: “The premiums are great, but you can give it all back in one bad heifer-buying spring.”
The Wisconsin model calculated that under optimal conditions (high reproductive performance with strategic sexed-beef deployment), a 1,000-cow herd produces just one extra replacement heifer per month beyond what’s needed to maintain herd size. That’s not much cushion.
Industry consultants generally recommend keeping at least 25-30% of breedings allocated to replacement production. The specific number depends on your culling rate, heifer survival, and how much risk you’re comfortable managing. But the principle holds: protecting your replacement pipeline matters more than maximizing beef-cross production in any single year.
The heifer situation is already critical. USDA data shows dairy heifer inventories expected to calve dropped to 2.5 million head as of January 2025—the lowest level since the agency began tracking this metric. That tightening supply makes the replacement question even more consequential.
One example shared in industry coverage illustrates the risk. A tie-stall operation reportedly shifted too heavily toward beef breedings without accounting for their actual replacement needs. When spring arrived, and heifer prices spiked, the cost to maintain herd size ate significantly into their calf premium gains.
It’s a mistake that’s understandable when you’re looking at $1,000 calves. But the replacement pipeline operates on an 18-24 month lag, and that timeline catches operations who haven’t planned ahead.
Matching Strategy to Your Operation
What makes the Wisconsin research particularly valuable is its recognition that different herds need different approaches. This isn’t one-size-fits-all guidance.
For Higher-Performing Herds (30%+ Pregnancy Rate)
Operations at this level have the most flexibility. The research indicates you can deploy beef semen on most adult cow breedings after using sexed semen on first-service heifers, and you’ll still produce adequate replacements.
Here’s the underlying logic: high reproductive performance typically means you’re already producing surplus dairy heifers under conventional breeding. Many producers in this category know the feeling of watching heifer inventory accumulate or selling springers at less-than-ideal prices. Strategic sexed-beef deployment redirects that surplus into premium beef-cross calves.
This is also where genomic testing—running about $40-50 per head—starts paying dividends. You can identify lower-genetic-merit animals for beef breedings while keeping your best genetics in the replacement pool. Some operations have built this into their standard protocol, and the ROI makes sense when you’re already managing tight replacement margins.
For Mid-Range Herds (20-25% Pregnancy Rate)
A more measured approach makes sense here. The Wisconsin model suggests you’ll need sexed semen on heifers and first-service primiparous cows before shifting later services to beef.
This is where many solid operations sit—not struggling, but without the reproductive cushion that allows aggressive beef semen deployment. Worth remembering that sexed semen typically achieves about 80% of conventional conception rates, so the fertility trade-off factors into replacement planning.
For Herds Working on Fundamentals (Below 20% Pregnancy Rate)
The research points toward a different priority: improving reproductive efficiency first. Each percentage point of improvement in the pregnancy rate expands future opportunities to capture beef-cross premiums.
This is really about sequencing. Focus on transition cow management, fresh cow protocols, and reproductive fundamentals. The beef-on-dairy opportunity will still be there once the herd performance supports it.
Strategy Component
High Performance (30%+ PR)
Mid Performance (20-25% PR)
Low Performance (<20% PR)
Sexed semen on heifers (1st service)
Yes
Yes
Focus on reproduction first
Sexed semen on primiparous cows
No – can skip
Yes (1st service)
Focus on reproduction first
Beef semen on adult cows
Yes – most breedings
Yes – later services only
Not viable
Replacement allocation minimum
25-30%
30-35%
All breedings
Genomic testing ROI
High – target low-merit
Moderate – selective use
Not priority
Monthly net calf income (1000-cow herd)
$6,215
$2,001
$0
What’s Working in Practice
Several patterns keep emerging in conversations with producers successfully implementing these strategies.
Genomic-guided breeding decisions have become increasingly common. At $40-50 per head, genomic testing provides concrete data for targeting beef breedings rather than guessing about genetic merit. One producer described it as “taking the emotion out of breeding decisions”—and there’s something to that.
Protocol consistency matters more than protocol sophistication. Operations that capture full premiums aren’t necessarily complicated—they do the same thing every week. Written protocols, consistent execution, and regular review.
Buyer relationships are evolving. Packers and feedlots increasingly want traceable genetics and documented health records, paying premium prices. Operations that provide vaccination records, colostrum protocols, and weight documentation are building relationships that hold value when markets tighten.
Regional Considerations
Market premiums vary by region, and that variation affects strategy. Pennsylvania’s New Holland market shows some of the strongest beef-cross prices, driven partly by veal demand and feedlot connections. Upper Midwest markets in Wisconsin and Minnesota have been solid but show more week-to-week variability.
California operations have also seen significant adoption, with California Dairy Magazine recently covering emerging data on the value beef-dairy crossbreds bring to the supply chain. The state’s large-scale operations have been early adopters of systematic breeding protocols.
Texas has been particularly notable—according to Texas A&M AgriLife and USDA data, the state recently added 50,000 dairy cows, with complementary beef-on-dairy programs contributing to strong production gains. The Southwest’s integration with regional feedlot infrastructure creates natural marketing channels.
Producers closer to feedlot concentrations in the Central Plains sometimes see slightly lower premiums but more consistent demand. If you’re running a smaller operation, understanding your local market dynamics helps calibrate how aggressively to deploy beef semen.
Geography matters: Ontario leads at $1,500 per calf, while Pennsylvania’s New Holland market delivers the widest U.S. range ($680-$1,160)—regional feedlot connections and veal demand drive the spread
Putting the Numbers in Perspective
Under 2021 baseline prices ($225 beef-cross calves), the Wisconsin model showed breakeven prices of just $69 per head for high-performing herds and $100 per head for medium-performance herds. Current prices running $700-1,100 sit well above those thresholds.
That margin provides some comfort. Even if beef-cross premiums decline by 50% from current levels, the economics still favor strategic use of beef semen in herds with adequate reproductive performance.
The research team’s sensitivity analysis found that optimal strategies remained consistent across most feasible market scenarios. What changes isn’t whether to use beef semen, but how much and on which animals.
Before Your Next Breeding Cycle
Critical Decision Point
What 72% Are Doing
What Wisconsin Research Says
The Gap
Pregnancy rate baseline
Guessing or using targets
Actual rolling 12-month 21-day PR
Most overestimate by 5-8%
Replacement allocation
15-20% of breedings
25-30% minimum to protect pipeline
Leaves zero margin for error
Beef semen deployment
“As much as possible”
Strategic by service number & cow type
Burn through replacements
Calf pricing strategy
Take spot market price
Build feedlot/packer relationships
Leave $150-$300/head on table
Genomic testing
Skip it – too expensive
$40-50/head pays dividends at scale
Miss precision breeding gains
Breakeven awareness
Assume current premiums last
Know exact threshold ($69-$100)
Vulnerable to market cycles
Review your actual calf sale data. What premium are you actually receiving for beef-cross versus straight dairy? If it’s below $350 per head, it’s worth investigating whether it’s pricing, timing, or buyer relationships.
Calculate your current pregnancy rate honestly. Use your actual rolling 12-month 21-day pregnancy rate—not your target. This single number largely determines which strategies fit your operation.
Run your replacement pipeline numbers. Count heifers by age group and compare against your culling rate. Are you producing 25-30% more replacements than you need? If not, be conservative on beef semen deployment.
With 72% of dairy farms now using beef genetics, according to Farm Bureau data, the practice has shifted from innovative to expected. Current premiums reflect a beef supply situation that won’t resolve quickly—the smallest cow herd in 64 years doesn’t rebuild overnight.
The producers succeeding with beef-on-dairy share a common approach: they matched their strategy to their actual reproductive performance, protected their replacement pipeline, and built buyer relationships that hold value beyond the current premium cycle.
The market is paying you to be smart, but it will punish you for being short. Run your numbers through the DairyMGT.info calculator before your next breeding setup—because $1,000 calves don’t fix an empty heifer barn.
Key Takeaways
Know your tier. Wisconsin research tested 30 strategies: 30%+ pregnancy rate = $6,215/month. 20-25% = $2,001/month. Below 20% = not viable.
Protect the pipeline. Heifer inventories are at record lows (2.5M head). Keep 25-30% for replacements—$1,000 calves don’t fix an empty heifer barn.
Margins are historic—for now. Beef-cross calves are selling for $680-$1,160, vs. a breakeven of $69-$100. Even a 50% price drop works for high performers.
Three numbers determine your strategy: the actual 21-day pregnancy rate. Replacement allocation (25-30%). Genomic cutoff for beef breedings ($40-50/test).
Run the math. Free DairyMGT.info calculator shows which strategy fits your herd before you commit.
EXECUTIVE SUMMARY
Beef-cross calves are selling for $680-$1,160, and 72% of dairy farms have jumped into beef-on-dairy, but University of Wisconsin research reveals most are flying blind. Dr. Victor Cabrera’s team tested 30 breeding strategies and found the economics split sharply: herds at 30%+ pregnancy rate can generate $6,215 monthly in net calf income, while herds below 20% pregnancy rate have no viable beef semen strategy at all. The margin for error is vanishing. The U.S. beef cow herd sits at a 64-year low, dairy heifer inventories hit a record low of 2.5 million head, and one aggressive breeding cycle can erase a year of calf premiums in a single heifer-buying spring. The research points to one approach: know your pregnancy rate, protect your replacement pipeline, and run your numbers through the free DairyMGT.info calculator before your next setup. The market is paying for precision—$1,000 calves don’t fix an empty heifer barn.
The underlying research (Cabrera, 2021) was published in JDS Communications and is available through PubMed Central.
Complete references and supporting documentation are available upon request by contacting the editorial team at editor@thebullvine.com.
Learn More:
The Beef-on-Dairy Wake-Up Call: What Some Farms Are Still Missing – Reveals why holding onto “Holstein purity” is costing herds thousands and details how to implement a genomic testing protocol to accurately identify the bottom 30% of cows for terminal beef breeding.
Join over 30,000 successful dairy professionals who rely on Bullvine Weekly for their competitive edge. Delivered directly to your inbox each week, our exclusive industry insights help you make smarter decisions while saving precious hours every week. Never miss critical updates on milk production trends, breakthrough technologies, and profit-boosting strategies that top producers are already implementing. Subscribe now to transform your dairy operation’s efficiency and profitability—your future success is just one click away.
A $9.50 milk price sounds great—until you see the $8.50 break-even. NZ’s one-dollar margin is a wake-up call for dairy farmers everywhere.
Executive Summary: When the world’s lowest-cost milk producers are farming on a dollar of margin, that’s a wake-up call for dairy everywhere. New Zealand’s December 2025 numbers: $9.50/kgMS milk price, $8.50 break-even, one dollar left for debt, drawings, and reinvestment. They’re not alone. Teagasc projects Irish dairy incomes dropping 42% in 2026. UK farmgate prices have fallen below production costs. Rabobank calls global output growth ‘stunning’—the very oversupply compressing margins worldwide. And China’s shift from aggressive importer to tactical buyer has removed the demand safety valve the industry once counted on. The old formula—high prices equal comfortable margins—no longer holds. The farms that make it through will be those building resilience now: feed efficiency, component focus, diversified revenue, right-sized debt. Not growth for growth’s sake. Strategic survival.
When the world’s lowest-cost milk producers are working on about one dollar of operating margin per kilogram of milk solids, that’s worth every dairy farmer’s attention.
That’s exactly where New Zealand finds itself heading into 2026.
Here’s what makes this relevant beyond the Pacific: it’s essentially a real-time stress-test of the global dairy model. From Wisconsin freestalls to Irish grass paddocks to Canterbury’s irrigated pastures, the underlying question is the same.
If New Zealand’s efficient pasture systems can’t maintain comfortable margins at these milk prices, what does that mean for the rest of us?
The narrative has shifted. It’s less about waiting for the next price spike and more about adapting to a new reality—one defined by persistent cost pressure, cautious global buyers, and markets that recover more slowly than they used to.
Understanding the One-Dollar Margin
DairyNZ’s December 2025 Economic Update paints a clear picture.
Farm working expenses have climbed 16 cents to $5.83 per kgMS. Meanwhile, Fonterra revised its 2025-26 farmgate milk price forecast down to a midpoint of $9.50 per kgMS—a notable drop from the earlier $10.00 projection.
DairyNZ puts the break-even milk price for an average reference farm at around $8.50 per kgMS.
That leaves roughly a dollar per kgMS as operating surplus. And that’s before capital repayments, family drawings, or any reinvestment.
Metric
2024-25 Season
2025-26 Season
Change
Milk Price ($/kgMS)
$10.00
$9.50
-$0.50
Break-even Cost ($/kgMS)
$8.34
$8.50
+$0.16
Operating Margin ($/kgMS)
$1.66
$1.00
-$0.66
Farm Working Expenses ($/kgMS)
$5.67
$5.83
+$0.16
Interest Costs ($/kgMS)
$1.46
$1.11
-$0.35
Tracy Brown, DairyNZ’s chair and herself a Waikato dairy farmer, offered some measured perspective in their December update: “Profit is still on the table, but the margin gap has clearly tightened, and that means every spending decision on farm needs a harder look.”
That’s a statement worth sitting with.
What This Looks Like on a Real Farm
Think about a fairly typical New Zealand herd—400 cows producing 400 kgMS each. That gives you 160,000 kgMS for the season.
At $9.50 per kgMS, gross milk revenue comes to about $1.52 million NZD. With a break-even point of around $8.50, core operating costs consume roughly $1.36 million.
That leaves approximately $160,000 NZD of operating surplus.
On paper, that’s profit. But reality includes broken gates, aging tractors, and family obligations. The buffer is much thinner than the headline suggests.
I recently spoke with a consultant who works across both New Zealand and Australian operations. His observation: for a 200-cow farm, that surplus might only be $80,000 NZD before tax and drawings. For a 2,000-cow operation, you’re looking at roughly $800,000—but spread across substantially higher fixed costs and larger teams.
Farm Size
Production (kgMS)
Gross Revenue
Operating Costs
Operating Surplus
Margin Per Cow
200 cows
80,000
$760,000
$680,000
$80,000
$400
400 cows
160,000
$1,520,000
$1,360,000
$160,000
$400
2,000 cows
800,000
$7,600,000
$6,800,000
$800,000
$400
The ratio matters more than the headline number. Whether you’re milking 200 or 2,000, everyone’s working with a narrower buffer.
The Takeaway: A $9.50 milk price sounds strong. But with $8.50 break-evens, you’re farming on a dollar of margin—and that dollar has to cover everything else.
Tracing the Cost Increases
Where exactly did those 16 cents go? Understanding the drivers makes them easier to address.
DairyNZ’s Econ Tracker identifies three primary contributors.
Cost Category
Increase (¢/kgMS)
400-Cow Farm Impact
Controllability
Feed Costs
+7¢
+$11,200
Medium – Nutrition strategy
Fertiliser
+4¢
+$6,400
Low – Global commodity
Electricity/Irrigation
+2¢
+$3,200
Low – Fixed infrastructure
Wages
+2¢
+$3,200
Low – Labour market
Repairs/Maintenance
+1¢
+$1,600
Medium – Defer vs invest
Compliance
+1¢
+$1,600
None – Regulatory
Other Operating
-1¢
-$1,600
Variable
TOTAL
+16¢
+$25,600
—
Feed costs have risen meaningfully year-on-year across most categories. Palm kernel has been somewhat more stable, but grain and purchased roughage have risen noticeably.
Fertiliser continues to pressure budgets. Phosphate and urea prices remain elevated, driven by energy market dynamics and export restrictions from major suppliers. Teagasc’s Outlook 2026 suggests costs will climb further as the EU Carbon Border Adjustment Mechanism takes effect.
Other operating costs—repairs, freight, wages, fuel, compliance—have all experienced inflation.
The encouraging news? DairyNZ reports that interest costs are easing. Payments are forecast to drop about 35 cents to $1.11 per kgMS for 2025-26.
The catch? Those interest savings are largely offset by increases elsewhere. The budget might show relief on one line, but feed, fertiliser, and operating costs are absorbing it.
For a 200-cow farm, this might mean choosing between replacing an ageing parlour component or making do with repairs. On a 2,000-cow dry-lot operation, it could be the difference between upgrading a feed mixer or deferring that decision another year.
The Takeaway: Feed and fertiliser are eating your interest rate savings before you ever see them.
The Production Paradox
This is where the situation becomes counterintuitive.
New Zealand is currently in its spring flush. DairyNZ reports national milk collections running about 3.4% ahead of last season, with August and October 2025 volumes among the highest on record.
South Island production in October was up 5.7% year-on-year. Customs data shows palm kernel imports are up significantly—a clear indicator that farmers leaned into purchased feed to boost production.
Why does this matter? Because the same pattern is playing out across multiple dairy regions simultaneously.
I’ve been following similar trends in US and European coverage. Where corn or by-products are relatively affordable, there’s considerable temptation to push cows harder to maintain cashflow. Especially when fixed obligations don’t adjust downward just because your milk price does.
At the individual farm level, this appears entirely rational. If you’ve already invested in the parlour, the effluent system, and the bank financing, pushing a few more kilograms through spreads those fixed costs.
But collectively? When New Zealand, the US, Ireland, and parts of Europe all make that same calculation simultaneously, you end up with what Rabobank’s December 2025 commentary described as “stunning” global output growth.
Region
2026 Growth Forecast
Impact on Global Supply
Argentina
+4.0%
Aggressive expansion continues
United States
+1.3%
Steady growth despite tight margins
New Zealand
+1.0%
Spring flush pushing volumes
European Union
0.0%
Only major exporter hitting brakes
That additional milk is precisely why price forecasts have moderated.
A Midwest producer I spoke with recently put it simply: “We’re not trying to grow anymore—we’re trying to survive long enough to see the other side.”
The Takeaway: What makes sense on your farm might be making things worse for everyone—including you.
Regional Perspectives
New Zealand’s experience offers the clearest current signal. But similar pressures are emerging across other major dairy regions.
Region
Current Margin (2025)
2026 Forecast
Key Pressure Point
Competitiveness
New Zealand
+$1.00/kgMS
Tight ($0.80-1.00)
Feed & fert eating savings
High — Pasture based
Ireland
€0.115/L
Severe (-45%)
Butter price collapse
Medium — Scale challenges
United Kingdom
Below cost (38.5p/L)
Further pressure
Commodity liquid pricing
Low — High costs
United States (DMC)
Above $9.50/cwt
Stable (low feed)
Production growth
Variable — Regional
European Union
Squeezed — varied
Contraction likely
China probe uncertainty
Medium — Policy support
Ireland: Preparing for a Correction
Teagasc’s Outlook 2026 projects that average Irish dairy farm incomes could decline by approximately 42% in 2026. That would take the average income from an estimated €137,000 this year to around €80,000.
Their baseline anticipates milk prices moderating from the high-40s cent per litre range back toward approximately 42 cents.
At 11.5 cents per litre, the average dairy net margin in 2026 is forecast to be down 45% from 2025 levels.
For a 70-hectare, 100-cow family farm, cash surplus after drawings and loan repayments could drop from around €80,000 to closer to €45,000.
That’s manageable if the debt is moderate. For operations that expanded aggressively, the adjustment will be sharper.
The UK: Below-Cost Production
Recent market data shows that farmgate milk prices have fallen below full production costs for many operations.
As of late 2025, Arla’s conventional price sits around 39.21 pence per litre. Müller’s Advantage price drops to 38.5ppl from January 2026.
Industry estimates place all-in production costs closer to the 40-45ppl range.
The picture varies by contract type. Producers on cheese or retailer-aligned arrangements often fare better. But in the commodity liquid segment, some operations are producing milk at a level below full economic cost.
Processors have responded by shifting toward component-based and fixed-volume contracts. Retailers continue to prioritise competitive shelf prices, putting pressure on producers’ margins.
The US: Regional Variations
The American experience differs due to policy structure—and substantial regional variation.
The Dairy Margin Coverage programme has provided meaningful support. The University of Wisconsin Extension reports that through the first ten months of 2023, DMC distributed over $1.27 billion in indemnity payments. That averaged approximately $74,453 per enrolled operation, with around 17,059 dairy operations participating.
But the experience varies dramatically by region.
In California, water costs and environmental compliance add layers of expense that Midwest operations don’t face. Wisconsin operations are navigating processor consolidation and volatility in the cheese market. Northeast producers face declining fluid milk demand and processing capacity constraints.
Larger US herds—1,000 cows and above—are increasingly relying on scale economies and diversified revenue streams. Beef-on-dairy programmes, heifer development, and energy projects are becoming standard.
The Takeaway: The squeeze is global, but every region has its own version. Know your local dynamics.
The China Factor
For two decades, much of dairy’s long-term optimism rested on a straightforward assumption: China would continue buying more.
That assumption deserves recalibration.
New Zealand Treasury’s 2024 dairy exports analysis, Rabobank’s global outlooks, and trade reports identify three meaningful shifts.
Product Category
2021 Imports (MT)
2024 Imports (MT)
Change
Trend
Whole Milk Powder
1,680,000
740,000
-56%
Domestic production surge
Milk Powder (Total)
2,580,000
1,360,000
-47%
Structural decline
Skim Milk Powder
900,000
620,000
-31%
Domestic substitution
Whey
480,000
380,000
-21%
US tariff impact
Cheese
140,000
170,000
+21%
Foodservice growth
Butter
110,000
135,000
+23%
Bakery sector expansion
Domestic production has expanded substantially. China has invested heavily in large-scale dairy operations. This is structural import substitution, not a temporary measure.
Per-capita consumption growth has moderated. Dairy consumption continues trending upward, but at slower rates than during the expansion years. The steepest part of the adoption curve appears behind us.
Purchasing behaviour has become tactical. Chinese buyers now step back when prices strengthen and increase purchases when value emerges—rather than consistently supporting auctions.
China remains a vital market. But it’s no longer the automatic release valve that absorbs surplus production.
The Takeaway: Don’t count on China to bail out oversupply anymore. That era is over.
What Farmers Are Actually Doing
When margin discussions move from conferences to kitchen tables, what are producers actually changing?
Managing Through Feed
In New Zealand, palm kernel imports are up significantly. Many farmers chose to push production while payout expectations remained near $10/kg MS.
Similar decisions are playing out in US operations where corn and by-products remain relatively affordable.
The logic is straightforward: when principal payments and family expenses don’t flex with milk price, spreading fixed costs across more production can appear to be the only short-term lever.
Strengthening Balance Sheets
New Zealand’s Ministry for Primary Industries notes that some farmers used the strong 2021-2023 payouts to reduce debt rather than adding infrastructure.
That decision is looking increasingly prudent.
On a 200-cow farm, this might translate to directing an extra $20,000 annually toward debt reduction rather than equipment upgrades. On a 2,000-cow operation, it could mean restructuring short-term facilities into longer-term arrangements.
Diversifying Revenue
Beef-on-dairy has become mainstream. Industry analyses suggest crossbred calves can add $100-200 per cow annually, depending on local markets.
Sustainability-linked premiums are emerging as processors develop payment structures tied to documented environmental outcomes.
Even modest additional revenue streams—$50,000-$100,000 annually on a mid-sized operation—can make a meaningful difference when the milk cheque alone isn’t covering the spread.
The Takeaway: Smart operators aren’t just cutting costs. They’re restructuring debt and finding new revenue.
Strategy
Short-Term Cashflow
Margin Impact
Risk Level
Best For
Push Production (Palm Kernel)
Improved
$0.85/kgMS
High — Adds to oversupply
High debt, large scale
Cut Costs Aggressively
Preserved
$1.15/kgMS
Medium — Quality risks
Medium farms, low debt
Maintain Status Quo
Squeezed
$1.00/kgMS
High — Thin buffer
No flexibility
Reduce Debt First
Reduced
$1.00/kgMS
Low — Future flexibility
Strong balance sheet
Strategic Levers by Scale
Even in challenging margin environments, individual operations retain meaningful levers. They won’t shift global prices, but they determine which side of the margin line you occupy.
Feed Efficiency and IOFC
Research consistently documents substantial variation in feed efficiency—both between herds and within individual herds.
Fresh cow protocols that establish strong intake patterns during those critical first 30-60 days
Active use of income over feed cost metrics as management tools, not retrospective reports
Getting started: On smaller operations, work with a nutritionist to develop simple IOFC reporting by production group. On larger TMR operations, establish monthly review rhythms to identify underperforming groups.
Component Value Capture
As payment systems emphasise solids over volume, butterfat and protein percentages deserve strategic attention.
The value ranges from 75 cents to $1.25 per hundredweight in many component-based systems, even at equivalent volume.
Getting started: Talk with your AI representative about reorienting sire selection toward fat and protein kilograms. Pair that with a nutritionist input on optimising rumen health, not just energy delivery.
Beef-on-Dairy Integration
This has evolved from a niche strategy to standard practice.
Getting started: Begin with market research. Talk with calf buyers about which terminal breeds and calving ease profiles actually command premiums in your area.
Financial Structure
What research keeps showing—across EU and Latin American farms alike—is that how you structure debt often matters as much as how efficiently you produce.
Getting started: Have proactive lender conversations before cash flow challenges emerge. Walk through three-year projections under multiple price scenarios.
The Takeaway: You can’t control global milk prices. But you can control feed efficiency, component focus, revenue diversity, and debt structure.
Strategy
Immediate Impact
1-Year Margin Gain
Resilience
Capital Required
Feed Efficiency Focus
Moderate — Slow gains
+$0.10-0.20/kgMS
High — Permanent
Low — Nutrition/management
Component Optimization
Moderate — Genetic lag
+$0.15-0.25/kgMS
High — Permanent
Low — Semen/consulting
Beef-on-Dairy Integration
High — Instant revenue
+$0.08-0.15/kgMS
Medium — Market dependent
Low — Contract only
Aggressive Debt Reduction
Low — Reduces cashflow
$0/kgMS
Very High — Future flexibility
High — Requires surplus
Volume Push (Status Quo)
High — Spreads fixed costs
-$0.05 to +$0.05/kgMS
Low — Worsens oversupply
Moderate — Feed purchases
What Could Actually Change Things?
If current margin pressure is structural, what developments might shift the trajectory?
Genuine supply contraction would require sustained exits that actually reduce production capacity. We’re seeing accelerating consolidation in parts of Europe, the UK, and Australia. It’s unclear whether the pace is sufficient.
Emerging market demand growth offers longer-term potential in Southeast Asia, Africa, and Latin America. But developing those markets takes time.
Policy and structural changes—such as transition support, improved risk-sharing between processors and producers, and trade agreements—could shift the environment. But political processes move slowly.
None of these are quick fixes. But understanding the possibilities helps inform longer-term positioning decisions.
Key Takeaways
Price levels don’t ensure margin. A $9.50 per kgMS payout with $8.50 break-evens means strong prices can coexist with tight margins.
Volume gains require margin verification. More production can support cashflow while contributing to oversupply. Check IOFC, not just output.
Input decisions carry strategic weight. Feed and fertiliser now warrant careful analysis, not routine repetition.
Revenue diversification has moved mainstream. Beef-on-dairy and sustainability premiums are standard elements, not experiments.
Financial structure shapes survival. Operations that reduced debt during good years enter this period with more flexibility.
Opportunity persists, but looks different. More competition, more selective buying, more scrutiny. Adapt or get squeezed.
The Bottom Line
No individual farm can resolve global oversupply. No policy will quickly restore previous comfort levels.
But careful attention to what New Zealand’s numbers reveal—and thoughtful application regardless of region or scale—can improve the odds of staying on the right side of that one-dollar margin line.
The farms that thrive in 2030 are making decisions right now. Not necessarily to get bigger. But to get more resilient, more diversified, more intentional about where margin actually comes from.
Complete references and supporting documentation are available upon request by contacting the editorial team at editor@thebullvine.com.
The Wall of Milk: Making Sense of 2025’s Global Dairy Crunch – Provides a deep dive into the “24-month trap” of global oversupply, explaining why export records aren’t saving prices and how to position your operation against the structural shift in Chinese demand.
Join over 30,000 successful dairy professionals who rely on Bullvine Weekly for their competitive edge. Delivered directly to your inbox each week, our exclusive industry insights help you make smarter decisions while saving precious hours every week. Never miss critical updates on milk production trends, breakthrough technologies, and profit-boosting strategies that top producers are already implementing. Subscribe now to transform your dairy operation’s efficiency and profitability—your future success is just one click away.
$3.71 butterfat in 2023. $1.70 today. Same cows. Different math. Different future.
Executive Summary: Butterfat crashed 54%—from a record $3.71/lb in October 2023 to $1.70 today. Beef-on-dairy calves now bring $1,400; dairy bulls, maybe $800. This isn’t a down cycle. It’s the year global oversupply, China’s growing self-sufficiency, and processor consolidation collided—and the old playbook stopped working. For 300-800 cow operations, the math is forcing real choices: scale hard, capture niche premiums, or use beef-on-dairy as a planned exit over 3-5 years. This analysis delivers the diagnostic tools—breakeven thresholds, debt ratios, the five questions to ask your lender—alongside an honest look at the mental health stakes when “just hang on” becomes dangerous advice. Waiting isn’t a strategy. It’s a decision by default.
You know, looking at 2025, a lot of producers are saying the same thing over a cup of coffee: “On paper this shouldn’t be a disaster year… so why does it feel like one?” Class III futures are hovering around $17/cwt according to the latest CME data. Butterfat premiums have been cut nearly in half from their 2022–2023 peaks—USDA component pricing shows we’ve gone from above $3.00/lb down to $1.70. And here’s the kicker: beef-cross calves are commanding $1,400 a head in organized sales while the milk check shrinks.
Milk is still moving. Dairy demand hasn’t fallen off a cliff. Some export numbers even look decent based on what Rabobank’s been reporting. Yet plenty of 300–800 cow herds are staring at negative cash flow, higher debt from 2024 expansions, and kids who aren’t sure they want in.
The sentiment among multi-generation producers is a familiar one these days. They followed the signals. They invested when they were supposed to. And now many are questioning whether the playbook has fundamentally changed.
What farmers are finding is that 2025 isn’t just another low-price year. It’s the year a lot of long-standing assumptions got stress-tested all at once—about global demand, butterfat premiums, beef-on-dairy, and how much processing steel the system can really keep full. So let’s walk through what the data and real-world stories are showing us, and what that means for the mid-sized commodity herds feeling the squeeze the most.
“2025 isn’t just another low-price year. It’s the year a lot of long-standing assumptions got stress-tested all at once.”
The Year Everyone Hit the Gas at the Same Time
If you step back and look at global numbers, the first big lesson is simple: we managed to grow milk almost everywhere at once.
Rabobank’s late-2024 and 2025 global outlooks flagged something that probably should have gotten more attention. After several years of very modest growth, combined milk output from the major exporting regions—the “Big 7” of the US, EU, New Zealand, Australia, Brazil, Argentina, and Uruguay—was back in positive territory. On an annualized basis, Rabobank forecasts 2025 milk production from the Big 7 at 326.7 million metric tons—approximately 1–1.6% higher year-on-year, depending on the quarter measured—the highest annual volume gain since 2020.
Here’s why 2025 feels different: every major dairy exporter is growing production simultaneously—US, EU, New Zealand, Brazil, all in positive territory. That hasn’t happened since 2020. When the whole world expands at once and China stops absorbing the surplus, you get structural oversupply. This isn’t a down cycle. It’s a fundamental reset of the global dairy balance
United States: Volume on Top of Volume
USDA data shows the US dairy herd creeping back up toward 9.4–9.5 million cows by mid-2025, after earlier contraction. States like Texas, Kansas, and South Dakota led the way—in some periods, Texas was up by over 10% and Kansas by nearly 19%, according to USDA livestock reports. Monthly production in the first half of 2025 was regularly running several tenths of a percent to a few percent above the year before.
Here’s what’s interesting about where that growth landed. A lot of it didn’t go back into small parlor barns in traditional dairy counties. It went into dry-lot systems and large freestall complexes, specifically designed to handle high volumes of standardized milk for specific plants.
This creates a split reality we don’t talk about enough. In Texas and Kansas, expansion is still penciling out for operations built around $16 milk and economies of scale. Meanwhile, traditional dairy states like Wisconsin, New York, and Pennsylvania face a different equation entirely—higher land costs, older facilities, tighter environmental rules, and processors who may be more interested in sourcing from the new mega-plants out west.
California sits in its own category. Still a production giant, but increasingly constrained by water policy under SGMA and labor costs that have pushed some herds to relocate or downsize. Same industry, very different local math.
Europe and Oceania: Back in Expansion Mode
On the other side of the Atlantic, 2024 forecasts projected stable-to-slightly higher EU milk deliveries as margins improved from earlier lows. Ireland, Poland, and some German regions have all contributed to that uptick, offsetting declines in more constrained zones.
In New Zealand, Fonterra’s updates through late 2024 and 2025 pointed to milk collections running 2–4% ahead of the prior season in some periods. Reasonable pasture growth and a farmgate price forecast that—while trimmed at times—still kept most herds milking hard. Add in recovering output in Brazil and Argentina, and global trade reports going into 2025 were pretty consistent: exportable milk supply was growing again across the big players at the same time.
That’s our backdrop. Now layer on demand.
When the “China Safety Valve” Stopped Working the Way It Used To
For close to a decade, a lot of quiet boardroom confidence in export expansion could be summed up in one thought: “If we’re a little long on powder or whey, China will take it.” That was never entirely true, but it was true enough to guide a lot of investments.
Recent Chinese dairy outlooks from the USDA’s Foreign Agricultural Service tell a different story. Over the last several years, Chinese raw milk production has risen steadily, backed by large-scale commercial dairies and improved fresh cow management. At the same time, Chinese imports of some dairy commodities have flattened or declined—particularly whole milk powder—as domestic supply fills more of the pipeline.
Rabobank Research highlighted that net dairy product import volumes in 2024 fell by 12% from a year earlier, with skim milk powder imports dropping by nearly 37% according to their December 2024 analysis. Chinese buying is still important, but it’s no longer the automatic “pressure release” it once seemed to be.
So in 2025, we have more exportable milk from the US, EU, New Zealand, and South America… and a key customer that’s now partly replacing imports with its own production. The world is less forgiving of synchronized overproduction than it was ten years ago.
How the Component Story Flipped on High-Butterfat Herds
Now let’s zoom back into the bulk tank.
Here’s the supply crisis nobody’s talking about: butterfat production is exploding at 5.3% while milk volume crawls at 0.5%. That 10x divergence explains why cream buyers have the upper hand and why your high-fat breeding strategy from 2020 is now crushing your margins. Volume numbers lie—component pounds tell the truth
For most of the last decade, breeding and feeding for top-end butterfat performance was one of the clearest, most rational strategies available. Butter prices were strong. Fat-based milk pricing rewarded high tests. Nutrition and genetics teams encouraged ration tweaks and sire selection that reliably bumped herd butterfat 0.2–0.4 points over time.
And you know what? It worked beautifully. According to Federal Milk Marketing Order data reported by USDA, butterfat saw five consecutive months of record-breaking prices in 2022, from June to October, with prices ranging from $3.33 to $3.66 per pound. Then in October 2023, butterfat hit a new summit of $3.7144 per pound—an all-time record.
The Great Butterfat Crash reveals the brutal math facing dairy producers: a 54% price collapse from $3.71 to $1.70 per pound while protein stayed steady. This isn’t a cycle—it’s a structural reset that makes every breeding and feeding decision from the last decade suddenly obsolete
Not surprisingly, farmers responded. By late 2023, commentaries from US economists and industry consultants noted that national butterfat production had grown faster than protein output as herds and rations adjusted to these incentives. We did exactly what the market told us to do.
2025: Butterfat Comes Back to Earth
By late 2025, that story had changed dramatically. USDA’s November 2025 component price announcement shows butterfat at $1.7061 per pound—down more than 54% from that October 2023 peak. November butterfat fell almost 12 cents from October and was $1.20 less than the $2.91 per pound value from one year ago. Protein, meanwhile, has held steadier at $3.01 per pound according to USDA Dairy Market News.
One ag economist told Brownfield in October 2025 that US producers should pay more attention to protein going forward, because relative protein value was expected to play a larger role in milk checks than in recent years.
For herds that had pushed bulk tank fat to 4.3–4.5% and beyond, this doesn’t mean they were “wrong.” But it does mean the payback period on those genetic and ration decisions suddenly got longer.
What’s important to understand—and I think this gets missed sometimes—is that you can’t “un-breed” a cow in a year. It takes two or three calf crops, plus solid fresh cow and transition management, to materially shift the herd’s component profile. That lag is exactly why many producers started looking for a faster-acting lever to help the milk check in 2025: the beef-on-dairy calf.
Beef-on-Dairy: From Extra Cash to Core Margin Tool
If you want to see how quickly economics can reshape breeding philosophy, just look at the 2025 calf markets. According to Laurence Williams, dairy-beef cross development lead at Purina Animal Nutrition, beef-on-dairy calf prices averaged about $650 three years ago, compared to today’s average of $1,400 for day-old beef-on-dairy calves. A 2025 report puts current prices at $1,000 to $1,500 per head, driven by strong demand for high-quality beef and tight supplies.
Beef-on-dairy calves exploded from $650 to $1,400—a 115% gain that’s rewriting the dairy business model. Meanwhile, replacement heifers jumped 58% to $2,850, creating a profitability squeeze that forces every producer to recalculate their breeding strategy. The question isn’t whether to use beef semen anymore—it’s how much
Year
Beef on Dairy Calf Price
Holstein Bull Calf Price
Replacement Heifer Price
2022
650
50
1800
2023
900
150
1990
2024
1200
600
2400
2025
1400
800
2850
Meanwhile, even Holstein dairy bull calves—once nearly worthless—can today fetch as much as $10 per pound at auction because of historically high beef prices, according to Christoph Wand, livestock sustainability specialist with Ontario’s Ministry of Agriculture, Food and Rural Affairs. But a dairy-beef crossbred animal commands about 50% more.
Academic and extension work backs up the economic case. A 2021 analysis in JDS Communications found that when beef calves sell at a strong premium, using beef semen on lower genetic merit cows can significantly improve whole-farm profitability—especially when sexed dairy semen is used strategically on replacements. A 2023 paper in Animals, which modeled beef-on-dairy strategies at herd and sector levels, reached similar conclusions.
As many producers have been sharing at industry meetings lately, the beef calf check in some months now rivals or exceeds net milk margin. That’s not a side hustle anymore. That’s starting to look like a business model.
What we’re all figuring out is there’s a tipping point where this shifts from “nice emergency cash” to “core business model.”
At 20–30% of breedings to beef, beef calves feel like a smart way to trim replacement heifer numbers and pick up needed cash. Milk remains the clear focus.
Somewhere around 40–60%, the beef calf check can rival or even exceed net milk income in tough years, especially for mid-sized herds.
Above 70% beef usage, the operation starts to resemble a confinement cow-calf system that happens to have a milk parlor attached.
That’s not a moral judgment—the cow is perfectly capable of playing both roles. The key is that this shift has downstream consequences, especially for processors and milk sheds built on the assumption of a steady dairy-only supply.
Processors, Plants, and the Risk of Empty Steel
While all of this is happening on the farm, processors are juggling their own challenges. Over the past decade, North America saw massive investment in large, efficient processing plants designed to handle millions of pounds daily. Those decisions assumed long-run milk growth and strong export markets.
At the same time, older, smaller plants keep closing. In 2024, Saputo announced closures of several US facilities as part of a network optimization plan. Regional media in 2025 highlighted more closures in the Northeast and parts of Canada.
Here’s why this matters to you: keeping plants viable depends on high utilization and dense, local milk supplies. Even a 3–5% regional reduction in cow numbers can force a plant to haul milk from farther away or cut shifts. And hauling costs have climbed—milk transport expenses now run $0.50–$1.50/cwt more when a nearby plant closes, and milk has to travel an extra 100–150 miles round-trip.
The remaining dedicated dairies—folks who want to stay 100% in milk—can end up paying part of the bill for regional consolidation, even if they themselves haven’t downsized. That’s one more reason to know where your buyer sees you fitting in their long-term supply plans.
The Quiet Load: Mental Health and Identity in a Restructuring Industry
Up to this point, we’ve mostly talked numbers. But the other part of the 2025 story—the part that doesn’t show up in USDA reports—is the mental and emotional toll of trying to navigate all this change while the bills are due every month.
Multiple studies and policy briefs over the past few years have documented that farmers, including dairy farmers, face significantly higher suicide risk than the general population. CDC data and rural health research put it at often around three-and-a-half times higher, depending on the dataset. A 2024 paper in FACETS reviewing Canadian data linked poor mental health directly to stressors such as financial pressure, weather extremes, and the feeling of being trapped between tradition and economics.
Qualitative work focused on agricultural communities has found similar themes. Farmers talk about isolation, stigma around seeking help, and the unique pain of feeling like “the generation that lost the farm.” A 2021 systematic review of farmer mental health interventions highlighted both the scale of the issue and the need for supports that actually fit farm culture and schedules.
Dairy-specific stories in 2024–2025 from farm mental health organizations describe producers who came very close to suicide during prolonged downturns, often when they felt powerless to change course or communicate with family and lenders. Many of these farmers eventually decided on a concrete plan—scaling back, changing enterprises, or exiting—that gave them what one producer called “permission to breathe again.”
“I think a lot of us tie our self-worth to the operation,” one Upper Midwest producer told a farm stress counselor in a 2025. “When the numbers say you’re failing, it feels like you’re failing—not just the business.”
From a purely business perspective, it can be tempting to say “hang on for better prices.” From a human perspective, there’s a point where “tough it out” becomes dangerous advice—especially when a farm is burning equity simply to keep operating with no clear path back to profitability.
The point isn’t that everyone should sell out. It’s that mental health and business planning are now inseparable topics. Decisions about scaling, shifting to beef-on-dairy, taking on new debt, or stepping away all have real emotional weight. And that weight deserves as much open, factual discussion as the milk-to-feed ratio.
A Simple Diagnostic for 300–800 Cow Commodity Herds
Most Bullvine readers aren’t running 30,000-cow dry lots or tiny direct-market dairies. You’re probably in that 300–800 cow band—big enough to be a full-time enterprise, small enough to feel exposed when margins shrink.
Based on extension work, lender guidance, and whole-farm modeling from land-grant universities, three numbers can really sharpen the conversation about next steps.
1. Your True All-in Breakeven
This isn’t just feed and vet. It’s everything:
All-in breakeven = (Total farm expenses + principal & interest + family living) ÷ cwt sold. Using USDA’s Dairy Margin Coverage calculations, the average dairy producer spent $9.38/cwt on feed alone in August 2025—down from $9.86/cwt in July. August feed costs were the lowest for any month since October 2020. 2024 Northeast Dairy Farm Summary showed a net cost of production at $21.49/cwt, down $1.15 from 2023.
Studies suggest efficient herds can still produce milk in the high teens per cwt all-in, while others sit in the low 20s once all costs are honestly accounted for.
As a rough rule of thumb…
If your honest all-in breakeven is under $18.50/cwt, you’re positioned to consider careful growth if demand justifies it.
If you’re between $18.50 and $20.50, you’re in the “tight but workable” zone, where beef-on-dairy, better component focus, or cost control can make the difference.
If your all-in breakeven is consistently above $20.50, and local mailbox prices are expected to average well below that, then every tanker load you ship deepens the hole unless you have strong non-milk income.
The uncomfortable truth: 75% of mid-sized herds are in the squeeze zone or worse. If your breakeven is above $20.50/cwt and milk prices average $17-$18, every tanker load deepens the hole. This isn’t a chart—it’s a mirror. Which tier are you really in when you count EVERYTHING, including family living and debt service?
2. Debt-to-Asset and Working Capital
Look at your debt-to-asset ratio—using realistic values for land, cows, and facilities. Not peak boom prices. Farm financial work from universities and ag lenders generally marks 35–40% D/A as a comfortable zone, and anything over 50–60% as a caution area where new borrowing becomes riskier.
Similarly, working capital (current assets minus current liabilities) should be at least 15–20% of gross farm revenue to handle volatility safely. If you’ve slipped below 10%, even small shocks can force fire-drill decisions.
3. Matching Numbers to a Path
Once you’ve run those numbers, three broad paths look clearer.
Path 1: Scale Aggressively makes sense when costs are already competitive (breakeven in the high-teens), debt-to-asset is modest, working capital is healthy, and a processor explicitly wants additional volume. Some 2024–2025 appraisals have documented distressed facilities selling at 40–60 cents on the dollar.
Path 2: Capture Premium or Niche Value looks promising when you’re near urban markets or specialty processors for organic, A2, grass-based, or farmstead products. You need contracted premiums that justify the extra work.
Path 3: Strategic Exit or “Milk-Out” with Beef-on-Dairy deserves attention when all-in breakeven is consistently above realistic price expectations, debt-to-asset is high, and there’s no next generation eager to step in. Some herds are using beef-on-dairy as a 3–5 year glide path—selling high-value calves and older cows while avoiding the cost of raising many replacements.
Five Questions to Discuss with Your Lender in 2026
“If milk prices stayed where they are for the next two years, what would our cash flow and equity position look like?”
“What’s our true all-in breakeven right now—not our best year, but our honest trailing twelve months?”
“Where does our processor see us in their five-year supply plan? Are we core, or are we on the margin?”
“If we shifted 50% of breedings to beef and stopped raising most replacements, what does that do to our debt service capacity over 36 months?”
“At what point would you advise us to exit with equity intact rather than continue operating at a loss?”
These aren’t comfortable questions. But they’re the ones that can turn a vague sense of pressure into a concrete plan—one way or another.
How This Looks in Your Region
National averages hide a lot of variation. The 2025 squeeze doesn’t hit every geography the same way.
High Plains (Texas, Kansas, New Mexico): Expansion is still happening, driven by new processing capacity and relatively low costs. If you’re already here with scale, the game is volume and efficiency. Heat stress management becomes a year-round conversation.
Upper Midwest (Wisconsin, Minnesota, Michigan): Traditional dairy country is caught in the middle. Strong infrastructure, but older facilities, tighter environmental rules, and a wave of 50–200 cow retirements. Many Midwest producers report running the beef-on-dairy numbers very seriously for the first time.
Northeast (New York, Pennsylvania, Vermont): Proximity to population centers creates niche opportunities—fluid, organic, farmstead. But commodity margins are brutal, given land and labor costs. Northeast producers often note they’re not competing with Kansas—they’re competing with the farm down the road for the same premium slot.
California: Still a powerhouse, but increasingly constrained by water policy under SGMA, labor costs, and air quality rules. Some herds are relocating; others are doubling down on efficiency or specialty markets.
Canada: Supply management provides price stability but limits growth. The pressure shows up differently—less about survival, more about succession and quota value as the next generation weighs options.
No single playbook fits everywhere. The key is understanding which forces are strongest in your specific situation.
Key Takeaways: How to Use 2025 as a Turning Point
2025 is a structural stress test, not just a price dip. Synchronized production growth, China’s partial self-sufficiency, component pricing shifts, and processing consolidation all lined up this year. Those forces are likely to return.
Beef-on-dairy has become a core margin tool. With beef-cross calves worth several times a straight dairy bull, and good research backing the economics, it’s a strategy every herd should run the numbers on. The key is deciding how far up that scale you want to go.
Component focus needs a reset, not a reversal. Butterfat had a great decade. Protein and overall solids will deserve more attention going forward. Flexibility and balance matter more than chasing a single number.
Processing relationships matter more than ever. With plant closures reshaping where milk can go, knowing your buyer’s long-term plans is as important as any ration change.
Mental health isn’t separate from business planning. High suicide rates remind us that “just toughing it out” can be far costlier than a few bad years on a tax return. Sometimes the bravest decision is to change course in time.
Policy tools exist, but face real barriers. Supply management, environmental caps, and coordinated export agreements could, in theory, dampen boom-bust cycles. In practice, structural volatility is likely to persist. Betting on policy rescue probably isn’t a sound business plan for 2026.
If there’s one encouraging thread through all of this, it’s that information and tools are better than ever. We have more transparent market data, more refined economic models, and more breeding and management options than our predecessors did. The hard part is being willing to look those numbers in the eye and let them inform decisions, even when the answers aren’t what we hoped for.
What 2025 offers, if we let it, is a chance to re-align our operations with the new reality—whether that means becoming a lean, scalable commodity producer, a differentiated value creator, or a family that chooses to step away with its equity and relationships intact.
That’s not an easy conversation. But it’s one worth having now, while there are still options on the table.
Complete references and supporting documentation are available upon request by contacting the editorial team at editor@thebullvine.com.
Join over 30,000 successful dairy professionals who rely on Bullvine Weekly for their competitive edge. Delivered directly to your inbox each week, our exclusive industry insights help you make smarter decisions while saving precious hours every week. Never miss critical updates on milk production trends, breakthrough technologies, and profit-boosting strategies that top producers are already implementing. Subscribe now to transform your dairy operation’s efficiency and profitability—your future success is just one click away.
Just found out our 90-lb cow loses $3/day while our 85-lb cow makes $10/day. The difference? 6kg of feed. This changes everything
Executive Summary: What if your highest-producing cows are actually costing you money? Feed efficiency technology deployed across 3,000 dairy farms proves it’s not just possible—it’s common. The numbers are stark: cows producing identical 100-pound milk yields show daily profit swings from -$7 to +$10, based solely on whether they consume 17kg or 23kg of feed. Ryzebol Dairy transformed this insight into action, breeding inefficient cows for beef ($700 premiums) while focusing genetics on the efficient third that actually drives profit. At $75-150K investment returning $470/cow annually, payback takes just 3-5 years. The industry is splitting fast between operations still chasing volume, and those chasing profit—and the profit-chasers are pulling away.
For nearly a century, dairy farming has operated on a simple equation: more milk per cow equals more profit.
But what farmers are discovering through new feed efficiency technology is turning that fundamental assumption on its head. The highest-producing cows in many herds are actually the least profitable—a revelation that’s prompting forward-thinking operations to reimagine their breeding, feeding, and culling strategies completely.
I recently had a fascinating conversation with Clare Alderink, general manager of Ryzebol Dairy’s 3,000-cow operation in Bailey, Michigan. When his farm implemented Afimilk’s feed efficiency estimation system, the data revealed something that challenged everything he thought he knew about his herd.
“There’s no way the service knew these cows were from the same farm, yet all those cows found themselves on the top of the list as the most feed efficient.”
All of his most feed-efficient animals traced back to one group of purchased Holsteins—cows that weren’t his top milk producers but were generating the highest profit per dollar of feed consumed.
The Hidden Economics That Traditional Metrics Miss
You know, what’s really striking when you dig into the economics is just how much variation exists between seemingly similar operations.
The folks at Vita Plus Corporation ran an analysis in 2024 examining 20 Midwestern herds—all shipping roughly 100 pounds of energy-corrected milk per cow daily. What they found should make every dairy farmer pause.
Income over feed cost ranged from less than $7 to greater than $10 per head per day.
Think about that $3.50 daily difference for a moment. On a 1,000-cow operation, we’re talking about over $1.2 million in margin opportunity annually. Money that’s essentially invisible if you’re only tracking milk production.
QUICK TAKE: THE EFFICIENCY GAP
Cow Group
Dry Matter Intake (kg/day)
Difference (kg/day)
Cost Savings per Cow (lactation period)
Efficient
17.30
6
$700
Inefficient
23.30
6
$0
What’s interesting here is that we’re finally understanding the mechanism behind this variation through individual cow measurement. A study published in Frontiers in Genetics in 2024 evaluated genomic markers for residual feed intake in 2,538 US Holstein cows.
The differences they found between efficient and inefficient animals were eye-opening:
First-lactation cows? The most efficient animals consumed 17.30 kg of dry matter daily, while the least efficient needed 23.30 kg
Second-lactation cows showed an even wider gap, with efficient cows eating 20.40 kg versus 27.50 kg for inefficient animals
Now, here’s where it gets interesting for those of us looking at feed bills.
According to University of Wisconsin Extension data, feed costs in the Upper Midwest are averaging around $381 per ton of dry matter. That 6 kg daily difference? It represents roughly $700 per cow per lactation in feed cost variation between animals producing identical milk volumes.
Shane St. Cyr from Adirondack Farms in New York put it perfectly:
“You have the income half of the equation on most dairies. But without that expense equation, you’re really kind of flying blind.”
The Strategic Breeding Revolution: Beef-on-Dairy Meets Feed Efficiency
Perhaps the most dramatic shift I’m seeing—and I’ve been watching this space closely—is how farms are completely rethinking their breeding strategies once they have feed efficiency data in hand.
Instead of the old approach (trying to create replacement heifers from every cow that’ll stand still long enough to breed), operations are now using what’s essentially a three-tier system:
TOP 20-30% (HIGH EFFICIENCY):
Bred with sexed dairy semen
Create the next generation
Keep these genetics forever
MIDDLE 40-50%:
Conventional dairy semen
Backup replacement strategy
Flexible based on herd needs
BOTTOM 20-30% (LOW EFFICIENCY):
Bred exclusively with beef semen
Generate $350-700 premiums per calf
Transform losses into profit centers
The beef-on-dairy market has absolutely exploded in ways that, honestly, nobody saw coming five years ago.
Purina Animal Nutrition surveyed 500 dairy producers in 2024 and found that 80% are now receiving premiums for beef-on-dairy calves. Some crosses are fetching over $1,000 in tight cattle markets, particularly in Texas and the Central Plains.
For Ryzebol Dairy, this strategic allocation based on feed efficiency data has completely transformed how they view their inefficient cows.
“I want that efficient cow to stay in my herd a long, long time,” Alderink explained. “Whereas the other inefficient cows I would want to use to make a beef calf because she’s a lower-value cow.”
What University Research Missed: The Power of Individual Variation
Here’s something that really drives home why on-farm measurement matters more than controlled research trials. Ryzebol’s experience with high oleic soybeans illustrates this perfectly.
The university studies—Penn State ran a trial with 48 Holstein cows in 2024, and Michigan State published similar work—showed that high-oleic soybeans improved energy-corrected milk and components. The improvements were significant, particularly for butterfat. Solid research. Peer-reviewed. Convincing stuff.
So Ryzebol implemented them herd-wide and saw improvements.
But then Alderink did something the research couldn’t do. He used individual cow feed efficiency data to dig deeper.
“Increasing the average doesn’t always tell the whole story. It may have made our best cows really efficient and done little for the low cows.”
What he discovered should make every nutritionist rethink how we apply research findings:
TOP 30% OF COWS:
Excellent milk and component response
Strong returns on premium ingredient cost
Worth every penny
MIDDLE 40%:
Marginal improvement
Barely justified the extra cost
Questionable economics
BOTTOM 30%:
Little to no benefit
Essentially throwing money away
Better off with standard ration
This insight—that research-validated improvements don’t apply equally to all animals—represents a fundamental shift in how we can optimize nutrition economics.
The Technology Landscape: Understanding What’s Real vs. What’s Promised
Let’s talk about what this technology actually does, because there’s plenty of confusion out there.
Afimilk’s feed efficiency service represents a breakthrough in estimating individual cow feed efficiency through collar sensor data. The system tracks eating time and rumination patterns, then combines this with milk production information to generate efficiency values for each animal.
You’re entering weekly dry matter intake data from your feeding software to calibrate the estimates. According to validation studies at UW-Madison, the correlation between the algorithm’s estimates and actual measured intake has proven strong enough for commercial application.
THE NUMBERS THAT MATTER:
Investment
Annual service
Payback period
ROI
Beef premium
Feed savings
$75,000-$150,000 (500 cows)
$10,000-$25,000
3-5 years
$470/cow/year
$350-700/calf
$700/cow/lactation
Early adopters are reporting that the technology can deliver $470 per cow in annual profitability gains through better breeding and culling decisions.
On a 1,000-cow operation? That’s nearly half a million dollars in annual value.
Though I should note—and this is important—that’s assuming farms actually act on the data.
The Adoption Reality: Barriers Beyond Technology
Despite these clear economic benefits, several factors are creating real headwinds for adoption.
CAPITAL CONSTRAINTS We’re talking $75,000-$150,000 for basic sensor systems on 500 cows. Field data from early adopters suggests payback periods of 3-5 years. But that upfront investment? It’s tough when milk prices are volatile.
SYSTEM INTEGRATION Feed efficiency estimation needs to pull data from multiple sources:
Milk meters
Cow ID systems
Feeding software
Health records
According to Progressive Dairy’s 2024 tech adoption survey, approximately 70% of North American dairies have older equipment or mixed vendors. Additional integration costs that nobody mentions in the sales pitch.
PSYCHOLOGICAL RESISTANCE Here’s the barrier nobody wants to talk about. Kent Weisenberger from Vita Plus put it bluntly in a recent podcast:
“The technology works fine. Whether farmers will cull their favorite high-producing cow because she’s inefficient? That’s the real question.”
It’s worth noting that feed efficiency estimation isn’t a silver bullet for every situation. Grazing-based operations or farms with highly variable feed quality from homegrown forages might find the economics less compelling.
Environmental Benefits: The Profit-Sustainability Alignment
What I find particularly interesting about feed efficiency selection is how environmental benefits just naturally emerge from economic optimization.
You’re not trying to save the planet—you’re trying to make money—but the planet benefits anyway.
Research from Wageningen University in 2024 found that methane production varies by approximately 25% within herds due to genetic factors. The correlation between feed efficiency and methane reduction is strongly positive.
Since April 2023, Canada has been implementing national genetic evaluations for methane emissions through Lactanet. They’re projecting 20-30% reductions in breeding alone by 2050.
The Council on Dairy Cattle Breeding calculates that genomic selection for feed efficiency has already delivered $70 per cow per year in additional value—before accounting for any environmental benefits or carbon credits.
The key point? You don’t need expensive additives. Simply breeding from more efficient animals reduces methane automatically at zero additional cost.
Looking Ahead: The Industry Transformation
Here’s where things get really interesting for the bigger picture.
If enough operations start breeding away from high-volume, low-efficiency genetics, it fundamentally challenges what the breeding industry has been selling for decades.
VikingGenetics launched their Feed Efficiency 3.0 program earlier this year, explicitly prioritizing efficiency over raw production. Meanwhile, established players like Semex and Alta have scrambled to launch “sustainable genetics” programs.
The uncomfortable truth? While high producers generally dilute maintenance costs effectively (gross feed efficiency), metabolic efficiency—measured as Residual Feed Intake—is a distinct genetic trait. You can have a high producer that’s metabolically inefficient, or a moderate producer that’s exceptionally efficient at the cellular level.
For 40 years, the breeding industry chose production over efficiency. With feed accounting for 50-75% of operating costs, according to USDA data, the math increasingly favors a more nuanced approach.
THE BULLVINE BOTTOM LINE: Your Monday Morning Action List
IMMEDIATE ACTIONS (THIS WEEK): □ Calculate your current income over feed cost variance between top and bottom cows □ Call your nutritionist—ask if they’ll support data-driven feeding changes □ Visit a farm already using the technology (find one in your area)
EVALUATION PHASE (NEXT 30 DAYS): □ Get quotes from 3 vendors for feed efficiency estimation systems □ Run your herd’s numbers: What’s your potential at $470/cow/year? □ Talk to your banker about financing options (3-5 year payback)
DECISION CHECKPOINT: □ Can you afford to wait while neighbors gain $700/cow/lactation advantage? □ Will you act on uncomfortable data about favorite cows? □ Are you ready to challenge 40 years of production-first thinking?
The technology exists. The economics are proven. The only question: Will you act before your neighbors do?
As Alderink reflects: “I think we are just scratching the surface on all this, but it is taking us down a path where we can really start to look at these things because we have something to measure it.”
That ability to see which cows convert feed efficiently—versus which simply produce milk—represents the difference between optimizing for volume and optimizing for profit.
In today’s margin environment, that distinction increasingly determines which operations thrive and which struggle to survive.
Your move.
Key Takeaways:
The $700 Discovery: Efficient cows (17kg DMI) and inefficient cows (23kg DMI) produce identical milk but differ by $700/lactation in profit—measure to know which you have
Transform Your Breeding: Feed data creates three profit tiers → Top 30% get premium genetics | Bottom 30% produce beef calves ($350-700 each) | Middle 40% flex by needs
Precision Feeding Pays: Individual response data shows premium feed additives only benefit ~30% of cows—saving $200+/cow by removing non-responders from expensive rations
Competitive Clock Ticking: 3,000 early adopters gaining $470/cow annually are building herds 10-15% more efficient by 2030—each month you wait widens the gap
Complete references and supporting documentation are available upon request by contacting the editorial team at editor@thebullvine.com.
Learn More:
The Beef-on-Dairy Wake-Up Call: What Some Farms Are Still Missing – Strategic Analysis: Challenges the lingering “Holstein purity” mindset that holds 20% of dairies back, detailing the exact opportunity cost of delaying genomic selection and why “old-school” breeding is bleeding money in the current market.
5 Technologies That Will Make or Break Your Dairy Farm in 2025 – Innovation Guide: Expands beyond feed efficiency to evaluate five specific 2025 investments—from calf sensors to precision feeding robots—helping you decide which tools deliver genuine ROI versus which are just expensive toys.
Join the Revolution!
Join over 30,000 successful dairy professionals who rely on Bullvine Weekly for their competitive edge. Delivered directly to your inbox each week, our exclusive industry insights help you make smarter decisions while saving precious hours every week. Never miss critical updates on milk production trends, breakthrough technologies, and profit-boosting strategies that top producers are already implementing. Subscribe now to transform your dairy operation’s efficiency and profitability—your future success is just one click away.
Fairlife sells for $6. You get paid like it’s a store brand. Meanwhile, direct-market dairies are getting $48/cwt. See the gap?
EXECUTIVE SUMMARY: At $21.60/cwt, milk prices are crushing farm profits—your typical 500-cow dairy loses $125,000 this year while processors capture $38/cwt through hedging and consumers pay record retail prices. This isn’t a downturn; it’s the industry’s fundamental restructuring. By 2030, America’s 35,000 dairy farms will shrink to 24,000, with survivors clustering into three models: mega-operations leveraging scale, niche producers earning $48/cwt through direct sales, or multi-family partnerships pooling resources. The traditional 600-cow family farm is mathematically obsolete, running $250,000 in the red each year. Smart operators are already moving—diversifying revenue through beef-on-dairy, optimizing components for Class III premiums, or restructuring operations entirely. You have 18 months to choose your model before market consolidation chooses for you. The farms that thrive in 2030 won’t be those that survived 2025—they’ll be those that transformed during it.
You know, when I saw USDA’s latest forecast showing milk prices heading down to $21.60 per hundredweight, my first thought was about what this actually means for folks like us. For most 500-cow operations—and that’s a lot of farms I work with—we’re talking about roughly $125,000 in lost annual revenue. That’s not exactly small change when you’re already running things pretty tight.
Here’s what’s interesting, though. I’ve been looking at the Bureau of Labor Statistics data, and retail dairy prices? They’re still near record highs. And get this—fluid milk consumption actually grew in 2024 for the first time in 15 years. USDA’s own sales reports are showing this. The International Dairy Federation keeps saying global demand is climbing steadily.
So what’s going on here? Why are we getting squeezed when everything else suggests we should be doing better?
I’ve been talking with producers from Wisconsin to California lately, and what I’m hearing goes way deeper than typical market-cycle complaints. It’s this disconnect between what we’re getting at the farm gate and what consumers are paying at the store. And here’s the thing—even with the tightest heifer supplies in two decades, prices aren’t responding like they used to. What’s really fascinating is we’re seeing three distinct operational models emerging that’ll probably determine who’s still milking cows come 2030.
If you’re paying attention—and I know you are—the next year and a half represents what I’d call a critical decision window. The choices you make now? They’re going to determine whether you’re thriving or just hanging on when this industry looks completely different five years from now.
Let’s Talk About What’s Really Happening with Prices
So back in March, when CME Group reported Class III milk futures dropping to .75 per hundredweight, most of us expected the usual pattern, right? Supply tightens up, prices recover, and we all catch our breath. But that’s not what’s playing out, and honestly, it’s revealing something pretty concerning about how these markets work now.
Peter Vitaliano over at the National Milk Producers Federation articulated something that really resonates—the gap between farmgate and retail has never been this wide. We’re looking at USDA data showing farmers getting .60 per hundredweight while consumers are paying over a gallon for whole milk and around a pound for cheddar. These are historically high retail prices, folks.
What I find particularly noteworthy is how processors have positioned themselves. Take these massive new facilities—Leprino Foods with its 8-million-pound-per-day capacity plant, and Coca-Cola’s new fairlife facility up in New York. The International Dairy Foods Association has been tracking, it says, over $2 billion in infrastructure investments since 2020. These plants need milk volume a consistent milk supply to justify those investments. And that’s creating some… well, let’s call them interesting market dynamics.
Mark Stephenson from Wisconsin’s Center for Dairy Profitability shared something with me that really clicked. Processors are using futures contracts to lock in their margins months ahead, while we’re getting prices based on last month’s averages. That timing difference? It’s worth about three dollars per hundredweight in a protected margin for them. Three dollars!
A producer I know well out in California’s Central Valley—runs about 650 Holsteins—put it to me this way: “They’ve hedged their position months in advance. We’re operating with completely different risk exposure.” And you know what? He’s absolutely right.
[INSERT IMAGE: Graph showing the widening gap between farmgate prices and retail dairy prices from 2020-2025, with processor margins highlighted]
That Heifer Shortage Everyone’s Banking On
Now, conventional wisdom says—and I’ll admit, I believed this too—that this replacement heifer shortage should fix everything. CoBank’s August report shows we’re at a 20-year low, down to about 3.9 million head. You’d think that means better prices by late next year, maybe 2026?
Well… not so fast.
What we’re learning about beef-on-dairy breeding is fundamentally changing the game. The breeding association data shows that about a third of our Holstein and Jersey calves are now beef crosses. Think about what that means for a minute.
Replacement heifer prices have exploded—USDA’s tracking them at over three thousand per head, up 75% since early 2023. And if you’re looking for premium genetics? I’ve seen them go for thirty-five hundred, even four thousand at regional auctions. Down in Georgia and Florida, some producers are paying even more for heat-tolerant genetics. CoBank’s projecting we’ll be short another 800,000 replacements by 2026.
Yet—and here’s the kicker—this dramatic supply constraint isn’t translating to better milk prices. Why? It’s the processing overcapacity. Andrew Novakovic from Cornell’s Dyson School explained it to me this way: when processors have billions invested in facilities that require high volume, they have incentives to keep farmgate prices stable to ensure consistent throughput. It sounds backwards, but that’s the reality we’re dealing with.
The Darigold situation out in the Pacific Northwest really drives this home. Despite obvious milk supply tightness, they announced a $4-per-hundredweight deduction on all member farms back in May. A producer out there—runs about 3,000 cows—spoke at a meeting about it and didn’t mince words: “When milk price is down and you add these deducts, it really starts to sting.”
Why Growing Demand Isn’t Helping Us (This One Really Gets Me)
Here’s what caught me completely off guard when I first saw the International Dairy Foods Association data. Fluid milk sales grew about half a percent in 2024—first increase in 15 years! USDA’s marketing service confirms whole milk consumption hit its highest level since 2007. The Organic Trade Association reports that organic milk sales jumped by over 7%. And premium products? IRI’s retail data from 2024 shows brands like fairlife grew nearly 30% in dollar sales compared to the year before.
You’d think this demand recovery would support our prices, right? Instead—and this is what’s so frustrating—it’s doing the opposite. The growth is all concentrated in premium products where processors and retailers, not farmers, capture that value.
Let me break this down in real numbers—here’s The Value Disconnect:
Level
Price
Who Gets It
Farm Gate
$21.60/cwt
Farmers (commodity price)
Conventional Retail
~$40.00/cwt equivalent
Retailers (standard markup)
Premium Retail (fairlife)
~$60.00/cwt equivalent
Processors & retailers
The Gap
$38.40/cwt
Captured via hedging & branding
Marin Bozic, who does dairy economics at the University of Minnesota, explained the mechanism to me: the Federal Milk Marketing Order structure simply has no way for farmers to participate in the creation of premium product value. Your milk could become commodity cheese or the fanciest filtered milk on the shelf—you get the same basic commodity price either way.
The Three Futures: Why the Traditional 500-Cow Family Farm is Mathematically Obsolete (And What to Become Instead)
Research from Cameron Thraen’s team at Ohio State, which analyzed USDA’s agricultural census data and published its findings in the 2024 dairy outlook report, reveals something both fascinating and, honestly, a bit scary. They’re projecting that consolidation will reduce the number of dairy farms from about 35,000 today to 24,000 to 28,000 by 2030. And the production? It’s going to concentrate into three pretty distinct models.
If you’re running a traditional 500-to-700-cow family operation like many of us, the mathematics suggest you need to evolve into one of these structures, or… well, face some really tough decisions.
[INSERT IMAGE: Infographic showing the three operational models with icons – Mega-Operation (factory icon), Niche Producer (farmers market icon), Multi-Family Partnership (handshake icon) – with their respective herd sizes, investment requirements, and profit projections]
The Large-Scale Operations (3,500+ Cows)
We’ve got about 900 of these operations now, controlling roughly 20% of production. Wisconsin’s Program on Agricultural Technology Studies published their structural change analysis in 2024, suggesting this’ll grow to maybe 1,500 or 2,000 operations controlling 35-40% of all milk by 2030.
What makes them work? Well, Cornell’s annual Dairy Farm Business Summary shows they’re hitting costs of around 14 to 16 dollars per hundredweight through massive scale. They negotiate directly with processors—not as suppliers but as genuine business partners. They’re getting 50 cents to $1.50 per hundredweight just on volume guarantees. Investment required? We’re talking eight to fifteen million, according to the ag lenders I’ve talked with.
As one industry analyst put it, “A 5,000-cow operation with consistent component quality has real negotiating leverage.” And that’s the key word there: leverage.
The Niche Direct-Marketing Operations (100-400 Cows)
There are maybe 4,000 to 5,000 of these operations now, and interestingly, the National Young Farmers Coalition’s 2024 land access survey suggests this could grow to around 6,500 by 2030, particularly as beginning farmers explore alternative market channels.
I spoke with a producer in Vermont recently who made this transition—went from conventional to organic with direct marketing. She’s getting around $48 per hundredweight equivalent through farmers’ markets and on-farm sales. “It’s definitely more work,” she told me, “but we’re actually profitable now.”
A Texas producer I know took a different approach—focusing on A2 genetics and local Hispanic market preferences. He’s capturing premiums I wouldn’t have thought possible five years ago.
What works for these folks:
Premium pricing in that $35-to-50 range through direct sales
Organic, grass-fed, A2 genetics, local food positioning
On-farm processing so they capture those processor margins themselves
Investment needs are different—three to seven million, but it’s focused on brand building and market access, not just production
The Multi-Family Partnerships (2,000-3,500 Cows Total)
This is the emerging model that’s really interesting. We’re seeing maybe a few hundred of these now, but projections suggest over a thousand by decade’s end.
Mike Hutjens, who recently retired from the University of Illinois after decades of dairy research, described it well in his recent Extension publication on consolidation strategies: “Three families combining resources, each contributing 600-700 cows, sharing facilities and management. They’re achieving near-mega-operation efficiency while maintaining family control.” Based on operations he’s worked with, each family can see $200,000 to $300,000 annually.
Here’s the hard truth nobody really wants to hear: Cornell’s Pro-Dairy program’s 2024 cost of production analysis suggests that traditional 600-cow single-family operations face an approximately quarter-million-dollar annual profit gap compared to these three models. Without evolving into one of these structures… well, the math becomes pretty challenging.
What Successful Producers Are Actually Doing Right Now
What distinguishes farms positioned to thrive from those heading toward crisis? It’s not hope for market recovery—it’s specific actions during the downturn. I’ve been watching successful operations across the Midwest, and there are definitely patterns.
Moving Beyond the Milk Check
The smartest producers I know have completely abandoned the old assumption that milk sales should be 85-90% of revenue. A Wisconsin producer I work with is breeding 30% of his herd with beef semen. At current beef prices—around $250 per calf—that’s significant money. Plus, he’s not overwhelming his heifer facilities.
Strategic culling at these cull cow prices—USDA’s reporting over $145 per hundredweight—is generating serious cash. An Idaho producer told me she culled 15% strategically, generated substantial one-time revenue while cutting feed costs permanently by about 16%.
And value-added production? Penn State Extension’s 2023 bulletin on dairy value-added enterprises shows that even converting 5% of your milk to yogurt, cheese, or specialty products can generate margins two and a half to three times higher than commodity milk. Their case studies are pretty compelling, actually.
It’s About Efficiency, Not Just Volume
What I’m seeing is successful operations focusing on feed efficiency over just pushing for more milk. Kent Weigel at Wisconsin-Madison has data showing feed efficiency genetics have a heritability of around 0.43—meaning those improvements compound fast.
The approach is getting pretty sophisticated:
Genomic testing to identify and cull the bottom 20% for feed efficiency before they even enter the milking string
Switching to bulls with high Feed Saved indexes—costs nothing, impacts everything
Getting that metabolizable protein dialed in at 100-115% of requirements saves fifty to seventy-five dollars per cow annually, according to University of Minnesota research
For a 500-cow operation? These strategies might cost ten to fifteen thousand dollars to implement, but can return ten times that annually. And it compounds year after year. Scale it down to 250 cows, and you’re looking at maybe a $50,000 return on a $5,000-7,500 investment. Scale up to 1,000 cows? We’re talking $200,000-280,000 annually.
Components and Geography Matter More Than Ever
Here’s something worth noting: USDA’s November projections show Class III prices around $18.82, while Class IV falls to maybe 15 or 16 per hundredweight in 2026. That three-to-four-dollar spread? It rewards specific decisions.
A Minnesota producer told me about switching to Jersey-Holstein crosses three years back. “Our butterfat runs 4.3% now versus 3.7% before. That’s worth about seventy cents per hundredweight. Doesn’t sound like much until you’re shipping 50,000 pounds daily.”
What Canada’s System Reveals (It’s Not What You Think)
Looking north offers an interesting contrast. While we’re facing this dollar-per-hundredweight drop, the Canadian Dairy Commission’s February announcement showed essentially minimal change—less than a tenth of a percent adjustment.
Their stability comes from a formula: prices adjust by half to production costs and half to the consumer price index. As Sylvain Charlebois from Dalhousie University’s Agri-Food Analytics Lab explained, “Canadian farmers know their milk price nine months ahead.” Imagine being able to plan that far out!
But—and this is important—there are trade-offs. Dairy Farmers of Canada reports quota costs around $24,000 per kilogram of butterfat. That’s a massive entry barrier. A 2024 study in the Agricultural Systems journal documented approximately 6.8 billion liters of milk waste from 2012-2021 in the Canadian system. And the Fraser Institute calculates Canadian families pay nearly $300 more annually for dairy.
What’s really revealing? Statistics Canada’s agricultural projections suggest they’ll still lose about half their dairy farms by 2030, bringing the total to around 5,000. So even with all that protection, consolidation is happening. It’s fundamental economics that transcends whatever system you use.
The 2025-2027 Window: Why Timing Is Everything
What I’m seeing suggests 2025 is where three forces converge for the first time:
First, we’ve got this processing capacity overhang from billions of new facilities coming online. Industry tracking shows it’s massive. Second, the International Dairy Federation projects global consumption growing faster than production—about 1.1% versus 0.8%. And third, producer exits are accelerating. The American Farm Bureau reports Chapter 12 bankruptcies up over 50% year-over-year.
This creates what I’d call an 18-to-24-month window for strategic positioning. Christopher Wolf, who heads Cornell’s dairy markets and policy program, suggests once global supply scarcity becomes obvious and prices start recovering—probably 2027—consolidators will move aggressively. Acquisition costs will spike. Windows close.
So What Should You Actually Do? (The Practical Stuff)
Understanding all this, here’s what I’m seeing work:
If You’re Planning to Continue:
Focus on efficiency over growth. A Pennsylvania producer told me, “We’ve stopped all expansion. Every dollar goes to efficiency improvements and component optimization. That dollar-fifty from better components beats any volume premium.”
Lock in what you can. USDA’s Dairy Forward Pricing Program, reauthorized through April 2025, lets you contract ahead when futures look reasonable. Creating revenue floors has saved several operations I know.
Build those alternative revenue streams now. Beef-on-dairy, strategic culling, value-added—these can offset entire milk price declines.
If You’re Considering Structural Change:
The partnership conversation needs to happen now. An Ohio producer who merged three family operations told me they spent eight months finding the right partners. “Wait until the crisis? Your best options are already gone.”
Thinking about the niche route? Start small, but start now. That Vermont producer I mentioned began with just 5% of its output going to farmers’ markets. It took three years to transition fully, but she learned as she grew.
Geographic disadvantages are real. USDA data shows consistent one-to two-dollar regional differences. If you’re in a disadvantaged area, seriously consider your options.
For Everyone:
Accept that mid-size independence might require significant adaptation. As one Cornell economist put it, “That’s not defeat—it’s realistic evolution in a consolidating industry.”
Focus on what you control: genetics, efficiency, component quality, and marketing channels. An Idaho producer said it best: “The market does what it does. I can’t control that. But I absolutely control my cost per hundredweight.”
For those who want to dig deeper, information on the USDA’s Dairy Forward Pricing Program is available at your local FSA office. Cornell’s Pro-Dairy program has excellent resources on cost analysis. And if you’re considering the partnership route, the University of Wisconsin’s Center for Dairy Profitability has some solid guidance materials.
The Bottom Line (Where This All Leads)
The 2025 milk price situation isn’t really about traditional supply and demand—it’s a structural transformation that’s been building for decades. That $21.60 forecast from the USDA? It’s looking more like a new reality where processor margin management matters more than the old market dynamics we learned.
Yet within this challenging environment, I’m seeing clear paths forward for producers willing to abandon old assumptions. The farms thriving in 2030 won’t be those that simply survived 2025 through sheer determination. They’ll be operations that recognized this inflection point and repositioned, while others that waited for the recovery that follows will follow completely different rules.
You’ve got maybe 18 to 24 months for deliberate transformation. After that, market forces make the choices for you. The question isn’t whether to change—it’s which of these emerging models fits your operation’s future. That decision, made with clear eyes rather than false hope, determines success or failure.
What’s interesting is every producer I know who’s made these strategic pivots says the same thing: “Should’ve done it sooner.” Maybe that’s the real lesson. The best time to transform isn’t when crisis forces your hand—it’s right now, while you still have options.
And honestly? That’s both scary and oddly encouraging. At least we know what we’re dealing with. Now it’s time to act on it.
KEY TAKEAWAYS:
The $38/cwt gap is permanent: Processors locked in margins through futures—your $21.60 milk price won’t recover, costing typical 500-cow dairies $125,000 annually
Pick your path in 18 months: Mega-operation (3,500+ cows), direct-marketing ($48/cwt premiums), or multi-family partnership—traditional single-family 600-cow farms face mathematical elimination
Diversify revenue TODAY: Leaders generate $45,000+ from beef-on-dairy (30% of herd), 3x margins on value-added products, and $0.70/cwt from component optimization
10:1 returns exist: Genomic feed efficiency selection costs $15,000, returns $150,000 annually—compound these gains before the 2027 consolidation wave
Complete references and supporting documentation are available upon request by contacting the editorial team at editor@thebullvine.com.
Join over 30,000 successful dairy professionals who rely on Bullvine Weekly for their competitive edge. Delivered directly to your inbox each week, our exclusive industry insights help you make smarter decisions while saving precious hours every week. Never miss critical updates on milk production trends, breakthrough technologies, and profit-boosting strategies that top producers are already implementing. Subscribe now to transform your dairy operation’s efficiency and profitability—your future success is just one click away.
Every smart dairy decision right now is collectively destroying the industry. 14,000 farms gone by 2027. Your escape plan
EXECUTIVE SUMMARY: Your $1,600 beef-on-dairy calves are funding today’s survival while creating the heifer shortage that will eliminate 14,000 farms by 2027. This isn’t market volatility—it’s structural collapse driven by individual rational decisions creating collective disaster: processors betting $11 billion on milk from cows that don’t exist, heifer inventories at 20-year lows while replacements hit $4,000, and production racing west (Kansas +21%, Wisconsin +2%) where scale economics rule. The timeline is brutal—farms that don’t act before Q1 2026 lose all strategic options. Winners will be mega-dairies leveraging scale, small farms capturing specialty premiums, and operations that exit NOW while equity remains. Mid-size commodity producers face extinction unless they immediately choose: scale up through consolidation, pivot to high-value niche markets, or execute a strategic exit that preserves $200,000-400,000 in family wealth, which disappears after Q1 2026.
You know what’s been keeping me awake lately? It’s not just checking on fresh cows at 2 AM. It’s this strange situation where every producer I talk to—and I mean everyone, from my neighbors here in Wisconsin to folks I met at that Texas conference last month—they’re all making absolutely sensible decisions for their operations. Smart moves, really. Yet somehow, when you add it all up, we’re collectively driving ourselves toward the biggest industry shakeup since the ’80s farm crisis. And here’s what’s wild: this isn’t another milk price cycle we can just ride out. We’re looking at a fundamental transformation that could cut farm numbers from 26,000 to potentially 12,000 within the next 24 months.
The brutal 36-month timeline: 14,000 farms will disappear between now and 2028 – miss the Q1 2026 decision window and you lose all strategic options, joining the forced-exit wave
The Beef-on-Dairy Boom: When Opportunity Becomes a Trap
So here’s what triggered this whole conversation for me. A buddy from Pennsylvania—third-generation dairy farmer, solid operator—texted me last week. He just got $1,600 for a day-old Holstein-Angus cross calf.
I had him repeat that. Sixteen hundred dollars. For one calf.
You probably remember when those same calves were worth maybe $200 on a good day, right? Well, Penn State Extension’s been tracking this closely since earlier this year, and they’re confirming what we’re all seeing—these beef-on-dairy calves are moving for $1,000 to $1,400 pretty consistently across the Northeast. The Wisconsin team’s noting similar numbers out here.
The economic trap that’s destroying dairy: beef-cross calves now fetch $1,600 while replacement heifers hit $4,000 – farmers are cashing checks today that eliminate their industry tomorrow
I was talking with Dr. Michael Hutjens—you might know him from Illinois, he’s been doing some consulting work since retiring—and he put it perfectly. He said that with today’s beef premiums, the income-over-semen-cost calculation has basically rewritten everyone’s budgets. “When crossbred calves fetch double what dairy calves do, you can’t ignore it,” he told me. “But at three, four times? It changes what’s possible on a balance sheet.”
And the math is real. I’ve run these numbers with several neighbors using Cornell’s PRO-DAIRY modeling. Take your typical 500-cow herd, breed about 35% to beef semen—pretty standard approach these days—and you’re looking at $350,000 to $400,000 a year in extra calf revenue. That’s not marketing hype. That’s actual money hitting bank accounts.
But—and here’s where it gets complicated—have you seen what’s happening with heifer inventories? October’s USDA report shows we’re at a 20-year low. Think about that. Only 2.5 million heifers are coming into the US milking herds for 2025. That’s the lowest since they started properly tracking this back in 2003.
The Wisconsin auction yards tell the story. Replacement heifer prices jumped from $1,990 to $2,850 in just one year. And I’m hearing from producers out in the Pacific Northwest—granted, these are the extreme cases—but some folks are paying over $4,000 for the right animal. Even in California, where you’d think the scale would keep things stable, UC Davis Extension is reporting $3,500 for good replacements.
Dr. Victor Cabrera over at Madison said something that really stuck with me: “This makes perfect sense for each individual farm. But system-wide? We’re baking in a heifer shortage that’ll last years.” And you know what? The cull cow numbers tell the same story.
The heifer shortage nobody’s talking about: replacement inventories plummeting from 4.77M head in 2018 to a projected 3.2M by 2027 – a 33% collapse that makes industry expansion impossible
Shifting West: Kansas, Idaho, and the Geography of Expansion
Here’s what’s really fascinating—and honestly, it’s a bit unnerving if you’re farming in traditional dairy states like most of us. The October USDA milk production numbers are eye-opening. Kansas production is up 21% year-over-year. Twenty-one percent! Idaho’s up 9%, Texas jumped 7.4%. Meanwhile, we managed 2.1% here in Wisconsin, and Pennsylvania actually went backwards a bit. Even California, with all those new facilities near Tulare, only grew about 2.4%.
The death of traditional dairy states: Kansas explodes 21% while Wisconsin crawls at 2.1% and Pennsylvania contracts – geography now determines survival more than management skill
This isn’t just random variation, folks. This is a structural change happening right in front of us.
I had the chance to visit a 15,000-cow operation outside Garden City, Kansas, this summer. And what struck me—beyond the sheer scale, which is something else entirely—was the complete integration of every system. They’ve got water reclaim that essentially recycles every drop, hydroponic barley sprouting for year-round fresh feed, and they’re adjusting rations twice daily based on real-time component testing.
The ops manager (he asked me not to use his name because of co-op agreements) shared something interesting. They’re running about $2.50 per hundredweight below the Midwest average on total costs. “It’s not that we’re smarter,” he said. “We just built for this scale from day one. No retrofitting old tie stalls. No working around century-old barn foundations.”
Kansas State’s ag economics folks have been studying this, and they’re confirming these mega-dairies achieve 10% to 15% cost advantages through scale and integration. And yeah, let’s be honest—lower regulatory burden plays a role too.
What’s happening down in Florida and Georgia is different but equally telling. Producers there are dealing with heat stress that would knock our cows flat, but they’re making it work with cross-ventilated barns and genetics explicitly selected for heat tolerance. One Georgia dairyman told me he’s getting 75 pounds per day in August—not Wisconsin numbers, but impressive given the conditions.
Out in New Mexico and Arizona, it’s a different story again. Water scarcity is forcing innovation—one operation near Phoenix installed a reverse-osmosis system that recovers 85% of its water. They’re spending $50,000 annually on water technology, but it’s cheaper than not having water at all. These Southwest operations are proving that you can adapt to almost anything if you’re willing to invest in the right systems.
But here’s what really drives this geographic shift—it’s the processing infrastructure. That new Hilmar plant in Dodge City? It needs 8 million pounds of milk daily. That’s roughly 16 average Wisconsin farms, or about 1.5 of those Kansas mega-dairies. Valley Queen, up in South Dakota, is expanding by 50% to increase capacity, too. The processors go where the milk is, the milk goes where the processors are. It’s self-reinforcing.
The $11 Billion Bet: Processors Defy the Herd Falloff
Here’s a number that should make everyone pause: $11 billion. That’s what the International Dairy Foods Association says processors are investing in new capacity through 2028.
From their perspective, it makes sense. USDA’s November forecasts show milk output reaching 232 billion pounds by 2026, up from 226 billion in 2024. Even with cow numbers staying flat or declining slightly.
Michigan’s posting 2,260 pounds per cow monthly—that’s more than 250 pounds above the national average. Dr. Kent Weigel over at Madison calls this the “component yield era.” We’re seeing 3% to 5% yearly increases in protein and butterfat just from genetics and better feeding. With advances in nutrition, processors are betting on continued supply growth. It’s a reasonable bet based on what we’ve seen historically.
Yet—and this is where things get interesting—CoBank’s August report says we’ll lose another 800,000 heifers before the curve turns around in late 2027. I asked a cheese company exec about this disconnect at last month’s conference. His take? “We’re not betting on more cows. We’re betting on more milk per cow. Frankly, we’d rather work with fewer farms producing consistent volume than coordinate with hundreds of smaller operations.”
What’s interesting is that processors in the Southeast are taking a different approach—smaller, more flexible plants for regional supply. A new facility in North Carolina is designed to handle just 500,000 pounds daily, specifically targeting local specialty markets. But the big money? That’s all, heading to the Plains states.
GLP-1: The Protein Surge Nobody Planned
The obesity drug windfall: GLP-1 users exploding from 41M to 315M creates insatiable whey protein demand – pushing >3.2% protein herds to $1.50/cwt premiums worth $75,000-$100,000 per 500-cow operation
You know what’s wild? The biggest market mover right now isn’t even on the farm—it’s in the pharmacy. Morgan Stanley’s research shows 41 million Americans have tried those weight-loss GLP-1 drugs like Ozempic and Wegovy. The market for these medications is expected to hit $324 billion by 2035.
Why should we care? Well, turns out folks on these drugs need massive amounts of protein to avoid losing muscle along with the weight. The bariatric surgery folks updated their guidelines this year—they’re recommending 1.2 to 2.0 grams of protein per kilogram of body weight for these patients. That’s way above normal recommendations.
Dr. Donald Layman—Professor Emeritus at Illinois, who has been studying protein metabolism forever—told me whey protein’s become the gold standard. “The amino profile and absorption rate match exactly what GLP-1 patients need,” he explained. “You can’t get that efficiency from plant proteins.”
And the market’s responding in real time. CME spot dry whey prices jumped 19.8% in just a month, while Class III and IV are struggling. Lactalis rolled out GLP-1-specific yogurt lines that are flying off shelves. Danone’s high-protein Oikos line posted 40% growth last quarter. Even Nestlé’s getting in on it, developing what they call “next-gen functional proteins” specifically for the weight-loss market.
Here’s what this means for us: a 500-cow herd pushing protein above 3.2% can pocket an extra $50,000 to $100,000annually, just from protein premiums. That’s based on current Federal Milk Marketing Order pay schedules. Real money that could make the difference between red and black ink.
The 24-Month Crunch: Who Exits? Who Thrives?
I’ve been having a lot of conversations lately about survival math. Here’s how I think the next two years play out:
Right now through early 2026: We’re in the “kitchen table decision” phase. A Farm Credit rep in Wisconsin told me they’re seeing two to three times the usual requests for transition planning. “These aren’t distressed operations yet,” he said. “They’re farmers who can read the writing on the wall.”
Spring and summer 2026: That’s when the new processing capacity comes online hard. Valley Queen’s expansion, multiple Texas and Kansas cheese plants. The mega-dairies will lock in those contracts first, leaving mid-size operations scrambling. CoBank expects 3% to 5% of operations to exit during this window. Not all bankruptcies—but hard transitions.
Late 2026 into 2027: Cornell’s Dyson School economists are flagging rapid compression—25% to 40% of milk could come from operations over 5,000 cows. Dr. Andrew Novakovic at Cornell compared it to the ’80s consolidation, but compressed. “What took ten years then is happening in two or three now,” he told me.
2027-2028: We’ll likely stabilize at 12,000 to 18,000 farms total, down from today’s 26,000. The rest get absorbed or shut down.
What This Means for Different Operations
So what’s a producer to do? Well, it depends on your situation.
If you’re running a mega-dairy (5,000+ cows): Your advantages are clear—scale, technology, processor relationships. Just don’t overleverage. Keep debt under 40% of assets—that’s what saved the survivors in 2009 and 2020. And plan for those beef-on-dairy premiums to drop back to $400-500 when the beef herd rebuilds. It always does.
If you’re mid-size (500-2,000 cows): This is where it gets tough. If you’re losing money on milk alone, that beef-on-dairy revenue is buying time, not solving problems. Gary Sipiorski at Vita Plus puts it bluntly: “Q1 2026 is your decision window.” Exit while you have equity, find a niche, or partner up for scale.
I’ve seen success stories from Northeast operations doing direct sales, some Georgia and Texas folks making it work with heat-tolerant crossbreeds and targeted butterfat contracts. Down in Arizona, several mid-size operations formed a marketing co-op specifically for premium contracts. There are paths forward, but they require decisive action.
If you’re smaller (under 500 cows): Don’t write yourself off. Direct sales, on-farm processing, high-premium markets like A2 or grassfed with strong local brands—these can work if you’re committed. Bob Cropp at Madison always says, “Niche isn’t enough—you need real differentiation and usually some off-farm income during transition.”
The Stuff That’s Not in the Spreadsheets
Mental health matters here. Every banker I talk to mentions family stress. The Wisconsin Farm Center offers free, confidential counseling. Minnesota has their Farm & Rural Helpline (833-600-2670). Iowa State Extension runs Iowa Concern (800-447-1985). Most states have similar programs—find yours and use it. I’ve seen too many good operators make bad decisions because stress clouded their judgment.
Policy risk is real. Don’t build a five-year plan assuming today’s Dairy Margin Coverage program or immigration rules stick around. They won’t. Build flexibility into your planning.
Water—if you’re in the Southwest, plan for 30% cuts in availability by 2030. That’s what the Bureau of Reclamation models suggest. I talked to a Central Texas dairyman who’s already hauling water weekly, and another in New Mexico who’s paying $200 per acre-foot—triple what he paid five years ago. Changes everything about your cost structure.
And technology disruption? Precision fermentation isn’t science fiction anymore. Fonterra just put $50 million behind it. Perfect Day is already selling ice cream made with lab-produced dairy proteins. We can’t ignore this stuff.
Looking Forward: Building Smart AND Resilient
What I keep asking myself is—are we optimizing for the wrong things? Dr. James Dunn at Penn State warns that stable conditions reward efficiency, but what happens when things get less stable?
I think adaptability wins. The operations that’ll thrive in 2028 won’t necessarily be the biggest or most efficient. They’ll be the ones with options—not all-in with one processor, not overleveraged, not betting everything on one market.
Watch what’s happening in Europe with their farm protests. See New Zealand fighting environmental regulations. Australia’s dealing with drought cycles that make our weather look predictable. No export market is guaranteed. No playbook survives every storm.
The Bottom Line
If there’s one thing I’d leave you with, it’s this: the window for proactive decisions—whether that’s expansion, exit, or complete restructuring—is closing faster than most of us realize. By Q1 2026, most of the good options will be taken.
Push for higher components, not just volume. Be realistic about calf prices. Know your regional advantages—whether that’s proximity to processors in Kansas or grassfed premiums near Boston. And don’t try to go it alone. Get good advice. Run real numbers. Have honest conversations with your family.
The industry isn’t dying, but it is shedding its skin. Make sure you aren’t the one shed with it.
Your state’s Farm Center or Extension can help—Wisconsin’s is free and confidential (800-942-2474). Farm Aid runs a national hotline at 1-800-FARM-AID. The National Suicide Prevention Lifeline (988) has agricultural specialists available. Sometimes the hardest conversation is the one that saves your farm—or helps you exit with dignity and equity intact.
KEY TAKEAWAYS
Decision Deadline: Q1 2026 – After this, you lose all strategic options. Exit now = $200-400K preserved equity. Exit later = bankruptcy.
Immediate Revenue: Chase Protein Premiums – Getting above 3.2% protein captures $50-100K annually (500 cows) from GLP-1 demand while you plan next moves.
Reality Check Your Business – If you need $1,600 beef calves to survive, you’re already dead. Plan for $500 calves, $15 milk, and 30% less water (Southwest).
Only 3 Models Survive – Mega-scale (5,000+ cows), radical differentiation (A2, grassfed, on-farm processing), or strategic exit. “Local” and “family farm” aren’t differentiators.
Geographic Destiny – Kansas/Idaho/Texas have won. Traditional dairy states face a permanent 15% cost disadvantage. Location now determines survival more than management.
Complete references and supporting documentation are available upon request by contacting the editorial team at editor@thebullvine.com.
Learn More:
Beef-on-Dairy: Real Talk on Turning Calves into Serious Profit – Provides specific feeding protocols and genomic cut-off points (top 40% vs. bottom 35%) to maximize calf value, ensuring your crossbreds actually hit the $1,400 premiums mentioned in the main article rather than getting discounted.
Join over 30,000 successful dairy professionals who rely on Bullvine Weekly for their competitive edge. Delivered directly to your inbox each week, our exclusive industry insights help you make smarter decisions while saving precious hours every week. Never miss critical updates on milk production trends, breakthrough technologies, and profit-boosting strategies that top producers are already implementing. Subscribe now to transform your dairy operation’s efficiency and profitability—your future success is just one click away.
One decision in 2022 split dairy into winners and losers. The 30-month biology clock just rang. Which side are you on?
Executive Summary: The U.S. dairy industry faces a 47-year low in replacement heifers (3.914 million head), with bred springers commanding $4,500—a crisis born from 72% of farms choosing beef-on-dairy breeding to survive 2022-2023’s brutal economics. Biology’s inflexible 30-month timeline means the survival decisions made today are creating today’s shortage, splitting the industry into clear winners and losers. Pennsylvania’s 30,000-heifer advantage translates to $120 million in strategic value, while Kansas farms missing 35,000 head scramble for replacements they can’t afford. By 2030, the industry consolidates from 26,000 to 21,000 operations, with only three paths forward: mega-dairies capturing scale, niche operations commanding premiums, or mid-size farms securing processor relationships. Operations needing over $350,000 for replacements face immediate strategic decisions—breeding choices made today determine 2028 survival.
The dairy industry is facing a structural shift not seen since 1978. The USDA’s January inventory shows we’re down to just 3.914 million replacement heifers—that’s the lowest in 47 years. Quality bred springers are commanding $3,200 to $4,500 at auctions at auctions from Lancaster to Tulare, it’s clear this isn’t your typical market cycle that’ll sort itself out.
Here’s what’s really interesting… this whole situation stems from decisions most of us made during that brutal stretch in 2022-2023, when we were just trying to survive. The National Association of Animal Breeders—that’s NAAB for those keeping track—shows about 72% of dairy farms shifted to beef-on-dairy breeding back then, and honestly, it made perfect sense at the time. But those decisions locked us into a biological timeline—that 30-month cycle from breeding decision to fresh heifer—that no amount of money or technology can speed up. The operations that understood this reality early? They’re positioned to dominate the next decade. Those who focused on quarterly cash flow are… well, they’re having some really tough conversations right now.
Heifer prices have rocketed by 295% since 2019, topping out at $4,500 in 2025—a momentum shift so powerful, it’s redrawing farm budgets and the survival map for U.S. dairies.
How Survival Economics Created Today’s Crisis
Let me take you back to what we were all dealing with in 2022-2023. Wisconsin’s All-Milk price had crashed to $17.40 per hundredweight by July 2023, while corn was hitting $6.50 per bushel and soybean meal was pushing $480-500 per ton on the CME. I mean, those were brutal numbers for anyone trying to keep the doors open.
So beef-on-dairy breeding became this lifeline, right? NAAB’s data shows crossbred calves were bringing $1,000 to $1,200 during that stretch, compared to maybe $300-500 for straight Holstein bulls. Do the math on a thousand-cow operation—that’s easily $100,000 to $140,000 in extra revenue. For many of us, that was literally the difference between staying in business and bankruptcy.
What really tells the story is how fast this shift happened. NAAB’s quarterly reports show beef semen sales to dairy farms jumping from 5 million units in 2020 to 7.9 million units in 2024—that’s a 58% increase. By last year, about 84% of all beef semen sold in America was going to dairy operations, with roughly 72% of farms using it in their programs.
Michigan producers, for example, report spending $2,100 to $2,200 to raise a heifer from birth to fresh, but market values had dropped to around $1,200. So they’re losing a grand on every heifer raised, while beef-cross calves are generating $900 to $1,000 at just 10 days old. What would you have done?
But here’s the thing—and I think we all knew this intellectually but didn’t fully appreciate it at the time—biology doesn’t care about our quarterly financial statements. Those breeding decisions from 2022? They don’t produce replacement heifers until 2025-2026. That 30-month timeline from breeding to fresh heifer… you can’t compress it, no matter how desperate things get.
The dairy supply crisis explained in one frame: a 47-year low in heifer numbers collides with record price inflation—squeezing mid-size farm margins from both sides.
Regional Winners and Those Facing Challenges
What’s fascinating is how differently this is playing out across regions. The strategic decisions folks made between 2019 and 2023 essentially determined who’s thriving now and who’s struggling.
Pennsylvania’s Strategic Windfall
Pennsylvania really caught everyone by surprise, didn’t they? The USDA’s January inventory shows they added 30,000 replacement heifers—that’s a 15% increase—while keeping cow numbers fundamentally flat. At current prices, we’re talking $90 to $120 million in strategic inventory advantage for the state.
I’ve been following what’s happening with custom heifer raisers around Lancaster County. Operations running 300-500 head are seeing some remarkable economics. Penn State Extension’s surveys, led by dairy specialist Rob Goodling, are documenting profits of $550 to $726 per contracted heifer, with spot-market opportunities ranging from $1,076 to $1,276 per head.
One operator told me recently, “I’m getting $2,850 per head delivered on my contracts. Sure, spot market might bring $3,200 to $3,400, but contracts give me certainty.” Then he mentioned—and this really shows how wild demand has gotten—”Texas operations are calling, offering $4,200 per head plus $380 trucking for bred springers I can deliver in March.” Never seen anything like it.
Kansas’s Processing Capacity Dilemma
Now, Kansas… that’s a whole different story. They lost 35,000 dairy replacement heifers, according to USDA reports—the largest single-state decline. And this is happening right when they’re part of that massive $10-11 billion wave of national dairy processing investments. Talk about bad timing.
Betty Berning, senior analyst at Daily Dairy Report, pointed this out back in March, and it really stuck with me. Kansas added just 3,000 cows in 2023, despite all these new cheese plants needing millions of pounds of milk daily. The arithmetic just doesn’t work for filling that new processing capacity.
I’ve been talking with producers running 800-900 cow operations out there, and the math they’re facing is tough. Say you need 280 fresh heifers in 2026 to maintain herd size, but your internal pipeline only produces 150. That means buying 130 head externally at an average of $3,500—we’re talking $455,000 in capital requirements. When you’re already sitting at 43-44% debt-to-equity? Your banker’s going to have concerns, and honestly, they should.
The Upper Midwest’s Balanced Approach
What’s encouraging is seeing what Wisconsin, Minnesota, and South Dakota managed to do. They collectively acquired 20,000 replacement heifers, according to state reports, by maintaining strategic breeding programs even when the economics looked terrible.
Curtis Gerrits, senior dairy lending specialist at Compeer Financial, said something recently that captures it well: processors in their region work with farmers who consistently deliver high-quality milk, and those relationships include about $0.85 per hundredweight in quality premiums for consistent volume and good components. That’s enough to make a real difference.
A few things these states had going for them:
Those processor relationships with meaningful premiums for consistency
Custom heifer-raising infrastructure that survived the downturn
And this matters—lower HPAI exposure compared to what California and Idaho dealt with
It’s worth noting what’s happening globally, too. New Zealand’s production is running about 3% ahead of last season, and Europe’s recovery is underway despite its bluetongue challenges. That means U.S. processors facing domestic supply constraints have import options, which affects everyone’s pricing dynamics. But imports can’t fully replace local supply relationships—especially for specialized dairy farm survival strategies that depend on regional processor partnerships.
Strategic decisions made in 2019-2023 have created stark regional winners and losers: Pennsylvania’s 30,000-heifer surplus translates to $90-120M in market advantage, while Kansas faces a 35,000-heifer deficit that threatens its ability to supply $11 billion in new processing capacity
Where This Industry’s Heading by 2030
Looking at projections from the USDA Economic Research Service and groups like the IFCN Dairy Research Network, we’re likely to see 21,000 to 24,000 total dairy operations by 2030. That’s down from about 26,000 to 27,000 today. But it’s not just simple consolidation—it’s a complete restructuring of how the industry works.
The Large-Scale Reality (3,500- 10,000+ cows)
We’ll probably see about 2,500 to 3,000 of these mega-operations producing 80% of the national milk supply. Wisconsin’s dairy farm business summaries show these folks are achieving production costs around $14.20 to $15.80 per hundredweight through their operational efficiencies. Pretty impressive.
A surprising and significant factor is that many are also generating $800,000 to $1.8 million annually from renewable energy credits. The California Air Resources Board data on this is eye-opening. These operations can afford to pay $4,200 for a replacement heifer because their scale and contracts support it.
The Premium Niche Path (40-150 cows)
I’m seeing maybe 12,000 to 15,000 smaller operations finding real success through differentiated marketing. They’re capturing $35 to $50 per hundredweight through direct sales—compare that to the $21 or so we see in Federal Order commodity markets. That’s a completely different business model.
Vermont’s organic dairy studies show these operations can generate $220,000 to $650,000 in family income with minimal debt. Sure, marketing takes up 25-35% of their time, but if you’re near Burlington or Boston, where consumers value what you’re doing? It works.
The Challenging Middle (200-800 cows)
This is where it gets tough—maybe 6,000 to 9,000 operations producing 8-12% of milk supply. Too big for farmers markets, too small for those mega-dairy efficiencies. The ones making it work either have strong processor relationships with meaningful premiums, specialized markets like A2 or grass-fed, or they’ve diversified into custom heifer raising themselves.
What We Can Learn from Those Who Saw This Coming
I’ve spent a lot of time trying to understand what separated operations that maintained replacement programs through the tough years from those that didn’t. A few patterns keep showing up.
They Thought in Biological Timelines, Not Quarters
Take Kress-Hill Dairy in Wisconsin. Nick Kress and Amanda Knoener kept investing in registered genetics when beef premiums peaked. Holstein Association records show they’ve now got 18 Excellent and 99 Very Good cows. That’s serious genetic value in today’s market.
They Protected Their Pipeline
Rose Gate Dairy up in British Columbia does something interesting—they wait until cows are 40-60 days fresh before making culling decisions. This ensures they don’t short themselves on replacements. While neighbors were chasing every beef premium, they kept asking, “What’s our 2025 pipeline look like?”
They Invested Before the Crisis Hit
The Moes family at MoDak Dairy in South Dakota—130 years of continuous operation, which tells you something—manages all heifers on-site in well-designed facilities. They balance current technology with proven practices rather than jumping on every trend. Smart approach.
They Did the Multi-Lactation Math
Penn State’s data shows home-raised feed costs account for about 42% of total heifer expenses—roughly $893 out of $2,124. Operations with good crop-to-cow ratios who maintained this advantage? They’re consistently among the most profitable farms in their regions.
They Ran Complete Scenarios
There’s research in the Journal of Dairy Science that followed 29 farms for 5 years. Producers making optimal replacement decisions generated about $175 more monthly than those making suboptimal choices. The successful folks all ran scenarios like: “If heifers hit $3,500 and we need 150, can we actually finance $525,000?”
Cost Component
Cost per Heifer
% of Total
Key Notes
Opportunity Cost (calf not sold)
$1,742
60%
Record calf prices inflate this
Labor (23.5/hr)
$261
9%
Avg dairy wage rates
Feed & Nutrition
$174
6%
Lower grain costs 2025
Veterinary & Health
$116
4%
Vaccine price increases
Machinery & Equipment
$174
6%
Depreciation included
Land & Housing
$145
5%
Opportunity cost of land
Other (fuel, utilities, etc)
$292
10%
Building maintenance, etc
TOTAL – Home Raised
$2,904
100%
Adjusted for 10% open rate
Market Purchase Price – 2025
$4,200
—
Peak auction prices
SAVINGS BY RAISING
$1,296
54% cheaper
IF you can manage costs
Why Technology Can’t Fix This Fast Enough
A lot of folks are hoping that sexed semen can solve the replacement shortage. I get it—the technology’s improved tremendously. But when you look at the reality…
University of Florida and Wisconsin research consistently shows conventional semen gets you 58-65% conception rates on heifers. Sexed semen? You’re looking at 45-55%. That changes your cost per pregnancy from about $42 to $90. That’s real money when you’re breeding hundreds of animals.
But here’s the bigger issue with timing. Even if you started today with perfect execution, those pregnancies give you calves in August-September 2026. Those calves won’t freshen until February-March 2029. Operations need replacements in early 2026. Biology has its own schedule, and it doesn’t negotiate.
Plus—and people often forget this—effective sexed semen programs need serious infrastructure. Extension estimates suggest $30,000 to $72,500 for detection systems, training, and facility upgrades. Operations already at 43-44% debt-to-equity? That capital just isn’t available.
Looking ahead, emerging technologies might help—gene-editing approvals could accelerate genetic progress, and automation might reduce labor constraints—but these are 5-10-year developments, not 2-year solutions.
Your Strategic Framework for Current Conditions
So where does this leave us? Here’s what I’ve been telling folks who ask about navigating this situation.
First, Get Real About Your Pipeline
Calculate what you actually need for 2026-2027. Compare what you can raise internally versus what you’ll need to buy. Model it at $3,500-$4,500 per head. If you’re looking to make purchases of more than $350,000—essentially 100+ animals—you need to rethink your breeding strategy immediately.
Second, Understand Your Regional Position
Growth regions like Wisconsin, South Dakota, Michigan, and even parts of Texas? You can position for expansion. Contraction regions—thinking of parts of California, the Southwest, and the Southeast—might benefit from planned consolidation. Transition regions like Kansas and Idaho? You either need rock-solid processor relationships or… well, you need to consider alternatives.
Third, Pick Your Path
Can you reach 3,500+ cows while keeping manageable debt? That’s one path. Are you near a city with direct marketing skills? That’s another. Stuck in the middle at 200-800 cows? You need processor premiums or specialized markets to make it work.
Fourth, Run the Financial Reality Check
Calculate your debt service coverage ratios using current replacement costs. Test scenarios cost between $17 and $21 with milk. If your DSCR drops below 1.25, you need contingency plans now, not next year.
If you’re in that tough spot, remember there’s help available. USDA’s Farm Service Agency has restructuring programs, many Extension offices offer confidential financial counseling, and Farm Credit counselors understand these specific pressures. You don’t have to navigate this alone.
Fifth, Think Biology, Not Just Finance
Every breeding decision today affects 2028-2029 replacement availability. Infrastructure investments typically need 3-5 year paybacks. And processors remember who delivered consistent volume through the tough times.
Quick Reference: Critical Thresholds
Current Replacement Costs (November 2025):
Pennsylvania/Northeast: $3,200-$3,800
Wisconsin/Upper Midwest: $3,000-$3,500
California/West: $3,500-$4,000
Texas (importing): $4,200 plus $380 trucking
The Biological Timeline (It Doesn’t Negotiate):
Breeding to birth: 9 months
Birth to breeding age: 13-15 months
Breeding to fresh: 9 months
Total: 31-33 months if everything goes perfectly
Financial Warning Signs:
Debt-to-equity over 50%? That’s concerning
DSCR below 1.25? Most lenders get nervous
Need over $350,000 for replacements? Time for strategic changes
The Bottom Line as I See It
After watching this unfold and talking with producers across the country, a few things are crystal clear.
These replacement costs—$3,000 to $4,500 per head—aren’t a temporary spike. CoBank’s modeling and what we’re seeing at auctions suggest this is the new baseline through at least 2027. Plan accordingly.
Regional advantages compound fast. Pennsylvania is sitting on 30,000 extra heifers? That’s a real competitive advantage. Kansas is missing 35,000? That’s an existential challenge, even with all that processing investment.
Three models will dominate by 2030: mega-dairies with scale efficiencies, premium niche operations with loyal customers, and mid-size survivors who found their special angle. Everything else faces increasing pressure.
For new folks wanting in? Cornell and Penn State studies show you need a minimum of $2.83 million to $4.875 million for a conventional startup. The next generation enters through inheritance, processor partnerships, or niche markets. Traditional bootstrap dairy farming? That door’s fundamentally closed.
And this is the key difference—biology beats finance every time. Operations that recognized those 30-month timelines positioned themselves well. Those who optimized for quarterly cash? They’re having much harder conversations right now.
What really separates winners from those struggling isn’t access to better information. It’s having better frameworks for using that information. Successful operations asked, “What’s 2027 look like?” while others asked, “How do I maximize this quarter?”
That difference—thinking in biological timelines versus financial quarters—determines who captures supply premiums through 2030 and who’s evaluating exit strategies.
This transformation is permanent. The industry structure emerging from this will define American dairy through 2035. Each of us needs to figure out where we fit in that structure, because the decisions we make today determine what opportunities we have tomorrow.
And remember, this industry has weathered tough cycles before. Those who adapt, who think strategically, who understand both the biological and economic realities—they’ll find their way through. The dairy industry needs milk, processors need suppliers, and consumers still want dairy products. The question isn’t whether there’s a future in dairy—it’s what that future looks like and who’s positioned to capture it.
Key Takeaways:
The $350,000 test: If you need 100+ replacement heifers, you’re facing $350,000-$450,000 in capital needs—breeding strategy must change immediately, or consider consolidation options
30-month reality: Biology doesn’t negotiate—decisions made in 2022 determine 2025-2026 heifer availability, and today’s breeding choices lock in 2028-2029 survival
Regional winners declared: Pennsylvania’s 30,000-heifer surplus commands market premiums while Kansas’s 35,000-heifer deficit threatens processor contracts despite billions in new capacity
Three paths forward: By 2030, only mega-dairies (3,500+ cows with scale), niche operations ($35-50/cwt premiums), or mid-size farms with processor relationships will survive
Think biology, not quarterly profits: Operations that preserved replacement pipelines during 2022’s cash crunch now name their price; those that maximized short-term revenue face existential decisions
Editor’s Note:This analysis examines the dairy replacement heifer crisis as of November 2025, drawing on the latest USDA inventory data, market reports, and industry projections through 2030.
Learn More:
Are You Raising Too Many Heifers? – This practical guide provides a framework for “right-sizing” your replacement program. It offers tactical methods for calculating your true heifer needs to optimize cash flow and avoid future inventory crises.
Beef on Dairy: The Pendulum Has Swung Too Far – This strategic analysis dives deeper into the beef-on-dairy trend that caused the current shortage. It examines the market volatility and long-term economic consequences, reinforcing the main article’s “biology vs. finance” thesis.
Sexed Semen: “Am I Doing This Right?” – While the main article notes technology isn’t a quick fix, this piece explores the correct implementation. It provides innovative strategies for using sexed semen effectively to maximize conception rates and accelerate genetic gain.
Join the Revolution!
Join over 30,000 successful dairy professionals who rely on Bullvine Weekly for their competitive edge. Delivered directly to your inbox each week, our exclusive industry insights help you make smarter decisions while saving precious hours every week. Never miss critical updates on milk production trends, breakthrough technologies, and profit-boosting strategies that top producers are already implementing. Subscribe now to transform your dairy operation’s efficiency and profitability—your future success is just one click away.
Milk at $18. Butter at $1.50. But heifers at $3,200 tell the real story. The recovery’s already starting—if you know where to look.
EXECUTIVE SUMMARY: A Wisconsin dairy producer’s confession reveals the new reality: “I watch New Zealand milk production closer than my own bulk tank.” While traditional metrics show disaster—butter at $1.50, milk under $18, three forward signals are flashing a recovery 3-4 months out. Weekly dairy slaughter remains at historic lows (230k vs. 260k trigger) because $900-$1,600 crossbred calves are keeping farms afloat, breaking the normal correction cycle. Smart operators monitoring Global Dairy Trade auctions and $230/cwt cattle futures have already locked in $4.38 corn, gaining $1.20/cwt margin advantage over those waiting for Class III improvements. With heifer inventories at 40-year lows (3.914 million head), operations that went heavy on beef-on-dairy face a cruel irony: they survived the crash but can’t expand in recovery. The next 18 months won’t reward efficient production—they’ll reward those watching the right signals.
Last week, a Wisconsin producer told me something that stopped me in my tracks: “I’m watching New Zealand milk production closer than my own bulk tank readings.”
That conversation captures perfectly how dairy economics have shifted. And looking at Monday’s CME spot prices—butter hitting $1.50 a pound, lowest we’ve seen since early 2021—alongside December cattle futures losing nearly twenty bucks per hundredweight over the past couple weeks, you can see why traditional metrics aren’t telling the whole story anymore.
Here’s what’s interesting, folks… while everyone’s fixated on Class III and IV prices that essentially report yesterday’s news, there are actually three specific signals providing genuine forward-looking intelligence. I’ve been tracking these with producers across the country for the past year, and what I’ve found is that the patterns could determine which operations thrive during this transition period.
AT A GLANCE: Your Three Critical Market Signals
Three Forward Signals Dashboard provides dairy producers with actionable intelligence 90-120 days before traditional Class III prices signal recovery—those monitoring these indicators have already locked in $4.38 corn and gained $1.20/cwt margins over competitors waiting for conventional signals. This is Andrew’s edge: forward-looking data that beats reactive strategies.
📊 Signal #1: Weekly dairy cow slaughter exceeding prior year by 8-10% for three consecutive weeks 📈 Signal #2: GDT auctions showing 6-8% cumulative gains over four consecutive sales 📉 Signal #3: December cattle futures 30-day moving average crossing above 200-day at $230+/cwt
The Perfect Storm We’re Navigating Together
You’ve probably noticed this already, but what we’re experiencing isn’t your typical dairy cycle. It’s more like… well, imagine several weather systems colliding simultaneously, each amplifying the others in ways most of us haven’t seen before.
The Production Surge
So here’s what the USDA data shows—milk production increased 3.5% through July, and those butterfat tests? Katie Burgess over at Ever.Ag called them “somewhat unbelievable” in her recent market analysis, and honestly, she’s spot on. I’m seeing consistent test results of 4.2% butterfat, even 4.3%, across multiple regions—Wisconsin operations, Pennsylvania farms, and even out in California—when just two years ago, 3.9% was considered excellent.
You know what’s happening here, right? We’re all getting better at managing transition periods, feeding programs are more precise, genetics keep improving… but when everyone’s achieving similar improvements simultaneously, well, the market gets saturated. And that’s exactly what we’re seeing.
Global Supply Pressure
The Global Dairy Trade auction has declined for three straight months now, and that’s coinciding with European production recovering—you can see it in the Commission’s September data—and Fonterra announcing that massive 6.3% surge in September collections. When major exporters increase production simultaneously like this… friends, you know what happens to prices.
Domestic Demand Challenges
Meanwhile, domestic demand faces unprecedented pressure. Those SNAP benefit adjustments affecting 42 million Americans? They’re creating ripple effects throughout the retail sector. Food banks across Iowa are reporting demand increases of ten to twelve times normal—I mean, the Oskaloosa facility went from distributing 300-400 pounds typically to nearly 5,000 pounds in the same timeframe. That’s not sustainable.
A Lancaster County producer managing 750 Holsteins shared an interesting perspective with me recently:
“Component payments help, sure, but when everyone’s achieving similar improvements, the market gets saturated. And those fluid premiums we used to count on? They’re basically evaporating as processors shift toward manufacturing.”
The Broken Feedback Loop
Here’s what really caught me off guard, though—that traditional feedback loop where low prices trigger culling, which reduces supply and brings markets back? It’s broken.
With crossbred calves commanding anywhere from $900 to $1,600 at regional auctions—and I’m seeing this from Pennsylvania clear through to Minnesota based on the USDA-AMS reports—compared to maybe $350-$400 back in 2018-2019, that additional beef revenue is keeping operations afloat despite negative milk margins.
The Beef-on-Dairy Survival Paradox illustrates the cruel irony facing dairy producers: crossbred beef calves now generate 20-25% of farm revenue (at $900-$1,600 each vs. $350-$400 for dairy heifers), which kept operations afloat during low milk prices—but eliminated the heifer inventory needed for expansion when markets recover. Survival strategy becomes growth killer.
Three Dairy Market Signals Worth Your Morning Coffee
📊 SIGNAL #1: Weekly Dairy Cow Slaughter Patterns
When: Every Thursday at 3:00 PM Eastern Where: USDA Livestock Slaughter report at usda.gov Time Required: 5 minutes
What’s fascinating is the consistency here—dairy cow culling has run below prior-year levels for 94 out of 101 weeks through July, according to USDA’s cumulative statistics. Year-to-date culling? It’s the lowest seven-month figure since 2008, and we’ve got a much bigger national herd now.
🎯 THE KEY THRESHOLD: Three consecutive weeks where slaughter exceeds prior-year levels by 8-10% or more
When weekly figures rise from the current 225,000-230,000 head range toward 260,000-270,000 head, that signals crossbred calf values have finally declined below that critical $900-$1,000 level where they no longer offset weak milk margins.
💡 WHY IT MATTERS: A 600-cow operation near Eau Claire started monitoring these signals back in March, locked in feed when they saw the pattern developing, and improved margins by $1.20/cwt compared to neighbors who waited. That’s real money, folks.
📈 SIGNAL #2: Global Dairy Trade Auction Trends
When: Every two weeks, Tuesday evenings, our time Where: globaldairytrade.info (free access) Time Required: 15 minutes
I’ll be honest with you—for years, I ignored these New Zealand-based auctions, thinking they were too far removed from Midwest realities. That was an expensive mistake.
🎯 THE KEY THRESHOLD: Four consecutive auctions showing cumulative gains of 6-8% or higher, with whole milk powder exceeding $3,400/MT
Katie Burgess explains it well: “GDT auction results in New Zealand influence U.S. milk powder pricing dynamics.” And the correlation is remarkably consistent—GDT movements typically show up in CME spot markets within two to four weeks.
💡 INSIDER PERSPECTIVE: A Midwest cooperative CEO recently shared this with me—can’t name the co-op for competitive reasons—but he said: “We’ve integrated GDT trends into our pooling strategies. Sustained upward movement there typically translates to improved export opportunities within 30-45 days.”
📉 SIGNAL #3: Cattle Futures Technical Analysis
When: Daily monitoring Where: Any free futures charting platform Time Required: 5 minutes daily
With the National Association of Animal Breeders data showing 40-45% of dairy pregnancies now utilizing beef sires, and those calves generating 20-25% of total farm revenue, cattle market volatility directly impacts our cash flow.
🎯 THE KEY THRESHOLD: 30-day moving average crossing above 200-day moving average while December futures maintain above $230/cwt
Recent movements illustrate the impact perfectly—when cattle prices dropped in October, crossbred calf values fell by $200-$250 per head. For a 1,500-cow operation with 40% beef breeding, that’s substantial revenue reduction… we’re talking six figures of annual impact.
💡 PRO TIP: If you’re just starting to track these signals, give yourself a full month to establish baseline patterns before making major decisions based on them. As many of us have learned, knee-jerk reactions rarely pay off.
✓ Access USDA slaughter report (3 PM ET) ✓ Calculate 4-week moving average vs. prior year ✓ Note trend acceleration or deceleration
BIWEEKLY GDT DAYS (15 minutes)
✓ Monitor GDT Price Index and whole milk powder ✓ Calculate 3-auction cumulative change ✓ Compare with NZ production reports
MONTHLY DEEP DIVE (worth the hour)
✓ USDA Cold Storage report analysis ✓ Regional milk production review ✓ Update beef-on-dairy calf values ✓ Calculate actual production cost/cwt ✓ Evaluate 2:1 current ratio benchmark
Understanding the Structural Shifts Reshaping Our Industry
The Heifer Shortage: By the Numbers
The 40-Year Heifer Crisis shows U.S. dairy heifer inventory at 3.914 million head—the lowest level since 1978—creating an expansion trap where even when milk prices recover to $22/cwt, operations can’t grow due to $3,200 heifer costs and limited availability. This isn’t a cyclical problem; it’s a structural crisis that will define the industry for years.
You know, CoBank’s August dairy report really opened some eyes—they’re projecting an 800,000 head decline in heifer inventories through 2026. And the January USDA Cattle inventory confirmed we’re at just 3.914 million dairy heifersover 500 pounds. That’s the lowest since 1978, folks.
Current Reality:
$3,200 current bred heifer cost (compared to $1,400 three years ago)
Wisconsin actually added 10,000 head
Kansas dropped 35,000 head
Idaho lost 30,000 head
Texas shed 10,000 head
A Tulare County producer summed it up perfectly when he told me: “The irony is crushing—beef-on-dairy revenue helped us survive the downturn, but now expansion is virtually impossible without heifers.”
SNAP Impact: The Ripple Effect
When those 42 million Americans saw their SNAP benefits cut from $750 to $375 for a family of four… the impact on dairy demand was immediate and, honestly, worse than I expected.
The Numbers:
50% benefit reduction starting November 1st
10-15% reduction in retail dairy orders within the first week
Andrew Novakovic from Cornell’s Dyson School—he’s been studying dairy economics for decades—offers crucial context: “Dairy products often see early reductions when household budgets tighten. Unfortunately, many consumers categorize dairy as discretionary when financial pressures mount.”
Global Dynamics: The New Reality
Twenty years ago, friends, U.S. dairy prices were mostly about what happened between California and Wisconsin. Today? With 16-18% of our production going to export markets, what happens in Wellington, Brussels, and Beijing matters just as much.
Key Production Increases:
Ireland’s up 7.6% year-to-date through May
Poland’s share grew from 1.9% to 3.9% of EU production over five years
New Zealand hit four consecutive monthly records through September
China’s now 85% self-sufficient, up from 70%
Ben Laine over at Rabobank explained it well: “When major exporters increase production simultaneously while China requires fewer imports, prices have to adjust globally. These signals reach U.S. farms within weeks, not months.”
Action Plans by Operation Type
📗 For Growth-Oriented Operations
Genomic Testing ROI:
I’ll admit, spending $45 per calf for genomic testing when milk prices are in the tank seems counterintuitive. But here’s the math that convinced me:
Test 300 heifer calves at $45 each: $13,500
Apply sexed semen to top 120 at $27 extra per breeding: $3,240
University dairy economics programs have validated these projections, and frankly, those numbers work in any market.
Risk Management Stack:
You can’t rely on DMC alone—it hasn’t triggered meaningful payments in over a year according to FSA records. Smart operators are layering:
DMC at $9.50: ~$0.15/cwt for first 5 million pounds
DRP at 75-85%: Premiums run 2-3% of protected value
Forward contracts: 30-40% when you see $19+/cwt
📘 For Transition Candidates
Three Proven Paths:
Collaborative LLC: Three farms near Fond du Lac reduced per-cow investment from $8,000 to $3,200 by sharing infrastructure
Premium Markets: A2 can bring a $4/cwt premium; organic runs $20/cwt over conventional if you can secure a buyer first
Strategic Exit: You preserve 80-85% of equity in a planned transition versus maybe 50% in distressed liquidation
📙 For Next Generation
If you’re under 30 and considering this industry, you need to know it’s fundamentally different from what your parents knew. University programs like Wisconsin’s Center for Dairy Profitability and Cornell’s PRO-DAIRY are developing specific resources for younger producers navigating this new environment. Use them.
Regional Snapshot: Your Competition and Opportunities
Southwest: Water costs are doubling in some areas. One Albuquerque producer told me they’re making daily tradeoffs between feed production and maintaining adequate water for the herd.
Northeast: Those fluid premiums we used to count on? They’ve compressed from $2-3/cwt down to $0.50-1.00 in many months.
Pacific Northwest: Urban pressure near Seattle and Portland—plus down in Salem—has reduced available land by 30% in five years for some operations. A Yakima producer told me they’re now focusing entirely on efficiency rather than expansion.
Upper Midwest: Generally best positioned with those heifer additions and relatively stable production costs. Wisconsin operations, particularly, are seeing benefits from their heifer inventory decisions.
The Path Forward: Your 18-Month Strategy
You know, a Turlock-area veteran told me something last week that really stuck: “We’ve shifted from watching weather and milk prices to monitoring New Zealand production and Argentine beef policy. This isn’t the dairy farming of previous generations, but it’s our evolving reality.”
The coming 18 months will challenge all of us, yet patterns remain identifiable for those watching. Markets will recover—they always do—but the question is whether your operation will be positioned to benefit from that recovery.
Looking at this trend, farmers are finding that appropriate signal monitoring, combined with decisive action, makes the difference. Your operation deserves strategic planning beyond hoping for better prices. And with the right approach, achieving better outcomes remains entirely possible.
Because at the end of the day, friends, as many of us have learned, success in modern dairy isn’t just about producing quality milk anymore. It’s about understanding global dynamics, managing risk intelligently, and making informed decisions based on forward-looking indicators rather than yesterday’s prices.
The tools are there. The signals are clear. What we do with them over the next 18 months will determine who’s still farming when this cycle turns—and it will turn. It always does.
KEY TAKEAWAYS:
Monitor three signals, not milk prices: Weekly slaughter approaching 260k (currently 230k), GDT auctions gaining 6-8% over four sales, and cattle futures holding above $230/cwt predict recovery 3-4 months before Class III moves
The correction isn’t coming—it’s different this time: Crossbred calves at $900-$1,600 create a revenue floor keeping marginal operations alive, breaking the traditional supply response to low milk prices
First movers are winning now: Operations tracking these signals have locked in $4.38/bushel corn and gained $1.20/cwt margins while others wait for “normal” price recovery that follows different rules
The heifer shortage trap: At 3.914 million head (lowest since 1978), expansion is mathematically impossible for most—even when milk hits $22, you can’t grow without $3,200 heifers
Your 18-month edge: Implement Monday morning CME checks, Thursday slaughter monitoring, and biweekly GDT tracking—15 minutes weekly that separates thrivers from survivors
Complete references and supporting documentation are available upon request by contacting the editorial team at editor@thebullvine.com.
Learn More:
Building a Beef-on-Dairy System: Capturing $360,000 in Annual Farm Profit – Reveals how beef-on-dairy breeding jumped from 50K to 3.2M head and demonstrates methods for capturing 6% of total farm income through crossbred calves, directly addressing the $900-$1,600 calf values sustaining operations through negative milk margins.
Trump Promised Cheaper Beef – Here’s Your $160,000 Counter-Move – Provides contrarian strategies for producers considering heifer production when others focus on beef breeding, perfectly aligning with the heifer shortage trap at 3.914 million head and offering a profitable alternative path during market transitions.
Pick Your Lane or Perish: The 18-Month Ultimatum Facing 800-1,500 Cow Dairies – Explores October’s $2.47 Class spread proving mid-size dairies must choose between commodity and premium markets, offering strategic frameworks that complement the three-signal monitoring system for operations navigating the “middle ground is gone” reality.
Join the Revolution!
Join over 30,000 successful dairy professionals who rely on Bullvine Weekly for their competitive edge. Delivered directly to your inbox each week, our exclusive industry insights help you make smarter decisions while saving precious hours every week. Never miss critical updates on milk production trends, breakthrough technologies, and profit-boosting strategies that top producers are already implementing. Subscribe now to transform your dairy operation’s efficiency and profitability—your future success is just one click away.
When your best customer starts making their own milk, it’s time to rethink everything about your business model
EXECUTIVE SUMMARY: What farmers are discovering right now is that October 2025’s cheese price drop to $1.67 isn’t just another market dip—it’s the canary in the coal mine for structural changes reshaping dairy economics. Mexico’s commitment of 83.76 billion pesos toward dairy self-sufficiency through 2030 effectively removes our largest export customer, who bought $2.47 billion worth of U.S. dairy products last year and absorbed over half our nonfat dry milk exports. Meanwhile, the disconnect between DMC’s calculated $11.66/cwt margin and actual farm economics—where labor costs alone have increased by 30% since 2021, while machinery expenses have risen by 32%—reveals a safety net that no longer accurately reflects operational reality. Recent FMMO data shows protein climbing to 3.38% while butterfat hits 4.36%, creating component pricing opportunities for farms that can quickly adjust rations to capture premiums before the December 1st formula changes. With our national herd at 9.52 million head (the highest in 30 years), producing into weakening demand, and processing plants built on export assumptions that won’t materialize, the next 18 months will determine which operations successfully pivot toward margin management over volume growth. The good news? Producers layering risk management tools, optimizing beef-on-dairy programs, and adding $0.50-0.75/cwt are already demonstrating that adaptation—while challenging—remains entirely achievable, targeting protein-to-fat ratios of 0.80+ and beyond.
You know that feeling when you check the CME spot market and something just feels… off? That’s what hit most of us Monday when block cheese broke through $1.70 to trade at $1.67 on October 13, 2025. After tracking these markets for years, I’ve learned that when those established price floors start giving way, there’s usually something bigger happening beneath the surface.
Here’s the Bottom Line this week:
Mexico’s push toward dairy self-sufficiency is reshaping export dynamics
DMC margins no longer reflect true on-farm costs, especially labor and machinery [USDA Farm Labor Survey; U of I]
Component pricing has flipped: protein premiums are now outpacing butterfat [FMMO data]
Mexico’s Strategic Shift: What It Really Means for U.S. Producers
Looking at this trend, Mexico bought $2.47 billion of U.S. dairy in 2024—more than Canada and China combined. They’ve taken over half our nonfat dry milk exports and imported 314 million pounds of cheese through September 2025.
In April, President Sheinbaum announced the “Milk Self-Sufficiency Plan,” committing 83.76 billion pesos (~$4.1 billion USD) through 2030 to boost production to 15 billion liters annually and reach 80% self-sufficiency by 2030. They guarantee producers 11.50 pesos per liter while selling at 7.50 pesos—absorbing that 4-peso difference, roughly $0.22 USD per liter. What farmers are finding is that policy talk is turning into infrastructure: production ran 3.3% ahead of last year through May 2025.
Mexico’s 83.76 billion peso commitment through 2030 isn’t just policy talk—production already runs 3.3% ahead, and your $2.47 billion customer is building capacity to replace U.S. imports within five years
The DMC Disconnect: When the Safety Net Doesn’t Match Reality
I recently had coffee with a 600-cow producer in central Wisconsin who said, “DMC shows an $11.66 margin, but I’m burning through equity just keeping the lights on”. This disconnect deserves a closer look.
The DMC Disconnect reveals a $9.75/cwt gap between calculated margins and on-farm reality—labor and machinery costs that jumped 30%+ since 2021 don’t factor into the safety net formula
The DMC formula originated when feed costs represented half of all expenses. University budget analyses now show feed often runs only 35–45% of costs—not because feed got cheaper, but because labor and machinery soared. USDA’s Farm Labor Survey documents a 30% increase in wages since 2021. A 500-cow operation can spend $300,000–400,000 annually on labor alone—about $1.50–2.00 per cwt that DMC ignores [USDA Farm Labor Survey].
Equipment costs tell a similar story. University of Illinois data shows machinery expenses jumped 32% from 2021 to 2023 and have continued upward through 2025. A 310-HP tractor at $189.20/hour in 2021 now runs $255.80/hour—financing at 7–8% adds another $0.80–1.00 per cwt [U of I].
“The DMC formula often shows acceptable margins while extension economists note significant divergence from on-farm cash flow when non-feed costs rise.” —Dr. Mark Stephenson, Director of Dairy Policy Analysis, UW-Madison, Distinguished Service to Wisconsin Agriculture Award [UW News]
Component Pricing: Why Protein’s Suddenly the Star
Scenario
Protein %
Butterfat %
Protein-to-Fat Ratio
Premium Before Dec 1
Premium After Dec 1
Monthly Gain (500 cows)
Current Average U.S.
3.38
4.36
0.77
Baseline
Baseline
$0
Target Optimized
3.45
4.30
0.80
+$0.25/cwt
+$0.38/cwt
$1,900
Wisconsin Case Study
3.38 (from 3.12)
4.28
0.79
+$0.42/cwt
+$0.58/cwt
$2,900
What’s interesting here is that component pricing has flipped. Butterfat averaged 4.36% through September, up from 3.95% five years ago [FMMO data]. Protein climbed from 3.181% to 3.38% but still lags butterfat gains. Cheesemakers generally target a 0.80 protein-to-fat ratio; U.S. milk sits around 0.77, forcing processors to add nonfat dry milk powder [FMMO data].
The FMMO changes effective December 1—boosting protein factors to 3.3 lbs and other solids to 6.0 lbs per cwt—will amplify premiums for higher-protein milk [USDA AMS]. A Sheboygan herd I spoke with pushed protein from 3.12% to 3.38% in eight weeks through amino acid balancing and bypass protein, adding $0.42 per cwt, roughly $3,200 per month on 450 cows.
Herd Dynamics: When Culling Economics Don’t Make Sense
The August USDA report shows 9.52 million head—the highest in 30 years. Why keep expanding herds when margins are tight? Auction data puts replacement heifers at $3,500–4,000, and CDCB research shows cows average 2.8 lactations before exit. When cows leave before paying back replacements, the usual 35% turnover target collapses [CDCB data].
Despite record $157/cwt cull cow prices in July 2025 [USDA AMS], many producers hold onto older cows because replacing them costs more. Beef-on-dairy adds complexity: cross-bred calves fetch $1,370–1,400 at auction, so breeding for beef income often outweighs dairy replacement logic [Auction reports].
Key Takeaways for Action This Week
Review risk coverage – Enroll DMC at $9.50 coverage ($0.15/cwt for first 5 M lbs) – Layer in Dairy Revenue Protection at 60–70% quarterly coverage
Optimize components – If protein-to-fat <0.77, schedule a nutrition consult – December 1 FMMO changes make ratios more lucrative
Assess finances – Maintain debt service coverage >1.25 – Keep working capital >15% of gross revenue
Consider beef-on-dairy – At $0.50–0.75/cwt extra revenue, review breeding strategy
Lean on the community – Share experiences at coffee shops and meetings
Regional Adaptation: Different Strategies for Different Situations
Region
Current Challenge
Winning Strategy
Premium Opportunity
Risk Level
Timeline
Wisconsin
Mid-size squeeze (500-1,500 cows)
Scale to 2,500+ OR pivot to specialty (300-400)
Specialty: $8-10/cwt
HIGH – Middle vanishing
Decide by Q2 2026
Texas/New Mexico
Scale competition intensifying
Mega-scale expansion (10,000+ cows, +20% growth)
Efficiency: $0.30-0.50/cwt
MEDIUM – Capital intensive
Expand through 2027
Southeast
Fluid premiums fading
Grass-fed organic + agritourism pivot
Organic: $12-15/cwt
MEDIUM – Market transition
Transition 2025-2026
California
Two-tier system emerging
Central Valley scale OR North Coast farmstead cheese
Farmstead: $15-20/cwt
HIGH – Two extremes
Ongoing divergence
Pacific Northwest
Capacity limits + basis discounts
Regional cooperative consolidation
Limited due to isolation
VERY HIGH – Exit risk 2026
Some exits planned 2026
Northeast
High costs vs legacy markets
Local glass-bottle programs + direct sales
Direct sales: $10-12/cwt
MEDIUM – Niche viable
Building programs now
Wisconsin’s mid-size producers face tough choices: scale up to 2,500+ cows for efficiency or shrink to 300–400 and chase specialty markets. That middle ground is disappearing.
Down in Texas and New Mexico, mega-dairies double down on scale. A 10,000-cow manager plans 20% expansion by 2027, betting automation offsets price pressures. “Every penny of efficiency multiplies,” he said.
The Southeast leans on fluid milk premiums, though processors warn they’ll fade. Several Georgia farms are shifting to grass-fed organic, accepting lower volumes for higher margins.
California’s dairy scene splits into two worlds: Central Valley mega-dairies expanding, North Coast farmstead cheesemakers thriving on agritourism and direct sales.
The Pacific Northwest battles capacity limits and isolation. Basis discounts bite, and some producers plan 2026 exits if conditions don’t improve.
The Northeast juggles legacy fluid markets with new ventures like local glass-bottle programs to offset high costs.
Global Competition: Learning from Other Exporters
The EU’s production is essentially flat (+0.15% in 2025), despite a 1% decline in herd size, with raw milk at EUR 53.3/100 kg (28% above the five-year average) [EU Commission]. They’re pivoting to value-added and sustainability premiums.
New Zealand’s Fonterra posted 103% profit growth in Q3 2025 but is divesting consumer brands to focus on B2B ingredients. Their NZ$10.00/kgMS forecast suggests confidence in fundamentals but a shift away from commodity volume.
The U.S. stands out for its $11+ billion capacity build-out on export assumptions now under pressure [IDFA]. Few competitors committed similar investment levels.
Beef-on-dairy: Crossbred calves add $0.50–0.75/cwt; LRP support starts 2026
Looking Ahead: Probable Scenarios Through 2028
The next 18 months separate survivors from exits—Class III tests mid-$14s through 2027 as the herd contracts by 600,000+ head, then stabilizes at $16-17 once supply finally matches reduced export demand
Based on talks with lenders, processors, and economists:
Mid-2026: Zombie phase persists. Credit tightens; bankruptcies climb 55% in some regions [USDA, AFBF, UArk].
Late 2026: More plant closures follow Saputo and Upstate Niagara moves, stranding some producers.
2027: Mexico’s self-sufficiency hits export volumes; global production pressures domestic prices; Class III may test mid-$14.
2028: Herd contracts by several hundred thousand head; Class III stabilizes around $16–17; significant exits reshape the industry.
The Human Element: Supporting Each Other
These challenges take a human toll. Farmer suicide rates run 3.5× higher than the general population, and rural rates climbed 46% between 2000 and 2020 [CDC; NRHA]. These aren’t just numbers—they’re neighbors and friends under immense pressure.
Research from land-grant universities identifies several early warning signs, including routine changes, declining animal care, family health issues, and farmstead neglect. Recognizing these patterns lets communities step in before crises deepen. For those struggling, the National Suicide Prevention Lifeline (988) and National Farmer Crisis Line (1 866 327 6701) offer confidential support from counselors who understand farm life.
The Bottom Line
Even now, opportunities exist. Producers pivoting to specialty markets report net incomes rising despite lower volumes. Beef-on-dairy revenue can offset labor cost hikes. Component optimization often pays for its cost within weeks when executed well.
The next 24–36 months will test us like never before, but this is a structural change, not a cyclical downturn. Government programs can’t restore lost export markets or close idle capacity built for vanished demand. Success will go to those who recognize new fundamentals early and adapt strategically: focus on margins over prices, relationships over volume, and long-term sustainability over endless growth.
Coffee-shop conversations may feel quieter these days, but they matter more than ever. Sharing success stories and stumbling blocks—our collective resilience and adaptability—will guide us through to a sustainable, though different, future.
KEY TAKEAWAYS:
Capture immediate protein premiums worth $0.42/cwt by adjusting rations to hit 0.80-0.85 protein-to-fat ratios before December 1st FMMO changes—Wisconsin herds report $3,200 monthly gains on 450 cows through amino acid balancing and bypass protein strategies
Layer risk protection starting at $0.15/cwt with DMC at $9.50 coverage for your first 5 million pounds, then add Dairy Revenue Protection at 60-70% quarterly coverage to protect margins as Mexico’s production ramps up and displaces exports
Maximize beef-on-dairy revenue, adding $0.50-0.75/cwt to current milk checks—with crossbred calves fetching $1,370-1,400 at auction and Livestock Risk Protection coverage starting in 2026, this strategy offsets rising labor costs that DMC ignores
Monitor three critical financial ratios weekly: debt service coverage above 1.25, working capital exceeding 15% of gross revenue, and variable rate debt below 50% of total borrowing—extension economists identify these as early warning indicators before operational stress becomes a crisis
Choose your strategic path by Q2 2026: Wisconsin’s mid-size operations show the middle ground between 500-1,500 cows is vanishing—either scale toward 2,500+ head for efficiency, pivot to specialty markets (grass-fed, organic, local) capturing $8-10/cwt premiums, or plan an orderly exit while equity remains
Complete references and supporting documentation are available upon request by contacting the editorial team at editor@thebullvine.com.
Learn More:
Unlocking Profitability: The Strategic Power of Beef on Dairy in Today’s Market – This guide provides the tactical blueprint for implementing the beef-on-dairy strategy mentioned in the article. It details genetic selection, calf care protocols, and marketing channels to maximize the revenue stream that adds a critical $0.50-$0.75/cwt to your milk check.
Navigating the Choppy Waters of Dairy Exports: A 2024-2025 Outlook – While the main article focuses on Mexico, this strategic analysis broadens the lens to the entire global market. It reveals where future export opportunities may emerge and how competitive pressures from the EU and New Zealand will impact U.S. producers.
The Data-Driven Dairy: How Precision Technology is Reshaping Herd Management and Profitability – This article explores the innovative technologies that directly combat rising operational costs. It demonstrates how investing in sensors, automation, and data analytics can improve feed efficiency, reproductive performance, and labor productivity, helping you manage margins in a tight economy.
Join the Revolution!
Join over 30,000 successful dairy professionals who rely on Bullvine Weekly for their competitive edge. Delivered directly to your inbox each week, our exclusive industry insights help you make smarter decisions while saving precious hours every week. Never miss critical updates on milk production trends, breakthrough technologies, and profit-boosting strategies that top producers are already implementing. Subscribe now to transform your dairy operation’s efficiency and profitability—your future success is just one click away.
What if I told you every beef breeding is stealing milk from 2027? Time to rethink your replacement strategy.
EXECUTIVE SUMMARY: You know that sick feeling when you see $4,000 heifer prices at auction? Well, buckle up – we’re sitting on the worst replacement shortage in 47 years, and it’s about to reshape how profitable operations manage their herds. Here’s the reality: we’ve got just 3.914 million replacement heifers nationwide, with only 2.5 million expected to freshen in 2025. That’s not just tight supply – that’s a fundamental shift that’s already forcing Wisconsin producers to swallow $860 per head increases year-over-year.
The beef-on-dairy trend that’s been padding cash flow with $1,000 crossbred calves? It’s creating the very shortage that’s now costing us thousands per replacement. But here’s what the smart operators are figuring out: retention programs are delivering 54% cost savings versus market purchases, and strategic sexed semen deployment is becoming the difference between profit and survival. You need to start treating this like the crisis it is – not next month, not next season, but right now.
KEY TAKEAWAYS
Slash replacement costs by 54% immediately – Implement heifer retention programs now instead of buying $3,000+ market animals. Start with your top genetic quartile and build management systems that can handle 25-27% replacement rates.
Lock in female calves with sexed semen strategy – Deploy on your best 25% of cows achieving 80-90% conception rates. With replacement values this high, the extra $20-30 per dose pays for itself in one successful breeding.
Recalibrate your beef-on-dairy exposure – Limit to 40% maximum of total breedings to maintain adequate replacement generation. Those $1,000 crossbred calves won’t help if you can’t find replacements at any price.
Stress-test your operation at $4,000 replacement costs – Build these numbers into 2025-2026 cash flow projections and secure financing before you need it. The farms that survive this crisis will be those that planned for it.
Upgrade calf management protocols immediately – With heifer calves worth $3,000+ each, failure of passive transfer and preventable losses become financially devastating. Target less than 10% passive transfer failure rates.
Let me tell you something that’s been keeping me up at night… and it should probably be bothering you too. We’re sitting in the middle of the worst replacement heifer shortage I’ve seen in my career, and if you think those $4,000 heifers showing up at auctions are just a temporary spike… well, grab a coffee because we need to talk.
I’ve been watching these numbers for years, and what’s happening right now? It’s not just a market correction – it’s a fundamental shift in how we think about building and maintaining dairy herds. The January 2025 USDA cattle inventory data tells a story that’s frankly pretty sobering: 3.914 million dairy replacement heifers across the entire country. That’s the lowest figure since Jimmy Carter was in the White House, and the trend line isn’t exactly encouraging.
Here’s what really gets me – Statistics Canada’s showing the same pattern up north. Their cattle inventories dropped 0.7% to 10.9 million head by January, marking three straight years of decline. When both sides of the border are dealing with shrinking replacement pools… well, that’s when you know we’re looking at something bigger than just a regional hiccup.
What’s Really Happening in the Field
The thing about spending decades in this business is that you start recognizing patterns that others might miss. And this pattern? It’s different from anything we’ve dealt with before. I was chatting with a Wisconsin producer just last week – been in business for thirty years, runs about 800 head – and he put it perfectly: “three years ago I budgeted $1,500 for a replacement. Today I’m looking at $3,000… if I can even find one.”
What strikes me about this whole situation is the velocity of change. We’re not talking about a gradual price increase here. Recent auction reports are showing premium pregnant heifers selling for upward of $4,000 per head. That’s not a typo, that’s the new reality hitting operations from coast to coast.
And here’s something that really caught my attention – USDA’s projecting only 2.5 million heifers will enter the milking herd in 2025. Think about that for a minute. That’s the lowest level since they started tracking this metric systematically. Makes you wonder what other trends we’re missing while we’re focused on milk prices and feed costs, doesn’t it?
What’s particularly concerning is how we’re adapting to this shortage. Industry observers are noting that operations are keeping older cows in the barn longer just to maintain herd size. The efficiency drag from that decision? It’s showing up in components, cell counts, and ultimately in milk checks across multiple regions.
The Market Reality Nobody Wants to Face
You know what really drives this home for me? I’ve been to auctions recently where quality springer heifers are selling for more than what some producers paid for their first tractors. The numbers are just staggering when you step back and look at them.
Wisconsin’s been a bellwether for replacement pricing, and producers there have watched values nearly double compared to five years ago. That’s not inflation – that’s fundamental supply and demand economics hitting the reset button on how we value replacement animals.
Transportation has become another pressure point that’s easy to overlook. Moving heifers between regions can easily add $200 to $500 per head, depending on distance and current fuel costs. So if you’re not located near traditional heifer-producing areas, you’re getting squeezed from multiple directions.
The geographic implications are fascinating… and a little concerning. Proximity to heifer sources is becoming a real competitive advantage in ways we haven’t seen before. Operations in traditional dairy regions are finding themselves with leverage they didn’t know they had, while farms in newer dairy areas are scrambling to secure reliable replacement sources.
What’s particularly noteworthy is how seasonal patterns are playing out differently this year:
Spring markets have traditionally been when we’d see peak heifer availability, but that predictable pattern is breaking down. The Upper Midwest still has the highest concentration of available animals, but even there, you’re looking at premium pricing that would’ve been unthinkable just a few seasons ago.
Summer breeding efficiency has become even more critical when every successful pregnancy represents such significant value. Heat stress management isn’t just about milk production anymore – it’s about protecting potentially $3,000+ investments in genetic progress.
Technology That’s Gone from Nice-to-Have to Essential
Here’s where the conversation gets really interesting… and expensive. Recent research is confirming that modern sexed semen technology is achieving conception rates that are 80% to 90% of conventional semen. Five years ago, those numbers would’ve seemed optimistic. Today, they’re becoming the baseline expectation.
The economics have completely flipped on reproductive technology adoption. When a replacement heifer represents a $3,000+ investment, spending an extra $20 to $30 per breeding to guarantee female offspring isn’t just smart management – it’s basic math.
What’s particularly fascinating is how environmental conditions are affecting these technologies differently than we expected. Some operations are reporting that sexed semen conception rates actually hold up better during heat stress periods than conventional AI. That’s counter to what many of us assumed would happen.
Here’s what I’m seeing work consistently across different operation types:
Strategic deployment of sexed semen on the top genetic quartile of animals – you’re maximizing both replacement quality and quantity where it matters most. The middle tier gets conventional semen for backup protection, because you still need some insurance against breeding failures. The bottom quartile? That’s where beef semen makes sense for immediate cash flow, but we’ll get to that challenge in a minute.
The embryo transfer conversation is evolving rapidly, too. Research is showing fresh embryo transfer achieving conception rates of 35.4% compared to 21.4% for conventional AI during heat stress periods. For operations dealing with brutal summer conditions – and that’s a lot more of us than it used to be – those numbers represent real opportunities to maintain replacement generation even when natural breeding efficiency drops.
The Beef-on-Dairy Phenomenon… and Its Consequences
This is where we get into some unintended consequences that I don’t think the industry fully anticipated. National Association of Animal Breeders data shows beef semen sales to dairy operations hit 7.9 million units in 2023. That represents adoption levels that caught even the most optimistic projections off guard.
The immediate economics are pretty compelling, I’ll give you that. Recent market reports show newborn beef-cross calves bringing $800 to $1,000+ per head at just days old. Compare that to conventional dairy bull calves that were barely worth hauling to market just a few years ago, and you can see why so many operations jumped in with both feet.
But here’s the catch that I think we’re just starting to fully understand – every beef breeding represents a replacement heifer you’re not producing. The short-term cash flow boost is real, but the long-term capacity implications are becoming clearer every month.
What’s really interesting is watching how different regions are adapting to this dynamic. Operations in areas with reliable heifer sources can probably afford to run higher percentages of beef semen. But what about farms in regions where replacement acquisition is already challenging? They’re having to recalibrate those breeding strategies pretty quickly.
The global perspective on this trend is also worth considering. Different regulatory environments and market structures are creating varying adoption patterns. What works in the Upper Midwest may not translate directly to operations dealing with different seasonal patterns or regulatory constraints.
Making Smart Moves in a Tight Market
The retention game has fundamentally changed, and I’m not sure everyone has fully absorbed what that means yet. Research from bovine specialists is showing that well-managed heifer retention programs can deliver up to 54% cost savings compared to market acquisition. When you’re looking at $2,500+ acquisition costs – and we’re clearly past that threshold – the math strongly favors keeping more of your own replacements.
Here’s what I’m seeing work consistently in real operations:
The replacement rate conversation has gotten a lot more sophisticated. Most operations need somewhere between 25% and 35% replacement rates when you factor in normal mortality and culling patterns. The smart operators I know are targeting the lower end of that range – maybe 25% to 27% – to give themselves flexibility for selective culling and market timing opportunities.
What’s often overlooked in these discussions is calf management. Pre-weaning studies are showing costs ranging from $258 to $583 per calf, with feed representing nearly half of total expense. When every heifer calf represents potential $3,000+ value, losing animals to preventable management failures isn’t just disappointing – it’s financially devastating.
The colostrum management piece has become absolutely critical. While industry-wide data on passive transfer failure varies, getting those rates down to 10% or less isn’t just good animal husbandry anymore – it’s basic economics when individual animals represent such significant investments.
Regional Realities and Strategic Implications
The geographic shifts happening in dairy production are creating some interesting dynamics that I think deserve more attention. Major dairy regions continue expanding processing infrastructure – we’re talking about billions in investment that requires sustained milk supplies to justify.
What concerns me about the concentration trends is disease vulnerability. When you’ve got large percentages of national production concentrated in specific regions, any disruption – whether it’s disease pressure, extreme weather, or regulatory changes – can have outsized impacts on replacement availability.
Let me break down what I’m seeing by region, because the challenges are definitely not uniform:
Southwest Operations: Water scarcity is becoming a genuine constraint on expansion, which affects replacement planning in ways that aren’t always obvious. Heat stress management is requiring more sophisticated cooling systems, and that’s affecting the economics of heifer raising. Feed cost volatility from drought conditions is making budgeting more challenging than it used to be.
Upper Midwest: Seasonal breeding patterns are creating more pronounced availability clusters than we’ve seen historically. Weather volatility is affecting feed quality and storage in ways that ripple through heifer development programs. Labor constraints in rural areas are limiting expansion opportunities for some operations.
Canadian Operations: The currency fluctuation aspect adds another layer of complexity to replacement acquisition decisions. Provincial regulatory differences are affecting breeding strategies in ways that U.S. producers might not fully appreciate. The seasonal patterns are different enough that timing becomes even more critical for successful heifer development.
Climate projections aren’t particularly encouraging for any region. Heat stress impacts could significantly affect milk production by 2030, and that’s going to create additional pressure on replacement strategies across the board.
Global Context and Market Dynamics
What’s happening internationally adds another dimension to this story that I think we need to pay attention to. EU operations are dealing with similar heifer shortages, but their regulatory environment creates different constraints and opportunities. New Zealand’s seasonal system generates entirely different dynamics around replacement timing and availability.
The international genetics trade is shifting in response to these supply constraints. Traditional exporters are facing their own production pressures, while demand for superior genetics continues growing globally. This creates opportunities for operations that can produce high-quality replacements, but it also means more competition for the best genetic material.
Export data shows U.S. bovine semen exports reaching new highs, but the flow of that genetic material is increasingly going to dairy operations rather than traditional beef producers. That shift has implications for domestic availability that might not be immediately obvious.
What This Means for Your Operation Right Now
Look, I’ve been around this industry long enough to recognize when we’re at a genuine inflection point. This isn’t a temporary market disruption that’s going to resolve itself in six months. The operations that adapt their strategies first are positioning themselves for significant competitive advantages.
If you’re serious about maintaining or growing your operation, here’s what needs to happen:
Financial Planning – Start Here:
Recalculate your replacement budgets using current market pricing
Build heifer acquisition costs into cash flow projections for the next 18 to 24 months
Explore financing options before you actually need them
Factor transportation and acquisition costs into your planning process
Stress-test your operation’s financials at even higher replacement costs
Breeding Strategy Overhaul:
Strategic sexed semen deployment on your top genetic tier
Limit beef-on-dairy exposure to maintain an adequate replacement generation
Consider embryo transfer for multiplying elite genetics
Implement genomic testing to optimize breeding decisions
Adjust seasonal timing for maximum reproductive efficiency
Operational Changes:
Develop intensive heifer retention programs
Upgrade calf management protocols
Focus on reproductive efficiency improvements
Explore cooperative agreements with neighboring operations
Accelerate technology adoption for precision breeding
Risk Management:
Increase insurance coverage for high-value animals
Diversify heifer sources across multiple regions
Develop contingency plans for disease outbreaks
Implement financial stress testing for market volatility
Plan for seasonal weather disruptions
The thing that strikes me most about this whole situation is that it’s simultaneously a crisis and an opportunity. Operations that figure out how to navigate these challenges effectively won’t just survive the current market conditions – they’ll establish competitive advantages that compound over time.
Better reproductive efficiency, superior genetic progress, optimized replacement strategies… these aren’t just operational improvements anymore. They’re becoming the fundamental differentiators between operations that thrive and those that struggle to maintain viability.
So here’s my question for you: What’s your move going to be? Because standing still isn’t really an option when the fundamentals of replacement economics have shifted this dramatically. The heifer shortage is real, the pricing pressure isn’t going away, and the seasonal patterns are becoming more pronounced every year.
But for producers willing to adapt their strategies and embrace new approaches to herd management, there are genuine opportunities to build sustainable advantages. The question isn’t whether these changes will continue – it’s whether your operation will lead the adaptation or get left behind trying to manage with outdated assumptions.
The choice is yours, but the clock’s ticking.
Complete references and supporting documentation are available upon request by contacting the editorial team at editor@thebullvine.com.
Learn More:
dairy heifer management – The Bullvine – Reveals science-based selection methods for maximizing replacement heifer quality, including genetic ranking systems and critical health factors that determine which animals become profitable long-term producers in your herd.
Why Dairy Farmers Are Struggling Despite Soaring Milk Prices – Demonstrates how strategic breeding decisions impact long-term profitability, showing why maintaining proper heifer headcounts delivers better returns than chasing short-term crossbred calf revenue in volatile markets.
5 Technologies That Will Make or Break Your Dairy Farm in 2025 – Practical strategies for leveraging smart calf sensors, AI-driven analytics, and precision feeding systems to reduce mortality by 40% and optimize heifer development efficiency in the current shortage environment.
Join the Revolution!
Join over 30,000 successful dairy professionals who rely on Bullvine Weekly for their competitive edge. Delivered directly to your inbox each week, our exclusive industry insights help you make smarter decisions while saving precious hours every week. Never miss critical updates on milk production trends, breakthrough technologies, and profit-boosting strategies that top producers are already implementing. Subscribe now to transform your dairy operation’s efficiency and profitability—your future success is just one click away.
Component premiums are rewiring dairy economics—FMMO reforms + $2,870 heifer costs = dual-purpose strategy goldmine. Are you ready for December’s game-changer?
Executive Summary: The dairy industry’s most significant structural transformation in decades is happening right now, and most producers are missing the massive profit opportunity hiding in plain sight. Our comprehensive June 26th market analysis reveals how FMMO reforms and record $2,870 replacement heifer costs are creating a dual-purpose genetic goldmine that smart operators are already capitalizing on. With component premiums set to explode in December 2025 (3.3% protein, 6.0% other solids), the producers focusing on milk quality over quantity are positioning themselves for $1.20+/cwt milk check increases. Meanwhile, beef-on-dairy programs are generating 10-15% of total farm income, with day-old calves selling for $900+, fundamentally transforming the economics of herd management. The convergence of favorable feed costs, processing capacity investments exceeding $8 billion, and the component economy’s arrival means traditional volume-focused strategies are becoming financial suicide. This isn’t just another market report—it’s your roadmap to navigating the “new normal” where components trump volume and dual-purpose genetics become essential for survival. Stop betting on outdated strategies and capitalize on the component revolution that’s reshaping dairy profitability forever.
Key Takeaways
Component Focus Delivers Immediate ROI: FMMO reforms reward 3.3% protein and 6.0% other solids starting December 1st, with early adopters already seeing $1.20+/cwt premiums—audit your genetics and nutrition programs now to capture these gains before your competitors wake up
Beef-on-Dairy Transforms Economics: With replacement heifers hitting record $2,870/head, strategic beef semen use on lower-tier genetics generates $900+ day-old calf values, creating 10-15% of total farm income while eliminating replacement costs
Feed Cost Advantage Creates Margin Cushion: Current corn at $4.04/bushel and declining soybean meal costs are projected to reach yearly lows in June, improving income over feed costs (IOFC) and reducing DMC payments—lock in these favorable costs through long-term contracts
Processing Capacity Boom Drives Component Demand: Over $8 billion in new cheese-focused processing infrastructure coming online through 2026 creates unprecedented demand for component-rich milk, positioning quality-focused producers for premium pricing power
Heat Stress Mitigation = Competitive Advantage: With above-average temperatures forecasted and smaller farms (under 100 head) most vulnerable to 15-20% yield losses, investing in cooling systems and strategic calving schedules protects margins while competitors suffer production declines
Today’s CME dairy markets saw modest gains in butter and barrel cheese, while blocks and nonfat dry milk remained stable. The primary takeaway for dairy operations is the continued emphasis on milk components, especially with the new Federal Milk Marketing Order rules now active, which are fundamentally reshaping how milk is valued.
Today’s Price Action & Farm Impact
Product
Price
Daily Change
Weekly Trend
Trades
Bids
Offers
Impact on Farmers
Butter
$2.5375/lb
+1.75¢
-0.4%
7
12
5
Positive for Class IV milk checks; strong demand
Cheese Blocks
$1.6100/lb
Unchanged
-6.5%
17
3
1
Class III outlook pressured by recent block weakness
Cheese Barrels
$1.6375/lb
+1.00¢
-5.4%
1
1
1
Modest support for Class III, but overall trend down
NDM Grade A
$1.2500/lb
Unchanged
-1.5%
0
0
0
Stable, but weak export demand remains a concern
Dry Whey
$0.5775/lb
+1.00¢
+4.2%
0
3
1
Supports Class III; strong demand for protein products
Market Commentary: Today’s session witnessed butter continuing its upward momentum with active trading (7 completed trades) and strong bidding interest (12 bids vs. five offers), indicating solid processor demand for inventory building. The significant bid-offer imbalance in butter markets suggests continued strength ahead.
Cheese blocks showed resilience after recent declines, with substantial trading activity (17 trades) but limited bidding interest (3 bids vs. one offer), reflecting cautious market participation. The barrel market saw minimal activity (1 trade) but managed a modest gain, suggesting some underlying support despite the constrained trading environment.
Market Sentiment & Industry Voice
Trading activity patterns reveal a market in transition. As one market observer noted in recent analysis, “retail cheese buyers have ‘gone dark,’ waiting for further price declines before re-entering the market”. This cautious approach from buyers explains the limited bidding activity in cheese markets despite relatively stable prices.
The broader sentiment reflects what industry analysts describe as a “decoupling” from global dairy strength. U.S. markets are experiencing unique pressures despite the FAO Dairy Price Index showing 21.5% year-over-year gains globally.
Feed Cost & Margin Analysis
Current Feed Costs:
Corn (July): $4.0400/bushel (-1.25¢)
Corn (December): $4.2100/bushel
Soybeans (August): $10.2950/bushel
Soybean Meal (August): $275.20/ton (-$4.40)
Margin Outlook: Feed costs are projected to reach their lowest point for the year in June, with mostly flat feed costs for the remainder of 2025. This improving relationship between milk revenue and feed costs leads to better income over feed costs (IOFC), with lower feed costs projected to decrease Dairy Margin Coverage (DMC) payments in 2025.
Production & Supply Insights
Milk Production Trends: U.S. milk production reached 19.9 billion pounds in May 2025, marking a 1.6% year-over-year increase with the national dairy herd expanding to 9.45 million head. Component quality continues hitting records, with average butterfat levels reaching 4.40% and protein 3.40% in 2025.
Weather Impacts: June 2025 outlook favors well above average temperatures across most dairy regions, presenting significant heat stress risks that could curtail the typical late-spring/early-summer production strength.
Regional Dynamics: The “Great Dairy Migration” continues with Texas milk production surging 10.6% year-over-year, while California faces a 9.2% decline due to H5N1 impacts affecting approximately 650 herds.
Market Fundamentals Driving Prices
Domestic Demand: The most concerning factor remains the collapse in domestic cheese consumption, which declined 56 million pounds in Q1 2025. Restaurant traffic weakness continues to dampen foodservice demand, with sales declining from $97.0 billion in December to $95.5 billion.
Export Markets: While global dairy prices show strength, U.S. markets face export challenges. China’s temporary tariff reduction from 125% to 10% on certain U.S. dairy products provides only short-term relief, as the 90-day pause could be reversed. Butterfat exports surged 41% in January 2025, while skim-based products faced continued weakness.
Processing Capacity: Over $9 billion in new processing capacity is coming online through 2026, adding approximately 55 million pounds per day of production capability. Much of this capacity focuses on cheese production, driving demand for component-rich milk.
FMMO Implementation Impact
The June 2025 FMMO reforms represent significant structural changes. Key updates include:
Class I Location Differentials: Increased significantly (Cuyahoga County example: from $2.00/cwt to $3.80/cwt)
“Higher-of” Formula: Class I skim milk price now uses the higher of Class III or Class IV advanced values
Make Allowances: Updated across all categories, with cheese make allowances increasing processors’ margins
Barrel Cheese Removal: 500-lb barrels removed from Class III pricing, making block prices solely determinant
The Class I advanced price for June in Cuyahoga County reached $21.26/cwt, up from $20.57/cwt in May, while Class IV advanced milk price decreased nearly $0.60/cwt.
Forward-Looking Analysis
USDA Forecasts: The USDA’s June 2025 forecast shows an all-milk price of $21.95/cwt (+$0.35 increase), with Class III at $18.65/cwt and Class IV at $18.85/cwt. For 2026, projections moderate to $21.30/cwt all-milk price.
CME Futures Settlement:
Class III (July): $17.06/cwt
Class IV (July): $18.83/cwt
Cheese (July): $1.7460/lb
Butter (July): $2.5810/lb
Regional Market Spotlight: Component Strategy
With FMMO reforms rewarding higher protein (3.3%) and other solids (6.0%) from December 1, 2025, the focus intensifies on breeding and nutrition programs to boost component yields. Current record component levels (4.40% butterfat, 3.40% protein) demonstrate the industry’s successful pivot toward value-added production.
Actionable Farmer Insights
Immediate Actions:
Component Focus: Audit genetics and nutrition programs to optimize for December FMMO changes
Risk Management: Monitor basis risk between classified prices and actual mailbox prices due to make allowance changes
Heat Stress Preparation: Implement cooling systems ahead of forecasted above-average temperatures
Strategic Planning:
Dual-Purpose Genetics: Leverage beef-on-dairy opportunities with record replacement heifer costs
Forward Contracting: Consider establishing price floors through processors, given current volatility
Feed Cost Management: Lock in favorable feed costs through long-term contracts
Industry Intelligence
Processing Investment: The current $8+ billion investment wave in processing infrastructure continues, with substantial daily capacity additions through 2026 focused on cheese production.
Technology Integration: Farm-level innovations, including smart monitoring systems and precision feeding, offer measurable ROI within 7-18 months.
The Bottom Line
Today’s mixed dairy market signals reflect a fundamental industry transformation toward component-driven economics. While butter’s strength (+1.75¢) and active trading demonstrate solid processor demand, cheese markets remain under pressure despite stable block prices. The critical factor is the December 1st FMMO component implementation, which will dramatically reward operations optimizing for 3.3% protein and 6.0% other solids.
Complete references and supporting documentation are available upon request by contacting the editorial team at editor@thebullvine.com.
The Future of Dairy Farming: Embracing Automation, AI, and Sustainability in 2025 – Demonstrates practical technology solutions for heat stress mitigation and precision feeding that directly support component optimization strategies, offering ROI-focused automation tools that complement FMMO reforms and dual-purpose genetic programs.
Join the Revolution!
Join over 30,000 successful dairy professionals who rely on Bullvine Weekly for their competitive edge. Delivered directly to your inbox each week, our exclusive industry insights help you make smarter decisions while saving precious hours every week. Never miss critical updates on milk production trends, breakthrough technologies, and profit-boosting strategies that top producers are already implementing. Subscribe now to transform your dairy operation’s efficiency and profitability—your future success is just one click away.
To provide the best experiences, we use technologies like cookies to store and/or access device information. Consenting to these technologies will allow us to process data such as browsing behavior or unique IDs on this site. Not consenting or withdrawing consent, may adversely affect certain features and functions.
Functional
Always active
The technical storage or access is strictly necessary for the legitimate purpose of enabling the use of a specific service explicitly requested by the subscriber or user, or for the sole purpose of carrying out the transmission of a communication over an electronic communications network.
Preferences
The technical storage or access is necessary for the legitimate purpose of storing preferences that are not requested by the subscriber or user.
Statistics
The technical storage or access that is used exclusively for statistical purposes.The technical storage or access that is used exclusively for anonymous statistical purposes. Without a subpoena, voluntary compliance on the part of your Internet Service Provider, or additional records from a third party, information stored or retrieved for this purpose alone cannot usually be used to identify you.
Marketing
The technical storage or access is required to create user profiles to send advertising, or to track the user on a website or across several websites for similar marketing purposes.
To provide the best experiences, we and our partners use technologies like cookies to store and/or access device information. Consenting to these technologies will allow us and our partners to process personal data such as browsing behavior or unique IDs on this site and show (non-) personalized ads. Not consenting or withdrawing consent, may adversely affect certain features and functions.
Click below to consent to the above or make granular choices. Your choices will be applied to this site only. You can change your settings at any time, including withdrawing your consent, by using the toggles on the Cookie Policy, or by clicking on the manage consent button at the bottom of the screen.
Functional
Always active
The technical storage or access is strictly necessary for the legitimate purpose of enabling the use of a specific service explicitly requested by the subscriber or user, or for the sole purpose of carrying out the transmission of a communication over an electronic communications network.
Preferences
The technical storage or access is necessary for the legitimate purpose of storing preferences that are not requested by the subscriber or user.
Statistics
The technical storage or access that is used exclusively for statistical purposes.The technical storage or access that is used exclusively for anonymous statistical purposes. Without a subpoena, voluntary compliance on the part of your Internet Service Provider, or additional records from a third party, information stored or retrieved for this purpose alone cannot usually be used to identify you.
Marketing
The technical storage or access is required to create user profiles to send advertising, or to track the user on a website or across several websites for similar marketing purposes.


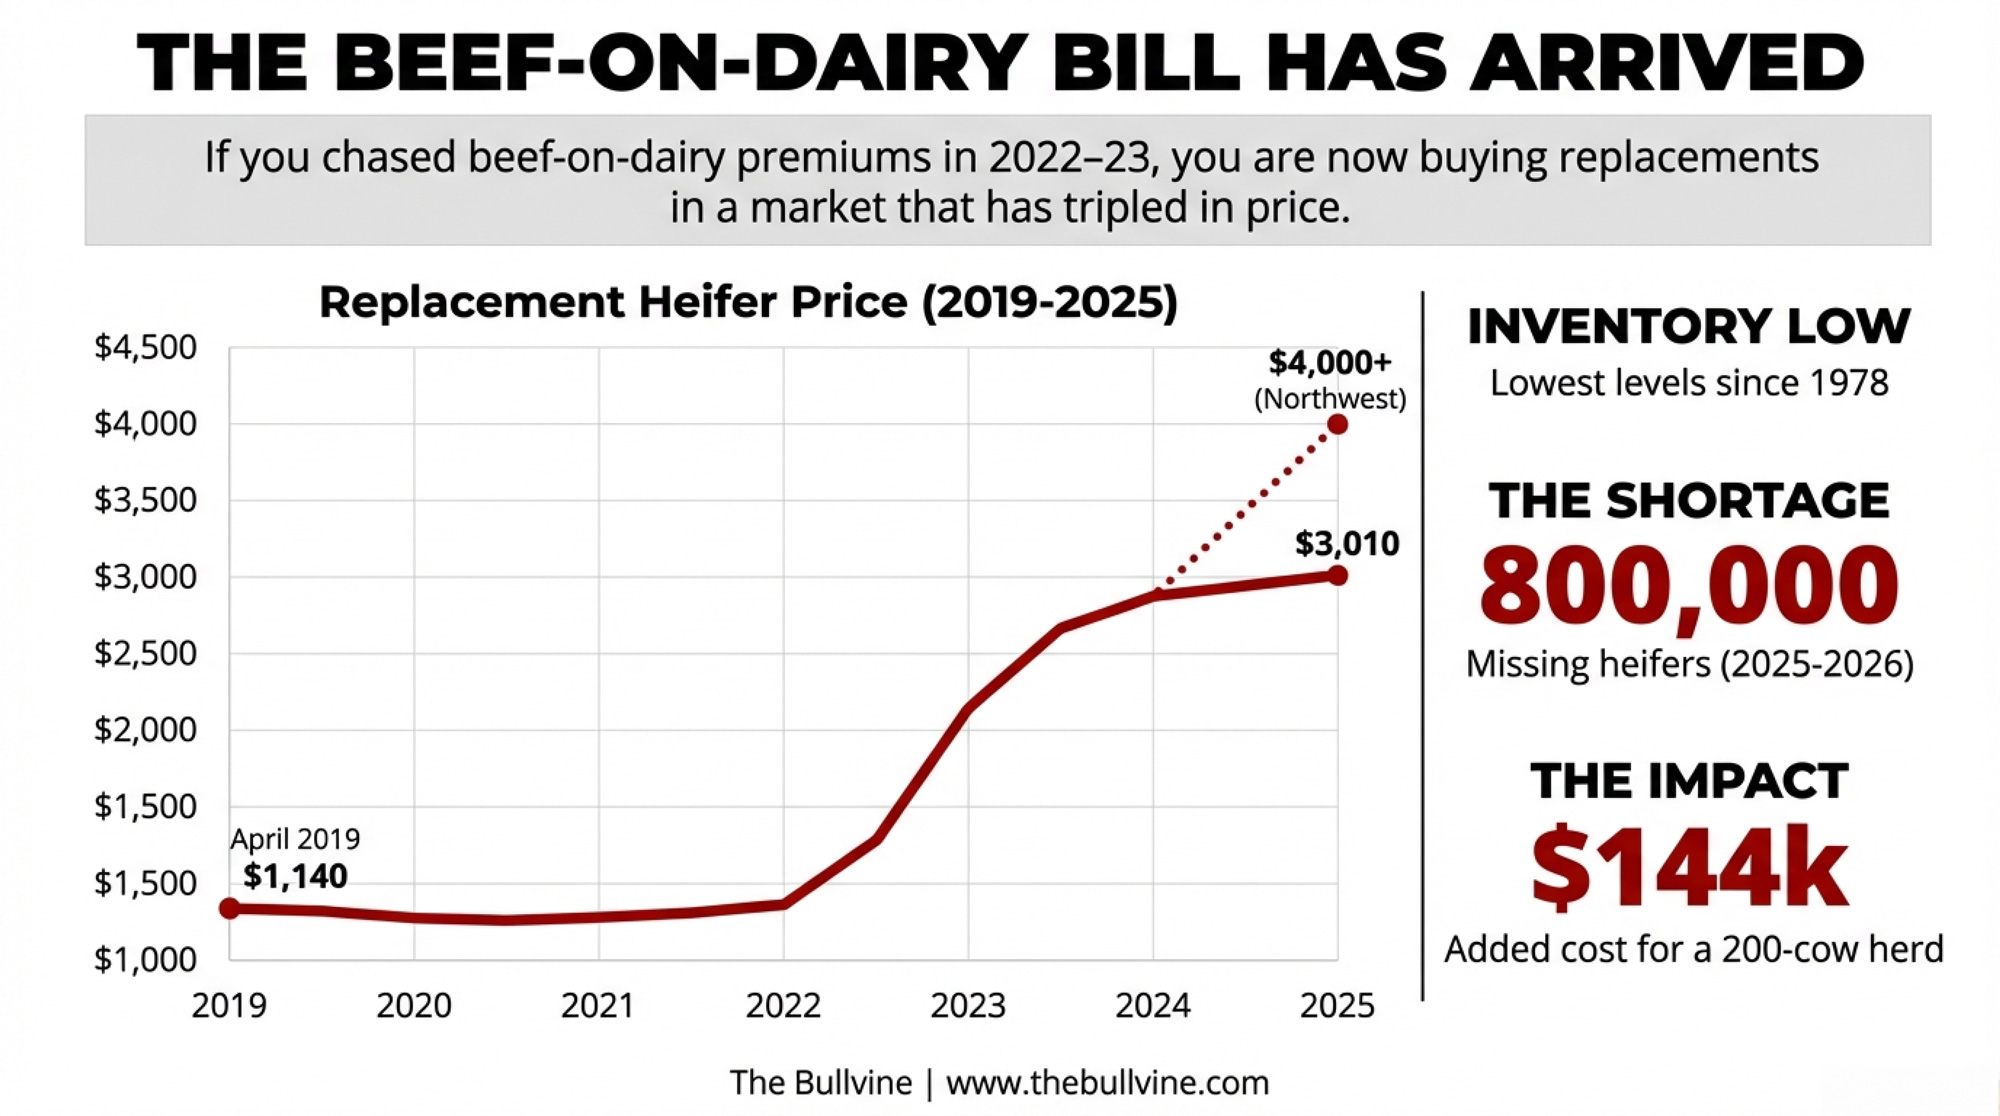
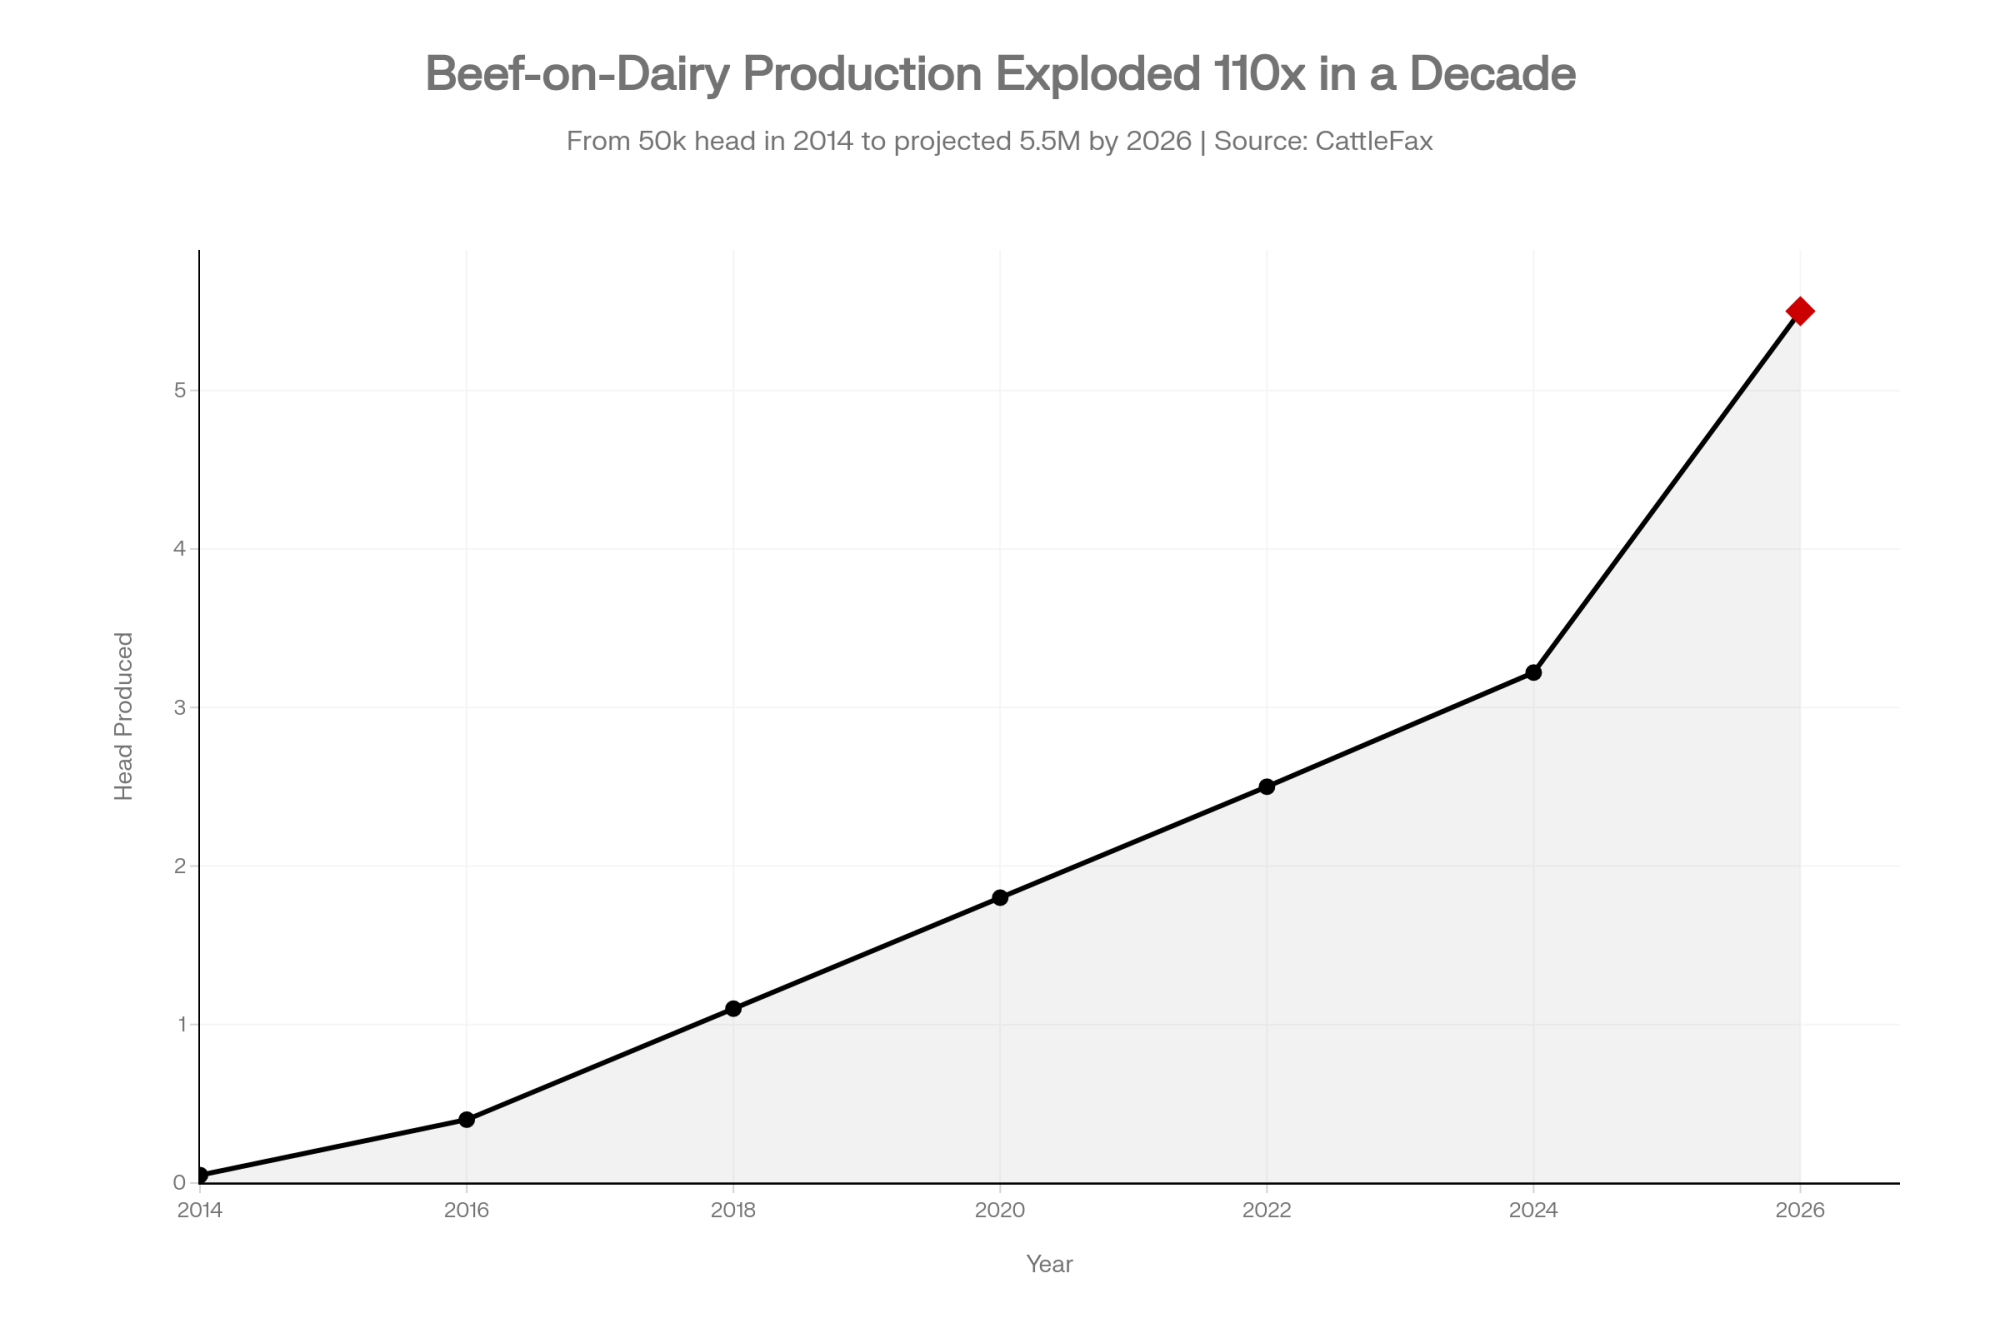
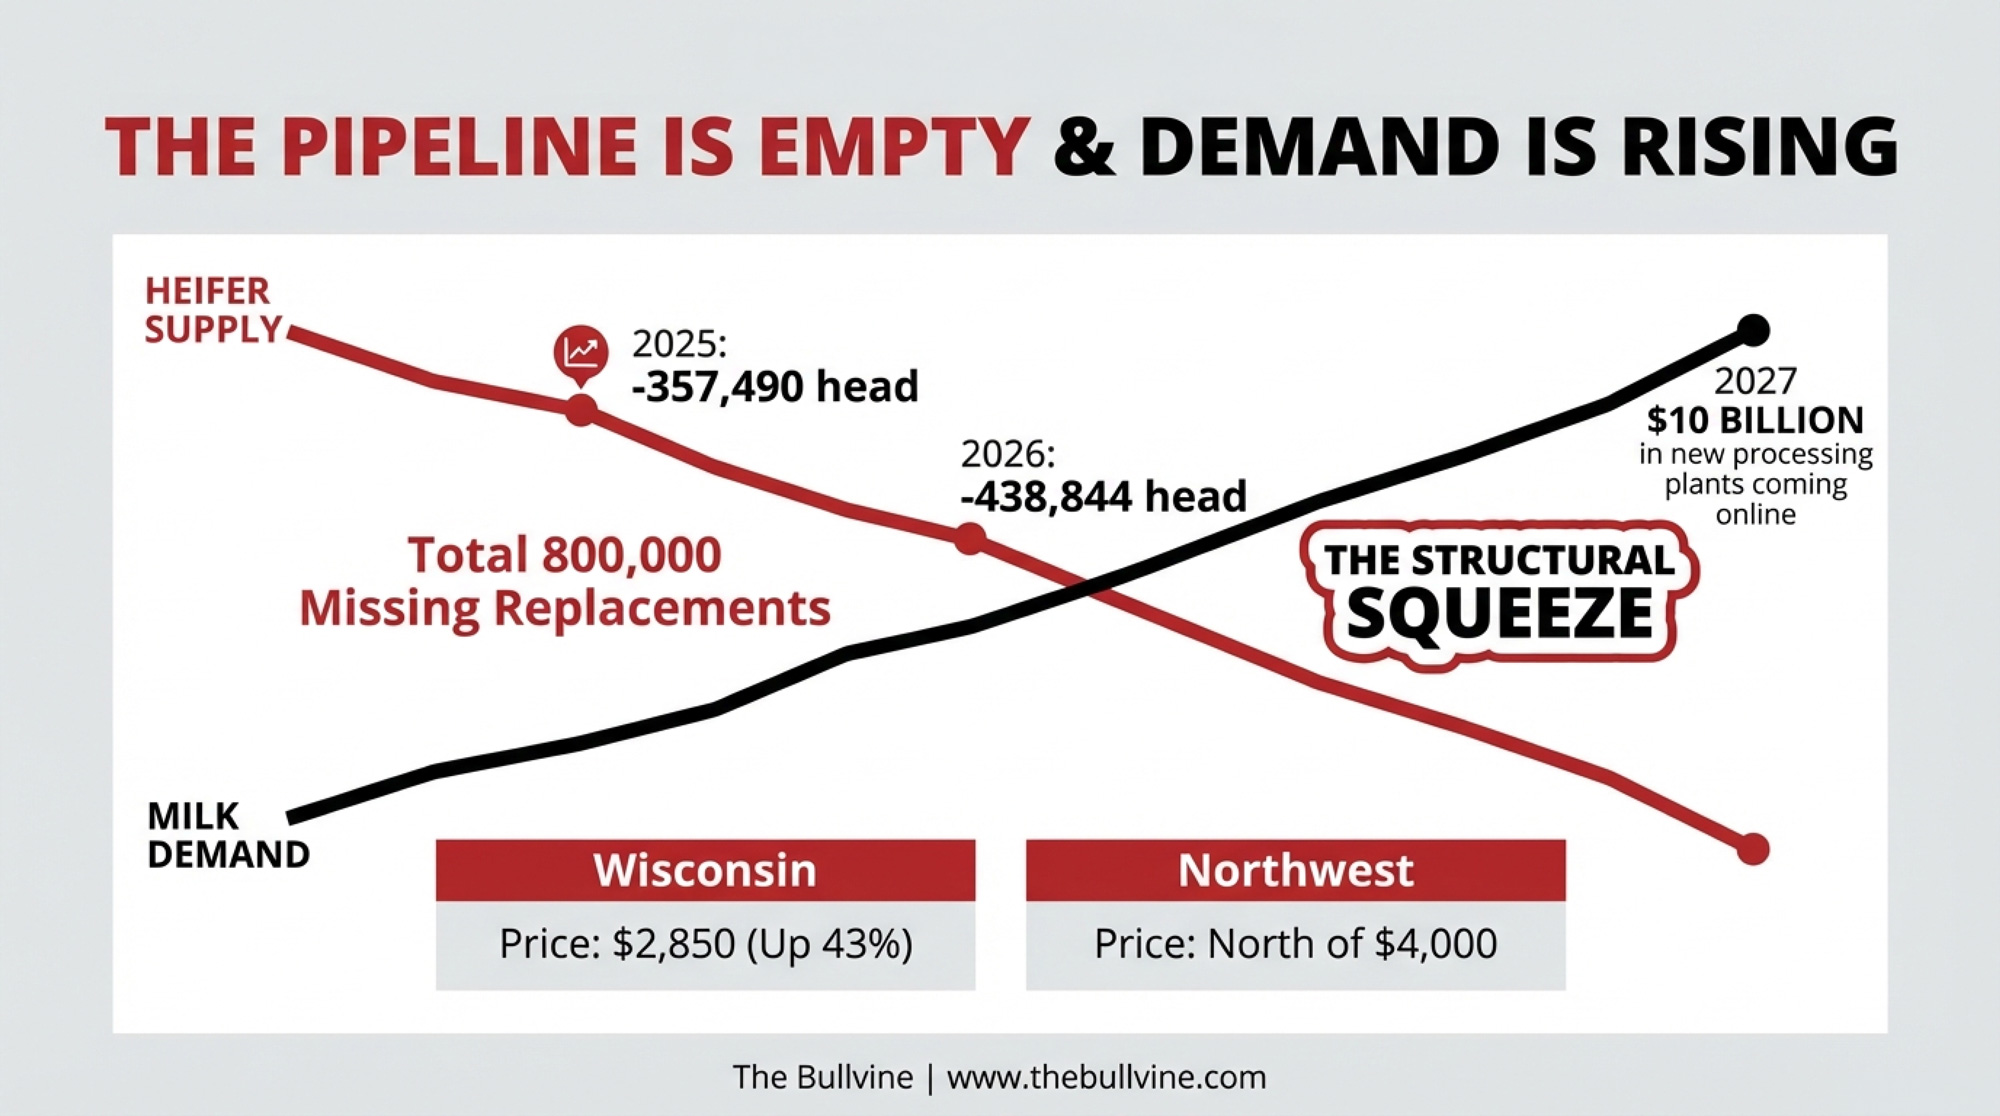

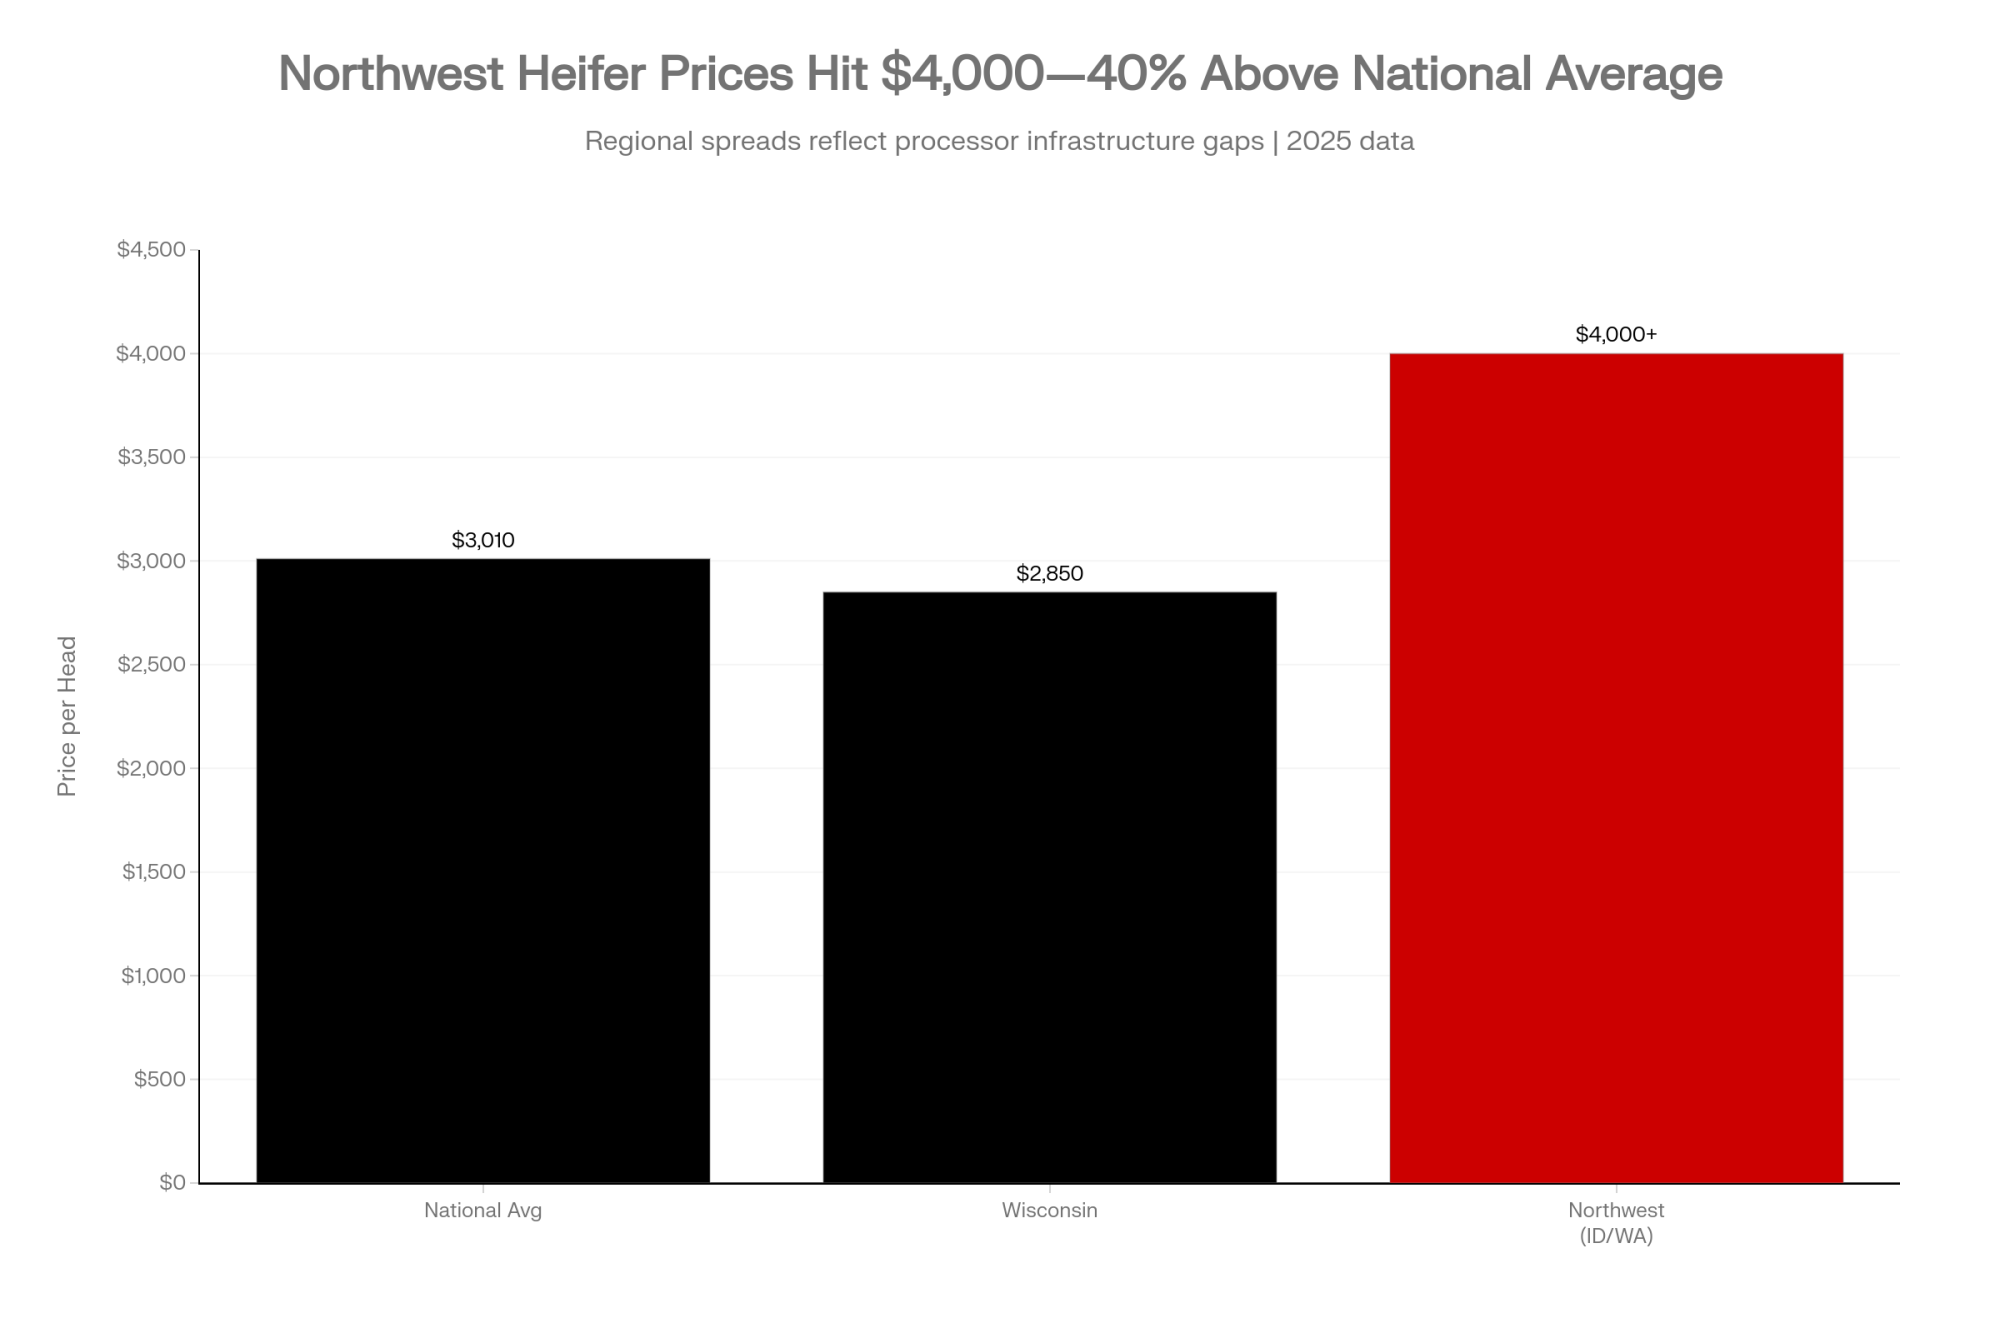
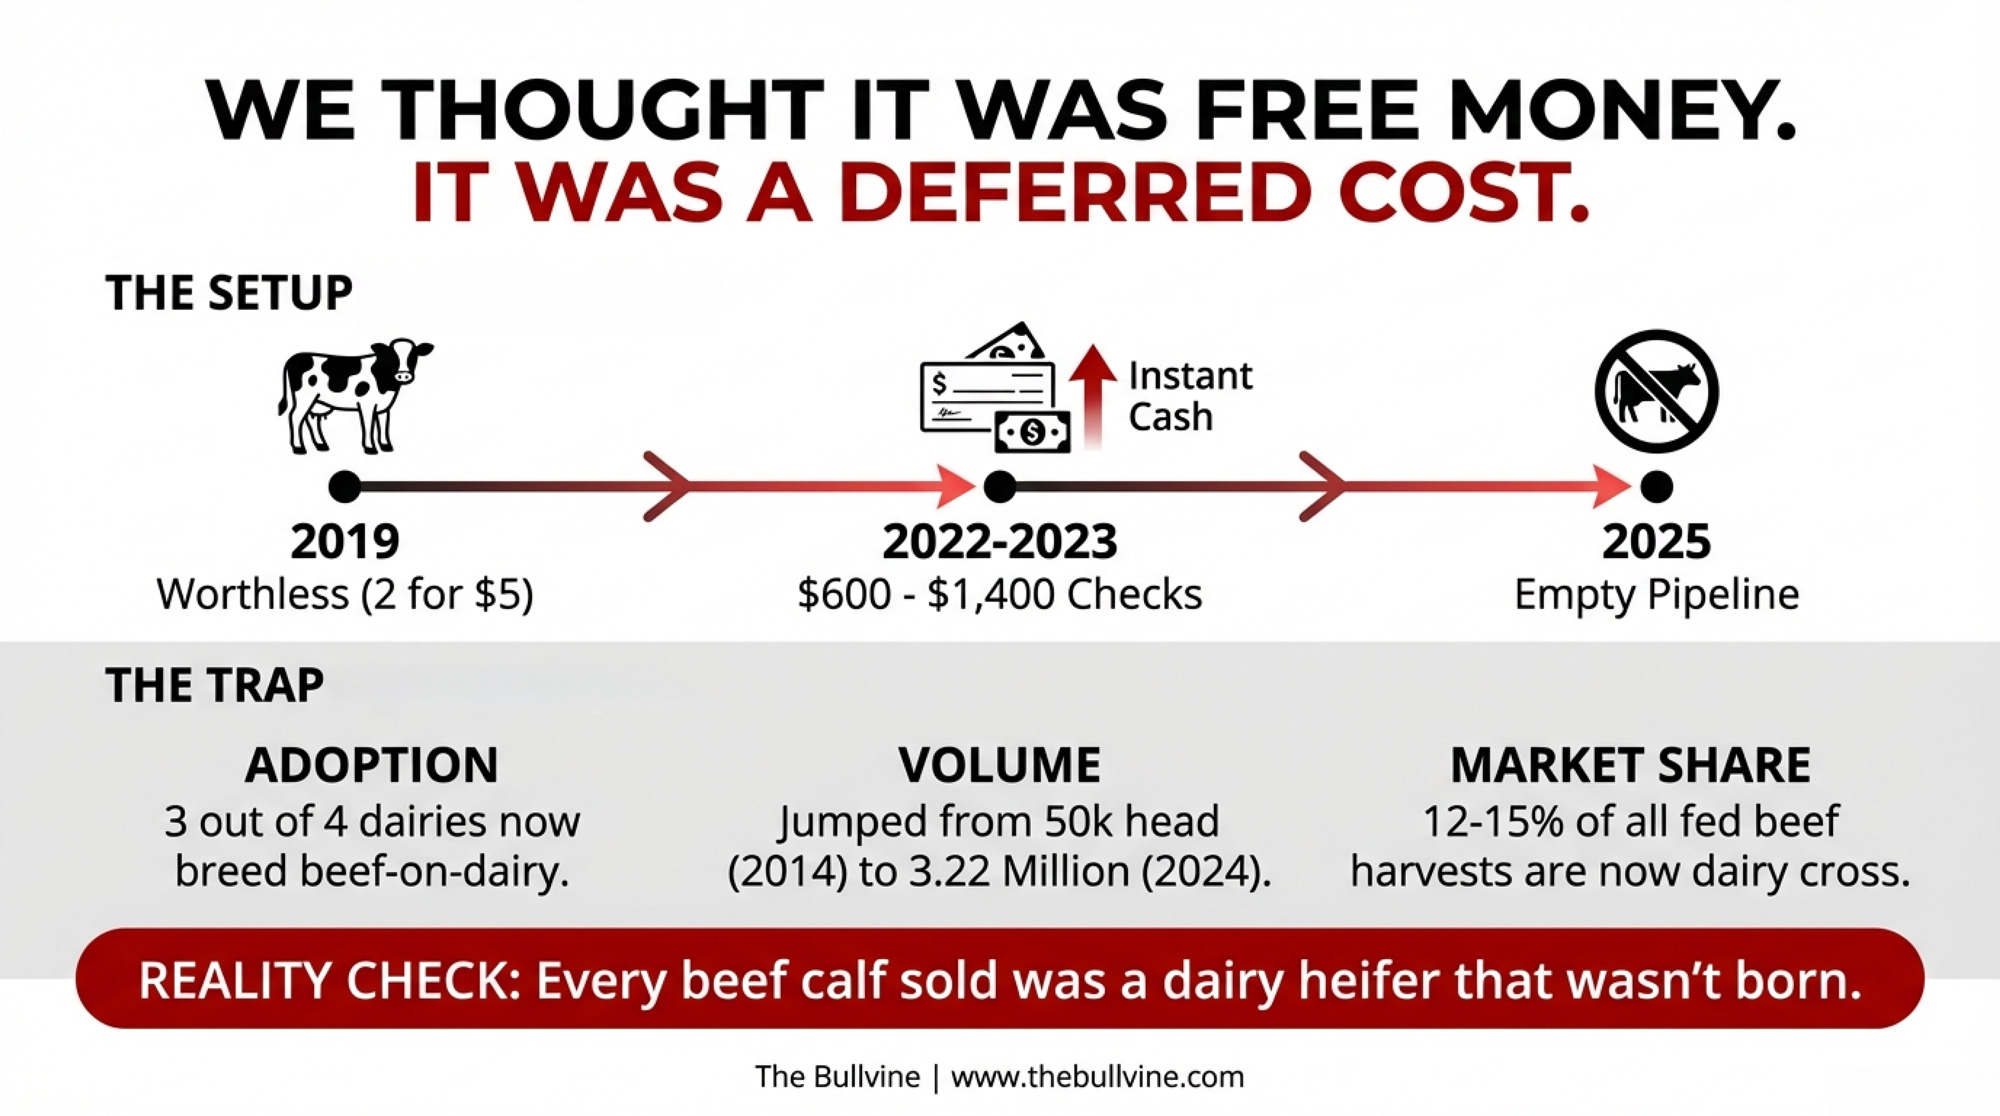
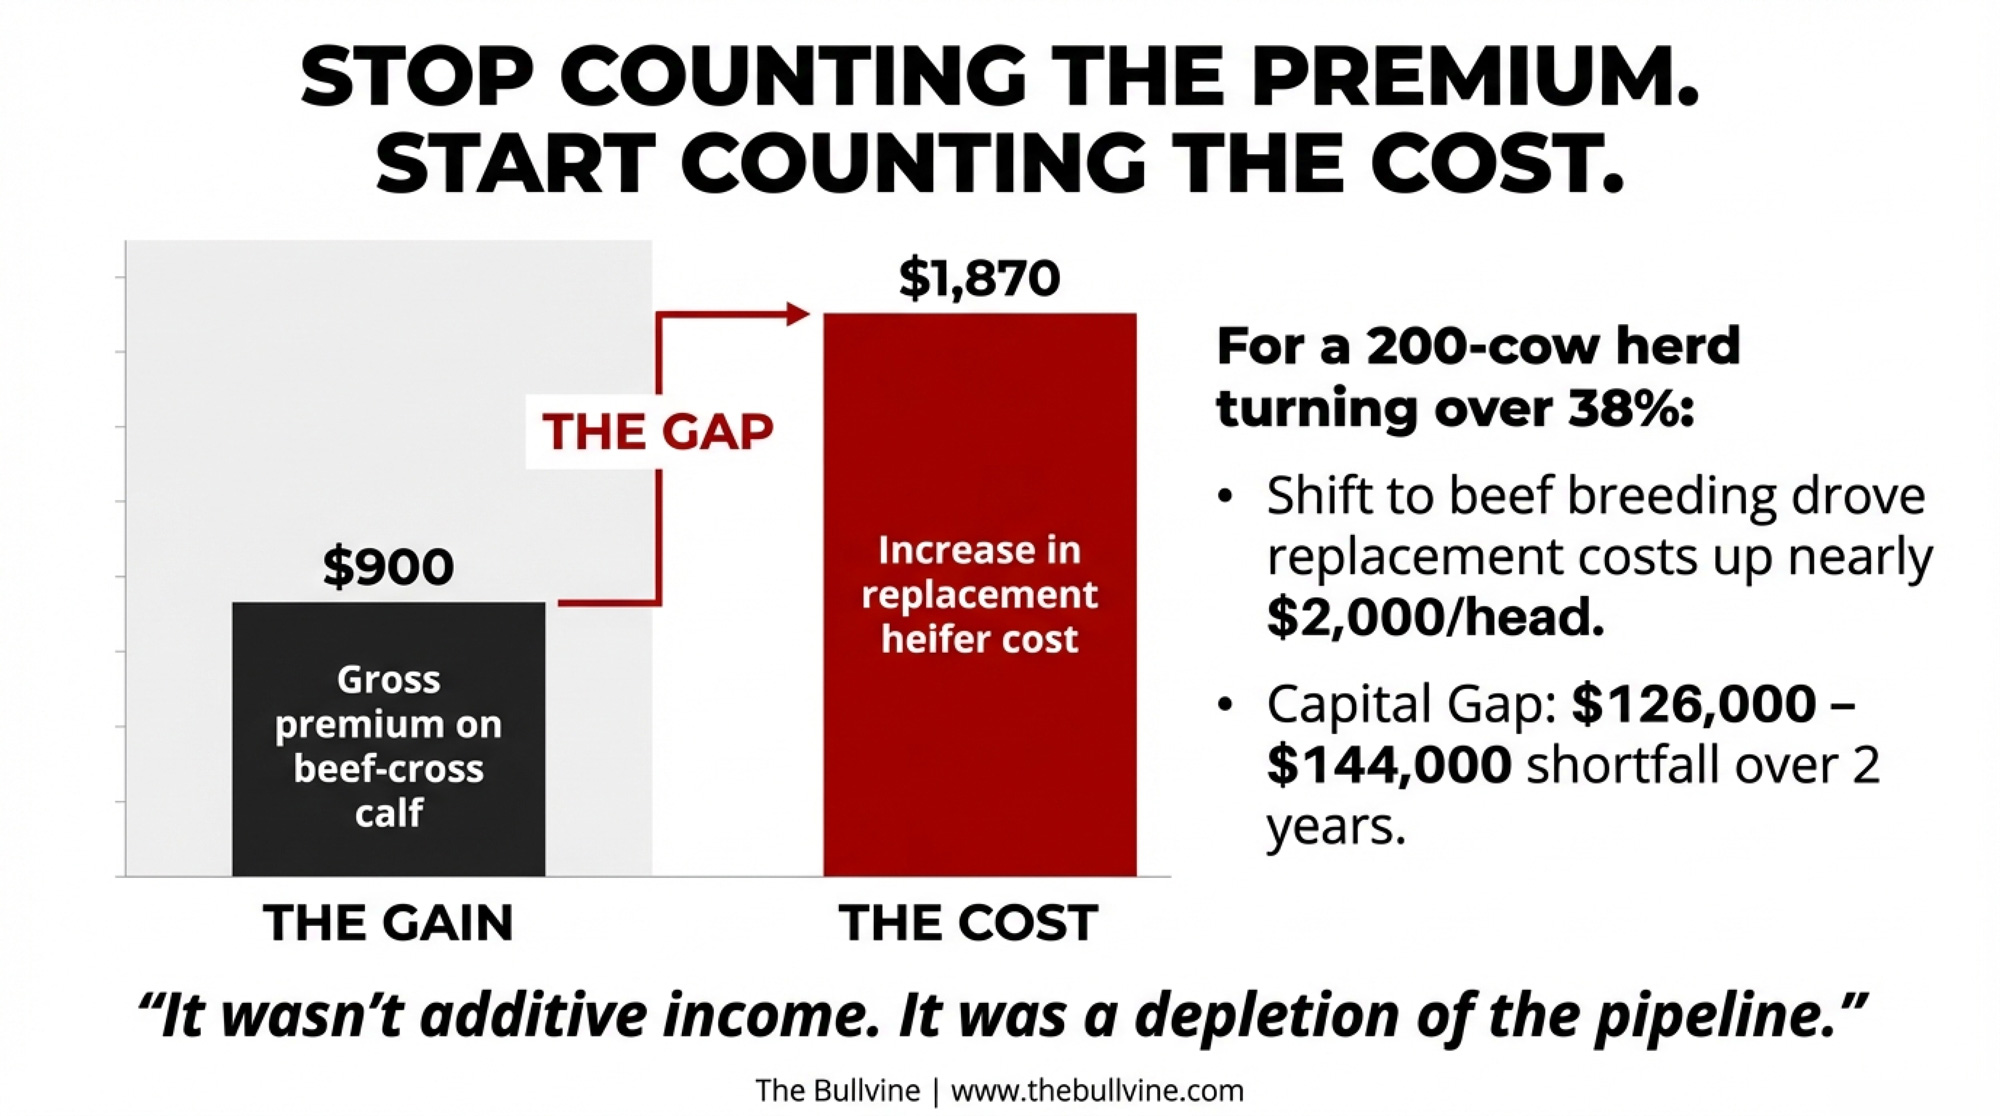
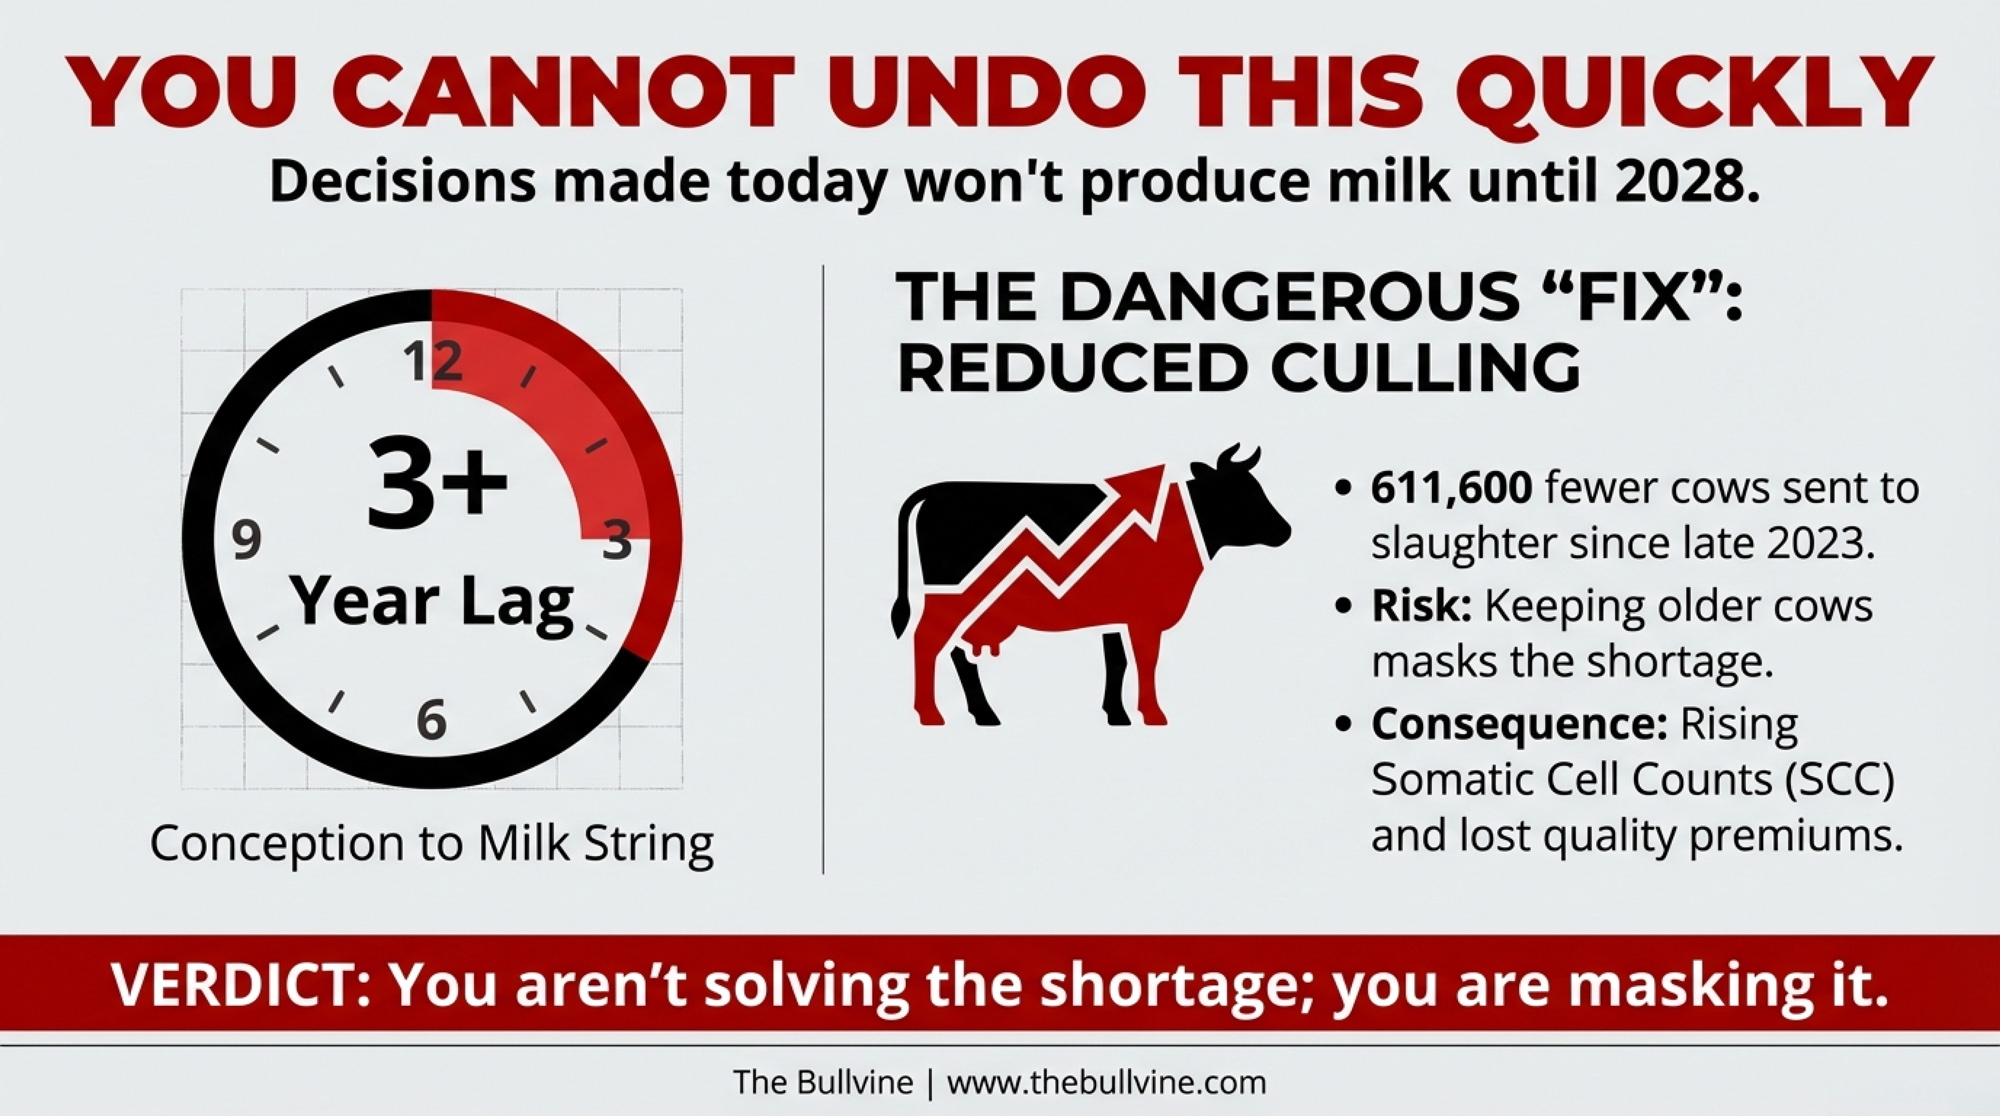
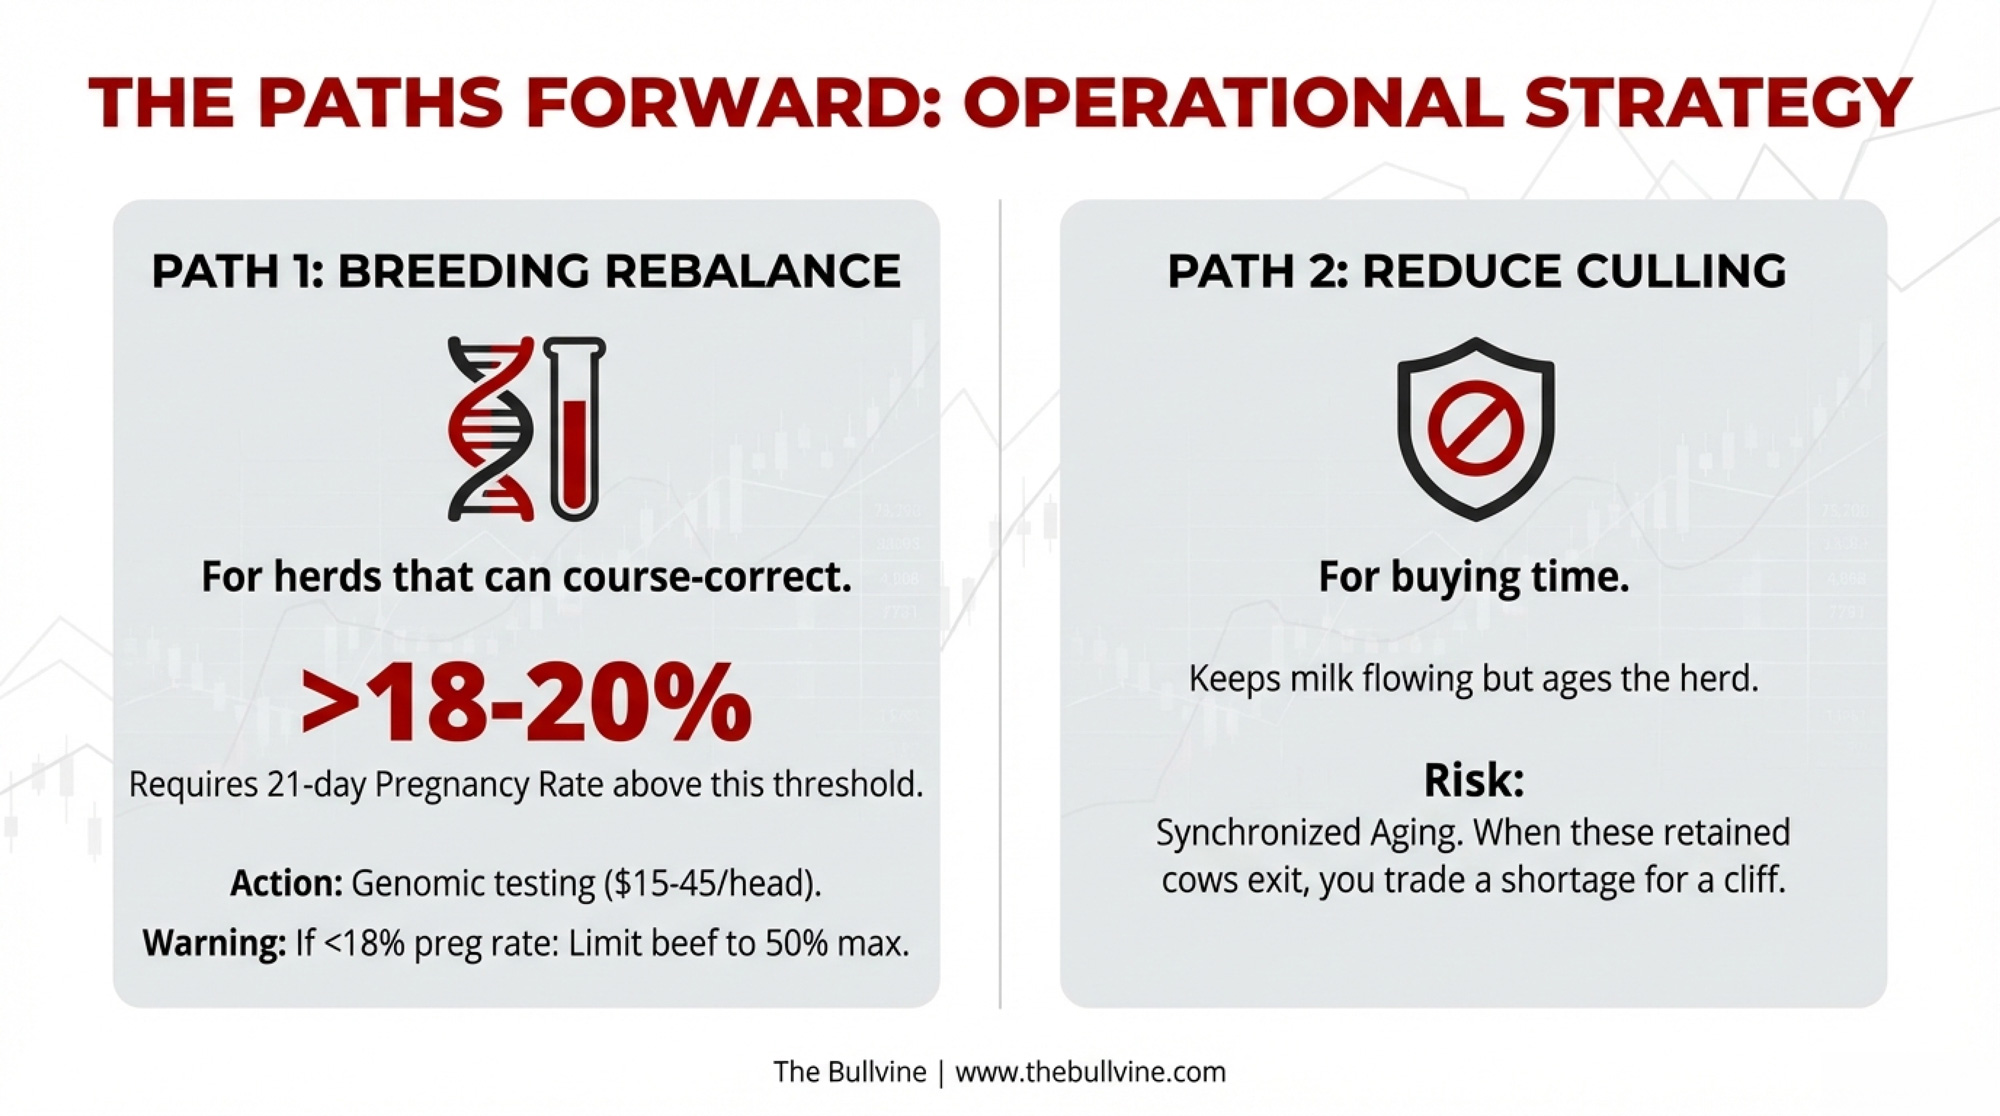
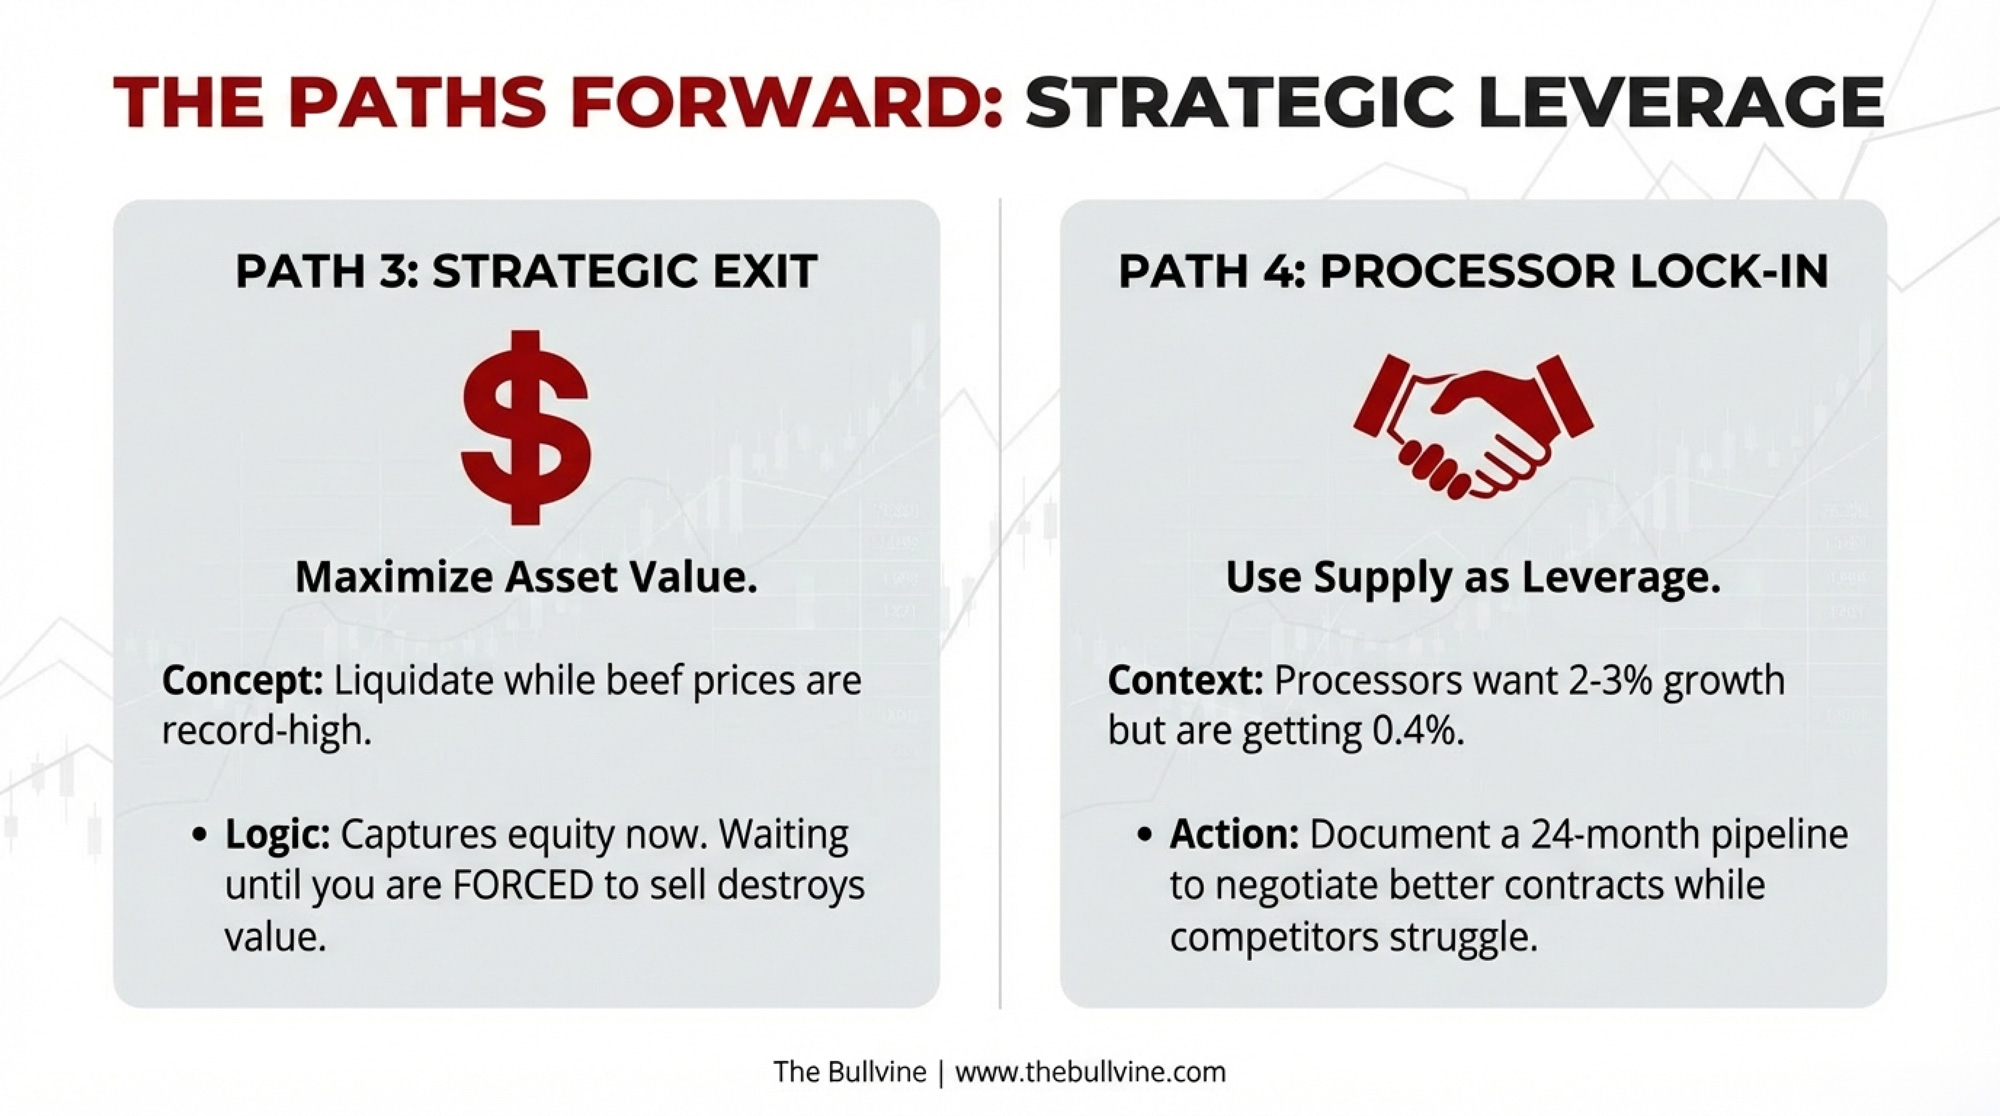
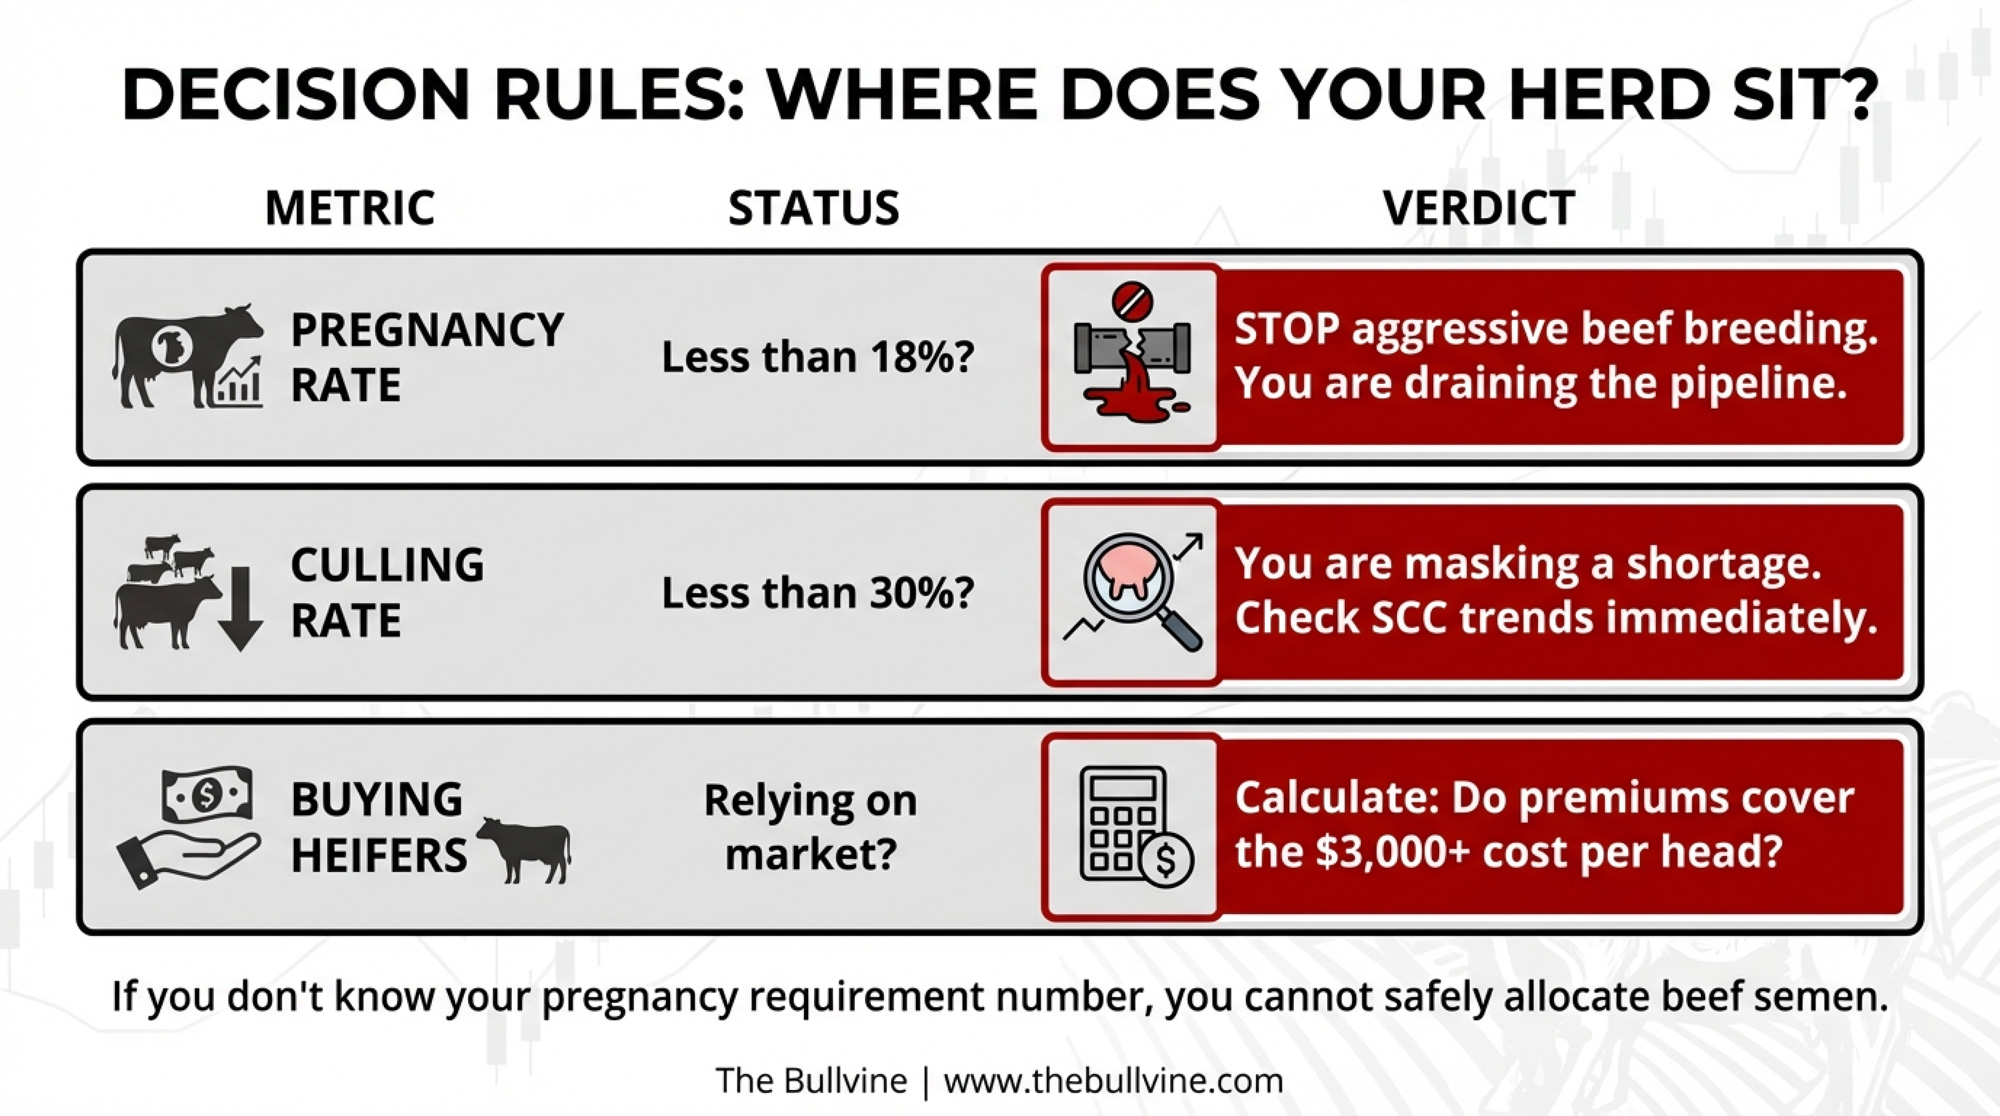
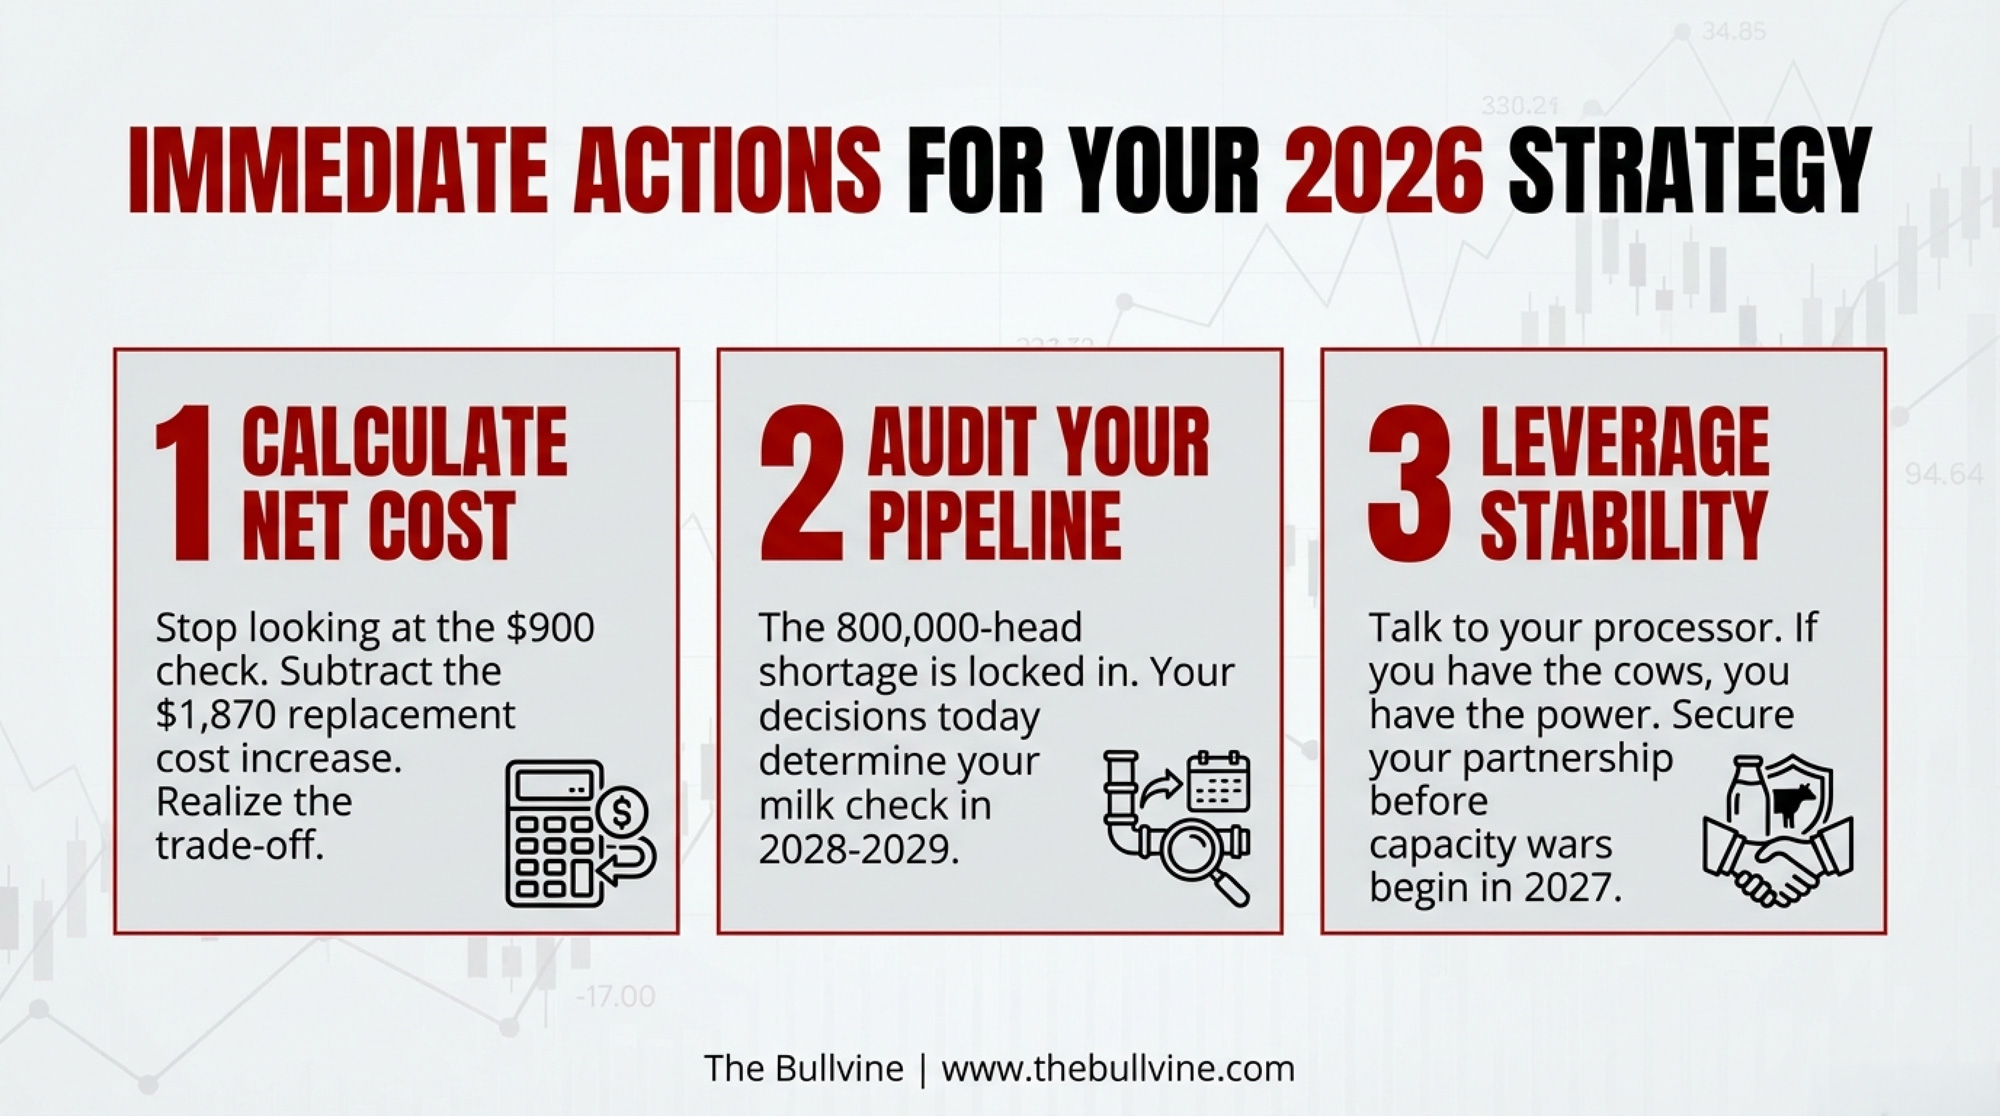
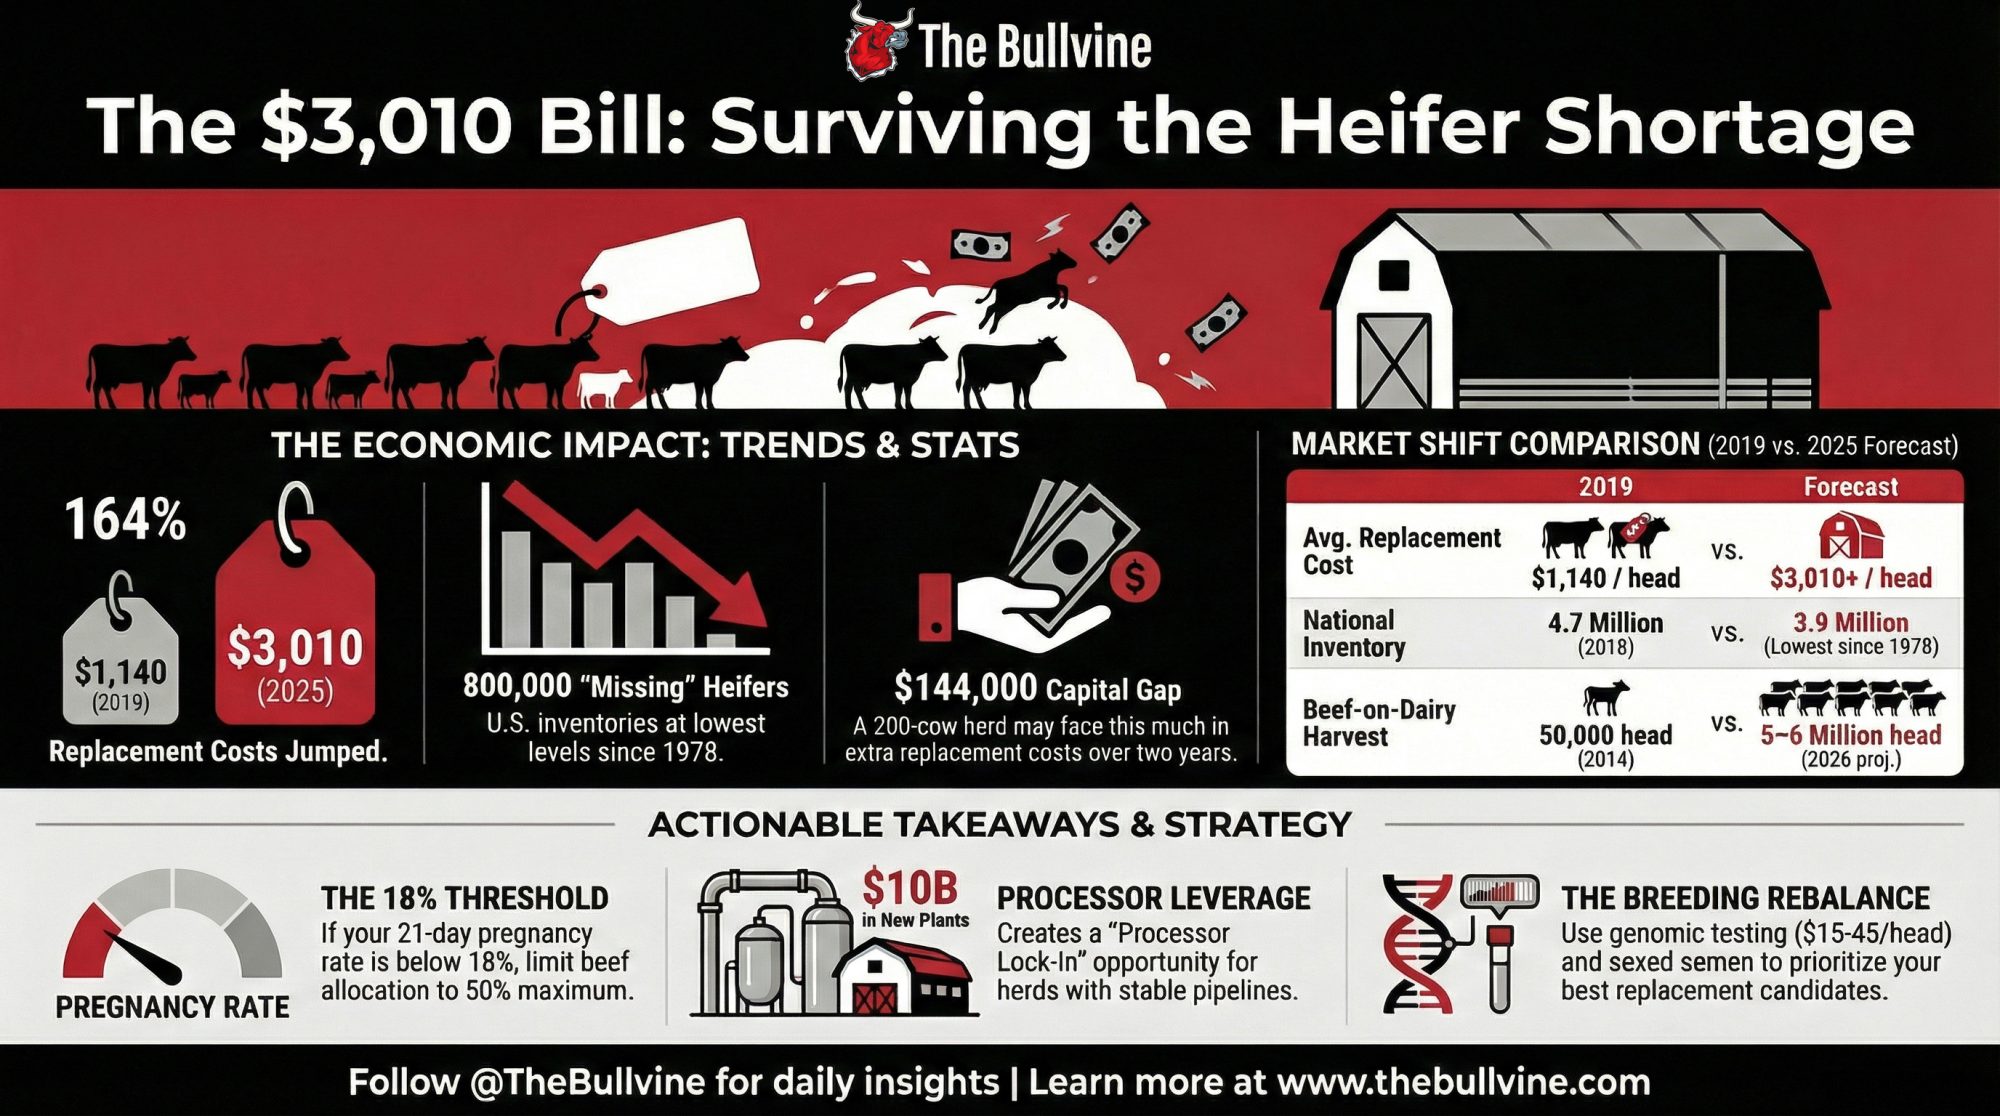
 Join the Revolution!
 Join the Revolution!