Archive for heifer replacement costs

Which Lane Is Your Dairy In? The $10B Shift You Need to Map Now

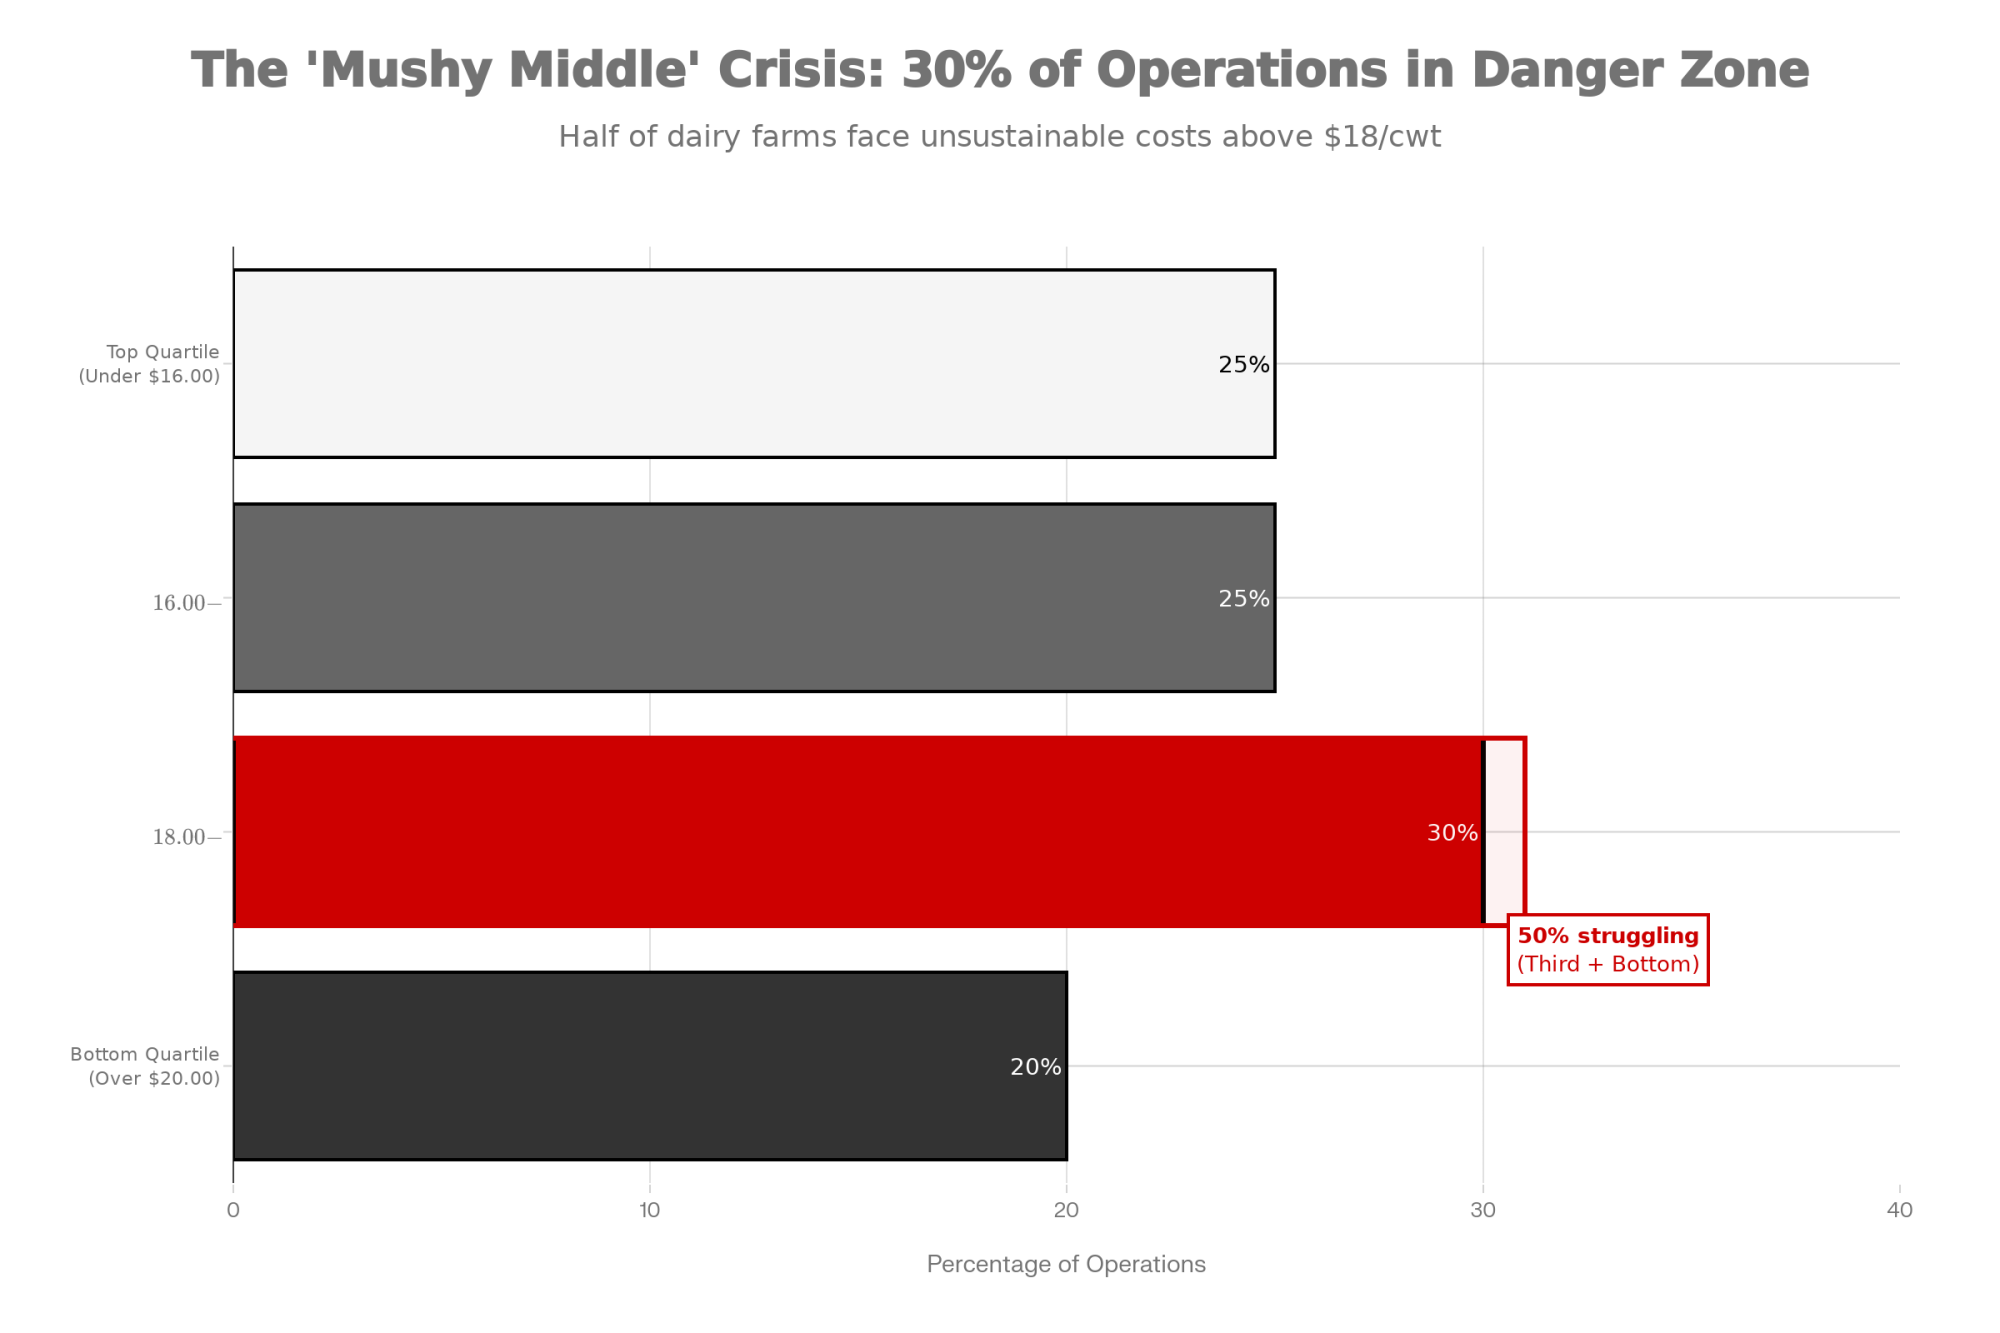
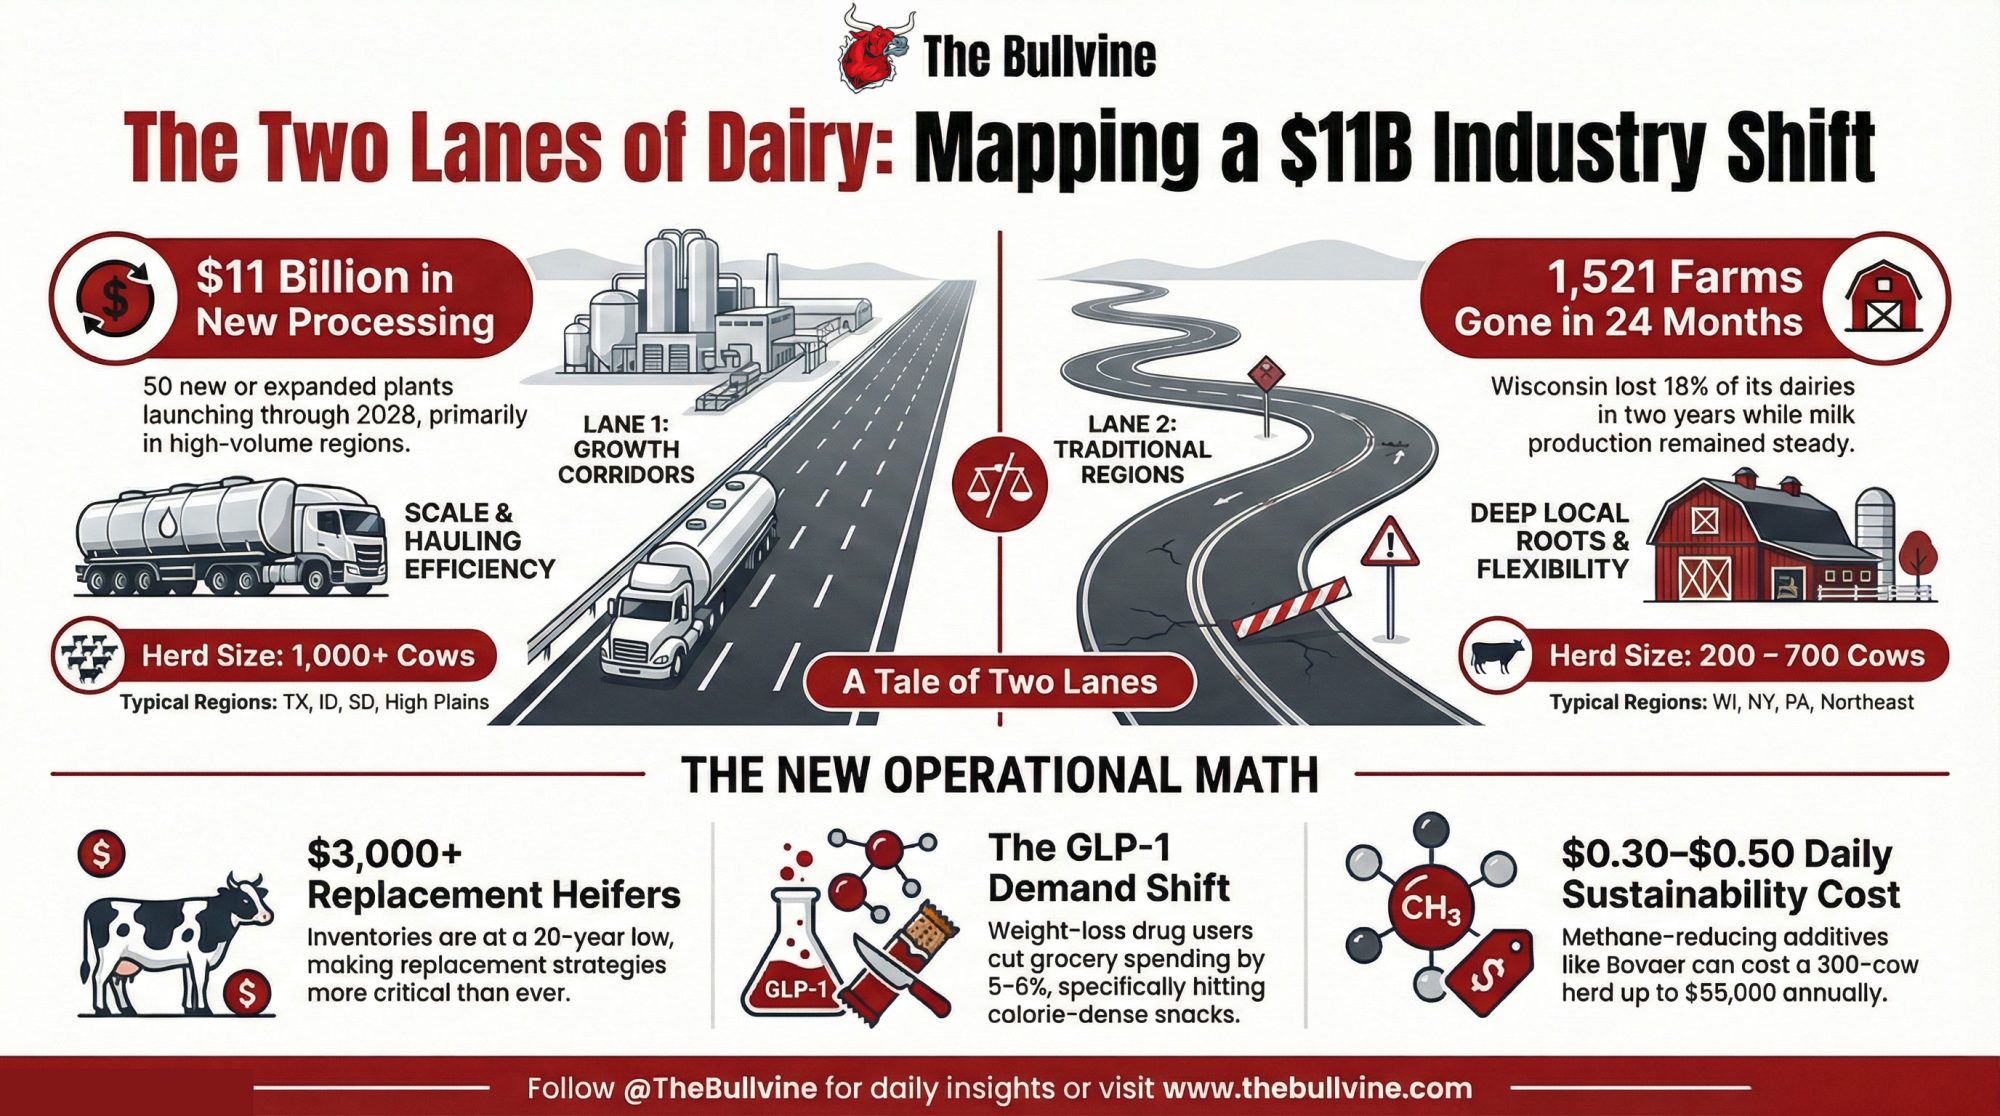
Dairy just sorted itself into two lanes. $10B in new plants is flowing to one. The other lost 1,521 farms while milk output held steady. Where does a 300-cow herd fit? Let’s map it.

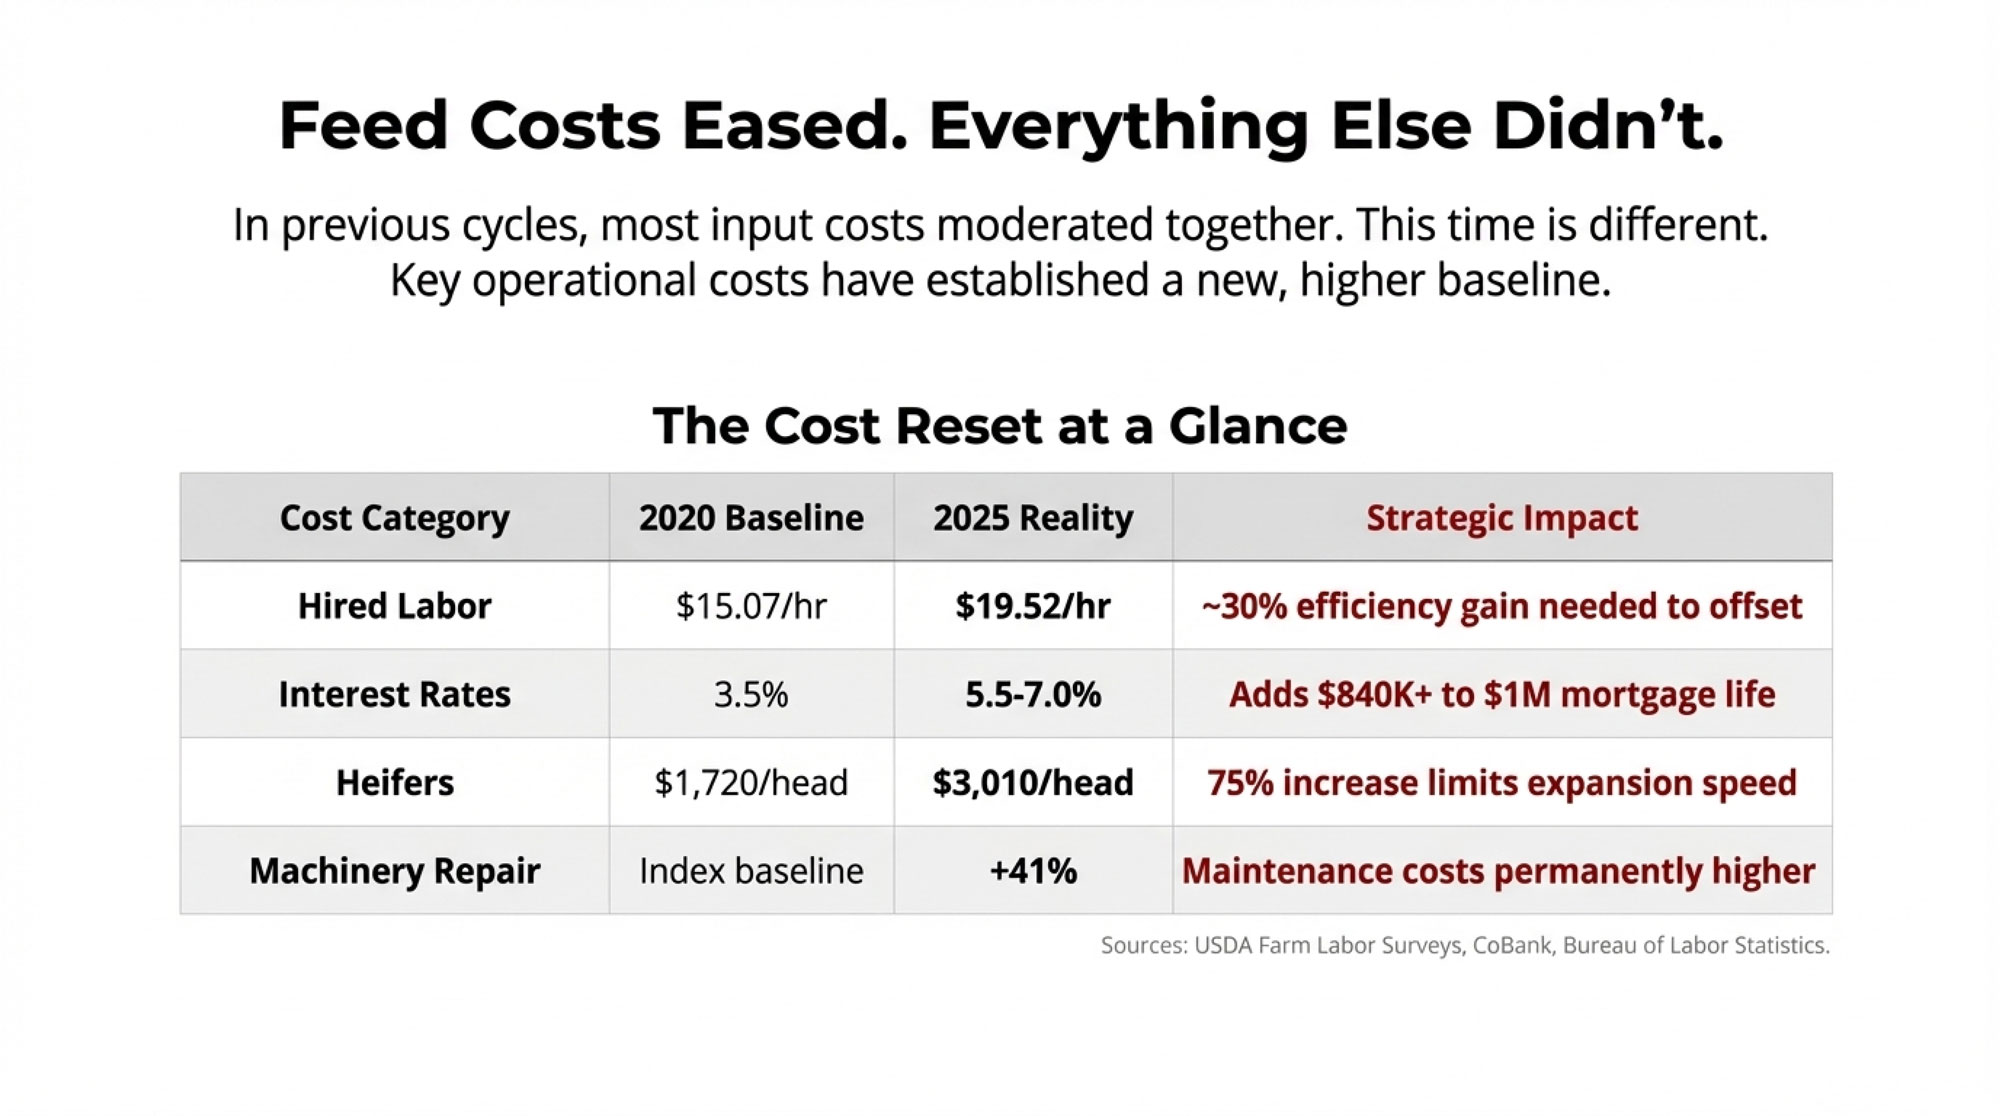
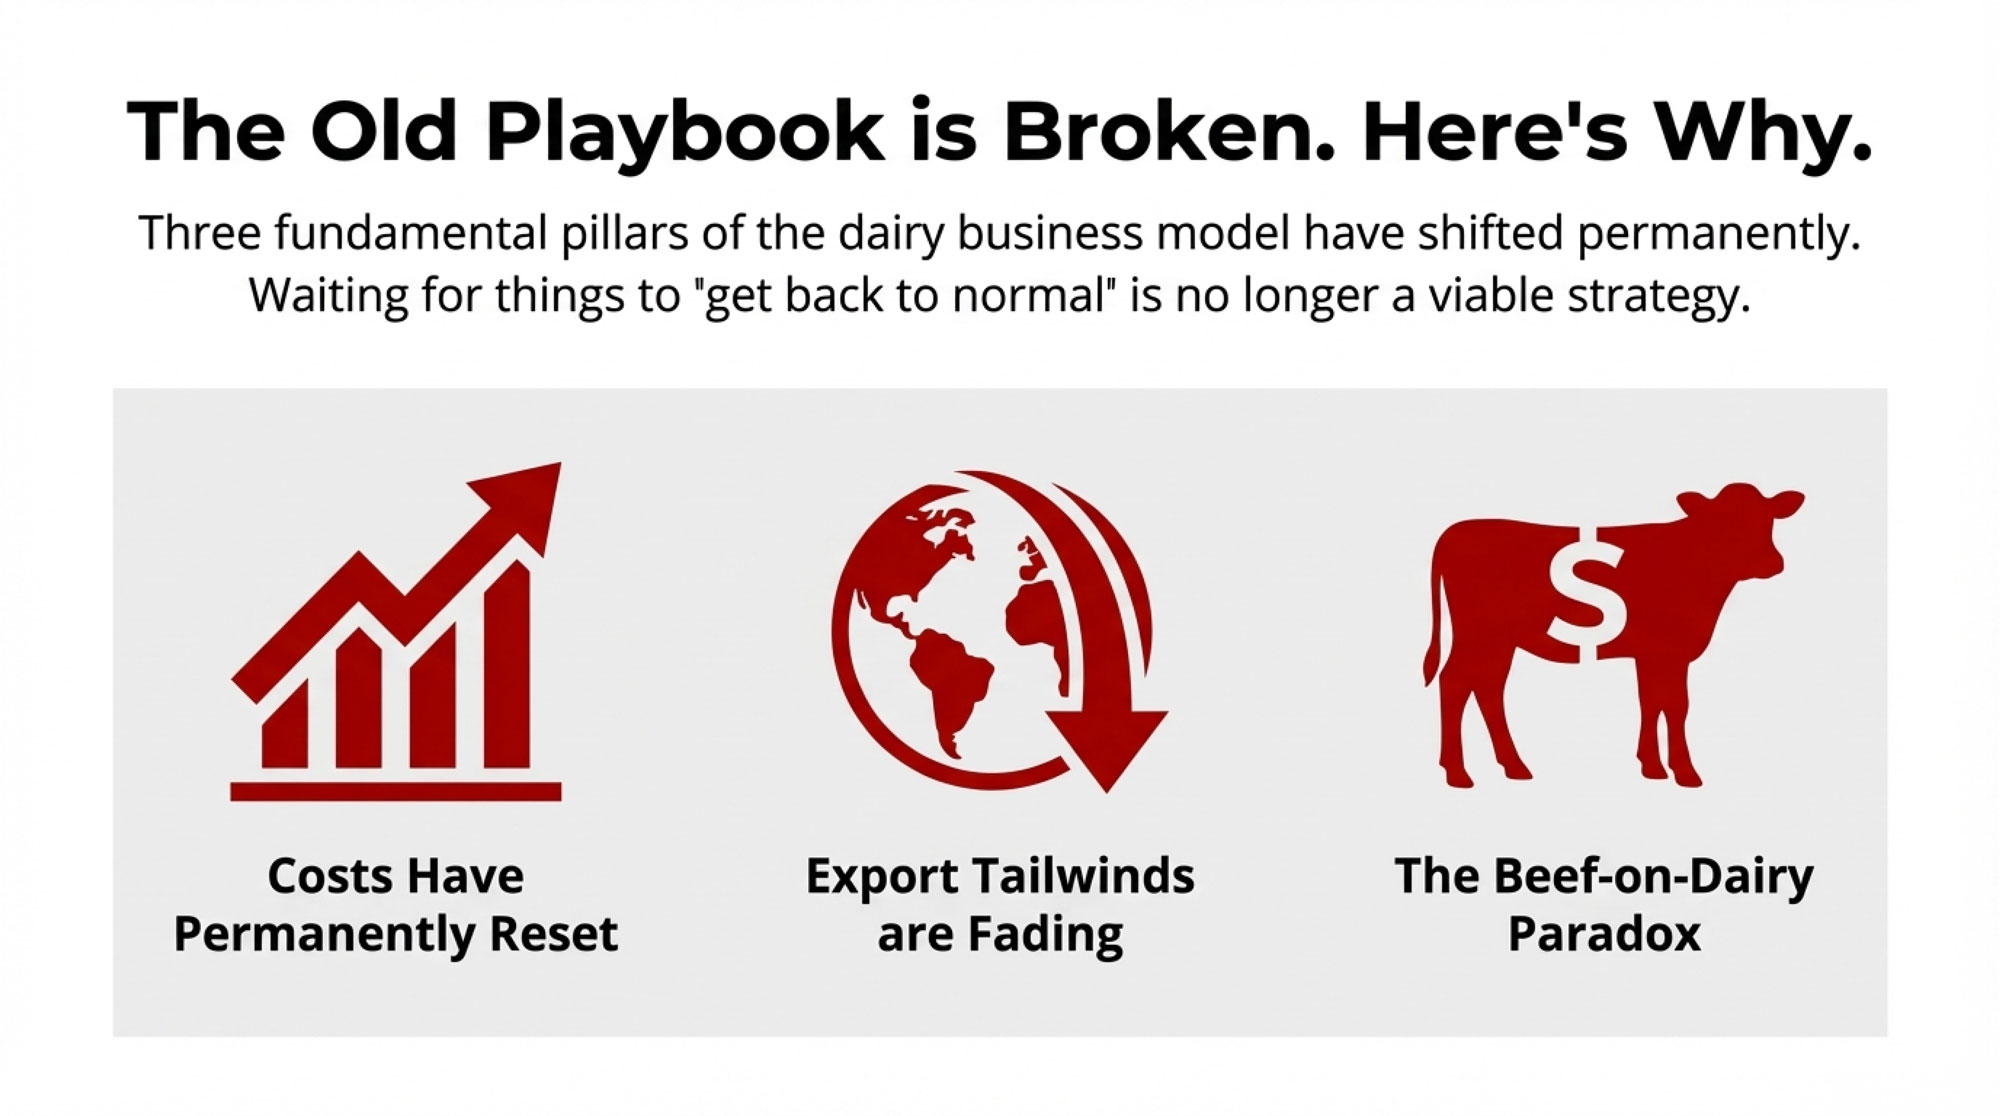
EXECUTIVE SUMMARY: U.S. dairy has sorted into two lanes—and most 300-cow herds didn’t pick theirs. Lane 1 (large operations in Texas, Idaho, the High Plains) is pulling $10-11 billion in new processing investment, per CoBank and IDFA data. Lane 2 (mid-sized family dairies in Wisconsin, New York, the traditional Midwest) watched 1,521 farms disappear in two years while milk output held steady. The pressure is structural, not cyclical: heifer inventories at a 20-year low, bred replacements topping $3,000, GLP-1 drugs shifting grocery spending, and sustainability mandates like Bovaer adding $0.30-0.50/cow/day. Here’s the playbook—stress-test your margins against hard scenarios, map your processing exposure, calibrate beef-on-dairy carefully, vet sustainability contracts like any major deal, and have the family conversation about whether staying, growing, or a well-timed exit is your version of winning. The math is uncomfortable. But it’s yours to run.

mid-sized dairy strategy

If you sit around enough kitchen tables in Wisconsin, New York, Pennsylvania, or Minnesota, you start to hear a very different conversation than the one you get on the conference stage.

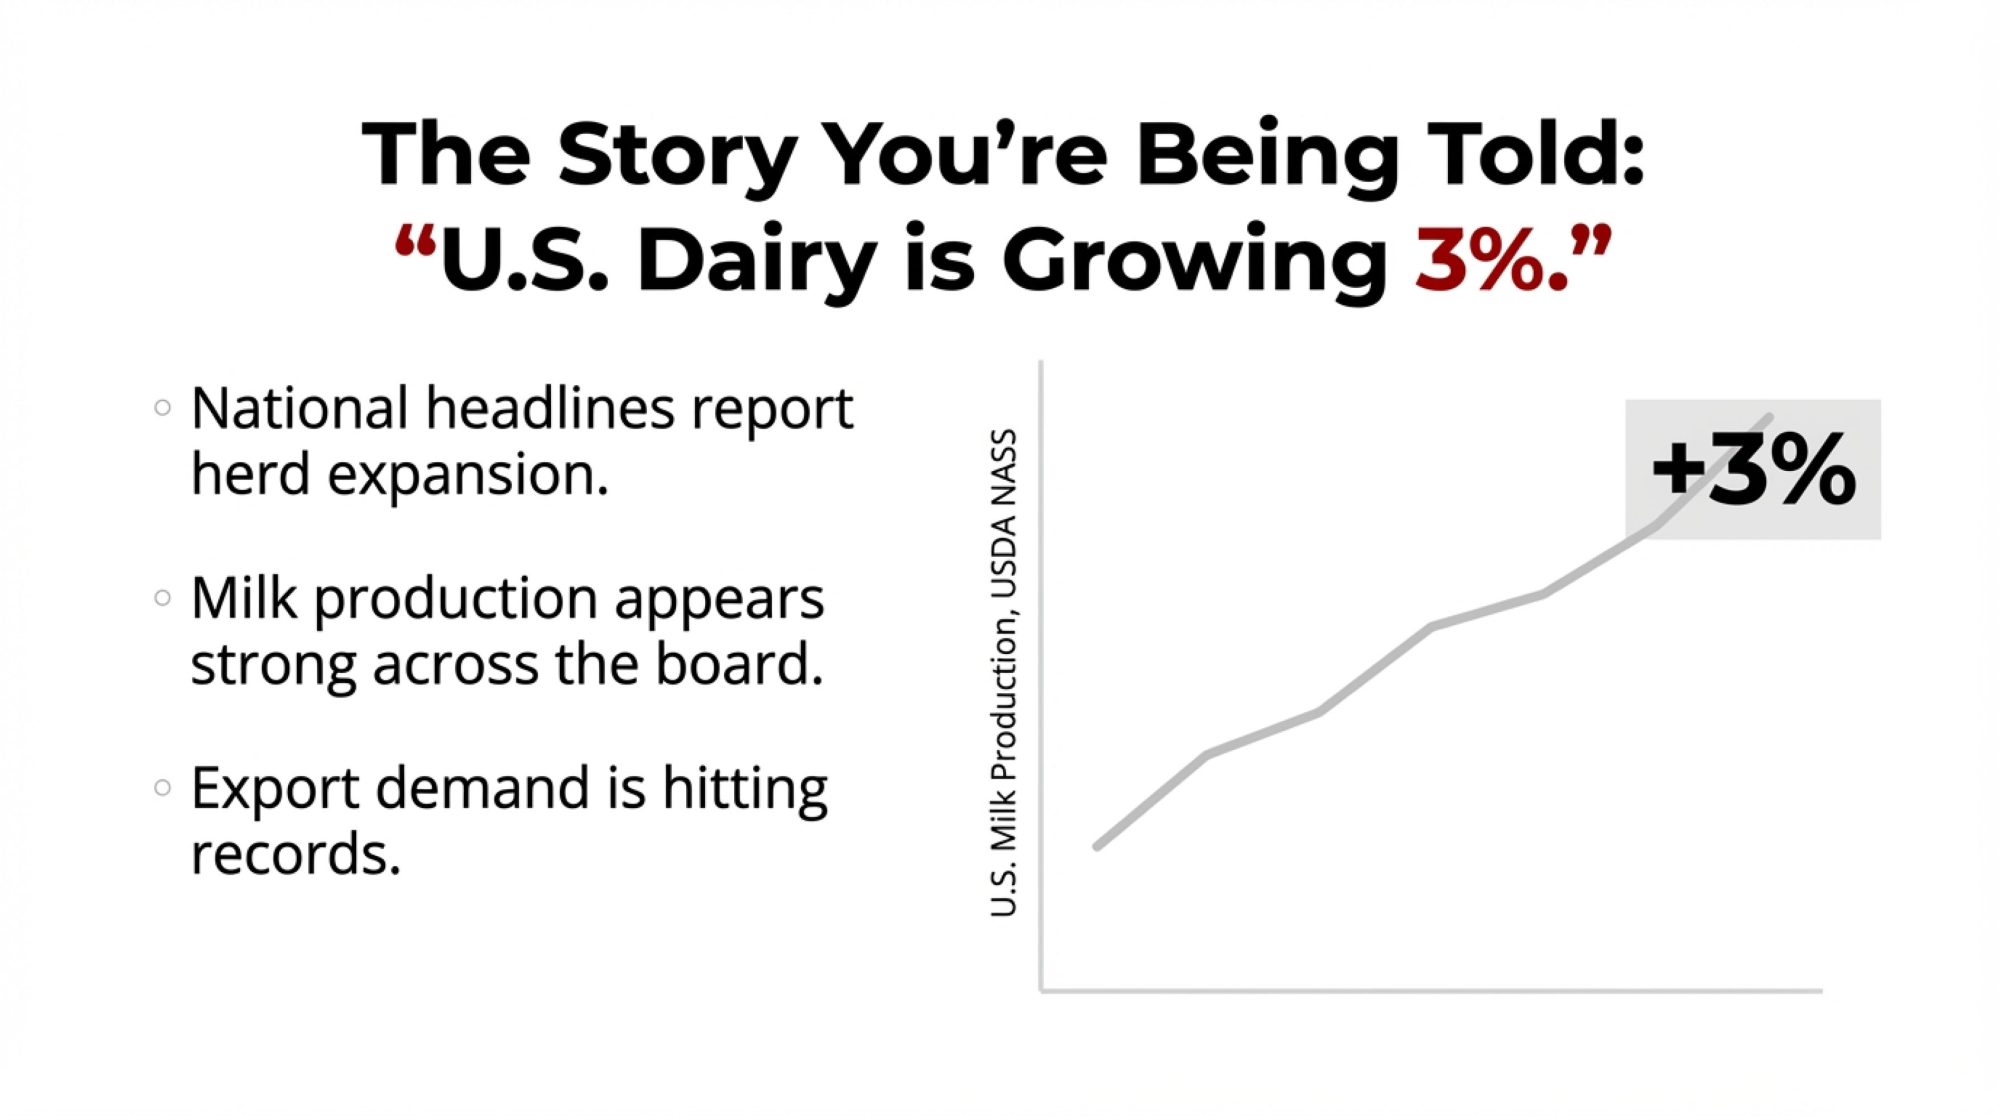
On stage, the slides say U.S. dairy is strong, national milk volumes are holding, and there’s a massive wave of new stainless going into places like South Dakota and the Texas Panhandle. And you know what? Those slides aren’t wrong.

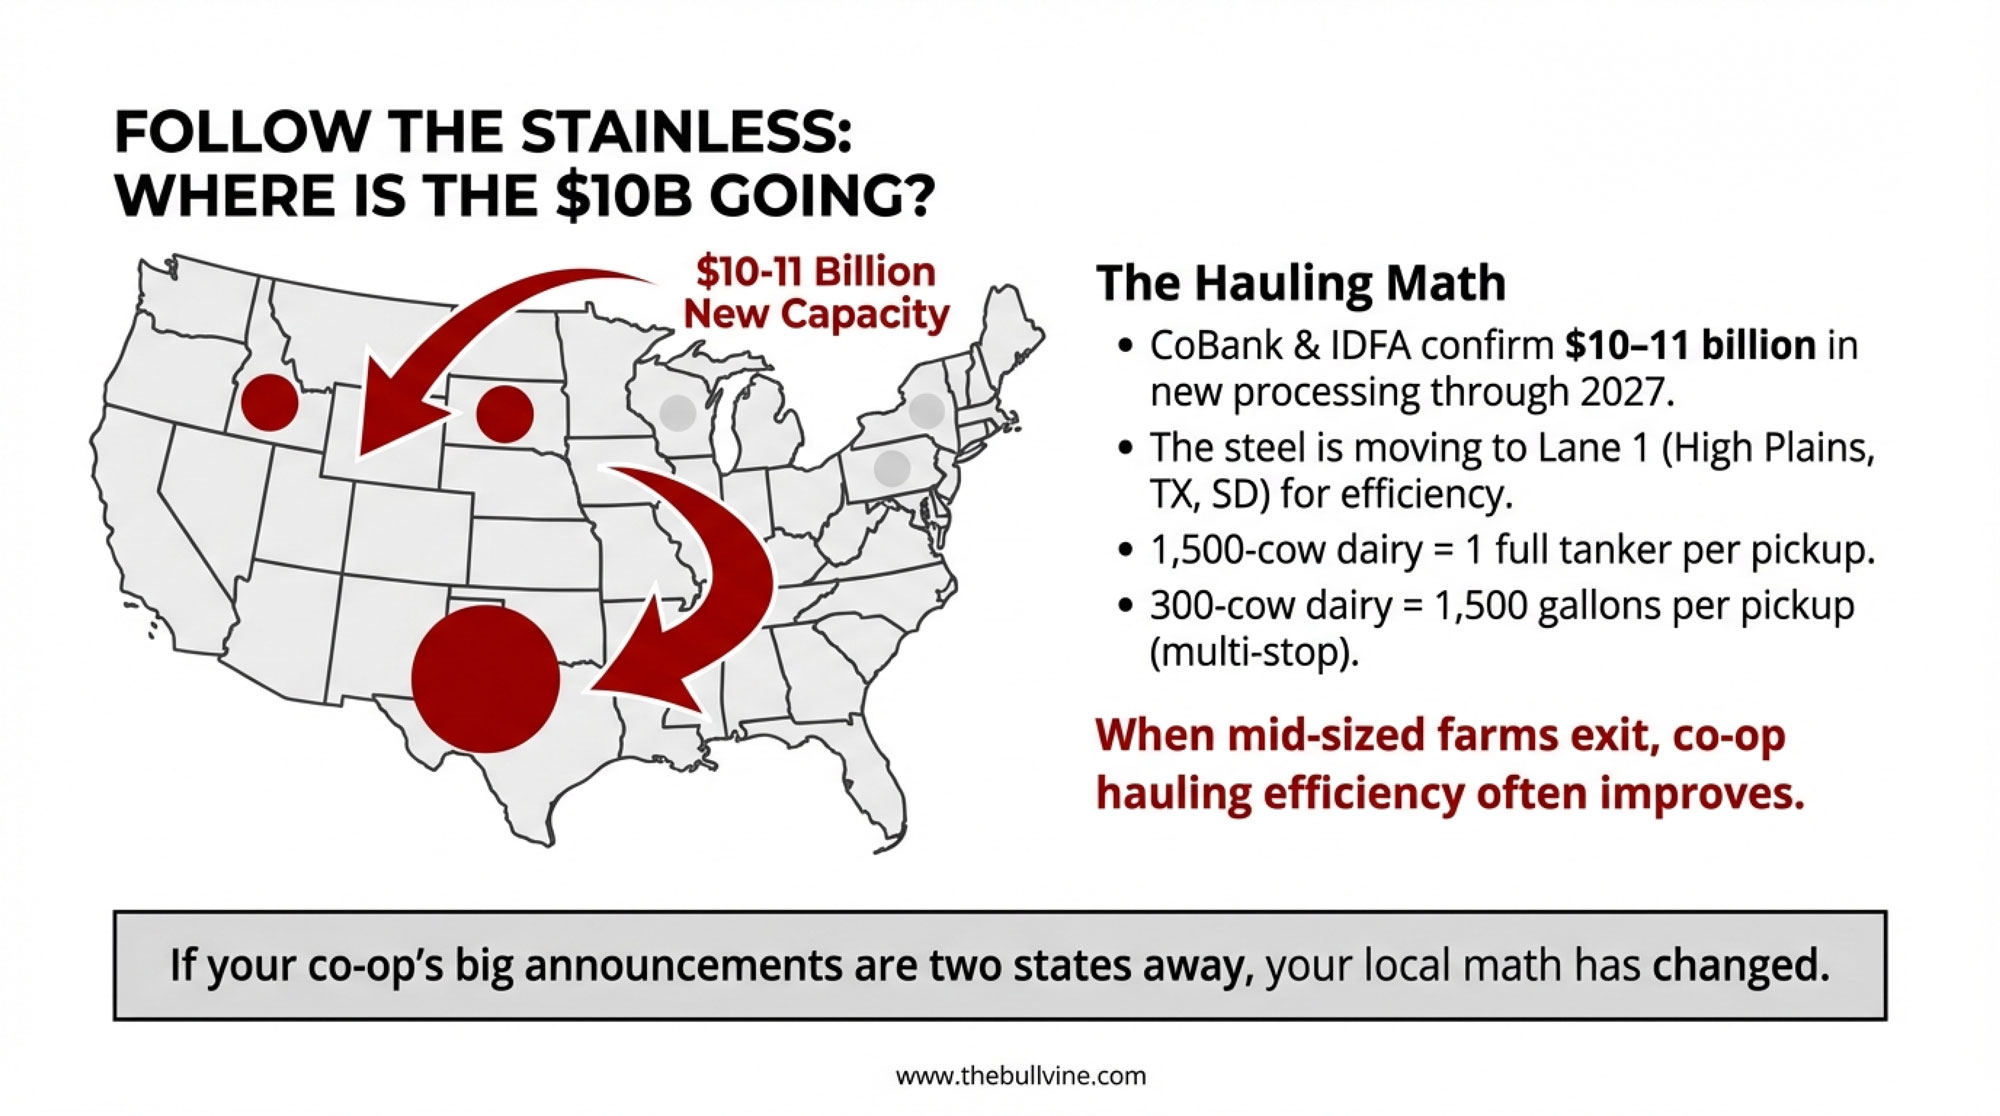
CoBank’s dairy economists peg new U.S. dairy processing investment at about $10 billion expected to come online through 2027, much of it in large cheese, powder, and beverage plants anchored in high‑volume regions. The International Dairy Foods Association announced in October 2025 that processors are investing more than $11 billion in 50 new or expanded plants across 19 states between 2025 and early 2028. 

Region2025 ($B)2026 ($B)2027 ($B)Total ($B)
Texas Panhandle / High Plains3.54.22.810.5
Idaho / Western Growth1.21.50.93.6
Wisconsin / Northeast / Traditional0.30.50.41.2

But over coffee, the conversation sounds more like this:

“Given everything that’s changed—markets, plants, even what people eat now—does it really make sense for us to keep milking 250 or 400 cows? Or are we better off stepping out while we still have something solid to pass on?”

You can’t answer that honestly without stepping back and looking at how the whole system has shifted. So let’s walk through the big pieces together, then bring it right back to a farm that probably looks a lot like yours.

Five Big Forces Hitting Mid‑Sized Dairies Right Now
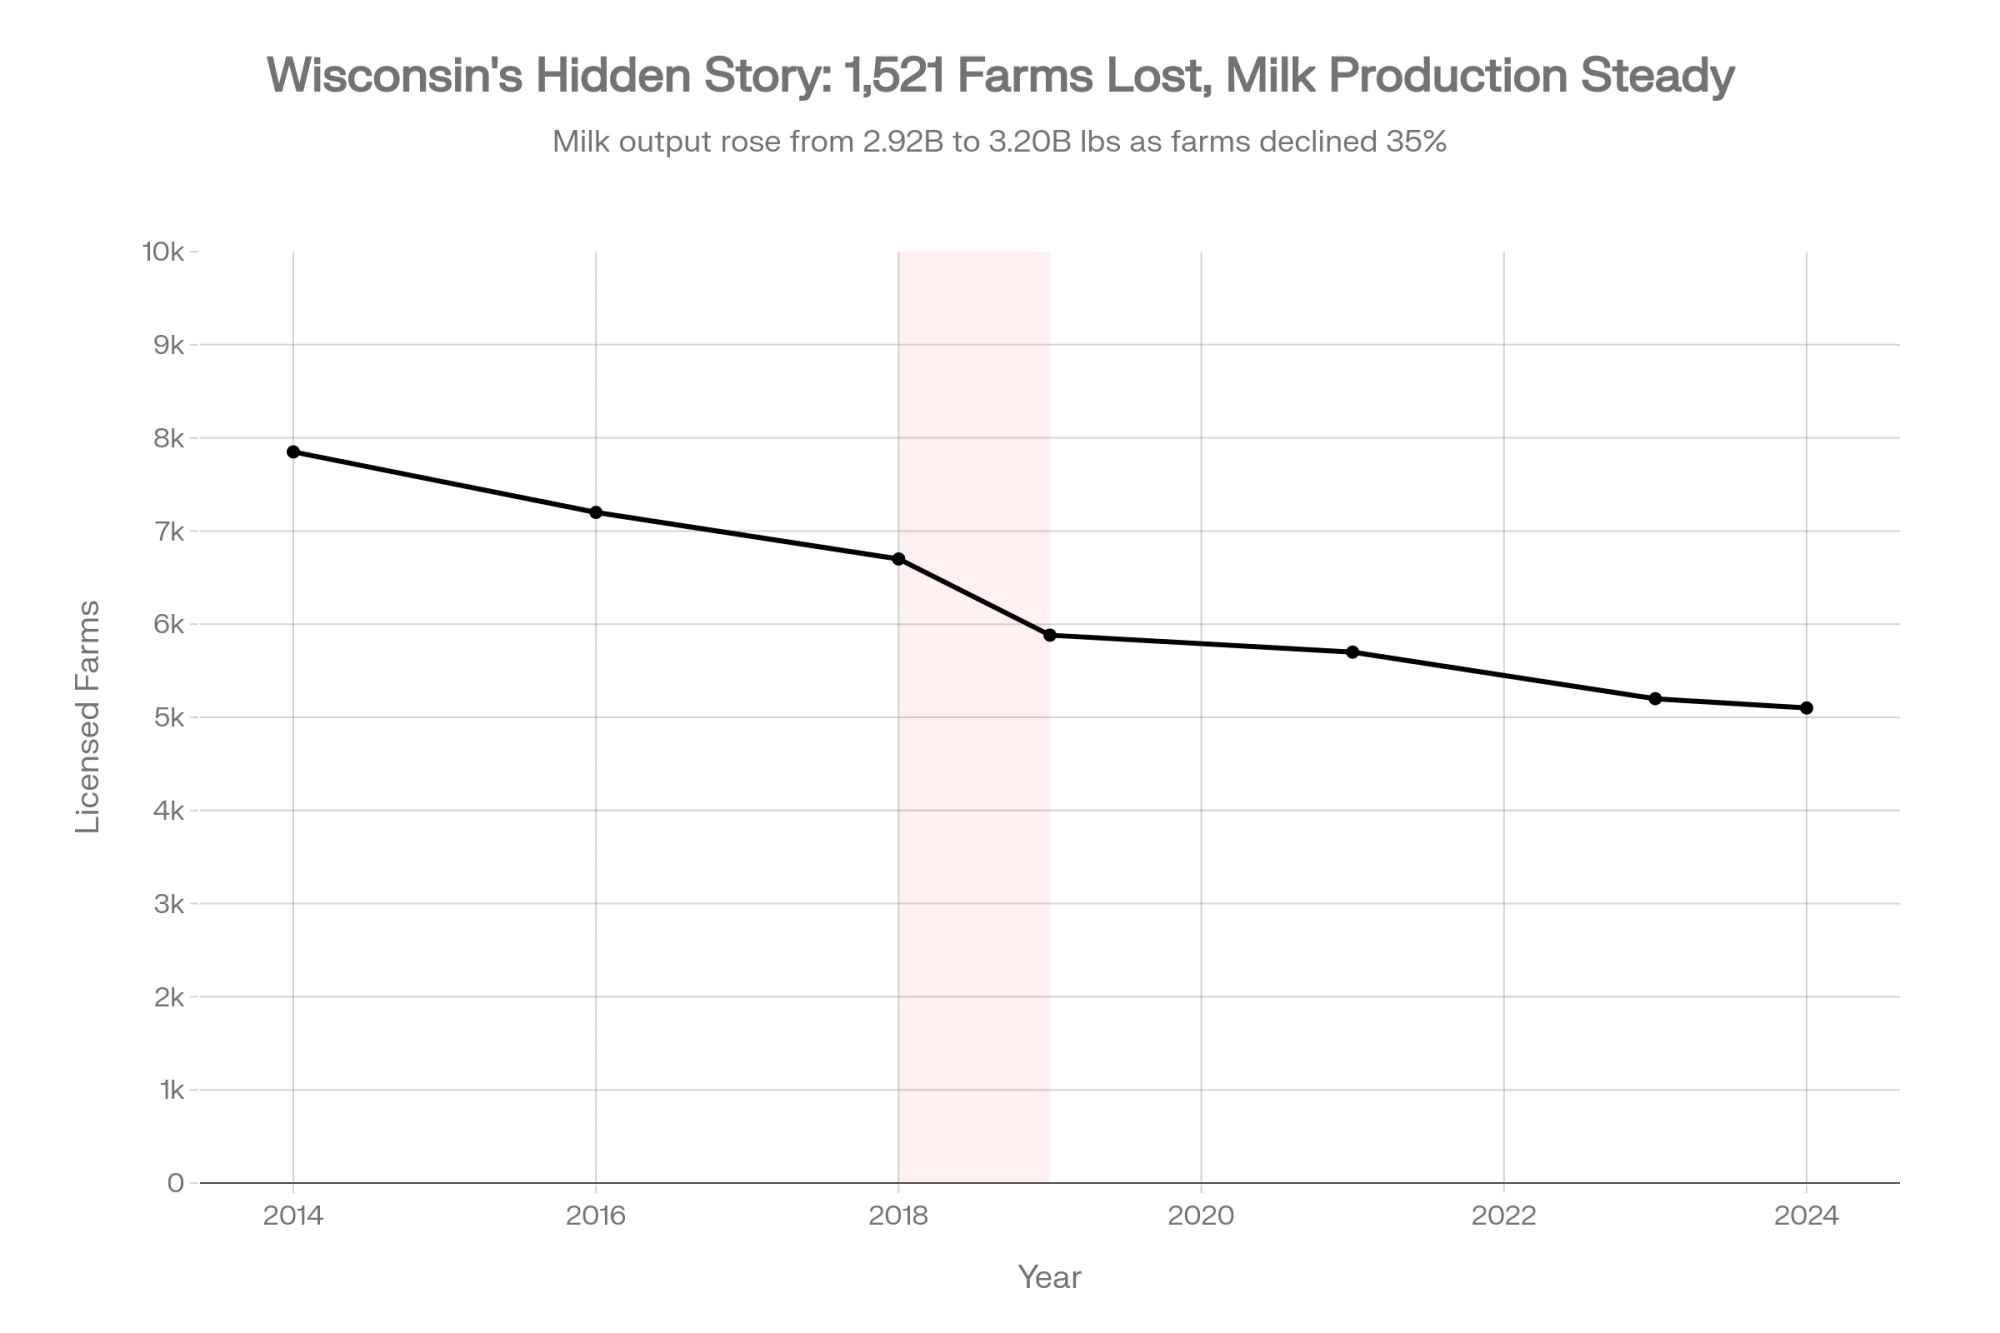
YearFarmsMilk Production (B lbs/yr)
20147,8502.92
20167,2003.04
20186,7003.11
20195,8823.15
20215,7003.18
20235,2003.22
20245,1003.20

Here’s the quick snapshot before we dig in:

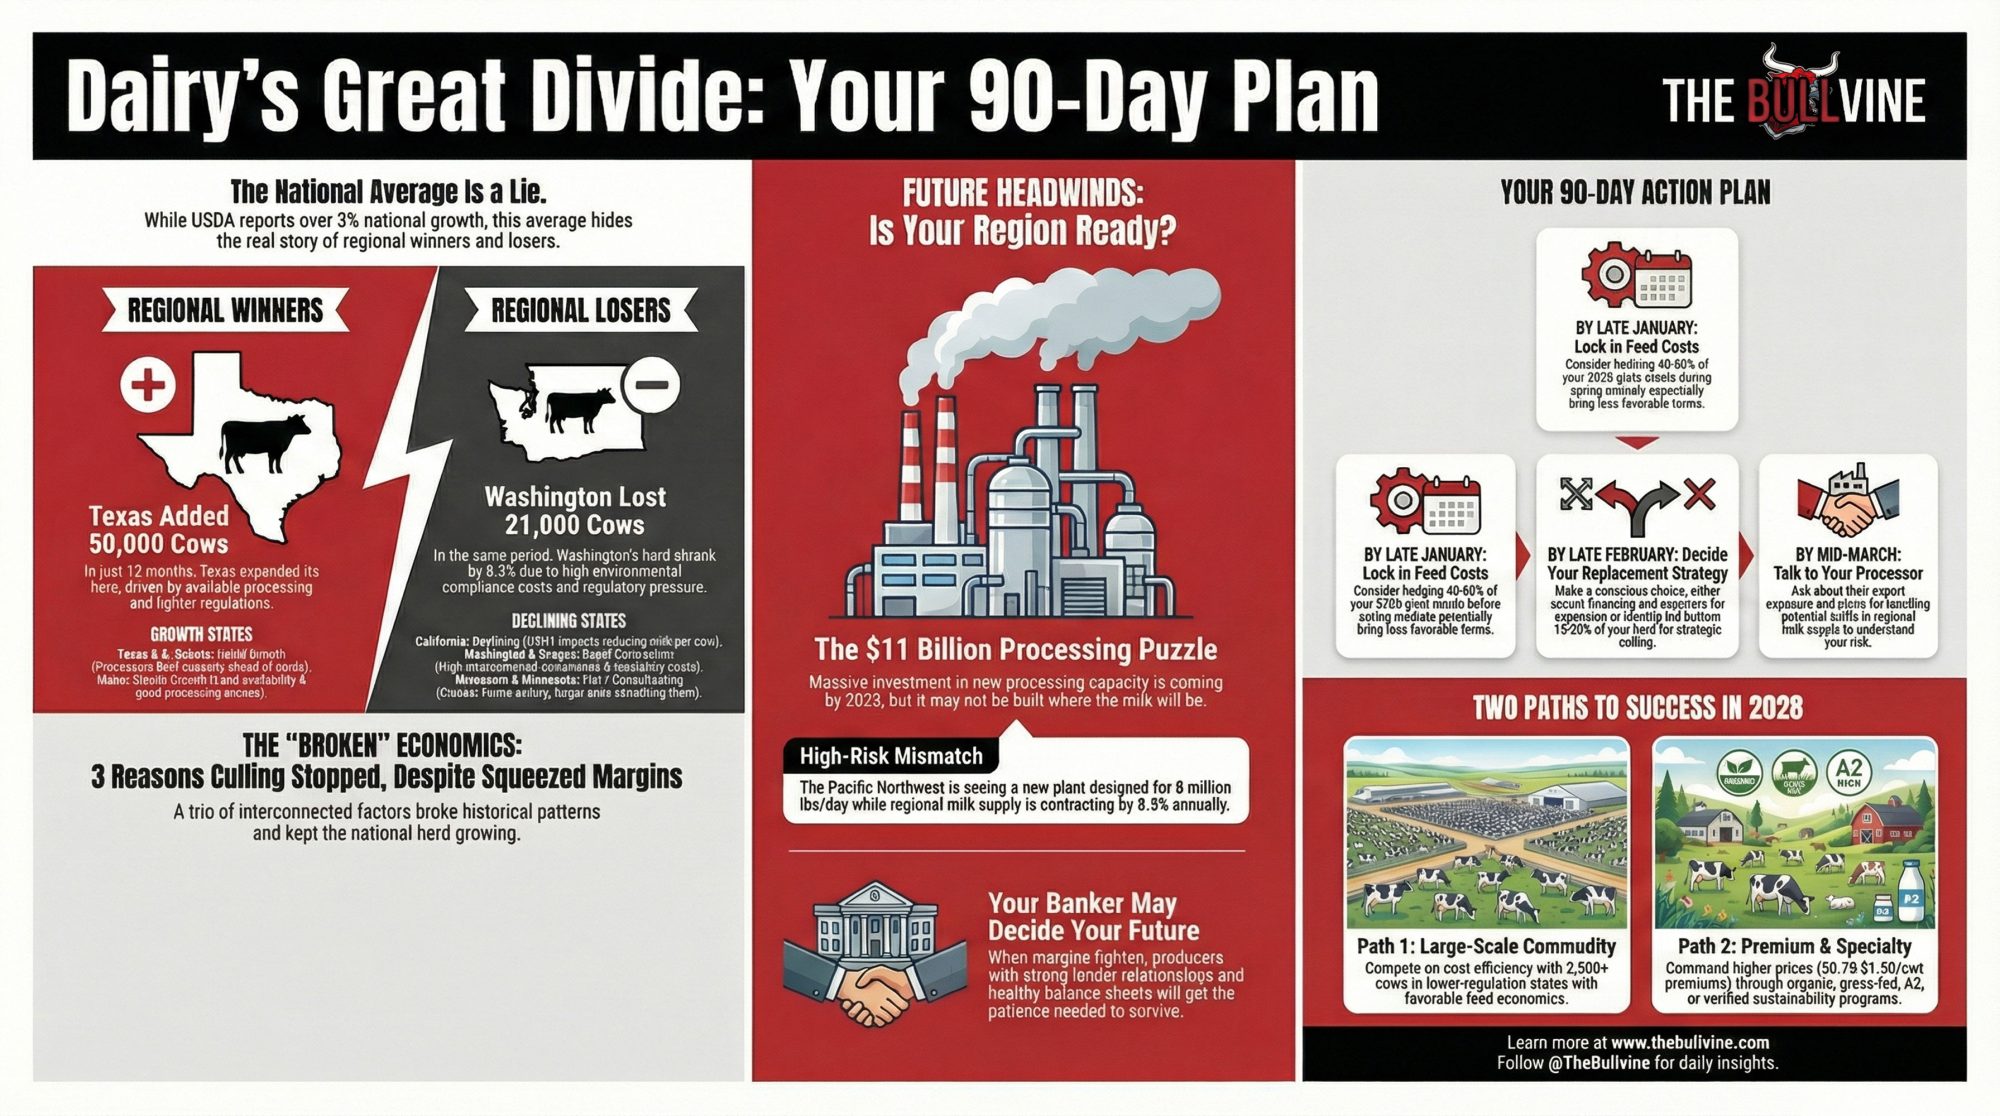
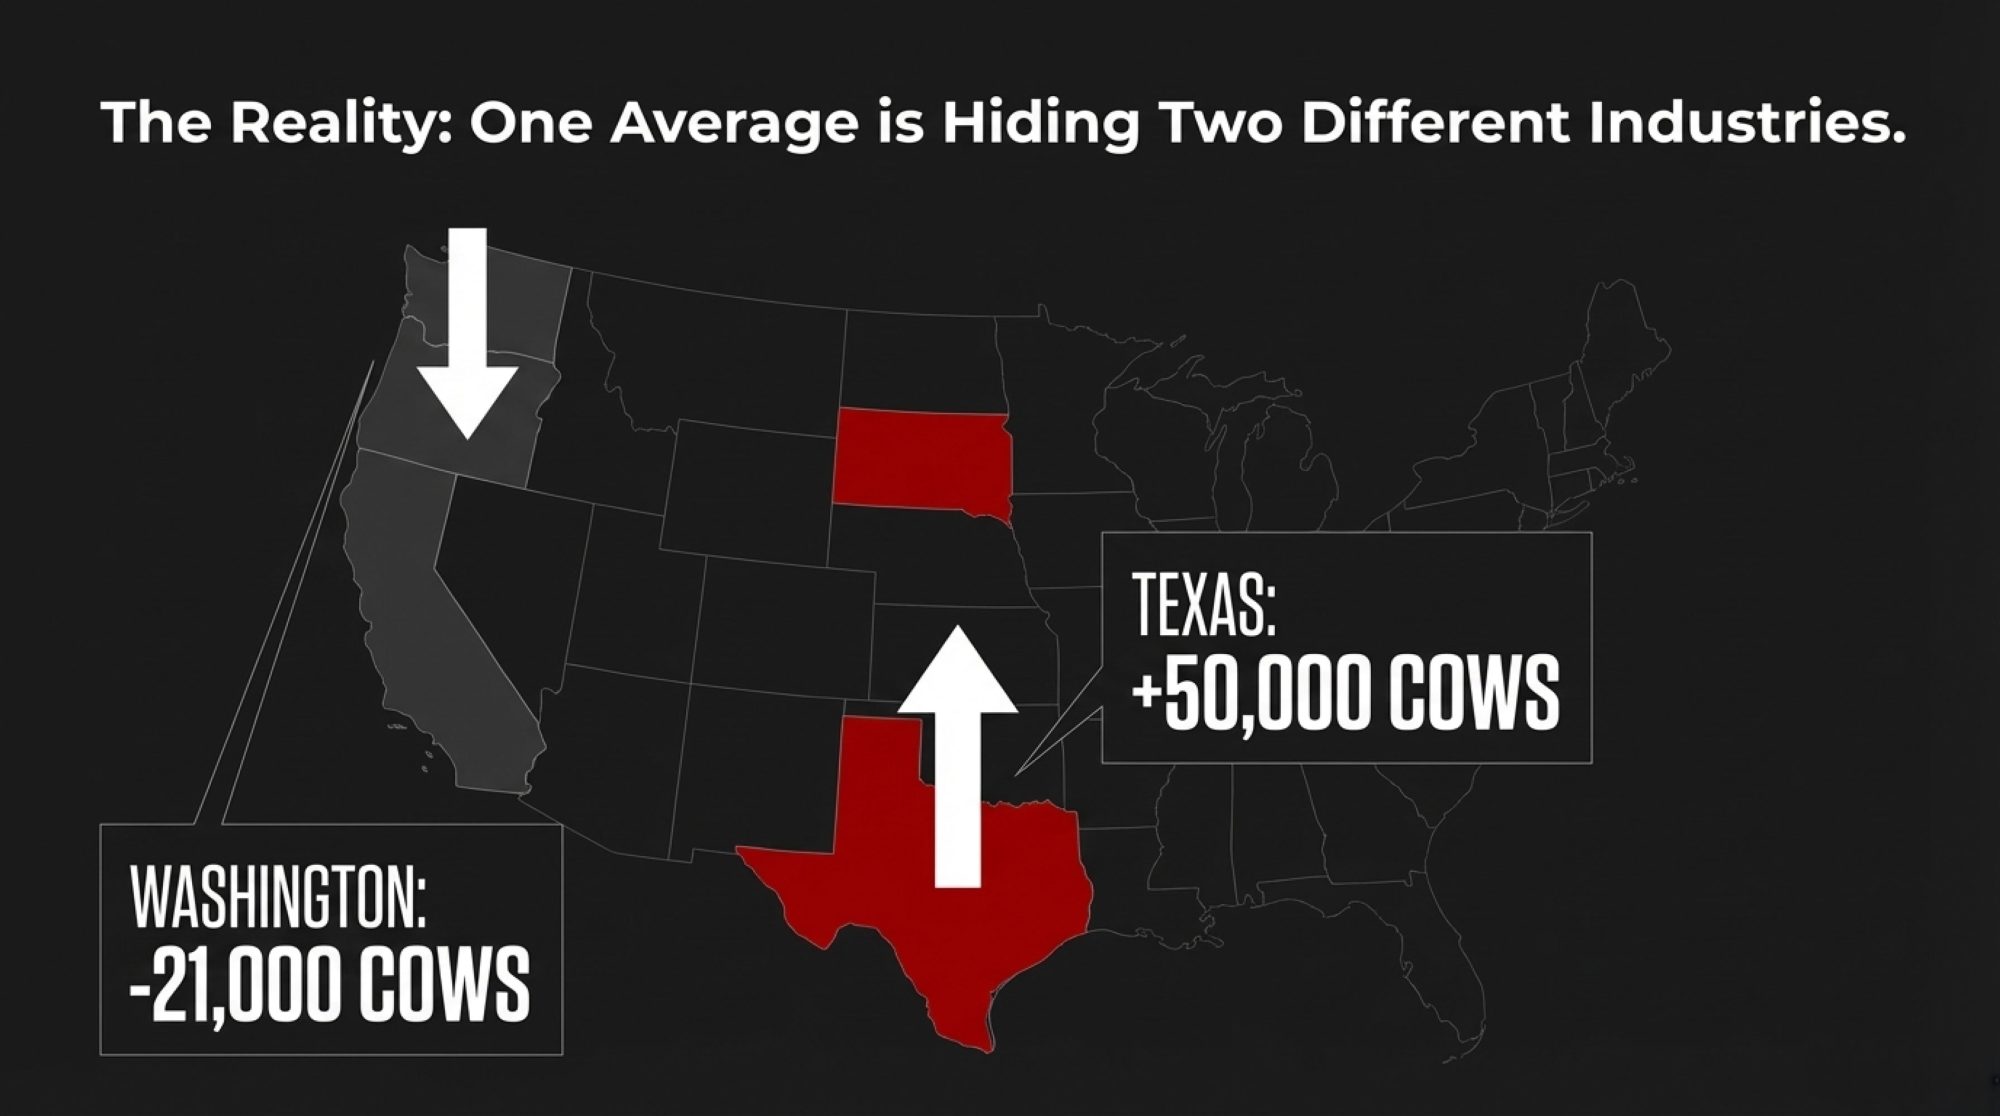
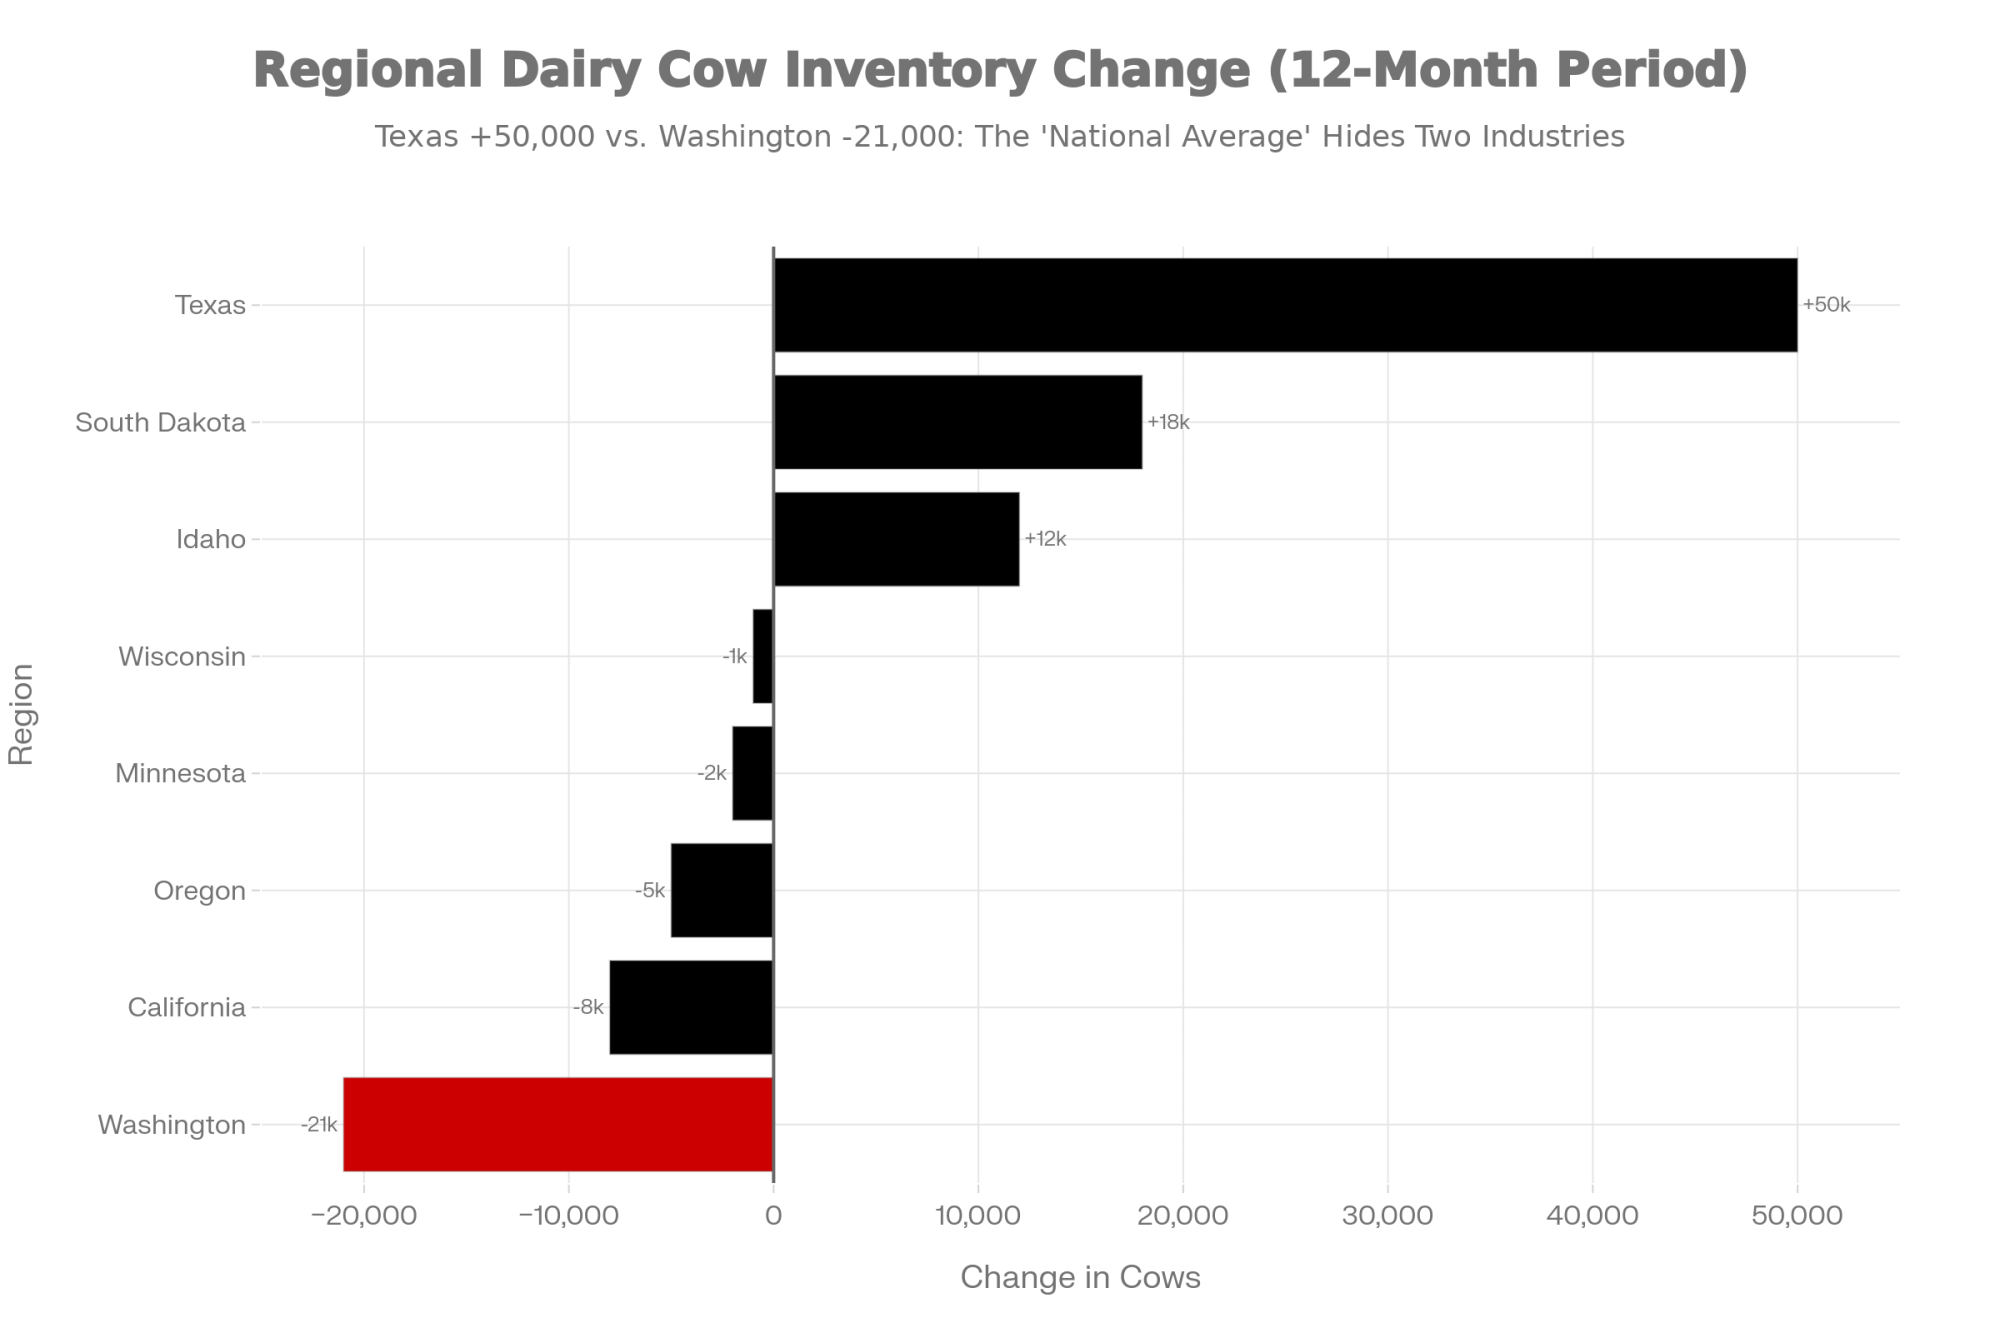
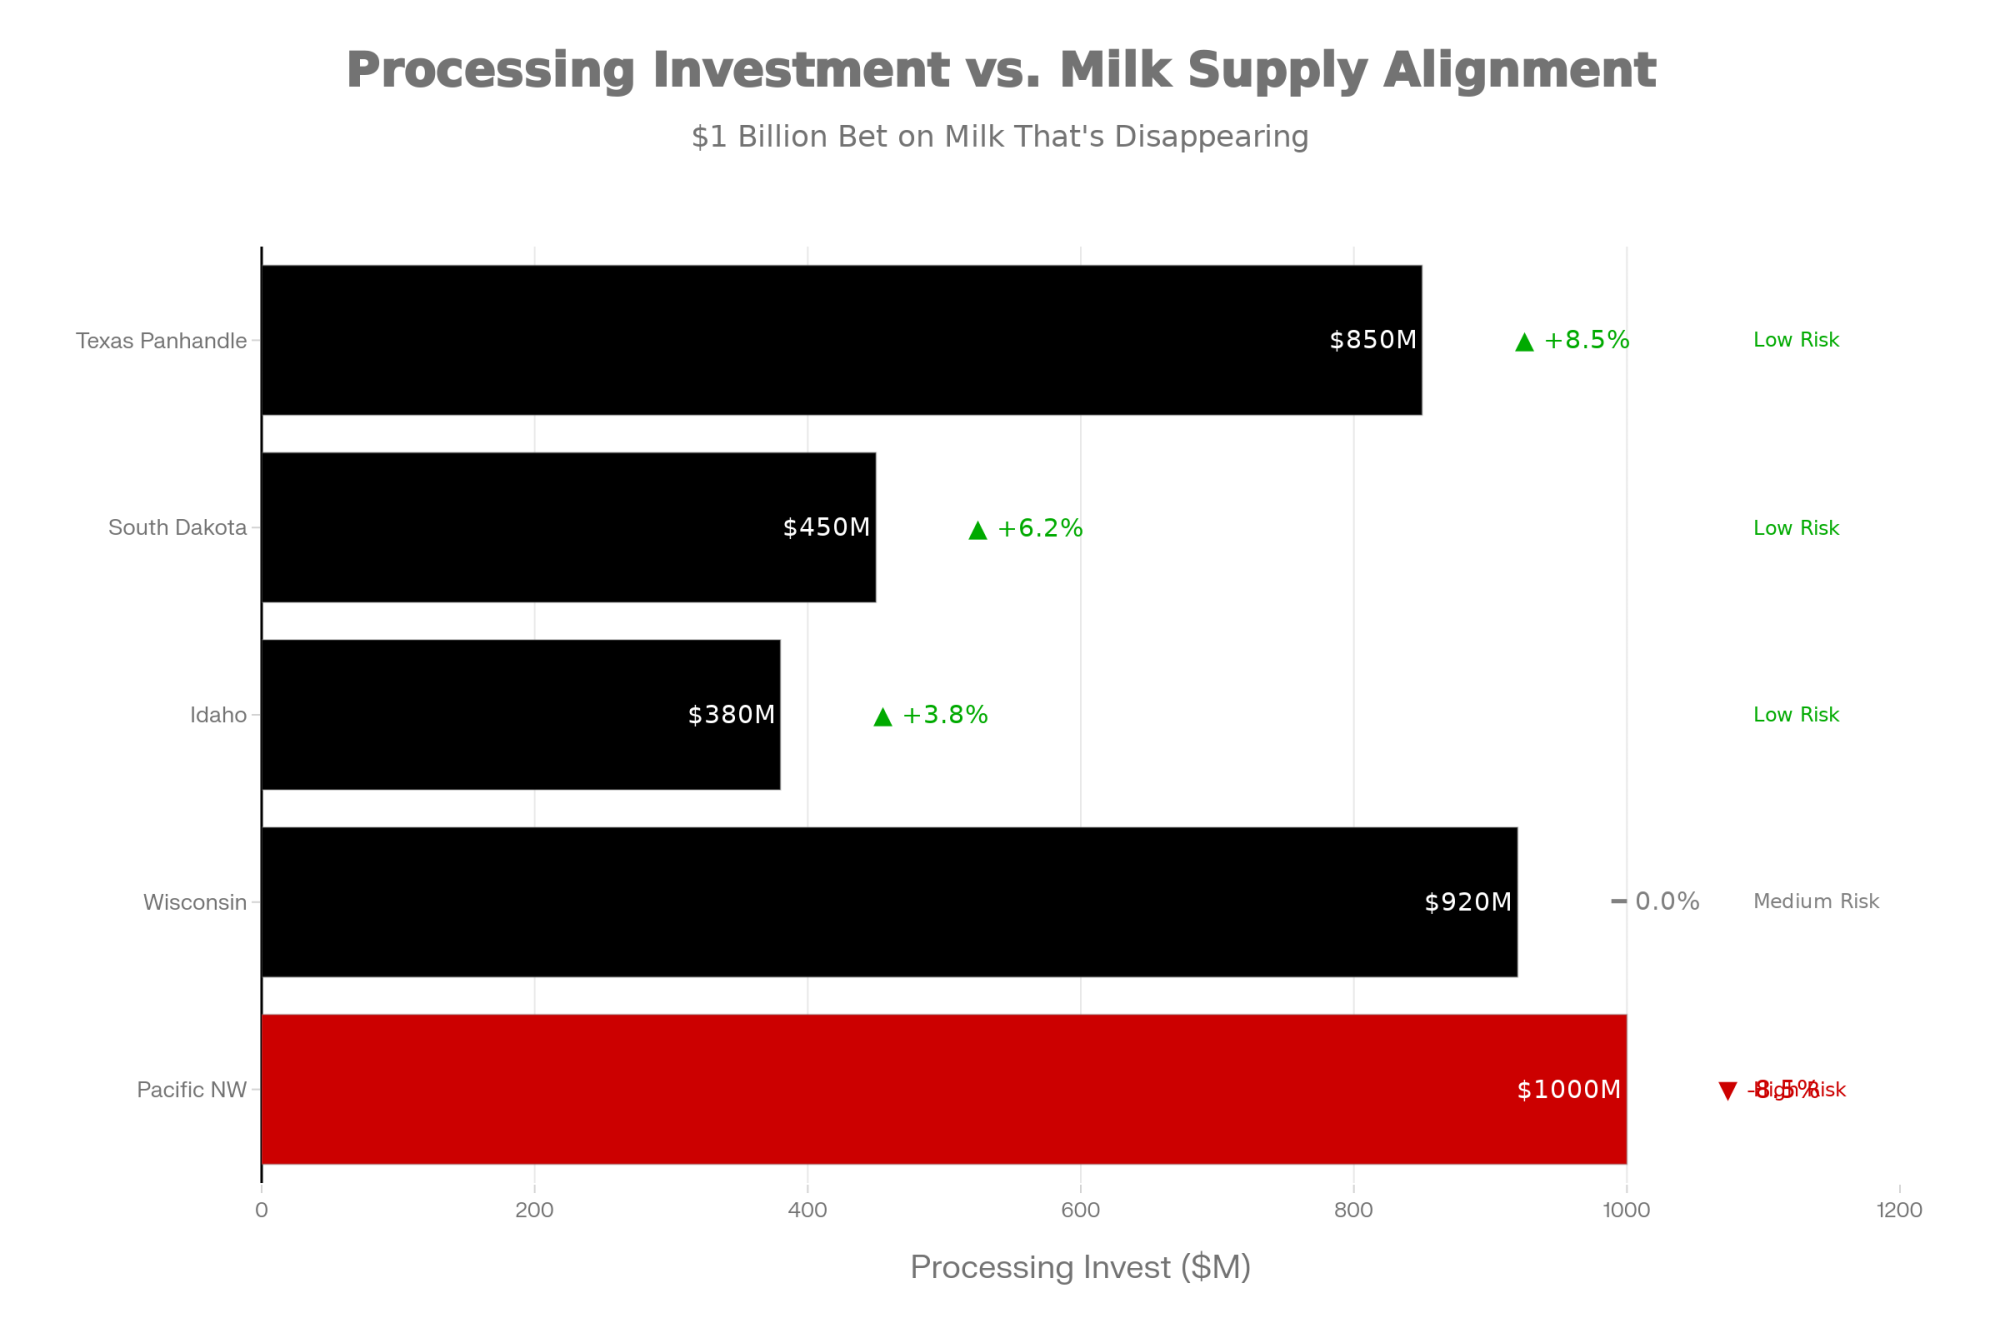
  • Processing geography is shifting. That $10–11 billion in new capacity? It’s heavily concentrated in growth regions—the High Plains, Texas Panhandle, parts of the West and Upper Midwest—where large herds and cheap land can feed big plants efficiently. 
  • Farm numbers are dropping fast, even when milk holds. In Wisconsin alone 818 licensed dairy farms disappeared in 2019—over 10% of the state’s dairies in a single year. Farm Progress adds that 703 farms shut down in 2018, bringing the two‑year total to 1,521 farms gone—nearly 18% of Wisconsin’s dairies—while milk production stayed near record levels. 
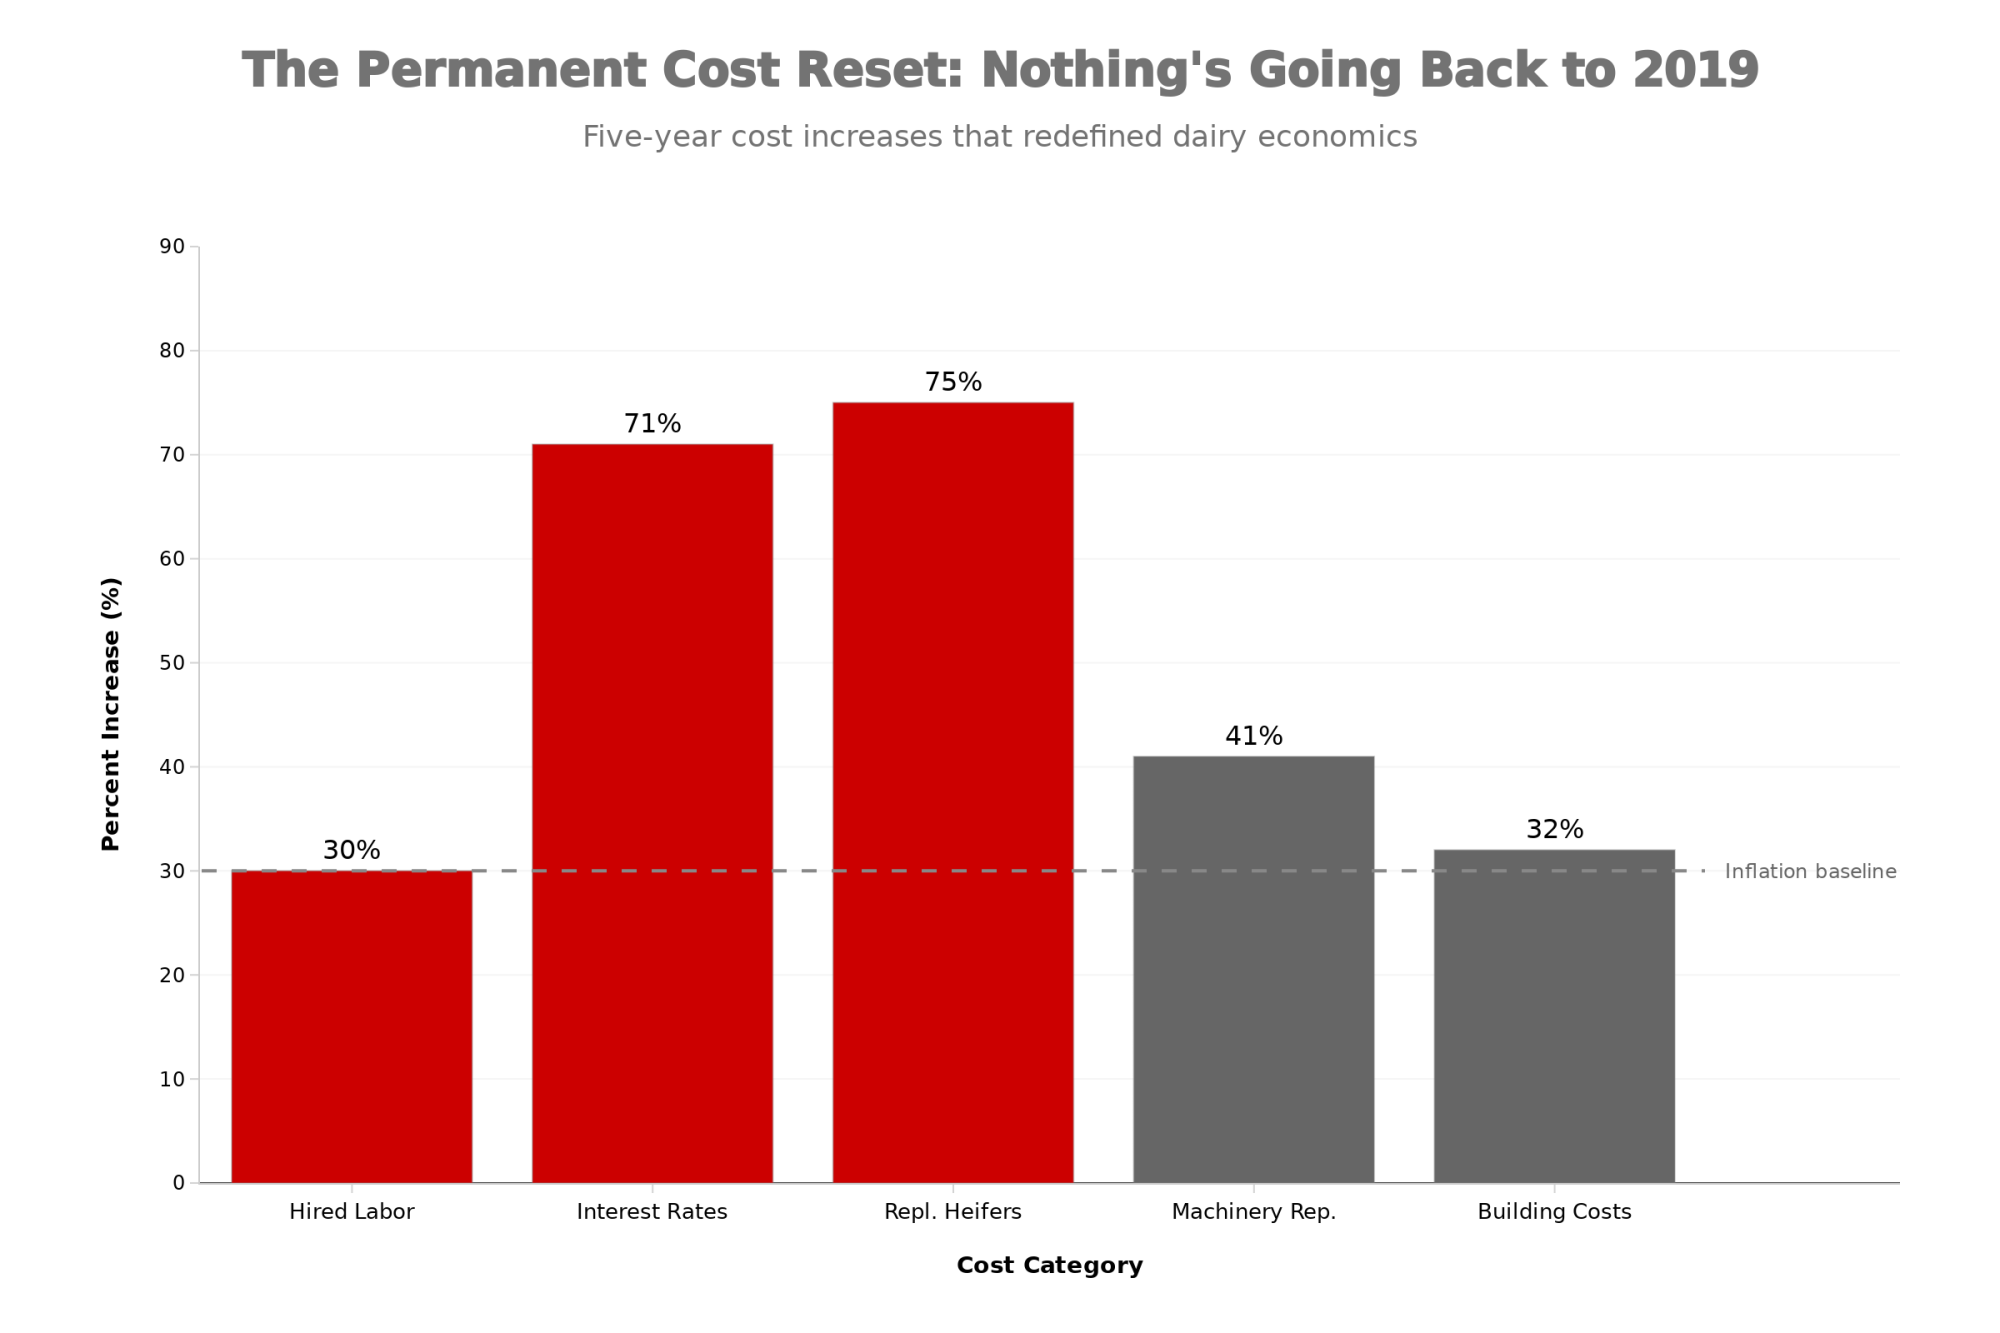
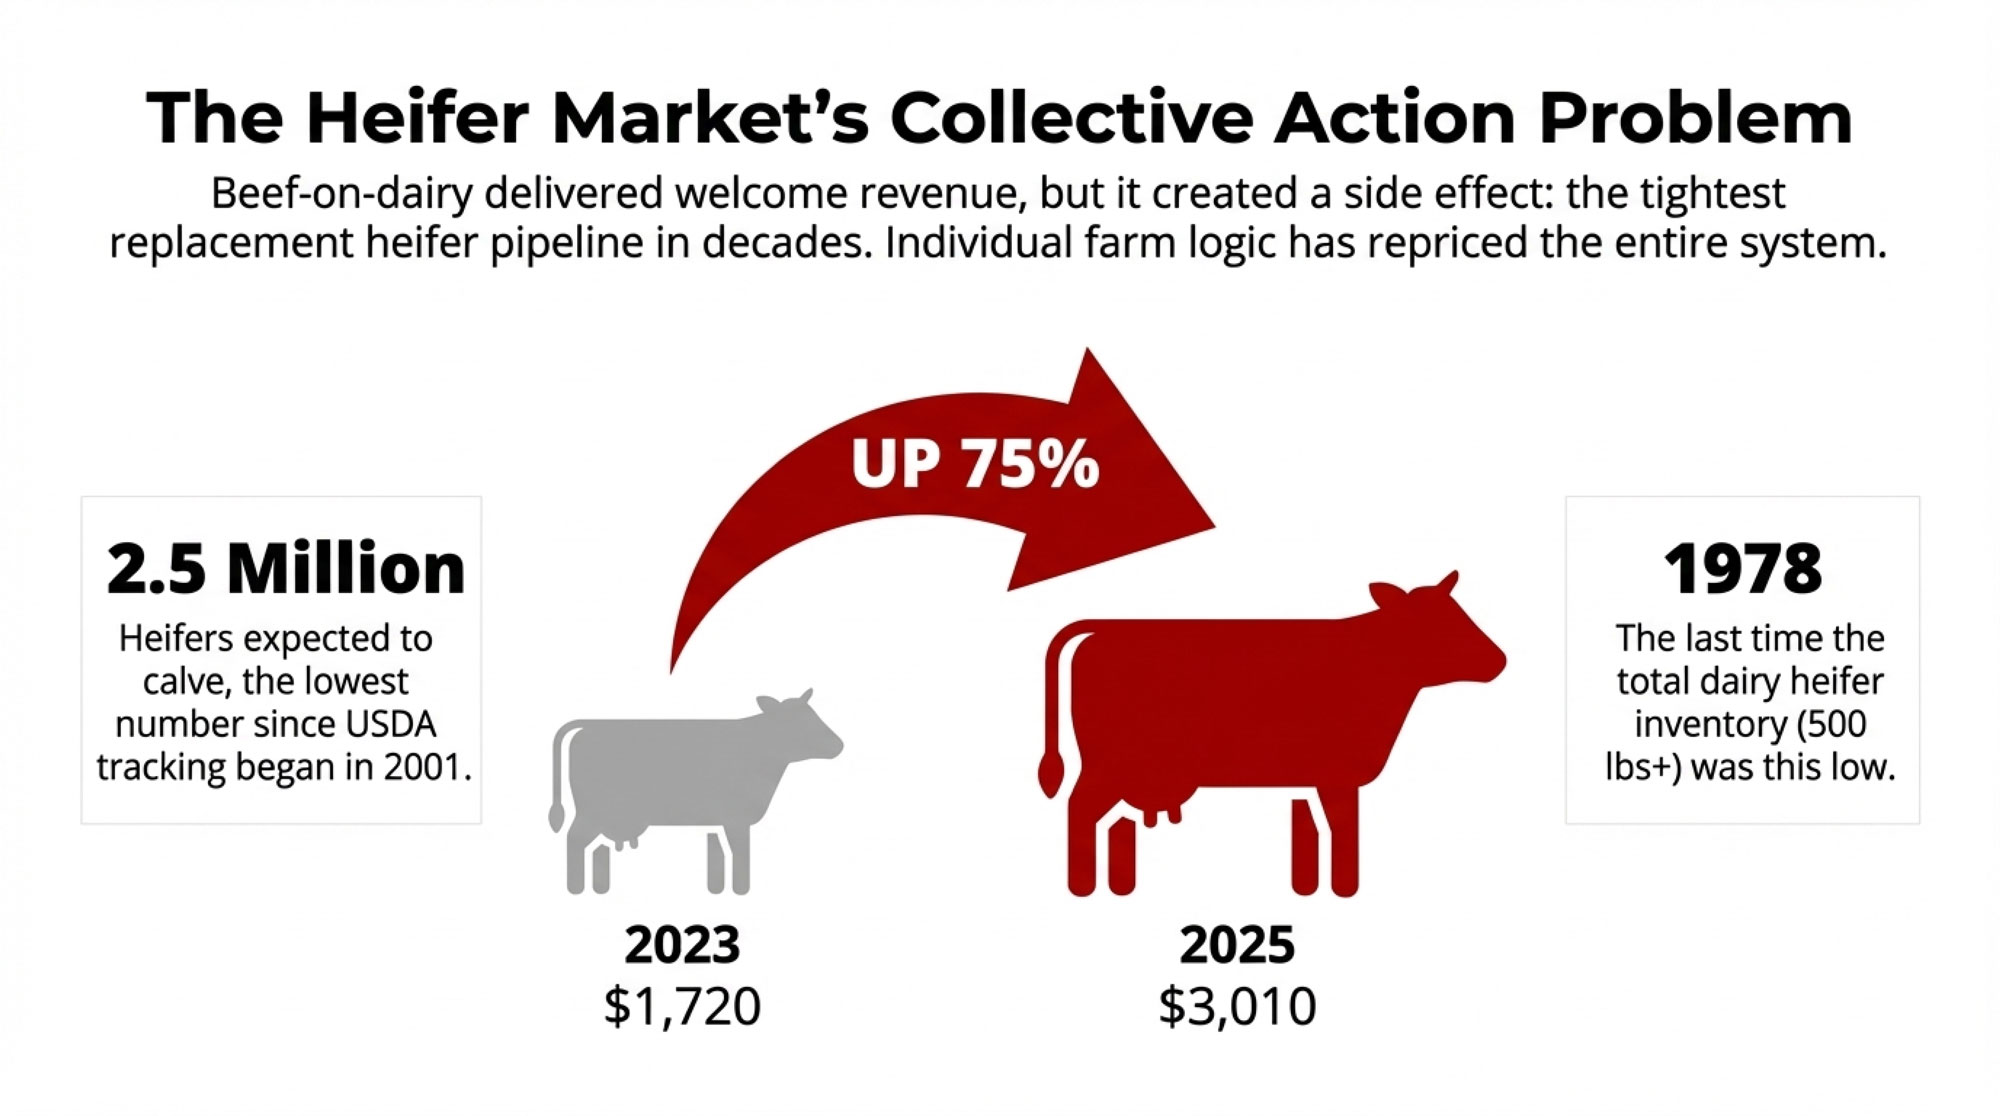
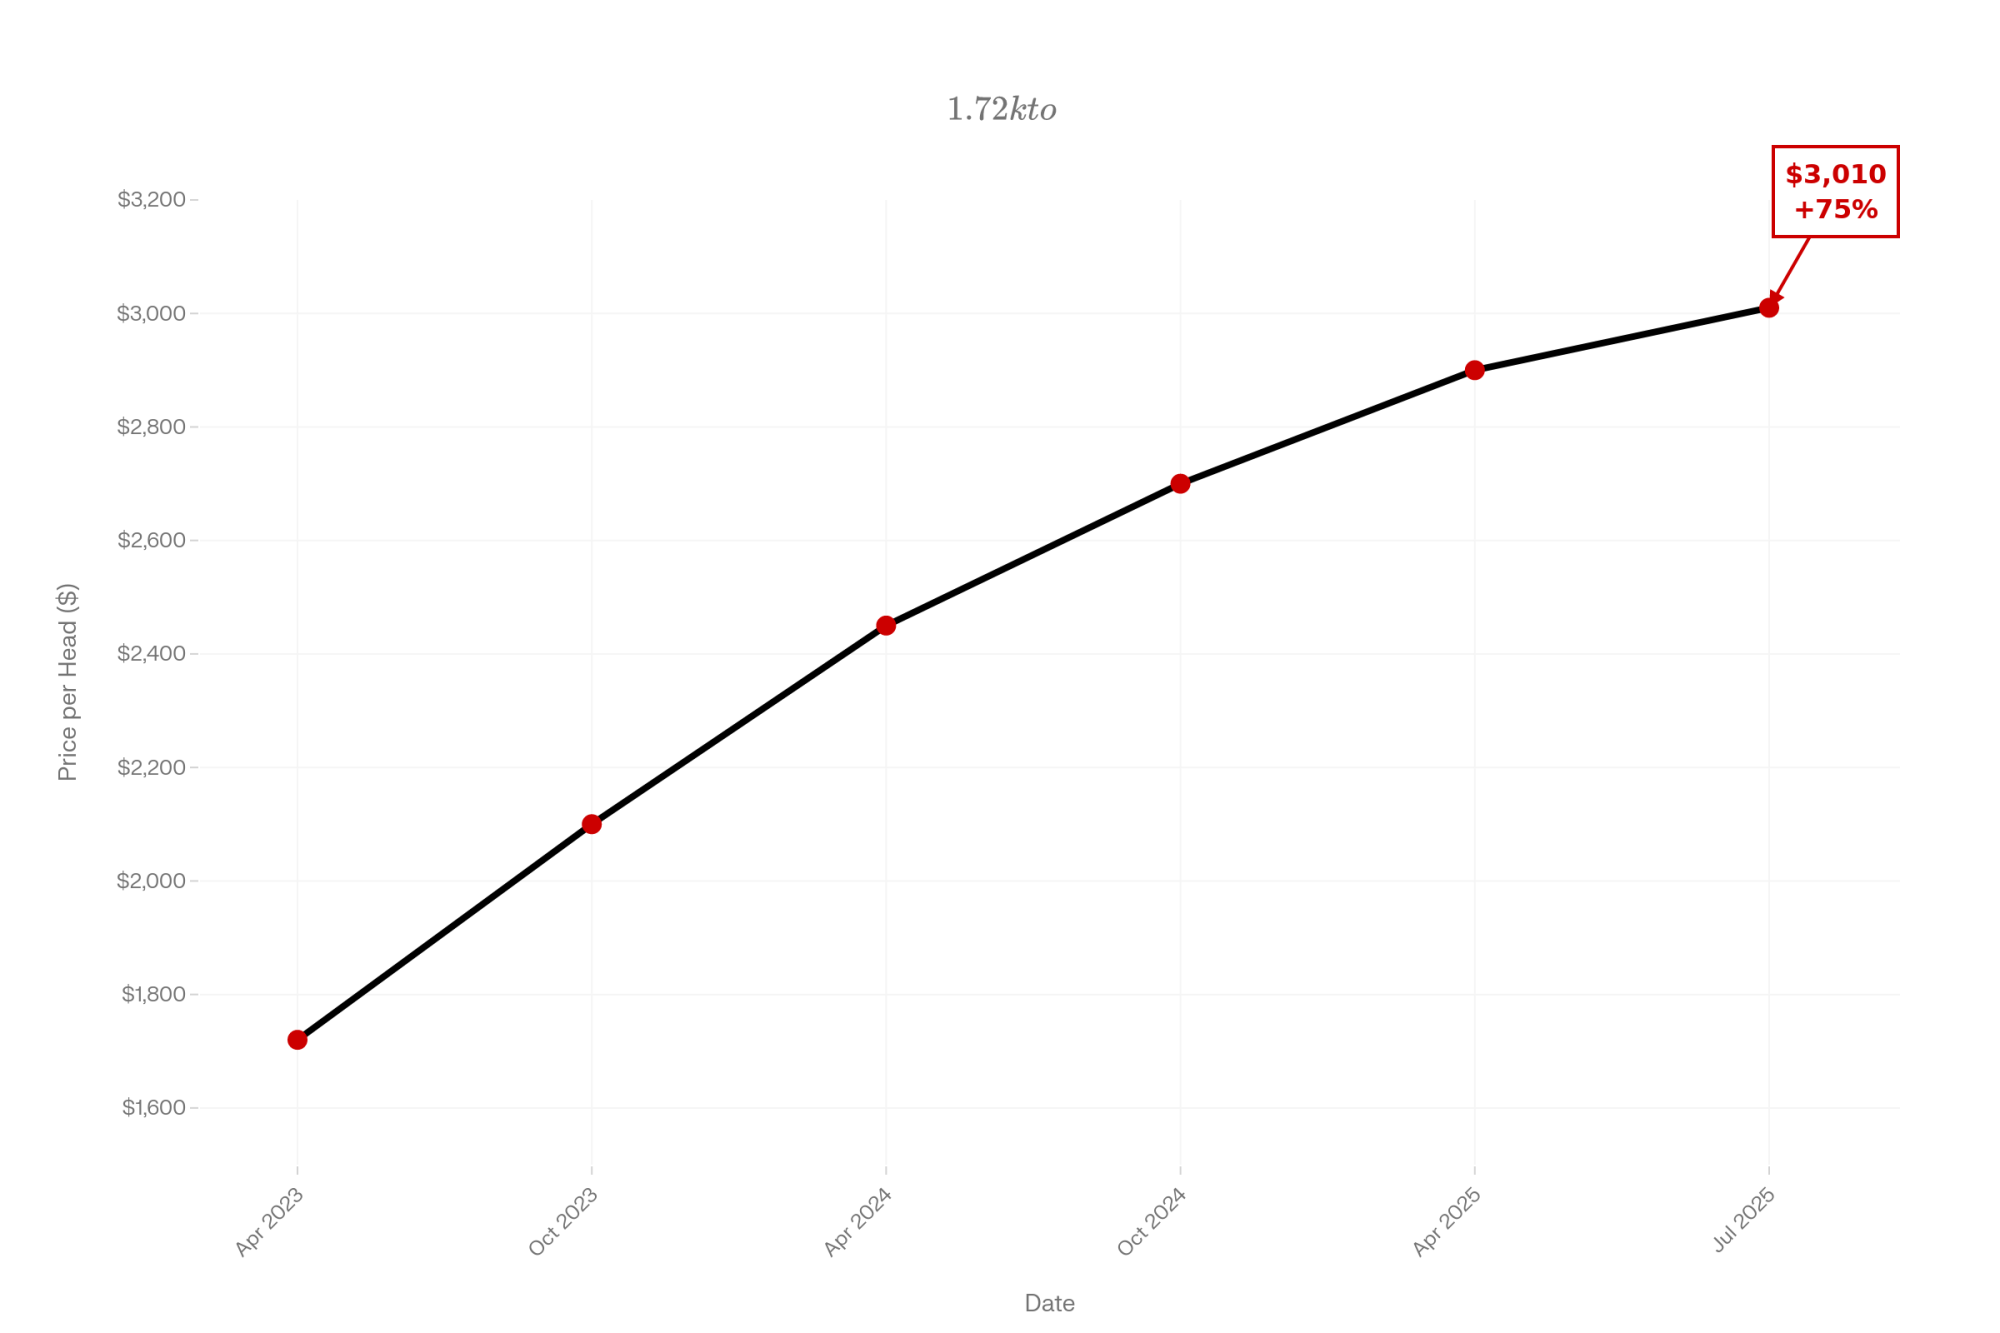
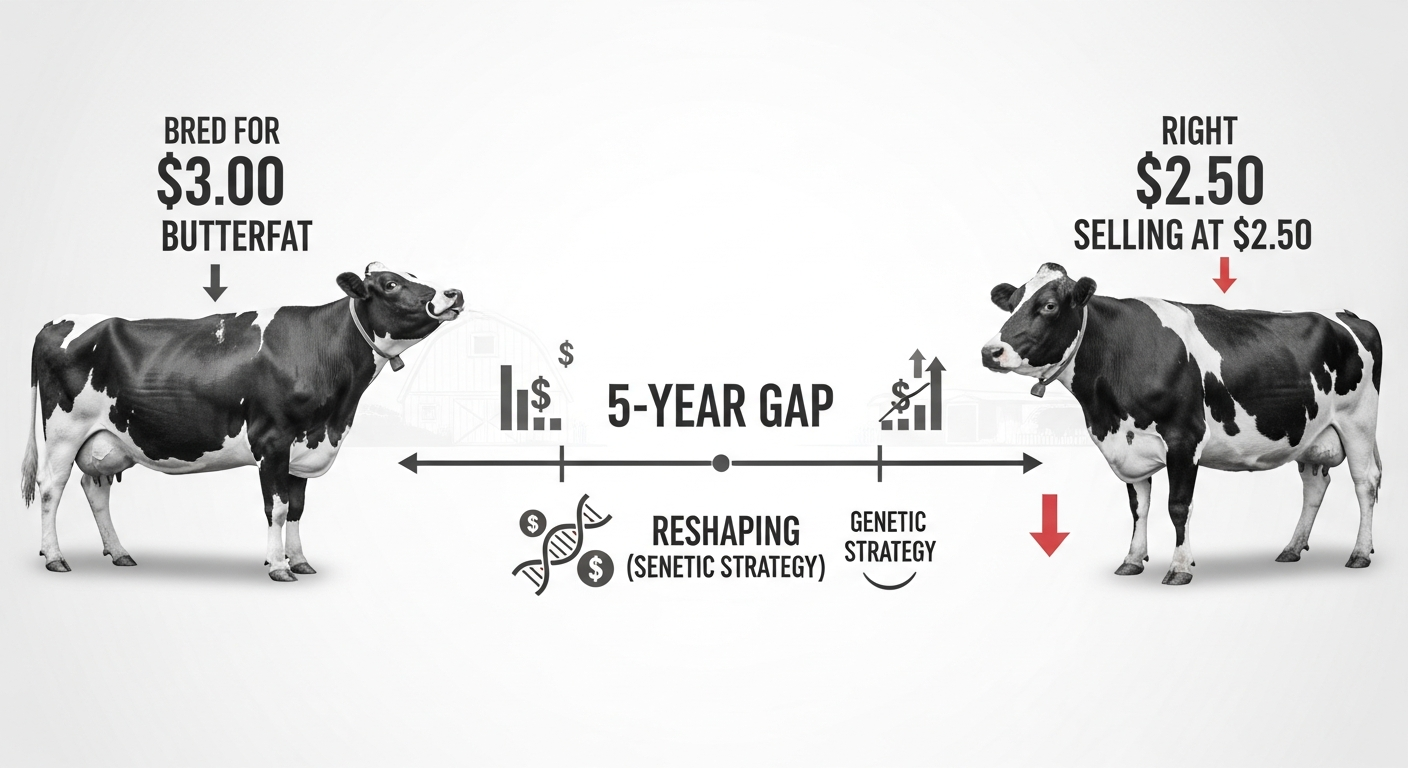
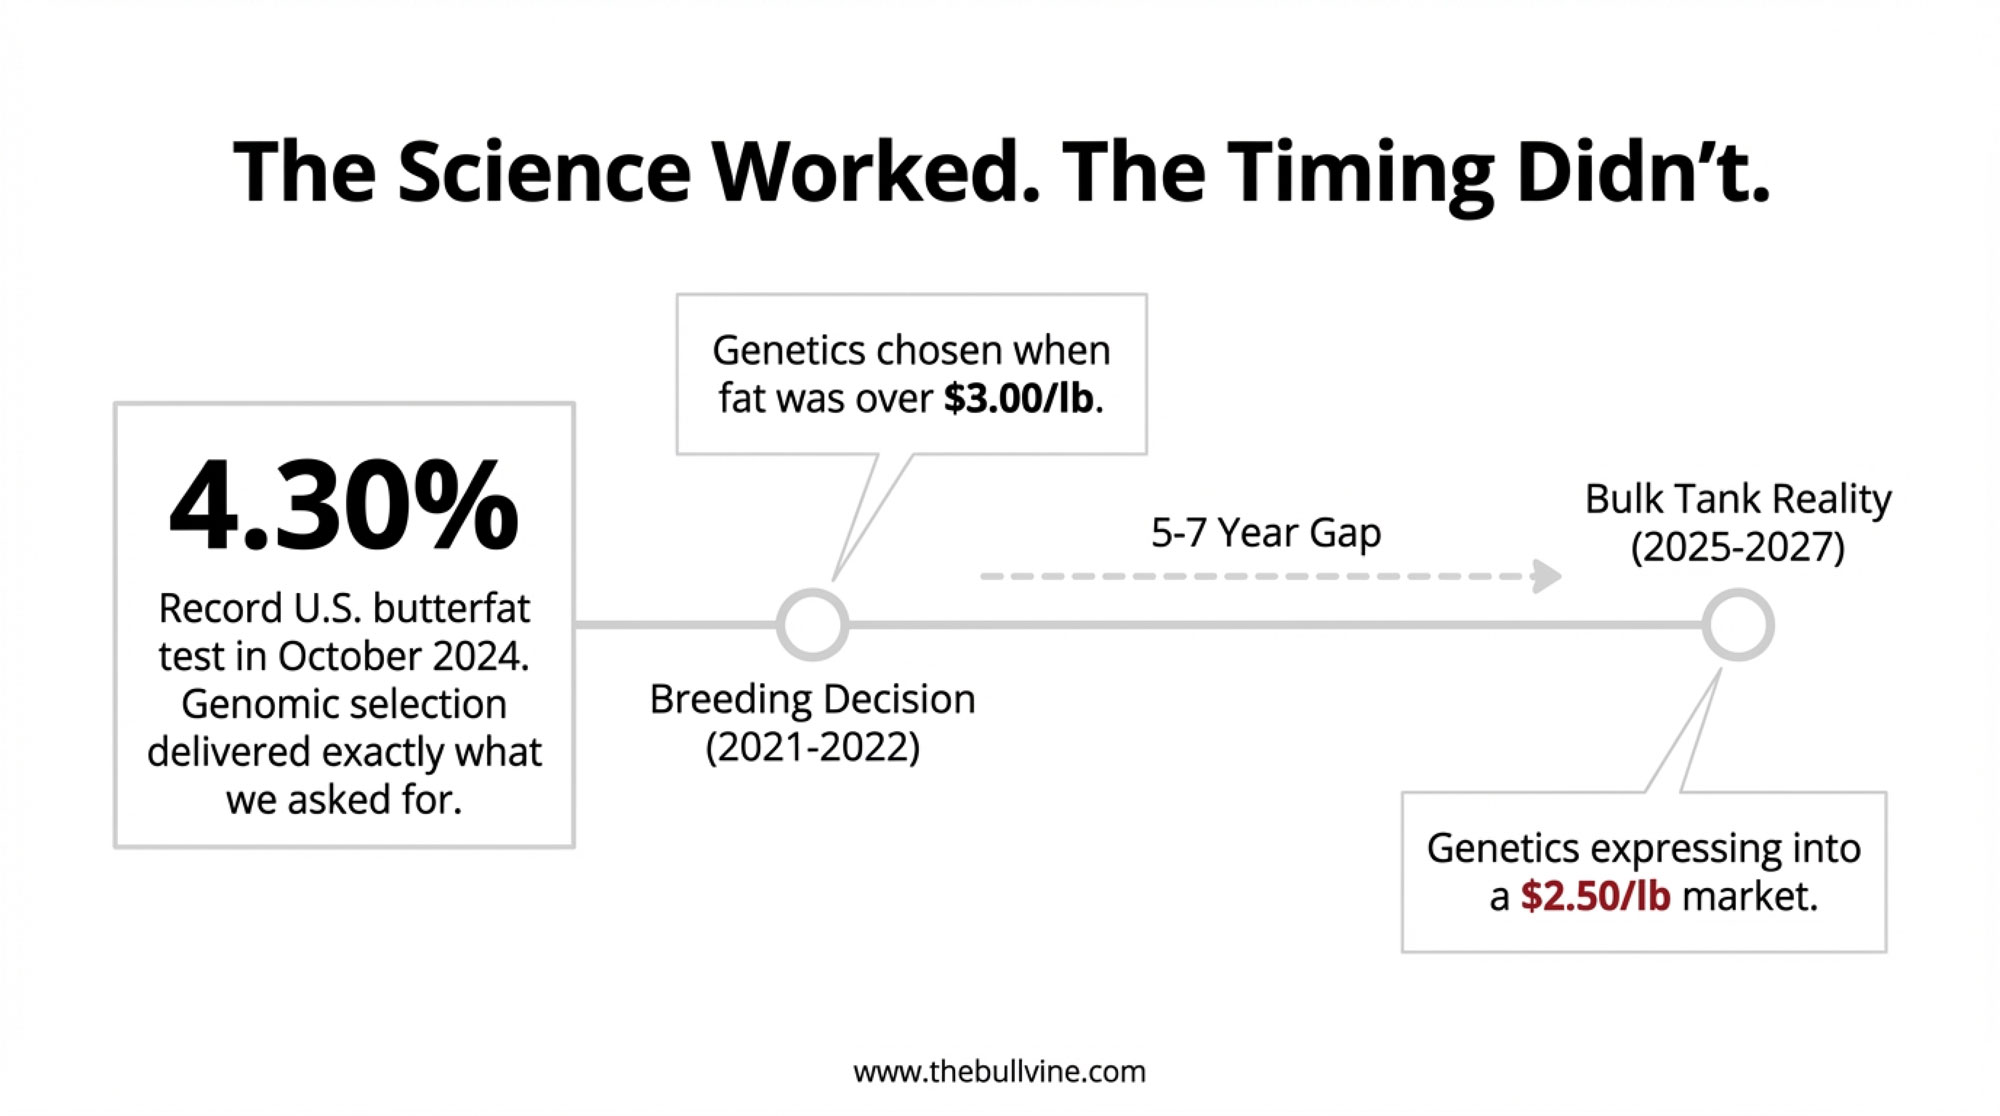
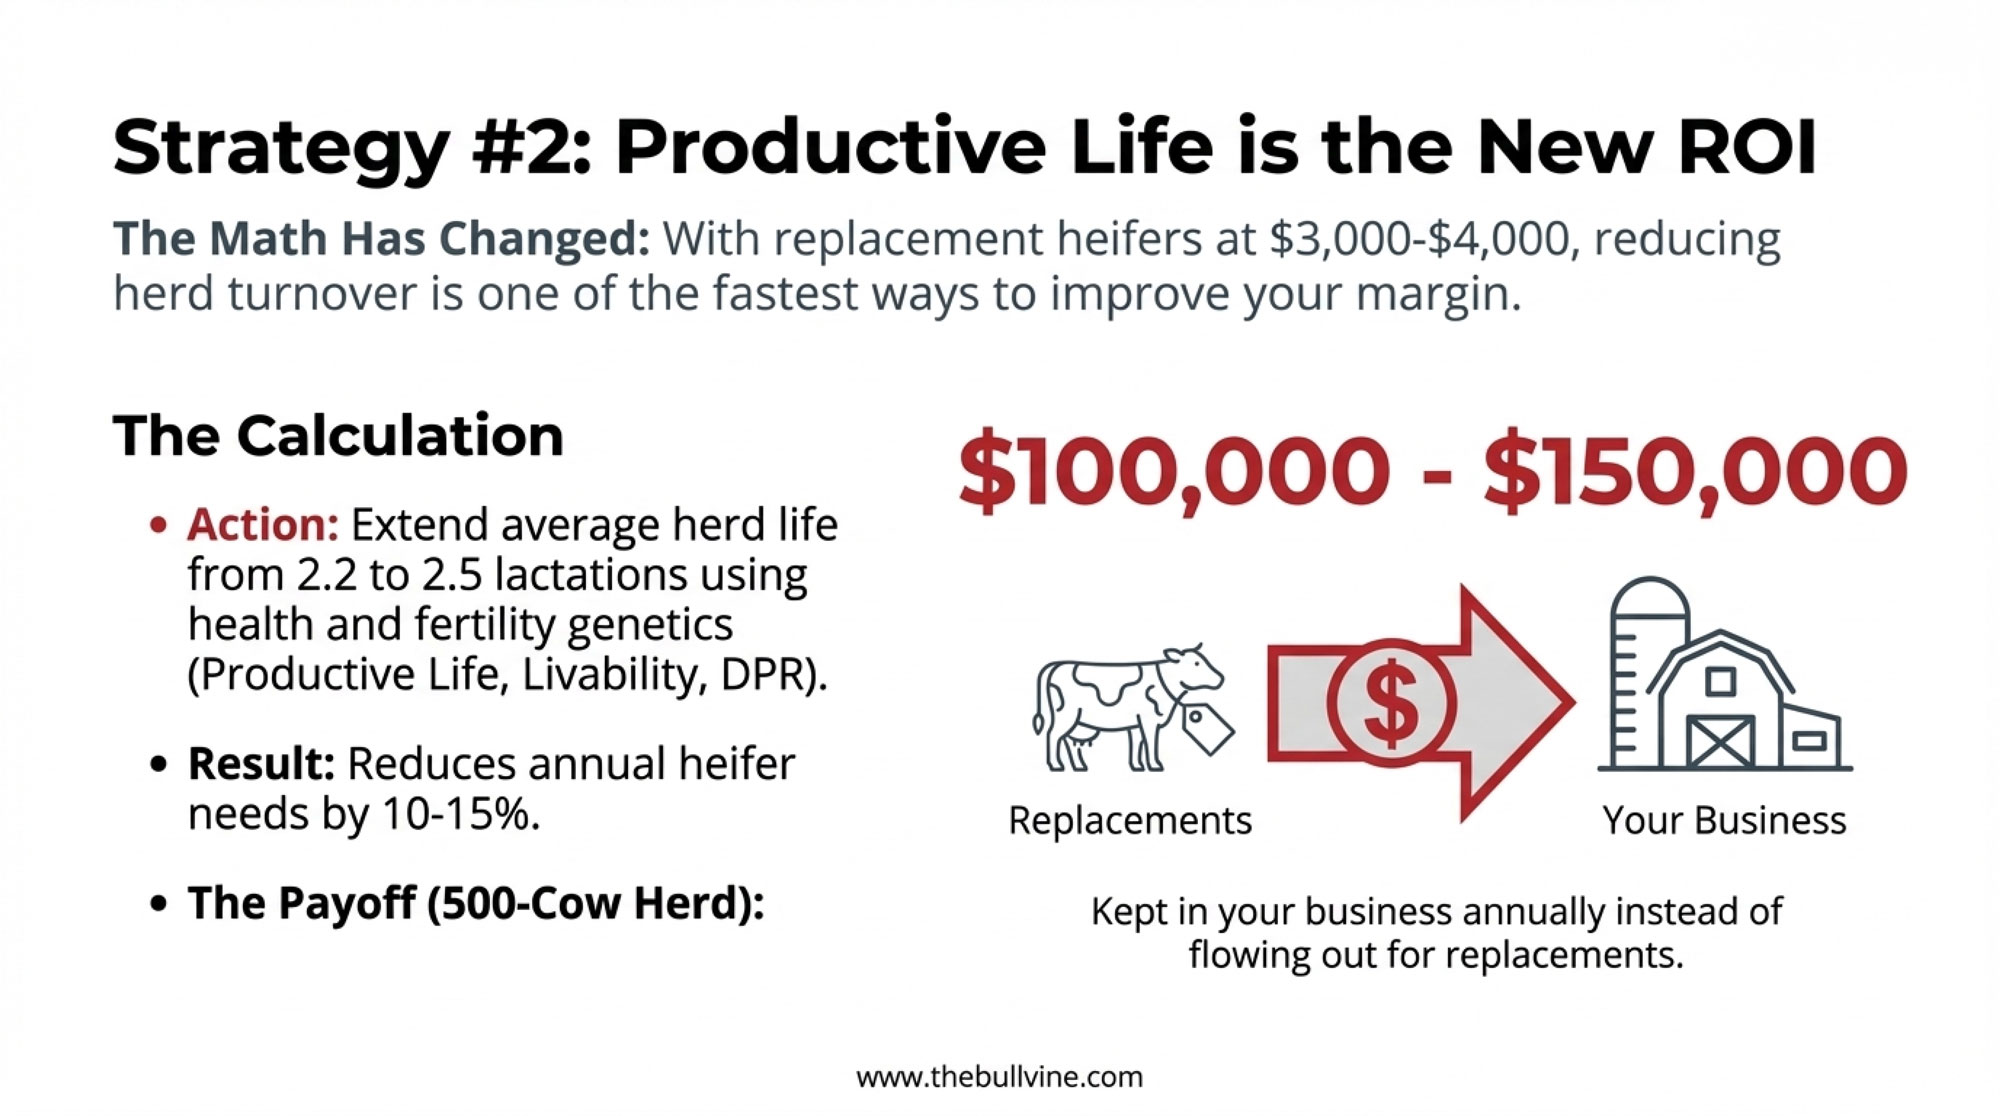
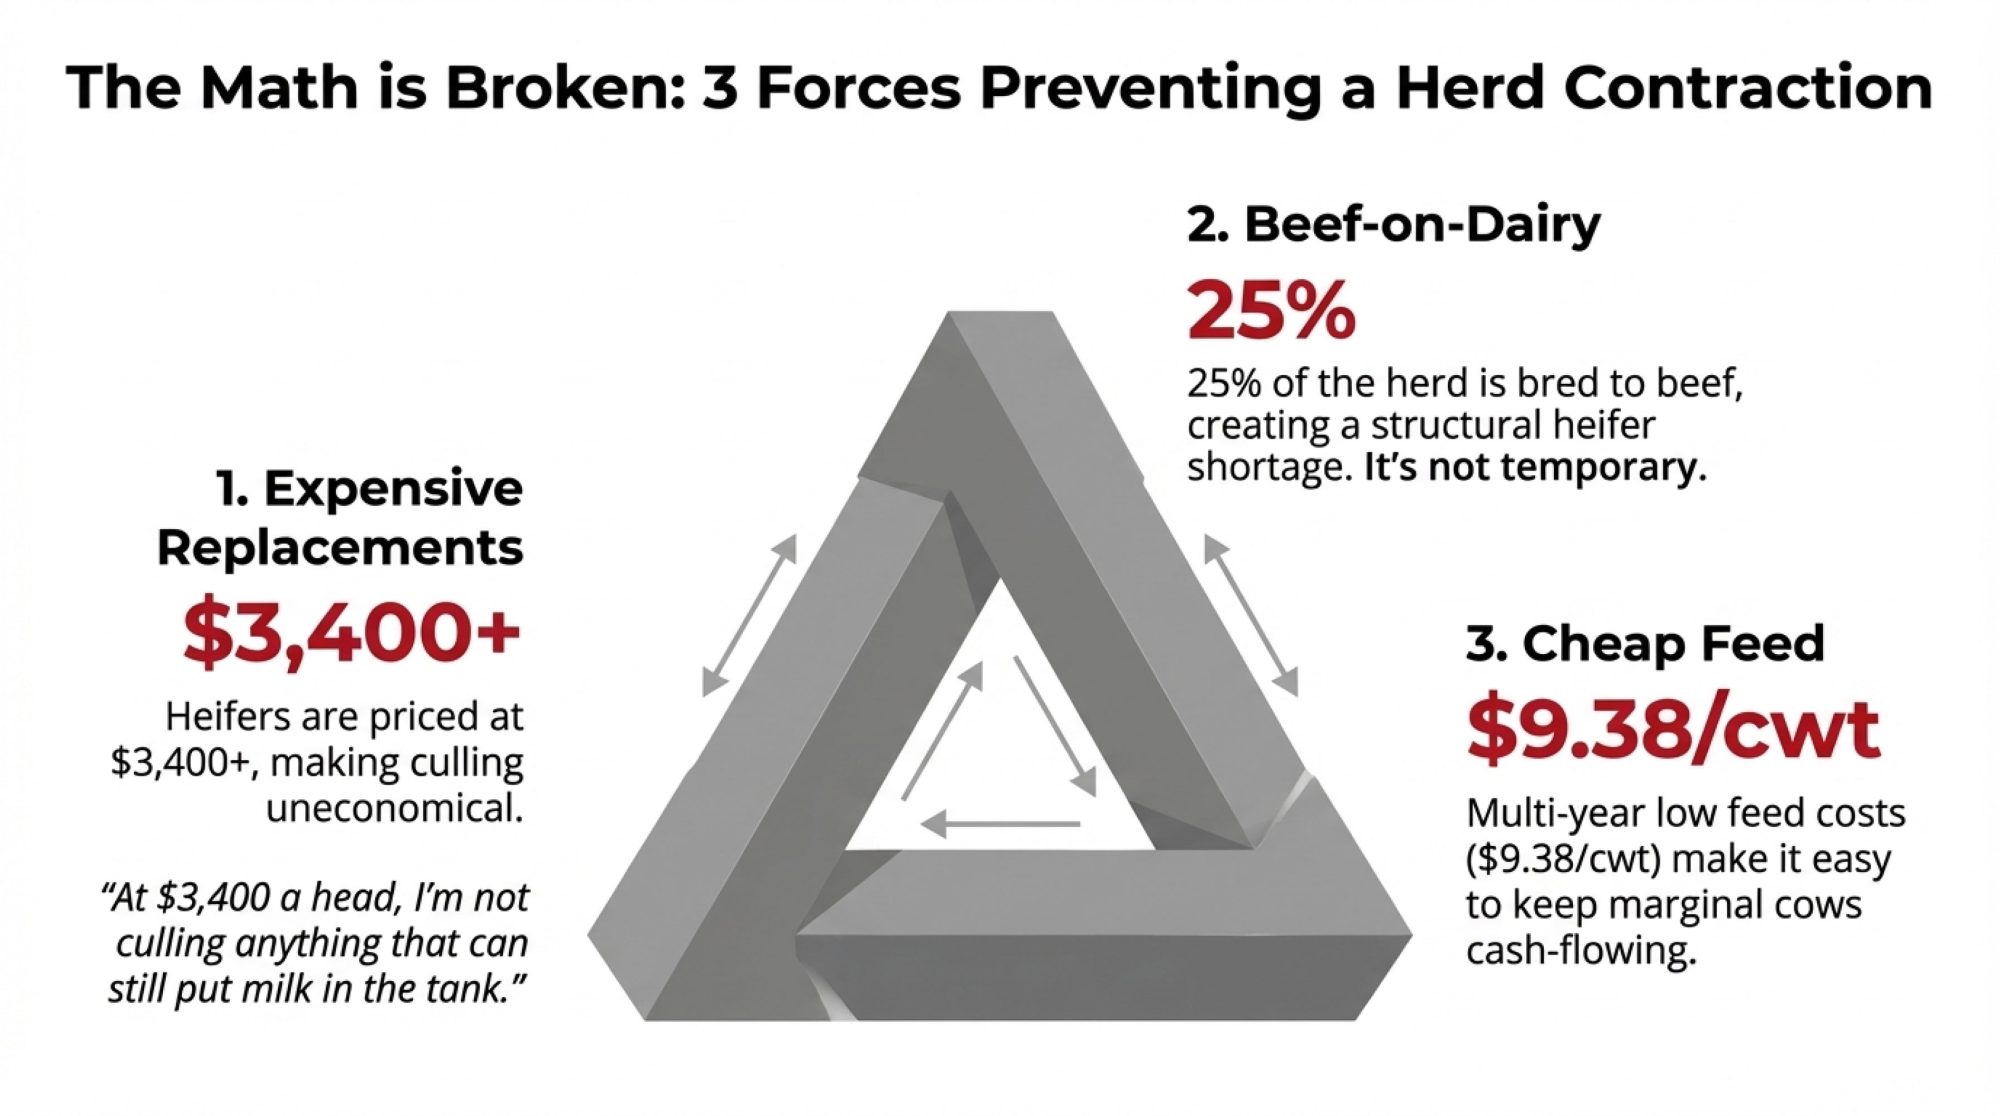
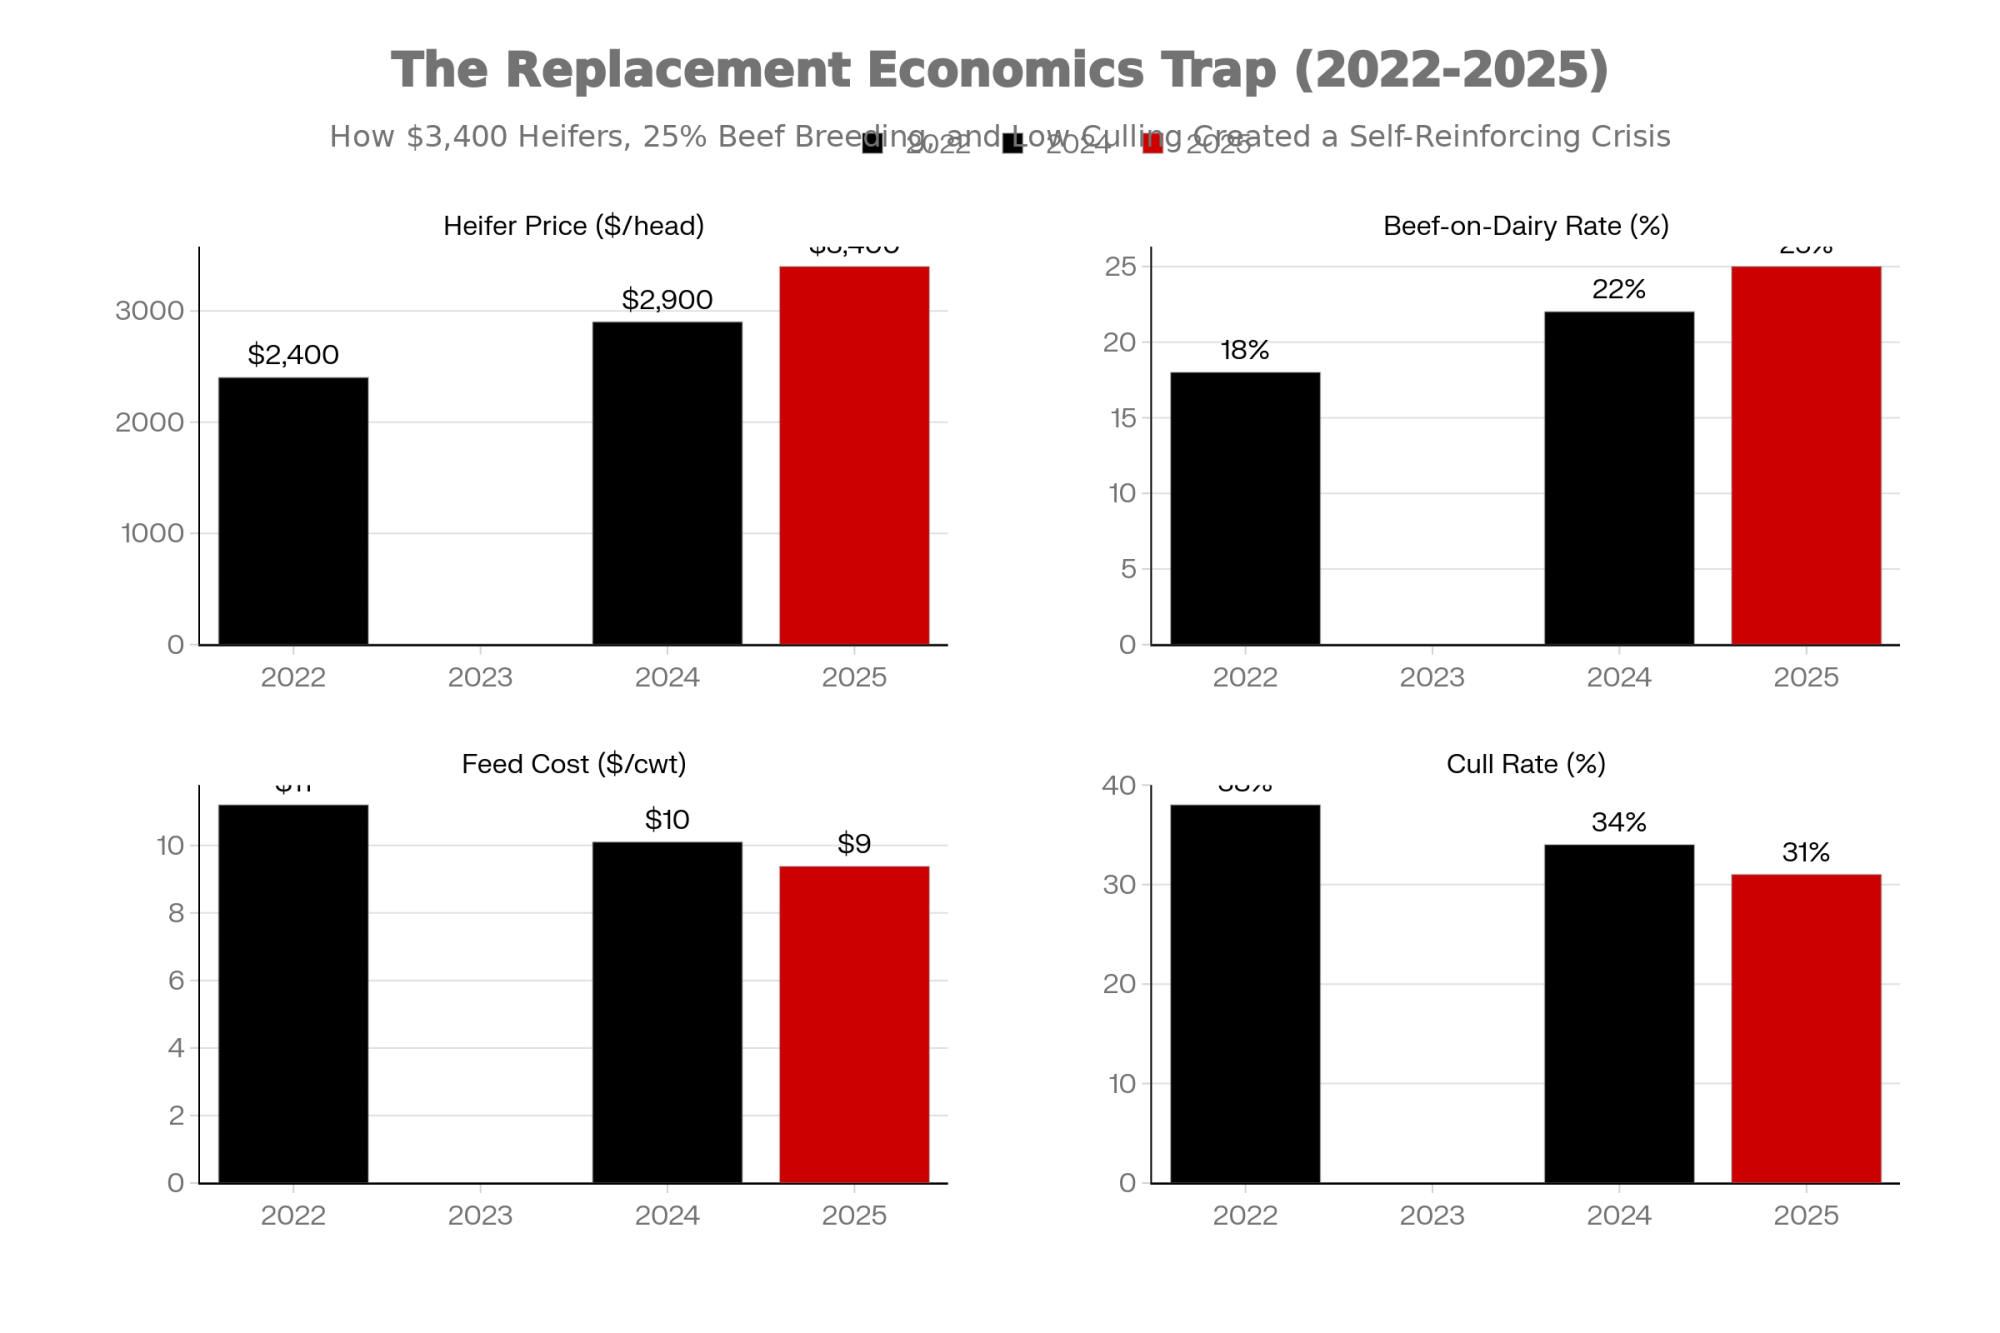
  • Replacement heifers are tight and expensive. U.S. replacement heifer inventories have fallen to about a 20‑year low. CoBank’s modeling projects an additional 800,000‑head decline over the next two years before a rebound in 2027. And bred heifer prices? They’ve climbed well above $3,000 per head in many markets. 
  • GLP‑1 weight‑loss drugs are changing grocery carts. A Cornell University–Numerator study found that households with a GLP‑1 user cut grocery spending by about 5–6% within six months, with higher‑income households cutting nearly 9%. The biggest reductions hit calorie‑dense, processed items—spending on savory snacks, baked goods, and cookies dropped between 6.7% and 11.1%. 
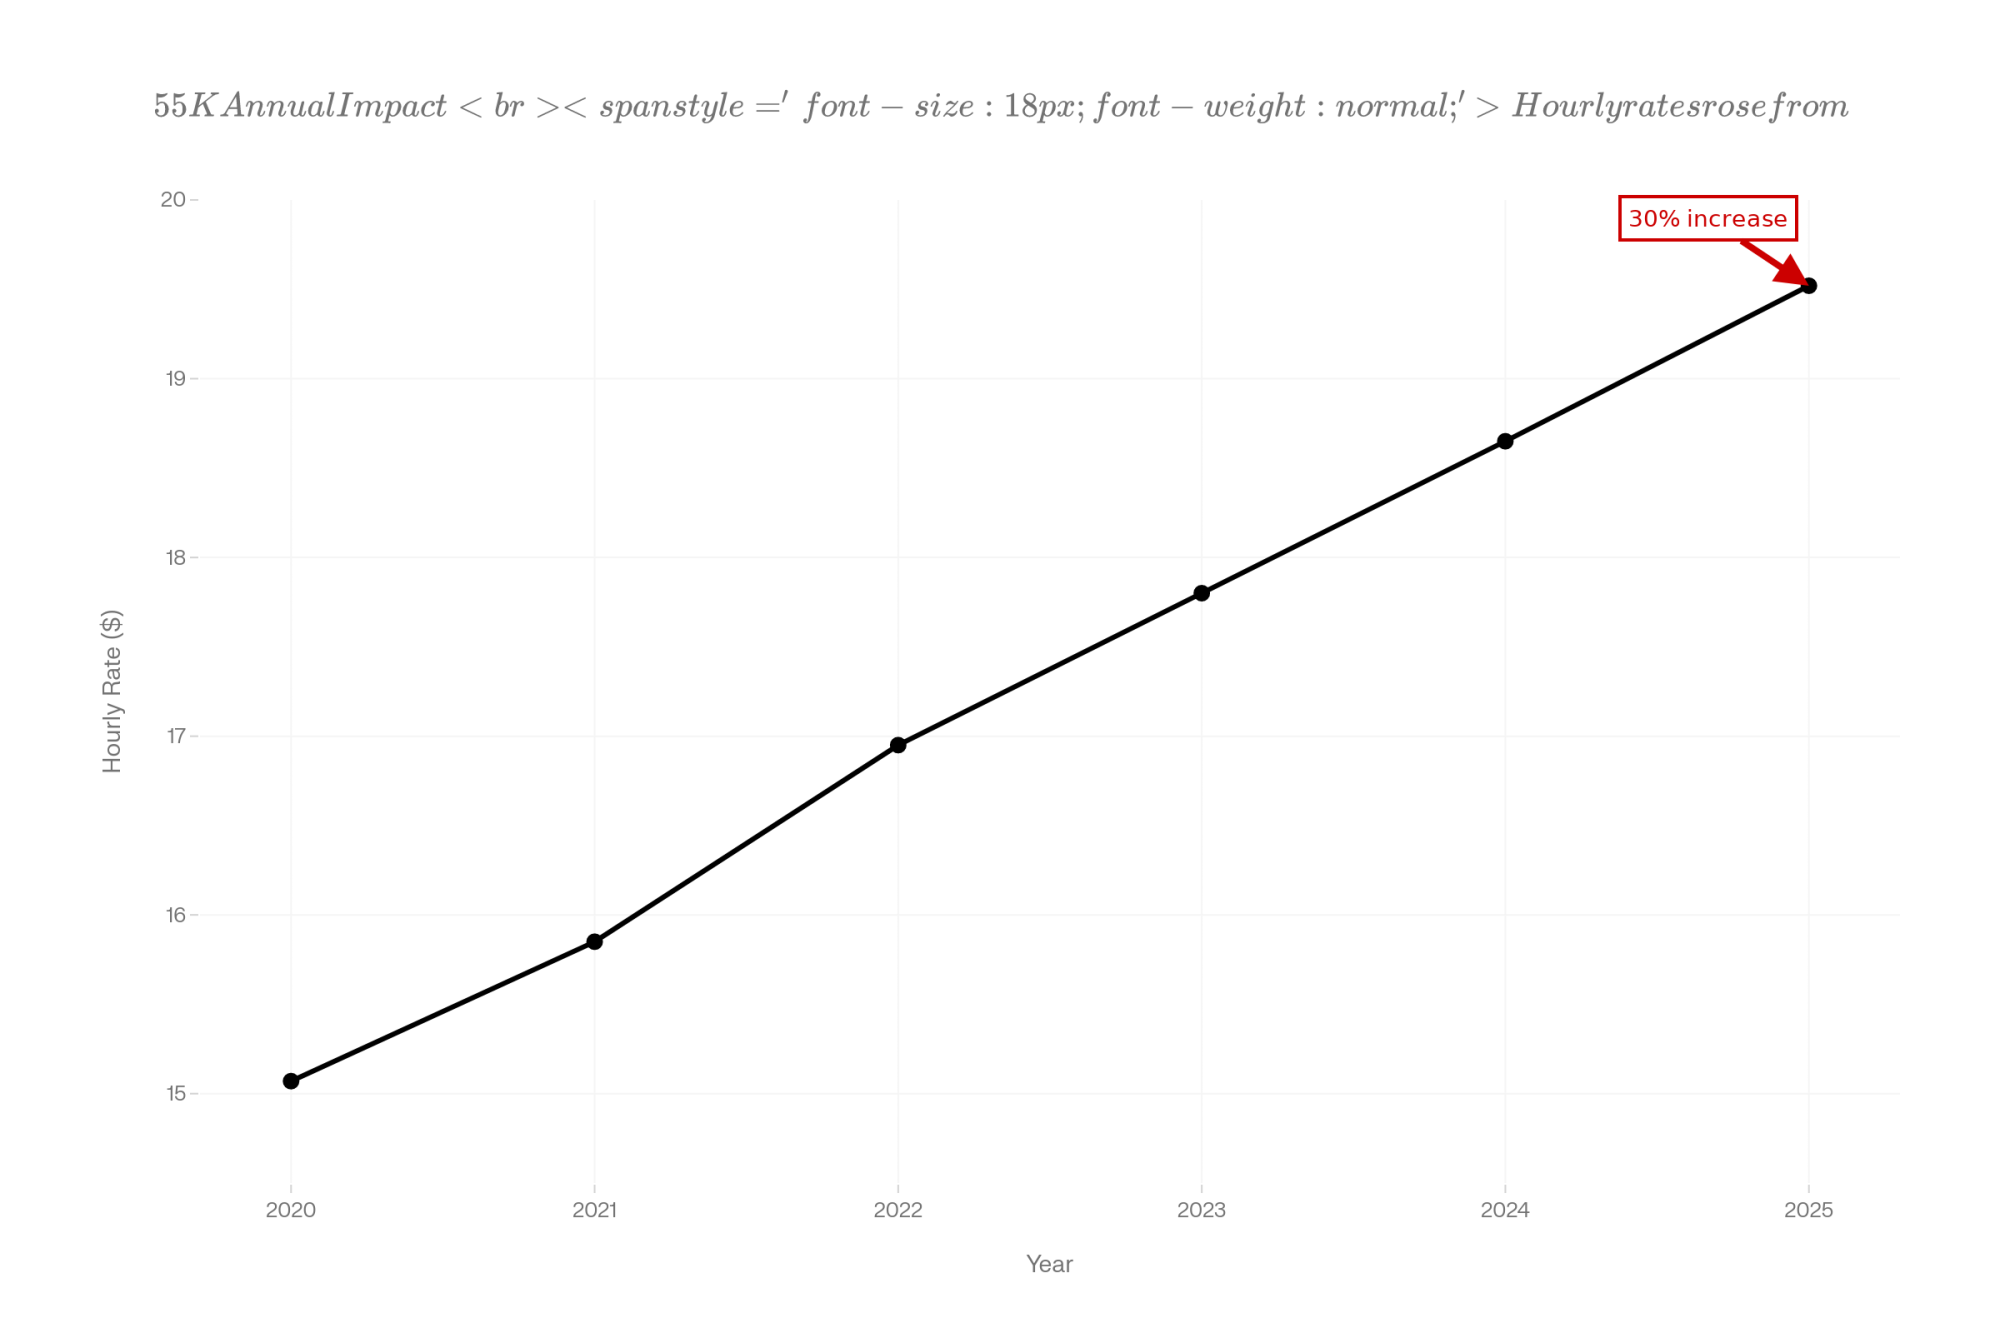
  • Sustainability is real money now. The FDA approved Elanco’s methane‑reducing feed additive Bovaer for U.S. dairy cattle in May 2024. Studies show it can cut enteric methane emissions by about 30%—roughly 1.2 metric tons of CO₂‑equivalent per cow per year. But it’s not free. Independent technical reviews and industry coverage suggest early commercial costs tend to fall in the $0.30–0.50 per cow per day range, depending on region and feeding system. 

Those are the big gears turning while you’re focused on butterfat levels, fresh cow management through the transition period, and whether that next heifer pen will be full.

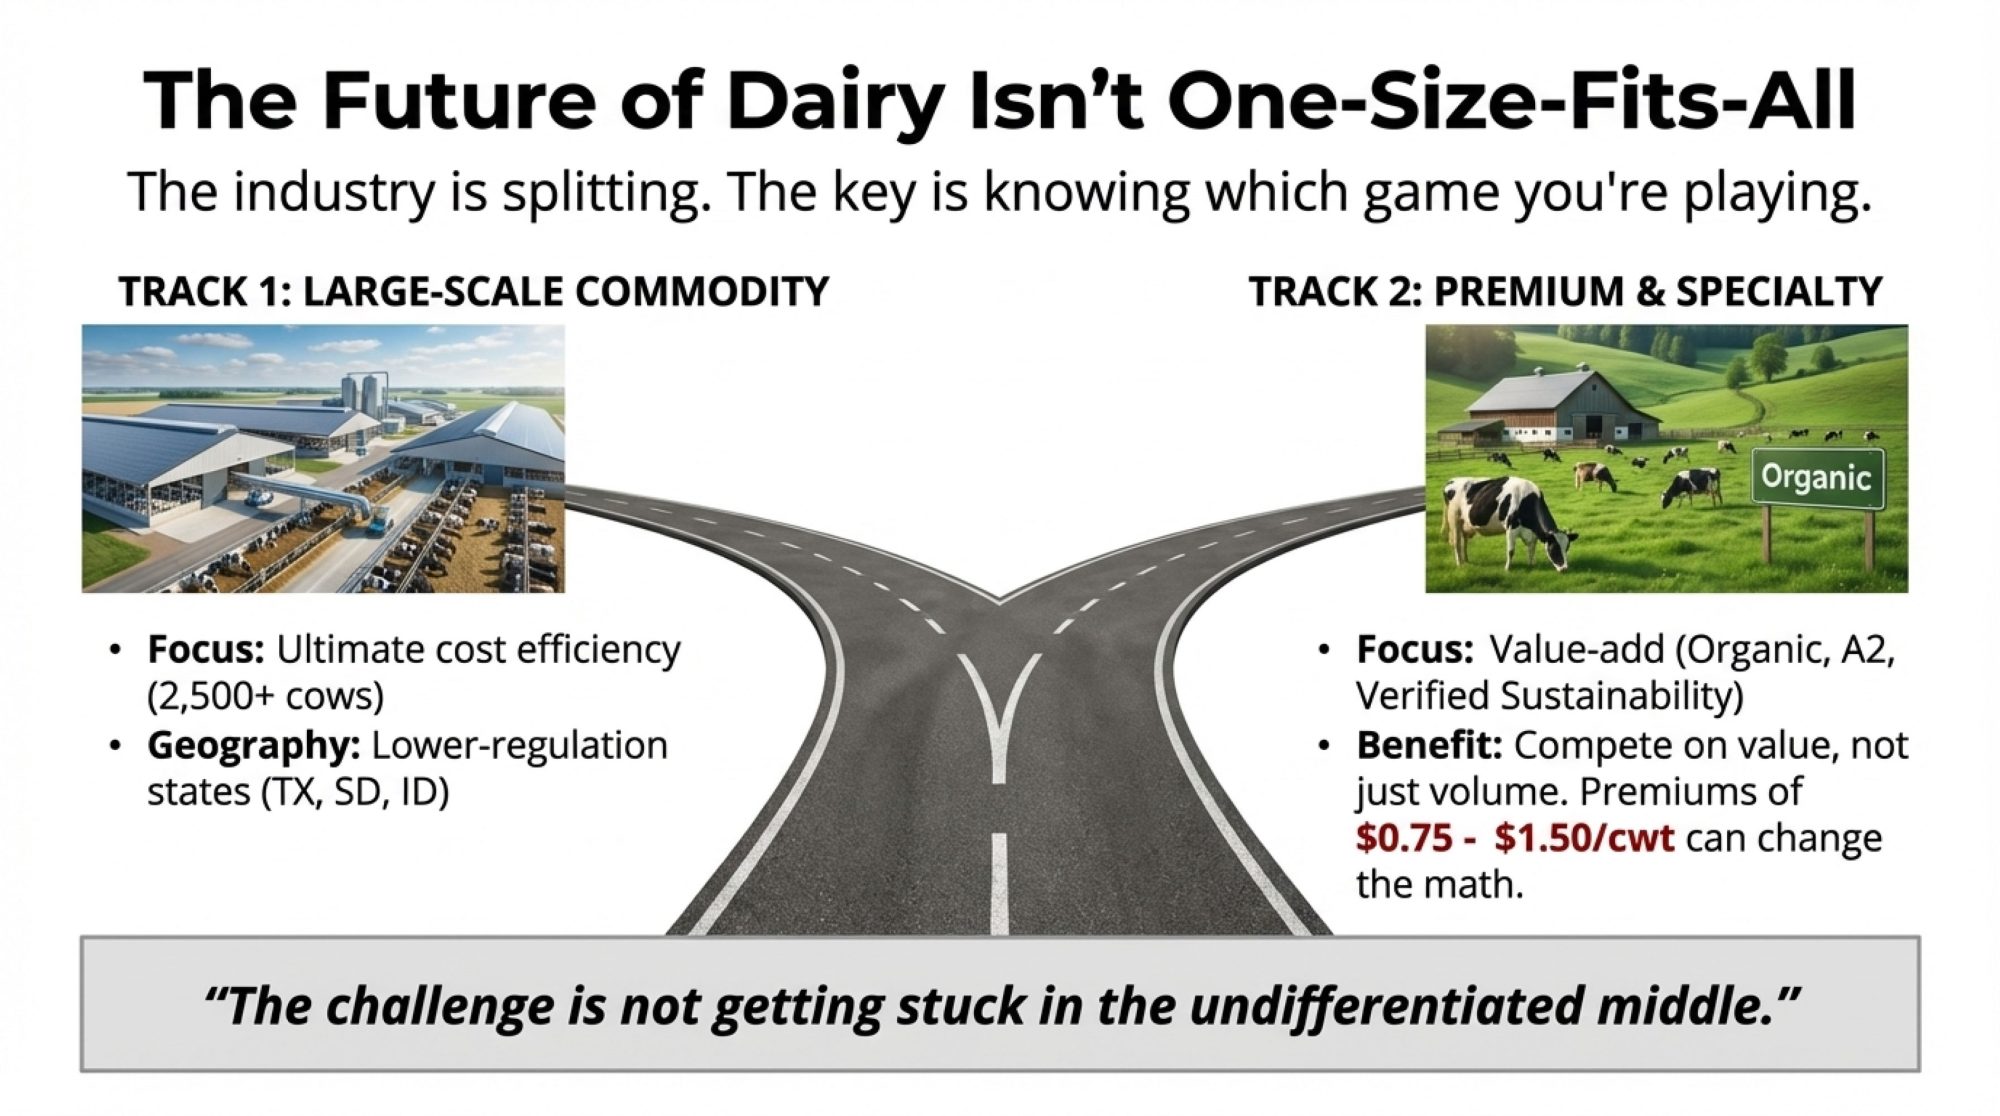
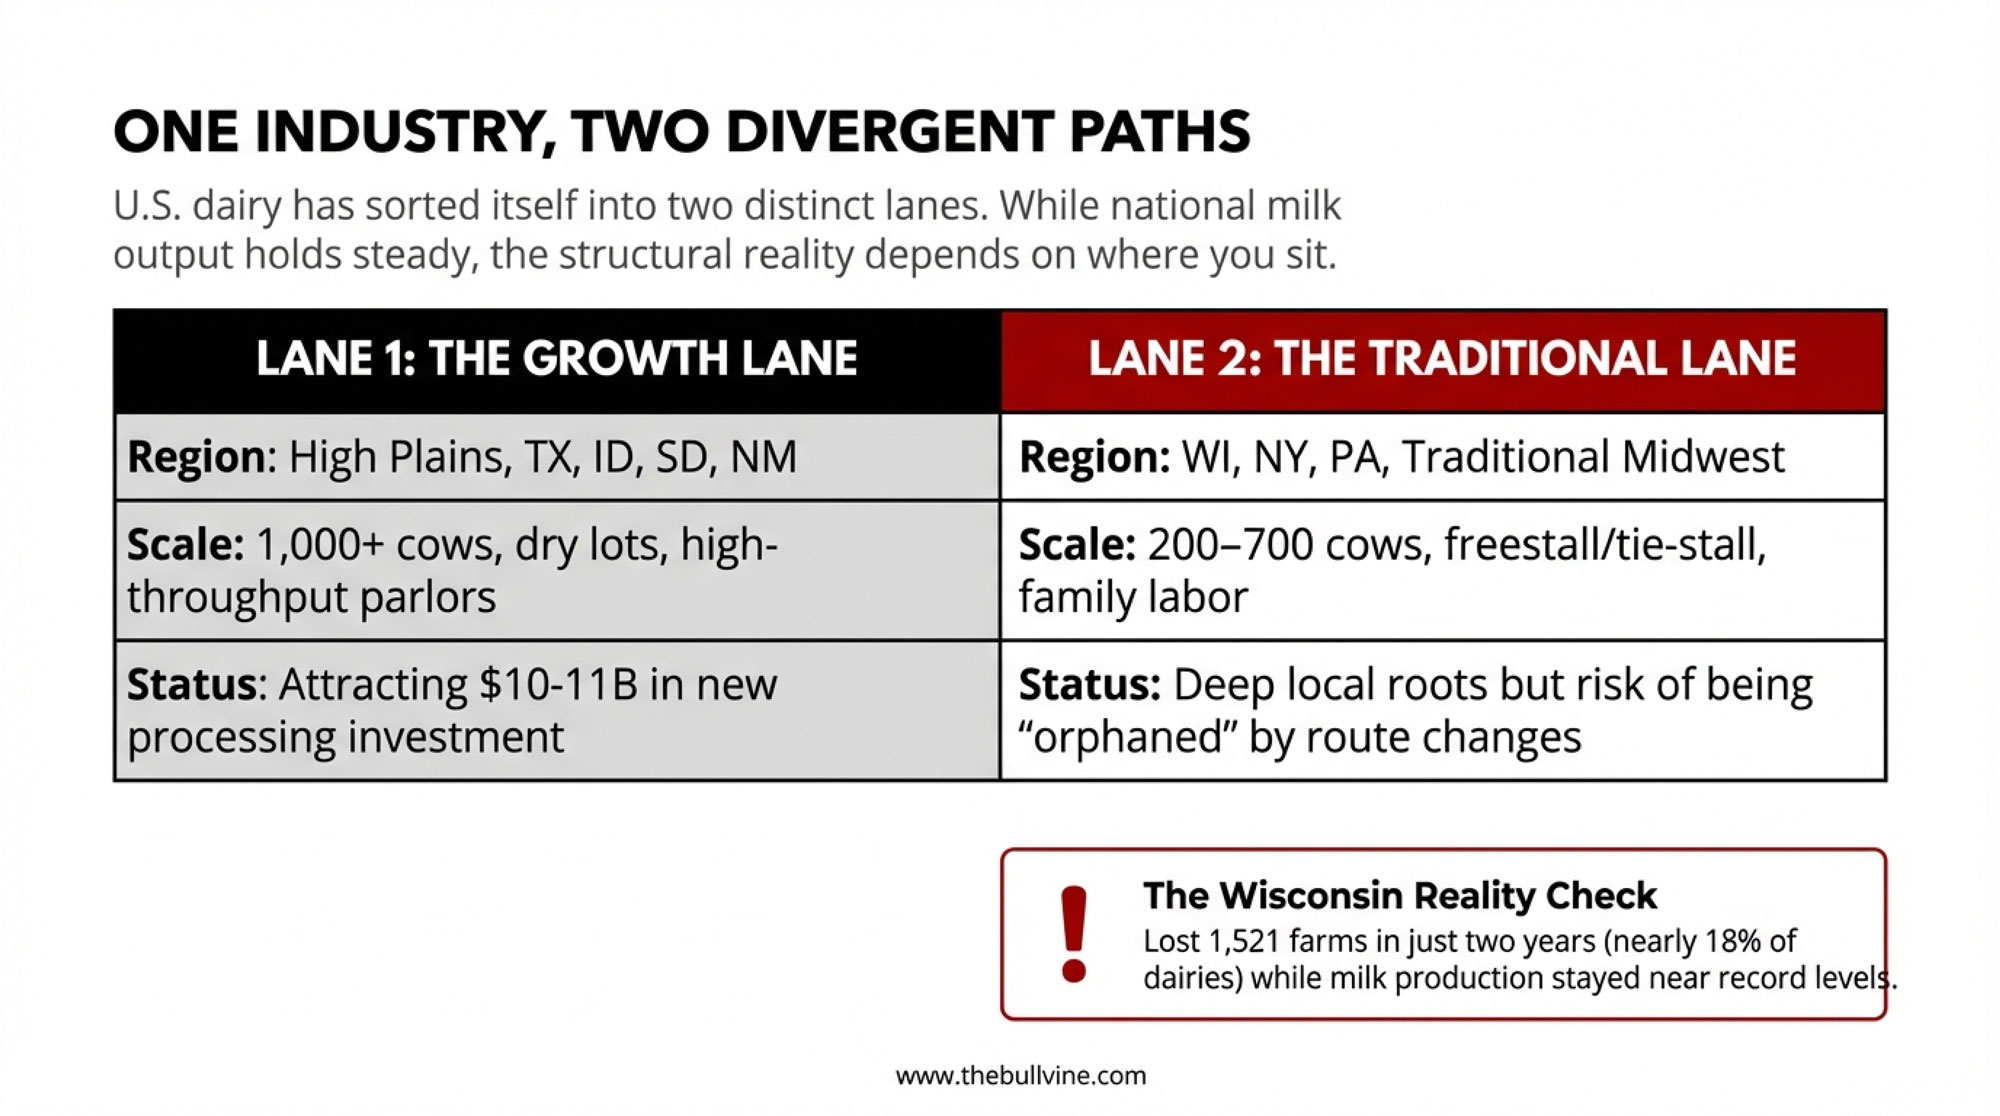
Two Lanes, One Industry: Where Does Your Herd Really Fit?

You’ve probably noticed this yourself: U.S. dairy has quietly split into two main “lanes,” even though nobody formally labeled them that way.

LaneTypical RegionsHerd SizeHousing & SystemsKey UpsideKey Risk
Lane 1Texas Panhandle, eastern New Mexico, Idaho’s Magic Valley, eastern South Dakota  1,000+ cowsDry lot systems, high‑throughput parlorsScale, hauling efficiency, tight and fit with the new capacityDependence on large‑plant contracts
Lane 2Wisconsin, New York, Pennsylvania, Vermont, broader Northeast/Upper Midwest  200–700 cowsFreestall or tie‑stall, family plus small hired teamsDeep local roots, flexible managementRisk of being “orphaned” by route changes

Lane 1: Big herds in growth corridors

In one lane, you’ve got the big outfits—often 1,000 cows and up—in places like the Texas Panhandle, eastern New Mexico, Idaho’s Magic Valley, and eastern South Dakota. They run dry lot systems or hybrid housing, big parlors, and high daily ship volumes.

CoBank and IDFA data show that much of that $10–11 billion in new processing capacity is landing in exactly these regions. From the processor’s point of view, that makes sense. Fewer farms, bigger loads, more predictable butterfat and protein flows for specific product specs and export programs. 

Lane 2: Mid‑sized family barns in traditional regions

In the other lane are the herds many of us grew up around: 200–700 cows, freestall or tie‑stall barns, double‑8 or double‑12 parlors, family labour plus a handful of employees.

Take Wisconsin as the clearest example. Using National Ag Statistics Service data, reported that the state lost 818 licensed dairy farms in 2019—over 10% in a single year. The decline was the largest in state history. 

In addition, 703 farms shut down in 2018, bringing the two‑year total to 1,521 farms—nearly 18% of Wisconsin’s dairies—while milk production stayed near record levels as larger herds added cows and pushed components. 

So at the state level, the narrative is “Wisconsin dairy is holding its own.” At the township level, it’s more like, “We’ve lost a third of the trucks that used to go past this mailbox.”

If you’re milking 300 cows in Marathon County or 450 in northern New York, you’re in that second lane whether you chose it or not. And the system treats you differently than it treats a 3,000‑cow dry lot in the Panhandle.

What Co‑ops and Plants Are Really Optimizing For

You probably already sense this from watching milk routes in your area, but it’s worth laying out the math plainly.

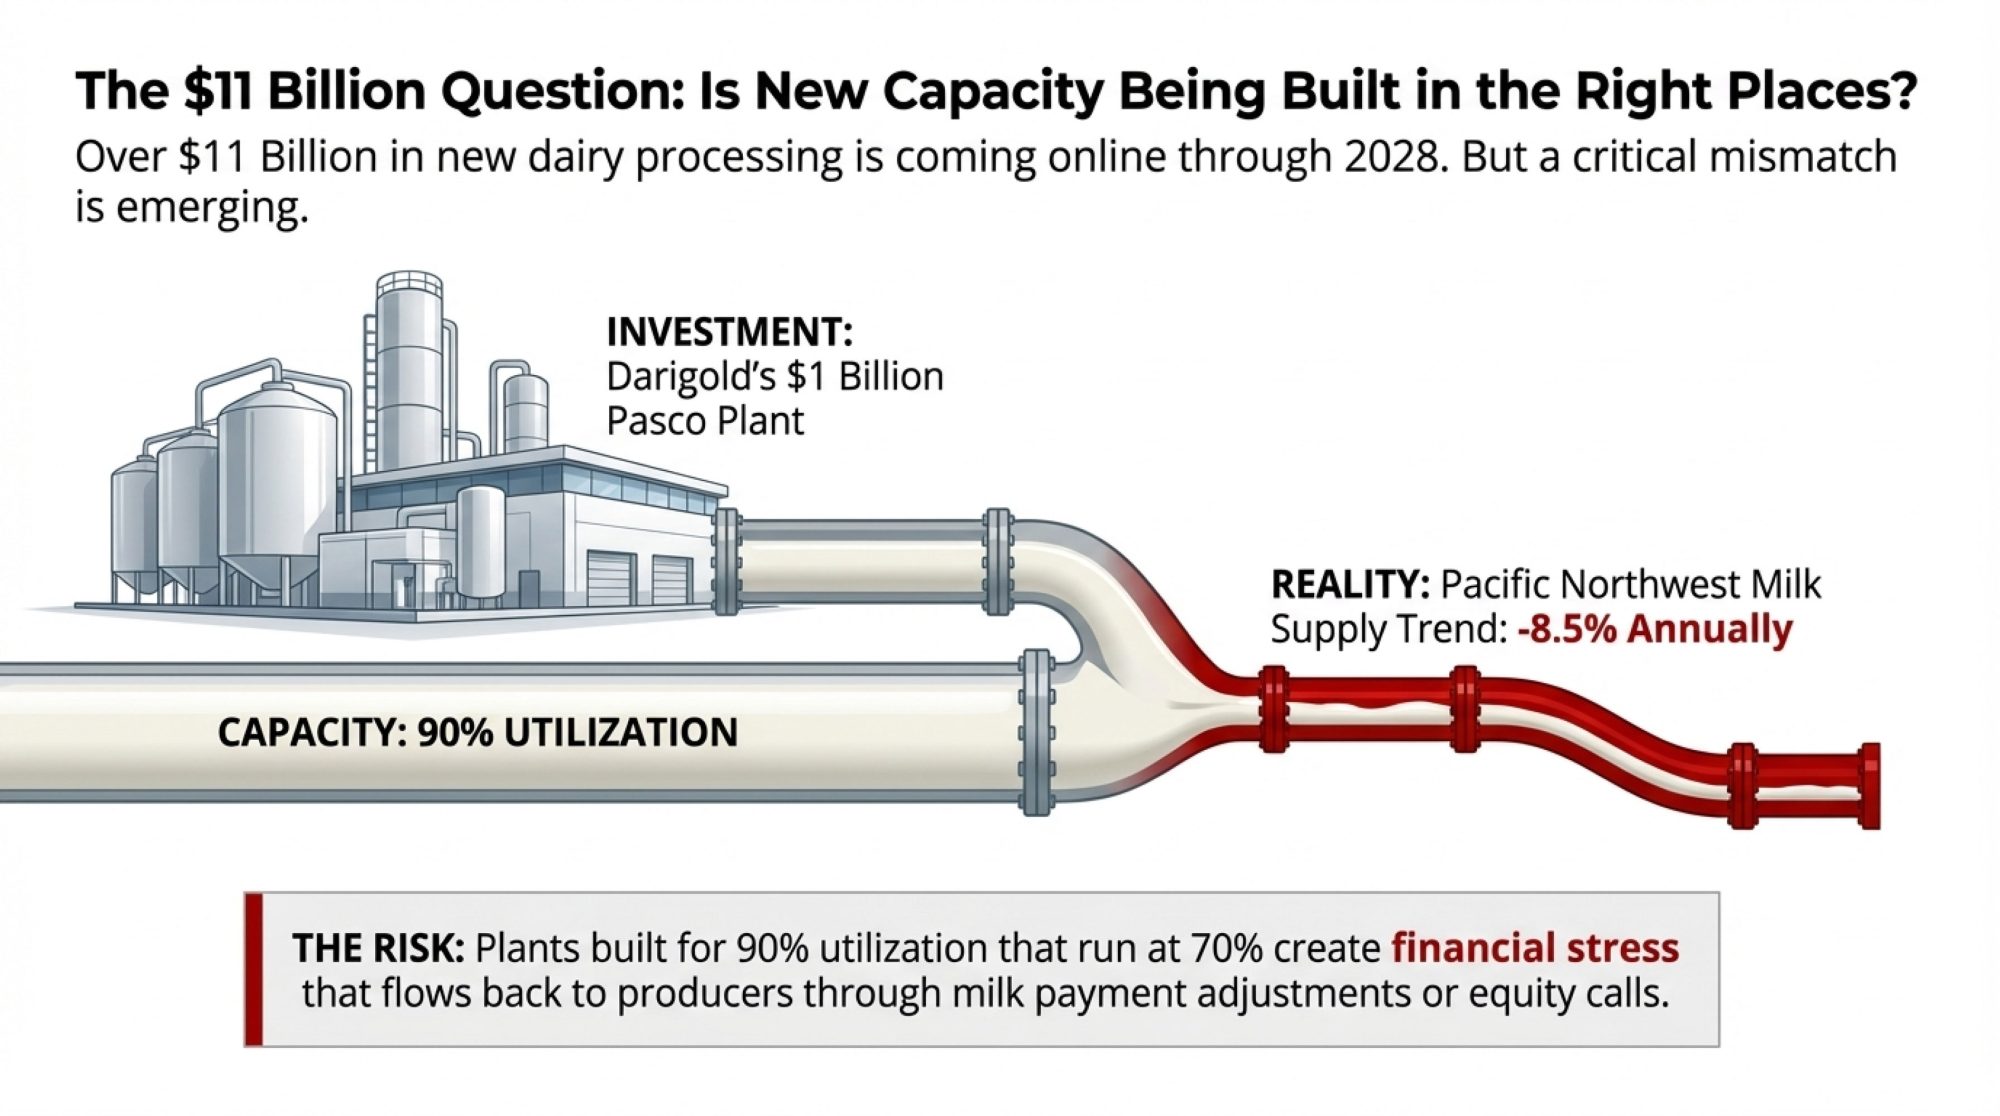
When Associated Milk Producers Inc. announced in late 2019 that it would discontinue production at its Arlington, Iowa, nonfat dry milk plant and its Rochester, Minnesota, cheese plant, AMPI pointed straight at lower regional milk production and the long‑term loss of dairy farms as key reasons. 

Their statement noted that Minnesota had lost 40% of its dairy farms since 2008, and Iowa has lost 50% during that same period. 

Here’s the part that stings but tracks with every hauling study:

  • A 300‑cow freestall might add 1,500–2,000 gallons per pickup.
  • A 1,500‑cow dairy can fill a tanker—or more—from one driveway.

When several mid‑sized farms exit, and their volume consolidates onto larger herds, a co‑op’s per‑unit hauling cost and plant efficiency can actually improve, even as rural communities feel hollowed out. 

Here’s the blunt reality: if your co‑op’s last three big announcements were about plants two states away, they’re telling you something about where they see their future milk coming from. It’s frustrating, but it’s not random. 

GLP‑1 Weight‑Loss Drugs: The New Demand Wildcard

Now let’s step off the farm for a minute. GLP‑1 medications—Ozempic, Wegovy, Mounjaro, and similar—started as diabetes drugs, but their use for weight loss has exploded.

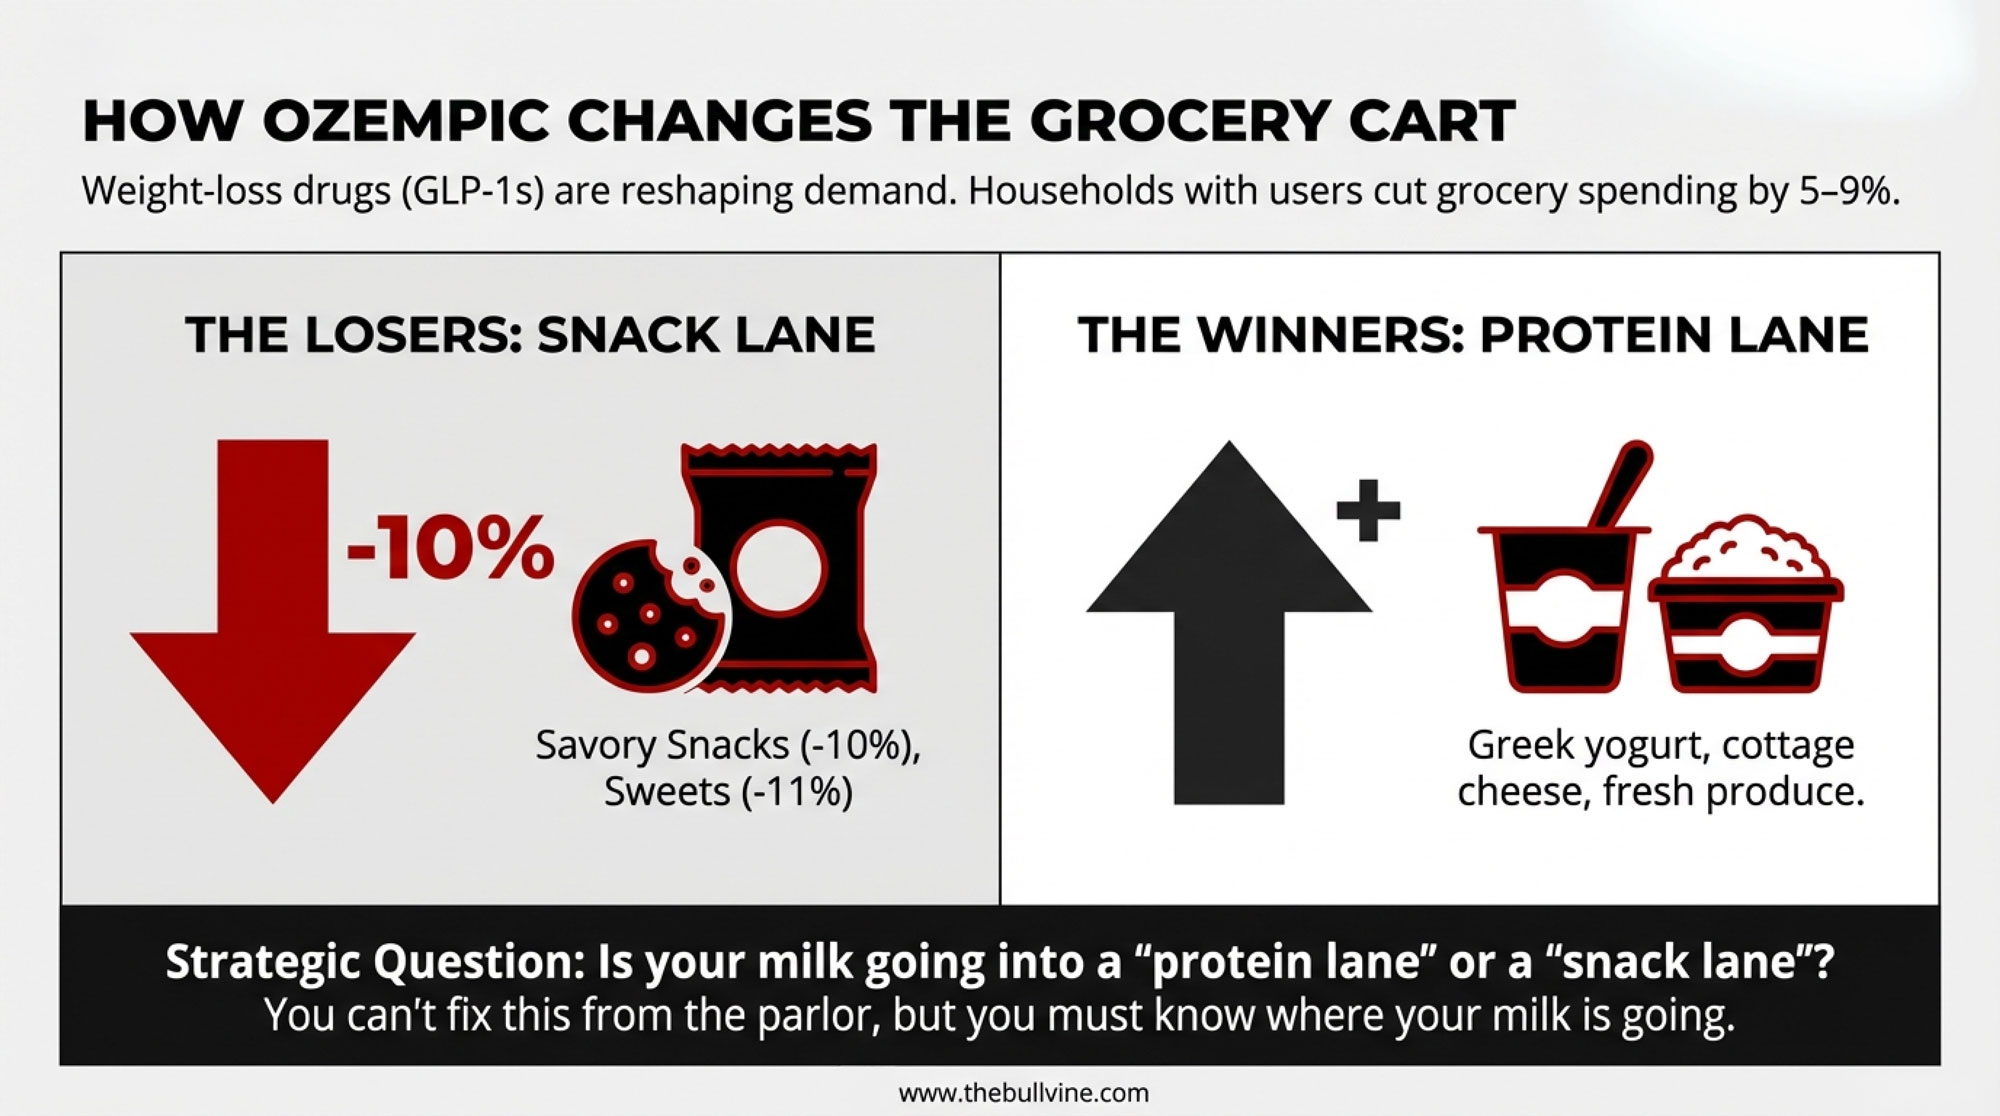
Industry tracking suggests approximately 15 million U.S. adults were using GLP‑1 medications by 2023, and clinical reviews show these drugs can cut daily calorie intake by around 20%. 

Cornell University and Numerator linked shoppers’ survey‑reported GLP‑1 use to their actual grocery purchases. The study found that households with a GLP‑1 user cut grocery spending by about 5–6% within 6 months of starting the medication, roughly $ 400 per year on average, and by 9% for higher‑income households. 

The biggest cuts landed on calorie‑dense, processed categories. Spending on savory snacks fell by about 10%, while categories like baked goods and cookies saw reductions of 6.7% to 11.1%. 
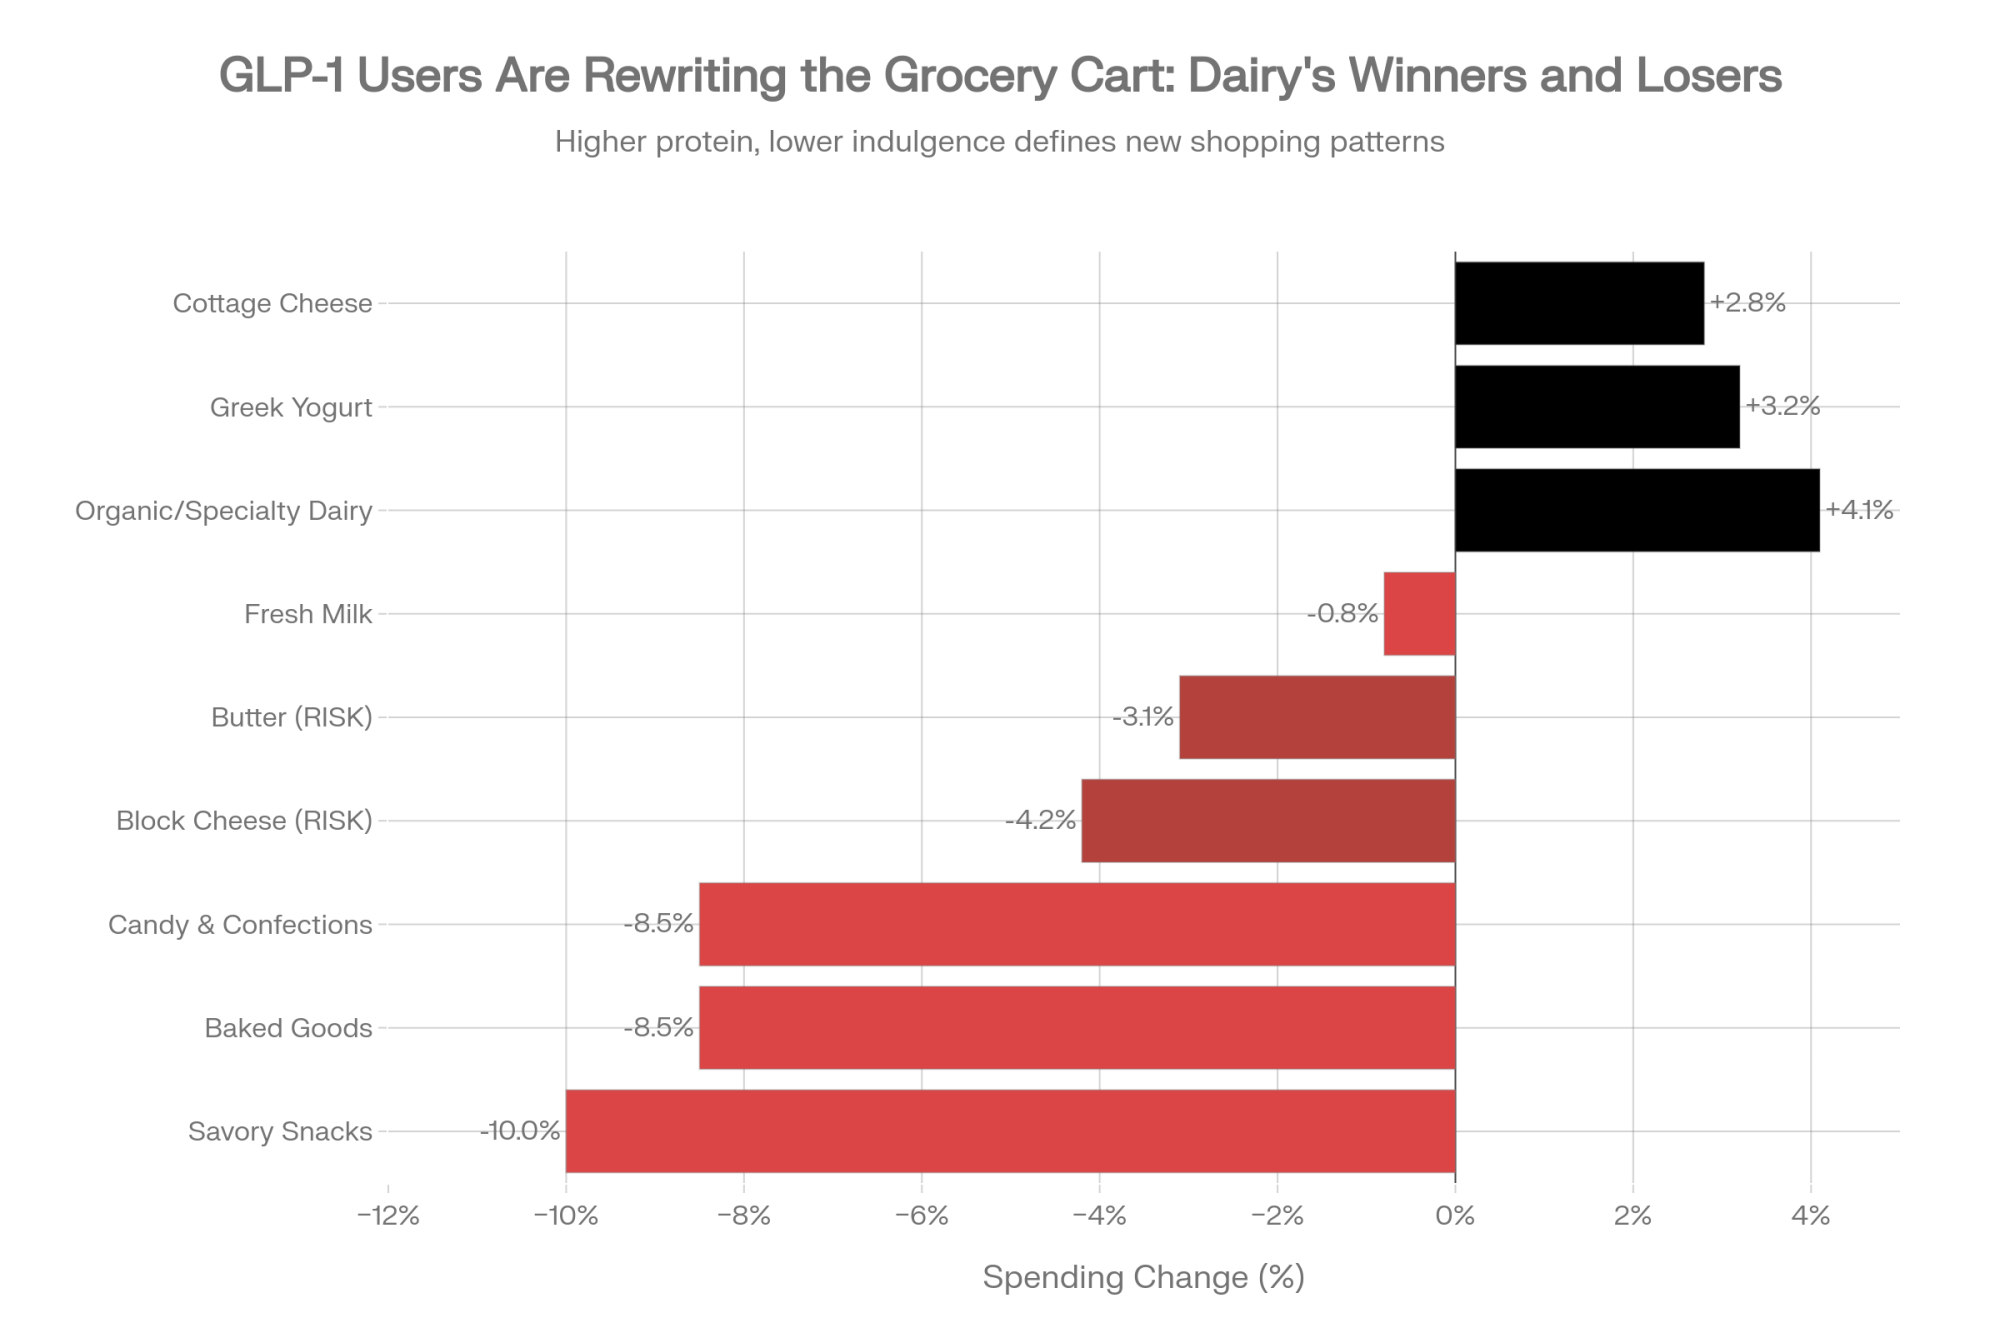
CategoryAverage Household Spending Change% ChangeMilk Relevance
Savory Snacks (chips, crackers, popcorn)−$24 to −$32−10.0%High—processed milk/whey used
Baked Goods (cookies, cakes, pastries)−$18 to −$26−6.7% to −11.1%High—butter, milk powder, butterfat
Candy & Confections−$12 to −$18−8.5%Moderate—dairy ingredients
Block Cheese (cheddar, American, processed)−$8 to −$14−4.2%HIGH RISK—commodity pressure
Butter (salted, unsalted)−$6 to −$10−3.1%HIGH RISK—indulgence category
Greek Yogurt (high-protein)+$4 to +$8+3.2%WINNER—protein focus aligns
Cottage Cheese (high-protein)+$3 to +$5+2.8%WINNER—protein focus aligns
Fresh Milk (milk, cream, fresh dairy)−$2 to +$1−0.8% to +0.5%Neutral to slight decline
Organic/Specialty Dairy+$6 to +$10+4.1%WINNER—premium positioning

Meanwhile, yogurt and fresh produce saw modest increases. 

What does this mean for your milk? If most of your production ends up in commodity cheese blocks and butter, GLP‑1 makes those categories a little more crowded. If it’s heading into high‑protein dairy—Greek yogurt, cottage cheese, protein drinks—you’re closer to where the growth is. 

You can’t fix GLP‑1 from the parlor. But you can understand where your milk is going and whether that’s a “protein‑forward” lane or an indulgence lane.

When Plants Move, the Local Math Changes

You don’t need a consultant to tell you that when a local plant closes or changes hands, everything around it feels it. We’ve already talked about AMPI’s closures and the logic behind them. 

Economic impact work for USDA and state ag departments has consistently shown that every dairy cow supports multiple off‑farm jobs—feed, vet, fuel, trucking, processing, retail. When processing capacity leaves a region, that ripple shrinks.

Meanwhile, the fresh steel is going into places that CoBank and IDFA keep pointing to: South Dakota, Texas, New Mexico, Idaho, parts of Kansas, and the Upper Midwest, where milk production is rising and component‑rich milk can efficiently fill new plants. 

Cows follow plants, and plants follow cows—it’s a feedback loop.

For a 300‑cow family dairy in Marathon County or northern Pennsylvania, the processing map now matters almost as much as your soil map. If your buyer is putting new capital into your region, that’s one kind of future. If most of their big announcements are two or three states away, that’s another.

Sustainability and Bovaer: Real Emission Cuts, Real Costs

Let’s talk sustainability, because it’s showing up in almost every processor and retailer playbook now.

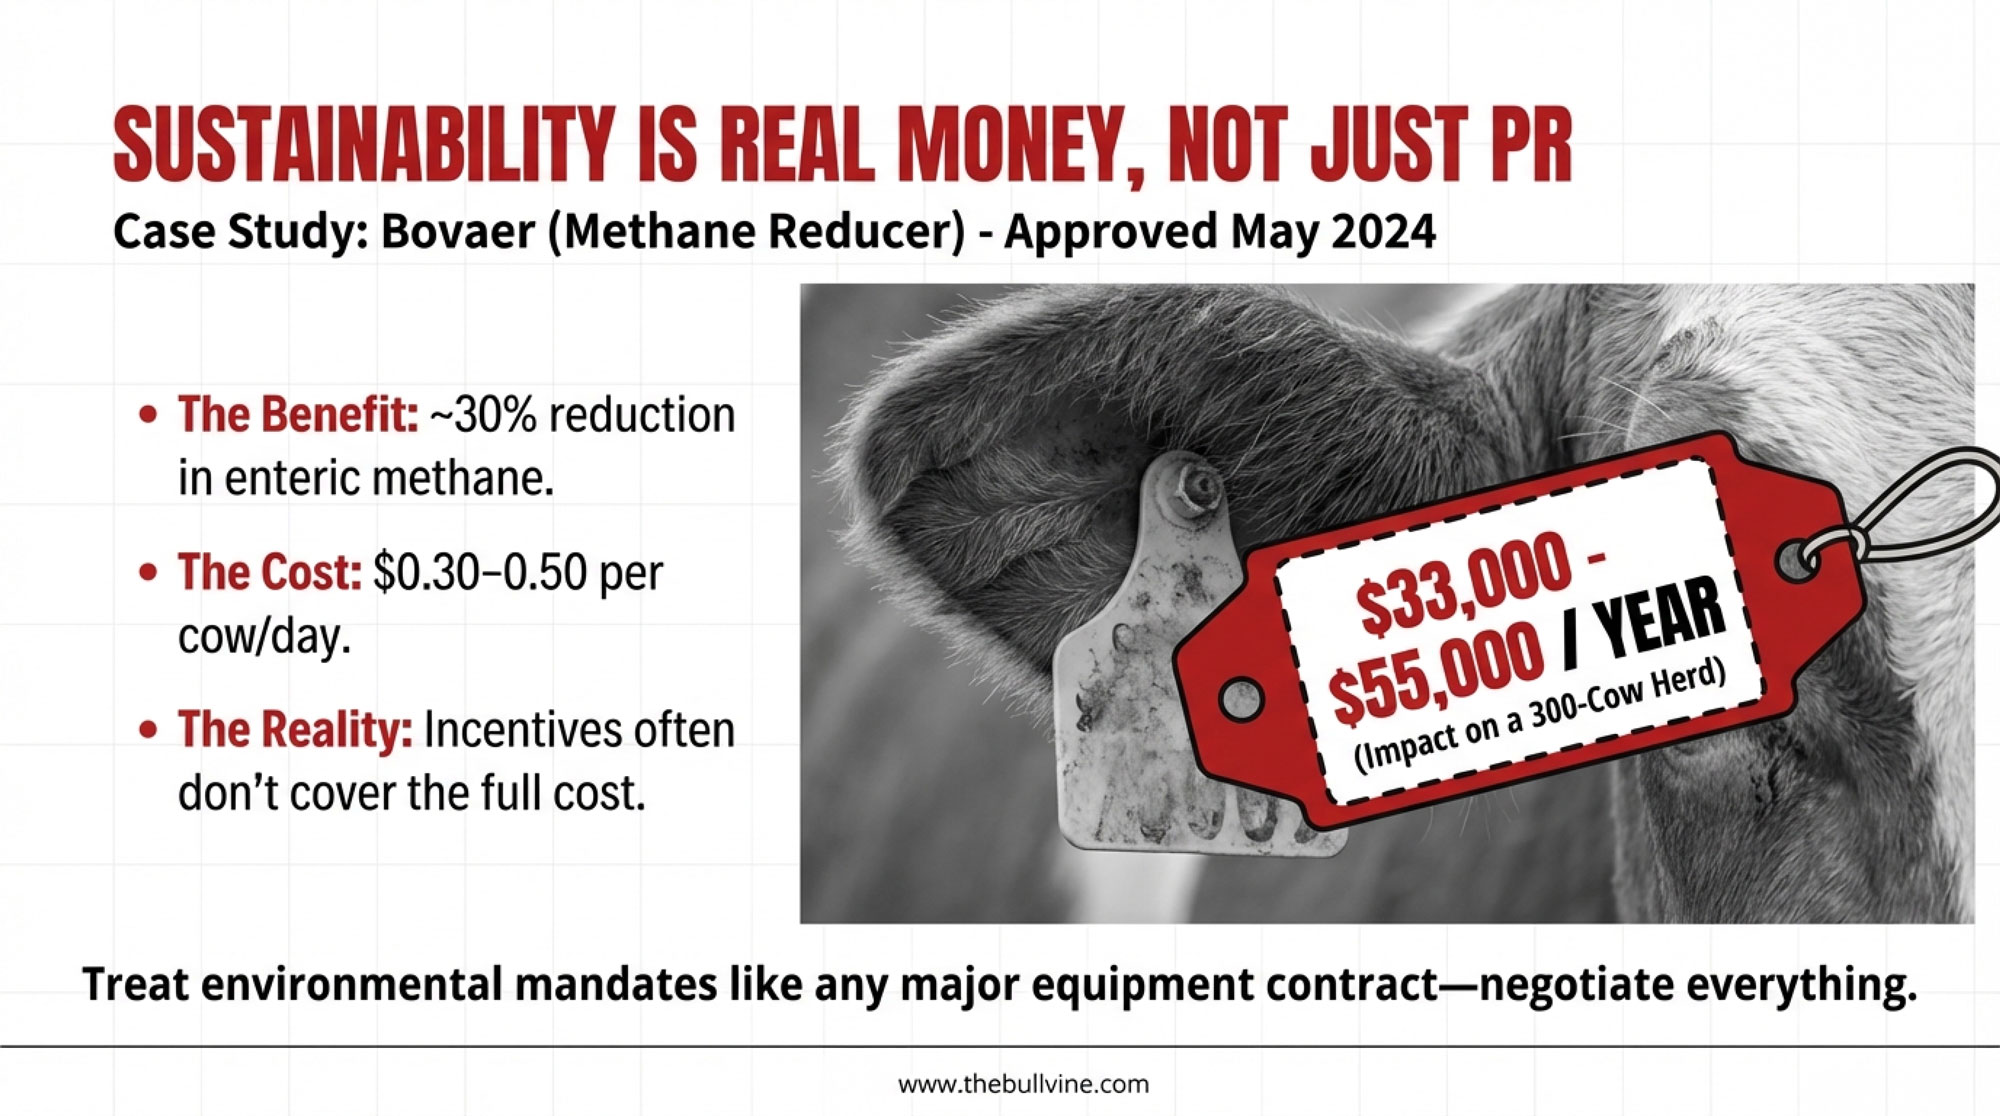
Bovaer is one of the most talked‑about tools on the enteric methane side. In May 2024, the FDA completed its review and approved Bovaer for use in U.S. dairy cows. 

Elanco’s data shows that feeding one tablespoon per lactating dairy cow per day can reduce methane emissions by about 30%—roughly 1.2 metric tons of CO₂‑equivalent per cow per year. 

On cost, the picture is still evolving. Independent technical reviews, including Dellait’s analysis and industry coverage, suggest early commercial costs tend to fall in the $0.30–0.50 per cow per day range, depending on region and feeding system. 

On a 300‑cow herd, that works out to roughly $33,000–$55,000 per year before any incentives.

Some co‑ops and processors are offering payments tied to documented methane reductions, and a few early pilots show those can offset part of the cost—especially for larger herds or brand‑aligned programs. But in many cases, the net benefit to a 250–600‑cow herd is still very case‑by‑case.

What’s encouraging is that not all sustainability steps look like pure cost. Extension work on energy efficiency, manure storage, and nutrient management shows that improving fans and pumps, optimizing manure handling, and tightening nutrient management plans can lower energy bills, reduce purchased fertilizer, and sometimes improve milk quality at the same time.

The big takeaway? Treat sustainability offers like any other major business contract: get the full cost per cow and per hundredweight, understand how incentives are calculated and how long they last, and talk to producers already in the program before you sign. 

Beef‑on‑Dairy: Great Tool, Dangerous Autopilot

Most of you have already seen the beef‑on‑dairy story firsthand. A decade ago, Holstein bull calves in many Midwest barns weren’t worth the time it took to haul them. Today? That’s changed.

In 2024–2025, newborn beef‑on‑dairy cross calves have often sold in the $600–$900 range in the Midwest and Western markets, with some lots hitting or exceeding $1,000 when beef supplies are especially tight. 

Compared to the $50–$150 Holstein bull calves many of us remember, that’s a different world entirely.

Here’s the catch. As more producers bred a high share of cows to beef, replacement heifer inventories dropped.

CoBank’s 2025 report concludes that U.S. replacement heifer numbers have already fallen to a 20‑year low and could shrink by another 800,000 head across the next two years before recovering in 2027. 
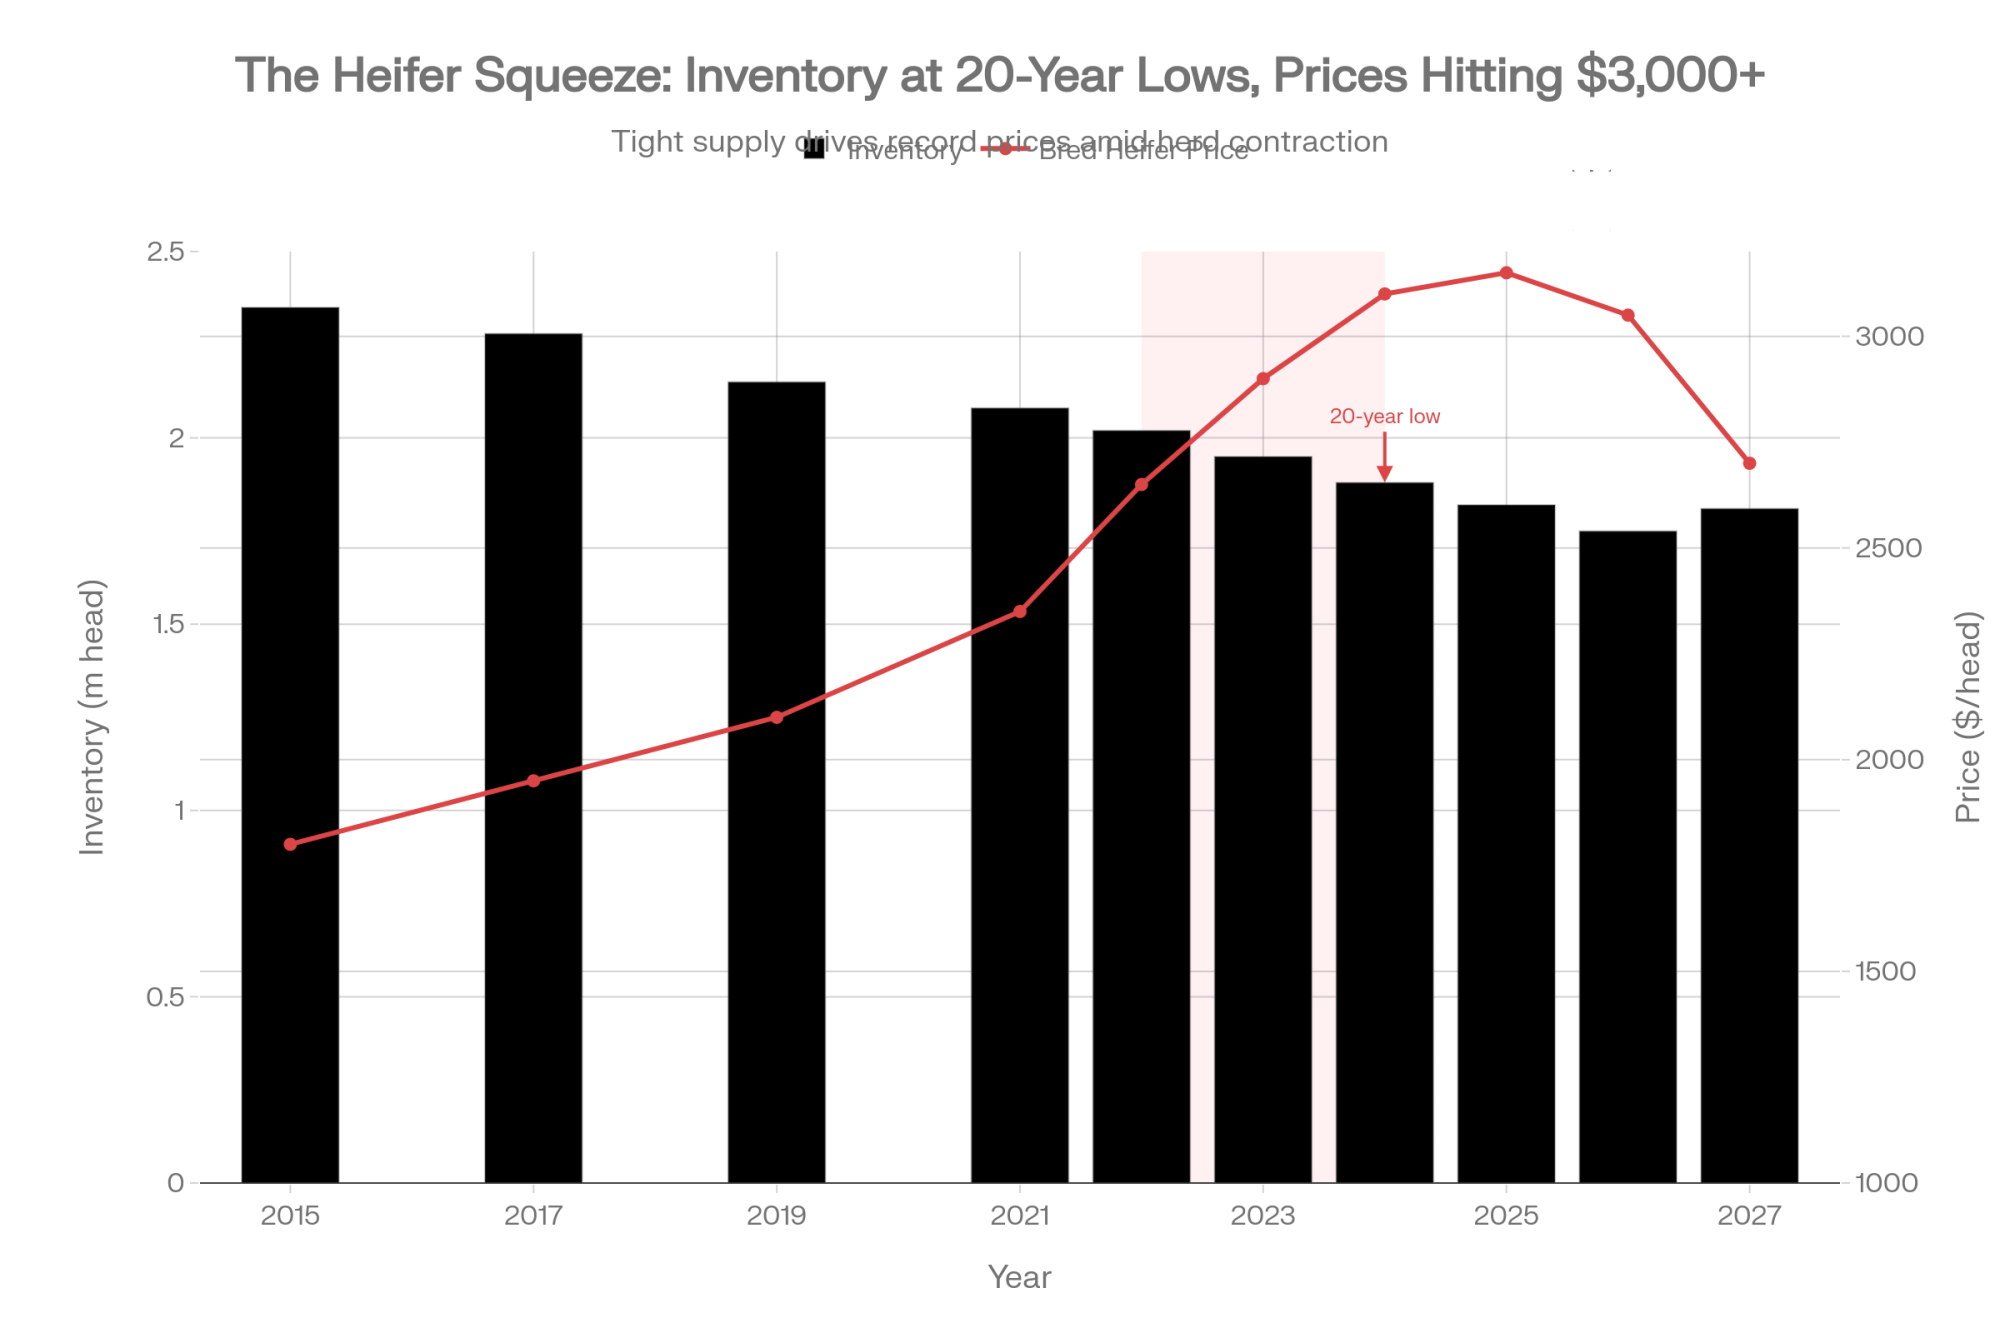
YearHeifer Inventory (M head)Bred Heifer Price ($/head)
20152.35$1,800
20172.28$1,950
20192.15$2,100
20212.08$2,350
20222.02$2,650
20231.95$2,900
20241.88$3,100
2025E1.82$3,150
2026E1.75$3,050
2027E1.81$2,700

During the same period, bred heifer prices have spiked “well above $3,000 per head” and in some cases significantly more. 

So if a 320‑cow herd runs several years of aggressive beef‑on‑dairy use without a disciplined replacement plan, it can easily end up short on heifers and forced to buy back in at a painful price.

What farmers are finding is that beef‑on‑dairy works best as a controlled tool:

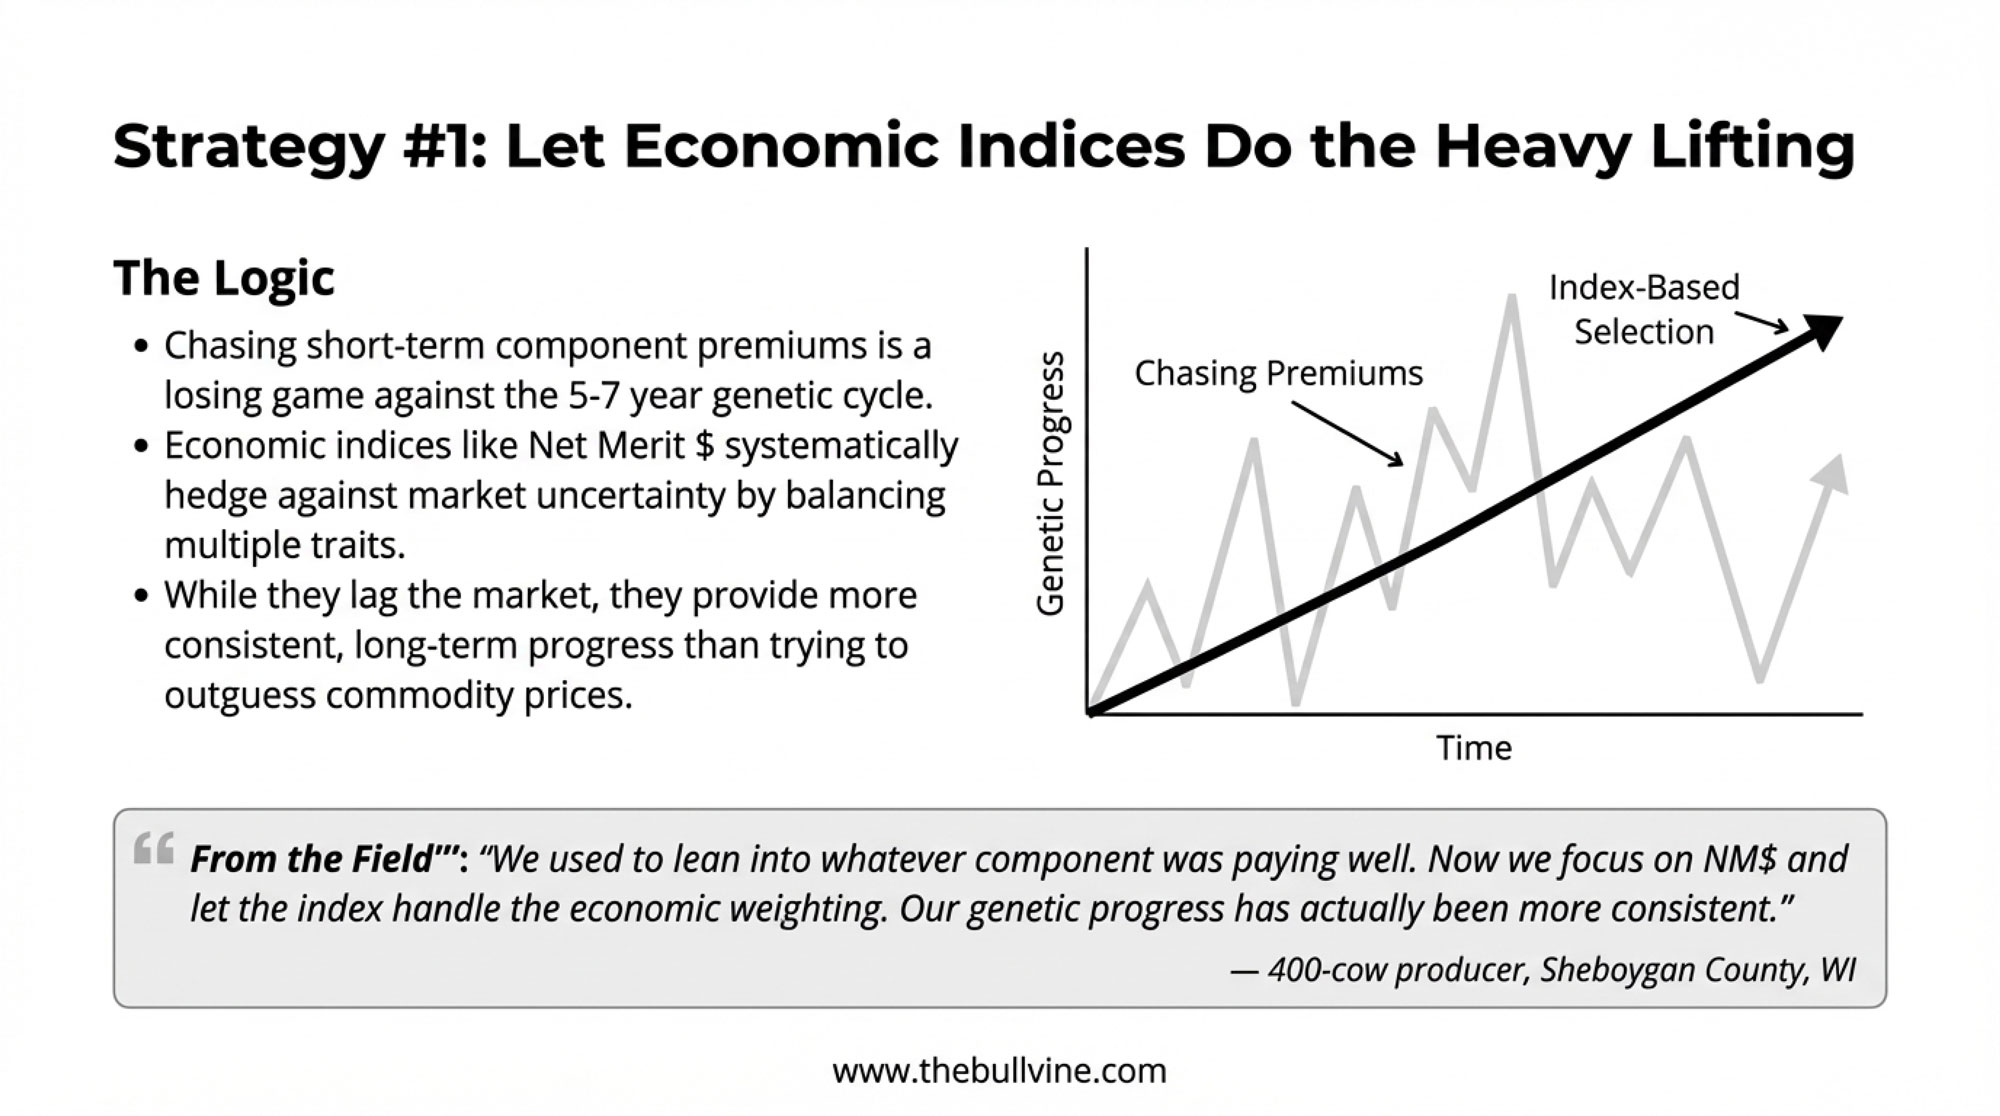
  • Set your replacement target. Use your actual cull rate, age at first calving, and herd size to calculate how many heifers you truly need each year. Many herds land near 30–36 replacements per 100 cows per year, depending on goals and longevity.
  • Use sexed dairy semen and genomics where they pay. Focus dairy semen on your top‑end cows and heifers—animals that will move butterfat performance, protein yield, and health traits in the right direction for your market.
  • Then layer beef‑on‑dairy on the rest. Once you’ve covered replacements, you can confidently use beef semen on the remainder to capture calf premiums without jeopardizing your future herd.

It’s like balancing protein and energy in a ration. Pushing beef semen to the max without watching replacement numbers might feel good in the short term, but the payback can hurt.

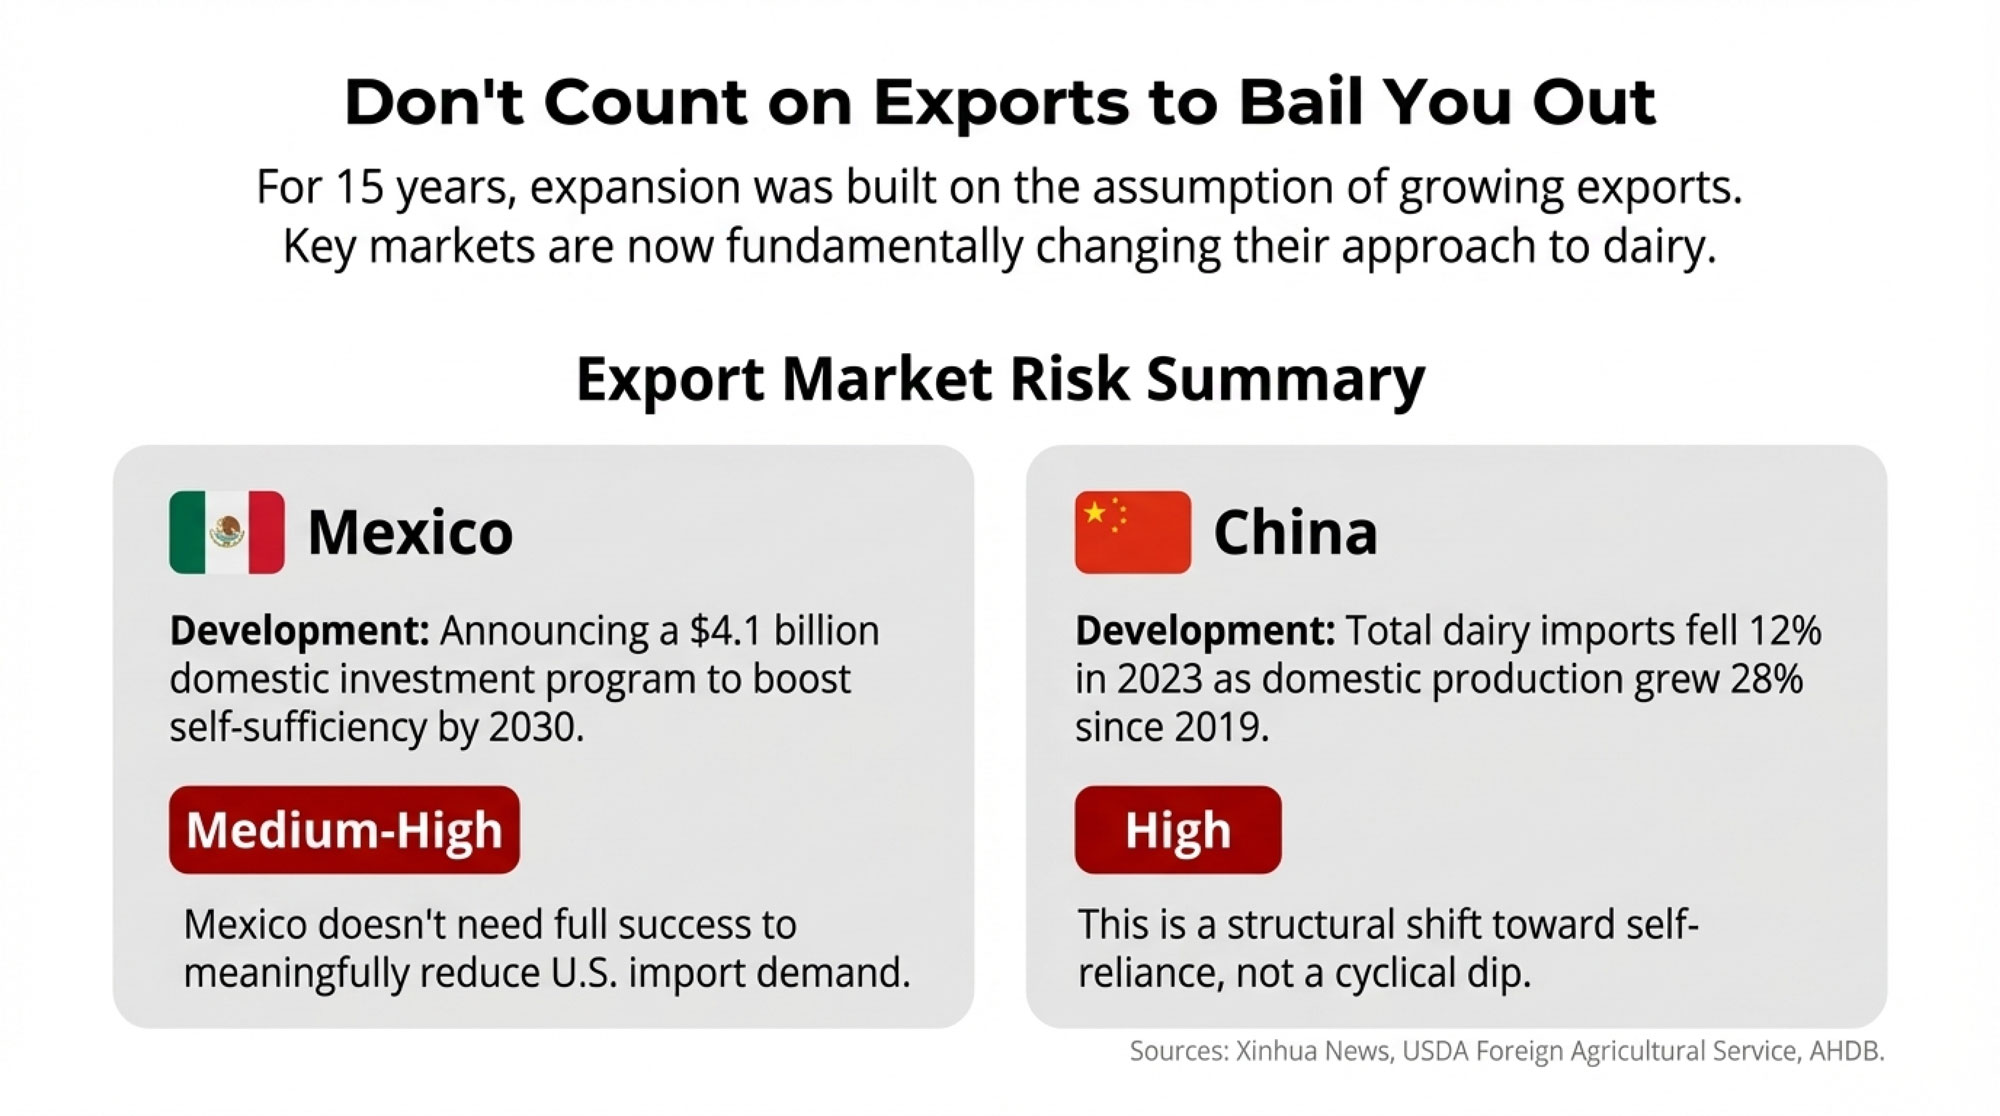
Canada’s Supply Management: Different Rules, Different Outcomes

Whenever the conversation gets tough in U.S. barns, someone inevitably says, “Canada doesn’t seem to be going through this the same way. What are they doing differently?”

Statistics Canada census data shows that Canadian dairy farm numbers have declined while average herd sizes have grown—a pattern similar to the U.S., but from a different starting point and under different rules.

Western Canada tends toward larger freestall herds while Québec maintains many smaller, tie‑stall family dairies.

Canadian dairy operates under supply management: production quotas, farmgate prices set by cost‑of‑production formulas, and import controls that cap foreign dairy entering the market. That framework has helped maintain relatively stable farmgate milk prices and a higher proportion of mid‑sized family dairies than in the U.S.

Could the U.S. copy that model? Realistically, not quickly. The U.S. sector is far larger, heavily involved in export markets, and bound by trade agreements that assume relatively open dairy trade.

The point here isn’t that one country is “right” and the other “wrong.” It’s that the rules you play under matter a lot. Canadian mid‑sized herds operate in a structure designed to support them. U.S. mid‑sized herds operate in a structure that rewards volume, efficiency, and export competitiveness.

The Human Load: When the System Sits on People

Under all these numbers are people—families, hired teams, neighbors.

In 2023 that farmers may face a suicide rate roughly 3.5 times higher than the general U.S. population, citing CDC‑linked occupational mortality data. 

The National Rural Health Association and Senator Chuck Schumer’s office have both cited similar figures based on CDC research. Rural Minds, a nonprofit focused on rural mental health, notes that suicide rates in rural areas climbed significantly faster than in metro areas over the past two decades. 

You see that in real life when a neighbor sells out under pressure or when a family member quietly struggles.

What’s encouraging is that more support is becoming available. Rural Minds maintains directories of confidential mental‑health and stress resources for farm families, and the Farm Aid hotline (1‑800‑FARM‑AID) connects farmers to local financial, legal, and crisis support.

Many states now have dedicated farm stress lines and behavioral‑health programs through their departments of agriculture and extension systems. 

Reaching out for that kind of help is not a sign you “can’t handle it.” It’s part of taking care of yourself and the business in an industry where the pressures are structurally high.

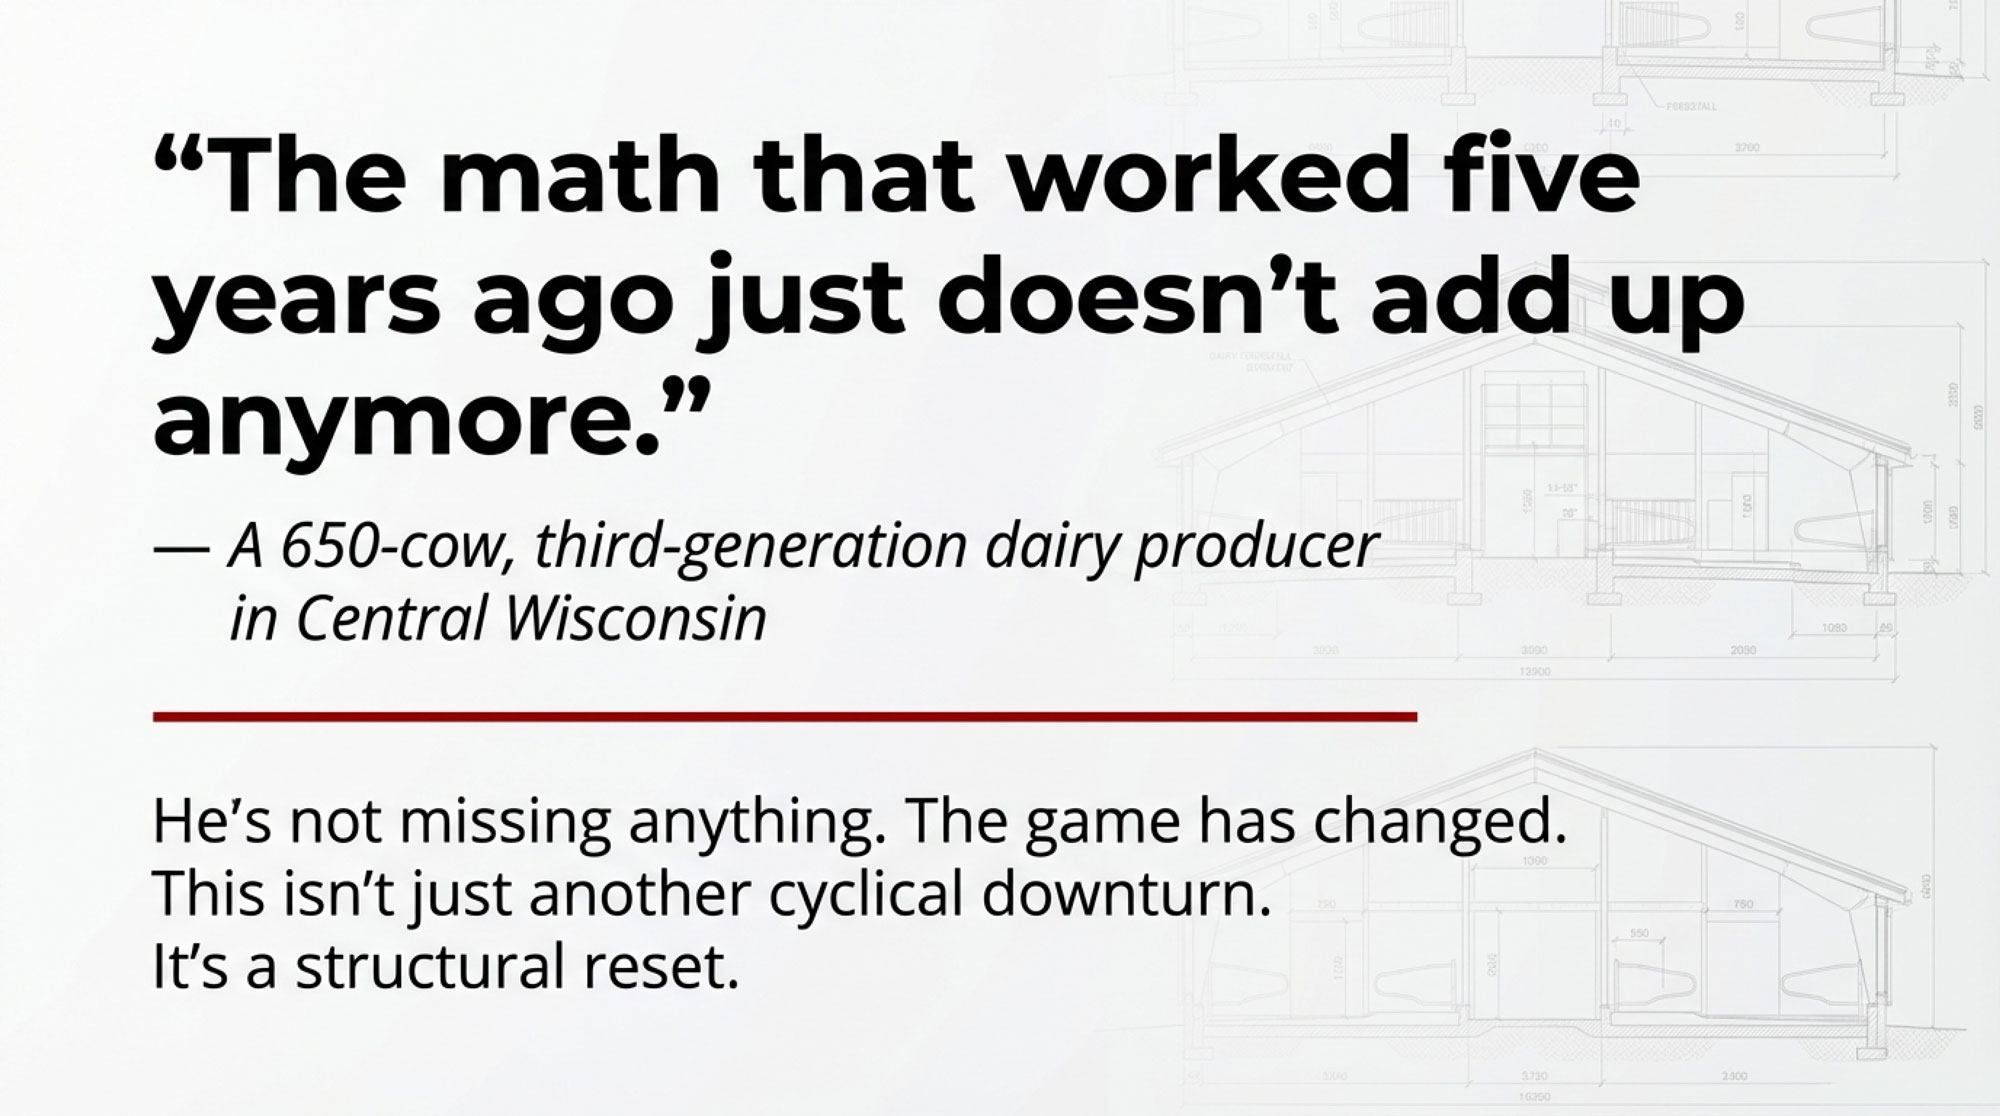
Back at the 320‑Cow Freestall: What Do You Actually Do With This?

Let’s bring this down to the barn level.

Picture a fairly typical operation in central Wisconsin or upstate New York: about 320 cows in a freestall barn, a double‑8 or double‑12 parlor, corn silage and alfalfa on a few hundred acres, butterfat performance around 3.9–4.2% with solid protein test, shipping to a co‑op that’s already changed plant destinations once or twice in the past decade, and one or two younger family members quietly wrestling with whether to come home full‑time.

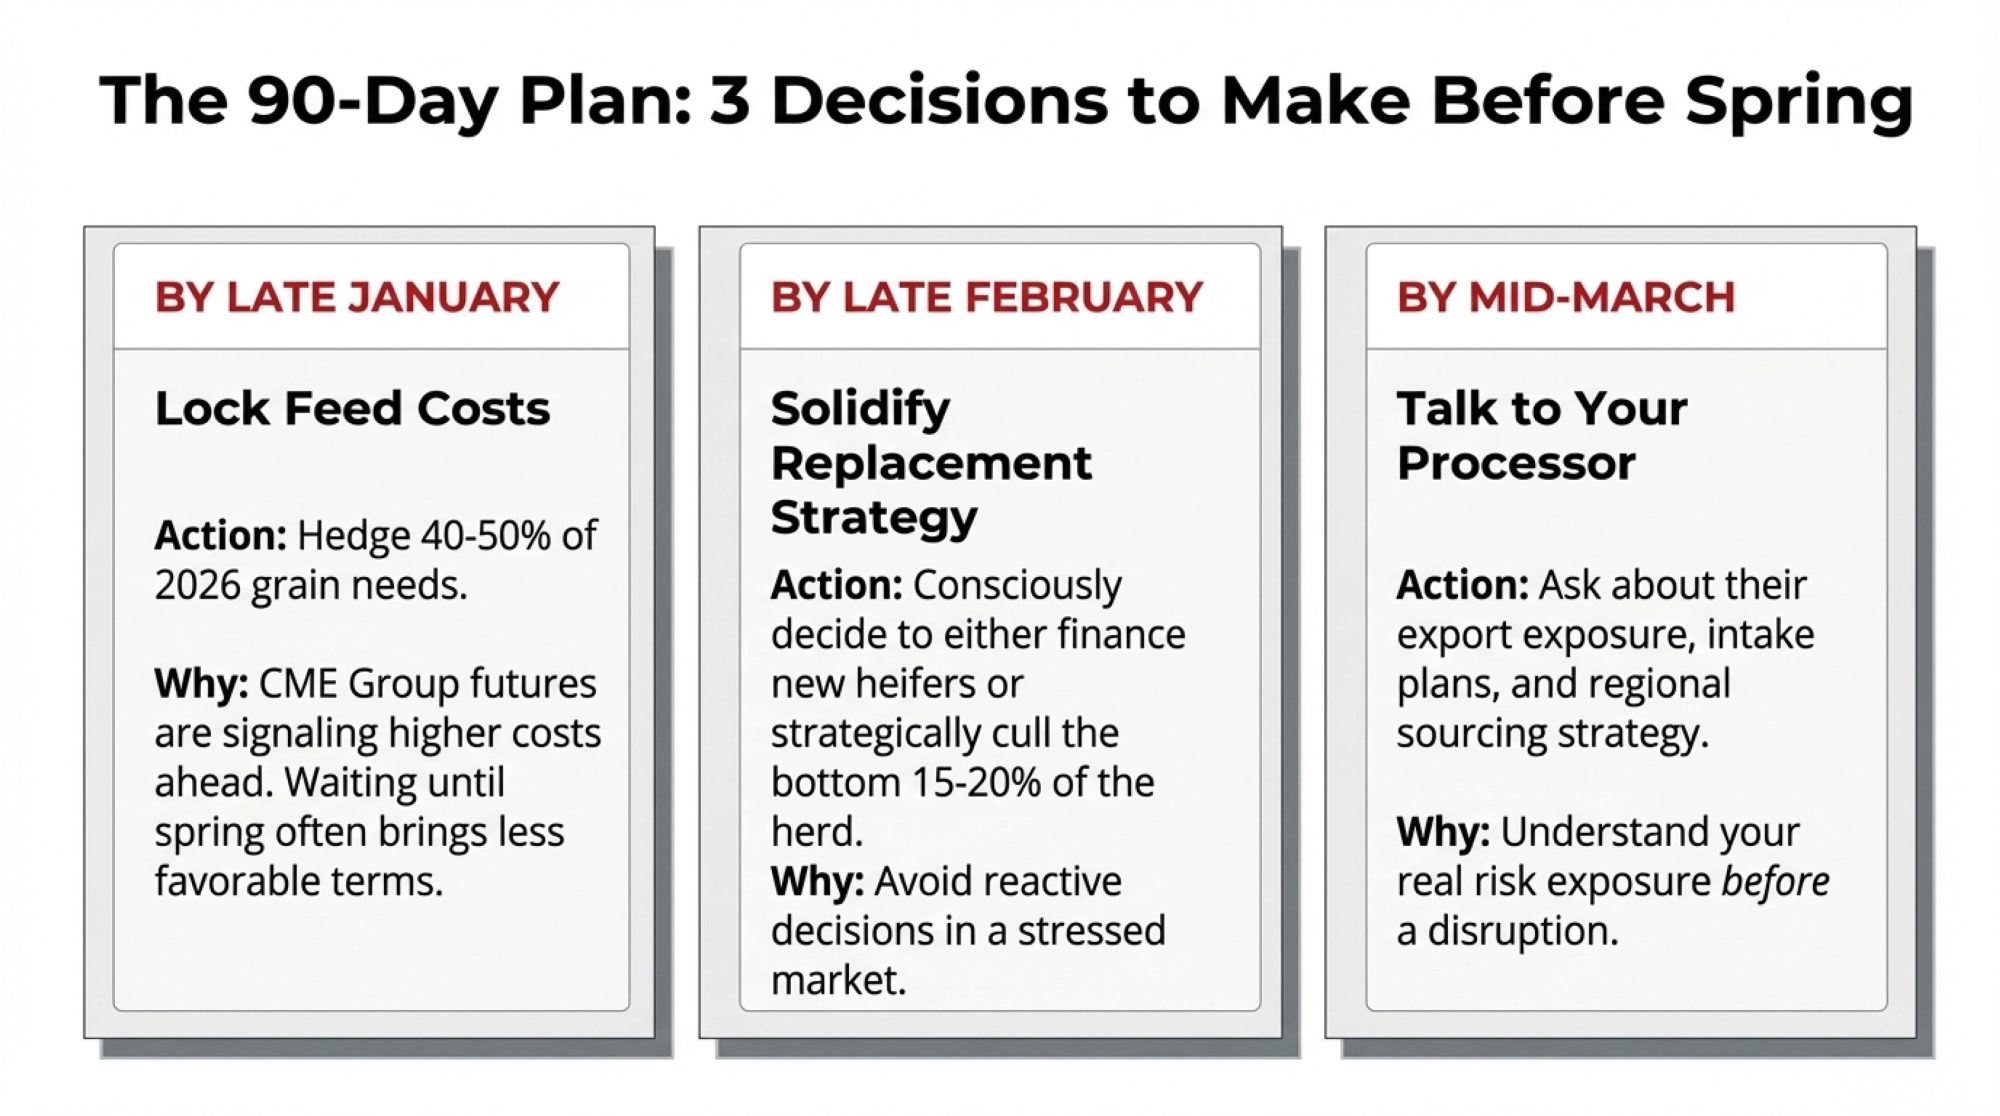
Here are five practical steps that kind of herd—and many like it—can take using the “uncomfortable math” instead of being blindsided by it.

1. Run a real stress test, not just a hope test

Sit down with your lender or advisor and run a few realistic stress scenarios:

  • Milk price in the mid‑teens for 12–18 months.
  • Beef‑on‑dairy calf prices are dropping 30–50% from current highs.
  • A methane‑reduction requirement adding $0.30–0.50 per cow per day without guaranteed long‑term premiums.

On 320 cows, that additive alone could run $35,000–$58,000 per year. If you’ve been selling 80–100 beef‑cross calves at $800 and the market falls back toward $500–600, you could be looking at $16,000–$24,000 less revenue from calves. 

When you spread those costs and revenue hits over your annual milk shipped, it can easily move your effective margin by $0.50–$1.00 per cwt, depending on production.

ScenarioMilk PriceBeef Calf PriceBovaer AdoptionReplacement Heifer ShortageAnnual Margin ImpactMargin/cwt vs. Baseline
Baseline (Normal)$18.50$800NoneNone$52,000+$0.80
Scenario 1: Mild Stress$17.00 (−$1.50)$700 (−$1,100)OptionalNone$38,500+$0.59 (−$0.21)
Scenario 2: Moderate Stress$16.00 (−$2.50)$550 (−$22,500)Mandated ($0.40/day)5 heifers forced to buy @ $3,100$19,200+$0.30 (−$0.50)
Scenario 3: Hard Stress$15.00 (−$3.50)$450 (−$31,500)Mandated ($0.50/day)10 heifers forced to buy @ $3,100−$8,900−$0.14 (−$0.94)
Scenario 4: Structural Crisis$14.50 (−$4.00)$400 (−$36,000)Mandated ($0.50/day)15 heifers forced to buy @ $3,100−$61,500−$0.95 (−$1.75)

Some families will find they’re more resilient than they feared. Others may realize that one hard cycle like that would dramatically change their options.

2. Map your marketing and processing exposure

Just like you map soil types and yield history, sketch out your marketing picture:

  • How many serious buyers exist within a practical hauling radius for your size?
  • Which plants have closed, reduced capacity, or changed ownership within that radius over the past 10–15 years?
  • Where are your co‑op’s and main buyer’s latest big processing investments—locally, or in other states?

If you’re located near multiple growing plants, you’ve got a different risk profile than if you’re in a region with flat or shrinking capacity. 

3. Calibrate beef‑on‑dairy as a tool, not autopilot

The starting point is knowing your true replacement needs. Work with your records, your cull rate, and extension benchmarks to set a realistic target.

Use sexed dairy semen and genomic testing where they actually pay—on the top tier of cows and heifers that will move your components and herd health the right way. Once those replacement slots are safely covered, assign beef semen to the rest.

Over‑raising heifers ties up capital, but under‑producing replacements pushes you into a high‑priced replacement market like the one we’re in now. 

4. Approach sustainability projects like any other major contract

When someone pitches you a sustainability project—Bovaer, a digester, a low‑carbon milk program—try to approach it like you would a custom harvesting contract or a parlor upgrade.

Questions to put on paper:

  • What’s the total cost per cow and per hundredweight, including product, equipment, extra labour, data collection, and verification?
  • How exactly are incentives or premiums calculated, and how long are they guaranteed?
  • Can you talk one‑on‑one with two or three producers already in the program to hear what works and what surprised them? 

5. Make space for the family conversation about “what’s next.”

Most multi‑generation 250–600‑cow farms will eventually have to sit down and talk about who really wants to be on the farm in 5, 10, or 15 years, what level of debt and volatility everyone is willing to live with, and what “winning” means: staying roughly the same size, expanding, diversifying, or planning an orderly exit.

Many farm families are discovering that having a neutral third party—a mediator, succession planner, or extension specialist—at the table helps those conversations stay constructive. fb

I’ve heard from families in Wisconsin and New York who decided that selling a 280‑cow herd while land values were strong and equity was intact was their version of success. They’d run the numbers, talked with their kids, and realized they could leave with their health and their equity—and, for them, that felt like winning. 

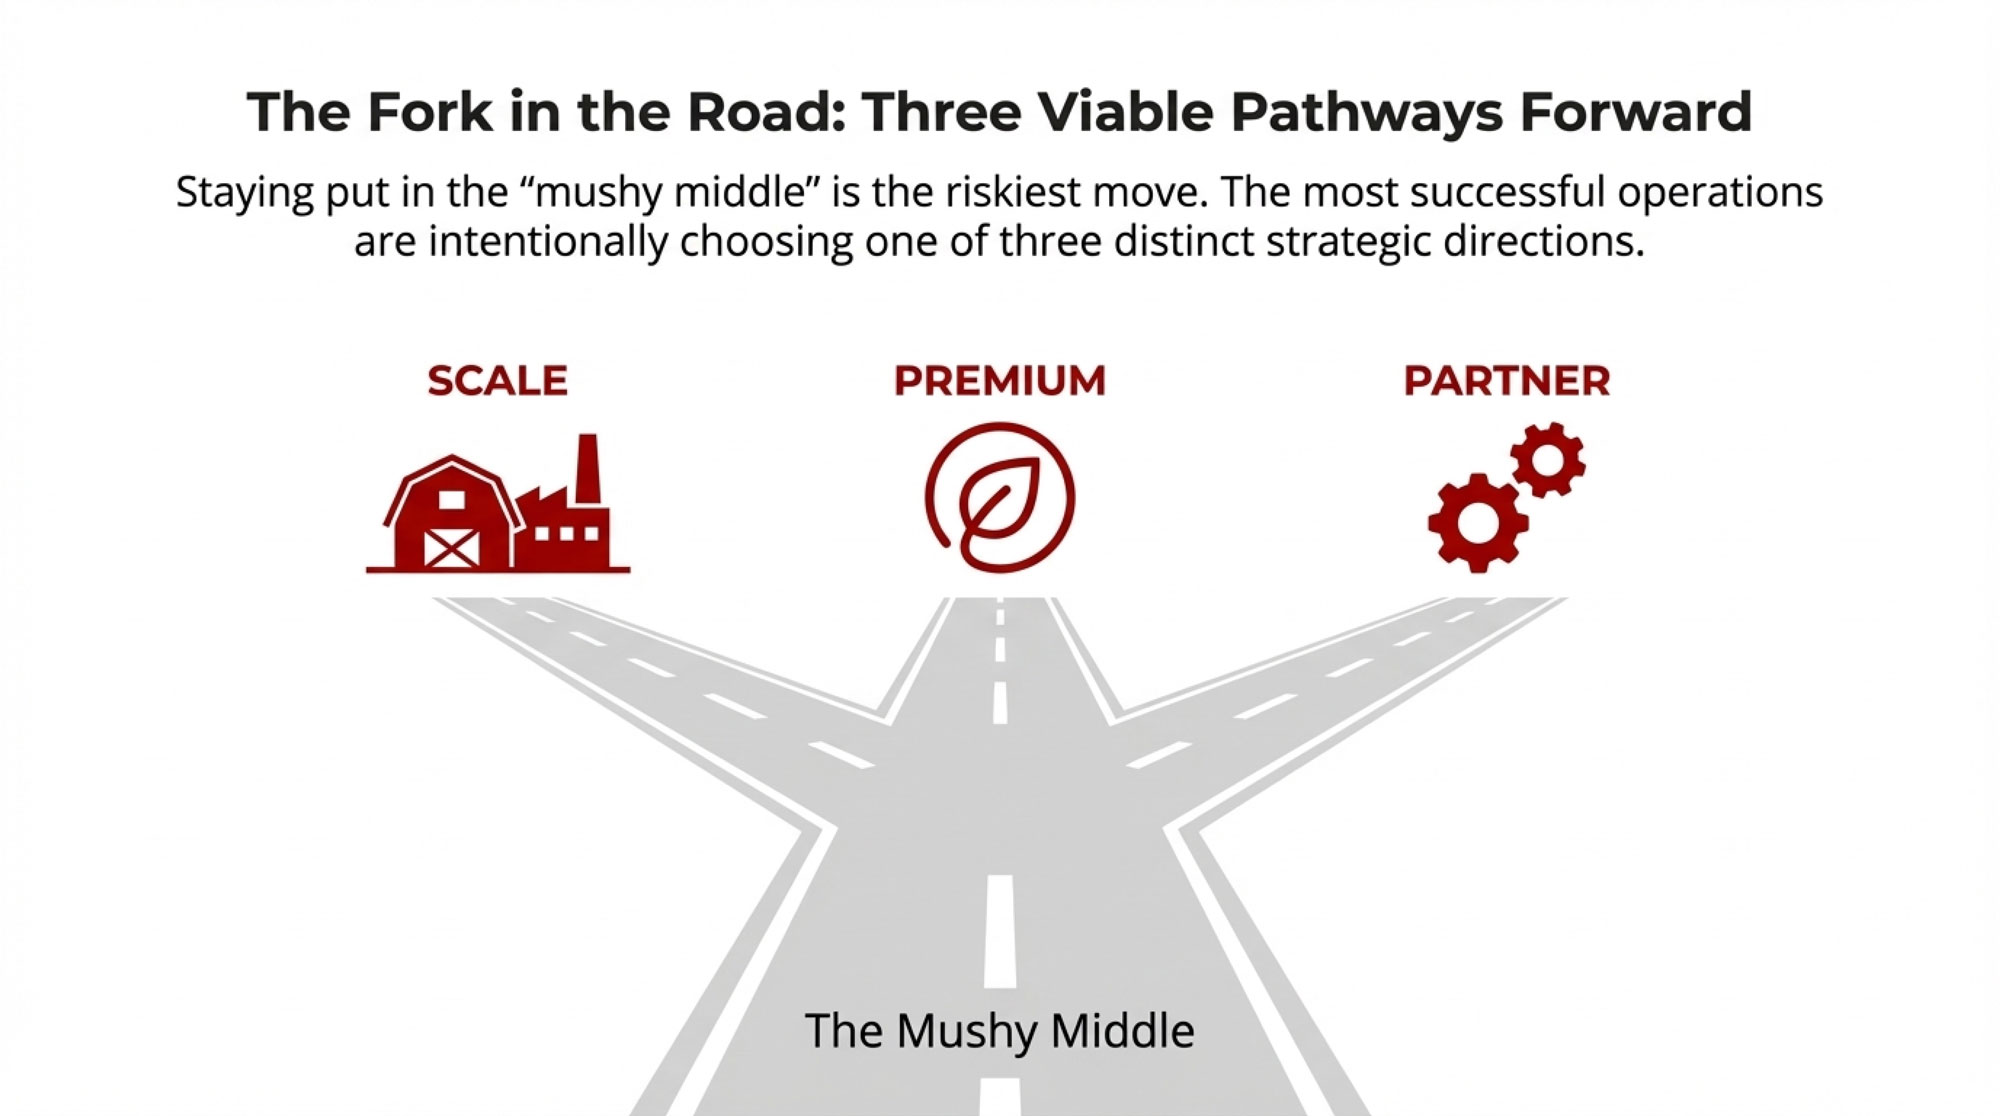
That won’t be the right path for everybody. Some will grow, some will pivot, some will partner, some will exit.

Your Next Three Moves

The math in this piece isn’t meant to scare you into any particular decision. It’s meant to show you the landscape clearly so you can choose your path with your eyes open.

If you take nothing else from this:

  • Run the uncomfortable stress test and write down the results. Not in your head—on paper or in a spreadsheet, with real numbers.
  • Decide whether you’re playing in Lane 1 or Lane 2—and whether that matches your long‑term goal. If there’s a mismatch, that’s the conversation to have next.
  • Make a timeline for a real family conversation, with outside help lined up if you need it. Succession planning isn’t about giving up. It’s about choosing your terms.

Doing nothing is also a decision—it just hands the timing and terms to markets, processors, and lenders.

The uncomfortable math is a planning tool, not a verdict. The decision about whether to stay, grow, partner, or step away while you’re still on your feet—that still belongs to you, your family, your cows, and your land.

KEY TAKEAWAYS 

  • Two lanes, diverging fast: Lane 1 (1,000+ cow herds) is pulling $10-11B in new plants. Lane 2 (mid-sized dairies in WI, NY, PA) lost 1,521 farms in two years while milk output held steady.
  • Heifer trap is set: 20-year-low inventory. 800,000 more head gone by 2027. Bred replacements topping $3,000. Beef-on-dairy without a replacement plan backfires hard.
  • GLP-1 is sorting winners: Users cut grocery spending 5-6%—snacks down 10%, sweets down 11%. Greek yogurt and cottage cheese are gaining popularity. Know where your milk lands.
  • Sustainability has a price tag: Bovaer cuts methane 30% but costs $0.30-0.50/cow/day ($33K-55K/year for 300 cows). Incentives rarely cover it. Negotiate like it’s a major contract.
  • This is structural, not cyclical: Stress-test your margins. Map your processing exposure. Decide if staying, growing, or exiting on your terms is the win.

Complete references and supporting documentation are available upon request by contacting the editorial team at editor@thebullvine.com.

Learn More

Join the Revolution!

Join over 30,000 successful dairy professionals who rely on Bullvine Weekly for their competitive edge. Delivered directly to your inbox each week, our exclusive industry insights help you make smarter decisions while saving precious hours every week. Never miss critical updates on milk production trends, breakthrough technologies, and profit-boosting strategies that top producers are already implementing. Subscribe now to transform your dairy operation’s efficiency and profitability—your future success is just one click away.

NewsSubscribe
First
Last
Consent

$3,010 Heifers, 30% Labor Jumps: The Mid-Size Dairy Survival Crisis

$3,010 heifers. 30% labor jump. A 650-cow Wisconsin dairyman told me: ‘The math that worked five years ago just doesn’t add up anymore.’ He’s right—and here’s the survival playbook for mid-size operations.

EXECUTIVE SUMMARY: The math that worked for mid-size dairies in 2019 doesn’t work anymore—and this isn’t a cyclical downturn waiting to correct itself. Replacement heifers hit $3,010 per head (up 75% since 2023), labor reached $19.52/hour (up 30% since 2020), and rate increases added $840,000 to the lifetime cost of typical barn financing. Operations milking 300-800 cows are stuck in the ‘mushy middle’: too large for family labor, too small for scale economics that make 1,000+ cow herds consistently profitable. Export tailwinds are fading—Mexico’s $4.1 billion domestic dairy investment and China’s 12% import drop signal permanent shifts. Three paths forward remain viable: scaling past 2,000 cows with strong balance sheets, premium positioning through organic or specialty programs, or partnership models sharing infrastructure costs. Operations missing three or more key benchmarks—cost under $17/cwt, labor efficiency of 50-60 cows/FTE, debt-to-asset under 40%—need strategic reassessment now, not later. The producers still hoping 2026 looks like 2019, risk becoming the cautionary tales others reference.

mid-size dairy survival

I had coffee with a producer friend in central Wisconsin a few weeks back. Runs about 650 cows, third generation, solid genetics, consistently good production numbers. He expanded his freestall barn in 2019—good timing, good financing, everything done right by the book.

But something he said stuck with me: “The math that worked five years ago just doesn’t add anymore. And I keep wondering if I’m missing something or if the whole game changed.”

He’s not missing anything. The game really did change.

As we look toward 2026, it’s becoming clear that we’re not simply weathering another cyclical downturn—the kind where you tighten the belt, wait for better prices, and emerge stronger on the back end. Several fundamental pillars of the traditional dairy business model have shifted, and understanding those shifts is essential for making sound decisions over the next few years.

“The math that worked five years ago just doesn’t add up anymore.” — Central Wisconsin dairy producer, 650-cow operation

Why Different Farms Are Having Such Different Experiences

Purdue University’s Ag Economy Barometer from August 2025 found that crop farms showed financial stress rates around 6.5%—nearly triple the rate reported by livestock operations. Sentiment surveys consistently show livestock farmers running more optimistic than their crop and dairy neighbors, sometimes in the very same counties.

Why the gap? Much of it traces back to how capital gets deployed.

Here’s the reality of dairy economics: a substantial majority of assets are tied up in specialized infrastructure—milking parlors, freestall barns, manure handling systems. These are illiquid, depreciating assets. Research from the Wisconsin Center for Dairy Profitability has shown this pattern repeatedly: as capital investment per cow climbs, return on assets tends to compress.

A cattle feeding operation under margin pressure can reduce placements, turn cattle more quickly, and adjust in real time. A dairy operation doesn’t have that flexibility. Once you’ve built infrastructure for 500 cows, you’re milking roughly 500 cows every single day, regardless of where prices sit.

What’s Really Happening with Costs

Good news first: feed costs have moderated meaningfully. USDA’s Agricultural Prices Report showed dairy feed costs at $9.38 per hundredweight this past August—the lowest monthly reading since late 2020. That’s genuine relief after several difficult years.

But here’s what concerns me. In previous downturns, nearly all input costs eventually moderated together. This cycle looks different. Feed came down, but most other major cost categories have reset to what appear to be permanently higher levels.

While feed costs moderated, every other major input permanently reset higher—heifers up 75%, interest rates up 71%, labor up 30%—this isn’t cyclical, and waiting for 2019 margins is a losing strategy

The Cost Reset at a Glance

Cost Category2020 Baseline2025 RealityStrategic Impact
Hired Labor$15.07/hr (USDA April 2020)$19.52/hr (USDA May 2025)Requires ~30% efficiency gain to offset
Interest Rates3.5% (historic lows)5.5-7.0% (commercial)Adds $840K to $1M mortgage over loan life
Replacement Heifers$1,720/head (April 2023)$3,010/head (July 2025)75% increase limits expansion speed
Machinery RepairIndex baseline 2020+41% (BLS 2025)Maintenance costs are permanently higher
Building Costs2021 baseline+25-40% (materials + codes)New construction ROI fundamentally changed

Sources: USDA Farm Labor Surveys (2020, 2025), USDA FSA rate schedules, CoBank Knowledge Exchange, Bureau of Labor Statistics

My Wisconsin friend’s 2019 expansion? Those interest rates look very different now. He locked in around 4%. Anyone evaluating the same project today faces rates pushing 6-7% on commercial loans.

These figures represent national averages. California operations typically face higher labor and regulatory costs. For Canadian operations, supply management creates a different dynamic entirely—quota values shift the strategic calculus in ways that don’t directly translate from U.S. benchmarks.

Labor illustrates this most clearly. The American Farm Bureau Federation’s analysis shows farm labor costs reaching record territory in 2025—USDA’s Economic Research Service projects labor expenses at $53.7 billion nationally. The May 2025 USDA Farm Labor Survey showed that operators paid $19.52 per hour on average, up 30% from $15.07 in April 2020.

Labor costs jumped 30% since 2020, adding $55,600 annually to a typical 500-cow operation—this isn’t reverting, and competing industries keep bidding wages higher

Anyone who’s tried hiring lately knows the challenge firsthand. Competing industries keep bidding up wages, and the workforce available today simply expects more than it did five years ago. That’s not a criticism—it’s market reality.

Interest rates fundamentally changed expansion economics. Analysis from the Daily Dairy Report illustrates the math starkly: on a 30-year mortgage of $1 million, moving from around 3.5% to over 7% increases monthly payments by more than $2,300. Over the loan’s life, that’s nearly $840,000 in additional interest expense.

Equipment and construction costs reset higher as well. Bureau of Labor Statistics data shows farm machinery repair costs spiked 41% since 2020 alone. Ontario operations are navigating new agricultural building codes in 2025 that are estimated to add 15-35% to construction costs.

The Export Landscape: Meaningful Shifts Underway

Export dynamics deserve attention because they’ve underpinned expansion assumptions for the past 15 years.

Mexico launched a significant self-sufficiency initiative. In April 2025, Xinhua News reported that the Mexican government announced a $4.1 billion investment program running through 2030 to increase domestic milk production. The Secretaría de Agricultura y Desarrollo Rural outlined specific projects—new pasteurization and milk drying facilities across multiple states.

Will Mexico achieve these ambitious targets? Honestly, that’s genuinely uncertain. Water scarcity and enormous productivity gaps between regions present challenges. But here’s the insight worth considering: Mexico doesn’t need full success to affect U.S. export volumes. Even partial achievement would meaningfully reduce demand.

China’s import patterns have shifted structurally. Customs data shows total Chinese dairy imports fell 12% to 2.6 million tonnes in 2023. Meanwhile, domestic production reached 41 million tonnes annually—up 28% from 2019according to the USDA Foreign Agricultural Service and AHDB analysis.

Export Market Risk Summary

Export Market2025 DevelopmentRisk Level for U.S. Dairy
Mexico$4.1B domestic investment through 2030Medium-High: Even partial success reduces demand
ChinaImports -12%; domestic production +28% since 2019High: Structural shift, not cyclical
DomesticFluid milk declining; yogurt/cottage cheese growingModerate: Growth can’t absorb 2.5-3% production increases

Beef-on-Dairy: Understanding the Complete Picture

Beef-on-dairy has delivered meaningful revenue for many operations. Day-old beef-cross calves command substantially higher prices than a few years ago, with some operations reporting six-figure annual revenue additions.

But a broader dynamic is developing.

As more operations breed to beef semen, the replacement heifer pipeline has tightened considerably. HighGround Dairy analysis shows heifers expected to calve totaled just 2.5 million head as of January 2025—the lowest since USDA began tracking in 2001. Total dairy heifers weighing 500 pounds or more reached only 3.914 million head, the smallest inventory since 1978, according to USDA data.

CoBank’s Knowledge Exchange division projects 357,490 fewer dairy heifers in 2025 compared to 2024, with an additional 438,844-head decline expected in 2026.

The 75% heifer price surge from $1,720 to $3,010 fundamentally changed expansion economics—this isn’t a cyclical spike, it’s a structural reset that makes traditional growth strategies obsolete for mid-size operations

The market response has been dramatic. USDA Agricultural Prices data tracked by CoBank shows replacement heifer prices moved from $1,720 per head in April 2023 to $3,010 by July 2025—a 75% increase in just over two years. Top dairy heifers at California and Minnesota auctions reached $4,000 per head by mid-2025.

This is a classic collective action situation. Each farm’s individual decision makes sense. But collectively, these decisions created a replacement shortage that’s repricing the entire system.

The “Mushy Middle” Reality Check

The Zisk profitability platform now monitors operations milking over 4.9 million cows—more than half the U.S. herd. Their data confirm that farms with 1,000 or more cows consistently outperform smaller operations in per-cow profitability.

So what does this mean for my Wisconsin friend with 650 cows? That operation is squarely in the danger zone by these metrics.

Half of all mid-size dairy operations fall into vulnerable or crisis zones with costs above $17.50/cwt—the ‘mushy middle’ at $17.50-19.00 faces the worst math: too large for family labor, too small for scale economics

The danger zone for mid-size operations involves several compounding factors:

  • Cost per hundredweight between $17.00-19.00—too high to compete on commodity margins, but without premium positioning
  • Debt-to-asset ratios above 45-50%—limited financial cushion
  • Herd size between 300-800 cows—too large for family labor alone, too small for full scale efficiencies
  • Single processor relationship—limited negotiating leverage
Performance TierCost per CwtCharacteristics
Top QuartileUnder $16.00Sustainable regardless of price cycles
Second Quartile$16.00-17.50Profitable in good years, vulnerable in downturns
Third Quartile$17.50-19.00The “mushy middle”—requires strategic change
Bottom QuartileAbove $19.00Unsustainable without premium pricing

For that 650-cow operation to stay competitive, the math suggests needing to hit at least three of these five benchmarks:

  1. Total cost of production under $17.00/cwt
  2. Labor efficiency in the 50-60 cows per FTE range
  3. Debt-to-asset ratio under 40% before expansion
  4. Milk price premium of at least $0.50-1.00/cwt
  5. Feed cost under $9.50/cwt
The new competitive threshold: mid-size operations need to hit at least three of these five benchmarks—miss three or more, and you’re not waiting out a cycle, you’re sliding toward the cautionary tale category

Miss three or more? That’s the signal that strategic repositioning deserves serious analysis.

Technology favors scale as well. Genomic testing pays outsized dividends for larger operations—making breeding decisions on $50 tests rather than waiting years for daughter proofs accelerates genetic progress while the per-test cost spreads efficiently across larger herds.

I don’t want to overstate this. Many mid-size operations remain profitable. The data simply suggests the “sweet spot” has narrowed.

Strategic Pathways: What’s Actually Working

The Scale Pathway

Operations growing to 2,000+ cows achieve meaningful cost advantages when they have the right foundation: debt-to-asset ratios well under 40% before expansion, substantial liquid reserves, land and nutrient management already permitted, and management depth beyond the founding family.

The Premium Positioning Pathway

Smaller operations are capturing substantial margins through differentiation. Organic programs through cooperatives like Organic Valley pay meaningful premiums. The most successful premium operations layer multiple strategies—specialty genetics, A2A2 certification, organic practices, and on-farm processing.

The Partnership Pathway

I’ve spoken with Upper Midwest producers running separate family operations who share feed mixing systems, manure handling, and collective purchasing. Individually, none could justify certain equipment investments. Split three ways, the economics work. Partnership success hinges on governance—formal LLCs with clear operating agreements, not handshake arrangements.

Looking Forward

When I asked my Wisconsin friend what he’s planning, he said he’s finally running the numbers on all three pathways. That kind of strategic clarity is available to anyone willing to ask difficult questions.

The producers I encounter who seem most comfortable with their choices—whether expanding aggressively, transitioning to premium markets, or planning thoughtful exits—share something in common: they’ve done the analysis and made intentional decisions rather than defaulting to continuation.

The producers still hoping 2026 will look like 2019 may be the ones writing the case studies that future articles reference as cautionary tales.

Key Takeaways

  • Cost structures have reset permanently higher in labor (+30% since 2020), interest rates, equipment, and construction—feed relief alone won’t restore historical margins
  • Export dynamics are evolving as Mexico invests $4.1 billion in domestic capacity, and China’s imports fell 12%
  • The “mushy middle” faces the toughest math—operations with costs between $17-19/cwt need strategic repositioning, not just better prices
  • Replacement heifer prices hit $3,010/head—up 75% since 2023, fundamentally changing expansion and beef-on-dairy calculations
  • Five benchmarks define competitive mid-size operations: cost under $17/cwt, labor efficiency near 50-60 cows/FTE, debt-to-asset under 40%, milk premium capture, and feed cost advantages
  • Multiple strategic pathways remain viable—scale, premium positioning, and partnerships each show success stories
  • Proactive strategic decisions outperform reactive ones—the optimal time for analysis precedes circumstances that narrow available options

Complete references and supporting documentation are available upon request by contacting the editorial team at editor@thebullvine.com.

Learn More

Join the Revolution!

Join over 30,000 successful dairy professionals who rely on Bullvine Weekly for their competitive edge. Delivered directly to your inbox each week, our exclusive industry insights help you make smarter decisions while saving precious hours every week. Never miss critical updates on milk production trends, breakthrough technologies, and profit-boosting strategies that top producers are already implementing. Subscribe now to transform your dairy operation’s efficiency and profitability—your future success is just one click away.

NewsSubscribe
First
Last
Consent

Bred for $3 Butterfat, Selling at $2.50: Inside the 5-Year Gap That’s Reshaping Genetic Strategy

Bred for $3 fat. Paid $2.50. The 5-year genetic timing gap just got real—and the smartest dairies are already adapting.

Executive Summary: October 2024 delivered record U.S. butterfat at 4.30%—genomic selection is doing exactly what it promised. The problem is timing: those genetics were chosen when fat topped $3.00 per pound, and today’s market pays $2.50. This 5-7 year gap between breeding decisions and bulk tank reality is dairy’s toughest planning challenge, made more complex by an April 2025 Net Merit $ revision that increased butterfat emphasis just as prices softened. Factor in heifer inventories at 20-year lows—CoBank projects 800,000 fewer replacements through 2027—and record cheese exports making protein the processing bottleneck, and genetic strategy looks different than it did three years ago. The producers navigating this well are leaning on economic indices rather than chasing premiums, building health traits into their programs, and treating extended productive life as the new margin strategy. The window for assessing your positioning runs through 2026—before current selections fully express into whatever market awaits.

You know what struck me when I was looking at the October milk production numbers? That month delivered the highest butterfat production in U.S. dairy history. We’re talking 1.947 billion pounds at 4.30% concentration—that’s straight from USDA’s November report. By any measure, genomic selection delivered exactly what it promised. The science worked.

But here’s what’s interesting. Those genetics trace back to breeding decisions made in 2021-2022, when butterfat was running north of $3.00 per pound on CME spot markets. Some of you probably remember that October 2022 peak at $3.18. Farmers making aggressive butterfat selections back then were doing exactly what the numbers told them to do. Made perfect sense at the time.

Now those genetics are expressing into a market paying $2.50-2.80 per pound. That’s just how it played out.

And look, this isn’t about second-guessing anyone. It’s about understanding something we all have to work with: genetic cycles run on 5-7-year timelines, while commodity markets… well, you’ve seen how fast those can shift. That timing mismatch creates challenges, no matter how sound the original thinking was.

QUICK TAKE: The Numbers That Matter

  • 4.30% butterfat — October 2024’s record test, up from 4.08% five years ago
  • 0.77 protein-to-fat ratio — Below the 0.82-0.84 optimal range for cheese plants
  • $3,000-$4,000 — Current replacement heifer prices (75% increase since April 2023)
  • 508,808 metric tons — Record U.S. cheese exports in 2024, first time exceeding 1 billion pounds
  • 800,000 head — Projected dairy heifer inventory decline through 2026-2027

Sources: USDA NASS, USDEC, CoBank Knowledge Exchange

What the Numbers Actually Tell Us

Let me walk through the data, because there’s a nuanced story here worth understanding.

U.S. dairy cows hit 4.30% butterfat in October—up from 4.08% just five years back.

That 5.4% increase in concentration doesn’t sound like much until you multiply it across 9.36 million cows producing roughly 226 billion pounds of milk a year. That’s a real shift in what’s going into bulk tanks nationally.

Now, it’s worth noting that October typically shows higher butterfat tests anyway—fall milk tends to run richer than summer production due to temperature effects on cow metabolism and feed intake patterns. But even accounting for seasonal variation, we’re seeing a structural increase that goes beyond normal fluctuation. The trend line has moved.

Protein’s held pretty steady at 3.30%, which brings us to what might be the most telling metric:

The protein-to-fat ratio has dropped to 0.77 — and that matters more than it might seem at first glance.

If you’ve spent any time around cheese operations—and many of you have—you know processors generally like to see that ratio closer to 0.82-0.84 for optimal standardization and yield. Dr. David Barbano over at Cornell has published extensively on this in the Journal of Dairy Science, and his milk standardization work documents these ranges pretty clearly.

When milk comes in heavy on fat relative to protein, plants have to adjust. Dr. John Lucey at the Center for Dairy Research in Madison describes it as “real operational adjustments at the plant level—not unmanageable, but it affects processing economics in ways that eventually work back through the value chain.”

I’ve heard similar things from cooperative procurement managers in the Upper Midwest. One large regional co-op’s field services director told me their standardization costs have increased noticeably over the past two years, which is starting to factor into component premium structure discussions at the board level. The genetic decisions we made five years ago are genuinely showing up in plant economics today. It’s worth being aware of.

The Timing Question—And the Ironic Twist in the 2025 Index Update

The Timing Trap: How Genetic Decisions Lag Market Reality by 5-7 Years

Here’s something I’ve been thinking about a lot lately. Genetic selection success depends heavily on when decisions get made—not just what traits you’re selecting for.

And here’s where it gets really interesting—even our selection tools were caught in this timing paradox.

The April 2025 Net Merit $ revision, documented in USDA-AGIL’s technical report, actually increased emphasis on butterfat and decreased emphasis on protein compared to the 2021 formula. Why? Because NM$ economic weights are based on recent price trends—specifically, the previous three-year average. Butterfat prices from 2021-2024 averaged $2.88 per pound, well above the $2.10 forecast used in the 2021 index. Meanwhile, protein prices averaged only $2.27, below the $2.60 that had been projected.

The Ironic Index Trap: How April 2025’s NM$ Formula Emphasized Butterfat Just as Prices Fell

So the index that’s supposed to help us hedge against market uncertainty was itself responding to high butterfat prices—just as those prices were beginning to soften. The 2025 NM$ formula now places 31.8% relative emphasis on fat and only 13% on protein for Holsteins. There’s a certain irony in that timing.

This doesn’t mean NM$ is broken—far from it. The 2025 and 2021 formulas correlate at 0.992, meaning most animals rank similarly. But it does illustrate how even our best tools reflect backward-looking price data. Nobody’s crystal ball works perfectly.

Consider two groups of producers who approached genomics differently.

The early adopters—those who started genomic testing between 2010 and 2015—were operating in a different world entirely. Back then, reliability scores for production traits in young animals ranged from 41% to 50%. That’s from VanRaden’s foundational work in the Journal of Dairy Science. Better than parent average, sure, but with enough uncertainty that most folks spread their selection emphasis across multiple traits almost by necessity.

I was talking with a producer in southwest Wisconsin not long ago—a third-generation operation running about 650 Holsteins. “We started genomic testing in 2012 and were pretty conservative about it,” he told me. “The reliability numbers just weren’t high enough to justify betting heavy on any single trait. We focused on steady progress across the board.”

That approach, whether he planned it that way or not, positioned his herd well for different market scenarios. Including this one.

The more recent selectors—those making decisions in 2021-2023—faced different conditions. Genomic reliability had improved to 70-78% on young animals according to CDCB documentation. The tools were more precise. And butterfat prices were at historic highs. The economic signals seemed pretty clear.

Dr. Kent Weigel at UW-Madison, who’s done as much genomic selection research as anyone, puts it this way: “When you’re looking at butterfat premiums that high, and you’ve got genomic tools with that kind of reliability, the math seems obvious. The challenge is that nobody can reliably predict commodity prices five to seven years out. The genetics will do what the genetics do. Markets are another matter.”

Both approaches made sense given what people knew at the time. That’s important to acknowledge.

The Breed Diversity Conversation

There’s been more discussion lately about genetic diversity in Holsteins, and it deserves thoughtful consideration. Not alarm, not dismissal—just honest assessment.

The breed has achieved remarkable progress. CDCB’s periodic genetic base adjustments document substantial merit increases. That’s a real achievement, and we shouldn’t lose sight of it.

But that progress has come alongside increasing genetic concentration. Dr. Chad Dechow at Penn State has researched this extensively—his work in the Journal of Dairy Science shows Holstein inbreeding levels around 8% on average now, with young bulls running somewhat higher at 9-10%.

“What we’re seeing is the natural consequence of intense selection on a relatively narrow genetic base,” Dr. Dechow explains. “The bulls ranking highest on TPI and NM$ tend to be related to each other, so when everyone selects from the top of the list, inbreeding accumulates. It’s not a crisis yet, but it’s a trend worth monitoring.”

The Hidden Cost of Genetic Progress: Why Inbreeding Now Costs $23 Per Percentage Point Per Cow

It’s worth noting that we’re not alone in grappling with this. Dairy industries in New Zealand and across the EU have been addressing similar questions about genetic diversity within their own populations. The Dutch, in particular, have invested significantly in maintaining broader genetic bases in their Holstein-Friesian herds, and there’s been interesting research coming out of Wageningen on balancing selection intensity with diversity preservation. Different systems, different approaches—but the underlying challenge is universal when you’re selecting intensely from elite genetics.

The practical effects show up gradually. Published research from several groups—Pryce’s team in 2014 and Smith’s in 2019, both in the Journal of Dairy Science—has documented that each percentage point of inbreeding correlates with roughly 0.2-0.3 additional days in the calving interval. Not dramatic on its own. But it compounds over time, as many of us have seen.

What’s encouraging is that tools now exist to proactively manage this. CDCB publishes Expected Future Inbreeding scores through uscdcb.com that help identify high-merit genetics with less relationship to your existing herd. Several AI organizations have built mating programs around this. These are practical solutions for folks who want to stay ahead of the trend.

What Seems to Be Working

I’ve had a lot of conversations with producers and consultants across the Midwest and Northeast over the past year. Some patterns keep coming up among operations that seem to be navigating current conditions well.

Letting Economic Indices Do the Heavy Lifting

The operations that appear best positioned aren’t chasing whatever component pays best this month. They’re using economic indices—particularly Net Merit $—as their primary guide.

What makes NM$ useful is that USDA updates those economic weights periodically based on current conditions. Yes, those updates lag the market somewhat—as the April 2025 revision illustrates—but over time, the adjustments provide more systematic hedging than trying to guess where prices will be in five years.

A producer I know in Sheboygan County, Wisconsin—400-cow operation—made this shift about three years back. “We used to lean into whatever component was paying well,” he said. “Now we focus on NM$ and let the index handle the economic weighting. Our genetic progress has actually been more consistent.”

You hear variations of this story across different regions. California, Upper Midwest, Northeast—the specifics vary, but the principle holds.

Rethinking Replacement Economics

Here’s something that’s changed the math for a lot of operations—and it ties directly to one of the biggest structural shifts in our industry.

With heifer prices sustained at $3,000-$4,000 across many markets, herd turnover economics look dramatically different than they did five years ago. USDA data shows a 75% increase in heifer prices from April 2023 to mid-2025, moving from $1,720 per head to over $3,000—reaching unprecedented levels.

The driver? The beef-on-dairy trend has fundamentally reshaped our replacement pipeline. According to CoBank’s August 2025 analysis, dairy replacement heifer inventories have fallen to a 20-year low and could shrink by an estimated 800,000 head through 2026-2027 before beginning to recover. The National Association of Animal Breeders tracked the shift: of 9.7 million units of beef semen sold in 2024, 7.9 million went to dairy farmers—up from 5 million of 7.2 million units in 2020.

The Replacement Reckoning: How 800,000 Missing Heifers Reshape Genetic Strategy

The Financial Reality

Any genetic strategy conversation has to acknowledge what most of us are actually dealing with. Dairy farms generally run on tight margins with real debt service obligations. That’s just the reality.

Annual summaries consistently document substantial debt across dairy operations. When milk prices run in that $22-23 per cwt range—roughly where USDA forecasts have pointed for early 2025—margins support current operations but don’t leave much cushion for experiments.

Dr. Weigel acknowledges this: “You have to be realistic about financial constraints. The best genetic strategy doesn’t matter if it creates a cash flow problem. For most operations, the answer is gradual adjustment—incorporating diversity and health traits incrementally while maintaining production genetics that support current obligations.”

What seems to work is matching the strategy to your actual situation:

If you’ve got some balance sheet flexibility: Consider incorporating Expected Future Inbreeding scores in selection. Explore health trait emphasis. Build reserves that give you room to adjust.

If margins are tighter: Focus first on extending herd life to reduce replacement costs. Use economic indices rather than chasing component premiums. Address refinancing conversations while conditions are favorable.

Both approaches make sense—they just align with the circumstances.

(For more on this dynamic, see our previous coverage: “America’s 800,000-Heifer Crisis: How Chasing Beef Premiums Broke Our Replacement Pipeline“)

The calculation that keeps coming up: extending herd average from 2.2 to 2.5 lactations through improved fertility and health genetics can reduce heifer purchases by 10-15%. On a 500-cow operation, that potentially keeps $100,000-$150,000 annually in the business rather than flowing out for replacements.

The genetic tools to support this exist. Productive Life and Livability carry reasonable genomic reliability. The daughter pregnancy rate directly influences how long cows stay productive. It’s a different way of thinking about genetic investment—through cost reduction rather than just chasing more production.

Taking Health Traits Seriously

This is one area where the tools have really improved. Modern genomic evaluations include predictions for health traits that weren’t reliably measurable a decade ago. CDCB documentation shows mastitis resistance predictions now achieving around 40% reliability. Lower than production traits, sure, but meaningful enough for selection purposes.

Research from Canadian dairy genetics programs—including University of Guelph work in the Journal of Dairy Science—has documented that herds emphasizing health traits can achieve substantially lower lifetime antibiotic use alongside improved productive life. The economic benefit often runs $150-200 per cow annually when you factor in reduced vet costs and culling.

Dr. Filippo Miglior at Lactanet Canada sees this as the emerging opportunity: “Health traits are where I think we’ll see the most practical progress over the next decade. The genomic tools have become reliable enough for meaningful selection, and the economic payback is real even when it’s harder to see on individual milk checks.”

That resonates with what I’ve seen on farms.

The Export Picture—And Why Protein Is Becoming the Bottleneck

One more piece worth understanding, because it adds important context to the milk composition discussion.

U.S. cheese exports are on a historic run. According to the U.S. Dairy Export Council, 2024 set a new record at 508,808 metric tons—the first time ever exceeding 1 billion pounds. That’s 17% above the previous record set in 2022. As USDEC president Krysta Harden noted, “U.S. suppliers posted record-high cheese exports, strengthened their presence across Latin America, lifted U.S. dairy export value, and demonstrated their commitment to global markets.”

U.S. suppliers set records in several key markets in 2024, including Mexico, Central America, South America, and the Caribbean. Strong demand continues across Asia, particularly in Southeast Asian markets.

Here’s why this matters for milk composition: cheese production is protein-limited, not fat-limited. When we’re shipping record volumes of cheese overseas—and new processing capacity keeps coming online—protein becomes the bottleneck. Our current high-fat, relatively lower-protein milk actually creates challenges for exporters trying to maximize cheese output.

So while we’ve been genetically optimizing for butterfat premiums, the export market that’s driving so much of our growth needs protein. That’s not to say fat doesn’t matter—it absolutely does, especially for butter exports, which rebounded strongly in 2024 with AMF shipments more than doubling year-over-year according to USDEC data. But it does suggest that balanced milk composition may have more strategic value than we’ve been pricing in.

Dr. Mark Stephenson at UW-Madison, who directs dairy policy analysis, notes that “the export growth reflects genuine U.S. competitiveness on price and quality. Maintaining that position long-term depends partly on genetic resources—having flexibility to produce milk that meets diverse market specifications.”

As we compete globally, our ability to produce milk suited to different end uses becomes a competitive factor. Our genetic flexibility—or lack of it—shapes what market opportunities we can pursue.

Some Questions Worth Asking Yourself

As genetics selected in 2023-2024 move toward full expression in 2026-2028, there’s time to evaluate where you stand.

  • What’s happening with inbreeding in your herd? CDCB provides coefficients at uscdcb.com, and AI organizations often do herd-level analysis. If you’re trending toward 8-9%, it might be worth a conversation with your genetic advisor.
  • How balanced is your selection emphasis? Heavy concentration in any single area creates market exposure. Looking at where you stand across production, health, and fertility gives a useful perspective.
  • What’s your replacement rate telling you? Elevated involuntary culling often signals underlying fertility or health issues that compound over time. Sometimes it’s worth addressing root causes at the genetic level.
  • How dependent is your milk check on specific premiums? Understanding what happens if butterfat premiums compress further helps inform genetic emphasis going forward.

Looking Ahead

  • Timing matters as much as trait selection. That 5-7 year expression cycle means today’s decisions meet future conditions we can’t fully predict. October’s record butterfat illustrates this pretty clearly.
  • Even index formulas chase prices. The April 2025 NM$ update increased butterfat emphasis based on recent high prices—just as those prices were softening. It’s a reminder that all our tools are, to some degree, backward-looking.
  • Economic indices still offer systematic hedging. Despite their limitations, NM$ balances multiple trait values and adjusts as conditions change. Generally beats trying to forecast commodity prices years out on your own.
  • Breed diversity warrants attention. Progress has been remarkable, and tools exist to balance improvement with diversity maintenance. Expected Future Inbreeding scores make this practical.
  • The heifer shortage is real and structural. With replacements at 20-year lows and 800,000 fewer heifers projected through 2026-2027, extending productive life through genetics has never been more valuable.
  • Protein matters more than we’ve been pricing. Record cheese exports mean protein is increasingly the bottleneck. Balanced composition may have strategic value beyond what component premiums currently reflect.
  • Assessment time is now through 2026. Genetics selected will fully express in a few years. Evaluating your positioning while there’s time for adjustments makes sense.

The Bottom Line

Today’s genomic tools are genuinely more capable than anything we’ve had before. What experience keeps teaching us is that effective use requires careful consideration of timing, market uncertainty, and the development of genetic flexibility that works across different conditions. The producers who seem to navigate these cycles best tend to balance ambition with appropriate humility about what any of us can actually predict.

For ongoing coverage of genetic trends, market analysis, and practical strategies, visit www.thebullvine.com.

Resource Note

CDCB offers several free tools at uscdcb.com—Expected Future Inbreeding scores, individual inbreeding coefficients, and genetic evaluations across production, health, and fertility. Your AI rep can help interpret these for your situation. Most organizations can also pull a herd-level inbreeding trend report that shows where you’ve been heading over the past several breeding cycles.

Key Takeaways:

  • Timing beats genetics: The $3 butterfat genetics you selected in 2021-2022 are now producing into a $2.50 market—the 5-7 year cycle creates risk no breeding decision can fully hedge
  • Even the indices lag: April 2025’s Net Merit $ revision increased fat emphasis based on recent high prices—just as those prices softened. All tools look backward.
  • Productive life is the new ROI: Heifer inventories at 20-year lows and 800,000 fewer replacements through 2027 mean extending herd life now pays faster than chasing production gains
  • Protein is the emerging bottleneck: Record 2024 cheese exports—first year over 1 billion pounds—mean processors need balanced composition more than current component premiums suggest
  • Your window is now through 2026: Genetics selected today will fully express by 2028-2030. Assess your herd’s positioning while adjustment time remains.

Complete references and supporting documentation are available upon request by contacting the editorial team at editor@thebullvine.com.

Learn More:

Join the Revolution!

Join over 30,000 successful dairy professionals who rely on Bullvine Weekly for their competitive edge. Delivered directly to your inbox each week, our exclusive industry insights help you make smarter decisions while saving precious hours every week. Never miss critical updates on milk production trends, breakthrough technologies, and profit-boosting strategies that top producers are already implementing. Subscribe now to transform your dairy operation’s efficiency and profitability—your future success is just one click away.

NewsSubscribe
First
Last
Consent

Dairy’s National Average Is a Lie: Texas +50,000 Cows, Washington -21,000 – Your 90-Day Plan

Here’s the thing about national averages—they can hide more than they reveal. While USDA reports 3%+ growth, one state added 50,000 cows and another lost 21,000. Let me walk you through what’s really happening and the decisions that matter most before spring.

Executive Summary: Here’s what the national dairy numbers aren’t telling you: Texas added 50,000 cows last year while Washington lost 21,000—and both get averaged into that 3% growth everyone’s celebrating. Three self-reinforcing factors explain why herds haven’t contracted despite margin pressure: heifer prices above $3,400, making culling uneconomical; beef-on-dairy breeding consuming 25% of the herd’s replacement capacity; and feed costs near multi-year lows. Add $11 billion in new processing capacity coming online through 2028—much of it potentially misaligned with where milk will actually be produced—and you’ve got an industry approaching a meaningful reset. Smart producers have a 90-day window to hedge feed costs, lock in replacement strategies, and have honest conversations with their processors and bankers. The operations that come out ahead won’t just be the best operators—they’ll be the ones who understood their regional trajectory and kept enough flexibility to move when the time came.

2026 Dairy Industry Outlook

You’ve seen the headlines by now. Milk production up. Herd expanding. Cheese exports are hitting records.

Now here’s what those numbers don’t tell you.

There isn’t one U.S. dairy industry anymore. There are at least two, maybe three—and they’re operating under completely different conditions, facing completely different futures. A producer in the Texas Panhandle and a producer in Washington’s Yakima Valley might see similar milk prices on any given month. But you know what? They’re playing entirely different games right now.

I should mention upfront: not everyone sees it this way. I was talking with a consultant last month who made a pretty compelling case that strong export demand signals continued growth across the board. And honestly, the optimists might be right. But the regional divergence I’ve been tracking suggests the headline numbers are masking something we all need to understand.

So let me show you what I mean.

The Great Divide: Where Dairy Is Growing vs. Where It’s Shrinking

That national milk production number everyone’s quoting—up more than 3% in August according to USDA NASS—is really just the average of dramatically different regional stories.

Here’s how it actually breaks down:

RegionWhat’s HappeningThe NumbersWhat’s Driving It
TexasRapid expansion+50,000 cows in 12 monthsProcessing built ahead of herds; lighter regulations
South DakotaStrong growthValley Queen is adding capacity for 25,000 cowsProcessor investment is pulling producers in
IdahoSteady growthContinued herd expansionLand availability; good processing access
WisconsinFlat, consolidatingProduction is barely above flat in 2025Smaller farms exiting; larger ones absorbing neighbors
MinnesotaConsolidatingSteady structural changeSimilar pattern to Wisconsin
CaliforniaDecliningProduction down despite stable herdH5N1 impacts; milk per cow dropping
WashingtonRapid contraction-21,000 cows year-over-year; -8.5% outputEnvironmental compliance costs; EPA involvement
OregonSteady declineContinued farm attritionAir quality regulations; rising costs

Data from USDA NASS September 2025, Dairy Herd Management, Farmers Advance, and IDFA analysis

You see what’s happening here? Texas added enough cows to fill a major cooperative. Washington lost enough to empty one. And we’re calling that a “national trend.”

What’s Fueling the Growth States

I had a chance to tour a newer Texas Panhandle operation last spring, and a few things really stood out to me.

First—and this is important—the processing came before the cows. Cheese plants in Dumas, Amarillo, and Lubbock were already running when producers started expanding. That sequencing matters more than people sometimes realize. You don’t have to wonder where your milk’s going when there’s a plant down the road hungry for supply.

The feed economics work differently out there, too. Land costs and crop prices create structural advantages that are hard to replicate in traditional dairy regions. And while Texas certainly has regulations, the overall compliance burden is measurably lighter than that faced by coastal operations.

South Dakota’s telling a similar story. Dairy Herd Management reports that Valley Queen’s expansion could accommodate roughly 25,000 additional cows over 2025-2026. The processor built the capacity first. The cows are following.

What’s Driving the Contraction

Now, Washington’s situation… that’s tougher to watch.

A producer I know in the Yakima Valley—third-generation, solid operator—told me he’s spending more time with regulators than with his cows some weeks. That’s an exaggeration, but it captures something real about what’s happening out there.

The challenges are stacking up: groundwater nitrate issues have brought EPA involvement to some operations. The Washington State Department of Ecology is proposing regulations that would substantially increase costs. Labor costs run higher than competing regions. And the result, according to Dairy Herd Management, is 21,000 fewer cows in October compared to the prior year.

California’s dealing with its own complexity—H5N1 outbreaks have hit productivity in numerous Central Valley herds, contributing to declining milk per cow even while the overall herd held relatively steady. It’s a different challenge, but the direction is similar.

Producers Who’ve Made the Move

Not everyone’s standing still, though. I’ve talked with a few producers who saw the writing on the wall and made strategic relocations. One Wisconsin family I know sold their 800-cow operation two years ago and partnered with an established South Dakota dairy. They’re now managing a larger string with better margins and—here’s what surprised them—less overall stress despite the bigger numbers. “The regulatory load alone,” the son told me, “freed up 15 hours a week we used to spend on paperwork.”

That’s not the right move for everyone. Plenty of operations have deep roots, family land, and established processor relationships that make staying put the smarter play. But it’s worth noting that some producers actively choose their region rather than just accept the one they inherited.

The Math Is Broken: Why High Costs Didn’t Shrink the Herd

Here’s something that’s been puzzling economists for months now: margins got squeezed, but culling rates stayed low. The national herd actually grew when every historical pattern said it should contract.

What’s going on? Three factors, and they’re all connected.


Metric
202220242025
Replacement Heifer Price ($/head)$2,400$2,900$3,400
Beef-on-Dairy Breeding Rate (%)18%22%25%
Feed Cost ($/cwt)$11.20$10.10$9.38
Cull Rate (%)38%34%31%
Heifer Shortage SeverityModerateElevatedCritical

Replacement Heifers Got Really Expensive

You probably know this already if you’ve been to an auction lately. Current prices from USDA Agricultural Marketing Service reports:

  • Upper Midwest: $3,200-$3,500 per head for quality replacements
  • Premium springers: $4,000+ at some California and Wisconsin auction barns

Mark Stephenson—he’s the director of dairy policy analysis at the University of Wisconsin-Madison—has pointed out that at these prices, payback periods on marginal replacements stretch to nearly 15 years.

I was talking with a 400-cow producer in central Wisconsin who put it pretty simply: “At $3,400 a head, I’m not culling anything that can still put milk in the tank.” And that sentiment seems widespread.

Beef-on-Dairy Changed Everything

This is the part that doesn’t get enough attention, in my view. Council on Dairy Cattle Breeding data shows roughly 25% of the dairy herd is now bred to beef genetics. Those crosses are generating $400-$600 premiums—sometimes more—for quality blacks with good conformation.

But here’s the catch, and it’s a big one: every beef-cross calf is a dairy heifer that doesn’t exist.

The heifer shortage isn’t temporary. It’s structural. And it’s self-reinforcing.

Feed Costs Hit Multi-Year Lows

The USDA Dairy Margin Coverage program calculated feed costs at $9.38 per cwt for August 2025. The Center for Dairy Excellence confirmed that figure—down nearly 50 cents from July. That’s among the lowest readings we’ve seen in years.

When feed is cheap, even that older cow in the back pen—the one you’d normally have shipped by now—can still contribute to cash flow. The economic pressure to cull just isn’t there.

And here’s the trap: These factors reinforce each other. Expensive heifers mean you keep old cows. Keeping old cows means you don’t need expensive heifers. Beef-on-dairy means fewer heifers get born anyway. And cheap feed makes all of it pencil out.

For now, anyway.

Feed Cost Outlook: Why Many Advisors Are Saying Hedge Now

Here’s what’s interesting about the forward markets. CME Group data shows that December 2026 corn futures are trading above current spot prices. The market’s signaling higher costs ahead.

TimeframeWhat Corn’s Telling UsWhat It Means for Feed Costs
Right nowFavorable pricing$9.38/cwt (August DMC calculation)
Dec 2026 futuresHigher than spotCould push toward $11.00+/cwt
Normal price swing+$0.50-$0.75/bushelAdds $1.50-$2.00/cwt to your feed line

Now, futures markets have been wrong before—I want to be honest about that. But the signal’s worth noting.

The window to lock in favorable feed pricing may be closing. I’ll get into specific timing in the action steps below.

PeriodFeed Cost ($/cwt)Futures Signal
Aug 2025$9.38Spot (Favorable)
Nov 2025$9.50Favorable
Mar 2026$10.20Rising
Jun 2026$10.80Elevated
Sep 2026$11.20High
Dec 2026$11.40High

The Processing Puzzle: $11 Billion in New Capacity—But Is It in the Right Places?

IDFA confirmed during Manufacturing Month that more than $11 billion in new dairy processing capacity is coming online through 2028 across 19 states. That’s cheese plants, butter facilities, powder operations, and fluid processing. It’s a massive investment that reflects real confidence in American dairy’s future.

But here’s the question worth asking: Is it being built where the milk will be?

The Mismatch Worth Watching:

RegionProcessing InvestmentMilk Supply TrendWhat to Watch
WisconsinMajor expansions underwayEssentially flat productionWhere does the milk come from?
Pacific NorthwestDarigold’s $1 billion Pasco plant (8M lbs/day)Contracting 8.5% annuallyReal supply/capacity tension
Texas/South DakotaMatched to growthExpanding steadilyBetter alignment

I don’t have a definitive answer on how Darigold plans to fill a billion-dollar facility when regional supply is declining nearly 9% annually. Their leadership clearly sees a path forward that I may not fully appreciate—and they know their market far better than I do.

But facilities built expecting 90%+ utilization that end up running at 70-75%… that financial stress eventually flows somewhere. Often, back to producers through milk payment adjustments or cooperative equity calls. It’s something to be aware of.

The Silent Partner: Why Your Banker Decides Who Survives 2026

Here’s something that rarely makes industry headlines but may matter as much as milk price or feed cost.

When margins compress—and they will at some point; they always do—the question isn’t just “Can my farm cash flow at $14 milk?” It’s “Will my lender give me time to get back to $17?”

That’s not purely an economic question. That’s a relationship question. And it might quietly decide who’s still farming in 2028.

Two producers with nearly identical cost structures can face completely different outcomes:

Producer AProducer B
Modest leverageAggressive expansion of debt from low-interest years
Six months of working capitalThin operating lines
Lender who’s been through dairy cyclesLender with stressed ag portfolio
Gets patience when neededGets pressure instead

A farm financial consultant I was talking with in Minnesota made this point effectively: the best-positioned producers right now aren’t just focused on cost per cwt. They’re using this window—while milk checks are decent and lines aren’t maxed—to:

  • Clean up any covenant issues
  • Term out short-term debt into longer amortizations
  • Build transparent, data-driven relationships with their lenders

The operations that emerge as consolidators on the other side of any transition won’t necessarily be the best operators. They’ll often be the ones whose banks stayed in the game.

The Biosecurity Wildcard: H5N1

I’d be remiss not to mention what’s been on everyone’s mind this year.

USDA APHIS has confirmed Highly Pathogenic Avian Influenza outbreaks in dairy cattle across multiple states, including Kansas, Idaho, Texas, Iowa, and others. The virus can move between herds, particularly through cattle movements and the use of shared equipment.

The current picture: Economic damage has been contained and localized so far. Some affected dairies experience temporary production drops during transition periods and during the fresh-cow phase. Export partners are watching but haven’t acted dramatically.

The risk: If regulators move from “monitor and manage” to “contain and control,” the orderly consolidation we’ve been discussing could become something more disruptive.

What to do now: The basics matter more than ever. Review boot and clothing protocols. Tighten visitor policies. Isolate new animals before introducing them to the string. Be thoughtful about shared equipment between operations.

None of this is new advice for anyone who’s been around dairy cattle. But the stakes for following it have increased.

The Sustainability Angle: $0.75-$1.50/cwt in Potential Premiums

Let’s skip the greenwashing debate and talk about what actually matters here: money.

Global food companies—Nestlé, Danone, and PepsiCo—have legally binding 2030 emission targets they must meet. Multiple pilot programs are already paying producers premiums for:

  • Verified methane reductions
  • Documented feed efficiency improvements
  • Low-carbon-intensity milk tagged to specific supply chains

The math that actually matters:

A “preferred” supplier with documented feed conversion efficiency, verified practices, and tight nutrient management could capture $0.75-$1.50/cwt in stacked value—base premiums, carbon credits, sustainability bonuses, and preferential contract access.

What’s encouraging is that a well-managed 1,500-cow Wisconsin or New York operation with strong sustainability credentials could compete with a 3,000-cow commodity operation. The premium contracts change the math.

Scale isn’t the only path forward. For producers looking for differentiation that doesn’t require doubling herd size, this is worth exploring.

The 90-Day Plan: What to Do Before Spring

Given everything we’ve walked through, what should you actually be doing between now and late March? Let me get specific.

By Late January: Consider Locking Feed Costs

  • Target: Hedge around 40-50% of your projected 2026 grain needs
  • Why now: December 2026 corn futures are already pricing above spot; winter weather and planting signals will move markets further
  • Risk of waiting: March and April often bring less favorable terms

Worth talking through with your nutritionist and financial advisor.

By Late February: Make Your Replacement Decision

If you’ve got capital flexibility:

  • Establish financing now
  • Identify heifer suppliers
  • Be positioned to move fast if prices soften mid-2026

If you’re focused on efficiency:

  • Identify the bottom 15-20% of your string
  • Target chronic health cases and poor reproduction performers
  • Consider strategic culling Q1-Q2 while beef prices remain favorable

The key: Make a conscious choice. Operations that drift into mid-2026 without a strategy end up reacting rather than acting. And reactive decisions during stressed markets rarely work out as well.

By Mid-March: Have the Processor Conversation

Four Questions Worth Asking:

  1. What percentage of our facility’s intake goes to export markets? Which destinations?
  2. What’s our Mexico concentration—and how might USMCA review affect intake decisions?
  3. If you needed to reduce intake by 15-20%, what would the notification timeline be?
  4. If regional supply keeps changing, how does that affect sourcing and our cost structure?

These conversations are easier to have now than during a disruption. The answers tell you a lot about your actual risk exposure.


Deadline
Critical ActionWhy NowRisk of Delay
Late JanuaryHedge 40-50% of 2026 grain needsDec 2026 futures above spotHigher feed costs locked in
Late FebruaryLock replacement strategy (buy or cull)Heifer prices still elevatedForced culling decisions
Mid-MarchProcessor/banker conversationsBuild relationships pre-crisisReactive instead of proactive
April (Post-Action)Monitor and adjustFlexibility to pivotLost opportunities

What 2028-2029 Might Look Like

If current trends hold—and that’s always a meaningful “if”—here’s what seems to be taking shape:

Fewer, larger operations. U.S. dairy farms dropped from over 40,000 to under 25,000 over the past couple of decades. Generational transitions without clear successors continue to accelerate this. It’s not inherently good or bad—it’s just the reality we’re working with.

Geographic shifts. Texas, South Dakota, and Idaho are capturing share. The Pacific Northwest faces headwinds. California likely remains the largest state, but its market share is declining.

Two distinct tracks are emerging. This is the part I find most interesting. The industry’s splitting into large-scale commodity operations—think 2,500+ cows competing primarily on cost efficiency, often in lower-regulation states with favorable feed economics—and premium/specialty production commanding meaningful price premiums through organic certification, grass-fed programs, A2/A2 genetics, or verified sustainability credentials.


Production Model
Typical Herd SizeMilk Price Range ($/cwt)Primary StrategyRisk Level
Large Commodity2,500+$16-18Cost efficiencyCommodity exposed
Mid-Size Conventional800-1,500$17-19Scale up or exitHigh vulnerability
Organic Certified400-900$26-28Premium captureProtected
Grass-Fed/Verified300-800$23-26Direct relationshipsModerate
A2/Specialty200-600$22-25Niche differentiationModerate

I know a 900-cow organic operation in Vermont that’s pulling $26-28/cwt consistently while their conventional neighbors struggle at $18. Different game entirely. And a grass-fed producer in Missouri who’s built direct relationships with regional grocery chains that insulate him almost completely from commodity price swings.

Both tracks can work. The challenge is being clear about which game you’re playing—and not getting stuck in the undifferentiated middle where you’re too small for cost leadership but not specialized enough for premium markets.

This isn’t a story of decline. Dairy demand remains solid. Exports keep expanding. Well-run operations build real wealth.

But it is a story of restructuring. And the producers who navigate it successfully will be those who understand the forces at play, make deliberate choices, and maintain enough flexibility to adapt.

Resources Worth Bookmarking

If you want to track the indicators we’ve discussed, a few sources are worth checking monthly—it takes maybe 20 minutes:

  • USDA NASS Milk Production Reports — released around the 20th
  • CME Group Dairy Futures — corn, soybean meal, Class III/IV signals
  • CoBank Quarterly Rural Economy Reports — solid dairy analysis, heifer market outlook
  • USDA APHIS H5N1 Updates — current outbreak status

The planning window’s open. What you do with it is up to you.

We’ll be watching these developments and keeping you informed as things unfold.

KEY TAKEAWAYS

  • The national average is hiding two industries: Texas +50,000 cows, Washington -21,000—both called “3% growth”
  • Three factors broke the old economics: $3,400+ heifers, beef-on-dairy taking 25% of replacements, and feed costs at multi-year lows
  • $11B in new processing capacity may be misaligned: Plants expanding where milk supply is flat or declining
  • Your 90-day action window: Hedge 40-50% of feed (January) → Lock replacement strategy (February) → Processor/banker conversations (March)
  • Your lender decides who survives: The winners won’t just be the best operators—they’ll be the ones whose banks stayed in the game

Complete references and supporting documentation are available upon request by contacting the editorial team at editor@thebullvine.com.

Learn More:

  • Feed Smart: Cutting Costs Without Compromising Cows in 2025 – Provides a tactical playbook for the “feed cost hedging” strategy mentioned in your 90-day plan. Learn specific methods for forward contracting corn below $4.60 and optimizing forage digestibility to protect margins against the potential spring rally.
  • The Wall of Milk: Making Sense of 2025’s Global Dairy Crunch – Expands on the “24-month trap” and global supply factors currently capping milk prices. This strategic analysis explains why the U.S., EU, and New Zealand expanding simultaneously creates the specific market ceiling your banker is watching closely.
  • Generate $15,000+ Annual Carbon Revenue: The Dairy Producer’s Guide – Delivers the implementation roadmap for the “sustainability premiums” opportunity. Discover how to stack Section 45Z tax credits with feed additives and carbon markets to generate new revenue streams without increasing herd size.

Join the Revolution!

Join over 30,000 successful dairy professionals who rely on Bullvine Weekly for their competitive edge. Delivered directly to your inbox each week, our exclusive industry insights help you make smarter decisions while saving precious hours every week. Never miss critical updates on milk production trends, breakthrough technologies, and profit-boosting strategies that top producers are already implementing. Subscribe now to transform your dairy operation’s efficiency and profitability—your future success is just one click away.

NewsSubscribe
First
Last
Consent

The Hidden Cost of Every $1,200 Beef Calf: A $4,000 Heifer Bill

The 60-day pregnancy check is becoming the most terrifying day on the dairy calendar.

EXECUTIVE SUMMARY: You’ve been breeding 35% to beef, banking $1,200 per calf while dairy bulls bring just $200—the math seemed obvious until June’s pregnancy check reveals you’re 150 heifers short. With dairy heifer inventory at its lowest since 1978 and replacements costing ,000 each, this “profitable” strategy has just created a 0,000 problem that will take two years to fix. The culprit: not tracking what percentage of pregnancies are dairy versus beef, the single metric that predicts replacement availability 18 months out. Successful operations monitor this number weekly—when it drops below 45%, they immediately increase sexed dairy semen usage, trading $520 in monthly semen costs to avoid a six-figure crisis. The entire monitoring system takes 30 minutes weekly, yet most producers don’t discover the problem until it’s biologically impossible to fix. The difference between thriving and crisis isn’t luck—it’s whether you’re tracking one number that takes five minutes to calculate.

beef on dairy strategy

You look at the ultrasound monitor as the technician calls out the results. Bull. Bull. Bull. Heifer. Bull. Your stomach drops. You’ve been breeding 35% to beef, following the plan you set in January. The math was perfect on paper—$1,200 beef calves versus $200 dairy bulls. But now you’re staring at a 120-heifer shortage for next year, and replacement heifers are selling for $3,500 to $4,000 each.

How did this happen? You followed your breeding plan to the letter.

Here’s what’s interesting—the answer lies in a calculation that deserves more attention: the forward-looking replacement inventory formula. The beef-on-dairy movement has certainly delivered valuable calf revenue when we’ve needed it most. Lord knows, those $1,200 beef calves have kept many of us afloat. At the same time, it’s creating what CoBank economists describe as a significant structural adjustment period for operations whose monitoring systems haven’t evolved alongside their breeding strategies.

The New Economics Reshaping Dairy Breeding

You know, the numbers tell a compelling story about where we are as an industry. The National Association of Animal Breeders reports that beef semen sales to dairy operations climbed from 2.5 million units in 2017 to 7.9 million units in 2024—a 216% increase that reflects fundamental changes in how we think about calf value.

Day-old beef-cross calves now command $1,000 to $1,400. Dairy bull calves? You’re lucky to get $100 to $200, and that’s if you can find a buyer. For a 1,000-cow operation breeding 35% to beef, that’s approximately $210,000 to $245,000 in additional annual calf revenue. That’s real money when you’re dealing with volatile milk prices and input costs that just won’t quit.

But here’s what’s particularly concerning—and what many of us are just starting to realize. The Holstein Association has documented that each percentage-point shift toward beef breeding removes approximately 95,000 dairy heifers from the national pipeline each year. The USDA’s January cattle inventory report reveals our dairy heifer inventory has declined to 3.914 million head. That’s a level we haven’t seen since 1978, when we were milking very different cows in very different systems.

CoBank’s dairy quarterly analysis from August makes this clear: we’re facing an 800,000-head decline in dairy heifer inventory before any meaningful recovery begins in 2027. This replacement shortage is becoming increasingly apparent to anyone who’s tried to buy heifers lately. They’re simply not available—at any price in some regions.

What’s worth noting is how this plays out differently across borders. Canadian producers navigating supply management face unique constraints when beef revenue opportunities conflict with quota requirements. European operations are balancing beef-on-dairy opportunities with stricter environmental regulations and different subsidy structures. Australian and New Zealand producers, with their seasonal calving systems, face entirely different timing pressures. But the fundamental challenge—balancing today’s revenue with tomorrow’s replacements—that’s universal.

The Critical Calculation Most Operations Miss

Let me share something that I’ve found most operations overlook:

The Forward Replacement Inventory Formula:

Herd Size × (Age at First Calving ÷ 24) × Cull Rate × (1 + Heifer Non-Completion Rate) = Annual Replacements Needed

ScenarioDairy Pregnancies %Annual Heifer ShortageReplacement CostCrisis Total
Unmonitored Herd (No Weekly Tracking)35%-150$3,500-$4,000$525,000-$600,000
Target Range (Disciplined Monitoring)45-55%On targetN/A$0 (Averted)
Early Warning (April Detection)42-45%-50$3,500-$4,000$175,000-$200,000
Sexed Semen Response50%+ recovery-25$520/month semen$6,240
annual
Late Detection (June Preg Check)35%-120+$3,800-$4,200$456,000-$504,000

Based on conversations with producers across the country—and I talk to a lot of them—most operations make at least one of three common miscalculations that can really bite you later:

First, we tend to be optimistic about heifer completion rates. Many of us plan with the assumption that 90-95% of heifer calves will eventually enter the milking herd. But research from folks at Elanco, based on extensive herd monitoring, shows actual rates are 75-80% on well-managed operations. That 15-20 point gap? It compounds annually, and suddenly you’re wondering where your heifers went.

Second: Age at first calving matters more than we think. Penn State Extension research shows that each month beyond 24 months increases replacement needs by approximately 4%. Push from 24 to 26 months—maybe because your heifer grower had a tough winter or you had some respiratory issues—and a 1,000-cow operation needs 33 additional heifers annually just to maintain herd size.

Third: And this is the one that really catches people—not tracking dairy versus beef pregnancy percentages. Research from UW-Madison identifies this as a critical predictive metric for future replacement availability. You probably know your overall pregnancy rate, but do you know what percentage of those pregnancies are dairy versus beef?

When Reality Hits: The 60-Day Moment of Truth

Here’s how it typically unfolds. You set your breeding plan in January, usually over coffee at the kitchen table or during that annual meeting with your nutritionist and vet. Execute it faithfully through spring. Everything looks fine on paper. Then June arrives with 60-day pregnancy checks and fetal sexing capability.

The ultrasound technician begins: “Heifer, bull, bull, bull, heifer, bull…”

Your expression changes as you realize the sex ratio isn’t what you expected. And here’s the kicker—five months of breeding decisions are now locked into 280-day gestations. A shortage of 120 to 150 replacement heifers is mathematically inevitable. You can’t unbred those cows.

What happens next? Well, I’ve watched this play out too many times:

  • July: You’re calling every heifer dealer in 200 miles
  • August: Prices climb from $3,000 to $3,600 per head
  • September-October: Crisis pricing hits—$3,800 to $4,200
  • November: You either write massive checks or keep those arthritic fifth-lactation cows another year

The Weekly Metric That Changes Everything

What successful operations are doing differently—and this really surprised me when I first learned about it—is monitoring dairy pregnancies as a percentage of total pregnancies weekly. Not monthly. Not quarterly. Weekly.

Your Decision Tree:

  • Dairy % between 45-55%: ✓ Continue current strategy
  • Dairy % at 42-45%: ⚠ CAUTION – Monitor closely next week
  • Dairy % below 42% or declining 3 weeks straight: 🔴 ACTION – Adjust immediately

This 5-minute habit can save you six figures. Think about that for a second. Identifying trends in April or May allows correction before June’s breedings lock in. Waiting for a 60-day pregnancy confirmation means the opportunity has passed. The biology is already set.

The Sexed Semen Solution That Surprises Producers

When dairy pregnancy percentages decline, here’s what seems counterintuitive: increase sexed semen usage despite lower conception rates. But look at the math:

Semen TypeConception RateFemale %Result per 100 Breedings
Conventional40%50%20 female calves
Sexed33%90%30 female calves

Despite an 18% conception penalty, sexed semen generates 50% more females. The cost difference? About $520 monthly in additional semen cost versus $3,500-4,000 per replacement heifer. That’s a no-brainer when you run the numbers.

The 30-Minute Weekly System That Works

Here’s what you need—and you probably already have most of it:

  • Your existing herd management software
  • A basic spreadsheet (or, honestly, even a notebook works)
  • 30 minutes weekly

Track five simple data points:

  1. Week number
  2. Total pregnancies confirmed
  3. Dairy pregnancies
  4. Beef pregnancies
  5. Dairy percentage (calculated)

Veterinarians I work with report that producers have avoided $400,000 replacement crises with nothing more than disciplined weekly monitoring. That’s it. Thirty minutes that could save you from financial disaster.

What Successful Producers Do Differently

They adjust breeding strategies based on real-time data rather than annual projections. When dairy pregnancy percentages drift, they respond within weeks, not quarters. No committee meetings, no analysis paralysis—just adjustments based on data.

They monitor conception rates by semen type. One California producer who asked not to be named noticed a problem when dairy conception was running at 38% while beef was at 44%. Overall, it looked fine at 41%, but the divergence signaled specific dairy bull fertility issues that needed to be addressed immediately.

They plan realistic completion rates. A Pennsylvania producer shared this experience: “We assumed 90% of heifer calves would reach the milking parlor. Reality was 76%. That 14% gap over three years? 180-heifer shortage.” That’s a lesson learned the hard way.

And perhaps most importantly, they resist market timing. When beef prices surge—and they will again, markets are cyclical—disciplined operations maintain their breeding allocation rather than chase short-term revenue.

The Industry Dynamics Creating This Challenge

Several factors are converging that make this more complex than it was even five years ago.

Rabobank identifies $10 billion in new processing capacity requiring 2-3% annual production growth. That milk has to come from somewhere—either more cows or higher production per cow, both requiring careful replacement planning.

Research from UW-Madison shows that keeping older, lower-genetic cows costs several hundred dollars per lactation in unrealized genetic potential. It’s a hidden cost that adds up quickly when you’re holding onto cows past their prime.

CME data confirms we’re seeing unprecedented spreads between beef-cross and dairy bull values. That economic pressure to breed beef is real and it’s intense.

And here’s what makes it tough—once beef-on-dairy revenue reaches a significant portion of farm income, as industry analysis suggests is happening for many operations, returning to previous breeding strategies becomes financially challenging, even when replacement needs suggest you should.

These industry pressures aren’t just numbers on a spreadsheet—they’re reshaping how we make decisions every single day on our farms.

Practical Lessons from the Field

Looking at how these dynamics play out in real operations, the patterns become clear.

One California producer managing 1,500 cows, who preferred to remain anonymous, shared this sobering experience: “We bred 40% to beef without weekly monitoring. By July, we were 180 heifers short. Cost us $650,000 in purchased replacements plus another $80,000 in health and adaptation challenges. Now we monitor weekly—takes 20 minutes, prevents million-dollar mistakes.”

A Pennsylvania operation with 800 cows reported better results: “When our dairy percentage dropped to 43% in April, we immediately increased sexed semen usage. That early adjustment means we’re actually ahead on replacements now.”

And from the other side of the equation, a Minnesota custom heifer raiser tells me: “Three years ago, I had excess capacity. Today, I’m declining inquiries weekly. The offers I’m getting—$500 per head premiums just to accept calves, before any feeding costs—show how desperate the situation has become. But biological realities mean these animals require two years regardless of how urgent the need.”

Looking Ahead: What This Means for Your Operation

The beef-on-dairy opportunity has provided crucial revenue during challenging economic periods—I’m not arguing against it. As replacement availability tightens and prices reach historic levels, though, success will belong to operations that balance opportunity with disciplined management.

This isn’t really about choosing between beef revenue and dairy replacements. It’s about implementing systems that enable real-time response rather than hoping annual projections prove accurate. These principles apply whether you’re managing 3,000 cows in an Arizona dry lot or 200 cows on a Missouri pasture—the mathematics remain consistent, only the scale varies.

So here’s the question that matters: Are you monitoring the right metrics weekly, or are you waiting for problems to become crises?

Tracking dairy pregnancies as a percentage of total pregnancies requires just 30 minutes weekly. The cost of not monitoring? Producers nationwide are discovering it can easily exceed $400,000 when replacement shortages force them to make desperate purchasing decisions.

The beef-on-dairy opportunity remains valuable—genuinely so. But like all agricultural opportunities, it rewards those who measure, monitor, and adjust based on data—not those who set plans in January and hope for the best.

As we approach 2026, your dairy pregnancy percentage might be the most critical metric on your farm. The encouraging news? The tools and knowledge exist to navigate this successfully. It simply requires discipline and perhaps a shift in how we think about breeding management—from annual planning to continuous optimization.

Don’t know your current Dairy Pregnancy %? Go check your herd management software right now. If it’s below 42%, call your breeding advisor today.

KEY TAKEAWAYS

  • Your dairy pregnancy percentage predicts your future: Below 45% means you’re heading for a 150-heifer shortage worth $600,000—monitor it weekly, not annually
  • Timing is everything: Problems discovered in April can be fixed with breeding adjustments; problems discovered at June’s 60-day check are locked in for two years
  • Sexed semen is cheaper than panic: $520/month extra for sexed semen generates 50% more heifers and beats paying $3,500-4,000 per replacement
  • The 30-minute solution: Weekly monitoring of one metric (dairy pregnancies ÷ total pregnancies) has prevented $400,000 crises for disciplined producers
  • Action required today: Check your dairy pregnancy percentage now—if it’s below 42%, increase sexed dairy semen usage immediately

Complete references and supporting documentation are available upon request by contacting the editorial team at editor@thebullvine.com.

Learn More:

Join the Revolution!

Join over 30,000 successful dairy professionals who rely on Bullvine Weekly for their competitive edge. Delivered directly to your inbox each week, our exclusive industry insights help you make smarter decisions while saving precious hours every week. Never miss critical updates on milk production trends, breakthrough technologies, and profit-boosting strategies that top producers are already implementing. Subscribe now to transform your dairy operation’s efficiency and profitability—your future success is just one click away.

NewsSubscribe
First
Last
Consent

80% Full or 95% Desperate: The $400,000 Difference in Dairy Expansion Timing

Expand at 80%: 28 months of cash runway. Expand at 95% = 8 months. Which farm survives the next milk price crash?

EXECUTIVE SUMMARY: Timing your expansion at 80% capacity versus 95% isn’t just about convenience—it’s a $400,000 decision that determines whether you’ll survive the next downturn. At 80% utilization, you have $400-600K working capital and 28 months of financial runway; at 95%, you’re down to $300K and 8 months before crisis hits. The hidden killer nobody’s calculating: heifer costs exploded from $1,800 to $4,000 between 2023 and 2025, adding an unbudgeted quarter-million to every expansion. Smart operators now work backwards from a 36-month timeline, securing heifer supplies before designing parlors. But here’s the plot twist—producers choosing NOT to expand are often outperforming expansion operations by 40%, using premium markets, cooperatives, and value-added processing to build margins without debt. This isn’t about getting bigger anymore; it’s about getting smarter with the assets you already have.

Dairy farm expansion strategy

I just came back from a producer panel in Madison, and—true to form—by the time coffee hit the table, we were deep into a debate: When’s the right time to expand? The folks from Texas mentioned USDA’s October 2025 figures—Texas added nearly 47,000 cows in the last twelve months. South Dakota? State data shows a 65% herd increase since 2019, thanks in part to Valley Queen’s ambitious processing expansion. And you can’t ignore Rabobank’s latest numbers: we’re talking billions in new dairy plant investment rolling out across the country through 2028. It’s a wild time for U.S. dairy.

But I noticed something as these success stories bounced around the room—nobody wanted to bring up the producers struggling under new debt loads or the expansions that triggered more stress than success. After reviewing cases with financial advisors, talking with university folks, and swapping stories with dairies from Georgia to Washington, I’m convinced we need a new framework for thinking about expansion. Let’s get practical.

The 80% Trigger—And Why Most Expansion Happens Too Late

Looking at this trend, it’s natural to assume the decision comes when the parlor’s maxed out, the labor’s grinding, and you’re racing against milk production efficiency limits. Michigan State University’s 2024 expansion analysis, along with similar work from Wisconsin’s Center for Dairy Profitability, reveals a different story. Their advice? Expand at 80% utilization—not after the wheels come off at 95%. When you do, your odds of profit skyrocket.

Here’s what I see in operations working at that 80% sweet spot:

  • Working capital sitting comfortably between $400,000 and $600,000 (not drained by constant cow turnover)
  • Debt-to-equity ratios below 0.5, so lenders trust you to ride out rough spots
  • Maybe 18–24 months’ cash cushion if things go sideways

But at 95%? Working capital has likely dropped below $300,000, debt pressures are building, and every new day at full tilt erodes your negotiating position. Lenders notice. Suddenly, rates creep up, terms get shorter, and flexibility disappears. This isn’t theoretical—producers in Iowa and New York both told me their latest refinancing offers came with “crisis” pricing, not partnership terms.

What’s particularly noteworthy is how that 80% number gives you time: time to fix bottlenecks, test labor models, and roll out changes before you’re under the gun. That breathing room is worth more than any construction discount you’ll ever get for waiting to expand.

The $400,000 Safety Net: Why 80% Capacity Expansion Timing Creates Financial Runway

Hidden Heifer Costs: The Expansion Killer in Plain Sight

What’s interesting here is how expansion plans rarely factor in the real price of replacements. CoBank’s October 2025 Dairy Quarterly puts current U.S. heifer inventories at a two-decade low—just shy of 3.9 million head. That’s about 18% lower than where we stood in 2018. And based on what I see at auctions and in dealer quotes around Wisconsin and Pennsylvania, a replacement heifer that cost $1,800 a couple of years back is now going for $3,500 to $4,000, with the best lines topping $5,000 on strong-herd sales.

USDA’s Livestock, Dairy, and Poultry Outlook supports this, showing heifer supply tightness through at least 2026. Plan for earlier recovery at your peril.

So if you’re modeling a jump from 300 to 450 cows, here’s what you’re really looking at:

The Quarter-Million Dollar Surprise Nobody Budgets For

Hidden Cost CategoryWhat You BudgetedWhat You’ll Actually Pay
Heifer Premium (150 head @ current market)$270,000 (@ $1,800/head)$525,000-$600,000 (@ $3,500-$4,000/head)
Additional Heifer Acquisition Cost+$255,000 to $330,000
Feed & Labor During 24-Month DevelopmentIncluded in operations+$50,000 (Cornell Pro-Dairy estimates)
Transition Health Management$5,000+$10,000-$15,000 (U of MN veterinary studies)
Overlapping Debt ServiceOften ignored+$35,000-$50,000
Total Unbudgeted:$350,000-$445,000

Bottom line? That quarter-million to nearly half-million dollar hole in your expansion budget isn’t a rounding error—it’s the difference between profit and bankruptcy. As Dr. Christopher Wolf at Cornell reminded us at a recent extension webinar, it’s not about filling the barn—it’s about whether you can afford to fill those stalls with cows that pay you back at today’s prices.

The Quarter-Million Dollar Surprise: Hidden Heifer Costs That Bankrupt Expansion Plans

Backward Planning: The 36-Month Expansion Timeline

From what I’ve seen in successful multisite operations across the Midwest and Northeast, the farms that ‘nail’ expansion don’t start with construction—they start three years out and work backwards.

Here’s how it plays out on farms that have grown without regrets:

  • At 36 months out, they’re assessing heifer facilities: can we build enough of our own, or do we need to secure outside sources? Consultants (think folks from Compeer Financial or university extension) are already involved, running stress tests and flagging operational or management gaps.
  • By 24 months, most of these producers are disabling beef semen programs and boosting sexed dairy semen use, which stings when you’re giving up $750–$900/hd for beef-dairy cross calves (just check any current USDA market report). Still, it’s necessary to provide the replacements.
  • 12 months out sees the start of construction—parlor design reflects actual heifer capacity, not fantasy projections. You’ll see operations using this window to bulletproof their management structure, too.

After the parlor goes live, it’s all about measured, gradual onboarding. Bringing heifers in over 12–16 weeks—rather than in one massive wave—gives everyone (cows and people) time to adapt, keeps butterfat performance on track, and helps maintain fresh cow management discipline.

One consultant put it to me like this: by the time you ‘decide’ to expand, if you’re doing it right, you’re really just executing the plan you made three years ago.

Designing for the Herd You’ll Have—Not the Cows You’ve Got

I visited a 400-to-650 cow Michigan operation that offers a simple but profound lesson: they built everything 50% bigger than needed—holding areas, feed alleys, manure storage, you name it. Wisconsin’s Dairyland Initiative supports this “150% Rule” in their 2024 planning guidelines, and the cost savings down the line are enormous.

Get this—building a larger holding pen initially costs $35,000–$50,000, while reconstructing a cramped one later runs $80,000–$120,000 and may force a multi-month shutdown. Operations from California (with tougher water board restrictions) to the Southeast (dealing with heat stress) should adapt the concept, but the “plan for growth” mindset seems universally valuable. Even Mountain West dairies dealing with seasonal water access and Southwest operations managing extreme summer temps are finding this forward-thinking approach pays dividends.

Modular barns—clusters of 250–350 stalls with independent ventilation—are growing popular in Idaho and Pennsylvania. You can add a new block without disrupting milk flow, which makes sense given the unpredictability of future herd size. Feed alleys and equipment, according to dealer experience and recent construction bids I’ve seen, cost more up front but save $100,000+ against retrofits later.

Building manure management for the next generation, not just today, is critical. One producer in central Wisconsin told me his “build only what you need now” approach meant a catastrophic $120,000 retrofit and 3 months of idle time when expansion couldn’t wait any longer.

Labor Is Now the True Bottleneck

Let’s talk labor, because nearly every operator I know admits it’s the limiting factor—sometimes more than parlor stalls or feed space. USDA’s 2025 Farm Labor Survey reports annual turnover rates near 40%, and Texas A&M’s economists calculate it costs $15,000–$25,000 every time you lose a trained hand. Think about it: that’s four to five cows’ worth of revenue lost every single year, just to churn.

I’m seeing operations adapt by leveraging automation—robotic milking, sort gates, feed pushers. The latest Lely and DeLaval systems, as deployed in California and New York herds, reduce labor needs up to 60% and pay for themselves in under two years if you’re in a tight labor market. This is transforming dairy farm management at every scale. And the non-wage elements—affordable housing, pickup shuttles, flexible shifts, pathways to supervisor roles—are finally getting attention. The University of Vermont’s 2024 dairy labor research suggests these perks cut turnover from 45% to 15% in pilot projects.

Big, multi-barn operations in the Midwest offer something else: real career ladders, so entry-level milkers can move up to shift lead or assistant manager roles as the farm grows. One HR director told me what keeps people isn’t just a fair hourly rate—it’s the chance to stick around and grow, plus an environment that respects their families and ideas.

The First Real Investment: Honest, Independent Analysis

Nearly every expansion I’ve seen succeed started with a $15,000–$35,000 commitment to serious, unbiased planning—a line item paid to consultants from Farm Credit, extension, or non-affiliated ag business planners. They’re not selling rotary parlors or advocating for any specific supplier. They’re just there to ask the brutal questions:

  • Would you expand if milk dropped $3/cwt for a year?
  • Can your buyer really take another 20% peak milk during the spring flush?
  • Does your current team have the management capacity for multisite or larger-scale operation, or are you training up as you go?

And here’s the value: good consultants model all this and often point out that your “8-year payback” plan will actually take 14 years under today’s risk profile. Sometimes, they even tell producers not to expand at all—which, believe it or not, is the advice that saves the most equity in the long run.

Choosing “Not to Expand”—and Winning Anyway

The Contrarian Play: Why NOT Expanding Often Beats Bigger-Herd Economics

What’s encouraged me most recently is meeting producers who took “no” for an answer after running the numbers—and ended up thriving. How? By focusing on premiums and efficiency, not just scale.

Consider organic transitions. The Organic Trade Association’s 2025 report shows price increases of 20–40% for certified milk. A2 milk and high-component lines command similar, sometimes higher, premiums. Even old-fashioned quality bonuses—holding SCC well under 100,000—mean an extra 40 to 60 cents per hundredweight at most Midwest and Northeast processors.

Out East, producer co-ops like Hudson Valley Fresh help members—regardless of herd size—earn meaningful premiums and negotiate better hauling and input deals. And Cornell’s Dairy Foods Extension has shown that on-farm cheese and yogurt ventures (with $150,000–$300,000 startup investment) routinely pay back in two to three years when executed well.

Don’t discount Vermont’s recovery model after 2015–17’s price crash. Instead of growing bigger, groups of family dairies leaned into direct-market sales, branded fluid milk, and value-added production. Their net margins—documented in Vermont Agency of Agriculture data—eclipsed many larger commodity peers.

A Farmer’s Framework for Deciding

For everyone I meet seriously eyeing expansion, here’s my basic checklist—honed from the best minds at Farm Credit, university extension, and my own seat-of-the-pants experience:

  • Stress test: How many months of negative cash flow can you truly weather? Most lenders want to see at least a year of history.
  • Scenario planning: Run the numbers for stable, down 12%, and down 15–20% price scenarios. Use current heifer prices and milk market conditions from sources like the USDA’s recent outlooks—never last year’s cheapest quotes.
  • Hidden costs: Don’t ignore transition losses (15–20% production dips are well-documented by Michigan State), overlapping debt, or retraining expenses.
  • Management readiness: Be honest—can your team adapt to delegation and documentation, or do you need to build that muscle before you break ground?
  • Alternatives analysis: Is there a premium brand, co-op, or processing venture you’re overlooking that could offer similar ROI with less debt risk?

If you’re short on any of those, slow down. Your farm’s resilience will depend on finding the right fit—not just the biggest number.

Looking Ahead: The Hard Truth About Smart Growth

Here’s what nobody wants to admit at those polite industry conferences: The era of “expand or die” is dead. It’s been replaced by “expand smart or die slowly.”

The data doesn’t lie. Based on Farm Credit lending data and recent expansion studies, operations expanding at 95% utilization with depleted working capital face substantially higher failure rates than those expanding from positions of strength. Farms that ignore the quarter-million-dollar heifer reality end up selling at distressed prices within five years. And those waiting for the “perfect moment” to expand? They’re still waiting while their neighbors either scaled strategically or pivoted to premium markets that pay double commodity prices.

The new reality is this: Smart growth beats fast growth. No growth beats dumb growth. And sometimes, the boldest move isn’t building bigger—it’s having the guts to stay exactly where you are and do it better than anyone else.

That 80% rule? It’s not just about timing. It’s about having enough oxygen in your operation to think clearly, plan strategically, and execute flawlessly. Because in today’s dairy economy, the difference between thriving and surviving isn’t the size of your herd—it’s the size of your margin for error.

And if that margin’s already gone? Well, maybe it’s time to stop focusing on expansion plans and start focusing on what actually makes money in this business. Because I’ll tell you what—it’s not always more cows.

KEY TAKEAWAYS

  • Your expansion trigger is 80%, not 95%—miss this and you’re $400,000 poorer: At 80% you have resources to plan; at 95% you’re making desperate decisions with 8 months runway instead of 28
  • Budget $4,000 per heifer, not $1,800—then add $100,000 for surprises: The quarter-million dollar gap between planned and actual heifer costs is bankrupting more expansions than milk prices
  • Winners plan backwards from a 36-month timeline: Secure heifer genetics at -24 months (yes, give up those $900 beef calves), build replacement inventory at -18 months, break ground at -12 months
  • The highest ROI might be NOT expanding: Producers capturing organic premiums (20-40%), joining cooperatives, or adding on-farm processing are beating expansion economics by staying exactly where they are

Complete references and supporting documentation are available upon request by contacting the editorial team at editor@thebullvine.com.

Learn More:

Join the Revolution!

Join over 30,000 successful dairy professionals who rely on Bullvine Weekly for their competitive edge. Delivered directly to your inbox each week, our exclusive industry insights help you make smarter decisions while saving precious hours every week. Never miss critical updates on milk production trends, breakthrough technologies, and profit-boosting strategies that top producers are already implementing. Subscribe now to transform your dairy operation’s efficiency and profitability—your future success is just one click away.

NewsSubscribe
First
Last
Consent
Send this to a friend