315 farms filed Chapter 12. A 20,000‑cow dairy thrived. The difference? Three temptations almost every farm faces — and a 40‑day pause most never take.
Executive Summary: Three hundred fifteen farms filed Chapter 12 in 2025 — a 46% surge. This feature uses the Lenten Gospel’s three temptations as a mirror for the three decisions destroying dairy operations: chasing unproven genomic sires over disciplined genetics, expanding on record margins into record debt, and surrendering independence to a single processor. McCarty Family Farms’ 20,000-cow, data-first program anchors the survival side; Kooser Farms’ second bankruptcy in six years anchors the warning. A 40-day framework then layers across Lent, the fresh cow transition window ($200–$500/cow at stake), and the darkest weeks of winter — when one in four Canadian farmers surveyed reported thoughts of suicide. The piece closes with a concrete audit protocol: pull your real cost-of-production, stress-test at $18/cwt, and run the ratios before any spring commitment. Every major claim traces to CDCB, USDA, AFBF, Penn State Extension, CDC MMWR, and University of Guelph primary sources.
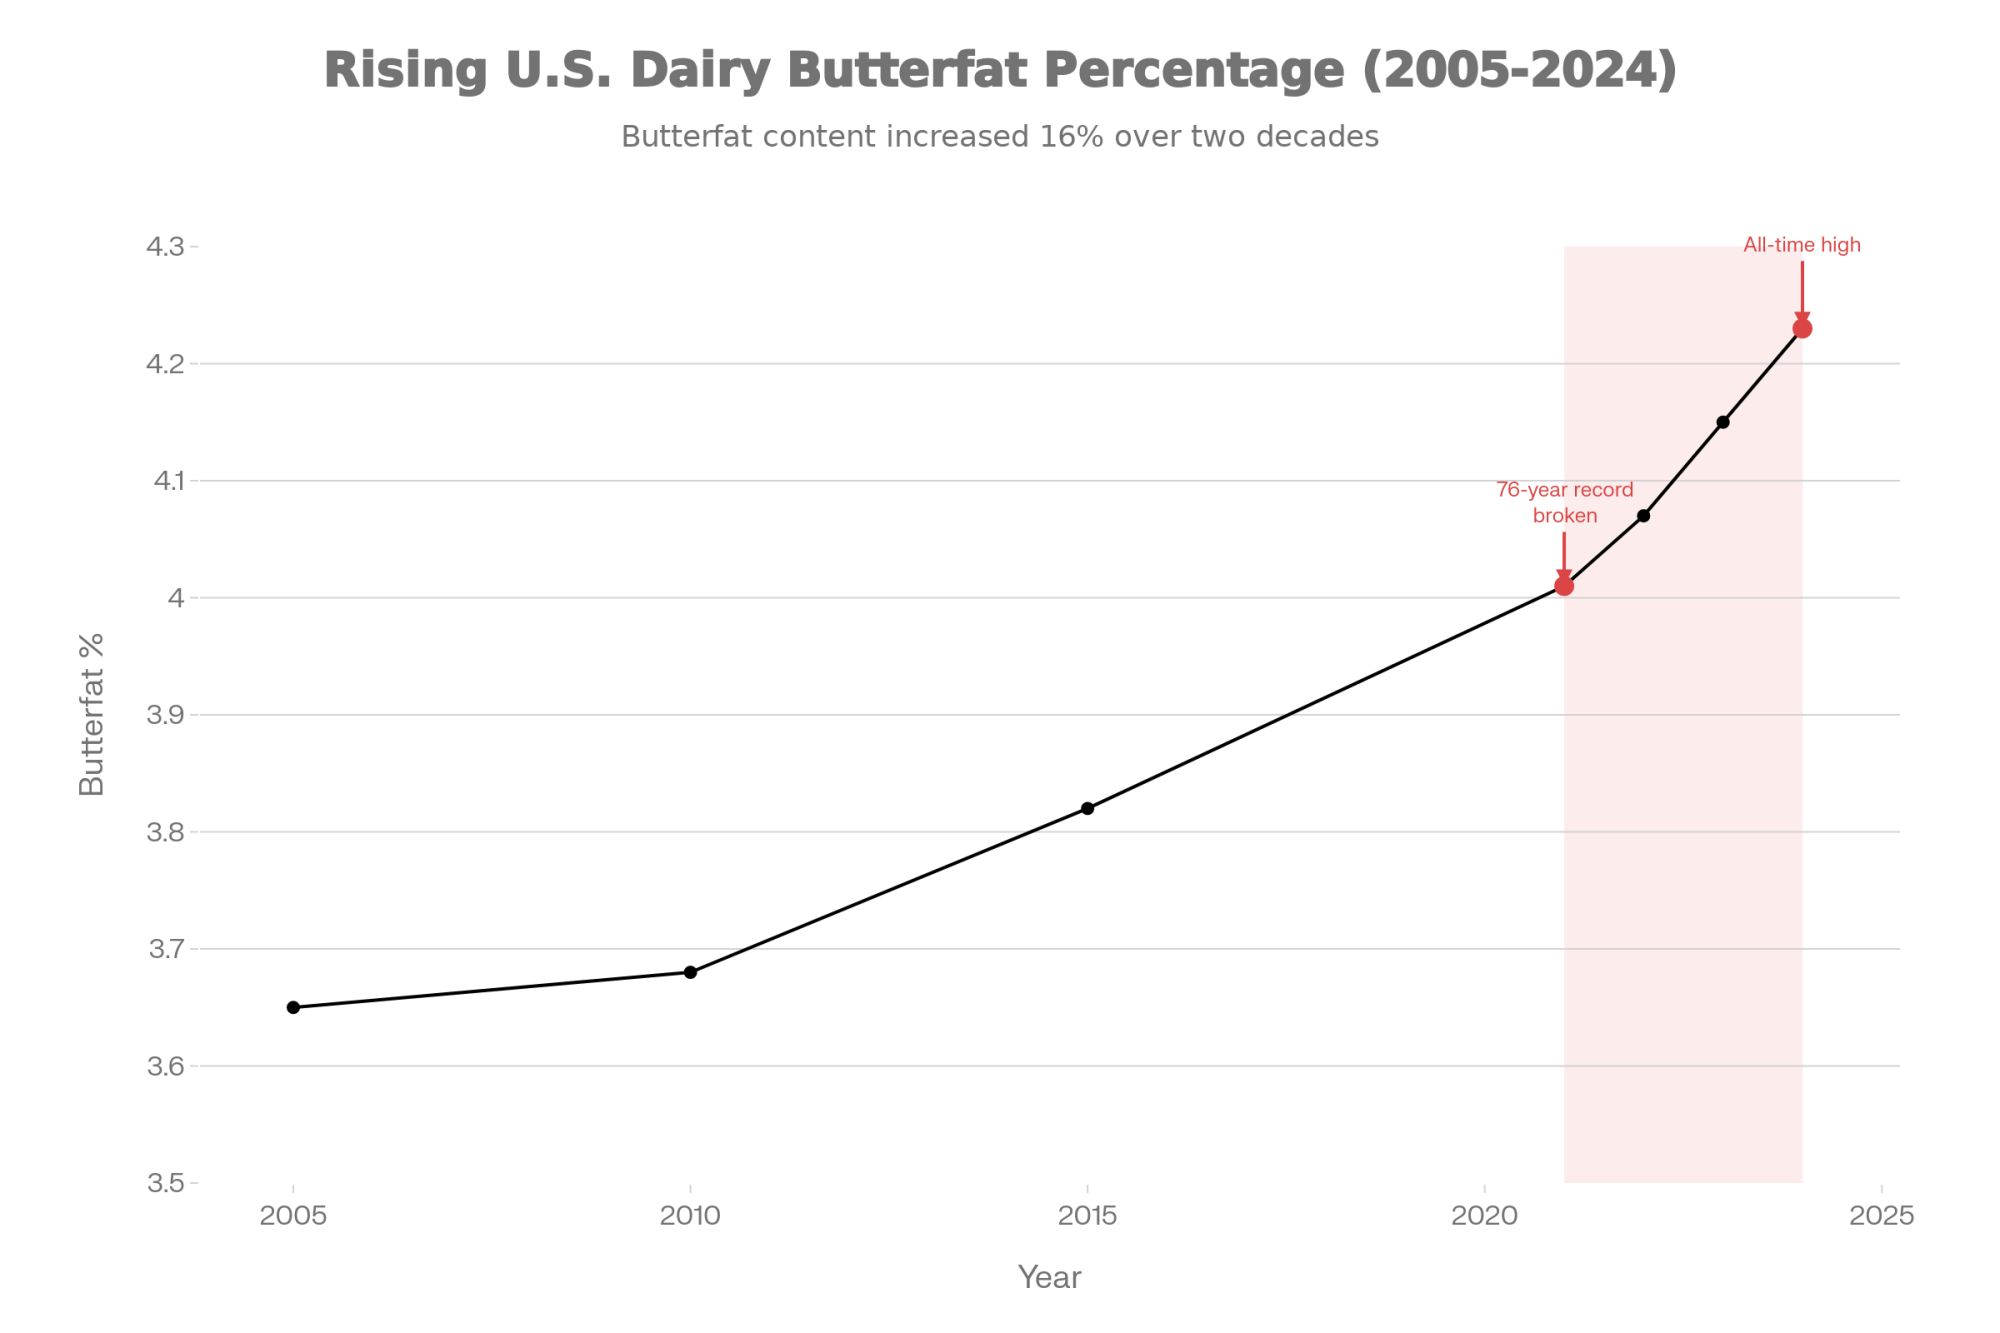
Ken McCarty found 28% of his parentage records were wrong.
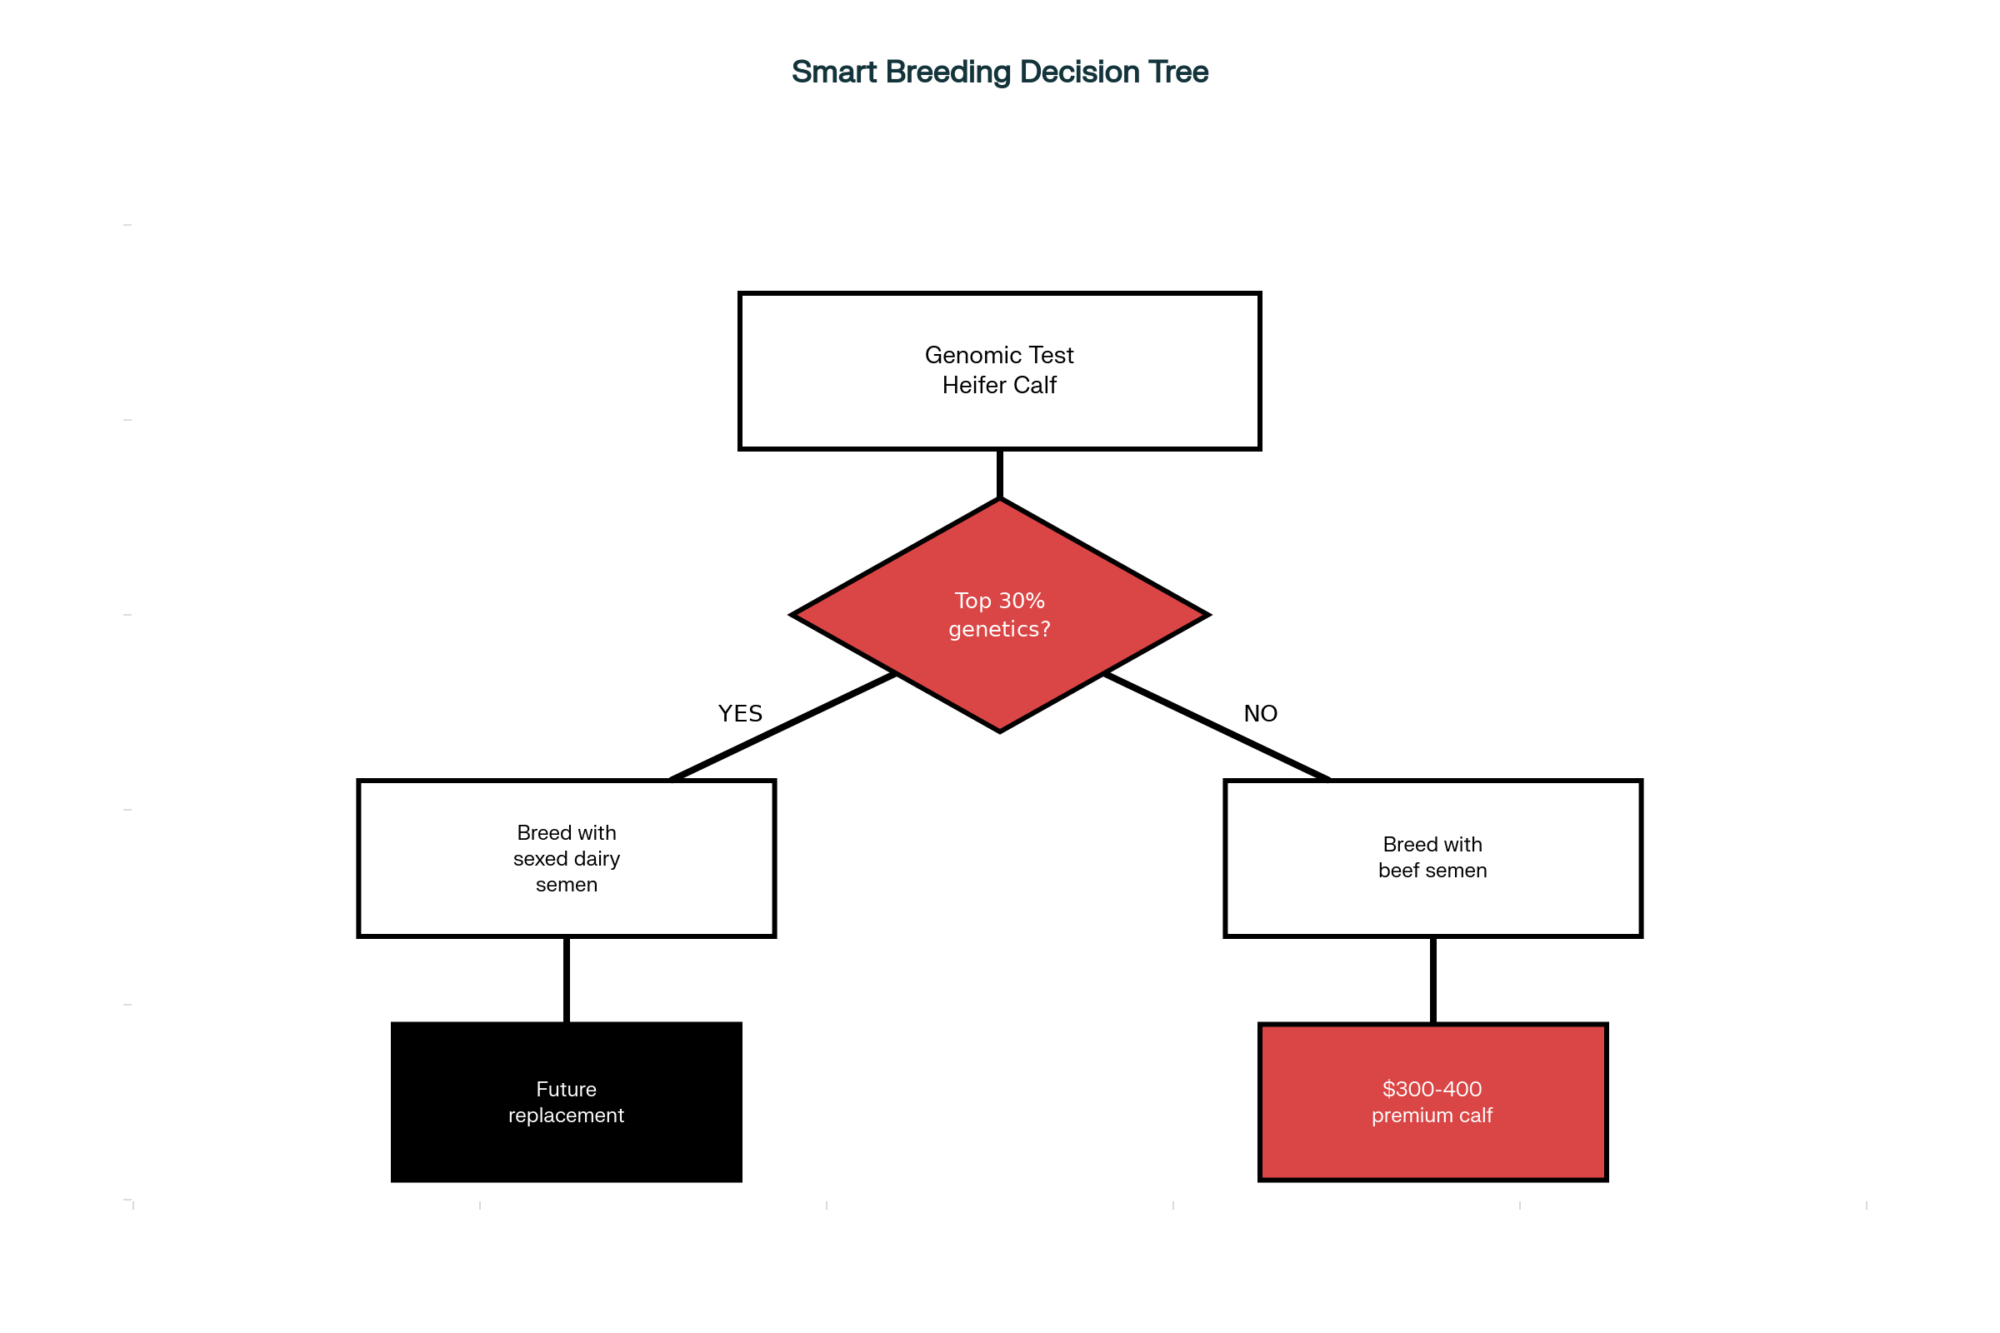
That number came out when McCarty Family Farms started genomically testing every heifer across an operation that has grown from 7,000 to nearly 20,000 cows — using the Zoetis Clarifide Plus program. “How can we ever drive the appropriate rate of genetic progress, reduce inbreeding to levels where we want them to be, make the types of breeding decisions that will propel our business forward” without fixing that foundation first, McCarty asked on the Uplevel Dairy Podcast in December 2024. The answer was they couldn’t. So they fixed it, ranked every animal — top half breeds the next generation, bottom half goes to beef — and daily output per cow climbed from 70 pounds to over 100, while somatic cell counts held steady between 120,000 and 180,000.
Meanwhile, on October 2, 2025, Kooser Farms LLC filed for Chapter 12 bankruptcy in the Western District of Pennsylvania — Case #25-22656. It was their second filing in six years. Liabilities between $1 million and $10 million. Assets between $100,001 and $1 million.
| Year | Total Filings | Midwest | Southeast | Milk Price |
|---|---|---|---|---|
| 2023 | 139 | 42 | 38 | $20.50 |
| 2024 | 216 | 71 | 62 | $21.80 |
| 2025 | 315 | 121 | 105 | $22.40 |
| 2026 | ? | ? | ? | $18.95 |
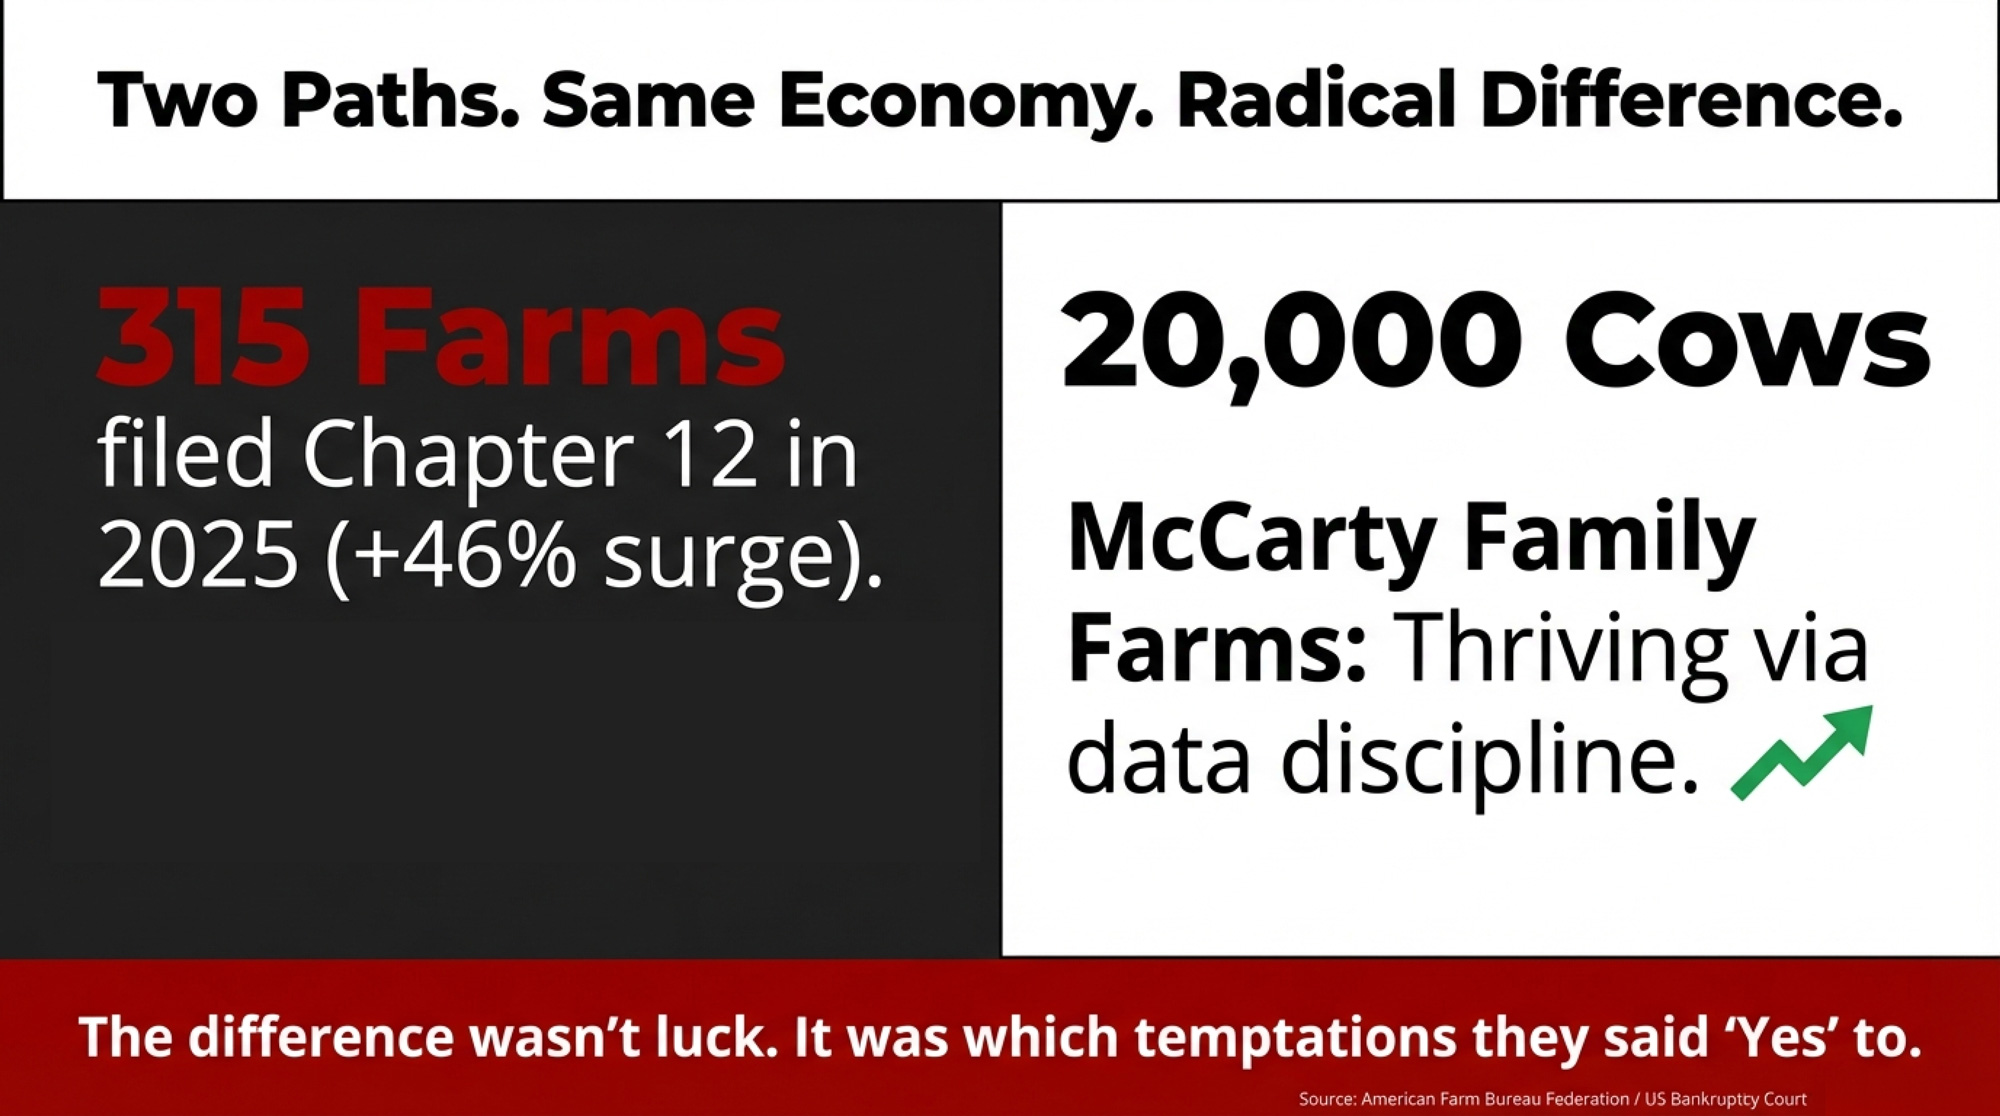
Same industry. Same economy. Radically different outcomes. And the difference wasn’t luck — it was which temptations each operation said yes to.
If you went to church this past Sunday — the First Sunday of Lent — you heard the Gospel of Jesus facing three temptations in the wilderness. Stones into bread. Throw yourself from the temple. All the kingdoms of the world. It’s a story about what happens when you’re exhausted and under pressure, and someone offers you a shortcut that seems like salvation.
The pattern playing out on dairy farms right now is the same one. Three temptations. Three lies dressed up as opportunity. And the farmers who recognize them are the ones still shipping milk.
Temptation One: Turning Stones Into Bread
“Command these stones to become bread.” In the Gospel, it’s a temptation to use power for instant gratification when you’re hungry and desperate. On a dairy farm, it’s chasing short-term genetic flash over long-term herd health.
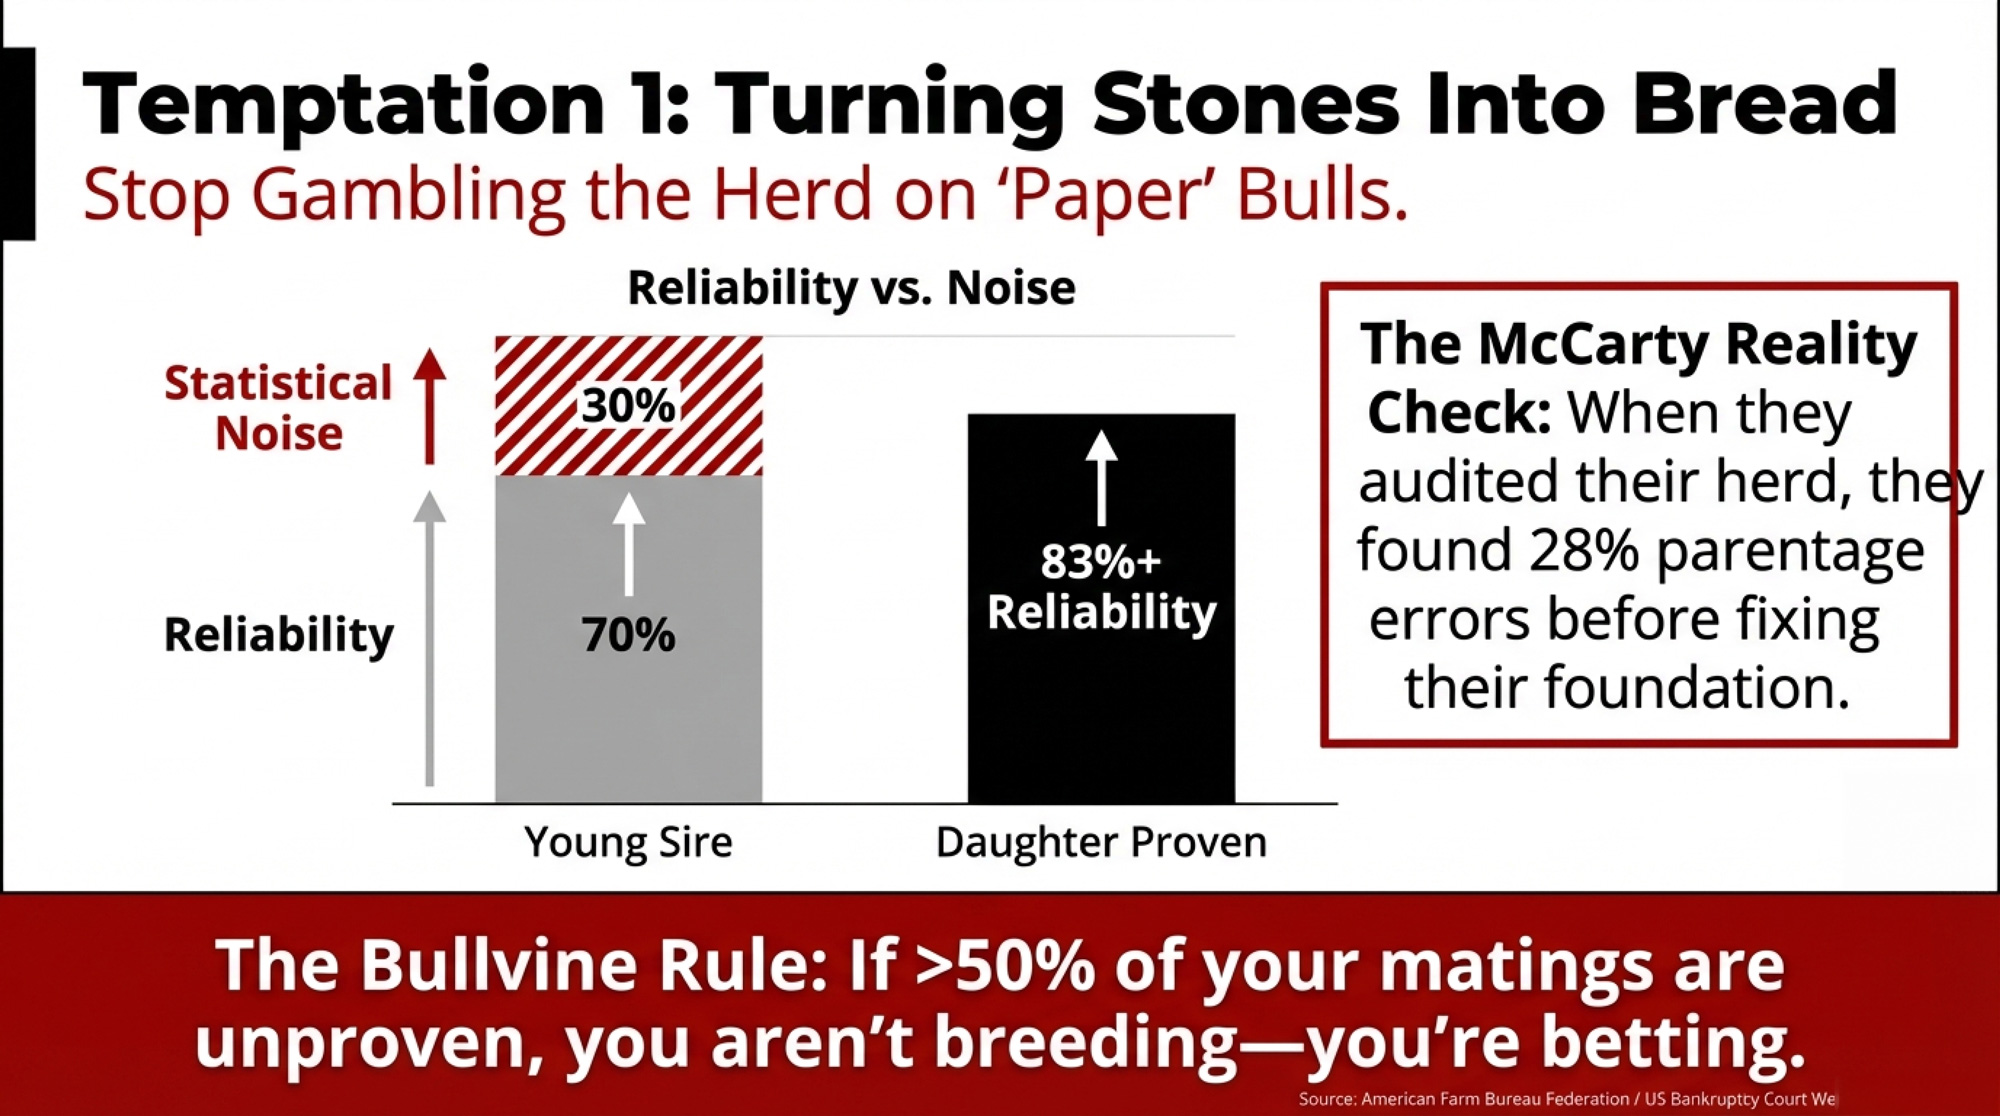
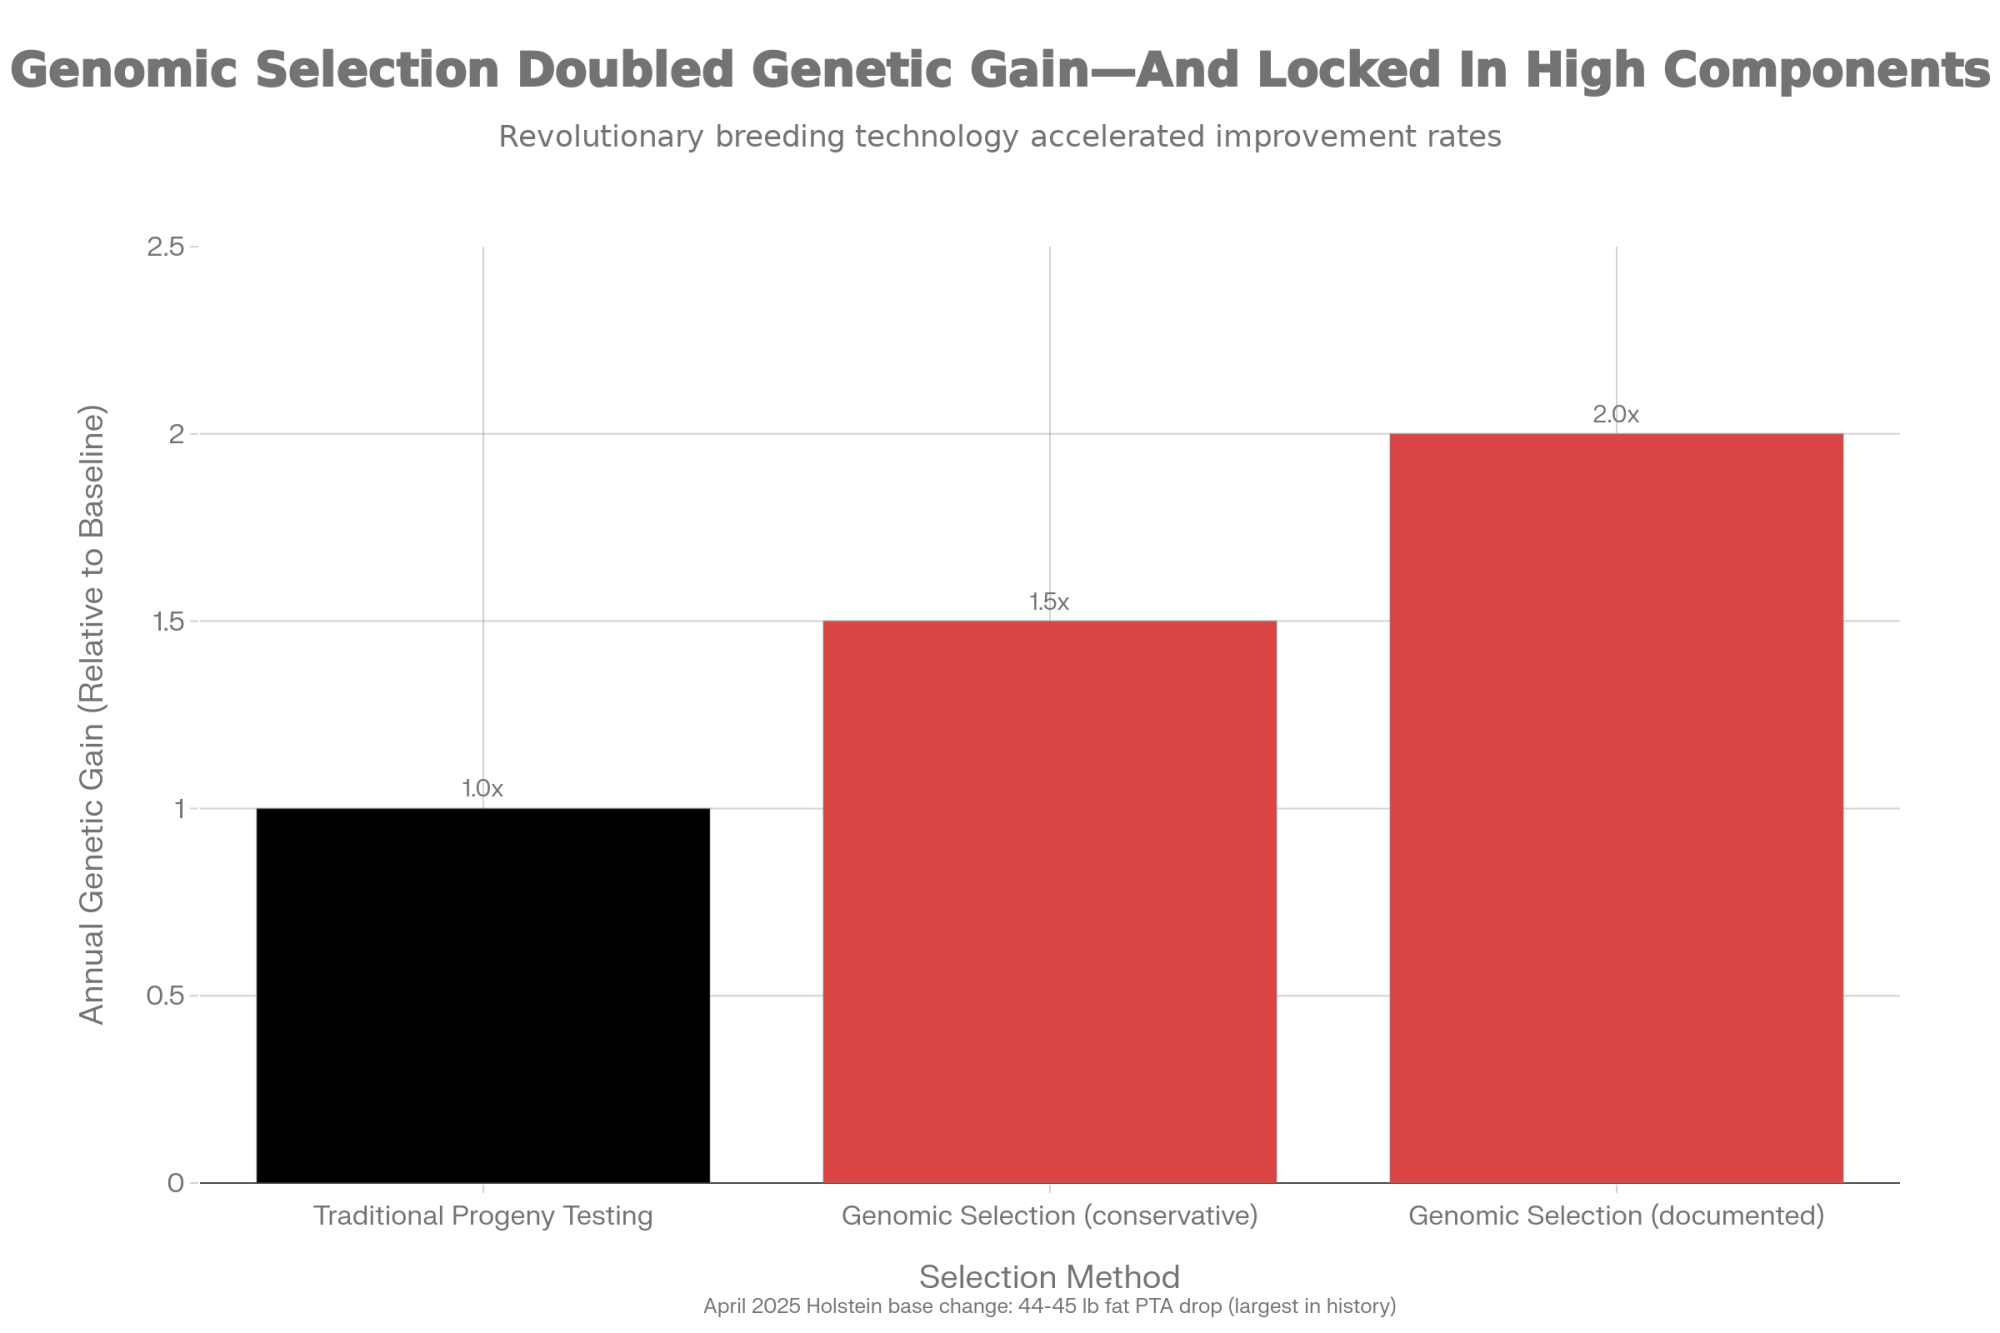
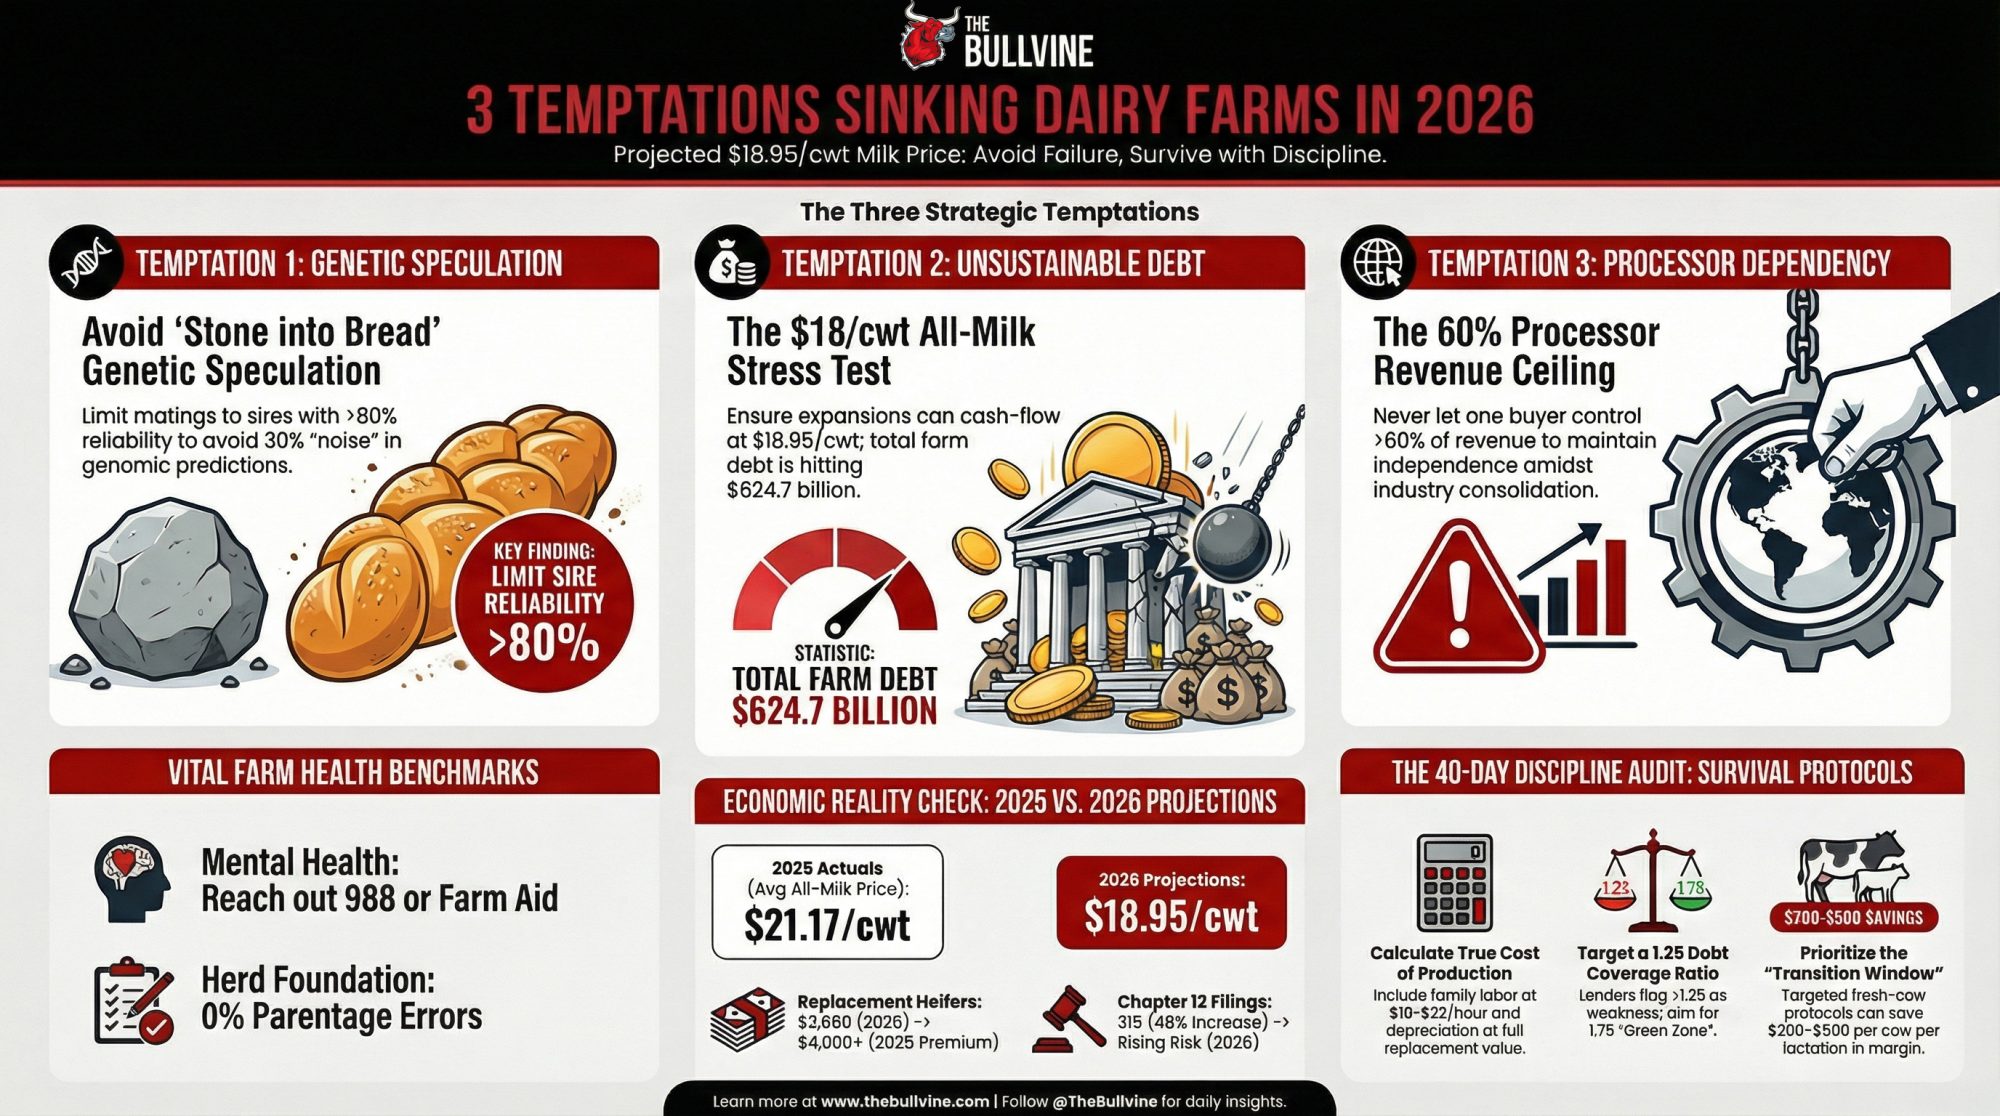
Every proof run brings a new wave of genomic young sires with dazzling indexes. The numbers look incredible — on paper. But a genomic young sire carries roughly 70% reliability. That means 30% of the prediction is noise. A first-crop daughter-proven sire sits around 83%. Second crop? North of 99%. The U.S. genomic selection program has doubled the rate of genetic gain — the average annual increase in Net Merit jumped from $40 to $85 per cow since 2010. Real progress. But those gains come from disciplined use of genomic data across the whole herd, not from betting the farm on a single young sire’s first proof.
Building your sire stack entirely on unproven genomic predictions is turning stones into bread. It looks like food, but it won’t sustain your herd through five lactations.
That’s not an argument against genomics. McCarty Family Farms proves what disciplined use actually looks like. They test everything. They rank ruthlessly. They use indexes like TPI and Dairy Wellness Profit to manage the 60% of their budget that goes to feed. But they don’t anchor their program to any single young sire before he has daughters in milk. Dan Weigel, the Zoetis geneticist who has worked closely with the McCartys, explained on the same podcast that genomic testing unlocked parentage accuracy first—and that gave the farm a dependable foundation to build every other breeding decision on.
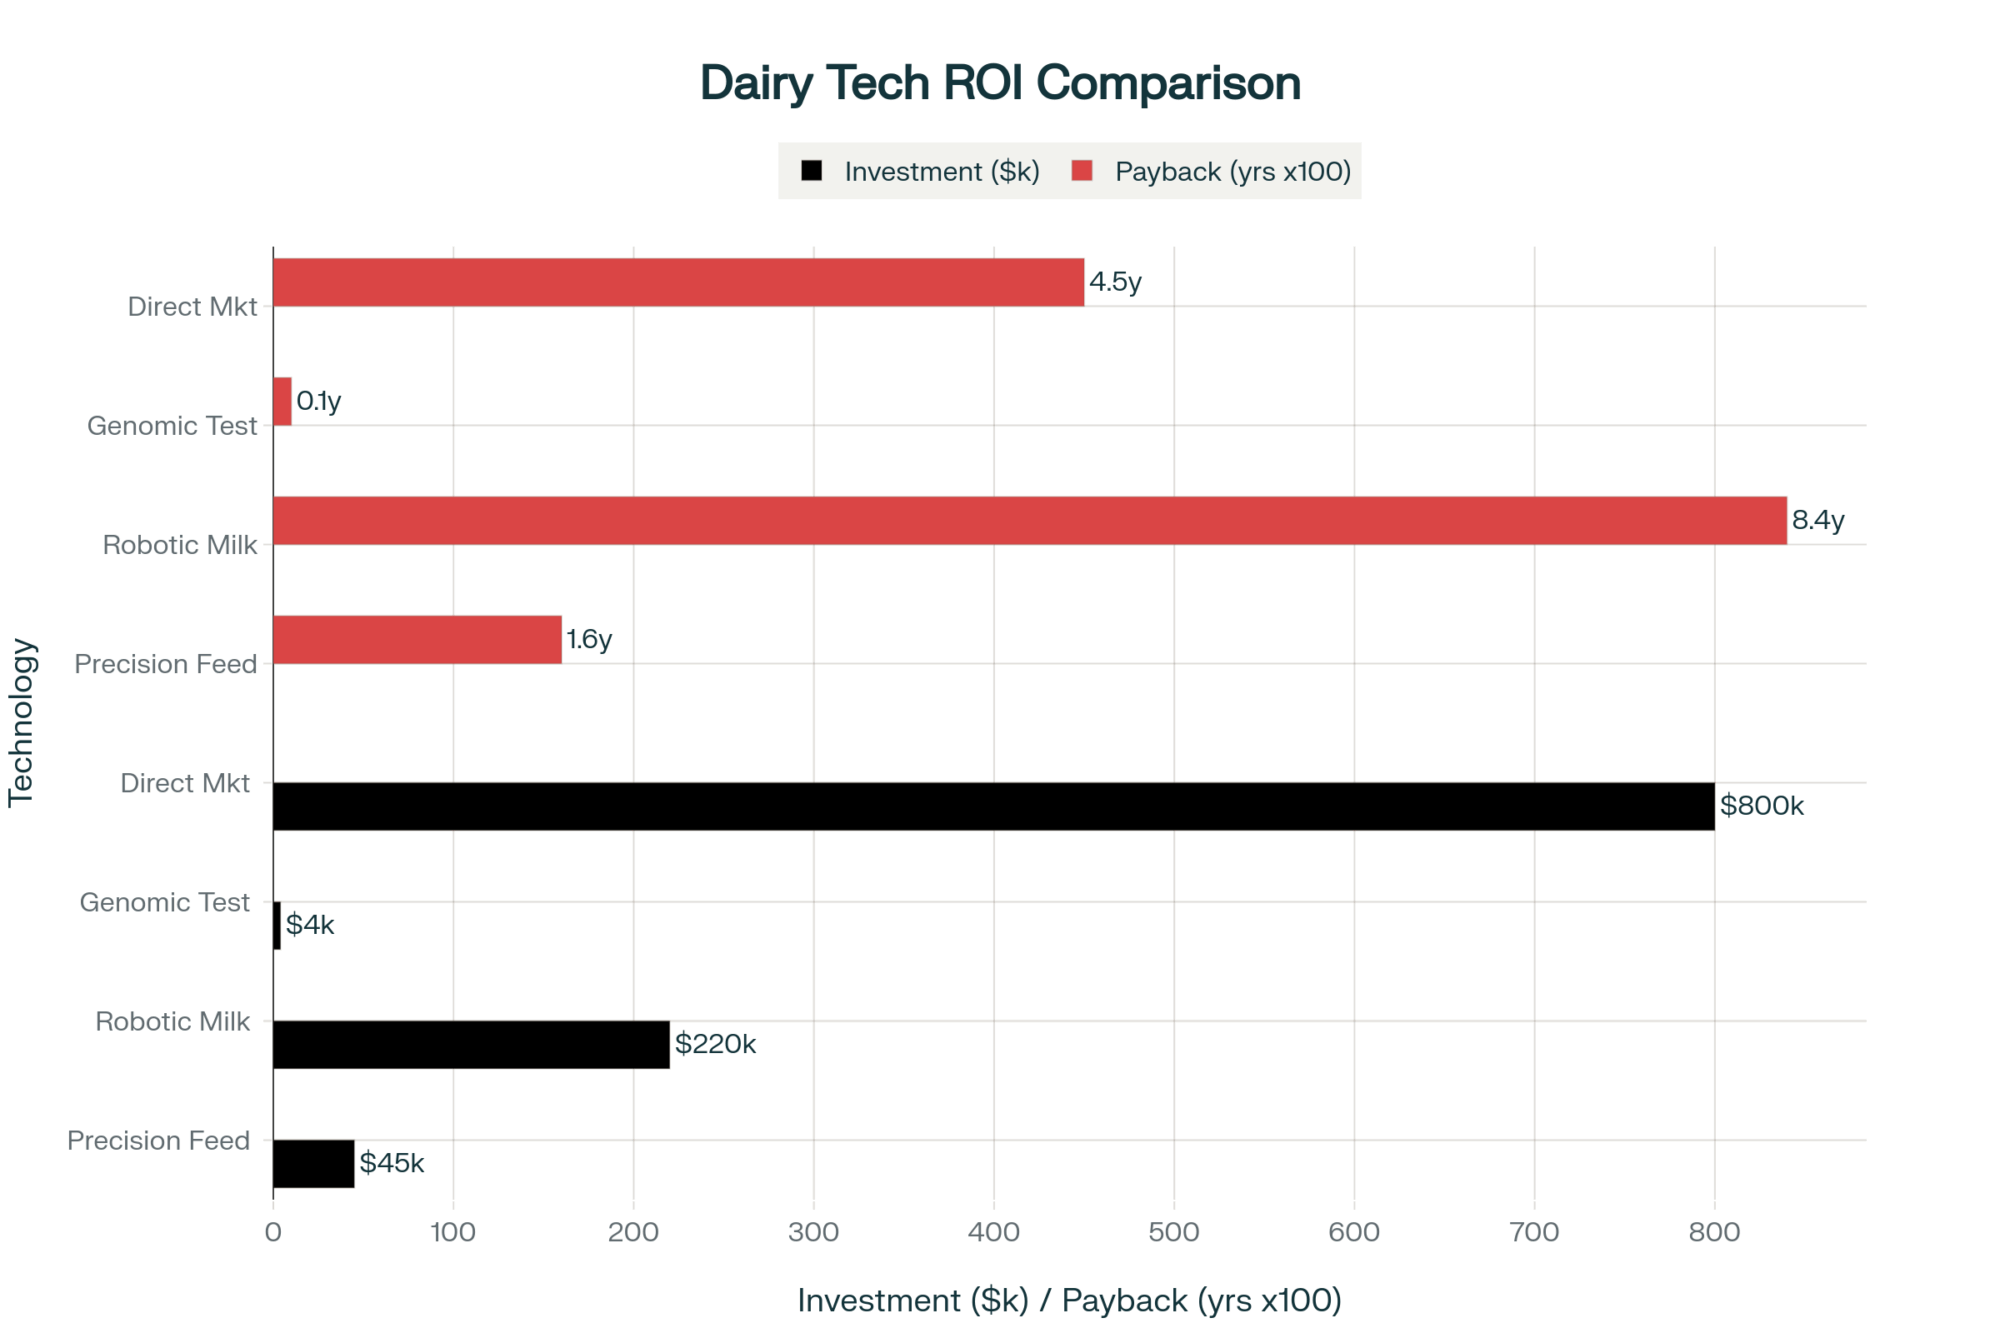
What Does the Genetic Gamble Actually Cost?
Here’s the barn math. The Council on Dairy Cattle Breeding estimates genetic gain savings from Net Merit selection at approximately $50 per cow per year — a figure that climbs toward $75 when you factor in the expanded trait indexes added since 2021, including feed saved, heifer livability, and early first calving. On a 200-cow herd, that’s $10,000–$15,000 annually in genetic progress you’re leaving on the table if you refuse to use genomic information at all. University of Alberta research frames it differently: a $50 reduction in genetic lag translates to roughly $33 per cow per year in realized value, using the formula of twice the PTA difference divided by average lactation lifespan.
But chasing unproven sires below 80% reliability and having even 15% of those matings disappoint? You could wipe out that gain through higher cull rates, lower components, and daughters that don’t match their pedigree predictions.
The discipline isn’t choosing genomics or not. It’s choosing which genomic information to trust, and when.
Temptation Two: Throwing Yourself From the Temple
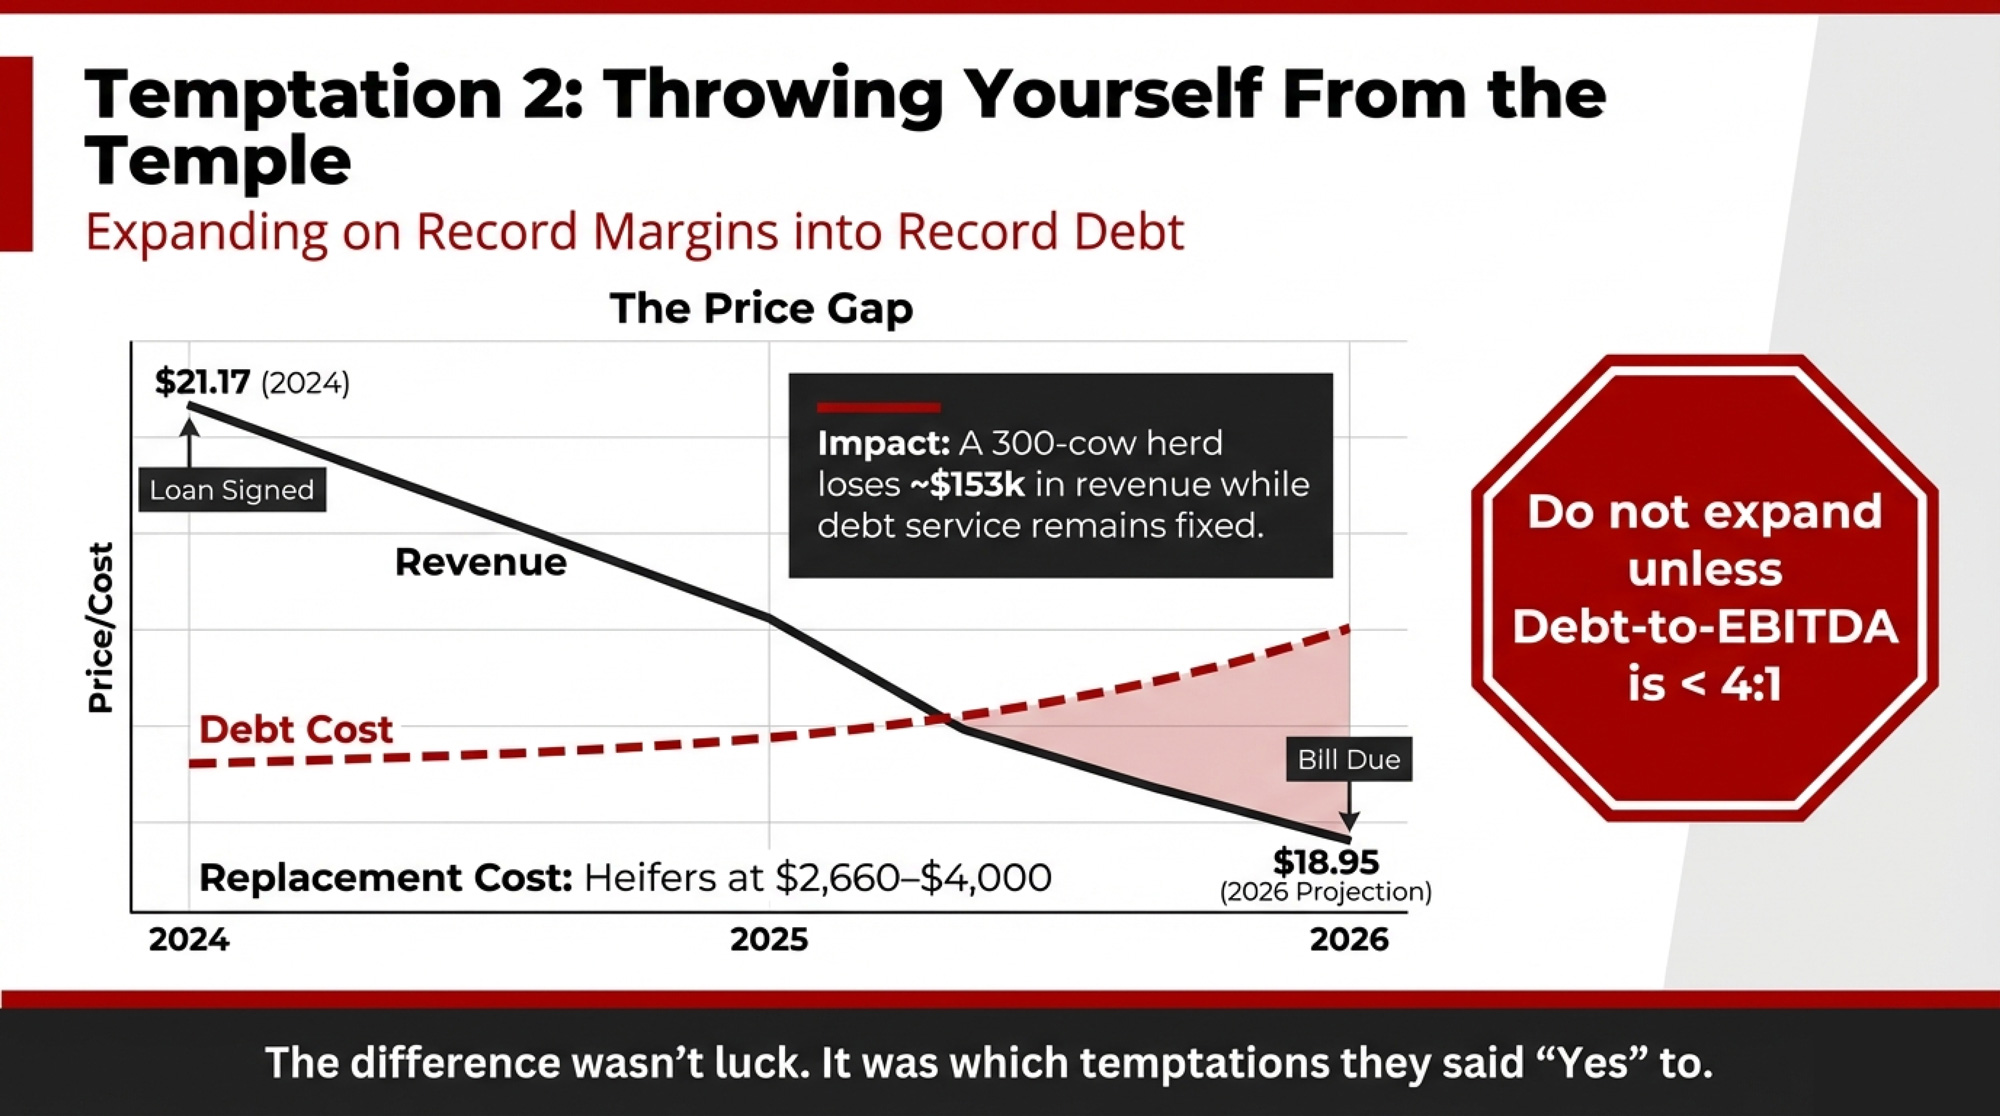
“Throw yourself down, for the angels will catch you.” The second temptation is about presumption — testing limits because you believe you’re protected. On a dairy farm, it’s expanding on record margins because the debt math looks survivable.
The genetic temptation erodes your herd over the years. This one can sink you in months.
Chapter 12 farm bankruptcy filings hit 315 in 2025 — a 46% jump from 2024’s 216 cases, according to the American Farm Bureau Federation. The Midwest took the hardest hit: 121 filings, up 70% year-over-year. Wisconsin went from 2 filings in 2024 to 16 — a 700% increase. Iowa jumped 220%. Missouri, 167%.
Ask Kooser Farms how expansion confidence ends. This Mill Run, Pennsylvania, operation filed its second Chapter 12 in six years. During the first bankruptcy in August 2019, they sold their entire dairy herd and pivoted to crops. Attorney Daniel White of Calaiaro Valencik explained the logic to the Pittsburgh Business Times: the farm had shifted from monthly milk payments to annual crop revenue and needed a payment structure to match. It made sense on paper. Then, adverse weather hammered yields for consecutive seasons, and “Plan B” became a second restructuring.
On February 9, 2026, Judge Taddonio confirmed Kooser Farms’ second restructuring plan. Whether it holds is an open question — the plan still has to survive three to five years of execution in an agricultural economy that already broke it once.
Many of the 315 operations that filed in 2025 expanded when milk prices made the numbers sing. At $24/cwt, you can make almost any barn pencil out. But 2024’s dairy cash receipts hit $50.7 billion, and USDA’s February 2026 WASDE projects $18.95/cwt all-milk for 2026 — down from the revised 2025 average of $21.17/cwt. For a 300-cow herd shipping 69,000 cwt a year, that’s roughly $153,000 in lost gross milk revenue. Total farm debt is expected to hit a record $624.7 billion in 2026, with interest expenses reaching $33 billion.
You see where this goes. Expansion debt taken on at $24 milk has to be serviced at $18 milk. And if your term debt coverage ratio doesn’t clear 1.25 — meaning for every dollar you owe in annual debt service, you’re generating $1.25 in cash available to pay it — you’re one bad quarter from a lender conversation you don’t want to have. Penn State Extension is explicit: many lenders require a minimum term debt coverage of 1.25 just to consider a plan viable, and flag 1.75 or better as the green zone. The University of Wisconsin Extension’s Farm Finance Scorecard uses the same thresholds — below 1.25 is “a concern and a weakness.” Stay below a 4:1 debt-to-EBITDA ratio. No exceptions.
Can Your Expansion Survive $3,500 Heifers and $18 Milk?
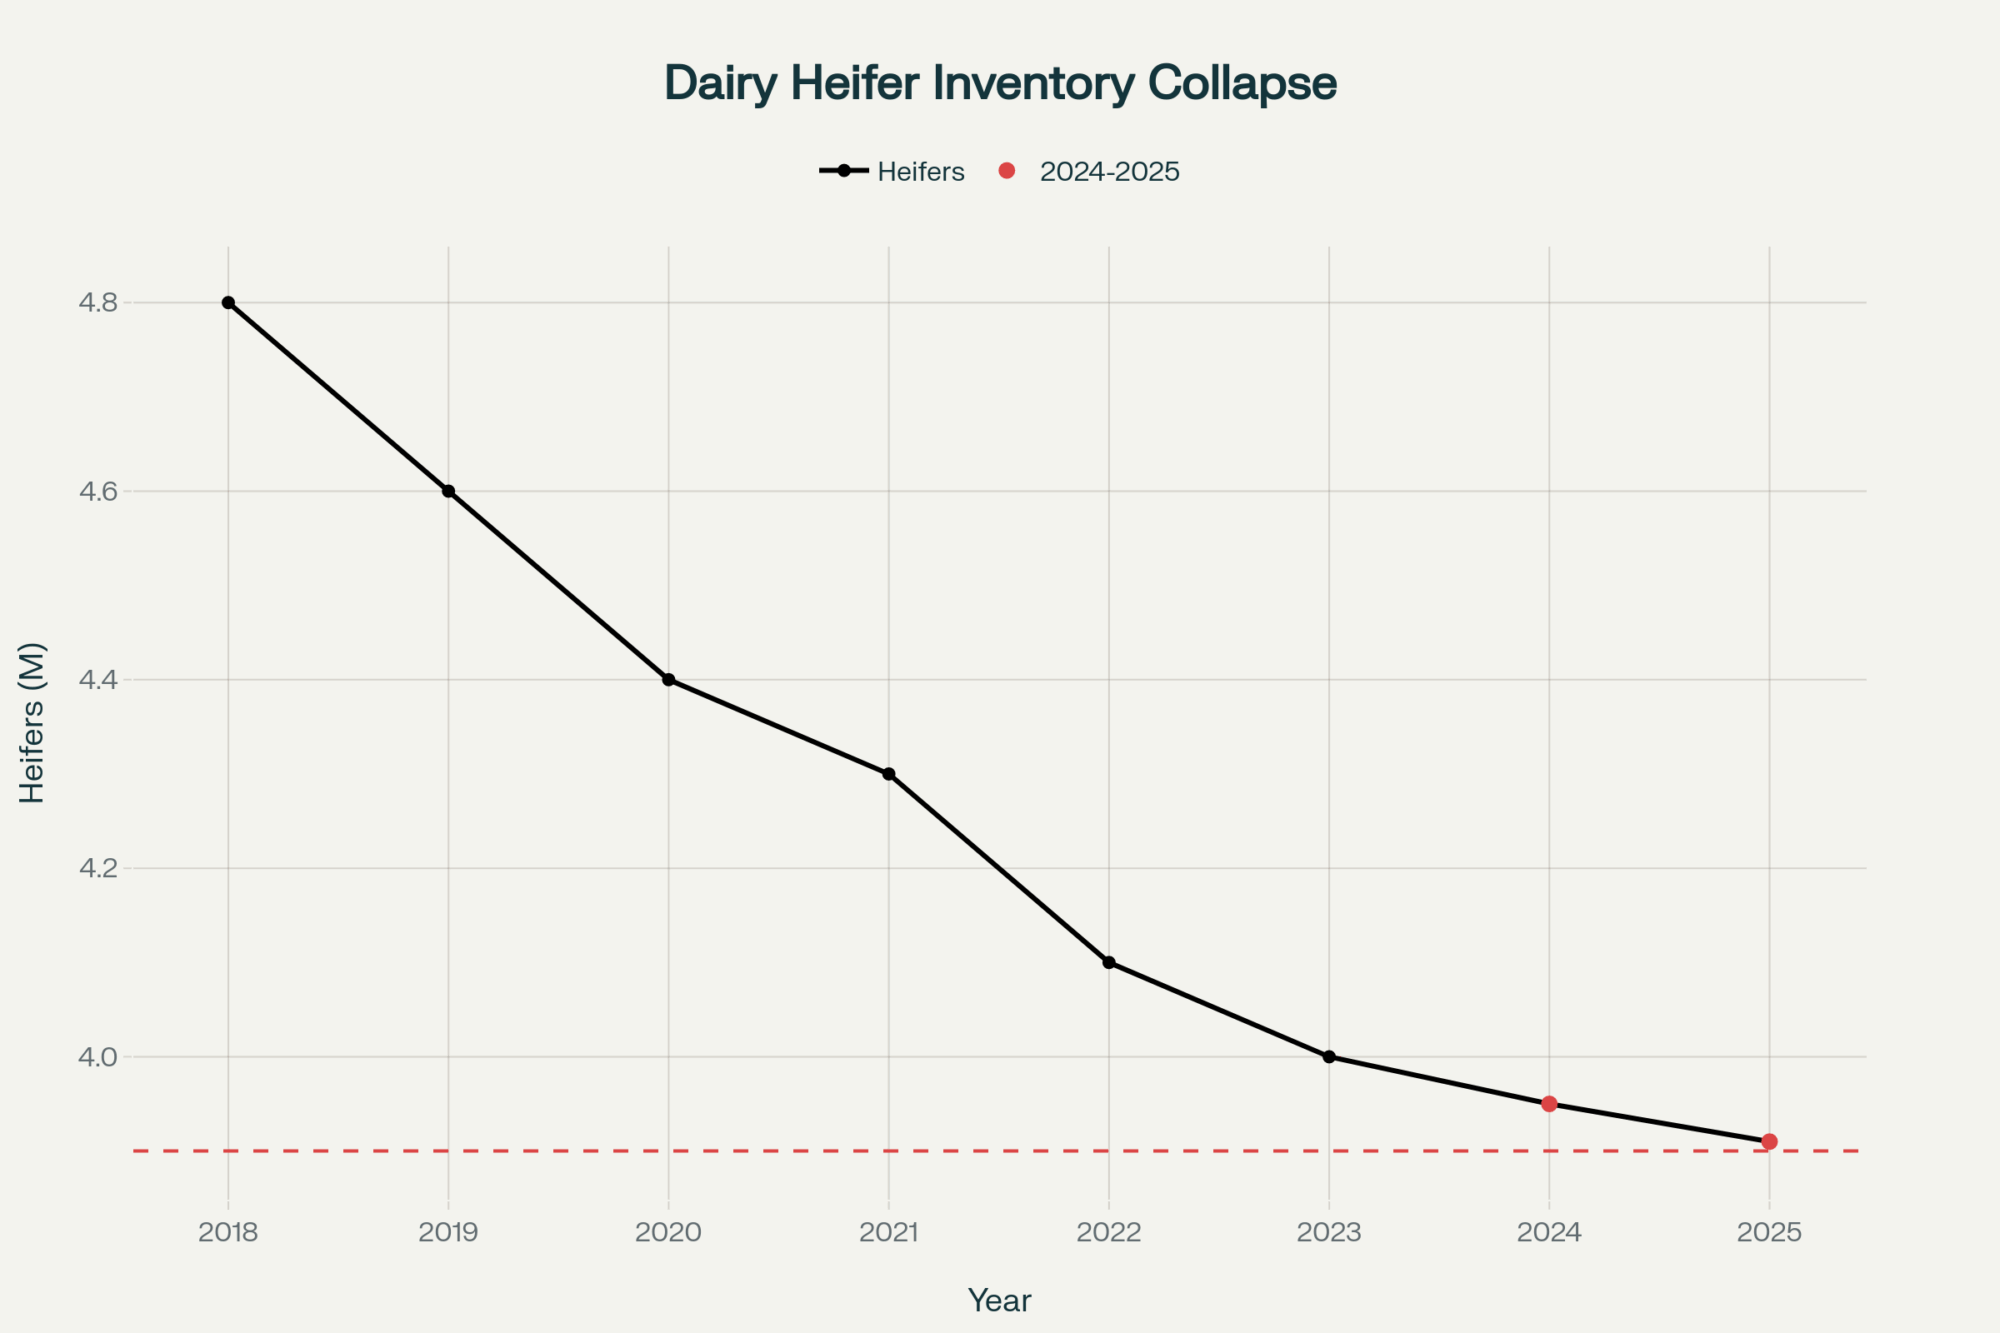
What makes the 2026 expansion especially dangerous? Replacement heifer inventory is at a 20-year low, and prices have hit $2,660–$4,000 per head depending on region, with premium auction heifers routinely clearing $4,000 in California, Minnesota, and Pennsylvania. Beef-on-dairy crossbreeding has been enormously profitable for calf value, but it’s drained the pipeline of dairy replacements.
So you’re building a bigger barn. Your heifer costs alone might run $530,000–$800,000 for a 200-head expansion at those prices. The milk check is falling. Your interest rate isn’t 2022’s anymore. And you’re betting the angels will catch you.
They won’t.
Temptation Three: All the Kingdoms of the World
“All these I will give you, if you fall down and worship me.” The third temptation is about surrendering your independence for the promise of everything. On a dairy farm, it’s tying your operation’s survival to a single processor or consolidation play.
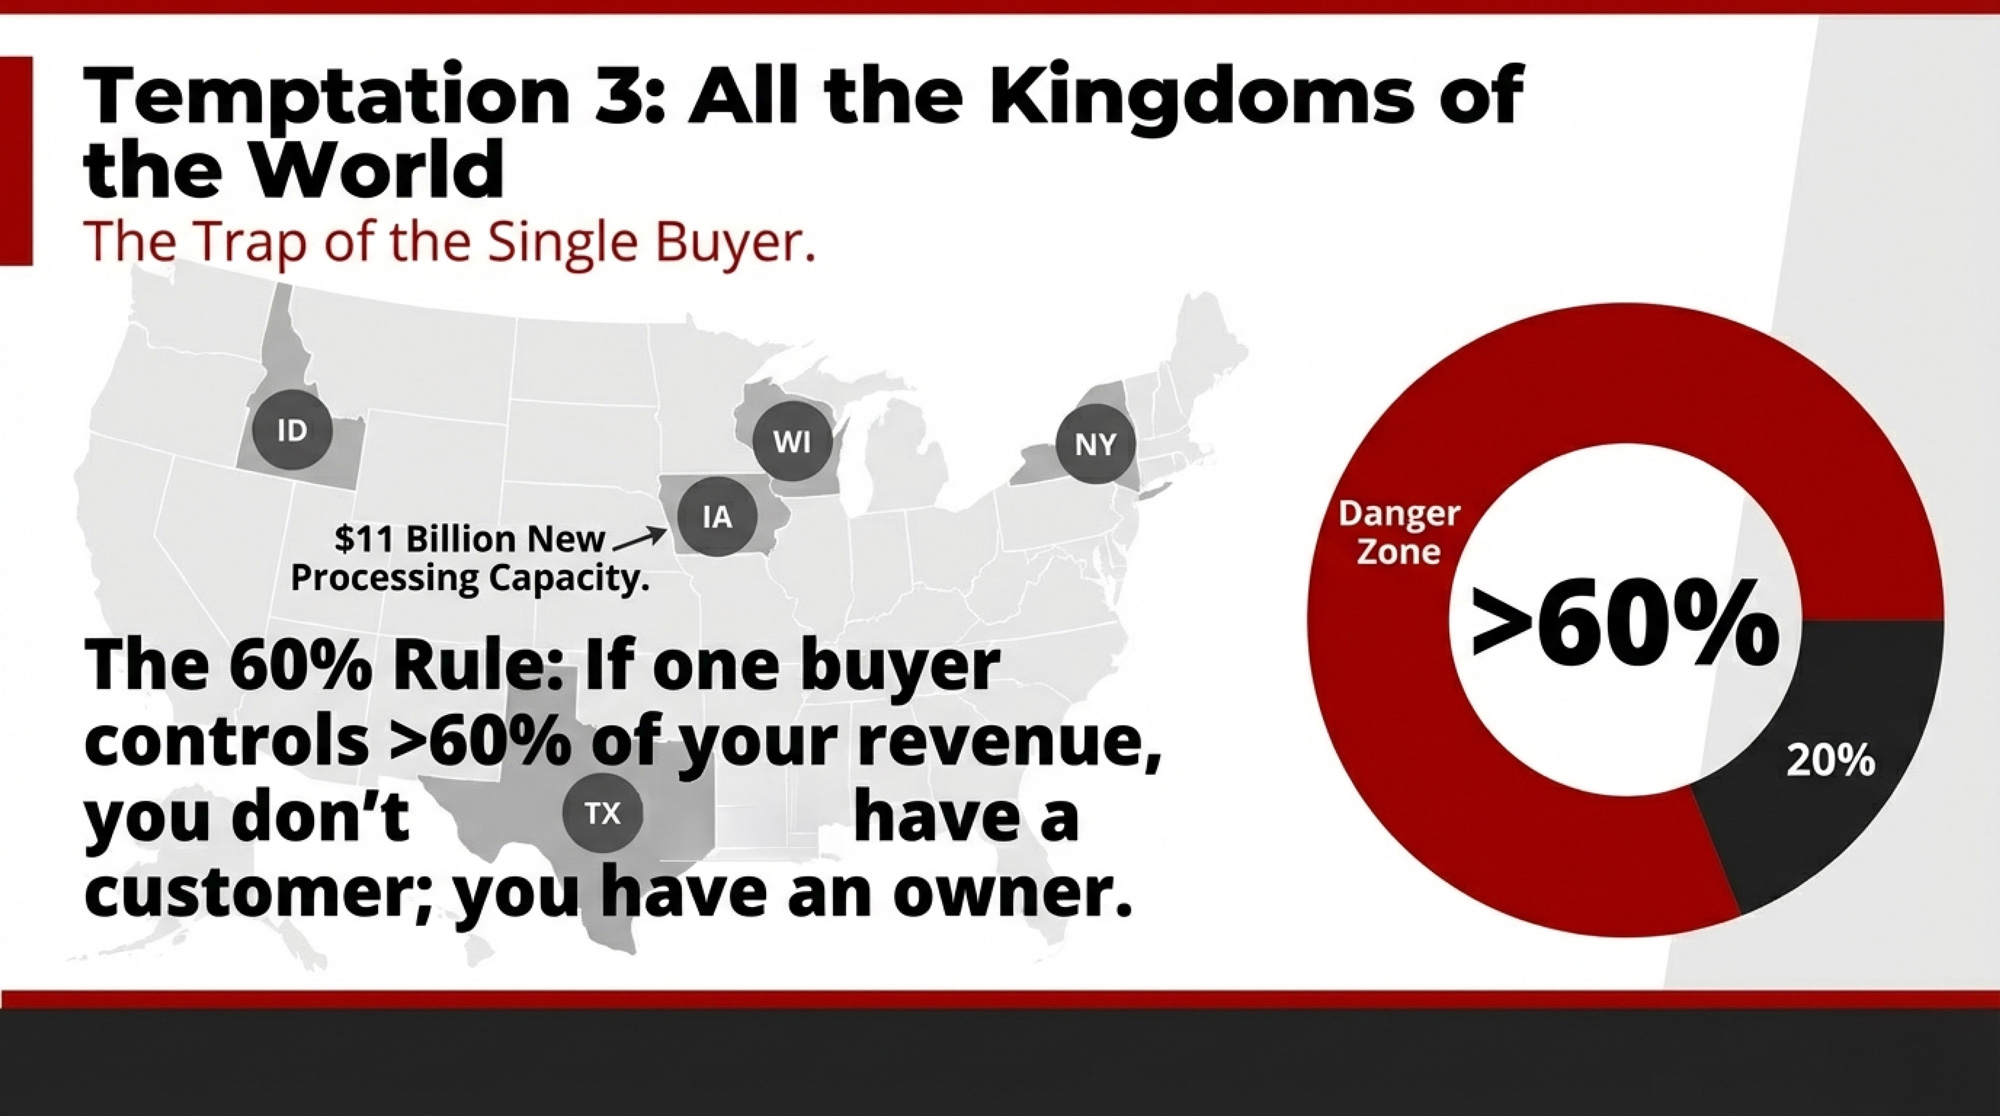
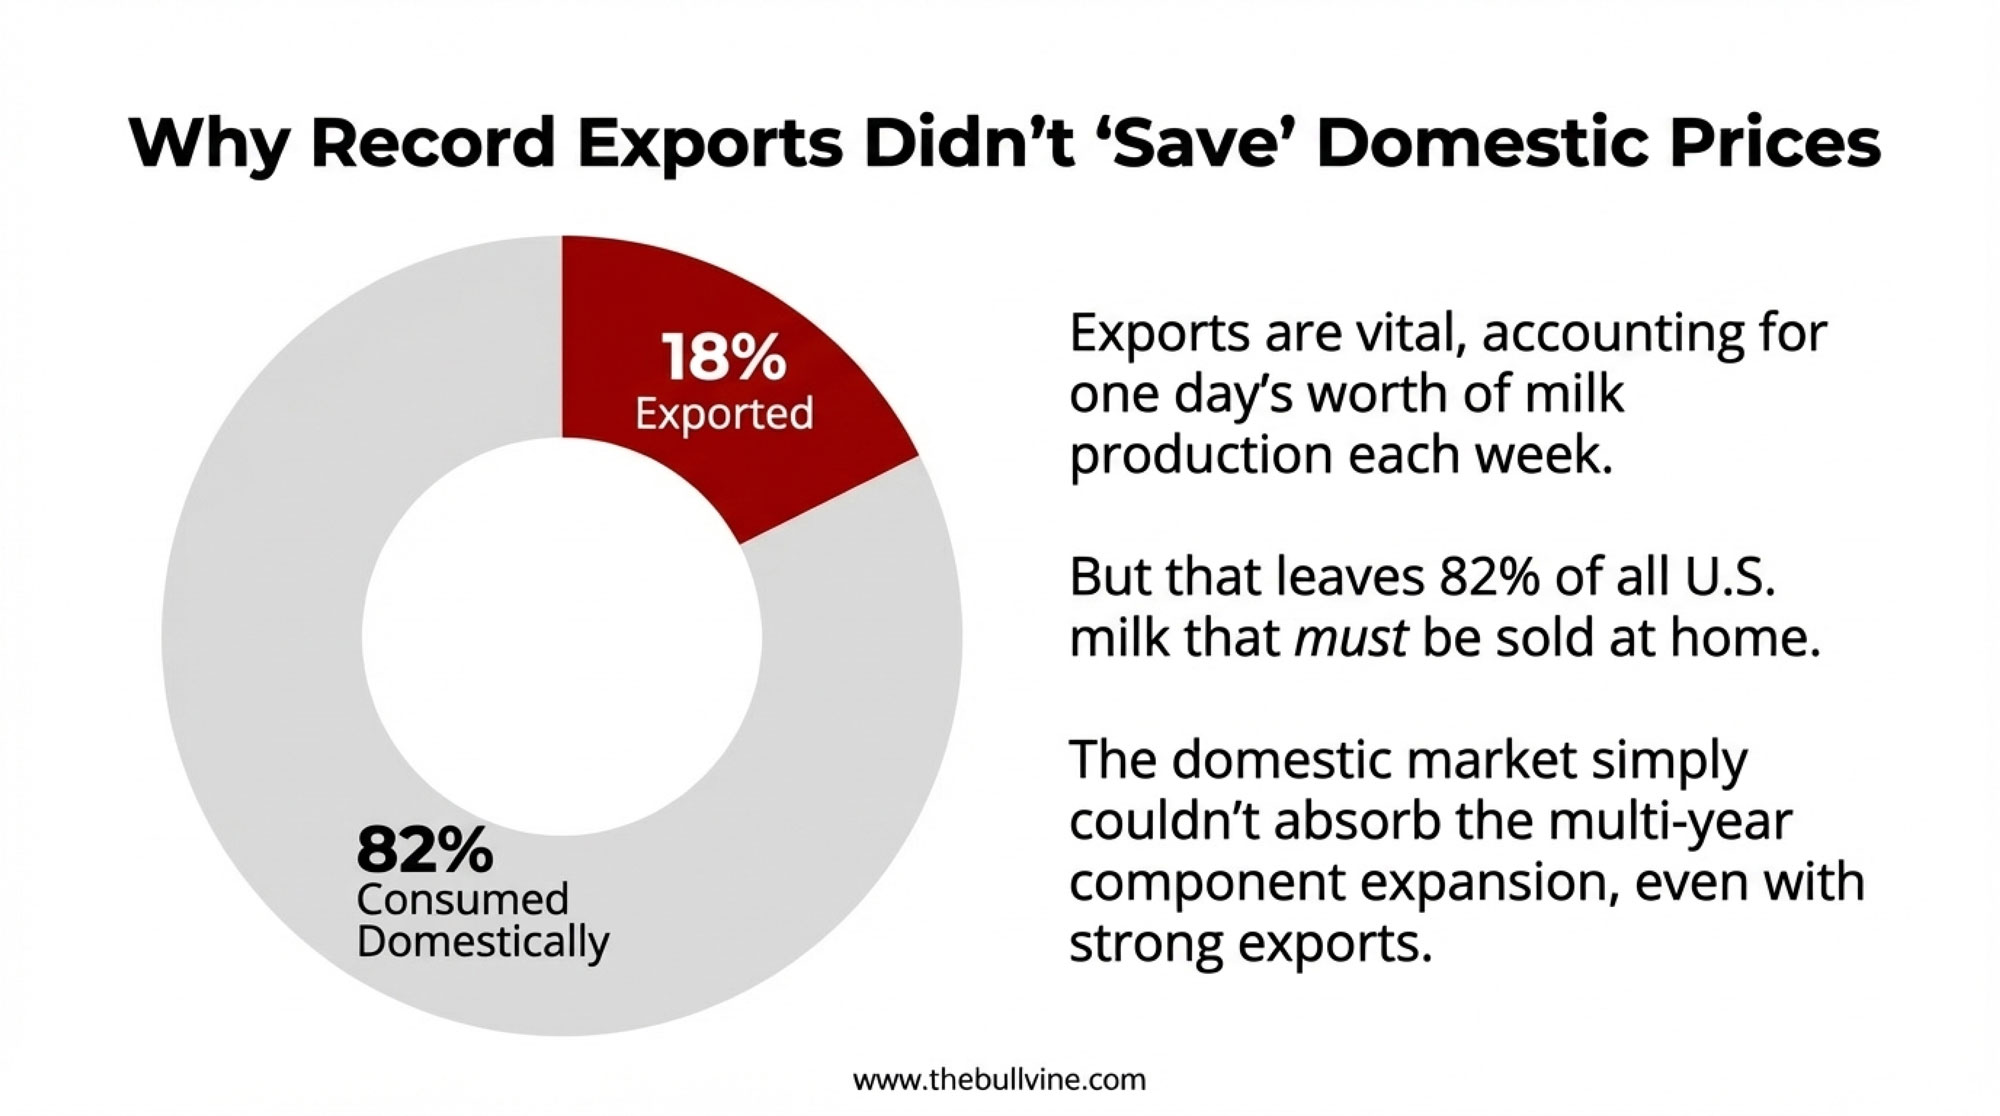
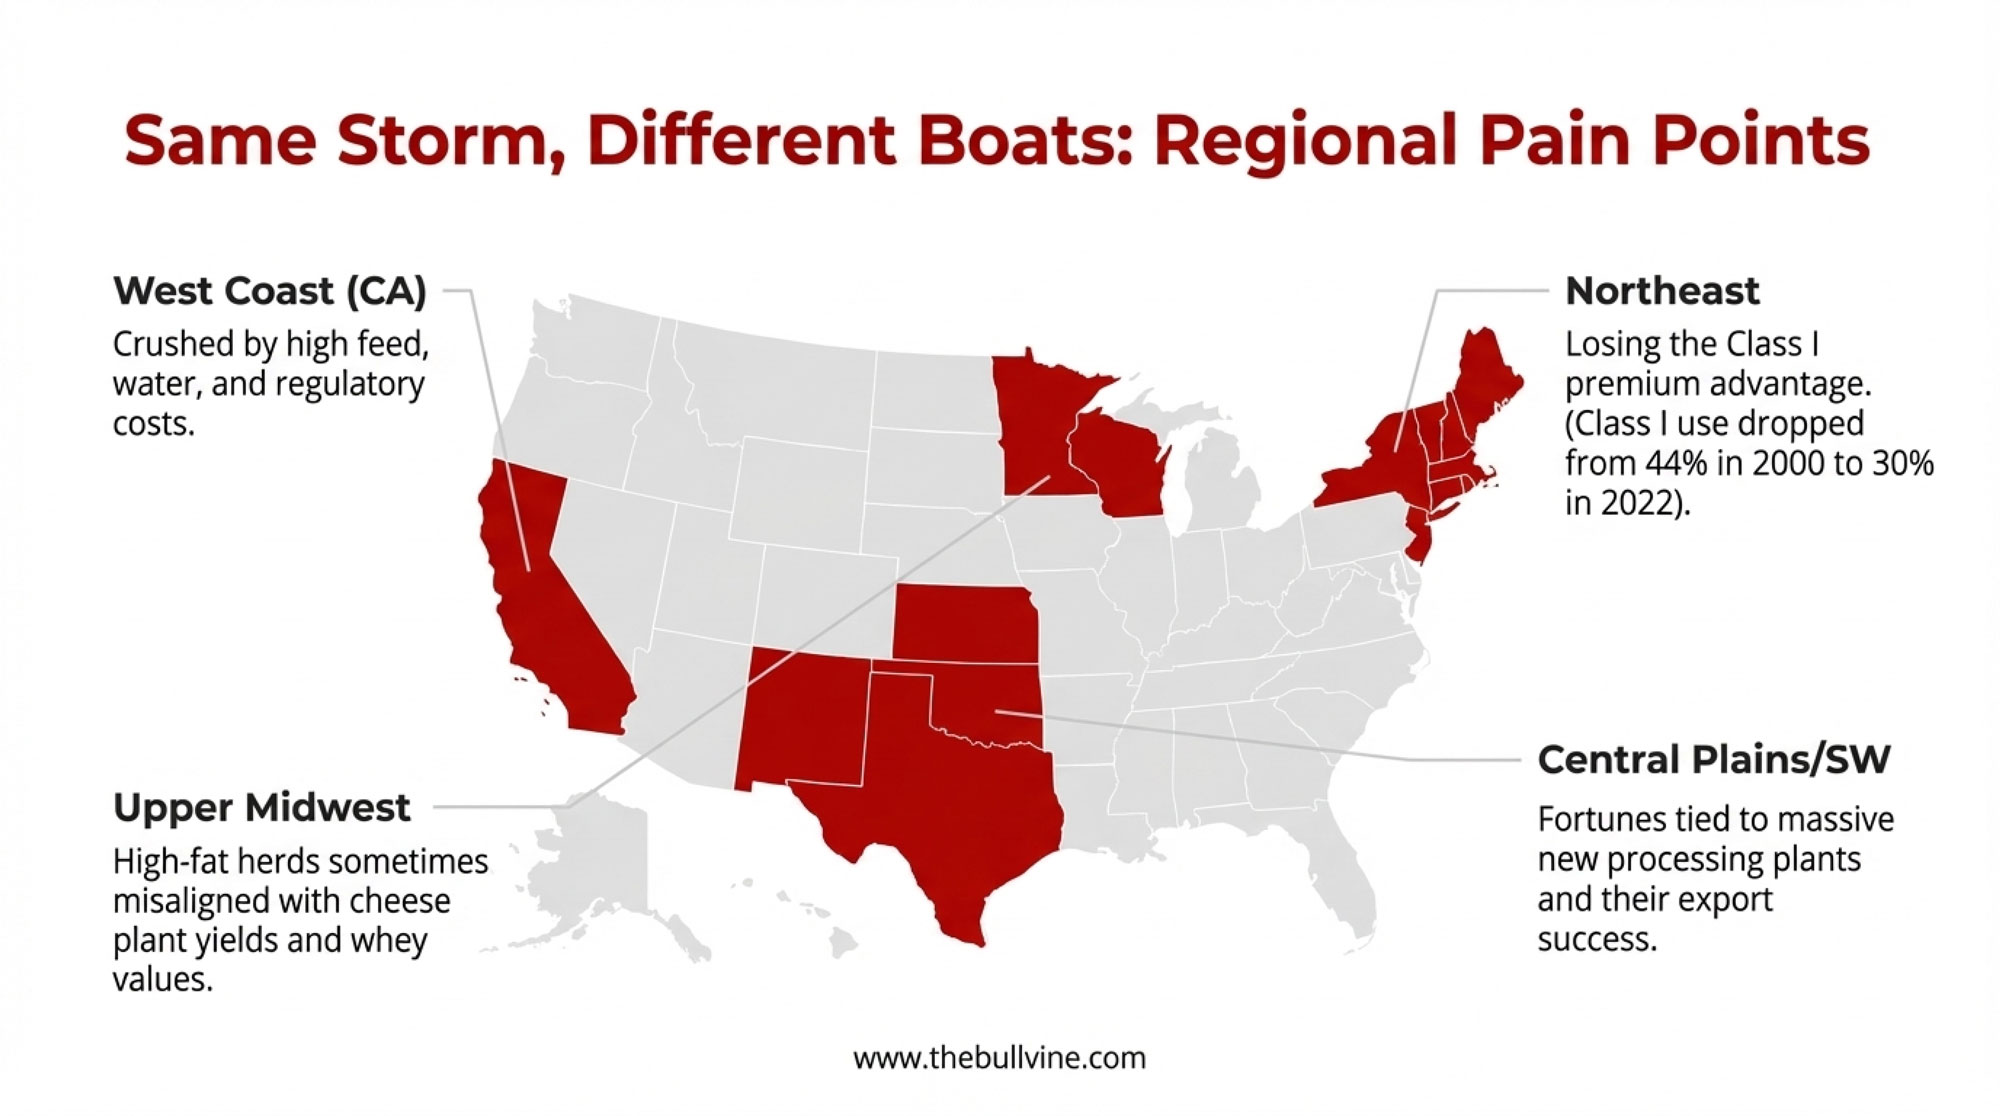
U.S. dairy processors have committed over $11 billion to new and expanded manufacturing capacity across 19 states, with more than 50 individual projects slated for 2025 through early 2028, according to the International Dairy Foods Association. The top five states by investment: New York ($2.8 billion), Texas ($1.5 billion), Wisconsin ($1.1 billion), Idaho ($720 million), and Iowa ($701 million).
Hilmar’s $600 million cheese plant in Dodge City, Kansas, and Leprino Foods’ roughly $1 billion complex in Lubbock, Texas, are the anchors of a processing wave pulling milk production toward the Southern Plains. Ben Laine, senior dairy analyst at Terrain, sees the optimistic read: “If you’re building new cheese plants and you need to fill them with milk, you’re going to pay what it takes to get the milk in there… producers might be able to negotiate and move around, and that’s not something they’ve had in a long time.”
That’s one read. The cautious one is simpler: those plants will fight hard for milk from the most scalable suppliers. They aren’t following milk. They’re creating gravity wells.
For larger operations positioned to fill those plants, this is a real opportunity. But for a mid-size dairy that signs an exclusive supply agreement with a single processor? That’s a kingdom built on sand. When that processor shifts its sourcing, renegotiates terms, or simply doesn’t renew your contract, you’re left with a barn full of cows and nowhere to ship.
How Dependent Is Too Dependent?
In most industries, lenders and risk analysts flag customers with revenue above 20–25% as a concentration concern. Dairy’s regional processor limitations push that practical ceiling higher—but as a working threshold, never let any one buyer control more than 60% of your revenue. Above that, you don’t have a customer. You have an owner who hasn’t filed the paperwork.
Most farms already feel like they’re in this boat. In a lot of regions, you’re effectively tied to one co‑op or processor, with the hauler taking you to the same plant every day. You don’t flip a switch and suddenly have three buyers fighting for your milk — but carving out even 10–20% of your volume for a secondary outlet (on‑farm processing, a specialty contract, or a second plant where geography allows) turns absolute dependence into something closer to leverage.
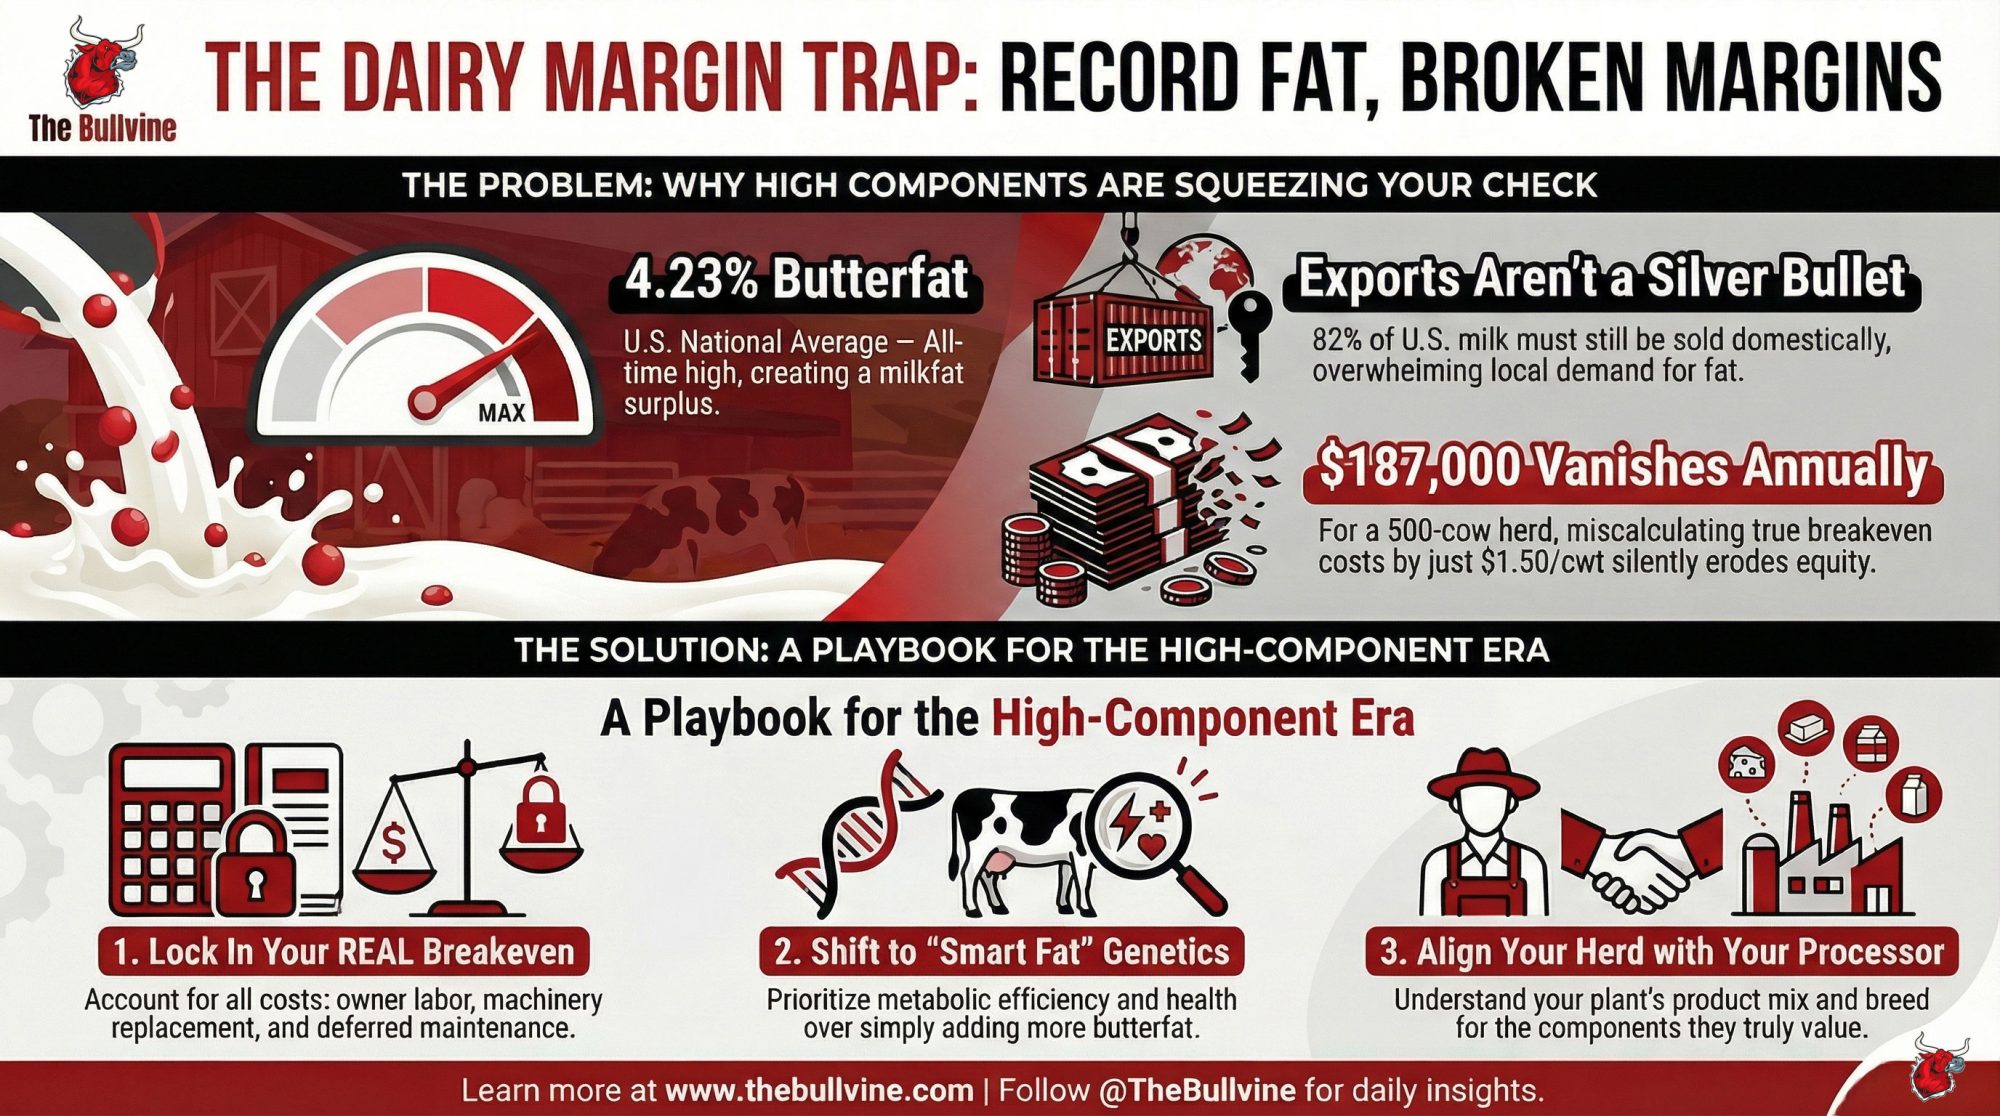
CoBank’s Corey Geiger warned in October 2025 that protein is overtaking fat on the milk check: “Protein will take over the pole position on milk checks because we need more of it.” That shift will reshape which contracts pay what, and operations locked into a single buyer won’t have room to pivot.
Diversifying market access is easier said than done, especially in regions where one processor dominates. But the time to explore alternatives — a specialty contract here, cooperative membership that spreads your risk there — is before you need them. Not after the call comes.
The 40 Days That Test Everything
Lent’s framework isn’t just a metaphor for the three temptations. Forty days shows up in the dairy in ways that are almost eerie, how precisely they parallel the spiritual discipline.
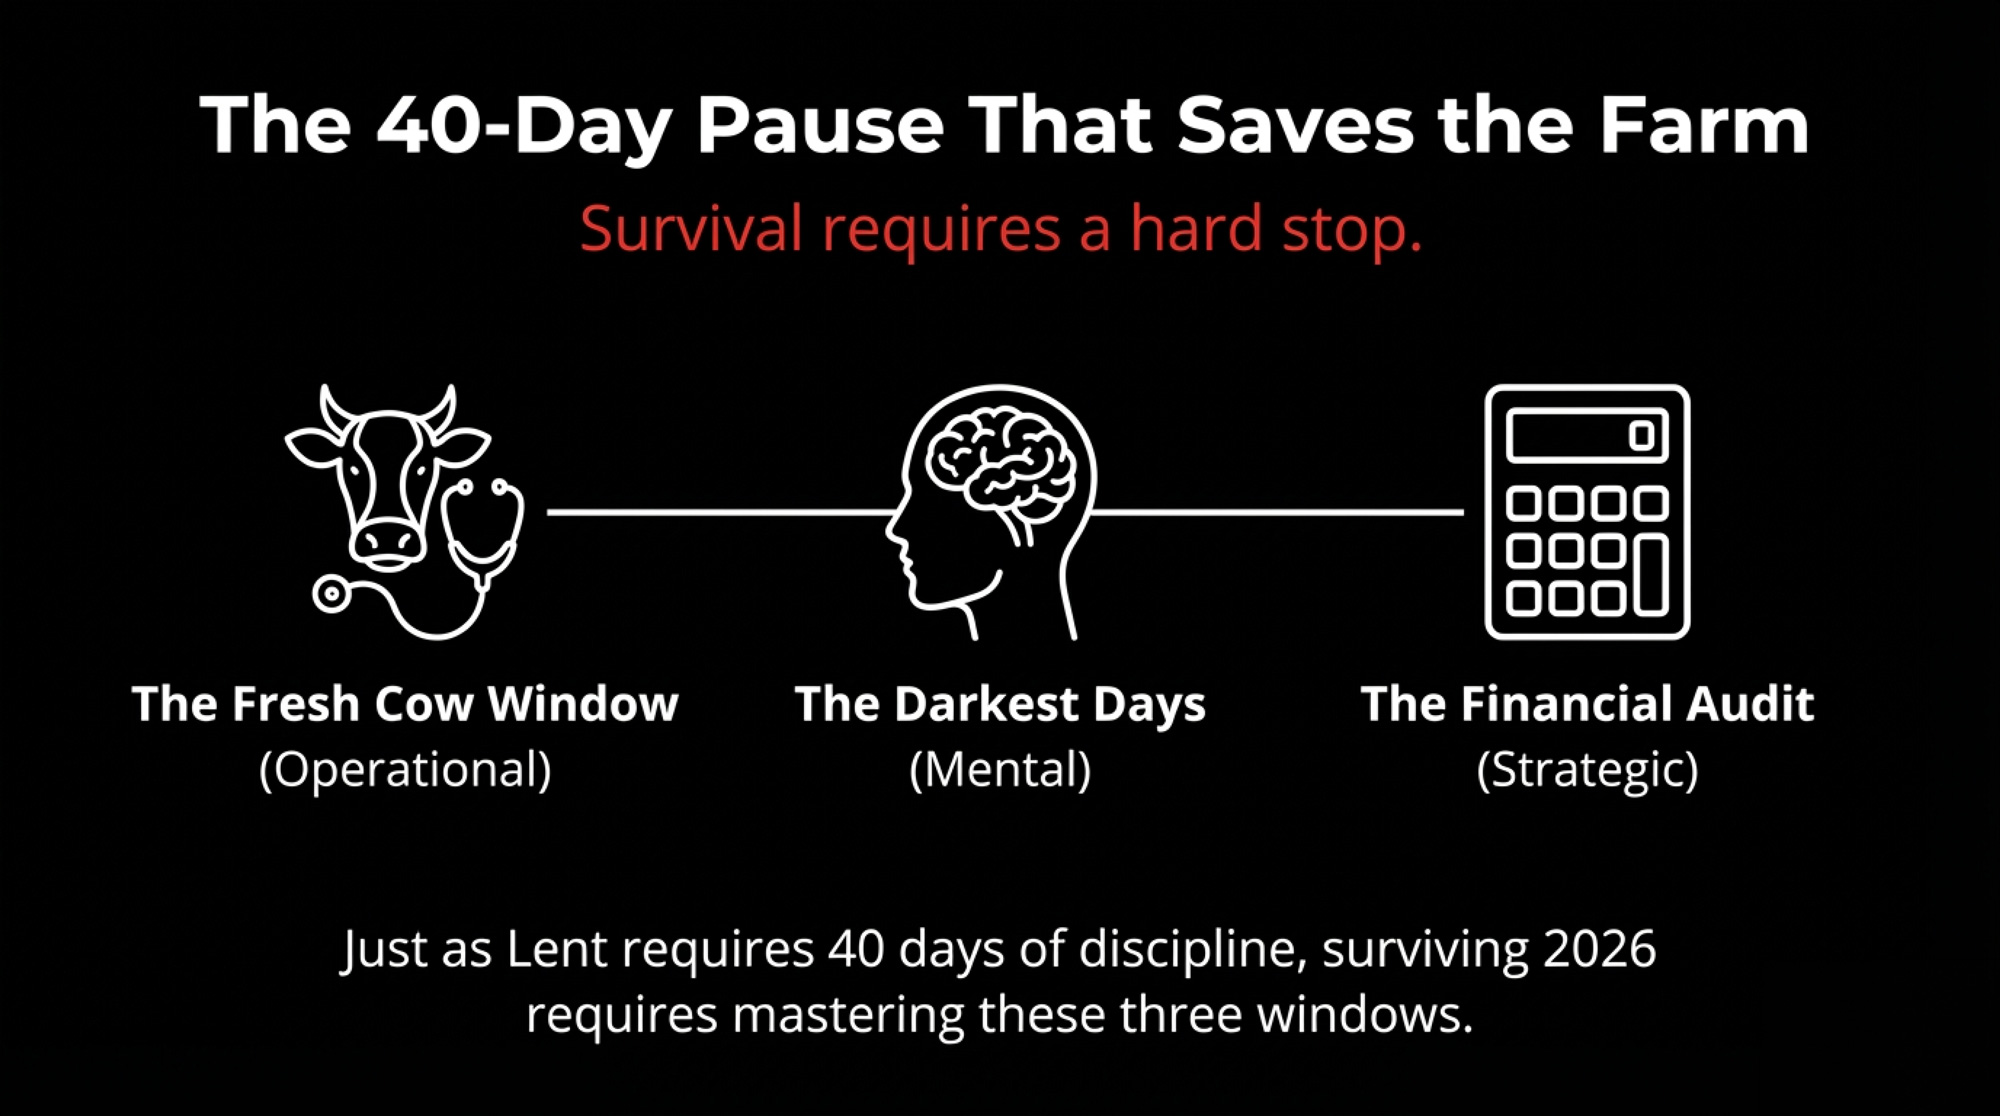
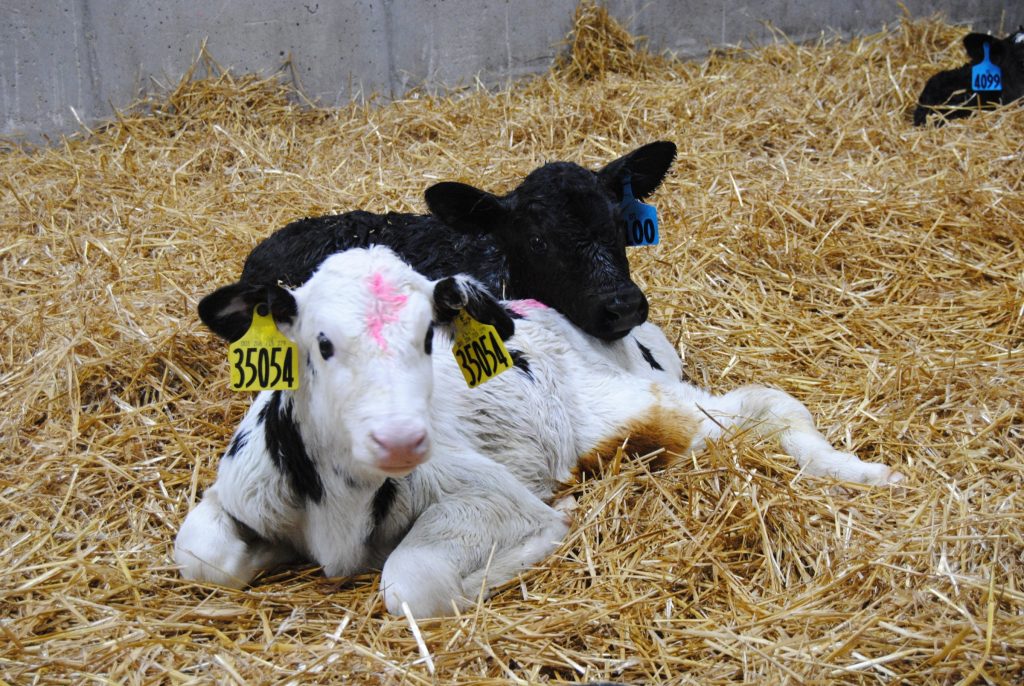
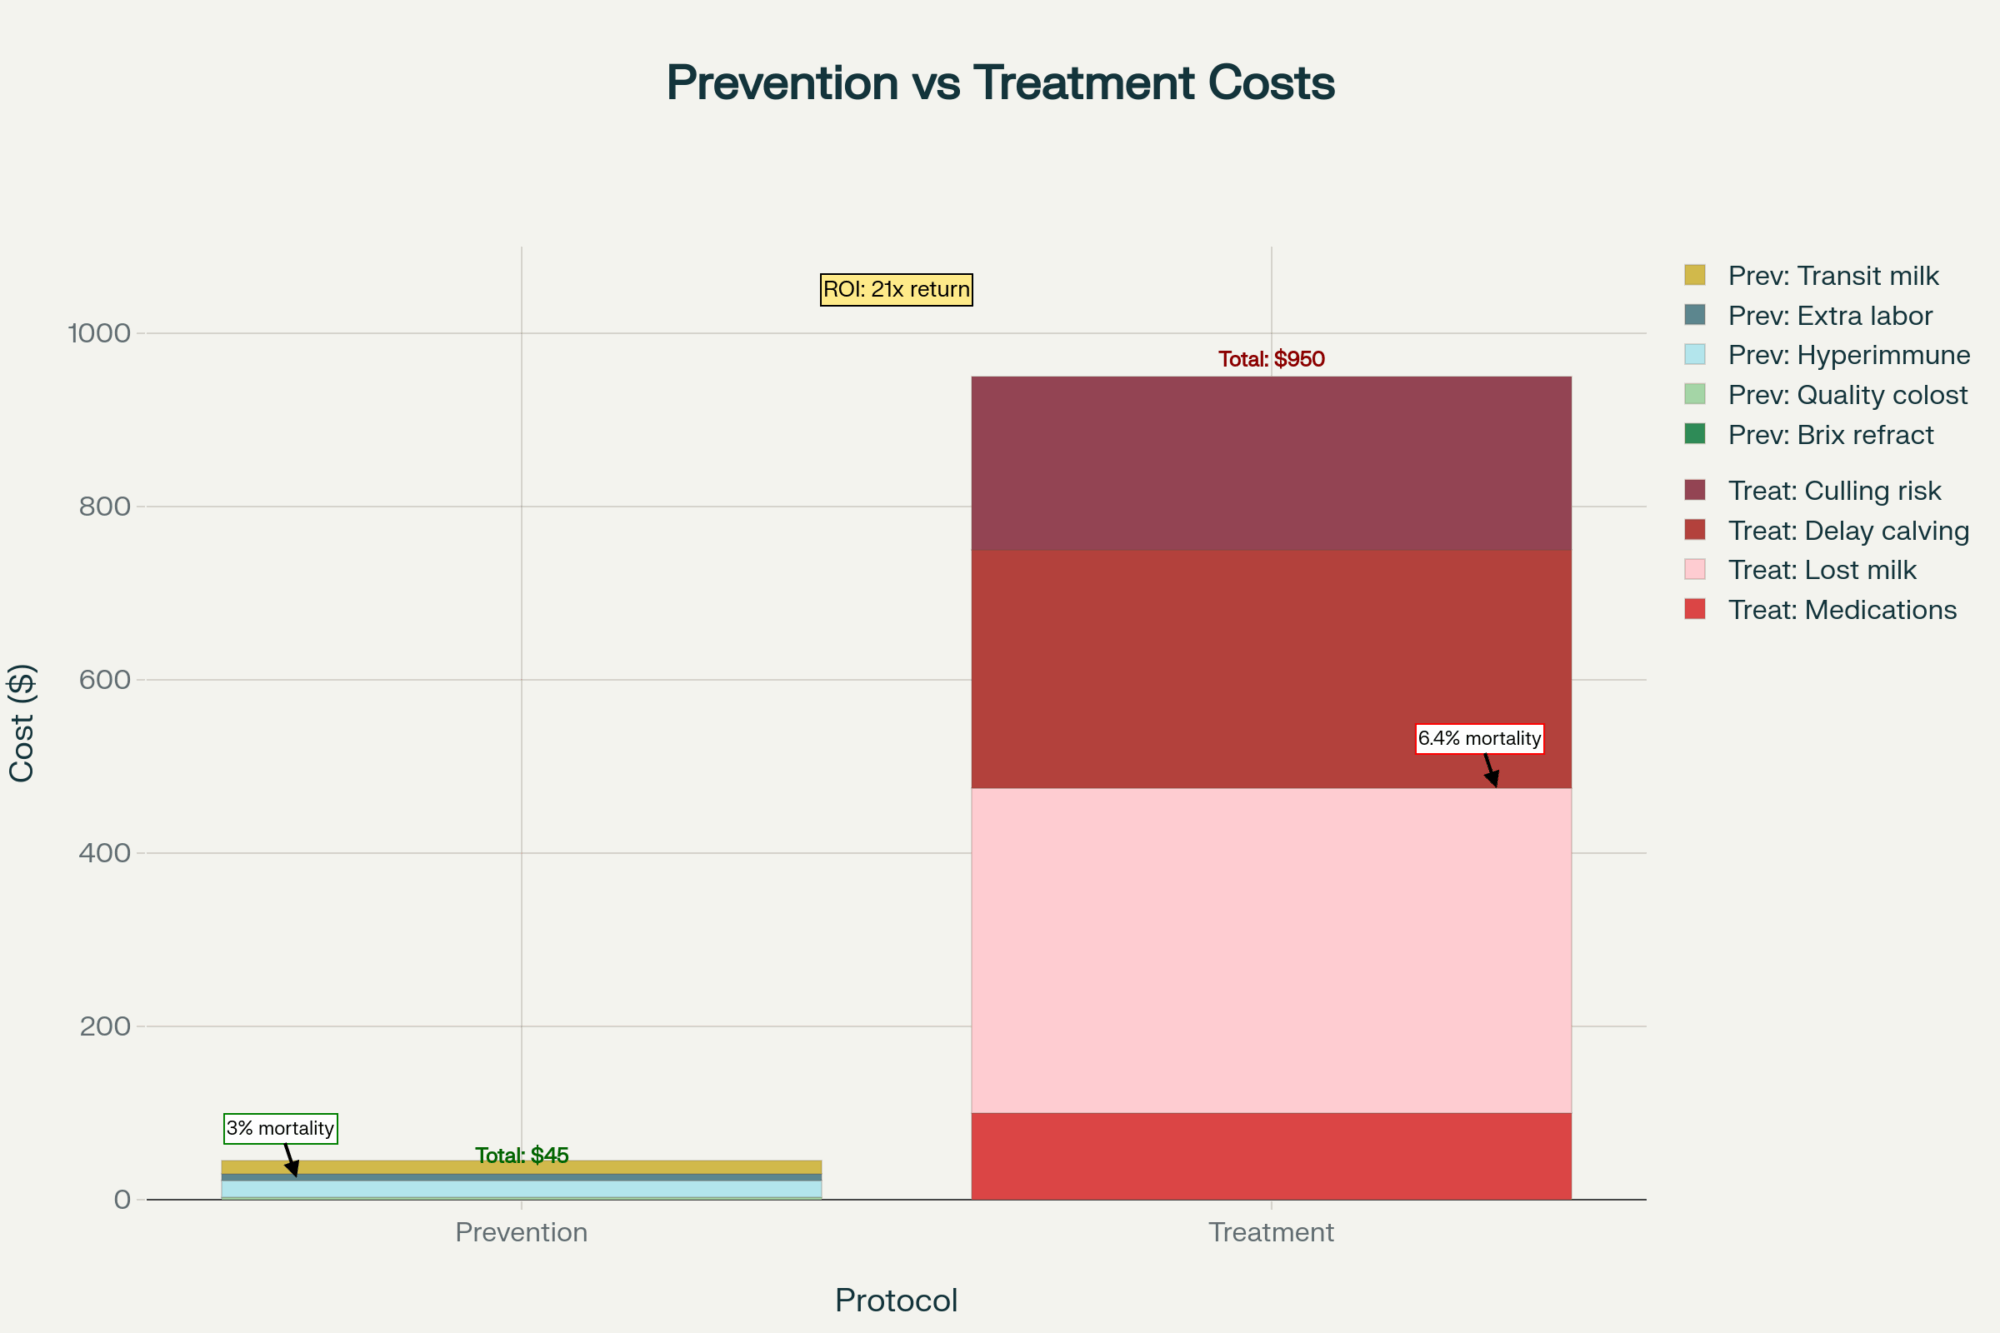
The 40-Day Fresh Cow Window. The transition period — roughly three weeks before calving through three weeks after — is where profitability is won or lost at the individual cow level. Penn State Extension research on transition cow management confirms that over a third of fresh cows develop multiple health problems in their first 30 days, and that targeted protocols addressing subclinical ketosis ($300–$350 per case) and metritis ($300–$500 per case) can deliver a net benefit of $200–$500 per cow per lactation.
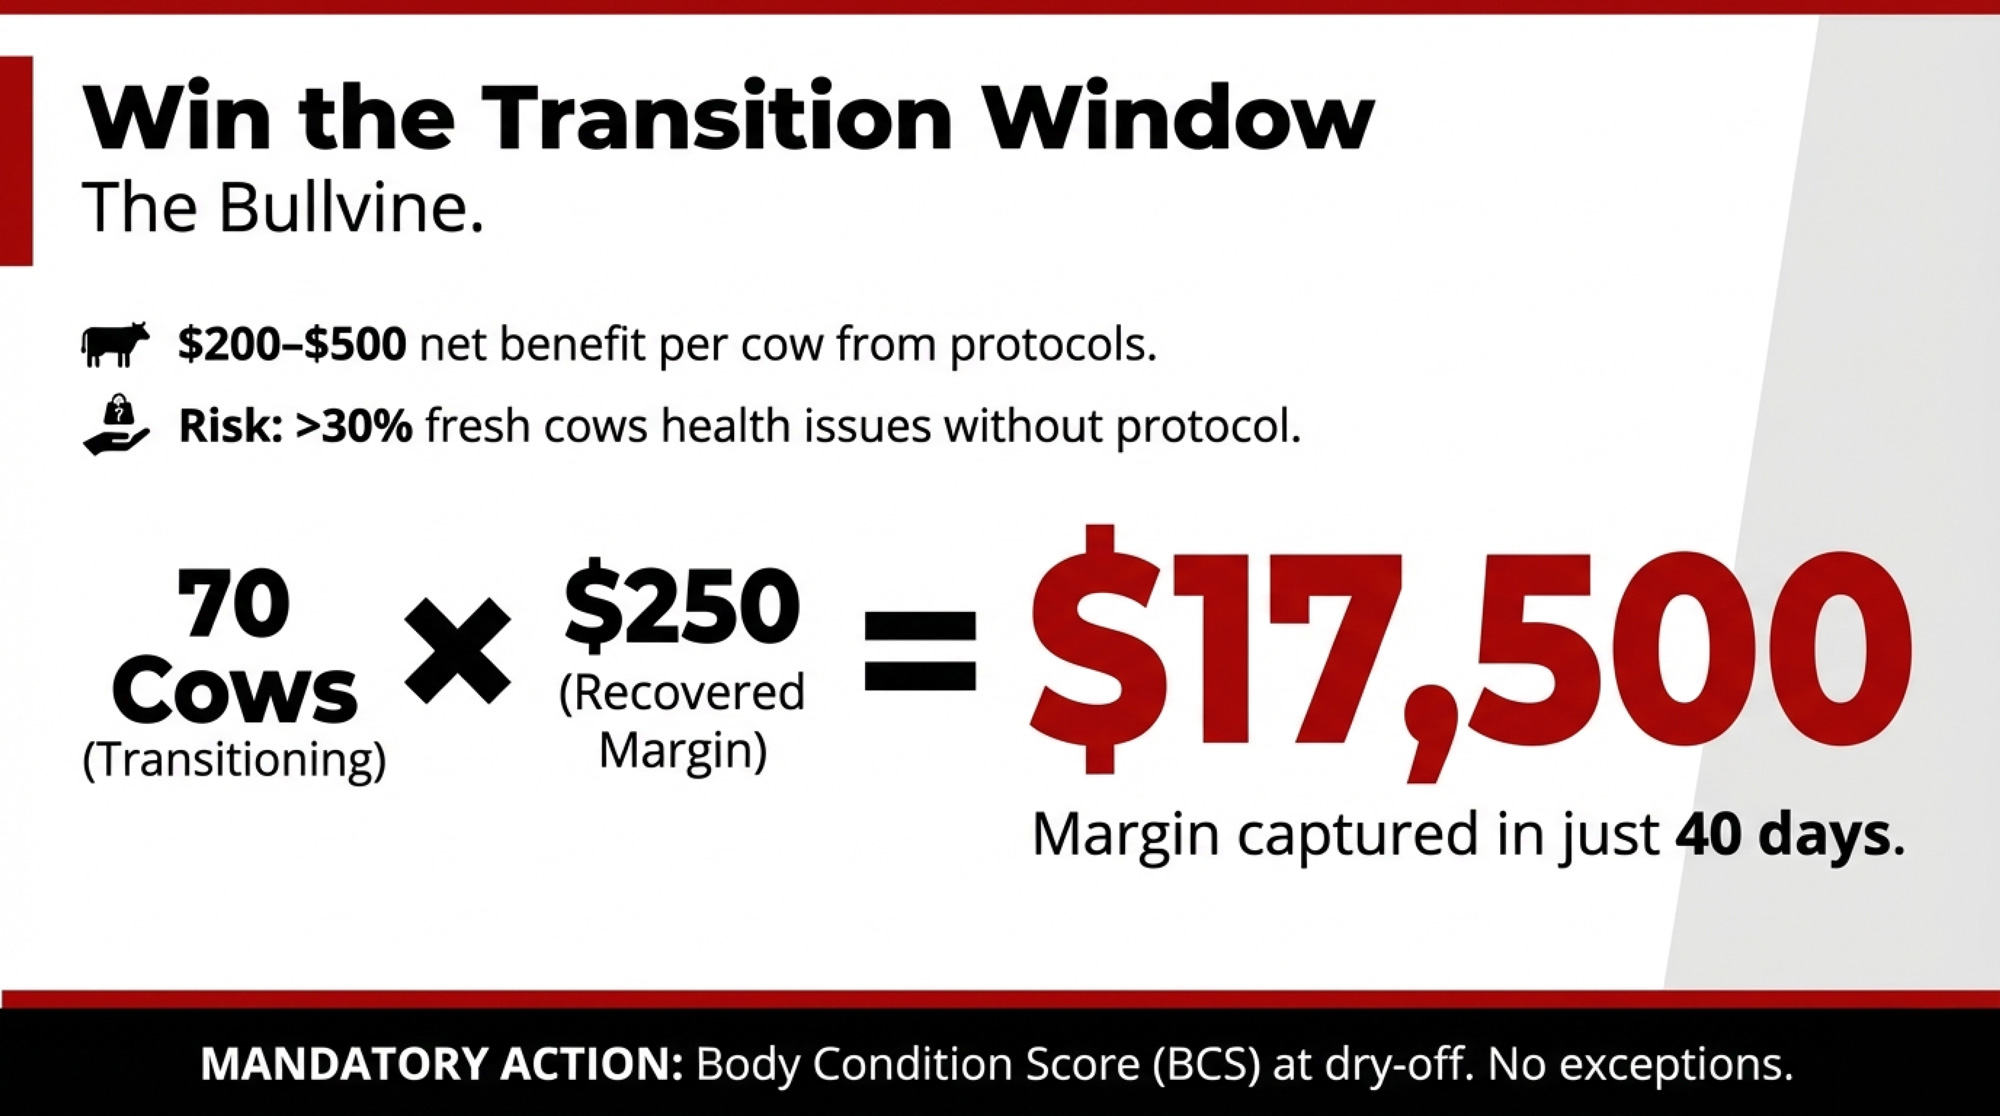
The barn math on this is straightforward. A 200-cow herd that freshens year-round puts roughly 65–70 cows through transition in any given 40-day period. If your protocols recover even $250 per cow across those animals, that’s $16,000–$17,500 in margin over 40 days. That’s what farms implementing targeted protocols — body condition scoring at dry-off, DCAD ration management, consistent fresh-cow checks — actually deliver when they execute consistently.
The 40 Darkest Days. And then there’s the window nobody wants to talk about. Late January through early March. Days are shortest, isolation peaks, and the cumulative weight of winter sits heaviest on the people doing the milking.
Dr. Andria Jones-Bitton’s research team at the University of Guelph surveyed over 1,100 Canadian farmers and found that 45% reported high stress, 57% met classifications for anxiety, and 35% met classifications for depression. Published in Social Psychiatry and Psychiatric Epidemiology in 2020, it was one of the first large-scale examinations of farmer mental health in Canada. A follow-up study during COVID-19, conducted in 2021, found the numbers held or worsened — 76% reported moderate or high perceived stress. One in four farmers surveyed reported having thought their life wasn’t worth living or had thoughts of taking their own life in the prior 12 months.
Jones-Bitton told the Saskatoon StarPhoenix that the public’s romanticized image of farming “underestimates the range of stressors that farmers are actually experiencing.” As one participant wrote in the COVID-era survey: “There is no sick note for farmers.”
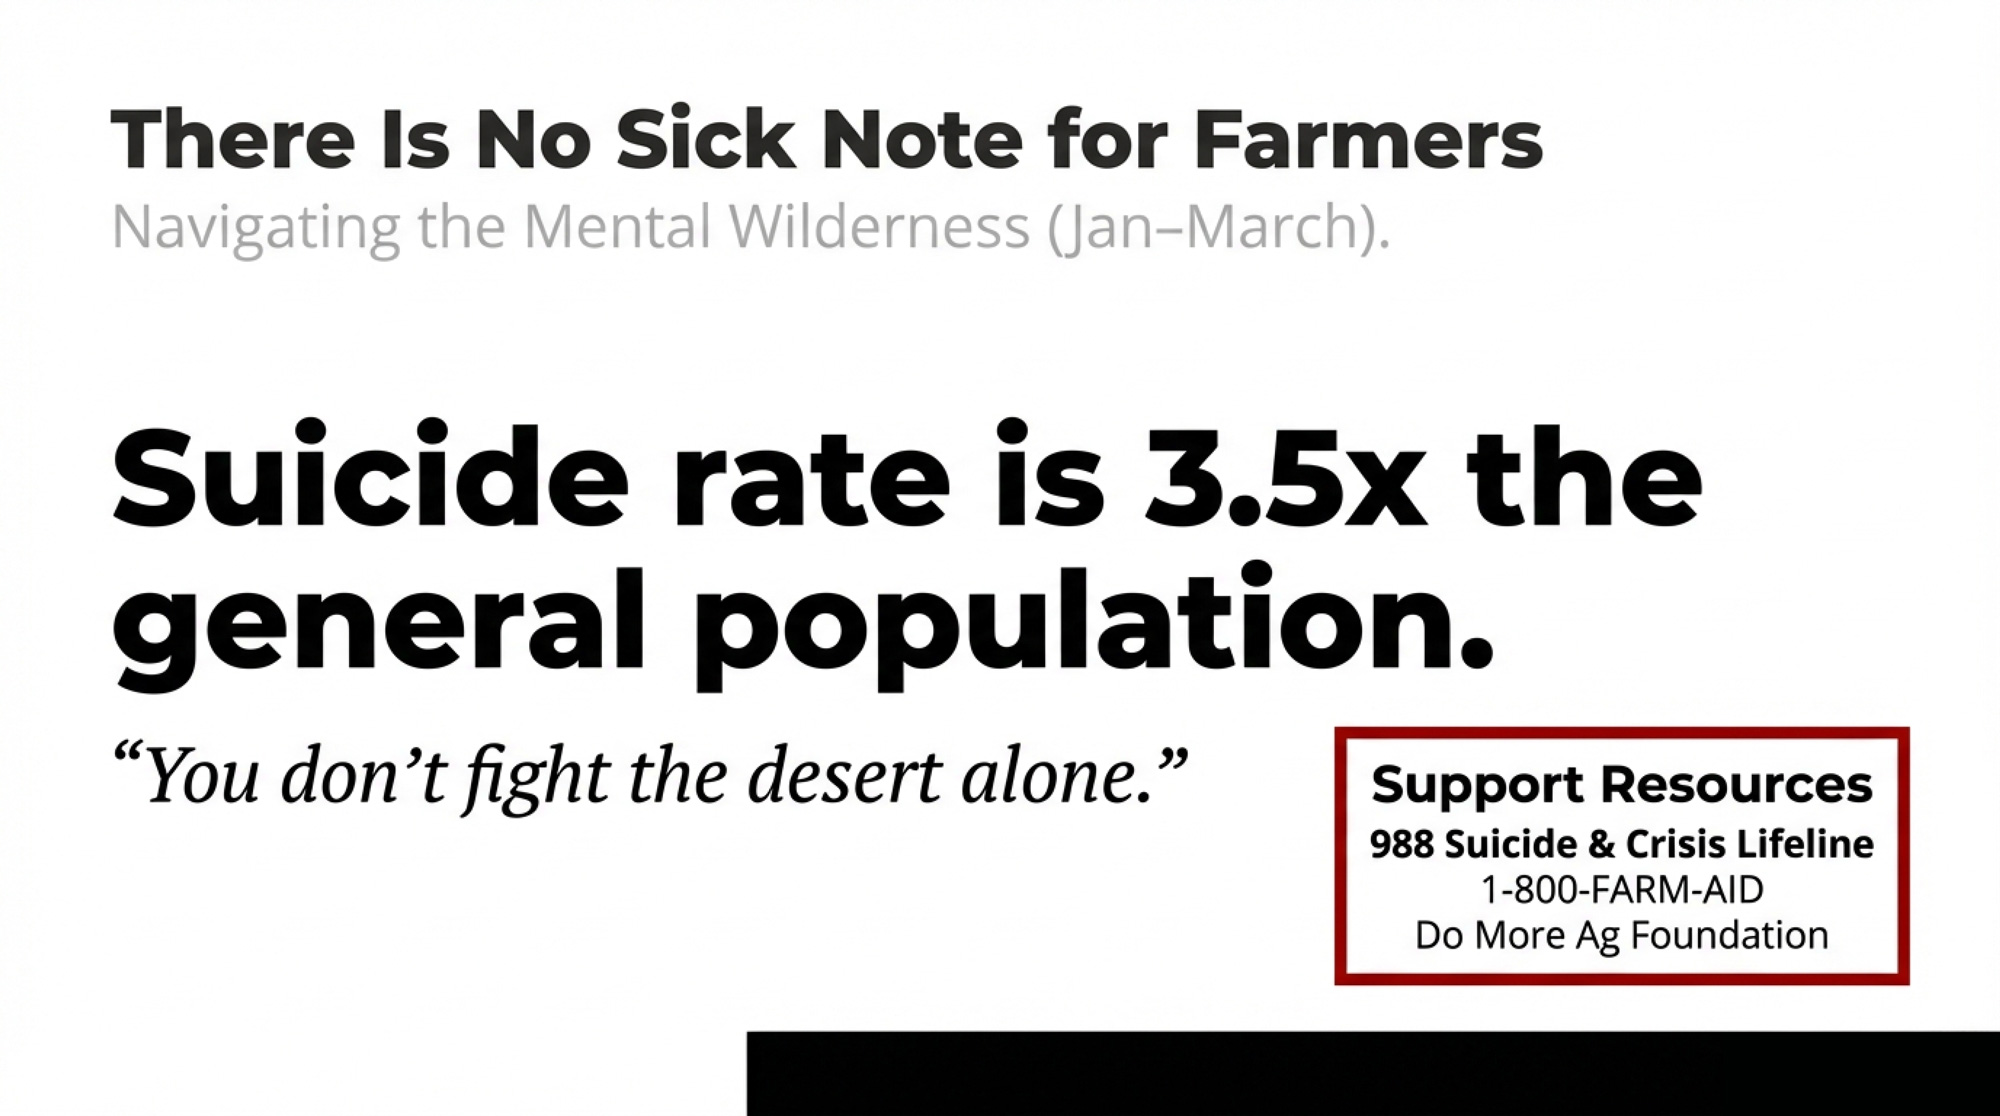
The National Rural Health Association reports that farmers die by suicide at 3.5 times the rate of the general population — a figure drawn from University of Iowa research covering 1992–2010 that has been cited in federal testimony and NRHA policy briefs. The most recent CDC data, published in MMWR in December 2023 using 2021 death records from 49 states, found that male workers in agriculture, forestry, fishing, and hunting had a suicide rate of 47.9 per 100,000 — compared to 32.0 per 100,000 for all male working-age adults. That’s roughly 50% higher than the national average for men. By either measure, farming remains one of the deadliest occupations for suicide in America.
The wilderness that tests the herd is the same wilderness that tests the farmer. And the Gospel’s answer is the same as the research: you don’t fight the desert alone.
If you or someone you know is struggling:
- Farm Aid: 1-800-FARM-AID
- 988 Suicide & Crisis Lifeline: Call or text 988
- Do More Ag Foundation: domore.ag
- Crisis Services Canada: 1-833-456-4566
What You Do Before Spring Decisions
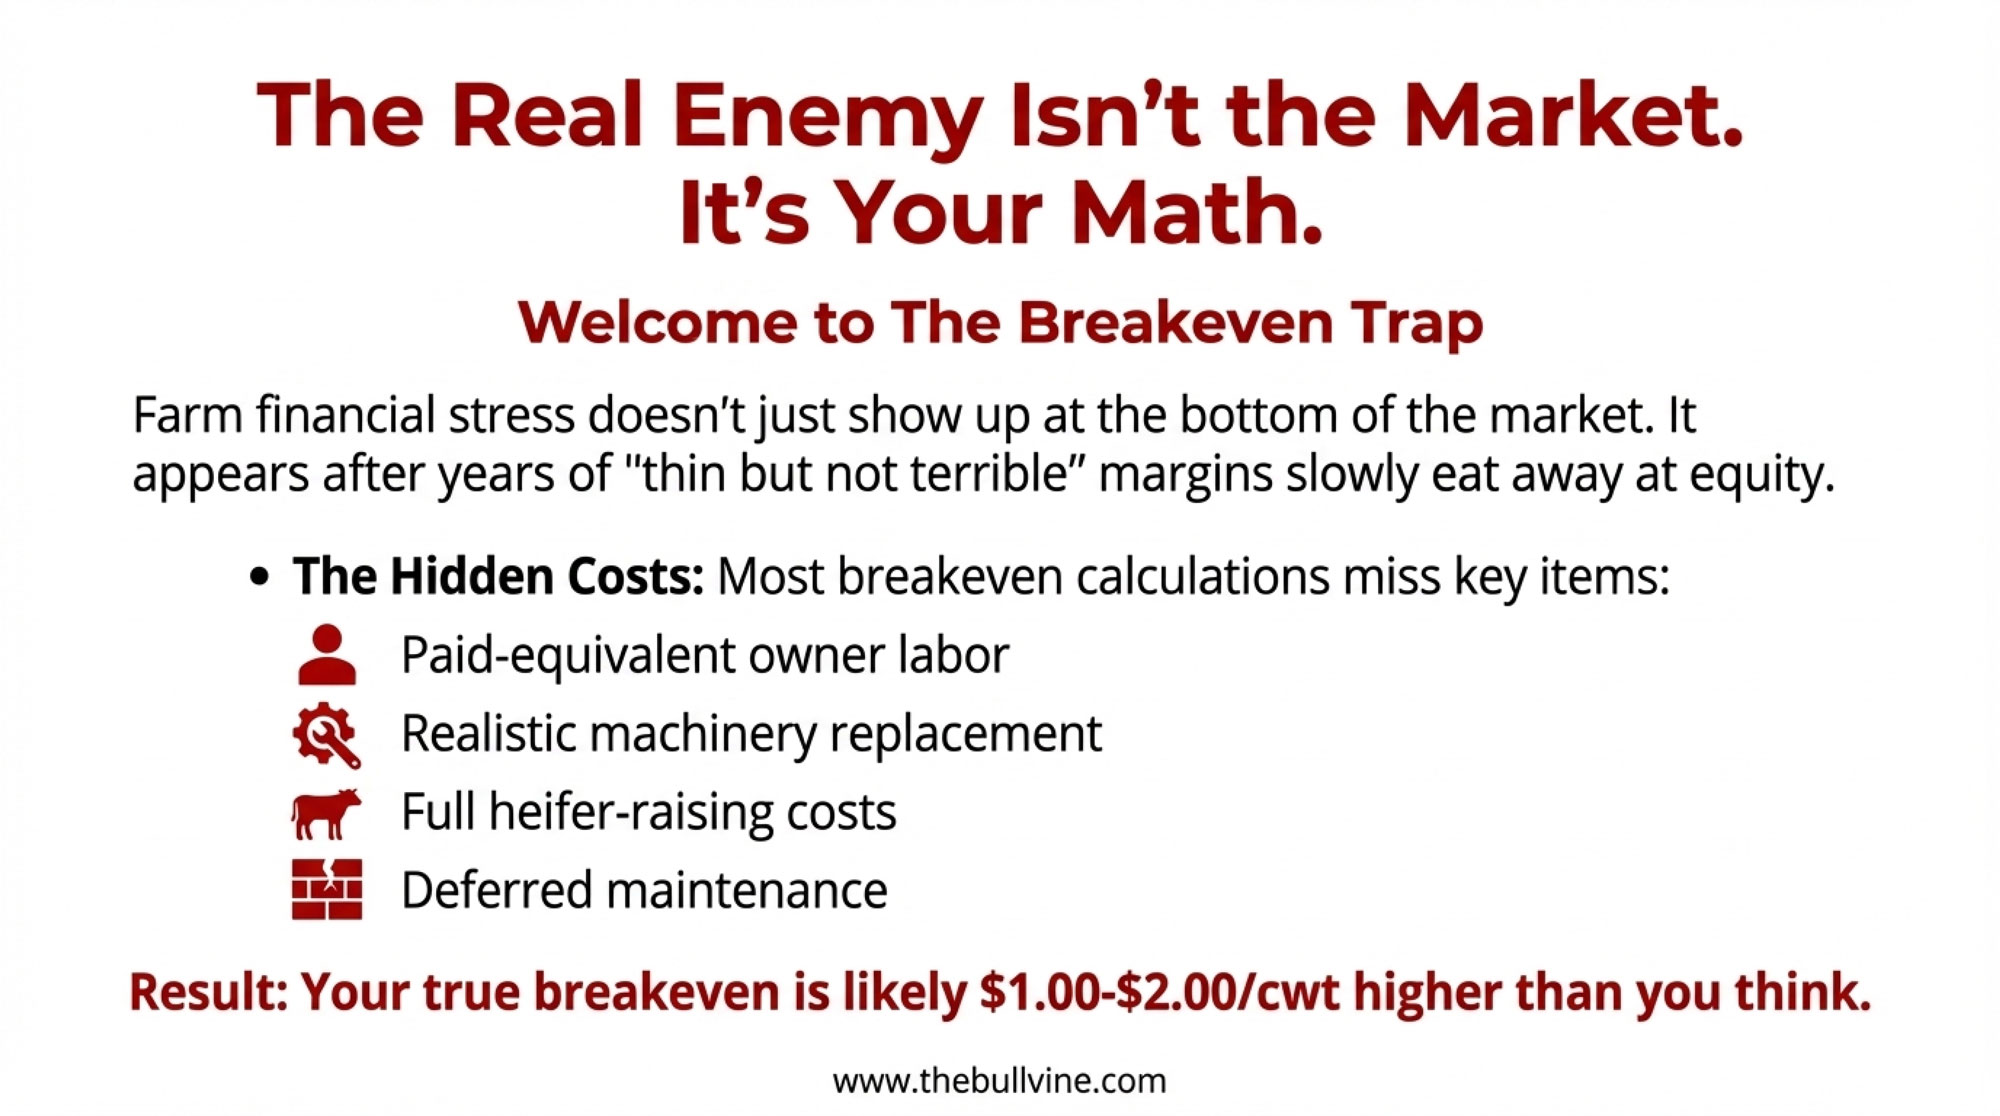
Path 1: Impose a 40-day audit before any major decision. Before you sign a breeding overhaul, barn expansion loan, or new processor agreement — stop. Pull your herd’s actual cost of production. Not the number in your head. The real one, with family labor at $18–$22/hour, depreciation at replacement value, and opportunity cost included. Run your debt-to-EBITDA ratio. Stress-test every scenario at $18/cwt all-milk price for six months — USDA’s February WASDE pegs 2026 all-milk at $18.95/cwt, but January’s actual Class III was $14.59. If the decision survives that test, proceed. If it doesn’t, you just saved your operation.
30-day action: This week, pull your last 12 months of actual expenses and calculate your true cost of production — including family labor and depreciation at replacement value. Do it before you commit to any spring decisions.
Path 2: Rebalance your sire stack toward proven reliability. If more than half your matings go to genomic young sires with reliability below 80%, you’re speculating. Use young sires on your bottom-half animals — the ones going beef anyway — and anchor your keeper matings to bulls with at least one daughter-proof cycle behind them. McCarty Family Farms runs nearly 20,000 cows this way. The $85/cow/year in Net Merit gains since 2010 came from whole-herd testing and data-driven culling, not hero-bull betting.
The risk: You may sacrifice some short-term index flash. You gain consistency across lactations. As the 2026 proof runs release, track which young sires maintain their rankings from genomic to daughter-proven. That transition — or lack of it — tells you everything.
Path 3: Audit your processor concentration now. Map your revenue sources. If one buyer accounts for more than 60% of your milk check, start building alternatives before the $11 billion processing investment wave reshuffles your region’s milk market.
Signal to watch: If your processor starts offering longer contract terms with volume floors, they’re locking you in. Negotiate optionality, not commitment.
Path 4: Treat transition like the 40-day audit it already is. If you’re not body-condition scoring at dry-off, you’re flying blind into your most expensive 40 days. Start there.
30-day action: Score every dry cow this month. Set up a tracking sheet — BCS at dry-off, calving date, health events through day 30. 90-day checkpoint: Review outcomes. You’ll have the data to see exactly where your transition dollars are leaking. 365-day benchmark: Run the full audit again next Lent. Compare your February 2027 numbers to this year’s baseline. If you’ve held the line, you’ll know it in the data.
Key Takeaways
- If more than 50% of your matings go to sires below 80% reliability, you’re not using genomics — you’re gambling with it. Tier your sire stack: proven bulls on keepers, young sires on beef-cross candidates. McCarty Family Farms found 28% parentage errors before genomic testing cleaned the records. Fix the foundation first.
- If your expansion can’t cash-flow at $18/cwt for six months, don’t build. USDA projects an all-milk price of $18.95/cwt for 2026. January’s Class III was $14.59. Stay below 4:1 debt-to-EBITDA. Insist on 1.25 term debt coverage. Kooser Farms filed Chapter 12 twice in six years. Plan B doesn’t always get a Plan C.
- If one processor controls more than 60% of your revenue, you have a dependency, not a marketing plan. Start diversifying before the $11 billion processing wave reshuffles your region.
- If someone on your operation is struggling, that matters more than any ratio in this article. Call 988 or 1-800-FARM-AID. Isolation is the accelerant. Reaching out is the intervention.
The Bottom Line
The farms that make it through this cycle won’t be the ones who never faced temptation. Every dairy farmer alive has stared at a young sire’s proof and wanted to believe the number. Run the expansion math at peak milk price and felt the pull. Looked at a processor contract and thought, this solves everything.
The ones still milking in 2030 will be the ones who built in the pause. Forty days. Real numbers. And the willingness to admit that some shortcuts aren’t salvation — they’re just stones.
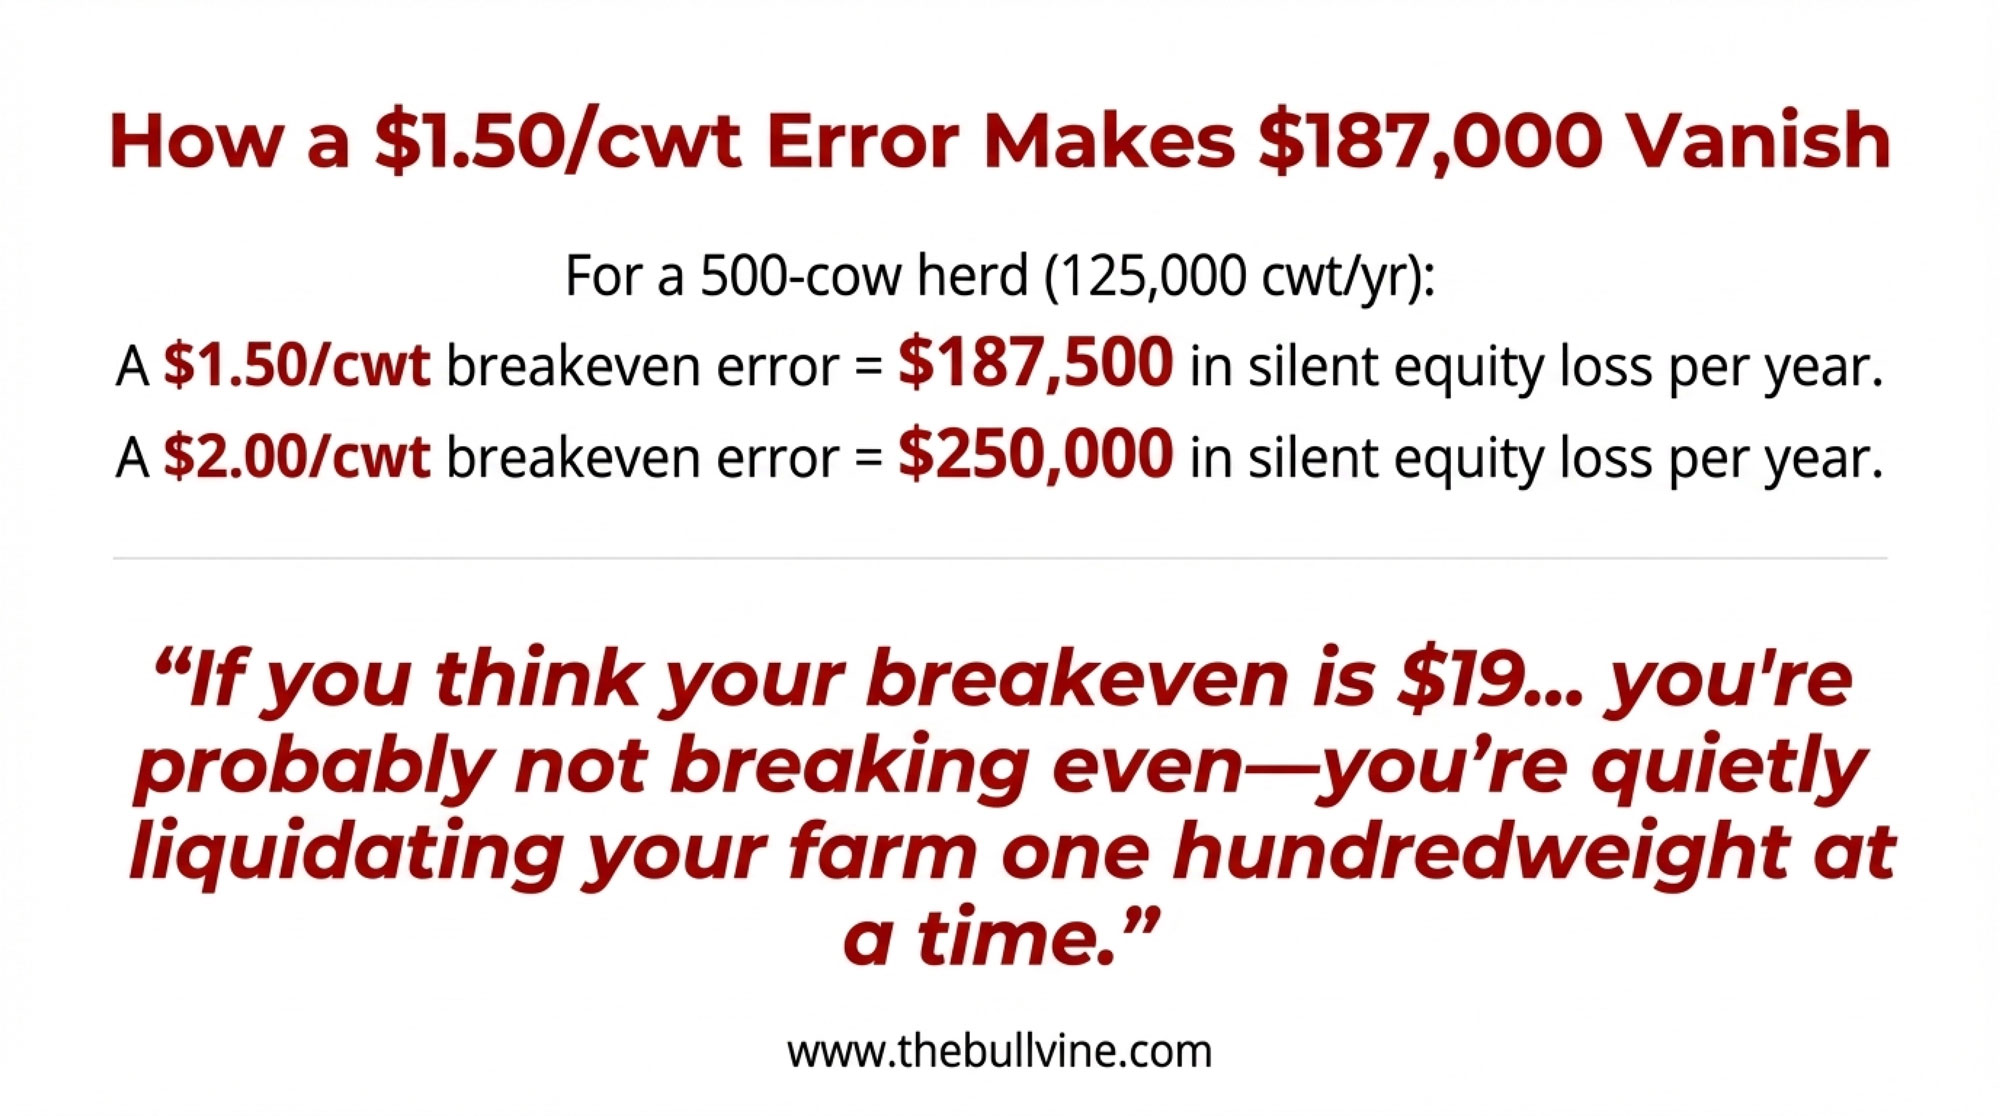
Where does your breakeven actually sit right now? Not last spring’s number. The one that accounts for $3,500 heifers, $624.7 billion in sector-wide debt, and a milk check that just dropped from $21.17 to $18.95 in a single year.
Pull it. Run it. Then decide.
Complete references and supporting documentation are available upon request by contacting the editorial team at editor@thebullvine.com.
Learn More
- Beef-on-Dairy’s $500,000 Swing: What 72% of Farms Know That’s Costing You $1,000/Cow Every Year – GAIN a $500,000 revenue swing by mastering the beef-on-dairy math. This breakdown exposes the “breeding flip” and arms you with a 30-day protocol to capture $700 premiums per calf before the 2026 heifer gap narrows your options.
- Beyond Efficiency: Three Dairy Models Built to Survive $14 Milk in 2026 – GAIN a bulletproof 90-day liquidity plan that safeguards your operation against $14 milk. This analysis delivers three proven business models and reveals how intentional diversification creates a competitive advantage that simple “hard work” never will.
- Did Genomics Really Deliver What We Think It Did? $238,000 Says Yes – If You Steer It Right – GAIN a $238,000 genetic edge by navigating the modernized 2025 LPI dashboard. This deep dive exposes the inbreeding traps of the genomic era and reveals how steering your sire stack toward health-focused indexes protects your fourth-lactation margins.
 The Sunday Read Dairy Professionals Don’t Skip.
 The Sunday Read Dairy Professionals Don’t Skip.
Every week, thousands of producers, breeders, and industry insiders open Bullvine Weekly for genetics insights, market shifts, and profit strategies they won’t find anywhere else. One email. Five minutes. Smarter decisions all week.