Archive for butterfat production

Feed as Science: How the Penn State Particle Separator Turns TMR Consistency into Butterfat and Profit

Feed as Science: How the Penn State Box Turns TMR Consistency into Butterfat and Profit

I was in a feed room on a Wisconsin dairy not long ago when I noticed something familiar—a brand-new Penn State Particle Separator, still in the box and tucked behind a stack of feed samples. The herd manager laughed when he saw me notice it. “We bought it last winter,” he admitted, “but we’ve been too busy to get into the routine.”

You know, that exchange says a lot about where we are as an industry. We’ve got tools that can unlock thousands of dollars in performance, but in the rush of day-to-day dairy life, the simplest ones often get sidelined. What’s interesting here is that this little plastic box—the Penn State Separator—is turning out to be one of the best pay-per-minute management tools we have.

Why Particle Size Still Deserves Attention

In recent years, research from Penn State Extension and the University of Wisconsin–Madison Department of Dairy Science has made one thing clear: physical feed structure drives both nutrition and profit. When TMR particle size drifts off target—either too fine or too coarse—milk output routinely dips 3–8 pounds (1.4–3.6 kg) per cow per day. Butterfat often falls 0.3–0.6 percentage points, especially when rumen function gets disrupted.

Those numbers add up quickly. For a 600-cow herd, that could easily amount to five figures in monthly component revenue left on the table.

Dr. Mike Hutjens, Professor Emeritus at the University of Illinois, puts it plainly: “Feed uniformity is your daily quality control system. Without it, you’re guessing.” And that’s the truth—consistency isn’t a luxury metric; it’s how high-performing dairies stay profitable year-round.

The Science Inside the Box

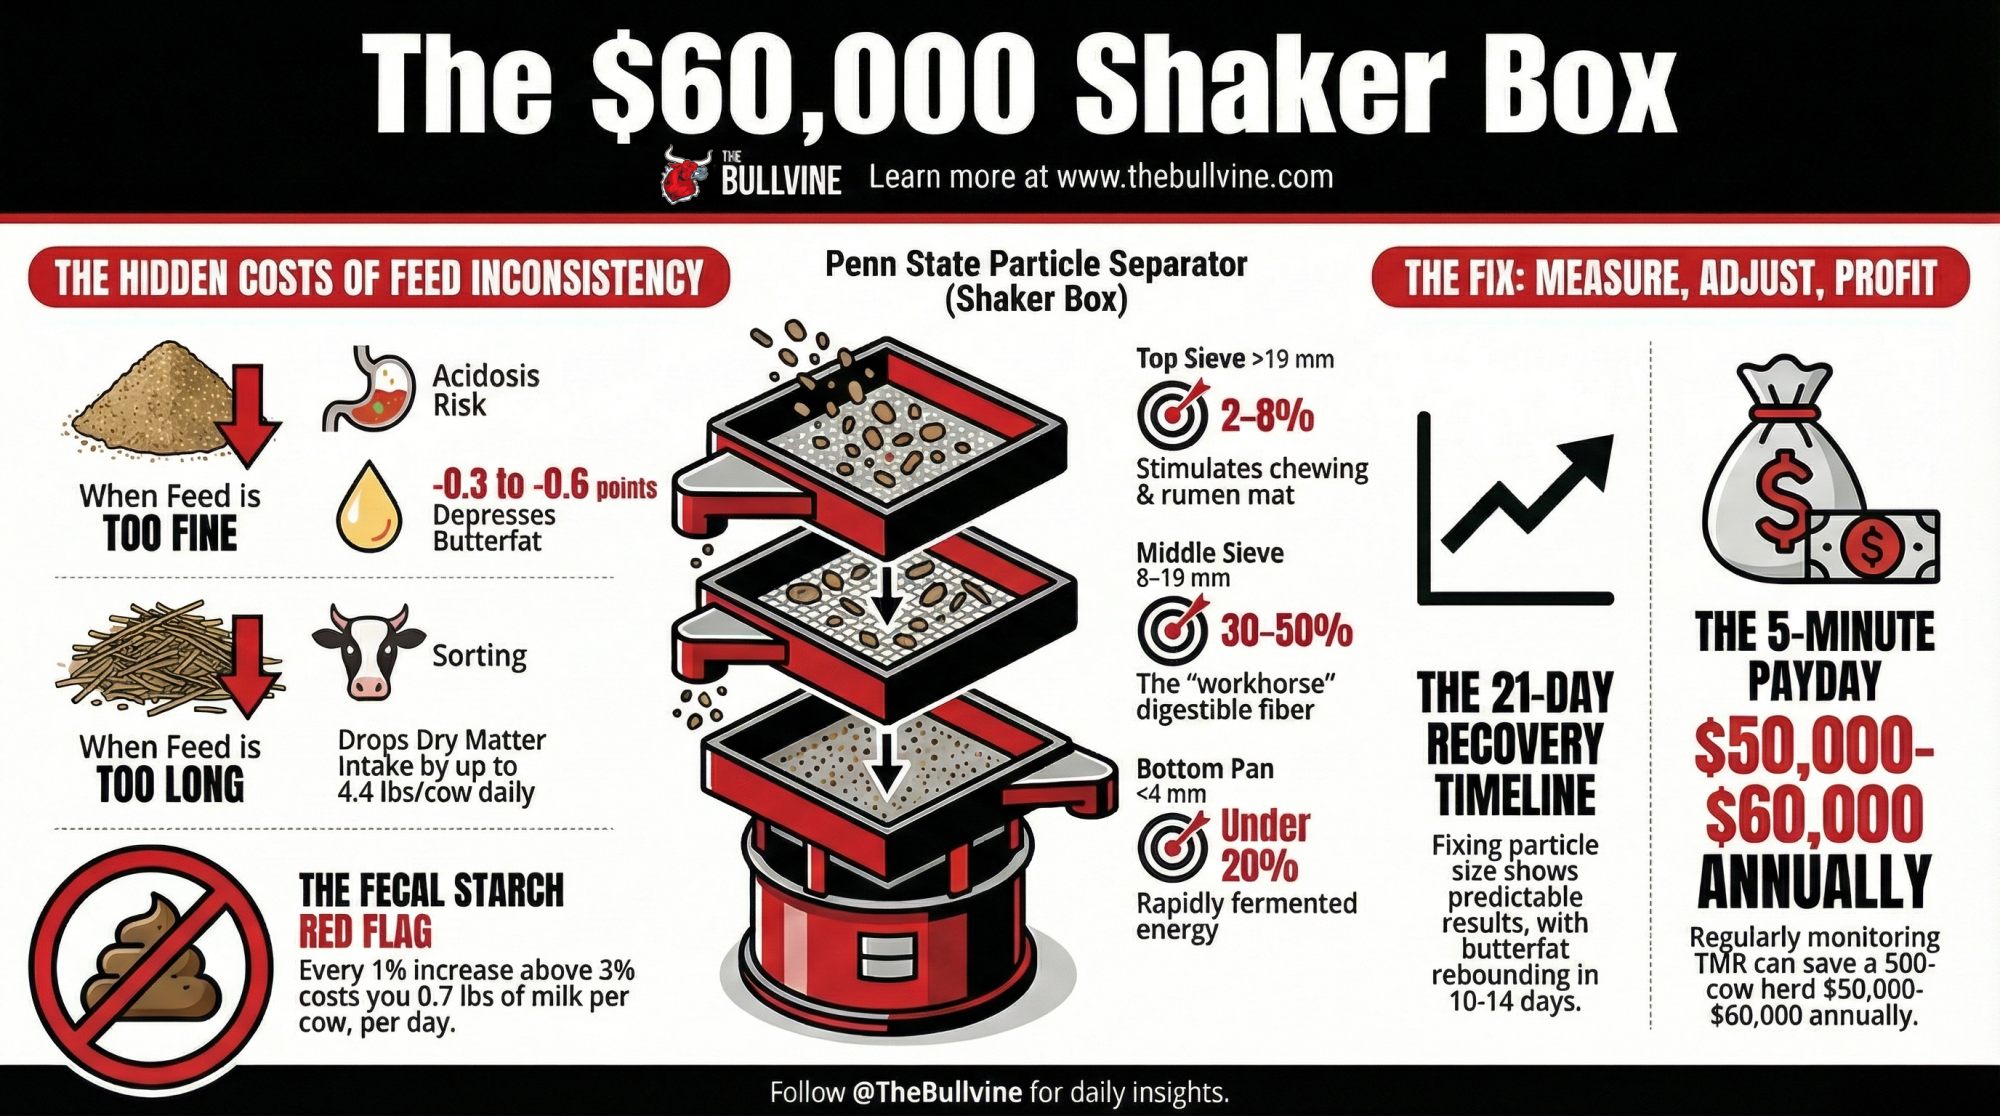
If you’ve handled a Penn State Particle Separator, you know it’s simple: four sieve trays stacked by particle size that literally show what cows are eating—not just what’s printed on the ration sheet.

For most lactating cows, Penn State guidelines suggest:

  • 2–8% retained on the top (>19 mm) sieve
  • 30–50% on the next (8–19 mm)
  • 20–30% on the third (4–8 mm)
  • Under 20% in the bottom pan (<4 mm)

What’s really fascinating is how this simple distribution tells us everything about the efficiency of rumen function. Too much fine material, and pH typically plummets below 5.8, kicking off subacute ruminal acidosis (SARA) (Krause & Oetzel, J. Dairy Sci., 2006). Too much long material, and cows start sorting, which restricts intake and upsets the delicate microbial balance that drives butterfat production.

Essentially, the Separator is a truth serum for TMR management—turning impressions into data.

When Feed Gets Too Fine – The Hidden Efficiency Leak

Overmixing is easy, especially in winter when forages dry out and mixing times stretch. The problem is subtle: rations start looking “fluffy,” but excessive blending breaks down fiber particles that cows need for natural buffering.

Mixing Time: The Goldilocks Zone for Particle Size – Seven to nine minutes hits the sweet spot for most operations: enough to blend thoroughly, not enough to pulverize fiber. Beyond 11 minutes, physically effective NDF drops below 60%, and fine particles spike—setting up acidosis risk. 

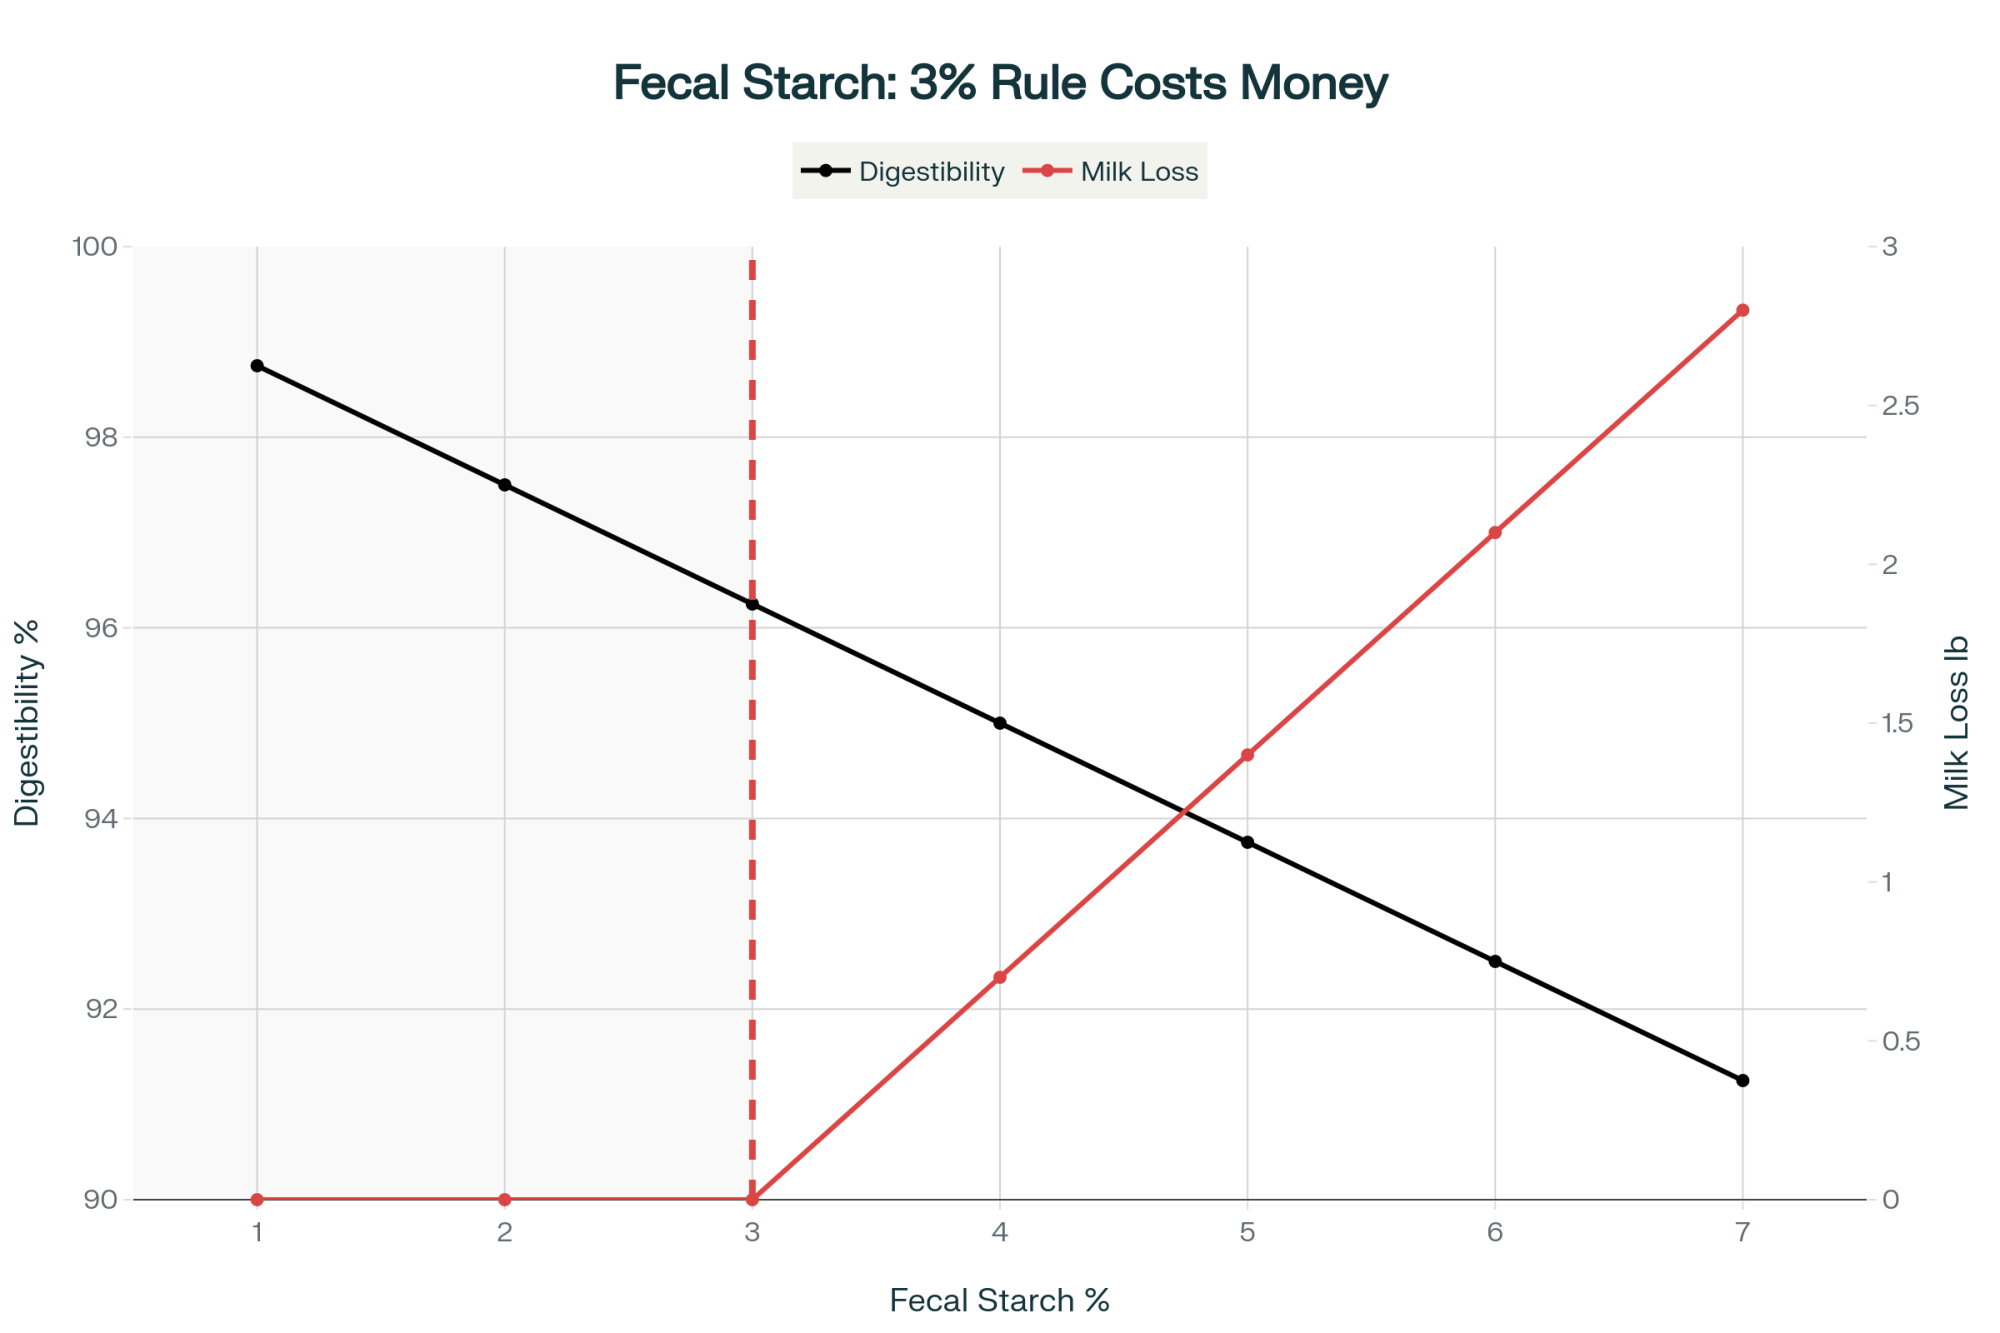
Research from Penn State (2023) and Dairyland Laboratories (2024) shows a consistent relationship—each 1% increase in fecal starch above 3% equals roughly 0.7 pounds (0.3 kg) of lost milk per cow per day. That drop traces directly back to reduced particle size and faster rumen passage.

Fecal Starch: The 3% Rule That Costs Real Money – Every 1% above 3% fecal starch equals 0.7 lbs lost milk per cow daily. At 5%, a 600-cow herd loses $30,660 annually.

Once the feed texture is corrected, cows respond fast. Intake climbs within a few days, and butterfat tends to normalize within 10–14 days. That’s the rumen re-establishing equilibrium, and it happens predictably if consistency holds.

It’s worth noting that recovery isn’t instant because microbial populations need a full cycle—about three weeks—to rebuild. But when farms stick with the plan, the results speak for themselves.

When Feed Gets Too Long – Why “More Fiber” Can Backfire

Across the Midwest, it’s common to see the opposite: rations that are too coarse. Sometimes it’s due to harvest conditions, sometimes prolonged knife wear, or wet forages. But even 10–15% material on the top sieve can drop dry matter intake by 3.3–4.4 pounds (1.5–2 kg) per cow per day, according to Cornell Cooperative Extension (2023)and Kononoff et al. (J. Dairy Sci., 2003).

It’s easy to spot. Bunks show long refusals, feed sorting increases, and milk solids vary from cow to cow. That imbalance also stresses the fresh cow group, where consistent energy delivery is critical during the transition period.

The fix is often small—a sharper chop or added moisture—but the payoff is large. One Northeast producer told me, “We didn’t change the ration at all, just the chop setting—and our intakes stabilized in a week.”

Connecting Particle Size and Fecal Starch

Here’s where modern precision feeding really shines. When farms combine physical evaluation (via the separator) with digestion analytics (via fecal starch testing), they close the loop on total feed efficiency.

Research at the University of Guelph (2024) found that herds maintaining a balanced TMR structure consistently achieved fecal starch levels below 3%, aligning with about 96% total-tract starch digestibility. Anything over 5% points to feed passing too quickly—often because TMR is too fine, not because kernels are underprocessed.

Or, as Hutjens says in his workshops, “If the rumen can’t hold feed long enough, microbes can’t finish their job.” That line always sticks because it’s a simple truth: the rumen’s efficiency relies on physical structure first, chemistry second.

What Improvement Looks Like – The 21-Day Timeline

Now, many producers ask: once we fix it, how quickly do the cows show results? Based on consistent findings from Penn State, UW–Madison, and the Miner Institute, here’s what usually happens:

  • Days 1–2: Feed sorting drops; bunk refusals even out.
  • Days 3–5: DMI increases 2–4 pounds (0.9–1.8 kg) per cow.
  • Days 5–7: Milk production rises 3–5 pounds (1.4–2.3 kg) per cow.
  • Days 10–14: Butterfat lifts 0.2–0.3 points.
  • By Day 21: Rumen and microbial stability return to optimal levels.

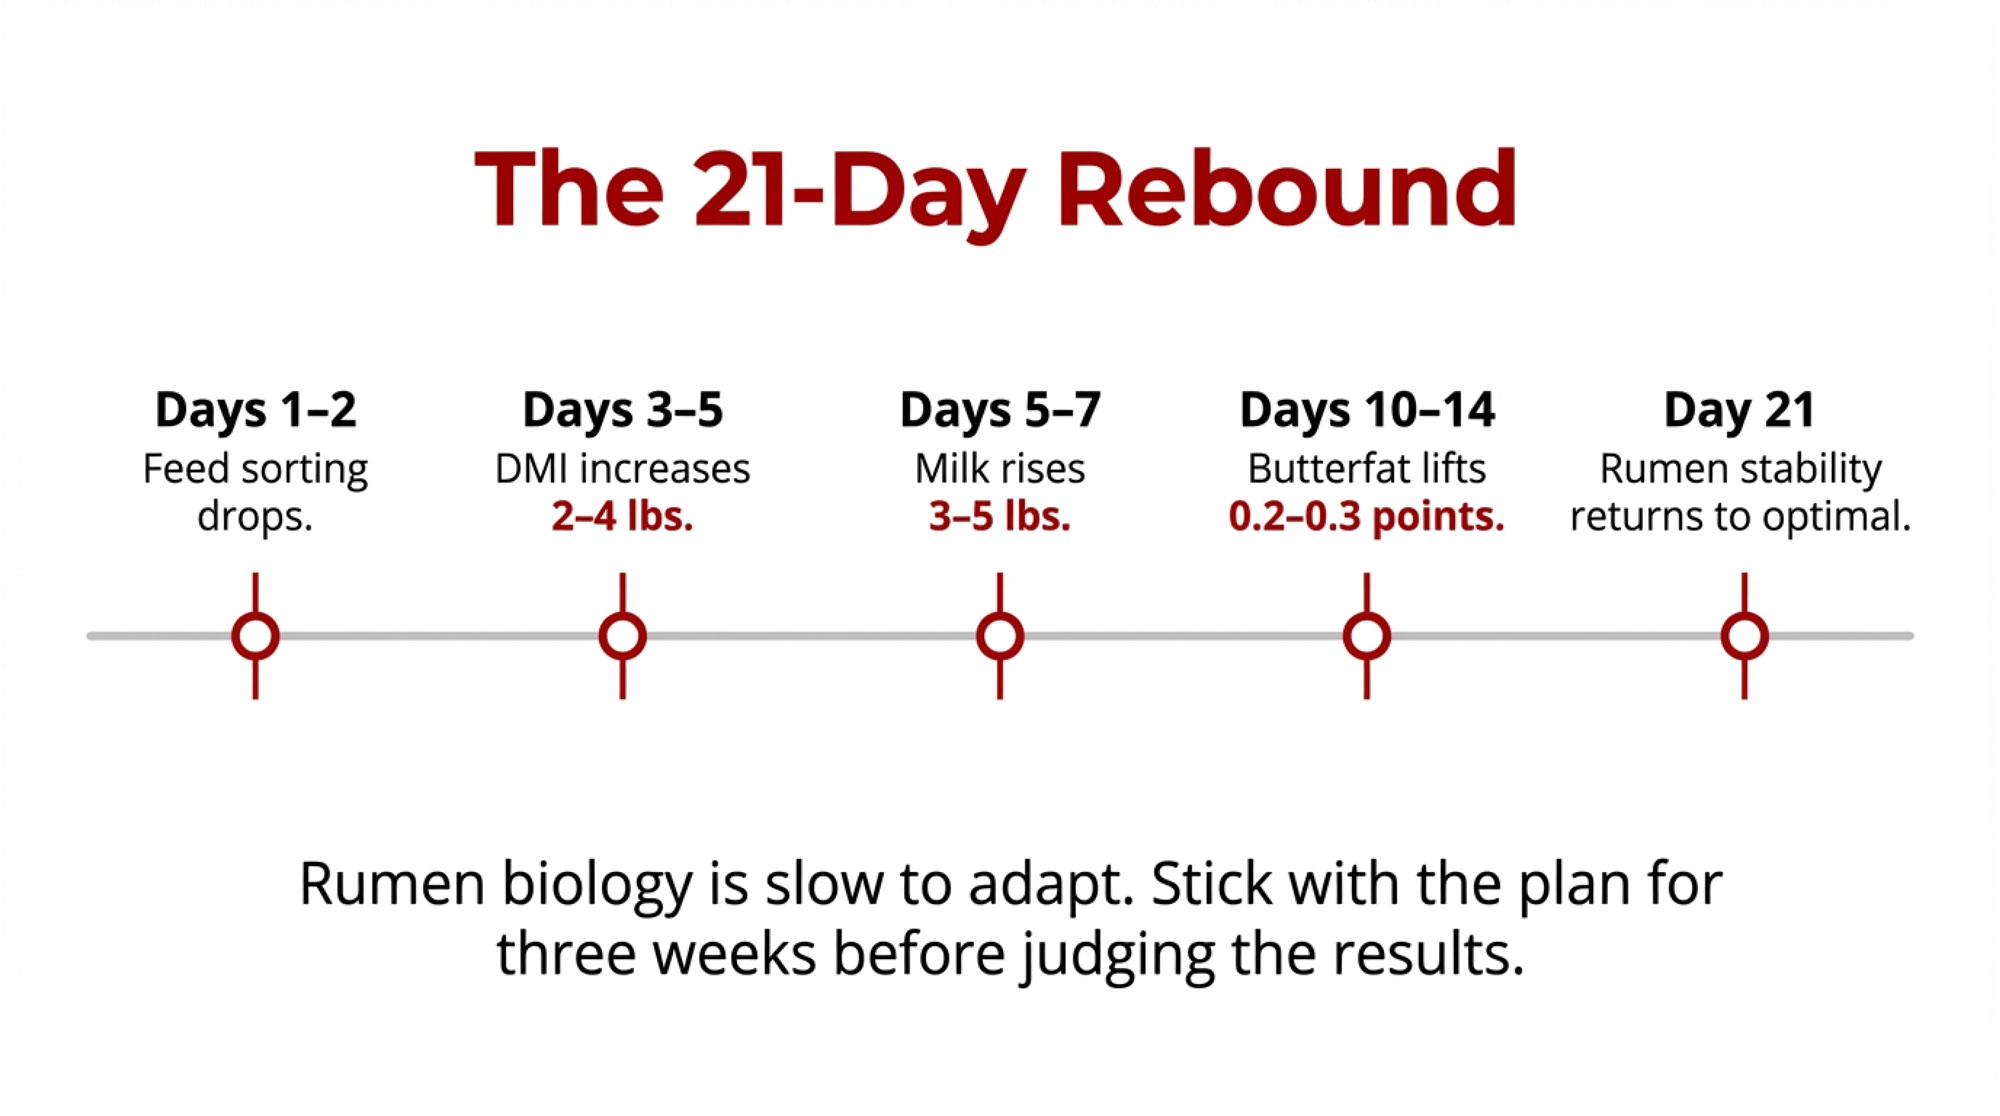
What’s interesting here is just how predictable the recovery is when particle size and feeding routine stay on target. Results don’t happen overnight—but give it three weeks, and the cows will show you why it’s worth sticking to the plan.

21-Day Recovery: From Feed Fix to Full Profit – Cows respond predictably when particle size is corrected. Milk rises within a week, butterfat follows by week two, and rumen stability locks in by day 21. 

Turning the Separator into a Habit

Producers who’ve made this work treat the Separator as part of weekly herd management, not a special task. I like to call it “Feed Quality Friday”—a fifteen-minute ritual where the feeder runs one test, records the numbers, and shares them with the nutritionist.

The payback for that small amount of time is remarkable. Field results from Penn State Extension (2024) show that farms that regularly monitor particle size reduced component volatility by nearly 30% across seasons, saving $50,000–$60,000 annually on a 500-cow herd.

But more importantly, it changes culture. Feeders begin catching drift before it shows up in milk tests. They start asking better questions about forage moisture, mixing time, and loading sequences. And that’s how farms shift from reactive to proactive management.

Building a Culture of Consistency

What’s encouraging is that this approach works everywhere—from 120-cow tiestalls in Ontario to 2,000-cow dry lot systems in California. The herds that succeed treat feed measurement with the same precision as fresh cow management or breeding records.

Across operations big and small, I’ve noticed that testing isn’t just about data—it builds accountability. Posting results weekly in the feed room, laminating target charts next to the mixer, or even color-coding sieves can transform an abstract concept into a visible, shared goal.

As Hutjens likes to emphasize, “Technology gives you options, but discipline delivers results.” That sentiment captures the heart of this discussion.

The Takeaway

Here’s what it all comes down to: the Penn State Separator isn’t flashy, and it doesn’t plug into an app—but it represents precision in its purest form. Measure, monitor, adjust, repeat. That process costs almost nothing and protects everything that matters: milk yield, butterfat performance, and cow health.

So if your separator is sitting in a corner, unopened, dust it off this week. Shake out one sample. It might just be the five most profitable minutes you’ll spend all month.

This feature draws on research and field data from Penn State Extension, University of Wisconsin–Madison, University of Guelph, Cornell Cooperative Extension, Dairyland Laboratories, and the William H. Miner Agricultural Research Institute, with expert perspective from Dr. Mike Hutjens, University of Illinois Professor Emeritus.

Key Takeaways:

  • The Penn State Particle Separator turns feed analysis into a five‑minute habit that can unlock five‑figure profits.
  • A simple metric—fecal starch over 3%—signals lost milk and missed feed efficiency worth hundreds daily.
  • “Feed Quality Fridays” pay off: just 15 minutes a week can protect up to $60,000 a year in butterfat returns.
  • Within 21 days of adjusting the feed structure, rumen health steadies, and milk fat rebounds naturally.
  • Across every region and herd size, the best dairies win on one thing: disciplined consistency—not fancy tools.

Executive Summary

Ask any successful dairy manager, and they’ll tell you—precision starts with the basics. This article reveals how the humble Penn State Particle Separator has become one of the most cost-effective tools for improving butterfat and overall feed efficiency. Backed by university and field research, it shows how something as simple as a five-minute TMR check can prevent $50,000 or more in yearly losses from feed inconsistency and poor fiber balance. Each 1% rise in fecal starch above 3% translates directly to milk left on the table, and yet, herds that make testing routine see full recovery in yield and butterfat within just 21 days. What’s interesting here is that the wins don’t come from expensive equipment—they come from habit, focus, and follow-through. It’s proof that on the best dairies, measurement has become a mindset, not just a task.

Complete references and supporting documentation are available upon request by contacting the editorial team at editor@thebullvine.com.

Learn More:

Join the Revolution!

Join over 30,000 successful dairy professionals who rely on Bullvine Weekly for their competitive edge. Delivered directly to your inbox each week, our exclusive industry insights help you make smarter decisions while saving precious hours every week. Never miss critical updates on milk production trends, breakthrough technologies, and profit-boosting strategies that top producers are already implementing. Subscribe now to transform your dairy operation’s efficiency and profitability—your future success is just one click away.

NewsSubscribe
First
Last
Consent

Butterfat vs. Powder: What the Great Dairy Divide Really Means for Your Bottom Line

Butterfat’s on top, powder’s under pressure—and the milk check now tells a story few saw coming

EXECUTIVE SUMMARY: Butterfat’s booming, powders are sliding, and together they’ve redrawn the dairy marketplace. This isn’t just another price cycle—it’s a lasting shift in how milk value is measured and paid. China’s preference for premium fats, new processor investments, and stronger herd genetics are driving a global realignment. Farmers who embrace component-based pricing, focused feeding, and risk protection remain profitable even as traditional markets weaken. The message heading into 2026 is clear: the future belongs to those who manage what’s inside the tank, not just how much fills it.

Walk into any farm shop or co-op office this fall, and chances are you’ll hear the same discussion. Butterfat is holding strong, while powders just can’t find their footing. The market doesn’t feel balanced anymore. What’s interesting here is that this gap doesn’t seem like a short-term pricing quirk—it looks and feels like a lasting shift in how milk value is determined.

Fat Holds Steady, Powder Loses Traction

Looking at the latest Global Dairy Trade (GDT) auctions, it’s easy to see the disconnect. The GDT index has fallen for five consecutive events, down roughly 1.4% in mid-October. Butter and anhydrous milk fat (AMF), however, remain firm, trading between $6,600 and $7,000 per tonne. Meanwhile, skim milk powder (SMP) is soft, sitting near $2,550 per tonne.

The Great Dairy Divide: Butterfat products command $6,800-7,200 per tonne while skim milk powder has collapsed to $2,550—a pricing gap that’s rewriting the economics of every dairy farm in America

That pattern isn’t isolated to one region. According to the EU Commission Market Observatory, SMP fell about 1% this month, while butter barely moved. In the United States, USDA Dairy Market News reported CME butter prices hovering around $3.15 per pound, roughly aligned with global benchmarks after accounting for shipping and grading differences.

The CoBank Dairy Outlook (October 2025) calls this “a composition-driven divergence.” In simple terms, the milk market isn’t paying for volume anymore—it’s paying for what’s inside. AMF, at 99.8% pure milkfat, is ideal for global manufacturers who need precision and performance. Butter, at 82% fat, still has a place, but powders are losing ground as demand in infant formula and rehydrated products slows.

China’s Import Strategy Speaks Volumes

The best way to understand this trend is to look at China, where import behavior has changed dramatically. The Chinese Customs Administration reported that butter imports rose 65% year over year, whole milk powder climbed 41%, and SMP dropped 12.5%.

China’s dairy import strategy reveals the future: butter imports surged 65%, whole milk powder up 41%, while skim milk powder dropped 12.5%—they’re buying precision fats and making powder at home

At the same time, the USDA Foreign Agricultural Service (FAS) confirmed that China’s milk production grew to 41.9 million tonnes in 2024, a rise of 6.7%. Those numbers sounded encouraging, but they also created oversupply at home. Processing plants are drying roughly 20,000 tonnes of milk a day, often at a loss. The OCLA Argentina Dairy Market Outlook (September 2025) estimates those losses at 10,000 yuan per tonne, or about $1,350 USD, thanks to high input and energy costs.

Here’s where things get interesting. China can produce plenty of powder. Where it struggles is in high-purity fats like AMF and industrial butter. Domestic processors lack the cream-separation and fractionation capacity found in markets like New Zealand, Europe, and the U.S. So their strategy has shifted. They’re importing what they can’t make efficiently. That choice has reinforced fat premiums in the global marketplace.

This development suggests a new normal for international trade. Countries will compete not on total milk output, but on how effectively they produce—and market—the right components.

Why U.S. Farmers Are Still Standing tall

Looking back through cycles like 2015 or 2020, it’s clear farmers have become better prepared to weather volatility. Part of that comes down to management maturity and new financial safety nets that didn’t exist a decade ago.

Risk Management Tools Are Paying Off
According to the USDA Risk Management Agency (RMA), about 35% of U.S. milk production is now protected under Dairy Revenue Protection (DRP), with participation surpassing 50% in the High Plains. Those policies are helping farms hold margins through increasingly unpredictable shifts in global pricing.

Smart farmers are protecting margins: 52% of High Plains milk production is covered by Dairy Revenue Protection, nearly double California’s 28%—proof that the best operators plan for volatility before it hits

Component Programs Reward Quality, Not Quantity
More than 90% of milk in the country is now sold under Multiple Component Pricing (MCP). Herds averaging 4.3% butterfat and 3.4% protein consistently earn $1.50 to $2.00 per hundredweight more than standard 3.7/3.1 herds, according to USDA AMS data. That’s a structural incentive, not a fad.

Genetics and Feeding Continue to Change the Curve
CoBank and USDA data show national butterfat averages rising from 3.95% in 2020 to 4.36% this year, while protein moved to 3.38%. The Michigan State University Extension (2025) recently found that feeding 5–6 pounds of high-oleic roasted soybeans per cow daily improved butterfat by 0.25–0.4 percentage points within 30 days, while enhancing rumen consistency and herd condition.

American dairy genetics are delivering: butterfat jumped from 3.95% to 4.36% in just five years while protein climbed to 3.38%—improvements that translate directly to bigger milk checks every month

What’s encouraging here is that improvements are cumulative. As one extension specialist explained during a recent producer roundtable, “The cows are doing the same work, but the milk’s worth more.” It’s proof that managing for higher components is one of the most direct paths to better returns.

The Processor Pivot: From Volume to Value

Processors are feeling this market divide just as strongly as producers are. And frankly, some are better positioned than others.

Let’s look at Darigold’s Pasco, Washington facility, which represents one of the industry’s most ambitious bets on global powder capacity. The plant—a $1.1 billion facility capable of processing 8 million pounds of milk per day—was planned to supply milk powders and butter to Southeast Asian buyers when those markets were booming back in 2019. But global dynamics changed faster than expected. Reports confirm the company had to deduct around $4 per hundredweight from producers’ milk checks this summer to offset startup losses. Powder-heavy exports aren’t what they used to be.

Contrast that with processors like Hilmar Cheese (Texas), Leprino Foods (Kansas), and Lactalis USA, which have expanded into cheese, whey protein, and AMF production. They’re diversifying toward higher-solids, higher-margin production that keeps milk geographically and economically competitive. Reports from First District Association (Minnesota) and Idaho Milk Products echo the same trend—premium payments now hinge on component tests because that’s where processors make their profit.

Here’s the hard truth: the U.S. industry is splitting not just by product, but by intent. Powder is still a volume game. Component ingredients are an efficiency game.

Could Butterfat Overshoot?

It’s a fair question to ask whether everyone aiming for higher fat could create the next surplus. CoBank’s August 2025 Outlook flagged that butterfat production might be “growing faster than demand absorption.”

But here’s where genetics help us. The USDA Agricultural Research Service (ARS) and Holstein Association USAperiodically adjust their Net Merit (NM$) and Total Performance Index (TPI) formulas to reflect changes in milk pricing. That means breed selection is constantly reweighted to economic reality. If fat premiums fall or protein values recover, herd objectives shift almost automatically.

The point is, dairy efficiency—not just butterfat—is what creates long-term stability. It’s why balance will always outlast fads.

The Metric That Matters: Component Spread

When you strip away all the noise, one figure tells the story: the component spread—the pay gap between baseline milk (3.5% fat / 3.0% protein) and high-component milk (4.4% fat / 3.4% protein).

Component pricing isn’t subtle: premium milk at 4.4% fat earns $2.00/cwt more than standard 3.7% fat milk—that’s $14,600 annually for a 100-cow herd, and the gap keeps widening

As USDA AMS Federal Order data shows, that premium has averaged more than $2 per hundredweight throughout 2025. If it holds, producers essentially have proof that processors are permanently paying for composition, not volume.

A USDA market economist summed it up best in a September forum: “When the value is tied to solids instead of water, you’re not in a price cycle anymore—you’re in a new structure.”

Practical Lessons Going Into 2026

The roadmap is clear: track components monthly, breed strategically, match your processor, feed for balance, and protect margins—five concrete moves that separate winning farms from the rest
  1. Track Your Components Monthly.
    Treat butterfat and protein performance as management metrics alongside fertility, transitions, or somatic cell counts. Precision wins.
  2. Start Small, Build Momentum.
    Genomic testing (around $40 per heifer) and ration adjustments are quick-return investments in this pricing climate.
  3. Match Your Processor Relationship.
    AMF and cheese plants prize solids. Powder plants still chase volume. Know which market pays for the milk you make.
  4. Breed and Feed for Balance.
    Fat and protein efficiency outweigh extremes. Avoid chasing a single number.
  5. Protect Margins with Modern Tools.
    DRP coverage, component contracts, and multi-year agreements keep income steady when markets fluctuate.

The Bottom Line: This Isn’t a Crisis—It’s an Adjustment

Every producer knows the milk market runs in cycles. But what’s happening right now feels different. Butterfat remains firm because the world wants quality ingredients that add value to food manufacturing. SMP is struggling because bulk reconstitution isn’t growing anymore.

For farmers, the lesson is clear: you don’t have to rebuild your entire operation to adapt—just fine-tune what you’re already measuring. Improving components, reviewing contracts, and aligning milk output with processor demand will go further than chasing volume.

The bottom line? The milk check no longer rewards gallons—it rewards balance, precision, and composition. The farms paying attention today are the ones positioning themselves to thrive long-term.

Key Takeaways:

  • Butterfat is booming while powders slide, signaling a lasting shift in dairy value and pay structures.
  • China’s strategic focus on high-fat imports and domestic powder production is reshaping global trade dynamics.
  • U.S. farmers maximizing components—and protecting with DRP—are turning market volatility into opportunity.
  • Processors investing in solids-based products like cheese and AMF are outpacing those tied to bulk powder markets.
  • Heading into 2026, milk checks will favor precision over production—the farms that measure will be the ones that win.

Complete references and supporting documentation are available upon request by contacting the editorial team at editor@thebullvine.com.

Learn More:

Join the Revolution!

Join over 30,000 successful dairy professionals who rely on Bullvine Weekly for their competitive edge. Delivered directly to your inbox each week, our exclusive industry insights help you make smarter decisions while saving precious hours every week. Never miss critical updates on milk production trends, breakthrough technologies, and profit-boosting strategies that top producers are already implementing. Subscribe now to transform your dairy operation’s efficiency and profitability—your future success is just one click away.

NewsSubscribe
First
Last
Consent

Rethinking Dairy Feed: Michigan Farmers Turn High Oleic Soybeans into High Butterfat Profits.

“We saw butterfat jump in three days.” How Michigan farmers and MSU science turned soybeans into dairy profits.

EXECUTIVE SUMMARY: A simple feed change in Michigan is making big waves across the U.S. dairy industry. At Preston Farms, feeding high oleic soybeans—developed with support from Michigan State University (MSU)—boosted butterfat from 4.4% to 4.8% in under a week, while replacing costly palm fats and protein meals with a locally grown crop. The shift, based on extensive research by Dr. Adam Lock, saved the farm hundreds of thousands in inputs and lifted overall profits to more than $1 million per year. Early adopters are proving that this innovation doesn’t just add points of fat—it builds feed independence and sustainability into dairy rations. And as universities and producers nationwide study the results, one thing is clear: sometimes the next big leap for dairy is just a smarter way to feed the cows.

High Oleic Dairy Feed

Sometimes the biggest dairy innovations don’t come from a lab or a boardroom—they start right in the feed bunk. That’s what’s happening at Preston Farms in Quincy, Michigan, where a simple change to the ration is improving butterfat performance, cutting feed costs, and rewriting the farm’s milk check.

Brian Preston didn’t set out to pioneer something revolutionary. But his decision to feed high-oleic soybeans, a crop once bred for frying oil rather than feed, has become one of the most quietly disruptive stories in dairying today.

From University Research to On-Farm Success

This breakthrough isn’t luck. It’s the product of years of research at Michigan State University (MSU) led by Dr. Adam Lock, Professor of Dairy Nutrition, whose focus has long been on how different fats affect rumen function and milk composition.

“We didn’t increase the fat level in the ration,” Lock explains. “We changed the kind of fat—and that changed everything.”

It’s Not Magic—It’s Biochemistry: Conventional soybeans trigger a biochemical cascade that blocks milk fat synthesis through trans-10 CLA formation. High oleic soybeans bypass the problem entirely—oleic acid moves straight through the rumen to the mammary gland. Same fat amount, completely different metabolic pathway.

Traditional soybeans are loaded with linoleic acid, a polyunsaturated fat known to interfere with rumen microbes and cause milk fat depression. High oleic soybeans, however, reverse that chemical balance. They contain 75–80% oleic acid and under 10% linoleic acid, according to USDA and Pioneer® data (2024). That single change stabilizes rumen fermentation and boosts acetate, an essential precursor to milk fat synthesis.

The Chemistry That Changes Everything: High oleic soybeans flip the fatty acid profile from 63% problematic linoleic acid to 75% beneficial oleic acid—a complete reversal that protects rumen function and boosts butterfat. This isn’t incremental improvement; it’s biochemical transformation.

The result? Cows can handle higher inclusion without the digestive disruption that once scared off nutritionists from pushing soy-based feeds too hard.

For Lock, the findings weren’t theoretical—they were replicated across multiple MSU feeding trials, later published in the Journal of Dairy Science (2023). And in Preston’s case, it worked exactly as the data suggested.

How Fast Did It Work? Try 72 Hours

In 2024, Preston planted 400 acres of Pioneer® Plenish® high oleic soybeans and began feeding them roasted—about 8 pounds per cow per day—in place of purchased soybean meal, canola meal, and expensive palm-based fats.

Within three days, milk tests came back with an unexpected jump: butterfat up from 4.4% to 4.8%, with milk protein slightly higher too.

Faster Than You Think: Butterfat jumped from 4.4% to 4.8% in just 72 hours—so fast Preston thought the lab made a mistake. The response stays consistent because oleic acid bypasses rumen hydrogenation. No lag time. No adaptation period. Just immediate biochemical efficiency.

“I honestly thought there was a lab error,” Preston laughs. “But it happened again the next week. The cows handled it so well, we kept it in full-time.”

Lock says that kind of immediate response makes sense because oleic acid bypasses much of the rumen’s hydrogenation process, entering the bloodstream faster as an energy source for milk synthesis. Cows use it directly—no lag time, no rumen stress.

That faster conversion means farms see the payoff quickly. As any producer knows, immediate improvements in component yield help confidence spread far faster than any spreadsheet could.

The Economics: Turning Fat into Feed Efficiency

When you quantify it, the economic implications are eye-opening.

Every 0.1 increase in butterfat adds roughly $0.20 per cwt when butterfat sells near $3.23/lb (USDA Agricultural Marketing Service, October 2025). Preston’s 0.4-point jump produced about $1 per cow per day, adding roughly $380,000 annually in butterfat premiums across his 1,000-cow herd.

Then came the ingredient savings.

Tack on feed savings—achieved by replacing high-cost supplements like palm-derived fats and purchased proteinswith roasted soybeans grown right on the farm—and the total improvement exceeded $1 million annually.

The Math That Matters: Preston Farms turned 400 acres of high oleic soybeans into over $1 million in annual gains—$380K from higher butterfat, $320K in feed cost savings, and $300K from improved efficiency. It’s rare to find a ration change that pays on both ends. This one does.

“It’s rare to find a single ration change that pays on both ends,” Preston says. “Usually you’re spending to gain production, or cutting cost and losing quality. This time, the cows—and the feed bill—both lined up.”

The Economics Work for Every Herd Size

Size Doesn’t Matter—Consistency Does: The economics scale perfectly from $36,500 for a 100-cow herd to $730,000 for 2,000 cows. Every single cow adds $365/year. No economies of scale required, no threshold to cross—just consistent, predictable, bankable per-head gains.

Why Michigan Is Ahead of the Curve

Michigan’s adoption of this feeding system stems largely from timing and teamwork.

Dr. Lock’s program at MSU, supported by the Michigan Alliance for Animal Agriculture (M-AAA), has spent over a decade translating lipid metabolism science into field-tested protocols. That partnership between the university and producer accelerated on-farm implementation and helped local nutritionists understand how to balance rations for these new soybeans.

“Michigan farmers had years of data before they took the plunge,” Lock says. “That’s what builds trust.”

In contrast, neighboring Wisconsin—the second-largest milk producer in the U.S.—has moved more cautiously. Nutritionists there often wait for validation from the University of Wisconsin-Madison Dairy Science Department, which is currently planning its first high oleic feeding trials for 2026.

It’s understandable. As Lock puts it, “Dairy nutritionists are trained to be risk-averse. When you’ve got millions of pounds of milk at stake, you confirm every feed trend before you move.”

The GMO Conversation: What Farmers Should Know

One of the first questions producers ask is whether the GMO status of these soybeans affects milk markets. The short answer: no.

Under the USDA’s National Bioengineered Food Disclosure Standard (2016), milk or meat from animals fed genetically modified feed is not considered genetically modified because the feed’s DNA does not transfer into milk or meat. After almost a decade of data, no studies—including those conducted by the FDA—have found detectable transference from feed to product.

For non-GMO or organic dairies, the alternative is the Soyleic® variety, developed at the University of Missouri, which achieves nearly identical oleic acid levels through conventional plant breeding. Those beans have done particularly well in identity-preserved markets, though they yield about 5–10% less per acre.

Long-term, both versions show strong potential for dairies seeking greater feed self-sufficiency.

How Many Farms Are Doing This?

METRICCURRENT STATUSOPPORTUNITY/NEEDEDTHE GAP
Dairy Cows on HOS Diet<1% (75,000 cows)20% (1.8M cows)1.725M cow opportunity
Nutritionists Recommending20% (160/800)80% for mass adoption480 nutritionists needed
Roasting Infrastructure~75 units1,500+ units1,425+ units required

Nationally, adoption remains low — about 70,000 to 80,000 cows on high oleic soybean diets, according to MSU Extension estimates (2025). That’s less than 1% of the total U.S. dairy herd.

The bottleneck isn’t supply — seed production can easily scale — but rather processing. On-farm roasting is still critical for unlocking feed value, and each roaster typically serves about 1,000 cows daily. Expanding adoption to even 20% of U.S. cows would require more than 1,500 new roasting units.

Some co-ops, especially across the Midwest, are exploring shared roasting programs in which individual farms deliver beans for contract processing.

There’s also a knowledge gap. Only about 20% of the nation’s 800 dairy nutritionists actively recommend high oleic soybean feeding programs (Great Lakes Dairy Nutrition Conference Survey, 2025). Many say they’re waiting for state-level replication trials before updating formulations.

It’s the same cycle seen with bypass proteins in the 1990s—slow at first, then exponential once the local data confirms early wins.

What Cows and Numbers Are Saying So Far

After a full year of feeding high-oleic soybeans, Preston’s herd metrics are stable. Milk yield remains consistent. Reproductive performance—often the first red flag for new fats—has held steady.

Lock’s ongoing work at MSU mirrors those findings, showing no significant difference in ketosis, displaced abomasum, or other metabolic measures compared with control groups. The focus now shifts to multi-year monitoring.

“We’re confident in the short-term biology,” Lock says. “Now it’s about proving sustainability year after year.”

For producers, that’s comforting. As most know, herd-level consistency decides whether an innovation stays or fades.

Practical Starting Points

For producers curious about testing the concept, the learning curve is short and management-friendly:

  • Start small: Try 50–100 acres and dedicate one group of cows for trial feeding.
  • Roast right: Keep roasting temps between 280–300°F for optimal protein availability.
  • Track diligently: Monitor butterfat, dry matter intake, and conception rates over multiple months.
  • Work closely with nutritionists: Fine-tune diets to prevent unbalanced fat inclusion.
  • Run the ROI: Compare component-based milk revenue with any feed cost shifts.

Early adopters like Preston insist on treating the transition as a management system, not a silver bullet. “We made sure every change was measurable,” he says. “Then we let the data drive whether we stayed with it.”

What’s Interesting About This Development

Three things stand out. First, it highlights how small biological improvements can have huge economic consequenceswhen component pricing drives profitability. Second, it reconnects modern dairying with something age-old: growing and processing one’s own feed to reduce dependency on volatile markets. And third, it demonstrates how collaboration between land-grant universities and farmers creates innovation grounded in real-world application, not lab theory.

“We’ve had feed additives come and go,” Preston says. “This one is different—it’s ours to grow, feed, and control.”

The Bottom Line

For all the advanced technology shaping the dairy world today, sometimes innovation looks as familiar as a roasted soybean.

High oleic feeding strategies may not transform the industry overnight, but evidence from Michigan’s early adopters shows real, sustained improvements in butterfat performance, feed efficiency, and economic stability. The concept works because it fits seamlessly into existing farm systems—it’s scalable, measurable, and backed by solid science.

If the next several years of data across Wisconsin, New York, and beyond confirm what MSU has already seen, this may very well be the next “quiet revolution” in feed efficiency.

As one producer joked after hearing Preston’s story: “The cows might be the best university research partners we’ve ever had.”

Key Takeaways

  • A quiet revolution in cow nutrition is underway: high oleic soybeans are raising butterfat and replacing expensive palm fats in dairy rations.
  • Preston Farms and MSU researchers demonstrated the impact—a 0.4-point increase in fat and more than $1 million in annual gains from feed efficiency and component premiums.
  • Dr. Adam Lock’s studies confirm that oleic-rich fats improve rumen stability and milk components more quickly than traditional rations.
  • Nationwide growth depends on expanding roasting infrastructure, education, and replicable regional trials.
  • For forward-thinking producers, this strategy offers a real-world, on-farm route to feed self-sufficiency, profitability, and sustainable dairy progress.

Complete references and supporting documentation are available upon request by contacting the editorial team at editor@thebullvine.com.

Learn More:

Join the Revolution!

Join over 30,000 successful dairy professionals who rely on Bullvine Weekly for their competitive edge. Delivered directly to your inbox each week, our exclusive industry insights help you make smarter decisions while saving precious hours every week. Never miss critical updates on milk production trends, breakthrough technologies, and profit-boosting strategies that top producers are already implementing. Subscribe now to transform your dairy operation’s efficiency and profitability—your future success is just one click away.

NewsSubscribe
First
Last
Consent

The 82% Problem: Why America’s Butterfat Isn’t Raising Your Milk Check

Why isn’t your extra butterfat paying off? Let’s talk about the bottleneck blocking your profits.

EXECUTIVE SUMMARY: It’s a strange scene – butter exports hit record highs and inventories tighten, yet prices remain stuck near 2021 lows around $2.23/lb (CME, Aug 2025). The U.S. butter market trades at a sizeable discount—about $1 less than Oceania and $1.45 less than Europe— even as top herds push milk fat to 4.4% (CDCB). The kicker? Most U.S. plants can’t handle the 82% fat, unsalted butter that global buyers demand (ADPI). That mismatch caps producer pay, even with component premiums of up to 22¢/lb—worth $265 extra per cow on a 4.2% butterfat performer. The smart move is to align genetics and feeding with your processor’s actual capacity—and lock in export contracts—to get paid what you deserve finally.

KEY TAKEAWAYS:

  • Push your herd to 4.4%+ butterfat to capture up to $265 more per cow annually (CDCB).
  • Use bulls like Cookiecutter and Jedi for proven 0.10–0.15% butterfat gains in two generations.
  • Dial in rations for 4.1–4.3% fat and add 30–40 mg biotin per cow daily to boost fat yield.
  • Understand your processor’s limits—upgrading for 82% unsalted butter demands major capital and carries risk.
  • Plan for the long haul—processing bottlenecks likely persist into 2026; start co-op discussions on capacity now.
butterfat production, dairy profitability, component pricing, dairy processing bottleneck, dairy genetics

The thing about the American butter market? It’s a real puzzle right now. Exports are surging and inventories are tightening, yet butter prices are slipping to lows not seen since 2021. What strikes me is that this disconnect reveals a serious bottleneck that’s capping the value farmers can earn from all this extra fat.

Why Export Demand Beats Domestic Buyers

Consider this: CME spot butter averaged $2.23 per pound during the week ending August 22—a level not seen in years, according to CME Group data. Normally, prices firm up heading into fall baking, but this year it’s different. The issue is that U.S. butter is largely made with 80% fat and salt, whereas export buyers want 82% fat unsalted. This product mismatch leaves high-value export demand mostly unmet.

Digging deeper, USDA Dairy News reports that U.S. butter trades roughly $1 per pound less than Oceania’s and around $1.45 less than Europe’s—a gap steady throughout 2025. For context, the Global Dairy Trade auction saw European butter fetch over $7,992 per ton, while U.S. prices hovered near $2.50 per pound.

 CME spot U.S. butter prices versus European butter prices at Global Dairy Trade auction across 2025 months, highlighting the persistent price gap

Your Butterfat Payoff: Component Pricing Math

If you’re breeding for higher fat, here’s good news: many component pricing programs offer premiums between 15 and 22 cents per pound of butterfat. On a cow producing 23,000 lb of milk at 4.2% fat, that translates to an additional $180–$265 annually.

Where the Bottleneck Lives: Processing Upgrades

Here’s the snag. A plant manager said,
“It’s not a quick flip—upgrading processors to handle export specs means investing in new packing lines and planning new shipping routes. It costs millions and carries significant risk without firm contracts.”

Meanwhile, New Zealand processors retrofit their plants with flexible lines that switch between salted and unsalted butter to meet various specifications—a nimbleness that U.S. plants need to capture export premiums.

Projected decline in processing bottleneck impact from 2023 to 2027 as new investments expand capacity

Closing the Gap: Genetics & Nutrition Tips

Our milk’s changing fast, too. The Council on Dairy Breeding reports that the U.S. average butterfat is above 4.2%, with some herds pushing past 4.4%—levels not seen in decades. An extension expert from the University of Wisconsin bluntly noted,
“Milk composition is evolving faster than plants can handle, causing a surplus of cream.”

On the breeding front, genomic selection now delivers 0.10–0.15 percentage-point gains in butterfat within a few lactations, with bulls like Cookiecutter and Jedi leading the charge. Nutritionists recommend targeting 4.1–4.3% fat in rations and supplementing with 30–40 mg of biotin per cow daily to maximize fat synthesis.

Industry watchers—including Sarah Thompson at Dairy Futures Group—forecast this processing squeeze will last into 2026 or later, until new capacity comes online.

The immediate strategy for producers is to align herd genetics and feeding practices with what processors can realistically handle today. Discuss with your cooperative to secure export contracts—and adjust your operation to capitalize on the opportunity.

Complete references and supporting documentation are available upon request by contacting the editorial team at editor@thebullvine.com.

Learn More:

Join the Revolution!

Join over 30,000 successful dairy professionals who rely on Bullvine Weekly for their competitive edge. Delivered directly to your inbox each week, our exclusive industry insights help you make smarter decisions while saving precious hours every week. Never miss critical updates on milk production trends, breakthrough technologies, and profit-boosting strategies that top producers are already implementing. Subscribe now to transform your dairy operation’s efficiency and profitability—your future success is just one click away.

NewsSubscribe
First
Last
Consent

Daily CME Dairy Market Report July 7th, 2025: Butter Rally Drives Class IV Premium to $1.71/cwt Over Class III – Component-Rich Milk Commands Premium

Stop chasing milk volume—butterfat surge creates $1.71/cwt Class IV premium. Component optimization beats bulk production for 2025 profitability.

Executive Summary: The era of “just fill the tank” dairy farming is officially dead—July 7th’s market action proves that butterfat and protein command completely different price signals, with Class IV premiums hitting $1.71/cwt over Class III. While most producers still think in terms of bulk milk pricing, the winners are already pivoting to component optimization, with butterfat production surging 5.3% year-over-year despite only 0.5% volume growth. The national average butterfat test has jumped to 4.36% and protein to 3.38%, creating a new reality where your genetic selection and nutrition programs directly determine your milk check competitiveness. U.S. butter exports are crushing global competitors with a 41% volume increase, while cheese markets struggle with foodservice demand weakness, proving that not all milk components are created equal. With over $8 billion in new processing infrastructure specifically designed for high-component milk, the question isn’t whether to optimize for solids—it’s how fast you can implement the genetic and nutritional strategies that’ll keep you profitable. Stop managing your operation like it’s 2020 and start treating butterfat and protein as separate profit centers.

Key Takeaways

  • Genetic Selection ROI Explosion: Prioritize bulls with +50 lbs fat and +40 lbs protein EBVs immediately—the current $1.71/cwt Class IV premium means every 0.1% butterfat increase translates to approximately $0.35/cwt additional revenue on 80% of your milk production.
  • Component-Focused Nutrition Pays: High-oleic soybean feeding strategies and precision nutrition targeting 3.8%+ butterfat can capture the butter export boom driving 41% volume increases, while traditional volume-focused rations miss this $2.62/lb opportunity.
  • Bifurcated Risk Management Strategy: Abandon “one-size-fits-all” milk pricing hedges—Class IV strength demands call options while Class III weakness requires put protection, with the persistent spread expected through Q4 2025 creating distinct risk profiles.
  • Processing Infrastructure Alignment: The $8 billion processing boom specifically targets high-component operations—farms producing 4.4%+ butterfat and 3.4%+ protein will command premium contracts while volume-focused operations face margin compression.
  • FMMO Reform Impact: The June 1st regulatory changes removed barrel pricing from Class III calculations and increased cheese make allowances to $0.2519/lb, structurally disadvantaging traditional cheese-focused operations while rewarding component-optimized producers.
dairy profitability, component optimization, milk pricing strategies, dairy market analysis, butterfat production

Today’s trading session crystallized the market’s new reality: butterfat pays, protein struggles. A decisive 1.50¢ butter rally to $2.6200/lb powered the Class IV future to $18.99/cwt, while cheese barrel weakness dropped 1.00¢ to $1.7100/lb, pressuring the July Class III contract to just $17.28/cwt. This $1.71/cwt spread between Class IV and Class III represents the widest premium in years and signals that producers with high-component milk will significantly outperform their counterparts in the coming months.

Today’s Price Action & Farm Impact

ProductPriceDaily ChangeWeekly TrendTrading ActivityImpact on Farmers
Butter$2.6200/lb+1.50¢+0.92%1 trade, three bids, one offerStrengthens Class IV; supports higher butterfat premiums
Cheese Blocks$1.6850/lbNo Change-0.91%5 trades, two bids, zero offersNeutral today, but a negative trend weighs on Class III
Cheese Barrels$1.7100/lb-1.00¢-0.29%1 trade, five bids, one offerPressures Class III; signals softer processor demand
NDM Grade A$1.2625/lb+0.25¢+0.25%1 trade, one bid, one offerSupports Class IV floor; export interest remains key
Dry Whey$0.6075/lbNo Change+1.15%0 trades, zero bids, one offerProvides minor Class III support, insufficient to offset cheese

Market Commentary

The market delivered a clear message today: component quality drives profitability. Butter’s 1.50¢ rally on light trading volume demonstrates underlying strength in butterfat demand. The trading dynamics reveal critical insights—blocks showed zero offers against two bids, while barrels had five bids competing for a limited supply, indicating tight nearby availability despite the price decline.

Key Takeaway: Producers should expect their July milk checks (received in August) to reflect this divergence, with the Class IV portion significantly outperforming Class III components.

Enhanced Trading Activity Analysis

Market Depth Indicators

ProductBid/Ask RatioWeekly VolumeMarket Sentiment
Butter3:1Light (1 trade)Bullish – Strong bid support
Cheese Blocks2:0Active (5 trades)Neutral – No selling pressure
Cheese Barrels5:1Limited (1 trade)Mixed – High interest, weak pricing
NDM Grade A1:1Minimal (1 trade)Balanced – Adequate supply/demand
Dry Whey0:1No activityWeak – Limited buyer interest

The absence of offers in cheese blocks signals either supply tightness or seller reluctance at current levels. Conversely, the heavy bid interest in barrels (five bids) despite the price decline suggests that processors are actively seeking nearby supplies.

Feed Cost & Margin Analysis

MetricCurrent ValueTrend & Implication
Corn (SEP)$4.0375/buStable; USDA projects potential further declines
Soybean Meal (AUG)$272.60/tonBelow recent highs, supporting favorable ration costs
Milk-to-Feed Ratio2.47Strongly positive; well above the 2.0 stress threshold
IOFC (Est.)$12.72/cow/dayIndicates robust per-cow profitability at current levels

Margin Outlook with Enhanced Risk Analysis

The milk-to-feed ratio of 2.47 represents a significant improvement from earlier in 2025. However, USDA forecasts suggest potential volatility ahead. The agency raised its 2025 milk production forecast to 227.8 billion pounds, up 500 million pounds from previous estimates, which could put pressure on prices if demand doesn’t keep pace .

Risk Scenarios:

  • Downside: A 10% feed cost increase could reduce IOFC by $2.50/cow/day
  • Upside: Continued low corn prices could add $1.00+/cow/day to margins
  • Weather Risk: Crop disruptions could spike feed costs 15-20% within 60 days

Production & Supply Insights with Regional Analysis

National Production Trends

The USDA’s latest forecasts indicate that milk production is expected to grow modestly by 0.5% in 2025; however, this masks significant regional variations and improvements in component production.  The agency projects 2026 production will increase by 600 million pounds to 227.9 billion pounds, driven by expanding herds and higher milk per cow.

Regional Competitive Analysis

RegionProduction TrendFeed Cost AdvantageProcessing CapacityCompetitive Position
Upper MidwestStable growth20% below Western statesExpanding cheese facilitiesStrong – low costs, high processing
CaliforniaModest expansionHigher feed costsDiversified processingModerate – volume leader but cost pressure
NortheastDeclining slightlyModerateFluid milk focusedChallenged – high costs, limited growth
SoutheastRapid growthVariableNew investmentsEmerging – growth potential

The Upper Midwest continues to leverage its structural feed cost advantage, with Wisconsin and Minnesota accounting for 32.4% of U.S. cheese production.

Market Fundamentals Driving Prices

Export Markets: Record Performance Continues

U.S. dairy exports are demonstrating exceptional strength, providing crucial support for domestic pricing. May 2025 exports reached $794.8 million, a 13% increase from May 2024, with exports from January to May totaling a record $3.83 billion.

Cheese Export Surge: May cheese exports reached 113.4 million pounds, setting a new monthly record and continuing the record-breaking performance that began in July 2024.

Key Export Destinations (January-May 2025):

  • Mexico: $1.04 billion (+10%)
  • Canada: $571.4 million (+21%)
  • Japan: $252.9 million (+39%)
  • China: $214.3 million (-5%)
  • South Korea: $209.2 million (+20%)

Domestic Demand Patterns

Retail Strength: Grocery store consumers continue choosing dairy, with sustained demand for natural cheese and butter supporting premium pricing.

Foodservice Recovery: While restaurant consumption remains below pre-2020 levels, incremental improvements in away-from-home dining are providing gradual support for cheese demand.

Forward-Looking Analysis with Enhanced Risk Quantification

Futures Curve Analysis

ContractClass III PriceClass IV Price (Est.)Spread (IV-III)Probability Assessment
JUL 2025$17.28$18.99+$1.7185% confidence
AUG 2025$18.40$19.85+$1.4575% confidence
SEP 2025$19.00$20.20+$1.2070% confidence
OCT 2025$19.20$20.20+$1.0065% confidence

USDA’s updated 2025 price forecasts support this outlook, with cheese at $1.8600/lb (up 2.0¢), butter at $2.5350/lb (up 7.5¢), and Class III milk at $18.70/cwt.

Quantified Risk Scenarios

High-Probability Risks (>50% likelihood):

  • Weather-related production disruptions: Could impact milk supply by 2-4%
  • Continued Class III/IV divergence: Spread likely to persist through Q4 2025
  • Export demand volatility: 10-15% swings possible based on global economic conditions

Medium-Probability Risks (25-50% likelihood):

  • Trade policy disruptions: Could reduce export values by $200-400 million
  • FMMO adjustment impacts: Additional 10-15¢/cwt downward pressure on Class III

**Low-Probability, High-Impact Risks (+50 lbs fat and +40 lbs protein

  • Focus on fat percentage improvements (target: 3.8%+)
  • Emphasize health traits to maximize a productive life

Nutritional Strategies:

  • Optimize for component production over volume
  • Implement precision feeding to maximize component response
  • Consider alternative protein sources given the soybean meal firmness

Cash Flow Planning with Scenario Analysis

Base Case Projections:

  • July milk checks: Expect solid payments from June’s $18.82/cwt Class III
  • August outlook: Budget for $17.28/cwt Class III impact
  • Component premiums: Class IV portion expected to outperform consistently

Stress Testing:

  • 10% price decline scenario: Plan for $1.50-2.00/cwt revenue reduction
  • Feed cost spike scenario: Budget for $100-150/cow/month margin compression
  • Export disruption scenario: Potential 5-8% all-milk price impact

Industry Intelligence

Processing Investment Boom

Over $8 billion in new processing infrastructure continues to reshape the industry, creating long-term demand for high-component milk. Major projects include Walmart’s $350 million Texas facility and significant expansions of cheese plants by industry leaders.

Technology and Efficiency Trends

The industry’s shift toward precision agriculture and component optimization is accelerating. Successful operations are implemented:

  • Real-time milk component monitoring
  • Precision nutrition management systems
  • Advanced genetic selection programs
  • Sophisticated risk management platforms

Weekly/Monthly Context

Today’s action accelerates a trend that has been building for months. The 30-day performance shows cheese blocks down 10.4% and barrels down 8.1%, contrasting with butter’s 2.7% gain. This represents a definitive structural shift, not market noise.

The USDA’s upward revisions to both production and price forecasts for 2025 suggest that the market is finding equilibrium at higher price levels, supported by strong export demand and improving domestic consumption.

Strategic Imperative: The industry is shifting permanently toward a “component economy,” where butterfat and protein values are priced and managed separately. Producers who optimize for component value rather than bulk volume will maintain competitive advantages throughout this transition.

Complete references and supporting documentation are available upon request by contacting the editorial team at editor@thebullvine.com.

Learn More:

Join the Revolution!

Join over 30,000 successful dairy professionals who rely on Bullvine Weekly for their competitive edge. Delivered directly to your inbox each week, our exclusive industry insights help you make smarter decisions while saving precious hours every week. Never miss critical updates on milk production trends, breakthrough technologies, and profit-boosting strategies that top producers are already implementing. Subscribe now to transform your dairy operation’s efficiency and profitability—your future success is just one click away.

NewsSubscribe
First
Last
Consent

The Fat Truth: Why Churning Through Component Records May Be Costing You Money

Record butterfat production meets falling prices: Is your genetic strategy filling your milk check or just filling cold storage with butter?

EXECUTIVE SUMMARY: The U.S. dairy industry faces a butterfat paradox where record consumer demand coexists with swelling inventories and falling prices, challenging producers to rethink their component strategies. Genetics have dramatically boosted butterfat percentages to unprecedented levels, with some Holstein herds now averaging 5%, yet this production surge has outpaced processing capacity and created an oversupply situation despite strong retail demand. The resulting inventory buildup has depressed butter prices to around $2.35/lb while simultaneously creating a “powder crisis” with skim milk solids. Rather than simply producing more butterfat, dairy farmers need balanced component strategies that optimize returns across all milk constituents while considering processing limitations and market demand. The industry’s winners will be those who strategically align their component production with realistic market opportunities rather than chasing maximum components at all costs.

KEY TAKEAWAYS

  • Genetic advancement has created a supply surge: First and second lactation Holsteins now average 5% butterfat, dramatically outpacing overall milk production growth and exceeding immediate processing capacity
  • Market contradiction signals imbalance: Despite record butter consumption (6.5 pounds per capita), butter inventories have swollen to 305.53 million pounds (up 17% MoM), depressing prices and revealing a disconnect between production and demand channels
  • Component crisis extends beyond butterfat: The singular focus on fat has created a “powder crisis” with nonfat dry milk stockpiles reaching five-year highs, potentially offsetting gains from butterfat premiums
  • Strategic approach needed: Success requires optimizing total component value rather than maximizing butterfat alone, with careful consideration of Federal Order payment systems, processing realities, and balanced genetic selection
  • Policy change could shift dynamics: The potential return of whole milk to school meal programs through the “Whole Milk for Healthy Kids Act” represents a significant potential demand driver that could alter current market equations
butterfat production, dairy components, milk prices, butter inventory, dairy economics

The U.S. dairy industry stands at a critical crossroads with butterfat. While your genetics push unprecedented component levels through the bulk tank, processors report churns running at capacity, and cold storage facilities are filling with butter inventory. Meanwhile, your milk check increasingly depends on butterfat premiums. Are we producing too much fat too quickly, or is this short-term pain part of a necessary transformation toward a component-driven future? The answer lies not in producing more butterfat blindly, but in producing it more strategically.

The Butterfat Paradox: More Production, Lower Prices

If you’ve been watching your milk check stubs in early 2025, you’re likely puzzled by what’s happening. Your components are hitting all-time highs, yet CME spot butter prices have plummeted to around $2.35 per pound, well below 2024’s $2.89 average. Your butterfat is simultaneously your greatest asset and your industry’s current challenge.

What’s driving this contradiction? According to the USDA’s Cold Storage report, in February 2025, butter stocks swelled to 305.53 million pounds, 17% higher than in January and 3% higher than last year. This represents the highest February inventory since 2021, creating significant downward price pressure. Meanwhile, cream multiples have fallen below 1.20 in several regions, as reported in recent Dairy Market News weekly reports.

Here’s the reality many industry “experts” won’t tell you: we’ve gotten so good at producing butterfat that we’re temporarily outpacing our processing and distribution infrastructure. The genetics and feeding strategies that propelled component levels upward have worked almost too well, creating a disconnect between farm-level production and market capacity.

But does this mean we should throttle back on butterfat? It does not necessarily mean we need to think more strategically about the total component picture.

Beyond the Bulk Tank: The Component Revolution

When New York dairy farmer Jonathan Lamb presented data at the 101st USDA Agricultural Outlook Forum earlier this year, it revealed something remarkable: his first and second lactation Holsteins completed lactations averaging 5% butterfat. Meanwhile, his fifth and greater lactation cows ranged from 3.5% to 4.4%. These aren’t Jerseys or crossbreeds- these are Holsteins achieving component levels unimaginable a decade ago.

This generational difference vividly illustrates how rapidly genetics has transformed dairy production. While your father might have selected sires primarily for milk volume, you’re now drilling into component PTAs and health traits.

But here’s what the semen catalogs won’t emphasize: this genetic revolution has happened faster than our processing infrastructure could adapt. Federal Milk Marketing Order data confirms this national trend. Butterfat percentages jumped from 4.01% in March 2021 to 4.33% by March 2025, an acceleration that’s left some processors struggling to handle all that cream.

The question isn’t whether components matter-they absolutely do-but whether we’ve created an imbalance by focusing too narrowly on butterfat alone. Are you selecting for a balanced component profile, or just chasing fat at the expense of other valuable traits?

America’s Butter Renaissance: Real Demand or Market Mirage?

The good news is that America’s love affair with butter has never been stronger. According to the latest USDA data, per capita consumption has surged to 6.5 pounds, the highest level since 1965.

With 345 million Americans today compared to 195 million then, we’re seeing 150 million additional butter consumers driving demand to record levels.

This consumption boom reflects several converging factors:

  • A sustained home cooking renaissance that gained momentum during the pandemic
  • Growing consumer preference for natural fats over processed alternatives
  • The expanding popularity of bakery items requiring significant butterfat
  • The “clean-label” appeal of butter as a simple, recognizable ingredient

But here’s the uncomfortable question no one’s asking: if consumer demand is so strong, why are prices falling and inventories building?

The answer lies in the complex seasonality of both production and consumption, alongside temporary foodservice weakness. Restaurant sales slumped significantly in early 2025, with major chains reporting concerning trends: Pizza Hut (-5.0%), Papa John’s (-3.0%), McDonald’s (-3.6%), and Starbucks (-2.0%).

Each percentage point decline in pizza consumption alone removes 1.25 million pounds of cheese from the market weekly, creating ripple effects throughout the dairy supply chain. Are we building production strategies for retail butter demand while ignoring warning signs in food service channels?

The Powder Crisis: Butterfat’s Overlooked Companion

While the industry celebrates component premiums and record butter production, a crisis is brewing on the other side of the centrifuge. We’re facing what USDA data confirms is a “powder crisis,” with nonfat dry milk stockpiles reaching five-year highs, up a staggering 57% year-over-year as of February 2025.

The dairy industry’s inconvenient truth is that every pound of butterfat inevitably produces multiple pounds of skim solids.

When we singularly focus on butterfat, we inadvertently create mountains of powder that must find a home.

With NFDM stockpiles at five-year highs, the pressure on skim milk values is immense. This isn’t just an inventory issue; it’s actively eroding the gains made on the fat side of your milk check for many producers. As butterfat production grew 2.3% in early 2025 while overall milk production increased less than 0.5%, the component imbalance has intensified dramatically.

The harsh reality is that your component strategy isn’t complete if it only addresses fat. Have you calculated how much depressed powder markets offset your butterfat premium improvements? Many farms are experiencing this zero-sum game without realizing it.

Global Opportunity: Butterfat’s Export Potential

A remarkable export opportunity has emerged amid these challenges. According to U.S. Dairy Export Council data, in January 2025, U.S. butter began trading approximately $1 per pound lower than major EU and New Zealand competitors. This price advantage catalyzed explosive export growth, with January 2025 butter exports jumping 41% year-over-year, while anhydrous milkfat exports grew more than sixfold.

This performance resulted in the largest volume of butterfat exported by the U.S. in any month since 2014, a sign that American butterfat can find profitable international homes when price-competitive.

But here’s what most analysts are missing: export markets are opportunistic, not guaranteed. They appear when our prices are low enough to overcome shipping, tariff, and quality barriers. Are we building a sustainable industry model that is dependent on price weakness to access international markets? That’s hardly a formula for long-term success.

The Component Balancing Act: Beyond Butterfat Tunnel Vision

For dairy producers, market dynamics create both opportunities and challenges. Component-focused production generally improves farm-level economics. Research evaluating high-oleic soybean feeding found that increases in milkfat production could improve Milk Income Less Feed Costs by up to $0.27 per cow per day, translating to approximately $33,000 annually for a 500-cow dairy.

Producers focusing on butterfat through strategic ration formulation and genetic selection reportedly realize a 6.3% price advantage compared to average component milk, a compelling economic incentive.

But the industry’s current fixation on butterfat at all costs represents dangerous tunnel vision. Success requires strategies that optimize the value of all milk components rather than focusing exclusively on butterfat. Are you calculating your true return on investment for fat-enhancing feed additives, or simply assuming more fat always equals more profit?

Policy Wildcards: Whole Milk’s Potential Return

Several pending developments could significantly impact future butterfat demand. As the International Dairy Foods Association reported, the “Whole Milk for Healthy Kids Act of 2025,” which received strong bipartisan endorsement in both the Senate Agriculture Committee and House Committee on Education and the Workforce, could create substantial new demand through school meal programs.

This legislation proposes returning whole milk to school cafeterias nationwide, a potentially game-changing development considering children aged 2-11 drink twice as much milk as adults, with 35% of that consumption occurring at school.

However, relying on government policy to solve market imbalances is dangerous. Legislative timelines are unpredictable, and implementation takes time. Are you building your business around what Washington might do, or what consumers do today?

The Bottom Line: Strategic Growth, Not Just More Production

Does the U.S. need more butterfat? The answer isn’t simply yes or no. From a short-term perspective, the current supply exceeds immediate market requirements. High inventory levels, suppressed cream multiples, and price pressure indicate adequate or excessive supply for current demand channels.

However, from a longer-term perspective, several factors support continued strategic growth in butterfat production:

  1. Record-high consumer demand for butter continues a multi-year upward trend
  2. The U.S. remains dependent on imports for approximately 8% of its butterfat needs
  3. Price-competitive U.S. butter creates significant export opportunities
  4. Potential policy changes could create new domestic demand channels
  5. Component-focused production generally improves farm-level economics

What This Means for Your Operation

The industry doesn’t need just “more” butterfat, it needs smarter butterfat production that aligns with processing capacity and market demand. Consider these strategies:

  1. Focus on efficiency, not just volume – Optimize component production per cow through strategic ration balancing rather than simply increasing herd size or pushing components beyond economical levels
  2. Implement comprehensive component strategy – Don’t chase butterfat at the expense of protein and other solids, analyze your Federal Order payment system, and maximize your total component value
  3. Diversify marketing options – Are there local creameries, cheese plants, or specialty processors who might value your components differently than commodity markets?
  4. Use risk management tools aggressively – The volatility in component markets demands sophisticated hedging strategies that protect both fat and protein values
  5. Review your genetic strategy – Are you selecting for the component balance that will maximize your milk check in tomorrow’s markets? Consider your breeding program’s emphasis on fat versus protein PTAs

The question every dairy farmer should ask isn’t “How can I produce more butterfat?” but “How can I maximize the economic return on my components while managing risk?”

America’s butterfat revolution is reaching a pivotal moment. The winners will be those who recognize that success in today’s dairy economy isn’t about filling the bulk tank with maximum components at all costs; it’s about strategic production aligned with realistic market opportunities.

What component strategy adjustments will you implement this month to position your operation for sustainable profitability, not just chasing the next tenth of a percent in the bulk tank?

Learn more:

Join the Revolution!

Join over 30,000 successful dairy professionals who rely on Bullvine Weekly for their competitive edge. Delivered directly to your inbox each week, our exclusive industry insights help you make smarter decisions while saving precious hours every week. Never miss critical updates on milk production trends, breakthrough technologies, and profit-boosting strategies that top producers are already implementing. Subscribe now to transform your dairy operation’s efficiency and profitability—your future success is just one click away.

NewsSubscribe
First
Last
Consent

Dairy Prices Defy Global Trends: What 20% Higher Markets Mean for Your Herd

Dairy prices surge 20% while feed costs drop—discover how this rare market alignment creates a golden opportunity for your herd’s profitability.

EXECUTIVE SUMMARY: The FAO Food Price Index for March 2025 reveals a remarkable opportunity for dairy producers as prices stand nearly 20% higher than last year while feed costs decline by 2.6%. This divergence creates an exceptional profit environment where butter prices have surged 3.9% despite cheese experiencing its first decline in nine months. With RaboResearch forecasting continued milk supply growth of 0.8% in 2025 and gains expected across all major exporting regions for the first time since 2020, producers can capitalize on this favorable market through strategic breeding decisions focused on butterfat (which has 50% heritability) and implementing precision feeding strategies that optimize component production rather than simply volume. The article provides actionable guidance for dairy farmers to maximize returns during this unique market window where input costs are falling while component values remain strong.

KEY TAKEAWAYS

  • Dairy prices are 19.9% higher than March 2024 while feed costs are declining, creating a rare profit opportunity window
  • Butter prices rose 3.9% while cheese declined 1.8%, signaling the importance of breeding for butterfat components
  • Genetic selection is crucial as butterfat has high heritability (50%), making it responsive to breeding strategies
  • Feed efficiency improvements directly impact profitability—each 1% increase in NDF digestibility yields 0.51 lb/day more milk
  • All major dairy exporting regions are expected to see production gains in 2025 for the first time since 2020
dairy prices 2025, FAO Food Price Index, butterfat production, dairy feed costs, dairy market trends

The FAO Food Price Index (FFPI) held steady in March 2025, averaging 127.1 points and remaining virtually unchanged from February, as declining cereal and sugar prices counterbalanced rises in vegetable oils and meat. Despite the month-to-month stability, the index registered 6.9% higher than March 2024 levels, though still sitting 20.7% below its historic peak in March 2022.

FAO Food Price Index Key Metrics (March 2025)

CategoryIndex ValueMonthly ChangeAnnual Change (vs. March 2024)
Overall FFPI127.10%+6.9%
Cereals109.7-2.6%-1.1%
Vegetable Oils161.8+3.7%+23.9%
Meat118.0+0.9%+2.7%
Dairy148.70%+19.9%
Sugar116.9-1.6%-12.3%

Dairy Markets Show Remarkable Strength: What It Means for Your Operation

The FAO Dairy Price Index remained unchanged from February at 148.7 points but stands nearly 20% higher than its March 2024 level – signaling continued strength in global dairy markets. This sustained price elevation creates significant opportunities for producers focused on component optimization and strategic breeding decisions.

International cheese prices fell 1.8%, marking the first decline in nine months, as steady European supply met weakening demand, particularly in Oceania. However, stronger performance in other dairy categories fully offset this decline.

Butter prices surged 3.9% on strong retail sales and lower seasonal output in Oceania, marking the third consecutive monthly rise. This butter strength aligns with broader market trends showing premium values for milkfat components, suggesting producers should consider genetic selection strategies prioritizing butterfat yield.

“When butterfat premiums rise, we adjust rations to optimize milk components,” says Dr. Mike Hutjens, University of Illinois feed specialist. This approach reflects the ongoing shift in component values that began several years ago.

Component Values Shift: Butterfat Takes the Lead

The strength in butter prices continues to be a long trend in dairy markets. According to Hoard’s Dairyman, butterfat has increasingly overtaken protein as the price leader in milk checks. This shift reflects changing consumer preferences as medical, nutrition, and public perceptions of saturated fats in foods like butter have evolved.

“For many years, protein was the consistent component leader in milk checks as it fetched the highest pay price. However, prices and demand for butterfat began to improve as medical, nutrition and public perception changed on saturated fats in foods such as butter, cheese, eggs, and meat,” notes Hoard’s Dairyman.

Feed Cost Relief Amplifies Dairy Profit Opportunities

The 2.6% decline in the FAO Cereal Price Index creates a favorable environment for dairy producers, as feed costs typically represent over 50% of total milk production expenses. This feed cost relief is optimal, potentially enhancing margins for producers who strategically manage their feed programs.

Research from the University of Wisconsin has demonstrated the significant impact of feed digestibility on production efficiency. “A 14% unit difference in Starch Digestibility would translate into a 10% unit difference in TDN,” according to work from Shaver at UW. Michigan State researchers found that for every one percentage-unit increase in NDF digestibility, there is a 0.51 lb/d increase in milk yield.

Strategic Breeding Decisions Critical in the Current Market

Dairy prices show remarkable strength compared to other agricultural commodities, so breeding decisions are critical. The current market environment particularly rewards producers who align their breeding programs with component-focused production strategies.

Since butterfat content is highly heritable (about 50%), genetic selection is crucial for improving performance and obtaining higher milk prices. Lactanet states, “The goal is to breed profitable cows that efficiently yield high volumes of butterfat and protein throughout their productive lives.”

Experts recommend improving overall selection indexes while paying special attention to fat content and yield. The Genetic Herd Inventory report can help assess a herd’s genetic potential for butterfat production, with percentile rankings providing context for how a herd compares to the industry average.

Vegetable Oils and Meat Markets Also Show Strength

The FAO Vegetable Oil Price Index rose significantly, increasing by 3.7% from February to average 161.8 points, positioning it 23.9% higher than its year-earlier level. Higher quotations across palm, soy, rapeseed, and sunflower oils drove this upward momentum.

The FAO Meat Price Index increased by 0.9% in March to 118.0 points, positioning it 2.7% above March 2024. This rise was predominantly attributed to higher pig meat prices in Europe, which strengthened following renewed demand in the European Union.

Historical Perspective Shows Stabilization After Volatility

While the current FFPI shows a 6.9% increase from March 2024, it remains significantly below (20.7%) the peak reached in March 2022 following Russia’s invasion of Ukraine.

Historical FFPI Comparison

YearAverage IndexNotable Events
2022159.7Peak post-Russia-Ukraine invasion
2024126.5Pre-March 2025 baseline
2025127.1Current stabilization phase

What This Means for Your Dairy Operation

The continued strength in dairy prices, particularly the nearly 20% year-over-year increase, combined with declining feed costs, creates exceptional profit opportunities for dairy producers in 2025. To maximize returns in this favorable environment, consider these strategic approaches:

Monitor Feed Grain Prices Against Milkfat Premiums

With cereal prices declining while butter values surge, the spread between input costs and component-based revenue streams is widening. This creates opportunities to optimize feeding programs that maximize valuable components rather than simply volume.

Consult Breeding Specialists to Align Genetics with Market Demands

The current market particularly rewards butterfat production. With butterfat’s high heritability (about 50%), genetic selection can significantly impact your herd’s ability to capitalize on current market conditions.

Implement Precision Feeding Strategies

Research shows that fiber and starch digestibility improvements can significantly impact production efficiency. Michigan State researchers found that for every percentage-unit increase in NDF digestibility, cows produced 0.51 lb/d more milk.

The March 2025 FAO Food Price Index reflects a complex global food market with divergent trends across commodity groups. Combining strong dairy prices and declining feed costs for dairy producers creates a uniquely favorable profit environment that rewards strategic management decisions focused on component optimization, efficient feed utilization, and aligned breeding strategies.

Learn more:

Dairy Market Mania: How Heatwaves, Bird Flu, and Heifer Shortages are Shaking Up Milk Production and Prices

Heatwaves, avian influenza, and skyrocketing heifer costs are wreaking havoc on milk production and driving up prices. Are you ready for the mounting challenges in the dairy industry?

Summary:  The dairy markets surged this week, fueled by an unprecedented heatwave, avian influenza, and a heifer shortage, tightening milk supplies. U.S. milk production hit 18.8 billion pounds in June, down 1% from the previous year, continuing a trend of lower output. While higher components like milk solids and butterfat offer some relief, they fall short of meeting demand. Key states saw sharp production declines due to heat and avian flu, amplifying scarcity. This has driven up prices for whey powder, cheese, and butter, presenting mixed outcomes for the industry. Producers are retaining older, less productive cows to sidestep high heifer costs, deteriorating herd productivity and long-term viability. Despite these hurdles, increased milk solids and butterfat output somewhat offset reduced milk production.

Key Takeaways:

  • The dairy markets are heating up as summer sets in, exacerbated by factors like the hot weather, avian influenza, and a shortage of heifers.
  • Milk output in the U.S. was 18.8 billion pounds in June, down 1% from the previous year, marking the lowest first-half production since 2020.
  • High temperatures, particularly in Arizona, California, and New Mexico, have significantly impacted milk production.
  • Avian influenza has further strained production, especially in states like Colorado, Idaho, and Michigan.
  • The trend of keeping older, less productive cows to avoid buying expensive heifers is resulting in reduced milk yields.
  • Increased demand for bottled milk has contributed to tighter supplies, even with higher component levels in milk.
  • Commodity prices, especially for whey powder and cheese, are on the rise due to stronger domestic demand and limited supply.
  • Class III and Class IV milk futures have seen significant gains, reflecting the market’s response to these supply challenges.
  • Political uncertainties, particularly regarding trade relations with China, have temporarily affected feed markets, causing a rally in soybean and corn futures.

As the summer heats up, so do dairy markets. However, the rising concerns, driven by intense heatwaves in critical areas, avian influenza outbreaks, and a persistent heifer shortage, are leading to a significant drop in milk output and profoundly impacting the dairy industry. Arizona and New Mexico experienced the highest temperatures in June, while Colorado and California’s Central Valley saw record-breaking nighttime lows. U.S. milk output in June was 18.8 billion pounds, down 1% from the previous year and the lowest first-half production since 2020. While higher components have kept U.S. milk solids and butterfat production slightly ahead of last year, more is needed to meet the needs of dairy processors. Despite these challenges, the adaptability and resilience of farm managers and industry experts are evident as they manage operations under adverse conditions, necessitating essential modifications effectively.

Heatwaves Hammer U.S. Dairy Industry

StateJune Average Temperature (°F)June Record High Temperature (°F)June Overnight Low Temperature (°F)
Arizona85.6120.075.2
New Mexico79.1110.062.4
Colorado65.7105.050.1
California’s Central Valley82.3115.072.6

Despite Record Temperatures and Aging Herds, the Dairy Industry Remains ResilientThe recent heatwaves’ severity and persistence have set new temperature records in crucial dairy-producing regions like Arizona, New Mexico, Colorado, and California’s Central Valley. This extreme heat has significantly impacted milk output and the health of dairy herds, underlining the severity of the situation.

Arizona and New Mexico experienced the highest temperatures in June, while Colorado and the Central Valley endured record nightly lows. These extreme heat conditions have stressed dairy cows significantly, leading to declining milk production. For instance, Arizona saw a staggering 3.9% reduction in milk output, while New Mexico experienced an even more drastic 12.5% drop. The heatwaves have affected milk production and the dairy herd’s health and productivity, exacerbating the milk supply shortage.

The heatwaves have also changed the mix of dairy cows. Producers are likelier to keep older, less productive cows than invest in more expensive heifers, decreasing the total herd size. This choice, prompted by severe weather, has resulted in an older and less productive dairy herd, worsening the milk supply shortage. Even if the weather fades, the long-term consequences on milk output may linger, putting production levels below the previous year’s standards.

Bird Flu Blunders: Avian Influenza Intensifies the Dairy Dilemma in Key States

Avian influenza has complicated the difficulties confronting the dairy business, notably in Colorado, Idaho, and Michigan. In Colorado, dairy farmers have been hit by harsh heat and avian influenza outbreaks. This twofold danger has compounded the problem, reducing milk supply and affecting overall herd health.

Idaho and Michigan have also seen the effects of avian flu. Milk output in Idaho fell by 1%, while Michigan had a 0.9% decline. The avian influenza outbreaks have increased biosecurity measures and operating expenditures, increasing demand for available resources. Producers in these states are attempting to preserve herd output while limiting the danger of the virus spreading.

Compounding these difficulties, the illness has distracted attention and resources that might have been directed toward other vital concerns, including heifer scarcity and market demands to improve milk supply. Consequently, dairy farmers in these areas face a challenging environment in which every action influences their enterprises’ short—and long-term survival.

Heifer Havoc: Skyrocketing Costs and Aging Cows Threaten Dairy Industry’s Future

YearHeifer Shortage (%)Average Heifer Cost ($)
20205%1400
20217%1600
202210%1800
202313%2000
2024 (Projected)15%2200

One of the major issues currently plaguing the dairy sector is the significant scarcity of heifers. This shortage is primarily driven by the high expenses of purchasing young heifers, which makes dairy farmers more unwilling to renew their herds. The heifer market has seen an inflationary spiral driven by extraordinary feed expenses, veterinary care, and general maintenance, all contributing to increased financial pressures on farm management.

Consequently, many producers choose to keep older cows, which, although cost-effective in the near term, has its own set of issues. These older cows are often less productive than their younger counterparts, decreasing milk output. Keeping these older cows in production results in a less efficient herd, which is bad news for future milk production.

The ramifications of an aging herd are numerous. Reduced milk yields restrict current production capacities and jeopardize the long-term viability of dairy farms. Lower productivity implies that the dairy business may need help to satisfy market demands, especially during peak consumption or export periods. Furthermore, older cows have longer calving intervals and more significant health risks, which may increase veterinary expenditures and a shorter productive lifetime.

The ongoing heifer shortfall may limit the industry’s capacity to recover from recent output slumps. However, with a consistent supply of young, productive heifers, the chances of reversing the downward trend in milk output are high. This situation underscores the need for deliberate investment in herd management and breeding programs to maintain a balanced and profitable dairy herd.

Sweltering Heat and Avian Attacks: U.S. Dairy Industry Faces Production Dip, But High Components Offer Hope

MonthMilk Production (in billion pounds)Change from Previous Year
January19.2-0.5%
February17.8-0.7%
March19.1-0.8%
April18.5-1.2%
May19.0-1.0%
June18.8-1.0%

This summer’s heat has certainly impacted U.S. milk production, which reached 18.8 billion pounds in June, a 1% decrease from the previous year—the first half of this year had a 0.9% decrease in output, the lowest since 2020. While some areas saw record-high temperatures, others were hit by avian influenza, which exacerbated the slump. Compared to previous years, these numbers highlight a disturbing trend compounded by the persistent heifer scarcity and aged herds. Despite these obstacles, there is a bright line: more excellent components imply that U.S. milk solids and butterfat production has continued to exceed prior year levels. This increase is crucial for dairy processors looking to fulfill market demand and sustain production levels despite decreased fluid milk yields. The increased butterfat and solid content mitigate the impact of reduced milk output, ensuring that dairy products remain rich in essential nutritious components.

Scorching Heat and Bird Flu: Regional Milk Production Tanks with Double-Digit Declines

StateProduction Change (%)Factors
Arizona-3.9%Record High Temperatures
California-1.8%Heat Wave
Colorado-1.1%Heat Wave, Avian Influenza
New Mexico-12.5%Record High Temperatures
Idaho-1.0%Avian Influenza
Michigan-0.9%Avian Influenza

Milk production has fallen significantly in states dealing with heatwaves and avian influenza. Arizona’s output fell by a stunning 3.9%, while California saw a 1.8% drop. Colorado was not spared, with a 1.1% decline in production. However, New Mexico had the most severe consequences, dropping milk output by 12.5%. These significant decreases emphasize the negative impact of harsh weather and illness on regional dairy operations, emphasizing the critical need for adaptable measures.

Tight Supply Chain Strains: High Component Levels Can’t Offset Milk Scarcity in Dairy Production 

Tighter milk supplies are having a noticeable impact on dairy product production. The shortage limits production capacity despite greater component levels, such as increased milk solids and butterfat. This bottleneck is visible across many dairy products, resulting in limited supply and price increases.

Notably, fluid milk sales have shown an unusual increase. Sales increased by 0.6% from January to May, adjusted for leap day, compared to the same period in 2023. This is a tiny but meaningful triumph for a sector experiencing falling revenues for decades. Increased bottling demand has put further pressure on milk supply, making it even more difficult for dairy processors to satisfy the industry’s requirements. As a result, although the increase in fluid milk sales is a welcome development, it also exacerbates the scarcity of other dairy products.

Milk Market Madness: Prices Skyrocket as Whey, Cheese, and Butter React to Tight Supplies

MonthClass III Milk Price ($/cwt)Class IV Milk Price ($/cwt)Cheese Price ($/lb)Butter Price ($/lbth)Whey Price ($/lb)Milk Powder Price ($/lb)
April$17.52$18.11$1.85$2.97$0.52$1.20
May$18.25$18.47$1.87$3.04$0.54$1.22
June$19.10$19.03$1.89$3.06$0.55$1.22
July$20.37$20.12$1.91$3.07$0.56$1.24
August$21.42$21.24$1.93$3.09$0.57$1.23
September$21.89$21.55$1.95$3.11$0.58 

The confirmation of decreasing milk output and the likelihood of more decreases has shaken the market. Prices rose, especially in the CME spot market. Whey powder prices skyrocketed from 5.25 to 57 cents per pound, reaching a two-year peak. Strong domestic demand for high-protein whey products and limited milk supply in cheese-producing areas drive significant growth.

Cheese prices have followed suit, rising considerably. CME spot Cheddar barrels increased by 5.75 percent to $1.93, while blocks increased by 6.5 percent at the same price. U.S. cheese production has been defined as “steady to lighter,” cheese stocks have declined, notably with a 5.8% reduction in cold storage warehouses as of June 30, compared to mid-year 2023. This reduced stockpile and record-breaking exports have resulted in tighter U.S. cheese supply and higher pricing. However, potential supply shortages will have a more significant impact in the future.

Butter had a modest gain, inching ahead by 1.5 percent to settle at $3.09. Although there is still a significant supply of butter in storage (6.8% more than in June 2023), concerns about availability as the year develops have affected the price.

During these price increases, the futures market responded strongly. Class III futures increased by 84 percent to $21.42 in September. Class IV futures increased by almost 20% and settled above $21, demonstrating strong market confidence amid tighter supplies and rising demand.

Whey Powder Bonanza: Prices Hit Two-Year High, Boost Class III Values, and Drive Market Dynamics

The whey powder industry has experienced a startling jump, with prices increasing from 5.25 to 57 cents per pound—a more than 10% increase. This is the highest price in two years, indicating a positive trend supported by strong local demand for high-protein whey products. Furthermore, tighter milk supply in cheese-producing areas has contributed to the rising trend. The whey market’s strength is a big boost for Class III values, as each penny gains in the whey price adds around 6˼ to neighboring Class III futures. Spot whey prices increased by about 7% in June and July compared to the first half of the year, resulting in a 40% increase in Class III pricing. Dairy experts should actively follow these changes since they substantially impact profitability and market dynamics.

Cheese Market Surge: Soaring Prices and Shrinking Inventories Signal Major Shifts

The cheese market is undergoing a significant transition, with prices constantly rising. CME spot Cheddar barrels surged considerably, reaching $1.93 per barrel, while blocks followed suit, reaching $1.93 per pound. Several variables contribute to these price changes, as does the present position of low cheese supplies.

For starters, cheese production in the United States has been defined as “steady to lighter,” which necessarily reduces the available supply. Cheese stocks fell in June as yearly, but this year’s drop was magnified by counter-seasonal falls from March to May. This condition resulted in 5.8% less cheese in cold storage on June 30 compared to mid-year 2023.

The dairy sector has also profited from record-breaking exports, which have helped to constrain the U.S. cheese supply. However, this phenomenon has a double edge. Although export demand has boosted prices and decreased local stockpiles, its long-term viability is still being determined. Export sales have begun to decline, and although local demand remains solid, it is unlikely that it will be strong enough to propel cheese prices beyond $2.

Butter Market Alert: Holiday Shortages Loom Despite Stock Increases and Rising Prices

The butter market saw a slight stock drop in June, indicating more considerable supply restrictions in the dairy industry. Despite a 6.8% increase in storage since June 2023, butter merchants are concerned about probable shortages in supermarket stores as we approach the holiday season in November. Butter prices have increased by 1.5 percent this week to $3.09, indicating a cautious outlook. The sector is prepared for a challenging quarter owing to strong demand and tight supply constraints.

Milk Powder Market Movement: Prices Surge to Five-Month High Amid Tight Supplies and Global Competition 

After months of sluggish pricing, the spot milk powder market has finally stirred, rising into the mid-$1.20s and finishing at a five-month high of $1.2325. This considerable increase is attributable to a combination of causes, the most prominent of which is dramatically reduced U.S. milk powder stocks due to continuous decreased production levels. Dairy managers and industry experts should be aware that competition for export markets is becoming more severe, a situation aggravated by China’s lack of considerable purchase activity. While New Zealand’s milk production season has started slowly, Europe’s milk output has progressively increased, topping year-ago levels by 0.4% in April and 0.6% in May. This increase in European manufacturing may soon lead to more robust milk powder offers, possibly weakening U.S. export competitiveness. Farm managers must be diligent about market signals and inventory management to negotiate a tighter supply chain.

Future Shock: Spot Market Gains Propel Class III & IV Milk Contracts to New Heights

The recent increase in spot markets has caused significant volatility in the futures market, notably for Class III and IV milk products. Futures prices have risen dramatically due to increasing spot prices for dairy commodities such as whey powder and cheese. The September Class III futures contract increased by 84 percent to $21.42, while Class IV futures climbed roughly 20 percent to remain over $21.

These price increases are primarily due to U.S. milk production growth limits. Record-breaking heatwaves have drastically reduced milk output in dairy cattle. The avian influenza has further exacerbated these losses by lowering herd size in important dairy states. An aged herd, compounded by the high expense of procuring replacement heifers, further impedes production advances. Despite greater component levels contributing to production, total milk supply remains constrained, driving up market prices.

Finally, more robust spot markets and the twin hurdles of heat-induced production losses and avian flu effects have resulted in an optimistic forecast for the futures market. Dairy farmers and market analysts should pay careful attention to these trends as they negotiate the complexity of a business experiencing unprecedented pressure.

Political Jitters Jolt Feed Markets: Potential Trade War with China Spurs Soybean and Corn Futures Rally

This week, political uncertainty has placed a pall over the feed markets. The main issue is the possibility of a fresh trade war with China, fueled by the changing political situation in the United States. As talk grows about a potential second term for Trump, battling against Vice President Harris rather than an aged President Biden, financial experts are concerned that trade dynamics may alter substantially. Tightening ties between the U.S. and China might significantly affect U.S. soybean exports, the world’s largest market.

In reaction to this uncertainty, the market saw a brief respite in feed price reductions early in the week. November soybean futures increased by more than 40%, while December corn futures increased by 16%. Traders assessed political concerns against crop quantities yet to be harvested and stored. However, by the end of the week, emphasis had returned to the immediate plenty of grain, resulting in price stability.

Today, December corn ended at $4.10 a bushel, up a cent from last Friday. November soybeans finished at $10.46, while December soybean meal was $324 a ton, up $19 from the previous week’s multi-year low. Despite short-term political uncertainty, the overall prognosis indicates that grain will remain plentiful and reasonably affordable shortly.

The Bottom Line

As we confront an extraordinary summer challenge, excessive heat, avian influenza, and heifer shortages have significantly reduced milk supply, dramatically dropping U.S. milk output. These gains have scarcely compensated for the shortages despite increased product components such as milk solids and butterfat. Extreme heatwaves in important dairy states such as Arizona, California, Colorado, and New Mexico and avian influenza outbreaks in Colorado, Idaho, and Michigan have substantially reduced production. Furthermore, the unwillingness to invest in pricey heifers has resulted in an aged, less productive dairy herd, impeding future expansion. These factors and a minor increase in fluid milk demand have pushed prices up, particularly for whey powder, cheese, and butter, severely hurting consumer costs and industry profits. The present status of the dairy business in the United States highlights the critical need for adaptive methods, such as improved herd management and investments in younger cows, to mitigate the consequences of climate change and disease outbreaks. How will your business adjust to strengthen resilience and ensure future output in these challenging times?

Learn more: 

Send this to a friend