


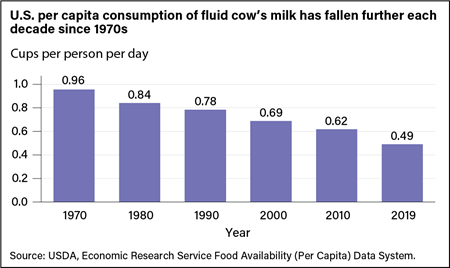
Fluid cow’s milk has long been a grocery staple for most U.S. households. However, as dietary habits change, individuals are drinking less milk on average. The USDA, Economic Research Service (ERS) Food Availability (Per Capita) Data System shows that U.S. daily per capita consumption of fluid milk decreased over each of the past seven decades. Between 1990 and 2000, it fell from 0.78 cup to 0.69 cup (an 11.5-percent decline). By 2010, it was down to 0.62 cup (10.1 percent lower than it had been in 2000). Compared with each of the previous six decades, U.S. daily per person fluid milk consumption fell at its fastest rate in the 2010s. In 2019, it was 0.49 cup (20.7 percent lower than in 2010).
The Dietary Guidelines for Americans, 2020–2025, recommend individuals consume 2- to 3 cup-equivalents of dairy products per day depending on their age, gender, and level of physical activity. One cup of fluid cow’s milk, 1 cup of yogurt, 1.5 ounces of natural cheese, or 2 ounces of processed cheese each contribute 1 cup-equivalent toward meeting daily dairy recommendations. One cup of fortified soy beverage also counts as 1 cup-equivalent of dairy product. Other plant-based products bearing two-part names (almond milk, rice milk, coconut milk, oat milk, hemp milk, and others) are not included as part of the dairy group because their overall nutritional content is not similar to that of dairy milk.
Despite Government and industry efforts, about 90 percent of the U.S. population does not meet the Dietary Guidelines’ dairy recommendations. Although U.S. per capita cheese and yogurt consumption has more than tripled since 1970, U.S. per capita consumption of all dairy products peaked in 1987 at 1.57 cup-equivalents per day. People drank less milk during the 1990s and 2000s, more or less offsetting increases in consumption of other dairy products. In 2009, consumption of U.S. dairy products was 1.55 cup-equivalents per person per day. By 2019, it was 1.49 cup-equivalents, weighed down by the faster rate of declines in milk consumption.
The future of U.S. fluid milk consumption depends not just on the overall trend but also on which consumers are reducing their consumption most and how they do so. To investigate U.S. fluid milk consumption trends among age groups, ERS researchers recently examined dietary intake surveys cooperatively planned and conducted by USDA and the National Center for Health Statistics (part of the Centers for Disease Control and Prevention) between 2003 and 2018. In these surveys, participants reported their food and beverage intake during a 24-hour period. They recorded what and how much they ate and drank and whether they consumed foods and beverages as standalone items or in combination with other foods. ERS researchers also studied scanner data collected between 2013 and 2018 with detailed information about which products a panel of households bought over that time period at retail stores. This study helped to better understand the evolving relationship between households’ purchases of fluid dairy milk, plant-based milk alternatives, and other potentially competing beverages.
Milk as a Beverage
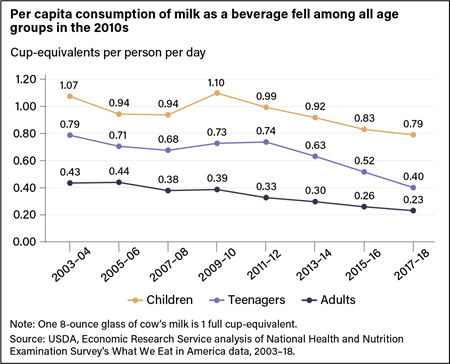
Dietary intake surveys from 2003–2018 confirm that people in the United States primarily consume fluid cow’s milk as a beverage. Even so, during this same period, individuals of all ages significantly decreased their consumption. This includes plain and flavored milk as well as malted milk, eggnog, and hot chocolate, among other milk-based beverages. Per capita daily consumption among children (ages 12 years and under) initially fluctuated over the 2000s. Children’s consumption of milk measured 1.07 cup-equivalents in 2003–04 and 1.10 cup-equivalents in 2009–10. However, during the 2010s, per capita consumption of milk as a beverage declined steadily among children, falling to 0.79 cup-equivalent per day in 2017–18. Steady declines also occurred in per capita consumption among teenagers (ages 13 through 19) and adults (ages 20 and older) after 2011–12.
Milk with Cereal
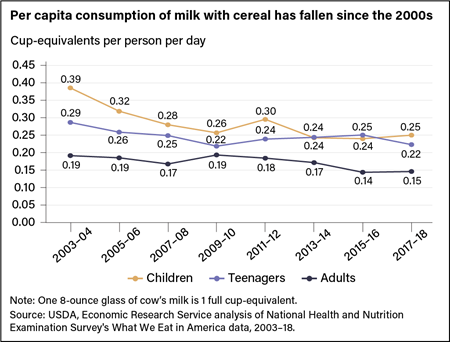
People also pour fluid cow’s milk on hot and cold cereal. Between 2003 and 2018, U.S. per person consumption of milk in this manner fell, with the steepest drop occurring among children. Among children, it fell from 0.39 cup-equivalent in 2003–04 to 0.25 cup-equivalent in 2017–18. A smaller decrease occurred among adults. Changes in consumption among teenagers were statistically insignificant.
Milk in Other Beverages
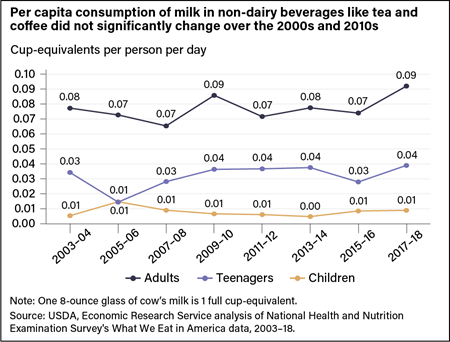
A third way people use fluid cow’s milk is by adding it to beverages such as coffee and tea. No statistically significant changes were detected in the amount of milk that individuals use this way over the 2000s and 2010s. In 2017–18, adults consumed an average of about 0.09 cup-equivalent of milk with non-dairy beverages each day, much as they did in 2003–04.
What Has Contributed to the Downward Trend?
Underlying the long-run downward trend in milk drinking are differences in the eating and drinking habits of newer and older generations. A 2013 ERS report shows that newer generations are consuming less fluid milk than preceding generations. Individuals born in the 1970s, for example, drank less milk in their teens, 20s, and 30s than individuals born in the 1960s did at the same age points. Those born in the 1980s and 1990s, in turn, appear likely to consume even less fluid milk in their adulthood than those born in the 1970s. These differences across generations reflect in part their unique eating choices as children. Every decade brings a wider selection of beverage choices at supermarkets, restaurants, and other food outlets.
Nutritionists have pointed out that consumption of sugar-sweetened beverages such as soft drinks and juice drinks increased during the 1980s and 1990s and appeared to be replacing milk. However, in recent years, U.S. per capita consumption of sugar-sweetened beverages also has declined. Using data on households’ beverage choices between 2013 and 2018, ERS researchers examined households’ purchases at retail grocery stores of milk, soft drinks, 100-percent juice and juice drinks, bottled water, and coffee and tea drinks. They found little evidence that consumption of one beverage was offset by consumption of another. That is, competition between milk and these other major beverage categories was found to have little effect on milk purchases over those years.
There was, however, evidence that plant-based milk alternatives, such as almond milk and soy milk, do compete with fluid cow’s milk. ERS research using household scanner data confirms that sales of these beverages are negatively affecting purchases of fluid cow’s milk. Still, the increase in their sales is much smaller than the decrease in sales of fluid cow’s milk, so plant-based milk alternatives can explain only a small share of overall sales trends. Sales of plant-based milk alternatives may be contributing to sales trends for fluid cow’s milk but are not likely to be a primary driver of those trends.
USDA Supports Dairy Consumption
Several USDA programs encourage consumption of fluid cow’s milk and overall dairy consumption, including the National School Lunch and School Breakfast Programs; the Special Supplemental Nutrition Program for Women, Infants, and Children, or WIC; and the Special Milk Program. Schools participating in the National School Lunch Program, for example, must offer students 1 cup of milk with each lunch.
When analyzing the 2003–18 dietary records of teenagers and children, ERS researchers found that children aged 6 through 12 years obtained 35 percent of their fluid milk at schools while teenagers aged 13 through 18 years obtained 25 percent of their fluid milk at schools. Consumption of fluid milk was also higher for both groups on weekdays, when schools are generally in session, than on weekends.
Dairy farmers and fluid milk processors also invest in checkoff programs that operate with oversight from USDA’s Agricultural Marketing Service. The Fluid Milk Processor Promotion Program, funded by fluid milk processors, was designed to maintain and expand markets and uses for fluid milk products produced in the United States through generic advertising (designed to promote a general product rather than a particular brand). The National Dairy Promotion and Research Board, funded by dairy farmers and dairy product importers, seeks to increase sales of, and demand for, all types of dairy products and ingredients.
ERS research in 2017 found that thousands of new beverage products are introduced in the U.S. market each year, which may compete with fluid milk. This mix of new products includes a variety of milks, carbonated soft drinks, fruit drinks, juices, energy drinks, sports drinks, and waters with fruit flavoring, among others. Competition among these products is based in part on price. Product packaging may also highlight attributes, including flavor or whether the product is USDA Organic certified, is natural in origin, contains probiotics, contains calcium, is lactose-free, is non-GMO, or is without artificial sweeteners. Future milk-drinking trends in the United States may be shaped by the abilities of milk processors and other beverage manufacturers to gauge and anticipate the mix of attributes most appealing to consumers.
Source: ers.usda.gov


