Archive for milk check math

The $333M Processor Rush: Why Rod Hissong Wins While Pool Farms Get the 30-to-1 Gap

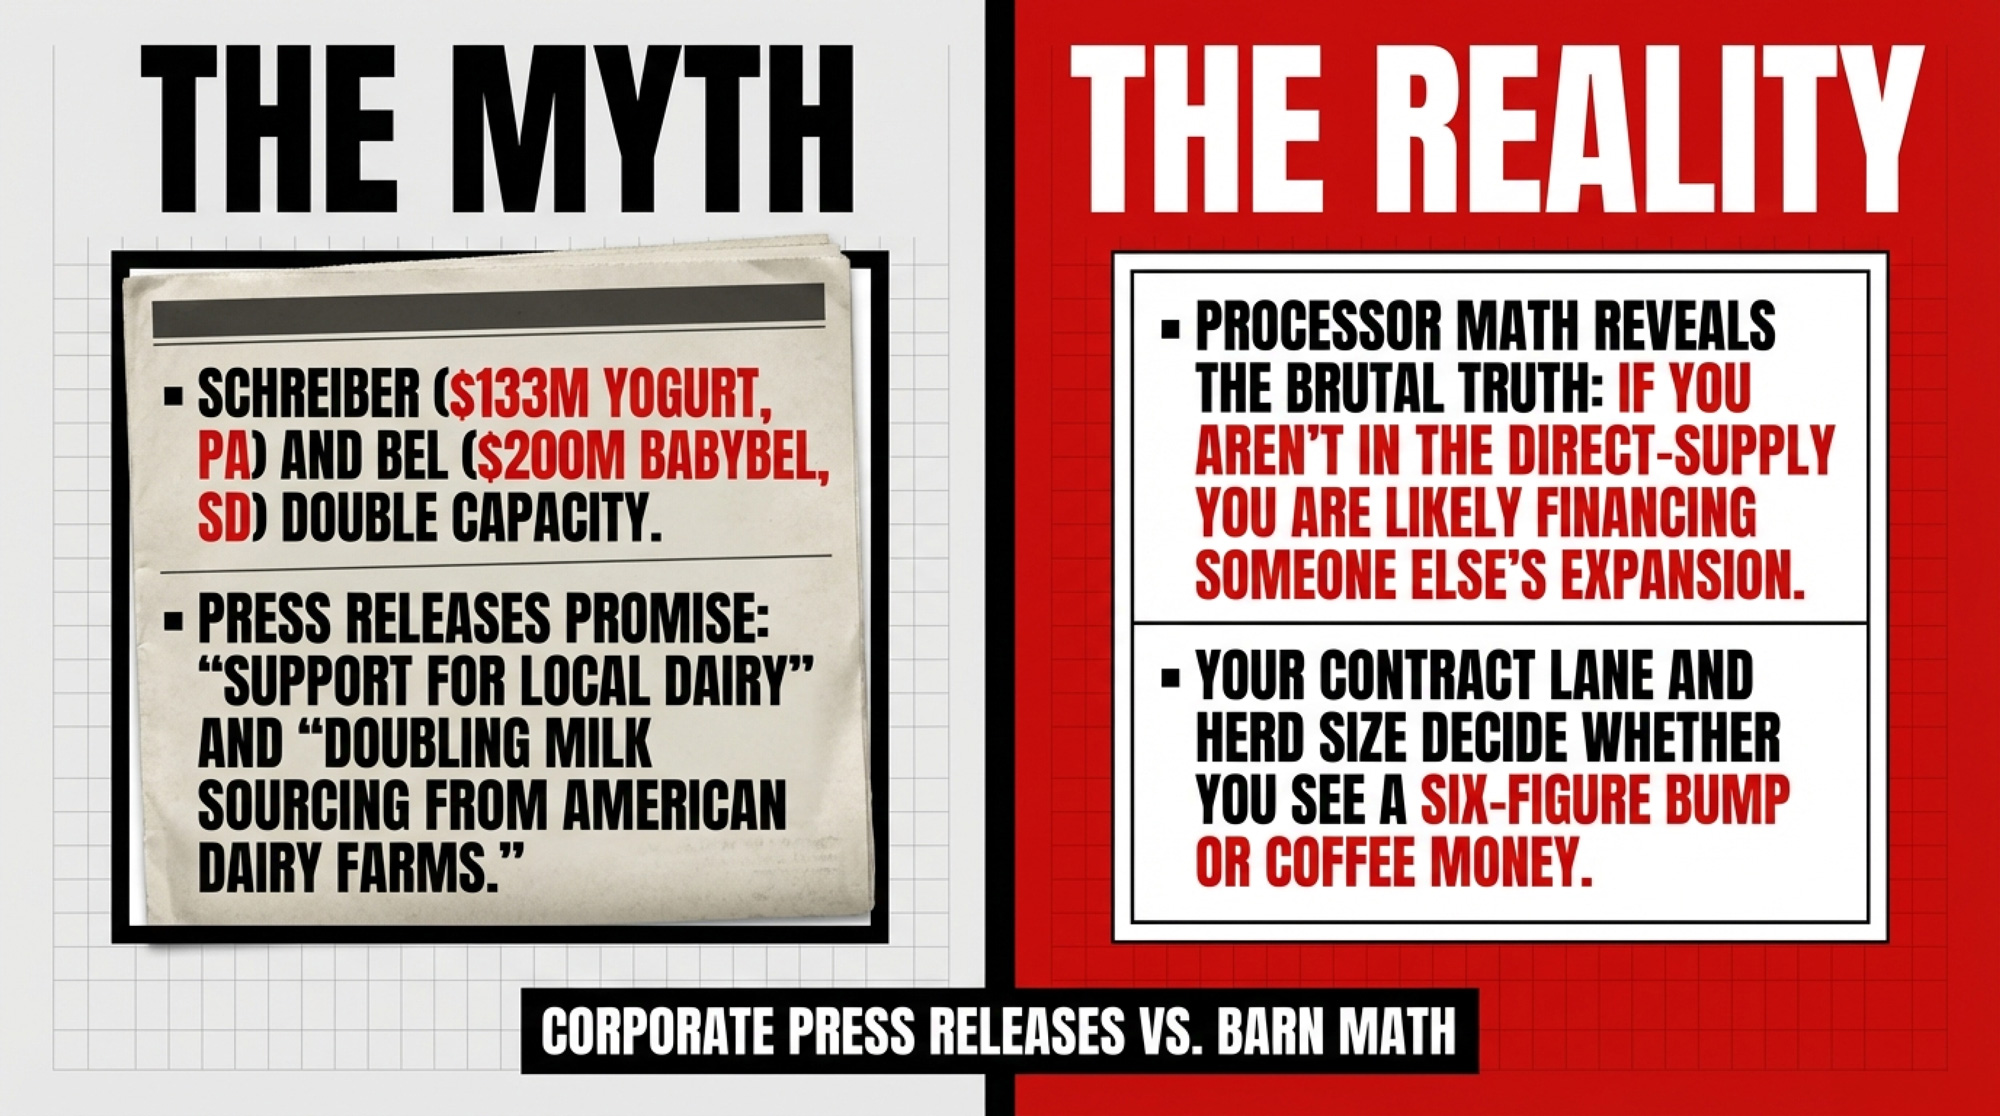
Processor math reveals the brutal truth: If you aren’t in the direct-supply lane, you’re likely financing someone else’s expansion.

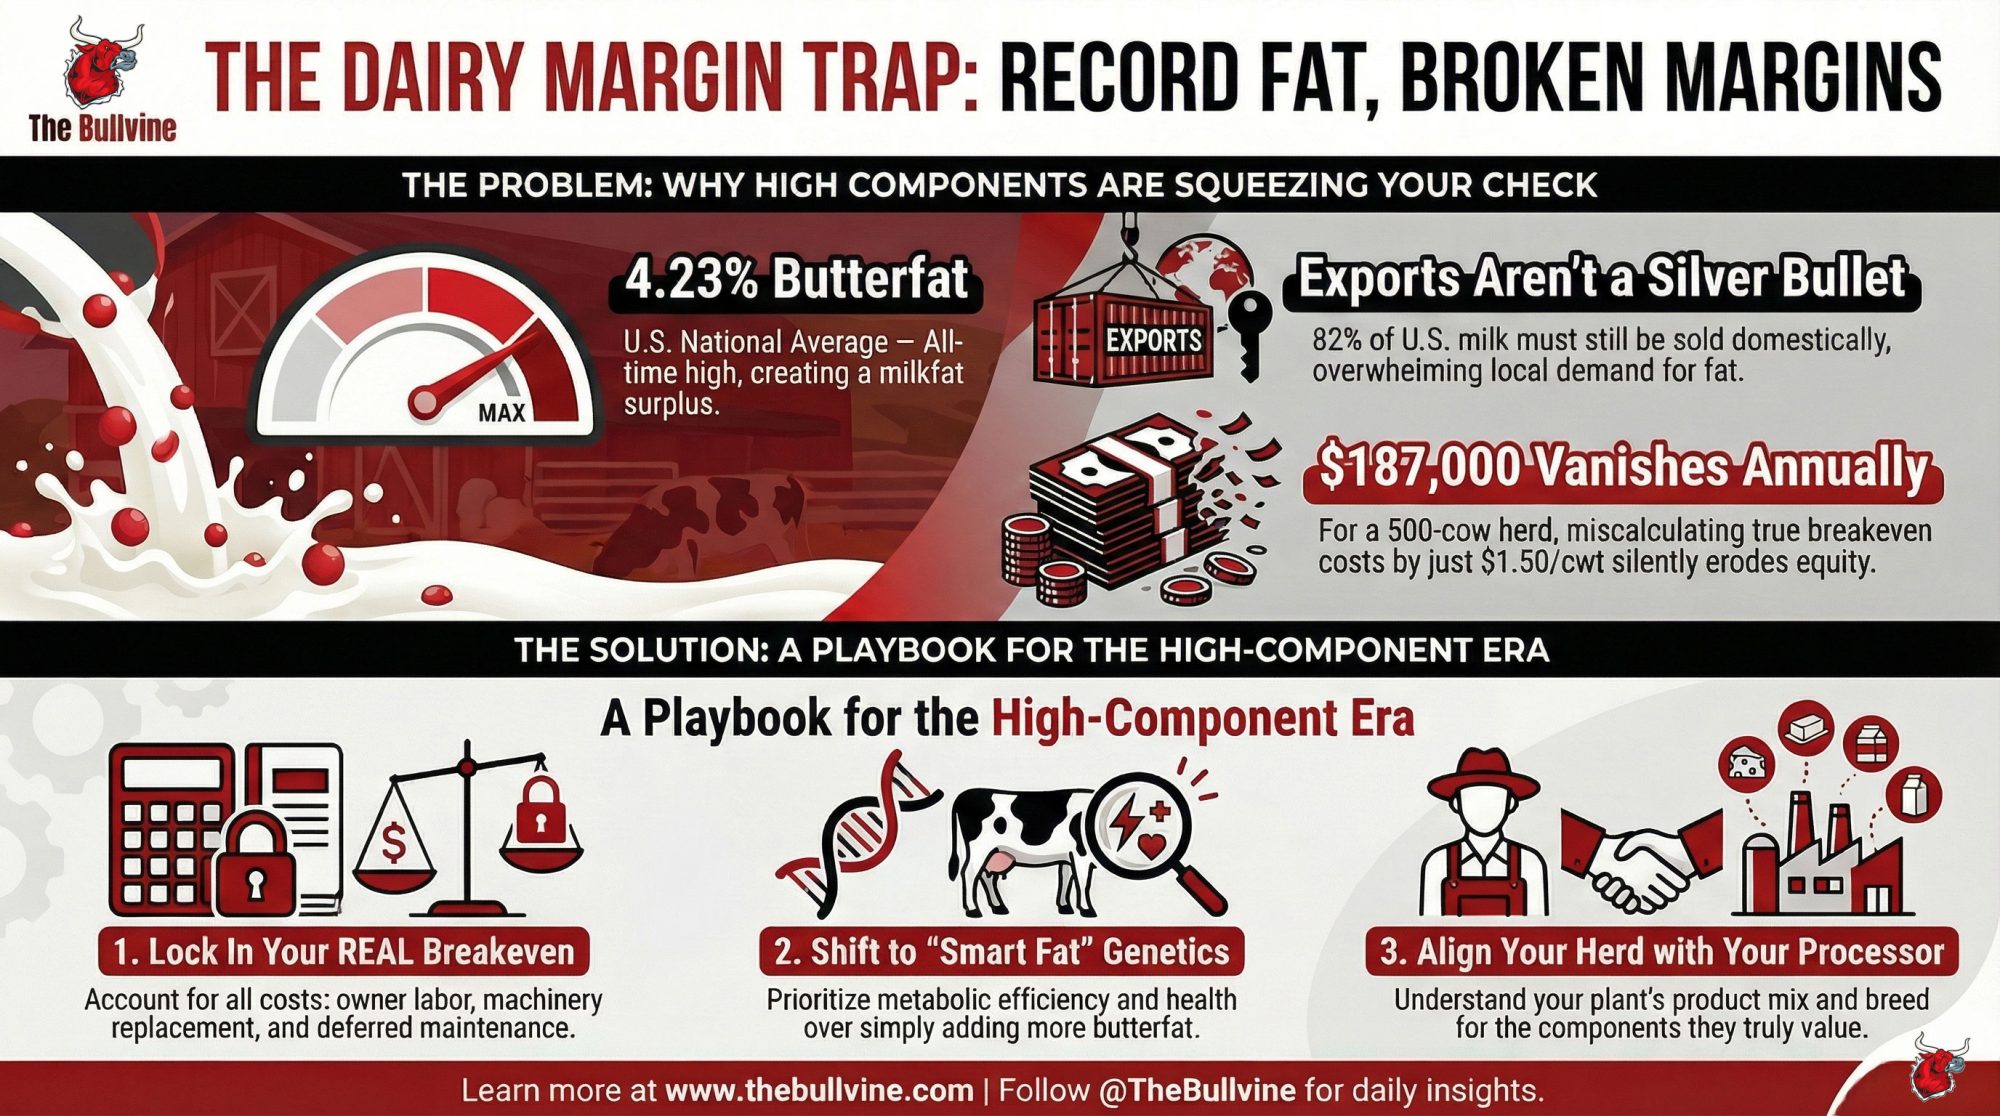
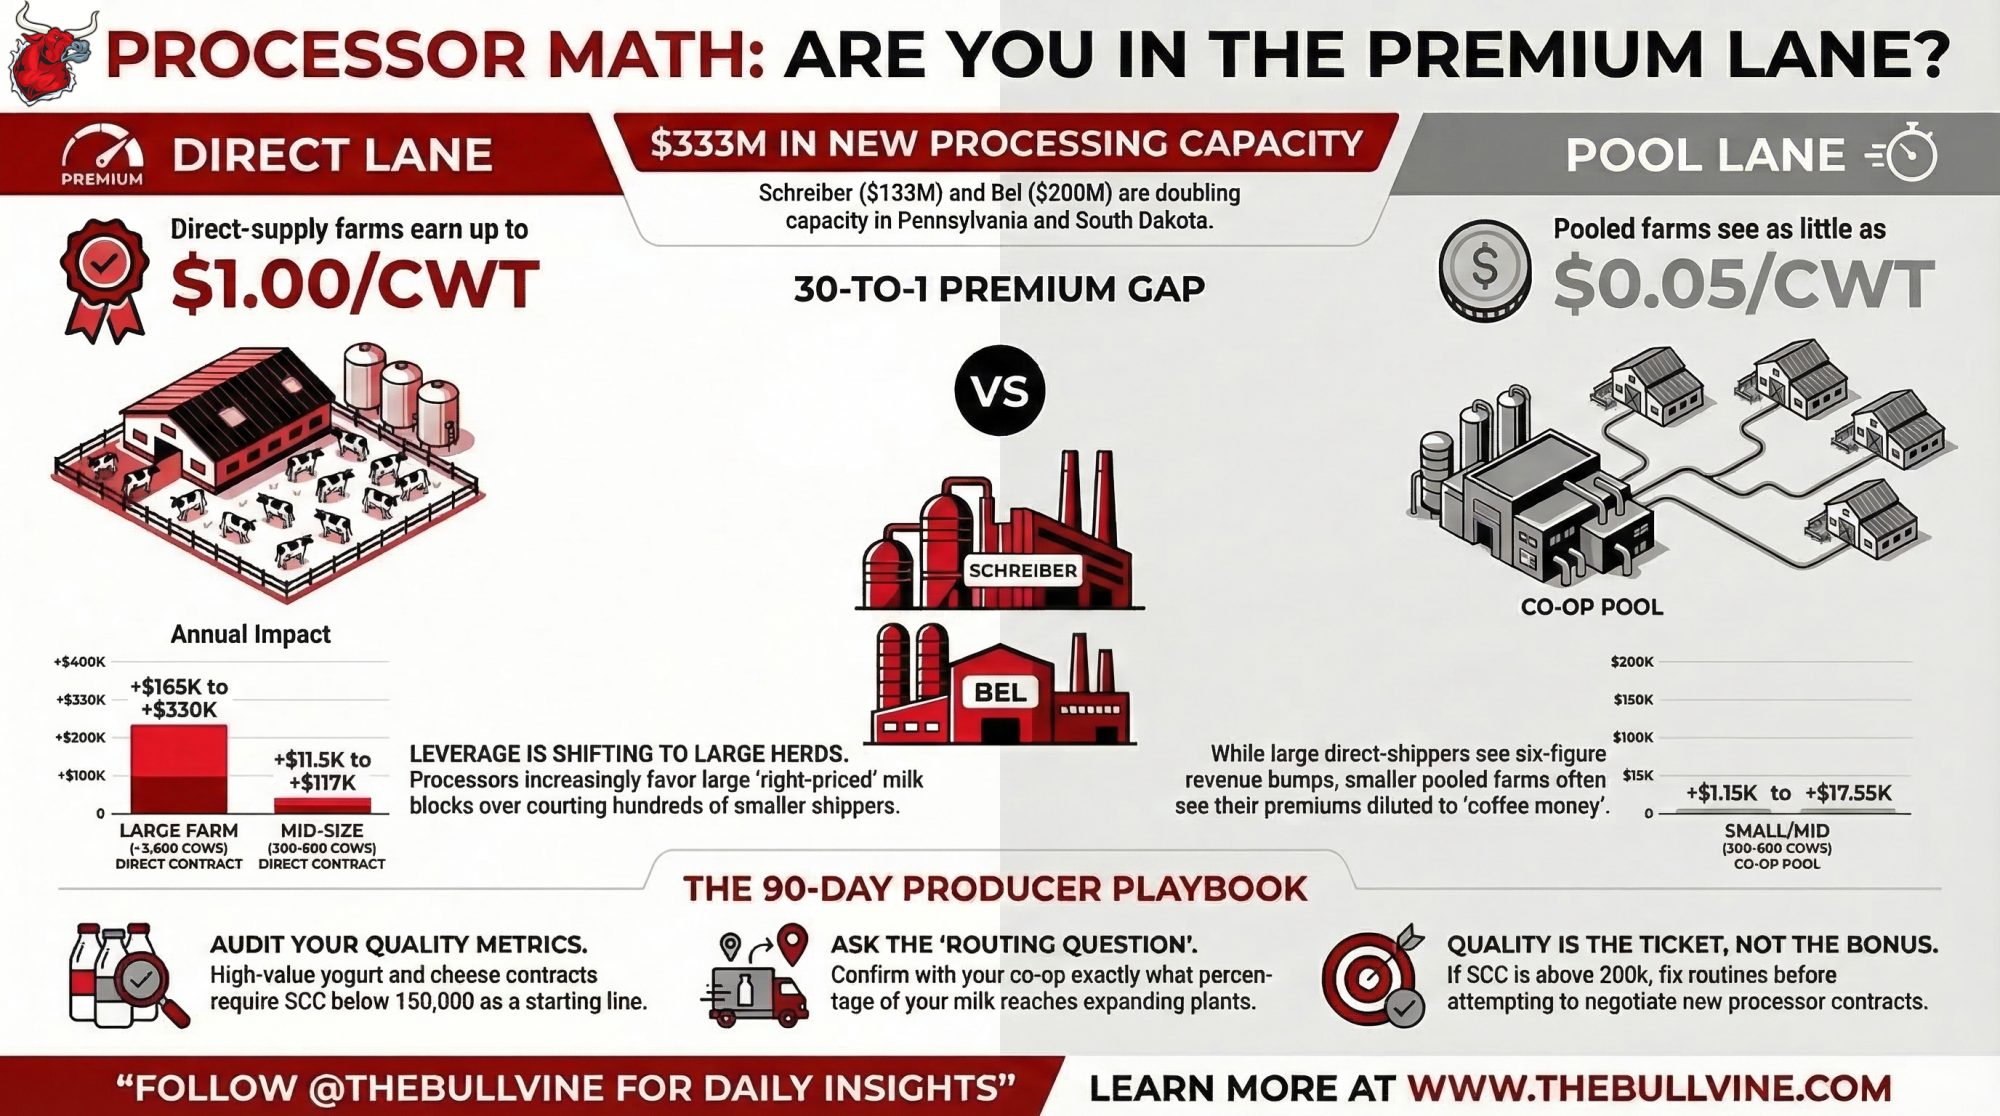
Executive Summary: $333M processor rush: Schreiber ($133M yogurt) and Bel ($200M Babybel) double capacity in PA/SD. Rod Hissong’s $5M Schreiber contract gains $165K–$330K/year. 200‑cow pool farms get $1K–$7K. 30‑to‑1 premium gap. PA’s 490 farm exits flip leverage to herds like Mercer Vu. FO30 down $5.42/cwt. Run your numbers: co‑op routing % + SCC <150K? +$0.50/cwt floor to switch lanes. Processor Math asks: where’s your share?”

dairy processing expansion

Rod Hissong ships 33 million pounds of milk a year to Schreiber Foods’ Shippensburg, Pennsylvania, plant — at least $5.06 million in annual revenue from that one relationship, using the Federal Order Class II minimum of $15.34/cwt(USDA, February 2026) as a floor. When Schreiber’s new yogurt line hits full stride, that same expansion could add $165,000–$330,000/year to his milk check, while a 200‑cow co‑op farm in the same sourcing zone might only see $1,150–$6,900 from the same announcement — depending on how premiums wash through the pool. 

Two days after that Schreiber news, Bel Group broke ground on a $200 million expansion in Brookings, South Dakota, to double Babybel production from 10,000 to 20,000 tons per year and double its milk intake from American farms, primarily in South Dakota and neighboring states. Together, those two projects add $333 million in dairy processing capacity to regions where milk is already concentrating into fewer, larger herds — and where contract structure quietly decides who actually gets paid. 

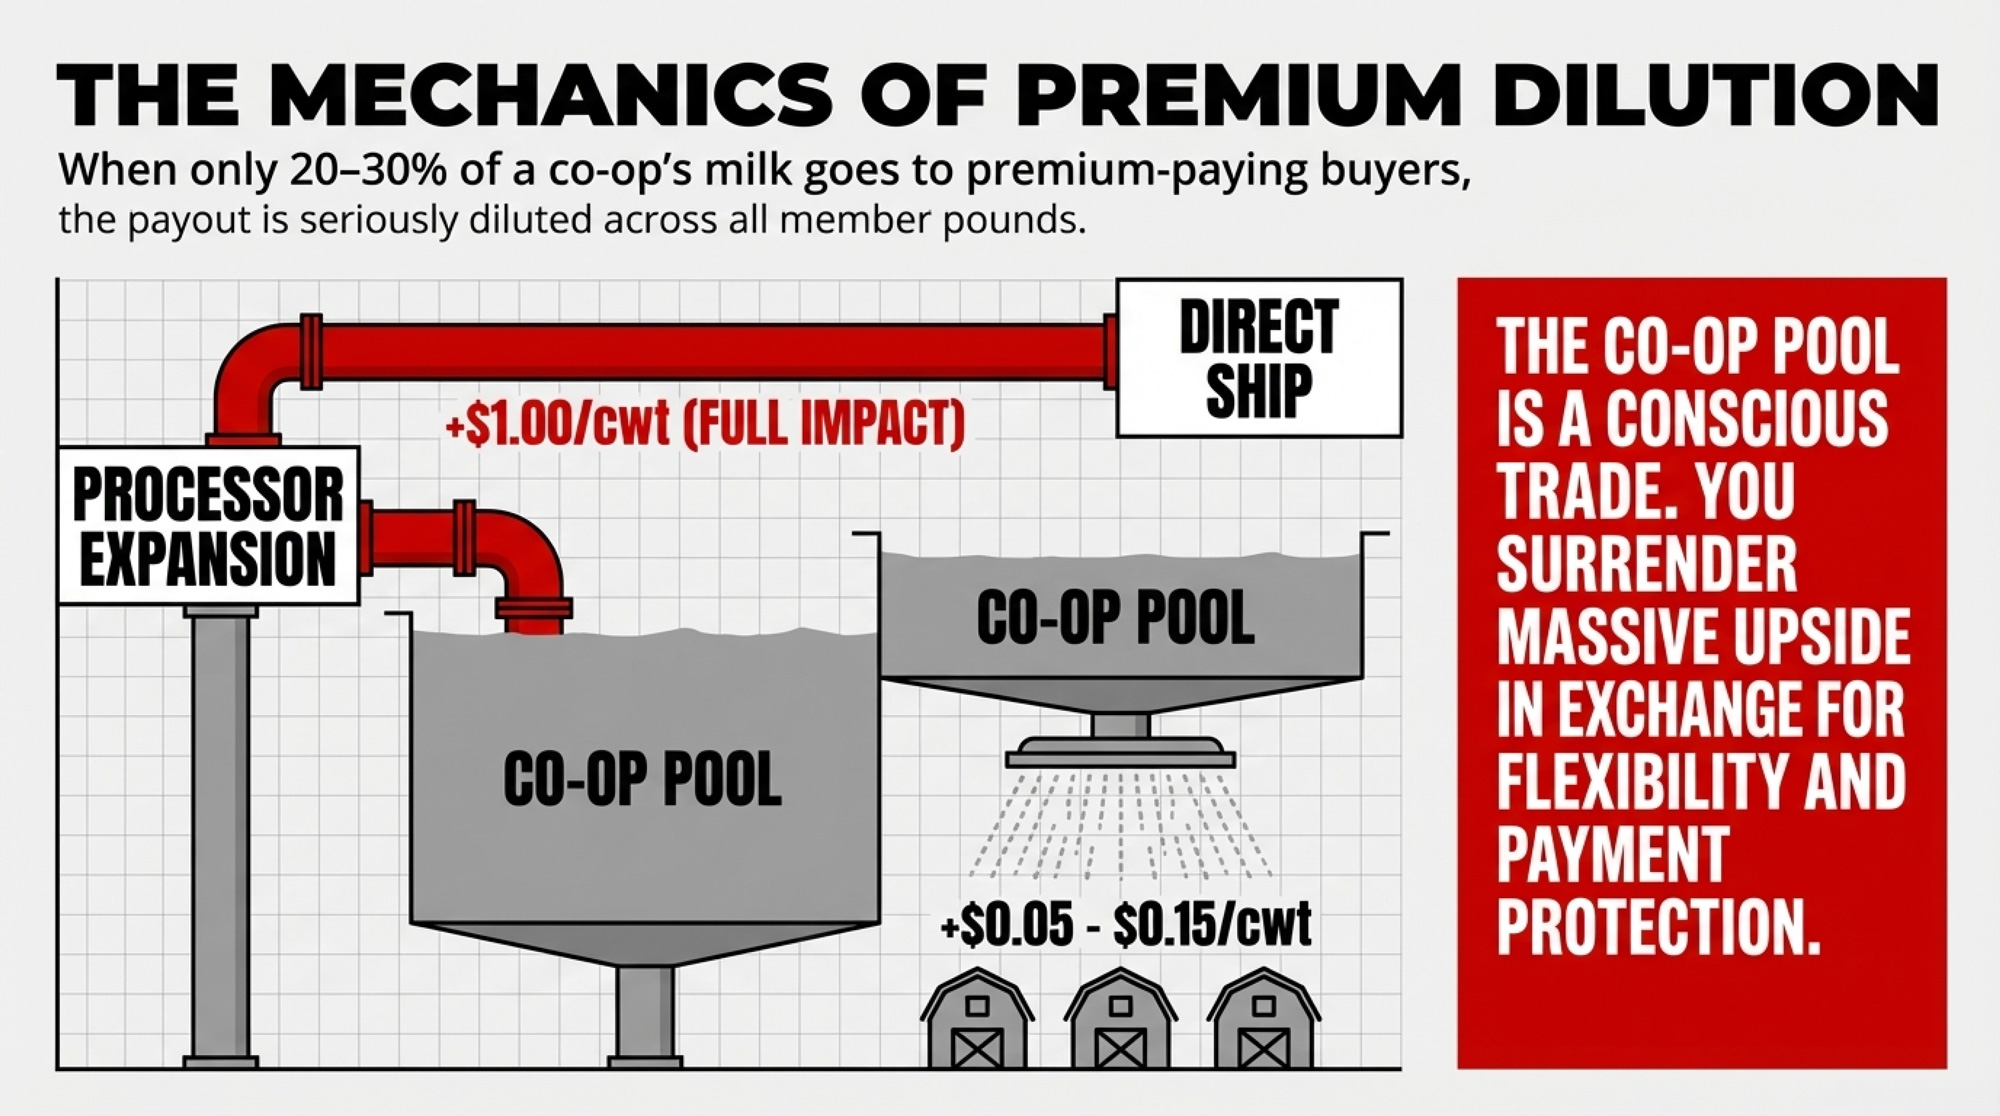
The Massive Premium Dilution Nobody Mentions

Press releases promise “support for local dairy.” The barn math says your contract lane and herd size decide whether you see a six‑figure bump or coffee money.

Mercer Vu Farms — Hissong’s operation in Mercersburg, PA — milks about 3,600 mature cows, farms 5,500 acres, and produces roughly 100 million pounds annually. Glenn and Mae Hissong started that herd with 7 cows in 1949; today, about one‑third of Mercer Vu’s production, around 33 million lbs/year, goes straight to Schreiber. The rest moves through Land O’Lakes. 

The “average” Schreiber‑zone producer looks very different. The Center for Dairy Excellence’s 2025 survey pegs average responding herd size at 152 cows, while the USDA puts the statewide Pennsylvania average closer to 106 cows. Even using 152, that’s roughly 3.5 million lbs/year per farm — about a tenth of Mercer Vu’s Schreiber volume. 

Schreiber’s 109,000 lbs/day: Same Expansion, Very Different Milk Checks

Governor Shapiro’s office says Schreiber’s Shippensburg project will add 109,000 lbs of raw milk processing per day, or about 39.8 million lbs/year, across 165 farms in 11 counties. Under realistic premium scenarios, that looks like this: 

Farm ProfileAnnual Schreiber VolumePremium ScenarioAnnual Impact (barn math)
Mercer Vu (~3,600 cows, direct)~33M lbs+$0.50/cwt+$165,000 (33,000 cwt × $0.50)
  +$1.00/cwt+$330,000 (33,000 cwt × $1.00)
200‑cow farm (direct, 50% to Schreiber)~2.3M lbs+$0.50/cwt+$11,500 (23,000 cwt × $0.50)
  +$1.00/cwt+$23,000 (23,000 cwt × $1.00)
200‑cow farm (co‑op pool, indirect)Pooled+$0.05–$0.15/cwt (diluted)+$1,150–$3,450 (23,000 cwt × $0.05–$0.15)
  +$0.10–$0.30/cwt (diluted)+$2,300–$6,900 (23,000 cwt × $0.10–$0.30)

Those premium bands line up with historical $0.25–$1.00/cwt over‑order and contract premiums discussed by agricultural economist John Janzen in Progressive Dairy, and with the pooling math laid out by Mark Stephenson and Andrew Novakovic for the Center for Dairy Excellence. Their work shows that when only 20–30% of a co‑op’s milk goes to premium‑paying buyers, those premiums are “seriously diluted” across all member pounds.

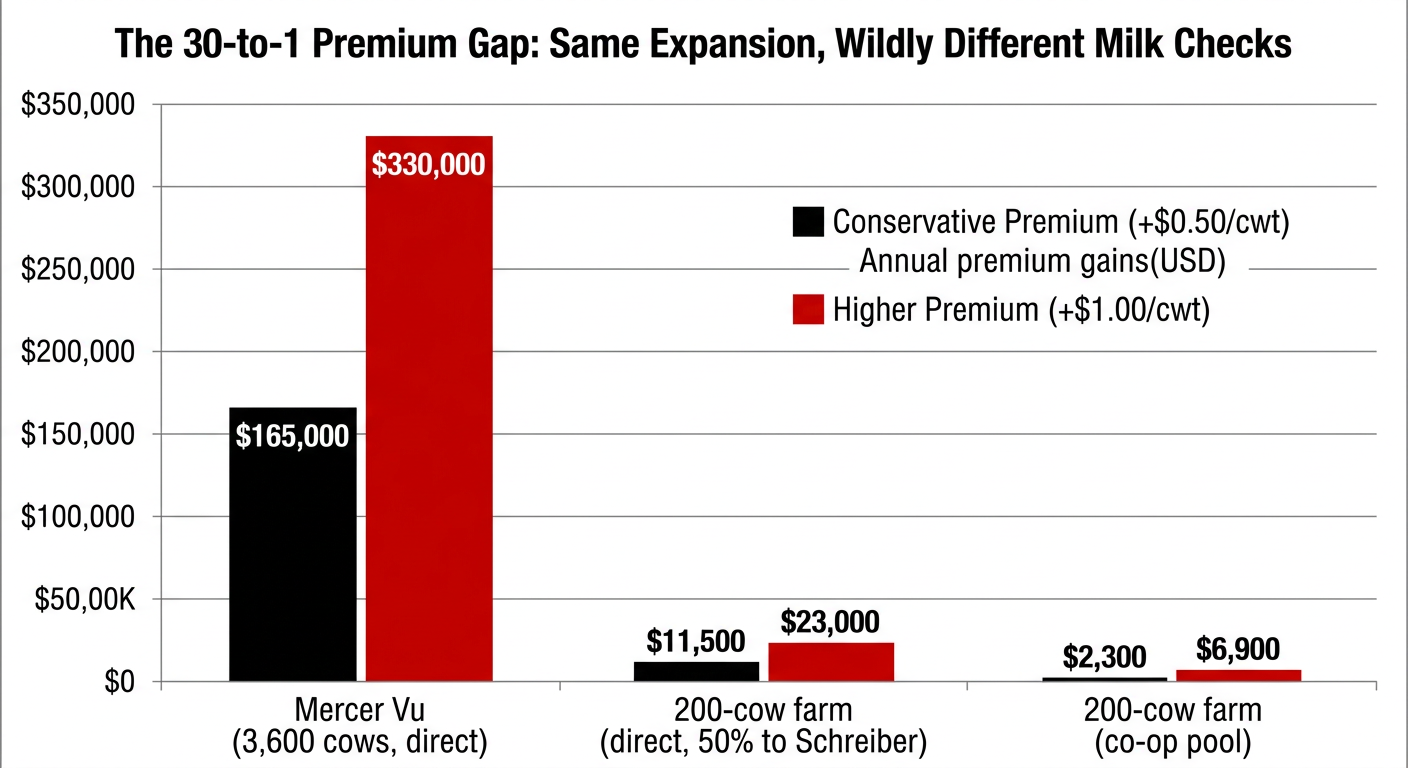
Same expansion. Same counties. A difference that can approach 30‑to‑1 between the top and bottom rows.

Farm ProfileConservative Premium (+$0.50 or +$0.10 pooled)Higher Premium (+$1.00 or +$0.30 pooled)
Mercer Vu (3,600 cows, direct)$165,000$330,000
200-cow farm (direct, 50% to Schreiber)$11,500$23,000
200-cow farm (co-op pool)$2,300$6,900

If your milk only reaches an expanding plant through a pool, you’re living in that bottom row — even if the press release name‑checks your state.

Concentration Gravity: From Shippensburg to Brookings

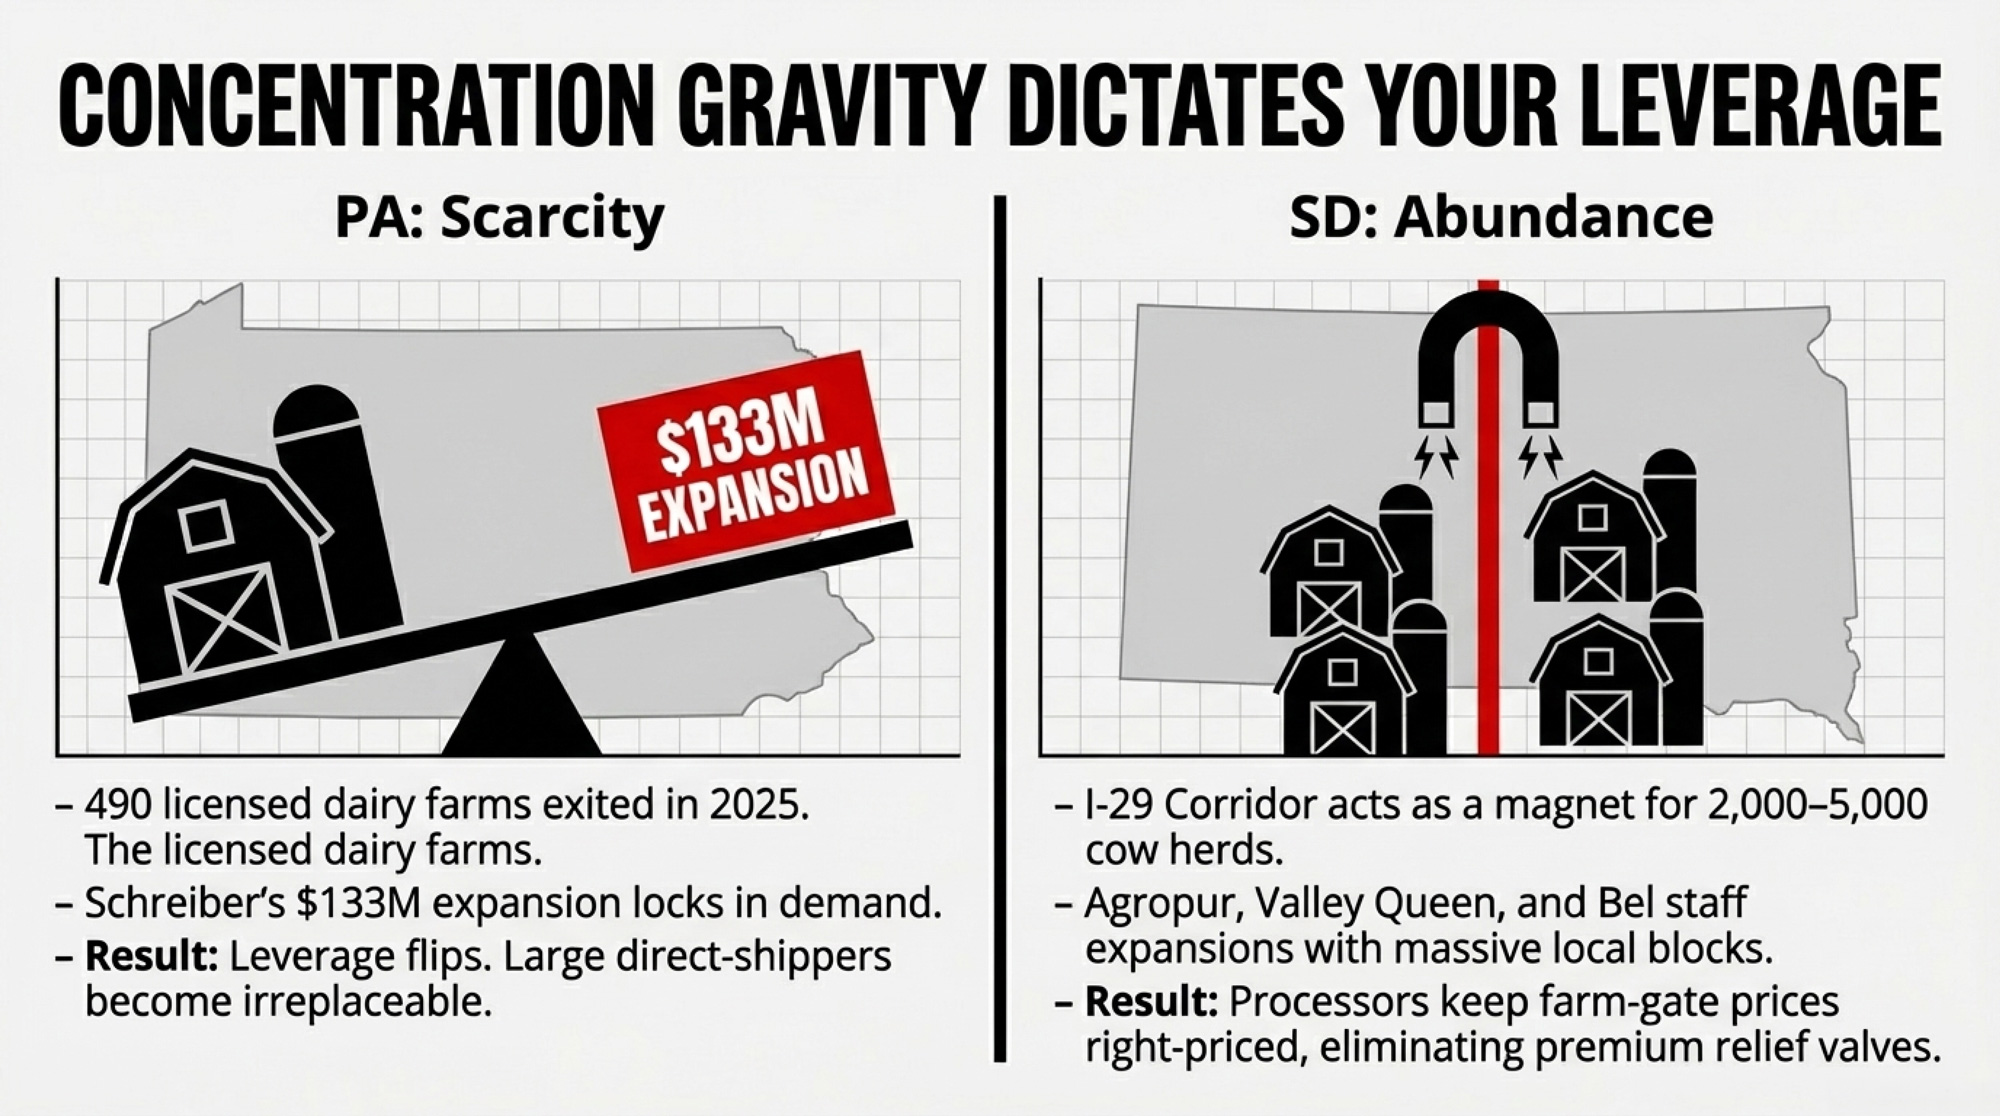
What’s happening in south‑central Pennsylvania is part of a broader concentration gravity: processor capital chasing large, “right‑priced” milk blocks.

On the PA side, Schreiber can pick up its extra 39.8 million lbs/year largely by deepening commitments with a handful of big direct shippers like Mercer Vu and adding a smaller number of mid‑size farms that can meet yogurt‑grade quality. Janzen’s line — “it’s much easier to sign up 10 2,000‑cow farms than 100 200‑cow farms” — is the procurement cheat code. 

On the SD side, that same gravity is even stronger:

  • Valley Queen’s 2025 profile highlights 39 farms milking around 95,000 cows — about 2,400 cows per farm, all within reasonable hauling distance. 
  • South Dakota has been one of the fastest‑growing milk states in the U.S., while national herd numbers slowly shrink. 
  • Agropur (Lake Norden), Valley Queen (Milbank), and Bel (Brookings) now form a cheese/snack corridor that can staff expansions with local 2,000‑ to 5,000‑cow herds instead of courting hundreds of smaller shippers. 

Bel’s press release says Brookings currently produces 10,000 tons/year of Babybel and will double to 20,000 tons, “doubling milk sourcing from American dairy farms, primarily in South Dakota and neighboring states.” Earlier coverage around the original Brookings plant pegged its draw at about 15,000 cows; doubling production implies a similar additional draw. 

The more easily Bel, Agropur, and Valley Queen can fill new vats with I‑29 corridor milk, the fewer basis‑premium “relief valves” remain for smaller herds shipping in from border states. That shows up later as weaker premiums and fewer calls when plants are short.

What Does Bel’s Expansion Really Mean for a 500‑Cow SD Herd?

South Dakota’s starting price floor is very different from Pennsylvania’s.

Federal Order 30 data show an Upper Midwest Statistical Uniform Price of $15.05/cwt in January 2026, down $5.42 from $20.47/cwt in January 2025, and among the lowest uniform prices across the FMMOs at that point. American Farm Bureau’s analysis of the June 2025 FMMO changes estimates that, in the first three months, higher allowances alone will result in about $64 million in lost revenue to the Upper Midwest pool. 

A 500‑cow SD herd producing roughly 11.7 million lbs/year sits at about $1.76 million of gross milk revenue at $15.05/cwt.

Bel’s expansion doubles Babybeladd’s output to 20,000 tons and puts another $200 million into the Brookings site. Translate that into barn‑math scenarios for a 500‑cow herd: 

FactorDirect ContractCo-op Pool
Premium Potential (500-cow herd, SD example)+$58,500–$117,000/year ($0.50–$1.00/cwt over FMMO)+$5,850–$17,550/year (diluted +$0.05–$0.15/cwt across all pool lbs)
Quality ThresholdSCC <150K (target <100K); strict bacteria/temp audits; failures can trigger terminationMore flexibility on month-to-month quality variance; still need to meet minimum FMMO standards
Volume Commitment3–5 year agreement typical; specified daily/monthly minimums; limited flexibility to expand/shrink without renegotiationShip what you produce; flexibility to grow/contract herd size without contract amendments
Payment ProtectionTermination risk if plant closes, finds cheaper supply, or cites quality “for cause”Federal Order payment security; pool guarantees you get paid even if processor fails
Upside CaptureYou get full premium when processor wins (e.g., +$0.50–$1.00/cwt for specialty cheese/yogurt)Premium dilution: your milk subsidizes pool members farther from premium plants

Exact over‑order numbers are contract‑specific and not public, but these ranges reflect real SD “right‑price” conversations and are consistent with historical premium levels along the corridor. 

ScenarioVolume & PriceAnnual Impact (barn math)
Base case (pool only)11.7M lbs at $15.05/cwt$1.76M (117,000 cwt × $15.05)
Direct lane, +$0.50/cwt11.7M lbs at $15.55/cwt+$58,500 (117,000 cwt × $0.50)
Direct lane, +$1.00/cwt11.7M lbs at $16.05/cwt+$117,000 (117,000 cwt × $1.00)
Pool farm, diluted +$0.05–$0.15/cwt corridor lift11.7M lbs at $15.10–$15.20/cwt+$5,850–$17,550 (117,000 cwt × $0.05–$0.15)

Lynn Boadwine — who milks more than 2,000 cows near Baltic and has been a visible voice for SD dairy recruitment — summed up the processor logic bluntly: “You don’t want to have the highest price raw material for those folks, so they’re not going to move here. We’ve got to be right-priced to attract a processor.” 

When a region can keep landing plants and keep farm‑gate prices “right‑priced” for processors, it’s not just growing local capacity. It’s slowly shifting where processors feel comfortable cutting bigger checks.

490 Pennsylvania Farms Gone — and Why That Flips the Leverage

Now flip back to Pennsylvania, because Hissong’s leverage sits on top of a changing supply base.

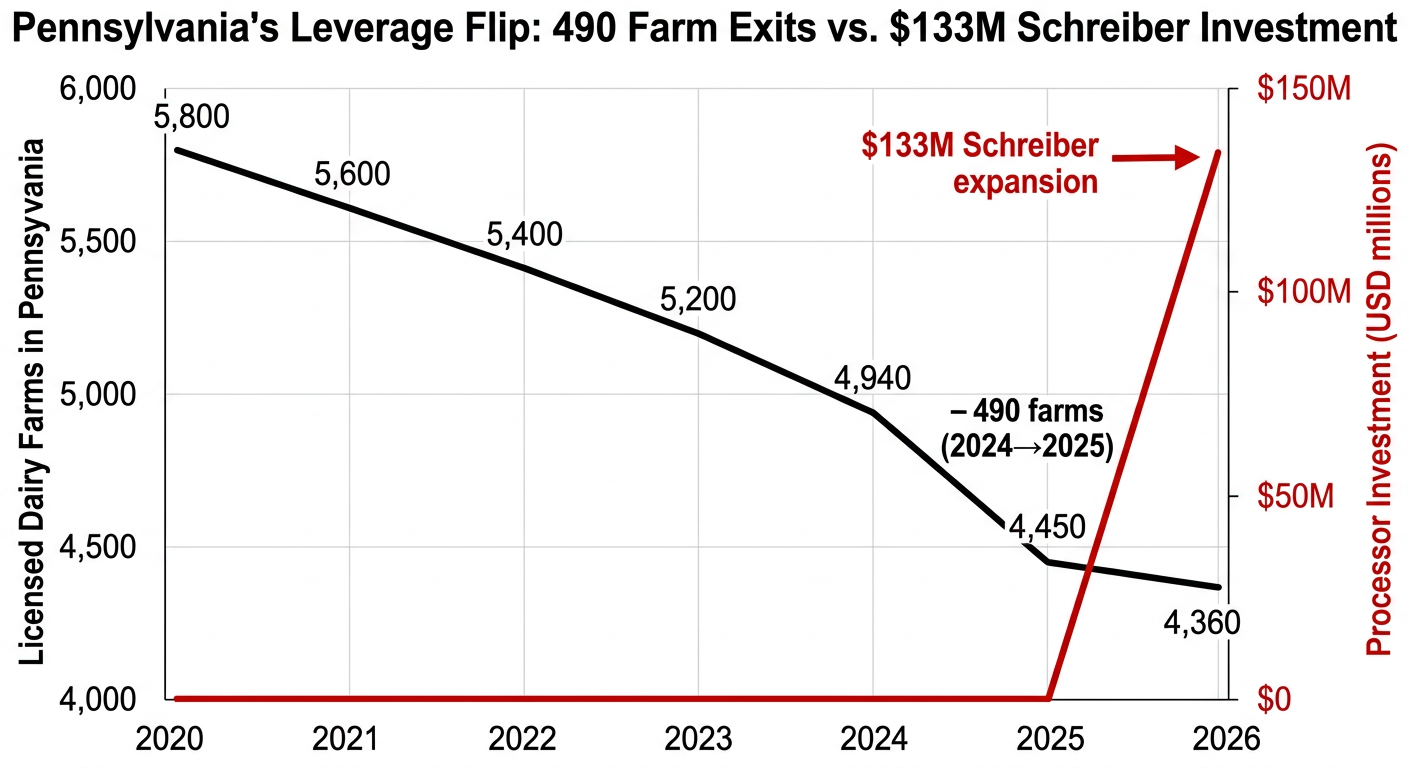
Looking at the USDA’s Milk Production report, notes that Pennsylvania lost 490 licensed dairy farms in 2025, dropping from 4,940 to 4,360 dairies — an 11.7% decline and about 41% of all U.S. dairy farm exits that year. Cow numbers fell by around 4,000 head to roughly 465,000, and state milk volume slipped 0.5% while national production rose 3.4%

Schreiber has operated its Shippensburg plant since 2002. By locking in a $132.9 million expansion and 47 new jobs there, the company is effectively tethering more of its future yogurt strategy to south‑central PA. 

Put that together:

  • Fewer herds.
  • Slightly fewer cows.
  • More processing demand backed by fresh capital.

For a large, proven direct‑ship supplier like Mercer Vu, that’s the moment the math flips. He’s no longer just one more shipper in a crowded market; he’s one of the relatively few large herds Schreiber can’t easily replace.

For a 200‑cow farm shipping into a co‑op pool, it raises the stakes on whether your co‑op is at the Schreiber table or repositioning milk into lower‑value outlets.

When Hissong said it’s “exciting and commendable for Schreiber Foods to continue investing in this plant” rather than chasing expansion “in West Texas, New York and other areas,” he was also naming the alternative: that $133 million could’ve gone somewhere else. pa

Trevor Farrell, Schreiber’s president, underlined that intent: “This expansion reinforces our long-term commitment to this area.” 

Big capital decisions like this lock in procurement patterns and premium maps for years. If your region isn’t seeing those announcements — or if you’re not inside the sourcing radius — you’re playing a different premium game than your peers in PA or SD.

The 90‑Day Playbook Before the Premium Window Closes

Processors usually build their supply base 12–18 months before an expansion line hits full utilization. After that, they mostly manage what they’ve signed.

If you’re anywhere near Brookings or Shippensburg, the next 90 days matter.

If You’re a 500‑Cow SD Herd in the Pool

In the next 30 days:

  • Pull your last 12 months of DHIA records. Write down the average SCC, bacteria count, fat %, and protein %.
  • If SCC is over 200,000 or SPC/bacteria over 20,000 cfu/mL, fix that first. That kind of quality noise kills a procurement conversation before it starts.
  • Call your co‑op field rep and ask three precise questions:
    • “Do we currently supply Bel Brookings, Agropur Lake Norden, or Valley Queen Milbank?”
    • “Roughly what share of my milk routes to each?”
    • “Are there any volume commitments tied to those plants I should know about?”

By 90 days out:

  • Ask SDSU Extension or SD dairy groups for named contacts in Bel, Agropur, and Valley Queen procurement. Don’t sit back and hope they find you. 
  • Fix any bulk tank cooling problems — recorded temps above 40°F at two hours are a red flag for most audits.
  • Decide your minimum acceptable premium before you sit down. If Bel or a handler can’t clear your current blend by at least +$0.50/cwt on all lbs, your default assumption should be that staying in the pool is the safer play.

If You’re a 200‑Cow PA Farm in Schreiber’s Zone

This month:

  • Pull DHIA and tighten your own bar: for Class II yogurt, aim for SCC below 150,000, with <100,000 as the “best shot at premiums” goal.
  • If you’re at 180,000, that’s a 60–90 day barn‑level fix (dry‑cow program, milking routine, towels, prep).
  • Ask your co‑op explicitly: “Do we have a direct supply agreement with Schreiber Shippensburg? If yes, how much of that volume comes from farms my size?”

Then set your walk‑away number:

  • If your current blend is $15.05–$15.34/cwt, you probably need at least +$0.35–$0.50/cwt to justify a direct contract with tighter QA and termination clauses.
  • On 2.3M lbs, that’s about $8,050–$11,500/year. A +$0.25/cwt offer (~$5,750) may not be worth the extra risk when you can often find similar gains by tightening components and SCC inside the pool.

If You’re a 400–600‑Cow Herd Stuck in “We Should Talk.”

This week:

  • Call your actual processor contact — not the plant’s main line. If you don’t have a name and a number, that’s job one.
  • Prepare a one‑page supply proposal:
    • Average daily lbs.
    • 12‑month quality stats.
    • Hauling logistics.
    • A specific offer like: “We can deliver 8 million lbs/year on a 3‑year agreement with 6‑month mutual termination.”

Then get a contract review. Janzen’s work on milk contracts points to “market conditions,” “quality failures,” and “termination for cause” clauses that quietly shift risk to the producer. A $500 legal review on a $2M/year contract is inexpensive risk insurance. 

If you don’t have at least a term sheet by fall 2026, assume this specific Bel/Schreiber expansion wave is largely spoken for. You’ll still move milk. You may not be in the first row of premium seats.

What This Means for Your Operation

  • Your contract lane matters more than your ZIP code. A 500‑cow herd inside Bel’s or Schreiber’s direct‑supply lane can see $58,500–$117,000/year from a $0.50–$1.00/cwt premium. A similar herd shipping through a pool might see $5,850–$17,550 — or nothing direct.
  • Quality is the ticket, not the bonus. For higher‑value Class II and branded cheese, <150,000 SCC is the starting line, and <100,000 is the target for serious premium conversations. If you’re above that, your first processor‑math project is fixing cows and routines, not chasing contracts.
  • The co‑op pool is a conscious trade, not a default. You give up some upside — maybe $29,000–$58,500/yearon a 500‑cow SD herd — in exchange for flexibility and regulatory payment protections. For small and mid‑size herds, that can be the smart play if you’re choosing it with eyes open.
  • Expansion somewhere shifts leverage everywhere. When corridor states like SD keep landing plants and keeping milk “right‑priced” for processors, it slowly nudges leverage away from regions that aren’t seeing those investments. That shows up later as weaker over‑order premiums and tighter contract terms.
  • 30‑day homework: Print your last 12 milk checks and DHIA summary. On one page, answer:
    • What % of your milk currently routes to a plant with announced expansion?
    • How many $/cwt above FMMO minimum are you actually getting?
    • How much of that spread is due to components/quality vs. processor premiums?

If you can’t answer those three without making a call, that’s your signal that the real story isn’t in Bel’s or Schreiber’s press release — it’s in the fine print of your own milk check.

Key Takeaways

  • If more than half your milk already ships to an expanding plant, you’re in the leverage band this article describes. Your decisions over the next 12–18 months are about terms and floors, not just having a home for your milk.
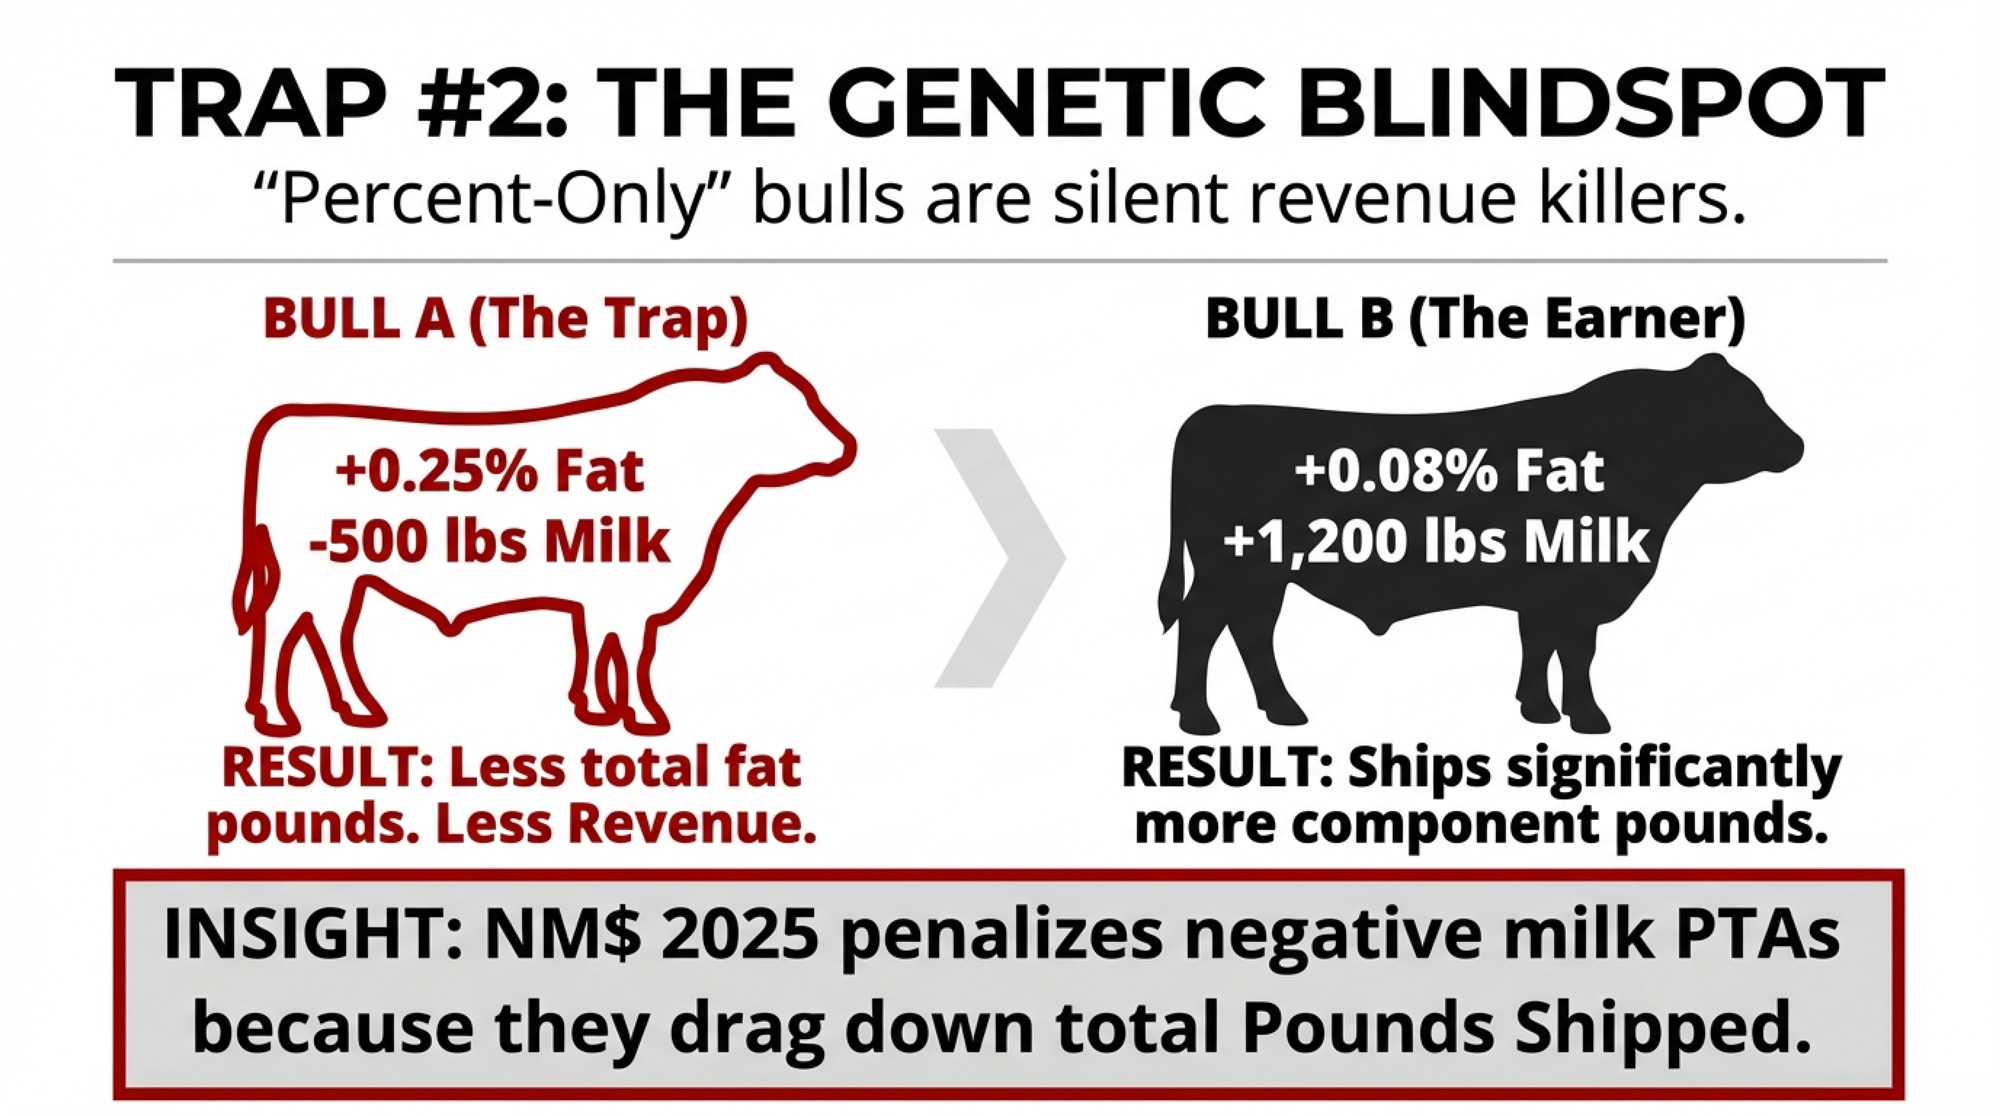
  • If all of your milk is pooled and none of it routes to an expanding plant, you’re probably subsidizing someone else’s premium. Your paths are: get into a sourcing radius, get into a different pool, or squeeze more out of components and costs where you are.
  • If you’re in that 300–500‑cow middle, you’re big enough that a good contract moves the needle, but small enough that you’re not the first call. Your edge is quality plus relationships — not waiting by the phone.

The Bottom Line

Whether you’re sitting in Franklin County or three states away, the practical question is simple: are you close enough — on paper and on quality — to be inside a processor’s premium lane, or are you quietly financing someone else’s expansion?

Complete references and supporting documentation are available upon request by contacting the editorial team at editor@thebullvine.com.

Learn More

The Sunday Read Dairy Professionals Don’t Skip.

Every week, thousands of producers, breeders, and industry insiders open Bullvine Weekly for genetics insights, market shifts, and profit strategies they won’t find anywhere else. One email. Five minutes. Smarter decisions all week.

NewsSubscribe
First
Last
Consent

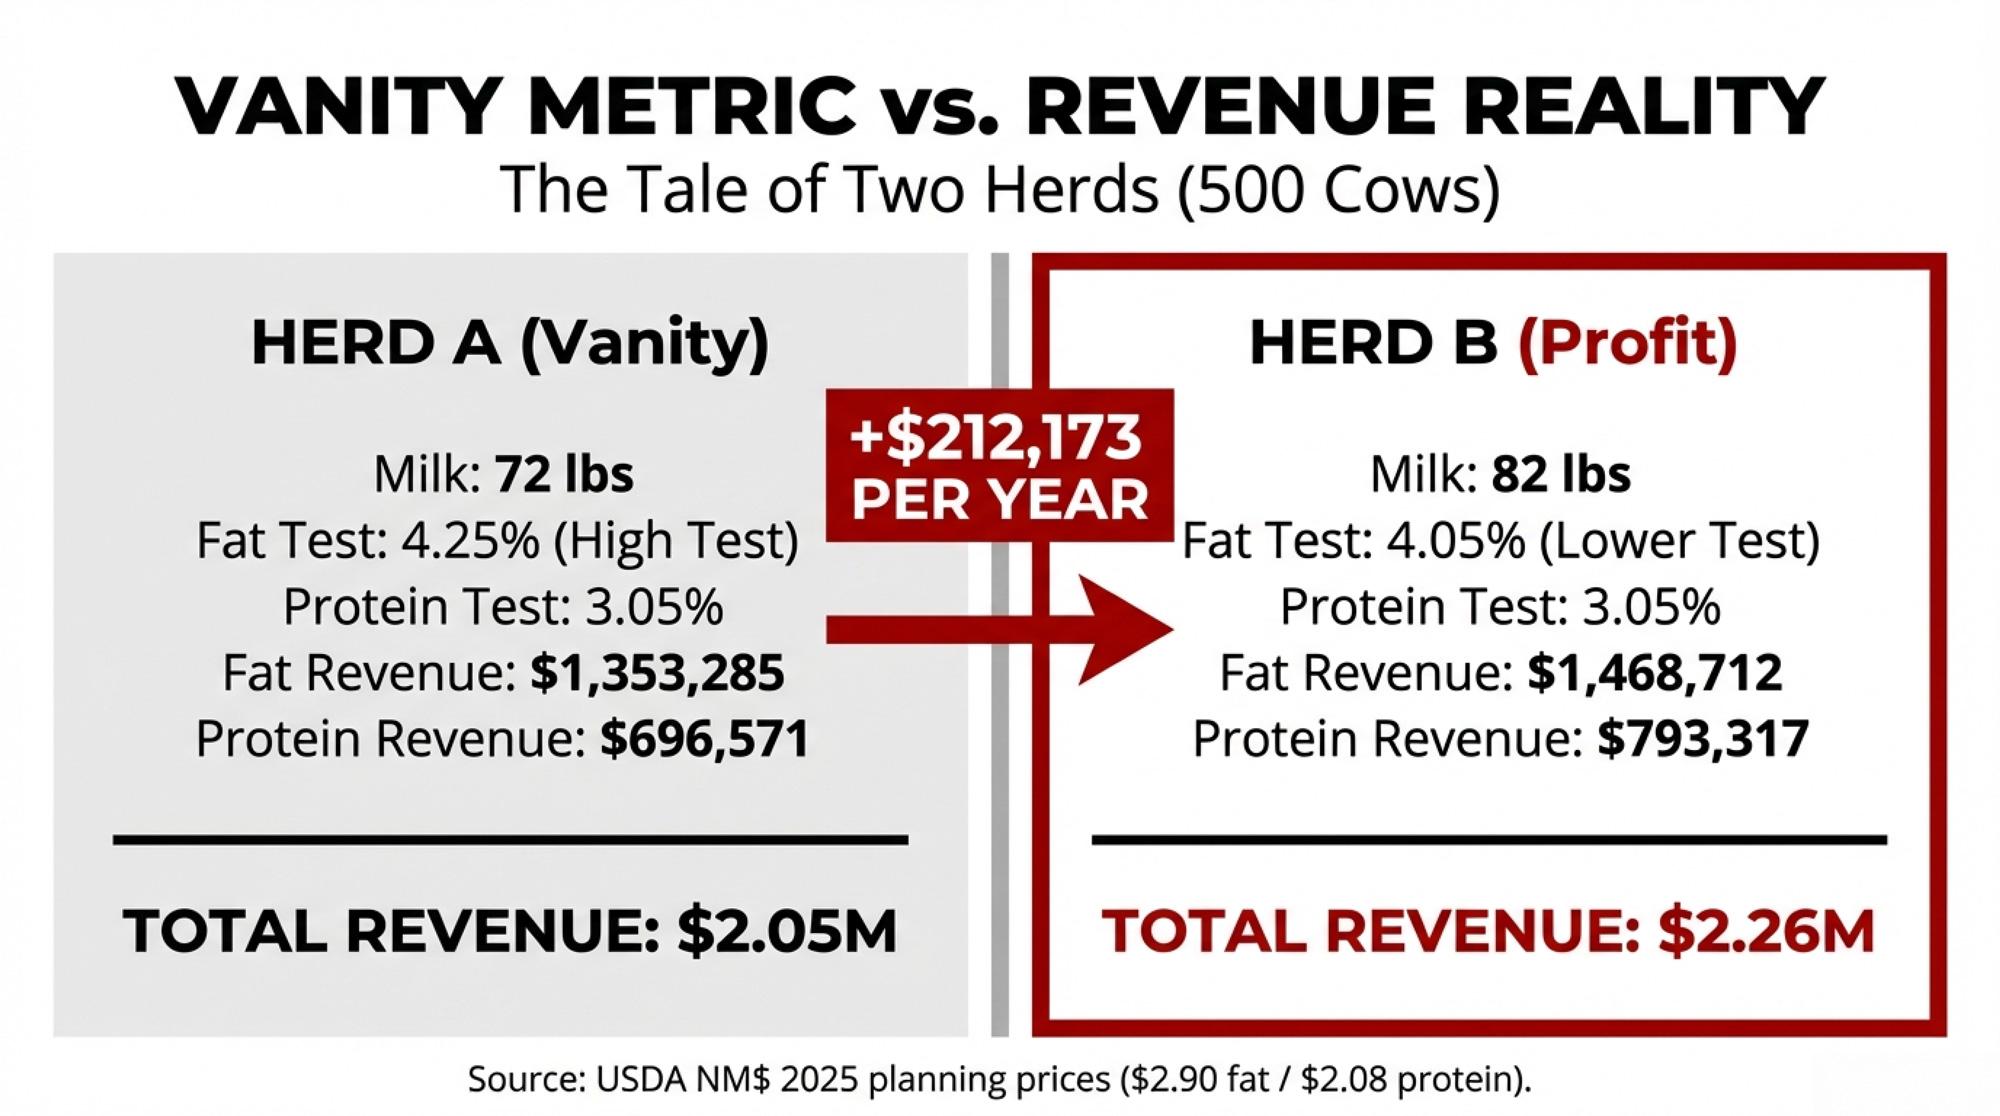
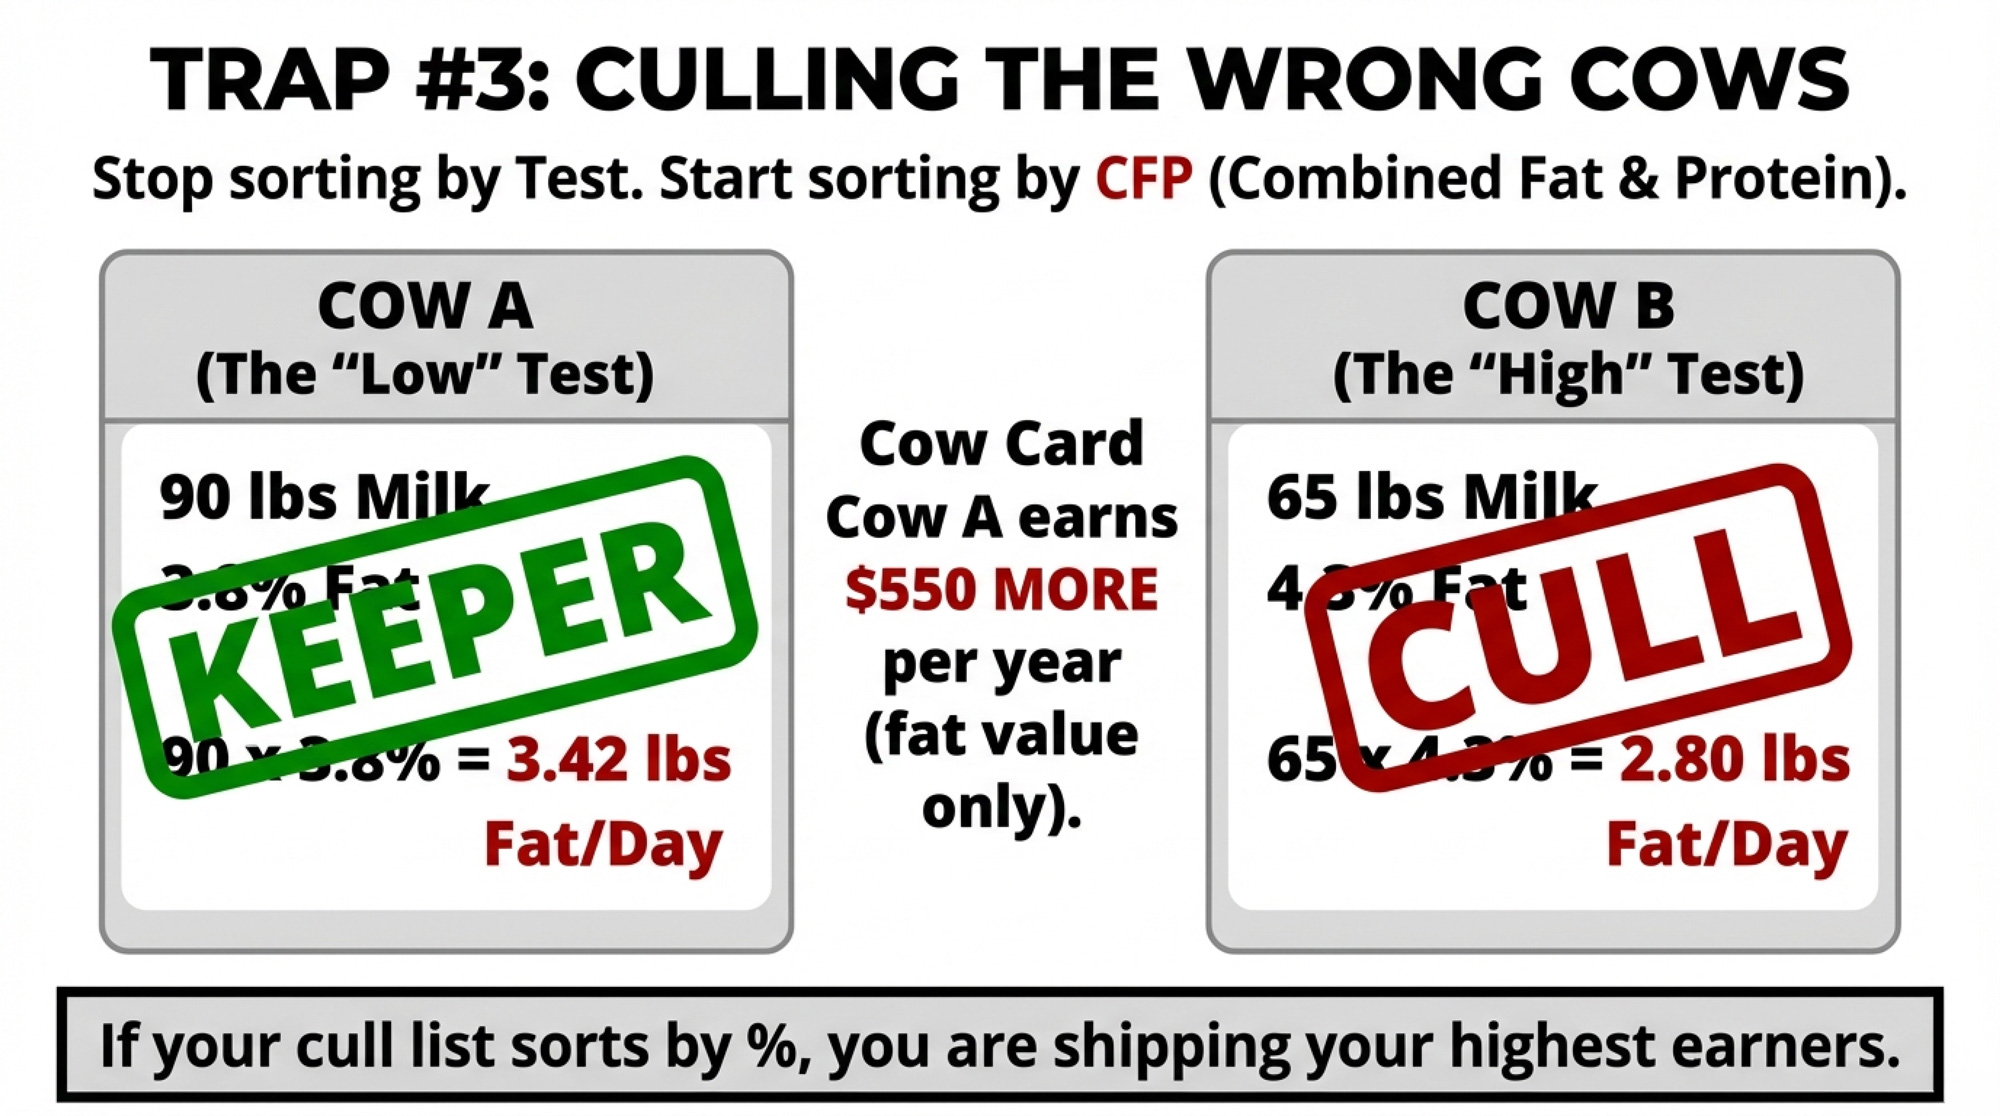
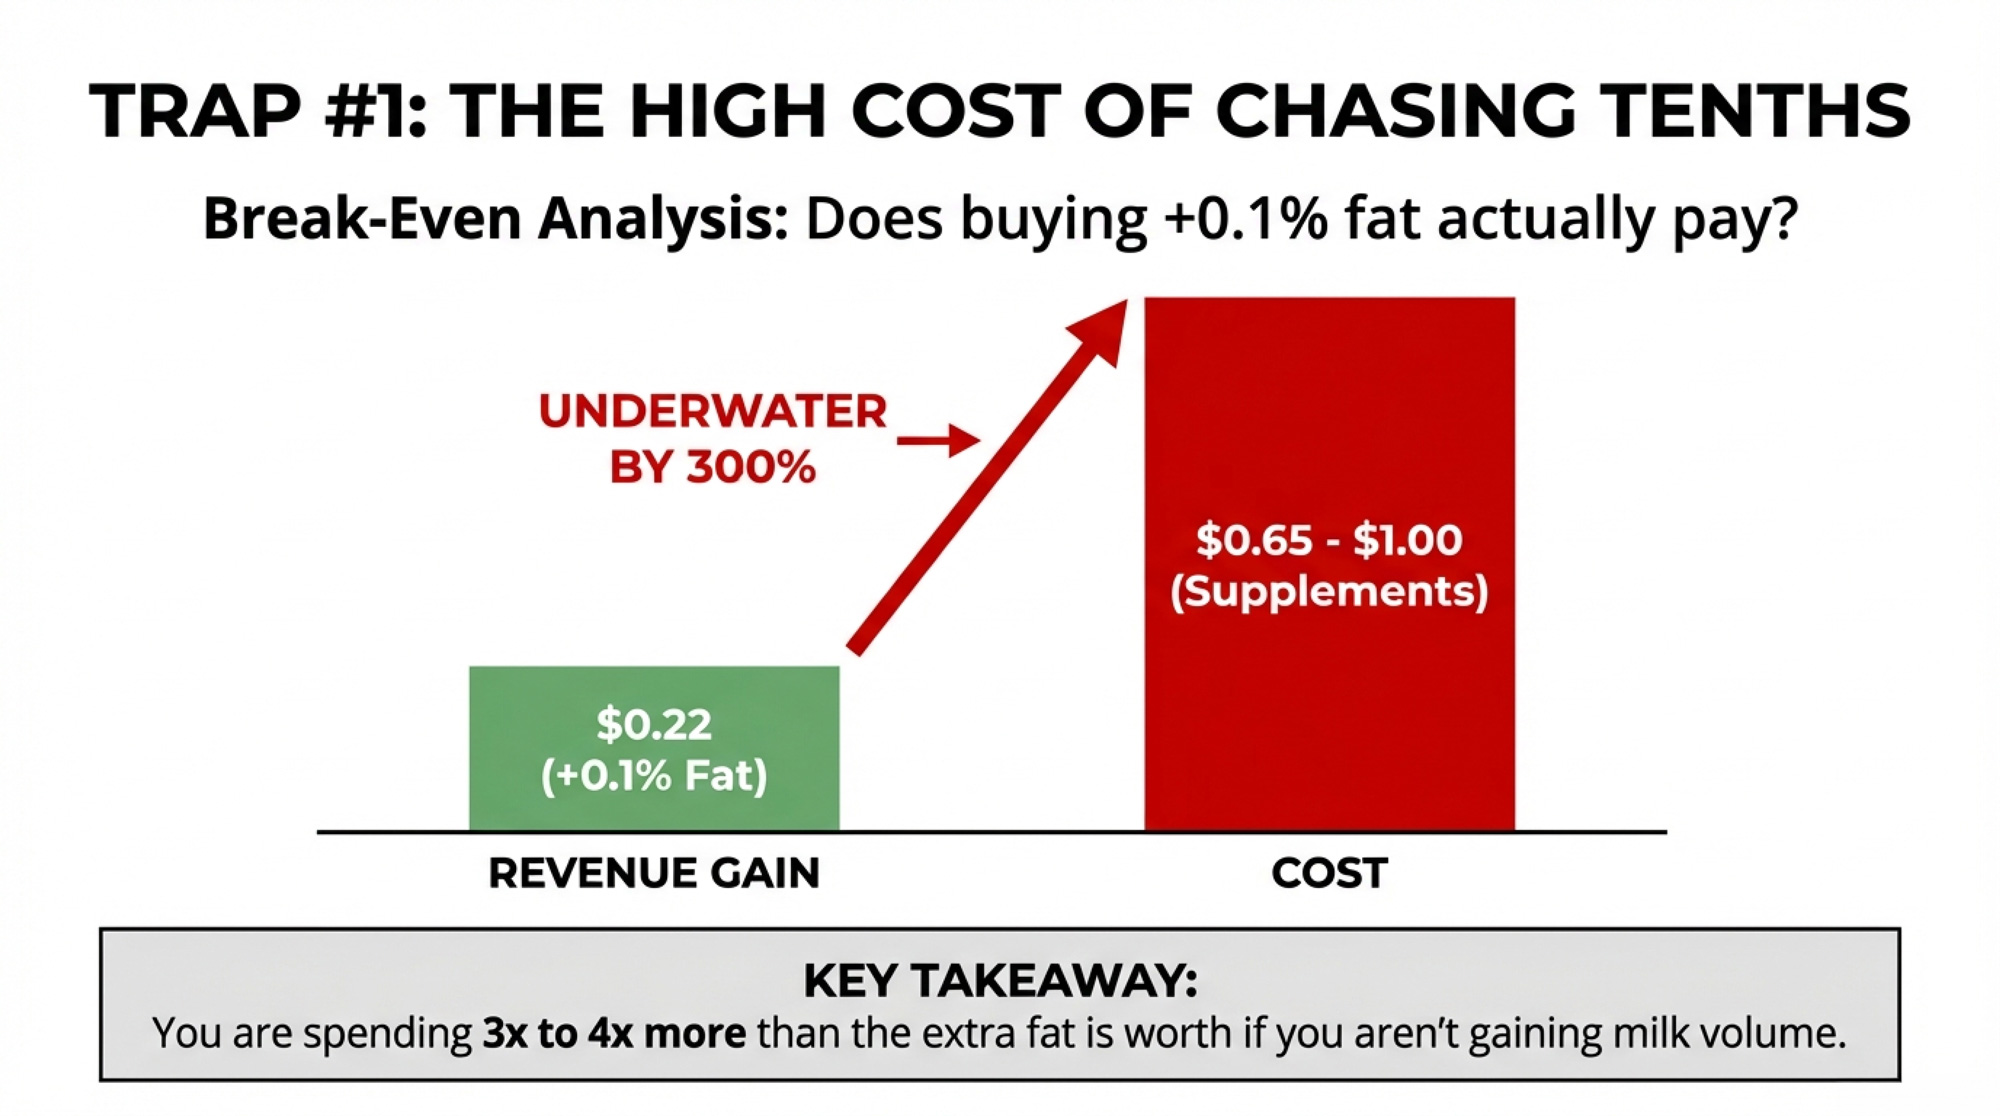
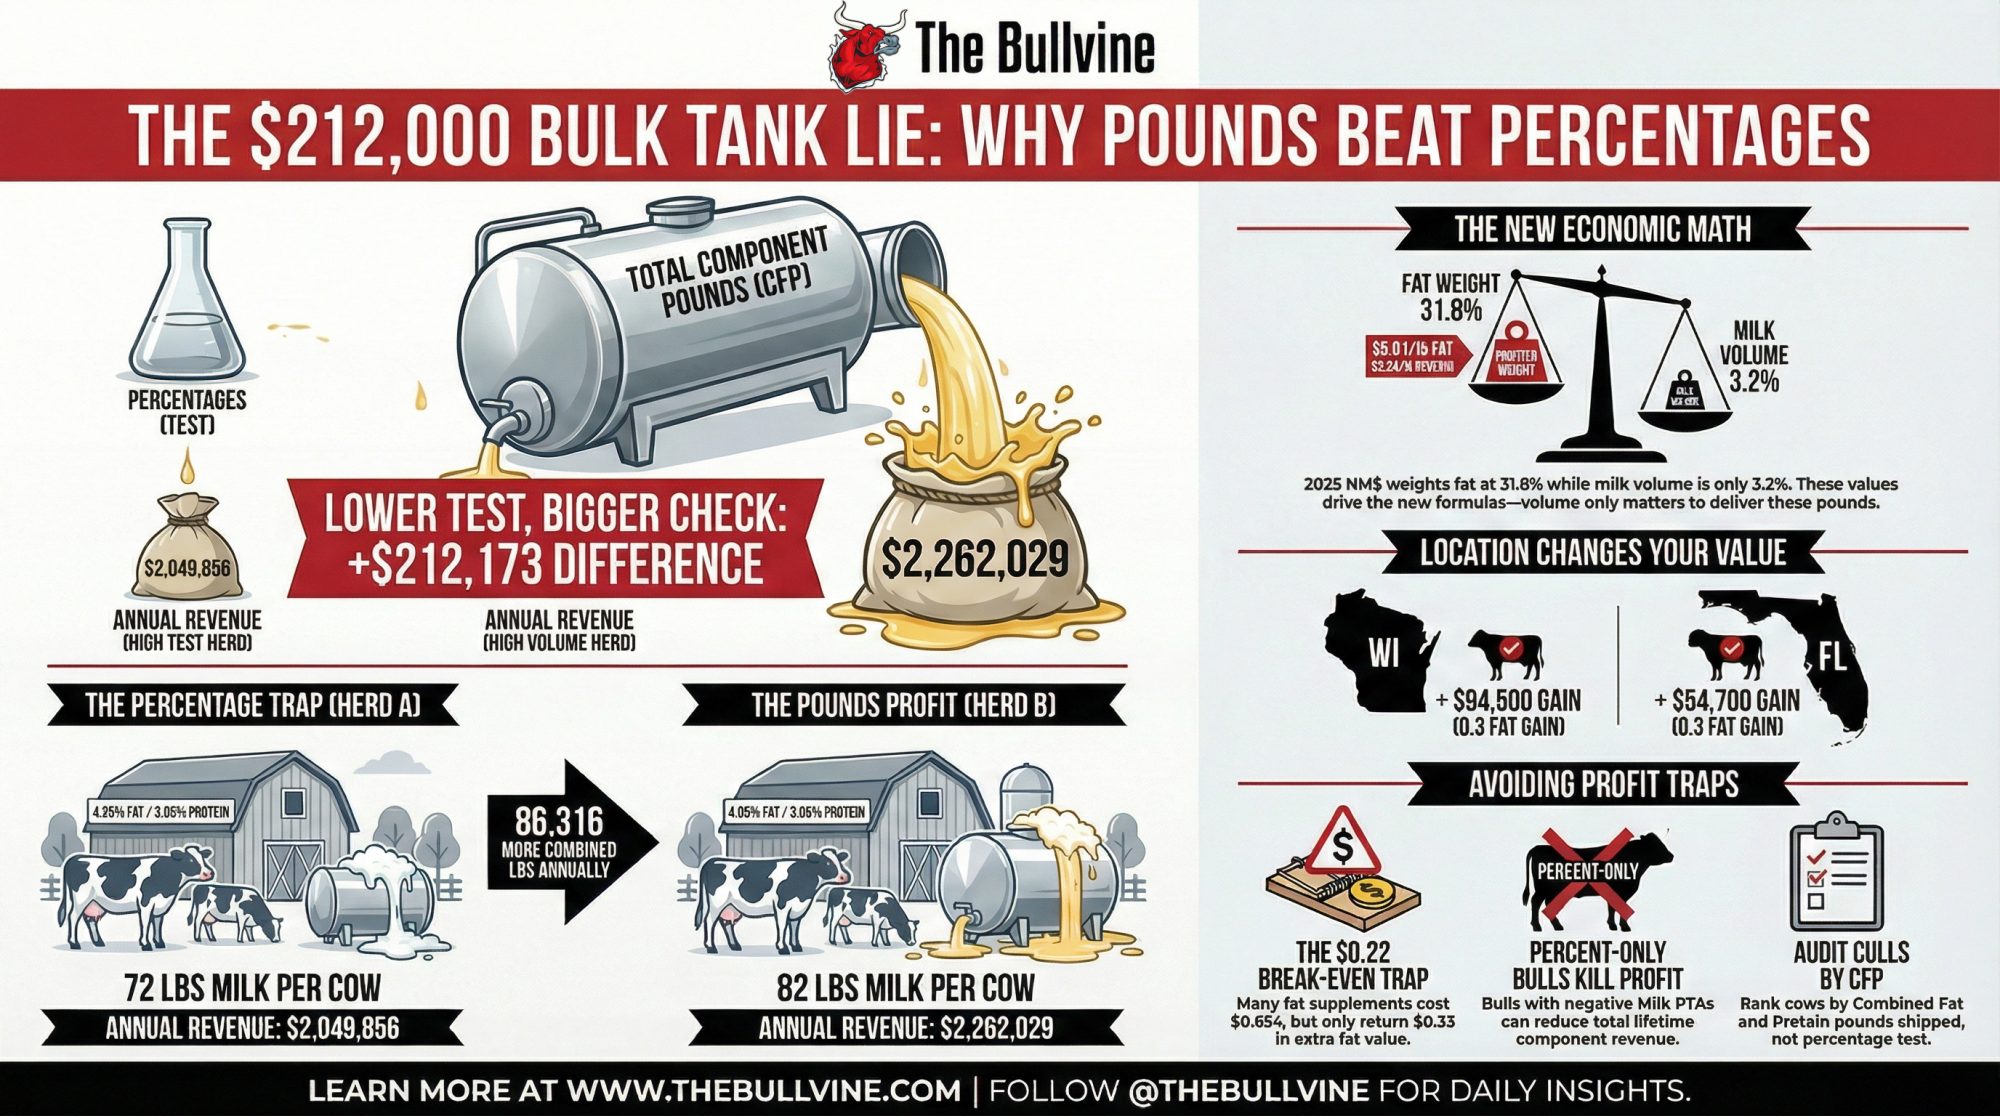
The $212,000 Bulk Tank Lie Hitting Upper Midwest Dairies

A lower-test herd shipped $212,000 more than its 4.25% neighbor. If you’re chasing percentages, this barn math is your wake-up call.

Executive Summary: June 2025 FMMO reforms and the 2025 NM$ revision have flipped the script so that fat and protein pounds shipped, not test percentages, drive your milk check. A side‑by‑side model of two 500‑cow Upper Midwest herds shows the lower‑test herd (4.05% fat at 82 lbs) shipping $212,000 more fat and protein value per year than a 4.25% herd at 72 lbs, using the USDA’s NM$ planning prices. NM$ now gives 31.8% weight to fat and only 3.2% to volume, which means “percent‑only” bulls with negative Milk PTAs can quietly cut lifetime component revenue even when their proofs look good on fat percentage. On the ration side, C16:0 supplement programs that add +0.10 fat test often cost three to four times more than the extra fat is worth once you do the barn math at $0.65–$1.00/cow/day. Your federal order then decides how much of that value you actually see: the same 0.3‑point fat gain is worth roughly $94,500 in a Wisconsin MCP plant but closer to $54,700 in a fluid‑heavy Florida order. The article walks through these calculations step by step and finishes with a four‑point playbook — track CFP, cull on pounds, match spending to your order, and pick sires on component pounds — so you can stress‑test your own numbers instead of trusting what the bulk tank report says.

A 500-cow Upper Midwest dairy can leave $212,000 in combined fat and protein revenue on the table by chasing a higher bulk tank test instead of shipping more component pounds. That’s not a hypothetical — it’s what the math shows when you model two herds side by side using USDA’s own NM$ planning prices.

A nutritionist working with herds in the region described the pattern: a 500-cow operation watches butterfat climb from 3.9% to 4.1% over six months. Everyone celebrates. Then somebody runs the real numbers — 78 lbs/day at 3.9% versus 74 lbs/day at 4.1% — and realizes they’re shipping nearly identical fat pounds. The test improved. The milk check didn’t.

What June 2025 Changed — And What It Cost

USDA’s April 2025 Net Merit revision pushed butterfat to 31.8% relative emphasis in NM$ — up from 28.6% in 2021 (VanRaden et al., NM$8 and NM$9). Protein carries 13.0%. Milk volume? Just 3.2%. The economic values are blunter still: fat at $5.01 per PTA pound, protein at $3.33, volume at $0.022.

Then the FMMO reforms hit on June 1, 2025. AFBF economist Daniel Munch calculated that in the first three months, producers lost more than $337 million in combined pool value — class price reductions of 85 to 93 cents per hundredweight depending on the order (AFBF Market Intel, September 2025). As Munch told Brownfield Ag News, the higher make allowances “more than wipe out” the gains from other reforms.

Upper Midwest Order 30 absorbed the worst of it. Roughly 69% of pooled milk went to Class III cheese in October 2025, with just 11.3% to Class I fluid (FMMA30 Dairy News, November 2025). That heavy cheese utilization means component value flows directly to producers — but the make allowance increase hit just as directly.

And regional structure amplifies everything. A 0.3-point butterfat improvement on a 500-cow herd captures an estimated $94,500 annually in Wisconsin’s MCP system versus approximately $54,700 in Florida’s skim-fat system. Same genetics. Same nutrition. A $40,000 gap from the order structure alone.

How $212,000 Disappears Into a Better Bulk Tank Test

Two 500-cow herds, both running 305-day lactations, were modeled using NM$ 2025 planning prices of $2.90/lb fat and $2.08/lb protein (VanRaden et al., January 2025). These are multi-year forecast prices; USDA built the index on non-spot prices. Actual FMMO butterfat ran about $2.95/lb in January 2025 and fell to approximately $1.45/lb by January 2026. The pounds principle holds at any price level; the dollar gap moves with the market.

MetricHerd A (High Test)Herd B (High Volume)Difference
Milk/Cow/Day72 lbs82 lbs+10 lbs
Fat Test4.25%4.05%−0.20 points
Protein Test3.05%3.05%Same
Annual Fat Shipped466,650 lbs506,453 lbs+39,803 lbs
Annual Protein Shipped334,890 lbs381,403 lbs+46,513 lbs
Fat Revenue @ $2.90/lb$1,353,285$1,468,712+$115,427
Protein Revenue @ $2.08/lb$696,571$793,317+$96,746
Combined F+P Revenue$2,049,856$2,262,029+$212,173

Herd B — the lower-test herd — ships nearly 40,000 more pounds of fat and over 46,500 more pounds of protein. At actual January 2025 FMMO prices ($2.95 fat, $2.33 protein), the gap widens to roughly $226,000 because protein is priced higher than the NM$ assumption.

Three Places the Trap Compounds Silently

Genetics. The 2025 NM$ penalizes “percent-only” bulls with deeply negative Milk PTAs. A bull posting +0.25% fat but −500 lbs Milk loses on all three lines — less volume means fewer total fat pounds, fewer protein pounds, and less volume revenue. A bull at +0.08% fat with +1,200 lbs Milk often ships more total component pounds per lactation. That’s exactly what the $5.01/lb and $3.33/lb economic values reward.

Nutrition. Research from Prof. Kevin Harvatine’s lab at Penn State found C16:0 palmitic acid boosts fat test by +0.30 to +0.50 percentage points at ~2% of diet DM (Dairy Global, November 2023). Michigan State’s de Souza lab (J. Dairy Sci., 2024) showed mid-lactation cows at 40–50 kg/day responded best. But supplements run $0.65–$1.00/cow/day, and the protein test can slip 0.02–0.03 points. If milk yield doesn’t climb with the fat test, the P&L can go negative while the bulk tank report looks great.

Culling. Cow 1 at 90 lbs/day and 3.8% fat ships 3.42 lbs fat/day. Cow 2 at 65 lbs/day and 4.3% ships 2.80 lbs. The “low test” cow delivers 0.62 more lbs of fat daily — about $550/year at $2.90/lb. If your cull list sorts by test instead of CFP (combined fat and protein pounds shipped), you may be shipping the wrong animals.

Does Chasing +0.1% Fat Actually Pay Under Component Pricing?

Full walkthrough: a program promising +0.10 points fat test on 500 cows averaging 75 lbs/day.

Value: 75 × 0.001 = 0.075 lbs extra fat/cow/day → 37.5 lbs/day × 305 = 11,438 lbs/year → 11,438 × $2.90 = ~$33,170

Cost/Cow/DayAnnual CostNet vs. $33,170 Gain
$0.65 (low end)$99,125−$65,955
$0.80 (midpoint)$122,000−$88,830
$1.00 (top)$152,500−$119,330

Break-even: about $0.22/cow/day. That’s three to four times below what any published C16:0 program costs. If a tenth of a point on fat test is the only gain — and you’re losing milk or protein in the process — the math is underwater.

The Shift: From Test Reports to Pounds Shipped

For herds getting ahead of this, the pivot starts with one change: they stop celebrating test and start tracking CFP per cow per day. Instead of “Our herd’s at 4.1% fat,” they’re asking: “How many pounds of fat and protein did we ship per cow today?”

That reframes every proposal — a new sire lineup, a nutrition tweak, or a cull list — around one question: does it raise CFP?

The Playbook: Four Ways to Manage for Pounds

1. Make CFP your primary metric. Calculate combined fat + protein pounds per cow per day, minimum monthly. 30-day action: pull last month’s data and establish your baseline. Trade-off: watching fat test flatten while CFP climbs feels wrong. It’s not.

2. Rebuild the cull list around CFP. Rank by shipped CFP first, then overlay fertility, health, and age. 90-day action: audit last quarter’s culls against CFP. Trade-off: you still need to watch for milk fat depression — tests aren’t irrelevant, just not the sorting metric.

3. Match spending to what your order actually pays. Order 30’s 69% Class III utilization means component value flows through relatively directly. In skim-fat orders with heavy Class I, the math is different. 30-day action: call your field rep and ask how much component value hits your check. Trade-off: even within the same order, different handlers deliver different capture.

4. Run genetics and nutrition on parallel tracks. Long-term: component-pound genetics (NM$, CFP). Short-term: nutrition for quick wins. 365-day action: rebalance your sire lineup at the next proof run using pound PTAs, not percentage PTAs. Trade-off: if component prices sag — January 2026 butterfat at ~$1.45/lb is a reminder — nutrition plays may need to scale back. The genetics keep compounding regardless.

What This Means for Your Operation

  • Run your own Herd A vs. Herd B table. Plug in your daily lbs, fat test, protein test, cow count, and your most recent FMMO component prices. If a lower-test scenario ships more pounds, you’ll need to decide.
  • The break-even for a +0.1% fat program is $0.22/cow/day. Published C16:0 costs range from $0.65 to $1.00. If you’re spending three to four times the break-even, the fat gain alone doesn’t cover it.
  • Audit your culls. Pull three to five cows you shipped for “low components” and check their CFP against cows you kept. If CFP sorts the list differently than test did, rebuild it.
  • Know your order structure. Order 30’s 69% Class III means the component value flows through. If you’re in a fluid-heavy order, your capture math is different — and so is every component investment decision.

Key Takeaways

  • If your success metric is fat test rather than fat and protein pounds shipped, you’re managing to the wrong number. The post-June 2025 FMMO system and the 2025 NM$ ($5.01/lb fat, $3.33/lb protein) both reward pounds.
  • The $212,000 gap is $115,427 from fat and $96,746 from protein at NM$ planning prices. At actual January 2025 FMMO prices, it’s closer to $226,000.
  • The 2025 NM$ penalizes percent-only bulls. Fat emphasis jumped from 28.6% to 31.8%, but milk volume still carries a positive value. A sire whose Milk PTA drags may produce daughters that ship fewer total component pounds.
  • Regional structure reshapes every component decision. A 0.3-point fat gain isn’t worth the same $94,500 in Wisconsin as it is in a fluid-heavy Southeast order.

The Bottom Line

The herds that come out of this stronger won’t necessarily be the ones with the prettiest bulk tank reports. They’ll be the ones that ran the barn math and were honest about what actually pays. So — where does your herd sit: managing for the number that feels good, or the pounds that move the check?

Complete references and supporting documentation are available upon request by contacting the editorial team at editor@thebullvine.com.

Learn More

The Sunday Read Dairy Professionals Don’t Skip.

Every week, thousands of producers, breeders, and industry insiders open Bullvine Weekly for genetics insights, market shifts, and profit strategies they won’t find anywhere else. One email. Five minutes. Smarter decisions all week.

NewsSubscribe
First
Last
Consent

4.23% Butterfat, $187,000 Gone: The Margin Math That Broke 2025 – And Shapes Your 2028

4.23% butterfat—an all-time record. $187,000 gone from a 500-cow herd—silently. That’s not bad luck. It’s the margin math that broke 2025 and shapes who wins by 2028.

Executive Summary: U.S. butterfat hit 4.23% in 2024—an all-time record. Exports topped $8.2 billion. Margins still collapsed. For a 500-cow herd underestimating true breakeven by just $1.50/cwt, that translates to roughly $187,000 in equity vanishing annually—often invisibly, until the lender starts asking hard questions. This isn’t cyclical bad luck; genomic selection has locked the national herd into high-component production through at least 2028, while 82% of U.S. milk still clears domestically, no matter how strong exports run. Regional pain points vary sharply: eroding Class I premiums in the Northeast, punishing cost structures in California, and processor-dependent fortunes across the Southwest. What follows is the margin math that explains 2025’s wreckage—and a 2026-2028 checkpoint framework for aligning genetics, breakeven reality, and processor fit before options narrow further.

Dairy Margin Math

You know that feeling when you look at the milk check and think, “This isn’t what the markets promised me a year ago”? A lot of dairy folks were right there in 2025.

What I’ve found, digging through the numbers and talking with economists, lenders, and producers across the country, is that 2025 wasn’t just “one bad year.” It was the point where years of genetic progress in butterfat performance, record-high component tests, and massive processing investments finally collided with the hard limits of demand and pricing. And that’s the math we need to walk through together.

The 2025 Reality: Less About Volume, More About Butterfat

Looking at this trend, one of the first surprises is that the U.S. didn’t suddenly drown in extra milk. Industry analysis based on 2024 and 2025 statistics indicates that total U.S. milk production has been relatively flat compared with earlier decades of growth. So the story isn’t just “too many cows.”

What really changed was what was in the tank.

Here’s what’s interesting. Industry reports traced national milkfat trends going back decades, and for a long stretch—from the mid-1960s up to about 2010—average U.S. butterfat hovered in a remarkably tight band, around 3.65–3.69 percent. Then things started to climb. By 2021, we hit a national average of about 4.01 percent milkfat for the first time in recorded history—breaking a record that had stood since 1944 and 1945.

That moved to roughly 4.06–4.08 percent in 2022 and 4.14–4.15 percent in 2023, depending on the calculation method, with each year setting a new record. By 2024, calculated national averages around 4.23 percent butterfat and 3.29 percent protein using monthly USDA National Agricultural Statistics Service data. That lines up with what many of you are probably seeing on DHI sheets—cows that were once 3.6–3.7 percent now sitting comfortably over 4.0.

It’s worth noting that because total milk volume hasn’t grown nearly as fast as butterfat tests, the total pounds of milkfat have jumped faster than the pounds of milk. From 2022 to 2023 alone, U.S. milkfat production increased by about 136.2 million pounds—a 1.5 percent gain—despite modest growth in total milk.

At the same time, price reports and commentary from CME, USDA, and the Farm Bureau, along with our own analysis here at The Bullvine, showed butter and cheese markets under pressure in 2024 and 2025 as stocks built and global competition intensified. So the 2025 reality wasn’t just “more milk.” It was a lot more fat in roughly the same milk pool, with fewer places to sell that fat at the premiums we’d gotten used to.

The Long Component Shift, in One Glance

To put the component story in perspective, here’s a simple snapshot using ranges and figures drawn from USDA statistics and industry analysis.

Table 1. The Component Shift (National Picture)

YearApprox. Avg. Milkfat %Primary Market FocusPhase
2005mid-3.6% rangeFluid milk / volumeOld baseline
20214.01%Fat premiums are gaining tractionThe “pivot”
20234.14–4.15%Fat clearly leading the checkThe “boom”
2024~4.23% (estimated)High-component “new normal.”The “overload”

Industry reports confirm that milkfat set a new annual record four years in a row, leading into 2024. And when you combine that with industry genetics coverage and what we’ve been tracking here, the component gains have been fueled by coordinated genetic selection, nutrition programs, and management improvements. Put together, the message is clear: we’re not drifting back to 3.6–3.7 percent as a national norm anytime soon.

Why Exports Didn’t “Save” 2025

What farmers are finding—and you probably know this already if you’ve been watching the trade reports—is that the export story is a bit of a double-edged sword.

USDA’s Foreign Agricultural Service and industry groups like USDEC and IDFA have all highlighted that U.S. dairy exports hit record or near-record levels in recent years. Dairy Foods reported that U.S. dairy exports topped $8.2 billion in 2024—the second-highest total export value ever—with strong cheese and powder shipments to key buyers such as Mexico and Southeast Asia. And here’s the figure that really matters: according to IDFA, roughly 18 percent of U.S. milk production, on a solids basis, is now exported. That’s about one day’s worth of milk produced on America’s dairy farms each week going overseas. A huge change from 20 years ago.

So it’s fair to ask: if exports were that strong, why did domestic prices still slump?

The scale math is pretty unforgiving. If about 18 percent of U.S. milk production goes out as exports, that still leaves roughly 82 percent that has to be consumed domestically. At the same time, the national butterfat average went from roughly 4.01 to 4.08 to 4.15 to over 4.2 percent in just a few years. So even if total milk volume is nearly flat, the pounds of fat looking for a home are not.

Market Destination% of U.S. Milk (Solids Basis)Key Vulnerability2024–2025 Reality
Domestic consumption82%Hard ceiling on fat absorptionButter stocks built despite record components; Class I utilization down to 30% in Northeast
Export markets18%Price competition with EU/Oceania$8.2B record exports in 2024, but often at discounted prices to move volume
Processing capacity100%Processor product mix locked in$11B in new plant investments (2025), but most designed for specific component profiles

On top of that, USDEC and Farm Bureau’s dairy trade analysis have emphasized that keeping those export channels open often means being competitive on price. In multiple periods, U.S. butter and skim milk powder have had to trade at a discount to European and Oceania products to move volume.

Industry reports have described that dynamic as a mix of record exports and tight margins, as a defining feature of the last couple of years. We covered the implications of this in our piece on 2025’s dairy dilemma.

What’s encouraging is that in some regions, especially in the West and Southwest, export-oriented plants have been a lifeline. Industry coverage of new powder and cheese facilities in Texas, New Mexico, and Kansas shows how those plants have created strong localized demand and a better basis for dairies in those draw areas, many of them large freestall or dry lot systems. In those cases, exports aren’t an abstraction; they’re the reason the local processor can keep taking milk.

But zooming out, the data from USDEC, IDFA, Farm Bureau, and industry analysts suggests exports did about as much as they reasonably could—and still couldn’t completely mop up the extra butterfat coming out of U.S. herds. When 80-plus percent of your product still has to clear domestically, multi-year component expansion will eventually show up in the price.

Genetic Momentum: The Part You Can’t Undo Next Breeding Season

Here’s where the genetics piece comes in, and it’s one of the most important parts of this whole story.

Coverage has spelled out how dairy cattle in the U.S. have essentially entered a “high-component era” thanks to genomics and selection for fat and protein. Genomic selection, shorter generation intervals, and focused breeding goals have stacked more fat and protein into the national herd over the last decade.

And the research backs this up. Peer-reviewed genetics papers published in journals such as Genetics, Selection Evolution, and PNAS have documented that genomic selection has increased genetic gain rates for production and component traits by 50% or more compared with traditional progeny-testing systems. Some studies show even larger gains—the Frontiers in Genetics review on U.S. dairy cattle genomic selection noted that the program has essentially doubled the rate of genetic gain.

The April 2025 Holstein base change really drove this home. According to documentation from NAAB and Select Sires, this was one of the largest base changes in history—resetting values to 2020-born cows with PTAs for fat dropping by about 44-45 pounds in the adjustment. That tells you just how much the genetic level has climbed. We covered the implications in our April 2025 US Holstein Evaluations analysis.

Here’s what that means in the parlor. A heifer you bred in 2021 or 2022 to a high-component genomic bull freshened in 2023 or 2024. Her daughters—already on the grow—will be milking through 2028–2030. So while you can start adjusting your sire lineup today—maybe shifting a bit more emphasis toward protein, feed efficiency, and health—you can’t un-breed the decisions from five years ago.

Land-grant university extension programs have been pretty clear in their 2024–2025 outlook discussions: the industry is genetically “pre-loaded” for high butterfat and strong solids for at least the next several years. The cows in the pipeline and the base-change data both point in that direction.

If current component and utilization trends continue, it’s hard to see a world in the late-2020s where butterfat returns to scarcity. Much more likely is a reality where high butterfat is the baseline, and the true differentiators are metabolic efficiency, health, and how closely your herd’s profile matches your plant’s needs.

Regional Pain Points: Same Storm, Different Boats

What farmers are finding is that the same national trends play out very differently depending on where you are and who you ship to.

Table 2. Regional Pain Points (2025–2026 Snapshot)

RegionPrimary Market StructureBiggest Margin Killer (2025)Est. Breakeven Range ($/cwt)Strategic Position
Northeast (FMMO 1)Fluid-to-manufacturing shiftLoss of Class I premiums (44% → 30% utilization)$21–$24High-cost structure meets manufacturing pricing; margin squeeze acute
California & West CoastMixed fluid/manufacturing/exportFeed + regulatory costs + co-op loss pass-throughs$20–$23Punishing input costs; basis often below U.S. average
Upper Midwest (WI/MI)Cheese-focused, high componentsComponent mismatch with some plants; 4.2%+ fat not always rewarded$17–$20Strong processing diversity, but not all plants optimize ultra-high butterfat
Central Plains / Southwest (TX/NM/KS)New cheese & ingredient plants, export-linkedProcessor-dependent; need consistent volume to justify $11B buildout$16–$19Best positioned if tied to new plants; vulnerable if outside draw areas

In the Northeast, FMMO 1 data and Cornell/Penn State extension work indicate that Class I (fluid) utilization has declined significantly. Analysis has documented that in the Northeast, Class I milk utilization fell from 44 percent in 2000 to 30 percent by 2022. That’s a dramatic shift, and it means more milk is being priced in manufacturing classes. Coverage of FMMO reform and Order 1 discussions has highlighted how that erodes the fluid premium that used to support many smaller and mid-size herds. Producers there are now being judged much more directly on components and the all-in cost structure.

In California and other Western states, the cost picture is especially tight. Feed, water, and regulatory burdens are already higher than in many other regions.

On top of that, reports have documented co-ops passing losses through to members during tough stretches, leaving some producers with net milk prices materially below the national all-milk price. Stack those together, and you have a very narrow margin for error.

In the Central Plains and Southwest, there’s been massive investment in new processing capacity. IDFA reported in October 2025 that more than $11 billion is flowing into 53 new or expanded dairy manufacturing facilities across 19 states, with Texas alone receiving about $1.5 billion. We examined these dynamics in our piece on the $11 billion wave of processor investments. Industry coverage has documented specific projects including Cacique Foods in Amarillo, Great Lakes Cheese in Abilene, H-E-B in San Antonio, and Leprino Foods in Lubbock. Many of those plants are designed around large freestall and drylot systems that supply consistent volume. Producers in those regions often report strong local demand and aggressive base allocations, even in weaker price windows, but they’re also tied tightly to the success of those new plants and their export programs.

In Wisconsin and other Upper Midwest states, statistics and extension data show a mix of strong production, high butterfat, and diversified processing: cheese, butter, whey, specialty products. But even there, when state and national butterfat levels pushed firmly into the 4.0+ range, not every product mix could reward unlimited fat—especially plants focused heavily on cheese yield and whey solids.

A Note for Canadian Producers: The specifics differ north of the border—quota systems buffer volume swings and provide different price dynamics. But the underlying component and cost pressures are real in Canada too, and conversations about efficiency, genetics, and processor fit are just as relevant. The genetic momentum we’re describing is continental, not just American, and many of the strategic questions around breeding emphasis and cost structure apply regardless of which side of the border you’re milking on.

So while the national numbers are the same for everyone, the pain points—and the opportunities—vary a lot by region and processor.

The Breakeven Trap: Where “Almost Okay” Eats Equity

Here’s the part that’s easy to overlook when you’re just trying to get through another month: the breakeven math.

Farm financial analysts, including those at American Farm Bureau and in land-grant university farm management programs, have flagged a significant uptick in Chapter 12 bankruptcies. Chapter 12 filings were up 56 percent in June 2025 compared to the prior year. Farm Policy News documented that family farm bankruptcies increased 55 percent in 2024 compared to 2023. And University of Arkansas Extension noted that Q1 2025 saw 88 Chapter 12 filings compared to just 45 in Q1 2024.

What’s striking is that these filings often don’t coincide with the absolute lowest milk prices we’ve ever seen—they show up after a few years of “thin but not terrible” margins. We explored this pattern in depth in our analysis of the 55% surge in strategic bankruptcies.

Our own “$200K Dairy Margin Trap” analysis here at The Bullvine walked through an example of how a relatively modest $1.25–$1.75/cwt squeeze between expected and actual margins can quietly drain $150,000–$200,000 a year out of a 500-cow operation. You don’t always feel that in any one month, but the balance sheet sure feels it in three to five years.

Extension bulletins from universities like Wisconsin and Penn State have stressed that many farms underestimate their true cost of production by omitting paid-equivalent owner labor, reasonable machinery replacement, heifer-raising costs, and deferred maintenance. When those are fully accounted for, breakeven often ends up $1–$2 per hundredweight higher than the “mental” number many producers are using.

To put some real numbers on it: a 500-cow herd averaging about 25,000 pounds per cow per year ships roughly 12.5 million pounds—125,000 hundredweight. If your real breakeven is $1.50/cwt higher than you think, that’s around $187,500 a year in unrecognized loss. At $2.00/cwt, it’s roughly $250,000. On a 150-cow herd producing around 37,500 hundredweight, the same $1.50–$2.00 error still adds up to roughly $56,000–$75,000 per year—enough to decide whether you can replace a tractor or re-roof a barn.

“If you think your breakeven is $19 but you haven’t fully counted owner labor, capital replacement, heifer costs, and deferred maintenance, you’re probably not breaking even—you’re quietly liquidating your farm one hundredweight at a time.”

Across three lean years, that’s hundreds of thousands of dollars of equity quietly eroded. It’s no wonder some producers feel blindsided when the bank suddenly looks nervous; the erosion happened slowly, while everyone hoped “next year” would fix it.

That’s why you’re seeing more talk from lenders and extension teams about detailed cost tracking, FINBIN-style benchmarking, and honest breakeven exercises. The goal isn’t to beat anyone up; it’s to make sure the math behind the milk check is as clear as the test sheet for butterfat.

Rethinking “Winning” in a High-Component Era

So, what farmers are finding is that the definition of “winning” has shifted.

Most serious market outlooks—including USDA’s Livestock, Dairy, and Poultry Outlook, CoBank’s Knowledge Exchange dairy briefs, Farm Bureau’s dairy market overviews, and multiple land-grant university outlook meetings—converge on a similar picture: a high-component milk supply, robust processing capacity, strong but not unlimited export growth, and ongoing Class I decline. They don’t pretend to know the exact Class III price in 2027, but they do suggest the structural pressures we’re seeing now aren’t going away.

Against that backdrop, three themes keep emerging in industry coverage and in our analysis here at The Bullvine.

1. Genetics: From “More Fat” to “Smart Fat.”

Industry analysts have shown we can absolutely keep breaking component records with the tools we have. The question isn’t “Can we add more fat?” anymore; it’s “Is more fat the best use of the next unit of genetic progress on this farm, with this processor?”

Reviews on milk quality and economic sustainability in journals such as Animals, and systematic reviews on performance indicators, point to a growing emphasis on metrics such as feed efficiency, health, and fertility. These align with what extension geneticists say: we now have the genomic tools to select for cows that convert feed into milk solids more efficiently, stay healthier through the transition period, and last longer in the herd.

For herds shipping mainly to cheese plants with strong whey and lactose streams, it can make sense to lean a little harder into protein, casein, and efficiency traits, while maintaining solid butterfat performance. For plants more dependent on butter and cream, maintaining high butterfat is still logical—but even there, balancing it with health and feed efficiency can keep production sustainable.

2. Efficiency and Health: Durable Competitive Edge

Our margin analysis and university farm business summaries both highlight that in tight times, the herds that stay profitable are the ones that consistently produce higher income over feed cost per stall, not just more pounds per cow. We explored the feed cost dynamics in our recent piece on why smart dairies are spending more on feed.

Research on seasonal milk composition, transition cow health, and fresh cow management shows that better control of the transition period—reducing displaced abomasum, ketosis, retained placenta, and metritis—pays off in both milk components and lower vet bills. The National Mastitis Council’s “Best of the Best” roundtable and industry coverage of quality award winners show that herds with strong udder health and milking routines capture more premiums and generally have more stable production.

In practical terms, as many of us have seen and extension case studies generally support, herds that clean up transition management and tighten ration consistency often see substantial improvements in income over feed cost—sometimes more than a dollar per cow per day—without adding new technology. That’s the kind of advantage that holds up whether butter is $1.80 or $3.00.

3. Market Alignment: Matching Cows to Plants

Industry coverage and our market pieces here keeps coming back to one simple idea: the same hundredweight of milk can be worth very different amounts, depending on what your plant does with it.

Cheese plants with advanced whey and ingredient streams can usually capture more value from both protein and fat than butter-powder plants with no side-streams. Plants that sell a lot of branded consumer products may be less exposed to global commodity swings than plants that sell mostly unbranded bulk product. Co-ops that spent heavily on certain commodity investments have more riding on specific market segments.

In Wisconsin operations, for example, producers shipping to specialty cheese plants with strong whey programs often report different checks than neighbors shipping to a more traditional commodity mix, even with similar butterfat performance and protein levels. In Texas and Kansas, dairies tied to new cheese/ingredient plants have reported strong demand and competitive pricing, while those just outside certain draw areas don’t see the same benefits.

The farms that seem to be navigating this best aren’t always the biggest, but they usually have a clear grasp of three things:

  • How their buyer makes money
  • How their butterfat and protein profile fits that product mix
  • How their cost of production stacks up against the risk profile of that market

2026–2028: Checkpoints Instead of Crystal Balls

So, where does that leave you when you sit down with your family, your lender, or your advisory team?

Nobody can tell you exactly where prices will be in June 2027. But the combination of USDA data, component trends, USDEC/IDFA trade reports, CoBank outlook briefs, and farm financial analysis provides enough structure to use checkpoints rather than crystal balls.

2026: Get Honest and Get Oriented

  • Lock in a real breakeven. Work with a farm business specialist or your lender to build a fully loaded cost of production that includes owner labor, realistic machinery replacement, heifer raising, and deferred maintenance.
  • Map your buyer. Identify your processor’s main products—cheese, powder, butter, fluid, ingredients, branded retail—and how they price butterfat and protein. Ask them directly how your component profile helps or hurts their system.
  • Audit your herd plan. With your genetic advisor, review whether your current sire choices and culling strategy still make sense for where you expect your milk to go in 2029–2031, not just where it went in 2022.

2027: Test Your Plan Against Reality

  • Compare plan vs. actual. Take your 2026 plan and match it against your actual margins, cull rates, heifer inventory, and debt service. Did the quiet equity erosion show up despite your adjustments?
  • Reassess market fit. If your plant is clearly long on cream and struggling with butter, but you’re chasing ever-higher butterfat performance, it might be time to rebalance breeding goals and rations slightly toward protein, efficiency, and health.
  • Decide whether to fix or pivot. If you’re still below true breakeven after making reasonable operational changes, 2027 is the year to have honest conversations about restructuring, resizing, or exploring different income strategies before equity erosion gets out of hand.

2028: Choose Your Long-Term Role

If current genetic and utilization trends continue, by 2028, we’re likely still in a world of high component prices, strong processing capacity, and export markets that are vital but not omnipotent. At that point, it’s less about hoping for a return to “normal” and more about choosing who you want to be in this system.

  • Are you positioned as a lean, efficient, component-savvy herd aligned with a processor that can pay for what you produce?
  • Is your breeding program clearly set up for metabolic efficiency, health, and the component balance your market values, not the one it valued five years ago?
  • Does your balance sheet give you room to keep investing in fresh cow management, transition cow care, and facilities that support cow comfort, instead of just plugging leaks?

Those aren’t easy questions, but the sooner they’re asked, the more options you tend to have.

Editor’s Note on Data and Methods

The numbers in this article come primarily from USDA National Agricultural Statistics Service milk production and composition data; U.S. dairy statistics; USDEC/IDFA and Dairy Foods export summaries; Farm Bureau, Farm Policy News, and University of Arkansas Extension analysis of dairy financial stress and bankruptcy trends; CoBank Knowledge Exchange dairy briefs; IDFA manufacturing investment data; and The Bullvine’s own breakeven and margin modeling. Genetic trends and efficiency themes reflect published reviews on milk composition and economic sustainability in peer-reviewed journals, including Genetics, Selection, Evolution, PNAS, and Frontiers in Genetics, as well as NAAB/Select Sires base change documentation. These are national or regional averages and may not mirror your exact situation; that’s why we encourage you to run your own numbers and share your experience.

The Bottom Line

What’s interesting is how consistently the data and the on-farm stories line up when you step back. USDA analysis shows a steady march to higher butterfat; industry genetics coverage shows record components driven by genomics; USDEC, IDFA, and Farm Bureau show exports doing well but still capped around that 18-percent share; and farm financial analysis points to slow, quiet equity erosion when breakeven is misjudged.

What’s encouraging is that producers have more tools than ever—genomic testing, better transition period nutrition research, fresh cow management protocols, quality benchmarking, and robust financial tools—to respond thoughtfully rather than just react.

If current trends continue, the late-2020s likely won’t be about “getting back” to some old version of the milk check. They’re going to be about thriving in a world where high butterfat is common, where efficiency and health are as valuable as raw output, and where being matched to the right plant matters more than ever.

The 2025 downturn wasn’t a random fluke; it was a feature of a system that finally caught up to its own success in components and capacity. The big question going forward isn’t when the market will fix itself. It’s whether our cows, our costs, and our contracts are lined up with the market we actually have.

So let me leave you with the same question I’ve been asking in winter meetings:

Are you still breeding and budgeting for the 2022 milk check—or are you starting to design your herd and your business for the 2028 reality the data keeps pointing toward?

KEY TAKEAWAYS:

  • Record butterfat broke the margin math: 4.23% components and $8.2 billion in exports still left producers struggling—82% of milk clears domestically, and American fat demand has hard limits
  • $187,000 vanishes without warning: A 500-cow herd underestimating true breakeven by just $1.50/cwt bleeds that much equity every year—often invisibly, until the lender starts asking hard questions
  • Genetics locked this in through 2028: Genomic selection doubled the rate of component gain; the high-fat cows freshening now were bred years ago, and their replacements are already growing out
  • Same storm, very different boats: Northeast herds face eroding Class I premiums, California operations fight punishing cost structures, and Southwest dairies have bet heavily on new processing capacity
  • Decide by 2027 or drift into trouble: Lock in your real breakeven, understand what your processor actually pays for, and audit your breeding direction—the window for strategic repositioning shrinks every season

Complete references and supporting documentation are available upon request by contacting the editorial team at editor@thebullvine.com.

Learn More

The Sunday Read Dairy Professionals Don’t Skip.

Every week, thousands of producers, breeders, and industry insiders open Bullvine Weekly for genetics insights, market shifts, and profit strategies they won’t find anywhere else. One email. Five minutes. Smarter decisions all week.

NewsSubscribe
First
Last
Consent
Send this to a friend