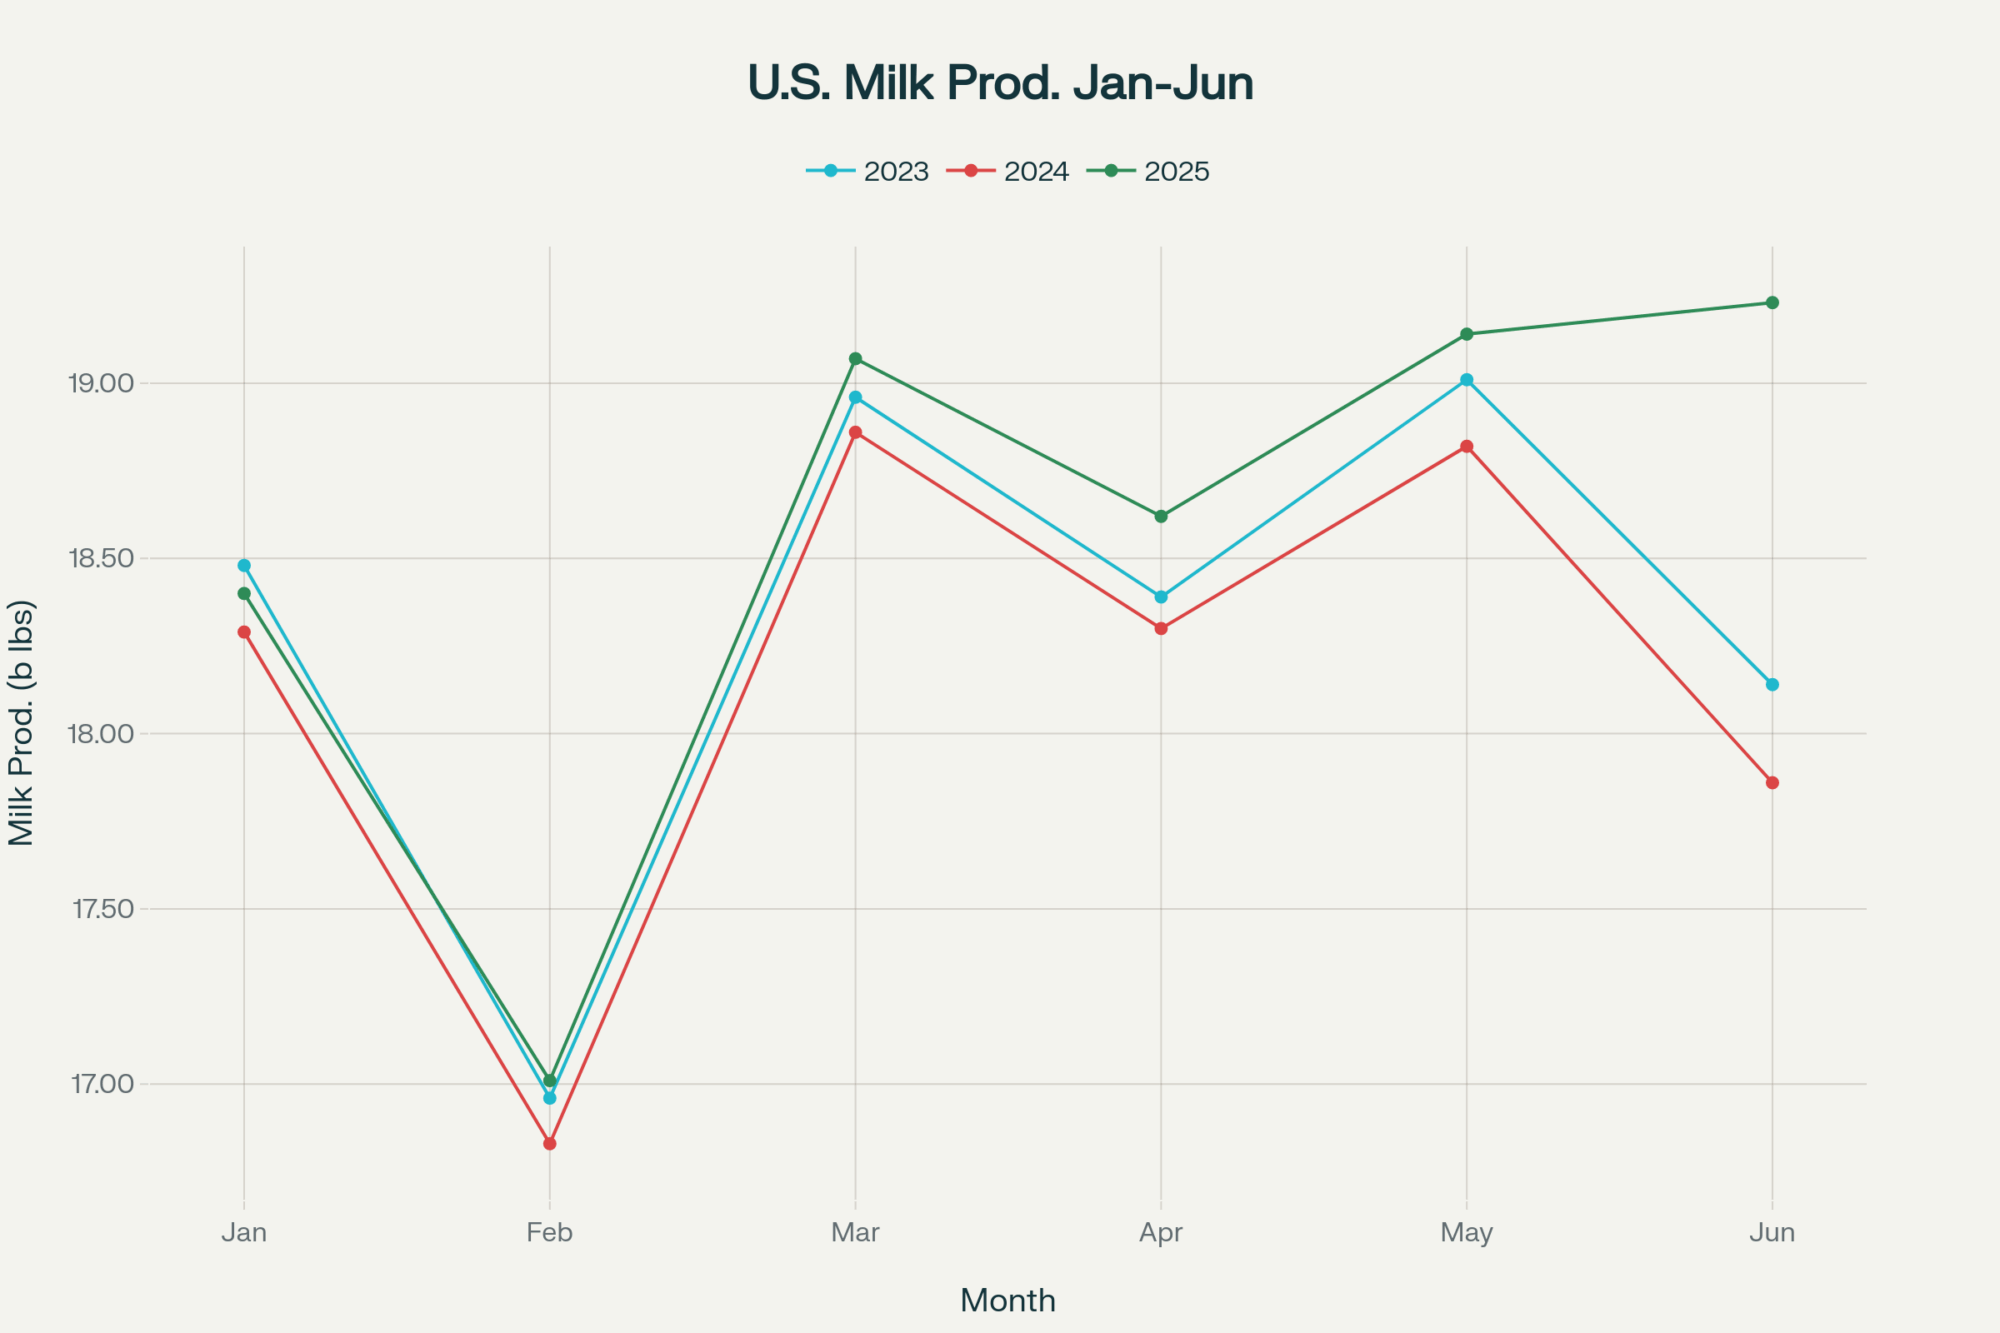
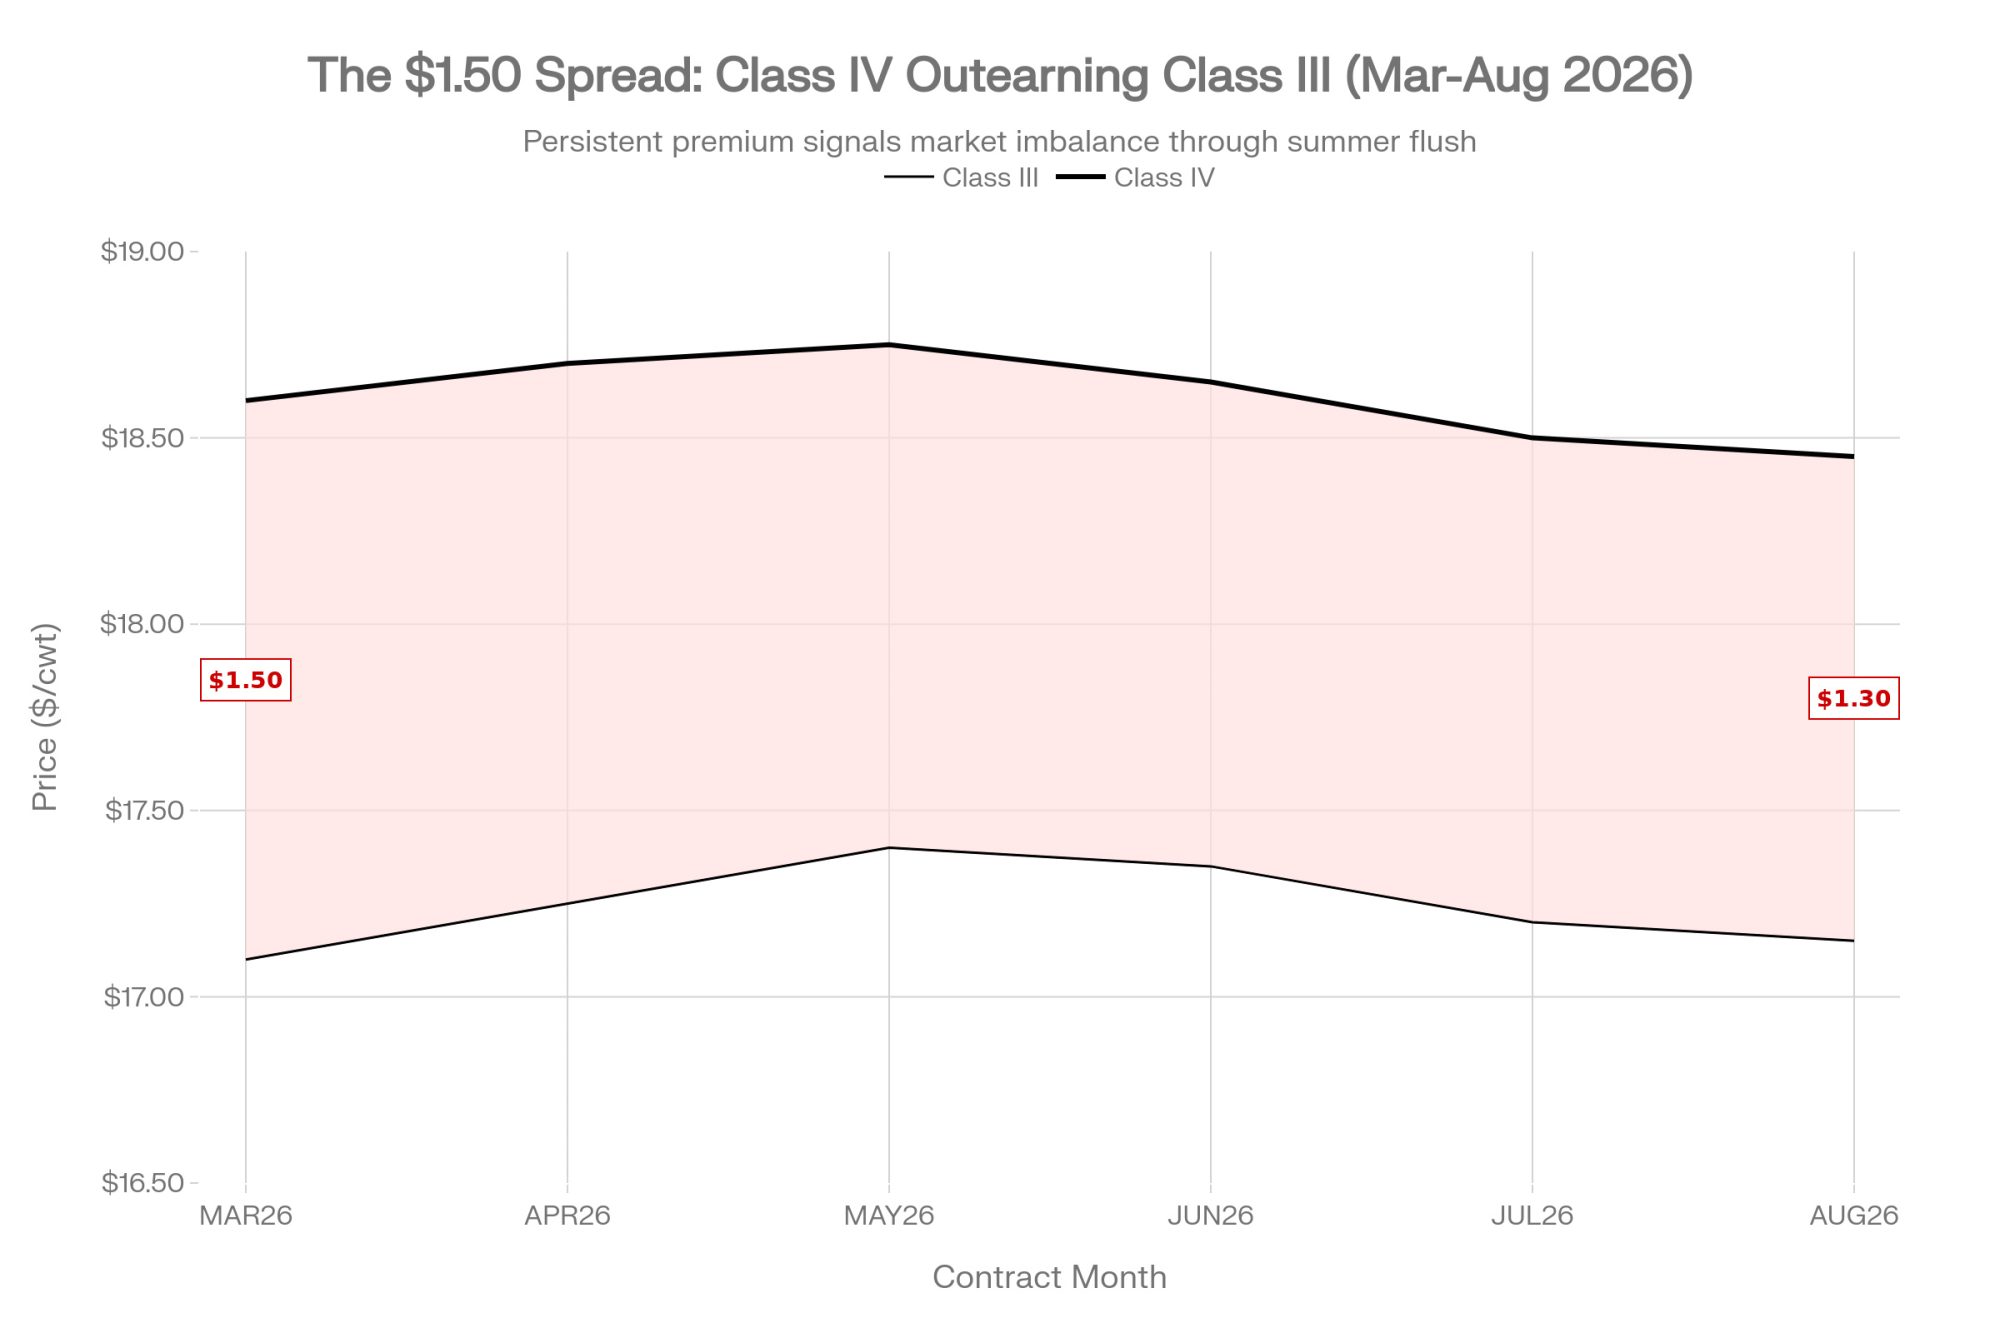
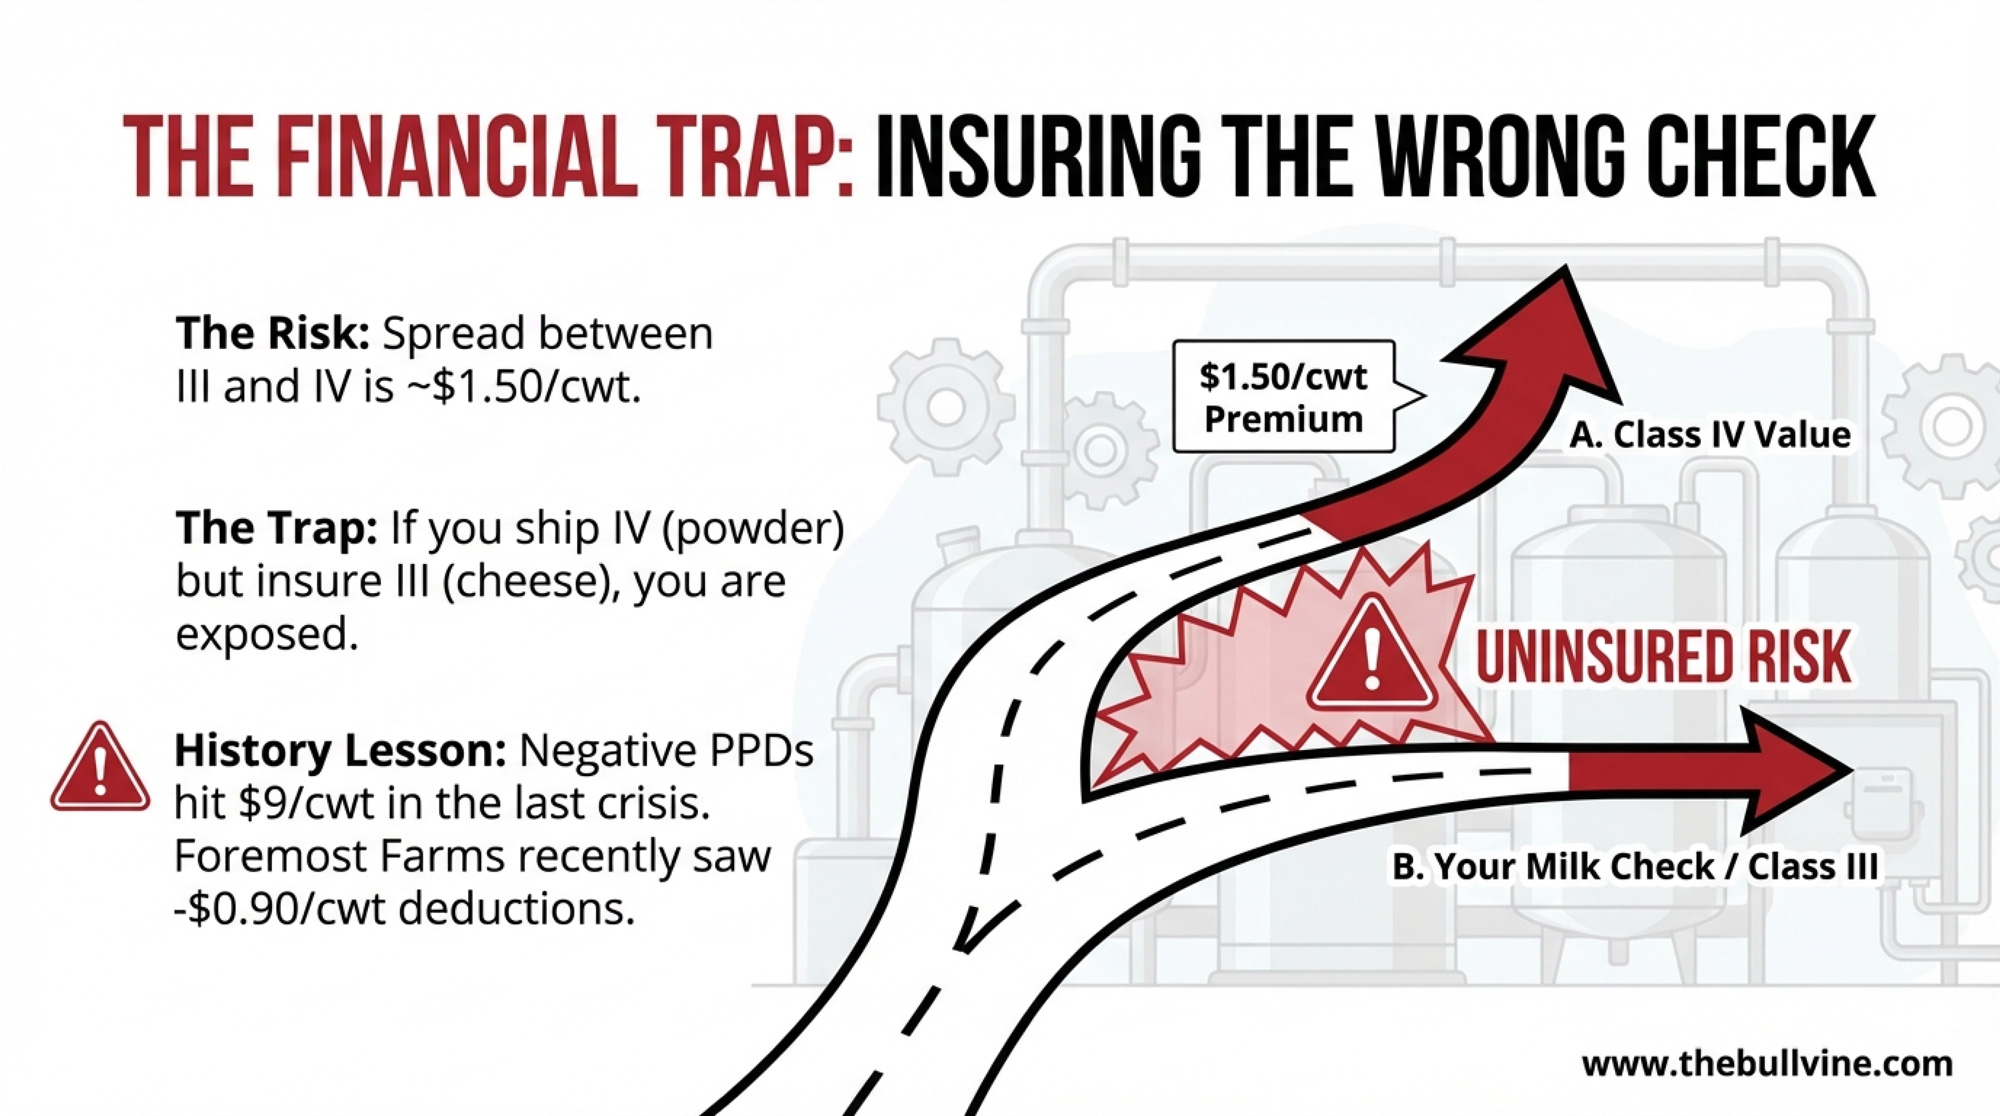
17 days to the DMC deadline. Class IV is $1.50/cwt above Class III. If your DRP is weighted heavily on III, you’re insuring a check that doesn’t exist.
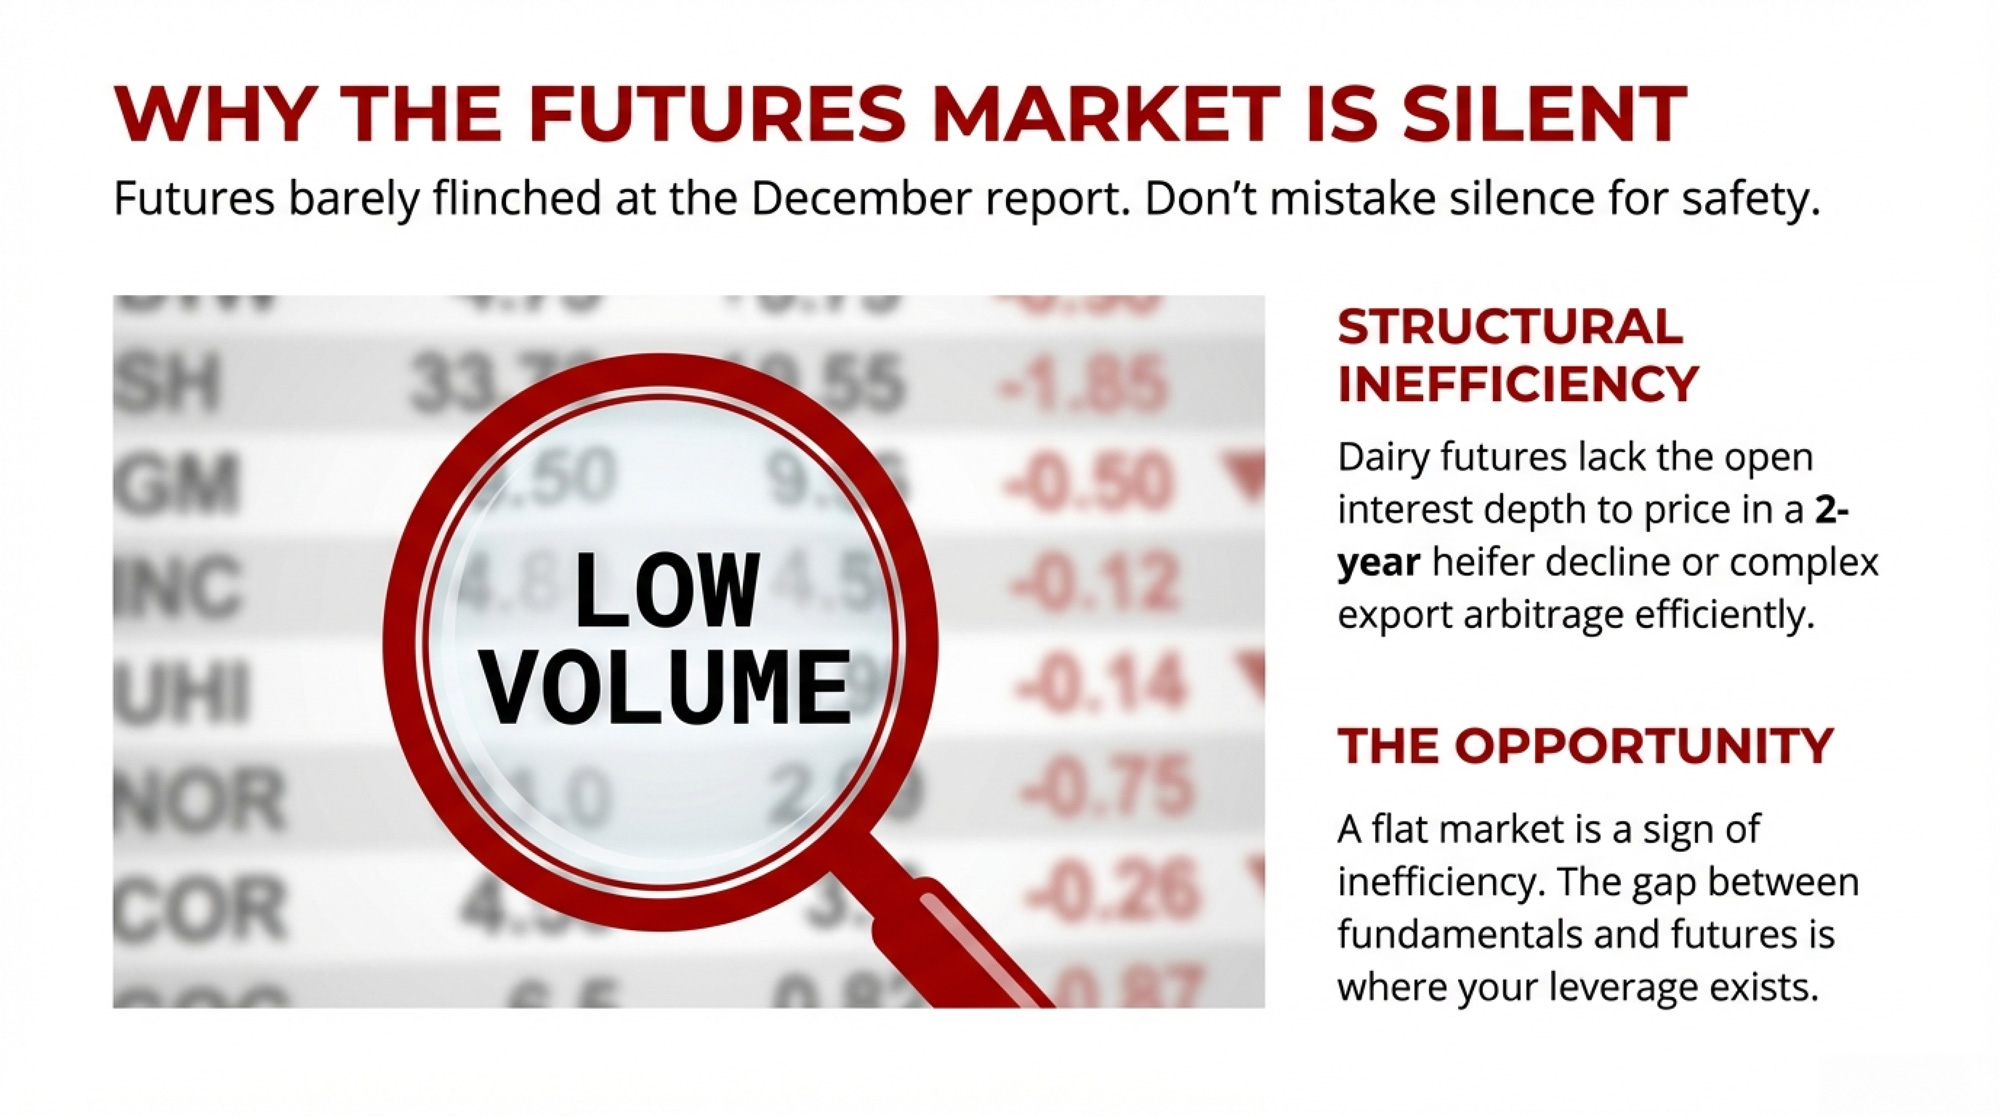
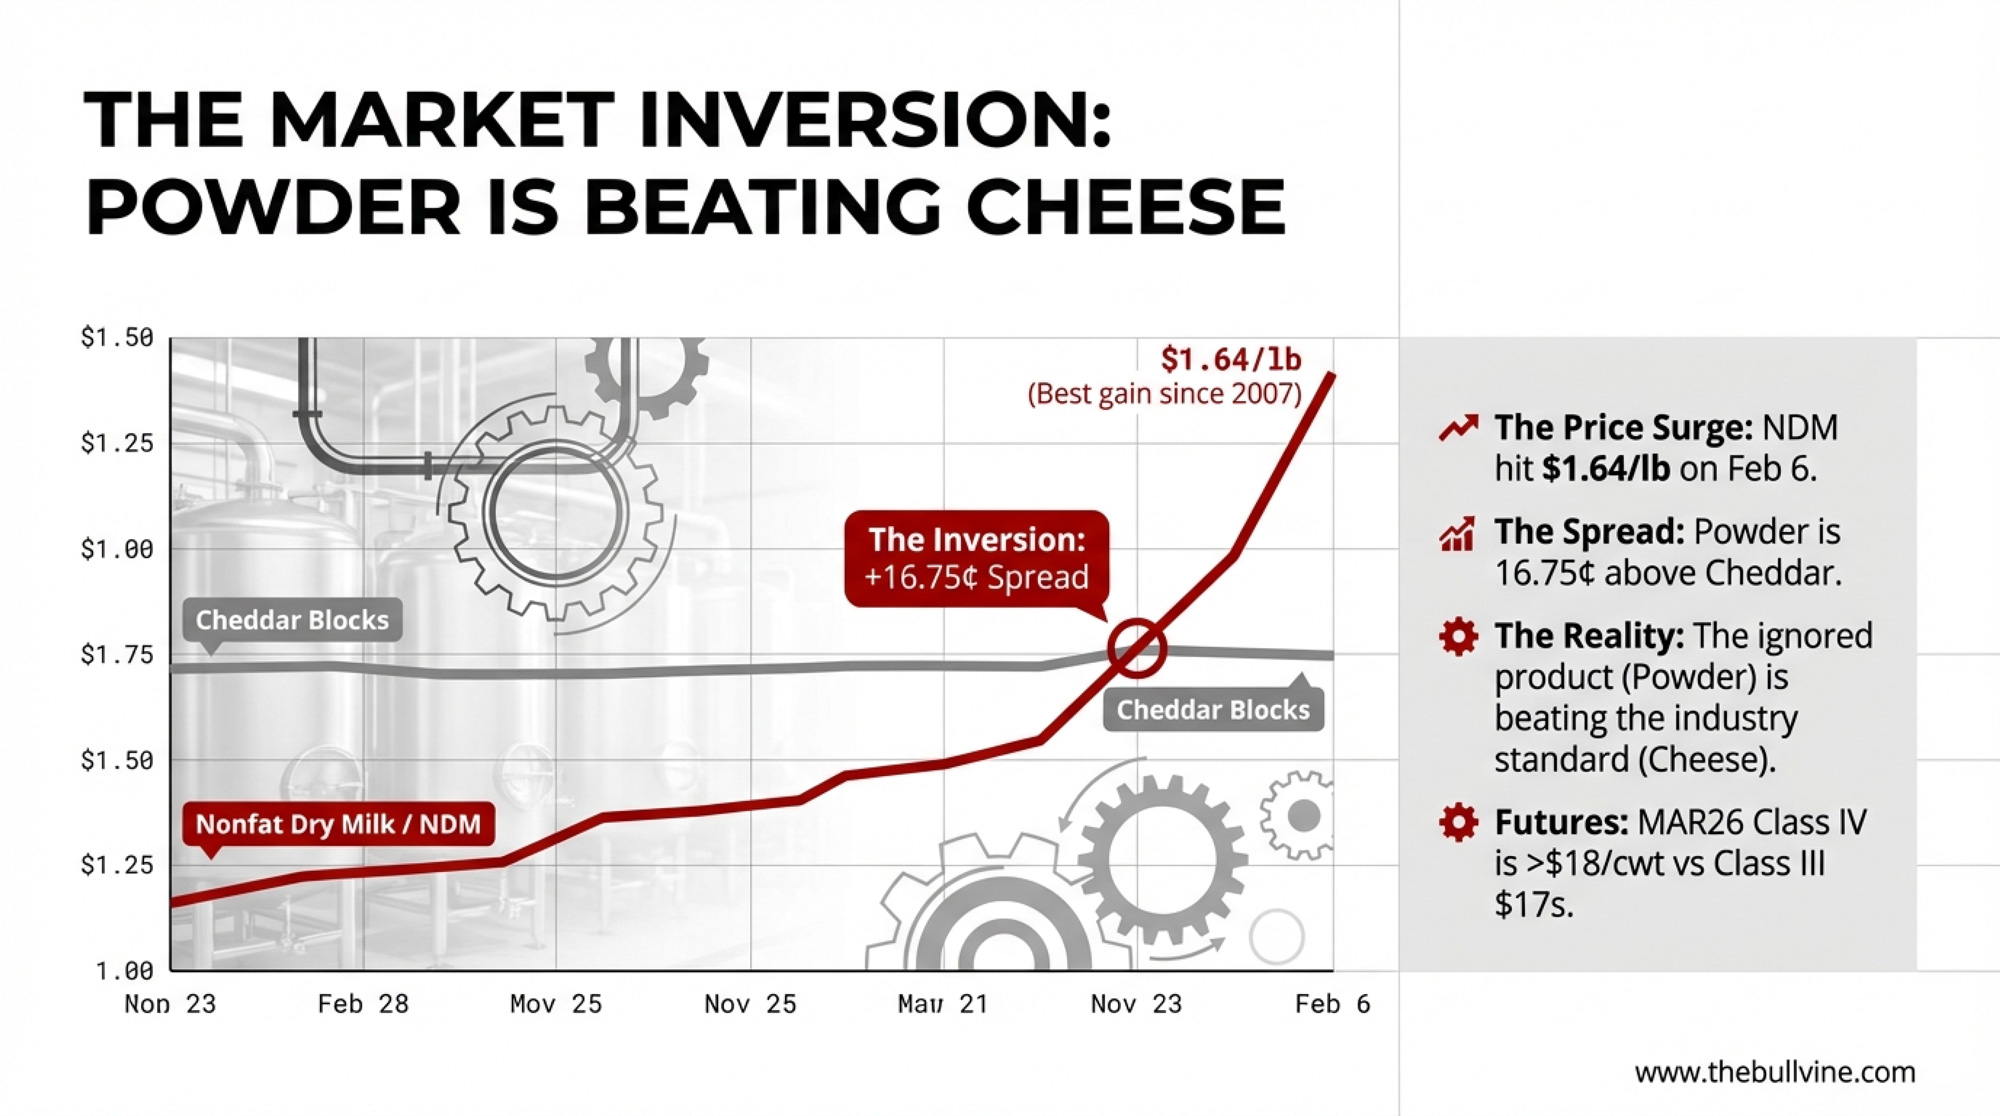
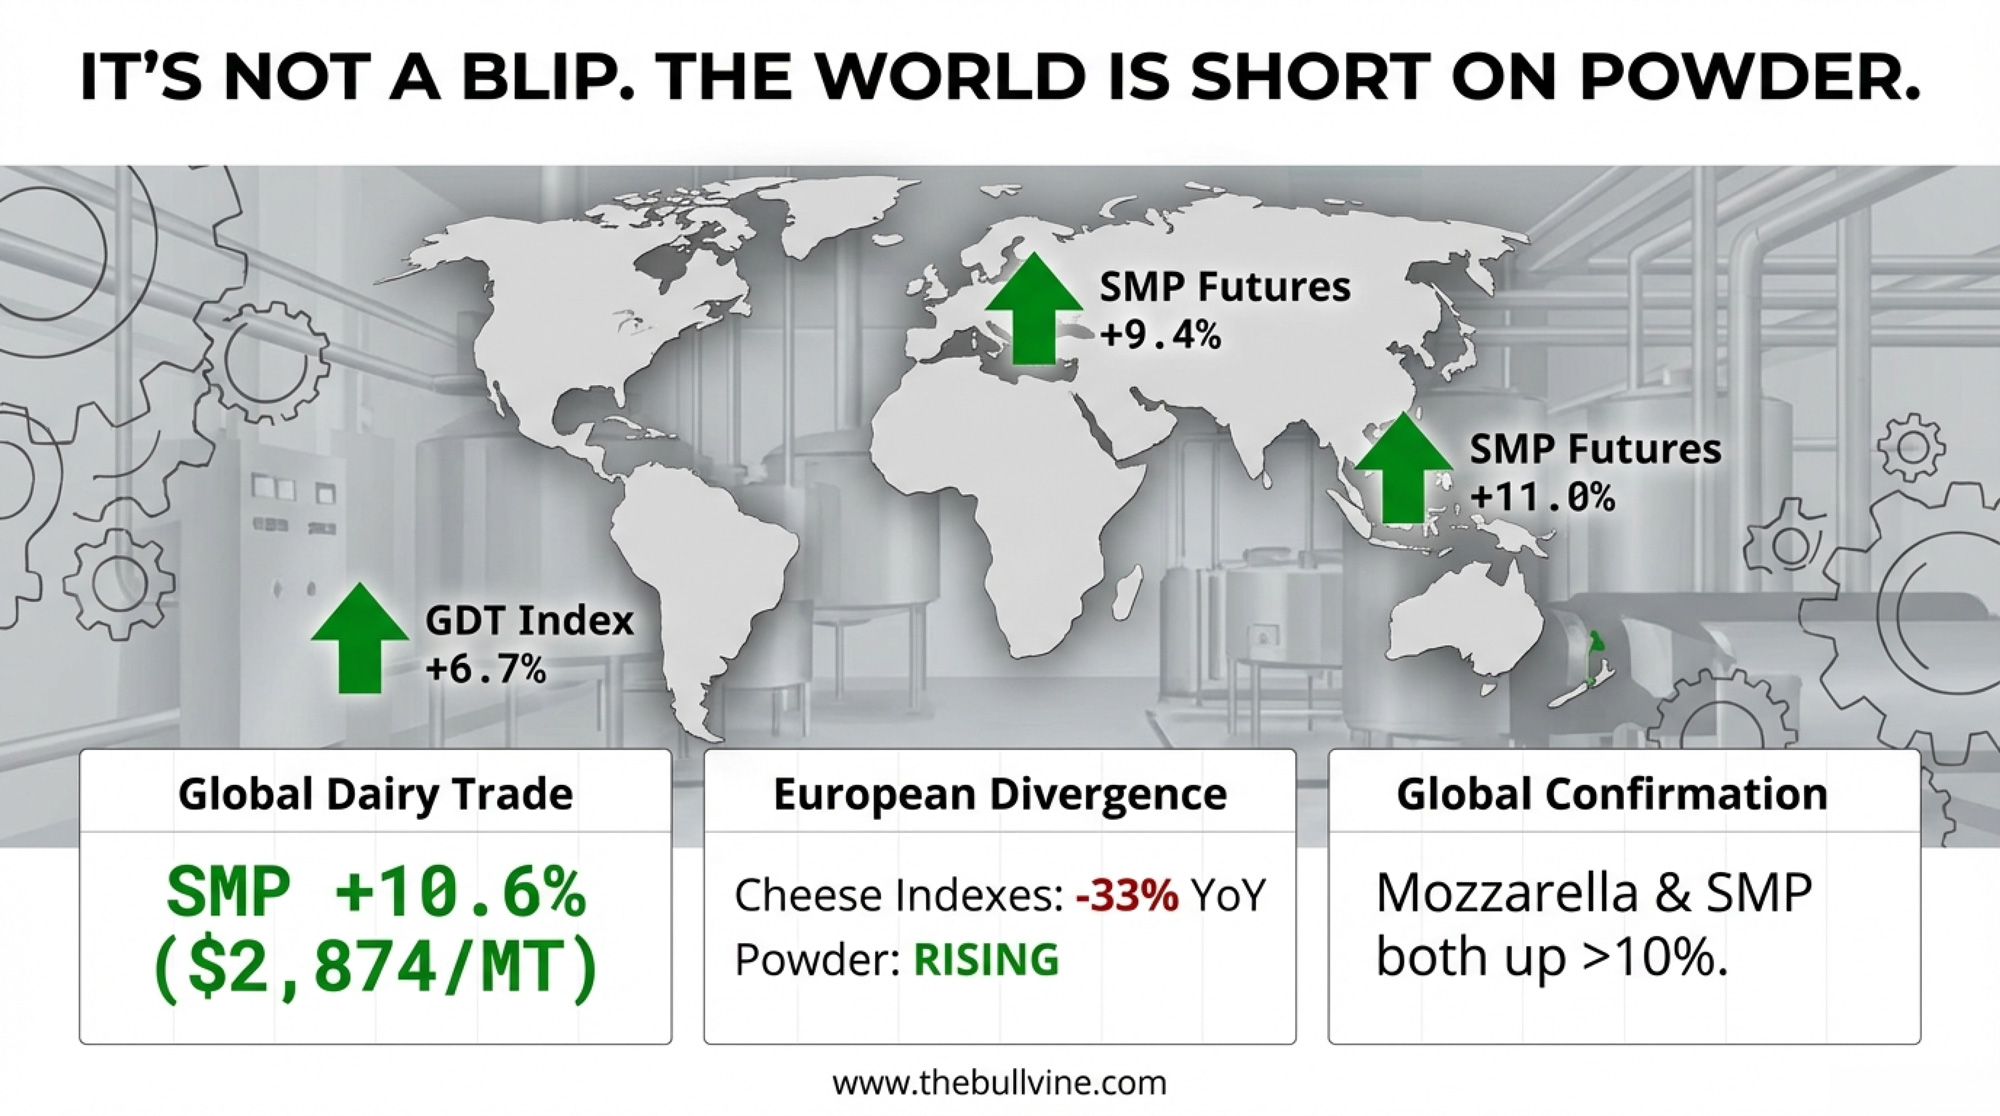
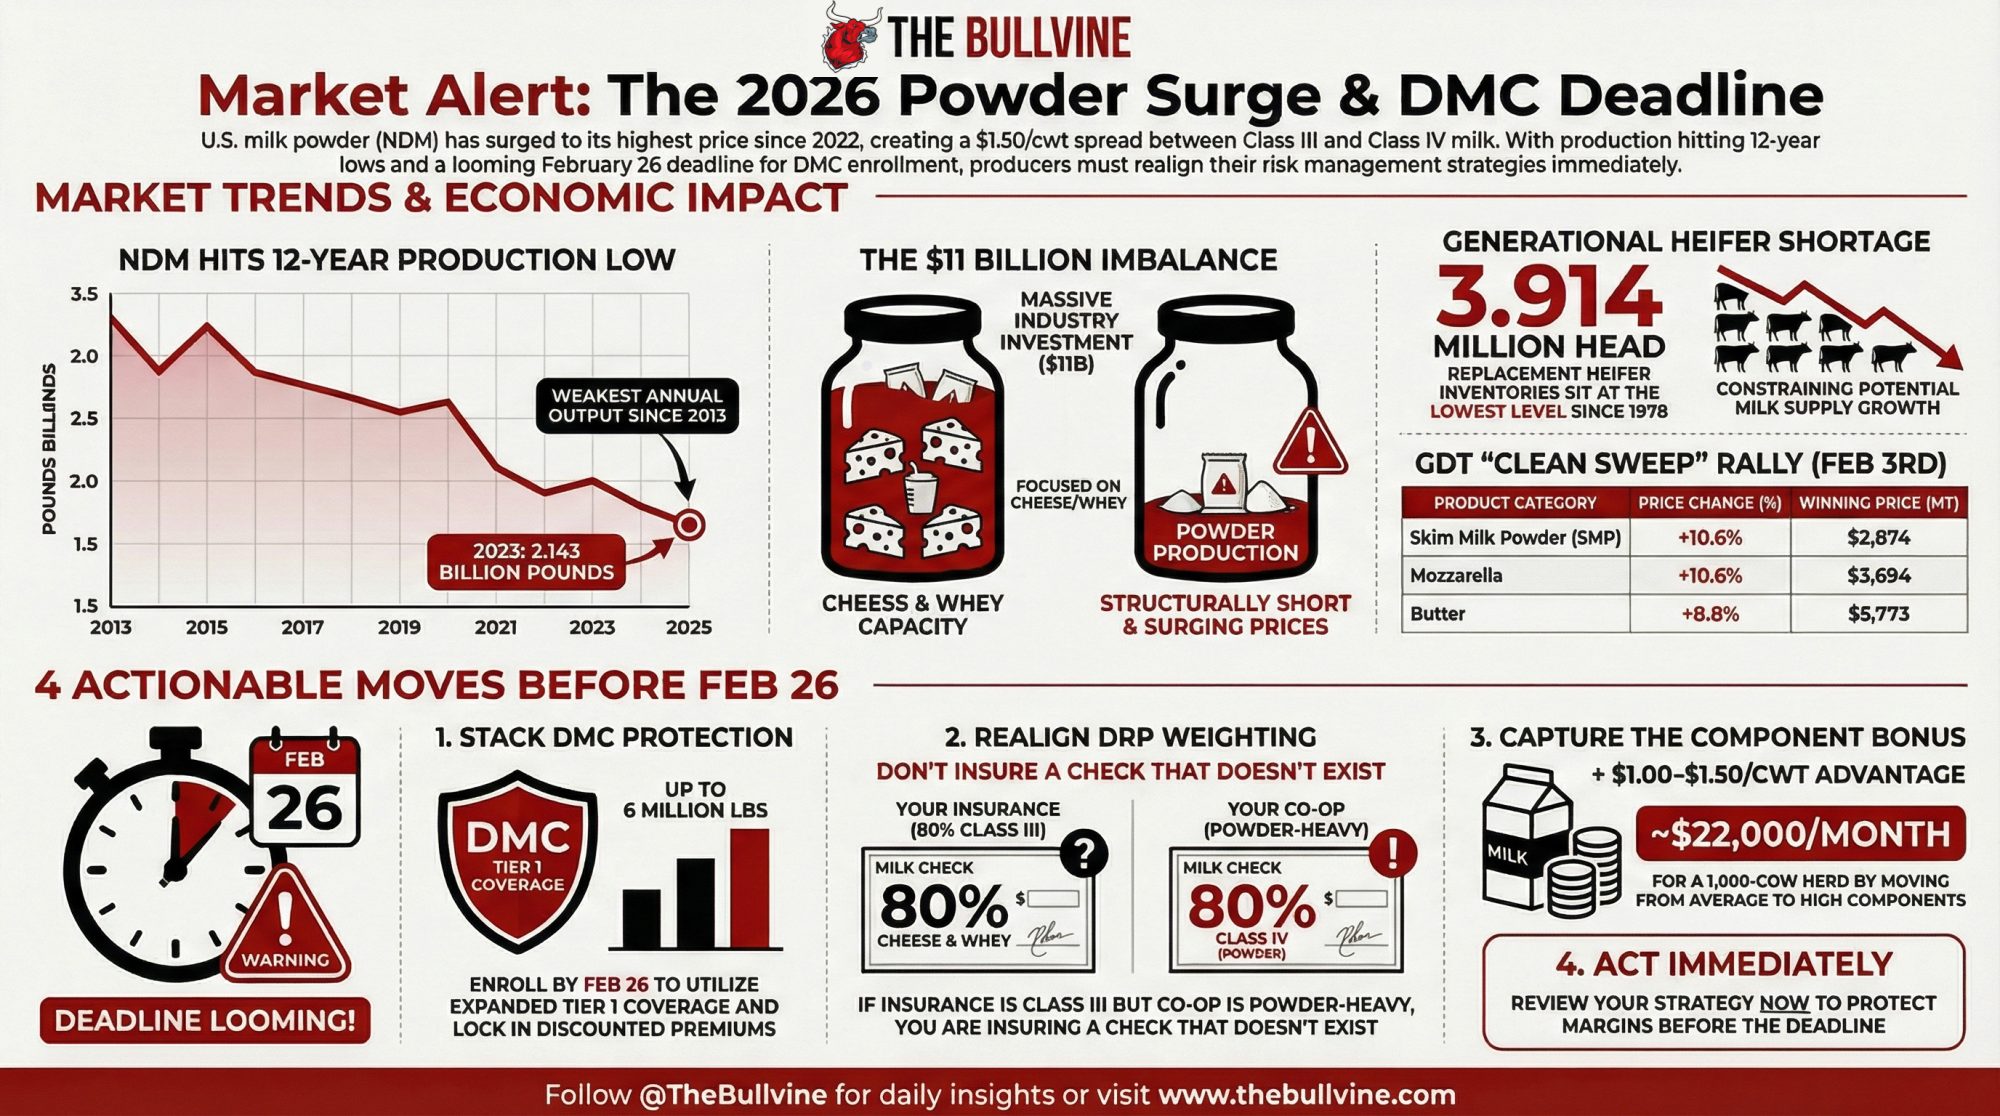
Executive Summary: NDM hit $1.64/lb on Friday — its best week since 2007 — putting milk powder 16.75¢ above Cheddar blocks. That’s not a blip. U.S. dryers produced just 2.143 billion pounds of NDM/SMP in 2025, the weakest since 2013, while the industry poured $11 billion into cheese plants that need more milk but don’t make powder. GDT confirmed the global story on February 3: the index surged 6.7%, SMP jumped 10.6%, and all seven product categories gained. The Class III/IV spread now sits at roughly $1.50/cwt—and every month you don’t restructure your DRP or optimize components, you’re subsidizing that spread from your own check. DMC enrollment closes February 26. Below: 4 moves before the deadline, the three structural constraints keeping powder tight, and the single production number that tells you whether this rally is real.

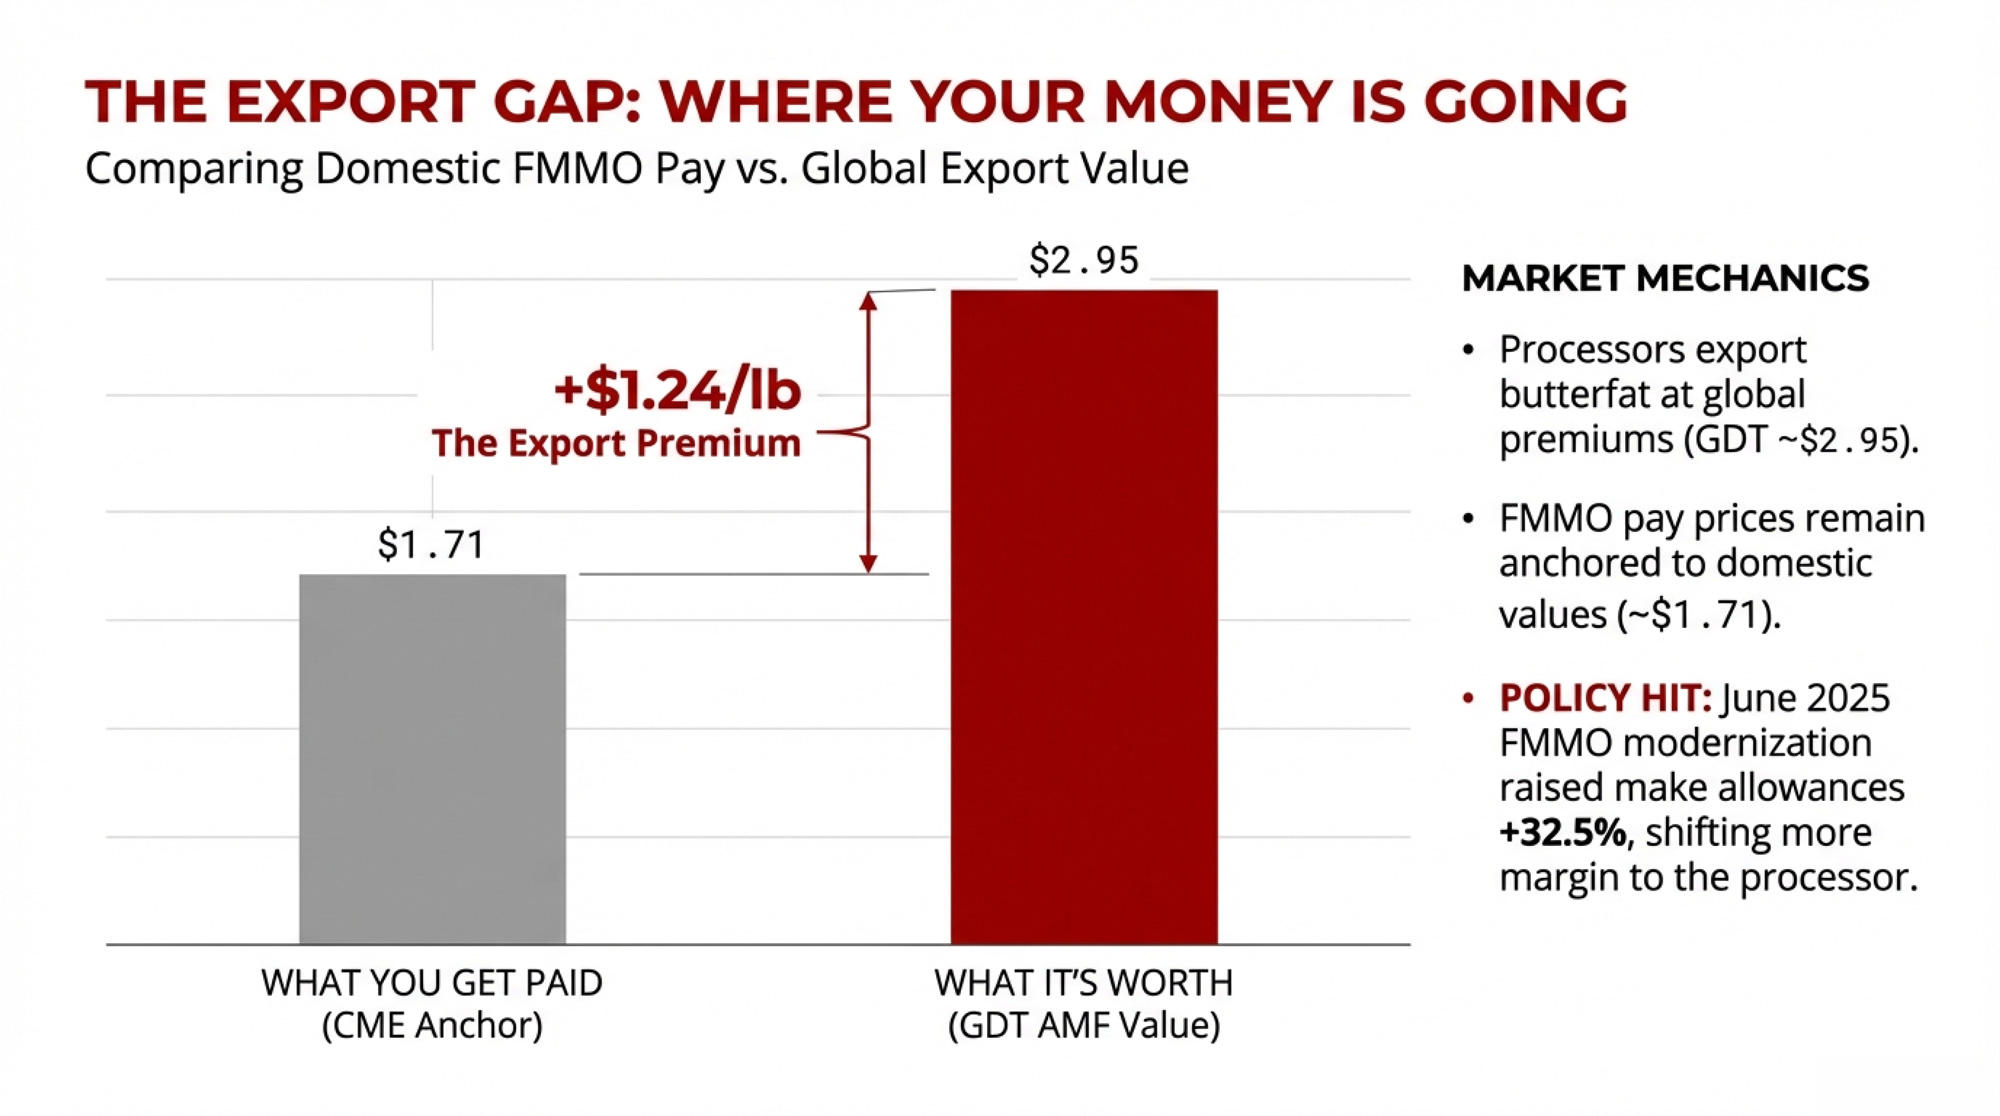
Nonfat dry milk surged 18¢ in a single week to settle at $1.64/lb on Friday, February 6 — the highest CME spot price since August 2022 and the strongest weekly gain since May 2007. That puts milk powder a full 16.75¢ above Cheddar blocks and within pennies of butter. For the first time in years, the product that the U.S. processing sector largely ignored is outpricing the one the entire industry was built around.

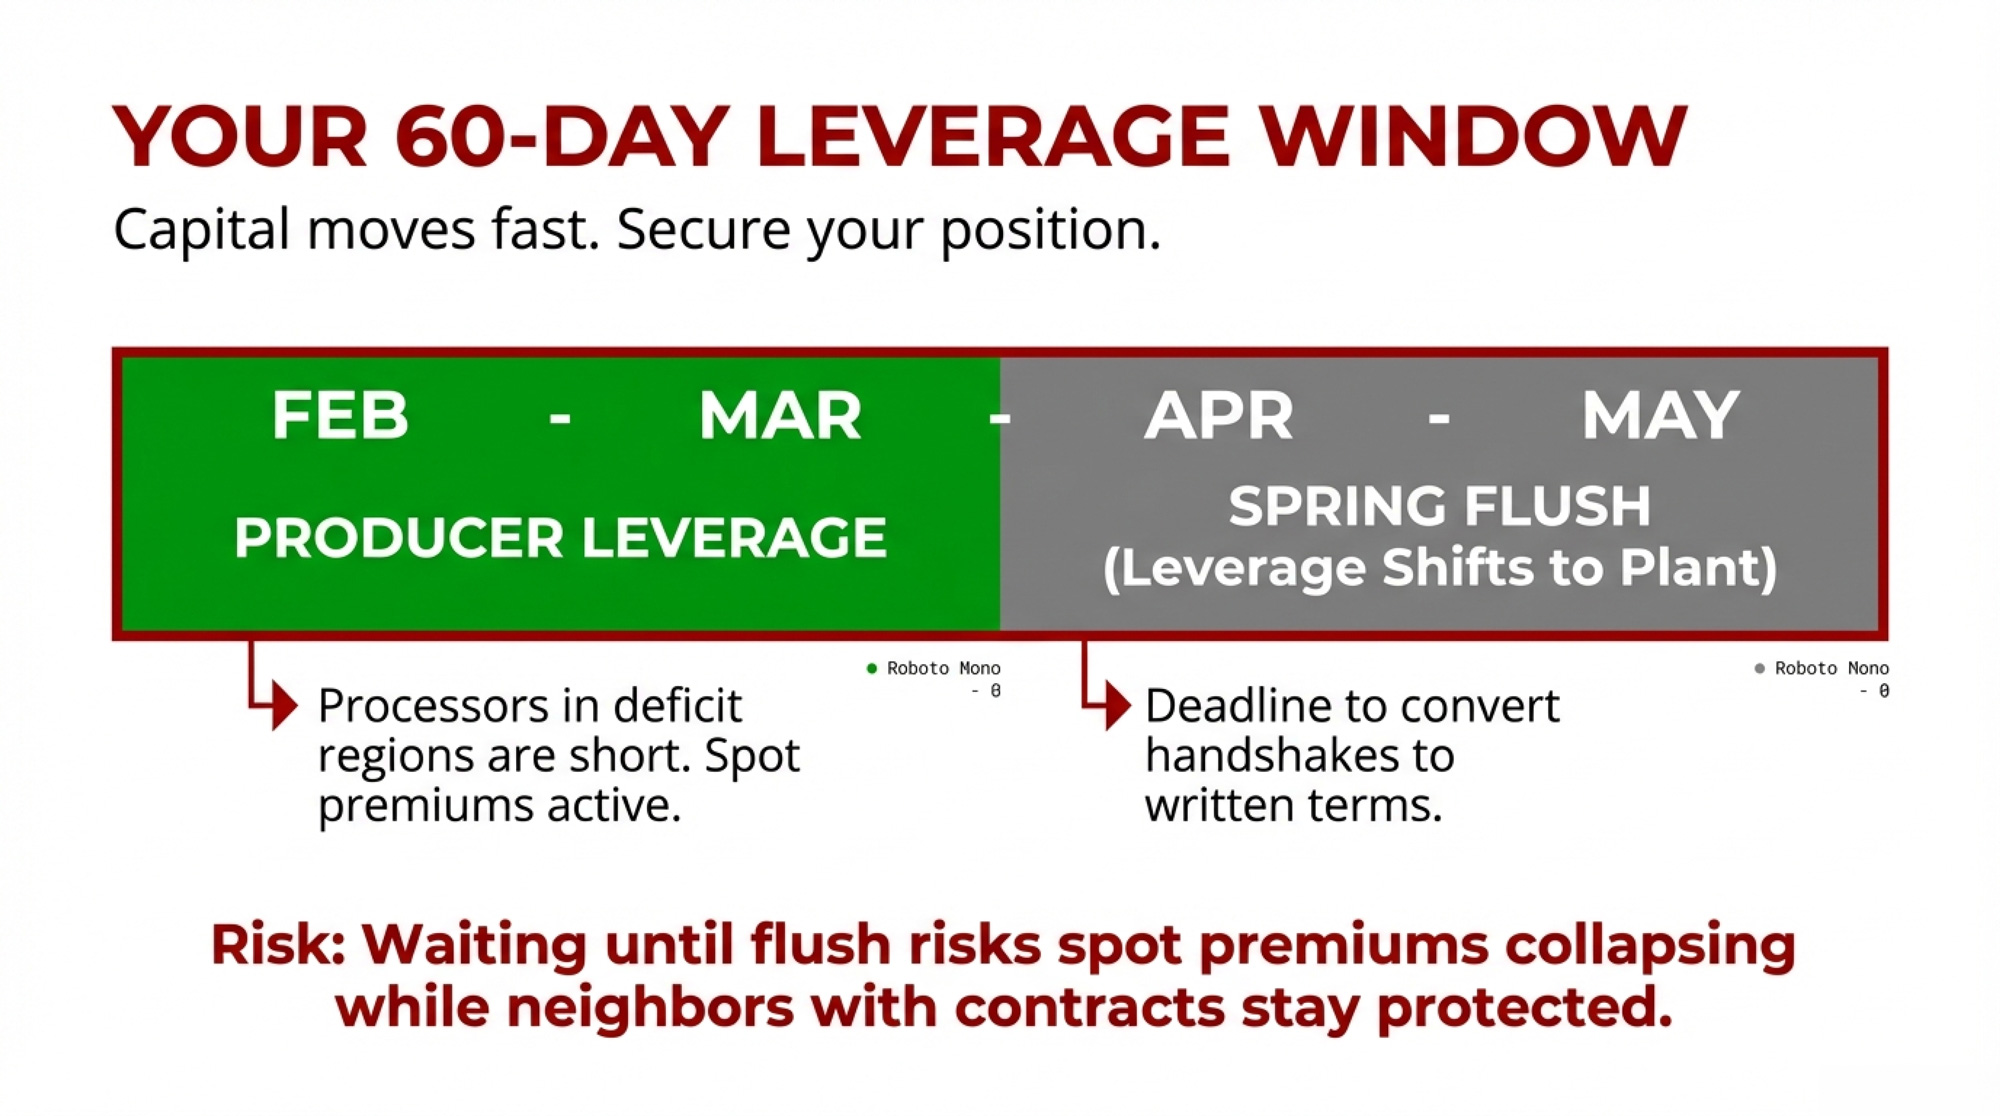
By Friday, MAR26 Class III futures were trading above $17/cwt through year-end, while Class IV — emboldened by surging NDM — was in the high $18s/cwt. DMC enrollment closes February 26. Just 17 days from today. Spring flush is six to eight weeks out.
Kevin Krentz, president of the Wisconsin Farm Bureau and a roughly 600-cow operator near Berlin, WI, knows what pool disadvantage feels like. He testified at the USDA Federal Milk Marketing Order hearing on August 31, 2023, that negative PPDs reached $9/cwt, costing his operation nearly $200,000 during the PPD crisis. The current Class III/IV spread is opening a similar gap — and the decisions you make about DRP coverage, component targets, and handler alignment right now determine which side of it you land on.
GDT Surges 6.7%: Powder and Mozzarella Lead a Clean Sweep
The Global Dairy Trade auction (TE397) on February 3 delivered a 6.7% jump in the price index — the third consecutive gain — with the average winning price firming to $3,830/MT across 24,034 tonnes sold and 175 bidders participating. SMP leapt 10.6% to $2,874/MT, and mozzarella matched it at +10.6% to $3,694/MT. Those two categories matter most for U.S. powder and cheese pricing.

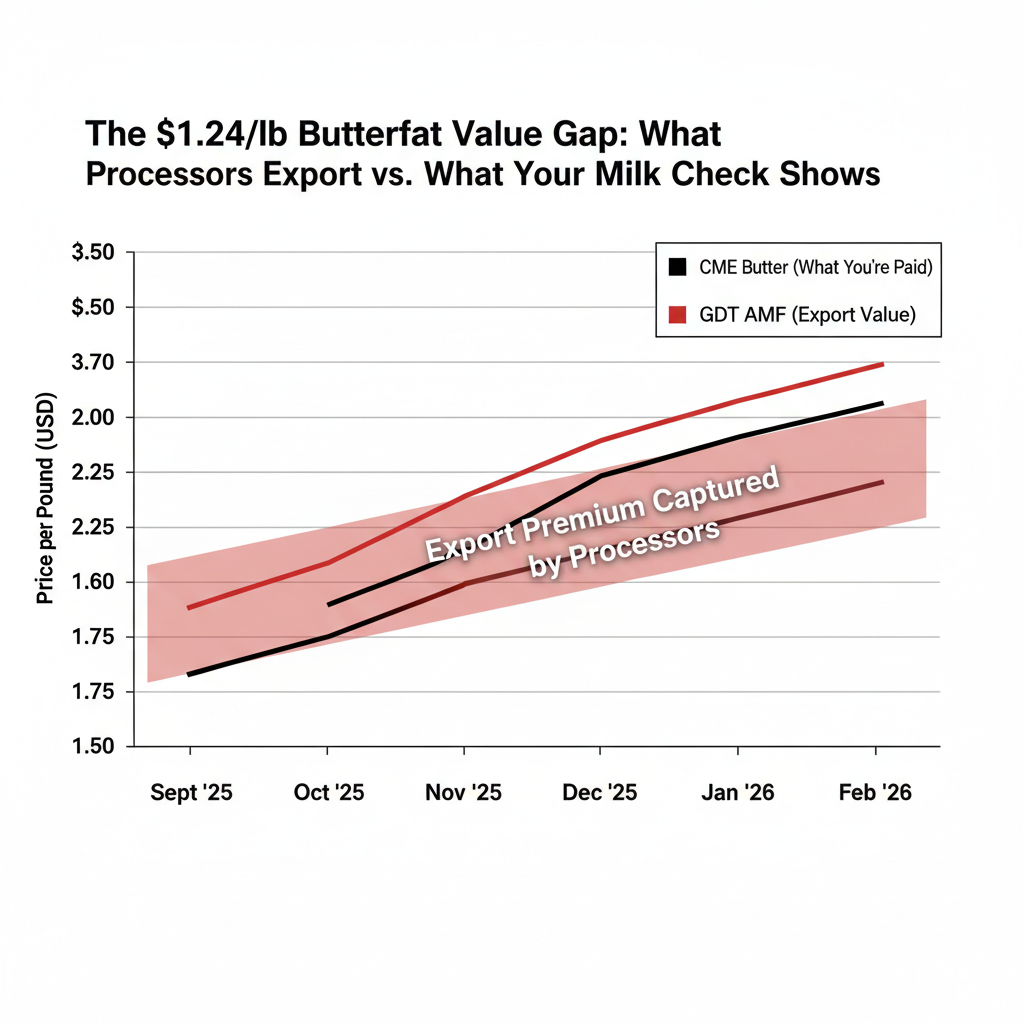
Butter surged 8.8% to $5,773/MT, with Solarec’s Belgian C2 butter hitting $4,950 — up 9.6% from two weeks ago. AMF gained 5.0% to $6,524, WMP rose 5.3% to $3,614, cheddar added 3.8% to $4,772, and lactose ticked up 1.5% to $1,410. Trade commentary attributed part of the rally to Chinese restocking ahead of the Lunar New Year and seasonal MENA demand ahead of Ramadan, though GDT doesn’t disclose buyer-country data.
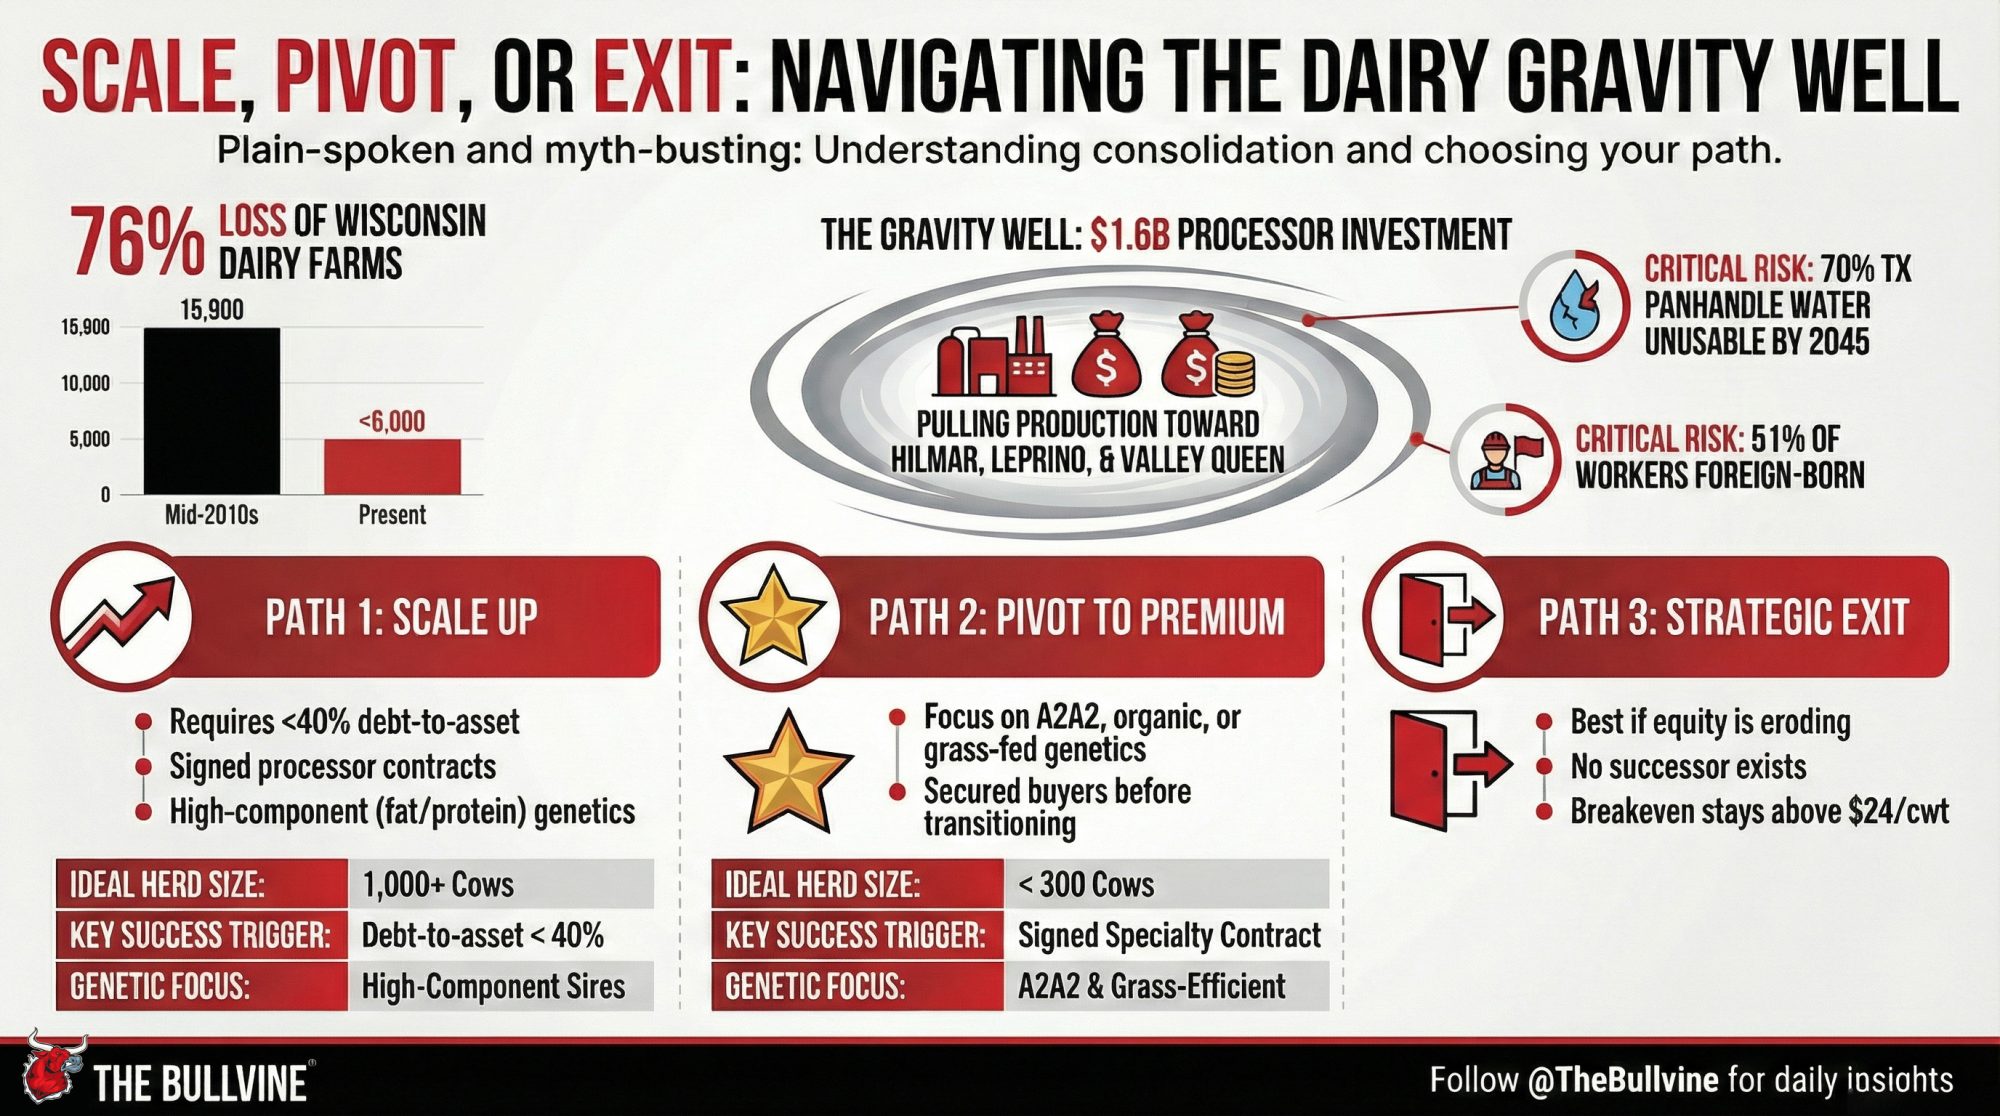
Phil Plourd, president of Ever.Ag Insights, framed the broader landscape bluntly in a report on industry consolidation trends: “It is a street fight, in terms of figuring out ways to stay relevant, to get more productive, to stay ahead of the curve, to manage risk better, because it’s never been an easy business. It’s not going to be an easy business anytime soon”.
EEX and SGX Confirm the Bid: 16,631 Tonnes Traded
The rally wasn’t just a GDT event. On EEX, 5,365 tonnes (1,073 lots) traded last week, with butter futures firming 10.7% on the Feb26–Sep26 strip to an average of €4,730 and SMP jumping 9.4% to €2,605. Only whey pulled back — down 1.8% to €1,019.
SGX told the same story: 11,266 lots traded, with WMP up 8.6% to $3,791 and SMP up 11.0% to $3,298 on their Jan26–Aug26 curves. AMF settled at $6,281 (+6.3%) and butter at $5,664 (+7.3%). The NZX milk price futures contract moved 1,763 lots — 10,578,000 kgMS — suggesting New Zealand producers are actively pricing forward at these levels. Powders led the rally on both exchanges. That confirms the GDT signal isn’t isolated.
European Market Snapshot: Powder Rallies, Butter, and Cheese Correct
European spot and futures markets pulled in opposite directions last week — and that divergence is the story worth watching.
| Product | Current Index | Weekly Chg | Y/Y Chg |
| Butter | €3,933 | −0.9% | −46.6% |
| SMP | €2,247 | +4.4% | −10.6% |
| Whey | €999 | Flat | +12.5% |
| WMP | €3,065 | −0.3% | −30.0% |
| Cheddar Curd | €3,222 | −1.4% | −33.1% |
| Mild Cheddar | €3,248 | −0.1% | −31.9% |
| Young Gouda | €3,059 | +1.1% | −29.0% |
| Mozzarella | €3,098 | +2.6% | −24.0% |
EU Weekly Quotation, 4 February 2026. Country splits tell the story: German butter unchanged at €4,050; Dutch butter +€50 to €3,950; French butter −€160 to €3,800. SMP: German +€90 to €2,250; French +€70 to €2,200; Dutch +€120 to €2,290.
That 46.6% year-over-year drop in EU butter tells you how inflated 2025 prices were — not how weak 2026 prices are. SMP moving in the opposite direction, with all three country quotations gaining, mirrors the global powder bid.
Every cheese index sits 24% to 33% below year-ago levels. That’s a massive compression European processors are still absorbing — and it’s keeping EU cheese competitively priced on global markets.
Global Supply: Butter Growing, Powder Capacity Isn’t
European and Irish butter supplies are expanding. Powder capacity outside the U.S. isn’t growing fast enough to fill the gap that GDT just priced in.
Ireland’s provisional December collections came in at 267kt, down 3.0% y/y — the second consecutive monthly contraction. But full-year 2025 totalled 9.10 million tonnes, up 5.0% y/y, with milksolids up 5.5% on stronger fat (4.93%) and protein (3.85%). Irish butter production for 2025 hit 286kt, up 7.1%.
Spain posted a decent December at 624kt (+1.8% y/y), but the full-year picture is flat — down 0.2%. UK butter production jumped 6.6% in December to 15.4kt, and total cheese production rose 3.4% to 42.4kt. Full-year butter hit 199kt (+2.1%), and cheese reached 513kt (+2.9%).
China’s farmgate price edged to 3.04 Yuan/kg in late January — up just 0.2% month-over-month and still 2.8% below last year. The Ministry noted that collections growth was driven by per-cow productivity, not herd expansion, with less productive cows culled. With Lunar New Year stocking mostly behind us, the question now is whether post-holiday Chinese buying holds — or if TE397 was the peak.
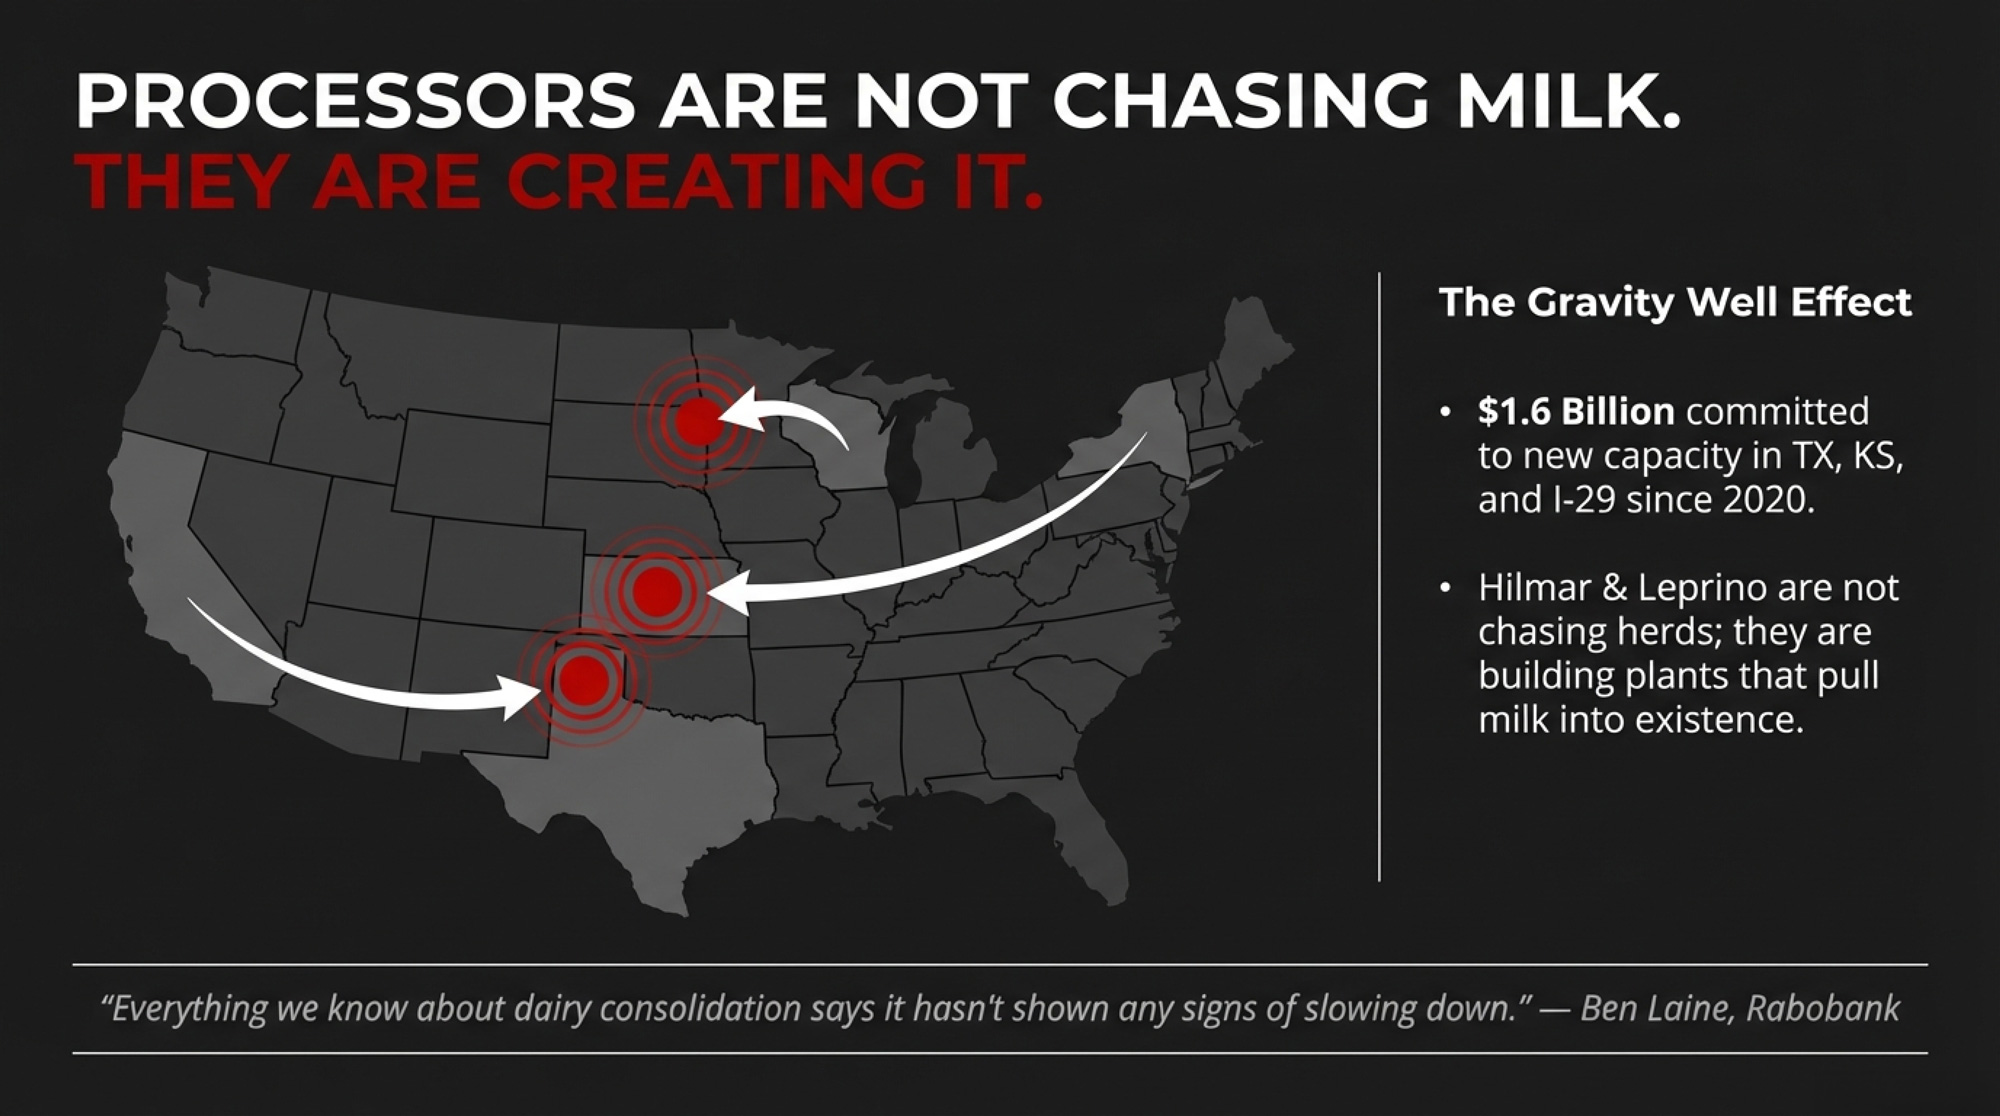
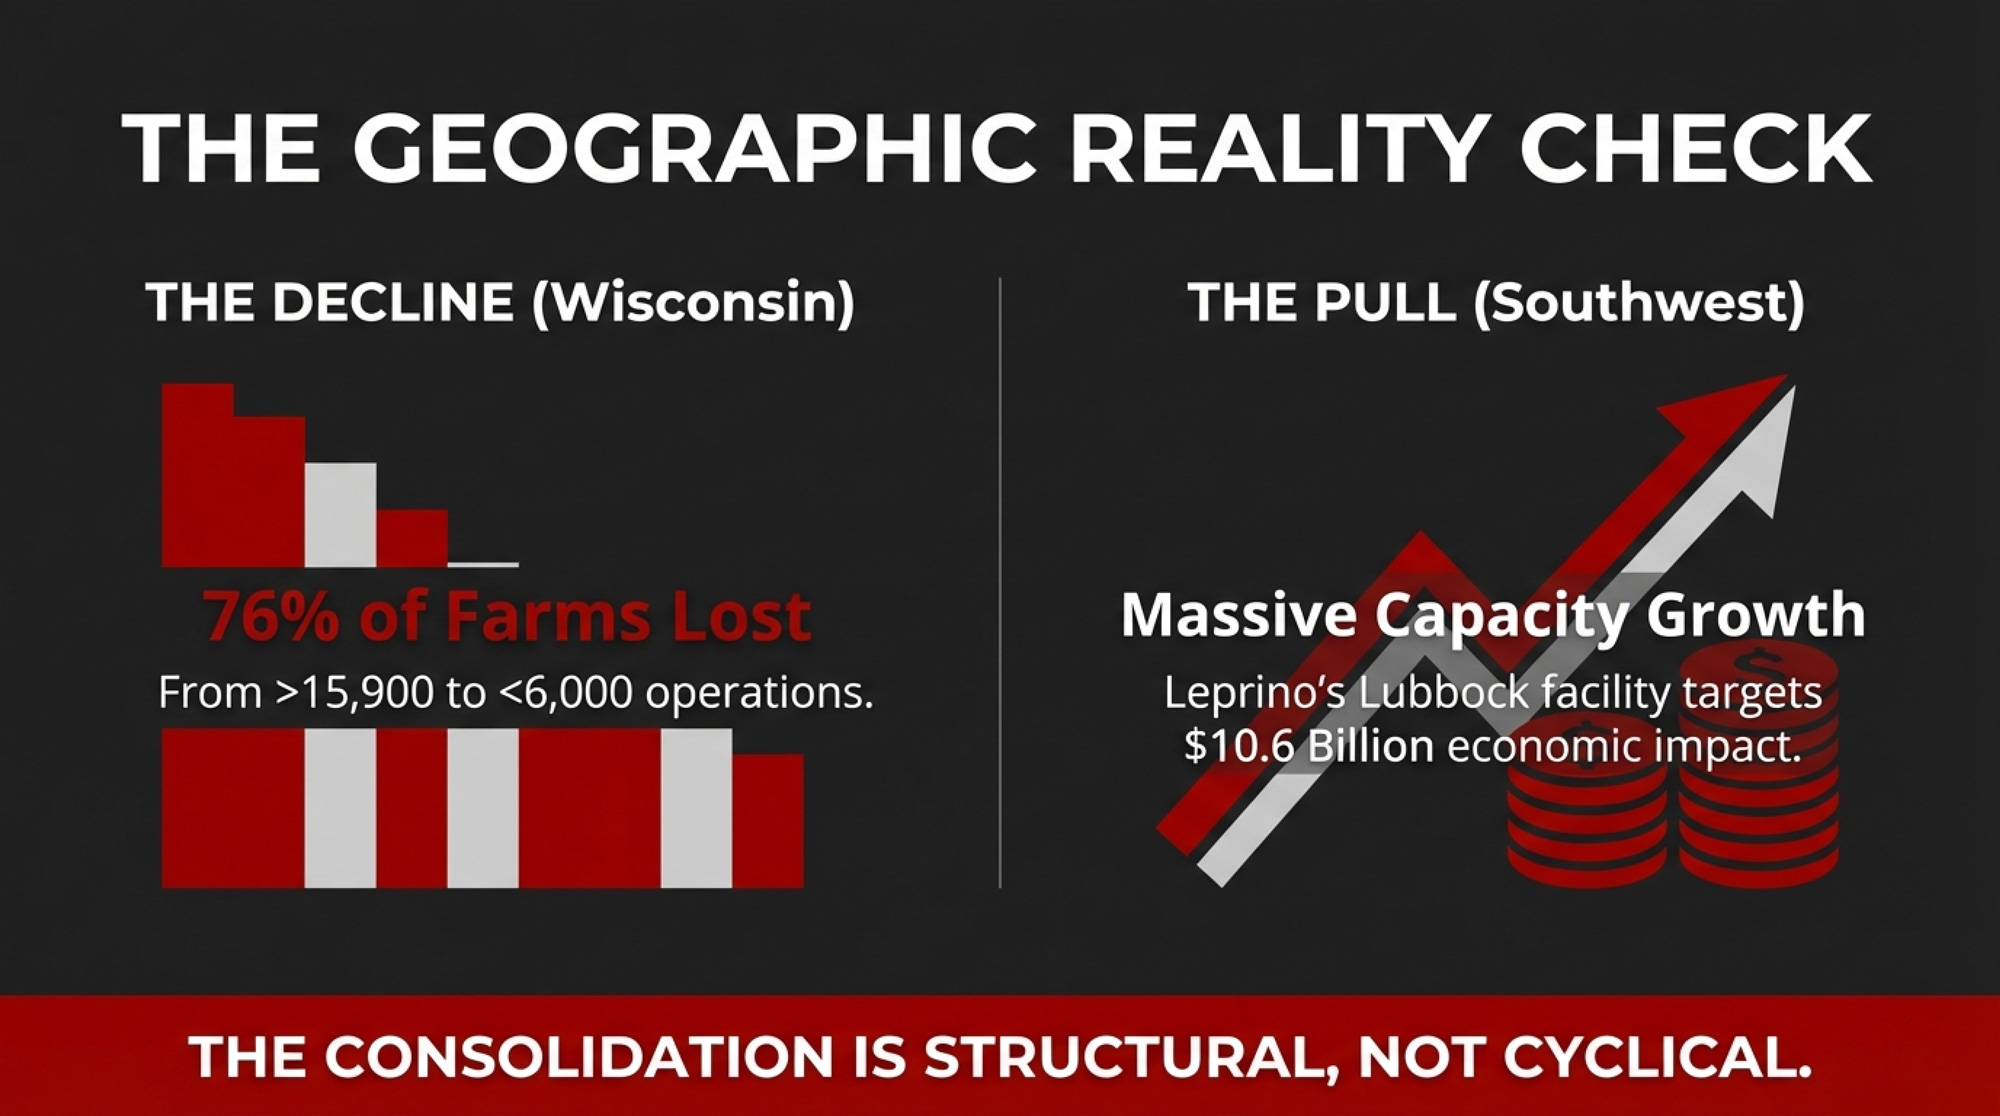
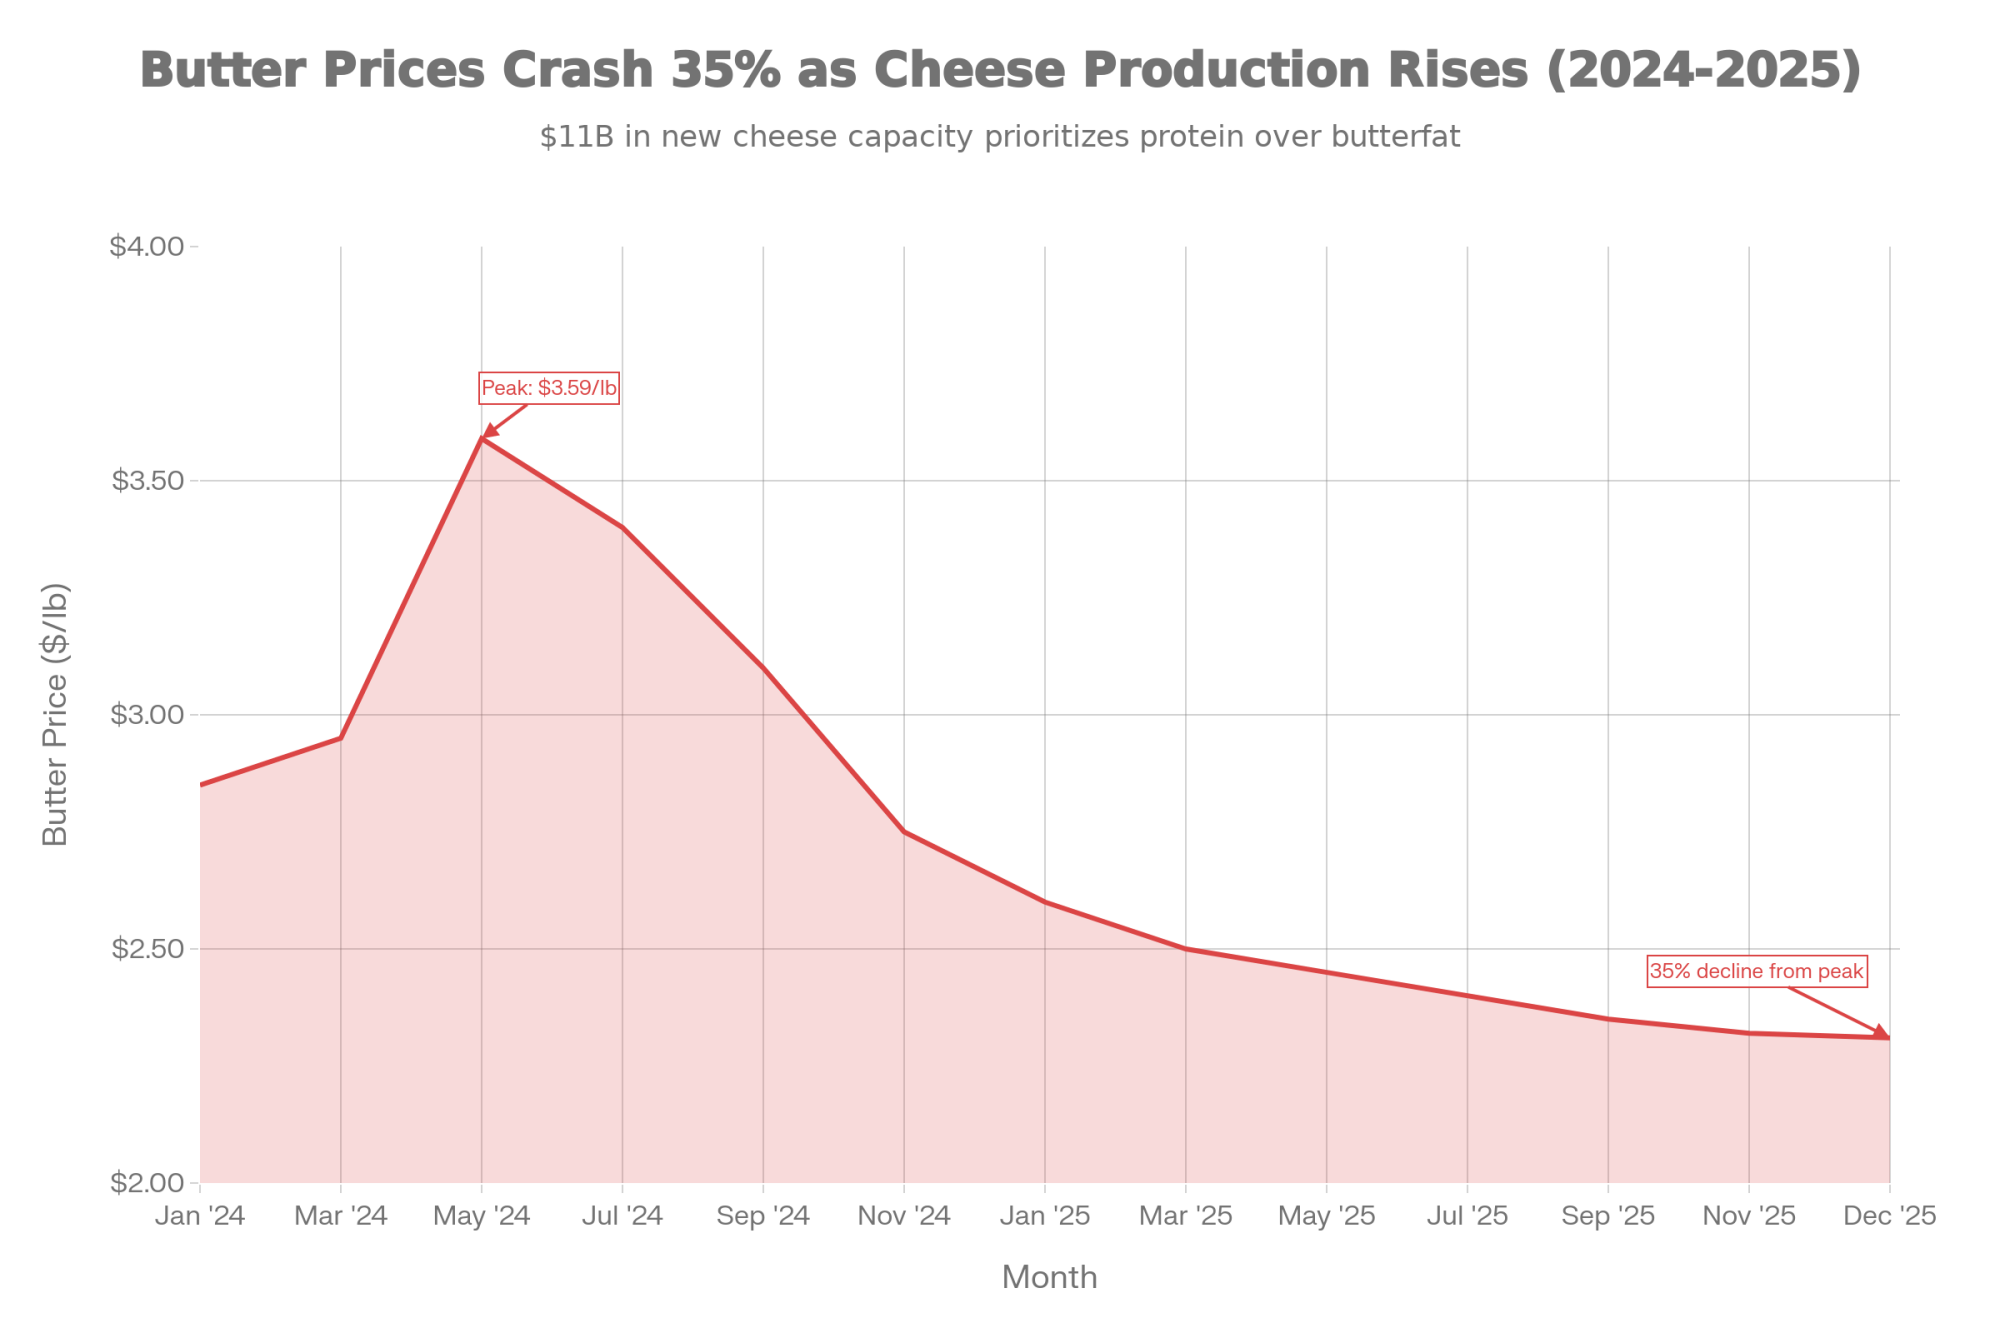
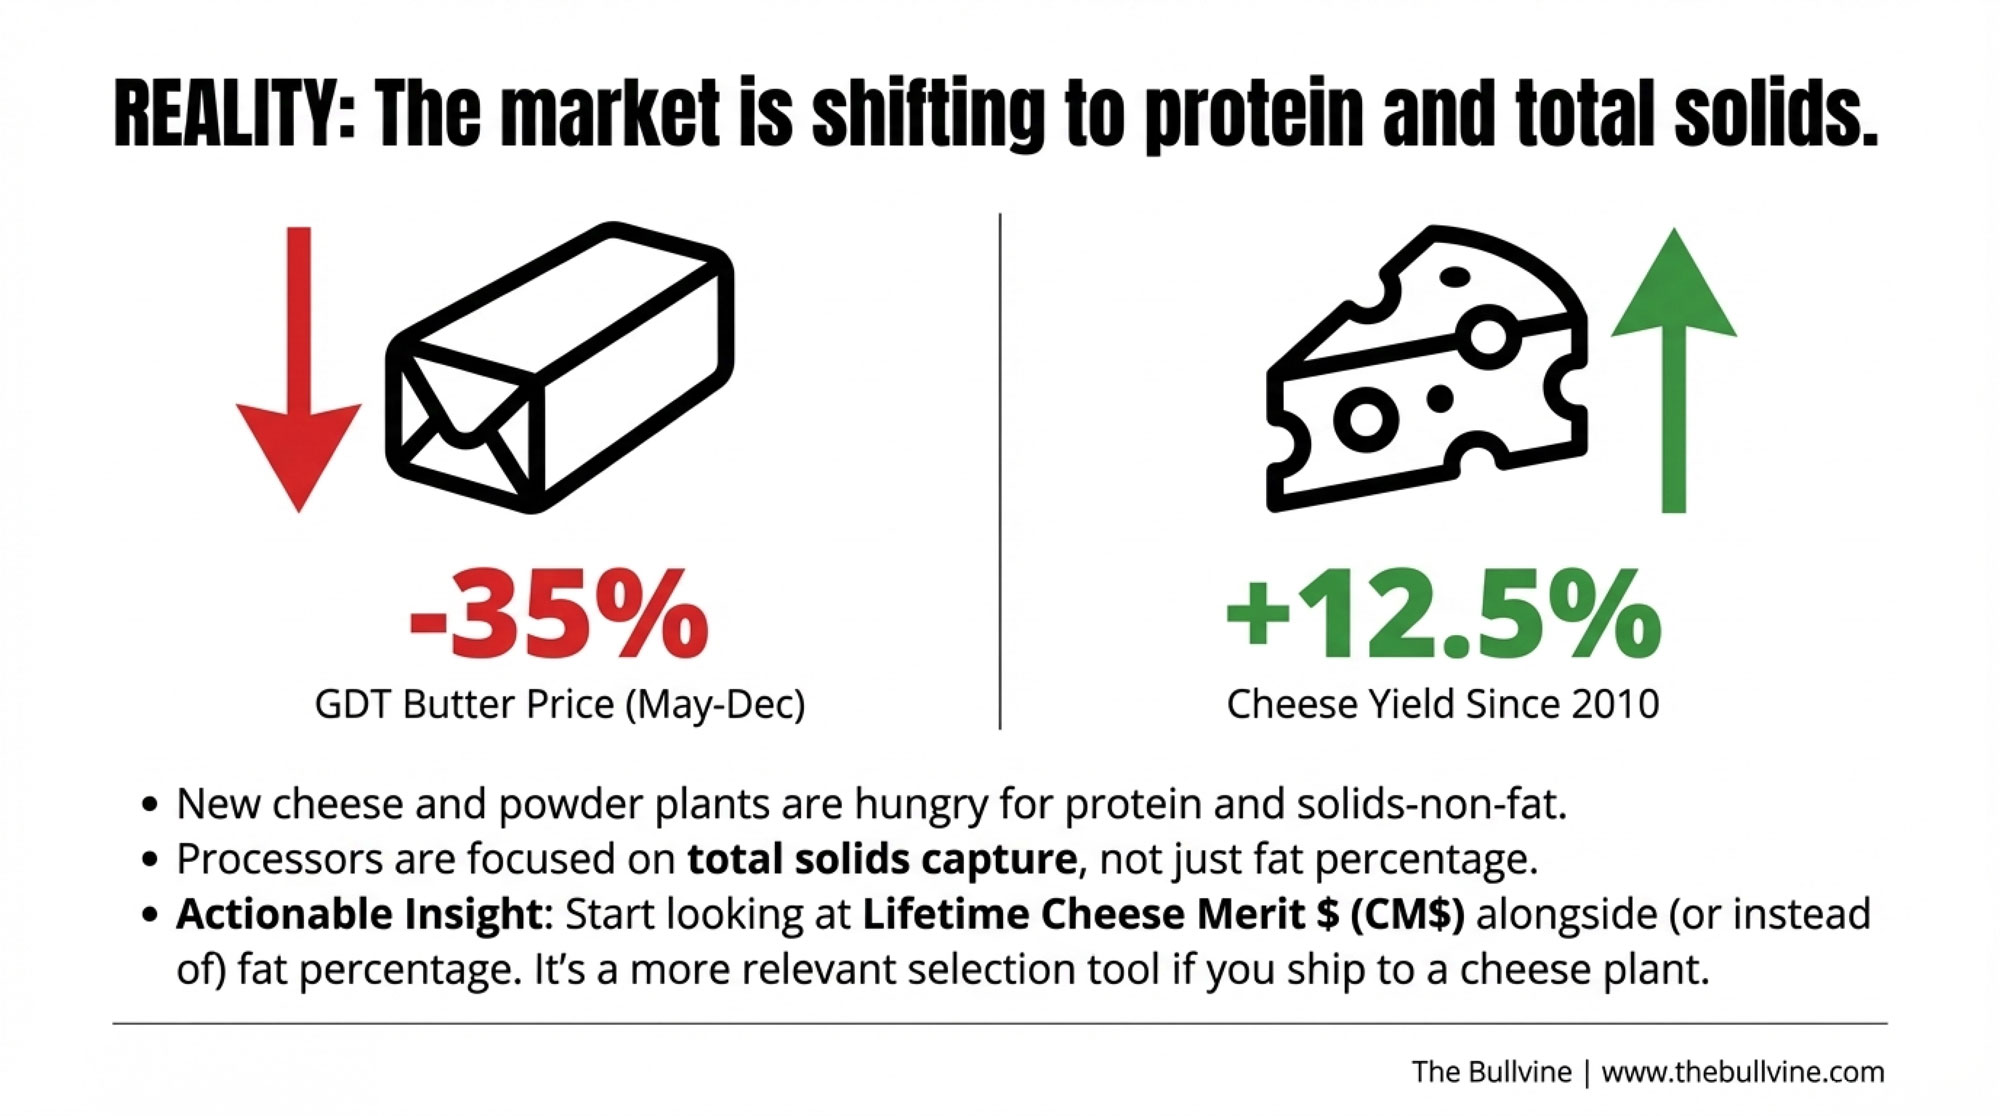
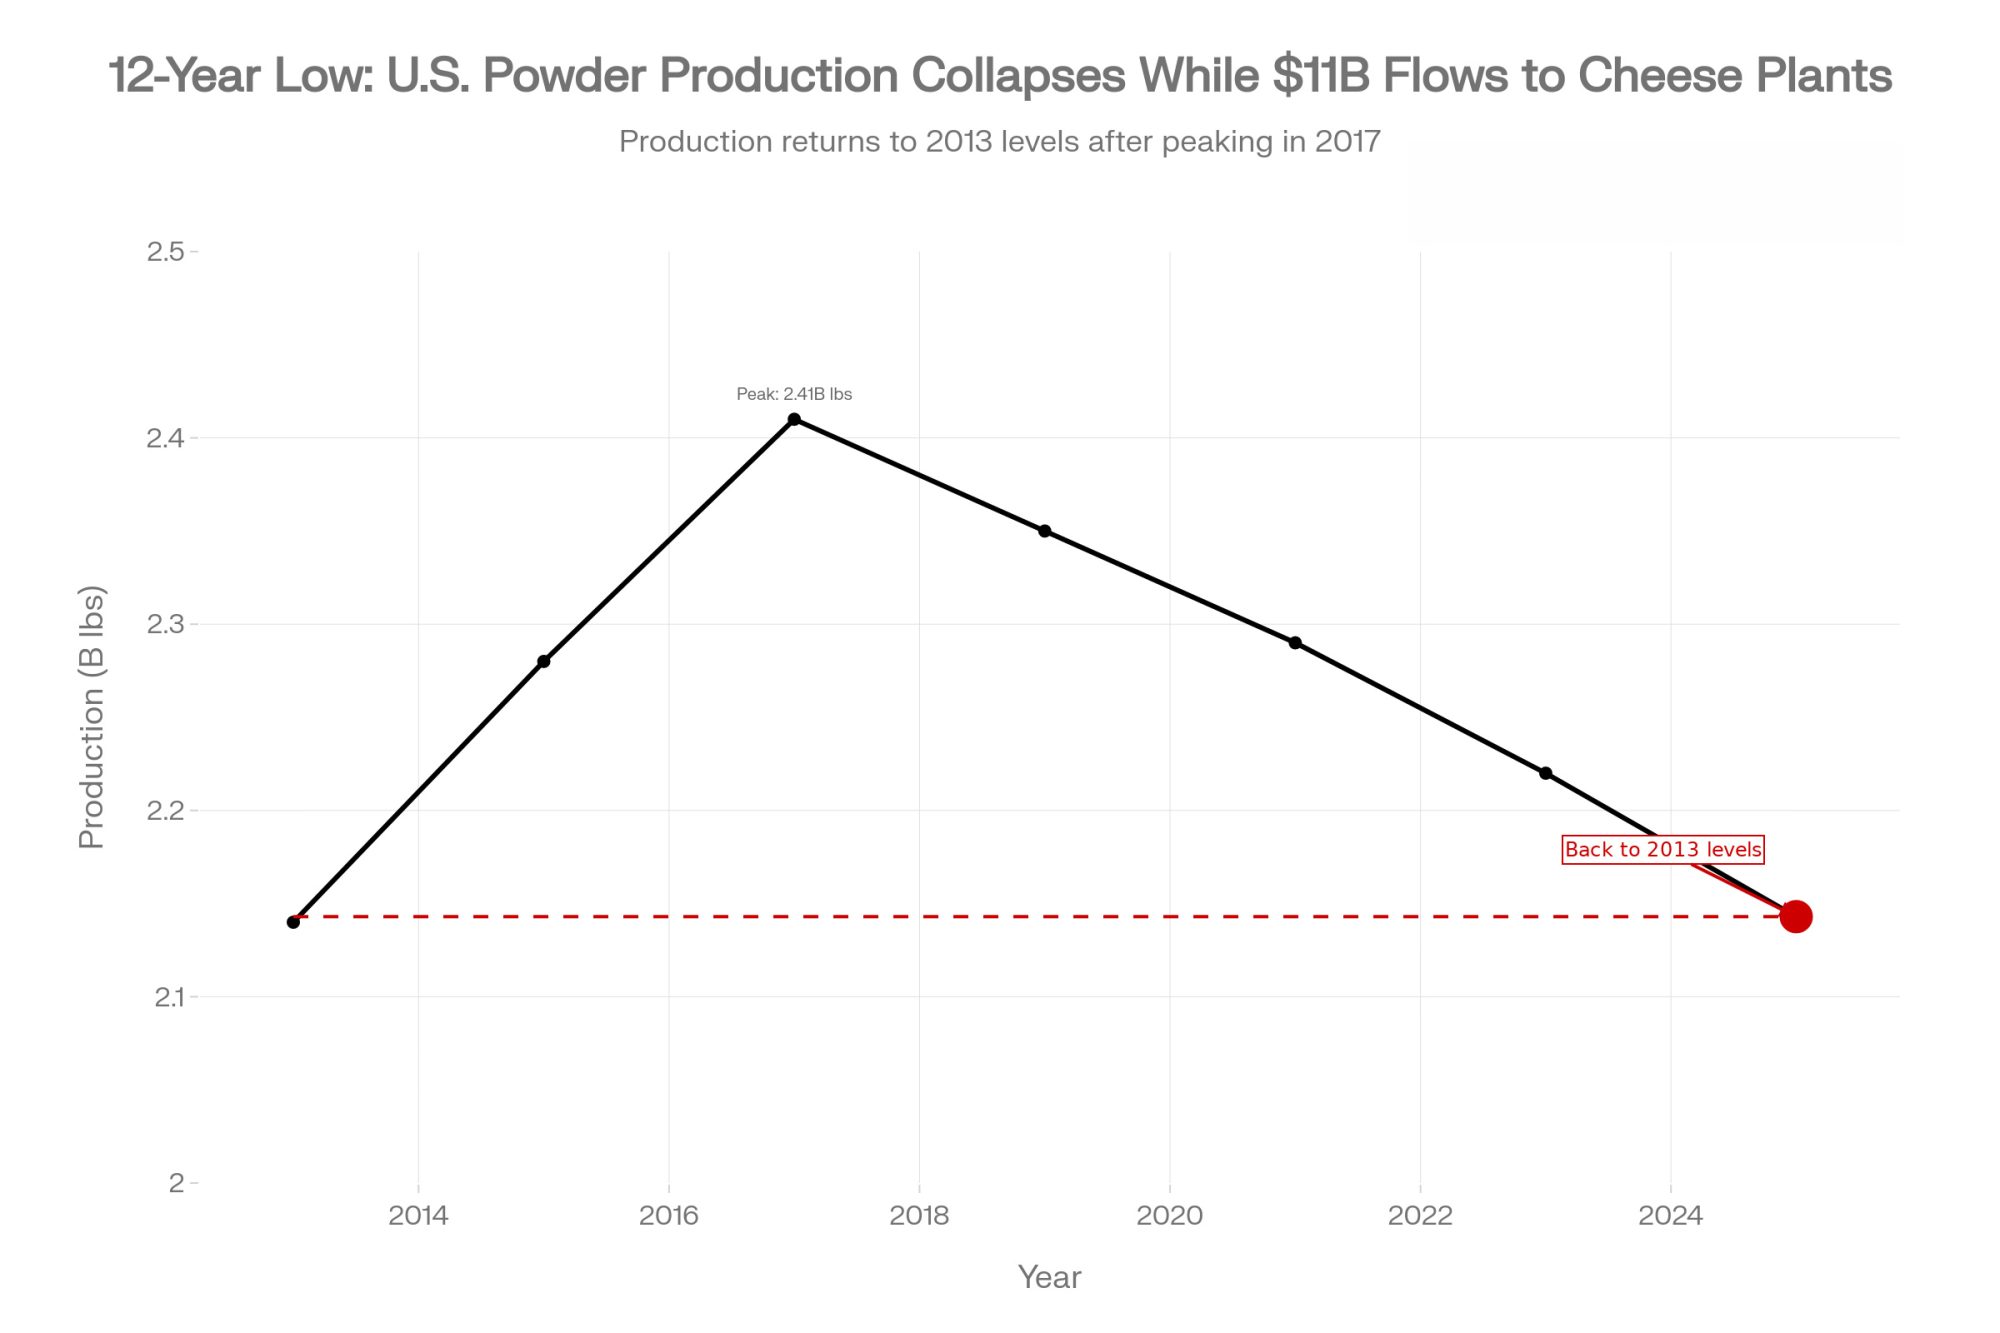
$11 Billion Went to Cheese. Now, Powder Is Short.
Powder got scarce because the industry was built for cheese, not because the world suddenly needed more milk powder.
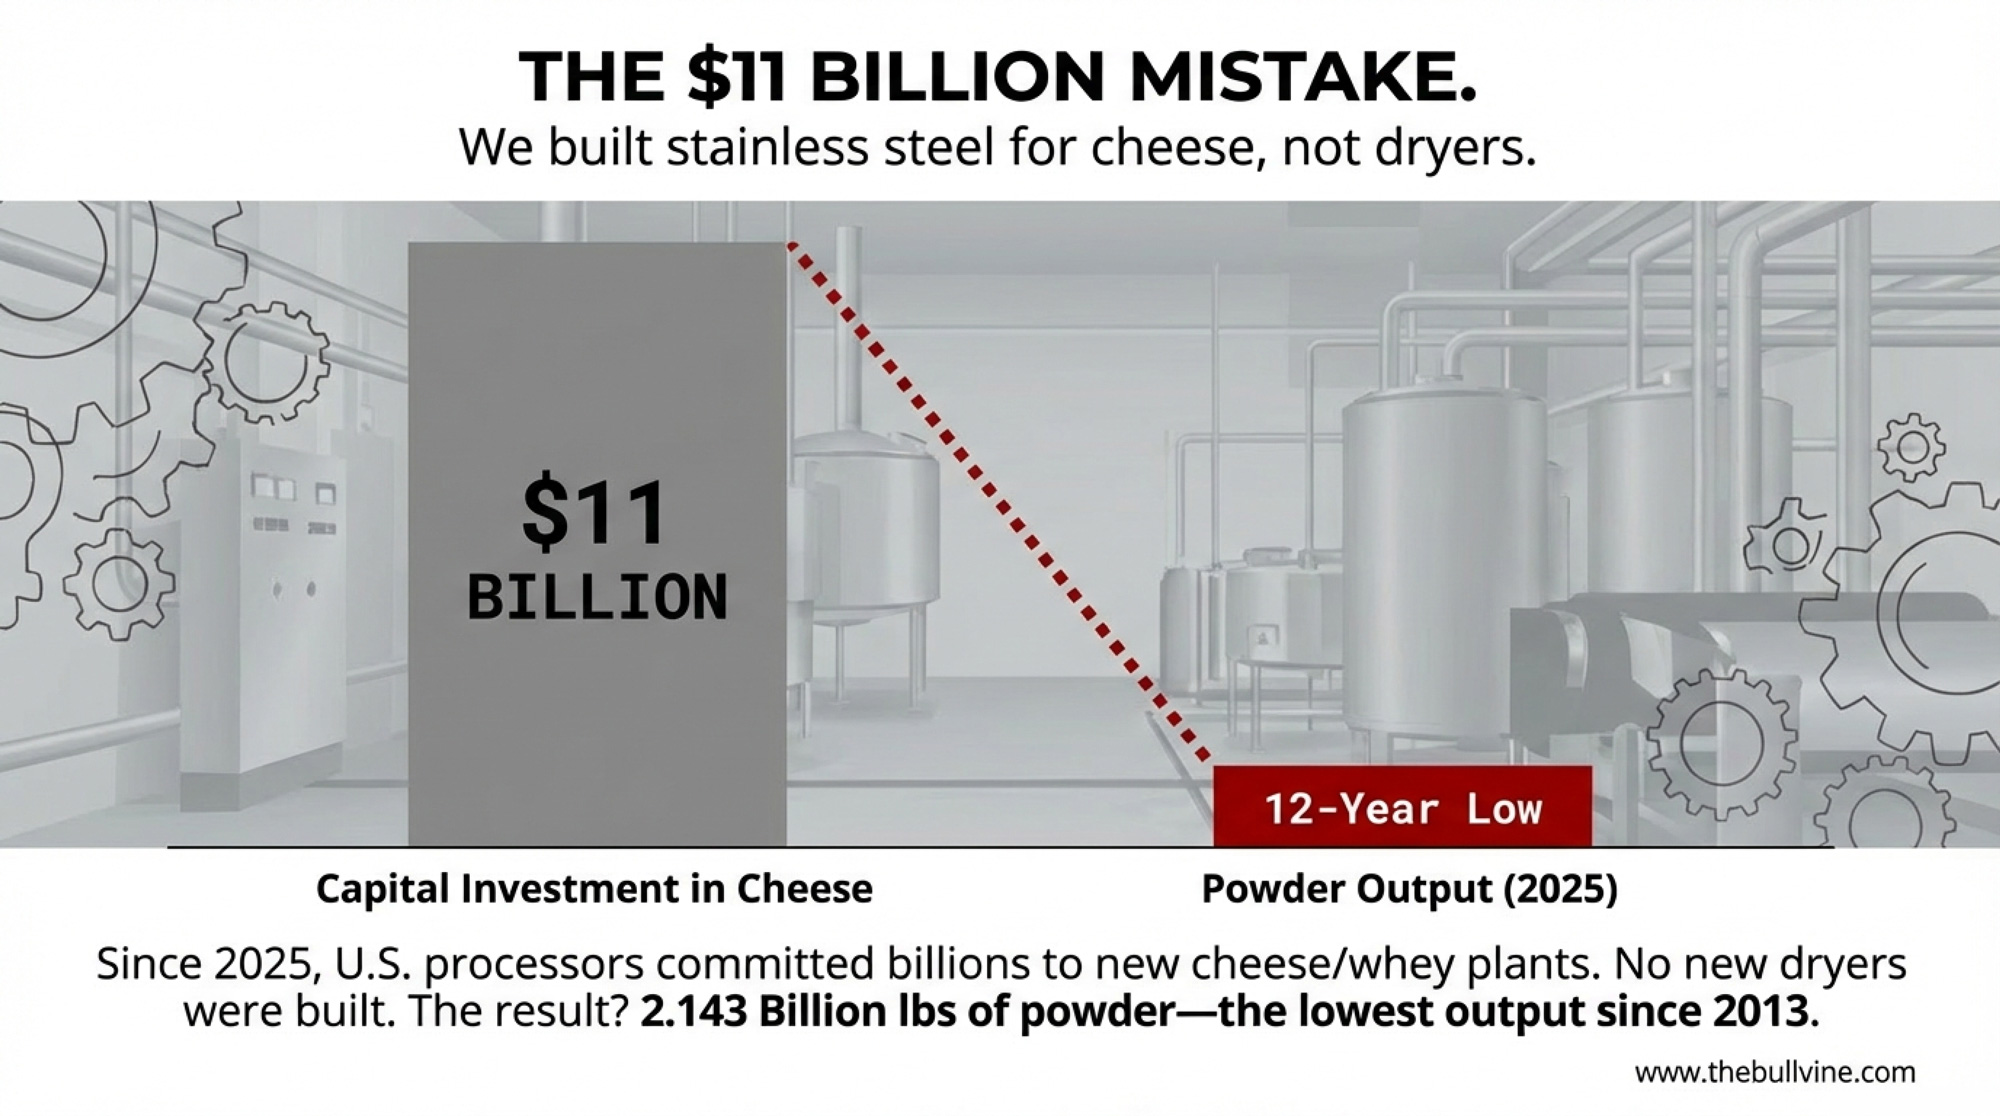
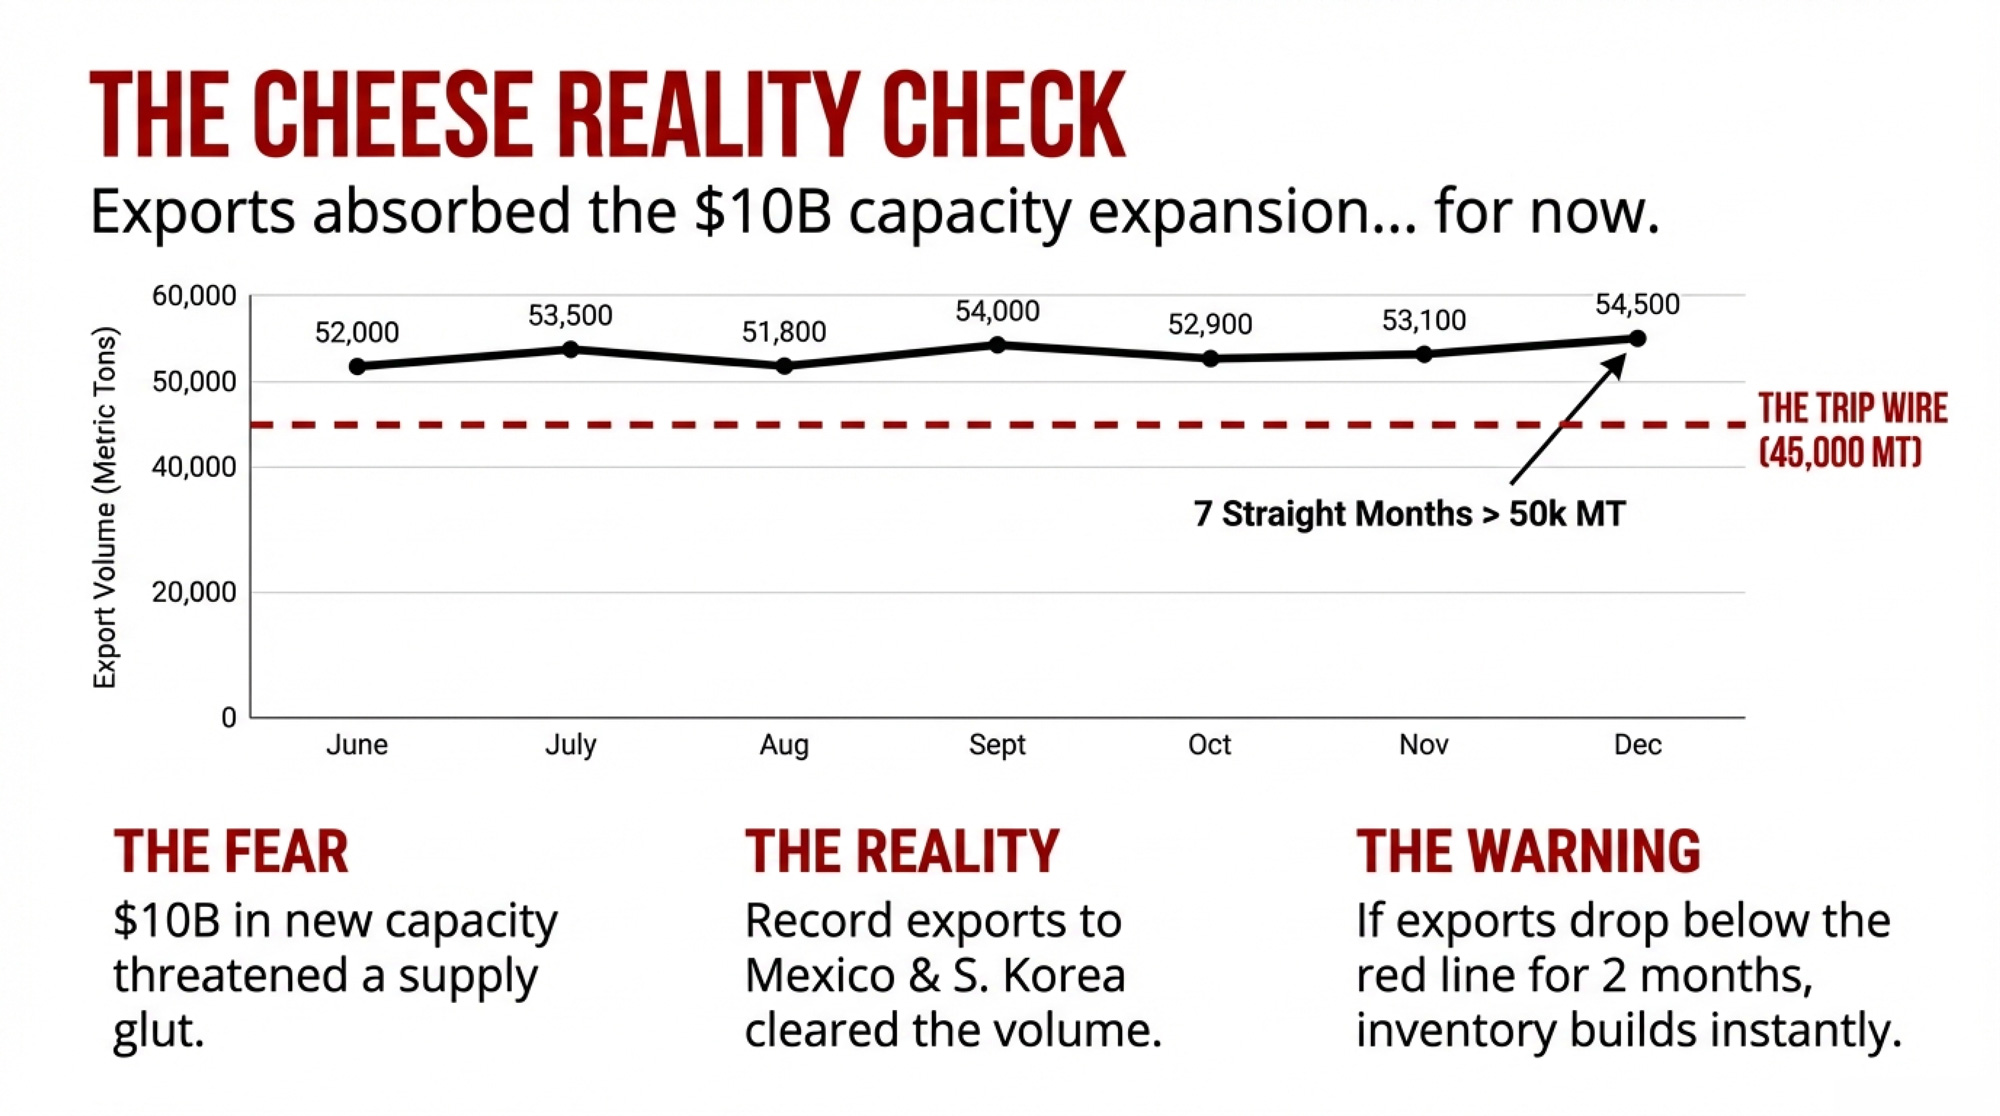
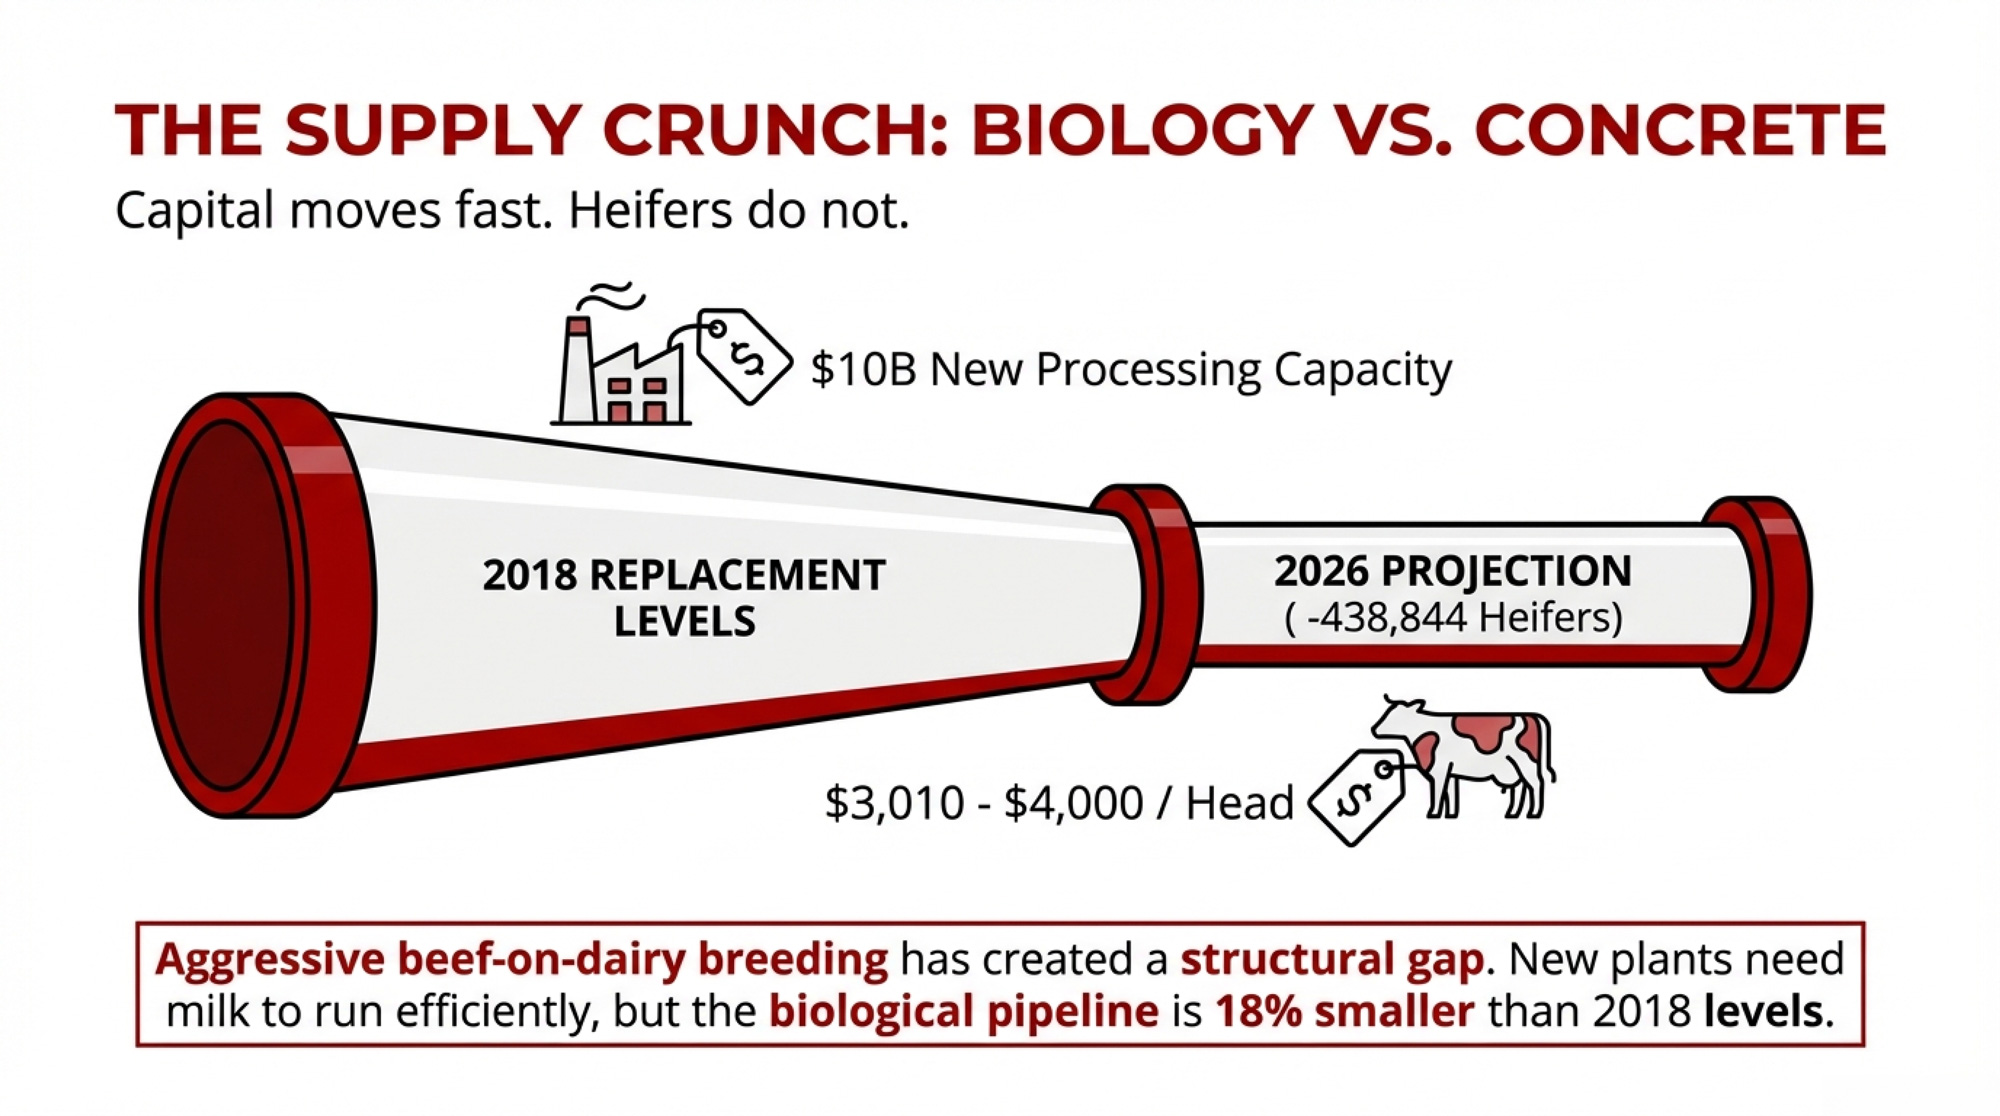
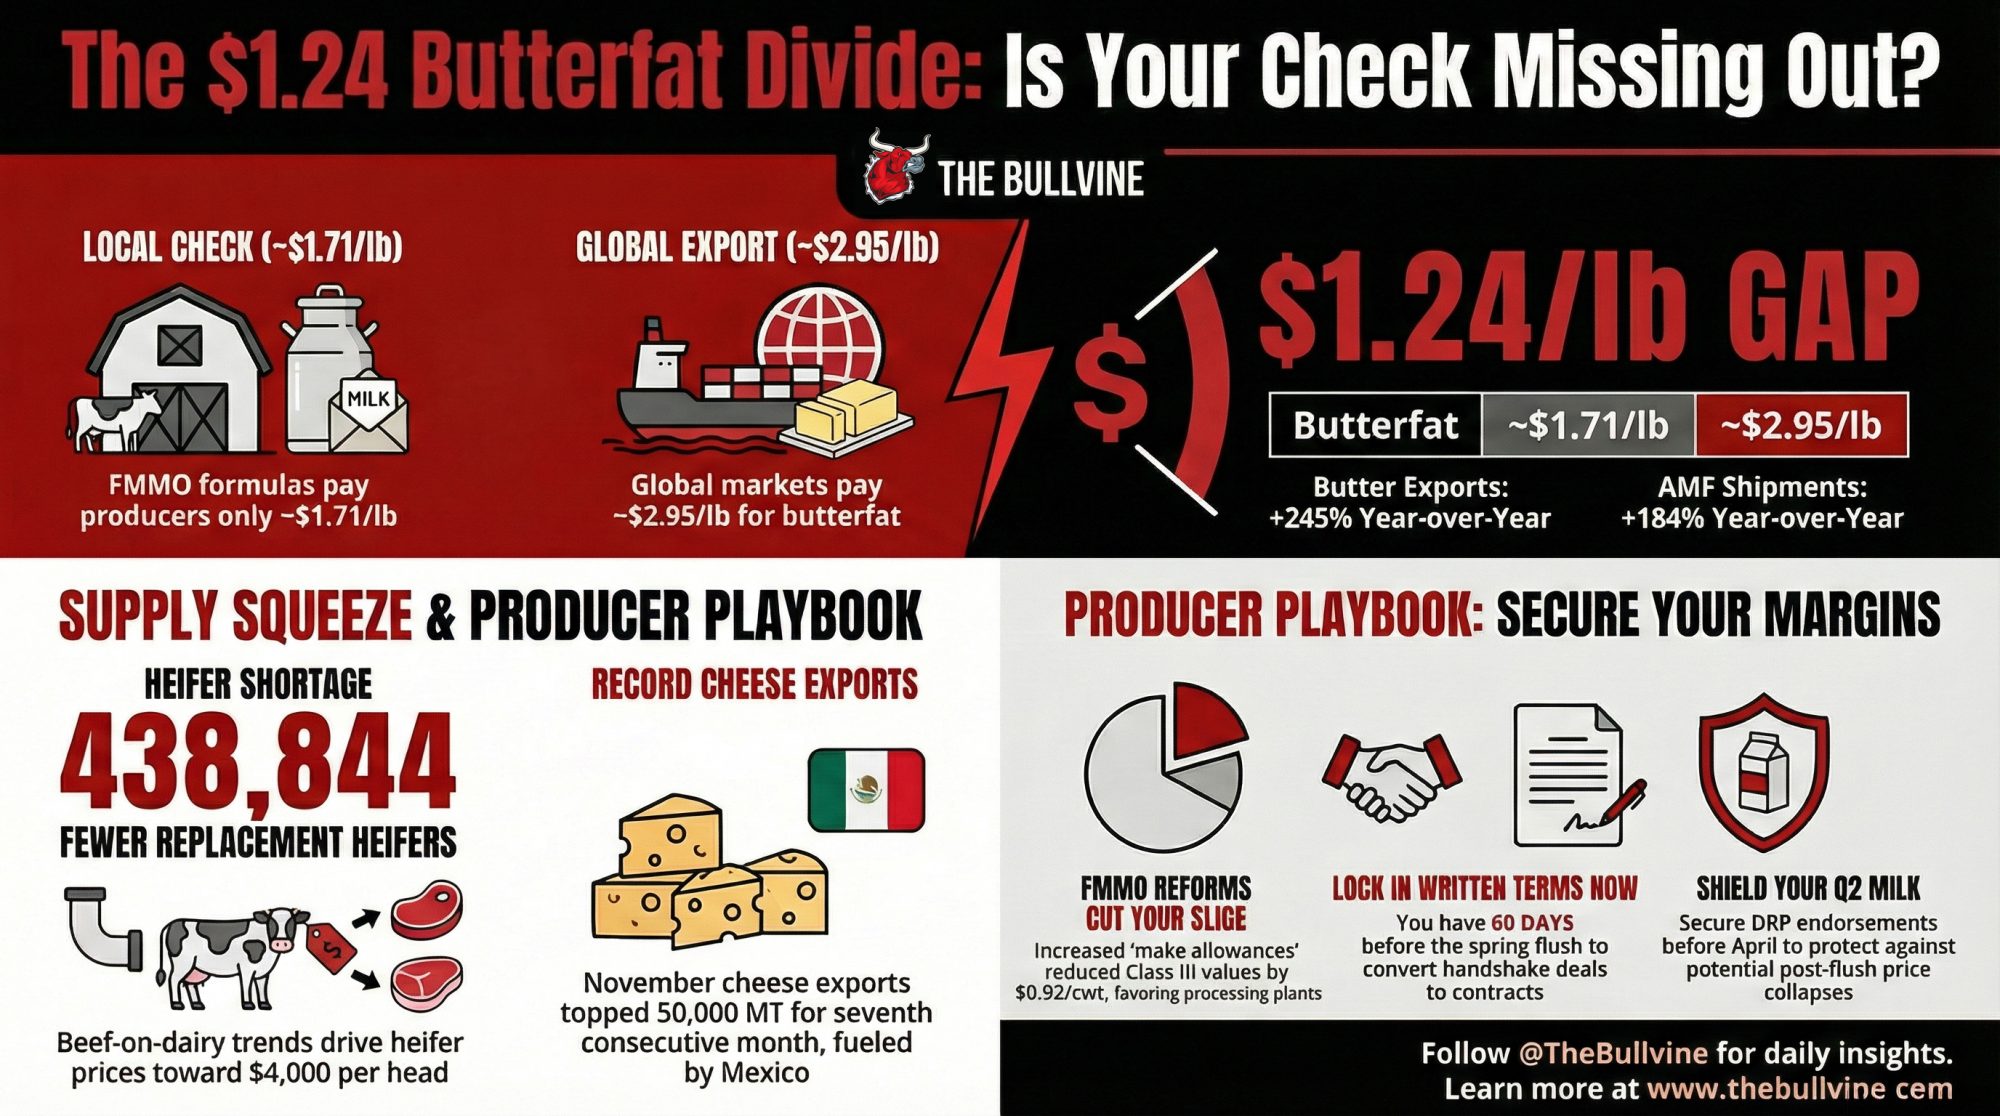
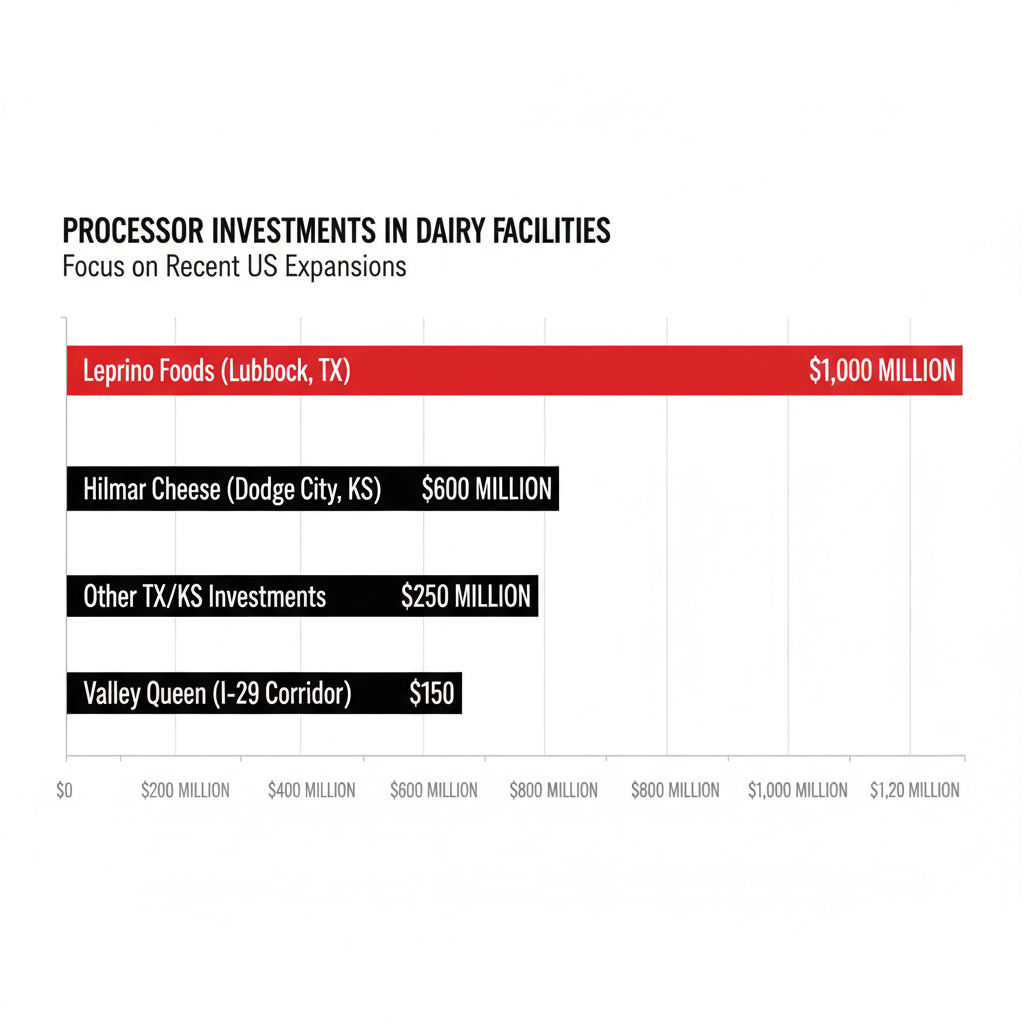
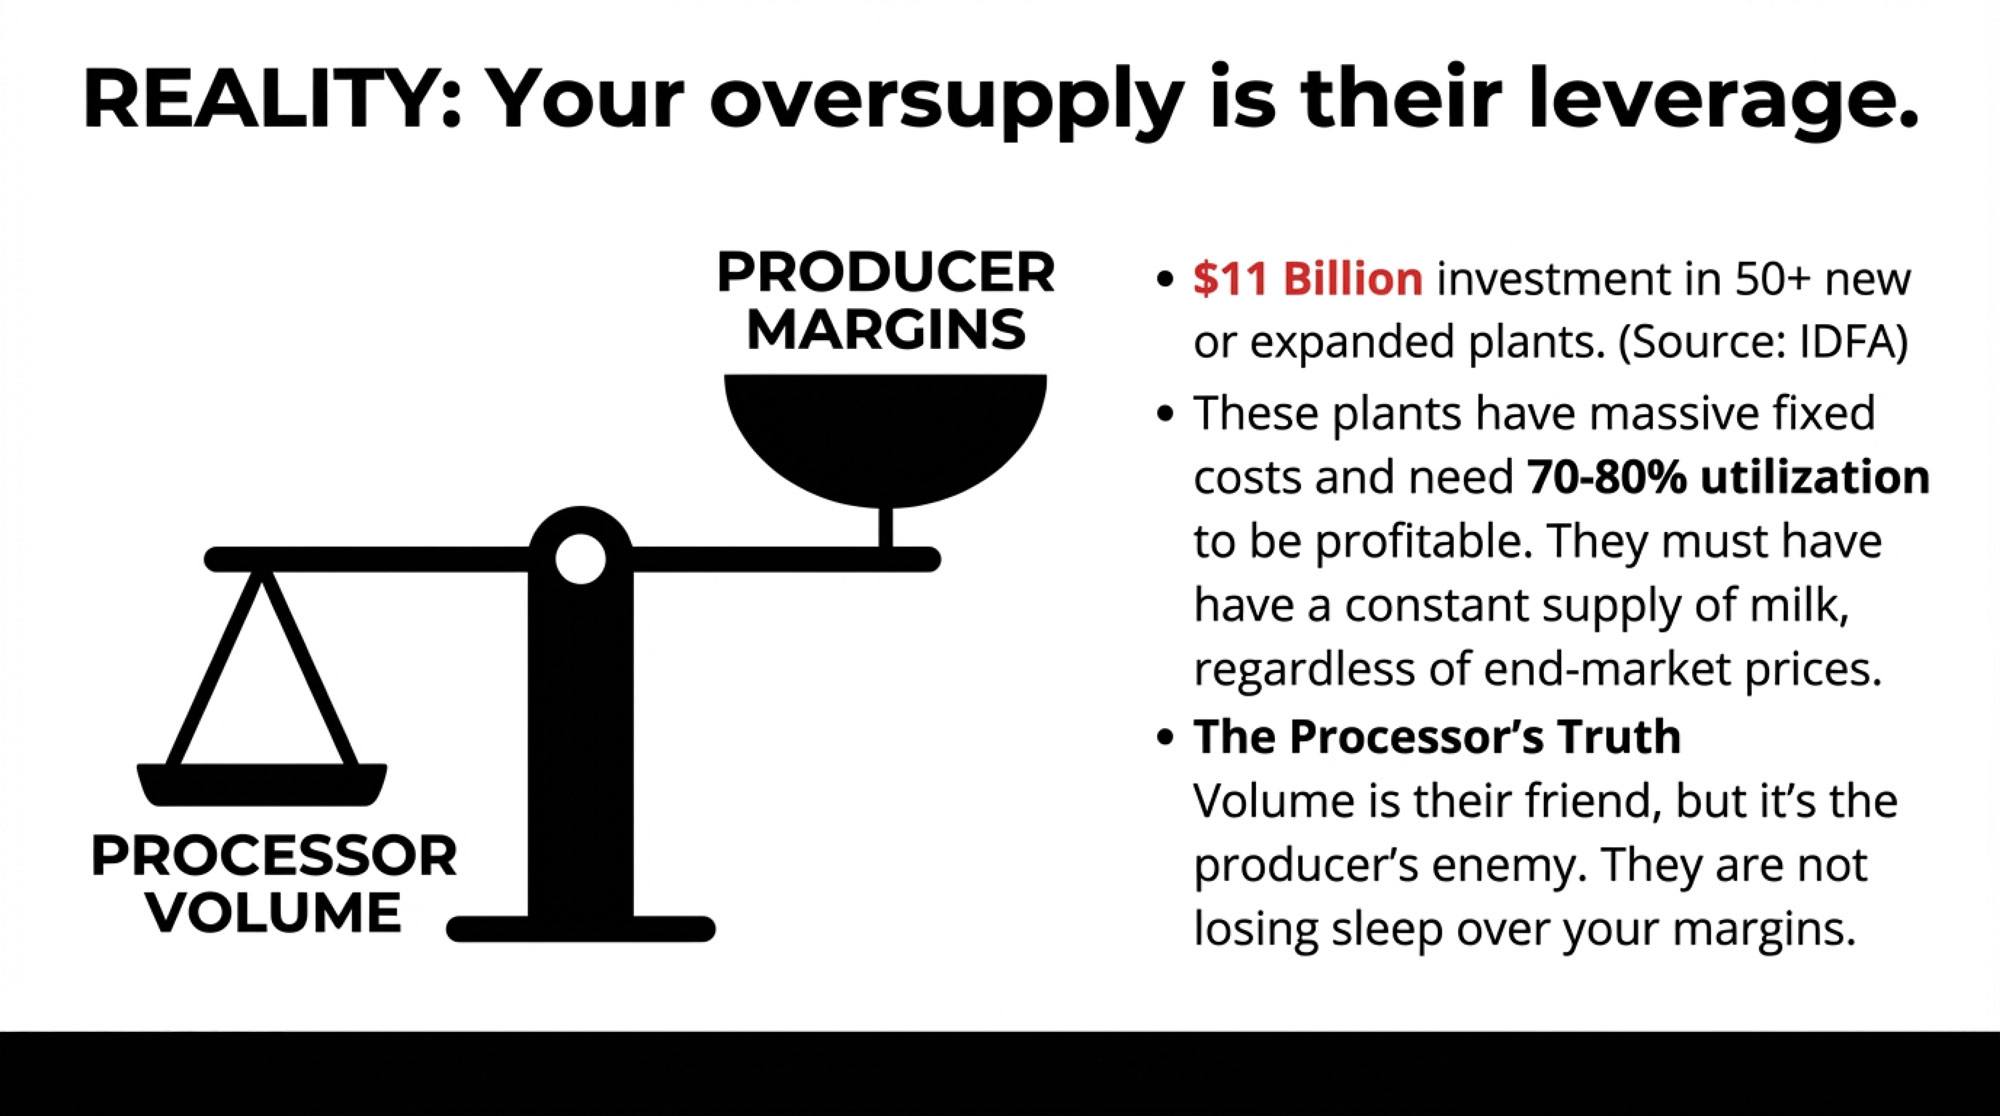
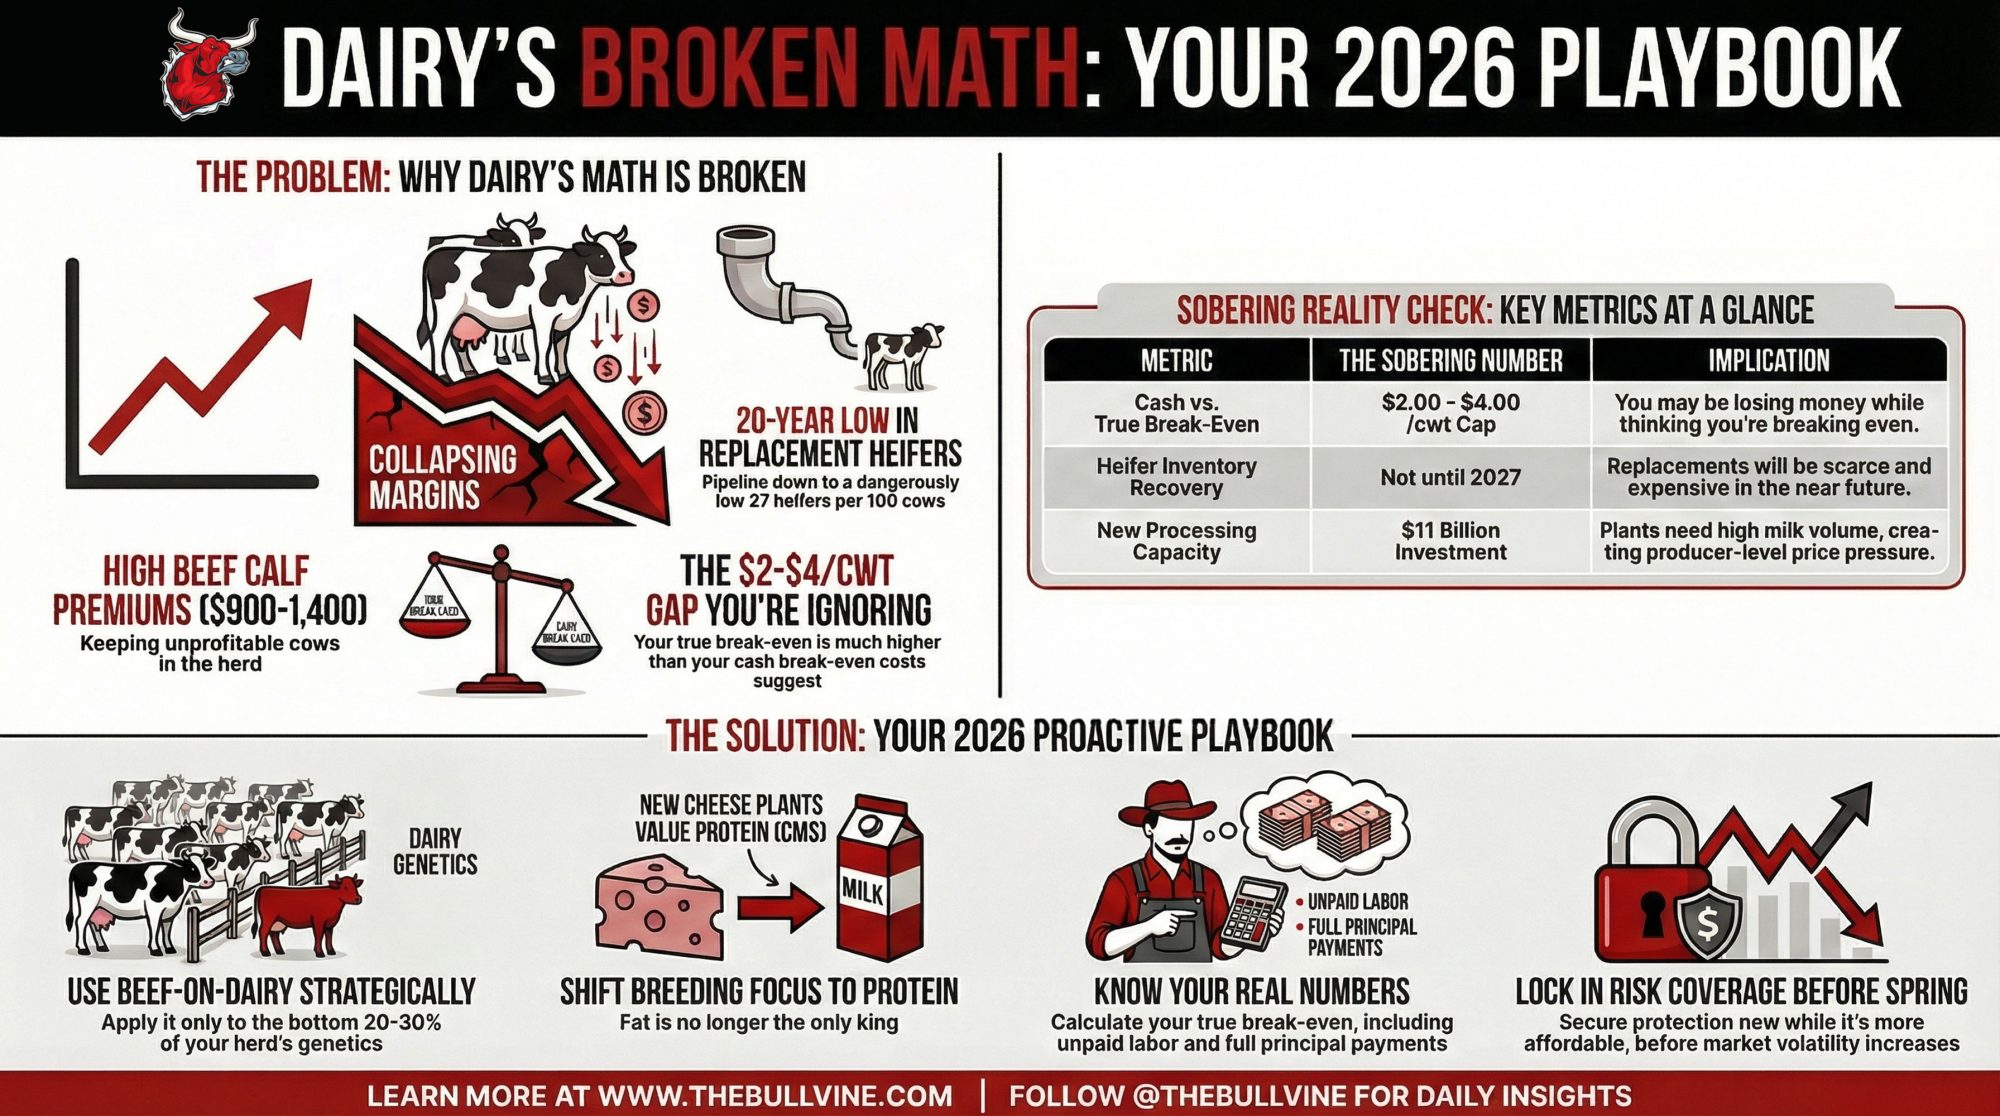
U.S. dairy processors have committed more than $11 billion in new and expanded capacity across more than 50 projects in 19 states between 2025 and early 2028 — overwhelmingly targeting cheese and whey protein, not drying, according to data released by the International Dairy Foods Association on October 2, 2025. UW Extension dairy economist Leonard Polzin described “more than eight billion dollars’ worth of stainless steel” being invested in new and expanded dairy processing in January 2025 — before several major announcements pushed the total higher. CoBank analyst Corey Geiger flagged the tension directly: those plants will need more milk and “many more dairy heifer calves in future years to bring the national herd back to historic levels.”
Ken Heiman knows the margins from the inside. The certified Master Cheesemaker runs Nasonville Dairy in Marshfield, WI, processing up to 1.8 million pounds of milk per day. He’s blunt about the economics: cheese alone just about breaks even — it’s the whey protein stream that makes the operation work. “We ought to be thanking people who are buying whey protein at Aldi’s,” Heiman told the New York Times on July 16, 2025. “It definitely enhances the bottom line”. That math explains why plants keep expanding cheese capacity even when cheese margins are thin. The whey subsidizes the vat.
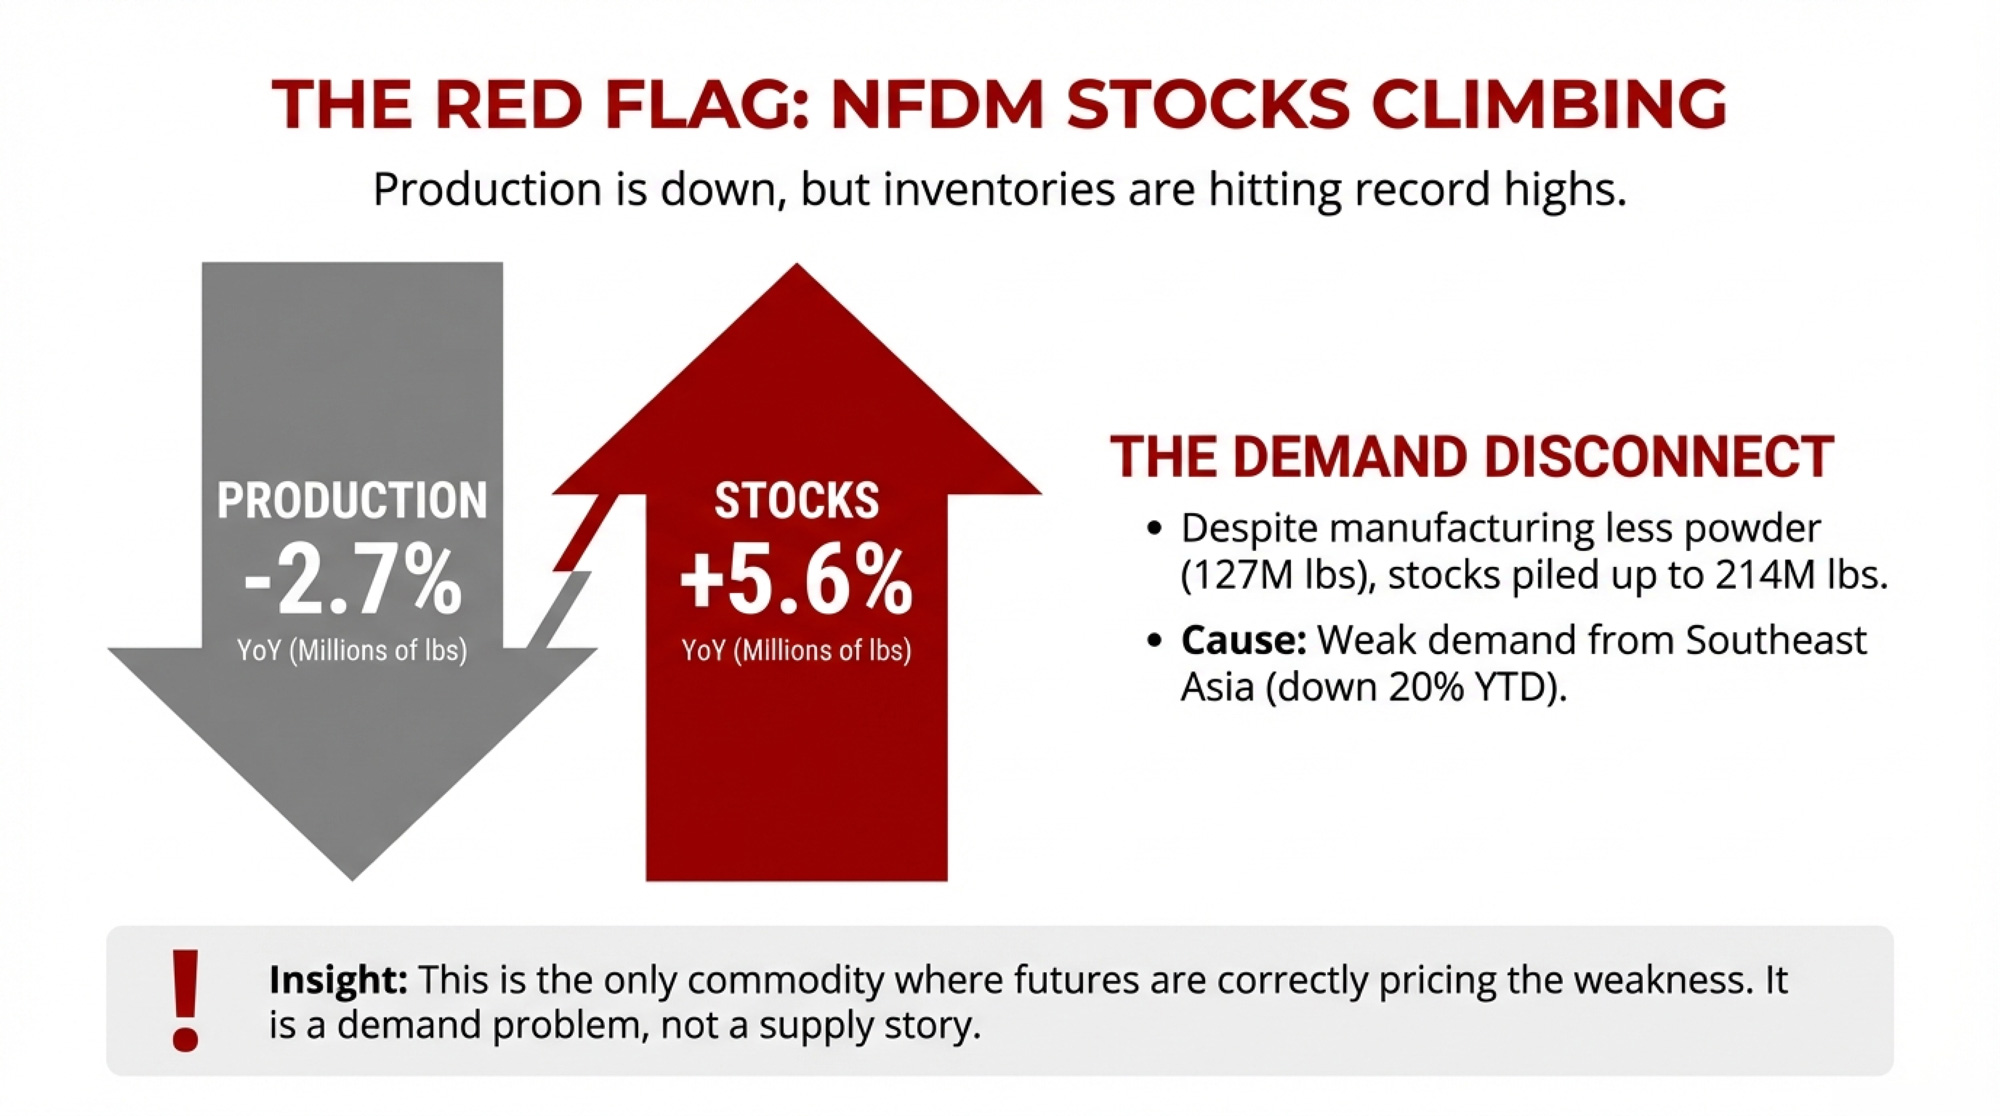
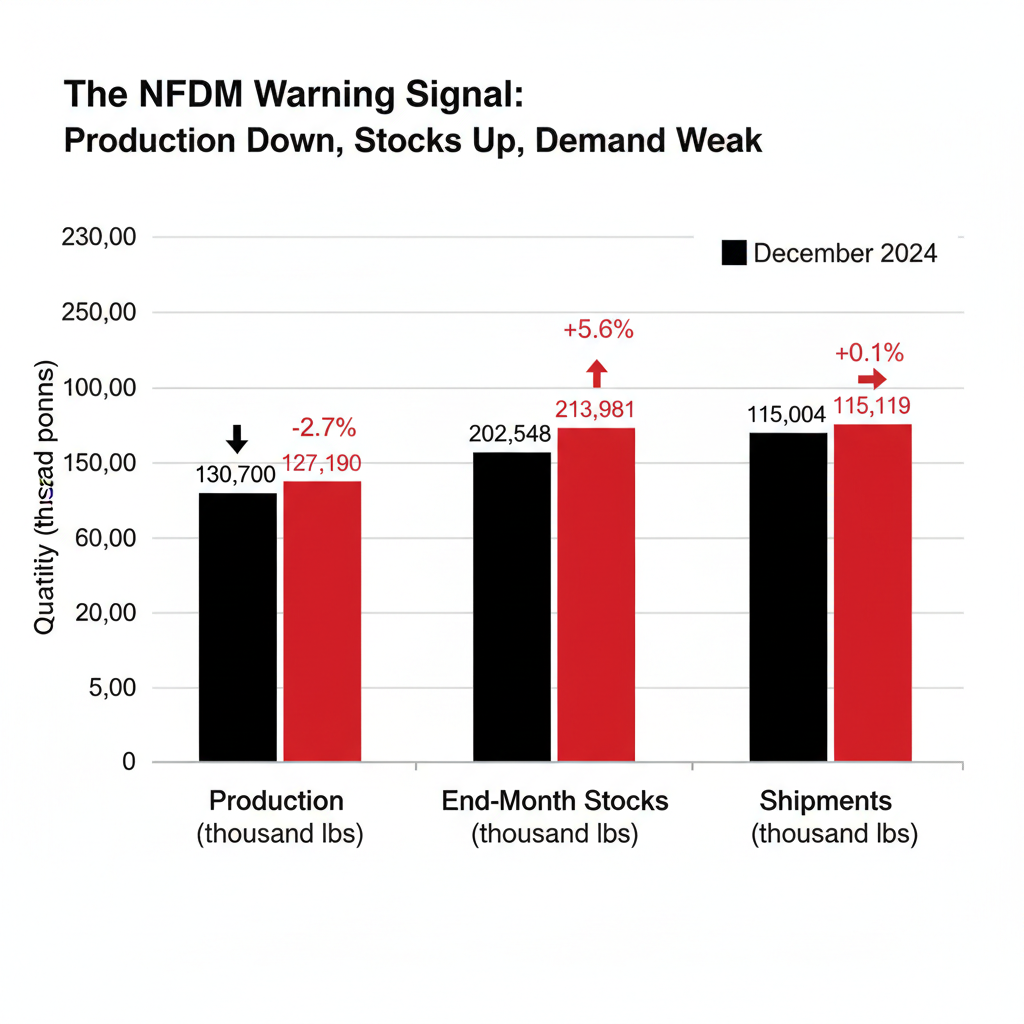
Meanwhile, USDA’s Dairy Products report (February 5, 2026) confirmed that combined U.S. NDM and SMP output in December totalled just 170.3 million pounds — down 6.2% year-over-year. Full-year 2025 powder production: 2.143 billion pounds. The weakest annual total since 2013.
U.S. Cheese Hits 1.28B Pounds in December — But Butter’s the Tighter Market
December cheese production hit 1.279 billion pounds, up 6.7% y/y, with Cheddar surging 9% and Italian varieties climbing 7.4%. Mozzarella grew 5.9%, even as foodservice channels continue pulling back. Hoard’s Dairyman reported in March 2025 that “food service has seen the biggest pullback in cheese demand” and that the pullback “shows little sign of any significant rebound”. Domino’s confirmed the trend firsthand, reporting a 0.5% decline in U.S. same-store sales in Q1 2025.
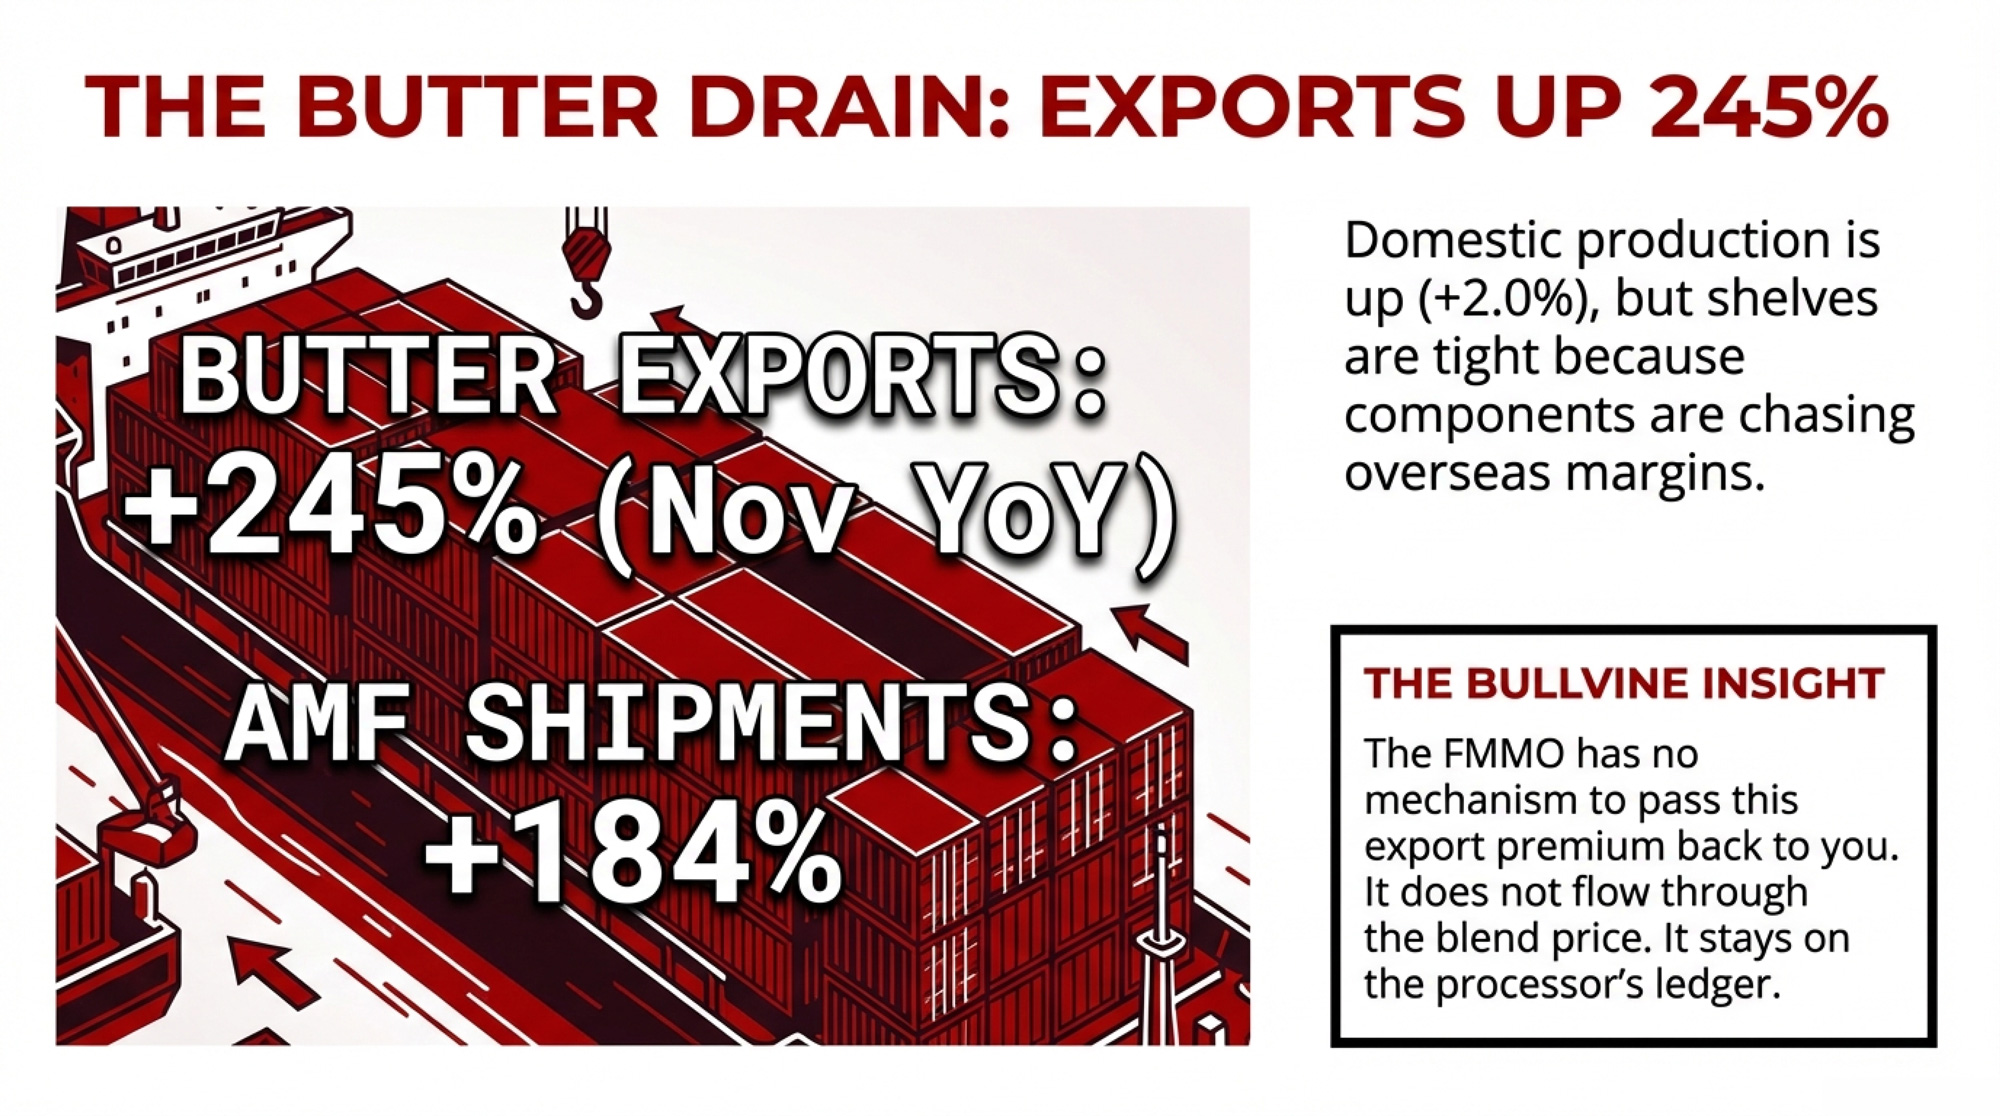
Butter production expanded a more modest 2% to 203.8 million pounds. But the spot market doesn’t feel oversupplied — CME butter jumped 13¢ last week to $1.71/lb, including a 10.25¢ leap on Thursday alone, with dozens of unfilled bids remaining at Friday’s close. USDA’s Agricultural Prices report pinned the national average fat test at 4.51% in December, up 0.05 percentage points y/y. More fat entering the system, and buyers still can’t get enough.
Cheddar blocks rose 11¢ to $1.4725/lb on 51 loads — competitively priced for global buyers. Dry whey was the lone loser, dipping 2¢ to 73¢/lb. But the whey complex is structurally shifting: December whey protein isolate production surged 11.7% to 20.6 million pounds, and WPC (50–89.9% protein) rose 9%, while lower-protein WPC (25–49.9%) fell 12.8%. Ask Ken Heiman — plants keep making cheese because the whey stream pays the bills.
Three Constraints Stacking: Heifers, Dryers, and Feed
The powder squeeze has staying power because three structural constraints are converging—and none resolves quickly.
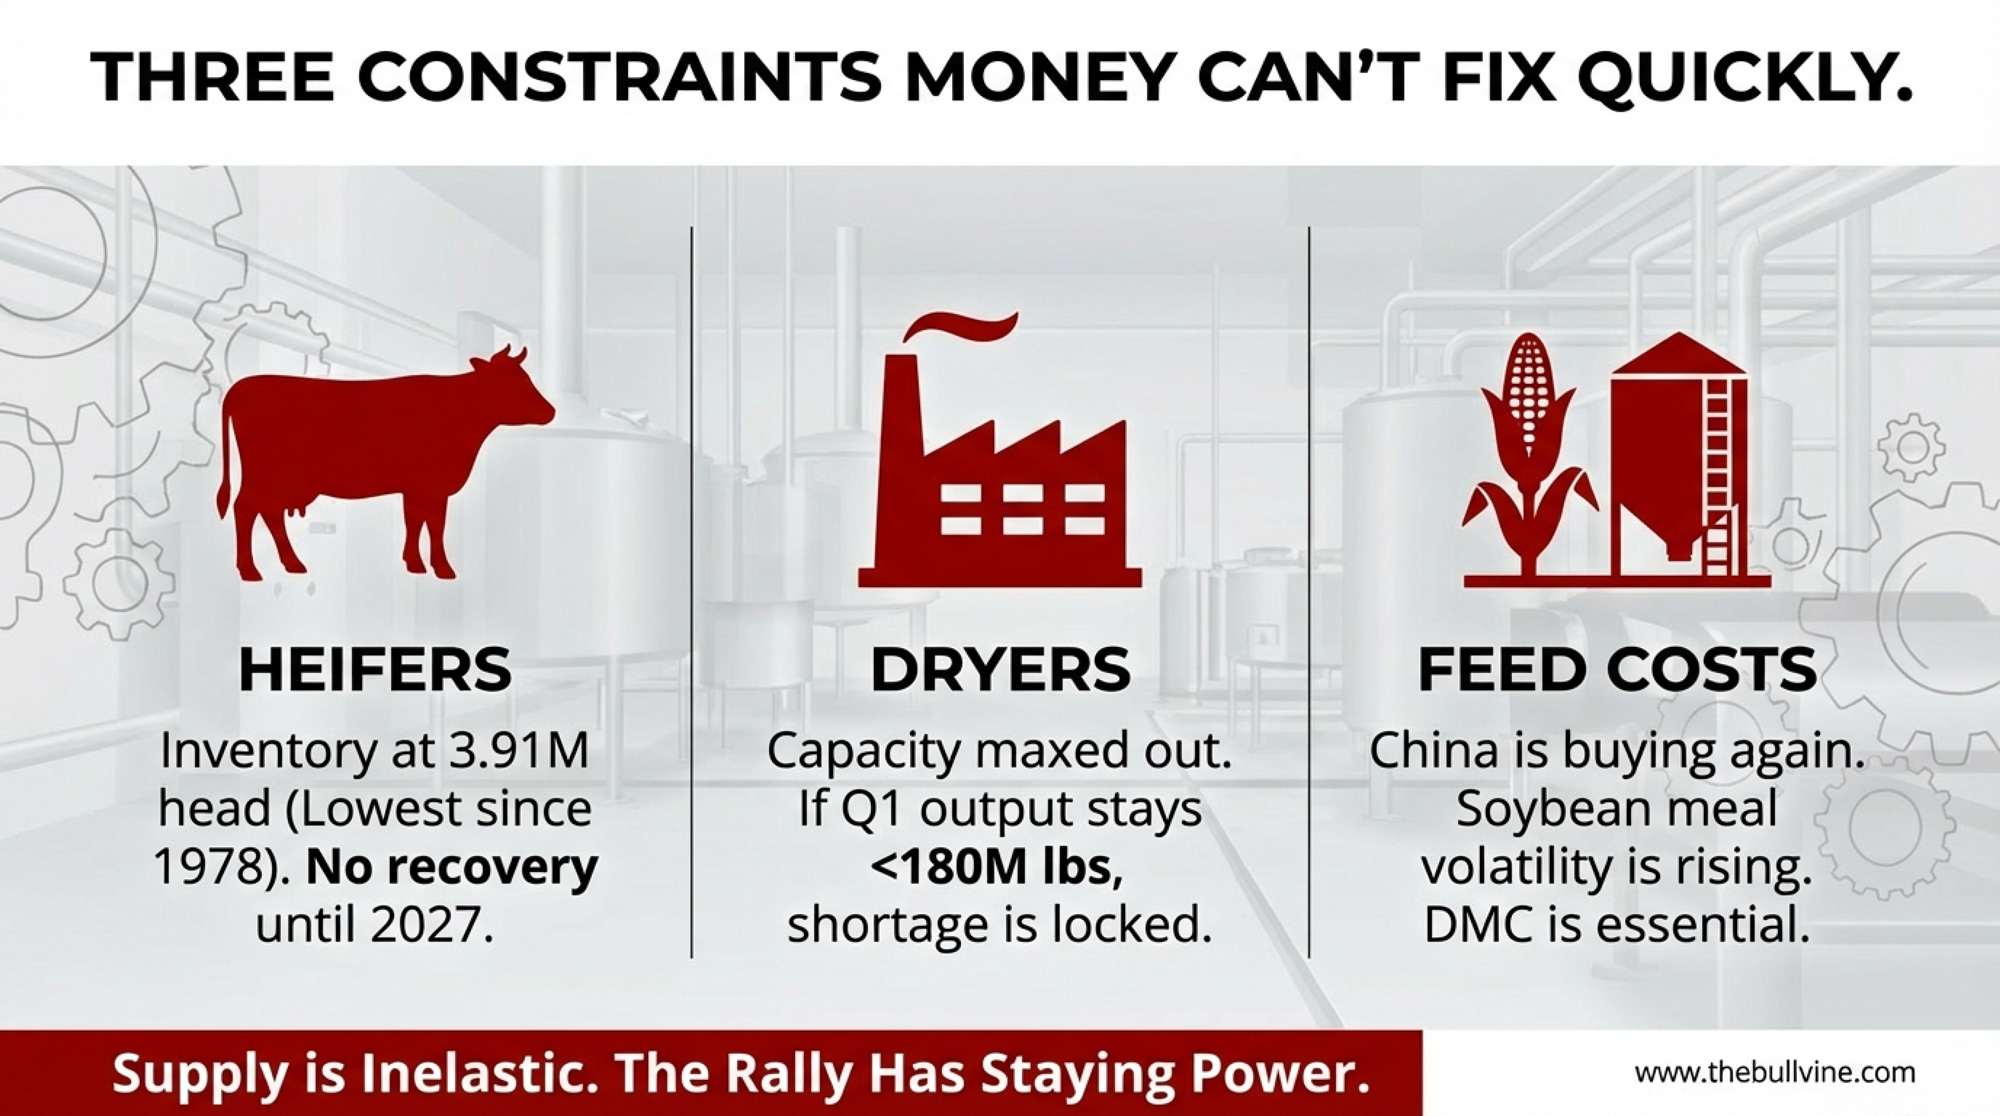
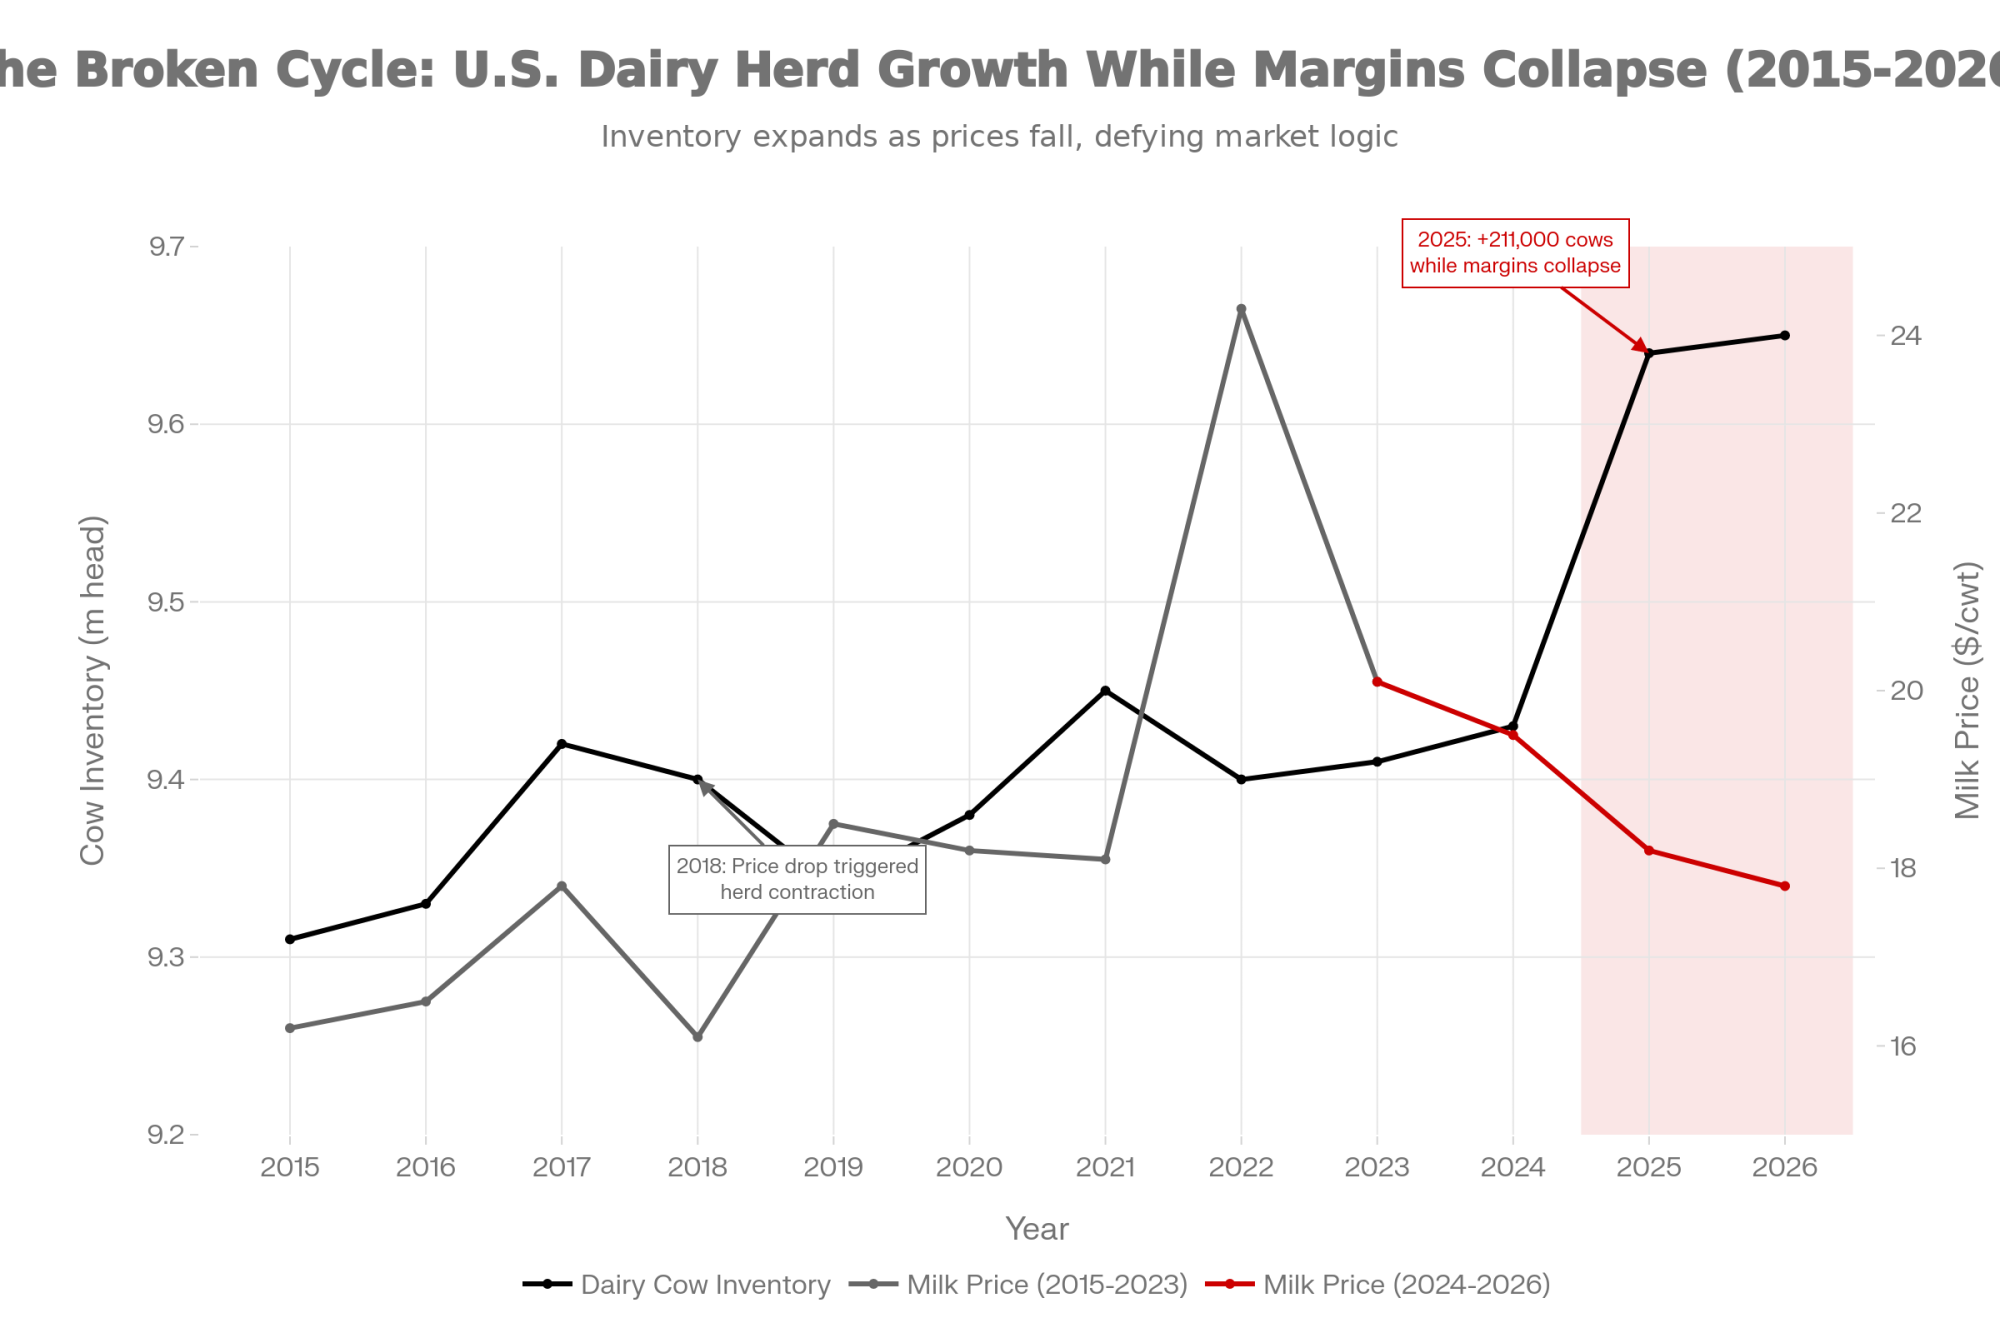
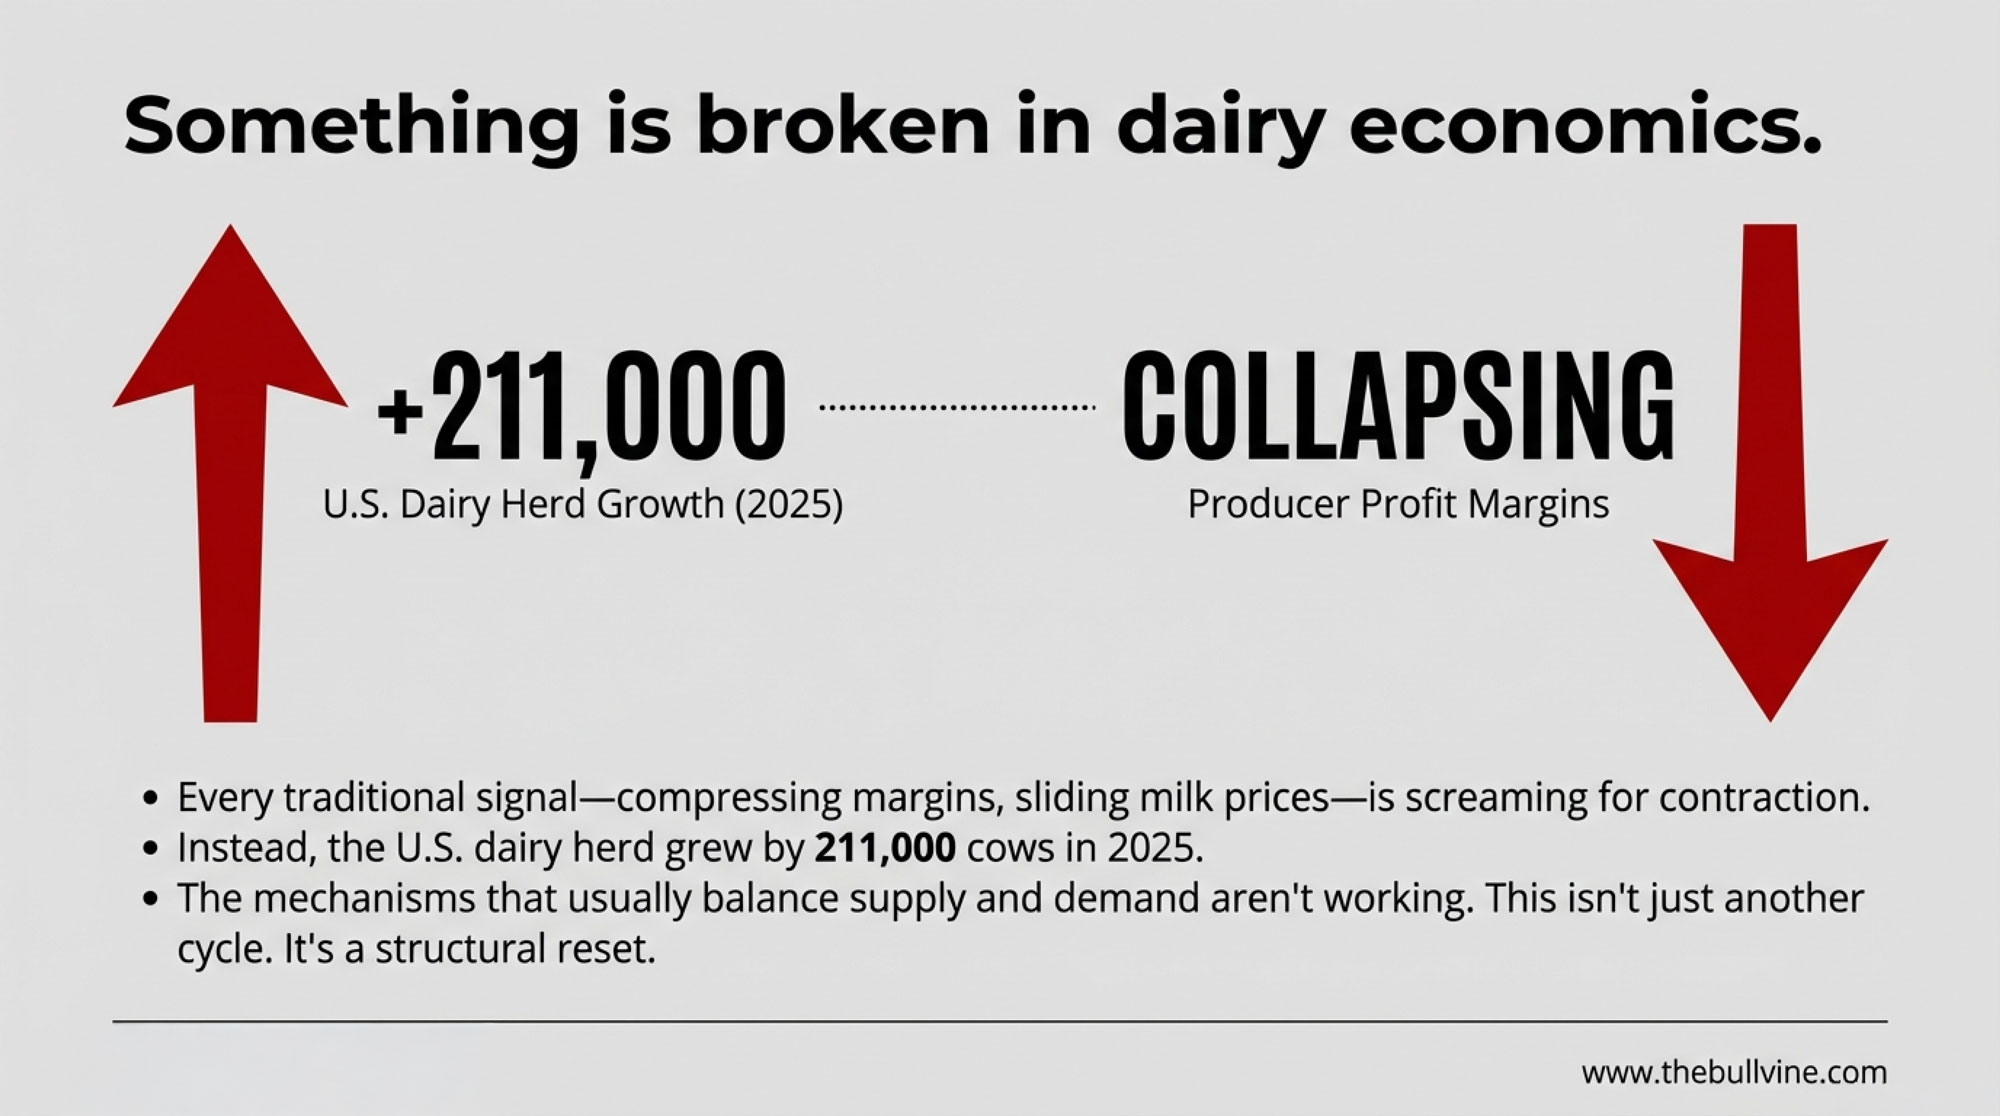
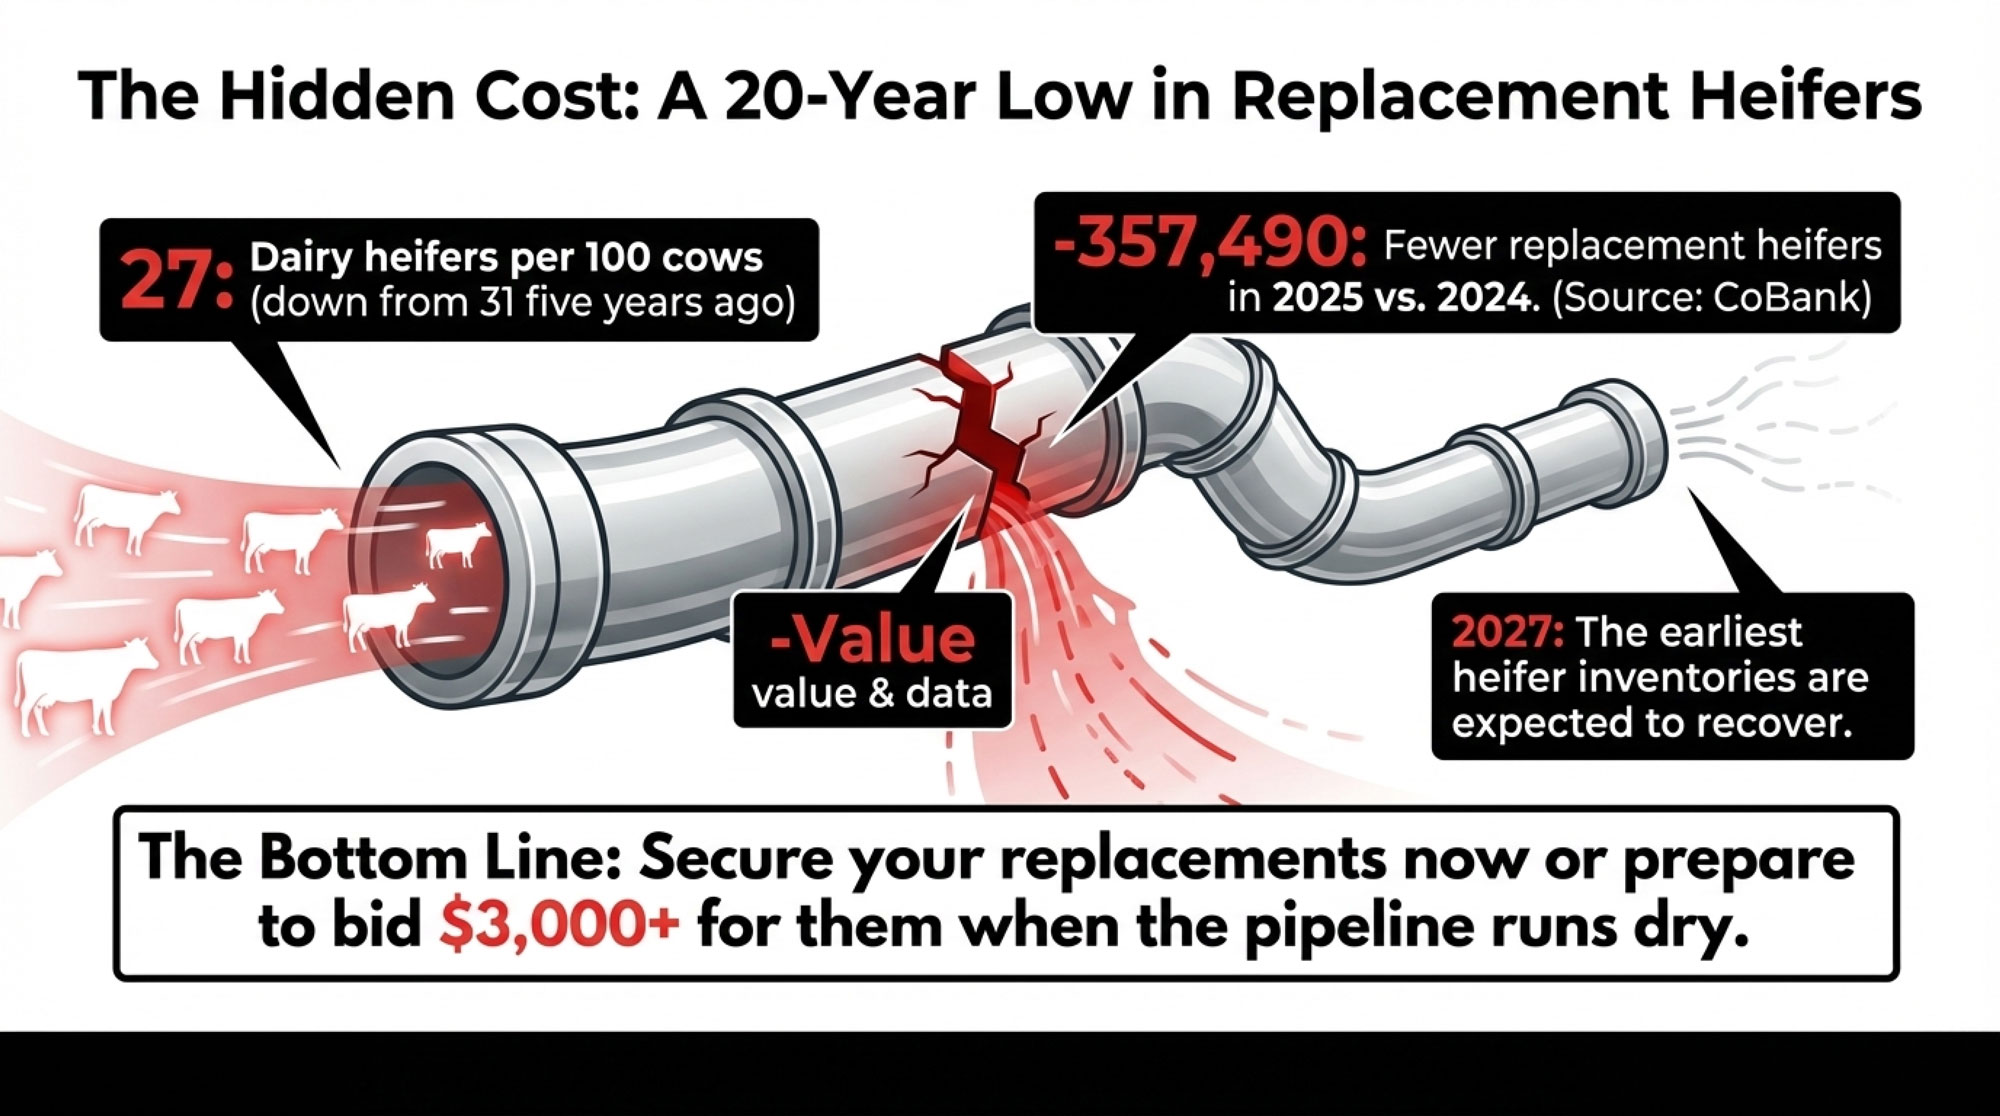
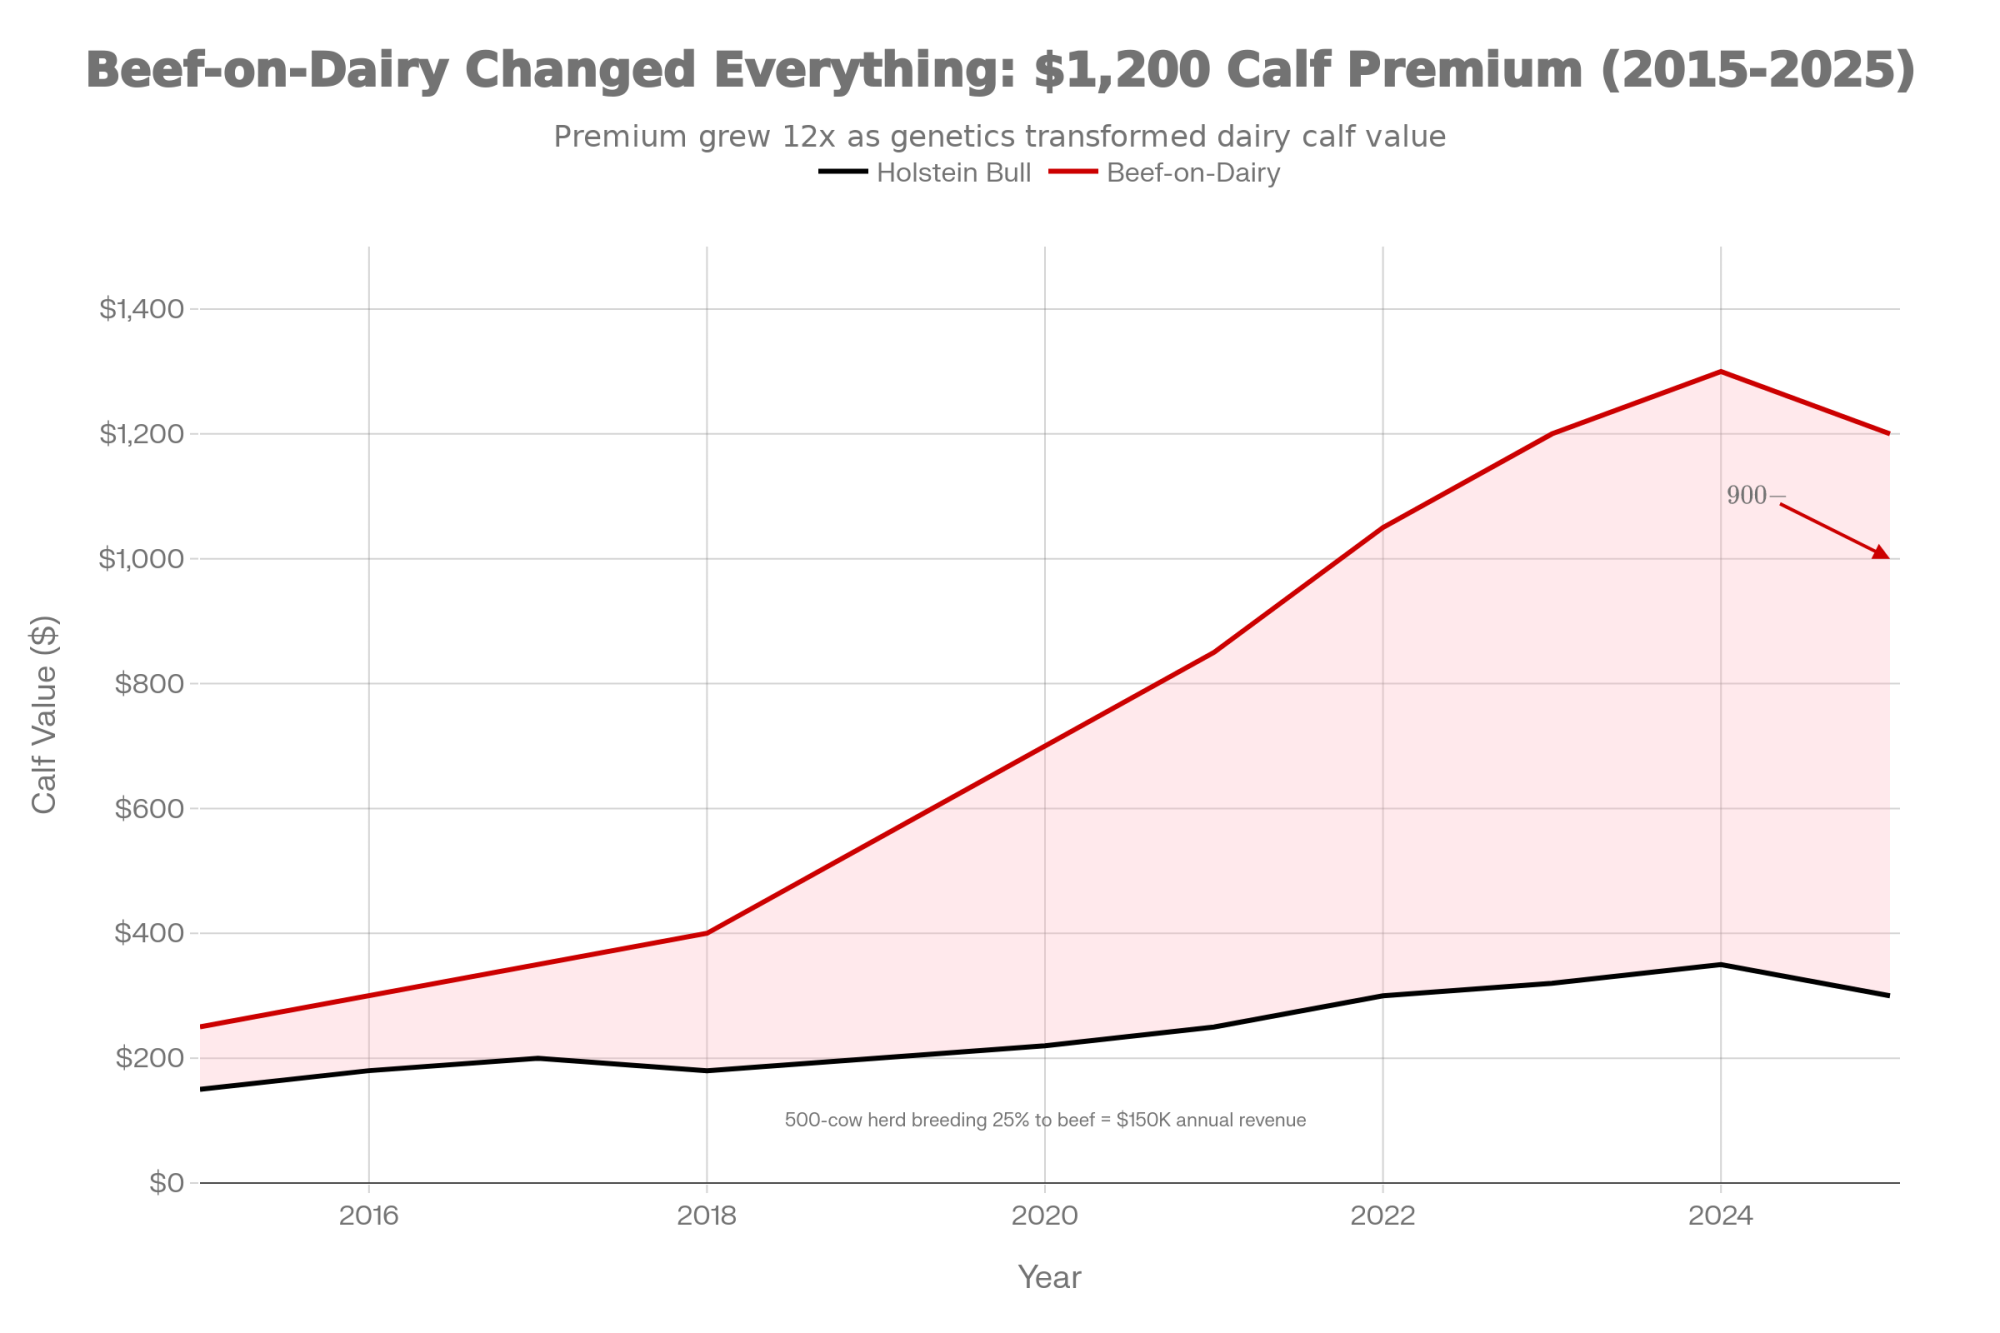
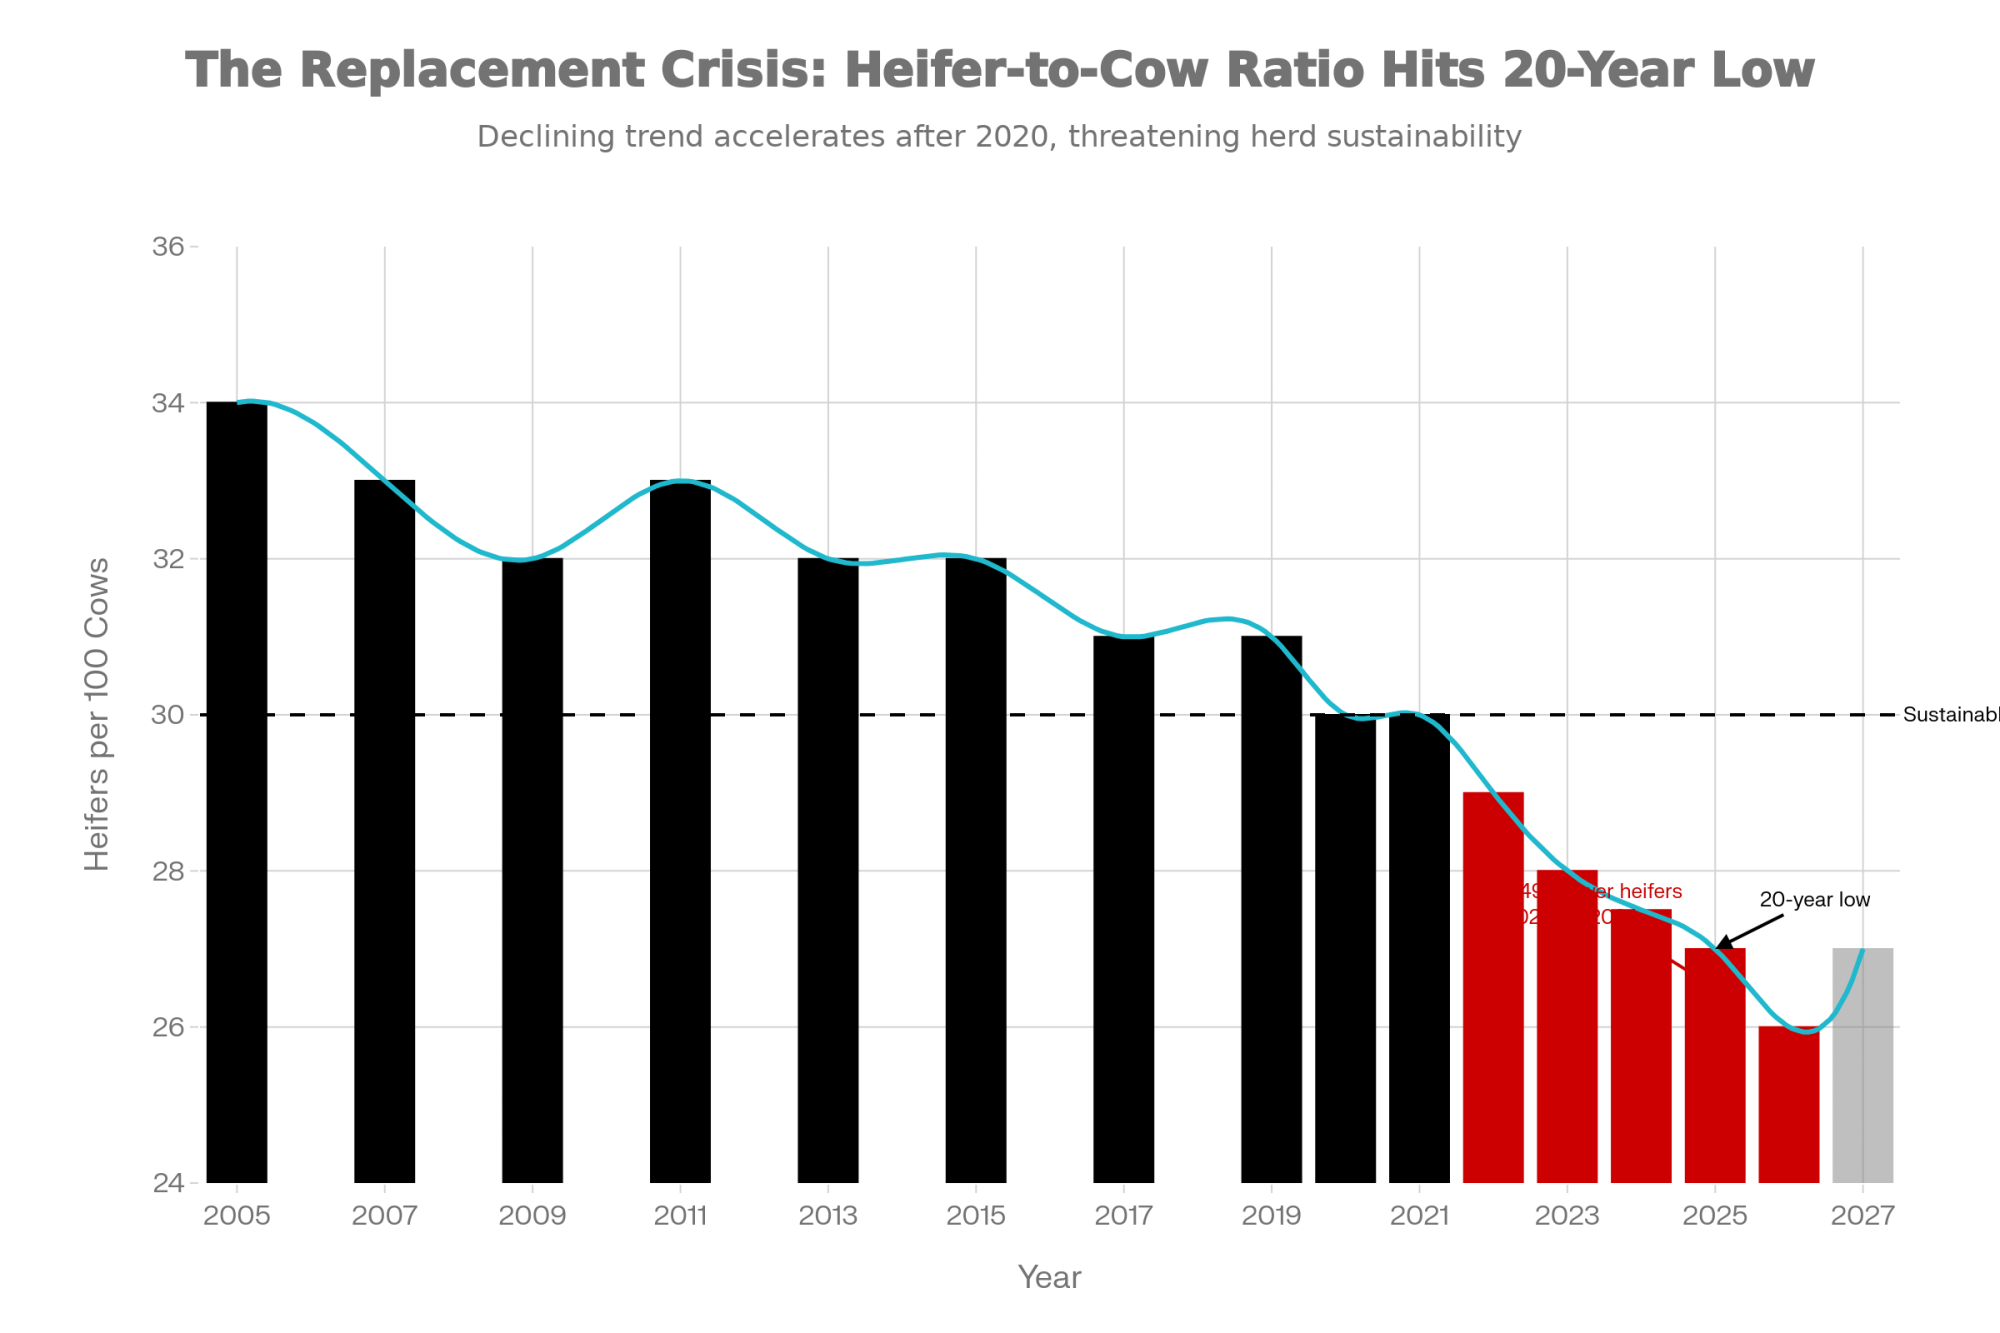
Heifers. USDA’s January 2025 estimate pegged dairy replacement heifers (500 lbs+) at 3.914 million head — the lowest since 1978. CoBank’s Abbi Prins projected the shortfall won’t begin recovering until 2027 at the earliest. With beef-on-dairy breeding running at elevated levels, the pipeline keeps shrinking even as processors need more cows.
Dryers. The $11 billion investment wave went to cheese and whey protein, not powder. No major drying plant expansions have been announced. If Q1 2026 NDM/SMP production stays below 180 million pounds monthly despite record milk supply, drying capacity isn’t just tight — it’s structurally insufficient.
Feed. MAR26 soybean meal settled at $303.60/ton on Thursday, with further gains on Friday. MAR26 corn hit $4.35/bu before giving back ground. On February 4, Trump stated that China was considering purchasing 20 million metric tons of U.S. soybeans this season, following what he called “very positive” talks with President Xi. On February 8, USDA confirmed an additional 264,000 MT of China soybean sale. This follows China’s completion in January of its initial 12 million MT commitment from the October 2025 Trump-Xi agreement, as confirmed by Treasury Secretary Scott Bessent at Davos. That buying pressure boosted soybean and soybean meal values heading into the week. Higher feed costs don’t make DMC optional. They make it essential.
4 Moves Before February 26
1. Restructure your DRP to match actual pool exposure. If your co-op runs 60% cheese and 40% butter/powder, but your DRP is weighted 80% Class III, you’re insuring a milk check that doesn’t exist. High-component herds generally benefit from the Component Pricing option; average-component herds from Class Pricing with accurate III/IV weighting. Get a current quote — premiums fluctuate with volatility.
| Your Pool Mix | Your DRP Weighting | Class III/IV Spread | Monthly Exposure (500 cows) | Risk Level |
|---|---|---|---|---|
| 60% Cheese / 40% Powder | 80% Class III / 20% Class IV | $1.50/cwt | -$10,000 to -$15,000 | HIGH |
| 60% Cheese / 40% Powder | 60% Class III / 40% Class IV | $1.50/cwt | -$3,000 to -$5,000 | MODERATE |
| 40% Cheese / 60% Powder | 60% Class III / 40% IV | $1.50/cwt | +$4,000 to +$6,000 | LOW |
| 70% Cheese / 30% Powder | 70% Class III / 30% Class IV | $1.50/cwt | -$5,000 to -$8,000 | MODERATE-HIGH |
2. Stack DMC before the deadline. Tier 1 now covers up to 6 million pounds — up from 5 million — giving medium-sized operations an extra million pounds of protection. You must establish a new production history based on your highest marketings from 2021, 2022, or 2023. The six-year lock-in (2026–2031) saves 25% on premiums but surrenders annual flexibility. Run the math both ways.
3. Audit your milk check. AFBF economist Danny Munch, speaking at ADC’s Dairy Hot Topics session during World Dairy Expo on October 2, 2025, urged producers to share milk check stubs with ADC, their state Farm Bureau, or their market administrator. He flagged instances — particularly in Wisconsin — where independent handlers weren’t meeting existing disclosure requirements.
Foremost Farms patrons already know the pain: the cooperative announced a $0.90/cwt market adjustment deduction from member payments, citing “a significant difference between Class III milk costs and the revenue generated from cheese and whey product sales”. The FMMO pricing formula changes implemented on June 1 resulted in decreases “up to $0.90 per cwt” for producers in the Upper Midwest, Central, and Mideast FMMOs. Look for months where your PPD went sharply negative while Class IV traded at a premium. Cost: one uncomfortable phone call. Potential payback: significant.
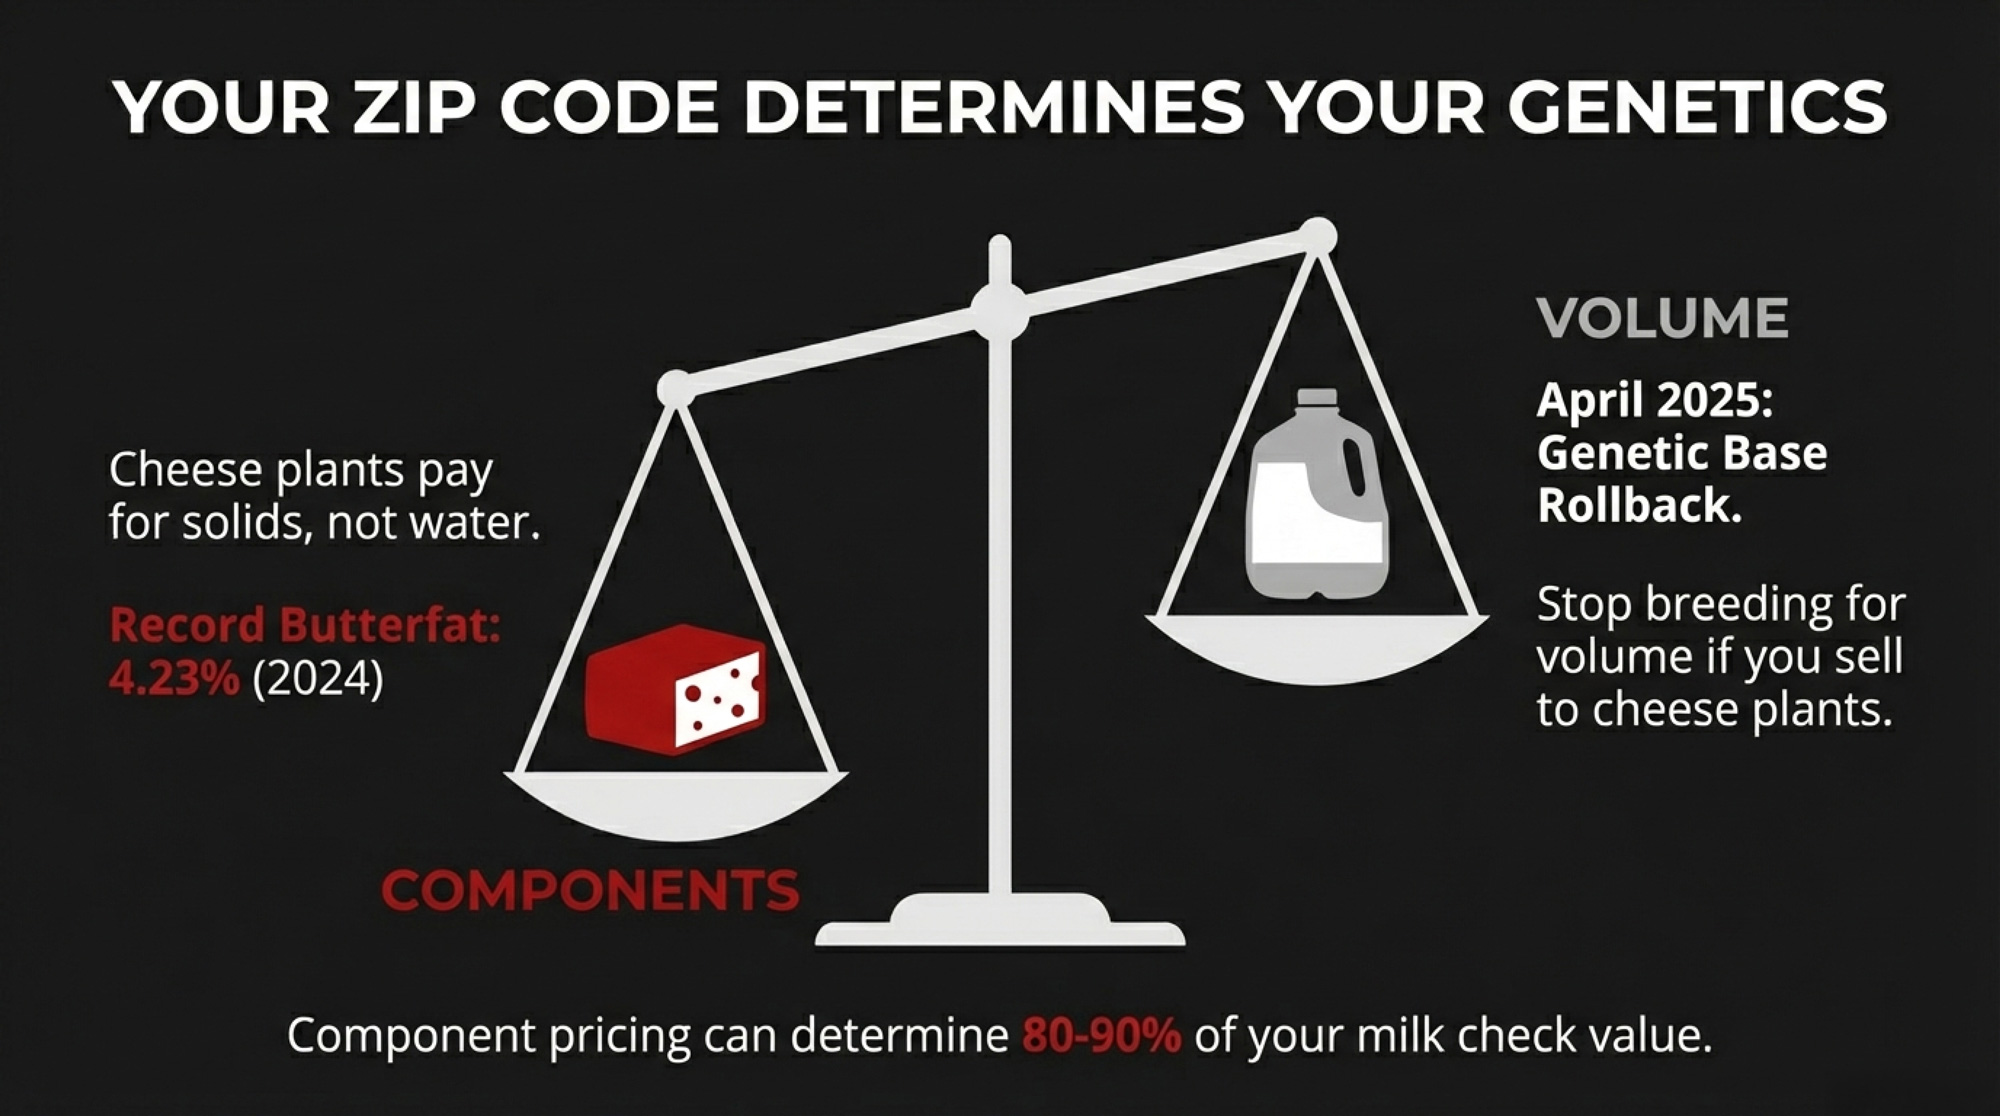
4. Run your component economics. As of January 2026, FMMO component prices ($1.4595/lb butterfat, $2.1768/lb protein): every tenth of a percent in butterfat translates to roughly $0.15–$0.35/cwt in additional revenue. A herd testing 4.3% fat and 3.3% protein versus one at 3.8% and 3.0% holds a cumulative advantage of roughly $1.00–$1.50/cwt. On 1,000 cows averaging 75 lbs/day, even the low end is approximately $22,000/month. Protected fat supplements typically run $0.30–$0.55/cow/day — University of Illinois dairy nutritionist Mike Hutjens has pegged rumen-protected choline alone at roughly 30¢/cow/day, with calcium salt fat supplements adding cost above that depending on inclusion rate. Genetic gains through sire selection take 6–24 months to hit the tank. Ask your nutritionist for the breakeven component test at current premiums.
| Herd Profile | Butterfat % | Protein % | Premium Value ($/cwt) | Monthly Revenue (1000 cows, 75 lb/day) | Annual Advantage |
|---|---|---|---|---|---|
| High-Component Herd | 4.3% | 3.3% | +$1.25 | +$28,125 | +$337,500 |
| Average Herd | 3.8% | 3.0% | Baseline | Baseline | Baseline |
| Gap | +0.5% | +0.3% | $1.00-$1.50 | $22,500-$33,750 | $270,000-$405,000 |
What to Watch at TE398 on February 17
The next GDT auction will be the first real test of whether TE397’s 6.7% surge was panic buying or a structural repricing. Rabobank’s Q4 update (“Global Dairy Supply Surpasses Demand,” published January 7, 2026, via AHDB) estimated Big-7 milk production finished 2025 up 2.2% y/y, with 2026 growth moderating to 0.6%. If SMP holds above $2,800/MT at TE398, the floor is real. If it retreats below $2,600, the rally may have been seasonal restocking ahead of Ramadan and Lunar New Year.
On the domestic side, the March USDA Dairy Products report — covering January production — is the single most important data point. If NDM/SMP output stays below 180 million pounds, drying capacity is confirmed insufficient. Above 195 million, the system may be self-correcting.
What This Means for Your Operation
- If you ship to a cheese-heavy co-op like Foremost Farms and your DRP is weighted more than 60% Class III, you’re likely insuring the wrong revenue stream. Pull your current DRP parameters this week and request a requote before the February 17 GDT gives the market its next signal.
- If you’re considering forward contracting at current NDM-driven Class IV levels, talk to your risk management advisor now. DRP covers revenue; DMC covers margin. Neither locks in today’s spot price, but structuring both before February 26 gives you the cheapest available hedge against the spread narrowing or feed costs widening.
- If you’re in the Southwest — near Hilmar’s Dodge City plant or Leprino’s Lubbock facility — your handler’s plant mix may already capture more Class IV value. DFA is even seeing milk production growth in areas like southern Georgia and northern Florida. Know where your milk goes before you assume the spread hits you the same way it hits a Wisconsin cheese-pool shipper.
- If your herd averages below 4.0% butterfat and 3.1% protein, you’re leaving an estimated $1.00+/cwt on the table relative to component-optimized herds in the same pool. That’s roughly $22,000/month on 1,000 cows at the low end.
- If your PPD went negative in any month since October 2025, ask your co-op directly whether Class IV milk was depooled. Danny Munch at AFBF has flagged handlers not following existing disclosure rules.
- Counter-signal: If Q1 NDM/SMP production rebounds above 195 million pounds monthly, the scarcity thesis weakens, and the Class III/IV spread narrows. The March Dairy Products report is the first real test.
Key Takeaways
- The Gap: NDM at $1.64 sits 16.75¢ above Cheddar and within pennies of butter. For cheese-pool herds, that translates to a Class III/IV spread costing real money every month — The Bullvine’s October 2025 paired-herd analysis pegged it at $10,000–$15,000/month on 500 cows.
- Why It Lasts: 2025 powder output fell to 2.143 billion pounds — weakest since 2013 — while $11 billion in new capacity went to cheese and whey. Heifer replacements are at a generational low of 3.914 million head, constraining even the milk supply.
- Your Biggest Lever: Components plus DRP alignment. Moving from average to high components is worth $1.00–$1.50/cwt, but only if your DRP weighting and handler actually capture that value. Fix both before February 26.
- The Cost of Waiting: Rolling into spring with a cheese-heavy pool, a Class III-heavy DRP, and average components is a bet that the Class IV premium disappears before your cash does.
The Bottom Line
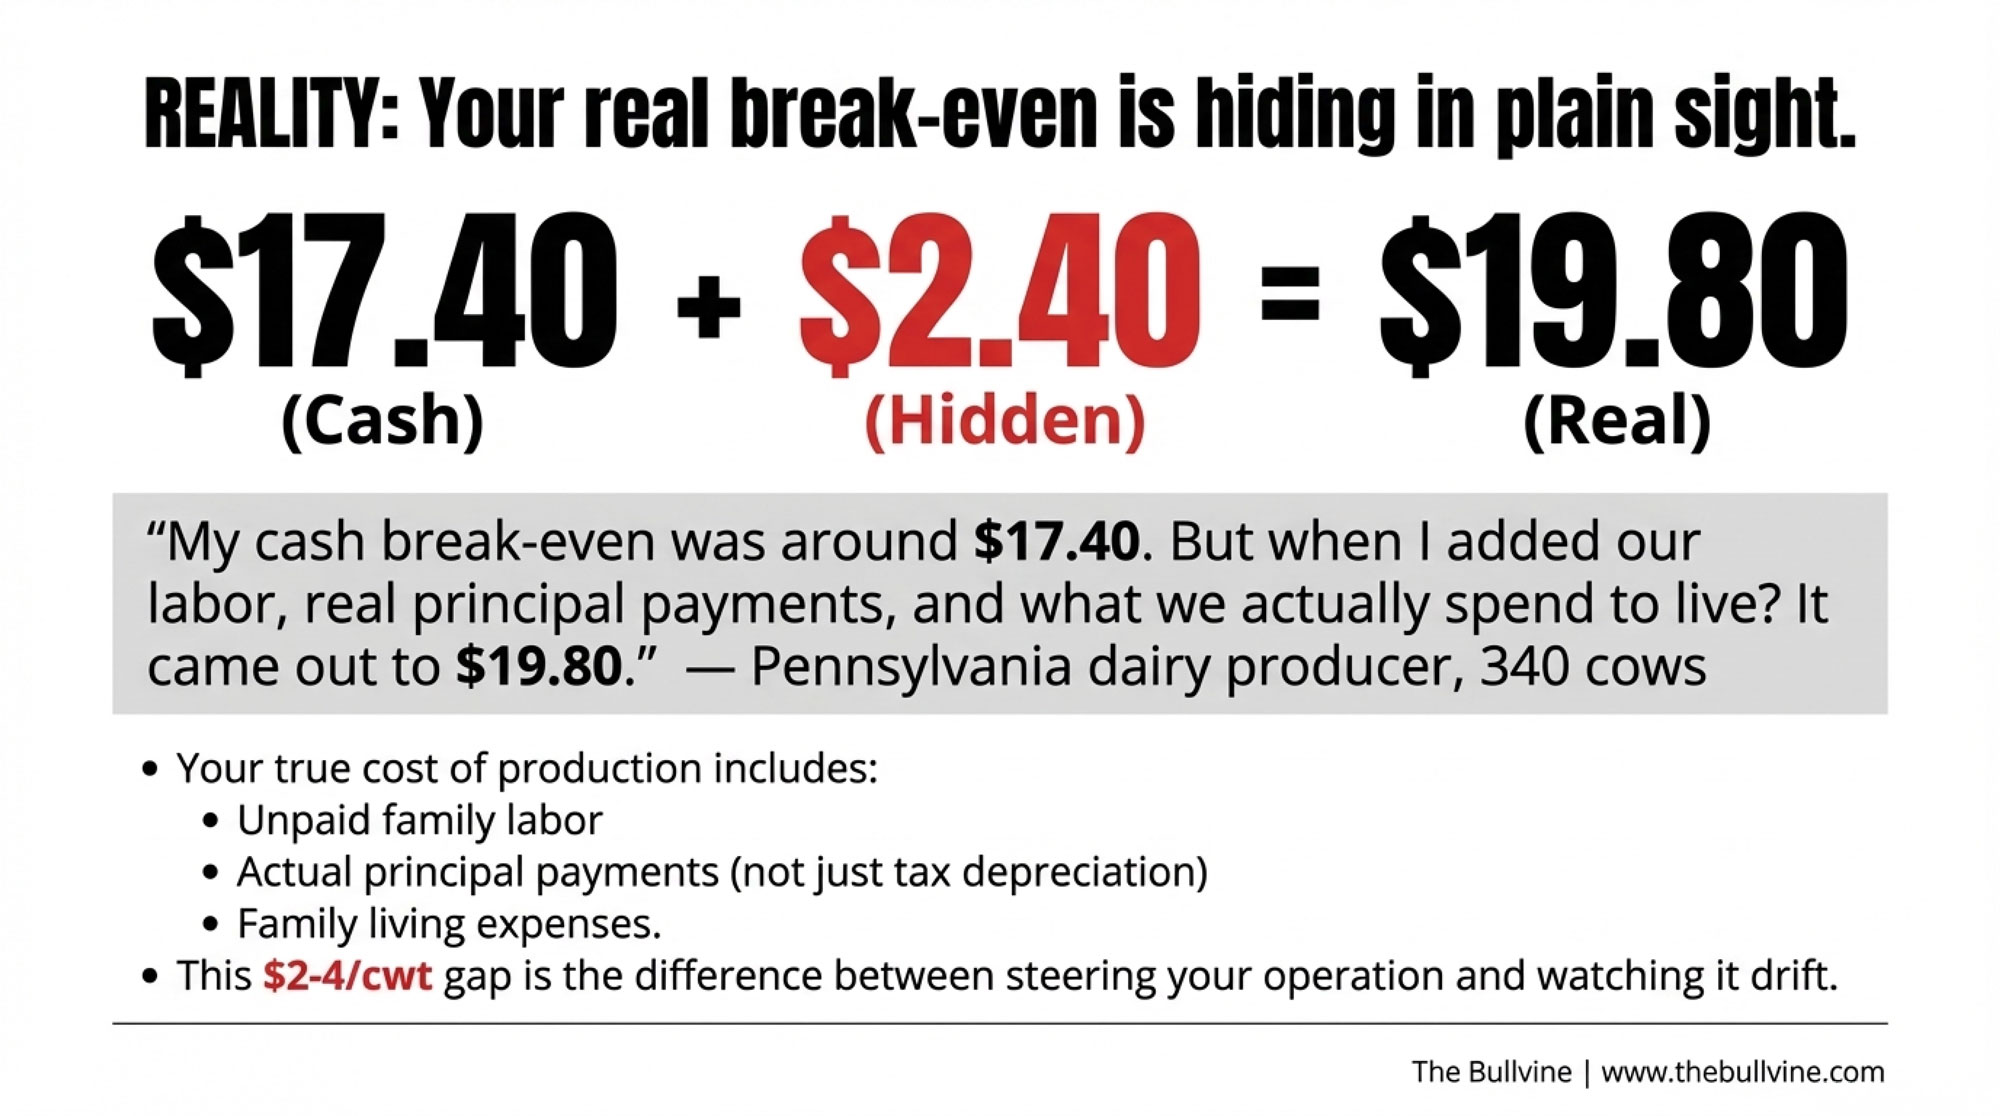
The February 26 DMC deadline isn’t the end of the conversation — it’s the last clean entry point before spring flush reprices everything. Where does your breakeven sit if Class III stays in the low $17s through summer?
To enroll in the 2026 DMC, contact your local USDA Farm Service Agency office or visit farmers.gov/service-center-locator. The deadline is February 26, 2026.
Complete references and supporting documentation are available upon request by contacting the editorial team at editor@thebullvine.com.
Learn More
- $3,010 Per Heifer. 800,000 Short. Your Beef-on-Dairy Bill Is Due. – Gain a survival strategy for the 2026 heifer crisis. This breakdown exposes the “biological trap” of beef-on-dairy breeding and arms you with the specific pregnancy thresholds needed to keep your stalls full without overpaying for replacements.
- The $11 Billion Reality Check: Why Dairy Processors Are Banking on Fewer, Bigger Farms – Gain a decisive edge by understanding processor consolidation before your next contract renewal. This analysis exposes why $11 billion in new steel favors mega-dairies and delivers the strategic roadmap needed to secure your place in a shrinking supply chain.
- Revolutionizing Dairy Farming: How AI, Robotics, and Blockchain Are Shaping the Future of Agriculture in 2025 – Gain a 2030 competitive advantage by identifying the automation tools that actually pay. This deep dive breaks down how AI-powered health monitoring and blockchain tracking slash vet bills and secure 15% premiums from transparency-obsessed buyers.
 Join the Revolution!
 Join the Revolution!
Join over 30,000 successful dairy professionals who rely on Bullvine Weekly for their competitive edge. Delivered directly to your inbox each week, our exclusive industry insights help you make smarter decisions while saving precious hours every week. Never miss critical updates on milk production trends, breakthrough technologies, and profit-boosting strategies that top producers are already implementing. Subscribe now to transform your dairy operation’s efficiency and profitability—your future success is just one click away.