3 out of 4 dairies bred beef-on-dairy. Now 800,000 heifers are missing, and replacements are $3,010 a head. Where does your herd sit in that math?
Executive Summary: If you chased beef‑on‑dairy premiums in 2022–23, you’re now buying replacements in a world where heifer prices jumped from $1,140 in 2019 to $3,010 in mid‑2025 and often top $4,000 in high‑demand regions. At the same time, U.S. replacement inventories have dropped to their lowest level since 1978, leaving roughly 800,000 “missing” heifers across 2025–2026 and making it harder—and more expensive—to keep herds at size. For a 200‑cow herd turning over 35–38% per year, that shift alone can mean an extra $126,000–$144,000 in replacement capital over the next two years if you have to buy those animals instead of calving them in. This piece breaks your options into four concrete paths—breeding rebalance, reduced culling, strategic exit, and processor lock‑in—and spells out where each helps, where it backfires, and the thresholds (like an 18% pregnancy rate or culling below 30%) that should force a rethink. It also links your barn‑level math to the bigger picture: beef‑on‑dairy calves now account for 12–15% of fed beef harvests, and roughly $10 billion in new dairy plants are scheduled to come online by 2027, keeping processor demand for reliable milk flows high even as replacements stay tight. The goal is simple: give you enough numbers and clear decision rules to decide whether your 2026 breeding sheet keeps you in the group processors treat as long‑term partners—or in the group scrambling for $3,000+ heifers with everyone else.
Ken McCarty of McCarty Family Farms still remembers trying to sell Holstein bull calves: “Two for $5″—with no takers. That painful baseline explains why dairy producers didn’t hesitate when beef-on-dairy calves started bringing $600, then $1,000, then $1,400 per head. The math seemed obvious. The check was immediate.
But it wasn’t free money. It was a deferred bill. And that bill has arrived.
CoBank data shows replacement heifer prices climbed from $1,140 per head in April 2019 to $3,010 by July 2025—with top-quality animals in California and Minnesota auction barns commanding $4,000 or more. USDA’s January 30, 2026, cattle inventory report confirmed the national herd continues to contract. For operations that bred heavily to beef in 2022 and 2023, the pipeline is now empty. For those who maintained balance, a window is opening.
The Scale Nobody Predicted
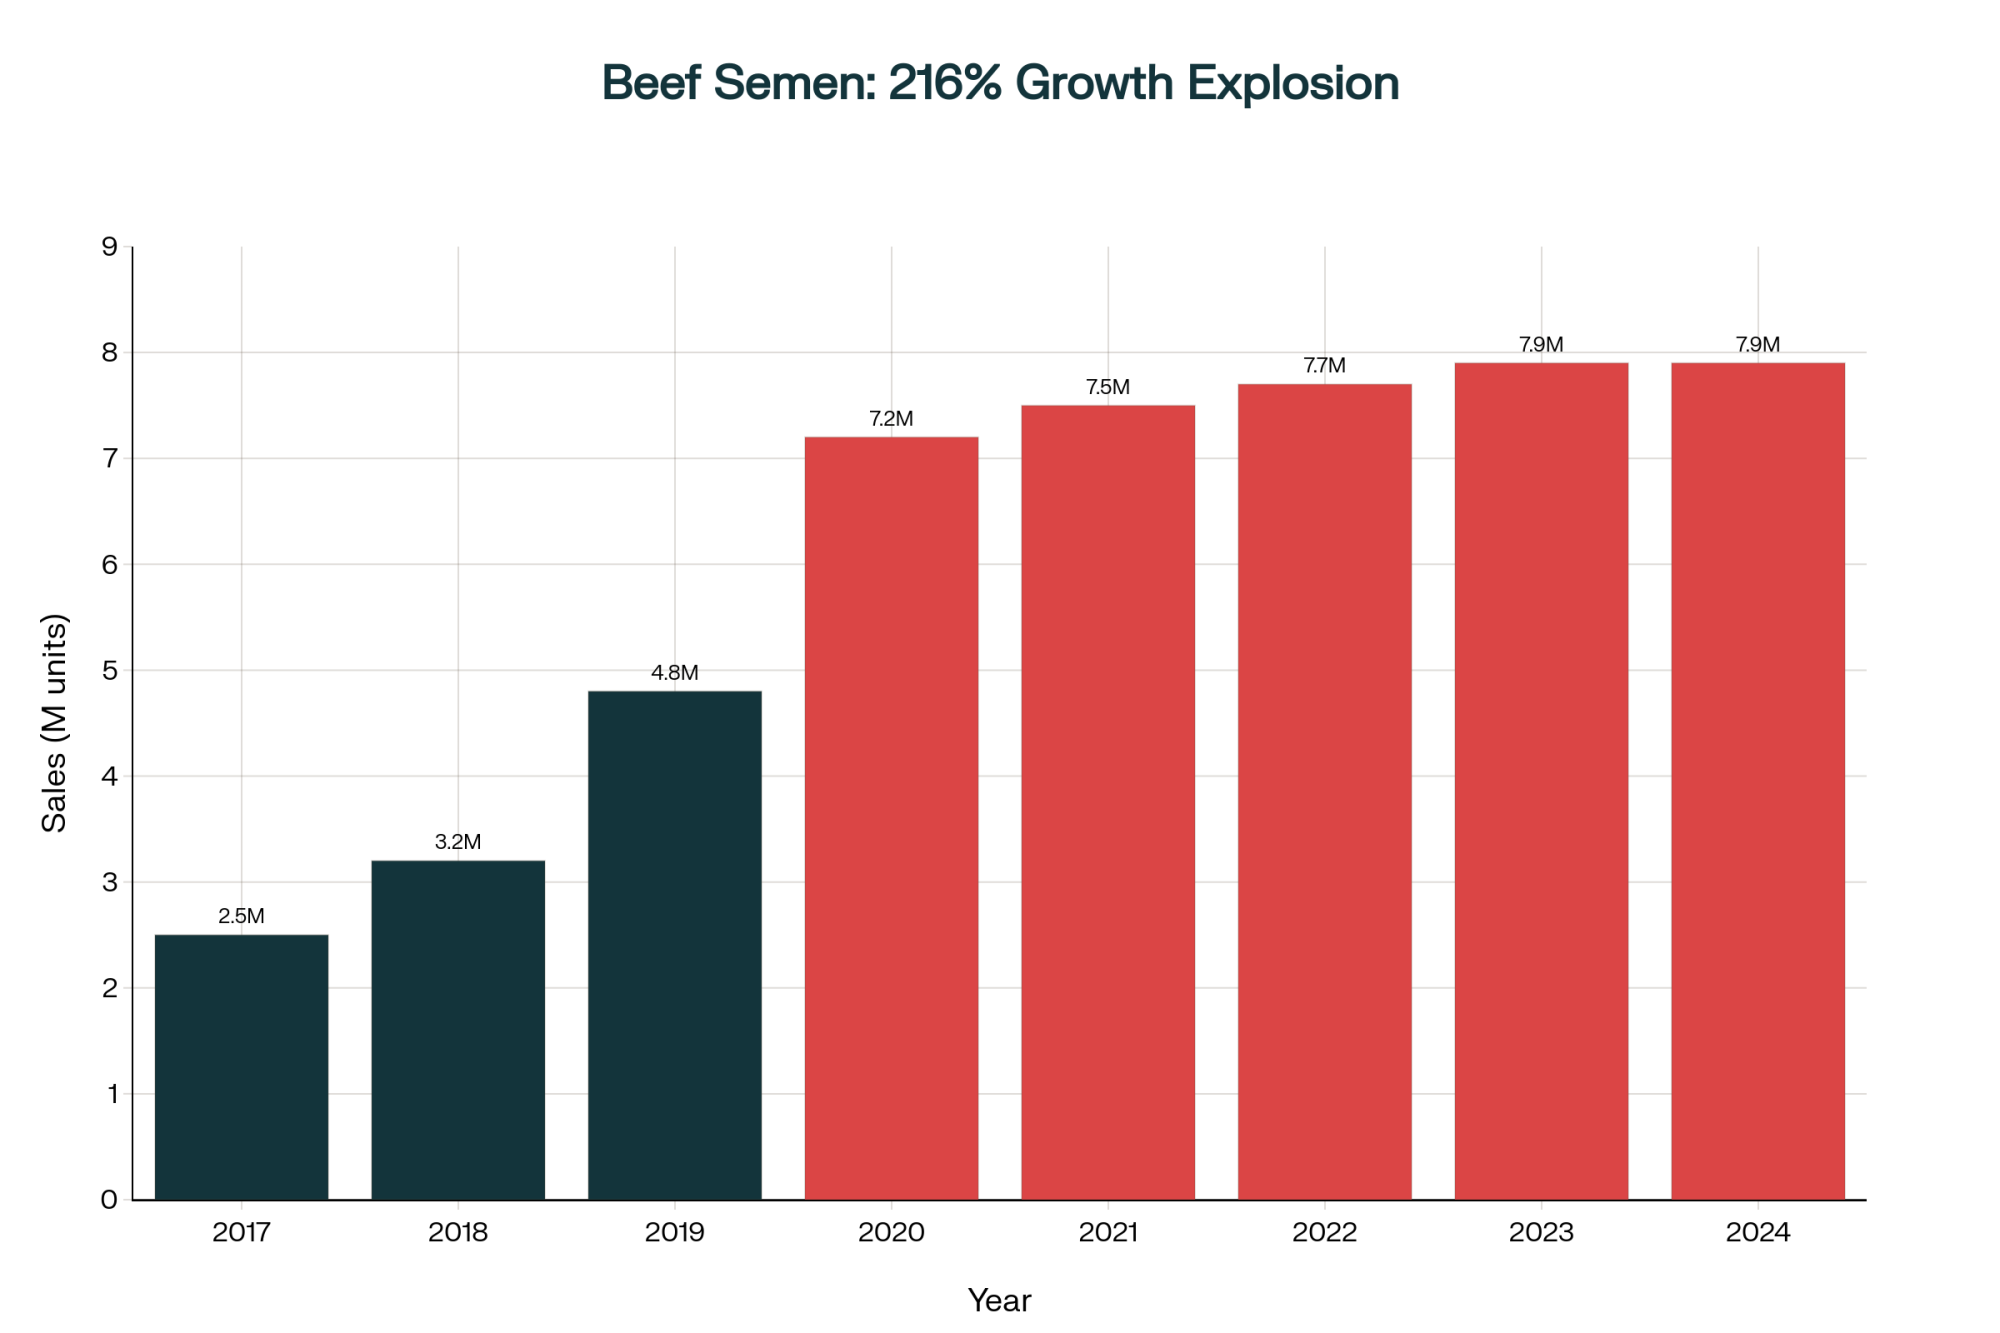
The adoption curve was staggering. Beef semen sales into dairy herds grew from 1.2 million units in 2010 to 9.4 million units by 2023—roughly 84% of which went into dairy cows, according to a 2024 Purina survey. That same survey found almost three-fourths of U.S. dairy farmers are now actively crossbreeding using beef genetics, with another 16% considering it.
CattleFax puts the production numbers in starker terms: beef-on-dairy calf production jumped from 50,000 head in 2014 to 3.22 million in 2024, with projections reaching 5–6 million head by 2026. These crossbred cattle now account for 12–15% of fed beef harvests.
Every one of those calves was a dairy heifer that wasn’t born.
The Pipeline Math That’s Already Locked In
Sarina Sharp at the Daily Dairy Report flagged in early 2024 that dairy heifer inventories had declined for six consecutive years. USDA’s January 2025 snapshot put milk replacement heifers at 3.914 million head—the lowest since 1978, a full 18% below 2018 levels.
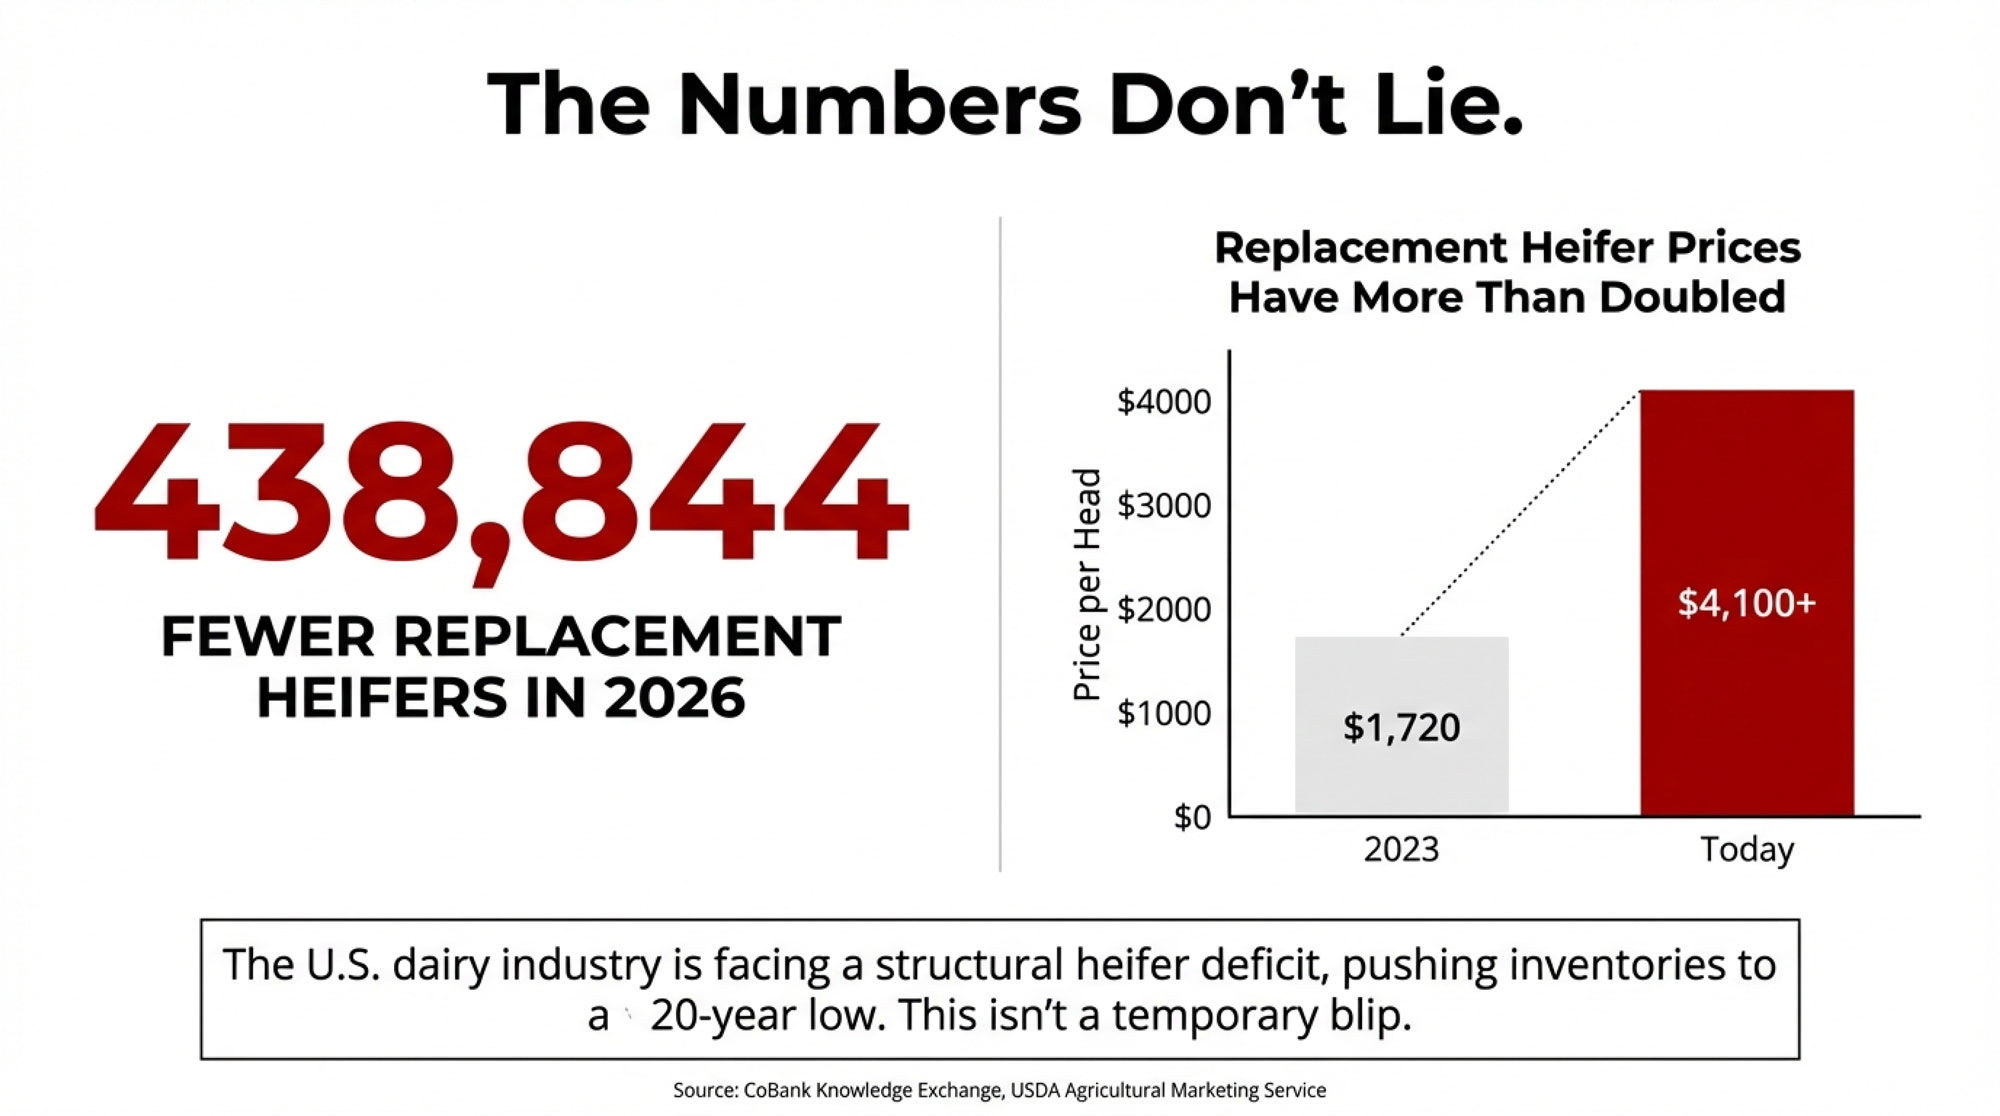
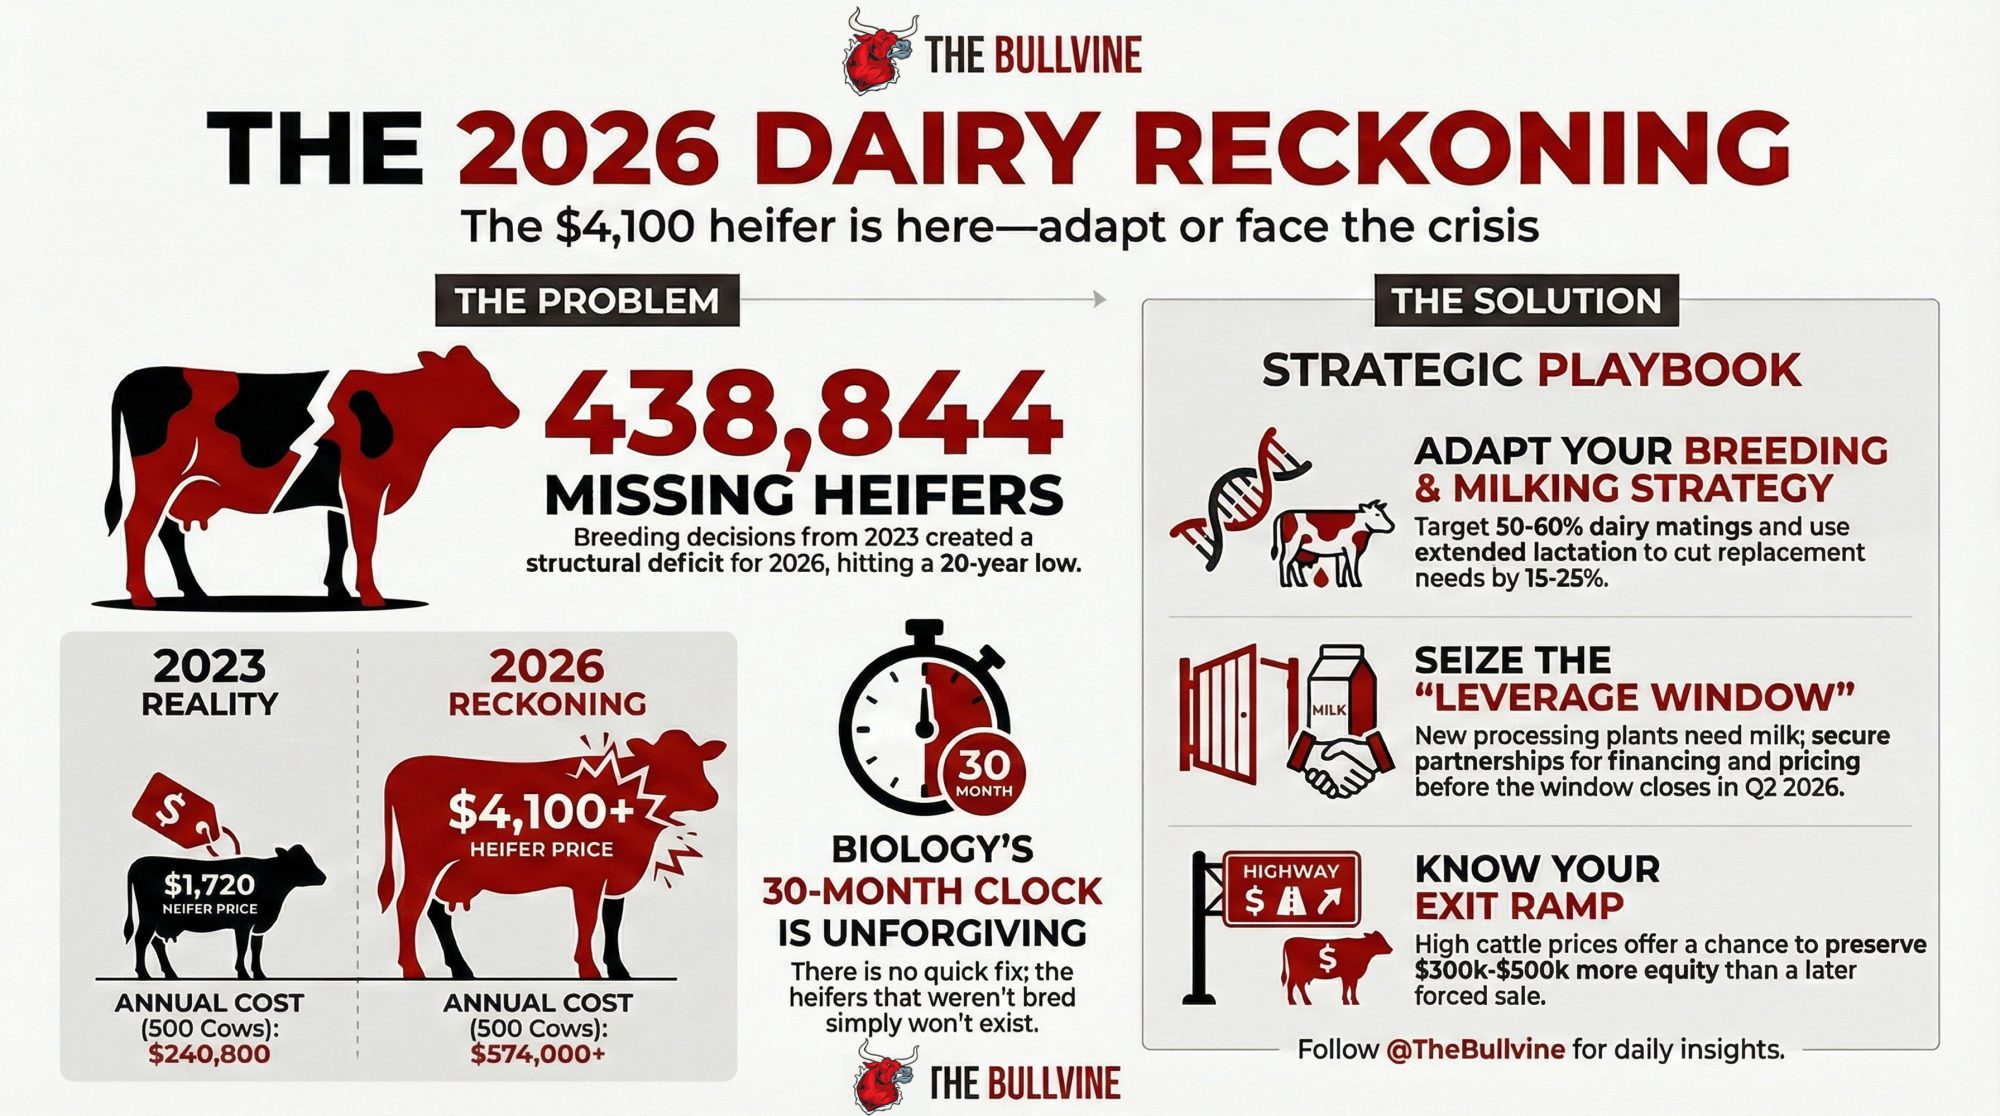
CoBank economist Corey Geiger quantified the gap in an August 2025 report: 357,490 fewer dairy heifers available in 2025, then 438,844 fewer in 2026. Add those up. That’s roughly 800,000 missing replacements across a two-year window. And as Geiger commented: “We don’t see a rebound until 2027, and that will be up 285-thousand, but you’ve got to remember, that’s going to be after 800-thousand fewer heifers”.
Regional variation tells its own story. Wisconsin replacement values jumped 43% year-over-year between October 2023 ($1,990) and October 2024 ($2,850), according to USDA data. Yet Wisconsin actually gained 10,000 heifers while Texas lost 10,000 head. “Watch” on the Northwest (Idaho/Washington), where prices have reportedly hit that $4,000+ “north of the border” threshold. That divergence comes down to processor relationships and infrastructure, not just breeding decisions.
The Beef-on-Dairy Miscalculation
Here’s what producers believed: beef-on-dairy premiums were an additive income. Extra revenue layered on top of normal operations without meaningful trade-offs.
Here’s what actually happened.
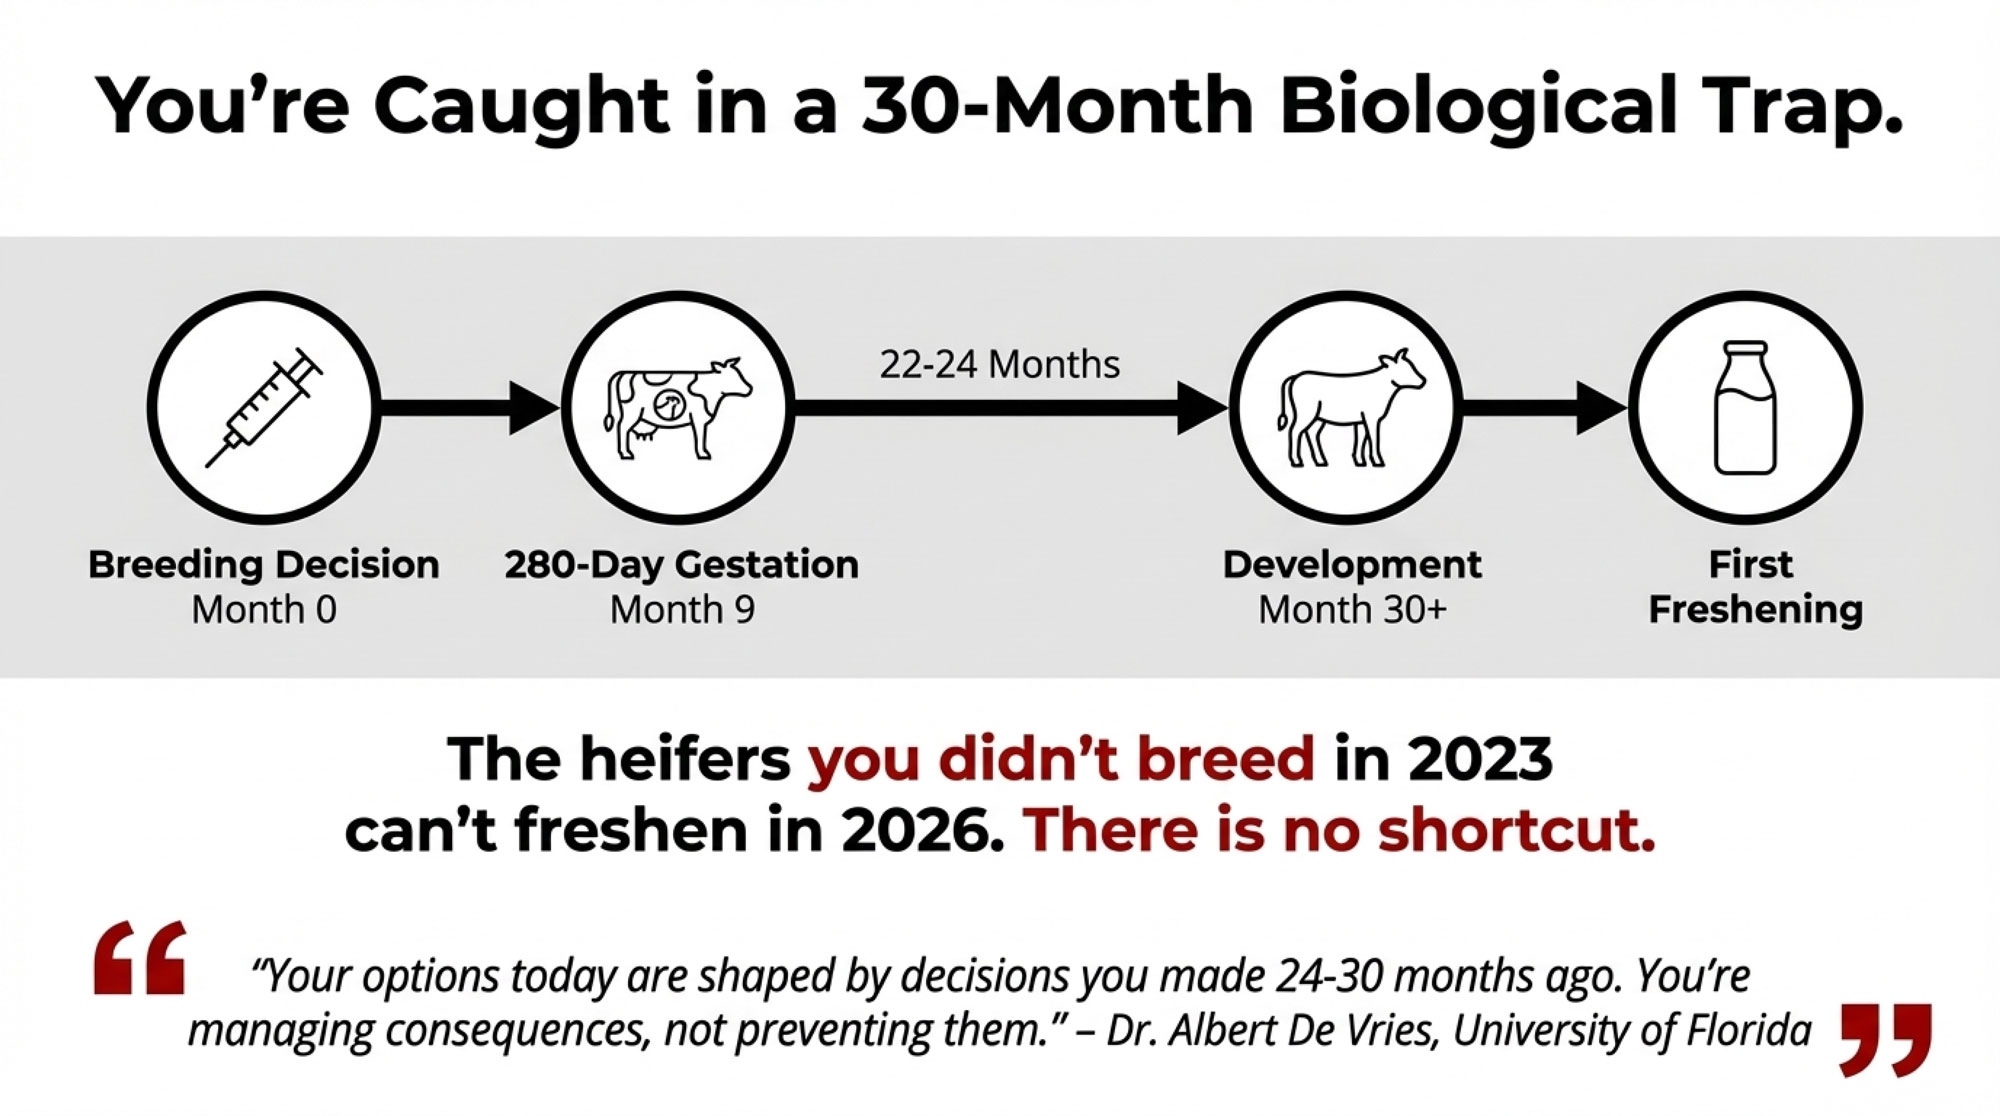
When beef-on-dairy calves climbed toward the $1,400 average that Purina’s Laurence Williams cited by 2024-2025, producers weren’t making a one-time decision. They were depleting a pipeline that takes three-plus years to rebuild. Every beef breeding looked like a $900 gain. What nobody penciled in was the replacement heifer that wouldn’t exist three years later—an animal that now costs $1,870 more than it did in 2019.
CoBank’s analysis is blunt: from conception to a cow in the milk string is a “three-plus year proposition”. You can’t undo aggressive beef breeding quickly.
And the 2024 NAAB semen sales data reveals how producers tried to have it both ways. Gender-sorted dairy semen surged 17.9%—an additional 1.5 million units. But beef semen held steady at 7.9 million units. No retreat.
How This Lands on Real Operations
When Mike North of Ever.Ag started seeing two-to-three-day-old beef-cross calves bringing $1,000, his framing captured the logic perfectly: “Why feed an animal for 18 months when the money’s sitting there at day three?”
But North also flagged the inflection point when the math flipped: “Some animals moving in the northwest last week were north of $4,000 an animal. That’s a pretty tall price, and so now, guess what? We’re seeing people starting to switch some of their breeding back to that replacement animal”.
One Minnesota producer’s current allocation illustrates the hedging strategy most operations have adopted: 10% of cows bred to sexed semen, while the rest go to beef; for heifers, 50% bred to sexed semen, while the other half go to beef. That’s not a correction—it’s a bet that partial measures will thread the needle.
Meanwhile, culling rates have collapsed. Dairy farmers have sent 611,600 fewer cows to slaughter since Labor Day 2023, according to CoBank’s analysis of USDA data. That keeps milk flowing but ages the herd.
Running the Numbers: Gross Premium vs. Net Replacement Cost
Here’s the full picture for a typical 200-cow Holstein operation in the Upper Midwest:
The spread:
Beef-cross premium over Holstein bull: ~$750-$1,200/head (2024-2025 market)
Incremental heifer cost increase (2019 vs 2025): ~$1,870/head at national averages
The math: If your replacement ratio means 1.5-2 beef breedings per “lost” heifer, and premiums average $900, you’ve captured $1,350-$1,800 in gross premium. But across the industry, the collective shift toward beef breeding drove replacement heifer costs up $1,870 per head. For a 200-cow operation needing 70-80 replacements annually (35-38% turnover), that gap represents $126,000-$144,000 in additional replacement capital over 24 months—if you can find animals to buy at all.
Metric
Value
Notes
Herd Size
200 cows
Typical Upper Midwest operation
Annual Replacement Rate
35-38%
70-76 replacements needed yearly
Beef-Cross Premium (2024-25)
$750-$1,200/head
Average $900 across regions
Gross Premium Captured
$1,575/replacement
Assumes 1.75 breedings per heifer @ $900
Heifer Cost Increase (2019-2025)
+$1,870/head
From $1,140 to $3,010 national average
Net Gap per Replacement
-$295/head
Premium didn’t cover cost inflation
Total Additional Capital (24 months)
$126,000-$144,000
For 140-152 replacements over 2 years
Critical Time Horizon
2026-2027
When depleted 2022-23 pipeline hits
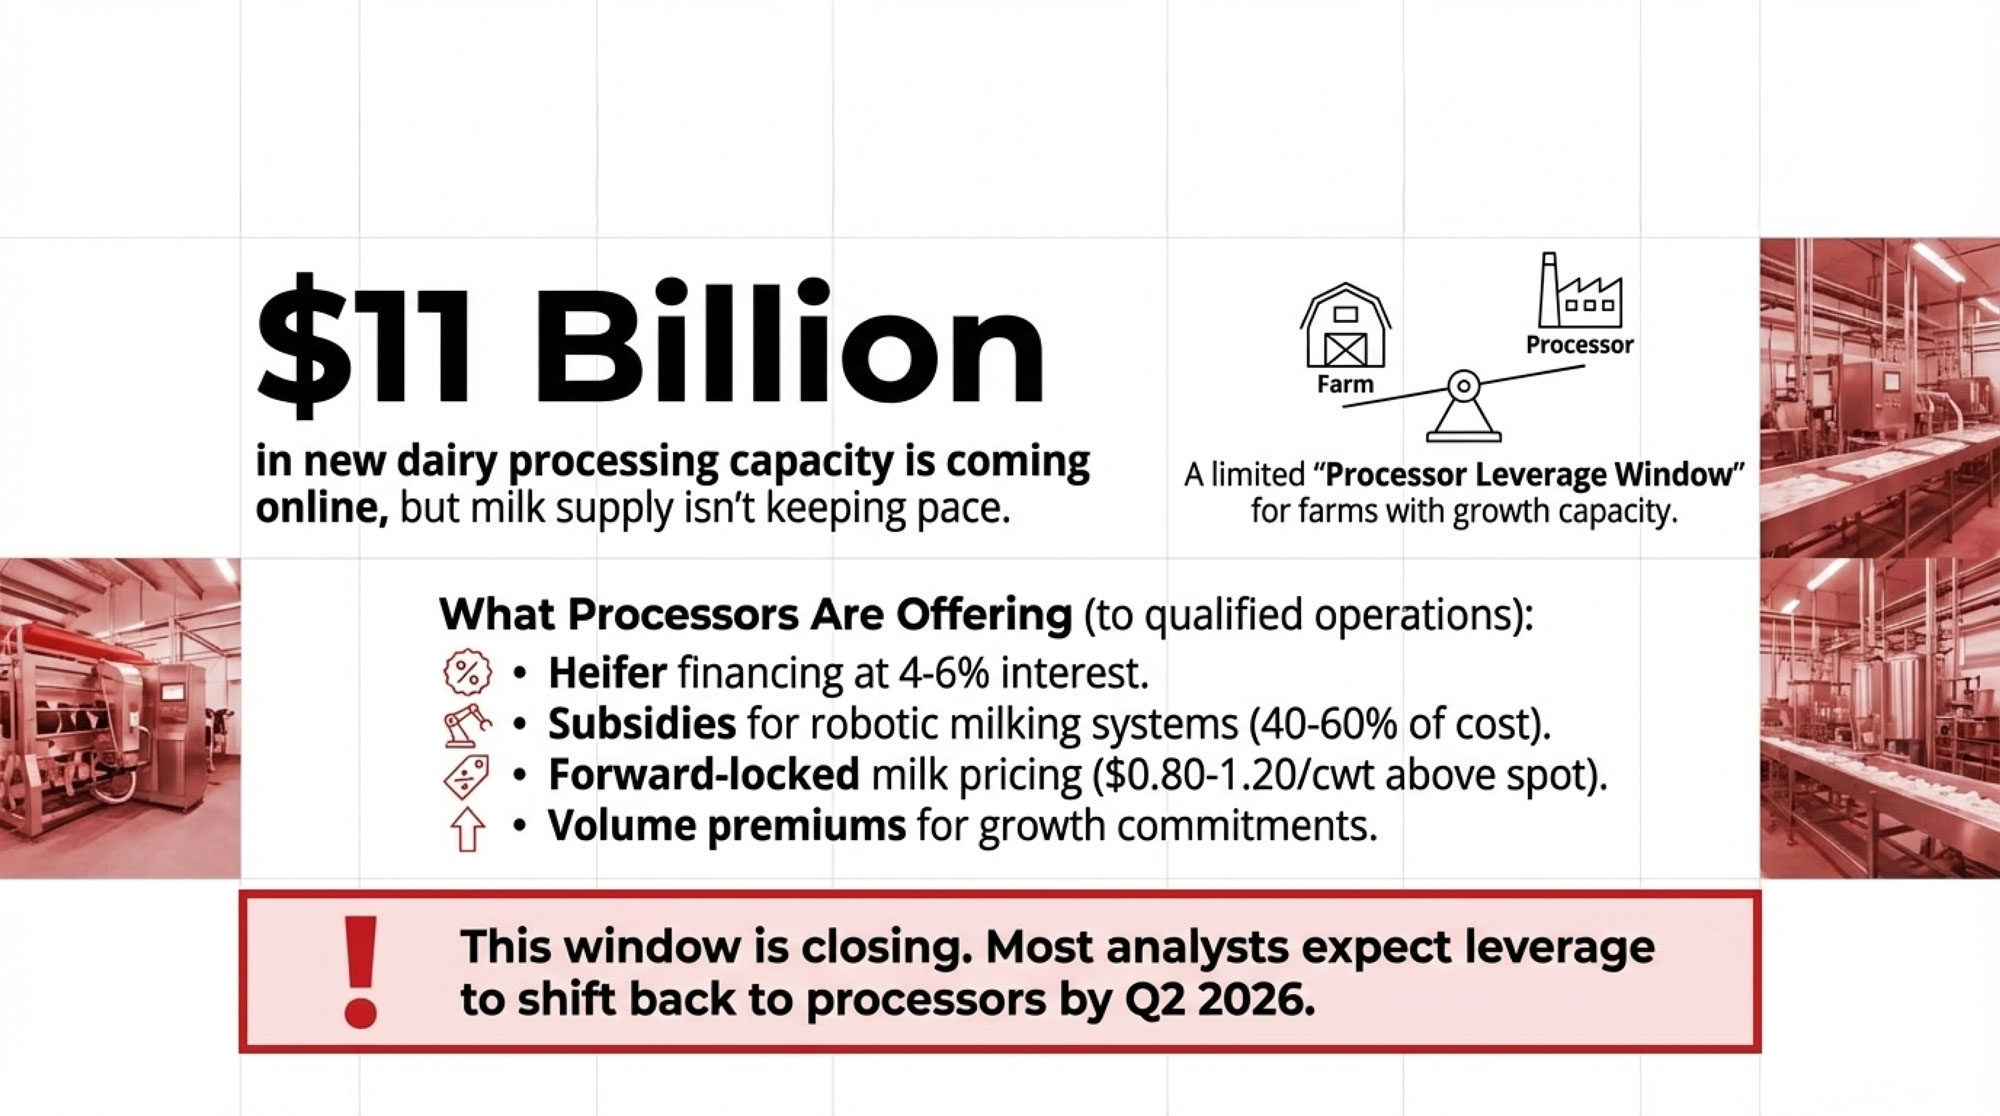
And here’s the kicker: The $10 billion in new dairy plants are set to come online through 2027, meaning processor demand for milk will keep climbing even as replacement supply stays pinched.
Four Paths Forward—And Where Each Can Backfire
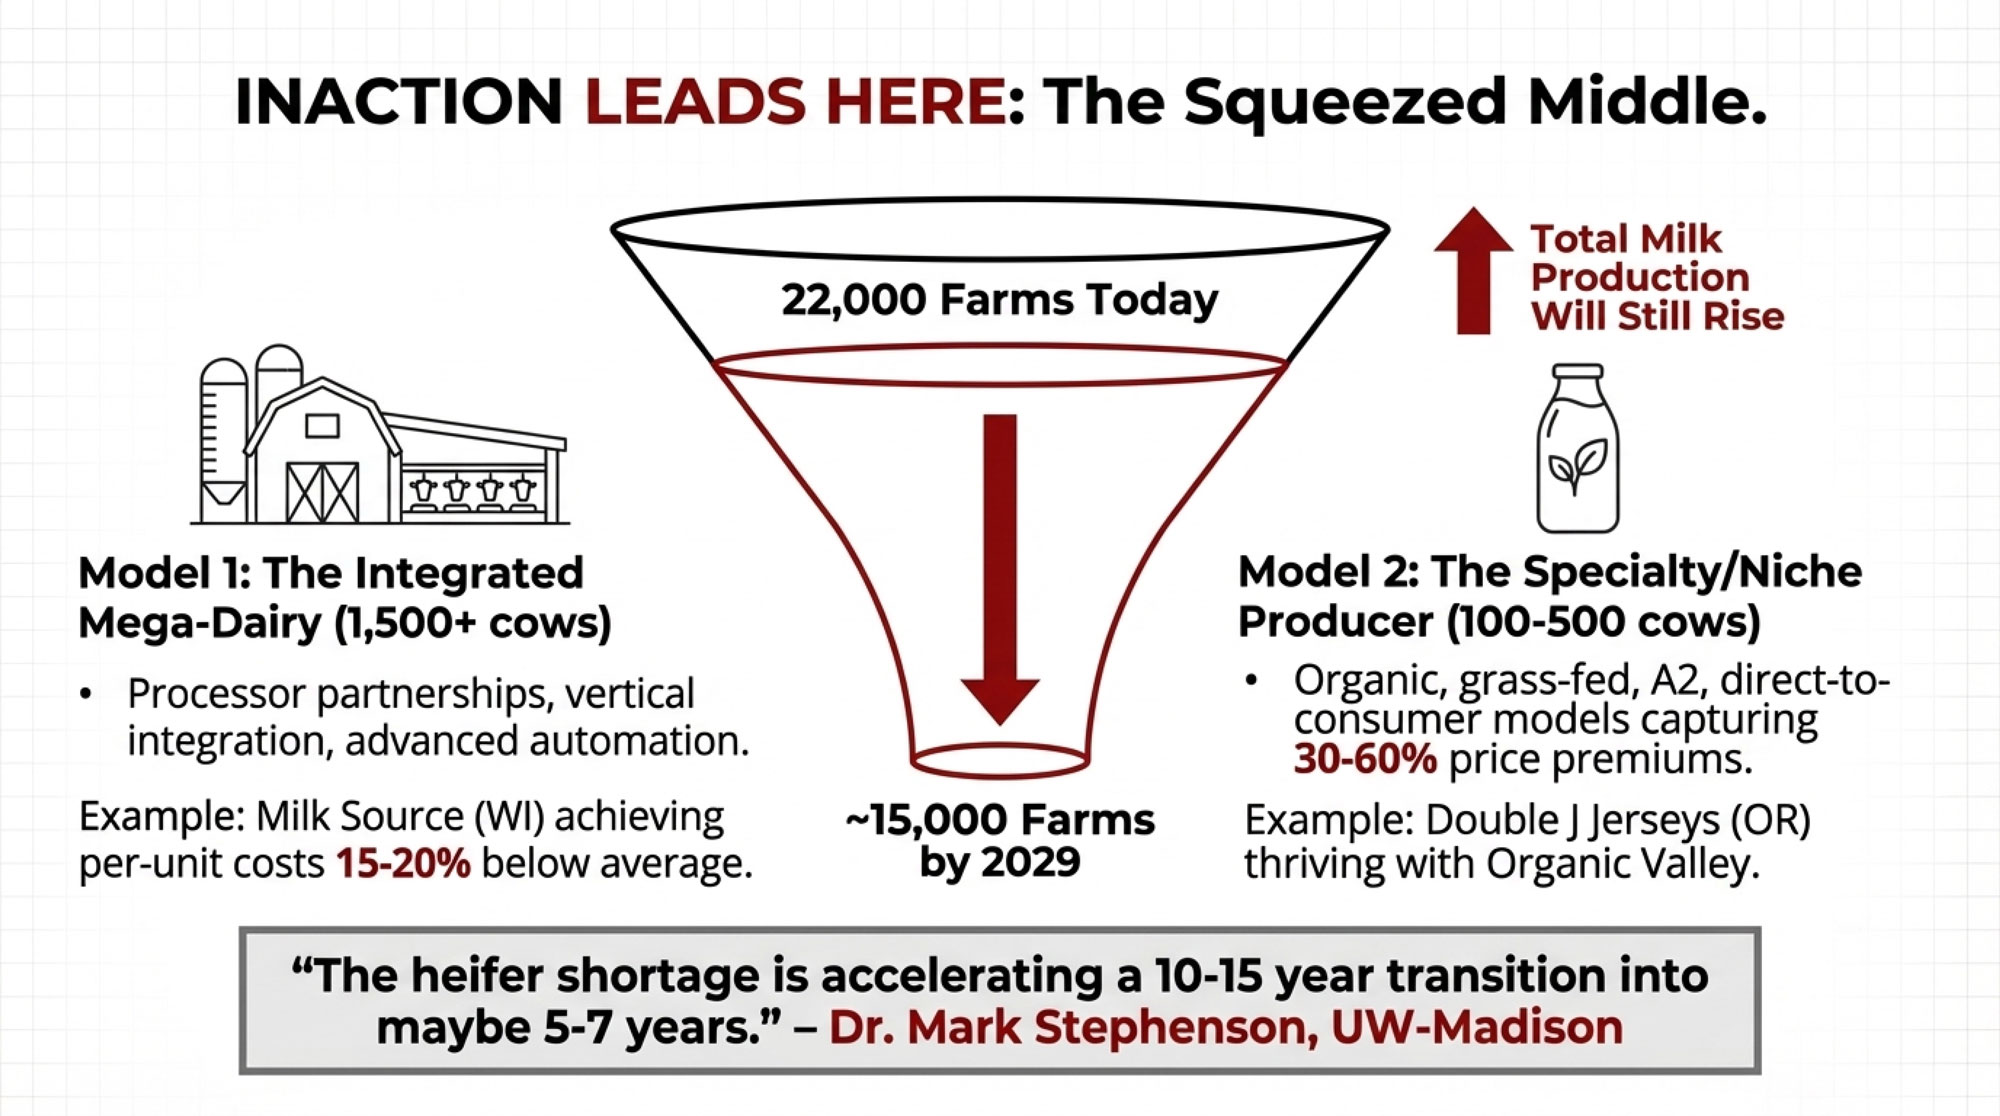
Chris Wolf’s Michigan State analysis of 14,824 farm records found that performance variation among small farms is 38% farm-related compared to only 15% for large farms. Your response to this crisis matters more at 200 cows than at 2,000.
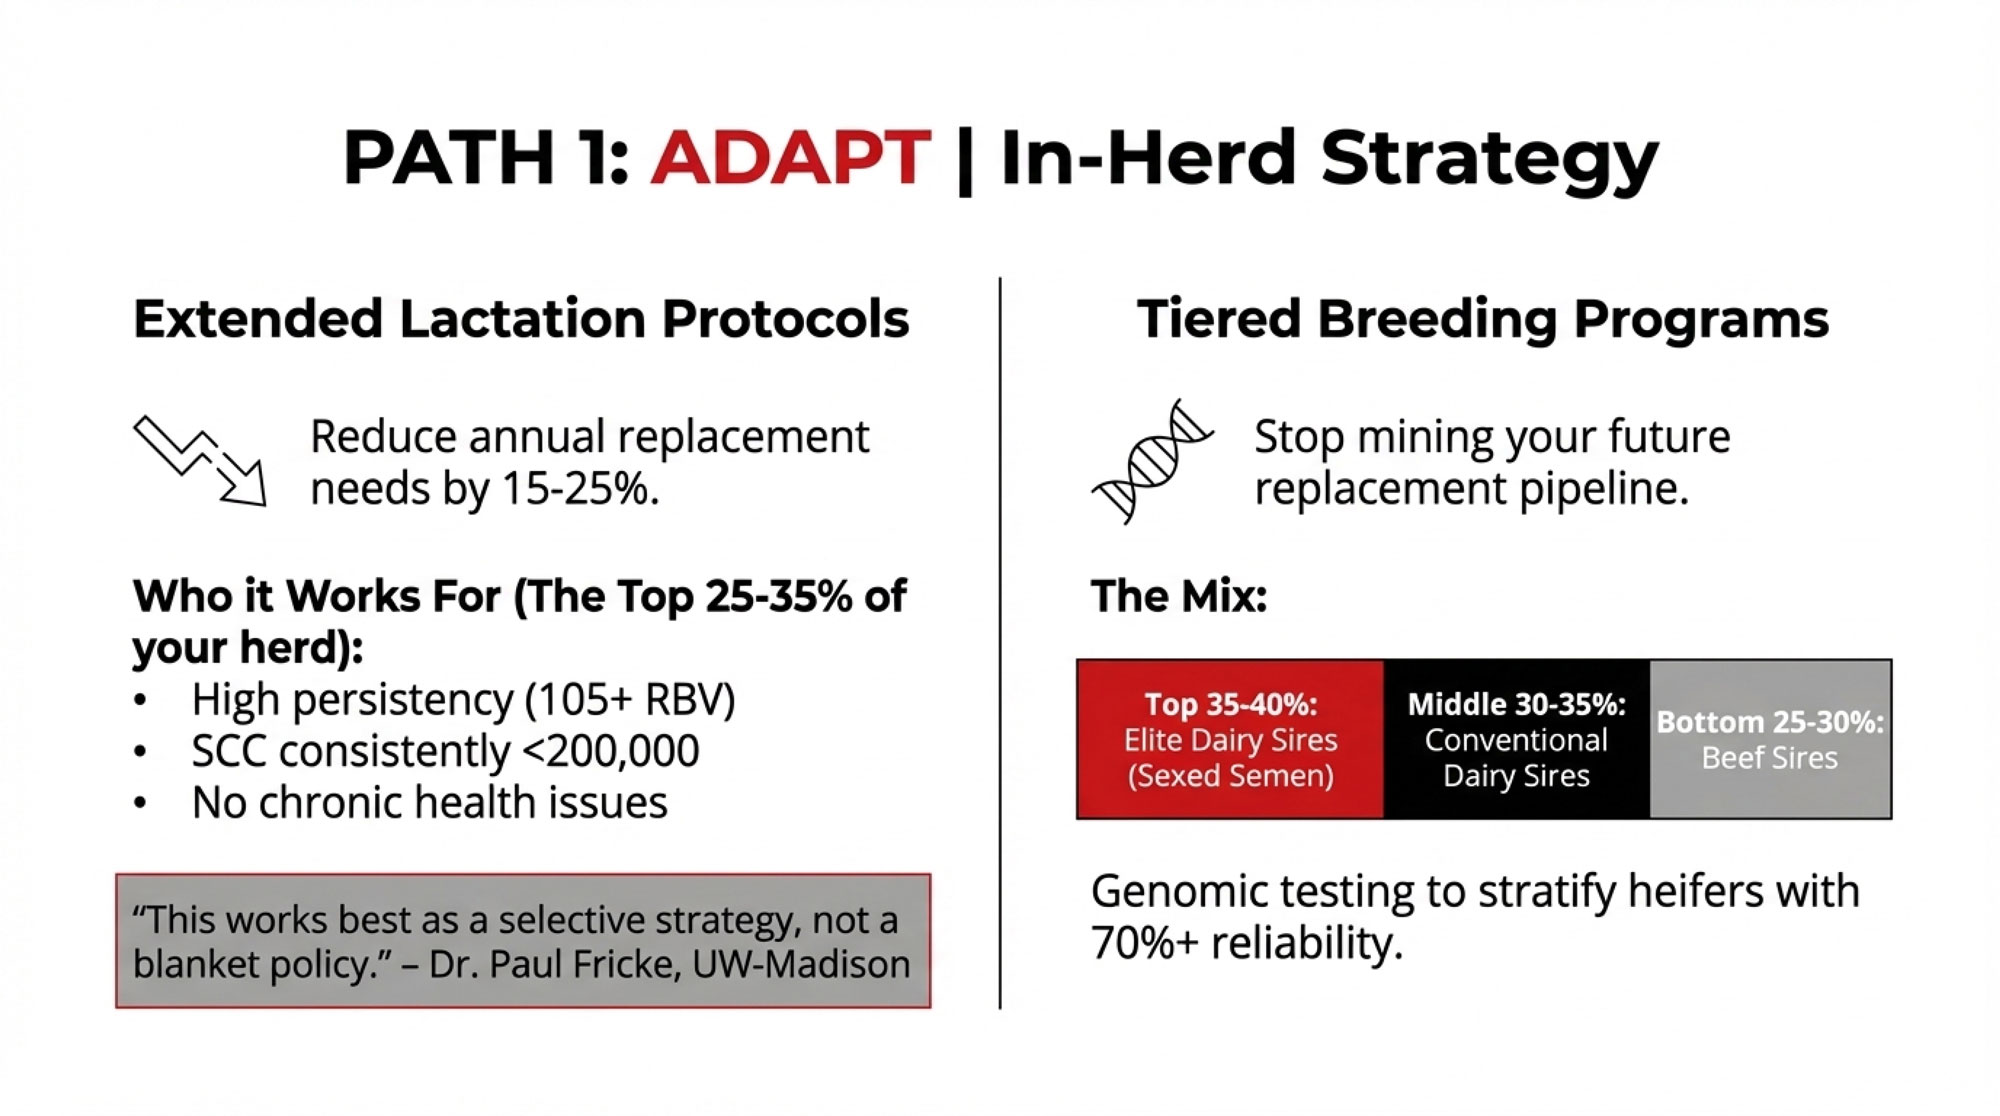
Path 1: Breeding Rebalance
Path 2: Reduce Culling
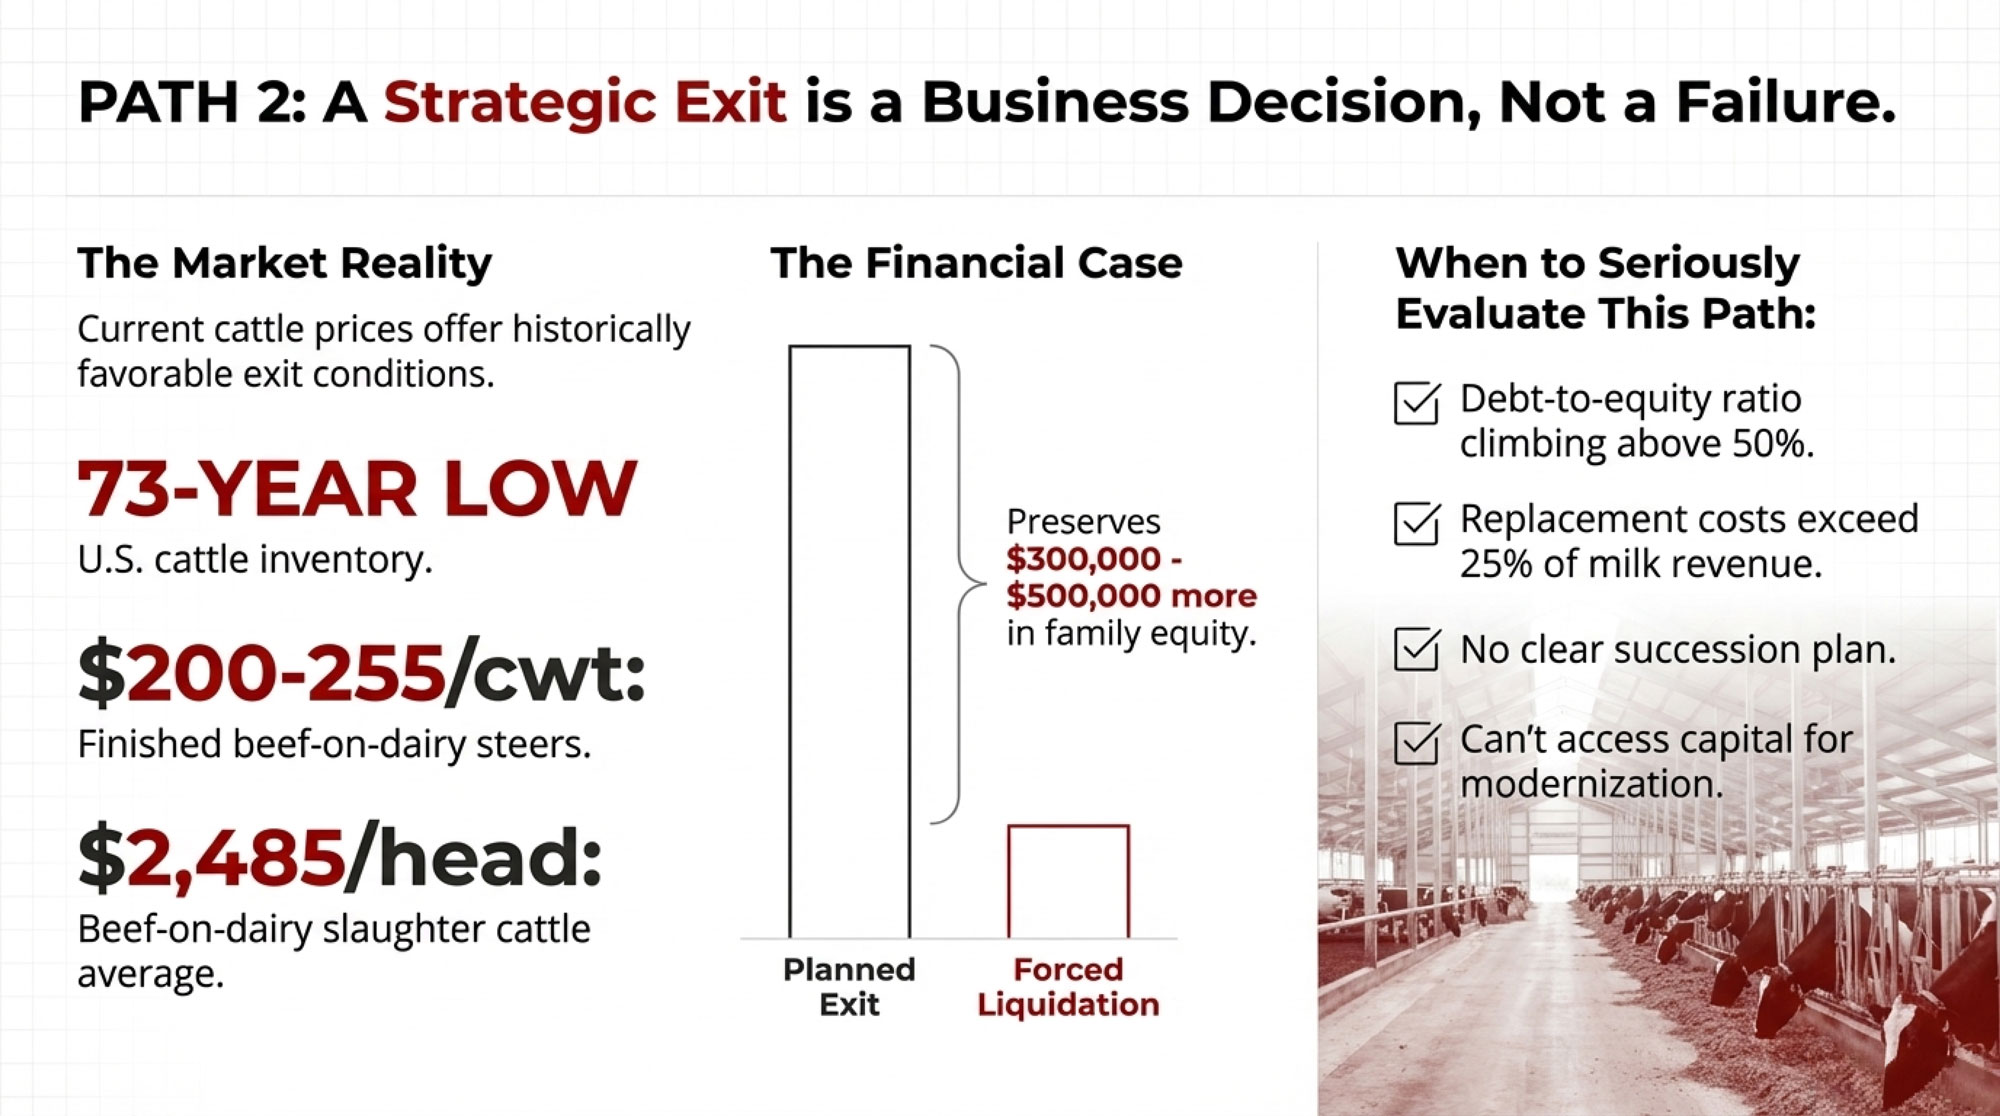
Path 3: Strategic Exit
Path 4: Processor Lock-In
Best for
Herds that can still course-correct the pipeline
Healthy older cows; buys time
Monthly losses; owners near retirement
Stable herds that can prove supply
Requires
Genomic testing ($15-45/head); sexed dairy on top 35-40%
Transition management; accept lower avg production
Honest market assessment before values erode
Documented 24-month replacement pipeline
⚠️ Backfire risk
Below 18% pregnancy rate, can’t maintain pipeline AND premiums
Failing to deliver on the supply commitment damages the relationship
Key threshold
21-day pregnancy rate ≥20% for optimal beef allocation
Monitor herd age distribution and SCC quarterly
Compare current liquidation value vs. projected 2027 value
Can you document pipeline sustainability?
Path 1 is where the Journal of Dairy Science analysis matters most: beef semen becomes economically optimal when crossbred calf price hits at least 2x dairy calf price, AND herd achieves ~20% 21-day pregnancy rate. ⚠️ Below 18%, limit beef allocation to 50% maximum. Only about 10% of Florida producers use genomic testing, per University of Florida estimates—adoption rates vary significantly by region.
Path 2 carries a hidden cost. Retaining older cows often means rising somatic cell counts, which can erode quality premiums from your processor—compounding financial strain at exactly the wrong time. Worse, when a wave of retained cows exits simultaneously, you’ve traded a gradual shortage for a cliff.
Path 3 isn’t a failure. With beef cattle prices at record highs, liquidating today captures significantly more equity than waiting until the shortage resolves. ⚠️ Waiting preserves optionality but erodes equity if exit becomes forced rather than chosen.
Path 4 is the angle most producers haven’t considered. Strong signals suggest processors expecting 2-3% milk supply growth and getting 0.4% are becoming choosy about who they keep. If you can document pipeline sustainability, you may find yourself first in line for favorable contract terms as competitors struggle to guarantee supply.
Signals to Watch
Heifer inventory trajectory. CoBank projects inventories won’t normalize until 2027 at the earliest. Watch USDA semi-annual reports for evidence that national heifer numbers have stopped declining.
Regional price spreads. The gap between Wisconsin’s $2,850 and Northwest prices “north of $4,000” reflects infrastructure differences, not just supply. Where does your region sit?
Your own replacement math. How many dairy heifer pregnancies must you generate annually to maintain herd size at the target age structure? If you don’t know that number, you can’t evaluate your breeding allocation.
What This Means for Your Operation
Calculate the real cost, not the gross premium. The $900 beef-cross check was real income—but if replacement costs have jumped $1,500+ per head since 2022, determine whether premiums actually offset that increase or simply deferred it
Run your replacement pipeline projection: at current breeding allocation and reproductive performance, will you have the heifers you need in 2028?
If “hard to breed” or “lower producing” remain your primary beef allocation criteria, the room for instinct-based allocation has narrowed sharply
Check your culling rate—if you’ve dropped below 30%, you’re likely masking a shortage rather than solving it—and check your SCC trends while you’re at it
Ask your processor what they value. If you can demonstrate a documented 24-month replacement pipeline, you may be in a stronger negotiating position than you realize
Opportunity signal: Balanced breeding programs with adequate heifer inventory could mean more favorable processor contracts as competitors struggle to guarantee supply
Key Takeaways
The 800,000-head shortage is locked in through 2026. Breeding decisions made today won’t produce milking cows until 2028-2029. The next 18 months are about managing what’s already baked in.
Don’t confuse gross premium with replacement reality. Across the industry, the collective shift drove replacement costs up $1,870 per head. For operations now buying replacements, the premium captured doesn’t come close to covering the increase in costs.
The 18% pregnancy rate threshold matters. Below that level, aggressive beef allocation creates unavoidable replacement shortfalls regardless of premium levels.
$10 billion in new dairy plants through 2027 means processor demand for milk keeps climbing while replacement supply stays pinched. Processors are likely choosing partners rather than just buying milk.
The Bottom Line
The operations that survive this won’t be those who avoided beef-on-dairy—many of the largest, most sophisticated dairies bred heavily to beef. They’ll be the ones who tracked replacement pipeline math while capturing premiums, rather than assuming the check today wouldn’t create a bill tomorrow.
Where does your operation sit on that spectrum—and what does your 2026 breeding sheet say about the answer?
Complete references and supporting documentation are available upon request by contacting the editorial team at editor@thebullvine.com.
High-Value Crosses: The Next Phase of the Beef-on-Dairy Revolution – Breaks down advanced terminal crossbreeding strategies that maximize carcass value without sacrificing your herd’s future. It delivers the blueprints for “Elite Beef” programs that command significantly higher premiums than standard auction barn crosses.
The Sunday Read Dairy Professionals Don’t Skip.
Every week, thousands of producers, breeders, and industry insiders open Bullvine Weekly for genetics insights, market shifts, and profit strategies they won’t find anywhere else. One email. Five minutes. Smarter decisions all week.
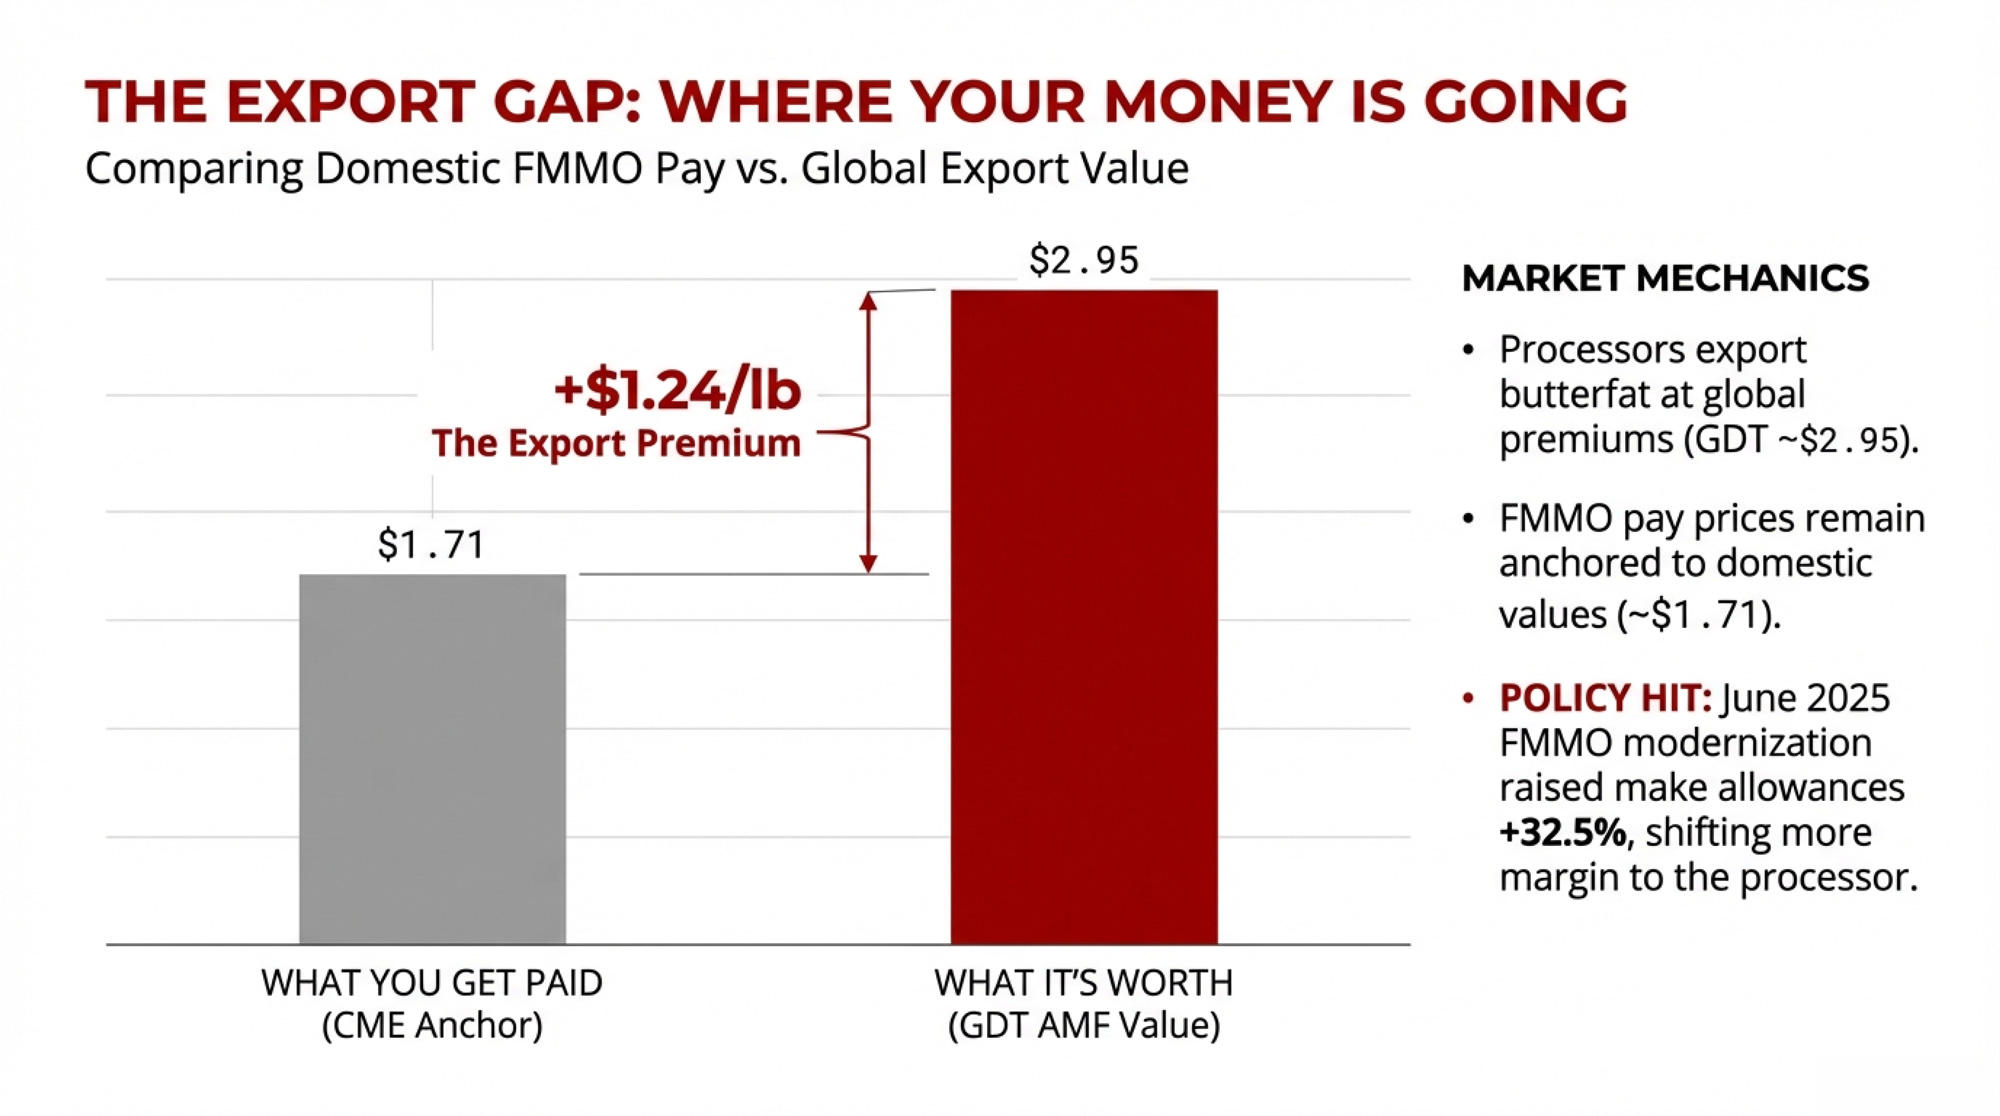
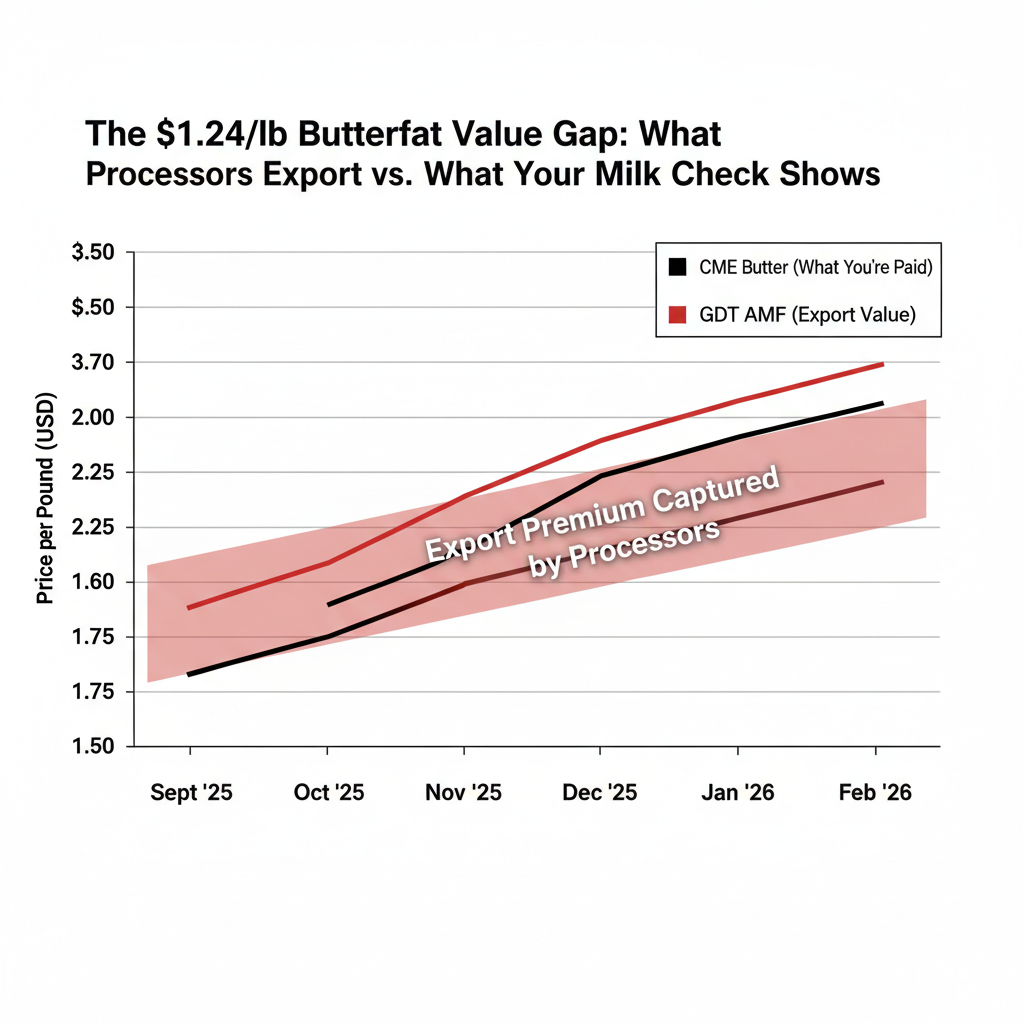
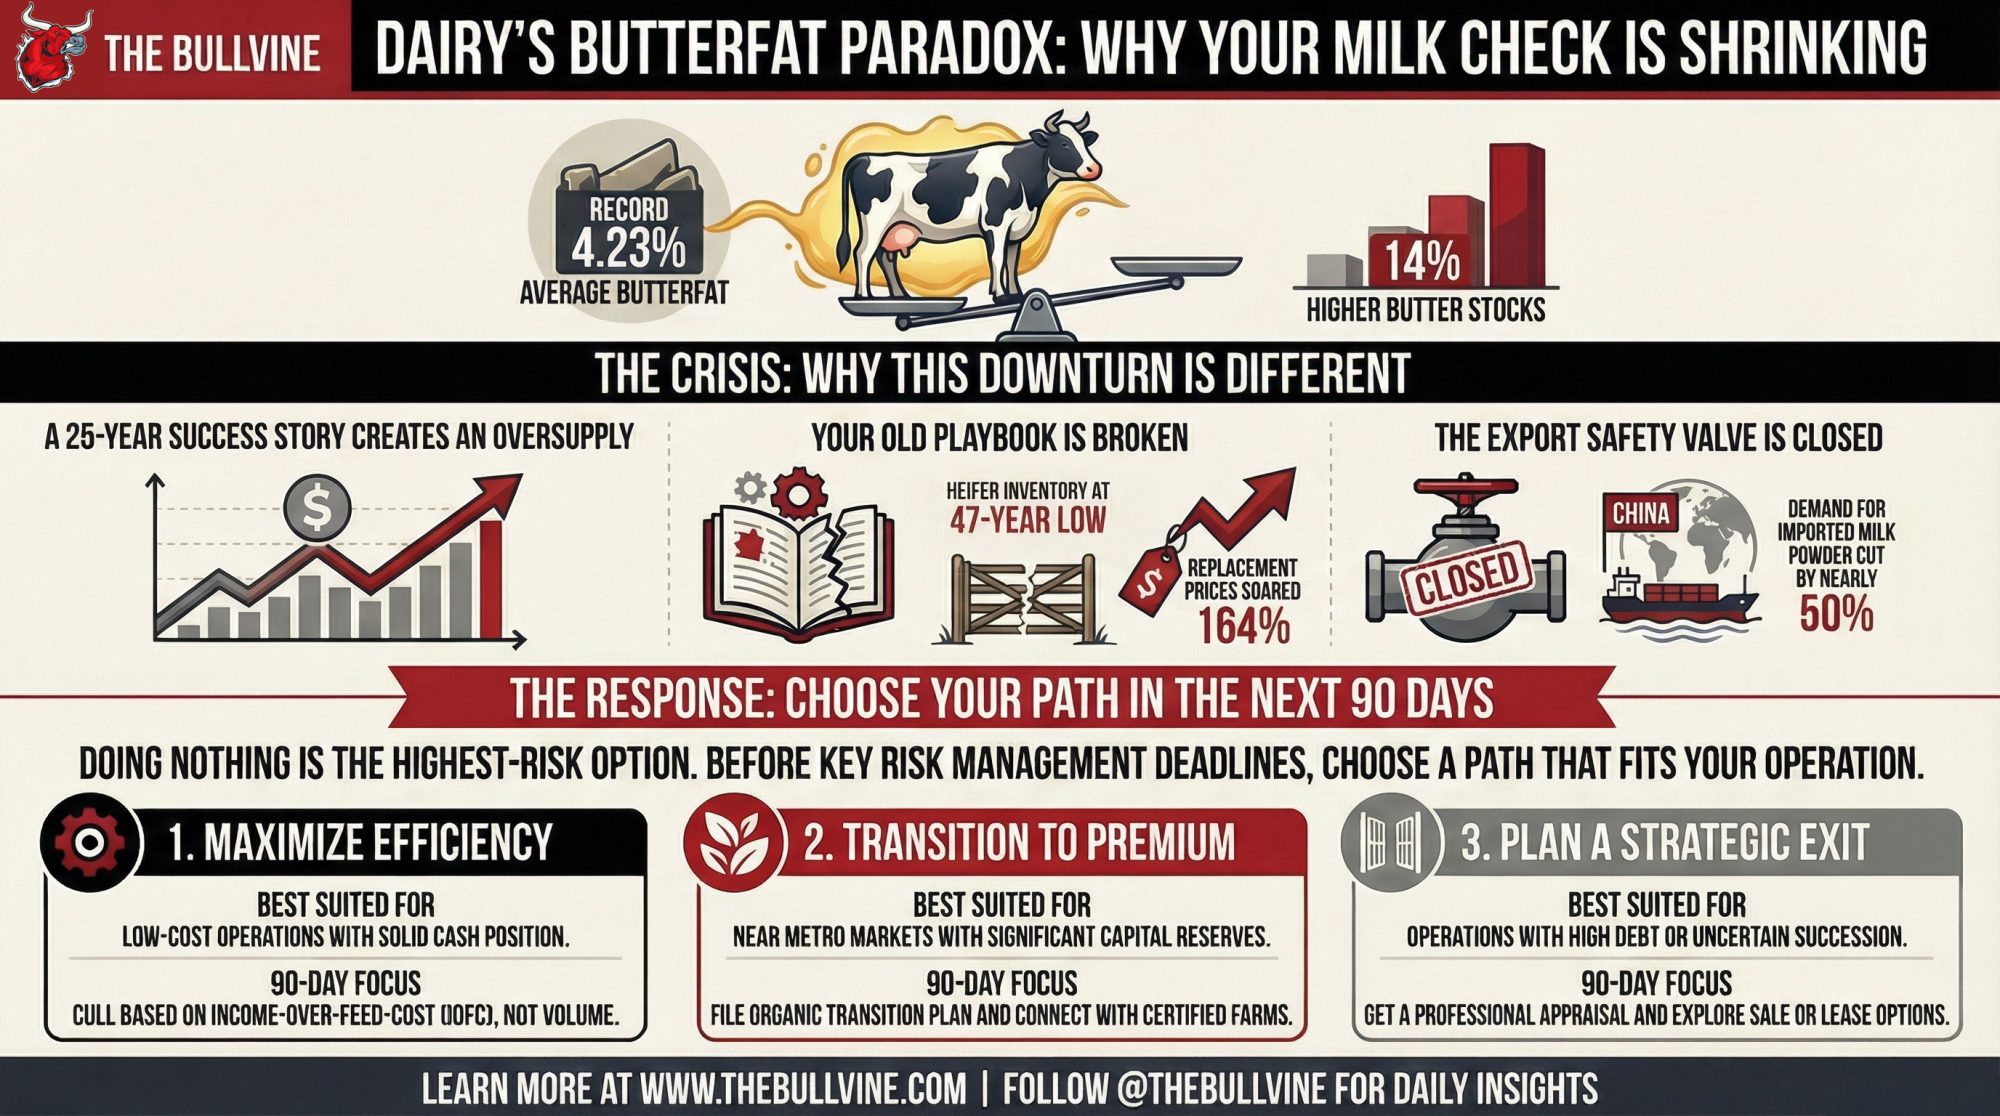
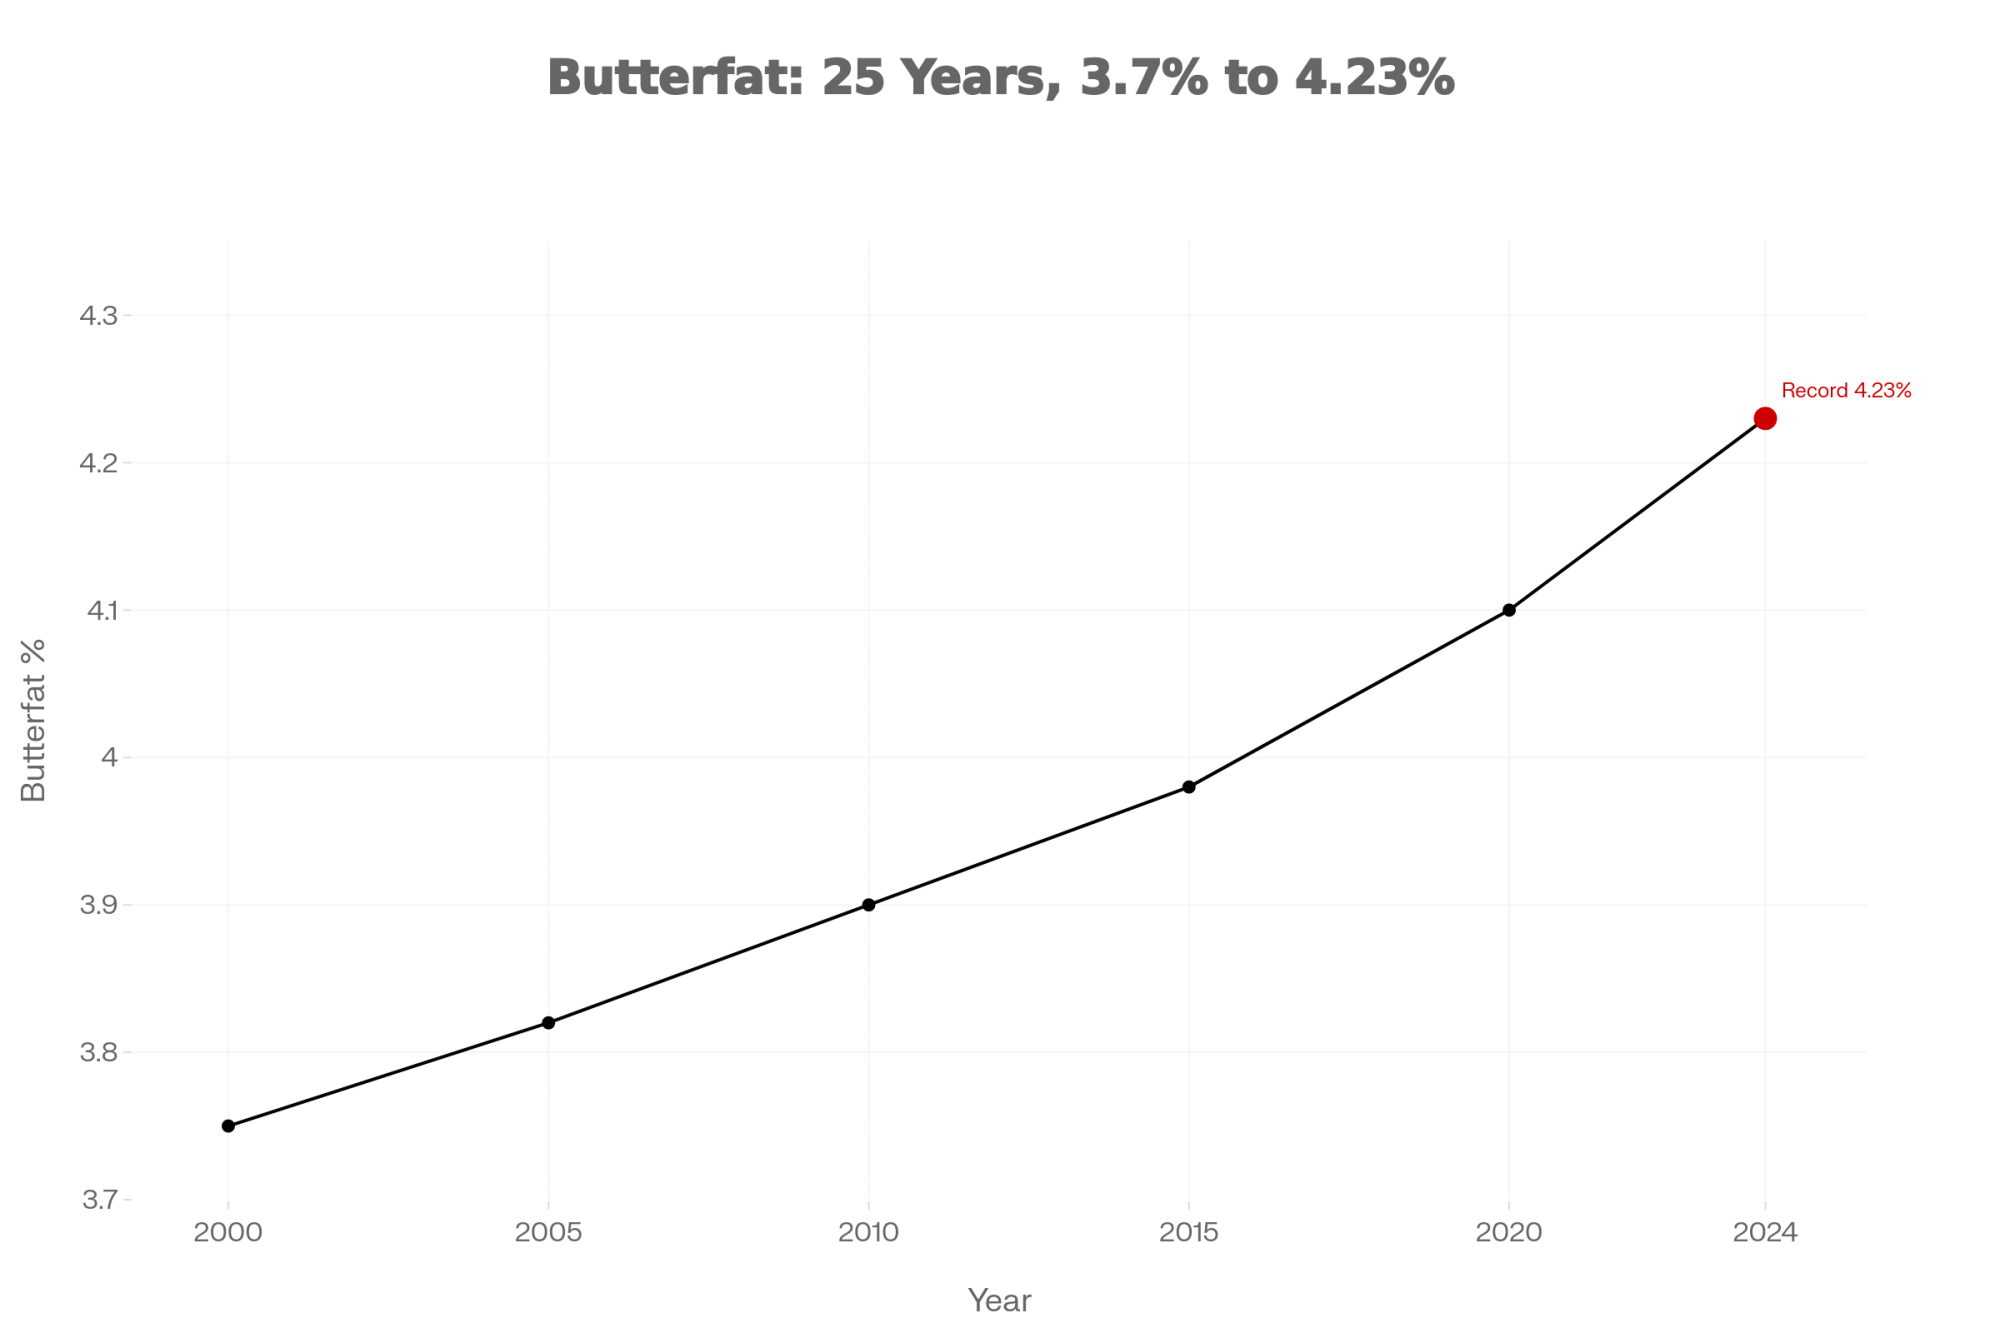
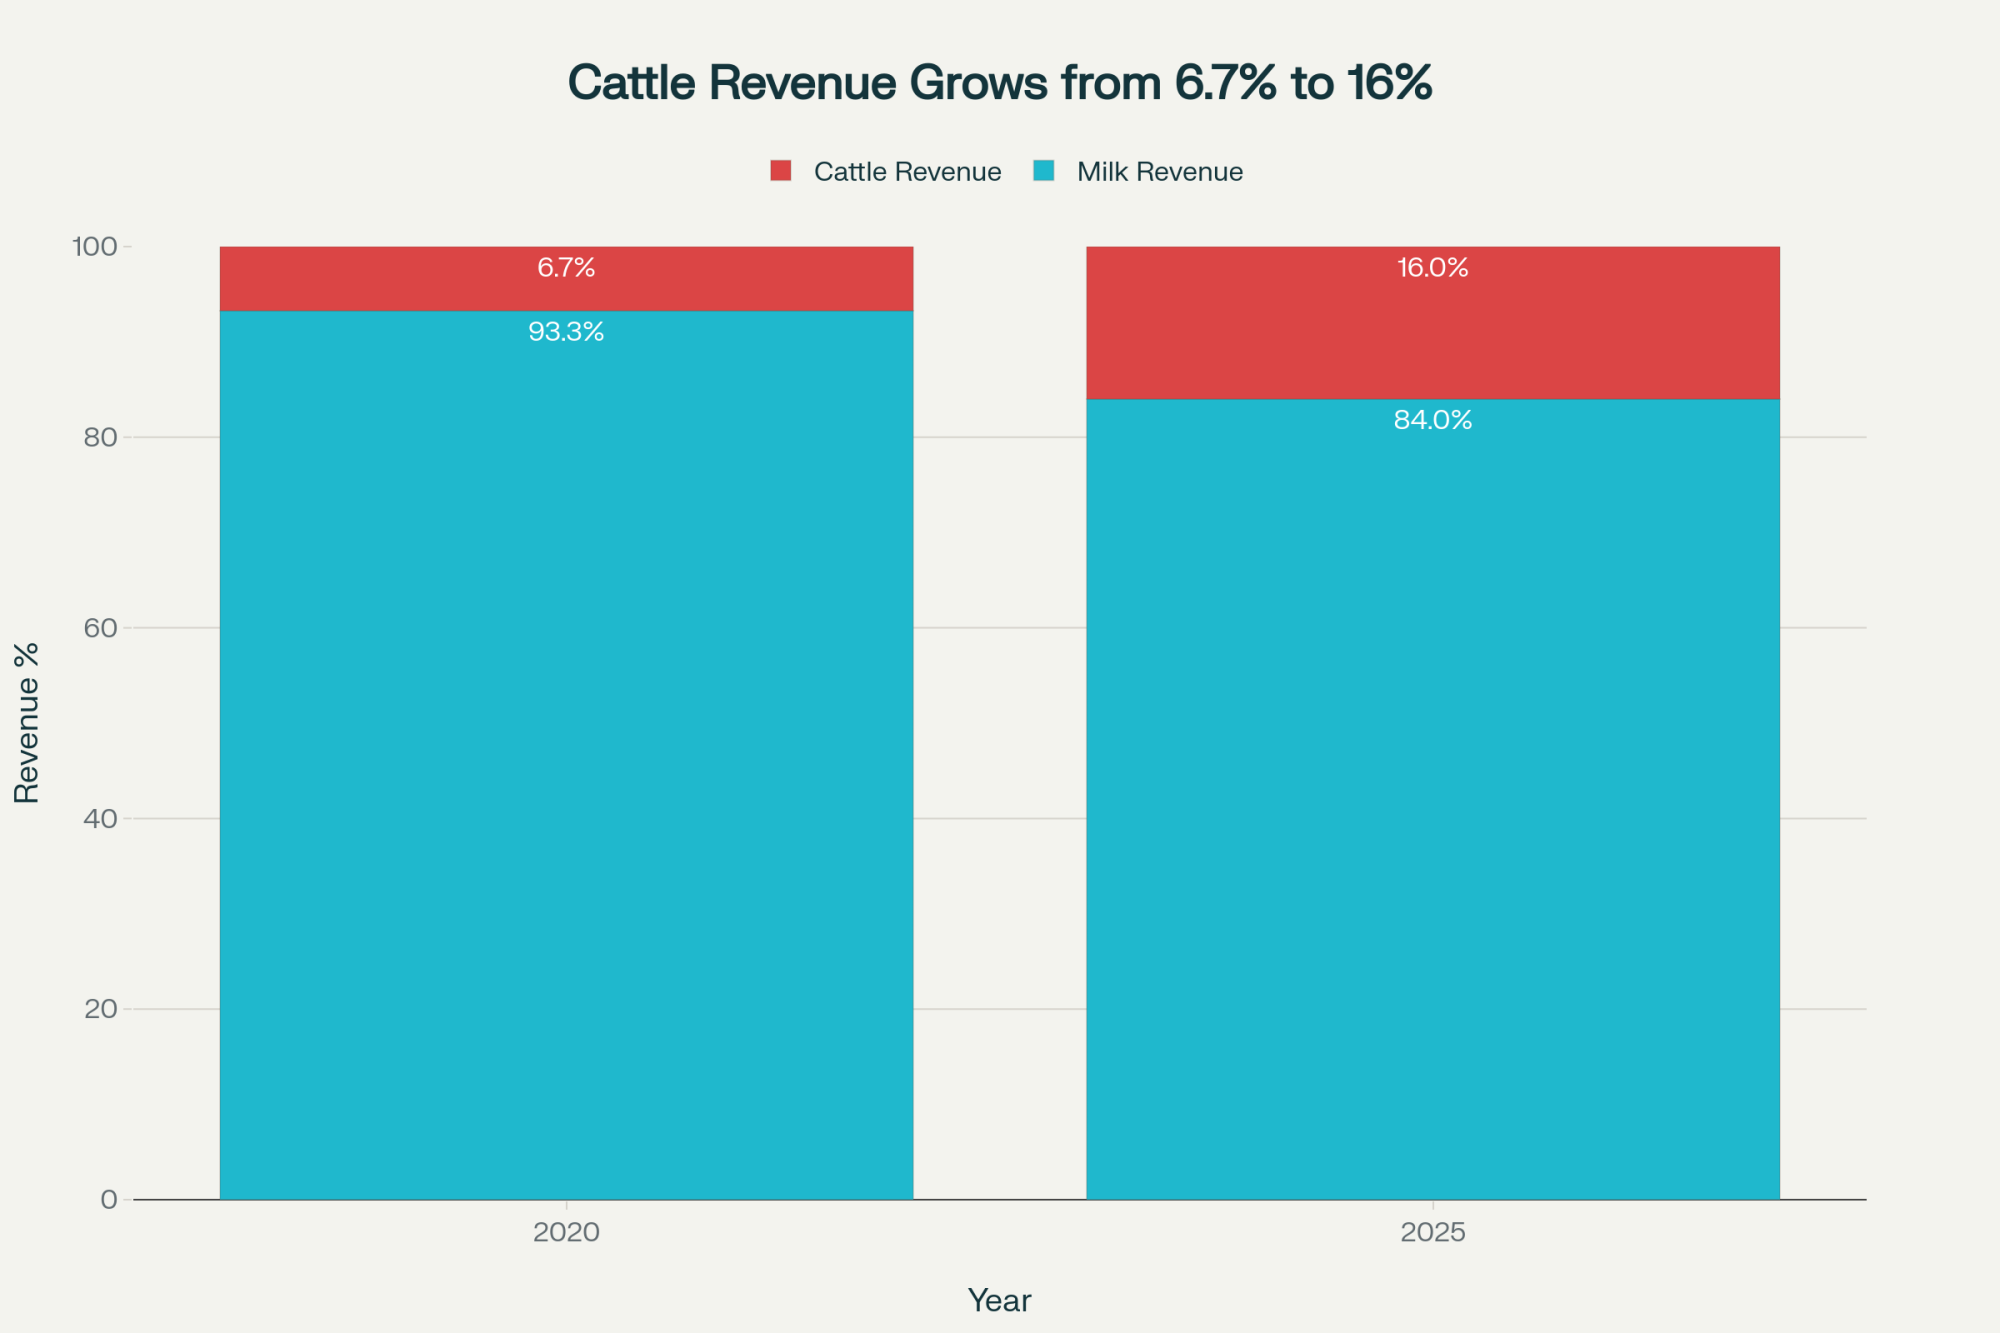
Processors are exporting your butterfat at roughly $2.95/lb while the FMMO pays you based on ~$1.71. Here’s how that gap formed — and what you need to lock in before spring flush closes the window.
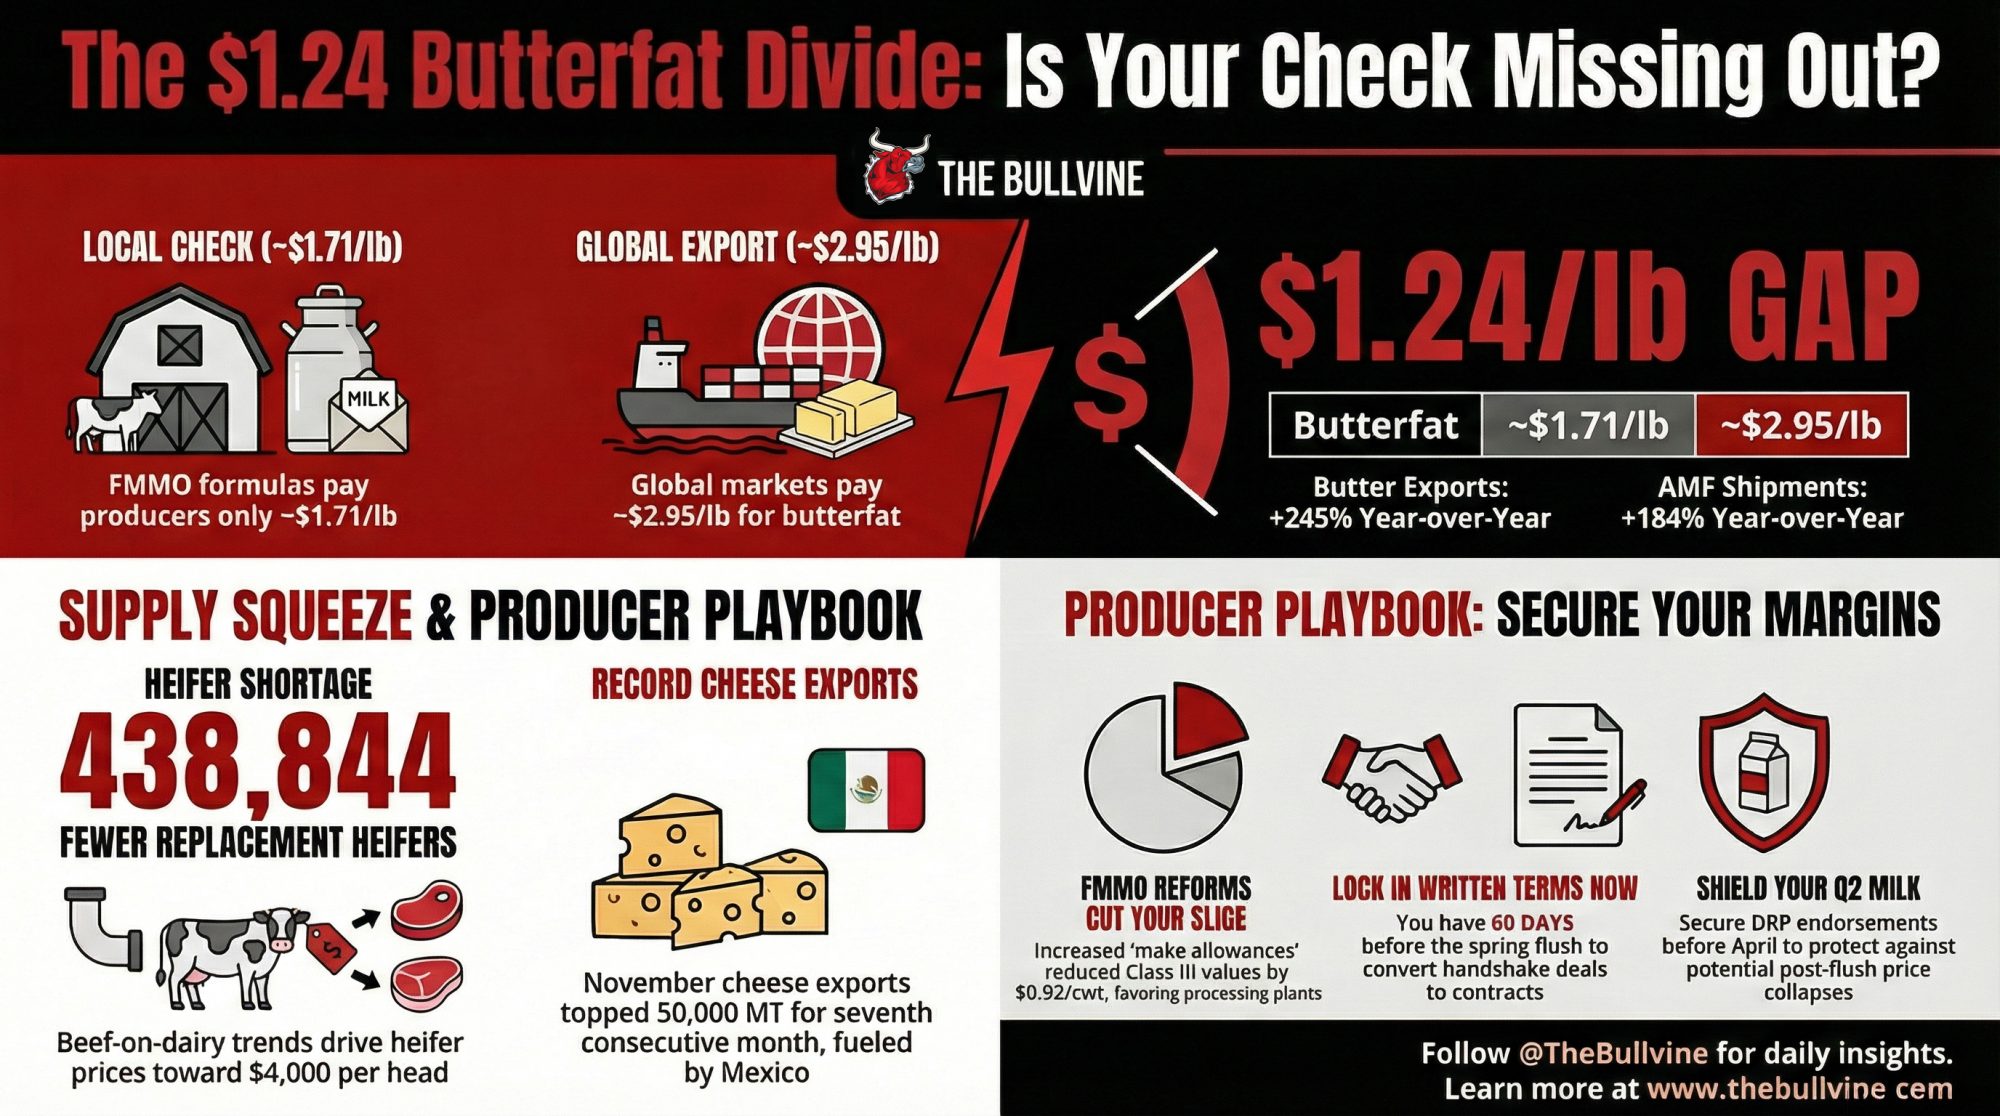
EXECUTIVE SUMMARY: Your butterfat is worth $2.95/lb on the global market. The FMMO pays you based on $1.71. That $1.24/lb gap — exposed in USDA’s December 2025 report — flows to processors exporting record butter and AMF volumes, not to the producers making the components. June’s FMMO modernization widened the divide: raised make allowances cut Class III by $0.92/cwt handing plants a bigger slice while yours shrank. Supply pressure is building from the other direction — CoBank projects 438,844 fewer replacement heifers by 2026, with prices at $3,010–$4,000/head, just as $10 billion in new processing capacity needs milk. Component-focused operations in deficit regions have roughly 60 days before the spring flush to convert handshake deals into written terms. After that, the leverage shifts.
Cheese blew past expectations. Butter missed — again. NFDM production fell, but stocks climbed anyway. When USDA dropped the December 2025 Dairy Products report on February 5, 2026, futures barely flinched. Everything traded flat except powder, which caught immediate sell-side pressure.
The headline numbers look simple enough: total cheese at 1.28 billion pounds (+6.7% year over year), butter at 204 million pounds (+2.0%), nonfat dry milk at 127 million pounds (down 2.7%), per USDA NASS. But underneath those percentages sits a widening disconnect between the global value of your components and what actually shows up on your milk check — a gap that should be front-of-mind for every component-focused operation heading into spring 2026.
For the component-focused operations tracking their butterfat premium against the blend, December’s milk check told a familiar story: the premium was up, but not nearly as much as the export math suggested it should be. The rest of the value? It left the country.
Cheese: $10 Billion in Capacity, and the Export Machine Is Absorbing It
Cheddar alone hit 340,350 thousand pounds in December — up 9.0% from a year ago. Not a one-month blip. Full-year 2025 cheddar finished 5.3% above 2024, and total cheese came in 2.9% higher. Italian types weren’t far behind: mozzarella up 5.9%, Parmesan up a striking 22.9%.
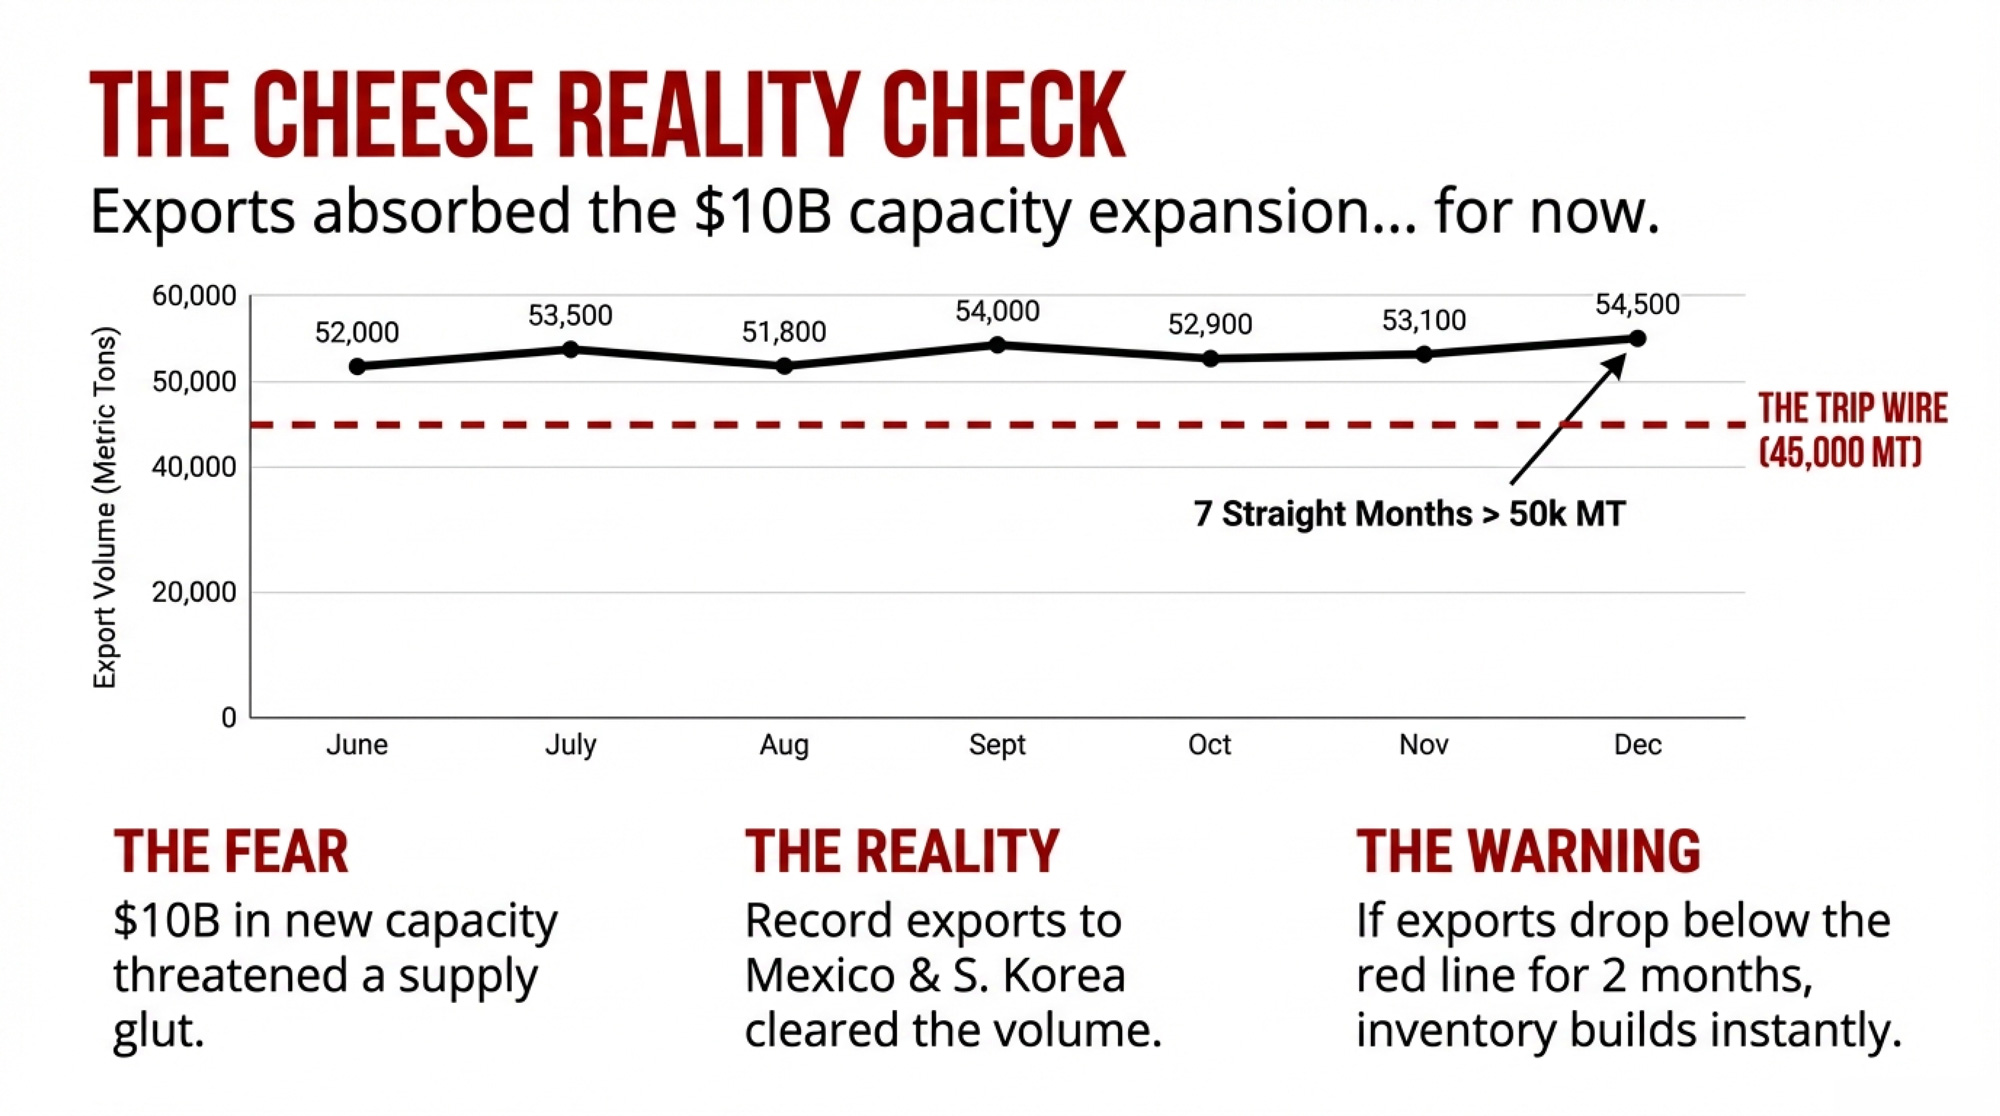
Announced U.S. dairy processing investments total roughly $10 billion through 2027, according to CoBank. The industry braced for a glut that would crush the board.
It hasn’t happened — because export demand ate through the extra volume. USDEC’s January 2026 trade summary puts November 2025 cheese exports at 50,775 metric tons, up 28% year over year. That’s the seventh consecutive month above 50,000 MT — a threshold never breached before 2025. Volume rose significantly to Mexico and South Korea, which USDEC says is “poised to set an annual record for U.S. cheese purchasing.” Southeast Asia cheese exports surged 92%.
Month
U.S. Cheese Exports (MT)
YoY Change (%)
Status vs. 50k MT Threshold
May 2025
51,240
+18%
✓ Above
June 2025
52,890
+22%
✓ Above
July 2025
53,470
+24%
✓ Above
Aug 2025
51,920
+21%
✓ Above
Sept 2025
54,110
+26%
✓ Above
Oct 2025
52,650
+23%
✓ Above
Nov 2025
50,775
+28%
✓ Above
But 28% export growth isn’t a number you can bank on forever. Here’s the threshold worth watching: if monthly cheese exports drop below 45,000 MT for two consecutive months while new plants keep ramping, domestic inventories will build faster than the market can clear. That’s not a prediction. It’s a trip wire.
Butter: Your Fat Leaves the Country at ~$2.95. Your Check Reflects ~$1.71.
Butter production came in at 203,848 thousand pounds, just 2.0% above December 2024. Full-year 2025 butter was up 5.7% — not a collapse — but December fell well short of private forecasts for the second straight month. USDA’s January 23 Milk Production report showed December output in the 24 major states at 18.8 billion pounds, up 4.6%year over year, with 222,000 more cows and 42 more pounds per cow generating plenty of cream.
So where’d all the butter go? Overseas. Where the margins are.
Per the CME cash dairy trade the week of February 3 (prices as of February 5, 2026), spot butter closed at approximately $1.71/lb, up from around $1.58 earlier in the week. GDT futures for February 2026 delivery had butter at roughly $2.64/lb and anhydrous milk fat at roughly $2.95/lb, per the Daily Dairy Report. That’s a spread of about $0.93/lb between CME and GDT butter — and $1.24/lb between CME butter and GDT AMF.
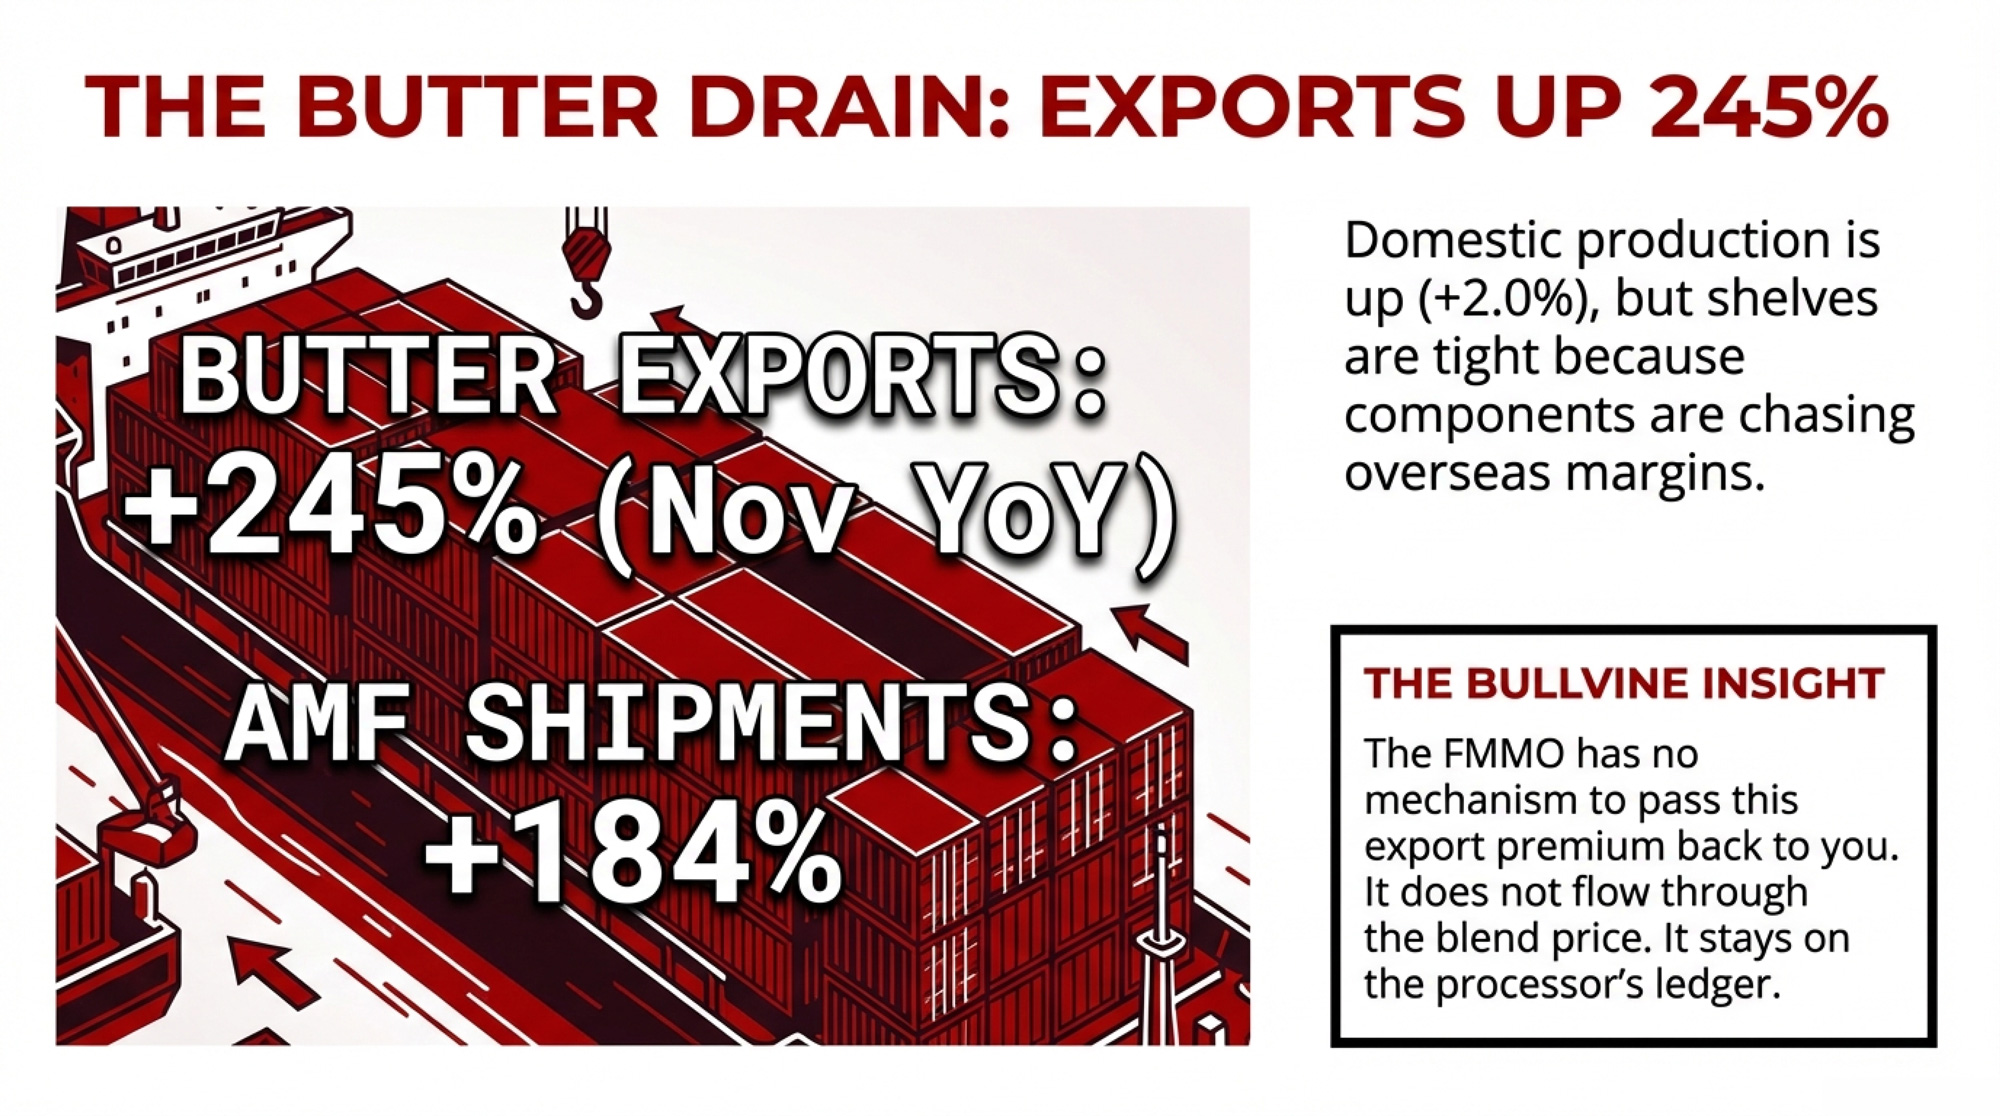
USDEC confirms processors are leaning hard into that spread. November butter exports surged 245% year over year. AMF shipments jumped 184%. USDEC called it the highest single month on a milk-fat basis for U.S. dairy exports — total butterfat exports reached 15,308 metric tons.
Now stack FMMO math on top. The June 2025 Federal Order modernization raised the butter make allowance from $0.1715/lb to $0.2272/lb — a 32.5% increase, per the USDA final rule published January 17, 2025. The changes “lowered the value of producer milk,” with the new cheese make allowances alone reducing the Class III price by $0.92/cwt.
The formula changes gave plants a bigger slice of the value pie. Your slice got smaller.
You produce the butterfat. Your plant converts it to 82% butter or AMF and sells it into an export channel, priced off GDT. Your milk check stays anchored to CME butter minus a bigger make allowance. The FMMO has no mechanism to pass that export premium back to you. Not through your blend price. Not through your component premium.
Product / Metric
CME Price ($/lb)
GDT Price ($/lb)
Spread ($/lb)
Value Gap per Tanker
Butter (82% fat)
$1.71
$2.64
+$0.93
~$5,580
Anhydrous Milk Fat
$1.71*
$2.95
+$1.24
~$7,440
Your Butterfat (3.7% test)
Based on $1.71 CME
Actual export value $2.95
+$1.24
~$7,440
Per Cwt Impact (80 lb/cwt @ 3.7% BF)
Paid ~$5.06/cwt BF
Worth ~$8.74/cwt BF
-$3.68/cwt
-$221/tanker
One partial exception worth investigating: if you’re a co-op member, your cooperative may return a share of export value through patronage dividends or retained earnings. Pull your co-op’s annual financial statement. Ask the question directly at your next member meeting. You might not like the answer — but you deserve to know it.
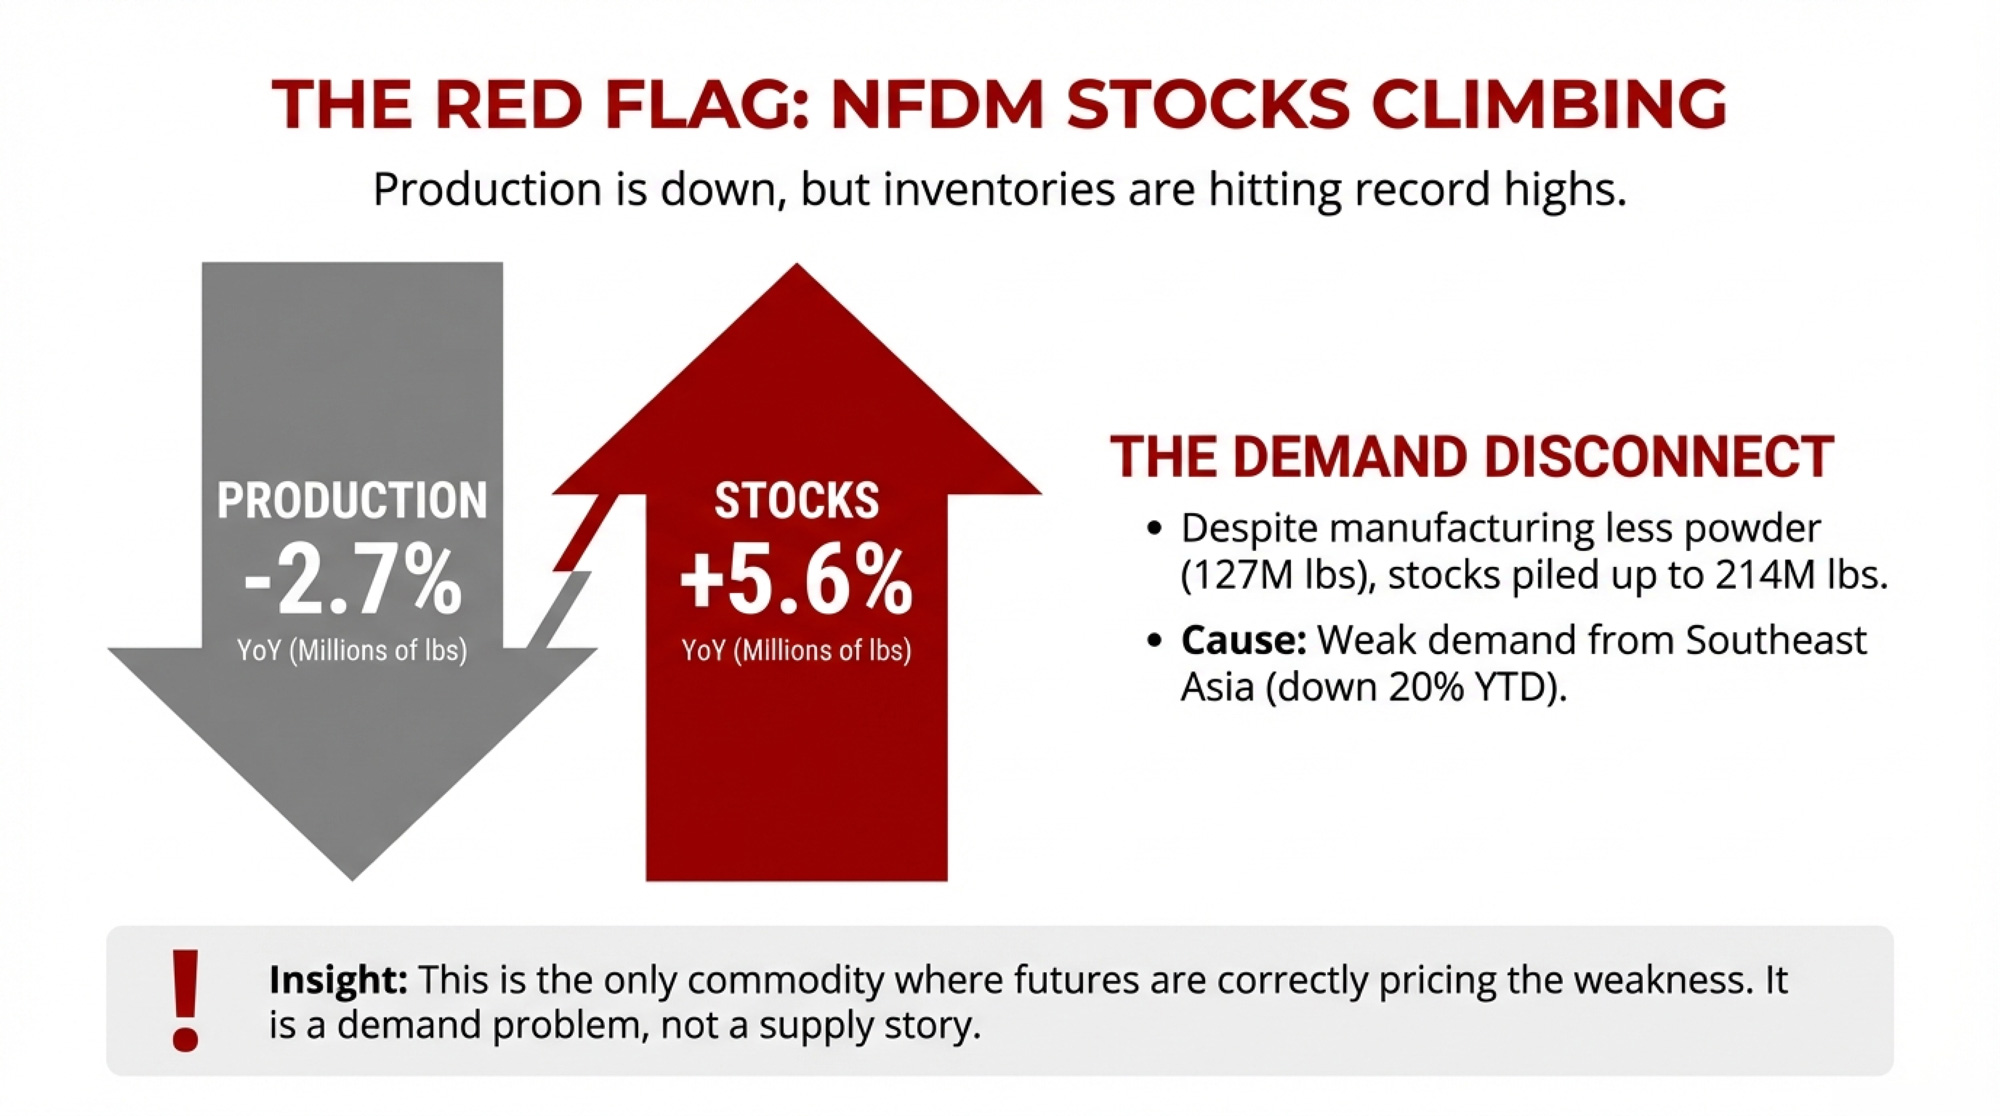
NFDM: Production Down, Stocks Up — Powder Took the Only Futures Hit
This is where the December report sent its clearest signal, and the one place futures actually listened.
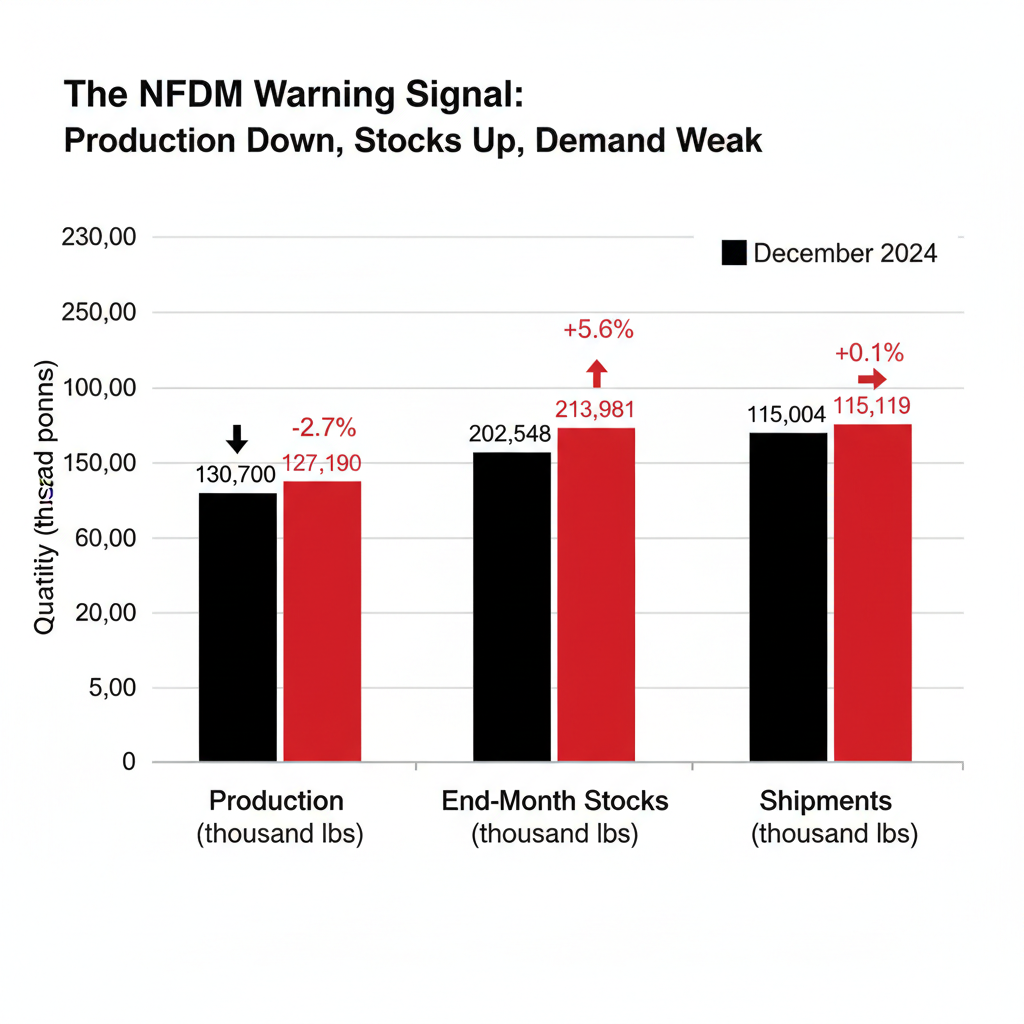
December NFDM production came in at 127,190 thousand pounds, down 2.7% year over year. Skim milk powder dropped even harder — down 15.2%. If you only saw the production side, you’d assume a tightening powder complex.
Category
Dec 2024
Dec 2025
Change
Production
130,700
127,190
-2.7% ↓
End-Month Stocks
202,548
213,981
+5.6% ↑
Shipments
115,004
115,119
+0.1% →
End-of-month manufacturer stocks told a different story: 213,981 thousand pounds, up 5.6% from 202,548 a year ago. NFDM shipments were essentially flat at 115,119 thousand pounds (+0.1%). USDEC’s trade data through three quarters showed total export volume up only 1.7% through September, while powder shipments to Mexico and Southeast Asia posted year-over-year declines. USDEC directly noted that “a decline in exportable supplies of milk powder from the U.S., combined with tepid demand from SEA, has caused volumes into the region to fall.”
November did bring a rebound in Southeast Asian powder shipments — NFDM/SMP to the region jumped 23%, driven almost entirely by Indonesia — but year-to-date milk powder exports to Southeast Asia were still down 20% through November.
Falling production. Rising stocks. Flat-to-weak exports. That’s a demand problem, not a supply story.
The Quiet Whey Shift: Putting a Floor Under Class III
One number buried in this report deserves your attention. Whey protein isolate production jumped 11.7% year over year to 20,644 thousand pounds, while WPI stocks fell 5.4%. Consumer demand for high-protein products is pulling whey streams into higher-value WPI — human dry whey was up only 4.0% despite 6.7% more cheese generating more liquid whey.
Because dry whey feeds the Class III formula, that structural pull is quietly supporting one of the inputs that determines your Class III price. If you’re on Class III, your dry whey component isn’t eroding the way the powder side is. Small bright spot in a complicated picture.
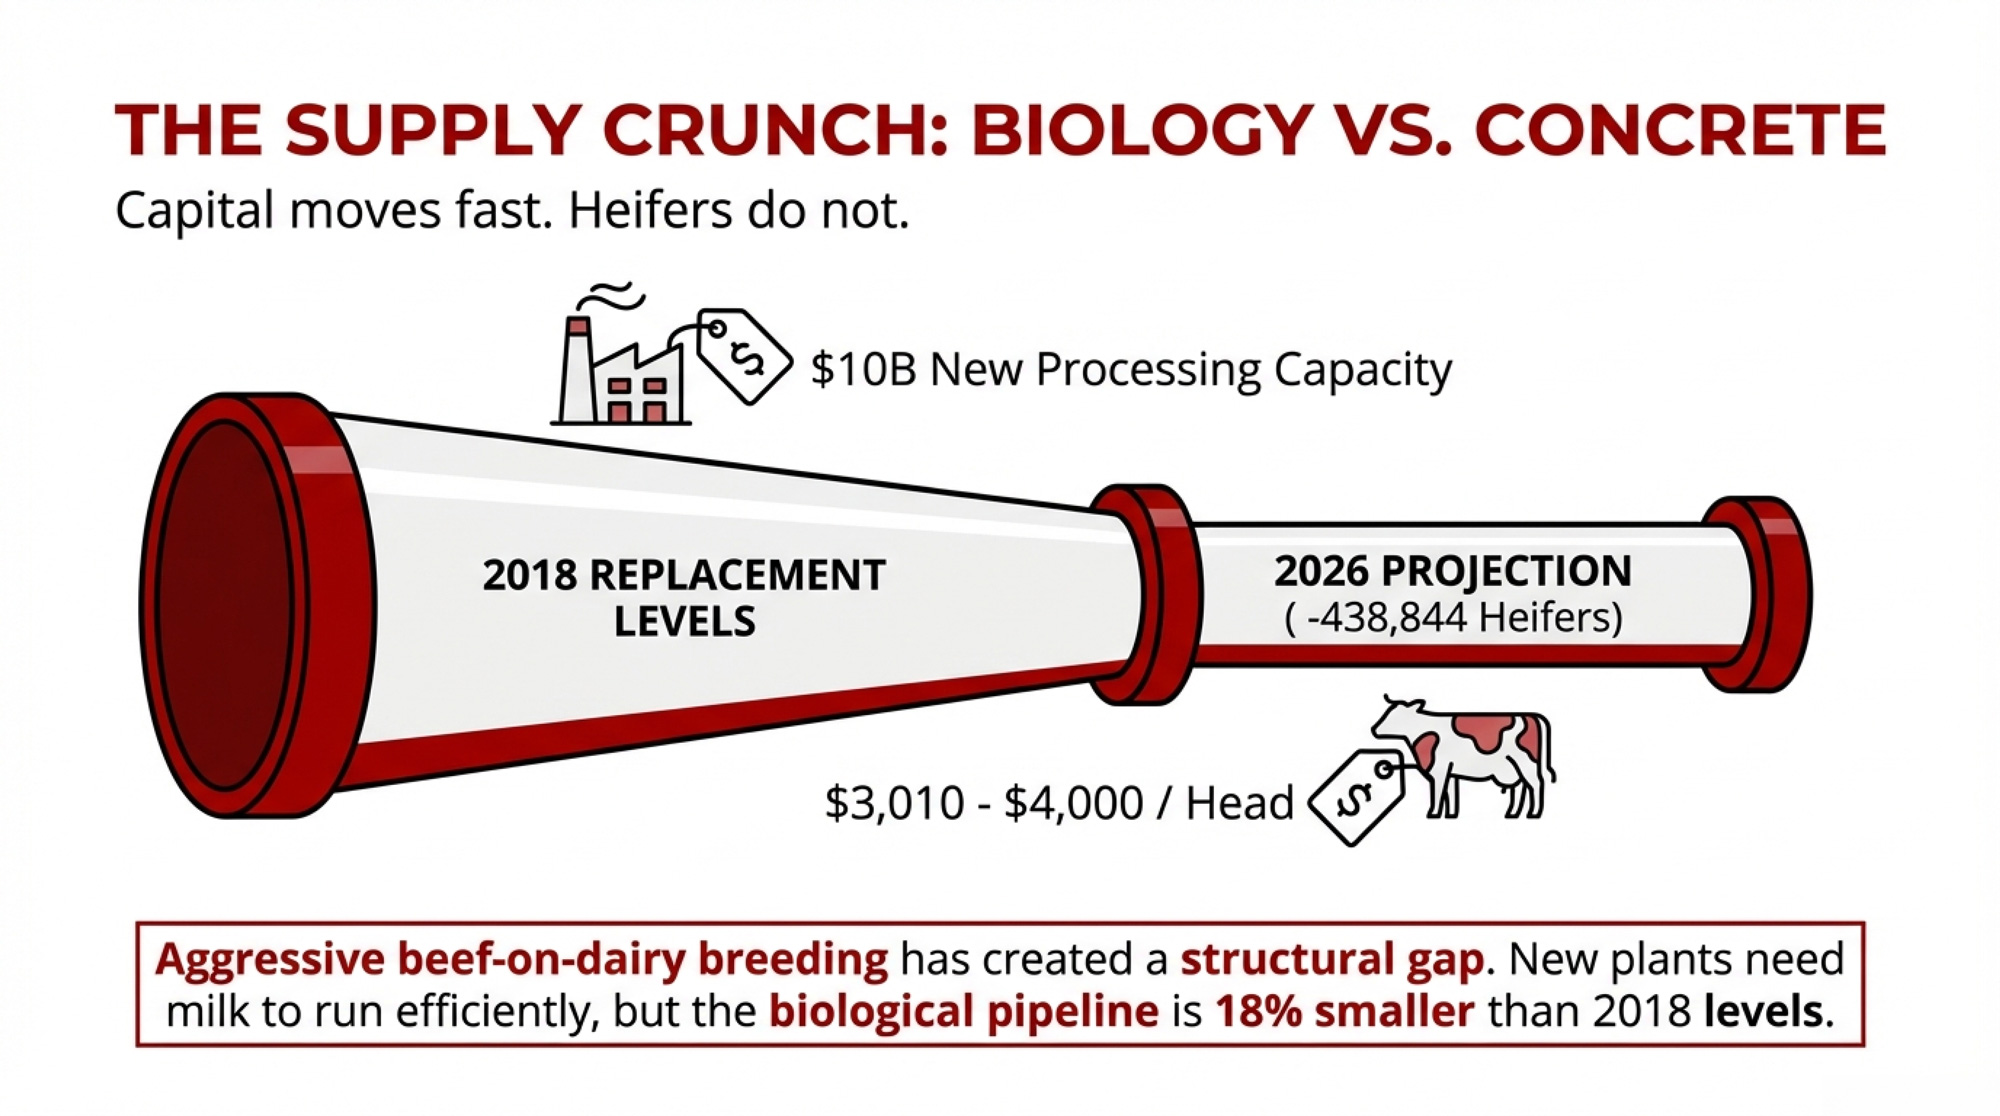
438,000 Fewer Heifers vs. $10 Billion in Hungry Plants
Every capacity story runs into the same wall. Biology doesn’t move at the speed of capital.
CoBank’s Corey Geiger projected in August 2025 that U.S. dairy heifer inventories would shrink by 438,844 head between 2025 and 2026, driven by beef-on-dairy breeding decisions that sent skyrocketing volumes of beef semen into dairy herds — 7.9 million units in 2024 alone, per NAAB data. Over two years, CoBank estimates the total decline could reach roughly 800,000 fewer replacement heifers, with a rebound starting in 2027. USDA’s January 2025 Cattle report showed 3.914 million dairy replacements — 18% fewer than in 2018.
Year
Heifer Inventory (million)
Cumulative Capacity Investment ($B)
2024
3.91
$2.5
2025
3.69
$5.8
2026
3.47
$8.5
2027
3.58 (projected rebound starts)
$10.0
December 2025 milk production still looked strong — up 4.6% in the 24 major states with 222,000 more cows and 42 more pounds per cow. But USDA’s January 2026 WASDE pegs 2026 production at 234.3 billion pounds, up roughly 1.4% from 2025, as a thinning replacement pipeline starts to constrain herd expansion.
Geiger didn’t sugarcoat it: “The short answer is that it will be tight. Those dairy plants will require more annual milk and component production, largely butterfat and protein. And it will take many more dairy heifer calves in future years to bring the national herd back to historic levels.”
Heifer prices already reflect the squeeze, from $1,720/head in April 2023 to roughly $3,010 by mid-2025 per the USDA’s July 2025 Agricultural Prices report. Top dairy heifers in California and Minnesota auction barns were bringing upwards of $4,000 per head by mid-year 2025, according to CoBank.
Why Flat Futures Don’t Mean the Fundamentals Are Wrong
If all this tension is real, why did cheese and butter futures trade flat on report day?
Near-term data wasn’t wildly off expectations. Cheese was already strong in November. Butter’s miss fit the ongoing “tight but not panicked” narrative. NFDM was the exception because rising stocks directly contradicted the bullish price story—a signal even a thin market could quickly process.
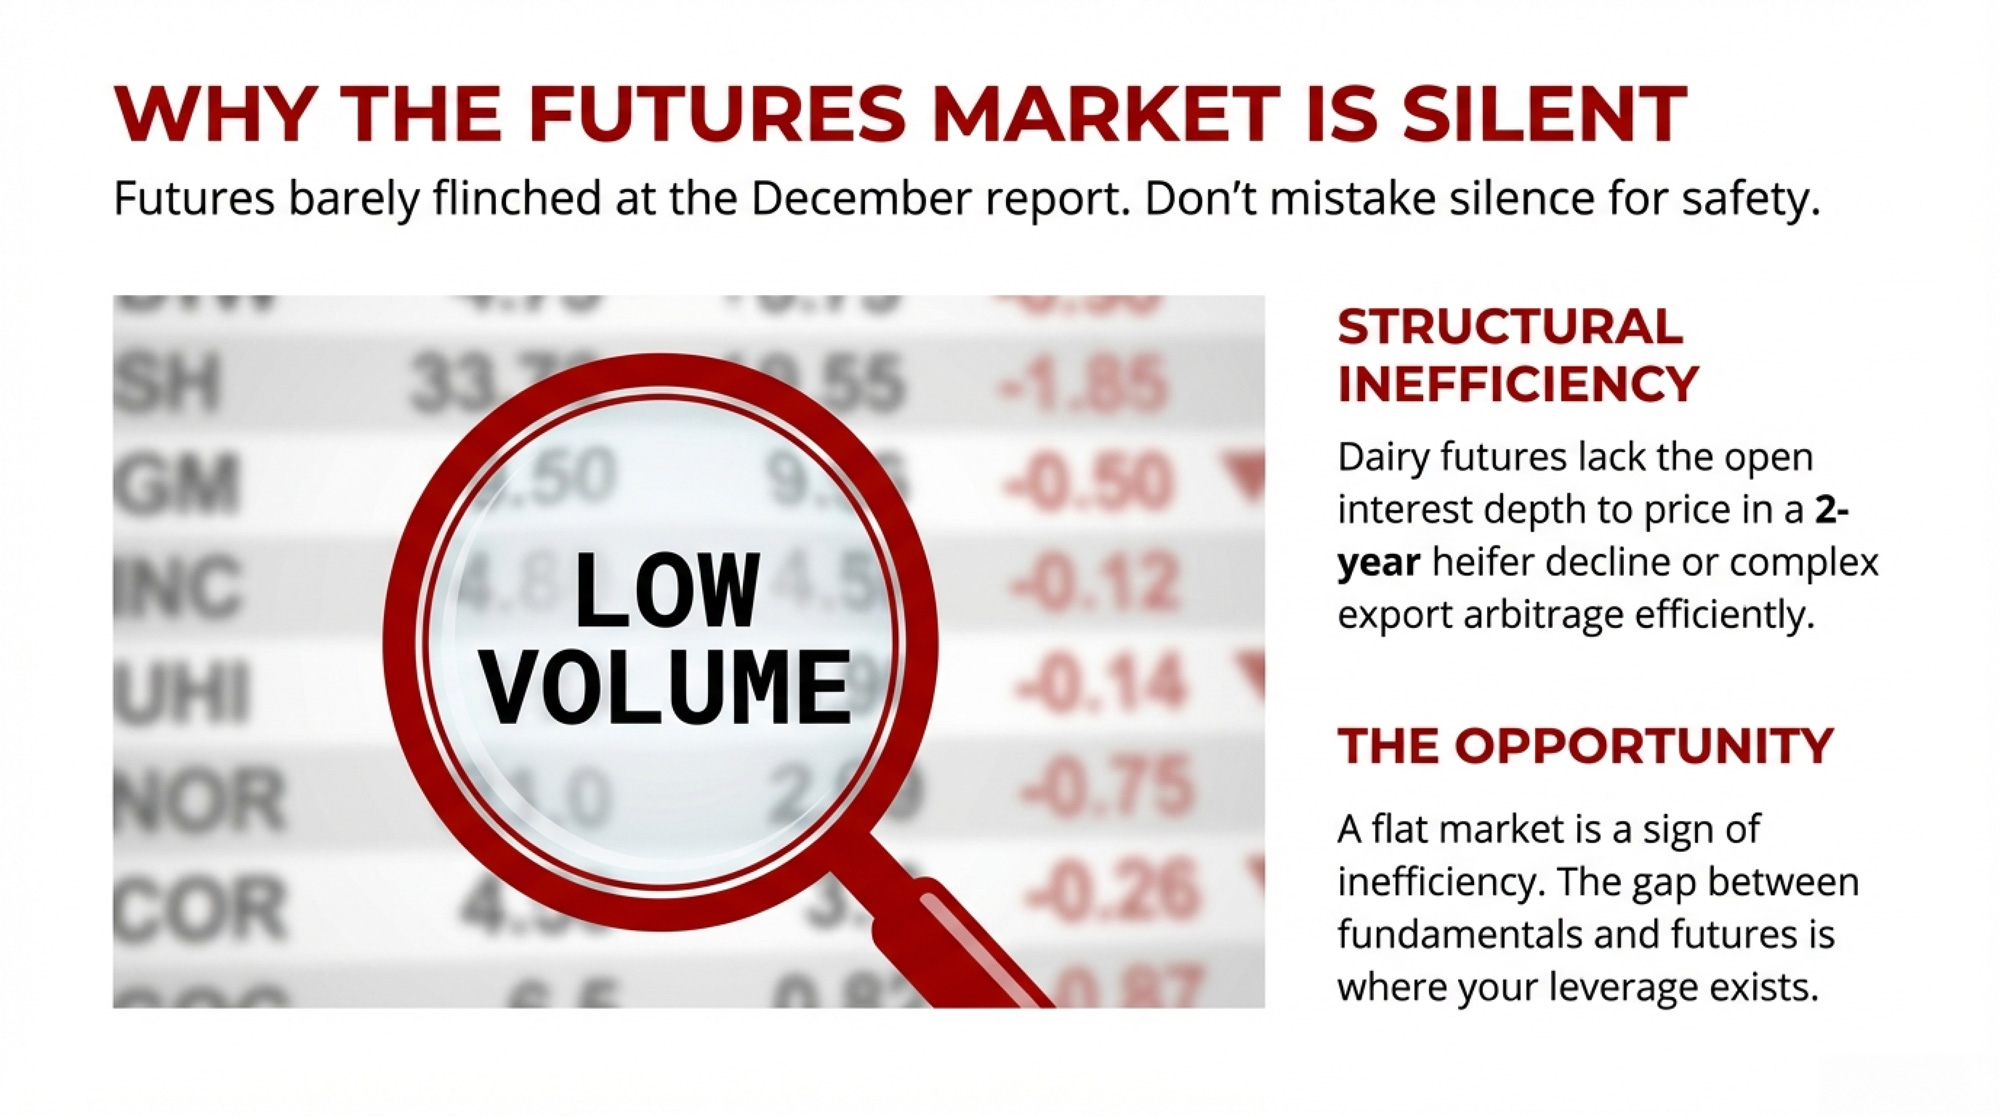
The deeper issue is structural. Dairy futures trade at a fraction of the open interest depth seen in cattle or hog contracts. That’s not a market that can efficiently price a two-year heifer decline or a multi-year butterfat export arbitrage. The flat response isn’t the market disagreeing with the fundamentals. It’s the market admitting it can’t fully express them.
And that gap between what futures say and what the fundamentals show? That’s where the opportunity sits for producers paying close attention.
What This Means for Your Operation
Your butterfat is underpriced relative to global value. As of February 5, 2026: GDT AMF at roughly $2.95/lb; CME butter at approximately $1.71/lb. Your Class IV price is anchored to CME plus a bigger make allowance. Component optimization still pays inside the system, but the extra export margin sits on the processor’s ledger. The spread to watch: if CME stays below $1.80 while GDT holds above $2.50, processors have no incentive to redirect cream to domestic channels, and your Class IV component value stays compressed. Pull your last three milk checks. Compare your butterfat premium per hundredweight to the CME butter price on those settlement dates. The gap between what you’re getting and what GDT says your fat is worth — that’s the number this article is about.
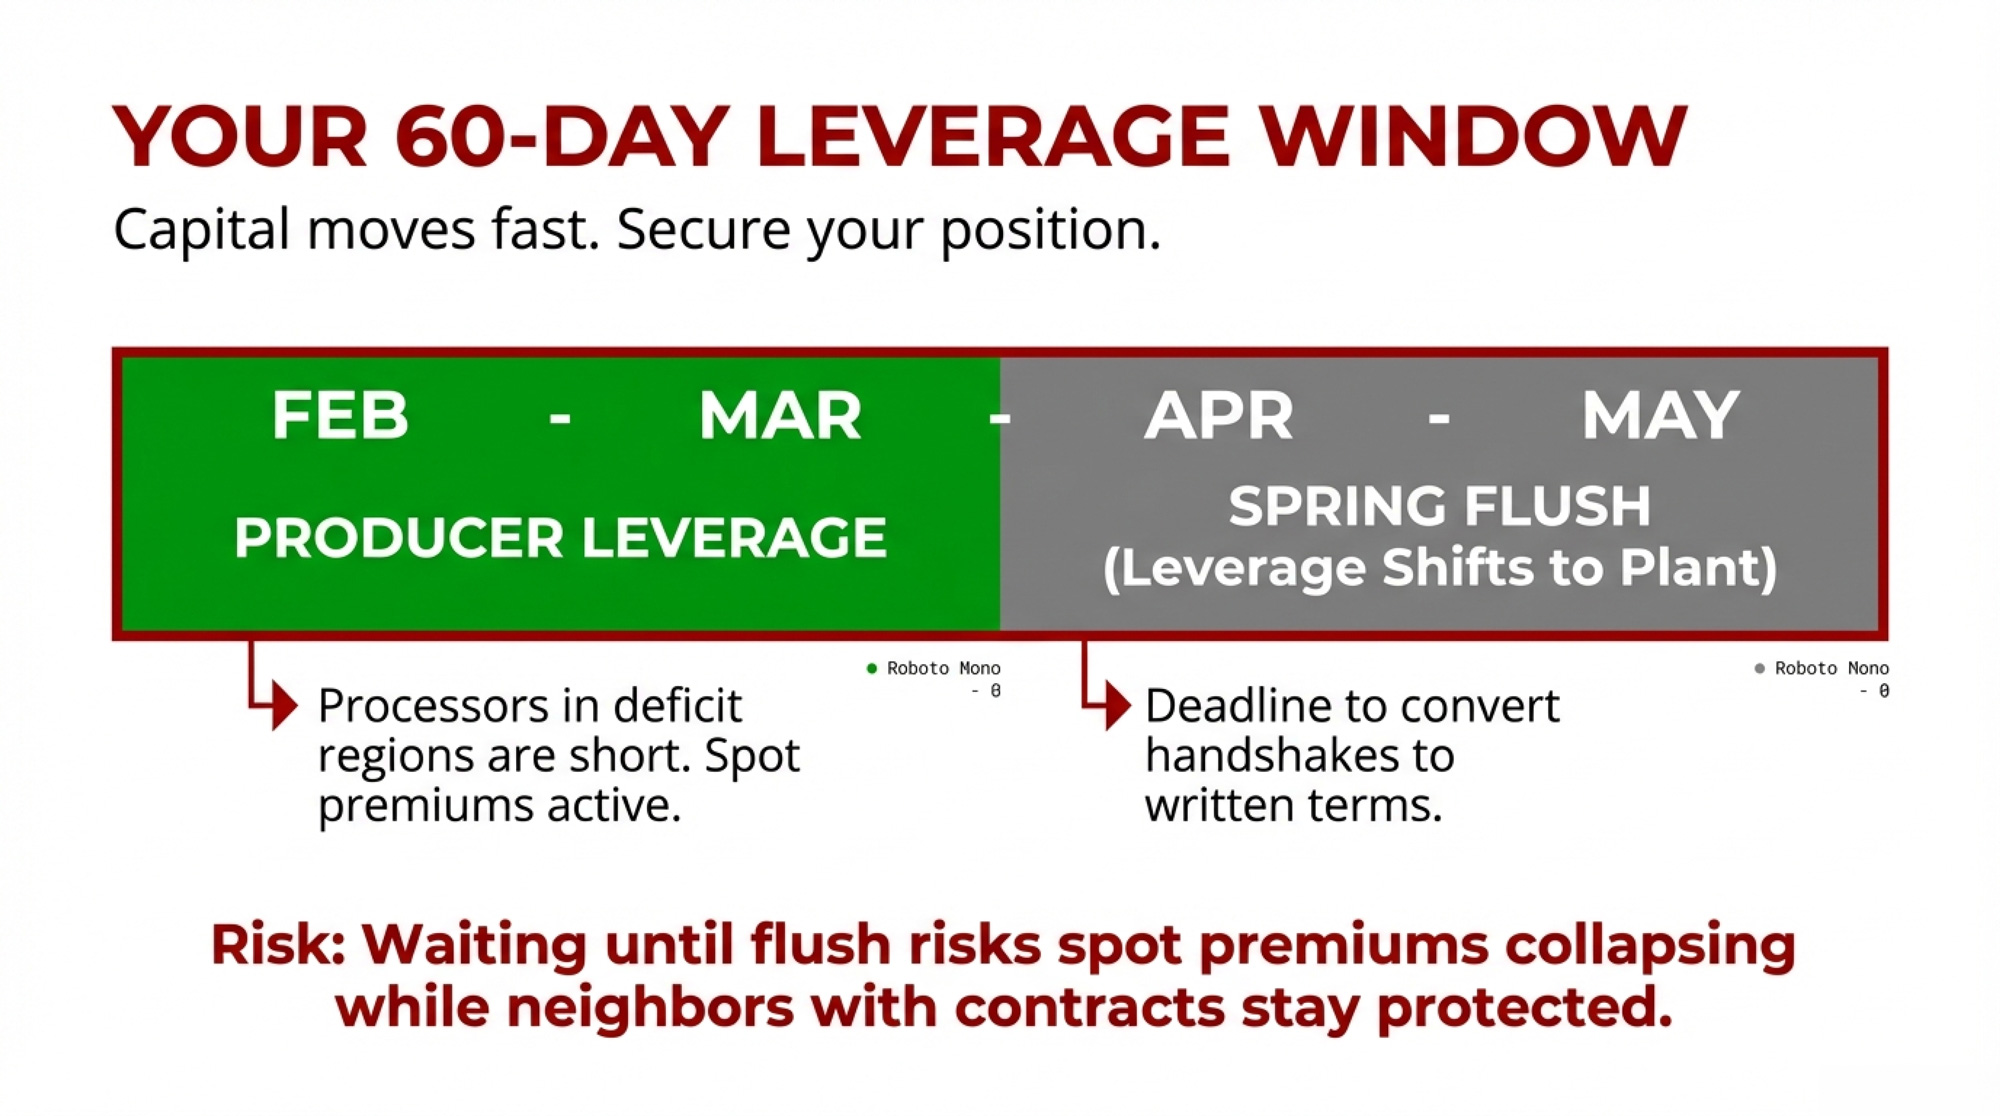
If you’re in a deficit region, your leverage is real — but it has a shelf life. Processors in short areas are paying to secure a supply right now. That urgency fades as cooperatives formalize long-haul logistics and spring flush arrives in April–May. The most important move in the next 60 days isn’t a hedge — it’s getting written terms on component premiums, hauling, and volume commitments while plants still feel short. Twelve-to eighteen-month agreements balance security with flexibility. The trade-off: if spot premiums spike higher than your locked rate during peak shortage, you’ll watch neighbors on handshake deals get paid more. But you’ll also sleep through the months when premiums collapse post-flush.
Watch NFDM stocks, not price. If manufacturer stocks hold above 210 million pounds through the March report while exports stay flat, that’s your signal to layer in Class IV put protection before spring flush. DRP Q2 2026 endorsements (April–June milk) are mostly written in the late-January to March window, outside of USDA report release days when sales are suspended. You want protection in place before April, not after.
Run the heifer math before you bid. At $3,500/head (midpoint of the $3,010–$4,000 range CoBank reported) and current carrying costs — Penn State Extension’s most recent data puts total rearing costs at roughly $1.60–$2.82 per head per day depending on operation type and region — a heifer needs to enter your string within about 24 months to break even against buying a fresh cow. But retaining heifers ties up capital and bunk space for 22+ months before they generate a dollar of milk revenue. Buying springers costs more per head but puts milk in the tank within weeks. Your cash flow position — not just the per-head price — should drive this call.
Check your Federal Order’s Class IV exposure. If you’re in Order 5 (Appalachian) running high Class I utilization, the differential increases from the June 2025 reforms may partially offset the make allowance pain — analysis found Orders 1, 5, 7, and 33 gained value under the new structure, while Order 30 (Upper Midwest) lost value. Run your margin-over-feed calculation against current component values to see where your breakeven actually sits under the new formulas.
Federal Milk Marketing Order
Order #
Value Impact
Primary Driver
Northeast
1
Gained Value
Higher Class I differentials offset make allowance increases
Appalachian
5
Gained Value
High Class I utilization + differential increases
Southeast
7
Gained Value
Class I differential structure favorable
Upper Midwest
30
Lost Value
Heavy Class III/IV exposure + make allowance cuts hit hard
Mideast
33
Gained Value
Class I differential gains exceeded component losses
Key Takeaways
Cheese is running hot but roughly in balance thanks to record exports — November was the seventh straight month above 50,000 MT. The risk trigger: monthly exports below 45,000 MT for 2 consecutive months while new plants keep coming online.
Butterfat is where the value gap is widest. CME butter at ~$1.71/lb vs. GDT AMF at ~$2.95/lb as of February 5, 2026, represents a $1.24/lb spread that FMMO pricing doesn’t capture for producers. Co-op members: ask what share, if any, flows back through patronage.
NFDM sent the clearest warning in this report. Stocks up 5.6% while production fell 2.7%, and year-to-date powder exports to Southeast Asia were down 20% through November — that’s the pattern that precedes price weakness, not strength.
The heifer shortage is real and has come at a bad time. It won’t choke production in 2026, but by 2027 — when new plants need to run full — the math stops working without more replacements than the pipeline can deliver.
Check your DRP windows. Q2 2026 endorsements are mostly written in the late-January to March window. If NFDM stocks stay elevated and spring flush hits Class IV values, you want coverage locked before April.
The Bottom Line
The next two months aren’t about whether exports stay strong or heifers tick up another $200. They’re about whether you’ll have written terms — or still be on a handshake — when your plant decides who to lock in for the next cycle. And whether the terms you’re milking under today reflect even a fraction of what your components are actually worth on the global market.
Complete references and supporting documentation are available upon request by contacting the editorial team at editor@thebullvine.com.
Every week, thousands of producers, breeders, and industry insiders open Bullvine Weekly for genetics insights, market shifts, and profit strategies they won’t find anywhere else. One email. Five minutes. Smarter decisions all week.
Holstein bulls at $800. Beef‑on‑dairy at $1,750. Same cow, same calving—double the cheque. Why are you still breeding everything Holstein?
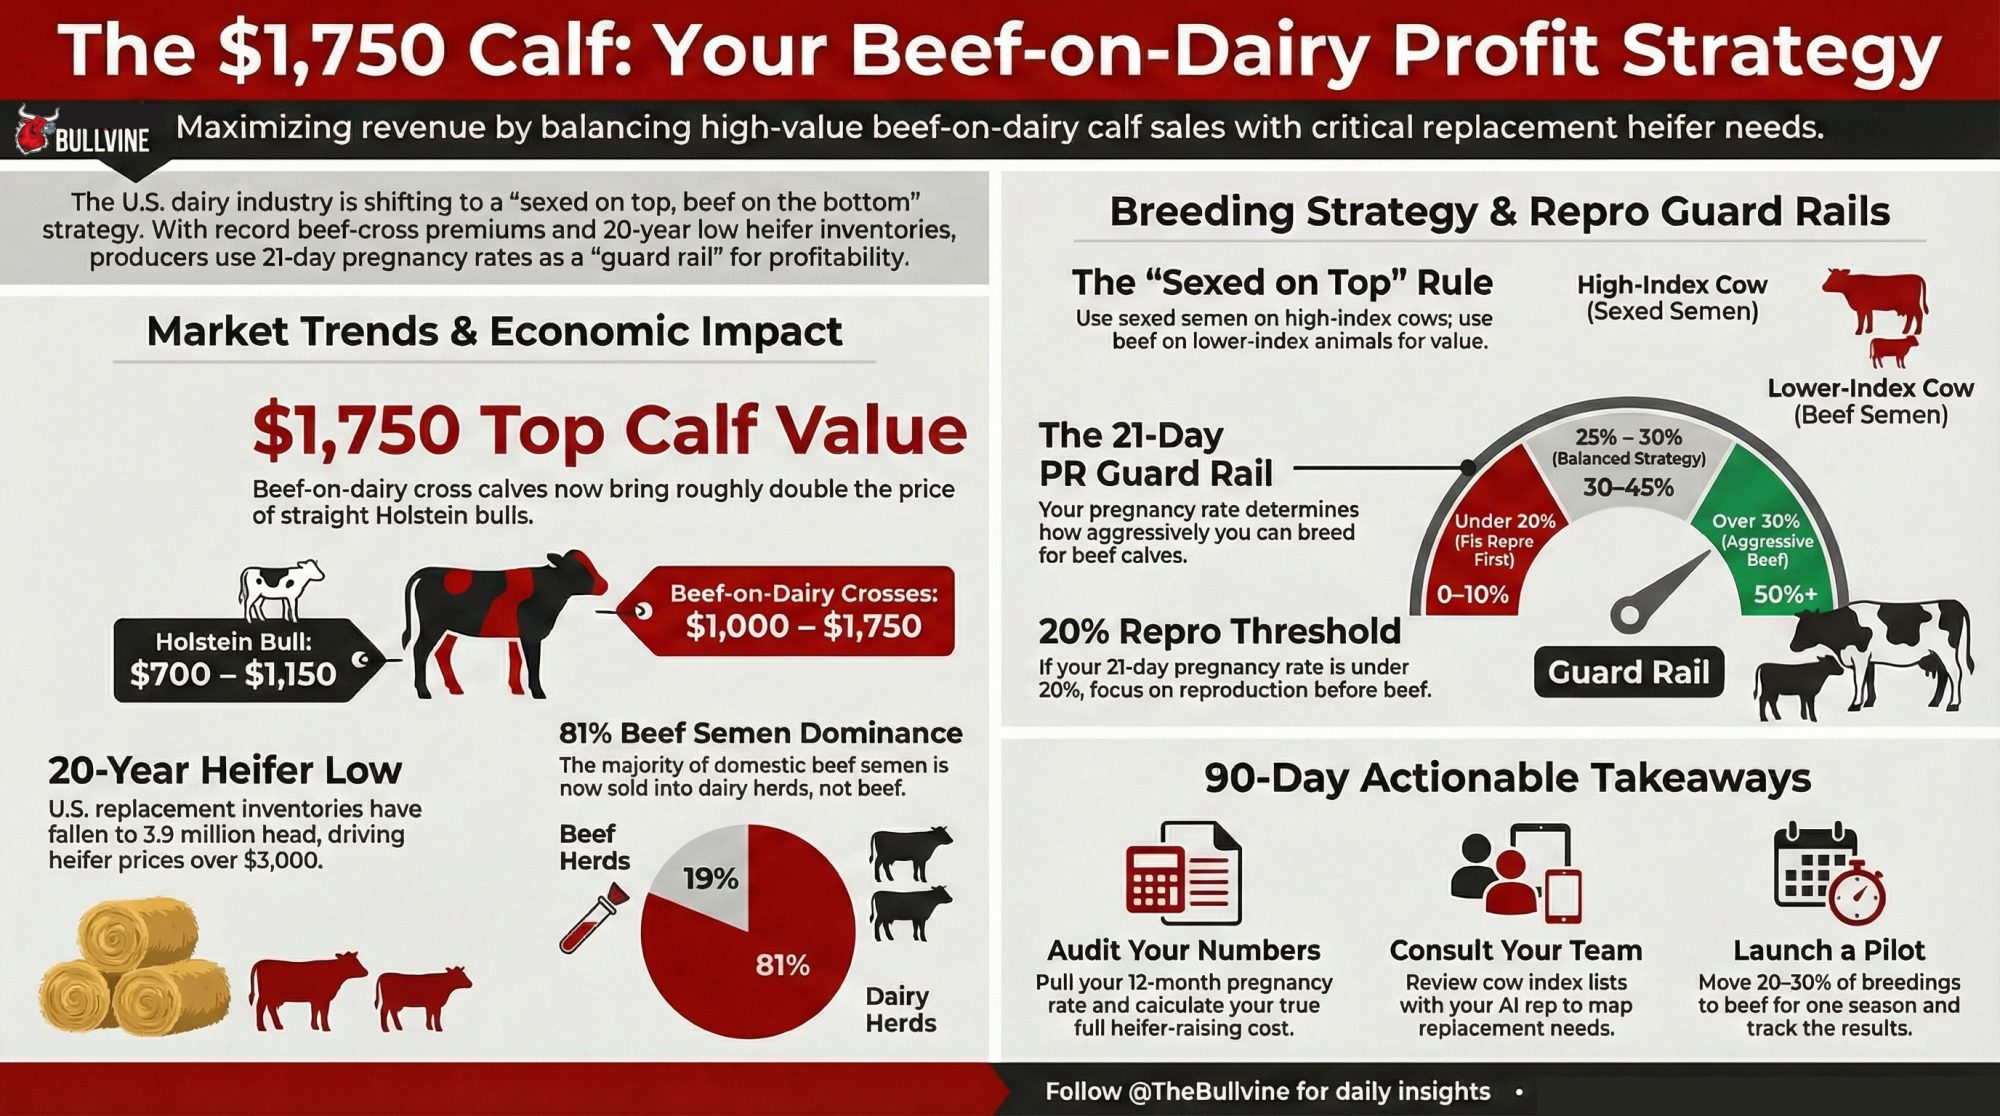
EXECUTIVE SUMMARY: In many U.S. sale barns today, Holstein bull calves that once brought $300–$450 are now commonly in the $700–$1,000 range in stronger markets, while well‑bred beef‑on‑dairy calves are cashing cheques up to about $1,750 in some auctions. At the same time, U.S. replacement heifer inventories have fallen to a 20‑year low near 3.9 million head as processors invest roughly $10 billion in new and expanded plants that will need milk to run. That combination has pushed 81% of domestic beef semen sales into dairy herds and made the “sexed on top, beef on the bottom” strategy hard to ignore. The catch is that it only pays long‑term if your 21‑day pregnancy rate stays above about 20% and you have heifers to spare, with herds in the 30–40% band able to run 50% or more of their breedings to beef while herds under 25% are usually better off fixing repro first. Three Wisconsin families—Hillview, Hiemstra, and Dornacker—show how registered Holsteins, a soil‑driven 170‑cow system, and a ProCROSS robot herd are all turning those same numbers into very different but profitable plans. By the end, you’ll know which of three breeding “paths” your own numbers put you in and what to do over the next 90 days to match sexed and beef semen to your repro, heifer, and calf markets.
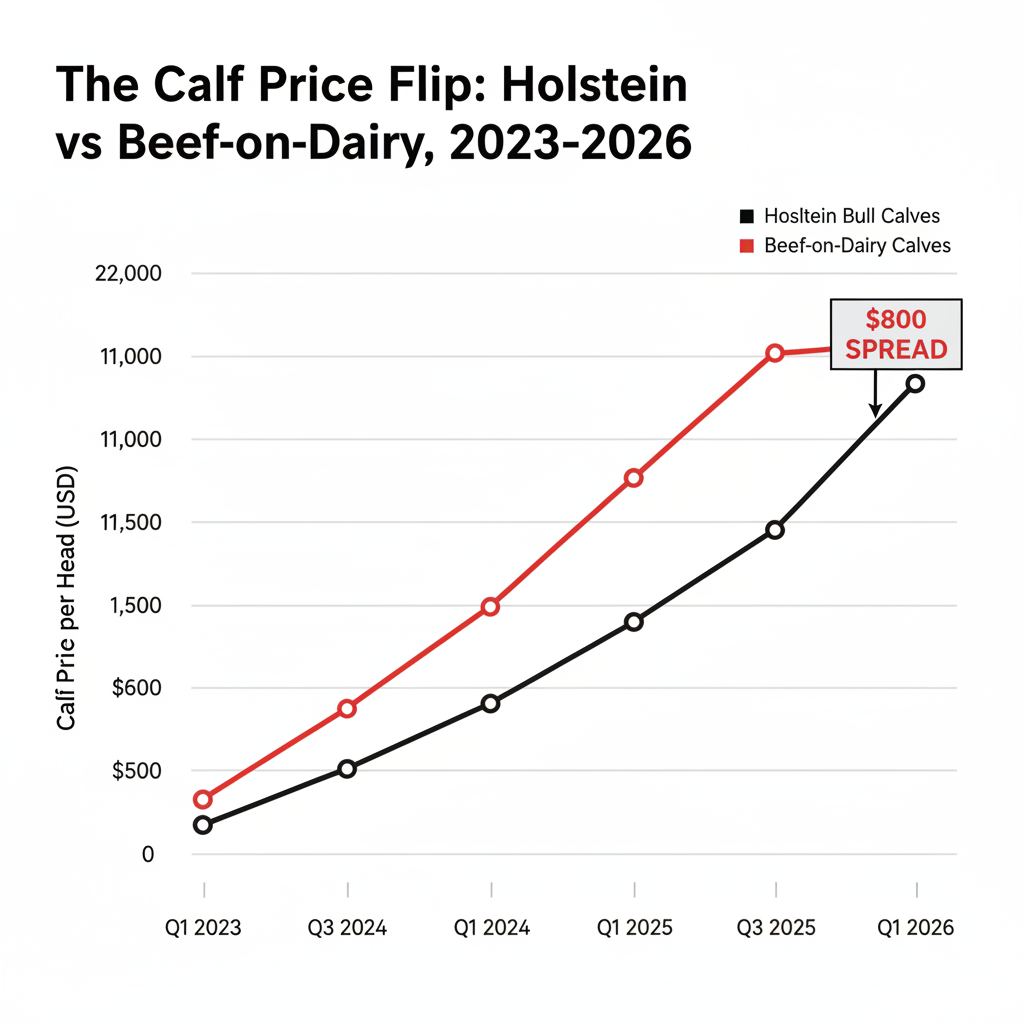
In strong Wisconsin markets, beef‑on‑dairy calves are bringing up to about $1,750 a head and Holstein bull calves are often in the $800–$1,000 range, with top sales in other regions breaking the $1,000 mark as well. U.S. milk replacement heifer inventories are down to roughly 3.9 million head as of January 1, 2026—a 20‑year low—with CoBank warning they could shrink another 800,000 head before 2027. At the same time, 81% of domestic beef semen now goes into dairy cows, not beef herds. If you’re breeding cows, managing heifers, or signing milk and cattle contracts in 2026, that mix isn’t background noise. It’s the math that decides whether your breeding program keeps you ahead of the curve or leaves you short of replacements when the processor wants more milk.
Quarter
Holstein Bull Calf Price (USD)
Beef-on-Dairy Calf Price (USD)
Spread (USD)
Q1 2023
$350
$800
$450
Q3 2023
$450
$1,100
$650
Q1 2024
$600
$1,350
$750
Q3 2024
$750
$1,500
$750
Q1 2025
$850
$1,600
$750
Q3 2025
$900
$1,700
$800
Q1 2026
$950
$1,750
$800
If you’re already selling calves, buying semen, and watching heifer checks climb, this is aimed squarely at you. The question isn’t “Should I try beef‑on‑dairy?” anymore. It’s: given your repro numbers and heifer pipeline, how hard can you lean into beef‑on‑dairy without blowing a hole in your future fresh pen?
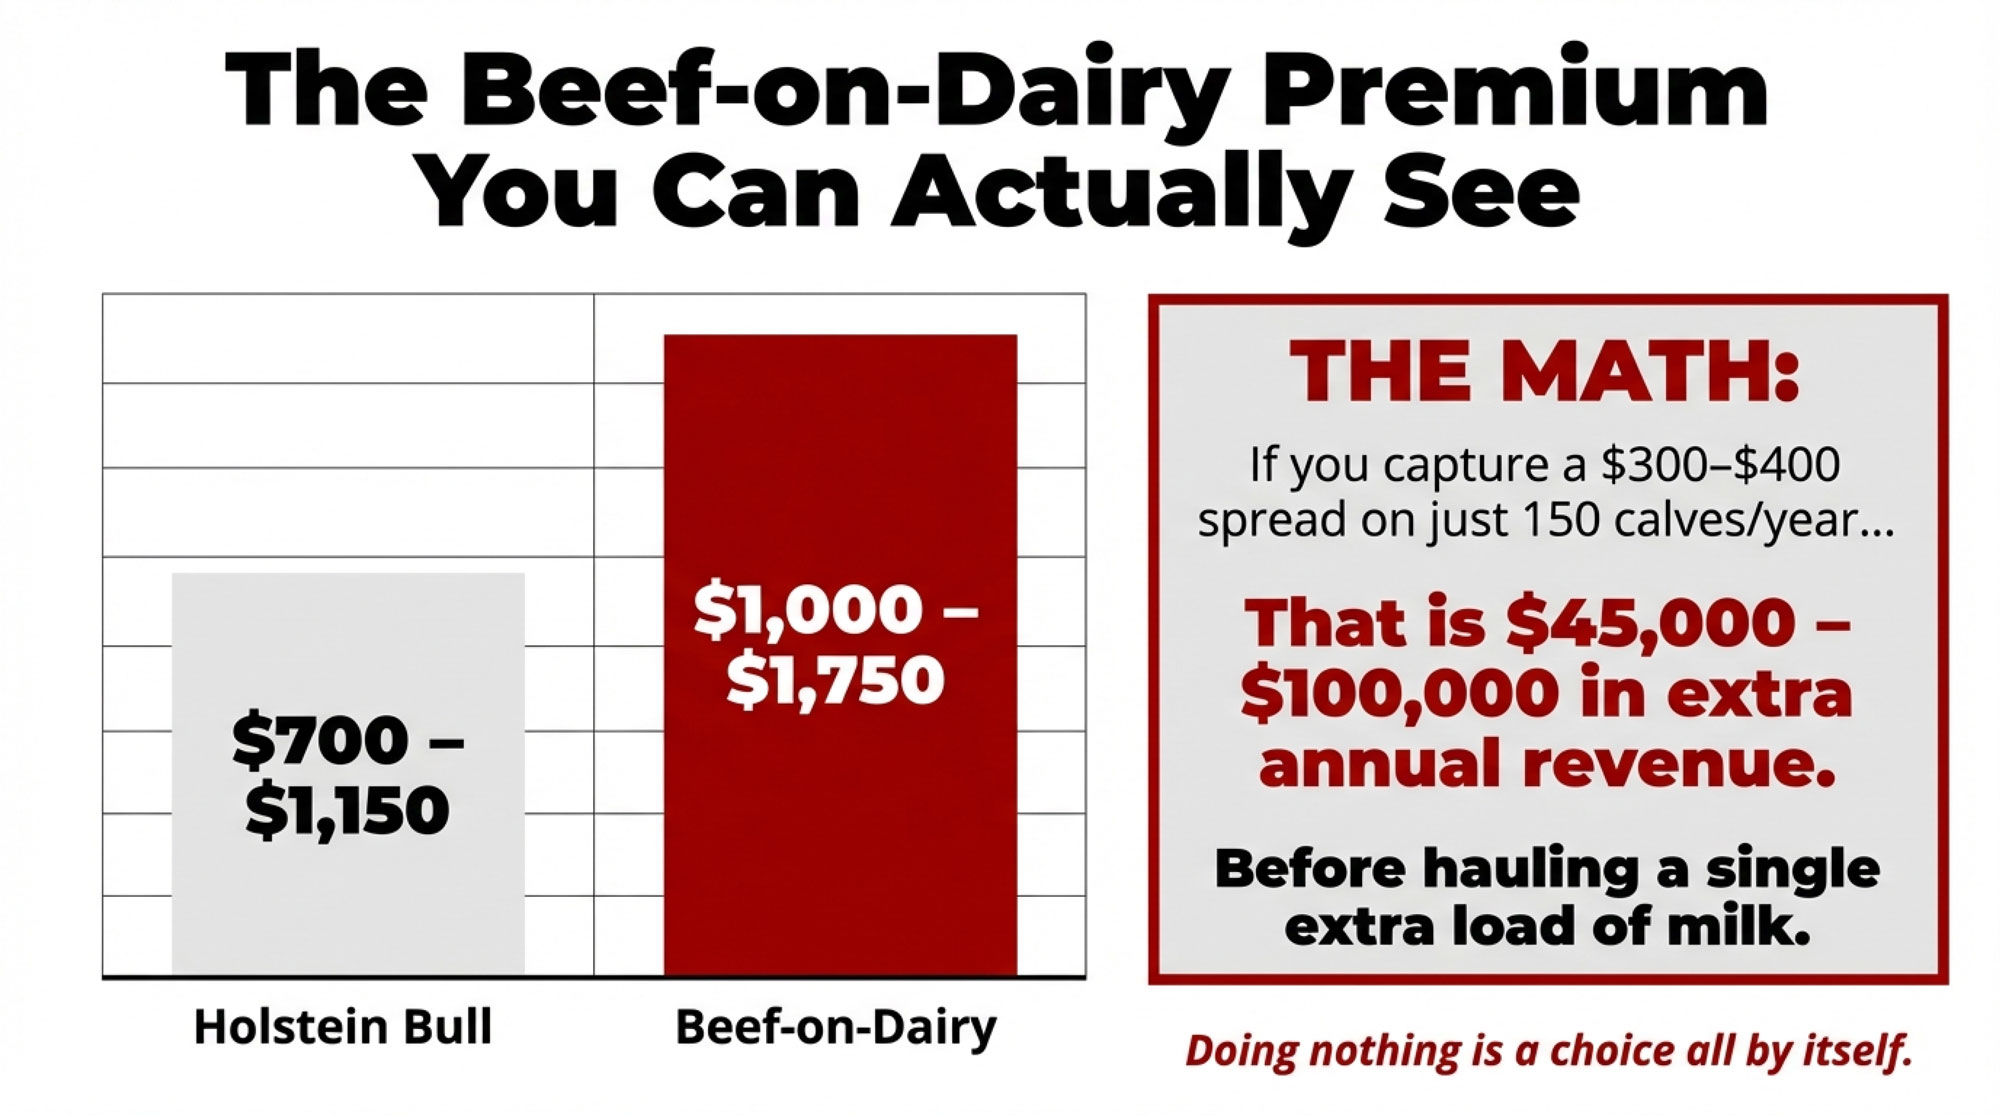
The Beef‑on‑Dairy Premium You Can Actually See
For years, bull calves were the side hustle. They helped pay a bill or two but didn’t change your year.
That flipped in late 2023 and into 2024. In sale barns across Wisconsin and Pennsylvania, newborn Holstein steer calves were bringing about $300–$450 per head, while beef‑cross calves hit as high as $1,750. Since then, a string of 2024–2025 market reports has pushed both numbers higher, with 2025 coverage noting newborn beef‑cross calves topping $1,500–$1,600 in Wisconsin and Premier’s January 2026 report listing beef‑dairy cross calves at $1,000–$1,750 and most Holstein bulls at $700–$1,150.
Sale reports from central U.S. barns tell a similar story. At South Central Livestock Exchange in 2024, “baby calf” reports—a mix of dairy and dairy‑beef—showed ranges like $175–$875 and $200–$780 per head depending on quality and condition. You don’t even need a breed column to see the pattern: the top calves bring several hundred dollars more than the bottom tier.
Since those 2023–2024 reports, national summaries from CattleFax‑linked analyses have pegged average day‑old beef‑on‑dairy calves around $1,400 in some U.S. markets, more than double levels from just a few years ago, while Holstein bull calves have also climbed. Exact numbers depend on your barn, your buyer, and this week’s market. The important part is the spread between plain Holsteins and well‑sired beef‑on‑dairy calves—and that spread has stayed real.
Run that against your own numbers. If you can consistently capture even a $300–$400 per‑head spread on 150–250 calves a year by shifting from commodity Holstein bulls to well‑managed beef‑on‑dairy crosses, you’re talking roughly $45,000–$100,000 in extra annual revenue before you haul one extra load of milk. Your math will be different, but the dollars are big enough that “doing nothing” is a choice all by itself.
How Hillview Turned Beef‑on‑Dairy Into a Revenue Engine
Jauquet’s Hillview Dairy in Luxemburg, Wisconsin, is the kind of place semen companies like to put on a brochure. They milk about 650 registered Holsteins in a cross‑ventilated freestall and have already been profiled for comfort, repro, and genetics.
Herds like Hillview didn’t jump into beef‑on‑dairy for the novelty. They moved because the economics said they could get more per pregnancy. Their breeding pattern now looks a lot like what the economists have been running in their models:
Sexed Holstein semen on the top of the herd—your highest‑index cows and heifers—to generate just the replacements you actually need.
Beef semen on lower‑index cows and groups where making another heifer mostly adds cost, not value.
A structured repro program (timed AI, close fresh‑cow work, and consistent heat detection) so expensive straws aren’t wasted on sloppy timing.
An October 2021 paper in JDS Communications (“Economics of using beef semen on dairy herds”) found that once your 21‑day pregnancy rate hits roughly 20% or better, and once beef‑on‑dairy calves bring at least about 2x the price of straight Holstein bull calves, this “sexed on top, beef on the bottom” approach maximizes income from calves over semen cost—even when sexed semen is more than twice the price of conventional or beef semen.
If your current repro and local calf markets look anything like that, you’re playing in the same lane as Hillview, whether you’ve admitted it yet or not.
Josh Hiemstra: Beef‑on‑Dairy as a Whole‑Farm System
Not every story here is about a big registered Holstein herd. Some are about getting every acre to pull its weight.
Hiemstra Dairy in Brandon, Wisconsin, milks about 170 cows and farms roughly 790 acres of owned and rented land in western Fond du Lac County. Josh Hiemstra farms with his family and has been profiled for his cover crops and soil‑health focus; he thinks in rotations and roots as much as in pounds and litres.
In a 2024 Farm Progress feature, Josh laid out how beef‑on‑dairy fits his plan. He’d just sold a load of beef‑on‑dairy steers and heifers that averaged 1,400 pounds and brought $1.75 per pound—about $2,450 per head. Then came the line that stuck with a lot of dairymen:
“I could have been smart and sold them as baby calves,” he admits.
He didn’t, because on his farm:
He can push more corn through finishing cattle than through the milking herd.
Older infrastructure—tower silos, a conventional parlor—fits a mixed dairy‑plus‑beef setup just fine.
Cover crops and “odd” forages that don’t slot neatly into a high‑producing TMR fit nicely into beef rations.
For Hiemstra, beef‑on‑dairy isn’t a side hustle bolted onto a dairy. It’s part of a whole‑farm plan to make soil, feed, facilities, and cattle all pull in the same direction.
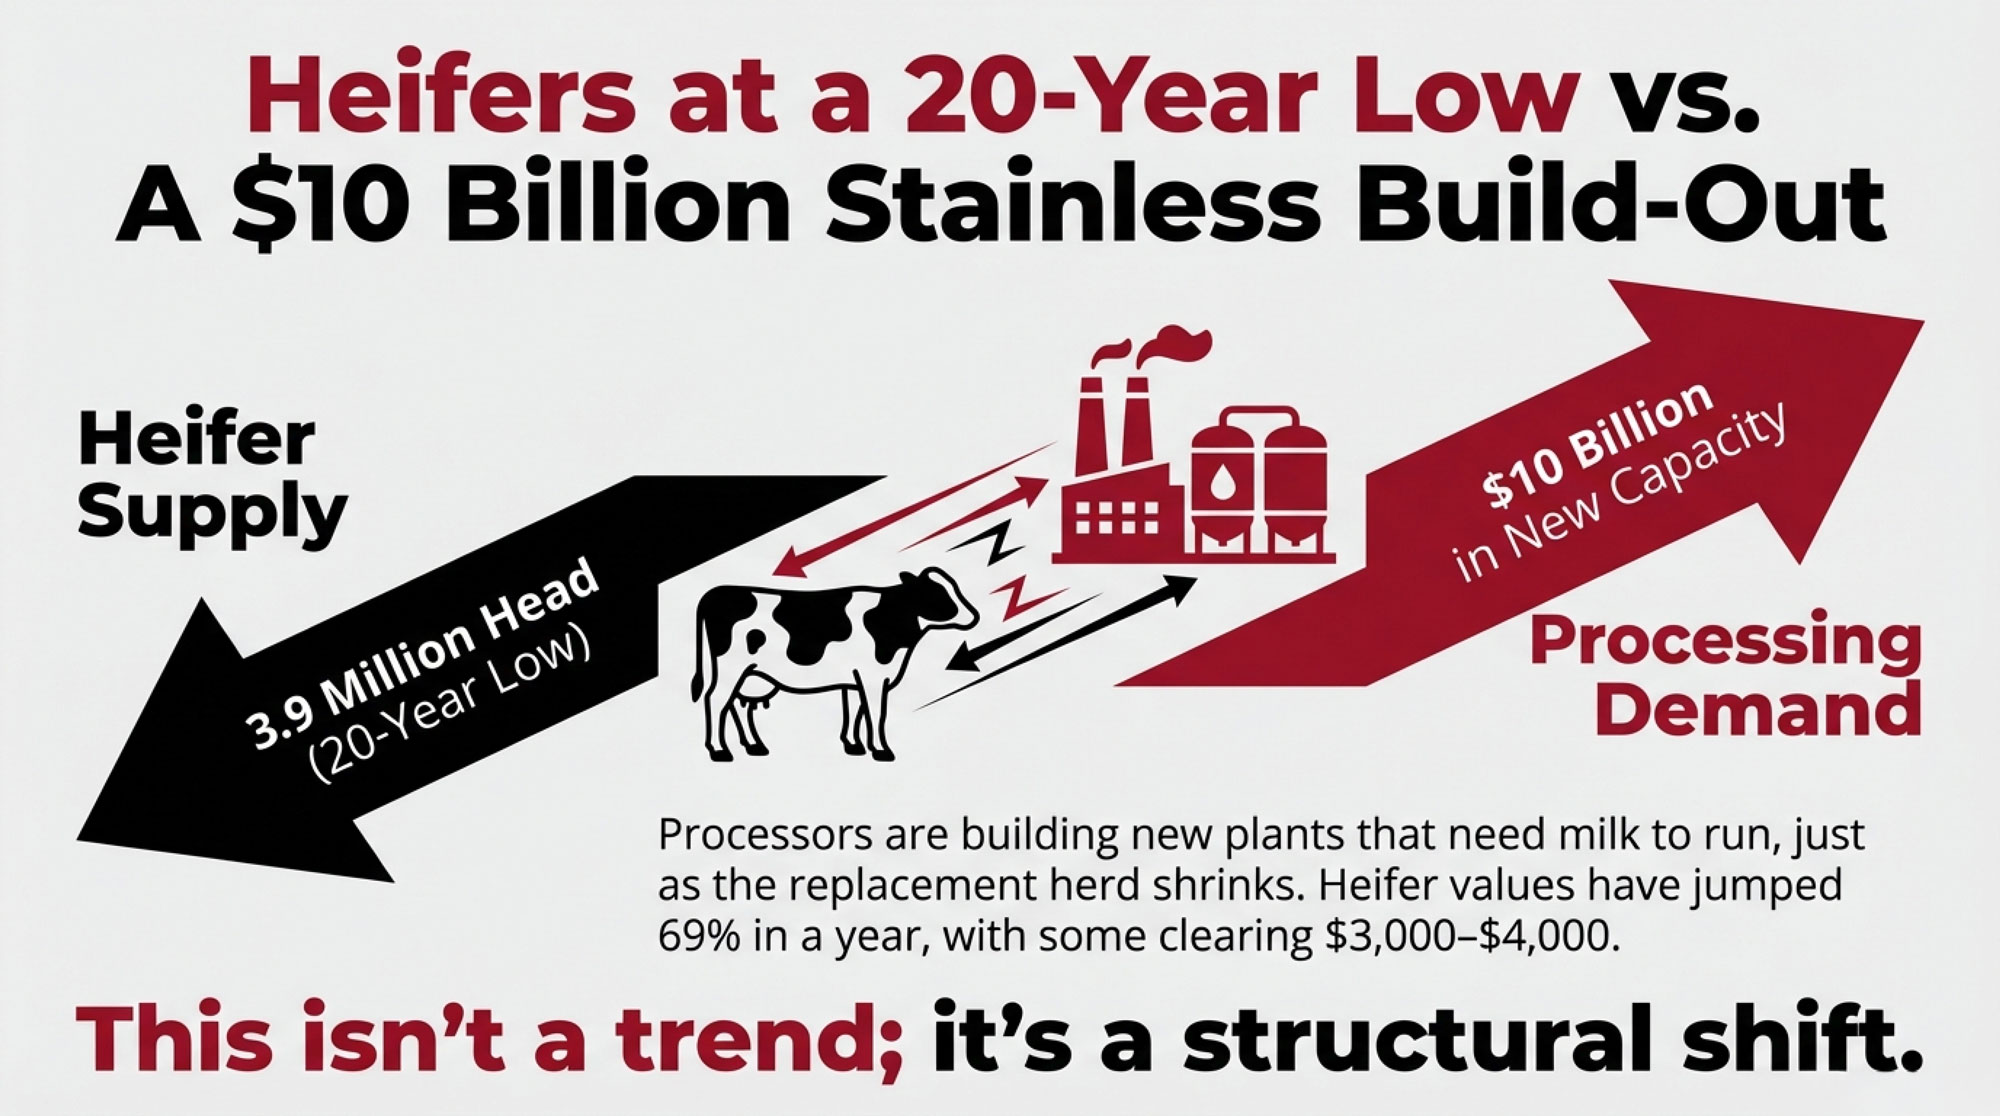
Heifers at a 20‑Year Low and a $10 Billion Stainless Build‑Out
Calf cheques feel good. Realizing you’ve starved your heifer pipeline does not.
CoBank’s August 2025 report “Dairy Heifer Inventories to Shrink Further Before Rebounding in 2027” pegs U.S. dairy replacement heifer inventories at a 20‑year low and projects they’ll shrink by another 800,000 head before they regain ground in 2027. USDA’s January 1, 2026, cattle report backs that up, putting milk replacement heifers at about 3.9 million head.
At the same time, CoBank highlights a “historic $10 billion” wave of new and expanded dairy processing capacity—cheese plants, ingredient plants, and value‑added facilities—set to come online through 2027. That’s a lot of new stainless chasing milk from a smaller pool of replacements.
On prices, CoBank’s Corey Geiger notes that heifer values “have reached record highs and could climb well above $3,000 per head.” Brownfield’s read on Wisconsin data shows replacement dairy animals jumping 69% in a year—from $1,990 in October 2023 to $2,850 in October 2024—with some Northwest sales “north of $4,000 per head.” Other 2025 coverage points to bred dairy heifers in many U.S. markets trading north of $3,000, with top strings clearing $4,000.
Every heifer you raise—or decide not to—now drags a much bigger number behind her than she did just a few years ago.
What Heifers Really Cost You
None of that means the right answer is to quit raising heifers. It does mean you should know, cold, what yours cost.
A 2019 economic analysis of pre‑weaning strategies found that:
Feed typically accounts for about 46% of heifer‑raising costs.
Pre‑weaning costs alone can range from roughly $259 to $583 per calf, depending on housing, milk program, and labour.
Once that calf gets to freshening, many 2024–2025 North American budgets put full heifer‑raising costs in the low‑to‑mid $2,000s per head, once you count feed, labour, interest, facilities, and death loss.
On the market side, CoBank and regional reports point to bred heifers trading around and above $3,000 per head, with special sales and select strings in some regions bringing over $4,000.
If your true cost to raise a heifer is running $2,300–$2,600, and local bred heifers are selling for $2,800–$3,200 or more, it’s perfectly rational to question the old “raise everything” reflex.
A simple rule of thumb: if your full heifer cost is consistently more than about 10–15% above the going price for solid bred heifers in your region, it’s time to pressure‑test a buy‑vs‑raise strategy with your adviser or lender instead of assuming raising is always the cheaper, safer play.
81% of Beef Semen Now Goes Into Dairy Cows
If you still think beef‑on‑dairy is a niche play for a few “progressive” herds, the semen market disagrees.
NAAB’s 2024 data shows 81% of all domestic beef semen sales now go onto dairy cows and heifers. Sexed dairy units keep climbing. Conventional dairy semen is getting squeezed from both sides.
The 2021 JDS Communications economics work predicts exactly that pattern. In its most profitable scenarios, herds:
Use sexed Holstein semen on the top‑ranked cows and heifers to generate replacements with the genetics they want.
Use beef semen on lower‑ranked or surplus animals, assuming beef‑on‑dairy calves bring at least about 2x the price of straight Holstein bull calves.
In other words, the semen sales chart already looks a lot like the recommended playbook: sexed for replacements, beef for value‑added calves, and conventional dairy semen steadily losing ground.
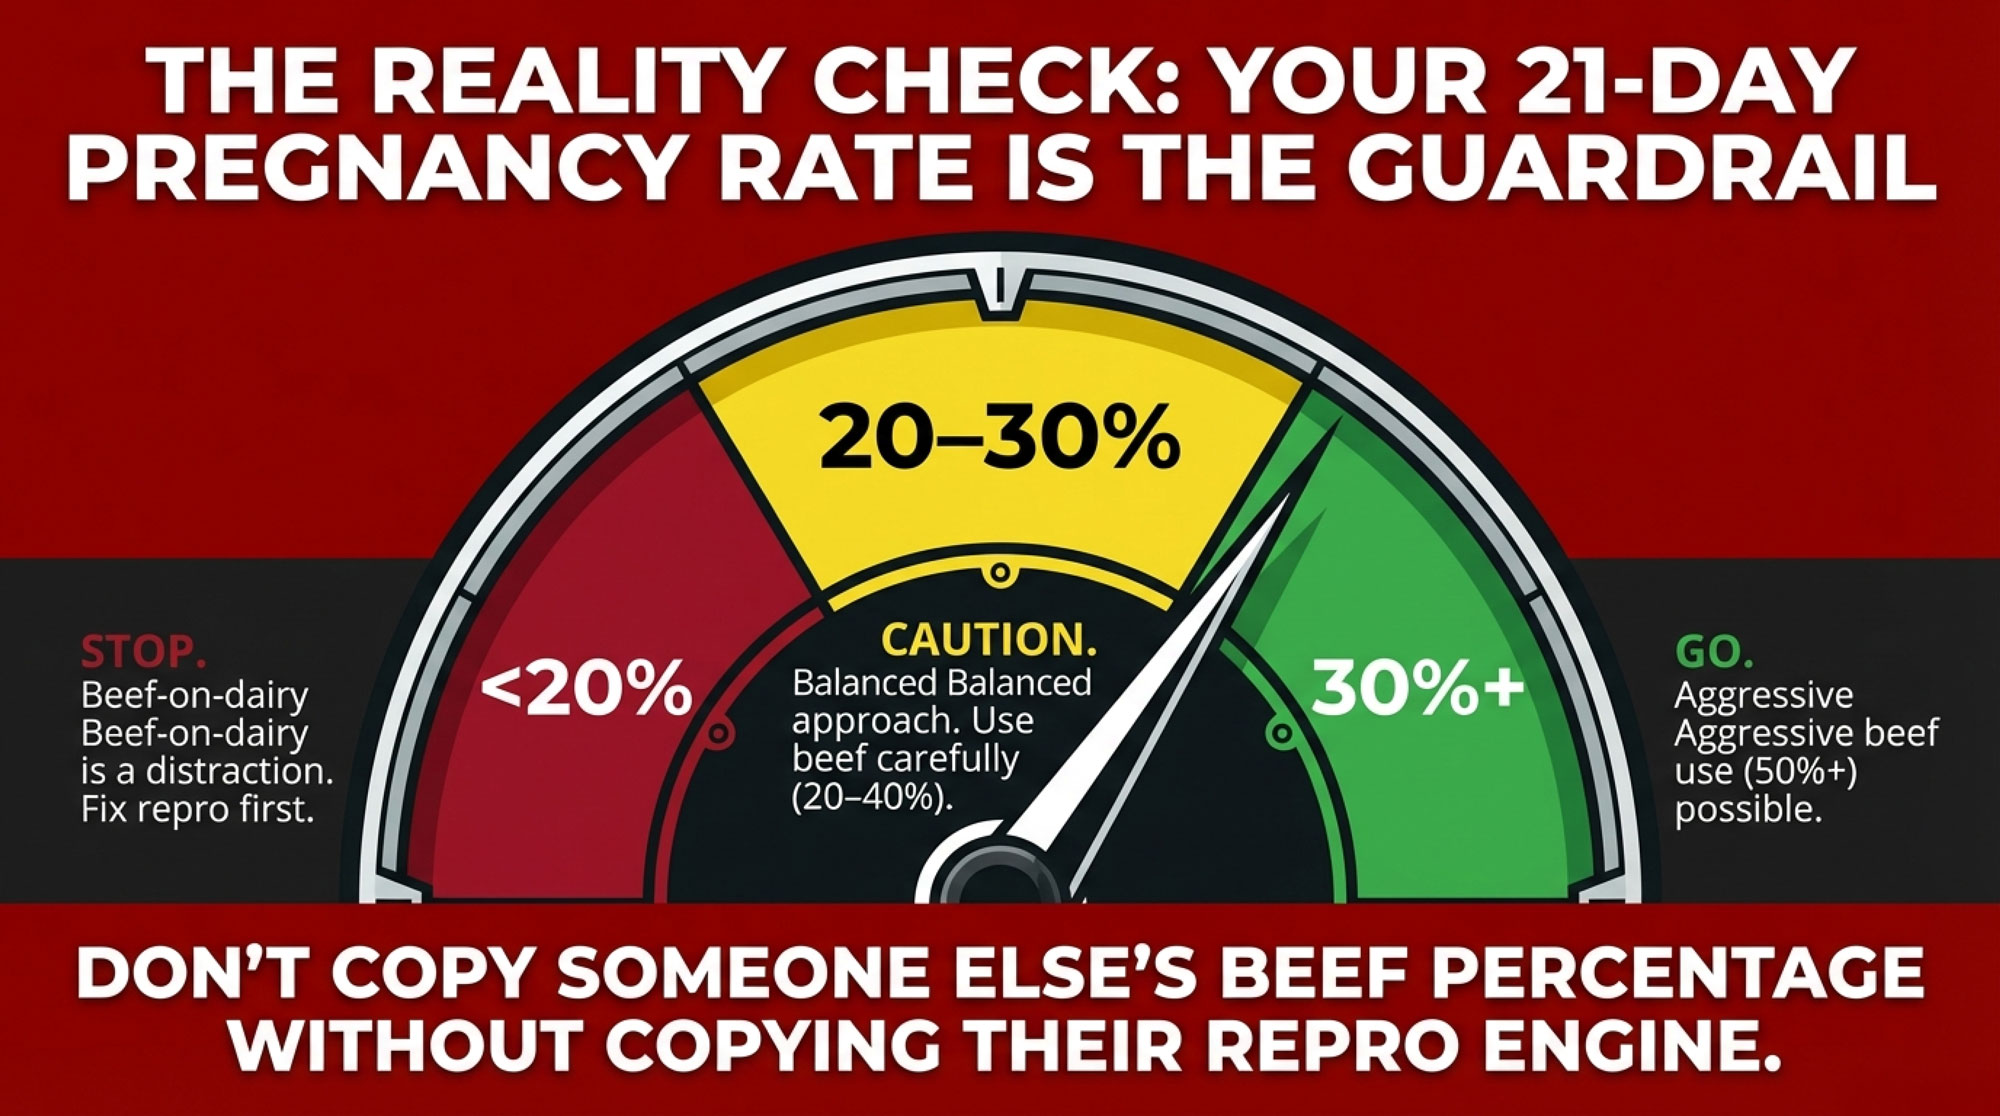
Your 21‑Day Pregnancy Rate Is the Guard Rail
Here’s where good herds quietly get themselves into trouble: copying someone else’s beef‑semen percentage without copying their repro engine.
UW–Extension work and the JDS Communications paper both land on the same idea: beef‑on‑dairy is a “spare pregnancy” business. You use pregnancies you don’t need for replacements to make higher‑value beef‑on‑dairy calves. If you’re short on pregnancies or short on heifers, chasing beef premiums can saw through your replacement pipeline fast.
High‑performing herds recognized by the Dairy Cattle Reproduction Council (DCRC) often run 21‑day pregnancy rates in the mid‑30s to low‑40s. Those herds have room to be aggressive with beef semen and still sleep at night about replacements.
If your 21‑day pregnancy rate is in the teens or low‑20s, you’re running a different race.
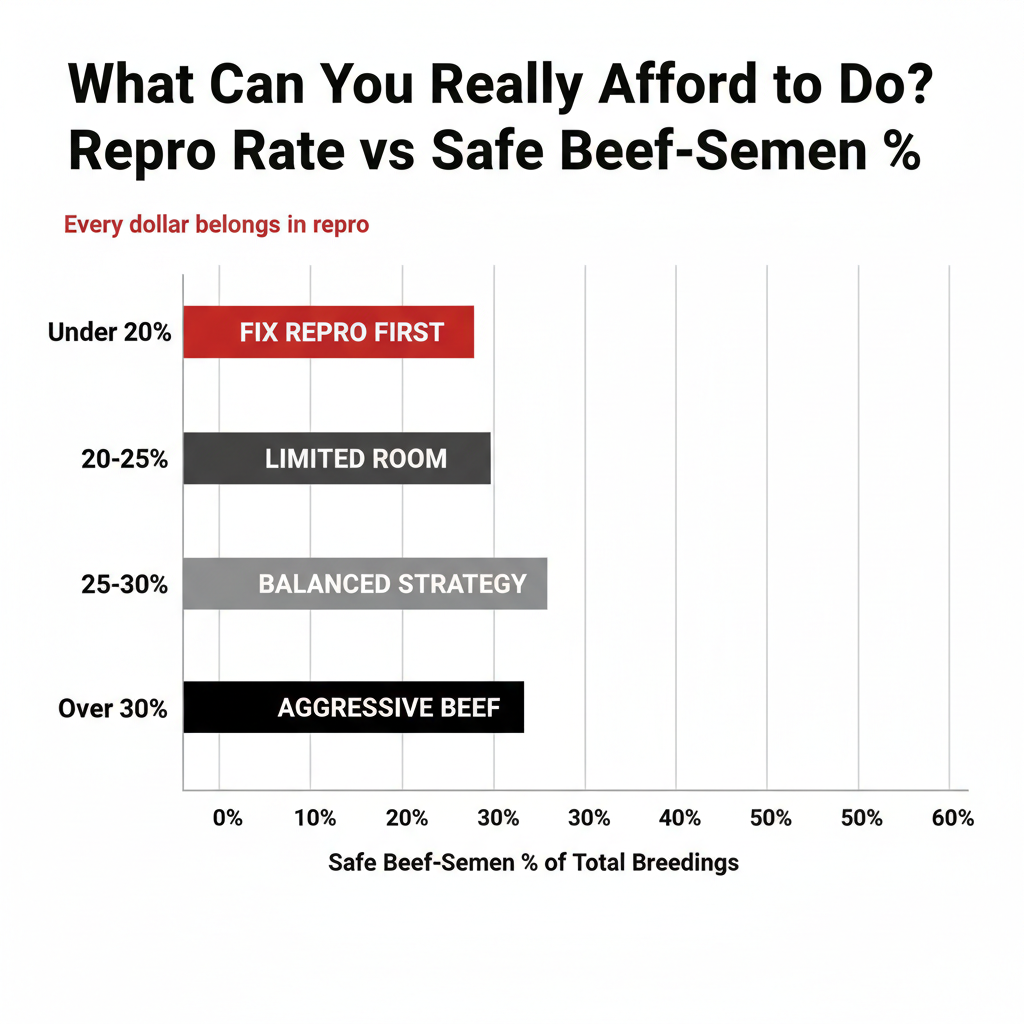
Here’s a simple frame based on the modelling and what the top repro herds actually do—not a law, but a practical starting point:
21‑Day Pregnancy Rate
Suggested Beef % of Breedings
What That Really Means
Under 20%
0–10%
Beef‑on‑dairy is a distraction; every dollar belongs in repro first.
20–25%
20–30%
Limited room; focus on sexed semen on top cows; use beef carefully.
25–30%
30–45%
A balanced “both/and” beef‑plus‑sexed strategy is realistic.
Over 30%
50%+
Aggressive beef use can work if you tightly manage the heifer inventory.
Those ranges line up with what the JDS Communications paper found and what DCRC‑type herds live every day. They’re guard rails, not commandments—but if your 21‑day PR is in the teens, cranking beef semen to 60% isn’t a bold strategy. It’s rolling the dice on your own replacement line.
Sexed Semen: The Old Knock vs the New Data
A lot of producers formed their opinions about sexed semen back when the technology was taking a 20‑point hit on conception. 2010 called. It wants those assumptions back.
A 2023 review in Animals pulled together results from multiple European and Irish studies on beef‑on‑dairy strategies. It found that modern sexed semen often hits 80–90% of conventional semen’s conception rates under good management, especially in heifers, not the steep penalty many people still quote from memory.
Both that review and the 2021 JDS Communications economics paper land on the same play:
Use sexed semen on higher‑index animals so more of your replacements come from the top of the herd.
Use beef semen on lower‑index animals to turn surplus pregnancies into calves with a better paycheque.
You may still see a few points lower conception with sexed vs conventional, depending on your handling and cow group. But if sexed semen lets you trim your heifer pipeline back to what you truly need—and frees up more pregnancies for beef‑on‑dairy calves that bring roughly double the Holstein price—the total calf‑plus‑semen line on your P&L can still climb.
So the real question isn’t “Is sexed semen good or bad?” It’s: what’s your actual cost per pregnancy with sexed, conventional, and beef semen, using your own conception rates and prices?
The Dornacker Plan: Crossbreeding, Robots, and Beef‑Ready Cows
Not every future‑proof herd is pure Holstein or built around banners.
Dornacker Prairies in Wisconsin is a fifth‑generation dairy with about 360 cows on roughly 1,000 acres, and about 90% of those acres are used to feed their own herd. Allen and Nancy Dornacker farm alongside Allen’s parents, Ralph and Arlene, and their four kids. They’ve been profiled internationally for blending robots, crossbreeding, and composting into a single system that works for their land and family.
Over the last decade, they’ve:
Installed Lely A5 robots starting in 2018, expanding from three units to six, with room for nine.
Adopted ProCROSS crossbreeding (Holstein × VikingRed × Montbéliarde) beginning in 2016 to improve fertility, health, and longevity.
Implemented composting that’s cut fertilizer purchases by about 80%.
Their crossbred herd averages around 9,200 kg of milk per cow per year (about 20,000 lb), with components near 4.6% fat and 3.6% protein—numbers that stack up nicely on a component‑based paycheque.
In a herd like that, beef‑on‑dairy is one more lever, not the whole story. Crossbred cows with stronger fertility give you more room to decide which lactations get beef vs sexed dairy semen. Moderate‑sized, robot‑friendly cows fit tighter breeding programs. Beef‑on‑dairy calf revenue stacks on top of genetics and facilities built around long‑term family ownership, not just next month’s cash flow.
If your focus is banners and purebred marketing, this path comes with trade‑offs. If your focus is a resilient commercial herd your kids might actually want to run, it’s worth a serious look.
Cover crops + “odd” forages fit beef rations; old infrastructure = low overhead
Robot-friendly moderate-frame cows; strong fertility (crossbreeding); family succession plan
Main Constraint They Manage
Heifer inventory—must keep sexed-semen conception high
Land base & feed logistics (790 acres, finishing cattle on-site)
Balancing milk components (4.6% fat, 3.6% protein) with beef-calf revenue
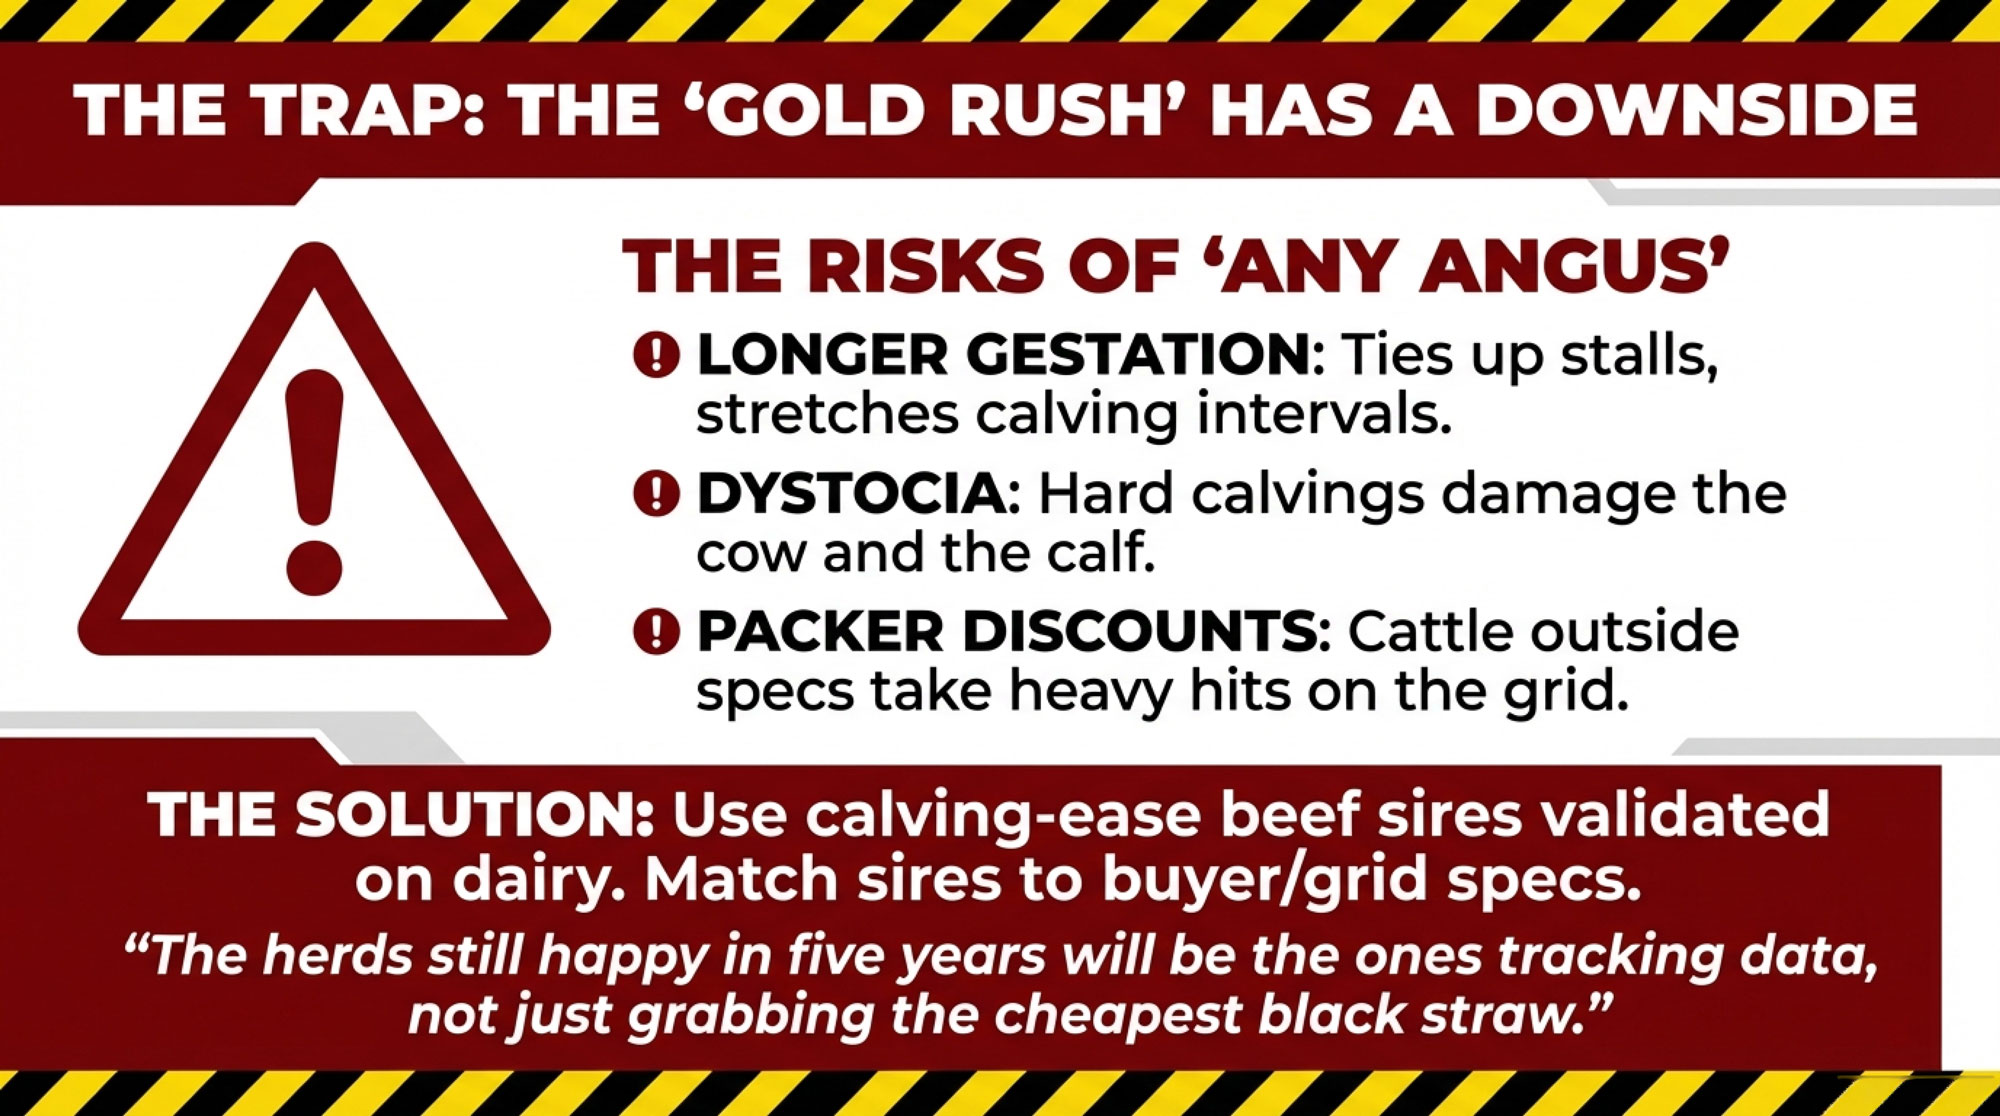
The Beef‑on‑Dairy Gold Rush Has a Downside
It’s easy to get starry‑eyed about $1,400 calf stories. Here’s the part that keeps you out of trouble.
The same 2023 Animals review that highlights beef‑on‑dairy’s upside also flags real risks when beef sires get sprayed across dairy cows without enough planning:
Longer gestation with some beef breeds, stretching calving intervals, and tying up stalls.
Higher dystocia and stillbirth rates in certain beef × Holstein crosses when calving ease isn’t prioritized.
Welfare and marketing problems occur when calves don’t meet buyer expectations on growth, muscling, or carcass traits.
On the fed‑cattle side, Kansas State’s grid‑pricing work shows that cattle outside packer specs on weight, yield, or quality take meaningful discounts. Poorly planned beef‑on‑dairy crosses—wrong frame, wrong fat cover, wrong muscling—are more likely to land in those discounted buckets.
If you:
Chase beef‑on‑dairy premiums with sires that add too much birthweight or gestation,
Ignore calving‑ease and carcass traits when picking beef bulls for dairy cows, and
Don’t align your calves with what your buyer, feedlot, or packer actually wants,
you can watch the “gold rush” vanish into dead calves, extra days open, and grid deductions.
The herds that will still be glad they leaned into beef‑on‑dairy five years from now are already:
Using calving‑ease beef sires validated on dairy crosses.
Matching sires to specific buyer or grid specs, not just grabbing “any Angus” off the sheet.
Tracking calf health, growth, and sale prices in their own records instead of assuming every beef‑cross calf lands at the top of the market.
What This Means for Your Operation
Beef‑on‑dairy is not a yes‑or‑no question. It’s a strategy that has to fit your repro, heifers, feed base, and markets.
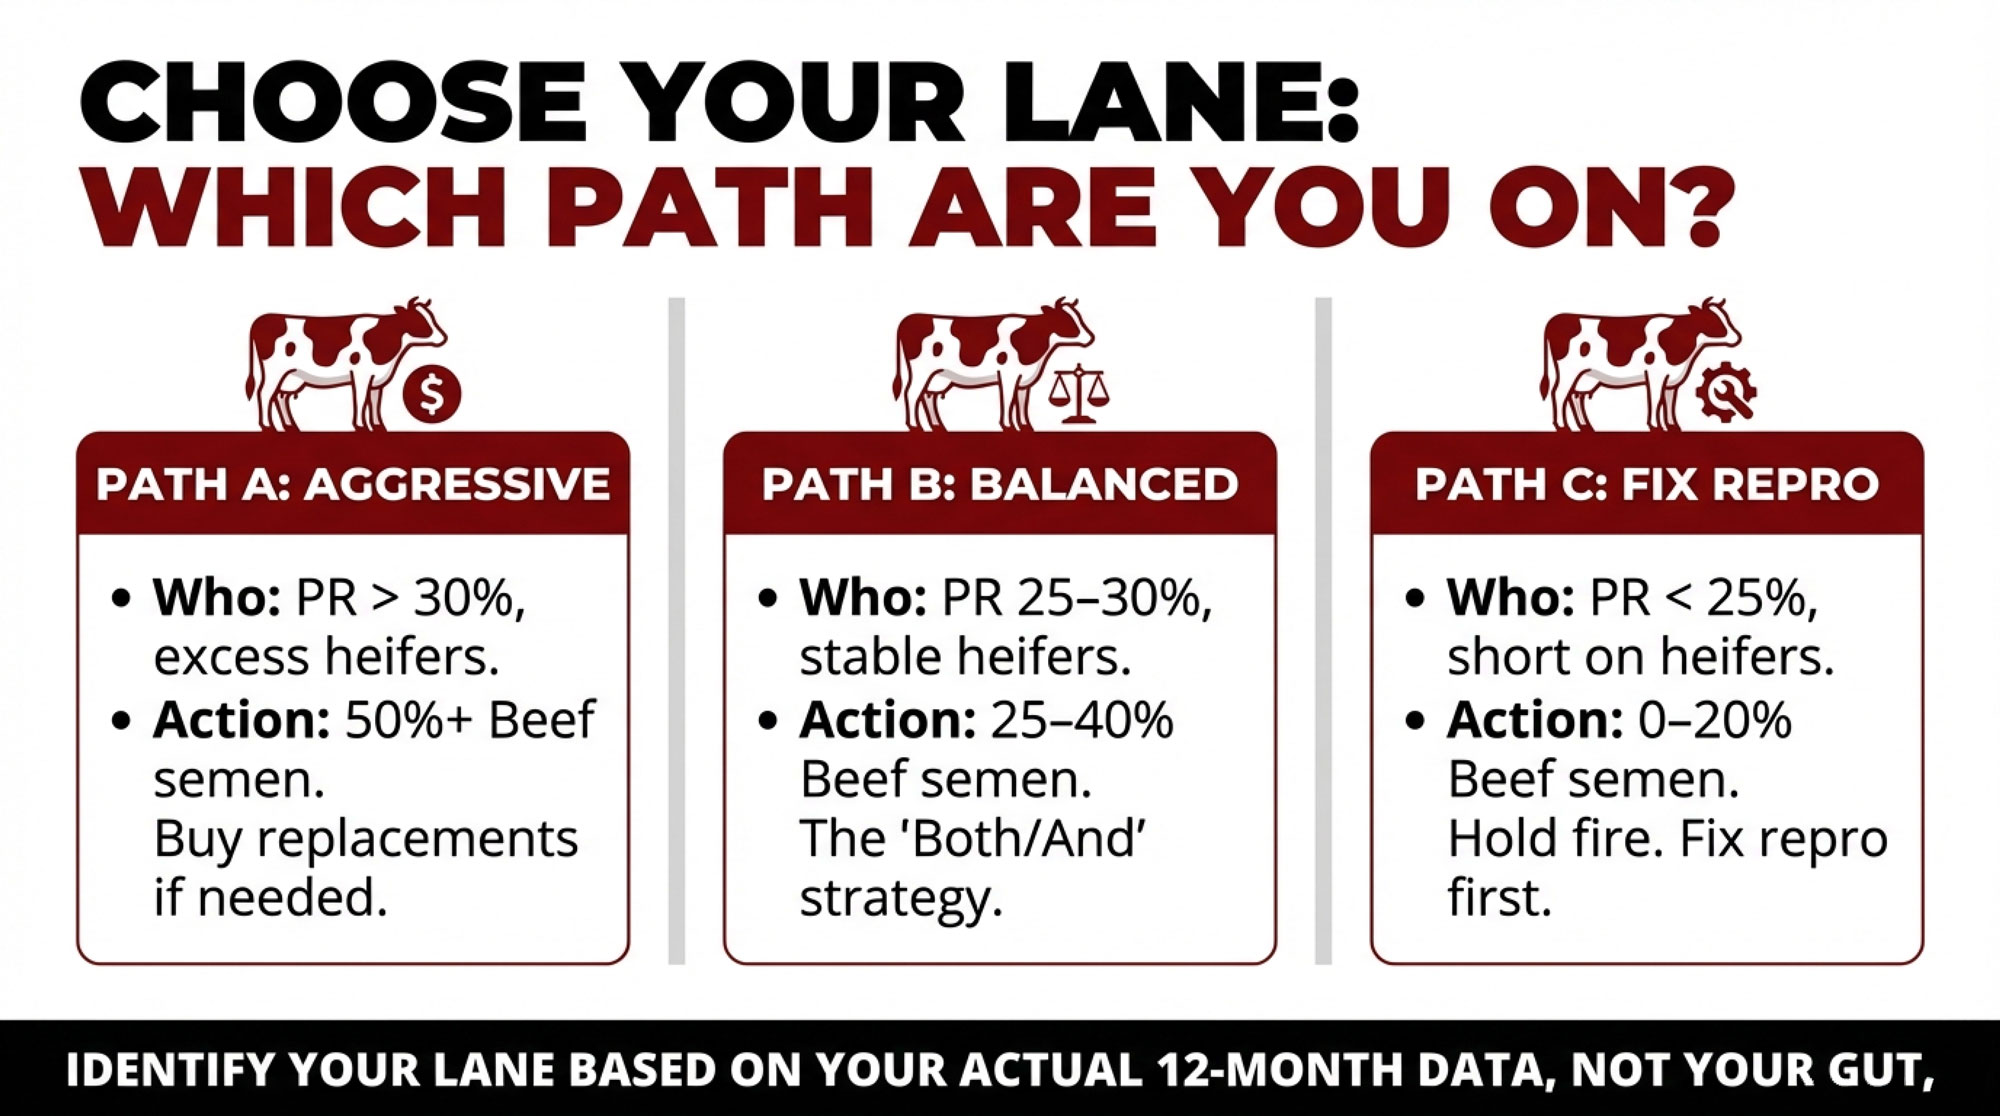
Most herds will land in one of three lanes.
Path A: Aggressive Beef (50%+ of Breedings)
You’re here if:
Your 21‑day pregnancy rate runs around 30% or higher.
You’ve consistently had more heifers than you truly need.
You have reliable outlets for beef‑on‑dairy calves or your own finishing capacity.
What it looks like:
The top 20–30% of cows and most heifers get sexed Holstein semen, selected on Net Merit, DWP$, or your index of choice.
The bottom 50–70% of cows receive beef semen from calving‑ease, dairy‑tested sires that meet buyer specs.
You’re willing to buy replacements when the heifer market says that beats raising every last one yourself.
Path B: Balanced Strategy (25–40% Beef)
You’re here if:
Your 21‑day pregnancy rate sits in the 25–30% band.
You’re mostly okay on heifers—short in some years, long in others.
You have decent calf markets but no locked‑in premium contract.
What it looks like:
The top 30–40% of cows and heifers get sexed dairy semen.
The bottom 25–40% of cows go to beef.
Conventional dairy semen still has a role where it wins on cost per pregnancy.
A lot of 300–800‑cow herds are going to live here for a while as they keep nudging repro higher.
Path C: Fix Repro First (0–20% Beef)
You’re here if:
Your 21‑day pregnancy rate is under about 25%.
You’re short on heifers and stretching days‑in‑milk.
Your risk budget feels pretty thin.
What it looks like:
Beef semen is used sparingly—older cows, obvious genetic culls, maybe a small test group.
Most of your cash goes into repro and cow performance: transition, heat detection, cow comfort, and vet work.
If you’re in Path C, the smartest beef‑on‑dairy move may be to hold your fire. Get your repro into the mid‑20s or 30s first. The beef premiums will still be there when you’ve actually got pregnancies to spare.
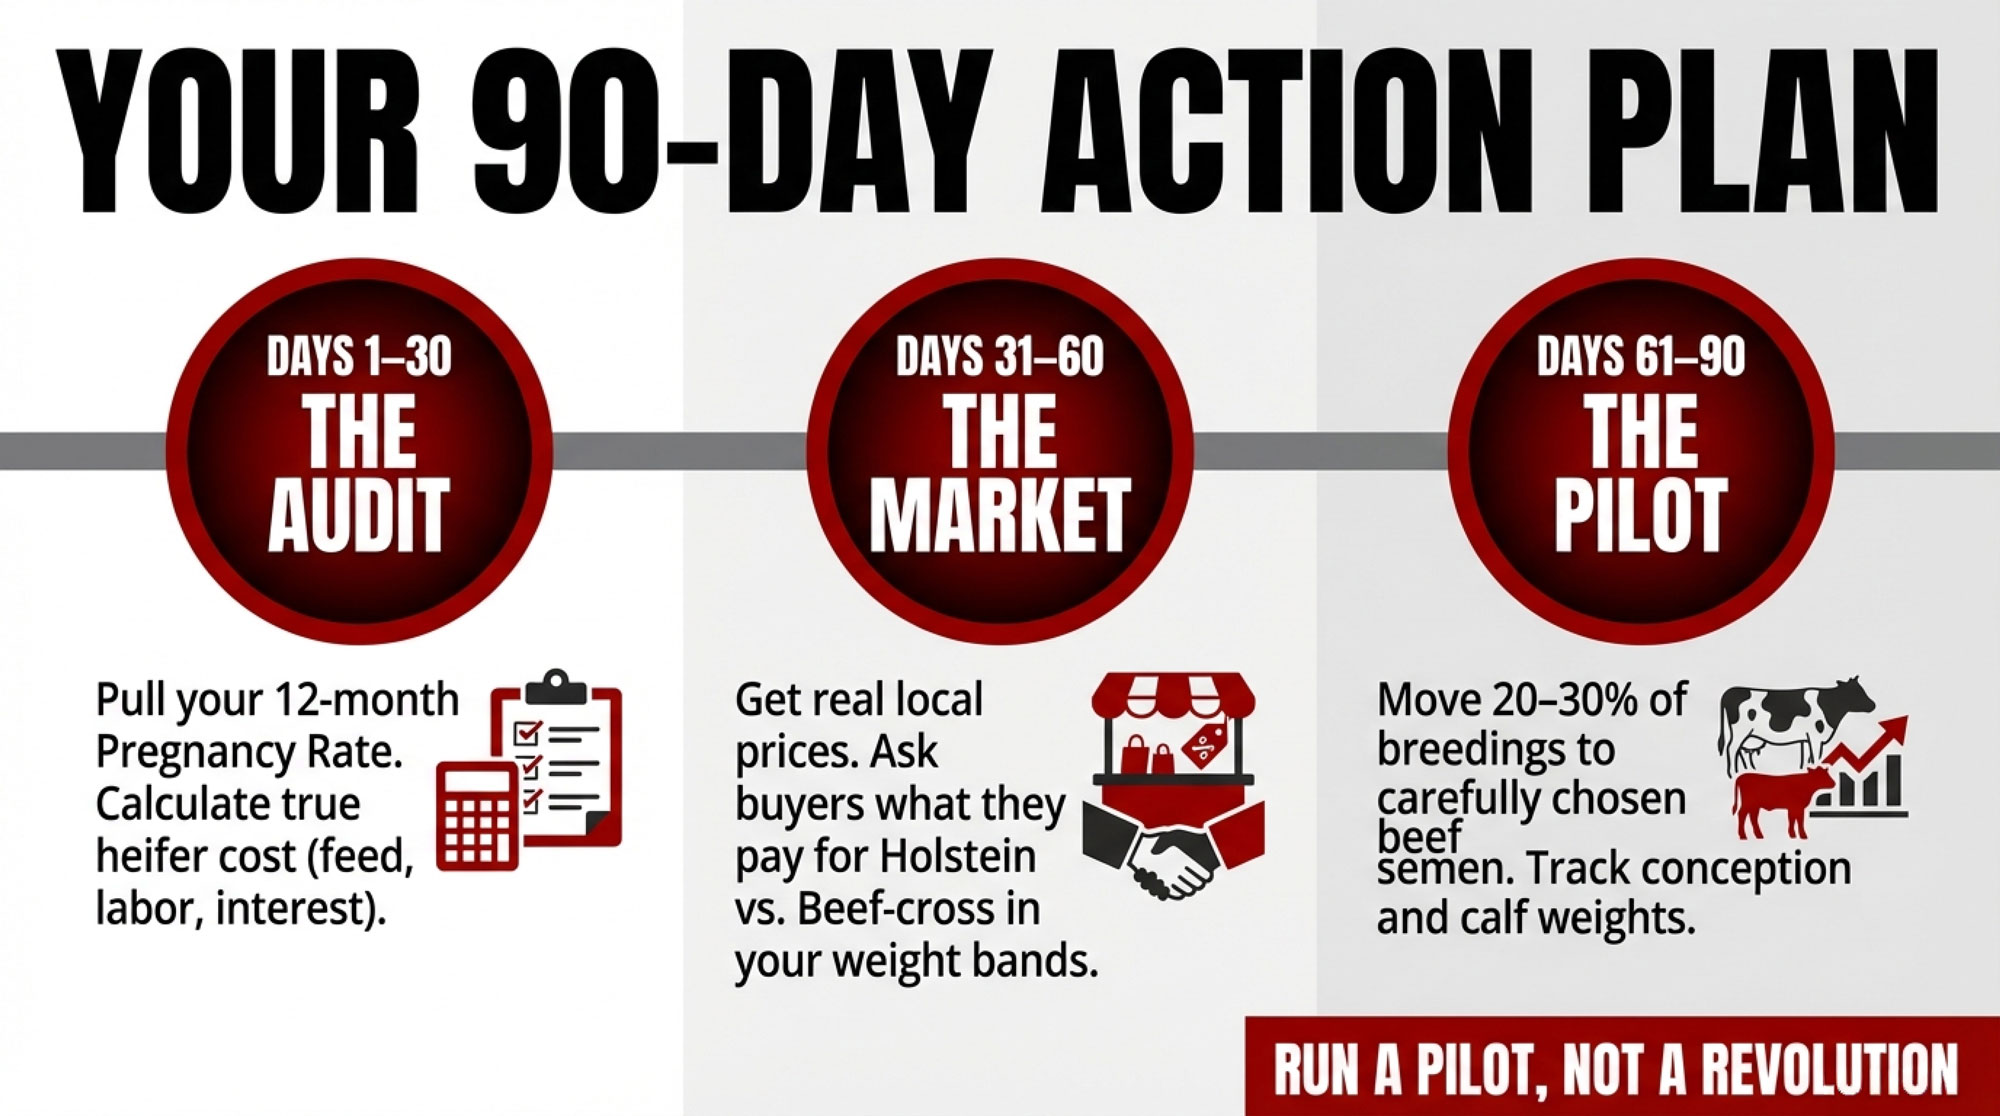
Your 90‑Day Action Plan
Here’s how you turn this from a good read into a working plan on your farm.
Next 30 days
Pull your 12‑month 21‑day pregnancy rate. Use your herd software or DHI reports, not a guess. That number tells you if Path A, B, or C is even on the table.
Calculate your full heifer cost. Use your 2024 books—feed, labour, interest, bedding, facilities, and death loss. If you need a framework, start from a university heifer‑raising budget or sit down with your lender and walk through your numbers line by line.
Next 60 days
Get real local calf price ranges. Talk directly to your sale barn or calf buyer. Ask what they’ve actually been paying for Holstein bull calves vs beef‑on‑dairy calves in your weight bands over the last 60–90 days. Use that spread—not coffee‑shop talk—as your baseline.
Sit down with your AI and genetics rep. Bring cow and heifer index lists, cull data, and heifer counts. Map how many replacements you truly need, and which animals can shift to beef semen without starving your fresh pen 18–24 months from now.
Next 90 days
Run a pilot, not a revolution. If your repro supports it, move 20–30% of breedings to carefully chosen beef semen for one breeding season. Track breedings, conceptions, calvings, calf weights, and sale prices. Let your own numbers, not somebody else’s story, tell you whether to ramp up or back off.
Check your risk tools. USDA’s Livestock Risk Protection (LRP) program has expanded coverage options in recent years, including coverage tied to feeder cattle and calf prices in general. Talk with your insurance agent or extension specialist about whether any current LRP products fit the kind of calves you’re producing and how you market them.
While you’re at it, read your milk cheque and the fine print of your contract. If your processor is paying for components, animal care, or specific beef‑on‑dairy traits, those lines belong in the same spreadsheet as semen prices and calf bids.
Timeline
Action Step
What to Calculate or Ask
Why It Matters
Next 30 Days(Step 1)
Pull your 21-day pregnancy rate
Use herd software or DHI—12-month rolling average, not a guess
Tells you if Path A, B, or C is even on the table; this number is your beef-semen budget
Next 30 Days(Step 2)
Calculate your full heifer cost
Feed + labor + interest + facilities + death loss from 2024 books
If your cost is >10–15% above local bred-heifer prices, raising every heifer is leaving money on the table
Next 60 Days(Step 3)
Get real local calf prices
Call sale barn or buyer: What did Holstein bulls vs beef-cross calves actually bring in last 60–90 days?
Use that spread—not coffee-shop gossip—as your baseline; if spread is <$300/head, beef-on-dairy math gets harder
Next 60 Days(Step 4)
Sit down with AI/genetics rep
Bring cow index lists, cull data, heifer counts; map how many replacements you truly need
Prevents the classic mistake: copying someone else’s beef-% when their repro and heifer pipeline are 20 points stronger than yours
Next 90 Days(Step 5)
Run a pilot, not a revolution
Move 20–30% of breedings to beef semen for one breeding season; track breedings, conceptions, calvings, calf weights, sale prices
Let your numbers tell you whether to ramp up or back off—not somebody else’s story at the sale barn
Next 90 Days(Step 6)
Check your risk tools
Talk to insurance agent about USDA Livestock Risk Protection (LRP) for feeder cattle/calf price coverage; read milk contract fine print for component or beef-calf incentives
If your processor pays for specific traits or your calf market swings hard, these lines belong in the same spreadsheet as semen prices
Key Takeaways
Beef‑on‑dairy calves are bringing several hundred dollars more per head than Holsteins in many U.S. markets—Holstein calves that used to bring $300–$450 are now commonly $700–$1,000 in strong markets, while beef‑cross calves are topping $1,500–$1,750 in parts of Wisconsin and over $1,000 in Pennsylvania and other key regions.
Heifer economics have flipped fast. CoBank says inventories could shrink by another 800,000 head before 2027, while Wisconsin replacement values jumped 69% in a year, and many U.S.-bred heifers now sell north of $3,000, with some lots over $4,000.
Beef‑on‑dairy works best long‑term when repro and heifer numbers are strong. Modelling shows the math starts to work above roughly 20% 21‑day PR and 2x calf price, with herds in the 30–40% band having the most flexibility.
There’s a real downside if you pick the wrong beef sires or ignore carcass specs. Longer gestations, harder calvings, and packer grid discounts can erase calf‑price gains very quickly.
The herds that will still be happy with beef‑on‑dairy in five years are matching sexed and beef semen to their own numbers—pregnancy rate, heifer needs, feed base, and actual buyers—not to the latest rumour at the sale barn.
The Bottom Line
You don’t have to milk 650 cows in Luxemburg or farm 790 acres in Fond du Lac County to make this work. But, like those families, you do have to pick a lane and live with the math that comes with it.
So when you look back on 2026, a year from now, do you want to say, “We finally lined up our breeding plan with our numbers,” or still be loading $700 Holstein bull calves while your buyer’s paying a lot more for the right beef‑on‑dairy cross?
Complete references and supporting documentation are available upon request by contacting the editorial team at editor@thebullvine.com.
Learn More
Building a Beef-on-Dairy System: Capturing $360,000 in Annual Farm Profit – Stop leaving money on the table and start building a profit-driven pipeline. This breakdown delivers the exact ROI calculations and management shifts needed to capture massive annual revenue gains by aligning your breeding with real-world demand.
The ProCROSS Payoff: Is It Time to Cross the Line? – Breaks down the University of Minnesota’s findings on how crossbreeding delivers a 9-13% boost in daily profit. This unconventional approach reveals how improving health and fertility traits secures your competitive advantage in a high-cost environment.
The Sunday Read Dairy Professionals Don’t Skip.
Every week, thousands of producers, breeders, and industry insiders open Bullvine Weekly for genetics insights, market shifts, and profit strategies they won’t find anywhere else. One email. Five minutes. Smarter decisions all week.
Sick calves can drain $27,000/year from your herd. By 2026, genomics will let you stop breeding them. Here’s the playbook.
EXECUTIVE SUMMARY: USDA research now confirms what many producers have long suspected: calf scours and respiratory disease are partly genetic—and by 2026, you’ll be able to select against them. The numbers are hard to ignore. Sick calves can drain $27,000 a year from a 1,000-cow herd, while wrong breeding calls leave another $30,000-plus on the table in missed beef-on-dairy premiums and wasted heifer slots. With replacements at a 20-year low, beef-cross calves topping $1,000, and heifers costing north of $2,500 to raise, every semen straw now carries real economic weight. This article lays out a five-step breeding playbook—genomic testing, rule-based beef-versus-dairy decisions, calf-health sire screening, calving-pressure management, and ongoing market adjustments—that forward-thinking herds are already putting to work. Producers who start now can realistically expect to shift $50,000 or more in annual herd economics within 18-24 months.
You know how the talk goes once the parlor’s washed down and the coffee’s on. Somebody mentions a nasty run of scours or a bunch of calves that just won’t quit coughing in the group pen, and five minutes later, you’re into genomics, beef‑on‑dairy, heifer prices, and whether some cows should ever see a dairy straw again. That’s not small talk anymore. That’s survival planning.
What’s interesting right now is that the genetics and the economics are finally lining up with what a lot of you have been seeing in your own hutches. Some cow families just throw tougher calves. Others seem to live in the treatment book every winter. And those sick calves quietly eat money long before they get a chance to show what they can really do on butterfat performance, fertility, or longevity.
At the same time, beef‑on‑dairy has turned into serious money in a lot of sale barns and contract deals, right when replacement heifers have slid to the lowest levels we’ve seen in about 20 years and gotten expensive to either raise or buy. A 2025 CoBank report describes US dairy heifer inventories as sitting at roughly a 20‑year low and projects they could tighten by as much as 800,000 head before gradually rebounding after 2027 as roughly 10 billion dollars of new processing capacity comes online and needs milk. Analysts used USDA Cattle Inventory data to show that the number of dairy heifers over 500 pounds dropped from about 4.76 million in 2018 to roughly 4.06 million by early 2024—almost a 15% decline in the pool of future milkers.
Put all of that together, and the question changes from “How do we get fewer sick calves?” to something a lot sharper:
Which calves do you actually want to be making in 2026—and which ones are you better off never creating in the first place?
Let’s walk through what the newest science says about calf‑health genetics, how it connects to beef‑on‑dairy money and replacement economics, and what a practical breeding plan looks like on real dairies.
Looking at This Trend: What the New Calf‑Health Genetics Actually Show
If you’re going to let genetics influence how you think about scours and pneumonia, the first question is simple: are these traits heritable enough to move the needle?
A 2025 paper in the Journal of Dairy Science from USDA’s Animal Genomics and Improvement Laboratory went straight at that. The team led by geneticists Babu Neupane, PhD, and John B. Cole, PhD, pulled producer‑recorded calf health data from the National Cooperator Database and built what’s probably the most comprehensive calf‑health dataset we’ve ever seen for North American Holsteins and Jerseys.
Here’s what they worked with:
207,602 calf records for diarrhea between 3 and 60 days of age.
681,741 records for respiratory disease between 3 and 365 days.
Calves born from 2013 to 2024, with about 97.5% of the data coming from Holsteins and Jerseys.
When they summarized those records, they found that 14.46% of calves had a recorded case of diarrhea in that 3‑ to 60‑day window, and 16.05% had a recorded respiratory case between 3 and 365 days. If you’ve ever watched a damp March wind whistle through hutches in Wisconsin or Ontario, those numbers probably sound about right. Scours tends to bully the youngest calves; as they get older, respiratory problems slowly take over.
On the genetic side, they estimated heritabilities of 0.026 (2.6%) for resistance to diarrhea and 0.022 (2.2%) for resistance to respiratory disease. That’s modest, but it’s right in line with what’s been reported for cow‑health traits like clinical mastitis, metritis, and ketosis that we already include in Net Merit, Pro$, and other indexes. In plain language: calf‑health traits behave like other health traits we’re already comfortable breeding for.
Trait
Heritability
Similar Industry Trait
Top 5% Sires (% Healthy Calves)
Bottom 5% Sires (% Healthy Calves)
Practical Implication
Diarrhea Resistance
2.6%
Clinical Mastitis (1.5%–3%)
88%
71%
17 percentage-point spread; top sires prevent ~200+ sick-calf events per 1,000 calves born
Respiratory Resistance
2.2%
Ketosis (1–2%)
88%
70%
Same order of magnitude; respiratory RBV predicts > 1 fewer pneumonia case per 10–12 calves
Cow Mastitis
1.5%–3%
Industry standard
~85%
~72%
Calf-health heritability is comparable to traits we’ve been selecting on for 20+ years
Genetic Correlations
0.0 to -0.1
Low cross-trait pull
N/A
N/A
Improving calf health does not sacrifice milk, fat, protein, or fertility gains
What’s encouraging is that when USDA‑AGIL ran genomic evaluations for these traits, the genomic predictions were noticeably more reliable than simple parent averages, particularly for young bulls with no daughter data yet. They also found that genetic correlations between calf‑health traits and most other traits—production, fertility, cow health—were low, with only a modest link between diarrhea and respiratory resistance and very little pull against milk or component traits. That matters. It means you can add calf‑health traits into a balanced index without giving up the gains you’re making in milk, fat, protein, or cow fitness.
USDA‑ARS and the Council on Dairy Cattle Breeding (CDCB) have been presenting this work through ICAR and industry meetings. The consistent message has been that these calf‑health traits are ready for inclusion in US national genetic evaluations for Holsteins and Jerseys as soon as data quality and validation milestones are met, with 2026 targeted as the window for implementation. The exact month depends on final testing and governance, but the direction is clear.
So, from a genetics point of view, we’re not talking about “maybe someday” anymore. These are real traits with real proofs coming.
What Sick Calves Really Cost: From $25 Per Case to $27,000 Per Year
You probably don’t need a scientist to tell you that sick calves are expensive, but it helps to put some hard numbers behind your gut feel.
A 2023 study in JDS Communications examined health costs at 16 certified organic Holstein dairies in the US. The researchers, including Laura C. Hardie, MSc, used on‑farm treatment records and standardized cost estimates for veterinarian time, medications, and producer labor.
On the calf side, they found average direct costs of:
25.21 dollars per case of scours.
56.37 dollars per case of respiratory disease.
Those figures are just what you can see on the invoice—vet visits, drugs, and some labor. They don’t include slower growth, extra days on milk replacer or starter, extra days to breeding, or the way a rough start can nibble away at first‑lactation milk and component performance. Reviews on calf health and heifer rearing, along with herd‑level calf‑health investigations, keep showing what many of you have already noticed: calves that get hammered early often lag behind, even when they survive and make it into the milk string.
So it’s reasonable—based on those cost estimates and the documented performance impacts—to say that a serious pre‑weaning disease episode can trim a few hundred dollars off a heifer’s lifetime economic value on many farms once you add up treatment, extra rearing time, and lost milk later on. The exact figure will move with your feed costs, labor rate, housing system, and milk price, but the order of magnitude is real.
If you want to see how that plays out across a herd, let’s do some simple math. Picture a 1,000‑cow dairy calving about 900 heifers a year. Say 15% of those calves—135 animals—have a significant scours or respiratory event. If you assign a conservative 200‑dollar economic hit per case, combining Hardie’s direct treatment costs with some allowance for long‑term performance losses, you end up at:
135 calves × 200 dollars ≈ 27,000 dollars per year in calf‑health‑related losses.
Cost Component
Amount (USD)
Percentage of Total
Direct Vet & Drug Costs
5,100
19%
Producer Labor (extra time)
4,050
15%
Slow Growth & Extended Rearing
8,100
30%
Lost First-Lactation Milk/Components
9,750
36%
Total
$27,000
100%
That’s not a published national average—it’s a realistic illustrative example built from current cost data and what we know about early‑life disease. On herds with higher disease burden, more expensive inputs, or longer rearing periods, that number can easily climb into the higher tens of thousands.
And that’s before you count the extra time and stress your team spends on repeated treatments and nursing fragile calves through bad weather.
So when we say calf health isn’t a “minor line item,” that it’s a major factor in your annual profit and loss, that’s the level of math we’re talking about.
Beef‑on‑Dairy and Tight Heifer Numbers: Why Every Calf Turned Strategic
Now layer the beef‑on‑dairy story and the heifer shortage on top of that.
On the beef side, you’ve watched this play out: the US beef cow herd has been slow to rebuild, and beef supplies have been tight enough that packers and feedlots are looking harder at dairy‑origin cattle, especially high‑health dairy‑beef cross calves. At the same time, dairy herds have become much more consistent with reproduction—timed AI, sexed semen, improved fresh cow management through the transition period—so you have more control over whether a given pregnancy is a “dairy heifer” or a “beef‑on‑dairy” calf.
Economists who work with both dairy and beef have been frank about the impact. In a 2025 interview, Mike North, an economist and risk‑management advisor with Ever.Ag, who works with many Midwest dairies, explained that beef‑on‑dairy breeding programs are generating “upwards of two and a half dollars per hundredweight in revenue back to the farm just in beef breeding” on some operations. In that same segment, he pointed out that in the current market environment, it’s not unusual to see a well‑bred, three‑day‑old dairy‑beef cross calf bring more than 1,000 dollars at certain sales, which really changes how that calf looks compared to a straight Holstein bull calf.
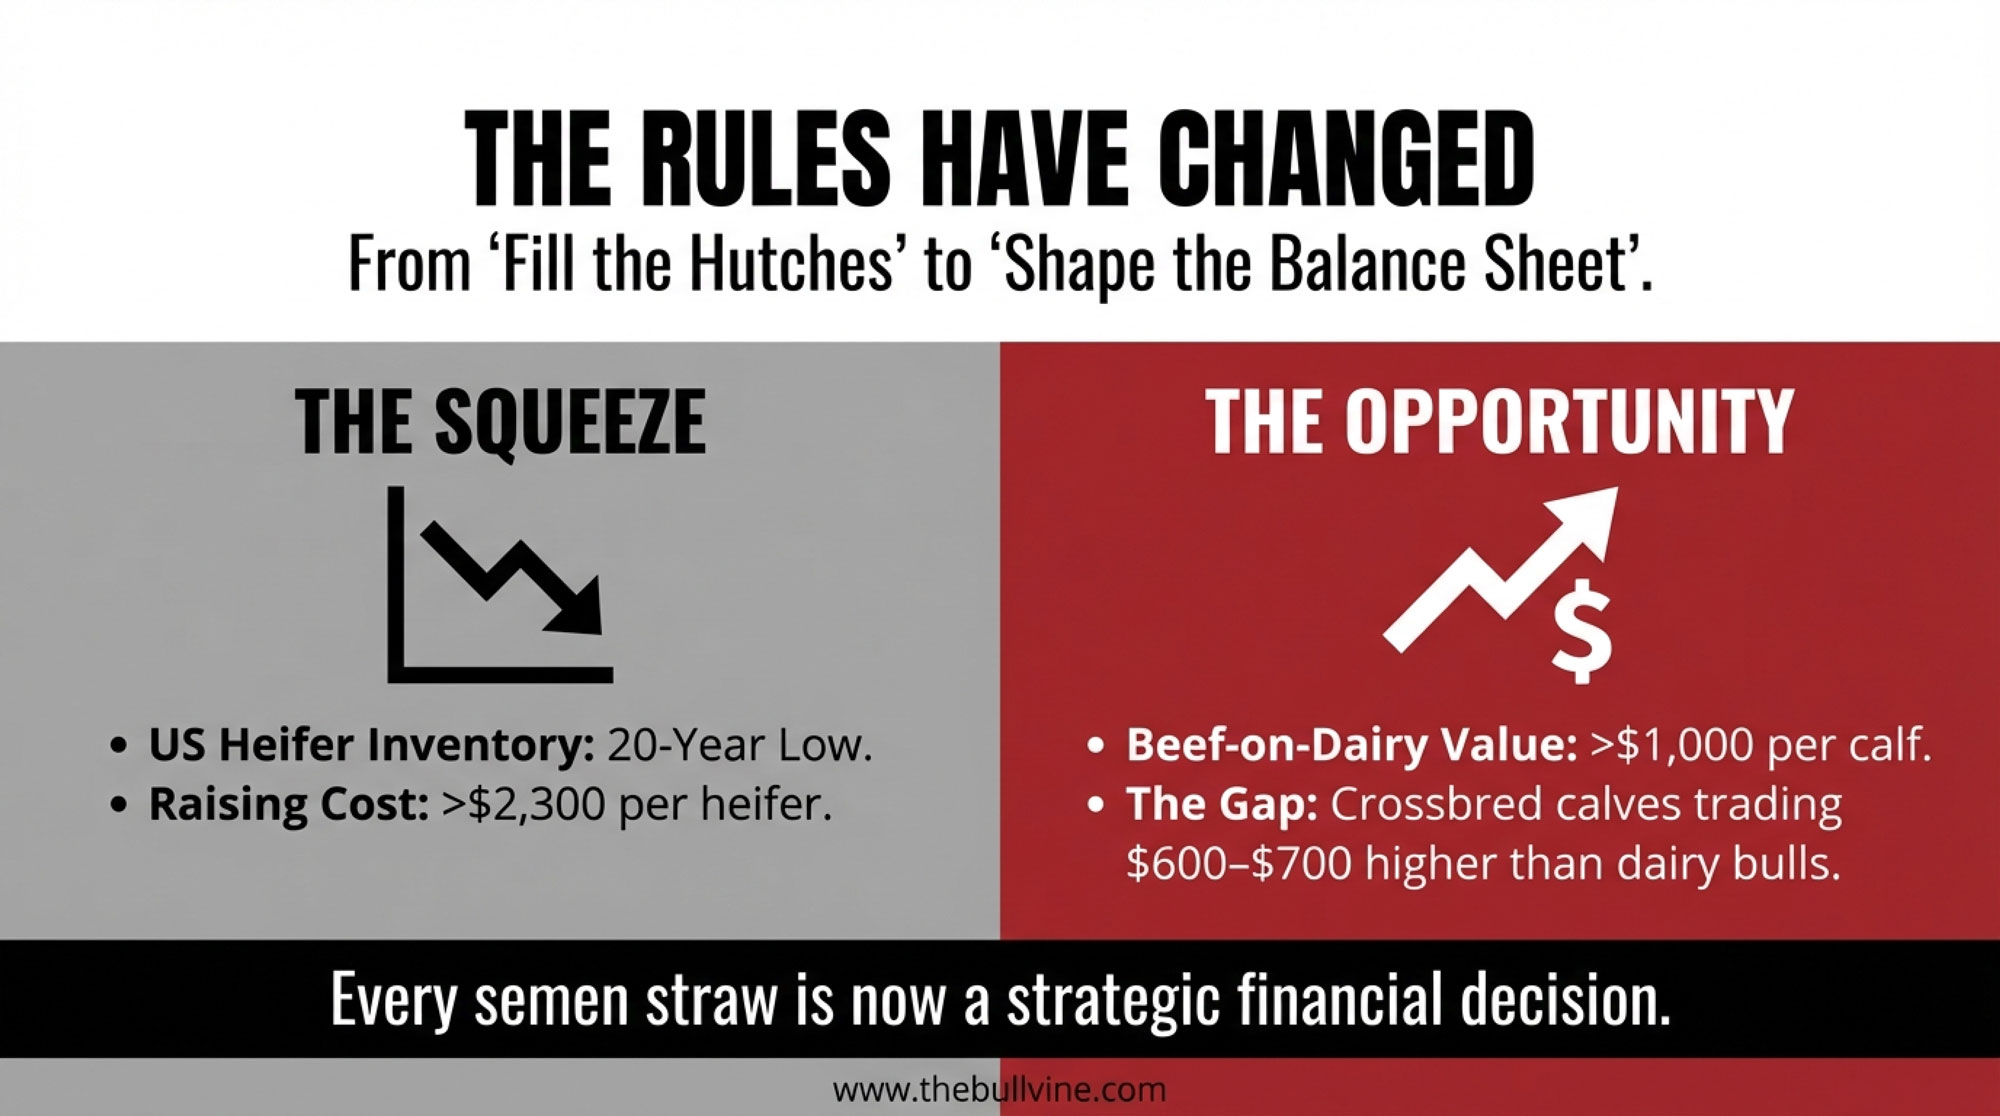
On the replacement side, CoBank’s 2025 heifer‑inventory analysis describes a sector at a “unique inflection point,” with dairy heifer numbers already at a 20‑year low and not expected to rebound until around 2027, as new processing plants draw more milk and heifer demand slowly pulls numbers up again. USDA Cattle Inventory reports shows that heifers over 500 pounds dropped from roughly 4.76 million in 2018 to 4.06 million in early 2024, while noting that stronger milk prices and processing expansion could drive replacement values higher. At the same time extension economists have pointed out that the total cost to raise a replacement heifer—from birth to first calving—often sits somewhere between 1,600 and 2,400 dollars under pre‑inflation conditions, with more recent budgets and Canadian/US benchmarking suggesting that on many units today, full economic rearing cost runs in the 2,300–3,000‑dollar range per head once you factor in feed, labor, housing, and overhead.
So across North America right now:
Dairy‑beef cross calves commonly bring a few hundred dollars more than straight Holstein bull calves at auction, with recent reports showing crossbred calves trading around 600–700 dollars in some Midwest sales while conventional bull calves lag behind.
In certain barns and weeks, especially in strong markets, three‑day‑old beef‑on‑dairy calves have topped 1,000 dollars.
Replacement heifers are scarce and expensive by historic standards, with multiple analyses pointing to rearing costs comfortably north of 2,000 dollars per head and market values for springers often pushing into the upper‑2,000 to 3,000‑dollar range in tight regions.
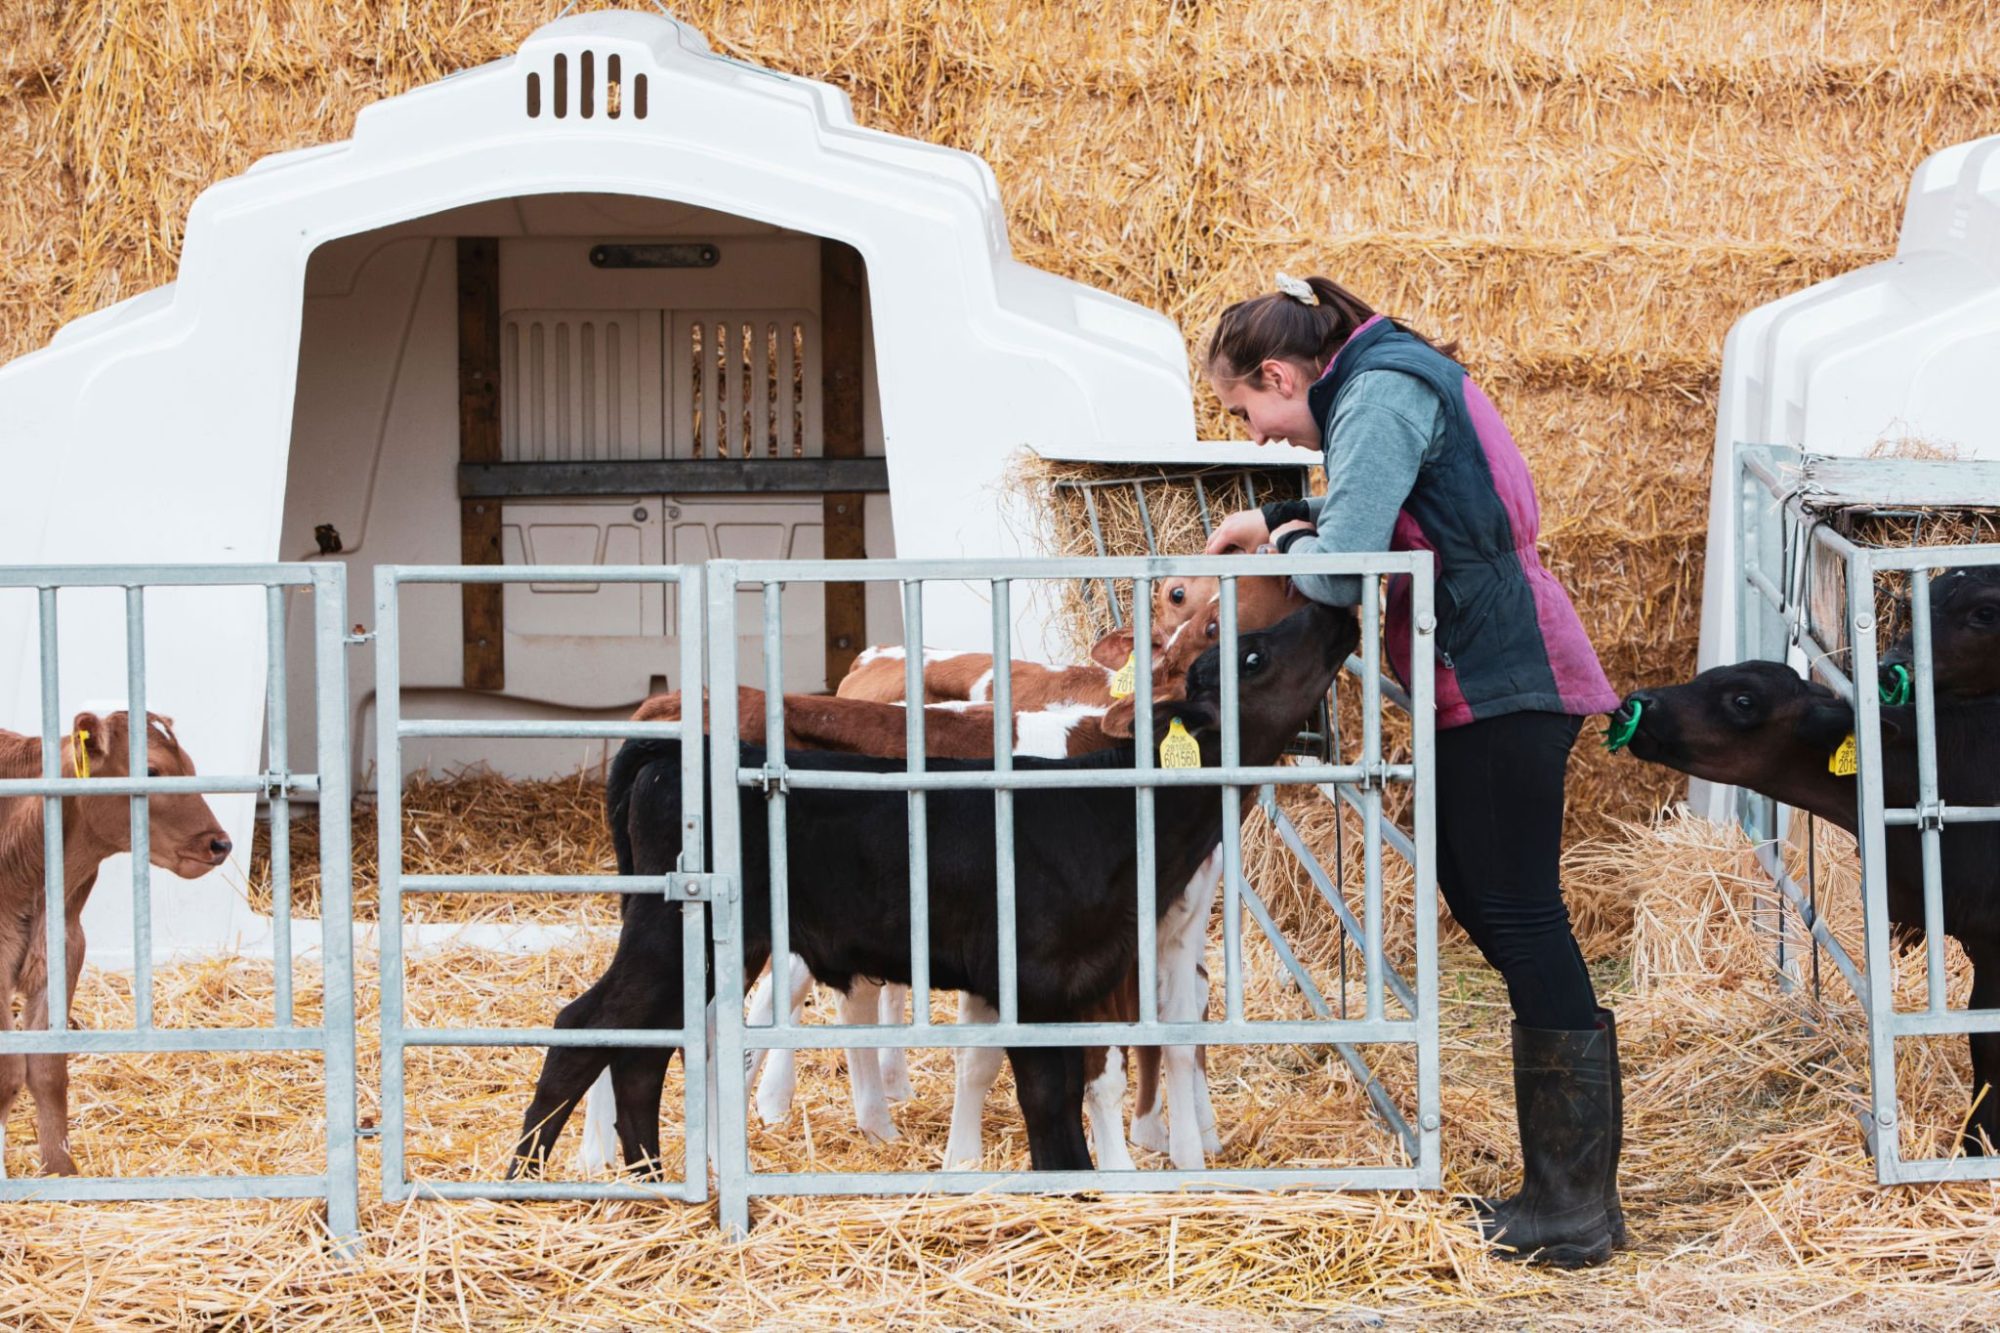
This development suggests that calves have shifted from “fill the hutches” to “shape the balance sheet.” Whether a pregnancy produces a dairy heifer or a dairy‑beef calf now has a direct and significant impact on both your future herd and your short‑term cash flow.
What Farmers Are Finding: A Five‑Step Breeding Framework That Actually Works
Looking at this trend across herds in Ontario, Wisconsin, California, and the Northeast, what I’ve noticed is that the operations making this work aren’t doing anything mystical. They’re just being very deliberate and consistent.
Most of them follow some version of a five‑step framework:
Use genomics to see which cow families are truly driving your herd.
Make a clear, rule‑based beef‑versus‑dairy decision for each breeding.
For dairy matings, add calf‑health genetics to your sire criteria as those proofs become available.
Factor in gestation length and calving pressure so you don’t overload high‑stress windows.
Re‑run the economics regularly as calf prices, heifer values, and milk markets move.
Let’s unpack that in barn‑level terms.
Step 1: Use Genomics to See Which Families to Grow—and Which to Let Go
Most herds that are serious about this are genomic‑testing their heifer calves, and some have also done a one‑time pass on younger cows to avoid missing high‑value animals that might be hiding behind older genetics.
A good real‑world example comes from a 5,000‑cow Holstein herd in the western US profile in 2024. The dairy, managed by veterinarian and producer Dr. Sergio Lopes, began genomic testing heifers in 2016 when they realized they were simply overrun with replacements and needed a better way to decide which heifers were truly worth raising.
Genomic results showed them a few things very quickly:
Some cows they had always considered “average” based on current production actually had very strong genetic merit.
Some of their highest‑producing cows were benefiting more from management and environment than genetics.
There were identification problems—wrong semen recorded, calves linked to the wrong dams—that genomics helped uncover and correct.
After a couple of years of working with the data, Lopes said they were confident enough to change their breeding strategy completely. They dropped conventional semen, used sexed dairy semen only on their best families, and bred the rest to beef. Today, they have a background of roughly 12,000 dairy‑beef cross animals tied to their 5,000‑cow dairy and partner herds, with beef calves and fed cattle now a major income stream alongside milk.
On a 300‑ to 600‑cow family herd—say a free‑stall in Wisconsin or a tie‑stall in Ontario—the same pattern shows up on a smaller scale. Producers genomic‑test their heifer calves, rank them on the index that matters most—Net Merit, TPI, Pro$, LPI, maybe with extra weight on health—and discover they have:
A top group, often the top 20–30%, they absolutely want to build daughters and granddaughters from.
A middle group they can flex up or down based on heifer inventory and cash flow.
A bottom group that’s tough to justify raising to calving when replacements are expensive, and barn space is tight.
Once you see your herd laid out like that, it becomes a lot easier to say, “These families deserve sexed semen and more daughters,” and “These cows can contribute better through beef‑cross calves than through more low‑merit heifers.”
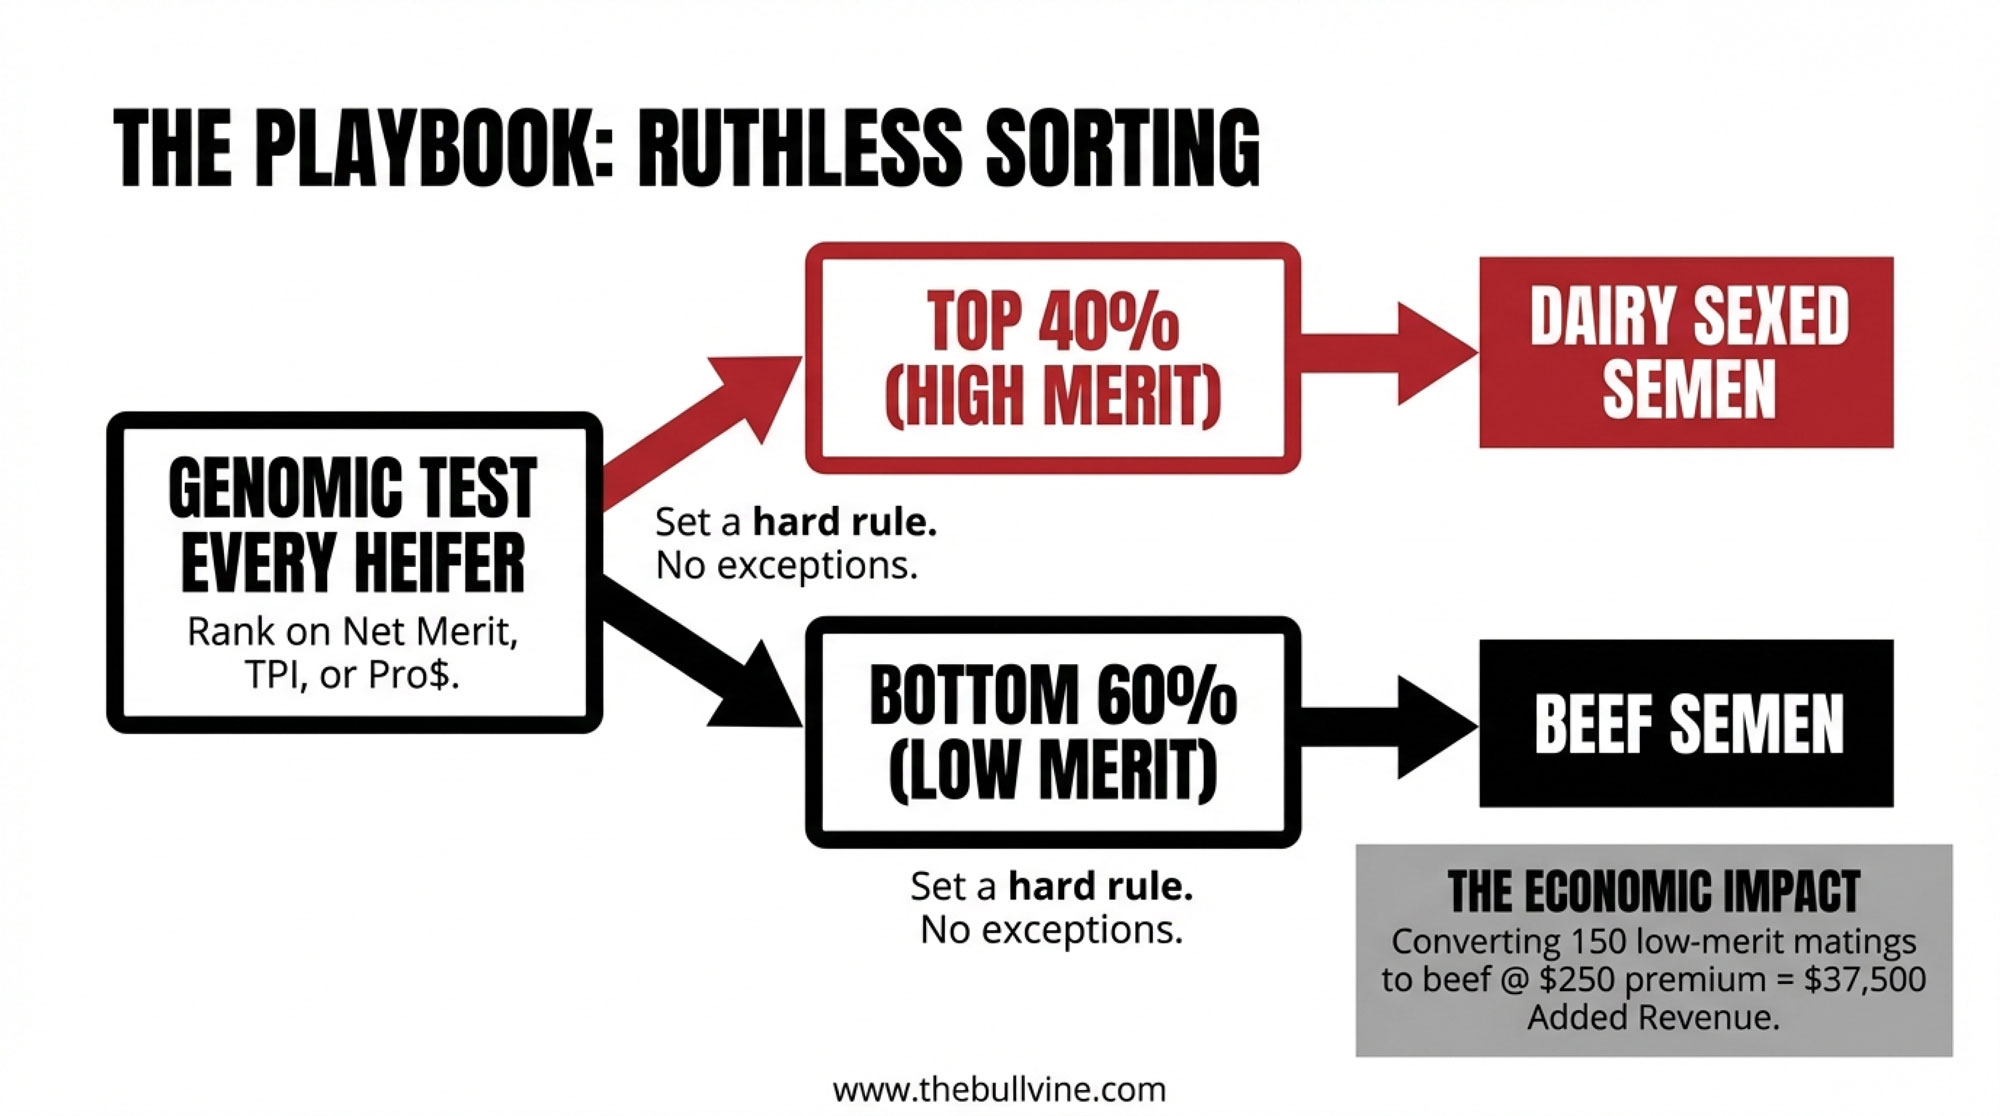
Step 2: Make Beef‑Versus‑Dairy Decisions Simple and Rule‑Based
Once you’ve got a handle on your cow families, the next step is to stop making beef‑versus‑dairy calls on the fly in the parlor and start following a simple rule you can execute every week.
A rule that’s working on a lot of herds looks something like this:
First‑ and second‑lactation cows whose most recent heifer ranks in the top 40% of your genomic list get bred to dairy semen, often sexed.
Cows whose daughters fall below that line, plus older cows without strong family backing, get bred to beef.
When herds stick to that for a full year, they usually end up with roughly 30–40% of cows getting dairy semen and 60–70% getting beef. That mix often covers replacement needs—because dairy semen is concentrated on the right cows—while generating a steady stream of well‑bred dairy‑beef calves.
Here’s where the big math starts to bite in your favor. In many Midwestern markets right now, it’s common to see a beef‑on‑dairy calf sell for a few hundred dollars more than a straight Holstein bull calf. For example, in early 2024, it was reported that crossbred calves were selling for around 675 dollars per head in some US sales, while conventional Holstein bull calves lagged far behind, and noted that “beef on dairy” was becoming a “big money” factor in the heifer shortage conversation. If you take 150 matings that would have produced low‑merit dairy calves and, instead, flip them to beef‑on‑dairy matings with a 250‑dollar average premium, you’re looking at:
Even if you trim that for calf‑price volatility or the occasional calf that doesn’t quite hit the premium, you’re still talking about tens of thousands of dollars per year from one simple change in breeding policy.
And on the cost side, you’re not spending all the feed, bedding, labor, and barn space to raise heifers from those bottom families. Long‑term work out of places like Cornell, Penn State, and western Canadian benchmarking suggests that when you spread all the costs out, total rearing cost per dairy heifer—from birth to first calving—often sits in the 2,000–3,000‑dollar range once you include feed, bedding, labor, health, and overhead, with the exact figure depending on system (confinement, pasture, dry lot) and region. So not raising heifers that were never likely to pay you back is a big part of this story, too.
Step 3: Add Calf‑Health Genetics to Your Dairy Sire List
Now bring calf‑health genetics back into the picture.
We’ve already seen that calf diarrhea and respiratory disease are heritable and can be evaluated genomically. Canada gives us a clear preview of how those traits can look in practice.
In August 2025, Lactanet—the national genetics and data organization for Canadian dairy producers—launched a Holstein calf‑health genetic evaluation that combines recorded cases of respiratory disease from birth to 180 days and diarrhea from birth to 60 days. The new trait is expressed as a Relative Breeding Value (RBV) centered at 100 with a standard deviation of 5. Higher RBVs indicate sires whose daughters are more likely to stay free of recorded calf‑health events in that early‑life window.
Lactanet geneticist Colin Lynch, MSc, explained in that a five‑point increase in calf‑health RBV corresponds to about 5.4% more healthy calves with no recorded diarrhea or respiratory problems. Their analysis showed that, among proven sires, the top 5% for calf‑health traits had around 88% healthy daughters, while the bottom 5% averaged closer to 70–71% healthy daughters—depending on whether you’re looking at diarrhea or respiratory disease. In real‑world terms, that’s the difference between a family where “most calves just start and go” and one where you feel like you’re forever pulling buckets and syringes.
Sire Rank
% Calves NO Diarrhea
% Calves NO Respiratory Disease
Combined Healthy Rate (Est.)
Per 100 Calves: Sick Events
Economic Cost per Cohort (100 calves)
Top 5%
92%
90%
~88%
~12 sick calves
$2,400 in direct treatment + losses
Middle 50%
87%
84%
~80%
~20 sick calves
$4,000 in treatment + losses
Bottom 5%
82%
76%
~70%
~30 sick calves
$6,000+ in treatment + losses
Spread (Top vs. Bottom)
+10 pts
+14 pts
+18 pts
+18 more sick calves
+$3,600 annually per 100-calf cohort
Here’s how herds are starting to use that kind of information:
For heifers and first‑calf cows, they insist on bulls that meet their production and cow‑health criteria and also clear a minimum calf‑health RBV. Bulls with poor calf‑health scores simply don’t get used on young animals.
For older cows, calf‑health RBV becomes a tie‑breaker among bulls with similar milk, components, fertility, and cow‑health profiles.
In regions with tough winter respiratory seasons—Wisconsin, Minnesota, Quebec, Northern New York—some producers are deliberately matching higher calf‑health bulls to matings that will calve into late winter and early spring, when pneumonia risk is highest.
Of course, these evaluations live or die on the quality of the health records behind them. A 2023 Canadian Journal of Animal Science case study on calf respiratory illness and diarrhea recording in Ontario found that the share of milk‑recorded herds logging calf disease rose from 2.6% in 2009 to 11.1% in 2020, but also pointed out several places where data can be lost or misclassified between the farm and the national database. Neupane and Cole have likewise emphasized in USDA‑ARS communications that clear, consistent on‑farm recording of calf health is critical if we want reliable calf‑health proofs.
So one very practical step you can take this year—before US calf‑health numbers even hit your AI catalogs—is to tighten how you record scours and pneumonia. Sit down with your vet, agree on what counts as a case, and make sure those events get logged consistently in your herd software. That way, when calf‑health proofs land, you can trust them more and know your herd is contributing good data.
Step 4: Factor in Gestation Length and Calving Pressure
You don’t need a statistician to tell you that what you do with calving‑ease and gestation length can make or break certain months. Stack too many long‑gestation, big‑calf bulls on heifers or smaller cows that all calve in a tight two‑week window, and you’ll see it in stillbirths, tough pulls, exhausted staff, and shaky fresh cow performance through the transition period.
Most modern proofs include calving‑ease and stillbirth rates, and many now list gestation length as well. Genetic evaluation organizations like CDCB and Lactanet have been gradually building more of these functional traits into their indexes and tools. They may not be as glamorous as milk or fat numbers, but they matter a lot when you’re planning calving pressure.
What farmers are doing, once they’ve set beef‑versus‑dairy and calf‑health rules, is using calving‑ease and gestation length as the next filter:
In herds with heavy winter or early‑spring calving in the Northeast, Great Lakes, and Upper Midwest, producers keep a short list of easy‑calving, shorter‑gestation bulls for dairy matings that will calve into February and March, when calving barns and fresh pens are under the most stress.
In Western dry lot systems, where summer heat is the big enemy, producers avoid long‑gestation bulls on matings that would calve into the hottest weeks and lean instead on sires with moderate gestation and favorable calving‑ease profiles.
You don’t need a complicated spreadsheet to manage this. Just mark a handful of bulls as “tight‑window sires” based on calving‑ease, gestation length, and acceptable production and health traits, and use them where the calendar and weather suggest you can’t afford added calving problems.
Step 5: Keep Re‑Running the Math as Markets Move
The last step—and this is the one that never really ends—is to keep re‑checking whether your thresholds still make sense as markets and costs move around.
Calf prices rise and fall with the beef cycle. Replacement heifer values swing with inventory, feed costs, and interest rates. Milk prices and component premiums fluctuate with supply, demand, and processor product mix. The herds that keep these breeding strategies working don’t treat them as set‑and‑forget decisions.
In practical terms, that looks like:
Watching local calf prices at sale barns, through order buyers, and with any calf contracts, so you know the current spread between dairy bull calves and dairy‑beef calves.
Tracking replacement heifer prices through USDA Cattle on Feed and Cattle Inventory reports, CoBank and other industry analysis, and local auctions, and comparing those numbers against your estimated cost per raised heifer.
Adjusting your beef‑versus‑dairy cutoff as those numbers shift. When dairy‑beef calves are bringing strong premiums and replacements are expensive, a lot of herds are comfortable breeding only the top 30% of cows and heifers (by genomic merit) to dairy semen; if the spread shrinks or they need more replacements, they might widen that to 40%.
One helpful thing about the new calf‑health traits is that USDA‑AGIL has designed them to slot into the same kind of multi‑trait indexes we already use. Because genetic correlations between calf‑health traits and production or fertility are low, you can improve calf health without sacrificing milk, components, or cow survival, as long as you keep using balanced indexes instead of chasing single traits.
What Year One Really Feels Like on the Farm
On a PowerPoint slide, all of this looks tidy. On your own farm, Year One feels a little different.
At the start, it’s mostly invoices and extra work:
You’re genomic‑testing heifer calves, and the lab bills arrive long before any calves from your new breeding plan hit the ground.
You’re tightening up calf‑health recording with your vet and staff, which means training, more detailed entries, and a few evenings spent cleaning up your database.
You’re adjusting semen orders—more sexed semen on the top families, more beef semen on the bottom end, fewer “just in case” dairy breedings on cows that were never likely to give you high‑value daughters.
In the calf barn, nothing magical happens overnight. Your heifer pens still look full. Calf checks look familiar. It’s easy to wonder if the effort and expense are worth it.
By mid‑year, a few things usually start to shift:
You may find yourself selling or culling more lower‑merit heifers earlier—especially if you’re long on replacements—which frees up feed, bedding, and barn space.
Pregnancies conceived under the new beef‑versus‑dairy rules are in gestation, but only a handful of calves have actually hit the ground.
On paper, your breeding lists and heifer rankings make more sense. In the parlor and calf barn, daily routines feel largely unchanged.
Late in Year One and into Year Two is where most producers say they start to feel real differences:
Beef‑on‑dairy calves begin arriving as a more uniform, intentional group. You see stronger buyer interest, better feedback from feedlots, and often better average prices.
Your heifer pens gradually tilt toward a more consistent, higher‑index group instead of a random mix of stars and passengers. When those heifers freshen, you notice differences in how they come through the transition period and what they do in first‑lactation milk and components.
If you’ve matched genetics with solid colostrum management, good housing and ventilation, and steady fresh cow management, you often see calf treatment rates and pre‑weaning mortality start to trend in the right direction, similar to what regional calf‑health and barn‑fogging projects have reported when calf environments improve.
Producers highlighted in university extension projects tend to say the same thing: these strategies pay, but the payoff shows up over 18–24 months, not two pay periods. So if you’re going to go down this road, it really helps to think in years instead of months.
Looking Ahead: Getting Ready for Calf‑Health Proofs in the US
Looking at where this is heading, timing matters if you want to be ready.
The USDA‑AGIL work in the Journal of Dairy Science has already shown that calf diarrhea and respiratory traits can be evaluated at a national genomic scale, with usable heritabilities and low correlations with other key traits. USDA‑ARS publications and ICAR genetic evaluation reports have laid out the models and confirm that these calf‑health traits are being prepared for inclusion in US national evaluations for Holsteins and Jerseys.
The Council on Dairy Cattle Breeding has indicated, through meetings and industry communications, that the goal is to add calf‑health traits to the US genetic evaluation system in 2026, once data quality, validation, and governance steps are complete. The exact date will depend on final testing, but the intent is clear enough that seedstock suppliers and AI companies are already watching those traits closely.
Meanwhile, Canada is already using calf‑health RBVs in everyday breeding decisions. Lactanet launched the trait in 2025 and is working it into the Lifetime Performance Index (LPI) and other tools, so Canadian producers now see calf‑health expectations right alongside production, fertility, and cow‑health numbers when picking sires.
If you think about how quickly somatic cell score, daughter fertility, and cow‑health traits became “just part of the proof” once they were introduced, it’s reasonable to expect something similar with calf health. Early on, there will probably be bulls that are quietly excellent on calf‑health traits without a big semen price premium for that advantage. Over time, as more herds use those bulls and see calf‑barn results, market demand and pricing will adjust.
The herds that stand to benefit most from the early years of calf‑health proofs are the ones that:
Already genomic‑test most or all of their heifer calves.
Already have a written rule for which cows get dairy semen and which get beef.
Already work from weekly breeding lists and can easily add one more column when calf‑health numbers show up.
A Practical Game Plan for 2025–2026
If you’re thinking, “This all adds up, but what do I actually do next?”, here’s a straightforward plan you can take back to the office or kitchen table.
1. Build your information base.
Genomic‑test your next one or two calf crops so you can see how big the gap really is between your best and worst heifers on your preferred index.
Sit down with your veterinarian and team and define what counts as a reportable scours case and a pneumonia case on your farm, then make sure those cases are consistently recorded in your herd software.
2. Put a simple beef‑versus‑dairy rule on paper.
For example: “Only cows whose most recent heifer ranks in the top 40% genomically get dairy semen; the rest get beef.”
Plan to revisit that 40% threshold once a year based on calf‑price spreads, replacement heifer values, and your own heifer needs.
3. Talk with your AI and genetics partners about calf‑health traits.
Ask when they expect US calf‑health proofs to show up in their catalogs and computerized mating programs.
Identify a short list of bulls that fit your production and cow‑health goals and are also likely to be above average on calf‑health traits once those numbers are official.
4. Build a weekly breeding list.
Include cows eligible to breed, days in milk, parity, last calving date, and the genomic rank or index of their most recent heifer.
Mark each cow as “dairy” or “beef” based on your rule, then assign bulls from a short list that meet your criteria for production, components, fertility, cow health, calf health (once proofs are live), calving ease, and gestation length.
5. Track a few key metrics over the next 24 months.
Calf diarrhea and respiratory treatment rates, ideally by season.
Pre‑weaning mortality.
Age at first calving for heifers bred under the new system.
First‑lactation milk and component yield, and major health events in that first lactation.
Number and average sale price of beef‑on‑dairy calves.
Total heifer inventory and your best estimate of cost per raised heifer.
If you’re tracking those numbers, you’ll be able to tell whether genomics, beef‑on‑dairy, and calf‑health traits are actually changing the economics on your own farm—not just in theory, but in your barn with your markets.
Different Regions, Different On‑Ramps—Same Core Question
It’s worth saying that not every region, or every herd size, is going to use these tools in exactly the same way.
In Wisconsin, Minnesota, and the Upper Midwest, long winters and naturally ventilated barns make respiratory disease a constant battle. Research supported by the Northern New York Agricultural Development Program and Cornell PRO‑DAIRY has shown that improvements in ventilation, barn‑fogging protocols, and calf‑barn layout can significantly reduce respiratory problems, with scours most common early in the rearing period and pneumonia more common later. Producers there are now layering calf‑health genetics on top of these management changes.
In Ontario and Quebec, where Lactanet calf‑health RBVs are already available, and LPI updates have brought more health and functional traits into the mix, many herds are simply adding calf health to breeding programs that already lean heavily on genomics.
In Western dry lot systems, such as those in California and the Southwest, heat and dust are greater challenges than cold. Work comparing confinement, dry‑lot, and pasture‑based heifer systems has shown that dry‑lot and pasture can lower some costs but demand strong management of shade, airflow, and group size. Producers there are combining calf‑health genetics with shade structures, better airflow, and early‑detection technologies for respiratory disease, plus close relationships with beef buyers who value uniform, high‑health dairy‑beef calves.
On smaller family herds in the Northeast or Great Lakes region, the most realistic first step might be to genomic‑test one year’s worth of heifers, use those results to decide which families get sexed dairy semen and which get beef, and then let the AI company’s mating program start incorporating calf‑health traits as they come into US proofs.
Different barns. Different weather. Different processor relationships and quota setups. But underneath all that, the strategic question you’re trying to answer is the same.
The Bottom Line
When you strip the jargon away, here’s where all of this leads.
We now have solid data showing that calf diarrhea and respiratory disease are common, costly, and heritable enough to improve through genetics. The same infrastructure that gave us cow‑health traits in our indexes is being used to bring calf‑health traits into US proofs, with Canada already showing how calf‑health RBVs can fit alongside production, fertility, and cow‑health information on a bull card.
We also have economic work on calf health, heifer rearing, and calf markets, telling us that:
Direct treatment costs per sick calf stack up quickly.
Serious early‑life disease can pull heifers off their full potential in growth, age at first calving, and first‑lactation performance.
Dairy‑beef cross calves can be a bright spot in the check when milk prices soften.
Replacement heifers are expensive enough that raising the wrong ones is a luxury most farms can’t really afford right now.
The tools—genomics, beef‑on‑dairy, calf‑health proofs—are all coming together just as those pressures peak. And you don’t need a PhD to use them. A simple, consistent five‑step approach—test, sort, decide beef vs dairy, add calf health and calving‑ease filters, and keep re‑running the math—will get you most of the way there.
What I’ve noticed, looking at both the research and what’s happening in real barns, is that we’re moving from a world where calf health was “just management” to one where genetics, markets, and management are all pulling in the same direction.
So maybe the real question for 2026 isn’t “Should I genomic‑test?” or “Should I try beef‑on‑dairy?” Those are just tools.
The bigger question—the one that can easily swing tens of thousands of dollars a year on many dairies—is this:
Given your barns, your local markets, your cash‑flow reality, and the calf‑health genetics coming into proofs, which calves do you truly want more of—and which calves are you better off never making in the first place?
If your breeding plan can answer that clearly, and you’re willing to line up your genetics, your fresh cow management, and your calf program behind that answer, then the next few years offer a real chance to tilt the math of your dairy in your favor quietly.
KEY TAKEAWAYS
Calf-health proofs hit US genetics in 2026. USDA data on 680,000+ calves confirms scours and respiratory resistance are heritable—and selectable.
Sick calves drain $27,000/year from a 1,000-cow herd. That’s treatment, slower growth, and daughters that never reach their genetic potential.
The breeding math has changed. Beef-cross calves are topping $1,000. Heifers cost $2,500+ to raise. Replacements just hit a 20-year low. Every straw matters.
Five steps shift the money your way. Genomic-test heifers. Set a hard beef-versus-dairy rule. Screen bulls for calf health. Manage calving pressure. Re-check the economics quarterly.
Act now, bank returns in 18-24 months. Herds implementing this playbook today can realistically add $50,000+ to their bottom line.
Complete references and supporting documentation are available upon request by contacting the editorial team at editor@thebullvine.com.
Every week, thousands of producers, breeders, and industry insiders open Bullvine Weekly for genetics insights, market shifts, and profit strategies they won’t find anywhere else. One email. Five minutes. Smarter decisions all week.
Biology doesn’t negotiate. The heifers you didn’t breed in 2023 can’t freshen in 2026. $4,100 price tags are just the start of this reckoning.
A Wisconsin dairyman running 650 cows near Fond du Lac remembers the exact moment he knew something had shifted. It was September 2025, and he was on the phone with his heifer supplier, trying to secure replacements for his operation. The price quote stopped him cold: $4,100 per head.
“Two years ago, I was paying $1,800,” he shared, asking that his name not be used due to ongoing supplier negotiations. “I actually asked the guy to repeat himself. I thought maybe we had a bad connection.”
They didn’t. What he was hearing was the sound of breeding decisions made across thousands of farms in 2023 and 2024 finally hitting the replacement market. You probably remember how it played out—when dairy farmers embraced beef-on-dairy genetics, chasing $400-800 beef-cross calves instead of $50-150 dairy bull calves, the math looked irresistible. Premium beef semen ran $8-15 per straw versus $25-40 for sexed dairy genetics. The premiums were real and immediate.
What wasn’t immediately visible was the 30-month lag hidden in those breeding choices. And here’s where it gets sobering. According to CoBank’s Knowledge Exchange report – Dairy Heifer Inventories to Shrink Further Before Rebounding in 2027, published this past August by lead dairy economist Corey Geiger and industry analyst Abbi Prins, the U.S. dairy industry faces 438,844 fewer replacement heifers in 2026 compared to 2025. We’re looking at heifer inventories hitting a 20-year low—territory we haven’t seen since the mid-2000s.
“We’re not talking about a temporary blip,” Geiger says. “The heifer deficit is structural. It reflects breeding decisions that were made two to three years ago, and those decisions can’t be unwound quickly.”
The farms that recognized this timeline early are positioning themselves for the decade ahead. Those that didn’t are facing some difficult choices. And the industry emerging on the other side? It’s going to look fundamentally different.
Biology Doesn’t Care About Your Cash Flow
Here’s what makes this situation so challenging—and you know this as well as anyone: the core constraint isn’t financial or managerial. It’s biological. And biology doesn’t negotiate.
A breeding decision made today takes approximately 30 months to produce a milking cow. You’ve got 280 days of gestation, then 22-24 months of heifer development before that animal freshens and enters your milking string. There’s simply no shortcut through that timeline, regardless of what you’re willing to invest.
What this means, practically, is that the heifer shortage hitting farms in 2026-2027 was locked in by breeding decisions made in 2023-2024. Dr. Albert De Vries, professor of dairy management and economics at the University of Florida, has been modeling replacement dynamics for over two decades. His research on optimal replacement decisions, published in the Journal of Dairy Science, consistently shows that herd composition changes operate on multi-year cycles that can’t be compressed.
“Farmers sometimes ask me, ‘What can I do right now to fix my replacement situation?'” De Vries shared. “The honest answer is that your options today are shaped by decisions you made 24-30 months ago. You’re managing consequences, not preventing them.”
It’s a difficult message, but a necessary one.
The practical impact shows up across the board:
Replacement heifer prices have climbed from $1,720 in April 2023 to $3,800-4,200 currently—more than doubling in under 30 months, according to USDA Agricultural Marketing Service livestock reports
A 500-cow dairy requiring 140 annual replacements now faces $532,000-588,000 in heifer costs versus $241,000 two years ago
Custom heifer rearing operations across the Upper Midwest report being fully booked through the remainder of 2026, with limited capacity for new clients
Metric
2023 Reality
2026 Reckoning
Change
Heifer Price (Per Head)
$1,720
$4,100
+138%
Annual Cost (500-Cow Herd, 140 Replacements)
$240,800
$574,000
+$333,200
Breeding Strategy
60-80% Beef-on-Dairy
40-50% Beef-on-Dairy
Recalibration
Beef Calf Premium
$400-800 vs. $50-150 Dairy
$350-700 vs. $40-120 Dairy
Still Positive
Custom Heifer Capacity
Available
Fully Booked Through 2026
Zero Slack
Processor Leverage
Buyer’s Market
Seller’s Market (Q1-Q2 2026 Window)
Historic Shift
Primary Strategy Lever
Maximize Beef Premiums
Extended Lactation / Partnerships
Survival Mode
One custom heifer operator running 400 head outside Lancaster, Pennsylvania, says he’s turned away 11 inquiries in just the past 3 months. “I’ve never seen demand like this,” he shared, asking that his name be withheld due to client confidentiality. “Guys who never called me before are suddenly very interested in long-term contracts. But I’m full. Everyone’s full.”
For operations that went heavily into beef breeding—we’re talking 60-80% of eligible matings, which wasn’t uncommon—the math creates a genuinely challenging scenario. Those heifers that should be entering the milking herd in 2026-2027? They were never conceived in the first place.
The North American Picture
It’s worth noting that this isn’t purely a U.S. phenomenon, though the dynamics differ by market structure. Canadian producers operating under supply management face a different calculus—quota values exceeding $40,000 per kg in many provinces mean heifer prices have always commanded premiums, but the beef-on-dairy trend has been more muted north of the border. The quota system creates built-in incentives to maintain replacement pipelines that open-market systems don’t.
In New Zealand and parts of the EU, seasonal calving patterns and grass-based systems create their own constraints on replacement. But the U.S. situation is unique in scale and severity—the combination of high beef-cross adoption rates and massive processing expansion has created a perfect storm that other markets haven’t experienced to the same degree.
What’s worth watching: The EU’s Green Deal and Farm to Fork Strategy—targeting a 30% reduction in agricultural emissions and 25% organic farmland by 2030—is adding regulatory pressure that’s expected to shrink EU dairy herds further in coming years. EU milk production already declined 0.2% in 2025 to 149.4 million metric tons, with environmental compliance costs straining smaller producers. According to UW-Madison Extension analysis , many EU dairy farmers are concerned these sustainability mandates will hurt their competitiveness in global markets. For U.S. exporters, this creates a potential opening—if domestic supply can keep pace with new processing capacity. The heifer shortage complicates that equation considerably.
Survival of the Smartest: Why Your 2023 Strategy Is Your 2026 Crisis
What’s encouraging is that rather than treating this as an insurmountable crisis, many progressive operations are discovering that the heifer shortage actually creates opportunities—if you adapt quickly enough. The key lies in understanding which strategies work within biological constraints and which ones amount to wishful thinking.
Extended Lactation: The Fastest Lever You Can Pull
Extended lactation protocols—keeping cows milking 14-18 months instead of the traditional 12-month cycle—offer the quickest path to reducing replacement pressure. This isn’t a new concept, as many of us know, but it’s getting a serious second look given current heifer economics.
Research from the University of Wisconsin-Madison’s Dairy Science Department, led by Dr. Kent Weigel, shows that well-managed extended lactations can reduce replacement needs by 15-25% without sacrificing lifetime production. The key word there is “well-managed.” This isn’t about keeping every cow milking longer—it’s about identifying the right candidates.
Here’s how the economics generally work:
A cow producing 85 pounds daily at month 12 typically drops to 68-72 pounds by month 16. That’s a real decline in daily output, no question. But here’s what the daily production numbers miss: that cow isn’t generating replacement costs, breeding expenses, dry-period feed costs, or fresh cow health risks during transition. When you factor in the full cost of bringing a replacement into the herd—currently running $4,000+ just for the heifer purchase, plus another $800-1,200 in transition period costs—the extended lactation cow often comes out ahead on a total cost basis.
One central Wisconsin producer milking 850 Holsteins started implementing extended lactation protocols in early 2025. “We’re keeping about 130 cows on 16-month cycles now,” she explained, requesting anonymity to avoid drawing competitor attention to her cost structure. “My replacement purchases dropped from 240 last year to around 185 this year. At current prices, that’s real money—probably $220,000 in savings.”
The candidates that work best for extended lactation, based on research and field experience:
Persistency ratings above 105 RBV (these cows maintain production better through late lactation)
Somatic cell counts consistently below 200,000, because udder health has to be solid for this to work
No chronic lameness or recurring health issues
Body condition scores holding at 2.75-3.25 through mid-lactation
Now, here’s an important caveat that doesn’t always make it into the enthusiastic discussions of extended lactation. Dr. Paul Fricke, professor and extension specialist in dairy cattle reproduction at UW-Madison, notes: “There are real considerations around subsequent fertility and metabolic health. Cows that go significantly longer between calvings can have more difficulty conceiving on subsequent cycles. This works best as a selective strategy, not a blanket policy.”
That’s worth emphasizing. Extended lactation isn’t about keeping your whole herd milking longer. It’s about identifying the 25-35% of your cows that are genuinely good candidates and managing them differently. Your veterinarian can help develop monitoring protocols specific to your operation.
Tiered Breeding: Stop Mining Your Own Future
The operations handling this best are implementing what you might call tiered breeding—a systematic approach that captures beef premiums where it makes sense while ensuring adequate replacement supply.
Here’s where genomic testing has become genuinely transformative. Instead of relying on parent average or waiting for first-lactation data, farms using genomic evaluations can stratify their heifer calves at 2-3 months of age with 70%+ reliability on key traits. That precision matters when you’re deciding which animals get the $40 sexed dairy straw versus the $12 beef straw. The cost of genomic testing—typically $35-50 per head—pays for itself many times over when it prevents you from putting beef genetics on a heifer that should have been a herd-building dam.
Here’s how a typical protocol structures breeding decisions based on genetic merit:
Herd Segment
% of Herd
Genetic Merit
Breeding Strategy
Cost Per Straw
Strategic Purpose
Top Tier
35-40%
Top 1/3 Net Merit or TPI
Sexed Dairy Semen (Elite Sires)
$35-45
Herd builders – next generation genetic improvement
Middle Tier
30-35%
Average genetics
Conventional Dairy Semen (Solid Sires)
$15-25
Replacement pipeline – maintain herd numbers
Bottom Tier
25-30%
Lowest 1/3 production/health
Beef Semen
$8-15
Terminal value – cull candidates
Extended Lactation Candidates
10-15%
High persistency (>105 RBV), excellent health
Skip Breeding / Delay 4-6 months
$0 initial
Reduce replacement pressure short-term
Top 35-40% of herd (highest genetic merit): These are your herd builders. Breed them to elite dairy sires using sexed semen. Yes, it costs more per straw—$35-45 versus $8-15 for conventional beef. But these matings produce your next generation of genetic improvement. They’re investments, not costs. If you’re using genomic testing, these are your animals with Net Merit or TPI in the top third of your herd.
Middle 30-35% (average genetics): Breed to conventional dairy sires—no sexing premium, solid genetics, predictable outcomes. These animals maintain your replacement numbers without straining the budget.
Bottom 25-30% (lowest merit): This is where beef genetics make sense. These animals should be transitioning out of your herd anyway based on their production and health profiles. Breeding them to beef sires maximizes their terminal value without compromising your replacement pipeline.
Many progressive operations have recalibrated their breeding mix after going heavy on beef genetics in 2023. The pattern emerging across Wisconsin and the Upper Midwest: farms that had 70% or more of matings going to beef are now pulling back to 40-50%, being much more deliberate about which cows get which service.
The key insight these producers have landed on: not every cow should leave genetic offspring in your herd—but enough of them have to, or you’re mining your own future.
The Processor Partnership Window: Leverage You Won’t See Again
Now, here’s where things get genuinely interesting from a market-dynamics standpoint. Perhaps the most significant—and honestly, underreported—development of late 2025 is the shift in negotiating leverage between farms and processors.
There’s roughly $11 billion in new dairy processing capacity coming online between 2025 and early 2028, according to IDFA data released this past October. These are major investments: Hilmar’s Texas expansion, Leprino’s new Texas facility, Glanbia’s recent Michigan expansion, plus a string of regional cheese and specialty product facilities across the Upper Midwest and Southwest.
Here’s the challenge these processors are facing: plants designed for 85-90% utilization are running at 60-70% because the milk supply growth they projected isn’t materializing. When you breed 60-70% of your herd to beef for two years, you don’t have the replacement heifers to expand production. The connection seems obvious in hindsight, but it caught many in the processing sector off guard.
“We planned capacity based on historical supply growth trends,” one Midwest cooperative procurement manager shared, speaking on background due to ongoing contract negotiations. “Nobody modeled what happens when a significant portion of the national herd stops producing dairy replacements for two years. We’re adjusting our assumptions now, but the capacity is already built.”
This creates what some industry observers are calling a “leverage window”—a period where farms with growth capacity can negotiate terms that would have been unthinkable three years ago.
What some processors are offering qualified operations:
Heifer financing at 4-6% interest, compared to 7-9% from traditional agricultural lenders
Equipment subsidies covering 40-60% of robotic milking system costs in exchange for supply commitments
Forward-locked milk pricing 12-36 months out, often $0.80-1.20/cwt above the current spot market
Volume premiums for farms that can commit to production growth trajectories
I’ve spoken with several farm operators in Wisconsin and Idaho who’ve signed or are negotiating agreements along these lines, though all requested anonymity given the competitive sensitivity. The common thread: processors are willing to put capital at risk to secure future milk supply because they’re genuinely concerned about where future growth will come from.
“They need us more than they’re used to needing us,” is how one central Wisconsin dairyman put it. “It’s a strange feeling after years of being told to take whatever price they offered.”
The qualification requirements typically include:
500+ cows are currently milking
Component levels approaching 3.2% protein (this aligns with December 2025 FMMO pricing changes that increase protein’s value)
Debt-to-equity ratios below 50%
Willingness to sign 5-7 year exclusive supply agreements
Demonstrated ability to grow production 10-20% over the contract period
For farms meeting these criteria, the partnerships can genuinely reshape their economics. For those who don’t qualify for processor financing, traditional options remain available—FSA guaranteed loans, state dairy assistance programs, and Farm Credit services are all seeing increased demand as farmers look for ways to finance heifer purchases and facility upgrades during this tight market.
But these windows don’t stay open forever. As processor capacity fills and supply concerns ease, the negotiating dynamics will shift back toward buyers.
The realistic window, based on conversations with dairy economists and processor representatives? Probably through Q1 or Q2 of 2026. Maybe a bit longer in regions with less processing competition. But farms considering this path shouldn’t assume the current leverage environment persists indefinitely.
The Exit Ramp: When Walking Away Is the Smartest Play
Processor partnerships aren’t available everywhere, and they’re not the right fit for every operation. For some farms, the current market offers a different kind of opportunity—one that involves making a clear-eyed decision about the future rather than doubling down on growth.
This is the part that’s hardest to write, honestly, but it would be dishonest to leave it out. For farms facing multiple stressors simultaneously, a strategic exit during the current cattle price peak may preserve more family wealth than continued operation.
I want to be clear about framing here: this isn’t a failure narrative. Cattle markets operate in cycles, as we’ve all seen over the years, and the current cycle offers historically favorable exit conditions. Making a clear-eyed decision to capture that value isn’t giving up—it’s recognizing market realities.
Consider the current market context:
Finished beef-on-dairy steers are bringing $200-255/cwt according to USDA Agricultural Marketing Service reports—near all-time highs
Beef-on-dairy slaughter cattle are averaging $2,485/head, outperforming native beef by roughly $100/head
U.S. cattle inventory sits at a 73-year low—the smallest since 1951 according to USDA data—supporting continued strong pricing through at least 2026-2027 per CattleFax projections
What farm transition data suggests—compiled by agricultural lenders, extension economists, and farm management associations—is that the timing difference between strategic exit and forced liquidation can be substantial. Operations that make planned exits in months 8-10 during financial stress typically preserve $300,000-500,000 more in family equity than those forced into distressed sales in months 16-18.
That gap represents college funds, retirement security, or capital to start something new. It’s not trivial.
Indicators that suggest seriously evaluating strategic exit:
Cash flow negative for 3+ consecutive months with no clear path to reversal
Debt-to-equity ratio above 50% and still climbing
No processor contract and fully exposed to spot market volatility
Replacement heifer costs are consuming more than 25% of milk revenue
Primary operator is 55-65 with no clear succession plan
Can’t access capital for necessary modernization
For families recognizing themselves in that list, the current window—Q4 2025 through Q2 2026—offers optimal timing. Cattle prices remain elevated, equipment values haven’t yet been depressed by consolidation-driven sales volume, and agricultural real estate markets in dairy regions remain relatively stable.
One southern Minnesota couple in their early 60s exited their 380-cow dairy this past August after running the numbers on replacement costs. “Our kids aren’t interested in the operation, and the heifer prices were the final straw,” the husband shared, asking that names be withheld to protect family privacy. “Once we did the math on replacing 110 heifers a year at $4,000-plus each, versus what we could get for the herd and equipment right now, the decision got a lot clearer.”
They netted roughly $1.4 million after debt payoff. “Ask me if I’m sad about it? Sure, some days. Ask me if it was the right call? Absolutely.”
A note on taxes: Livestock sale proceeds are taxable income—something that catches some exiting producers off guard. This family worked with an agricultural accountant to structure their sale across two tax years and take advantage of capital gains treatment where applicable. If you’re considering an exit, consult with a tax professional familiar with farm transitions before finalizing timing. The difference between a well-structured exit and an unplanned one can be substantial.
Two Models Will Dominate—Where Does Your Operation Fit?
Looking beyond the immediate heifer crunch, what we’re really watching is a structural transformation that will reshape dairy farming for the next generation. The numbers in various USDA and academic projections tell a consistent story: we’re likely moving from approximately 22,000 dairy farms today to 14,500-17,000 by 2028-2029, while total milk production increases modestly.
That’s not just “fewer farms.” It’s a fundamental restructuring around two viable models, with a shrinking middle ground between them.
Model 1: The Integrated Mega-Dairy
Operations of 1,500+ cows with exclusive processor partnerships, advanced automation, and increasingly vertical supply chains. According to the USDA’s “Consolidation in U.S. Dairy Farming” report, these farms are projected to produce 55-60% of U.S. milk from just 4-5% of total operations by decade’s end.
Large integrated operations, such as Milk Source in Wisconsin, illustrate this model at scale. Co-founded in 1994 by Jim Ostrom, John Vosters, and Todd Willer—all UW-Madison graduates from multi-generational Wisconsin farm families—the operation traces its roots to 1965, when John’s parents started a small 30-cow dairy in Freedom. Today, Milk Source operates multiple facilities across Wisconsin and the Midwest, running their own feed mills, calf ranches, and cropping operations, achieving per-unit costs 15-20% below industry average through vertical integration. That’s the competitive advantage mega-dairies are building: not just size, but system control.
Model 2: The Specialty/Niche Producer
Operations of 100-500 cows focused on organic, grass-fed, A2, or direct-to-consumer markets. These farms capture significant price premiums—often 30-60% above conventional—that offset their smaller scale. Organic Valley, for instance, reports steady demand growth for its farmer-members’ milk, with farmgate prices well above those in conventional markets.
Jon Bansen operates Double J Jerseys, a grass-fed, organic dairy with approximately 150-200 cows near Monmouth, Oregon, that sells through the Organic Valley cooperative. A multi-generational dairy farmer, Bansen has built his operation around intensive rotational grazing and 100% grass-fed practices—even when it means leaving some acres unproductive for conservation. What’s encouraging about operations like Double J Jerseys is that grass-fed premiums and cooperative membership provide price stability that helps absorb cost increases, which might challenge conventional operations of their size.
What’s getting squeezed: The traditional mid-size commodity dairy—500-1,000 cows producing undifferentiated milk for spot markets without processor partnerships or specialty premiums. This segment faces pressure from both directions: too small for mega-dairy efficiencies, too large for niche positioning.
Volume efficiency: $0.40-0.80/cwt below market, profit on scale
Premium pricing: 30-60% above conventional
Spot market exposure: full volatility
Competitive Advantage
Per-unit costs 15-20% below average via automation and vertical supply chains
Differentiation premiums and brand loyalty
None sustainable
Capital Requirements
$15-40 million (barriers to entry)
$500K-3 million (differentiation investment)
$3-8 million (too big for niche, too small for efficiency)
Risk Profile
Contract stability, but massive debt service
Market volatility, but loyal customer base
Maximum exposure: no contracts, no premiums
Examples
Milk Source (WI), Riverview Dairy (SD)
Double J Jerseys (OR), Organic Valley members
Most 500-1,000 cow operations without processor partnerships
2028 Projection
55-60% of U.S. milk from 4-5% of farms
8-12% of U.S. milk from 15-20% of farms
Declining share, consolidation pressure
Dr. Mark Stephenson tracked these structural shifts throughout his career as Director of Dairy Policy Analysis at UW-Madison. “The middle hasn’t been comfortable for a while,” he notes. “What the heifer shortage is doing is accelerating a consolidation that was already underway. It’s compressing a 10-15 year transition into maybe 5-7 years.”
Regional Realities: One Size Doesn’t Fit All
The geographic impact isn’t uniform, and it’s worth factoring regional dynamics into your planning.
Upper Midwest (Wisconsin, Minnesota): High processor density creates more partnership options, but also more competition for those deals. Wisconsin’s strong cheese industry values high-component milk, which advantages operations that can hit 3.2%+ protein targets. The state may see farm numbers decline 35-40%, but surviving operations will likely have strong processor relationships.
Northeast (New York, Pennsylvania, Vermont): More fragmented processor landscape with significant organic and specialty opportunity. The decline in fluid milk continues to pressure conventional operations, but proximity to population centers supports direct-market strategies. Farms close to urban markets may find the niche model more viable here than elsewhere.
West/Southwest (California, Idaho, Texas, New Mexico): Where mega-dairy expansion is concentrated. Lower regulatory burden, available land, and new processing capacity are pulling production westward. Texas has seen particularly significant dairy expansion in recent years, according to USDA NASS data, with growth concentrated almost entirely in operations with 2,000 or more head.
Pacific Northwest (Washington, Oregon): Mixed picture—strong organic demand through Tillamook and similar cooperatives, but conventional operations face the same squeeze as elsewhere. Water availability is increasingly a factor in expansion decisions.
What This Means for Your Operation
I want to be careful about projecting too much certainty here. Markets are complicated, and anyone who claims to know exactly what heifer prices will be in 2027 is guessing. That said, there are patterns worth watching and principles that seem reasonably sound.
What seems fairly certain:
The heifer shortage is structural, not cyclical. It reflects breeding decisions already made and can’t be reversed quickly.
Replacement costs will remain elevated through at least 2027, with CoBank projecting meaningful recovery only in late 2027 or 2028.
The farms that position themselves now—whether for growth, for niche markets, or for strategic exit—will have more options than those who wait.
What’s less certain:
Exactly how high will heifer prices go. The $4,000-$4,500 range seems likely, but market dynamics could push it higher.
How long does the processor-leverage window stay open? Current estimates suggest Q1-Q2 2026, but this depends on how quickly supply concerns ease.
Whether export markets absorb the new processing capacity. Trade policy, currency movements, and global demand all factor in.
If You’re Planning to Continue and Grow
Take a serious look at processor partnership opportunities now, while the leverage window remains open. This may be your best chance in a decade to negotiate favorable terms. Think about extended lactation protocols for the right candidates—that 25-35% of your herd with strong persistency, good udder health, and solid body condition. Work with your veterinarian to develop monitoring protocols that fit your operation.
Restructure your breeding program so that at least 50-60% of matings produce dairy replacements. The beef premiums are real, but so is the replacement pipeline you’re building. And budget conservatively—plan for replacement heifer costs of $4,000-5,000 through 2027. Hope for lower, but don’t count on it.
If you’re not already genomic testing your heifer calves, now’s the time to start. The $40-50 investment per head pays for itself when you’re making $4,000 breeding decisions. Knowing which animals have the genetic merit to justify elite dairy genetics versus which should get beef semen isn’t guesswork anymore—it’s data.
If processor financing isn’t available in your area, explore FSA guaranteed loans and state dairy assistance programs. Demand is up, but funds remain available for qualified operations.
If You’re Uncertain About the Future
Start with an honest financial assessment. Debt-to-equity ratio, debt service coverage, cash flow trends, and family situation. These numbers tell you something. Understand that a strategic exit in 2025-2026, at peak cattle valuations, preserves substantially more equity than a forced exit in 2027-2028 when prices may be lower, and more farms are competing for buyers.
Talk to agricultural attorneys and accountants about transition planning. Good advice costs money; poor advice costs more. And consider partial strategies if full continuation isn’t viable—retaining real estate while liquidating livestock and equipment can provide ongoing income while preserving land wealth.
Don’t overlook risk management tools: The Dairy Margin Coverage (DMC) program , extended through 2031 under the recent budget legislation, offers coverage levels from $4.00 to $9.50 per cwt—and Tier 1 coverage has been increased to 6 million pounds of milk. Producers enrolling for multiple years through 2031 can lock in a 25% premium discount. For operations navigating uncertain margins, DMC provides a floor that can help with cash flow planning. LGM-Dairy insurance offers another option, protecting against both feed cost spikes and milk price drops on a rolling 11-month basis. Neither program solves the heifer shortage, but both can help stabilize income while you work through the transition.
For Everyone
Accept that the industry structure of 2028 will look different from today. Not worse, necessarily—but different. Planning for that difference beats hoping it doesn’t happen.
The 30-month biological constraint isn’t going away. Every quarter you wait to adjust breeding protocols is another quarter before those decisions produce results. The farms that feel most confident about their position are those that began adjusting 12-18 months ago. They’re not immune to the heifer shortage, but they’re managing it rather than being managed by it.
The Beef on Dairy Boom that Changed the Game
The beef-on-dairy boom of 2023-2024 revealed something important about dairy economics: optimizing for today can create constraints tomorrow. That’s not a criticism of the farmers who made those breeding decisions—the premiums were real, and the cash flow mattered. But it’s a reminder that agricultural systems operate on biological timelines that don’t align neatly with market cycles.
The farms discovering that lesson now still have time to adapt. The 30-month clock that started with those breeding decisions keeps running. What happens next depends on decisions being made right now.
As that Wisconsin dairyman still processing the $4,100 heifer quote put it: “I can’t go back and change what I bred in 2023. But I can sure change what I’m doing today. That’s gotta count for something.”
It does. The question is whether enough farms figure that out while they still have choices to make.
The Bullvine Bottom Line
If you’re waiting for heifer prices to drop before you change your breeding mix, you’ve already lost. The 438,844-heifer deficit hitting in 2026 was locked in by decisions made in 2023, and the clock started ticking the moment those beef straws went in. Biology doesn’t care about your cash flow projections. The only question left: Are you breeding for 2024’s market or 2028’s reality?
Key Takeaways
438,844 Missing Heifers: The 2026 shortage was locked in by 2023 breeding decisions. Biology’s 30-month timeline means there’s no quick fix—only adaptation.
Replacement Costs Doubled: Heifers jumped from $1,720 to $4,100+. For a 500-cow dairy, that’s $300,000+ more per year in replacement costs alone.
The Leverage Window Closes Q2 2026: Processor partnerships, heifer financing at 4-6%, and forward pricing are available NOW. This window won’t reopen once capacity fills.
Restructure Your Breeding Mix: Target 50-60% dairy matings minimum. Extended lactation protocols on your top 25-35% of cows can reduce replacement needs by 15-25%.
Strategic Exit Beats Forced Liquidation: For operations under financial stress, exiting at peak cattle prices ($200-255/cwt for beef-on-dairy steers) preserves $300K-500K more in family equity.
Executive Summary:
U.S. dairy is staring down a 438,844-heifer deficit in 2026—the unavoidable consequence of 2023’s beef-on-dairy breeding boom. Replacement prices have more than doubled, from $1,720 to over $4,100 per head, adding $300,000+ in annual replacement costs for a typical 500-cow operation. Biology’s 30-month timeline means there’s no quick fix; the heifers that weren’t bred can’t be milked. The farms adapting fastest are implementing extended lactation protocols, restructuring breeding programs to ensure 50-60% dairy matings, and locking in processor partnerships while the leverage window remains open through Q1-Q2 2026. For operations facing compounding stress, current cattle prices—with finished beef-on-dairy steers at $200-255/cwt—offer strategic exit conditions that preserve $300,000-500,000 more in family equity than forced liquidation later. The industry is accelerating toward two dominant models: integrated mega-dairies and specialty niche producers. Mid-size commodity operations without contracts or differentiation are getting squeezed from both directions—and what you decide in the next 6-12 months will determine which side of this reckoning you land on.
About the Data in This Article
Heifer inventory projections and pricing trends cited in this analysis come from CoBank’s August 2025 Knowledge Exchange report by Corey Geiger and Abbi Prins, USDA Agricultural Marketing Service livestock reports, and USDA NASS cattle inventory data. Replacement cost calculations assume 140 annual replacements for a 500-cow dairy (28% replacement rate) at current market pricing of $3,800-4,200 per head. Regional costs and individual farm economics vary significantly based on location, management practices, existing heifer inventory, and market access. Some farmer sources requested anonymity due to ongoing business negotiations or family privacy considerations. We welcome producer feedback and case studies for future reporting—contact editor@thebullvine.com.
Every week, thousands of producers, breeders, and industry insiders open Bullvine Weekly for genetics insights, market shifts, and profit strategies they won’t find anywhere else. One email. Five minutes. Smarter decisions all week.
Record butterfat. Shrinking checks. The industry’s 25-year breeding strategy just ate itself.
Executive Summary: Here’s the paradox: U.S. dairy herds are testing 4.23% butterfat—an all-time record—yet milk checks are running $3-5/cwt below last year. The genetic industry’s 25-year push for components worked perfectly, and now everyone’s drowning in the success. Butter stocks are up 14%, Class IV prices hit $13.89/cwt in November (lowest since 2020), and the traditional cull-and-restock response is off the table with springers at $3,000+ and heifer inventory at a 47-year low. For operations in the 500-1,500 cow range carrying moderate debt, the next 90 days are decisive—DMC enrollment closes in February, DRP in March, and the choices made before spring will separate farms that reposition from those that get squeezed. Three viable paths exist: optimize for efficiency, transition to premium markets, or exit strategically while equity remains. Standing still isn’t on the list.
I’ve been talking with farmers across the Midwest and Northeast over the past few weeks, and there’s a common thread running through those conversations. A producer will mention their herd’s butterfat at 4.3%—exactly what they spent a decade breeding for—and then pause. Because that same milk is now flowing into a market where the cream premiums just don’t look like they used to.
It’s a strange place to be. You made sound breeding decisions. The genetics are performing. The components are there. And yet the check doesn’t quite reflect it.
So what’s actually going on here? And more importantly, what can we realistically do about it in the next 90 days?
[Image: Side-by-side comparison of a milk check from 2023 vs. 2025 showing component premiums shrinking despite higher butterfat test]
After reviewing the latest market data and speaking with lender advisors, farm management consultants, and producers who’ve been through similar cycles, a clearer picture emerges. This isn’t simply a temporary dip that’ll correct by spring flush. It’s a structural shift that’s been building for years—and the farms that come through it successfully will be those that understand both what’s driving it and which decisions actually move the needle.
The Component Trap: How 25 Years of Smart Breeding Created Today’s Problem
Here’s something that needs to be said plainly, even if it’s uncomfortable: the genetic industry—breeders, AI companies, genomic providers—collectively steered the entire U.S. dairy herd in one direction, and now we’re all standing here wondering what comes next.
That’s not an accusation. Everyone was following the economic signals. But the result is undeniable.
You probably know the broad outlines already, but it’s worth walking through the numbers because they’re pretty striking when you see them together. None of this happened by accident. It’s the result of pricing signals that consistently rewarded butterfat production across two and a half decades.
Consider the trajectory. The average Holstein was testing around 3.7-3.8% butterfat back in 2000, according to Council on Dairy Cattle Breeding historical data. By 2024, that figure had climbed to a record 4.23%—a substantial jump in component concentration. CoBank’s lead dairy economist, Corey Geiger, noted in his analysis last year that milkfat, on both a percentage and per-pound basis, reached an all-time high. In high-genetics herds, 4.3-4.5% is now pretty common.
U.S. Holstein herds have steadily climbed from roughly 3.7% to over 4.2% butterfat in just two and a half decades
This wasn’t a failure of individual breeding decisions. It was a success—of everyone doing the exact same thing at the exact same time.
[Image: Line graph showing U.S. average butterfat percentage climbing from 3.7% in 2000 to 4.23% in 2024]
Federal Milk Marketing Order formulas rewarded butterfat with premium pricing, and the industry responded accordingly. Then, genomic selection tools, which really gained traction around 2009, accelerated genetic progress dramatically. What once took 15-20 years of conventional breeding can now be achieved in roughly half that time. The April 2025 CDCB genetic base reset tells the story—it rolled back butterfat by 45 pounds for Holsteins, nearly double any previous adjustment. That’s how much progress has accumulated in the genetic pipeline.
The economics seemed compelling at the time. A farm producing 4.2% butterfat milk versus 3.8% butterfat earned roughly $0.80-1.20/cwt more on the same volume, based on component pricing formulas. For a 1,000-cow herd producing 25,000 lbs/cow annually, that translated to $200,000-300,000 in additional annual revenue. The incentives pointed clearly in one direction.
And here’s where it gets tricky.
When an entire industry simultaneously optimizes for the same trait, supply eventually outpaces demand. U.S. butter production has grown substantially over the past decade, according to USDA Agricultural Marketing Service data. Cold storage butter inventories showed elevated stocks throughout late 2024, with USDA Cold Storage data reporting September levels at approximately 303 million pounds—up about 14% from year-earlier figures.
Class IV milk futures, which price butter and powder, have reflected this pressure. USDA announced the November 2025 Class IV price at $13.89/cwt—levels we haven’t seen since 2020.
The question nobody in the genetic industry is asking publicly: Should we have seen this coming? And what does it mean for how we select sires going forward?
The Heifer Crisis: Why Your Normal Playbook Won’t Work This Time
What makes this particular cycle tricky is that some of the standard farm-level responses to low prices just aren’t available anymore. I’ve watched this play out in conversations with producers who are working through every option—and finding that familiar levers don’t pull the way they expect.
[Image: Infographic showing dairy heifer inventory decline from 4.5 million in 2018 to 3.914 million in 2025]
The Numbers That Should Keep You Up at Night
The logical response to component oversupply would be culling toward different genetics and restocking. But there’s a significant constraint worth understanding.
Replacement heifers simply aren’t available in the numbers many operations need—and the available ones have gotten expensive. The widespread adoption of beef-on-dairy breeding, which made excellent economic sense when beef prices surged, has reduced dairy heifer inventories to approximately 3.914 million head according to the January 2025 USDA cattle inventory report. That’s the lowest level since 1978.
Replacement heifer numbers have dropped by roughly 600,000 head since 2018, driving springer prices above $3,000
Here’s where the math gets painful. CoBank reported these figures in their August 2025 analysis:
National average springer price (July 2025): $3,010 per head
Wisconsin average: $3,290 per head
California/Minnesota top auction prices: $4,000+ per head
April 2019 low point: $1,140 per head
Price increase since then: 164%
Let that sink in. If you want to cull your bottom 50 cows and replace them, you’re looking at $150,000-$225,000 just in replacement costs—before you account for the production lag while those heifers freshen and ramp up.
This creates real tension. Operations that would like to cull more aggressively face either limited availability or elevated replacement costs. It’s a completely different calculation than we’ve seen in past downturns.
There’s also a timing consideration that’s easy to overlook. The replacement heifers entering milking strings in 2025-2026 were born and selected 2-3 years ago, when butterfat premiums were still paying handsomely. That genetic pipeline takes time to shift—meaningful changes in herd composition typically require 5-7 years, even with aggressive selection, according to dairy geneticists at the University of Wisconsin-Madison Extension.
The practical takeaway: Even if you start selecting differently today, you won’t see the results in your tank until 2030.
The Ration Workaround That Doesn’t Actually Work
Some producers have explored nutritional adjustments to modify butterfat percentage. I’ve heard this come up in several conversations, and it’s worth addressing directly.
Here’s the challenge—the rumen chemistry driving fat synthesis is interconnected with overall milk production in ways that make targeted adjustments difficult. Dairy nutritionists at Penn State and other land-grant universities have studied this extensively: adjustments that reduce butterfat typically also reduce total milk yield by 3-8%. The feed cost savings, maybe $0.30-0.50/cow/day depending on your ration costs, are often outweighed by lost milk revenue of $1.00-2.00/cow/day at current prices.
In most scenarios, ration manipulation doesn’t improve the overall financial picture. Counterintuitive, but the numbers generally bear it out.
The China Factor: The Export Valve That Closed
One element that’s amplified the current situation—and this deserves more attention in domestic discussions—is the shift in Chinese dairy import patterns.
[Image: Bar chart comparing China whole milk powder imports: approximately 800,000-850,000 MT peak around 2021 vs. approximately 430,000 MT in 2024]
For roughly two decades, China served as a significant outlet for global dairy surplus. When exporting regions overproduced, Chinese buyers absorbed much of the excess. That dynamic has evolved considerably.
China’s domestic milk production has grown substantially over the past several years, reaching over 41 million tonnesaccording to USDA Foreign Agricultural Service data. Self-sufficiency has risen from roughly 70% to around 85%, thereby reducing import demand.
The import trends tell the story clearly. Whole milk powder imports peaked at approximately 800,000-850,000 metric tonnes around 2021, according to Chinese customs data compiled by Rabobank. By 2024, that figure had declined to around 430,000 metric tonnes—a reduction of roughly 50%.
China’s demand for imported whole milk powder has fallen by roughly 50% since its 2021 peak, closing a major export outlet
Here’s what that means at the farm level: when 400,000 metric tonnes of powder that used to go to Shanghai starts competing for space in domestic and alternative export markets, that’s pressure that eventually shows up in your component check. Global dairy markets are interconnected in ways that weren’t true 20 years ago.
Rabobank senior dairy analyst Michael Harvey noted in their Q4 2024 Global Dairy Quarterly that Chinese imports could surprise to the upside if domestic production disappoints and consumer confidence improves. That’s a reasonable alternative scenario to consider.
Honestly? Nobody knows exactly where China goes from here. But planning as if that export outlet will suddenly reopen at 2021 levels seems optimistic at this point.
The Consolidation Accelerator
Dairy farming has been consolidating for decades—that’s well understood by anyone who’s watched their neighbor’s barn go quiet. What’s different about this period is the potential for that trend to accelerate under sustained margin pressure.
According to U.S. Courts data reported by Farm Policy News, 361 Chapter 12 farm bankruptcy filings occurred in the first half of 2025—a 13% increase over the same period last year.
Here’s an important nuance, though: milk production isn’t expected to decline in proportion to the number of farms. The operations most likely to exit tend to be smaller ones that represent a modest share of total volume. USDA projects national milk output at 231.3 billion pounds in 2026—essentially flat—even as the number of operations continues to decrease.
What this means for price recovery: Supply adjustments through consolidation happen more gradually than we might hope.
Three Directions for the Coming Months
For farmers operating in that 500-1,500 cow range—moderate scale, moderate debt, positioned to continue but facing real pressure—the next 90 days present some important decisions.
What’s been striking in conversations with experienced advisors is how consistently they point to the same priorities. The focus isn’t on finding some novel solution. It’s about executing fundamentals with careful attention during a demanding period.
[Image: Calendar graphic highlighting key deadlines: February 2026 (DMC), March 15 (DRP), March 31 (SARE grants)]
Key Dates Worth Tracking
December 31, 2025: Target for completing financial position analysis
February 2026: DMC enrollment deadline (confirm with your FSA office)
March 15, 2026: DRP enrollment deadline for Q2 coverage
March 31, 2026: SARE grant application deadline for organic transition support
Q2 2026: Period when margin pressure may be most pronounced
Priority 1: Knowing Exactly Where You Stand (Weeks 1-2)
Here’s what farm management consultants consistently emphasize: many operations lack precise clarity about their actual cost of production by component. They know their budgeted figures, but actual costs in the current environment often run $2-4/cwt higher than estimates suggest.
Consider a professional cost analysis through your lender or an independent agricultural accountant. Costs typically run $1,500-3,000, depending on scope and region—but the analysis frequently reveals $50,000-100,000 in costs that weren’t clearly showing up in standard bookkeeping. Your actual investment depends on your operation’s complexity.
Model three price scenarios for 2026:
Scenario
Class III
Class IV
Base Case
$17/cwt
$14/cwt
Stressed
$15/cwt
$12/cwt
Severe
$13/cwt
—
The key benchmark: if your debt service coverage ratio falls below 1.25x in the base case, you’re facing primarily a financing challenge rather than a production management challenge. That distinction shapes everything that follows.
Priority 2: Securing Protection Before Deadlines (Weeks 2-3)
DMC triggered payouts in August-September 2025 when milk margins compressed below coverage thresholds, according to USDA Farm Service Agency payment data. For operations that had enrolled, those payments provided meaningful cash flow support. For those that hadn’t… well, that opportunity has passed.
For a 700-cow operation, margin protection typically costs $35,000-40,000 in premiums based on standard coverage levels—though actual costs vary by operation size and coverage choices. What matters is the asymmetric protection: coverage that could preserve $200,000-300,000 in margin under severe scenarios.
[Related: Understanding DMC Enrollment for 2026 — A step-by-step walkthrough of coverage options and deadlines]
Priority 3: Choosing a Direction (Weeks 3-4)
Efficiency Focus
Premium Markets
Strategic Transition
Best suited for
Sub-$15/cwt cost structure, solid cash position
Within 50 miles of metro market, $300K+ reserve
Age 55+, elevated debt, uncertain direction
90-day focus
IOFC-based culling, Feed Saved genetics
File organic transition, apply for SARE grants
Professional appraisal, explore sale/lease
Timeline
12-18 months
36-48 months
6-12 months
Capital required
Low to moderate
$200K-400K
Low (advisory fees)
[Image: Decision tree flowchart helping farmers identify which of the three paths fits their situation]
Path A: Efficiency Focus
The core approach remains culling the bottom 15-20% of cows ranked by income-over-feed-cost, not by volume alone. Your 50 lowest-margin cows likely cost $300-400/month more than your top 50 to produce milk. Addressing that can improve annual cash flow by $180,000-240,000.
What I keep hearing from producers who went through aggressive IOFC-based culling during 2015-2016 is pretty consistent: it felt counterintuitive at first. Some of those cows were producing 90 pounds a day. But when they ran the actual economics, those high-volume cows were undermining their cost structure. Taking them out changed everything. Many came out of that period in better shape than they went in.
Producers running large dry lot operations in the West report similar experiences. The temptation is always to keep milking cows. But when you run the numbers, the bottom 10-15% of the herd is often break-even in a good month and loses money in a bad one. Letting them go without immediately restocking—just accepting a smaller herd—can actually improve your average component check per cow. Sometimes, smaller really is more profitable.
On the genetics side, it’s worth looking at “Feed Saved” as a selection trait. CDCB introduced this in December 2020, specifically to identify animals that are more efficient at converting feed to milk. The trait’s weight in Net Merit increased to 17.8% in the 2025 update, which tells you how seriously the industry is taking feed efficiency now. The potential savings vary by herd, but for operations where feed accounts for 50-60% of costs, even modest efficiency gains can translate into meaningful dollars. Talk to your AI rep about what realistic expectations might look like for your specific situation.
Path B: Premium Market Transition
For operations within a reasonable distance of major metro markets and with capital reserves to absorb transition costs, organic conversion or specialty milk contracts offer an alternative direction.
This path involves more complexity than it might initially appear. Organic transition typically means 3-year yield reductions of 10-15% according to data from the Organic Dairy Research Institute, followed by meaningful price premiums once certified. The economics can work—eventually—but the transition period requires substantial financial runway.
What I hear consistently from producers who’ve made this transition: the middle years are harder than expected. You’re essentially getting conventional prices while operating organically. But once you reach certification, the price difference is real. NODPA and USDA Organic Dairy Market News report certified operations receiving farmgate prices ranging from the mid-$20s to $30s per cwt for conventional organic, with grass-fed premiums often running significantly higher—sometimes into the $40s or above depending on your processor and region.
If this direction fits your situation, the 90-day priorities include:
Connect with certified organic dairies in your region through your state organic association—NOFA chapters in the Northeast, MOSA in the Upper Midwest, or similar organizations in your area. Request 2-3 farm visits to understand actual transition costs and challenges. The real-world experience matters more than marketing materials.
Explore SARE grants before the March 31, 2026, deadline. These grants may provide significant cost-sharing support for organic transition—contact your regional SARE coordinator for current funding levels and application requirements, since program specifics change annually.
If you’re committed, file your transition plan with your certifier by March 1, 2026, to start the 3-year clock. Earlier starts mean earlier access to premium pricing.
[Related: Organic Transition Economics: What the Numbers Actually Look Like — Real producer case studies and financial breakdowns]
Important consideration: This path makes most sense if you have substantial equity reserves and you’re genuinely within reach of organic market demand. Not every region has processors paying meaningful organic premiums. Market research should come before commitment—talk to Organic Valley, HP Hood, or whoever handles organic milk in your region about their current intake and premium structure.
Path C: Strategic Transition
This is the path that’s hardest to discuss, but for operators over 55, carrying elevated debt, or genuinely uncertain about long-term direction, a strategic exit while equity remains may represent sound financial planning.
Here’s what farm transition specialists consistently emphasize: a farm with a 45% debt-to-asset ratio that transitions strategically today typically retains significantly more family wealth than the same farm forced to exit in 2027-2028 after extended margin erosion. The difference can easily be $300,000-500,000, depending on circumstances.
That’s not failure. That’s recognizing circumstances and making a thoughtful decision.
University of Wisconsin Extension farm transition advisors make this point regularly in producer workshops: the families who come through in the best financial shape are almost always the ones who made the call themselves, not the ones who waited until circumstances forced their hand. There’s real value in choosing your path.
The 90-day approach for this path:
Obtain a professional appraisal ($2,500-4,000 depending on operation complexity) covering real estate, equipment, herd genetics, and any production contracts.
Explore multiple options—they’re not mutually exclusive:
Direct sale to a larger operation (typically a 12-18 month process)
Lease arrangement retaining land equity
Solar lease opportunities—rates vary significantly by region, but can provide meaningful annual income on 20-30+ acres depending on your location and utility contracts
Custom heifer rearing using your existing facilities—particularly relevant given the shortage we discussed earlier
Consult with a farm transition tax advisor. How you structure an exit matters enormously for what you ultimately retain—installment sales versus lump sum, 1031 exchanges, charitable remainder trusts, and other tools can make six-figure differences in after-tax proceeds.
Regional Realities: One Market, Many Situations
One pattern that emerges from these conversations is how differently the same market dynamics play out depending on where you’re farming. The fundamentals we’ve discussed apply broadly, but the specific numbers vary considerably by region.
In Idaho and the Southwest, large-scale operations with export-oriented processing face one set of calculations. These are often dry lot systems with 3,000+ cows, lower land costs, and direct relationships with major cheese manufacturers. When Glanbia or Leprino adjusts their intake, the regional implications differ from what you’d see in Wisconsin. The scale efficiencies are real, but so is the commodity price exposure. Producers in the Magic Valley are watching Class III futures more closely than component premiums—their economics are tied to cheese demand in ways that Upper Midwest producers selling to smaller plants simply aren’t.
In Wisconsin and the Upper Midwest, you’re more likely to encounter diversified operations—500-1,200 cows, often family-owned across generations, with a mix of cheese plant contracts and cooperative relationships. The smaller average herd size means fixed costs per hundredweight run higher, but there’s also more flexibility to adapt. I’ve talked with Wisconsin producers seriously exploring farmstead cheese or agritourism as margin supplements—approaches that wouldn’t make sense at 5,000 cows but can work at 400.
In the Northeast, higher land costs and proximity to population centers create yet another calculation. Fluid milk markets still matter more here than in most regions, even as fluid consumption continues its long decline. The premium path—organic, grass-fed, local branding—tends to be more viable in Vermont or upstate New York than in the Texas Panhandle simply because the customer base is closer and the logistics work better.
Here’s the bottom line on regional differences: Conversations with farmers and advisors who know your specific market really matter. Your cooperative field staff, extension dairy specialist, or lender can help translate these broader trends into your local context. The three-path framework applies everywhere, but the details of execution—which processors are actively buying, what premiums are realistically available, how constrained the local heifer market is—vary enough to influence decisions.
The Bottom Line
The farms that navigate this period most successfully won’t be those that discovered some novel solution—there isn’t one waiting to be found. They’ll be operations that understood the dynamics early, made honest assessments of their own position, and moved decisively while flexibility remained.
The window for making these decisions is now.
For additional resources on margin protection enrollment and strategic planning, contact your local FSA office, cooperative field representative, agricultural lender, or university extension dairy specialist.
Editor’s Note: Production cost data comes from the USDA Economic Research Service 2024 reports. Heifer pricing reflects USDA NASS data through July 2025. Bankruptcy statistics are from U.S. Courts data reported by Farm Policy News. Genetic progress figures reference the CDCB April 2025 genetic base reset. Cold storage and production data are from the USDA Agricultural Marketing Service. International trade figures come from the USDA Foreign Agricultural Service and Rabobank Global Dairy Quarterly. National and regional averages may not reflect your specific operation, market access, or management system. We welcome producer feedback for future reporting.
Key Takeaways:
Record butterfat, weaker checks: U.S. herds are averaging 4.23% butterfat, but Class IV has slipped to $13.89/cwt, and butter stocks are up 14%, so the component bonuses many bred for are no longer rescuing the milk check.
Heifer math has flipped: Dairy heifer inventory is at a 47-year low (3.914 million head), and quality springers are $3,000+ per head, which means the traditional “cull hard and restock” playbook often destroys equity instead of saving it.
This is a structural shift, not a blip: Twenty-five years of selecting for butterfat, China’s reduced powder imports, and slow-moving U.S. consolidation are combining into a multi-year margin squeeze, not just another bad winter of prices.
Your next 90 days are critical: Before DMC and DRP deadlines hit in February and March, farms in the 500–1,500 cow range need a clear cost-of-production picture, stress-tested cash-flow scenarios, and margin protection in place.
You have three realistic paths: Use this window to either tighten efficiency and genetics around IOFC and Feed Saved, transition into premium/organic markets where they truly exist, or plan a strategic exit while there’s still equity to protect—doing nothing is the highest‑risk option.
Complete references and supporting documentation are available upon request by contacting the editorial team at editor@thebullvine.com.
Learn More:
Is Beef-on-Dairy Causing America’s Heifer Shortage? – Reveals the structural mechanics behind today’s replacement crisis, detailing how the aggressive industry-wide shift to beef genetics created the specific inventory gap that is now driving heifer prices to record highs.
Cracking the Code: Behavioral Traits and Feed Efficiency – Provides the tactical “how-to” for the Efficiency Focus path, explaining how wearable sensors and behavioral data (rumination/lying time) can identify the most feed-efficient cows to retain when you can’t afford to restock.
How Rising Interest Rates Are Shaking Up Dairy Farm Finances – Delivers critical financial context for the Strategic Transition path, analyzing how the increased cost of capital is compressing margins and why debt servicing capacity—not just milk price—must drive your 2026 decision-making.
The Sunday Read Dairy Professionals Don’t Skip.
Every week, thousands of producers, breeders, and industry insiders open Bullvine Weekly for genetics insights, market shifts, and profit strategies they won’t find anywhere else. One email. Five minutes. Smarter decisions all week.
Every smart dairy decision right now is collectively destroying the industry. 14,000 farms gone by 2027. Your escape plan
EXECUTIVE SUMMARY: Your $1,600 beef-on-dairy calves are funding today’s survival while creating the heifer shortage that will eliminate 14,000 farms by 2027. This isn’t market volatility—it’s structural collapse driven by individual rational decisions creating collective disaster: processors betting $11 billion on milk from cows that don’t exist, heifer inventories at 20-year lows while replacements hit $4,000, and production racing west (Kansas +21%, Wisconsin +2%) where scale economics rule. The timeline is brutal—farms that don’t act before Q1 2026 lose all strategic options. Winners will be mega-dairies leveraging scale, small farms capturing specialty premiums, and operations that exit NOW while equity remains. Mid-size commodity producers face extinction unless they immediately choose: scale up through consolidation, pivot to high-value niche markets, or execute a strategic exit that preserves $200,000-400,000 in family wealth, which disappears after Q1 2026.
You know what’s been keeping me awake lately? It’s not just checking on fresh cows at 2 AM. It’s this strange situation where every producer I talk to—and I mean everyone, from my neighbors here in Wisconsin to folks I met at that Texas conference last month—they’re all making absolutely sensible decisions for their operations. Smart moves, really. Yet somehow, when you add it all up, we’re collectively driving ourselves toward the biggest industry shakeup since the ’80s farm crisis. And here’s what’s wild: this isn’t another milk price cycle we can just ride out. We’re looking at a fundamental transformation that could cut farm numbers from 26,000 to potentially 12,000 within the next 24 months.
The brutal 36-month timeline: 14,000 farms will disappear between now and 2028 – miss the Q1 2026 decision window and you lose all strategic options, joining the forced-exit wave
The Beef-on-Dairy Boom: When Opportunity Becomes a Trap
So here’s what triggered this whole conversation for me. A buddy from Pennsylvania—third-generation dairy farmer, solid operator—texted me last week. He just got $1,600 for a day-old Holstein-Angus cross calf.
I had him repeat that. Sixteen hundred dollars. For one calf.
You probably remember when those same calves were worth maybe $200 on a good day, right? Well, Penn State Extension’s been tracking this closely since earlier this year, and they’re confirming what we’re all seeing—these beef-on-dairy calves are moving for $1,000 to $1,400 pretty consistently across the Northeast. The Wisconsin team’s noting similar numbers out here.
The economic trap that’s destroying dairy: beef-cross calves now fetch $1,600 while replacement heifers hit $4,000 – farmers are cashing checks today that eliminate their industry tomorrow
I was talking with Dr. Michael Hutjens—you might know him from Illinois, he’s been doing some consulting work since retiring—and he put it perfectly. He said that with today’s beef premiums, the income-over-semen-cost calculation has basically rewritten everyone’s budgets. “When crossbred calves fetch double what dairy calves do, you can’t ignore it,” he told me. “But at three, four times? It changes what’s possible on a balance sheet.”
And the math is real. I’ve run these numbers with several neighbors using Cornell’s PRO-DAIRY modeling. Take your typical 500-cow herd, breed about 35% to beef semen—pretty standard approach these days—and you’re looking at $350,000 to $400,000 a year in extra calf revenue. That’s not marketing hype. That’s actual money hitting bank accounts.
But—and here’s where it gets complicated—have you seen what’s happening with heifer inventories? October’s USDA report shows we’re at a 20-year low. Think about that. Only 2.5 million heifers are coming into the US milking herds for 2025. That’s the lowest since they started properly tracking this back in 2003.
The Wisconsin auction yards tell the story. Replacement heifer prices jumped from $1,990 to $2,850 in just one year. And I’m hearing from producers out in the Pacific Northwest—granted, these are the extreme cases—but some folks are paying over $4,000 for the right animal. Even in California, where you’d think the scale would keep things stable, UC Davis Extension is reporting $3,500 for good replacements.
Dr. Victor Cabrera over at Madison said something that really stuck with me: “This makes perfect sense for each individual farm. But system-wide? We’re baking in a heifer shortage that’ll last years.” And you know what? The cull cow numbers tell the same story.
The heifer shortage nobody’s talking about: replacement inventories plummeting from 4.77M head in 2018 to a projected 3.2M by 2027 – a 33% collapse that makes industry expansion impossible
Shifting West: Kansas, Idaho, and the Geography of Expansion
Here’s what’s really fascinating—and honestly, it’s a bit unnerving if you’re farming in traditional dairy states like most of us. The October USDA milk production numbers are eye-opening. Kansas production is up 21% year-over-year. Twenty-one percent! Idaho’s up 9%, Texas jumped 7.4%. Meanwhile, we managed 2.1% here in Wisconsin, and Pennsylvania actually went backwards a bit. Even California, with all those new facilities near Tulare, only grew about 2.4%.
The death of traditional dairy states: Kansas explodes 21% while Wisconsin crawls at 2.1% and Pennsylvania contracts – geography now determines survival more than management skill
This isn’t just random variation, folks. This is a structural change happening right in front of us.
I had the chance to visit a 15,000-cow operation outside Garden City, Kansas, this summer. And what struck me—beyond the sheer scale, which is something else entirely—was the complete integration of every system. They’ve got water reclaim that essentially recycles every drop, hydroponic barley sprouting for year-round fresh feed, and they’re adjusting rations twice daily based on real-time component testing.
The ops manager (he asked me not to use his name because of co-op agreements) shared something interesting. They’re running about $2.50 per hundredweight below the Midwest average on total costs. “It’s not that we’re smarter,” he said. “We just built for this scale from day one. No retrofitting old tie stalls. No working around century-old barn foundations.”
Kansas State’s ag economics folks have been studying this, and they’re confirming these mega-dairies achieve 10% to 15% cost advantages through scale and integration. And yeah, let’s be honest—lower regulatory burden plays a role too.
What’s happening down in Florida and Georgia is different but equally telling. Producers there are dealing with heat stress that would knock our cows flat, but they’re making it work with cross-ventilated barns and genetics explicitly selected for heat tolerance. One Georgia dairyman told me he’s getting 75 pounds per day in August—not Wisconsin numbers, but impressive given the conditions.
Out in New Mexico and Arizona, it’s a different story again. Water scarcity is forcing innovation—one operation near Phoenix installed a reverse-osmosis system that recovers 85% of its water. They’re spending $50,000 annually on water technology, but it’s cheaper than not having water at all. These Southwest operations are proving that you can adapt to almost anything if you’re willing to invest in the right systems.
But here’s what really drives this geographic shift—it’s the processing infrastructure. That new Hilmar plant in Dodge City? It needs 8 million pounds of milk daily. That’s roughly 16 average Wisconsin farms, or about 1.5 of those Kansas mega-dairies. Valley Queen, up in South Dakota, is expanding by 50% to increase capacity, too. The processors go where the milk is, the milk goes where the processors are. It’s self-reinforcing.
The $11 Billion Bet: Processors Defy the Herd Falloff
Here’s a number that should make everyone pause: $11 billion. That’s what the International Dairy Foods Association says processors are investing in new capacity through 2028.
From their perspective, it makes sense. USDA’s November forecasts show milk output reaching 232 billion pounds by 2026, up from 226 billion in 2024. Even with cow numbers staying flat or declining slightly.
Michigan’s posting 2,260 pounds per cow monthly—that’s more than 250 pounds above the national average. Dr. Kent Weigel over at Madison calls this the “component yield era.” We’re seeing 3% to 5% yearly increases in protein and butterfat just from genetics and better feeding. With advances in nutrition, processors are betting on continued supply growth. It’s a reasonable bet based on what we’ve seen historically.
Yet—and this is where things get interesting—CoBank’s August report says we’ll lose another 800,000 heifers before the curve turns around in late 2027. I asked a cheese company exec about this disconnect at last month’s conference. His take? “We’re not betting on more cows. We’re betting on more milk per cow. Frankly, we’d rather work with fewer farms producing consistent volume than coordinate with hundreds of smaller operations.”
What’s interesting is that processors in the Southeast are taking a different approach—smaller, more flexible plants for regional supply. A new facility in North Carolina is designed to handle just 500,000 pounds daily, specifically targeting local specialty markets. But the big money? That’s all, heading to the Plains states.
GLP-1: The Protein Surge Nobody Planned
The obesity drug windfall: GLP-1 users exploding from 41M to 315M creates insatiable whey protein demand – pushing >3.2% protein herds to $1.50/cwt premiums worth $75,000-$100,000 per 500-cow operation
You know what’s wild? The biggest market mover right now isn’t even on the farm—it’s in the pharmacy. Morgan Stanley’s research shows 41 million Americans have tried those weight-loss GLP-1 drugs like Ozempic and Wegovy. The market for these medications is expected to hit $324 billion by 2035.
Why should we care? Well, turns out folks on these drugs need massive amounts of protein to avoid losing muscle along with the weight. The bariatric surgery folks updated their guidelines this year—they’re recommending 1.2 to 2.0 grams of protein per kilogram of body weight for these patients. That’s way above normal recommendations.
Dr. Donald Layman—Professor Emeritus at Illinois, who has been studying protein metabolism forever—told me whey protein’s become the gold standard. “The amino profile and absorption rate match exactly what GLP-1 patients need,” he explained. “You can’t get that efficiency from plant proteins.”
And the market’s responding in real time. CME spot dry whey prices jumped 19.8% in just a month, while Class III and IV are struggling. Lactalis rolled out GLP-1-specific yogurt lines that are flying off shelves. Danone’s high-protein Oikos line posted 40% growth last quarter. Even Nestlé’s getting in on it, developing what they call “next-gen functional proteins” specifically for the weight-loss market.
Here’s what this means for us: a 500-cow herd pushing protein above 3.2% can pocket an extra $50,000 to $100,000annually, just from protein premiums. That’s based on current Federal Milk Marketing Order pay schedules. Real money that could make the difference between red and black ink.
The 24-Month Crunch: Who Exits? Who Thrives?
I’ve been having a lot of conversations lately about survival math. Here’s how I think the next two years play out:
Right now through early 2026: We’re in the “kitchen table decision” phase. A Farm Credit rep in Wisconsin told me they’re seeing two to three times the usual requests for transition planning. “These aren’t distressed operations yet,” he said. “They’re farmers who can read the writing on the wall.”
Spring and summer 2026: That’s when the new processing capacity comes online hard. Valley Queen’s expansion, multiple Texas and Kansas cheese plants. The mega-dairies will lock in those contracts first, leaving mid-size operations scrambling. CoBank expects 3% to 5% of operations to exit during this window. Not all bankruptcies—but hard transitions.
Late 2026 into 2027: Cornell’s Dyson School economists are flagging rapid compression—25% to 40% of milk could come from operations over 5,000 cows. Dr. Andrew Novakovic at Cornell compared it to the ’80s consolidation, but compressed. “What took ten years then is happening in two or three now,” he told me.
2027-2028: We’ll likely stabilize at 12,000 to 18,000 farms total, down from today’s 26,000. The rest get absorbed or shut down.
What This Means for Different Operations
So what’s a producer to do? Well, it depends on your situation.
If you’re running a mega-dairy (5,000+ cows): Your advantages are clear—scale, technology, processor relationships. Just don’t overleverage. Keep debt under 40% of assets—that’s what saved the survivors in 2009 and 2020. And plan for those beef-on-dairy premiums to drop back to $400-500 when the beef herd rebuilds. It always does.
If you’re mid-size (500-2,000 cows): This is where it gets tough. If you’re losing money on milk alone, that beef-on-dairy revenue is buying time, not solving problems. Gary Sipiorski at Vita Plus puts it bluntly: “Q1 2026 is your decision window.” Exit while you have equity, find a niche, or partner up for scale.
I’ve seen success stories from Northeast operations doing direct sales, some Georgia and Texas folks making it work with heat-tolerant crossbreeds and targeted butterfat contracts. Down in Arizona, several mid-size operations formed a marketing co-op specifically for premium contracts. There are paths forward, but they require decisive action.
If you’re smaller (under 500 cows): Don’t write yourself off. Direct sales, on-farm processing, high-premium markets like A2 or grassfed with strong local brands—these can work if you’re committed. Bob Cropp at Madison always says, “Niche isn’t enough—you need real differentiation and usually some off-farm income during transition.”
The Stuff That’s Not in the Spreadsheets
Mental health matters here. Every banker I talk to mentions family stress. The Wisconsin Farm Center offers free, confidential counseling. Minnesota has their Farm & Rural Helpline (833-600-2670). Iowa State Extension runs Iowa Concern (800-447-1985). Most states have similar programs—find yours and use it. I’ve seen too many good operators make bad decisions because stress clouded their judgment.
Policy risk is real. Don’t build a five-year plan assuming today’s Dairy Margin Coverage program or immigration rules stick around. They won’t. Build flexibility into your planning.
Water—if you’re in the Southwest, plan for 30% cuts in availability by 2030. That’s what the Bureau of Reclamation models suggest. I talked to a Central Texas dairyman who’s already hauling water weekly, and another in New Mexico who’s paying $200 per acre-foot—triple what he paid five years ago. Changes everything about your cost structure.
And technology disruption? Precision fermentation isn’t science fiction anymore. Fonterra just put $50 million behind it. Perfect Day is already selling ice cream made with lab-produced dairy proteins. We can’t ignore this stuff.
Looking Forward: Building Smart AND Resilient
What I keep asking myself is—are we optimizing for the wrong things? Dr. James Dunn at Penn State warns that stable conditions reward efficiency, but what happens when things get less stable?
I think adaptability wins. The operations that’ll thrive in 2028 won’t necessarily be the biggest or most efficient. They’ll be the ones with options—not all-in with one processor, not overleveraged, not betting everything on one market.
Watch what’s happening in Europe with their farm protests. See New Zealand fighting environmental regulations. Australia’s dealing with drought cycles that make our weather look predictable. No export market is guaranteed. No playbook survives every storm.
The Bottom Line
If there’s one thing I’d leave you with, it’s this: the window for proactive decisions—whether that’s expansion, exit, or complete restructuring—is closing faster than most of us realize. By Q1 2026, most of the good options will be taken.
Push for higher components, not just volume. Be realistic about calf prices. Know your regional advantages—whether that’s proximity to processors in Kansas or grassfed premiums near Boston. And don’t try to go it alone. Get good advice. Run real numbers. Have honest conversations with your family.
The industry isn’t dying, but it is shedding its skin. Make sure you aren’t the one shed with it.
Your state’s Farm Center or Extension can help—Wisconsin’s is free and confidential (800-942-2474). Farm Aid runs a national hotline at 1-800-FARM-AID. The National Suicide Prevention Lifeline (988) has agricultural specialists available. Sometimes the hardest conversation is the one that saves your farm—or helps you exit with dignity and equity intact.
KEY TAKEAWAYS
Decision Deadline: Q1 2026 – After this, you lose all strategic options. Exit now = $200-400K preserved equity. Exit later = bankruptcy.
Immediate Revenue: Chase Protein Premiums – Getting above 3.2% protein captures $50-100K annually (500 cows) from GLP-1 demand while you plan next moves.
Reality Check Your Business – If you need $1,600 beef calves to survive, you’re already dead. Plan for $500 calves, $15 milk, and 30% less water (Southwest).
Only 3 Models Survive – Mega-scale (5,000+ cows), radical differentiation (A2, grassfed, on-farm processing), or strategic exit. “Local” and “family farm” aren’t differentiators.
Geographic Destiny – Kansas/Idaho/Texas have won. Traditional dairy states face a permanent 15% cost disadvantage. Location now determines survival more than management.
Complete references and supporting documentation are available upon request by contacting the editorial team at editor@thebullvine.com.
Learn More:
Beef-on-Dairy: Real Talk on Turning Calves into Serious Profit – Provides specific feeding protocols and genomic cut-off points (top 40% vs. bottom 35%) to maximize calf value, ensuring your crossbreds actually hit the $1,400 premiums mentioned in the main article rather than getting discounted.
Every week, thousands of producers, breeders, and industry insiders open Bullvine Weekly for genetics insights, market shifts, and profit strategies they won’t find anywhere else. One email. Five minutes. Smarter decisions all week.
Week-old beef calf: $1,400. Replacement heifer: $4,000. Still breeding beef? You’re not crazy—you’re doing the math.
EXECUTIVE SUMMARY: What started as desperate survival in 2018 has become an irreversible trap: beef-cross revenue now provides 16% of dairy farm income, forcing farmers to keep breeding beef at $1,400 per calf even as replacement heifers hit $4,000. This has driven U.S. heifer inventory to 3.9 million—the lowest since 1978—with 800,000 fewer coming before any recovery in 2027. Simultaneously, processors who invested $11 billion expecting 2-3% growth face just 0.4% milk expansion, guaranteeing plant closures and $3-5/cwt regional price swings. The industry is restructuring into three distinct survivors: fortress farms with over 1,500 cows capturing component premiums, strategic operations with 200-500 cows in profitable niches (organic/A2A2/grass-fed), and those exiting now at peak cattle prices. Wisconsin’s 10,000-heifer gain versus Texas’s 10,000-head loss proves that processor relationships and location now matter more than size. Behind the numbers, 2,400-3,700 dairy families face elimination—transforming not just an industry but entire rural communities.
You know something’s off when you’re seeing beef-cross calves bringing $1,000 to $1,400 at a week old while replacement heifers are hitting $4,000 at auction. It doesn’t make sense at first—but then you dig into what’s actually happening out there, and suddenly it all clicks.
We’re not looking at just another market swing here. What we’re seeing is the collision of desperate decisions farmers made back in 2018 and 2019 with billions in processing investments that assumed a completely different future. And if you’re wondering why your neighbor’s still breeding 40% of the herd to beef despite those heifer prices…well, let me walk you through what I’ve been hearing from producers across the country.
The 800,000 Heifer Crisis Timeline – From 4.8 million in 2018 to 3.4 million projected by 2027, this isn’t a market cycle—it’s industry transformation
Note: Throughout this article, some producers and industry professionals spoke on condition of anonymity to discuss sensitive business details. All financial figures and operational data have been verified against industry benchmarks.
The Numbers Paint a Picture Nobody’s Prepared For
So, CoBank released its latest dairy heifer inventory analysis in August, and the numbers are… honestly, they’re worse than most people realize. According to the USDA’s National Agricultural Statistics Service January 2025 cattle report, the national number of replacement heifers stands at 3.914 million. That’s the lowest since 1978—back when the average herd was what, 30-something cows?
But here’s the kicker that really got my attention: only about 2.5 million of those heifers are expected to actually calve into milking herds this year, based on CoBank’s projections. That’s tracking to be the lowest since the USDA started keeping those specific records in 2001. The ratio’s collapsed, too—USDA’s July calculations show we’re down to 27 heifers per 100 cows. Ten years ago? That was 31 per 100.
And it gets rougher. CoBank’s projects indicate that we’ll lose another 357,490 heifers in 2025, followed by an additional 438,844 in 2026. They’re saying maybe we’ll get back 285,387 or so in 2027, but…that’s still a massive hole. Add it up and we’re talking about 800,000 fewer replacements before any real recovery kicks in.
The 216% Explosion That Changed Everything – Beef semen sales to dairy farms surged from 2.5M to 7.9M units, creating the heifer shortage crisis
How Seven Years of Survival Mode Created Today’s Crisis
You can trace this whole thing back to that brutal stretch from 2015 through 2021. Class III milk prices averaged below $18 per hundredweight for most of those years—not continuously, but often enough to cause significant harm. University of Illinois dairy economist John Newton documented this period in his 2018 farmdocdaily analysis, calling it an extended period of sustained losses that fundamentally changed the industry.
By April 2019, according to the USDA’s Agricultural Marketing Service reports, replacement heifers that cost $ 2,000 or more to raise were only bringing $1,140 at market. Think about that for a second. You’re losing $860 to $1,360 on every single replacement you raise.
Then the technology all came together at once. Sexed semen finally worked reliably—industry data from Select Sires and other major AI companies shows you can get 90% female calves with 85-95% of conventional conception rates. Genomic testing through companies like Zoetis and Neogen dropped to about $40 per animal. And beef prices? Through the roof. Suddenly, those Holstein bull calves that might bring $200 on a good day were being replaced with Angus crosses worth anywhere from $600 to over $1,400, depending on genetics and your local market.
I mean, what would you have done?
The National Association of Animal Breeders has been tracking this transformation in their annual Semen Sales Reports. Beef semen sales to dairy farms went from about 2.54 million doses in 2017 to over 7.2 million by 2020. That’s nearly triple in three years. Their March 2025 industry update shows we’re now sitting at about 7.9 million units, and it’s just…stuck there. Meanwhile, conventional dairy semen sales have crashed almost 46.5% since 2020.
Why $4,000 Heifers Still Can’t Fix the Problem
Examining what doesn’t add up for many people: according to the USDA’s October 2025 Agricultural Prices report, heifers are currently worth a significant amount of money. Wisconsin’s averaging close to $2,860. Vermont’s around $2,930. Premium animals in California and Minnesota are fetching over $4,000, according to recent livestock auction reports. So why isn’t everyone breeding dairy again?
What I’m hearing from nutritionists working with Wisconsin herds is pretty consistent. Consider a typical 500-cow operation that breeds 40% of its cows for beef. They’re bringing in maybe $200,000 a year just from those beef calves. Add in cull cows at current prices, and you’re looking at $350,000 in cattle revenue.
The Revenue Revolution – Cattle sales jumped from 6.7% to 16% of dairy income – this structural shift is permanent and changes everything
According to USDA Economic Research Service data, that’s approximately 16% of total farm income for many operations now. Back in 2020? Cattle sales were maybe 6.7% of dairy farm revenue.
As one nutritionist put it to me, “It’s not just extra money anymore. It’s structural. These guys can’t just flip a switch and go back. Walking away from that revenue would mean completely restructuring the operation.”
From Crisis to Gold Rush – Heifer prices crashed to $1,140 in 2019, now average $2,860 with premiums hitting $4,000
The Processing Overcapacity Challenge Coming in 2027
And here’s where it gets really messy. According to the International Dairy Foods Association’s industry investment tracking, the processing sector has invested more than $10 billion in new facilities over the past three years—some estimates put the total closer to $11 billion. New York’s Department of Agriculture reports that the state alone has $3 billion in processing investments that require an additional 10 to 12 million pounds of milk per day.
These plants were all designed assuming we would continue to grow milk production at a rate of 2-3% annually, as we have for decades, based on USDA historical data from 1995 to 2020. Instead? USDA’s October 2025 World Agricultural Supply and Demand Estimates project just 0.4% growth next year. That’s not a typo—zero point four percent.
Mike North from Ever.Ag’s Risk Management division put it bluntly at the September 2025 Milk Business Conference: “We don’t have enough cows to fill all these plants.” He thinks we’ll see inefficient plants close, and others running way under capacity. That’s billions in stranded investment.
What’s worth noting here is that we’re already seeing some policy discussions emerging. The National Milk Producers Federation has formed working groups to study the situation, though no concrete proposals have emerged. Meanwhile, some state agriculture departments are exploring incentive programs for heifer retention, but the scale of these initiatives remains small compared to the challenge.
Three Different Worlds Emerging
What’s really interesting—and I’ve been watching this develop over the past year or so—is how the industry’s basically splitting into three completely different business models.
The Big Operations (Your “Fortress Farms”)
These 1,500 to 5,000-cow dairies have basically built moats around their businesses. They’re conducting genomic testing on every single heifer through programs like Zoetis’ CLARIFIDE Plus, utilizing AI-powered systems like DairyComp for informed decision-making. According to the Penn State Extension’s 2025 component premium tracking, they’re achieving component premiums that add $1.50 to $2.50 per hundredweight.
Large Midwest operations I’ve talked with are reporting revenue per cow that’s approaching $6,000 to $7,000—numbers that would’ve been fantasy five years ago. They’re generating base milk revenue in the millions, plus substantial component premiums, and nearly a million dollars from beef calves in some cases.
What’s interesting here is something I noticed visiting a couple of these operations recently: they’re not just bigger—they’re fundamentally different businesses. One manager showed me their real-time component monitoring system. “We know within 0.1% what our butterfat’s gonna test every single day,” he said. “That consistency is worth an extra $750,000 a year to us.”
It’s worth noting that these operations are also exploring emerging technologies. Embryo transfer programs, automated calf feeding systems, precision nutrition through AI…they’re positioning themselves for whatever comes next. Some are even experimenting with automated milking systems that can handle 500-plus cows, completely changing labor dynamics.
The Strategic Middle
This is where it gets interesting for those with 200-500 cows. According to the USDA’s organic dairy market reporting, they’re finding ways to make it work through specific niches. Organic products typically sell for $7-12 more than conventional ones. University of Wisconsin extension studies on pasture-based dairy show grazing systems are cutting costs by 30-50%. Some are going direct-to-consumer and getting $4 more per gallon.
I visited an organic operation in Vermont last month, which had transitioned to organic in 2022, with 280 cows. The producer told me she’s actually more profitable now than when she had 350 conventional. The premium’s real—she’s averaging about $9.50 over conventional—and her vet bills dropped 40%.
Out in California, there’s a different approach. One Jersey producer with about 450 cows is locked into a specialized cheese contract. Between base and components, he’s getting close to $24.50 when commodity milk’s at $21. On 10 million pounds, that $3.50 spread is…well, you can do the math.
Down in Georgia—and this is something you don’t hear much about—a 300-cow operation switched to A2A2 milk production exclusively. They’re selling direct to Atlanta-area health food stores at premium prices. “It’s niche as hell,” the owner admits, “but it works for us.”
The Ones Choosing to Exit
Then there are the operations using these high cattle prices as their exit opportunity. After a decade of barely hanging on, they’re done—and honestly, who can blame them?
I caught up with a couple who recently sold their 185-cow place in Wisconsin. After accounting for debt service, living expenses, and reinvestment, they were netting maybe $18,000 a year for 70-hour weeks. Now they’ve got a solar lease on the land, bringing in $52,000 with zero labor. Can’t really argue with that decision.
Industry Darwinism – Only 20% of small farms will survive the heifer shortage, while 95% of large operations thrive – consolidation is accelerating
Global Perspective: How Other Countries Face Similar Dynamics
What’s fascinating is seeing how this isn’t just a U.S. problem. The European Union’s dealing with their own version of this crisis, though for different reasons. Environmental regulations and nitrogen limits are forcing Dutch and German producers to reduce herd sizes, just as their processing sector has expanded to meet export market demands. According to European Dairy Association reports, EU milk production is expected to decline 1.5% annually through 2027.
New Zealand’s taking a different approach. Fonterra’s latest annual report shows they’re actually encouraging farmers to reduce production intensity and focus on value-added products. Their winter milk premiums now exceed NZ$11 per kilogram milk solids—that’s roughly equivalent to a $7/cwt premium in U.S. terms—specifically to maintain year-round supply for their specialty ingredient plants.
Brazil and India, meanwhile, are ramping up production. Brazil’s domestic consumption is growing at a rate of 3% annually, and the country is investing heavily in genetics and infrastructure. India’s cooperative model—completely different from ours—is actually expanding smallholder participation. It’s a reminder that there’s more than one way to structure a dairy industry.
What’s interesting is watching how other countries handled similar situations. Dairy Australia’s market analysis shows that in 2023, when their production hit 30-year lows, processors like Goulburn Valley Creamery started paying AUS$9.70 per kilogram milk solids—equivalent to about $28 per hundredweight U.S.—just to keep smaller farms from shutting down. We’re starting to see hints of that in the Upper Midwest—smaller co-ops offering bonuses that weren’t on the table two years ago.
Why Some Regions Are Winning While Others Lose
The shortage’s not hitting everywhere the same. USDA’s January 2025 cattle report shows Wisconsin actually added 10,000 replacement heifers last year. Meanwhile, Kansas dropped 35,000, Idaho lost 30,000, and Texas shed 10,000.
Why the difference? Extension specialists at UW-Madison point to several factors. It’s partly infrastructure, partly processor relationships, but mostly it’s about positioning. Wisconsin cheese plants require consistent, high-quality milk, and they’re willing to pay for it. They’re offering retention bonuses, multi-year contracts—things that make raising heifers actually pencil out.
Down in Texas, it’s brutal. One producer recently told me that he paid $4,200 per head for bred heifers from Wisconsin, plus an additional $380 each for trucking. “It hurt,” he said, “but dropping our ship volume would’ve cost us our quality premiums. That’s $140,000 gone.”
Out in the Mountain West states—Colorado, Wyoming, parts of Montana—they’re dealing with different challenges. Water rights, urban expansion, and feed costs… it’s pushing many smaller operations out. One Colorado producer told me, “Between Denver sprawl and water restrictions, we’re done in five years regardless of heifer prices.”
The “Obvious” Solution That’s Actually a Trap
You’d think with heifers at $4,000, somebody would be raising extras to cash in. Spend $2,400 raising them, pocket $1,600 profit. Simple, right?
Not really. The heifer management experts at UW-Madison have thoroughly reviewed this. First problem: mortality. The USDA’s 2022 Dairy Cattle Management Practices study shows you lose about 21% of heifers from birth to freshening when you factor in all causes of mortality and culling. So that $2,400 cost becomes over $3,000 per surviving heifer.
Then add labor—extension economists calculate $400-600 per head through freshening. Feed costs can fluctuate by $400 based solely on corn prices—we’ve seen a variation of $2.80 per bushel over the past 18 months. And you’re making a 24-month bet with no way to hedge the price risk.
As one extension specialist explained, “The only people successfully raising heifers for sale have paid-off facilities, family labor, and grow their own feed. That’s not a business model most can replicate.”
Industry Response: Fragmented Approaches to a Systemic Challenge
You’d think there’d be some coordinated response, but…not really. The National Milk Producers Federation has been discussing the situation, but they’re mostly focused on data collection and suggesting best practices. No real market intervention, though they are exploring potential policy recommendations for the next Farm Bill discussions.
Some cooperatives are exploring different approaches to help members finance replacement raising, though the details vary significantly by region. But as one board member mentioned in a recent meeting, the scale of what’s needed versus what’s being offered is pretty mismatched. We need hundreds of thousands, not tens of thousands, of additional heifers.
What’s encouraging is seeing some innovation at the regional level. A group of farms in Minnesota formed what they’re calling a “heifer pool”—basically sharing genetics and breeding decisions to optimize replacement production across multiple operations. It’s early days, but the concept’s interesting.
Meanwhile, some states are getting creative. Pennsylvania’s Department of Agriculture is piloting a heifer retention incentive program, offering $200 per head for farms that increase replacement numbers. It’s small—only $2 million allocated—but it’s something.
2027: The Year Everything Changes
Based on everything I’m hearing from processors, economists, and producers—plus what we’re seeing in reports from CoBank and Rabobank’s latest dairy quarterly analysis—here’s what’s probably coming:
Milk prices will diverge significantly regionally—possibly $3-5 per hundredweight between shortage and surplus areas. I’m already seeing it start. Some cooperatives in Texas are offering $2.40 location premiums for new farms near their plants.
Industry analysts suggest that processing plants will operate at 72-76% capacity, rather than the 85-90% required for profitability. Smaller regional processors will either close or get bought for significantly less than their construction cost. As one former cheese plant executive explained to me, “The consolidation is coming, it just hasn’t started yet.”
Heifer prices are likely to peak around $4,200-$4,800 in early 2027, based on historical price patterns from similar periods of shortage. They will then moderate back to $3,800-$ 4,200 as more sexed semen is used and the supply improves slightly.
According to NAAB’s projections, beef-on-dairy sales are expected to decline slightly—possibly to 6.5-7 million unitsfrom the current 7.9 million—but they are unlikely to return to pre-2020 levels. As one large-herd manager put it, “Once you’ve built those calf buyer relationships and you’re getting $1,000 to $1,400 per head, you don’t just walk away.”
The Human Cost We’re Not Calculating
What gets lost in all these numbers is what this means for actual people. Back in 2018, Agri-Mark started including suicide prevention hotline numbers with milk checks after losing three members to suicide, as documented in their member communications. The CDC’s 2020 Morbidity and Mortality Weekly Report shows farmers have the highest occupational suicide rate in America—43.7 per 100,000 workers, over 3 times the general population.
When 10-15% of dairy operations close over the next decade—that’s 2,400 to 3,700 families based on current USDA numbers—we’re not just losing businesses. These are communities that have been built around dairy farming for generations.
Researchers studying farmer mental health, such as those at the University of Illinois’ Agricultural Safety and Health Program, have found that after a decade of financial stress, decision-making processes undergo fundamental changes. As one researcher explained, “These aren’t people making strategic business decisions anymore. They’re making survival decisions from a place of chronic stress.”
I see it visiting farms. The producer who won’t look you in the eye when money comes up. The couple who stopped talking about succession because their kids made it clear they’re not coming back. The neighbor who sold out and now won’t answer calls because the shame’s too heavy.
That’s the real cost we’re not calculating.
Your Survival Playbook for the Next 18 Months
Look, every operation’s different, but here’s what seems to make sense based on what I’m seeing:
If You’re Under 200 Cows
Be honest about whether this still works for you. I know that’s hard, but extension economists have shown pretty clearly that the economics are brutal at this scale unless you’ve got a real niche.
If you’re staying, pick your lane now. Organic certification takes three years, but it adds significant premiums, according to USDA data. Grass-fed certification is faster. Direct sales need the right location. However, you have to pick one and commit to it completely. Half-measures don’t work anymore.
Consider teaming up with neighbors. I’m seeing more informal cooperatives forming—sharing equipment, coordinating breeding, even pooling milk for better bargaining power. It’s worth exploring.
If You’re 200-500 Cows
This is your moment to choose. The middle ground’s gone.
Invest smart. Extension research indicates that testing the top 30% of animals genomically costs approximately $3,000-$ 4,000 per year, but can significantly advance your genetics. Activity monitors from companies like SCR by Allflex run $150-200 per cow, but their field data shows conception rate improvements of 8-12%.
Build relationships with your processor now. The farms that’ll get premiums when things get crazy in 2027 are the ones building trust today. Consistent quality, reliable volume, good communication—that’s what processors are looking for.
And keep beef breeding at a maximum of 35-40%. Yeah, those $1,000-plus checks are nice, but you need flexibility when markets shift.
If You’re Over 500 Cows
Focus on component consistency. Penn State’s data show that farms with less than 2% daily variation are earning significant premiums—$375,000 to $750,000 annually on 50 million pounds of product.
Test everything genomically. University research consistently shows that herds testing all their females make genetic progress over twice as fast. At $40 per test, it pays for itself quickly through increased production efficiency.
Be ready to expand strategically when neighbors exit. But like one Idaho dairyman told me, “Don’t expand just because you can. Expand because it makes your operation better.”
What This All Really Means
We’re sitting at 3.914 million heifers—the lowest since 1978, according to the USDA—with 800,000 fewer expected to arrive before anything improves, based on CoBank’s modeling. We’re not going back to the dairy industry we knew.
What started as desperate survival with beef-on-dairy has triggered a complete restructuring. When cattle revenue reaches 16% of farm income, according to USDA ERS data, and large operations capture premiums that smaller farms cannot match, when $10 billion in processing investment faces milk shortages nobody predicted—this is creative destruction happening in real-time.
What’s emerging isn’t necessarily better or worse; What’s emerging isn’t necessarily better or worse. It’s fundamentally different.. The broad middle that defined dairy for generations is disappearing, replaced by high-tech large operations and strategic niche players.
The decisions you make in the next 18-24 months about breeding, technology, and positioning will determine not just profitability but survival. There’s opportunity in this chaos, but only if you recognize the game has completely changed.
The heifer shortage isn’t the crisis. It’s the catalyst exposing a transformation that was always coming. The question now is whether you’re positioned for what’s next or still trying to preserve what was.
KEY TAKEAWAYS:
The Numbers: 3.9 million heifers (lowest since 1978) with 800,000 fewer coming by 2027—yet farmers won’t stop breeding beef because it’s now 16% of revenue vs 6.7% in 2020
The Collision: $11 billion in new processing capacity built for 2-3% growth will get 0.4%—expect plant closures and $3-5/cwt regional price swings by 2027
Your 18-Month Strategy: Scale to 1,500+ cows for premiums | Find your niche at 200-500 (organic/A2A2/grass-fed) | Exit under 200 while cattle prices are high
Complete references and supporting documentation are available upon request by contacting the editorial team at editor@thebullvine.com.
AI and Precision Tech: What’s Actually Changing the Game for Dairy Farms in 2025? – For producers aiming to build a “Fortress Farm,” this article details the specific technologies creating separation. It breaks down the ROI on AI-driven health monitoring, precision feeding, and robotics, demonstrating how to achieve quantifiable cost savings and yield gains.
The Ultimate Dairy Breeders Guide to Beef on Dairy Integration – While the main article explains why beef-on-dairy is a structural necessity, this tactical guide explains how to execute it for maximum profit. It provides actionable strategies on sire selection, calf care, and marketing to optimize your beef-cross revenue stream.
The Sunday Read Dairy Professionals Don’t Skip.
Every week, thousands of producers, breeders, and industry insiders open Bullvine Weekly for genetics insights, market shifts, and profit strategies they won’t find anywhere else. One email. Five minutes. Smarter decisions all week.
Stop maintaining 100%+ replacement rates. Smart producers achieve 54% cost savings while traditionalists pay $4,000+ per heifer in 2025’s tightest market since 1978.
EXECUTIVE SUMMARY: The dairy industry’s sacred 90-110% replacement rate gospel just became financial suicide, and progressive producers are already capitalizing while traditionalists scramble. With heifer inventories at 47-year lows and 72% of operations shifting to beef-on-dairy breeding, internal heifer production now delivers up to 54% cost savings compared to market purchases exceeding $4,000 per head. University of Florida research involving 1,019 Holstein heifers proves precision breeding timing achieves 62.8% conception rates versus industry-average mediocrity below 45%. While conventional wisdom preaches surplus strategies, exceptional herds require only 65-80% replacement rates through improved genetics and reproductive efficiency. Canadian research from 87 Quebec Holstein farms confirms that operations in the “Low rearing cost cluster” achieved $4,145 CAD per heifer versus industry averages of $4,870 CAD—proving efficiency trumps volume. Global trends show New Zealand’s genomic selection delivering $45.58 additional value per animal annually, while U.S. producers cling to outdated strategies. Stop accepting industry averages and start calculating your true replacement needs using research-backed formulas that separate tomorrow’s dairy leaders from today’s struggling operations.
KEY TAKEAWAYS
Master the 62.8% Conception Advantage: University of Florida’s proven 13-23 day heat cycle timing protocol delivers 17+ percentage point improvements over conventional <45% rates, saving thousands in replacement costs when each failed conception represents $4,000+ in lost value.
Capture the 54% Cost Savings: Internal heifer production costs $2,034-$2,510 per head versus $2,870+ market prices, with premium genetics exceeding $4,000—progressive operations are banking massive savings while competitors pay premium prices for basic replacements.
Eliminate the 14% Failure Rate: Research-backed colostrum management using the “Five Q’s” protocol prevents passive immunity failures that cost thousands in future asset value, with precision timing and IgG monitoring replacing hope-based management.
Deploy Precision Replacement Calculations: Ditch obsolete 90-110% replacement rate recommendations for data-driven formulas that account for modern efficiency gains—exceptional herds now operate at 65-80% rates while maintaining optimal productivity.
Leverage Technology ROI: Smart calf sensors detect illness 48 hours before visible symptoms, reducing mortality by 40% with 7-month ROI at $120-$160 per calf, while activity monitoring systems achieve 78.3% conception rates versus 56.8% with traditional timing protocols.
The dairy industry’s most sacred assumption—that replacement heifers will always be available—just shattered. With inventories at 47-year lows and beef-on-dairy breeding consuming 72% of dairy operations, the traditional “buy versus raise” playbook is obsolete. Smart producers are already rewriting the rules while others scramble to understand why a $4,000 heifer represents the new normal.
Picture this: You’re sitting across from your neighbor who just paid $4,000 for a springing Holstein—more than double what you paid two years ago. Meanwhile, his day-old crossbred calves are bringing $1,000 each, and he’s wondering if anyone should bother raising dairy replacements anymore. This isn’t a hypothetical scenario—it’s playing out in auction barns across America every week.
Welcome to 2025’s dairy reality, where the fundamental economics of herd replacement have been turned upside down, and the producers who adapt fastest will own the next decade.
The Numbers Don’t Lie: We’re Living Through Historic Scarcity
The brutal mathematics of America’s heifer crisis demand immediate attention:
Crisis Indicator
2025 Reality
Historical Context
Total Dairy Heifers
3.9 million head
Lowest since 1978
Expected Calvings
2.5 million heifers
0.4% decline from 2024
Year-over-Year Drop
0.9% decrease
Steepest decline in decades
But here’s what makes this crisis different from previous market cycles: it’s not driven by high milk prices spurring expansion. The current shortage stems from a perfect storm of strategic decisions fundamentally altering the industry’s replacement pipeline.
The Beef-on-Dairy Revolution Has Arrived
Oklahoma Farm Report’s comprehensive analysis reveals that 72% of dairy farms now incorporate beef genetics into their breeding programs. This isn’t a fringe movement—it’s a wholesale transformation. Day-old crossbred calves command $675 per head at auction, with premium animals reaching $1,000 per head.
The math is devastating: analysis confirms that almost 4 million crossbred calves were born in 2024, potentially reaching 6 million in the next two years. At that point, dairy-beef animals could represent almost one-sixth of the fed beef cattle market.
Challenging the Sacred Cow: Why Traditional Replacement Rates Are Economic Suicide
Here’s the controversial truth that industry traditionalists refuse to acknowledge: the standard recommendation to maintain 90-110% of cow numbers as replacements isn’t just outdated—it’s financially destructive in today’s market.
The Replacement Calculation Revolution
USDA’s 2025 dairy outlook projects that despite favorable margins, “a challenge to potential herd expansion” exists due to reduced replacement heifer inventories. The agency forecasts annual milk production growth of just 0.5%—constrained entirely by heifer availability.
Modern operations demand precision thinking: research emphasizes that producers must “think of your heifer raising program as a funnel” where only a certain percentage will enter the milking herd due to mortality, infertility, and other losses.
Why Industry “Experts” Are Wrong About Surplus
While consultants still preach traditional surplus strategies, progressive producers are discovering that efficiency beats volume every time. Every excess heifer you raise instead of selling as a crossbred calf represents $1,000+ in immediate foregone revenue—money you’ll never recover from future milk production.
The Real Cost of Complacency: Record Prices Signal Permanent Shift
Current market data reveals the staggering new reality of replacement heifer economics:
Historical analysis shows that auction market reports reached $2,800 in some regions by early 2024—and prices have only climbed since then.
Why This Time Is Different
Unlike 2014’s price spike driven by record milk prices, today’s heifer shortage occurs while milk prices remain modest. This scarcity-driven pricing suggests structural changes rather than cyclical market forces.
The Reproductive Efficiency Revolution: Precision Timing Changes Everything
Smart producers aren’t just adapting to heifer scarcity—they’re leveraging it to force improvements in reproductive efficiency that should have happened years ago.
The University of Florida Breakthrough
Groundbreaking research involving 1,019 Holstein heifers fitted with activity monitoring collars revealed critical timing insights for prostaglandin treatments:
“Heifers that were in heat 13 to 23 days before a prostaglandin injection had greater conception rates (62.8%) than heifers that were in heat four to 12 days before injection (<45%).”
This isn’t theoretical—it’s actionable intelligence that can immediately improve breeding efficiency by over 17 percentage points.
The Industry’s Dirty Secret About Heat Detection
Here’s what reproductive “experts” won’t tell you: peer-reviewed research demonstrates that timing prostaglandin injections during late diestrus (cycle days 12-15) achieves 78.3% conception rates versus only 56.8% during early diestrus (days 5-7).
Yet most operations still use arbitrary timing protocols that ignore individual cow cycles. When each failed conception costs $4,000+ in replacement value, this negligence is economically catastrophic.
Performance Benchmarks That Separate Winners from Losers:
90% of heifers are pregnant within 100-150 days of entering the breeding pen
62.8% conception at first service using precision timing protocols
90% of heifers inseminated within the first 21 days of breeding pen entry
The Colostrum Management Crisis: Your Future $4,000 Assets at Risk
An uncomfortable truth directly impacts your replacement program: veterinary research reveals that approximately 14% of calves fail to achieve adequate passive transfer of immunity despite industry advances in colostrum management.
When each calf represents a potential $4,000+ future asset, this failure rate represents massive economic losses that most operations completely ignore.
The Research-Backed Protocol
University of Minnesota research by Dr. Sandra Godden confirms that colostrum management is “the single most important factor determining calf health and survival.” The protocol demands:
Feed 10% of birth weight within first feeding
Complete first feeding within 4 hours of birth
Maintain IgG levels above 10 mg/mL through testing
Monitor absorption efficiency rather than assuming success
Why Most Operations Fail
The industry’s casual approach to colostrum management made sense when replacement costs were $1,500. Every management failure at $4,000+ per heifer represents catastrophic economic loss that progressive operations can’t afford to accept.
Economic Reality Check: The New ROI Calculations
The economic foundation of heifer raising has fundamentally shifted, and the data proves internal production now offers substantial advantages:
Internal heifer production now offers up to 54% cost savings compared to market purchases—a competitive advantage that progressive operations are already exploiting while traditionalists continue buying at premium prices.
The Beef-on-Dairy Gamble: Industry Lemming Behavior or Strategic Evolution?
Here’s the industry’s biggest controversy: Is the widespread rush to beef-on-dairy breeding a smart diversification strategy or a dangerous herd mentality that will create long-term vulnerabilities?
Oklahoma Farm Report’s analysis reveals a troubling trend: 72% adoption rates suggest industry groupthink rather than strategic thinking. When three-quarters of an industry suddenly adopts the same strategy, contrarian analysis becomes essential.
The Strategic Implications
Hoard’s comprehensive review projects that beef-on-dairy animals could represent almost one-sixth of the fed beef cattle market within two years. This fundamental shift may help stabilize milk markets by naturally curbing oversupply, but it comes at the cost of future expansion flexibility.
The Contrarian Question
What happens when beef prices inevitably decline, and dairy expansion becomes profitable again? Operations maintaining replacement production capability will capture market share while beef-on-dairy converts scramble to rebuild their genetics programs.
Future-Proofing Your Operation: Why Conventional Wisdom Is Wrong
USDA projections confirm that milk production growth will remain constrained at just 0.5% annually due to replacement heifer shortages. This creates unprecedented opportunities for operations that can efficiently develop their own replacements.
The Technology Integration Imperative
Research on reproductive management documents unprecedented improvements in dairy reproduction over the past 20 years, with cow conception rates improving from 35% to nearly 50%.
This “reproduction revolution” was driven by automated activity monitoring systems and improved fertility programs—technologies transforming from luxuries to necessities when replacement costs exceed $4,000.
Risk Management in the New Era
Comprehensive risk management strategies become critical, with individual animals representing $4,000+ investments. Traditional “hope for the best” management is financially irresponsible when replacement failures cost thousands rather than hundreds.
The Bottom Line: Adapt or Face Extinction
The heifer shortage of 2025 isn’t a temporary disruption—it’s a permanent reshaping of dairy economics that demands immediate strategic response.
Your Strategic Action Plan:
Calculate True Replacement Needs: Use research-backed formulas rather than outdated industry averages that ignore modern efficiency gains
Implement Precision Breeding: Deploy the University of Florida’s proven 13-23 day timing protocols to achieve 62.8% conception rates
Master Colostrum Management: Eliminate the 14% failure rate that’s costing thousands in future asset value
Leverage Cost Advantages: Capitalize on the 54% cost savings of internal production versus market purchases
The Critical Questions:
With USDA confirming the smallest heifer inventory since 1978, can your operation deliver the precision required when mistakes cost thousands? Are you positioned to achieve 62.8% conception rates through proven protocols or accept industry-average mediocrity?
Your future depends on decisions made today. With heifer inventories at 47-year lows and no relief projected, tomorrow’s dairy leaders are being determined by today’s strategic choices.
The farms that master these research-backed principles won’t just survive the current crisis—they’ll dominate their markets for the next decade while competitors struggle with obsolete strategies and premium replacement costs.
5 Technologies That Will Make or Break Your Dairy Farm in 2025 – Demonstrates how smart calf sensors reducing mortality by 40% and robotic milkers boosting yields 20% provide technological solutions to maximize productivity from existing herds when replacement acquisition costs exceed $4,000 per head.
The Sunday Read Dairy Professionals Don’t Skip.
Every week, thousands of producers, breeders, and industry insiders open Bullvine Weekly for genetics insights, market shifts, and profit strategies they won’t find anywhere else. One email. Five minutes. Smarter decisions all week.
To provide the best experiences, we use technologies like cookies to store and/or access device information. Consenting to these technologies will allow us to process data such as browsing behavior or unique IDs on this site. Not consenting or withdrawing consent, may adversely affect certain features and functions.
Functional
Always active
The technical storage or access is strictly necessary for the legitimate purpose of enabling the use of a specific service explicitly requested by the subscriber or user, or for the sole purpose of carrying out the transmission of a communication over an electronic communications network.
Preferences
The technical storage or access is necessary for the legitimate purpose of storing preferences that are not requested by the subscriber or user.
Statistics
The technical storage or access that is used exclusively for statistical purposes.The technical storage or access that is used exclusively for anonymous statistical purposes. Without a subpoena, voluntary compliance on the part of your Internet Service Provider, or additional records from a third party, information stored or retrieved for this purpose alone cannot usually be used to identify you.
Marketing
The technical storage or access is required to create user profiles to send advertising, or to track the user on a website or across several websites for similar marketing purposes.
To provide the best experiences, we and our partners use technologies like cookies to store and/or access device information. Consenting to these technologies will allow us and our partners to process personal data such as browsing behavior or unique IDs on this site and show (non-) personalized ads. Not consenting or withdrawing consent, may adversely affect certain features and functions.
Click below to consent to the above or make granular choices. Your choices will be applied to this site only. You can change your settings at any time, including withdrawing your consent, by using the toggles on the Cookie Policy, or by clicking on the manage consent button at the bottom of the screen.
Functional
Always active
The technical storage or access is strictly necessary for the legitimate purpose of enabling the use of a specific service explicitly requested by the subscriber or user, or for the sole purpose of carrying out the transmission of a communication over an electronic communications network.
Preferences
The technical storage or access is necessary for the legitimate purpose of storing preferences that are not requested by the subscriber or user.
Statistics
The technical storage or access that is used exclusively for statistical purposes.The technical storage or access that is used exclusively for anonymous statistical purposes. Without a subpoena, voluntary compliance on the part of your Internet Service Provider, or additional records from a third party, information stored or retrieved for this purpose alone cannot usually be used to identify you.
Marketing
The technical storage or access is required to create user profiles to send advertising, or to track the user on a website or across several websites for similar marketing purposes.


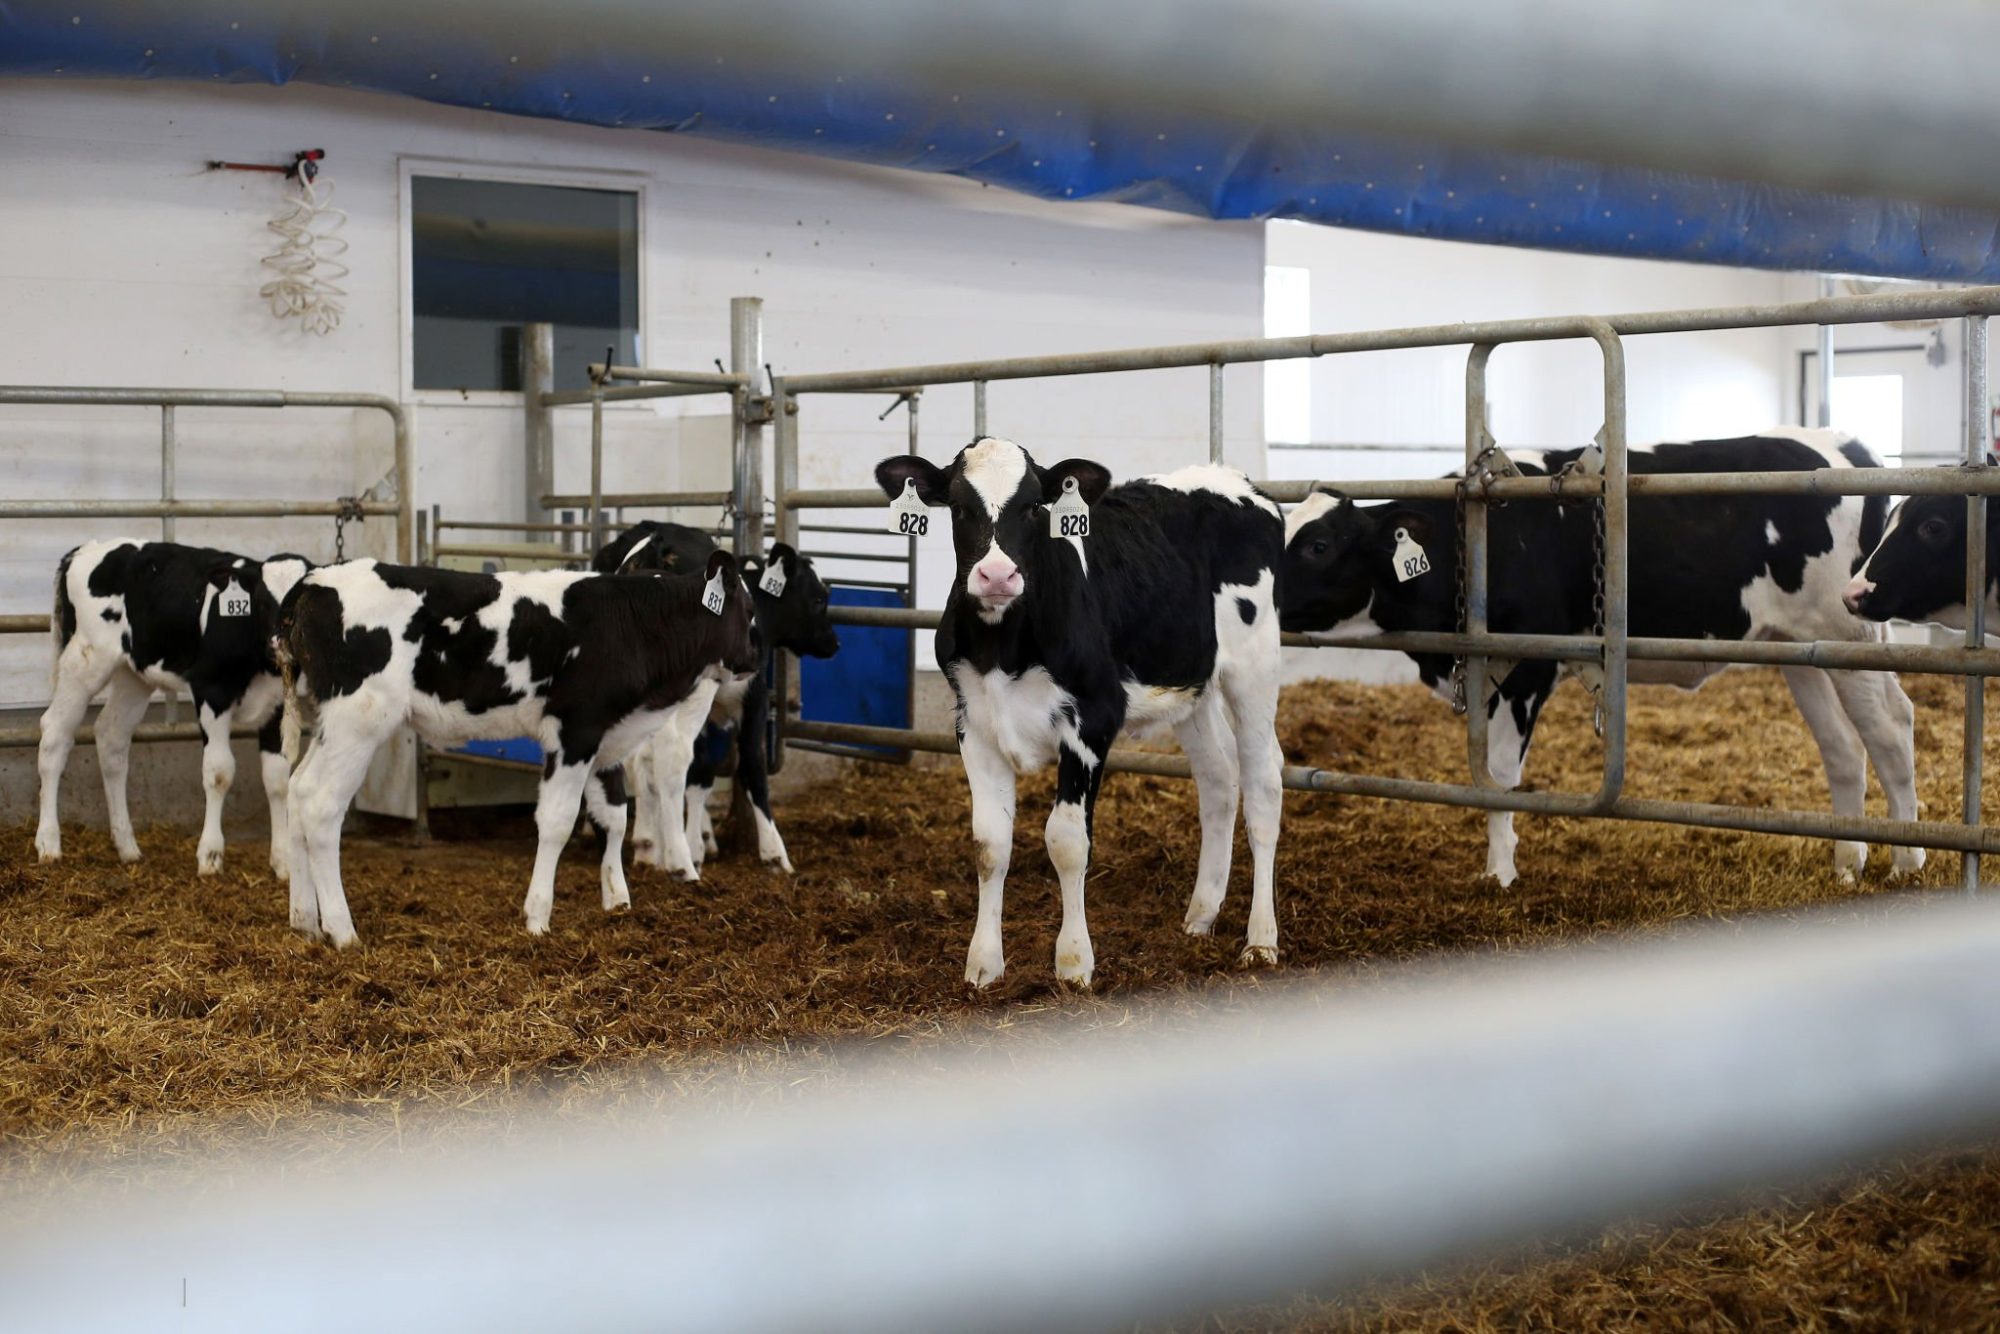
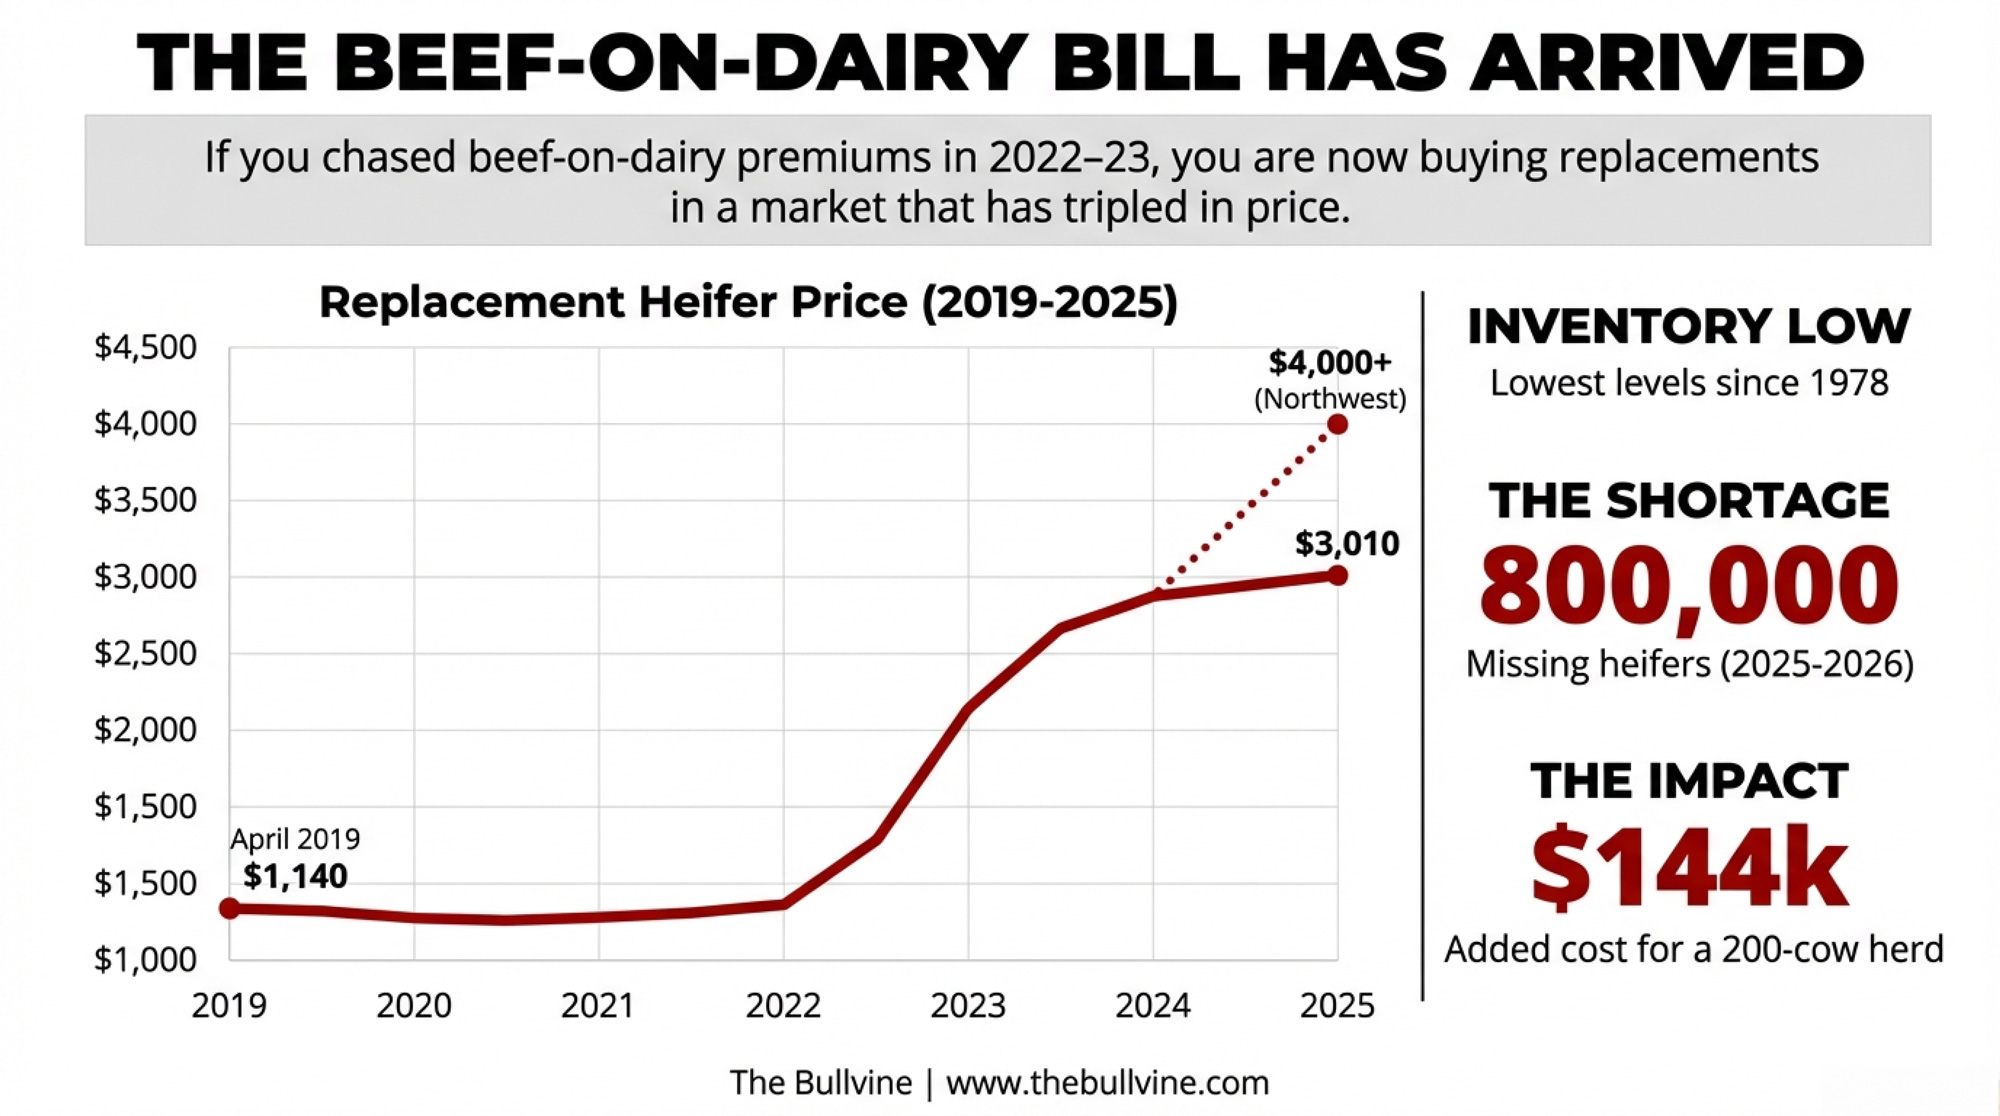
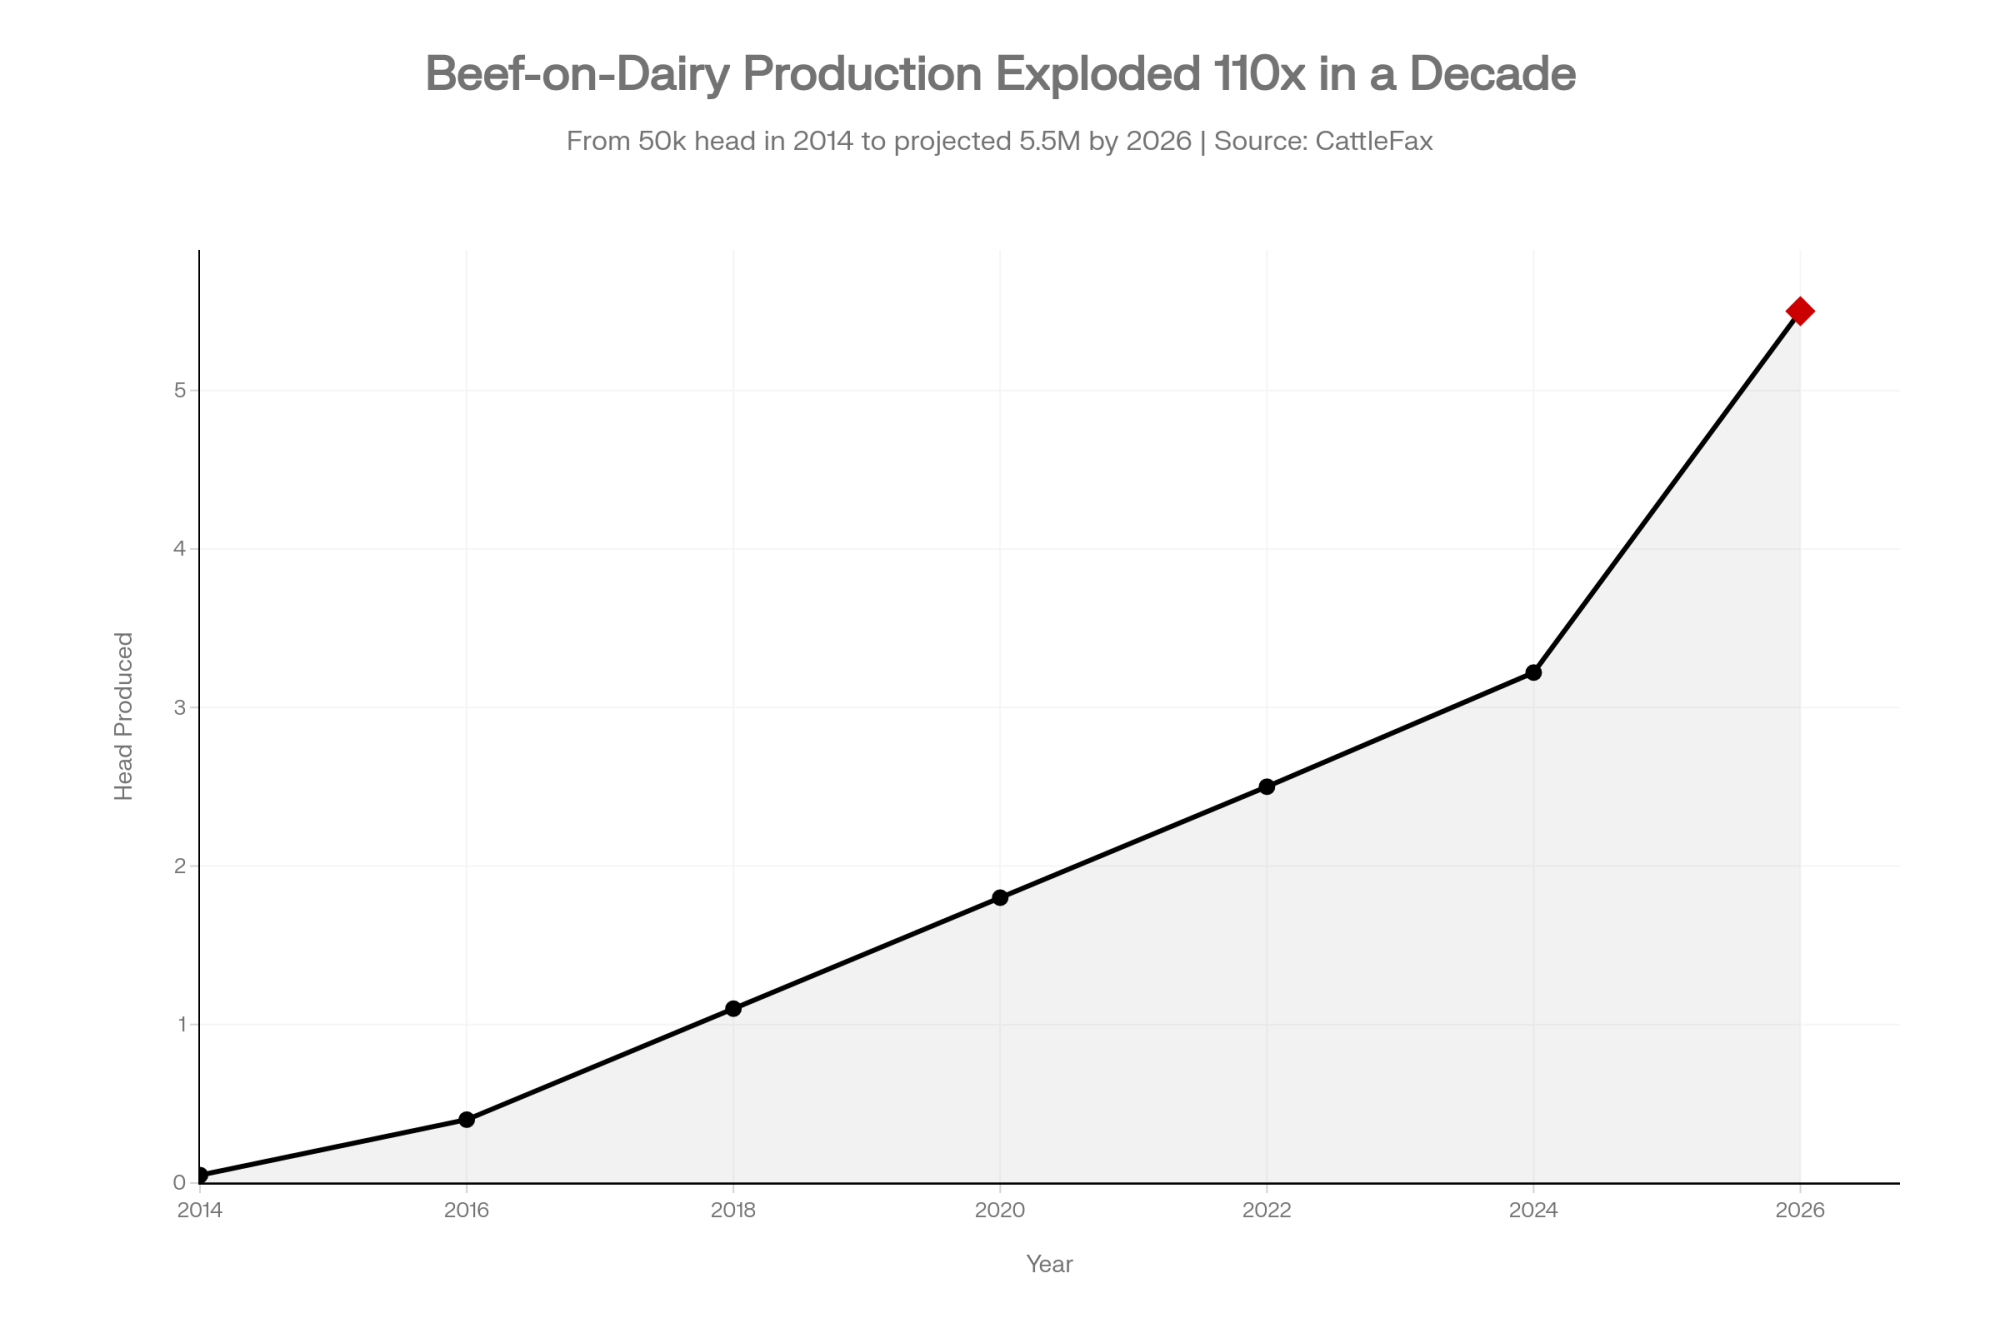
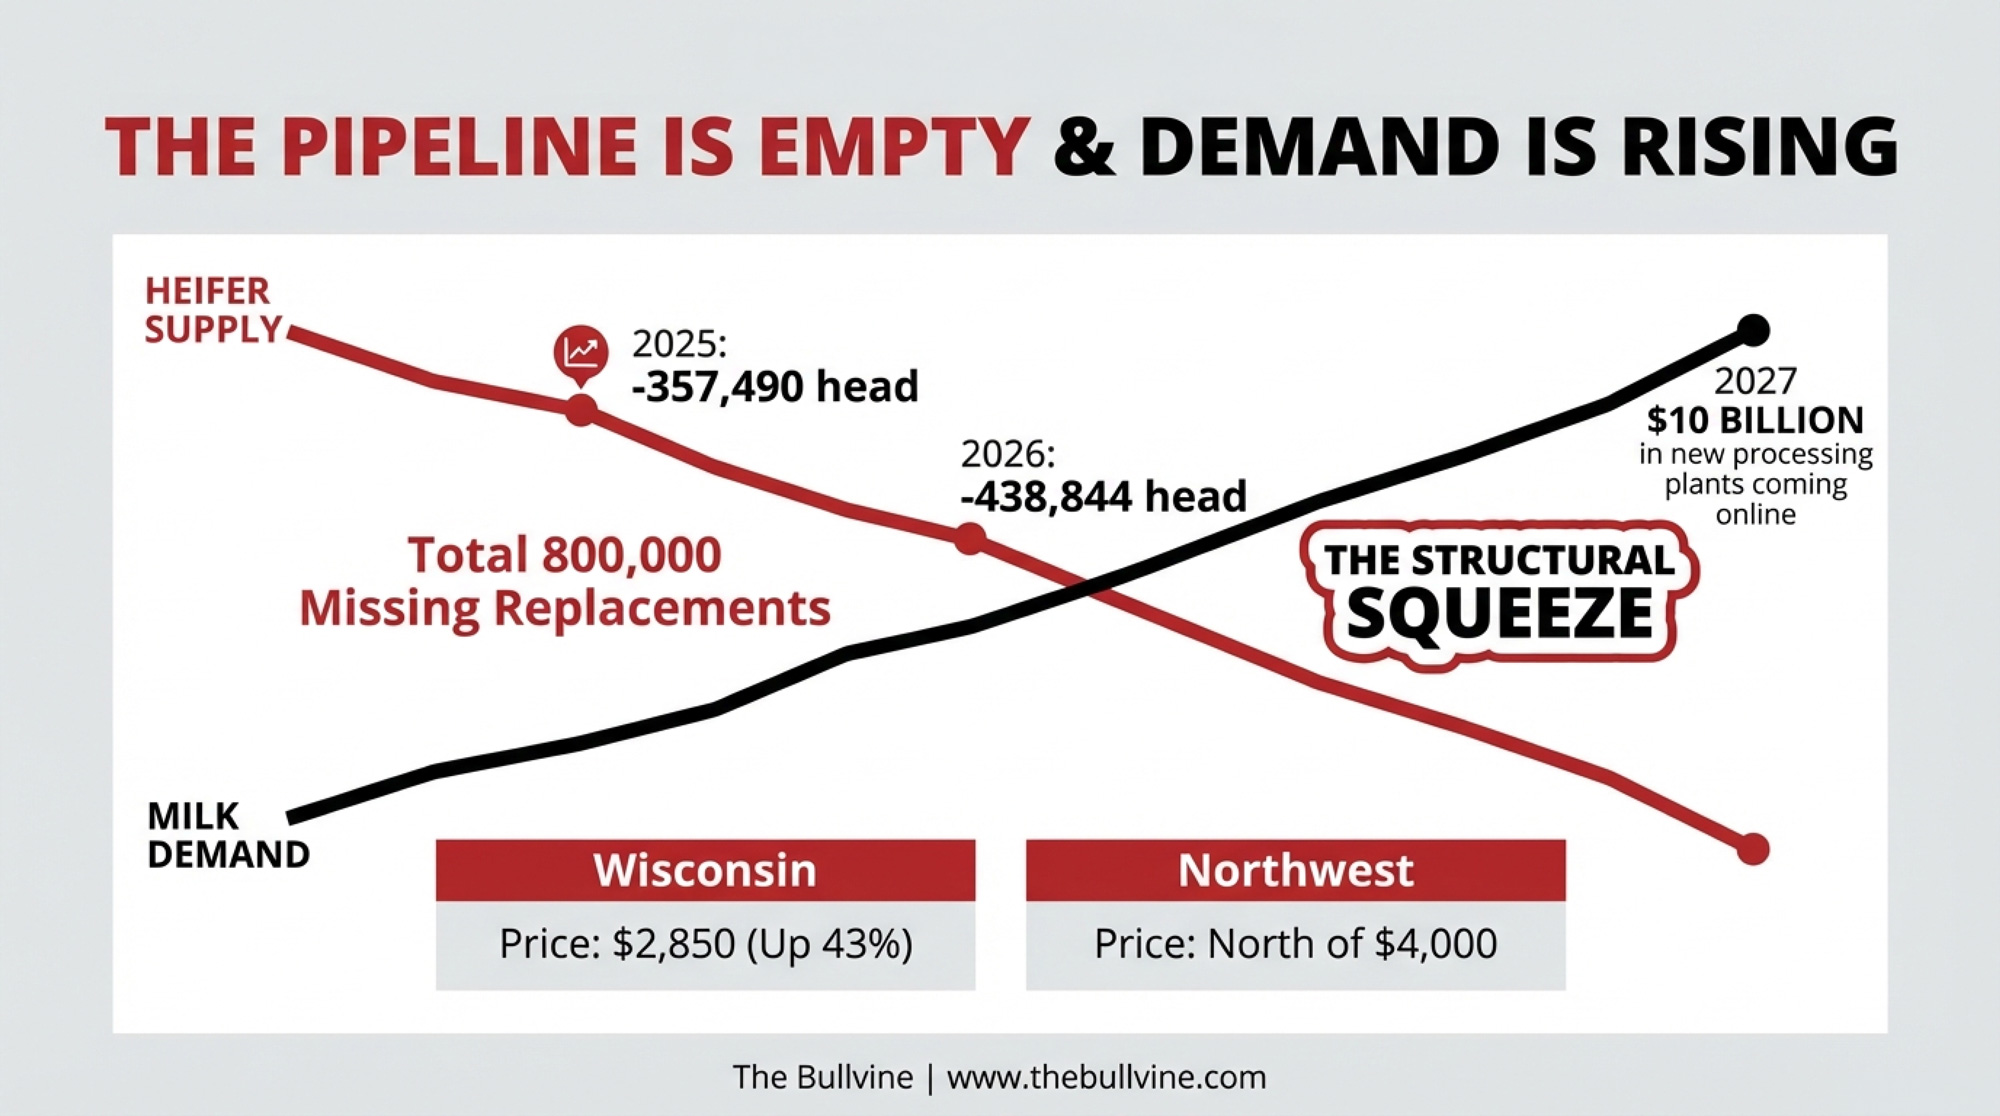

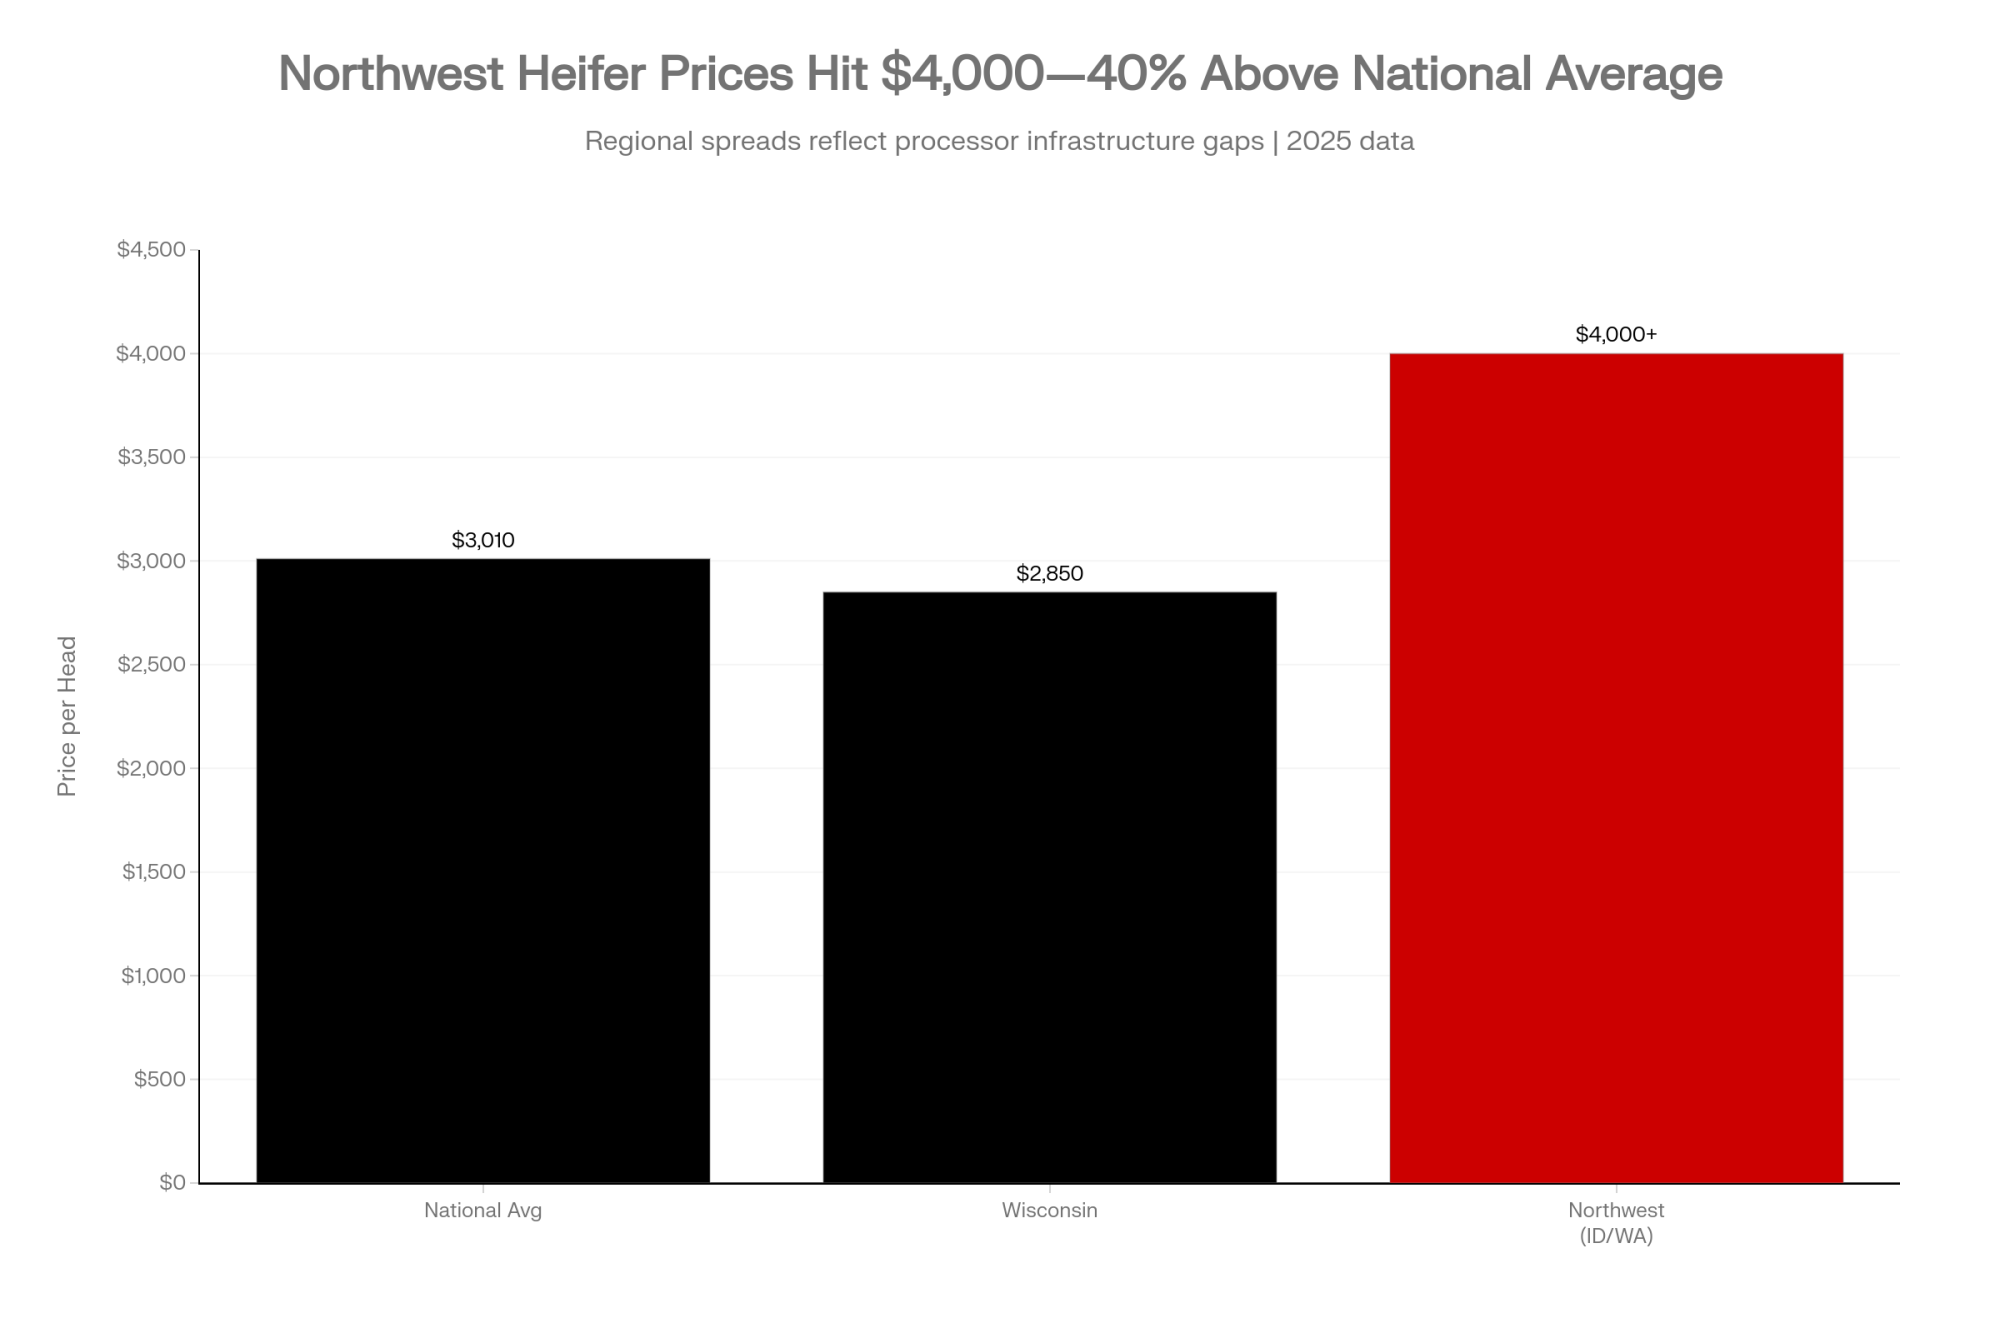
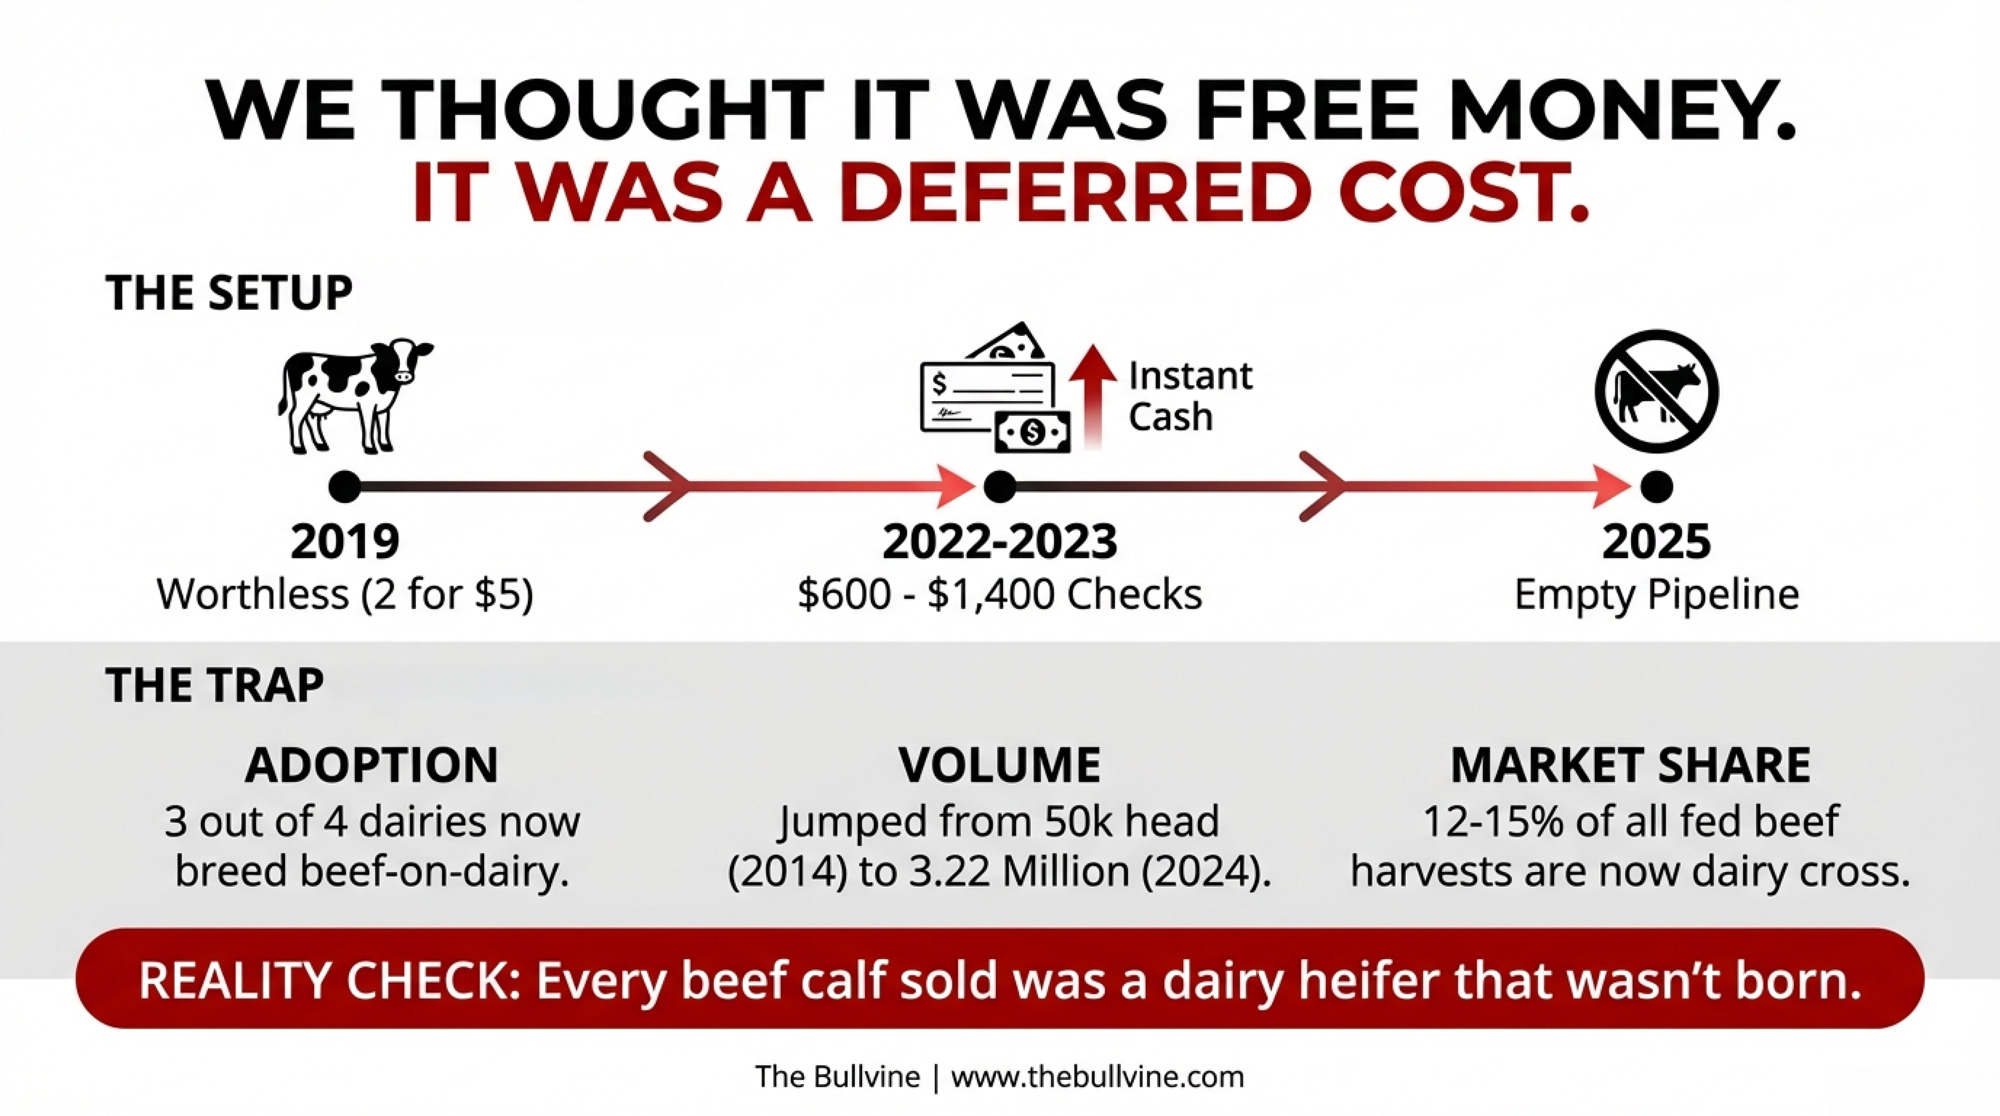
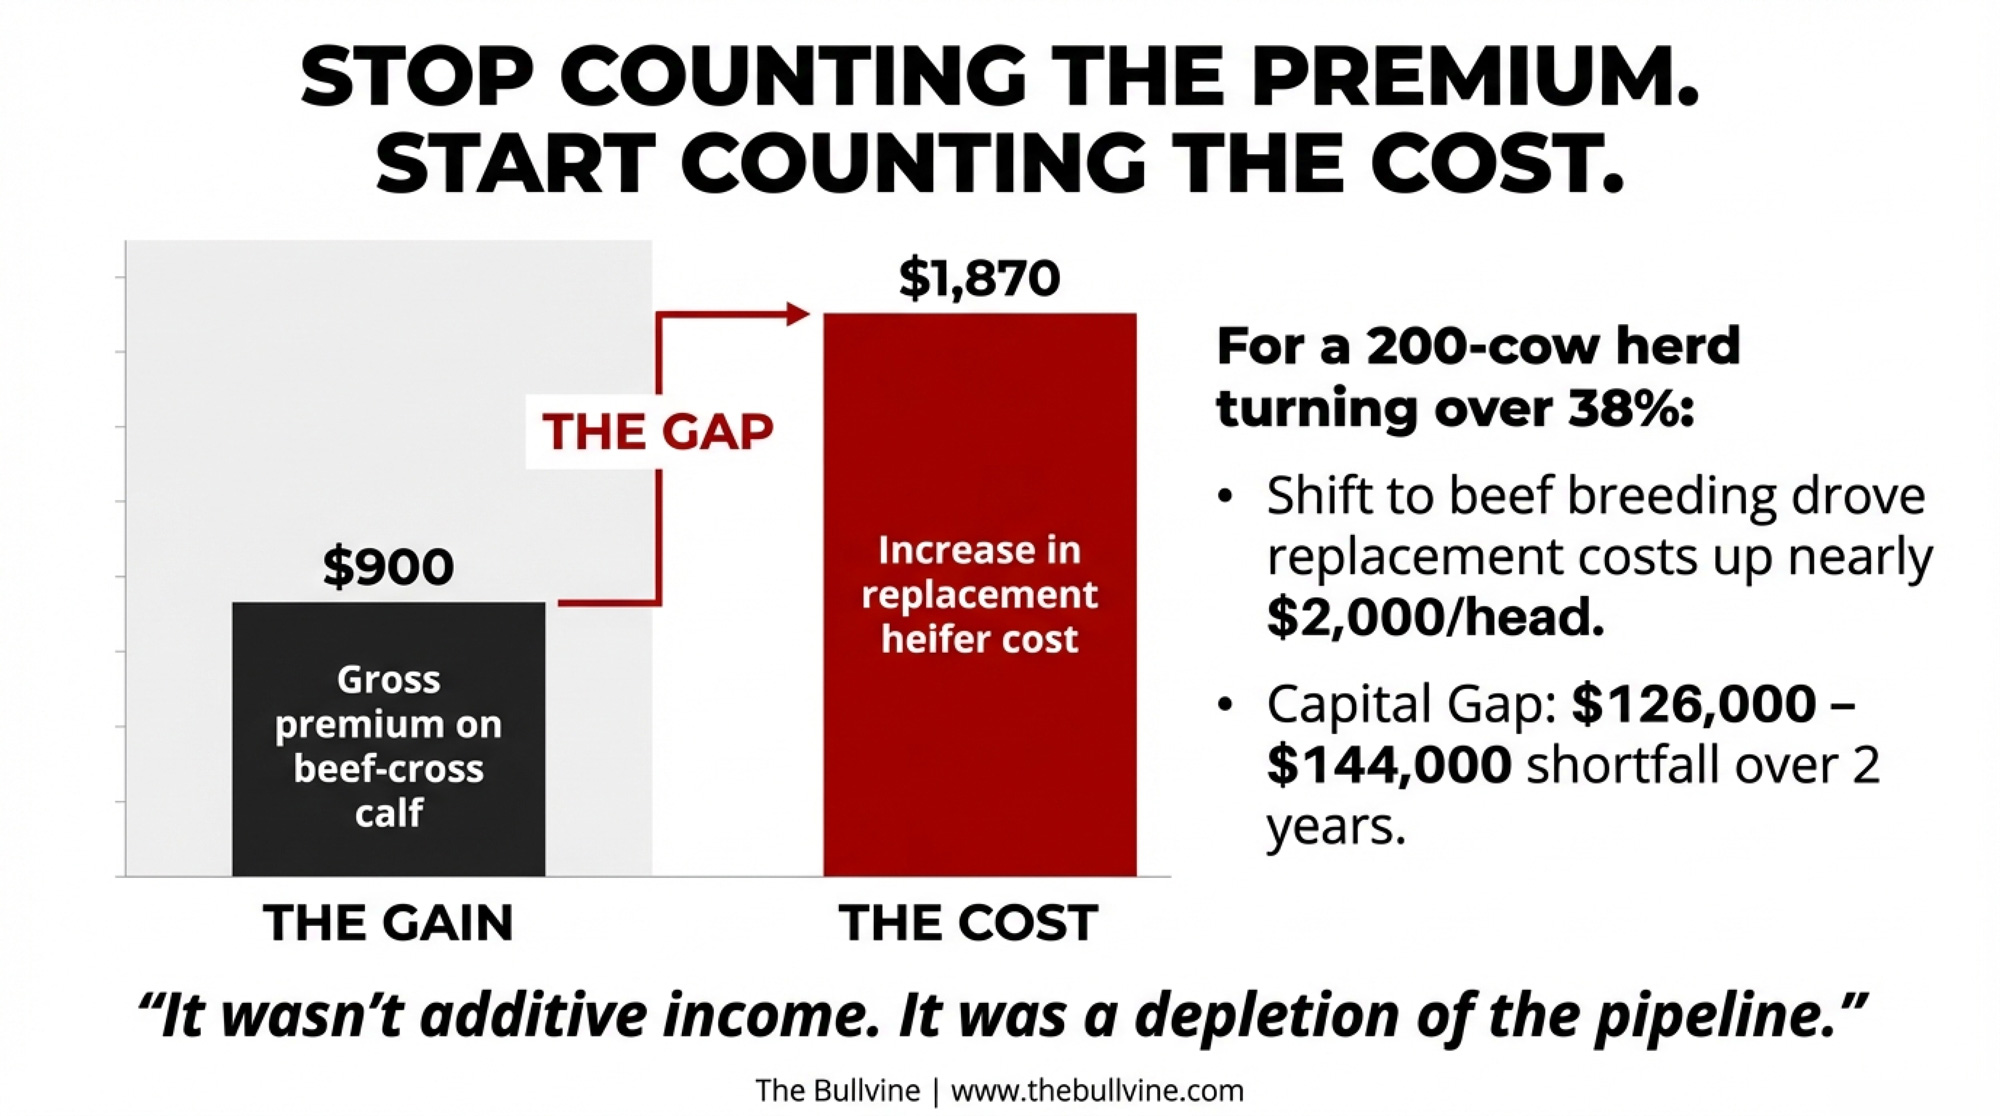
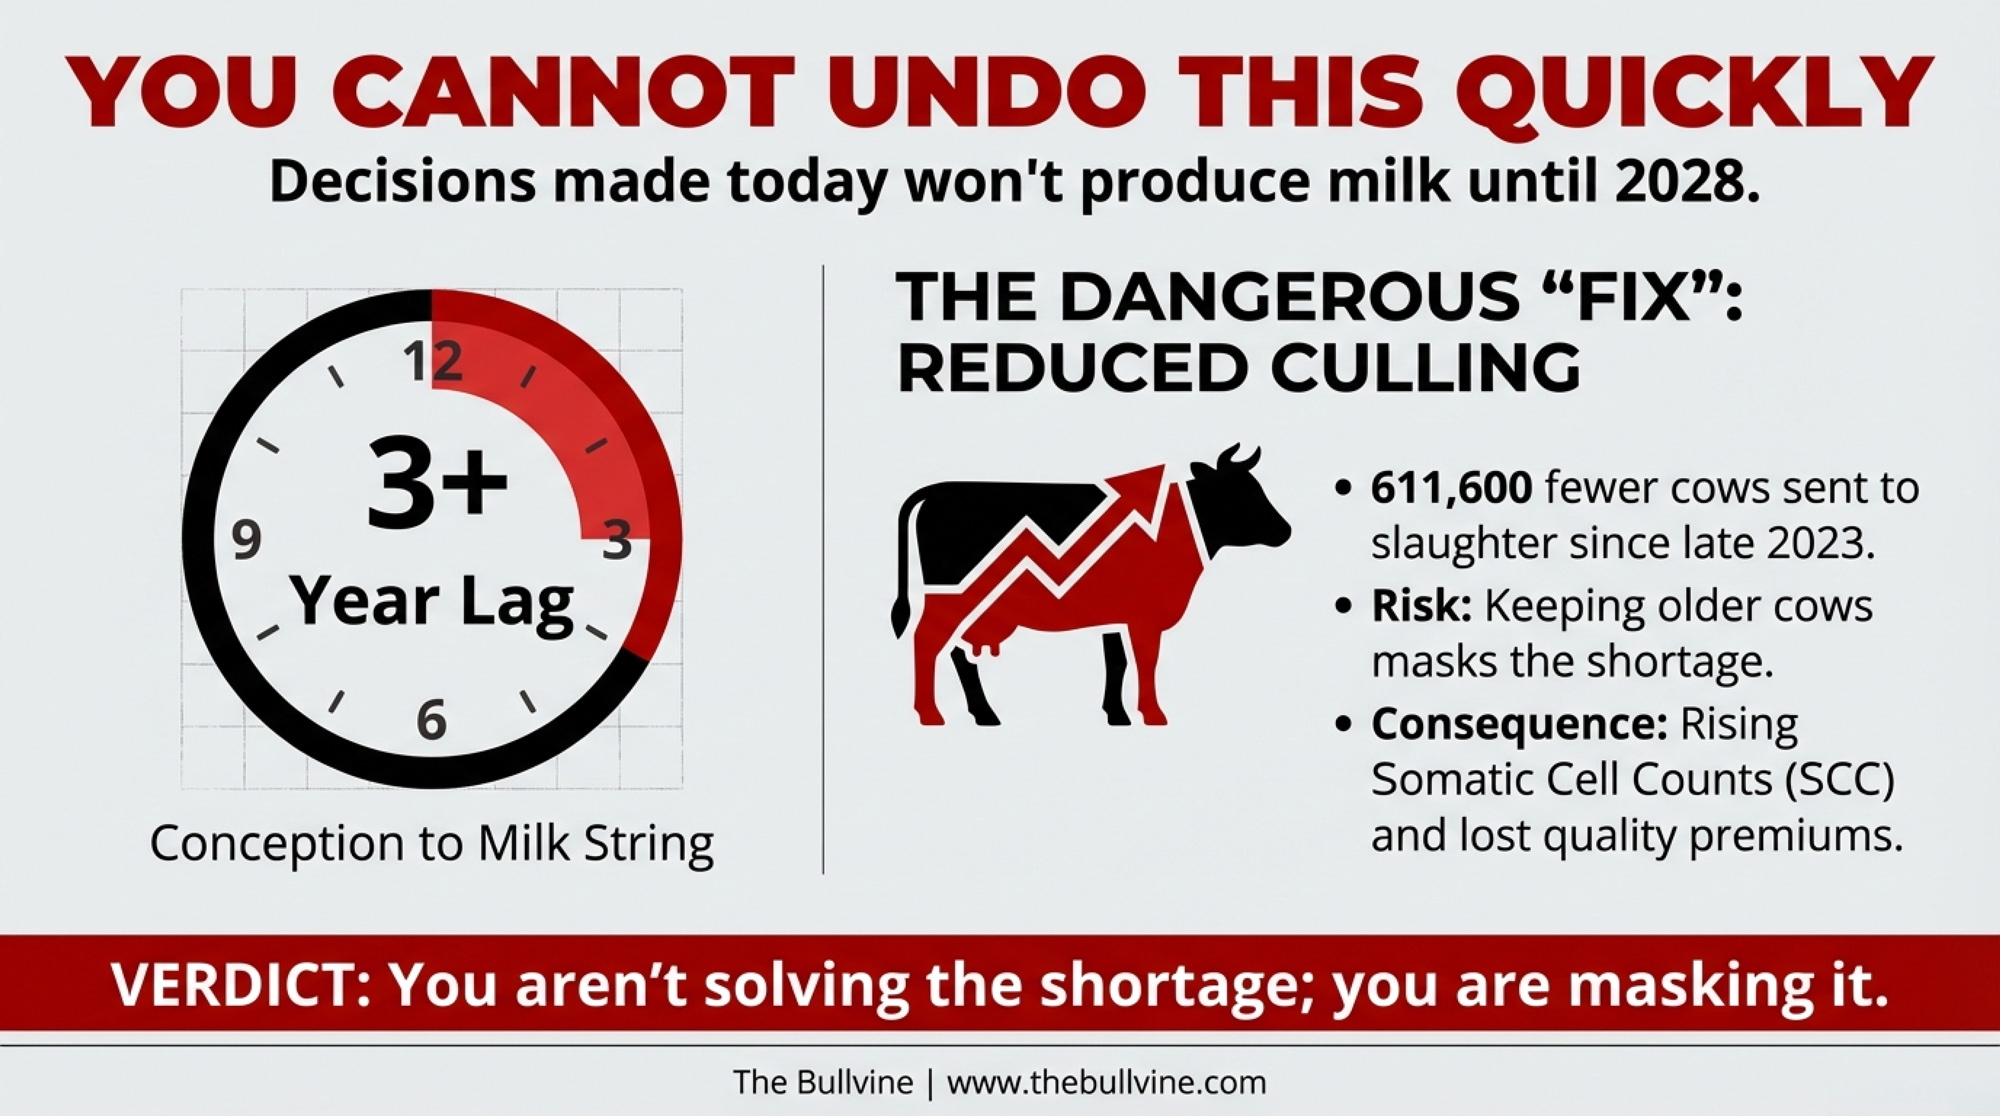
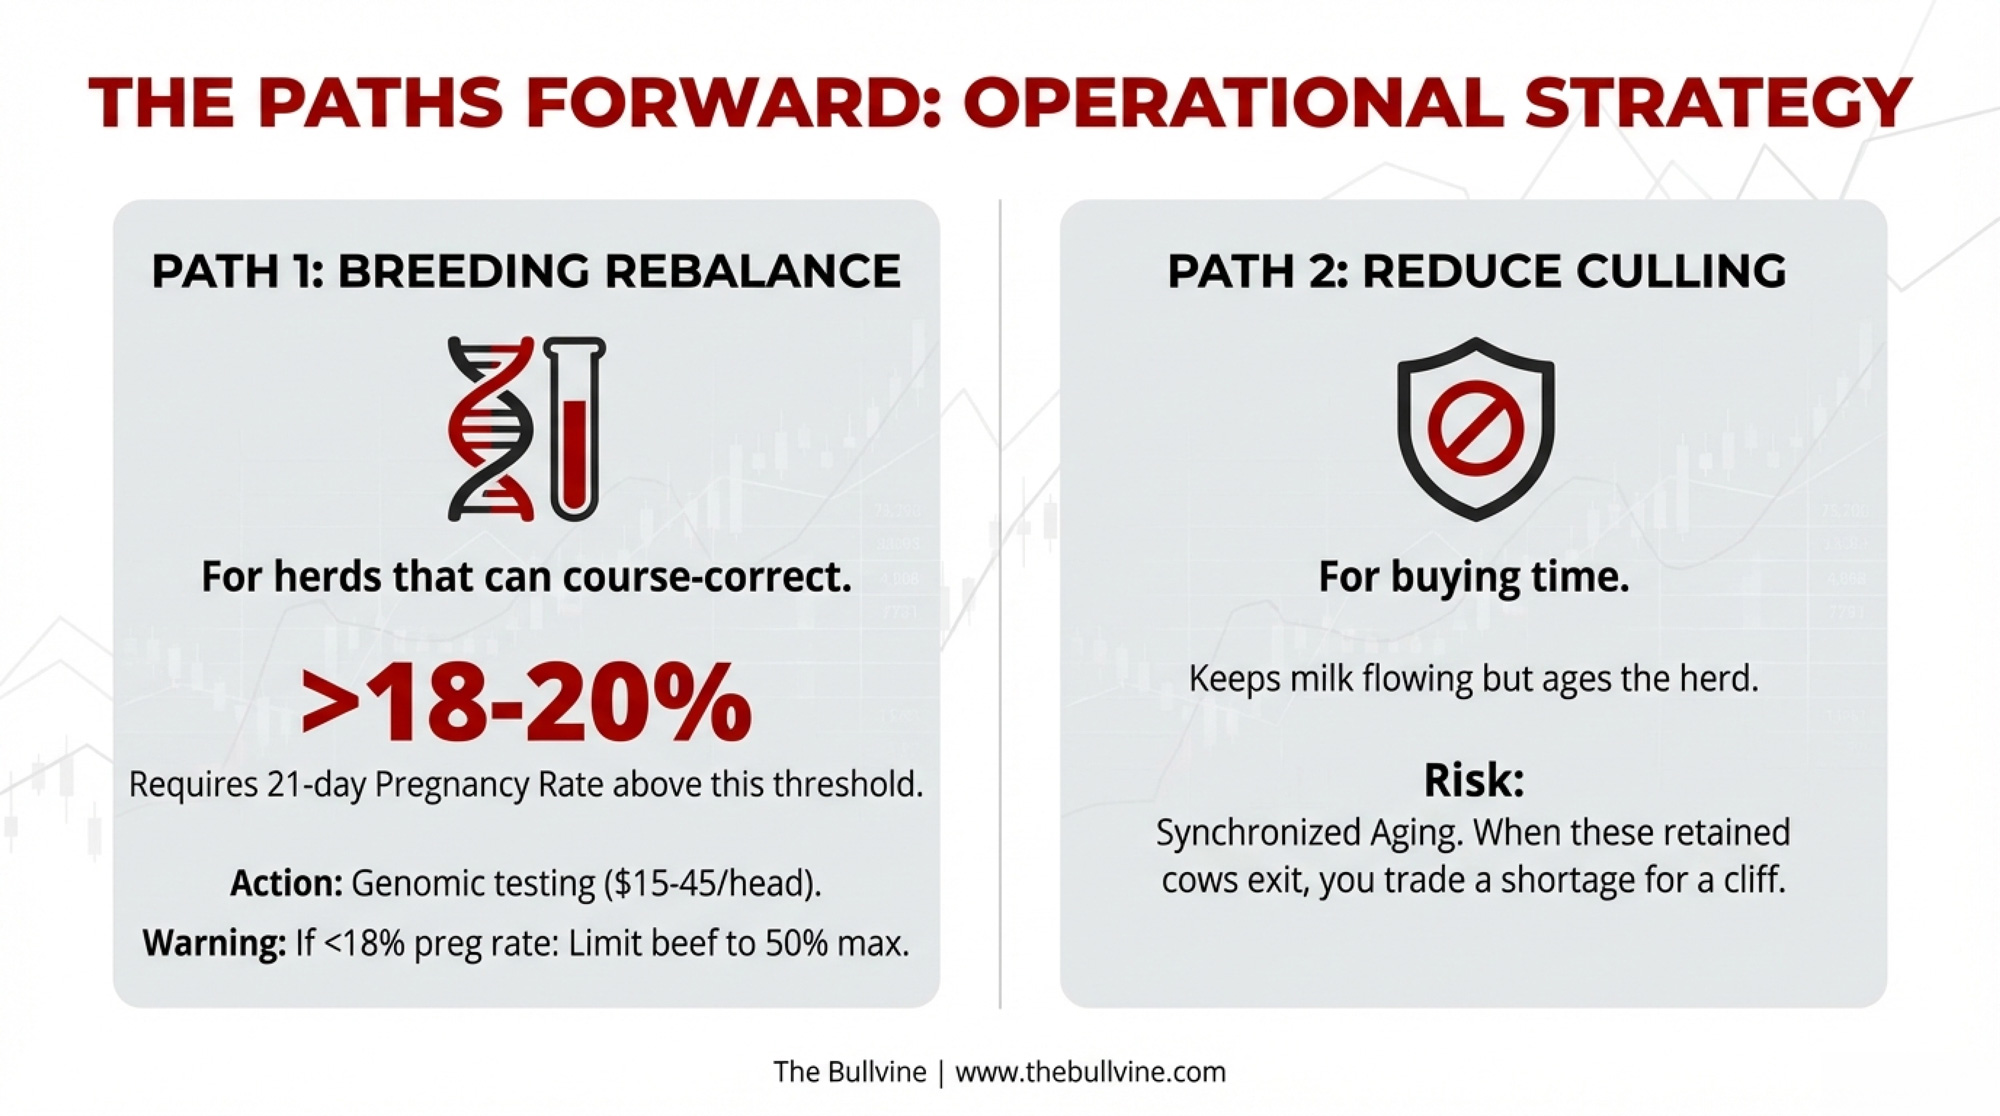
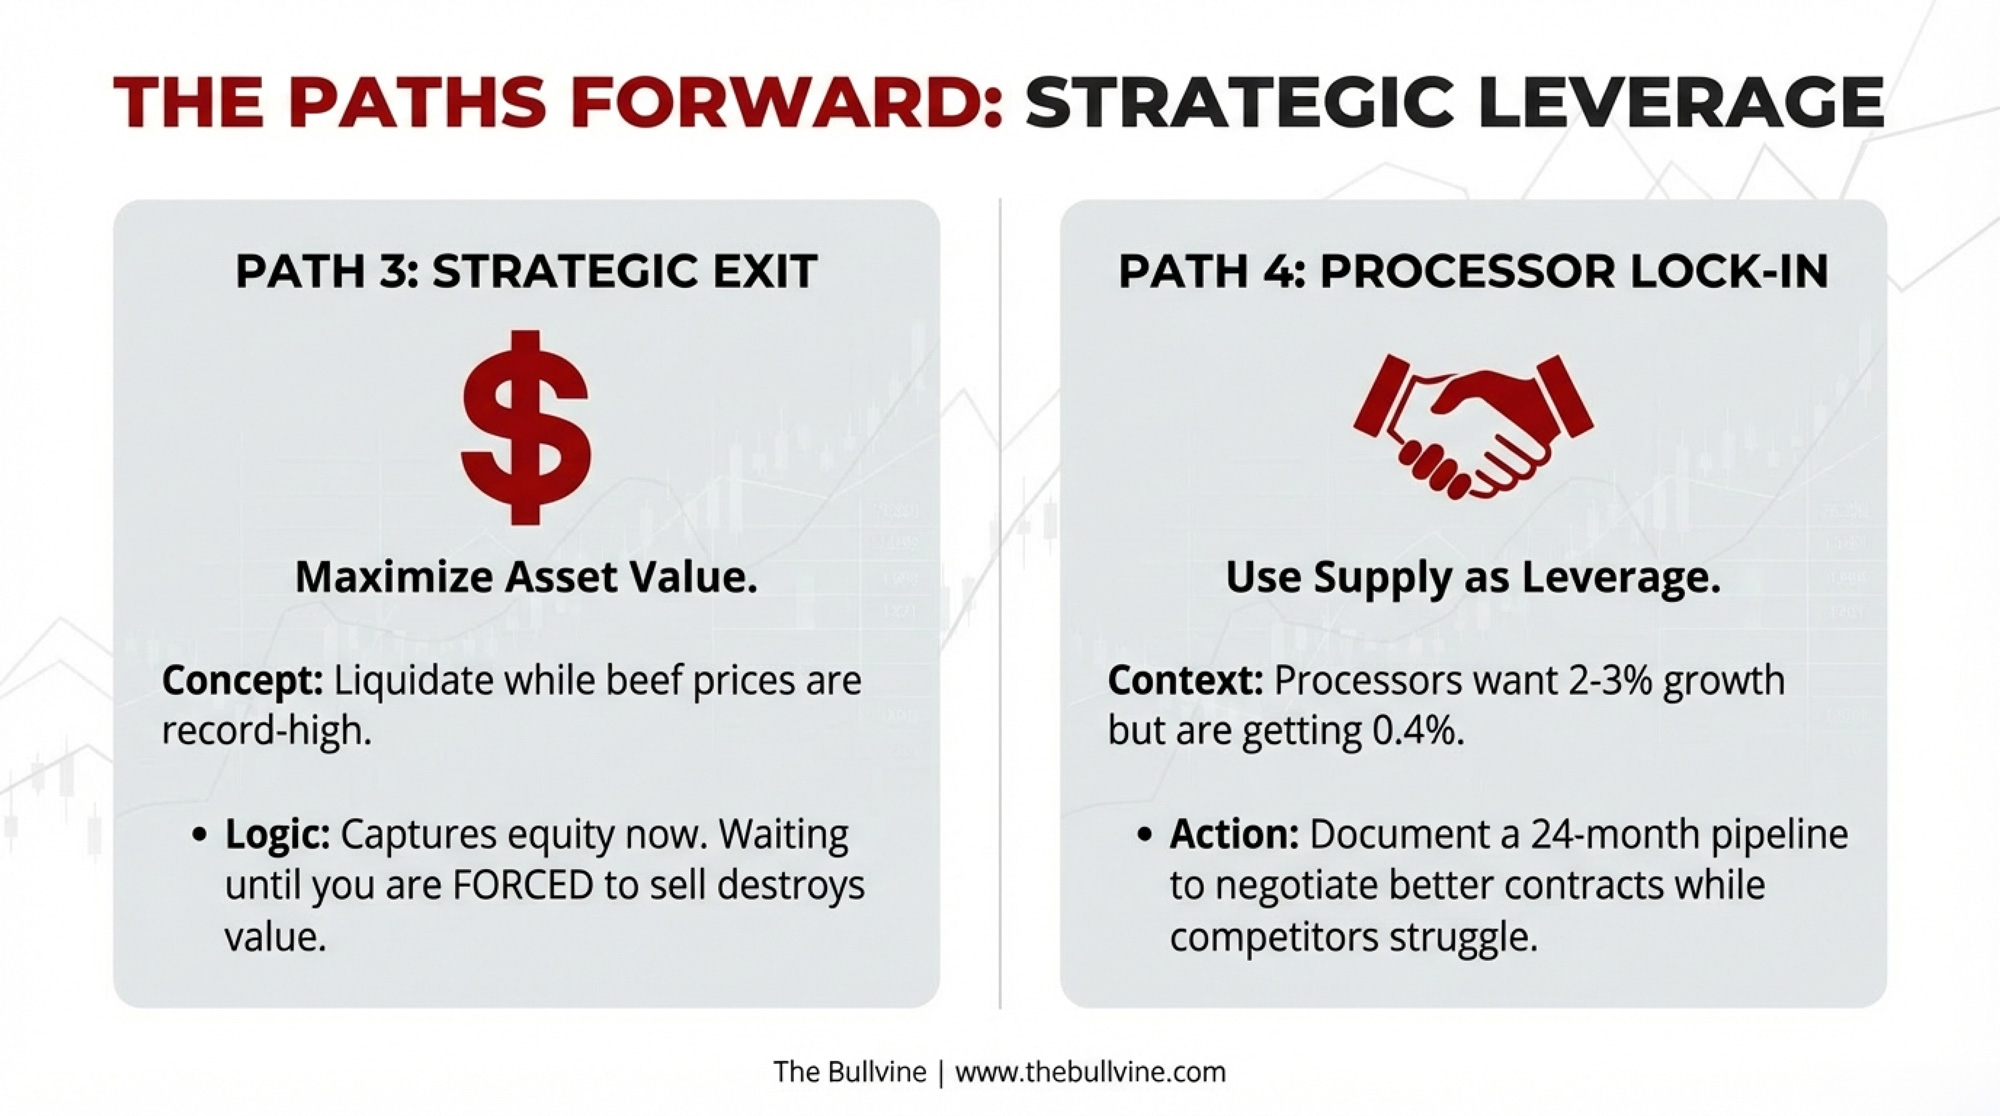
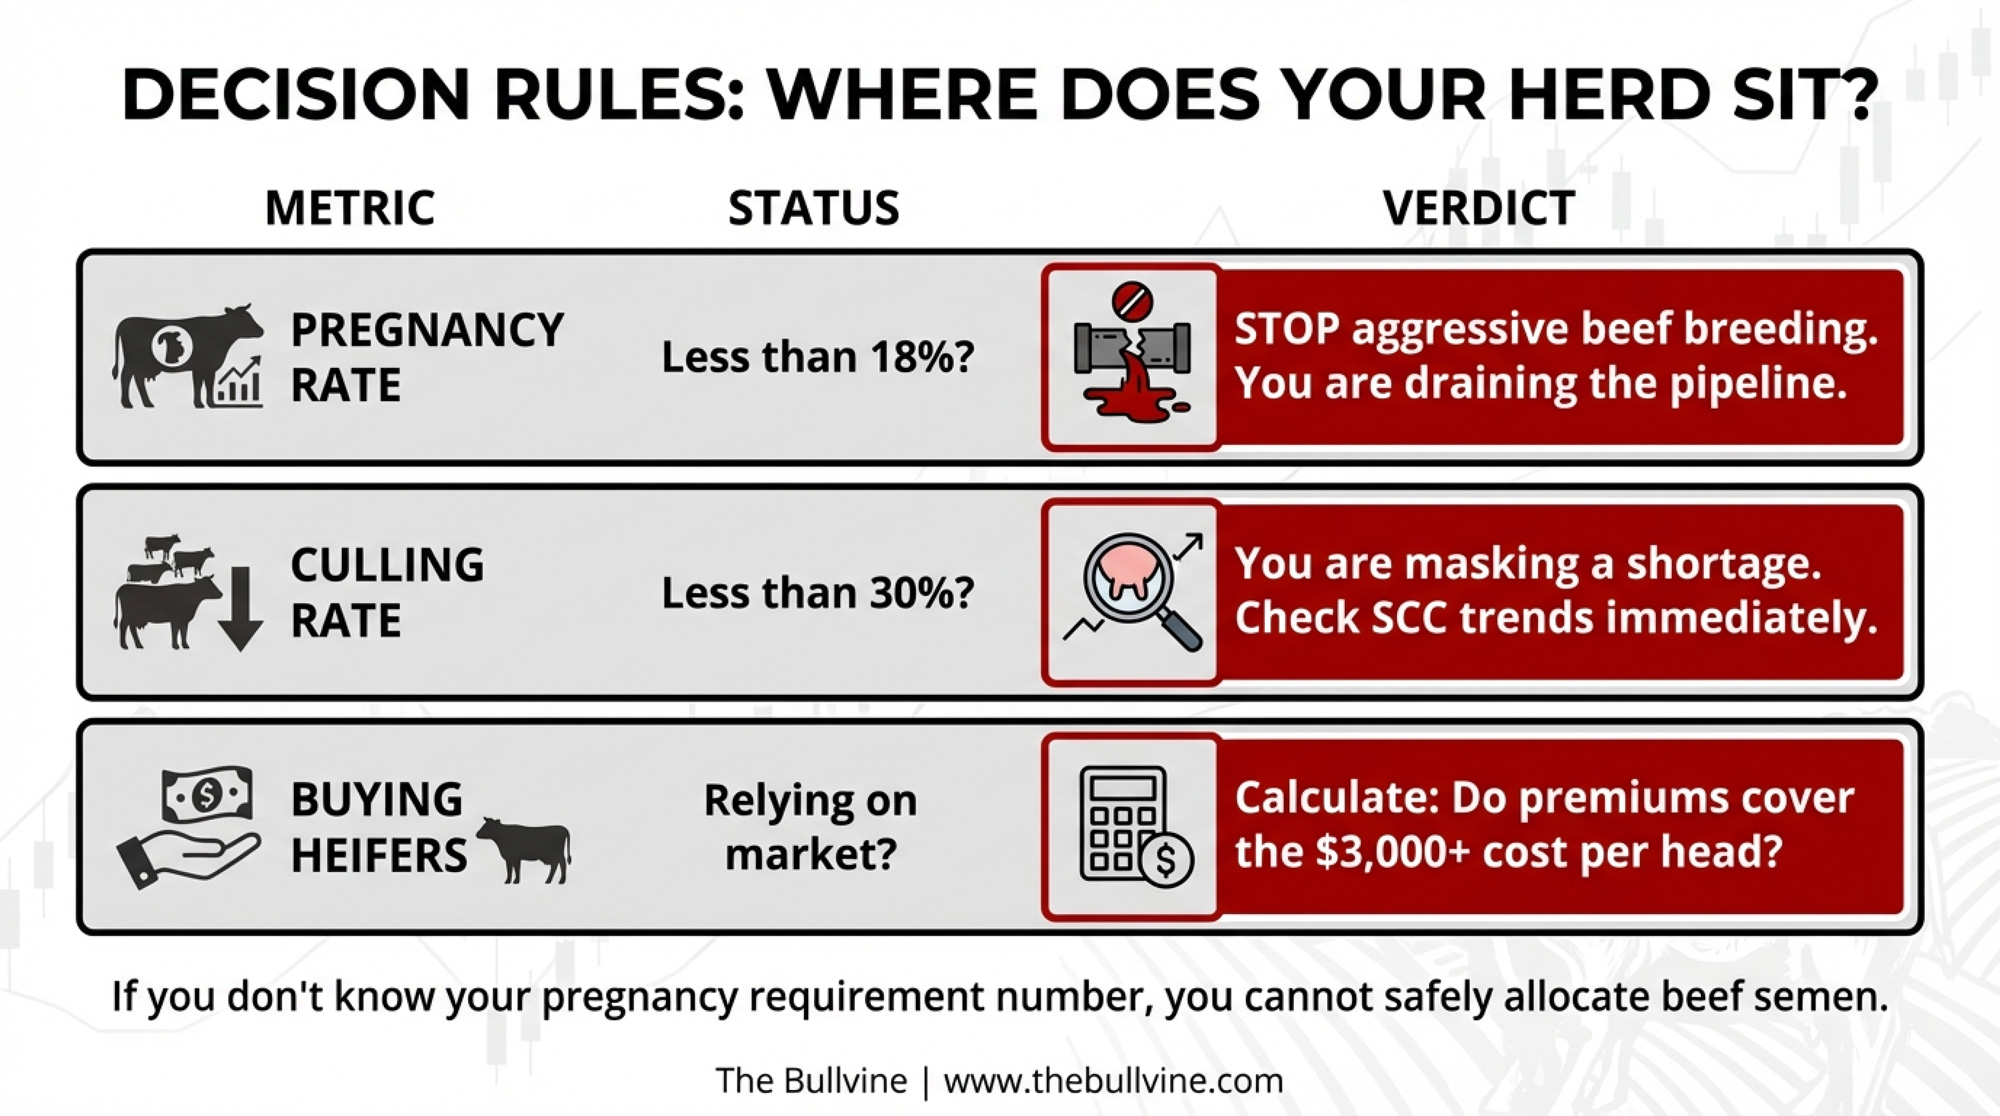
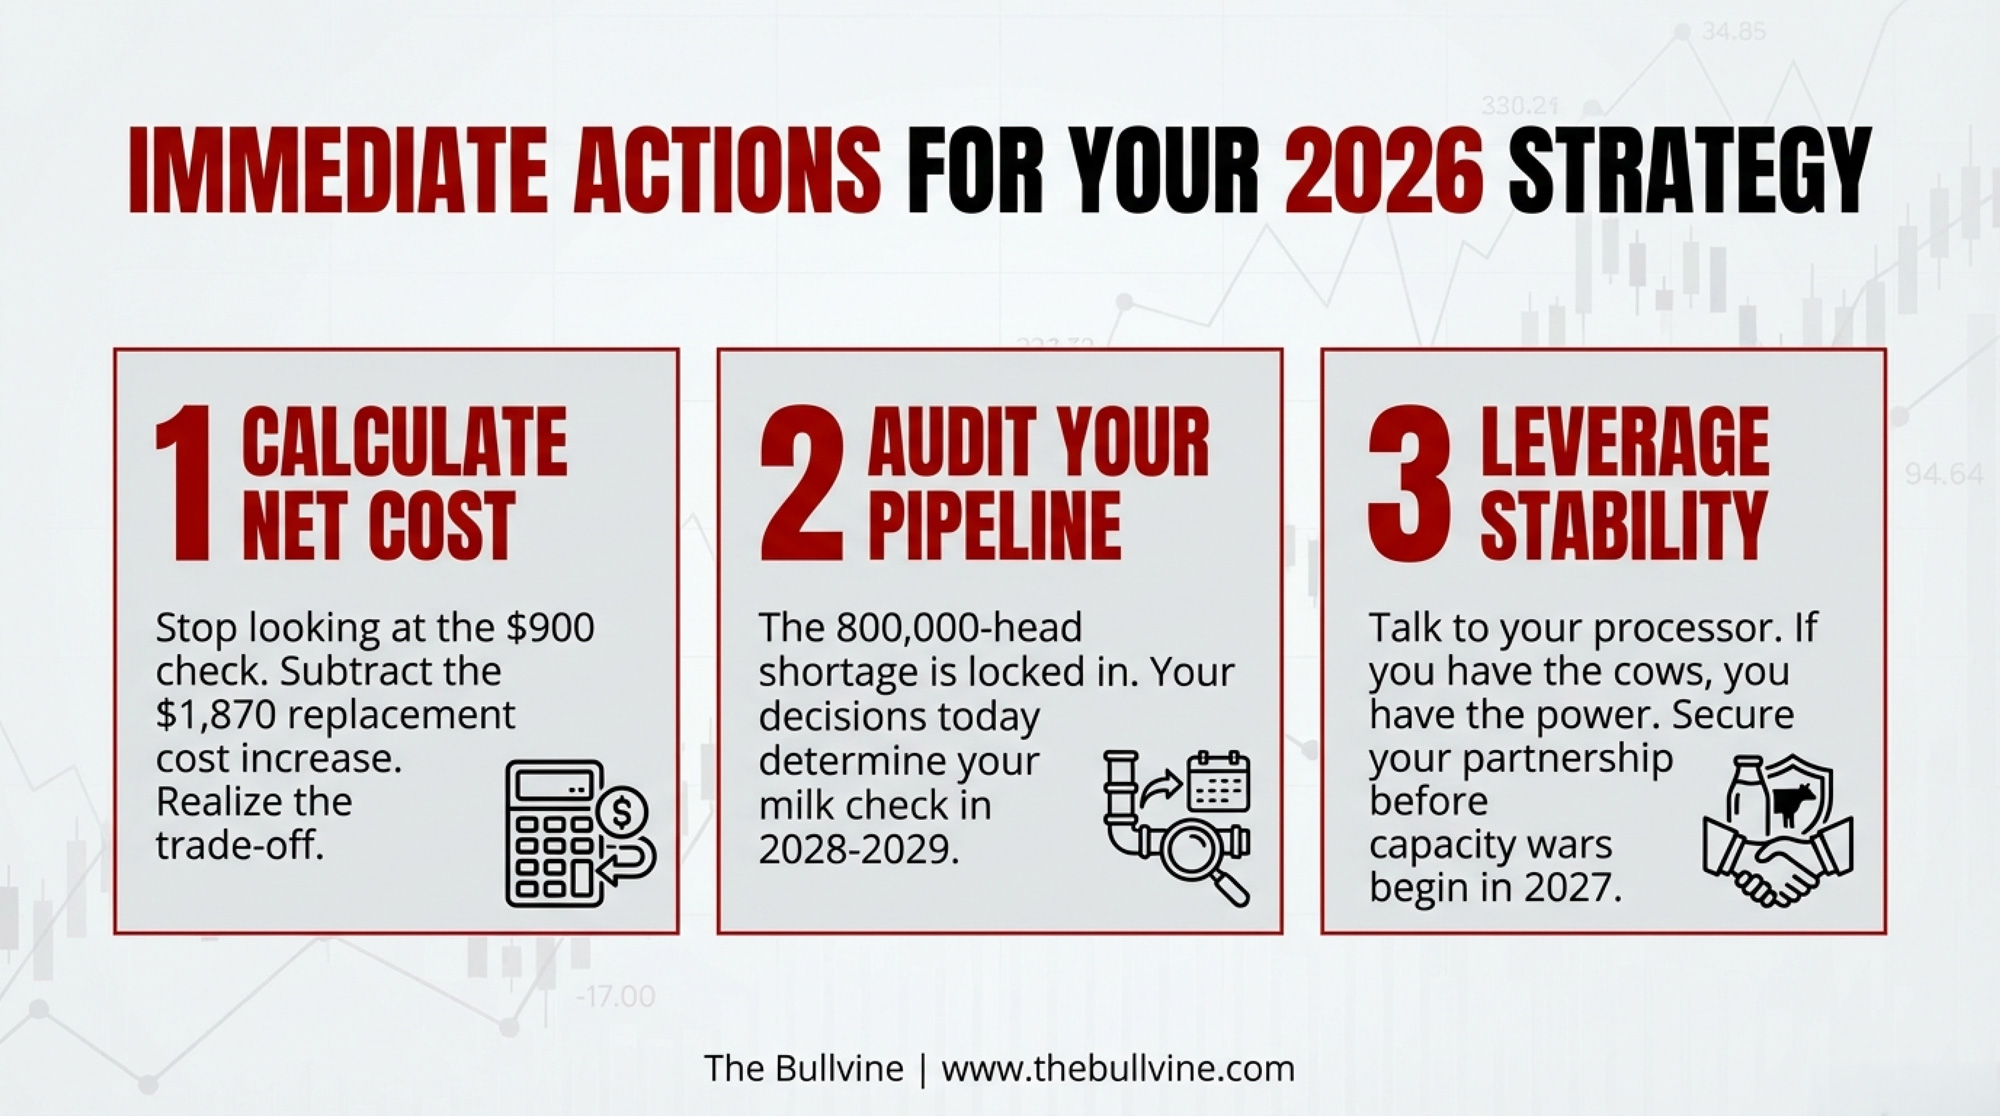
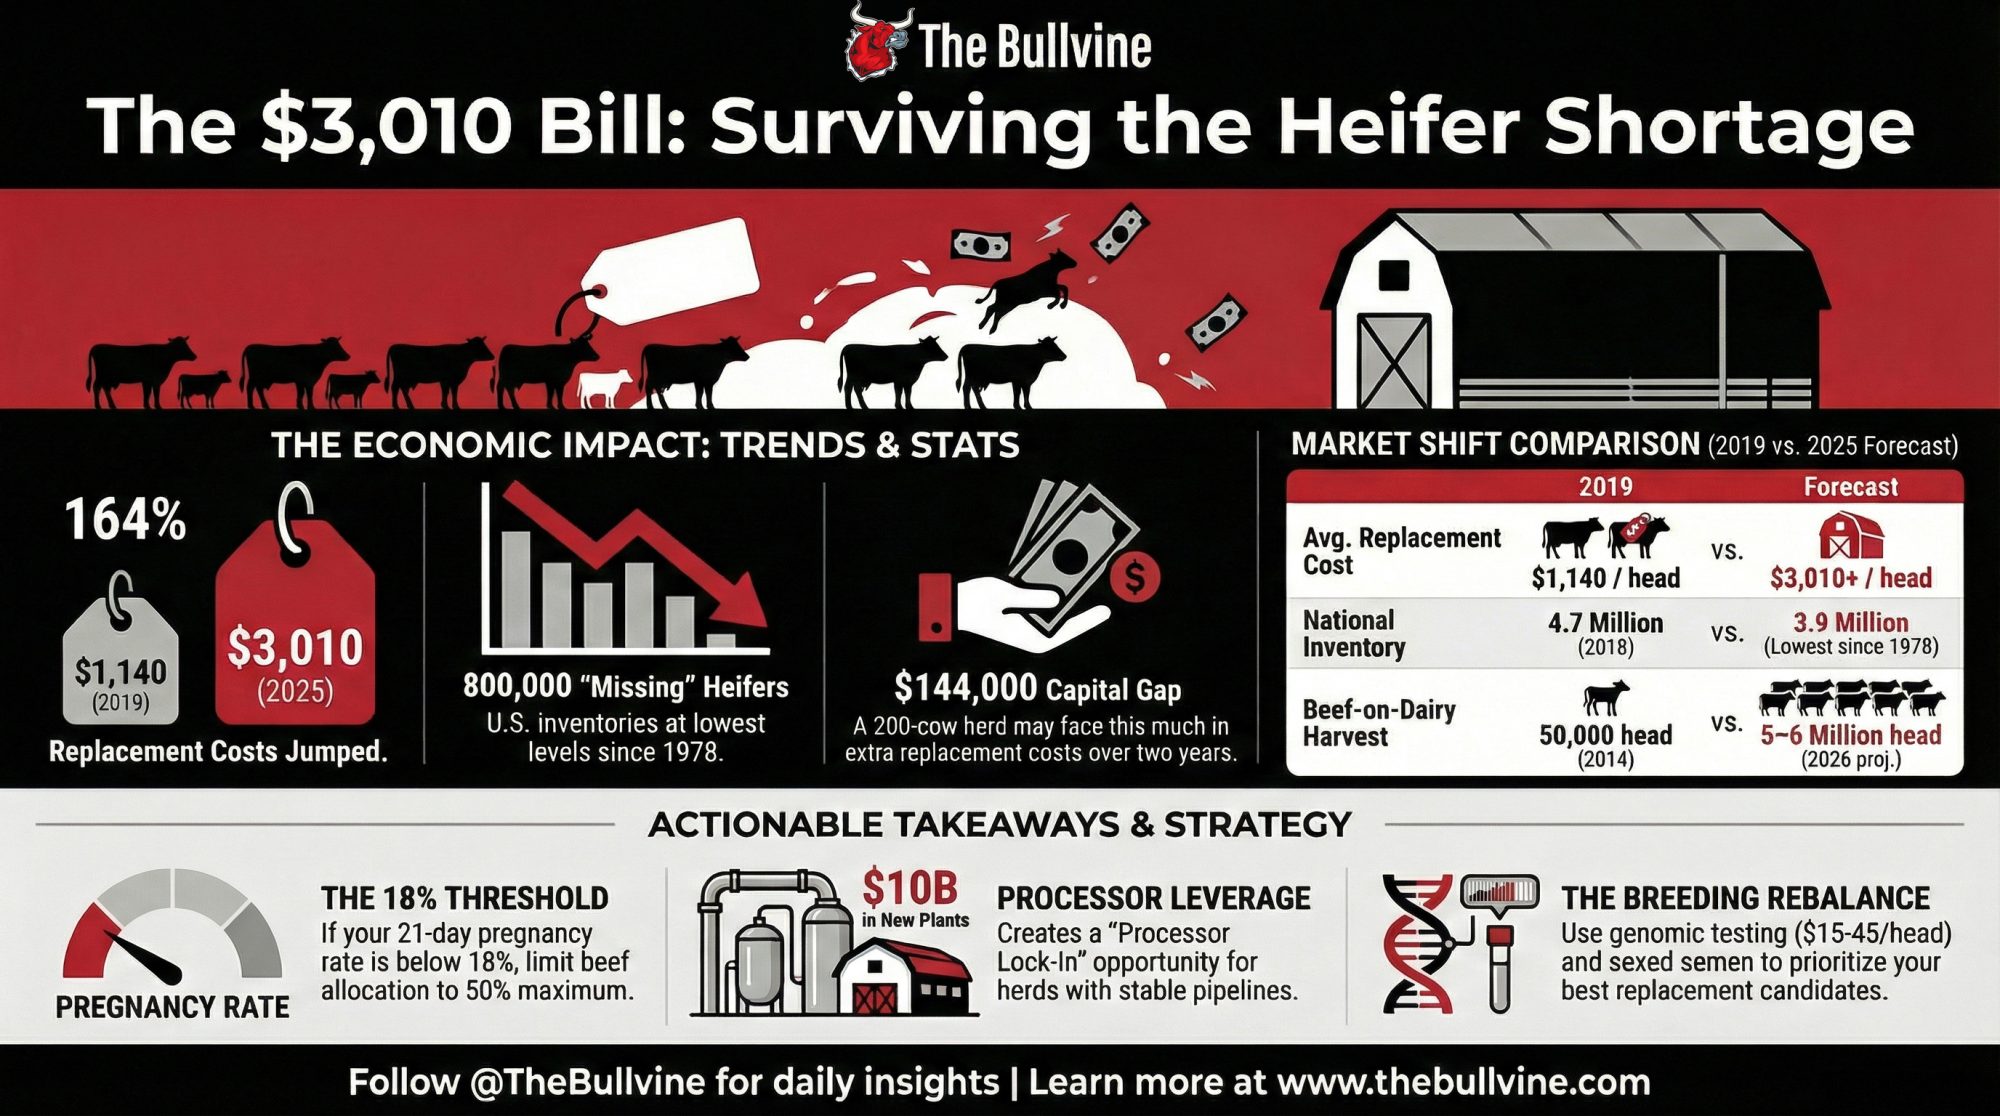
 The Sunday Read Dairy Professionals Don’t Skip.
 The Sunday Read Dairy Professionals Don’t Skip.