Archive for US dairy industry trends

CME Dairy Market Report October 30, 2025: Today’s Historic Class Price Gap Is Creating $3,800 Monthly Winners and Losers

Two identical farms. One gets $17.81/cwt today. The other? $13.75. The ONLY difference: where their milk truck goes.

Executive Summary: Today’s dairy market delivered a brutal verdict: if your milk goes to cheese, you’re winning at $17.81/cwt – but if it’s heading to powder, you’re bleeding money at $13.75. This historic $4 gap means identical farms are now separated by $3,800 per 100 cows per month, and NDM’s collapse today (seven sellers, zero buyers) signals it’s getting worse. While cheese held firm above $1.82, powder crashed by 2.25 cents amid intensifying European competition and weakening global demand. Feed costs keep climbing – corn hit $4.35/bu, soybean meal $308/ton – squeezing everyone’s margins, but only cheese producers have the pricing power to survive. The industry’s geographic revolution accelerates as Texas adds 50,000 cows and builds massive new plants while California and Wisconsin struggle with regulations and aging infrastructure. Smart operators are locking in Q1 2026 Class III near $18 and making hard decisions about their future – because in this market, standing still means falling behind.

Dairy Class Price Gap

Let me tell you what’s happening in the dairy markets today —and, more importantly, what it means for your next milk check. We saw cheese prices hold steady above $1.82, which is good news if you’re shipping to a cheese plant. But if your milk’s going into powder? That 2.25-cent drop in NDM to $1.14 is going to sting. This growing divergence between Class III and Class IV prices — now nearly $4 per hundredweight — is creating clear winners and losers depending on where your tanker is unloaded.

Looking at today’s trading, what’s interesting here is the complete absence of action in cheese despite decent bid support. No trades in blocks or barrels isn’t unusual after a week-long rally, but the seven offers stacked up against zero bids in NDM? That tells you everything about where sentiment is heading for powder markets.

Two Identical Farms, One Brutal Verdict: The $3,800 monthly gap reveals how processor relationships now matter more than production efficiency—cheese-bound operations at $17.81/cwt are winning while powder-plant farmers bleed at $13.75/cwt.

Today’s Price Action — What These Numbers Mean for Your Farm

ProductPriceToday’s MoveWeekly TrendReal Impact on Your Farm
Cheese Blocks$1.8250/lbUnchangedUp 1.4%Holding firm above $1.82 keeps Class III near $17.80
Cheese Barrels$1.8200/lbUnchangedUp 1.4%Steady demand supporting the cheese complex strength
Butter$1.5725/lb+1.75¢Down 0.1%Small bounce won’t offset NDM weakness for Class IV
NDM Grade A$1.1400/lb-2.25¢Up 3.4%Sharp drop pulls November Class IV below $14
Dry Whey$0.7000/lbUnchangedUp 3.2%Steady support for Class III other solids value
Market Sentiment Splits Violently: Cheese’s steady climb to $1.83 contrasts with NDM’s freefall to $1.14—today’s seven sellers against zero buyers signals powder markets haven’t found bottom yet, widening the Class III/IV chasm to historic levels.

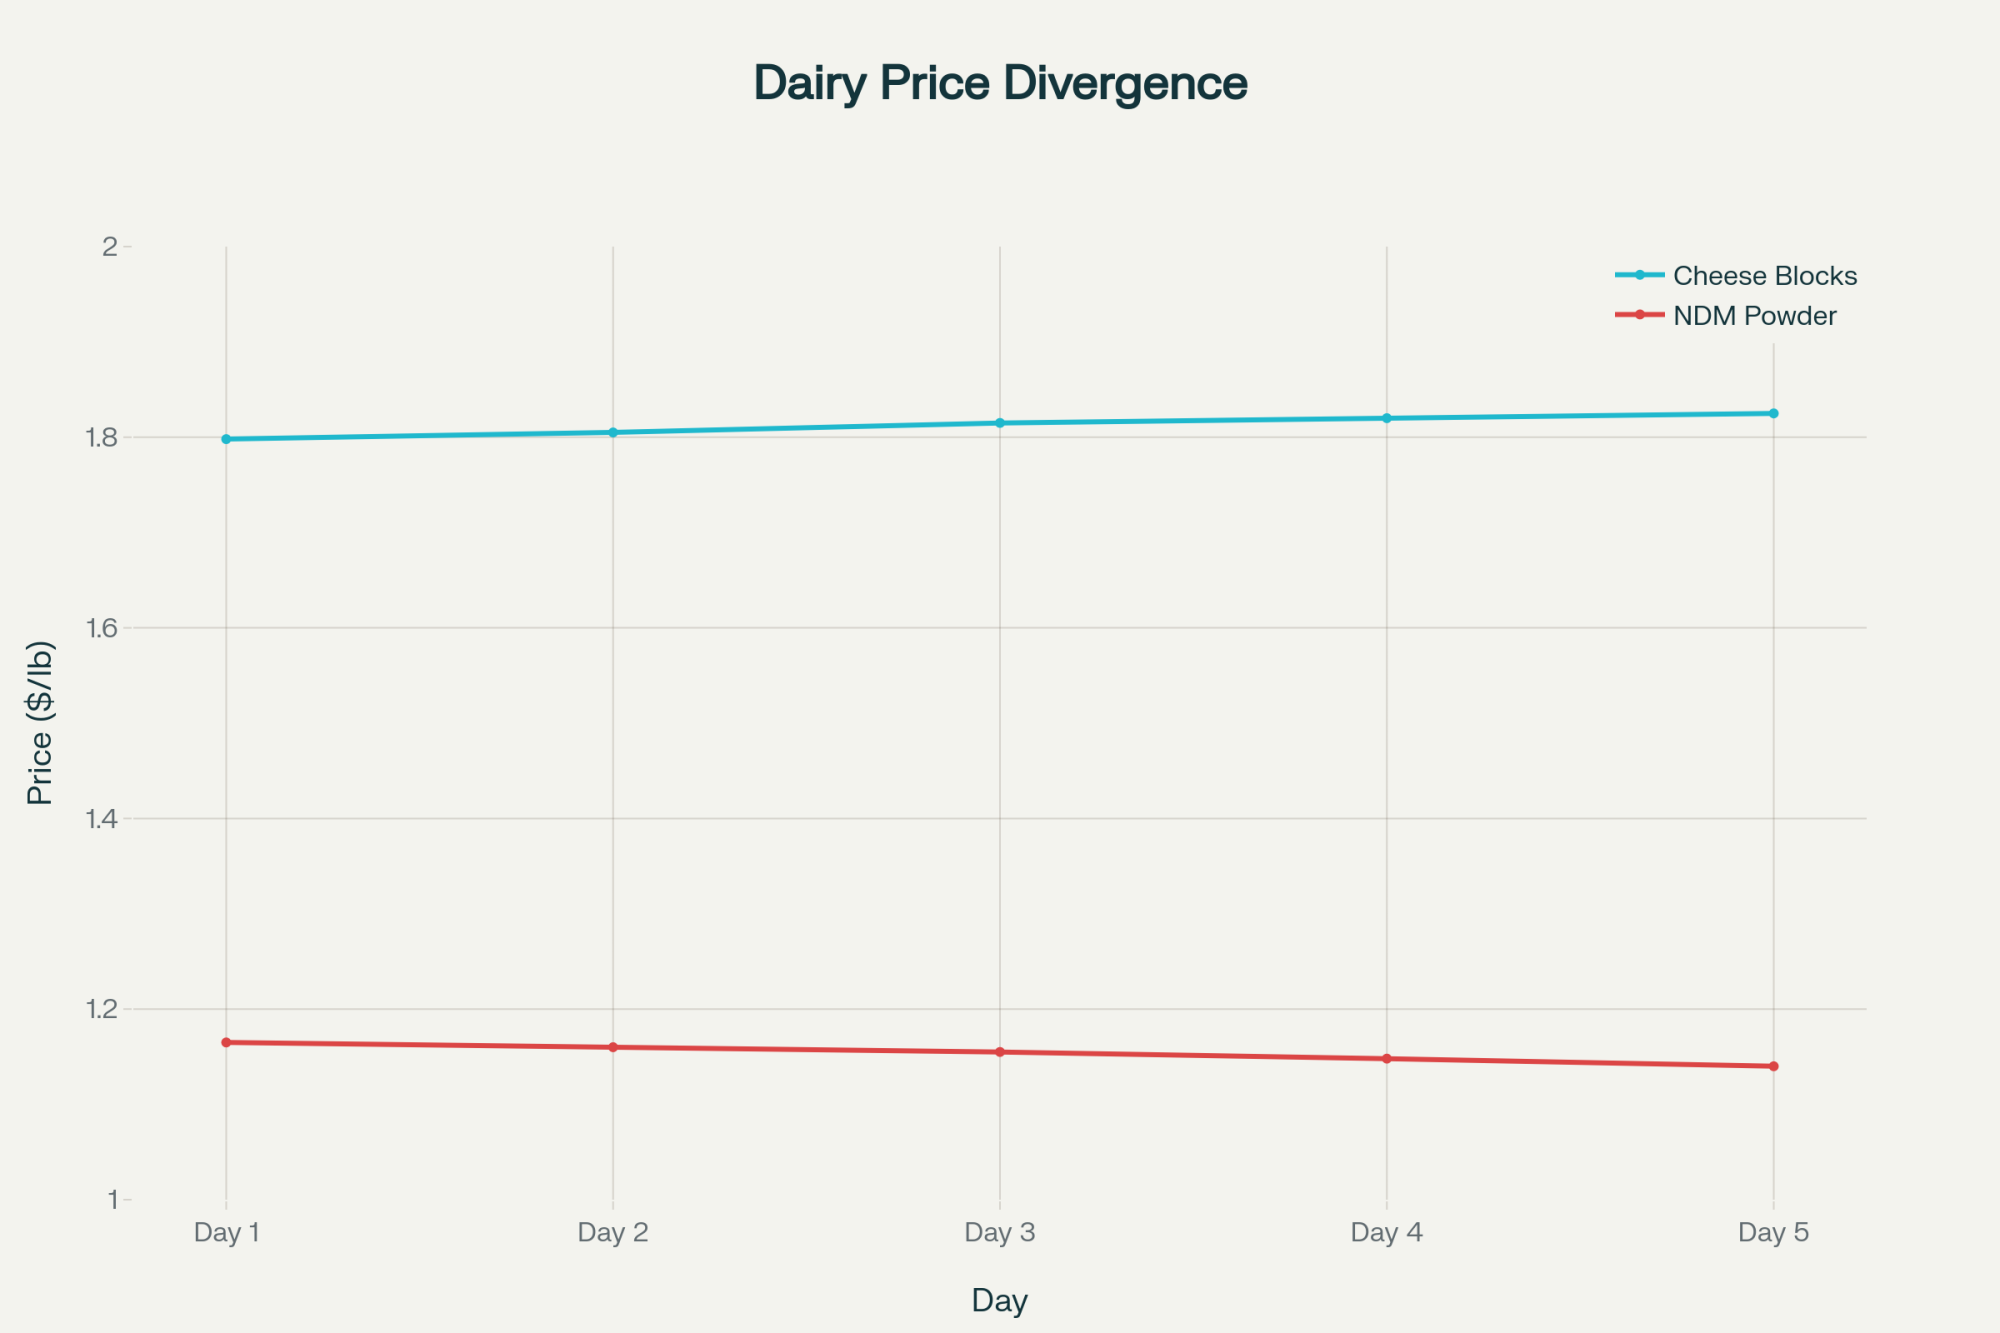
The cheese market’s taking a breather after climbing steadily all week. With blocks and barrels both parked above $1.82, processors seem content with their inventory levels heading into the November holiday demand. That’s actually constructive for maintaining these price levels.

But here’s where it gets concerning — NDM dropping 2.25 cents on heavy offers and absolutely no buying interest. When you see seven sellers trying to unload product with no takers, that’s a market looking for a floor. This weakness directly hits anyone shipping to butter-powder plants, pulling that November Class IV price down toward $14 or potentially lower.

From the Trading Floor — Reading Between the Lines

Bid/Ask Dynamics Tell the Story

The order book today painted two very different pictures. Cheese showed balance with just two bids and two offers on blocks, nothing on barrels — that’s a market comfortable with current levels. But NDM? Zero bids against seven offers is about as bearish as it gets. As one Chicago floor trader told me this morning, “Nobody wants to catch a falling knife in powder right now.”

Trading volumes stayed extremely light — only two loads of butter actually changed hands. The lack of cheese trades doesn’t worry me; it’s normal consolidation. But NDM’s inability to attract even a single bid at progressively lower prices? That suggests we haven’t found the bottom yet.

Volume Patterns and Market Mechanics

What caught my attention was the timing of those NDM offers. They started appearing early and kept building throughout the session, with sellers growing increasingly anxious as the day wore on. The price had to drop 2.25 cents just to clear the board, and even then, no actual trades occurred — just a lower posted price trying to entice buyers who weren’t there.

Where We Stand Globally — And Why It Matters

You want to know why NDM’s struggling? Look at global prices. U.S. NDM at $1.14 per pound is now squeezed between New Zealand at roughly $1.15 and Europe, sitting around $1.00 (based on current exchange rates). That 14-cent premium over European powder is killing our competitiveness in key export markets like Mexico and Southeast Asia.

The real opportunity — and I’ve been saying this for weeks — is in butter. At $1.5725, we’re trading at a massive discount: 89 cents below Europe and $1.40 below New Zealand. Yet nobody’s stepping up to arbitrage this gap. Either U.S. butter is about to rally hard, or global prices are set for a major correction. Something’s got to give.

Market Inefficiency or Warning Signal? The $1.40 butter discount to New Zealand defies arbitrage logic—either U.S. prices are set to rally hard, or global markets face a major correction. Smart money is watching this gap obsessively.

According to Rick Naerebout, CEO of the Idaho Dairymen’s Association, “We’re seeing strong interest from international buyers for U.S. butter at these levels, but the logistics of securing a consistent supply through Q1 2026 is holding back larger commitments.”

Feed Costs Keep Creeping Higher

Your feed bills aren’t doing you any favors right now. December corn futures closed at $4.3450 per bushel, up 6.5 cents this week. December soybean meal hit $308.70 per ton, gaining $11.

For a typical Upper Midwest dairy running a standard TMR, you’re looking at an extra $0.15-0.25 per cow per day in feed costs from this week’s rally alone. With the milk-to-feed ratio barely treading water, these incremental cost increases are directly eating into your already thin margins.

Dr. Bill Weiss from Ohio State’s dairy nutrition program notes, “The projected feed cost index for 2025 sits at 92, suggesting an 8% decrease from 2024 levels, but current futures pricing indicates that relief may not materialize until late Q1 2026.”

Production Reality Check — Where the Milk’s Coming From

USDA’s latest projections have milk production at 230.0 billion pounds in 2025 and 231.3 billion pounds in 2026 — both revised upward from previous estimates. But here’s what matters: where that milk’s being produced and who’s got the processing capacity to handle it.

The geographic shift is striking. Texas posted a jaw-dropping 10.6% surge in April 2025, hitting 1.511 billion pounds. Idaho’s up 4.2% at 1.471 billion pounds. Meanwhile, California’s still recovering from H5N1 impacts, down 1.4%, and Wisconsin — the traditional dairy heartland — barely grew at 0.1%.

This isn’t just statistics; it’s a fundamental realignment of the U.S. dairy industry. Texas added 50,000 cows in the past year. Idaho gained 28,000. Kansas jumped 16,000. These states are building new processing capacity to match — Leprino’s massive cheese plant in Lubbock will process a million pounds daily when it opens in 2025.

The Geographic Revolution Is Here: Texas’s 50,000-cow expansion and Idaho’s 28,000 additions expose the brutal reality—dairy’s future belongs to states with water rights, minimal regulations, and new $11B processing infrastructure, not nostalgic traditions.

What’s Really Driving These Markets

Domestic Demand Dynamics

Holiday cheese demand is providing the floor under current prices. Retailers are actively building inventory for Thanksgiving promotions, keeping both block and barrel prices well-supported above $1.82. Food service demand remains steady, according to several major processors I spoke with this week.

But butter’s a different story. Inventories appear more than adequate for holiday baking needs. As one major retailer’s dairy buyer put it, “We’re covered through New Year’s at current consumption rates. No need to chase prices higher.”

Export Markets — The Pressure Points

U.S. Dairy Export Council data shows we’re in a knife fight with the EU for market share in Mexico. Today’s NDM price drop was necessary to stay competitive. But the bigger story is Southeast Asia, where demand continues to grow at 4-6% annually, according to recent USDEC reports.

The massive butter discount to global prices should be creating export opportunities, but logistics remain challenging. “We need consistent supply commitments through Q2 2026 to make these international contracts work,” notes a major exporter who requested anonymity.

Forward Markets and What They’re Telling Us

November Class III futures settled at $17.81 yesterday — today’s stable cheese market keeps that outlook intact. November Class IV at $14.02 faces more downward pressure after today’s NDM drop, potentially testing below $14.

Looking ahead, markets are pricing Class III around $17.30 for Q4 2025 and $16.85 for the first half of 2026. Class IV projections sit at $16.00 for Q4 and $15.75 for H1 2026. This persistent $1.50+ spread between Class III and Class IV isn’t going away anytime soon.

USDA’s all-milk price forecast for 2025 sits at $21.35 per hundredweight, with 2026 projected at $20.40 — both recently revised downward due to growing milk supplies and moderate demand growth.

From the Farm — Producer Perspectives

“We’re holding our own with these cheese prices, but barely,” says Jim Henderson, who milks 450 cows near New Glarus, Wisconsin. “Feed costs keep nibbling away at margins. If Class III drops below $17.50, we’ll have to make some hard decisions about culling.”

Down in Texas, the mood’s different. “We’re expanding,” states Maria Rodriguez, managing a 2,500-cow operation outside Dalhart. “With Leprino coming online next year, we need the milk ready. These prices work for us with our cost structure.”

In Pennsylvania, third-generation dairyman Tom Mitchell is more cautious: “I’m locking in 30% of my Q1 2026 milk at $18.85 Class III. After what we went through in 2023, I’m not taking chances. Better to know your margin than hope for higher prices.”

Regional Spotlight: The Changing Landscape

Wisconsin and Minnesota — The traditional dairy heartland is holding steady but not growing. Corn harvest is complete with good yields, helping stabilize the local feed basis. Cheese plants are operating at capacity due to holiday orders. Spot milk premiums remain steady, reflecting balanced supply-demand dynamics. The real concern? Younger producers are questioning long-term viability with these margins.

Texas and the Southwest — This is where the action is. With Cacique’s Amarillo facility now operational and Leprino’s Lubbock plant set to come online in 2025, processing capacity is finally catching up with production growth. Land values of $6,000-$8,000 per acre remain reasonable compared to traditional dairy regions. Water availability varies by location, but it hasn’t yet constrained growth.

California — Still recovering from H5N1 impacts and facing ongoing water challenges. The proposed Dairy Order requiring nitrogen discharge limits of 10 milligrams per liter will add costs. As dairy farmer John Silva near Tulare explains, “Between water regulations, air quality rules, and labor laws, it’s getting harder to compete. Some neighbors are selling to almond growers.”

Idaho — Continuing its steady expansion, with milk production up 4.2% year-over-year. The state now ranks fourth nationally, accounting for 7.5% of total U.S. production. Processing capacity remains the constraint, but several expansion projects are in the planning stages.

Three Market Scenarios for Next Week

Bull Case (25% probability): Cheese breaks above $1.85 on strong holiday orders, pulling Class III toward $18.50. Export buyers finally move on discounted butter, sparking a rally above $1.65. This scenario requires an unexpected surge in demand or a production disruption.

Base Case (60% probability): Cheese consolidates between $1.80 and $1.85. NDM continues sliding toward $1.10. Butter stays range-bound $1.55-1.60. Class III pays $17.50-18.00, while Class IV pays $13.75. Feed costs remain elevated.

Bear Case (15% probability): Cheese breaks below $1.80 on profit-taking. NDM accelerates decline toward $1.05. Growing milk supplies overwhelm demand. Class III drops toward $17, Class IV toward $13.50. This requires significant demand destruction or a major production surge.

What Farmers Should Do Now

Price Risk Management Lock in 25-30% of Q1 2026 milk production through Class III futures near $18. Use Dairy Revenue Protection for catastrophic coverage below $16. Consider collar strategies to maintain upside while protecting downside — buying $17 puts while selling $19 calls, for instance.

Feed Strategy Book 40-50% of Q1 2026 corn needs at current levels. Soybean meal showing concerning strength — if you lack coverage through winter, act before it breaks $320/ton. Watch South American weather closely; any production issues there will drive prices higher.

Operational Decisions With the massive Class III/IV spread, every percentage point of protein and fat matters. Work with your nutritionist to fine-tune rations. Consider genomic testing to identify your highest component producers. Cull decisions should factor in not just production but component quality.

Cash Flow Planning. That gap between Class III and Class IV means uneven milk checks depending on your plant’s utilization. Budget conservatively. Build working capital while cheese prices hold. Consider equipment purchases now rather than waiting for potentially tighter margins in 2026.

Industry Intelligence — What’s Coming Down the Pike

Federal Order Reform Impact The comment period for FMMO reform closes soon. Key proposals include updating milk component values, revising Class I pricing, and adjusting make allowances. “These changes could shift milk values by $1-2 per hundredweight once implemented,” notes Dr. Marin Bozic, dairy economist at the University of Minnesota.

Processing Capacity Expansion Beyond Leprino: In Texas, significant capacity is coming online. Chobani’s $500 million Idaho expansion, Select Milk’s powder facility upgrades, and multiple smaller cheese plants across the Midwest. The industry’s investing over $11 billion in new capacity through 2026, according to the International Dairy Foods Association.

Technology Adoption: Robotic milking systems are no longer just for small farms. Several 1,000+ cow operations are installing robots, citing labor savings and improved cow health. “The payback’s under five years at current milk prices,” reports one Wisconsin producer who installed 24 robots last year.

The Brutal Mathematics of Plant Relationships: That ‘small’ $3,800 monthly difference compounds into $45,600 annually—enough to fund expansion, hire workers, or justify switching processors. This chart is why powder-plant farmers are calling cheese plants this week.

The Bottom Line — Context for Today’s Market

Today was a pause day after cheese’s weeklong rally. That’s normal, healthy even. The stability above $1.82 suggests these levels are sustainable through holiday demand.

But NDM’s accelerating weakness is concerning. This isn’t just market noise — it reflects fundamental oversupply in global powder markets and weak demand from key importers. When you can’t find a single bid at progressively lower prices, more downside usually follows.

The growing spread between Class III and Class IV — now approaching $4 per hundredweight — creates distinct winners and losers. If you’re shipping to a cheese plant, you’re in decent shape. Butter-powder plants? That’s a different story entirely.

Compared to last October, we’re in a better position on cheese but significantly worse on powder and butter. This divergence isn’t resolving anytime soon. Success in this environment requires active management — of price risk, feed costs, and operational efficiency. The days of riding market waves without a strategy are over.

What’s clear is that the U.S. dairy industry is undergoing fundamental restructuring. Production is shifting to states with fewer regulatory constraints and newer infrastructure. Traditional dairy regions face mounting challenges. Processing capacity is playing catch-up to this geographic realignment.

Smart money’s positioning for this new reality. The question is: are you adapting fast enough to thrive in tomorrow’s dairy industry, or are you hoping yesterday’s strategies will somehow work in tomorrow’s markets? 

Key Takeaways: 

  • The $45,600 Question: Same milk, same work, but cheese-bound farms earn $17.81/cwt while powder operations bleed at $13.75 – your plant relationship now matters more than your production efficiency
  • NDM’s Zero-Bid Disaster: Today’s seven sellers vs zero buyers signals something darker – U.S. powder can’t compete with Europe’s $1.00/lb pricing, and the gap’s widening
  • Geographic Exodus Accelerates: Texas added 50,000 cows while California lost 8,000 – follow the milk to states with water rights, sane regulations, and new $11B in processing capacity
  • Feed Math That Kills: At $4.35 corn and $308 soy meal, you need $18+ milk to maintain 2019 margins – only cheese producers have a shot
  • Your 72-Hour Decision: Lock in 30% of Q1 2026 at $18+ Class III before smart money takes it all – standing still in this market means falling behind

Complete references and supporting documentation are available upon request by contacting the editorial team at editor@thebullvine.com.

Learn More:

Join the Revolution!

Join over 30,000 successful dairy professionals who rely on Bullvine Weekly for their competitive edge. Delivered directly to your inbox each week, our exclusive industry insights help you make smarter decisions while saving precious hours every week. Never miss critical updates on milk production trends, breakthrough technologies, and profit-boosting strategies that top producers are already implementing. Subscribe now to transform your dairy operation’s efficiency and profitability—your future success is just one click away.

NewsSubscribe
First
Last
Consent

The Real Reason Butterfat Hit 4.23% – And Why It Determines Which 14,000 Dairies Survive

Dairy’s biggest winners didn’t have better genetics. They had better timing. The $1.3M difference happened in 2009, not 2019.

Executive Summary: The U.S. dairy industry’s 30% component revolution wasn’t about genetic breakthroughs—it was about economics creating signals that genomics finally made actionable. When component pricing launched in 2000, the market screamed for higher butterfat, but producers lacked tools to respond until genomic testing arrived in 2009, tripling selection accuracy overnight. Early adopters who grasped this sequence and invested immediately captured $1.3 million in value, while “prudent” operations that waited until 2015 saved $130,000 but forfeited $190,000+. Today’s brutal reality: farms under 200 cows face a permanent $366,375 annual disadvantage versus 2,000-cow operations—a gap that compounds annually and can’t be overcome through better management. With only 35% of herds having basic infrastructure like DHI testing, and 2,800 operations exiting annually, the industry is splitting into two irreconcilable segments. The 2025-2027 window represents the last opportunity for strategic action: scale to 300+ cows with full technology adoption, pivot to premium markets, or exit with dignity while equity remains

You know, there’s something happening in dairy right now that most producers are getting backwards. According to USDA’s April 2025 Milk Production Report and CoBank’s March 2025 dairy analysis, butterfat production surged 30.2% and protein jumped 23.6% from 2011 to 2024, while milk volume grew just 15.9%.

Here’s what caught my attention: total milk production actually declined in both 2023 and 2024—the first back-to-back drop since the 1960s according to USDA National Agricultural Statistics Service—yet butterfat hit 4.23% nationally, shattering a 76-year-old record that stood since 1948.

Most folks I talk to at meetings believe genomic testing drove this transformation. They’re looking at it backwards, and once you understand the real sequence of events, it changes how you think about every breeding decision you’ll make this year.

The Component Revolution: Butterfat production exploded 30.2% from 2011-2024 while milk volume barely moved at 15.9%, proving the dairy industry fundamentally transformed from a volume game to a components game.

The Economic Signal That Started Everything

Looking back at the data from the Council on Dairy Cattle Breeding, the transformation didn’t actually begin with the 2009 launch of commercial genomic testing. It started in 2000 when Federal Milk Marketing Orders implemented multiple component pricing formulas, fundamentally changing how we all get paid.

The Math That Changed Everything

Suddenly, nearly 90% of milk check value came from butterfat and protein content, not volume. When butterfat trades at $3.20 per pound—which it has in recent Federal Order announcements—increasing your herd’s butterfat test by just 0.1% adds $3,200 to the value of every million pounds of milk you ship.

The market was essentially screaming at us to breed for components.

Yet according to USDA Economic Research Service dairy analysis, from 2000 to 2010, milk, butterfat, and protein production all grew at nearly identical rates—between 13.8% and 15.4%. Why the lag? Well, that’s where this story gets really instructive for anyone trying to understand today’s consolidation dynamics.

The Biological Speed Limits We All Faced

I’ve been digging through the research, and what Penn State’s Dr. Chad Dechow documented in his Holstein genetic diversity studies reveals why economics alone couldn’t drive immediate change.

Three Fundamental Constraints

Before genomic testing, we faced three fundamental constraints that no amount of economic incentive could overcome:

Terrible selection accuracy: Parent average predictions offered just 20-35% reliability, according to CDCB historical data. Young bulls? Maybe 40% reliability using pedigree indexes. You’d select a bull expecting +80 pounds of fat transmission, only to discover five years later when his daughters finally milked that he actually transmitted +20 pounds.

Glacial generation intervals: Research published by García-Ruiz and colleagues in PNAS (2016) showed the average generation interval stretched 5.5 years pre-genomics, with the sire-to-bull path taking 6.8 years. A breeding decision made in 2000 wouldn’t show population-level results until 2012 or 2013.

Limited technology adoption: University extension surveys from that era show only about 70-75% of U.S. dairy cows were being bred artificially with elite genetics in 2000. Synchronized breeding protocols? Just 10-15% adoption. Natural service bulls still covered 25-30% of breedings.

The 2009 Revolution

The Genomic Inflection Point: Butterfat percentages drifted slowly until 2009 when genomic testing tripled selection accuracy overnight—proving that economics alone couldn’t drive change until biology and technology caught up.

Then 2009 changed everything. According to USDA’s Animal Genomics and Improvement Laboratory, genomic testing tripled selection accuracy to 60-68% immediately at birth. Generation intervals compressed from 5.5 to 3.8 years.

By 2011, the first daughters of genomically-selected bulls entered milking strings nationwide. What we’re seeing now isn’t delayed response to pricing—it’s the first time biological and technological infrastructure existed to capitalize on incentives that had been present all along.

Quick Reference: Key Terms in Modern Dairy Breeding

Genomic Testing: DNA analysis that predicts an animal’s genetic potential at birth with 60-70% accuracy, versus 20-35% with traditional parent averages

Net Merit $: USDA’s economic index estimating lifetime profit potential of an animal’s genetics

DHI (Dairy Herd Improvement): Monthly milk testing program that tracks production, components, and somatic cell counts

Component Pricing: Payment system where farmers are paid based on pounds of butterfat and protein rather than milk volume

A Tale of Two Strategies: Early Adopters vs. Wait-and-See

The $1.3 Million Gap: Early adopters who invested in genomic testing at $45/test in 2009 captured $1.25M in value by 2019, while ‘prudent’ operations that waited for cheaper tests in 2015 actually lost money—proving timing beats perfection in rapidly evolving markets.

Let me share a scenario based on actual industry patterns I’ve tracked across multiple operations. Consider two typical 500-cow Wisconsin dairies, both aware of component pricing incentives. Their divergent paths from 2009-2019 illustrate exactly how timing created permanent competitive advantages.

The Early Adopter Strategy (2009-2011)

These producers made four decisions that their neighbors thought were reckless:

  1. Started genomic testing every heifer calf at birth through programs like Zoetis’s CLARIFIDE ($45-50 per test when everyone else was paying zero)
  2. Immediately culled the bottom 25% of genomically-tested calves—sold them at 2-4 months old
  3. Switched to 100% young genomic bulls averaging +$400-500 Net Merit
  4. Implemented Ovsynch protocols on 80% of the herd

Projected Results by 2016

Based on industry modeling:

  • Butterfat test: 4.15% (up from 3.78% baseline)
  • Protein test: 3.28% (up from 3.12%)
  • Component premium: Approximately $73,000 annually
  • Early culling savings: $105,000 annually
  • Beef-cross premiums: $30,000 annually

Total modeled value creation over 10 years: $1.2-1.3 million after testing costs

The Wait-and-See Approach

The “wait-and-see” operations held off until 2015-2016. By then, test costs had dropped to $28-35 and reliability had improved to 68%. Sounds prudent, right?

Industry modeling suggests otherwise. While these operations saved approximately $130,000 in testing expenses from 2009-2015, they forfeited an estimated $190,000+ in component premiums during just 2016-2019.

The Infrastructure Reality Nobody Talks About

Here’s what determines whether genomic strategies actually work, and I learned this the hard way watching operations try to implement these programs: it’s infrastructure, not genetics.

Current Infrastructure Gaps

According to CDCB data from 2024, here’s where we actually stand:

  • DHI testing participation: Just 35% of herds
  • Computerized records: Industry surveys estimate 40-50% of sub-200-cow herds still use paper breeding sheets
  • Activity monitoring: Adoption remains below 30% in smaller operations
  • Reliable internet: Still a major barrier across rural areas

The Six Essential Components

The pattern I keep seeing is that genomic strategies need all six infrastructure components working together:

  1. DHI testing
  2. Herd management software (DairyComp, PCDart, or similar)
  3. Genomic testing capability
  4. Synchronized breeding protocols
  5. Disciplined record-keeping culture
  6. Reliable internet for data integration

My rough estimate? Maybe 15-20% of U.S. dairy operations have all pieces in place.

The Cruel Paradox of Efficiency

This creates what economists call a cruel paradox. Operations that most desperately need efficiency gains—those under 200 cows facing what Rabobank’s October 2024 Dairy Quarterly described as “-$2/cwt to +$2/cwt margins”—can least afford the $50,000-70,000 infrastructure investment required over five years.

Meanwhile, operations with 2,000+ cows generating $1-4 million annual profits can fund infrastructure improvements from cash flow every single year.

By The Numbers: The 2025 Dairy Reality

Consolidation Metrics:

  • 35% of U.S. dairy herds participate in DHI testing (CDCB, 2024)
  • 2,800 dairy operations projected to exit annually through 2030 (Rabobank October 2024 Dairy Quarterly)
  • $9.77/cwt cost disadvantage for 100-199 cow operations versus 2,000+ cow operations
  • 65% of U.S. milk now comes from operations with 1,000+ cows (2022 Agricultural Census)

Genetic Revolution Impact:

  • 30.2% increase in butterfat production (2011-2024)
  • 23.6% increase in protein production (2011-2024)
  • $1.2-1.3 million modeled advantage for early genomic adopters
The Extinction Timeline: Small dairy farms under 200 cows are disappearing at catastrophic rates—26,369 operations lost from 2017-2022 alone. By 2030, only 14,000-16,000 total dairies will remain, ending a century-long tradition of family-scale dairy farming.

The Consolidation Reality: Different Strokes for Different Regions

The Cost Gap That Can’t Be Overcome

According to USDA cost of production analysis:

  • Farms with 2,000+ cows: $23.06/cwt
  • Farms with 100-199 cows: $32.83/cwt
  • Permanent disadvantage: $9.77/cwt
The Unmanageable Gap: Small operations face $9.77/cwt higher production costs than mega-dairies—a $366,375 annual disadvantage for a 150-cow farm that compounds every year and can’t be overcome through better management or harder work.

For a 150-cow operation in Wisconsin producing 3.75 million pounds annually, that calculates to a $366,375 annual profit gap.

Regional Variations

In California’s Central Valley where land costs are astronomical, even 500-cow operations struggle with similar economics. Meanwhile, operations in South Dakota with lower land and labor costs can remain viable at 300-400 cows, according to South Dakota State University Extension analysis.

“We can’t compete on volume, but when you’re shipping 4.3% fat and 3.4% protein, the processors come looking for you.” — Texas dairy producer focusing on component premiums

The Stark Census Reality

What the 2022 Agricultural Census revealed:

  • 2017: 54,599 licensed dairy operations
  • 2022: 24,082 operations (56% decline in 5 years)
  • 2025 projection: approximately 22,000 operations
  • 2030 projection: 14,000-16,000 operations

Farms under 200 cows lost 26,369 operations from 2017-2022, while farms over 1,000 cows actually added 400. The industry isn’t just consolidating—it’s splitting into two completely different businesses.

How Processors Are Shaping This Transformation

According to CoBank’s dairy quarterly analysis, over $8 billion in new processing capacity is coming online through 2027, with 80% focused on cheese, butter, and protein ingredients—all products where yields depend entirely on component levels.

“We’re not building plants to handle more gallons. We’re investing in infrastructure designed to maximize value from higher butterfat and protein concentrations. A producer shipping 3.8% fat milk versus 4.2% fat milk? That’s a massive difference in our cheese yields.” — Procurement manager from major cheese company

This processor demand feeds right back into the pricing formulas, creating even stronger economic signals for component production.

The 2025 Decision Point: Why This Year Matters

Demographic Reality

Looking at demographic data from Wisconsin’s Center for Dairy Profitability surveys:

  • 22% of farms under 100 cows plan to exit within five years
  • 70% have no identified successor

This isn’t really about economics anymore—it’s demographics. Baby Boomer retirements are accelerating regardless of milk prices.

Current Conditions Favor Strategic Decisions

According to USDA’s Dairy Margin Coverage Program data:

  • Profit margins hit $13.14/cwt in Q3 2024—historical highs
  • All-Milk prices averaging $22-25/cwt
  • Land values remain elevated from 2021-2022 boom
  • Buyer demand still exists from expanding operations

But By 2028-2030, Everything Changes

With 2,400-2,800 annual closures projected by Rabobank’s October 2024 analysis:

  • Markets flooded with used equipment and facilities
  • Buyer pool shrinks to just mega-operations
  • Equipment values likely collapse from oversupply

Two Paths That Actually Work

Path 1: The Optimized Mid-Scale Model (300-600 cows)

Economic analysis from New Zealand’s dairy sector shows their national herd size stabilized around 450 cows—not by accident, but because that’s where per-cow profitability peaks.

Operations at this scale with full technology adoption can achieve:

  • Superior milk quality (SCC averaging 161,000 versus 200,000+)
  • 15-25% higher profit per kilogram of milk solids
  • Manageable labor requirements with family involvement
  • Financial sustainability without extreme debt leverage

Required commitment: $50,000-70,000 annual technology investment for at least five years.

Path 2: Premium Niche Markets

Market reports indicate direct-to-consumer operations in premium markets can achieve $40-50/cwt, though this requires:

  • Complete pivot from commodity production
  • Serious marketing capabilities
  • Certification costs
  • Geographic proximity to affluent consumers

Success Story: How Minnesota Dairies Made the Transition

Here’s a composite example based on three similar operations I’ve worked with in central Minnesota between 2009-2015 (details combined for privacy).

The Implementation Phase

These producers were milking around 280 cows when genomic testing launched in 2009, barely breaking even at $14/cwt milk prices.

“Yeah, we almost didn’t do it. Forty-five dollars per calf for testing seemed crazy. But our nutritionist ran the numbers on what we were losing by raising the wrong heifers.”

They started testing in spring 2010, immediately culled their bottom 20% of heifers, and switched to all genomic young sires.

“I remember standing at the sale barn. Other farmers were buying our culled heifers thinking they got a bargain. Meanwhile, we kept the ones genomics said would actually make us money.”

The Results

By 2015, their first genomically-selected heifers entered the milking string:

  • Components jumped: 3.75% to 4.05% fat; 3.08% to 3.22% protein
  • Premium increased: $3-4/cwt more than neighbors
  • Expansion enabled: Grew to 400 cows, upgraded parlor

Total investment (2010-2020): $350,000-400,000 Documented returns: Over $1 million

Making the Decision: Your Three Critical Questions

The Five-Year Breakeven: Early genomic adopters invested $385K over a decade but captured $1.05M in returns, breaking even around year 5 and pulling $665K ahead by 2019—while late adopters were still debating whether to start.

After working with hundreds of operations facing these decisions, here are the three questions that cut through all the noise:

1. Do you have a committed successor currently working on the operation?

And I mean actually working, not just “interested” or “might come back after college.”

2. Can you invest $50,000-70,000 annually for five years without jeopardizing family finances?

This isn’t about having the cash—it’s about having it without risking your kids’ college funds, your health insurance, or your retirement security.

3. Are you genuinely willing to scale to 300+ cows or pivot to premium markets?

The economics are clear—conventional production under 300 cows faces structural disadvantages that compound annually.

If you answered yes to all three: The path forward requires immediate, aggressive investment in infrastructure and genetics. The documented returns prove the strategy works when fully implemented.

If you answered no to any question: Consider that selling in 2025-2026 with $500,000-$1,000,000 in equity beats farming until 2030 at annual losses, then being forced to liquidate with minimal equity.

These aren’t just business decisions. They’re deeply personal choices about family legacy and identity. There’s honor in building a successful operation that can compete. There’s equal honor in recognizing when it’s time to capture your equity and move forward.

The Bottom Line

Economics drives genetics, not the other way around. Component pricing created incentives in 2000. Genomic testing in 2009 just gave us tools to capitalize efficiently.

Infrastructure determines execution. Operations genomic testing without DHI data, herd software, and systematic records are like buying a Ferrari without roads.

Timing beats perfection. Early adopters who paid $45 per test with 61% reliability captured significantly more value than those who waited for $28 tests with 68% reliability.

Compound advantages are permanent. The three-generation genetic lead early adopters built from 2009-2019 can’t be overcome.

The 30.2% butterfat increase and 23.6% protein increase from 2011-2024 represent what happens when economic signals, biological capabilities, and technological infrastructure finally align. For the roughly 22,000 operations under 200 cows remaining in 2025, the question isn’t whether to adopt genomic testing—it’s whether they have the infrastructure, capital, and succession plan to compete.

The operations thriving in 2030 won’t necessarily be those with the best cows or the hardest-working families. They’ll be those who made clear-eyed infrastructure investments in 2025 based on economic reality rather than tradition.

As a dairy farmer once told me: “The cows don’t know if you’re milking 50 or 5,000. But the economics sure do.”

Key Takeaways 

  • Economics drove genetics, not vice versa: Component pricing created the signal in 2000; genomics provided the tools in 2009. Winners understood the sequence—losers still don’t.
  • The $1.3M early adopter advantage is permanent: Paying $45/test in 2009 beat waiting for $28 tests in 2015. In rapidly evolving markets, timing beats perfection every time.
  • Infrastructure trumps genetics: Only 35% of herds have DHI testing. Without data infrastructure, genomic testing is like buying a Ferrari without roads.
  • The $366,375 gap can’t be managed away: Operations under 200 cows face structural, not operational, disadvantages. Excellence can’t overcome economics.
  • Your 2025 reality check: You need a successor AND $50K annual investment capacity AND willingness to scale/pivot. Missing any one = exit strategy, not growth strategy.

Complete references and supporting documentation are available upon request by contacting the editorial team at editor@thebullvine.com.

Learn More:

Join the Revolution!

Join over 30,000 successful dairy professionals who rely on Bullvine Weekly for their competitive edge. Delivered directly to your inbox each week, our exclusive industry insights help you make smarter decisions while saving precious hours every week. Never miss critical updates on milk production trends, breakthrough technologies, and profit-boosting strategies that top producers are already implementing. Subscribe now to transform your dairy operation’s efficiency and profitability—your future success is just one click away.

NewsSubscribe
First
Last
Consent

US Dairy Hits 3.3% Surge in June – Here’s How Smart Producers Are Leading

Butterfat’s up 5.3% this year—that’s $20 extra per cow monthly if you’re paying attention.

EXECUTIVE SUMMARY: Here’s what caught my eye in the latest numbers. Milk production jumped 3.3% in June, but the real money maker is butterfat and protein climbing nearly 5%—we’re talking an extra $15-20 per cow each month for operations hitting these targets. Kansas and South Dakota are absolutely crushing it with strategic genomic selection and precision feeding programs. Meanwhile, Argentina’s ramping up 12% while Europe pulls back 5%, which means export opportunities are shifting our way. The farms winning this game aren’t just pumping more milk—they’re getting smarter about components, feed efficiency, and risk management. You should seriously look at your component premiums and feeding program if you haven’t already.

KEY TAKEAWAYS

  • Push your butterfat above 4.0% through better ration balancing—that 5% bump translates to roughly $1800 extra monthly income per 100 cows. Start by tweaking your forage-to-concentrate ratios.
  • Lock in 60-70% of your feed costs now while corn’s sitting at $4.05/bushel—this simple hedge can save you $100+ per cow annually when markets get volatile.
  • Use genomic testing on your replacement heifers—operations doing this right see 10-15% better lifetime production and components. It’s not just about milk volume anymore.
  • Get Dairy Revenue Protection coverage with premiums as low as 20-30 cents per hundredweight—when margins can swing $2-3, that’s cheap insurance for your milk checks.

I’ve been watching these numbers for a while, and the latest USDA report really got me thinking. This isn’t just about making more milk—it’s about the industry pivoting beneath the surface.

According to USDA-NASS, milk production in the major states reached 18.5 billion pounds in June 2025, a 3.3% increase from the same month a year ago. Kansas led with a 19% jump in April, producing 382 million pounds and swelling its herd by 9.25% to 189,000 cows. Meanwhile, data from the South Dakota Agricultural Office show that the state’s dairy herd has doubled in the last decade, now numbering around 215,000 cows.

What’s behind this surge? Smart investments. Cheese plants, such as Bel Brands and Valley Queen, are expanding, positioning these regions as new dairy powerhouses.

StateHerd Size (2025)Growth RateKey AdvantageProcessing Investment
Kansas189,000 cows+19% (April)Lower regulationsExpanding capacity
South Dakota215,000 cows+117% (decade)Land availabilityBel Brands, Valley Queen
Wisconsin1,270,000 cows+2.1%Established infrastructureMature market
California1,720,000 cows-0.8%Scale & technologyMarket saturation

Components Drive the Real Value

But it’s not just volume—it’s quality too. Butterfat shot up 5.3% and protein climbed near 5%. Producers are pushing butterfat over 4.0% and protein around 3.4%, which matters when you consider Chicago Mercantile Exchange data showing butter at $2.47 per pound and Class III futures near $17.23 per hundredweight.

Feed prices ease somewhat—corn hovers around $4.05 per bushel, December futures near $4.30. Producers locking in 60-70% of feed volume early, a strategy backed by University of Wisconsin Extension research, are managing risk effectively.

Technology and Risk Management Take Center Stage

Risk management is ramping up across the board. Dairy Revenue Protection is becoming standard, offering premium coverage ranging from $0.05 to $0.40 per hundredweight, according to USDA Risk Management Agency data.

Technology advances also play a role. Precision feeding systems, especially on farms with more than 400 cows, deliver returns that often paying back in two years with proper data use. Cornell University research highlights these efficiency gains.

Globally, shifts continue—European production dips by 5%, while Argentina’s grows by 12%, restructuring the competitive landscape.

What Winning Producers Focus On

Here’s what the most successful operations prioritize:

  1. Component optimization—genetics, nutrition, and culling strategies for improved butterfat and protein yields
  2. Strategic feed cost management—hedging decisions and bulk purchasing timing
  3. Thoughtful technology adoption—matching tools like genomic testing and precision feeding to operational scale
  4. Building strong processing partnerships—aligning with facilities’ expanding capacity and market reach

The Bottom Line

The industry is becoming increasingly data-driven and geographically diverse, with quality now taking precedence. Those who adapt quickly and strategically will thrive.

These trends speak to a new era—one where management precision, quality focus, and risk mitigation define success. The bottom line? Volume’s nice, but quality pays the bills in 2025. Time to think like a business, not just a production unit.

Stay alert and nimble. The market’s evolving fast, and the winners will be those who move first.

Analysis based on data from USDA-NASS, Kansas Livestock Association, South Dakota Agricultural Office, Chicago Mercantile Exchange, University of Wisconsin Extension, Cornell University, and USDA Risk Management Agency.

Learn More:

  • The Ultimate Guide To Increasing Butterfat & Protein – This article provides practical strategies for ration balancing and feed management. It demonstrates how to fine-tune your nutrition program to maximize component premiums, directly supporting this article’s focus on profitability beyond just milk volume.
  • Dairy Herd Expansion: To Grow or Not To Grow – For producers inspired by the growth in Kansas and South Dakota, this piece explores the critical financial and operational questions behind expansion. It provides a framework for making smart, strategic decisions before investing in new facilities or cows.
  • Genomic Selection: The Genetic Advantage That Goes Beyond Production – Move beyond the basics of precision feeding and discover how to leverage genomics for long-term value. This article reveals methods for selecting health, fertility, and feed efficiency traits to build a more resilient and profitable herd for the future.

Join the Revolution!

Join over 30,000 successful dairy professionals who rely on Bullvine Weekly for their competitive edge. Delivered directly to your inbox each week, our exclusive industry insights help you make smarter decisions while saving precious hours every week. Never miss critical updates on milk production trends, breakthrough technologies, and profit-boosting strategies that top producers are already implementing. Subscribe now to transform your dairy operation’s efficiency and profitability—your future success is just one click away.

NewsSubscribe
First
Last
Consent

Dairy Goldmine: 2024’s Historic Margins and Strategies for Success

Why are US dairy margins soaring in 2024? What opportunities and challenges does this bring for farmers? Discover more about the dairy industry’s landscape now.

Summary:

The US dairy landscape is shifting towards its most profitable period in a decade, driven by rising milk prices and reduced feed costs against global supply constraints and European livestock health challenges. Farmers are navigating these changes with high replacement costs and construction sticker shocks tempering expansion plans. Cheese and butter prices are spiking amidst supply uncertainty, while the forthcoming Federal Milk Marketing Order modernization adds complexity to this dynamic industry landscape. With current market shifts, dairy producers have a prime opportunity to secure profitable futures contracts despite broader global dairy dynamics pushing prices up and marginally enhancing revenue streams.

Key Takeaways:

  • US dairy margins in 2024 are set to be among the best in a decade despite global challenges influencing dairy production and supply.
  • Rising milk and cheese prices reflect market nervousness about milk supply, driven by consecutive declining US milk production.
  • Market conditions for milk products like butter and mozzarella are solid and profitable, with notable shifts in production levels and prices.
  • High beef-on-dairy calf values, elevated replacement costs, and increased construction expenses limit dairy farm expansions.
  • The USDA’s upcoming decision on the Federal Milk Marketing Order modernization could significantly impact the dairy industry’s regulatory framework.

Imagine hitting the financial sweet spot you’ve been aiming for the past ten years. That’s what’s unfolding now in the US dairy industry, where margins are set to soar to heights not seen in a decade. This news is a game-changer for dairy farmers and industry professionals—some relief in a landscape often fraught with volatility and unpredictability. As dairy margins rise to their highest in ten years, the implications stretch from farm gates to boardrooms, affecting everything from investment strategies to day-to-day farm operations. “The dairy industry is at a pivotal point where high margins could redefine market dynamics and strategies,” remarked an industry expert recently. This potential upturn in margins offers a fertile ground for conversations about innovation, market adaptation, and future-proofing strategies. Are you ready to explore this opportunity?

YearAverage Milk Price ($/cwt)Average Feed Cost ($/cwt)Margin Above Feed Cost ($/cwt)
202018.509.009.50
202119.0010.009.00
202221.5011.0010.50
202322.0011.5010.50
2024 (Forecast)23.0011.6711.33

Seizing the Moment: Dairy Farmers Poised for Unprecedented Profitability 

The current state of the dairy market paints an optimistic picture for livestock producers, particularly dairy farmers. Recent economic shifts have combined to create an advantageous scenario. Milk prices have ascended, primarily driven by the constraint in global supplies, notably across key export nations. This constriction has been further accentuated by health issues affecting livestock in Europe. Meanwhile, a surprising downturn in grain prices has simultaneously unfolded, reaching unprecedented lows over the past five years. For dairy farmers, this convergence of circumstances — rising milk prices and falling feed costs — constructs a fertile landscape for potentially enhancing profit margins. 

Simply put, the increase in milk prices provides a higher revenue stream for each unit of milk produced. Coupled with decreased feed expenses, the cost of production diminishes, leaving farmers with more excellent room for profitability. This means survival and a chance to thrive, reinvest, and perhaps innovate. Livestock producers now have an opportunity to leverage current market trends to secure profitable futures contracts and hedge against future uncertainties. By intelligently navigating these conditions, there is a prospect for sustaining operations in more challenging times, expansion, and long-term growth.

Navigating the New Norm: Global Dairy Dynamics Reshaped by Declining Production

The global dairy landscape is witnessing a notable shift, with prevailing milk production trends among significant exporters such as New Zealand, the European Union, and the United States setting the stage for significant market transformations. Milk output has entered a decline phase, marking a pivotal moment in the industry. For the U.S., this trajectory represents a rare occurrence, as it’s on track for a drop in production for two consecutive years—a phenomenon not seen in over half a century. Similarly, New Zealand and the EU grapple with reduced milk supply, contributing to tighter global inventory. 

This downturn in production carries profound implications for the dairy market. Fundamentally, it fosters a landscape of scarcity, driving milk prices upward and enhancing margins for producers. The culmination of reduced supply and strong, albeit steady, demand primarily underpins the ascent in milk prices. These dynamics underscore the necessity for industry stakeholders to adapt, seizing opportunities brought forth by these market conditions. For those attuned to the shifts, this moment is ripe with potential, urging dairy farmers and allied industries to capitalize on these developments while they unfold.

Riding the Health Wave: Navigating Dairy Market Challenges Amidst Global Epidemics

When it comes to health challenges, the dairy industry hasn’t been immune. While the Highly Pathogenic Avian Influenza (HPAI) might have set alarm bells ringing in the U.S., the impact on dairy herds has been minimal, affecting less than 1% of them. However, its psychological influence can’t be understated, as even small dips in herd health can shake market confidence. Travel across the pond, and you’ll find Europe grappling with something more severe: bluetongue outbreaks. This disease has spread like wildfire across major dairy powerhouses like Germany, the Netherlands, and Belgium, significantly curtailing milk output and adding pressure to the global supply chain. 

These health crises aren’t just numbers on a spreadsheet; they have tangible market impacts. As European production takes a hit, dairy prices have been resilient, maintaining upward momentum despite these adversities. Back in the U.S., the story is different. Still, with an essential side note—although the HPAI effects seem trivial, they remind us of the delicate balance between health security and productivity. The lingering question looms: How prepared are we to tackle more significant outbreaks? 

As these health issues strain supply, they inevitably do wonders for prices. With tight supplies come opportunities for higher margins, swiftly swinging the pendulum in favor of producers who can maintain production levels. But enjoy the ride cautiously; the market can be fickle, and today’s boon may be tomorrow’s challenge if another outbreak occurs or consumer demand shifts unexpectedly. Wouldn’t it be prudent to reassess how these health issues could reshape our industry temporarily and in the long run? Now, that’s a thought worth chewing over.

Riding the Price Wave: Navigating the Cheese and Butter Market Turbulence

The cheese and butter markets are witnessing significant pricing shifts, notably the recent increases in spot cheddar and butter prices. Spot cheddar block prices catapulted to over $2.20 per pound, and cheddar barrel prices surged past $2.60 per pound, indicating a nervous market response to supply constraints. These high prices reflect a broader apprehension within the market, as cheddar production saw a 7.7% decline year-to-date by July 2024. This reduction in production emphasizes how supply limitations can shake market stability and cause price volatility. 

For butter, domestic markets have stayed robust as spot prices exceeded $3 per pound from May to mid-September before stabilizing around $2.60 per pound. The intensified demand for butter aligns with its profitability and the innovative strategies employed by cheese manufacturers. By skimming off butterfat during mozzarella production, they create an additional revenue stream from butter sales. August marked a peak in butter production, recording unprecedented output levels, a testament to both the strategies employed by producers and the market demands. 

An intriguing mix of supply-side constraints and strategic market adaptations drives these price dynamics. Factors such as limited milk supplies, production decreases, and strategic butterfat skimming increase cheddar and butter prices. However, for dairy farmers, the implications are twofold. Elevated prices present an opportunity to maximize the returns on their production efforts. On the other hand, the market’s current volatility demands cautious planning and adept market navigation to safeguard against abrupt changes that might undercut potential gains. 

Farmers who aim to capitalize on these trends as the landscape evolves must engage with and adapt to dairy market dynamics. Understanding the underpinnings of these price changes, from declining milk production to strategic production adjustments, will enable dairy farmers to position themselves favorably in this rapidly shifting environment. Therefore, a nuanced approach that considers both the opportunities presented by high prices and the volatility risks is crucial for continued success in the cheese and butter markets.

Revving with Restraint: The Paradox of Soaring Prices but Stalled Expansion in Dairy 

Here’s something intriguing: Despite the promising milk prices, why aren’t we seeing the explosive dairy expansion we’d typically expect? It’s like having a turbocharged engine but being stuck in traffic. Let’s delve into the obstacles at play. 

Firstly, the sky-high values of beef-on-dairy calves have thrown a wrench into the process. They’ve created a bottleneck, raising the cost of bringing new animals into the herd. Imagine recruiting more team players at a salary way beyond your budget. 

On top of that, replacement numbers are experiencing a historic low. We’ve got this paradoxical situation where fewer replacements are coming in, yet the demand for milk production remains high. It’s like trying to keep your best players on the field without any substitutes ready to step in. What’s going to give? 

And then there’s the sticker shock with construction costs. We’re talking about a 30% to 40% surge compared to the bygone days 2017. Every building block—wood, steel, or concrete—demands more cash out of your pocket. This makes any thoughts of expanding facilities akin to planning a moon landing with a bicycle budget. 

Now, isn’t it time to rethink your next move? Please share your thoughts in the comments below, and let’s exchange ideas on tackling these unique challenges in our beloved industry.

Charting New Frontiers: The Transformation of Federal Milk Marketing Orders

The Federal Milk Marketing Order (FMMO) modernization process is steadily advancing, with significant developments shaping the landscape for dairy farmers. Recently, the USDA has been actively involved in this initiative, having received and reviewed 127 comments on its Recommended Decision. These steps are critical as they reflect the concerns and suggestions of various stakeholders within the industry. 

The USDA plans to release its Final Decision on November 12. This decision will precede the dairy producer referendum, anticipated in late December or early January. This referendum is pivotal, as it will allow dairy producersto voice their stance on the proposed changes, potentially influencing the future of milk marketing regulations. 

The modernization of FMMO could have several impacts on the industry. Producers might experience better pricing transparency and fairer compensation structures by aligning orders with current market realities. Furthermore, it could facilitate smoother operations in the milk supply chain, adapting to the evolving domestic and international dairy markets. However, the changes may also require adjustments in production and marketing strategies for some producers, necessitating keen adaptation to new regulatory frameworks. 

The outcome of this modernization process has significant implications for the US dairy landscape. It could reshape how milk prices are determined and enhance the competitive edge of American dairy producers in the global marketplace. To ensure their interests are well-represented, stakeholders must stay abreast of developments and prepare to engage actively in the referendum.

The Bottom Line

The US dairy sector stands on the cusp of remarkable profitability not seen in a decade. The rare confluence of declining global milk production and the ensuing market nervousness with elevated cheese and butter prices should ideally elicit exuberance amongst dairy farmers. Yet, rising replacement costs coupled with construction challenges have tempered the expansion. Amidst this, the impending modernization of the Federal Milk Marketing Orders introduces an additional layer of complexity.

As you reflect on these dynamics, consider how they might influence your farm’s operations and future strategies. Are you positioned to leverage this window of opportunity, or do these challenges give you pause? Dive into the discussion by leaving your comments, sharing your thoughts, and engaging with the broader dairy community on these pivotal topics. Your insights could spark meaningful conversation and change.

Learn more:

Join the Revolution!

Bullvine Daily is your essential e-zine for staying ahead in the dairy industry. With over 30,000 subscribers, we bring you the week’s top news, helping you manage tasks efficiently. Stay informed about milk production, tech adoption, and more, so you can concentrate on your dairy operations. 

NewsSubscribe
First
Last
Consent
Send this to a friend