Archive for Daughter Pregnancy Rate

Fertility Bulls Failing? Your PTAs Are 30% Inflated – Here’s the Fix

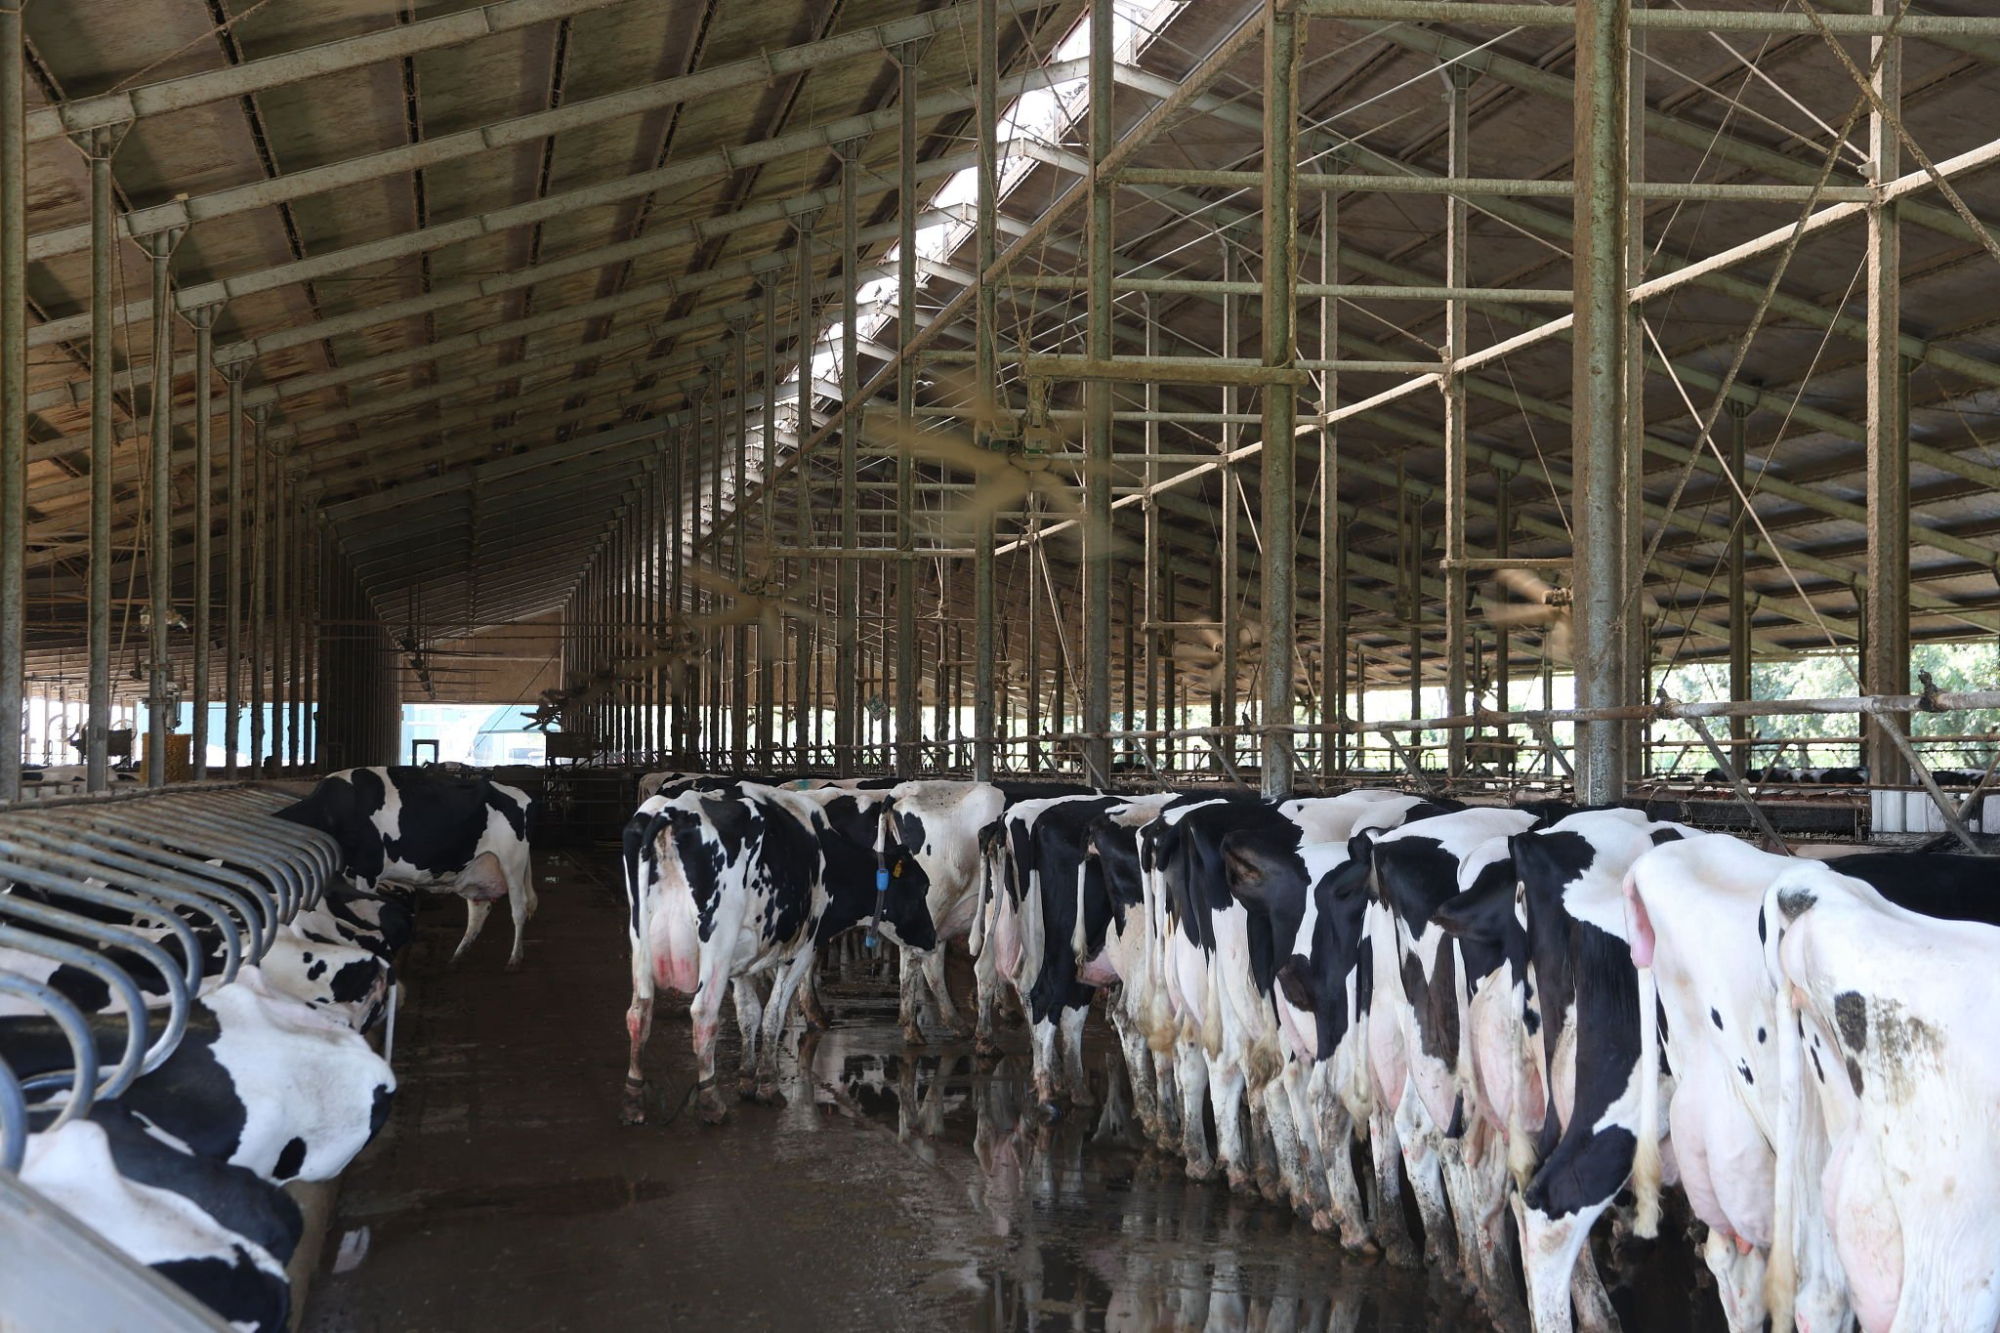
31% of dairy services now use beef semen. Fertility evaluations? Still pretending it’s 2005. No wonder your PTAs don’t work.

Executive Summary: If you’ve spent years selecting elite fertility bulls with zero improvement, you’re not alone—and you’re not failing. The genetic evaluation system has been broken for 20 years, inflating fertility PTAs by an estimated 25-30% based on the timing bias and management misalignment Dr. McWhorter described and costing the average 500-cow dairy $25,000 annually. Modern management broke the system: it assumes you breed at 50 days when the industry average is 67.5, can’t account for 31% of services using beef semen, and actively punishes progressive practices like extended VWP as genetic deficiencies. CDCB admits the problems and promises fixes in 2026, but smart producers aren’t waiting—they’re already discounting elite PTAs by 25-30%, trusting proven bulls with 750+ daughters, and spreading services across 8-12 sires. Your cows aren’t broken, your management isn’t failing—the measurement system just hasn’t caught up to how modern dairies actually operate.

Inflated Fertility PTAs

You know, I’ve been having the same conversation at every producer meeting lately—from Wisconsin to Pennsylvania, even down in Georgia where—let’s be honest, the heat stress alone should explain everything. Folks who’ve spent five to ten years selecting top-tier fertility bulls are seeing pregnancy rates that just… aren’t budging.

Here’s what’s interesting: the disconnect between what the PTAs promise and what shows up in the tank has left many questioning their management. But after sitting through Dr. Taylor McWhorter’s presentation at World Dairy Expo this year—and digging into the research behind it—I’m convinced we’ve been measuring the wrong thing, in the wrong environment, for about two decades now.

What Dr. McWhorter laid out at Madison this October were nine major updates to fertility evaluations scheduled for 2026. And while CDCB is presenting these as routine improvements, if you read between the lines… well, they’re quietly acknowledging that our fertility evaluations have been systematically miscalculating genetic merit for herds using modern management practices.

The economic modeling CDCB has done suggests we’re looking at tens of millions in foregone genetic progress over the past decade. That’s real money left on the table.

Click the link to view the presentation. Modern Herds, Modern Hurdles: Aligning Fertility Evaluations Taylor McWhorter, Ph.D., CDCB Geneticist Slides

The Hidden Cost of Assumptions That No Longer Match Reality

So here’s how something as basic as your voluntary waiting period created this mess.

For over 20 years, the genetic evaluation system has assumed that everybody’s breeding cows at 50 days after calving. Made perfect sense back when that’s what we all did, right? I remember my dad’s operation in the ’90s—50 days was gospel.

But here’s the thing: CDCB’s own data shows that by 2020, the actual industry average VWP had crept up to 67.5 days. And I know operations pushing 80-85 days, especially those high-producing herds out West trying to let cows get their metabolic act together before breeding. Even smaller operations I work with in the Northeast are extending to 70 days based on their vets’ recommendations.

As Dr. McWhorter explained it—and this really hit home for me—the evaluation methodology was assuming all cows had the opportunity to become pregnant starting at 50 days in milk. But when you’re actually waiting 70 days, there’s this phantom 20-day window where cows physically can’t be pregnant, yet the evaluation expects them to be.

What this means for your breeding decisions is pretty straightforward, and honestly, kind of frustrating. Bulls whose daughters were in extended-VWP herds looked artificially poor for fertility. Not because the daughters weren’t getting pregnant—they just couldn’t even be bred during the timeframe the evaluation was looking for.

The economic modeling suggests this mismatch alone costs an estimated $50 per cow annually based on CDCB economic modeling of missed genetic progress in distorted selection decisions and missed genetic progress. You do the math on your herd… for a 500-cow operation, that’s $25,000 every single year. It adds up fast.

Time PeriodIndustry Average VWP (Days)Evaluation System AssumptionTiming Gap (Days)Annual Cost Per Cow
1990s-200550500$0
201052502$5
201558508$15
202067.55017.5$50
2024 (Progressive Herds)75-855025-35$75-100

When Beef-on-Dairy Changed Everything We Thought We Knew

But the VWP issue? That was just the warm-up act.

You probably know this already, but the beef-on-dairy explosion happened faster than anyone expected. The National Association of Animal Breeders’ data shows beef semen sales to dairy farms hit 7.9 million units in 2023—that’s 31% of all semen sold to dairies. Five years ago? That number was basically nothing.

Holstein semen dropped from complete market dominance to just 43% of cow services by 2024, with Angus alone accounting for nearly 29% according to CDCB’s April evaluation summary. I mean, that’s a fundamental shift in what we’re doing reproductively.

The beef-on-dairy explosion happened faster than anyone predicted—Holstein semen dropped from 95% market dominance to just 43% in five years, while Angus alone captured 29% of dairy services by 2024

And it’s not just a market trend—it’s changed what “fertility” even means in a modern breeding program.

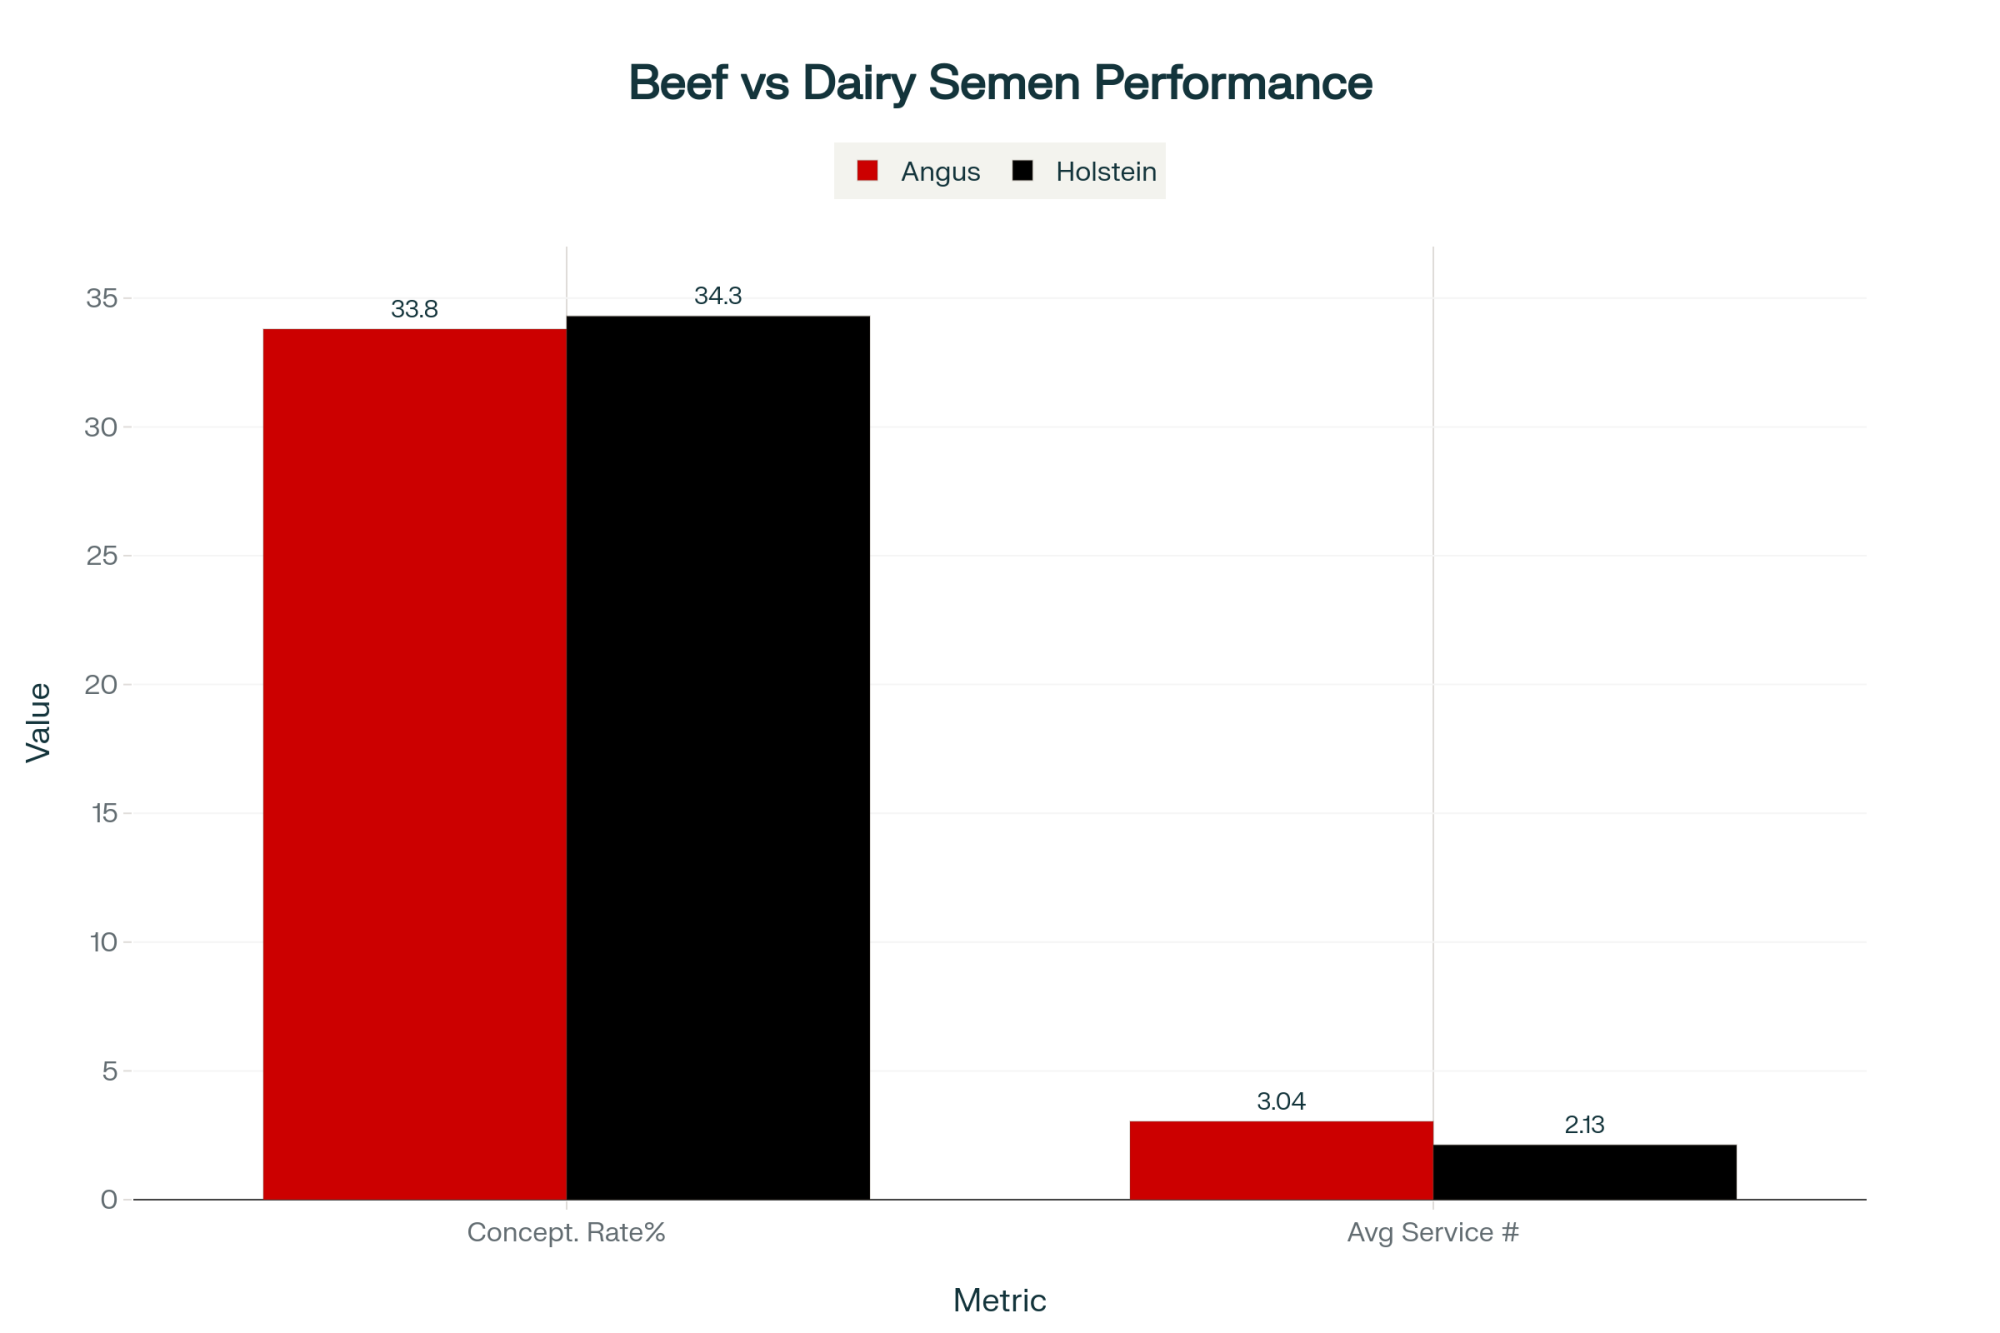
The research McWhorter presented from her University of Georgia work shows Angus semen produces slightly different conception rates than Holstein semen—we’re talking 33.8% versus 34.3% in lactating cows. But here’s what really matters: beef semen gets used strategically on problem breeders, averaging a service number of 3.04, compared to Holstein’s 2.13.

Conception rates look nearly identical—Angus at 33.8%, Holstein at 34.3%. But the story’s in the service numbers. Beef semen goes to problem breeders averaging 3.04 services, nearly 50% higher than Holstein’s 2.13. When 30% of your services use beef strategically on cows that already failed dairy breeding, the evaluation system can’t tell the difference. It attributes all that reproductive struggle to the dairy bull’s genetics. Bulls in heavy beef-on-dairy herds look artificially poor—even when their actual dairy daughters are doing just fine.

What I’ve found is that when 40-50% of services in a herd use beef semen—and those services concentrate on cows that already struggled with dairy breeding—the evaluation system can’t tell the difference. It attributes all of that to the dairy bull’s genetics.

So bulls in herds doing extensive beef-on-dairy look artificially poor for fertility, even when their actual dairy-breeding daughters are doing just fine.

The Five Games: When One Size Doesn’t Fit Anyone

Here’s what’s become crystal clear from analyzing all that data in the National Cooperator Database—you know, that massive collection of over 100 million lactation records we all contribute to…

“Fertility” has basically fragmented into at least five distinct biological processes. And each one selects for different genetic capacities.

Modern dairies aren’t playing one fertility game—they’re juggling five distinct breeding strategies simultaneously. With genetic correlations of only 0.65-0.75 between these systems, a bull ranking top 10% for elite replacements might rank bottom 30% for problem breeders. The evaluation system averages them all together and calls it “fertility merit.” No wonder your PTAs don’t work.

Think about it this way:

The elite replacement game. These are your nucleus herds using sexed Holstein semen on high-merit heifers and first-lactation cows at optimal timing. They’re pushing for maximum conception rates to produce superior replacements. Based on DHI participation patterns, about 20% of herds operate primarily this way.

You know the type—those big registered operations in Wisconsin and New York.

Commercial dairy breeding. Your typical commercial operation using conventional semen on mid-tier cows after standard VWP. This probably represents 35% or so of operations, based on what CDCB sees in their herd management surveys. Most of the 200-500 cow herds across the Midwest fall here.

Problem breeder salvage. We’ve all been there—service number four or five, just trying to get that cow pregnant before you have to cull her.

The Wisconsin research suggests this affects about 30% of the breeding-eligible population at any given time.

Beef-on-dairy terminal breeding. Strategic use of beef genetics on lower-genetic-merit cows to maximize calf value. NAAB data shows this grew from basically zero to representing 15-20% of breeding decisions in just five years. And it’s still growing.

The ET programs. Elite genetics multiplied through embryo transfer, bypassing natural breeding entirely. Small percentage overall, but concentrated in high-value genetics.

Now, current evaluations average performance across all five of these “games” into a single Daughter Pregnancy Rate or Cow Conception Rate score. But—and this is where it gets really interesting—the genetic correlations between these management systems have dropped to 0.65-0.75, based on recent genotype-by-environment research.

What’s that mean in plain English? A bull ranking in the top 10% for elite replacement production might rank in the bottom 30% for problem breeder management. Same genetics, completely different outcomes depending on which game you’re playing.

What Progressive Producers Are Learning the Hard Way

I was talking with a producer managing about 1,800 cows in Wisconsin—he’d been selecting exclusively on top-tier genomic bulls for fertility since 2019. His pregnancy rate? Still stuck around 28%.

He told me, “I kept thinking we were screwing something up with our management. We extended VWP to 72 days based on the University of Wisconsin recommendations for better first-service conception. We adopted beef-on-dairy for inventory control—now using about 35% beef semen. Everything the consultants said should help.”

What he didn’t realize—and what nobody was really talking about clearly—was that his progressive management practices were systematically penalized by the evaluation methodology.

Here’s the kicker that CDCB research has shown: high-fertility daughters enter genetic databases 6-12 months before low-fertility daughters. It’s this timing bias thing. Young bulls get their first evaluations based predominantly on their best-performing daughters. The PTAs look fantastic initially, then drift downward as more complete data rolls in.

Young bulls enter the market with fertility PTAs inflated by 25-30% because high-fertility daughters report 6-12 months earlier than struggling daughters. It’s like judging a pitcher’s ERA by only counting scoreless innings—the evaluation looks fantastic until complete data rolls in. By month 36, that elite +3.0 PTA has eroded to +2.0. Your breeding decisions weren’t wrong. You were sold incomplete scorecards.

Kind of like judging a pitcher’s ERA after only counting the scoreless innings, you know?

And it’s not just one or two operations seeing this. I’ve heard similar stories from California to Idaho—producers who thought they were doing something wrong when, in reality, the evaluation system wasn’t capturing what they were doing right.

One producer near Boise who made the shift told me his pregnancy rates reportedly improved notably after he started ignoring genomic fertility PTAs and selecting more on within-herd performance. Sometimes going backwards is actually going forwards.

Practical Steps for Managing Through the Uncertainty

What I’ve noticed is that savvy producers aren’t waiting for the 2026 updates. They’re already adjusting their selection strategies based on what they’re seeing in their own barns.

After talking with consultants and progressive producers across the country, several strategies keep coming up.

First, you’ve got to discount those sky-high PTAs. Many consultants I work with are recommending haircuts of 25-30%on top-ranked fertility PTAs. A large-herd manager I know in Idaho put it pretty bluntly: “A bull showing +3.0 DPR? We treat him like he’s maybe a +2.0, +2.2 at best for our operation.” It’s not perfect, but it’s more realistic.

Trust proven bulls for fertility. Dr. Kent Weigel at Wisconsin-Madison has published extensively on this—progeny-proven bulls with 750+ daughters have already been through the timing bias wringer. While their genetics may be a generation older, their fertility predictions have proven more reliable in field conditions.

Match your bulls to your management. If you’re running an extended VWP with substantial beef-on-dairy, bulls evaluated in traditional 50-day VWP environments may underperform pretty dramatically. With those genetic correlations of 0.65-0.75 between evaluation and deployment environments, you’re looking at only 65-75% of predicted gains actually showing up.

And don’t ignore your own data. For herds that are substantially different from national averages, selecting replacement heifers based on actual performance in your environment may outperform genomic predictions. A heifer that conceives on first service in your system? She’s carrying genetics that work for you, regardless of what her genomic PTA says.

I know one producer in Pennsylvania who’s been tracking this meticulously—he’s seen better results selecting on within-herd performance than chasing high genomic PTAs for fertility. Sometimes the old ways still work.

They’re also diversifying bull selection. Rather than putting all their eggs in 3-5 elite bull baskets, they’re spreading services across 8-12 sires. When top-ranked bulls prove overestimated—which history suggests some will—the damage is contained.

Many are building custom indices, creating herd-specific selection criteria that weight production traits (where evaluations remain pretty accurate) more heavily than fertility traits (where accuracy has… degraded).

Producer networks are sharing real outcome data. “This bull delivered, that one didn’t”—the kind of real-world validation that matters more than PTAs sometimes.

Keep in mind, with generation intervals what they are, you’re looking at 2-3 years before these breeding strategy adjustments really show up in your pregnancy rates. It’s a marathon, not a sprint.

Selection StrategyOld Approach (Pre-2024)New Reality (2024+)Impact
Trust Top Genomic PTAsUse +3.0 DPR at face valueTreat +3.0 as +2.0-2.225-30% inflation risk
Apply 25-30% DiscountNot appliedApplied to all elite PTAsMore realistic expectations
Young Bulls (<750 daughters)Primary selection poolHigh risk for inflationTiming bias exposure
Proven Bulls (750+ daughters)Considered “”outdated genetics””More reliable predictionsAlready corrected
Bull Diversification3-5 elite bulls8-12 bulls minimumRisk mitigation
Selection Weight on Fertility35-40% of TPI weight15-20% of custom indexReduce unreliable traits
Custom Index ApproachStandard TPI/NM$Production-heavy weightingWeight what works

Industry Trends Reshaping How We Think About Fertility

The changes coming in 2026 aren’t happening in a vacuum. They’re responses to massive shifts that caught the evaluation system flat-footed:

You’ve got management fragmentation—DHI data shows VWP now ranges from 50 to 85+ days across herds, compared to that narrow 45-55 day range we had two decades ago.

The beef integration explosion is real. NAAB reports show that 7.9 million units of beef semen were produced in 2023, up from 7.6 million the previous year. That’s not a trend anymore—it’s the new normal.

Then there’s the problem of missing data. CDCB estimates that about 6.6% of breedings have unknown or unrecorded service sires. Hard to evaluate what you can’t even identify, right?

Technology adoption is huge, too. The 2024 National Dairy FARM Program data suggests that around 68% of herds with 500 or more cows now use some form of automated heat detection. That’s creating management variation that the evaluations just can’t capture yet.

And here’s what really accelerates everything: generation intervals have collapsed from about 7 years pre-genomics to 2.5 years now, according to Holstein Association USA genetic trend reports. So evaluation errors multiply through breeding pyramids faster than… well, faster than the system can correct them.

What’s Actually Changing in 2026 (If Everything Goes Through)

Dr. McWhorter outlined nine specific updates at World Dairy Expo, pending Interbull validation this January. Let me break down what actually matters for us:

They’re finally going to adjust for variable VWP, accounting for herd-specific waiting periods from 50 to 85 days. About time, right?

Service sire breed effects will be adjusted for differences in conception rates between dairy and beef semen. That should help with the beef-on-dairy distortion.

There’s a 36-month age restriction coming to prevent that timing bias from early-reporting daughters I mentioned.

They’re introducing First Service to Conception as a new trait that measures only the post-breeding interval. That’s actually pretty clever—sidesteps a lot of the VWP confusion.

The variance components are being updated using the most recent 10 years of data rather than… well, let’s just say, much older averages.

Plus improvements to genomic validation, methods for handling those unknown service sires, some tweaks to the Early First Calving trait, and better modeling across multiple lactations.

If these pass Interbull validation in January, we’ll see implementation in April 2026 evaluations at the earliest. Miss that window? Add another 6-12 months minimum. So don’t hold your breath.

The Bigger Picture: Why Change Takes Forever

You might wonder why it takes 20 years to fix problems everyone can see. I’ve been asking the same question for… well, a long time.

The answer lies in how genetic evaluation governance works. CDCB operates through consensus among groups with very different priorities. Breed associations worry about the continuity of genetic trends. AI studs are protecting bull valuations. Data providers are managing costs. Getting them all to agree? It’s challenging, to put it mildly.

As Dr. Paul VanRaden explained at his retirement seminar last year, the system is designed for stability and credibility, not rapid adaptation. That served us well when management practices changed slowly. But when beef-on-dairy transforms the industry in 5 years, our 15-20 year update cycle just can’t keep pace.

What’s fascinating—and maybe a bit frustrating—is that this governance structure is working exactly as designed. It just wasn’t designed for the pace of modern dairy innovation.

Looking Ahead: What This Means for Different Operations

The impact varies quite a bit depending on your operation. And our friends north of the border in Canada are dealing with similar challenges through their own evaluation system—affecting international semen trade in ways we’re just starting to understand.

Smaller herds—say, under 200 cows—are often less affected because many still operate closer to traditional management. But those adopting beef-on-dairy to capture calf premiums? They face the same evaluation distortions as anyone.

Large Western dairies have been hit hardest. They led beef-on-dairy adoption and VWP extension. Their progressive management gets penalized most severely by these outdated evaluation assumptions.

In the Southeast, heat stress complicates everything, making it harder to separate management effects from genetic merit. The evaluation updates may actually help these herds most by reducing some of those confounding factors.

And grazing operations? That’s a different ballgame entirely. Seasonal breeding and pasture-based systems create genotype-by-environment interactions that the evaluation system barely acknowledges. Many have already moved to within-herd selection just out of necessity.

For seasonal calving systems in places like New Zealand or Ireland? They’re playing an entirely different game that the evaluation system barely recognizes.

Key Takeaways for Your Breeding Program

After all this, several lessons really stand out:

  • Your management wasn’t failing—the measurement was. If fertility hasn’t improved despite selecting high-PTA bulls for years, evaluation bias likely explains most of that gap. So you can stop second-guessing yourself.
  • Progressive practices have been getting penalized. Extended VWP, beef-on-dairy integration, those individualized strategies that actually improve fertility? They can make genetic evaluations look worse. The system has been interpreting sophistication as genetic failure.
  • Production traits remain reliable, thankfully. Milk yield, components, and type evaluations maintain high accuracy with genetic correlations above 0.90 across different management systems, according to recent published research. So focus your genetic selection firepower there.
  • For fertility specifically? Proven beats potential right now. Young bulls’ fertility PTAs are most inflated. Bulls with large progeny groups provide predictions you can actually bank on.
  • And honestly? Local performance beats global predictions. For traits with high management sensitivity, your herd’s actual outcomes predict future performance better than national evaluations that measure different environments.
  • Change is coming—slowly. The 2026 updates will help, but won’t fully resolve the fragmentation across management systems or the historical bias already baked into current breeding pyramids.

Fertility by the Numbers: A Quick Review

  • Discount elite fertility PTAs by 25-30%
  • Prefer bulls with 750+ daughters for fertility
  • Spread services across 8-12 bulls
  • Genetic correlation between evaluation and your environment: 0.65-0.75
  • Cost of VWP mismatch: $50/cow annually

For now, those of us who understand these limitations can make smarter breeding decisions: discounting inflated predictions, preferring proven performance, and trusting our own herds’ outcomes when genomic promises don’t match what we see in the barn.

The evaluation system is adapting, just at a pace that ensures progressive producers will keep operating at least one management revolution ahead of the genetic measurements trying to catch up. But that’s not necessarily a crisis; it’s just the new reality we need to factor into our breeding decisions.

After all, we’ve been dealing with the difference between promise and performance since the first bull stud opened, and we’ll figure it out, like we always do.

Complete references and supporting documentation are available upon request by contacting the editorial team at editor@thebullvine.com.

Learn More:

Join the Revolution!

Join over 30,000 successful dairy professionals who rely on Bullvine Weekly for their competitive edge. Delivered directly to your inbox each week, our exclusive industry insights help you make smarter decisions while saving precious hours every week. Never miss critical updates on milk production trends, breakthrough technologies, and profit-boosting strategies that top producers are already implementing. Subscribe now to transform your dairy operation’s efficiency and profitability—your future success is just one click away.

NewsSubscribe
First
Last
Consent

Daughter Pregnancy Rate (DPR) vs. Cow Conception Rate (CCR): Which will help you improve your herd’s fertility?

Learn the main differences between DPR and CCR in dairy cow fertility. How can these measures improve your herd’s breeding success and profits?

Think about dairy farming as solving a puzzle, where you want high milk production and healthy cow fertility. In the 1990s, breeders focused more on milk fat and protein, but this caused fertility problems. Cows had longer gaps between giving birth, which resulted in reduced productivity and profit. Today, we aim for balance, and tools like the Daughter Pregnancy Rate (DPR) and Cow Conception Rate (CCR) help us understand fertility better. However, it can be challenging to determine the appropriate times to use these tools and to distinguish between their unique functions. This article allows farmers to balance producing milk and keeping cows healthy to earn more money.

The Evolution of Dairy Cow Fertility Metrics

In the 1990s, the dairy industry focused on increasing milk production by selecting cows with higher milk fat and protein. However, this emphasis led to problems as cows became less fertile and required more time to conceive. By the early 2000s, a shift in strategy was necessary to address these fertility issues. 

YearAverage Milk Production (lbs/cow/year)% Improvement in Milk ProductionAverage Fertility Rate (%)% Change in Fertility Rate
199016,000 45 
200018,50015.63%42-6.67%
201020,0008.11%39-7.14%
202023,00015.00%36-7.69%

The introduction of the Daughter Pregnancy Rate (DPR) in 2003 offered a solution. The DPR predicts how frequently cows become pregnant every 21 days, enabling farmers to select bulls that produce more fertile daughters without compromising milk yield. In 2010, the Cow Conception Rate (CCR) was introduced to measure how likely cows are to conceive after insemination, allowing for more informed breeding decisions and improved herd health. 

Implementing DPR and CCR addressed the fertility challenges of the 1990s, resulting in healthier and more profitable dairy herds.

Delving Into Daughter Pregnancy Rate (DPR)

Daughter Pregnancy Rate (DPR) is a key measure in the dairy industry used to evaluate the fertility potential of dairy cows. It shows the percentage of non-pregnant cows that get pregnant every 21 days. This helps predict how well future daughters of a bull will become pregnant compared to the average. 

DPR calculation includes: 

  • Tracking ‘days open’ is the time from calving until a cow gets pregnant again.
  • Considering the waiting period after calving, this data can be turned into a pregnancy rate with a formula.
  • Looking at up to five lactations across different cows for a broad view.
  • Suppose the Predicted Transmitting Ability (PTA) for the pregnancy rate increases by 1%. In that case, it lowers ‘days open’ by four, showing potential genetic progress.

DPR is important for farmers who want to make their herd better over time. It’s included in key selection tools like Net Merit (NM$), Total Performance Index (TPI), and Jersey Performance Index (JPI). A study by the University of Wisconsin-Madison showed that raising DPR by 1% could make an average of $35 more per cow yearly.

However, DPR has its downsides. Its heritability is only 4%, meaning environment and management have a significant impact. Because of this, genetic progress is slower. Also, calculating the data needed for DPR can be challenging for some farmers.

The Precision of Cow Conception Rate

The Cow Conception Rate (CCR) is essential in dairy farming because it shows how well a cow can get pregnant. Unlike broader fertility measures, it measures how many inseminations lead to a confirmed pregnancy. This specific focus makes CCR valuable for checking if artificial insemination is working on farms. Its calculation is simple: it looks at the percentage of cows pregnant after being inseminated. This precise measure helps farmers evaluate their breeding plans quickly. Good CCR means fewer inseminations, which cuts costs and helps maintain steady calving, leading to regular milk production. This improves a cow’s overall productivity over its lifespan, showcasing the economic significance of CCR. 

Nevertheless, the Cow Conception Rate (CCR) presents challenges. It can be affected by factors like the cow’s health, semen quality, and the timing of insemination. These factors mean that CCR might not always be accurate, so farmers should consider them when interpreting CCR data. However, when used carefully, CCR helps improve dairy farming, supports genetic advancements, and promotes better breeding practices.

Cow Conception Rate (CCR) has even lower heritability, 1-2%. This means it’s even more affected by outside factors like breeding methods and cow health. Changing this trait with genetics alone is hard. Still, DPR and CCR are critical to improving the whole herd. Knowing how these traits are passed down helps farmers pick the right breeding goals and improve how they care for their cows to boost fertility.

Contrasting DPR and CCR

The Daughter Pregnancy Rate (DPR) and Cow Conception Rate (CCR) are critical for understanding dairy cows’ fertility. They measure different things, which affects how they are used. 

AspectDaughter Pregnancy Rate (DPR)Cow Conception Rate (CCR)
TimeframeExamine a cow for 21 days to determine whether she becomes pregnant.Examines each breeding attempt to decide whether or not it was successful.
ScopeIt covers overall herd fertility, including how well cows are detected in heat and inseminated.It focuses on whether each insemination results in pregnancy.
Genetic InfluenceMore about long-term genetic improvement focusing on genetics.About the immediate outcome and is more affected by factors like how well cows are managed.
Data RequirementsRequires extensive data, such as calving dates and the number of pregnant cows.It is more straightforward, requiring only information on whether inseminations worked.
Practical ApplicationsIt is excellent for long-term planning to improve cow genetics and reduce the time between calvings, helping keep cows healthy and farms profitable.It helps with quick decisions about breeding and shows how well an AI program is working, ensuring constant milk production.

Farmers use the Daughter Pregnancy Rate (DPR) and Cow Conception Rate (CCR) to help with breeding goals. Choosing bulls with high DPR scores improves herd fertility and encourages cows to give birth more often. This is usually combined with traits like milk production and disease resistance, which helps with herd health and long-term success

CCR shows how well cows get pregnant after insemination, which helps determine whether the expensive semen works. Watching CCR also helps plan when to breed cows, reduce the time without calves, and identify any food or health problems to increase productivity

Why Only Using Positive DPR Sires May Not Be The Best Strategy

Only bulls with a good Daughter Pregnancy Rate (DPR) might not be the best way to make cows more fertile. That’s because many things affect how well cows can have calves. First, DPR isn’t very reliable because only a tiny part, about 4%, comes from genetics. Weather, food, and care matter more for cows with calves. Also, sometimes bulls with good DPR might not be as good at producing milk, so it’s better to balance these traits for healthy cows. 

If you focus only on DPR, you could miss other vital traits like the Heifer Conception Rate (HCR) and Cow Conception Rate (CCR). These measures help understand how well cows can get pregnant. Plus, only thinking about genetics skips over essential factors like how cows are fed and cared for every day. Improving these areas can often boost how well cows reproduce faster and more effectively than just looking at their genes.

Another major problem with the Daughter Pregnancy Rate (DPR) is that it doesn’t account for the time farmers let cows rest before breeding, known as the voluntary waiting period (VWP). For example, suppose a farm lets high milk-producing cows wait longer before breeding. In that case, these delays can make their fertility look worse in the DPR calculations. This happened with the bull Lionel, whose daughters have a low DPR of -4.4 but a better Cow Conception Rate (CCR) of -0.3. Lionel’s daughters produce much milk, so owners let them keep milking longer before breeding them. Even though they get pregnant quickly once bred, the DPR unfairly lowers their fertility score because it doesn’t take this waiting time into account. Unlike DPR, CCR focuses on whether cows get pregnant, not when they are bred. Reflecting the shift from DPR to CCR, Holstein USA has reduced DPR’s importance from 0.4 to 0.1 and increased CCR’s from 0.1 to 0.4 in their fertility index. 

Embracing the Comprehensive Daughter Fertility Index

Farmers might consider using the Daughter Fertility Index (DFI) instead. DFI looks at more than just DPR, including calving ease and how often cows get pregnant, giving a better overview of a cow’s ability to reproduce. This helps farmers make better breeding choices, looking at the cow’s genetic traits and how well she fits into farm operations

In many places, the Daughter Fertility Index (DFI) is key for judging a bull’s daughter’s reproduction ability. DFI includes: 

  • Daughter Pregnancy Rate (DPR): Measures how many cows get pregnant every 21 days, showing long-term fertility.
  • Heifer Conception Rate (HCR): How likely young cows are to get pregnant when first bred.
  • Cow Conception Rate (CCR): Examines how often adult cows get pregnant after breeding.
MetricContribution to Profitability
Daughter Pregnancy Rate (DPR)Reduces days open, leading to more consistent milk production cycles and lower reproductive costs, enhancing long-term genetic improvement.
Cow Conception Rate (CCR)Focuses on immediate pregnancy success, reducing insemination costs, optimizing calving intervals, and improving short-term financial margins.
Daughter Fertility Index (DFI)Combines genetic evaluations to target comprehensive fertility improvements, effectively balancing reproduction with production demands to maximize profit.

Looking at these factors, DFI gives a fuller picture of a bull’s daughters’ fertility, helping farmers make smart farm breeding decisions.

Harnessing Technology

The future of dairy farming is changing with new technology. Tools like automated activity trackers help farmers determine the best time to breed cows by watching their move. This helps make more cows pregnant, improving the Cow Conception Rate (CCR). For instance, devices like CowManager or Allflex watch how cows move and eat, helping farmers know when to breed. This can make CCR better by up to 10% in some cases. One tool, the SCR Heatime system, uses rumination and movement tracking to find the best times for breeding, potentially raising pregnancy rates by up to 15%. 

Additionally, AI-powered imaging systems give detailed insights into cows’ health. They help find health problems early, making the herd healthier and more fertile. For example, some farms use AI systems that combine this tracking data with other scores to improve breeding choices, potentially boosting overall herd fertility by up to 20%. 

Data analytics platforms are essential for managing herds. They help farmers understand large amounts of data and predict health and reproductive performance. Reducing open days or when a cow isn’t pregnant can improve the Daughter’s Pregnancy Rate (DPR). 

Using data helps make dairy farms more efficient and profitable. These new tools allow for better choices, leading the way to the future of farming as we approach 2025 and beyond.

Leveraging DPR and CCR for Enhanced Herd Management

In today’s dairy farming, using the Daughter Pregnancy Rate (DPR) and the Cow Conception Rate (CCR) helps improve herd management and make more money. Here’s how they can help: 

  • Use DPR for Future Improvement: Choose bulls with high DPR scores to slowly improve your herd’s fertility. This can help cows get pregnant faster and shorten the time they don’t produce milk.
  • Apply CCR for Fast Results: Focus on CCR to speed up breeding decisions. This ensures that cows get pregnant on time and continue producing milk efficiently.
  • Leverage the Daughter Fertility Index (DFI): The DFI is an overall measure that includes genetic and environmental factors and can boost reproductive performance and sustainability.
  • Adopt New Technologies: Use advanced tools like health monitors and AI systems for real-time updates on cows’ health and fertility. These tools let you act quickly to fix any problems.
  • Review and Change Plans: Always review and change your breeding plans to accommodate your farm’s changing needs and market conditions.

Using DPR and CCR data to improve your breeding program, you can boost your herd’s fertility, productivity, and long-term gains, ensuring success on your farm. Start by checking your current metrics and getting advice from a breeding expert to make a customized plan for your herd.

The Bottom Line

We’ve discussed two essential ways to measure fertility in dairy cows: Daughter Pregnancy Rate (DPR) and Cow Conception Rate (CCR). These are helpful tools for dairy farmers who want to get the most out of their cows, both now and in the future. Knowing when and how to use DPR and CCR helps farmers make smart choices that fit their needs. 

The main idea here is about picking the right ways to improve how cows reproduce. As farming changes, mixing old methods with new technology is essential. Doing so can lead to a better and more prosperous future. This approach is like standing at a crossroads, choosing between old practices and the latest technology. 

It’s time for dairy farmers to look at their plans for breeding cows. Using what they’ve learned can help them make better choices. Imagine a future where every cow is used to its full potential and every choice is based on data. Are you ready to solve the final piece of this puzzle and revolutionize your herd’s potential?

Key Takeaways:

  • Daughter Pregnancy Rate (DPR) and Cow Conception Rate (CCR) are critical fertility metrics in dairy cattle breeding. Each provides unique insights into herd reproductive performance.
  • DPR evaluates long-term fertility and genetic improvement but is criticized for its instability due to calculation methods based on herd management variables rather than direct breeding outcomes.
  • CCR offers a more immediate assessment of a cow’s conception success, making it a practical tool for evaluating breeding effectiveness and managing costs in dairy operations.
  • The shift from primarily focusing on milk production to integrating fertility metrics like DPR and CCR is crucial for enhancing the profitability and sustainability of dairy farming.
  • Technological advancements in reproductive analytics are reshaping the dairy industry, offering farmers new tools to optimize reproductive strategies and overall herd management.
  • Farmers must balance DPR and CCR based on their specific operational goals. DPR favors long-term genetic strategies, while CCR addresses immediate breeding outcomes.

Summary:

The article looks at two essential tools in dairy farming: Daughter Pregnancy Rate (DPR) and Cow Conception Rate (CCR). These help farmers decide how to breed cows for better fertility and milk production. In the past, dairy farming focused too much on milk, which hurt fertility. DPR helps understand long-term fertility, while CCR shows how likely a cow is to get pregnant now. New technology like activity trackers and AI can help make dairy farms more productive and sustainable. But be careful with DPR; it’s not perfect. DPR and CCR can help farmers make smart decisions to improve their farms.

Learn more:

Join the Revolution!

Bullvine Daily is your essential e-zine for staying ahead in the dairy industry. With over 30,000 subscribers, we bring you the week’s top news, helping you manage tasks efficiently. Stay informed about milk production, tech adoption, and more, so you can concentrate on your dairy operations. 

NewsSubscribe
First
Last
Consent

Fertility: You Get What You Breed For

How often have you heard a 4H leader, FFA member, classifier or show judge say a heifer or cow must have slope from her hips to her pins and be wide in the pins because that’s what we need for good fertility? Yes we have all heard that many times. But is it true? Could it be that the Holstein bloodlines we have selected were poorer for fertility than other bloodlines we left behind half a century ago? And that rump conformation has a low correlation with fertility.

A Colorful Opinion

Something we can all agree on is that the fertility levels in our herds, the world over, are not what breeders would like them to be. I well remember just a year ago when I had a discussion with an old time Jersey breeder. True to form he was telling this Holstein guy that Holstein breeders have ruined the breed. Sure higher butterfat and protein yields and udders much higher off the ground were great moves but why the excessive stature, very flat and deep rear rib and the demand that animals be tall in the front end when nature did not make them that way? “Jersey cows don’t need to have sloping rumps in order to quickly get back in-calf. So why do Holsteins need sloping rumps?” His bottom line was that by going for the tall skinny cow syndrome we have selected against reproductively sound females. His concluding statement was “You are breeding cows not runway models.” Think about it, shorter, rounder cows that may give a little less milk but get in-calf quicker are very likely preferred by milk producers to the tall, deep rear rib, walk uphill ones.

Have we won a Little but Lost a Lot?

Have we selected our Holsteins for the ones that do not quickly get back in-calf? Is it possible that our breeding strategies have taken us in a wrong direction when female fertility is frequently the biggest cow problem that breeders have? (Read more: How Healthy Are Your Cows?)

Certainly over the past half century the average production of Holsteins has doubled. And yes in the past decade we are seeing more outstanding scoring (type classification) cows. And the winners at the shows are super cows with awesome mammary systems.

However whether it is genetics, nutrition or management, our calving intervals are longer and pregnancy rates are perhaps half what they were forty years ago. As well with the need for breeders to focus today on profitability there is the need to replace high cost manual labour with technology and there are moves ahead pointing to less use of drugs and medicines for food safety reasons. Therefore we need to find some way to put reproduction efficiency back into the Holstein cow. And do it by selection rather than by cross-breeding.

Skinny at Odds with Conception

Research and breeder experience has brought to our attention that cows that have above average body conditioning get back in-calf quicker and with less trouble than cows that sacrifice their body condition due to high yields, poor nutrition, inadequate transition cow feeding, poor conformation, … or maybe some combination of all of those.

The Billion Dollar Question

So I ask. “Now that we have sire and cow indexes for Daughter Pregnancy Rate (USA) and Daughter Fertility and Body Condition Score (Canada) are breeders using those indexes in their Breeding Programs?”

Bulls That Get Used

The Canadian Dairy Network, last week, published the thirty Holstein sires with the most daughters registered in Canada in 2012 (Read more: Canadian A.I. Market Share and Most Popular Sires for 2012) accounting for 40% of the total registrations. The remaining 60% were sired by 5900 other bulls. The Bullvine decided to study in some depth the 20 sires with the most registered daughters in Canada in 2012. Those twenty sired 35% of the females registered which should be a good benchmark for where the breed is heading.

Table 1 Sire Comparison – 2012 Daughters Born vs. 2011 Top Sires Available

GroupLPIMilk (kg)Fat (kg / %)Protein (kg / %)CONFMSF&LHerdLifeDFSCSUdepthCA
20 Bulls-most registered 20122075103160 /+.21%41 / +.06%15128105982.894s102
20 Bulls - top in 20112392139367/+.16%55 / +.07%101091081022.874s104
Difference-317-362-7-1452-1-3-4-0.020-2

Table 1 compares the twenty sires with the most registered daughters in 2012 to the top twenty Canadian proven LPI sires available to Canadian breeders in 2011. The short answers to the comparisons are: breeders use sires with lower LPIs, less production, more type, less fertility and less Herd Life than the very top LPI sires that A.I. organizations marketed. The shocking truth is that ten of the top twenty most used sires were below average for their Daughter Fertility (DF) indexes. One of those twenty sires had a DF index of only 88 while the top two sires were rated at 107 & 106. High (top 10%) but not overly high.

In case you are wondering if this is a Canadian phenomenon you can refer to a recent Bullvine article (Read more: Top Sires North American Breeders Are Using). The sires with most registered daughters in the USA have the same deficiency in their genetic merit for female fertility. Six of the top ten bulls with the most registered daughters in the middle half of April 2013 were below average for Daughter Pregnancy Rate. Different country same story.

Let’s take the Bull by the Horns

Even though we have only had fertility indexes on bulls for a few years, we as breeders are not using them to genetically improve female fertility in our herds. And it likely goes beyond that – are our A.I. organizations using them when selecting the parents of the next generation of bulls? After all over 90% of the genetic improvement in a herd comes from the sires used.

Fertility Sires

Sires do exist that top the April 2013 North American TPI™ and LPI listings and have fertility ratings in the top 25% of the Holstein breed. Breeders wishing to genetically improve their herds for female fertility should consider the following sires:

Table 2 Top Sires with High Fertility – April 2013

Table 2 Top Sires with High Fertility – April 2013

Click on image for enlargement

Of course we all want to know what we will have to give up to get the female fertility. Further analysis of the twenty-four bulls listed in Table 2 shows that only significant concession would be in ‘show type’ for eight of the twelve top proven sires.  All bulls on this listing have above average indexes for PTAT or CONF.

The Bullvine Bottom Line

Half a century of breeding for increased yields, taller and more angularity cows have taken their toll on the fertility in our herds. Female fertility indexes are available for both males and females. With genomics these indexes became much more accurate. Now is the time to put the genetics for female fertility back into our modern Holsteins. It is not a “Perhaps or Maybe”, it is a “MUST”!


The Dairy Breeders No BS Guide to Genomics


Not sure what all this hype about genomics is all about?

Want to learn what it is and what it means to your breeding program?

Download this free guide.


[related-posts-thumbnails]

FACT VS. FANTASY: A Realistic Approach to Sire Selection

How often do you select a mating sire for the reasons you typically cull animals, as opposed to what your perceived ideal cow looks like?  Further to our discussion about what the Perfect Holstein Cow looks like we here at the Bullvine started to ask ourselves, “How often do we choose our matings based on what we think the perfect cow looks like? vs. what our true management needs are?” Far too often sire selection is based on the fantasy of breeding that next great show cow or VG-89-2YR instead of facts needed to breed that low maintenance cow that will stay in your herd for many lactations and produce high quantities of milk.  Do your sire selections overlook your management needs?

Speedy Selection. Long-Lasting Problems

Discernment is the hardest part of sire selection.  Seeing your herd for what it is and what its genetic needs are is step one.  Step two is choosing what will work for you almost three years from now when the daughters of the sires you use today will be entering the milking string.  The old adage was “breed for type and feed for production.”  But how many breeding stock animals have you sold recently based solely on conformation?  How many will you be selling in three years based on their type?  What are the revenue sources for your farm now and in the future?  If your answer is “We get our revenue from the milk cheque from as few cows as possible and with as much profit per cow as possible” then selecting for type could mean that your sire selection is out of alignment with your management needs.

How Can You Tell If You Are You Out of Sync?

One place to determine where your herd has issues is to look at the reasons for and the frequency of culling. Every cow that leaves your herd for any reason other than a profitable sale is an indicator of the issues that could be arising from sire selection that is out of alignment with what is going on in your herd.

The Bullvine found the following information on milking age females that are removed from herds:

  • Over 35% of cows in a herd are replaced annually. That is costly!
  • The top known reasons for culling or removing cows are:
    • Infertility  / reproduction                    23.1%
    • Sold for dairy purposes                       21.4%
    • Mastitis                                               13.8%
    • Feet and Legs                                        9.6%
    • Low production                                     7.6%
    • Total    75.5%
  • The other known reasons for culling or removing cows are:
    • Injury               10.0%
    • Sickness           7.0%
    • Old Age           2.4%
    • Diseases          1.8%
    • Bad Temperament      0.9%
    • Difficult Calving          0.9%
    • Conformation 0.9%
    • Slow Milker                 0.6%
    • Total    24.5%

Are You Breeding to Spend Money or Are you Breeding to Make Money?

You may be comfortable with your culling rate especially if it isn’t too far off “normal”. However when you look closely at the cows that remain in your herd how “needy” are they?  Staff time, vet calls, hoof trimming, semen, drugs, supplies, extra time in the dry cow pen and removing cows from herds before they reach maturity – these all add up to significant dollars down the drain.  Therefore, anything that can be done in sire selection to minimize these costs goes right to improving the financial bottom line.  All unbudgeted costs mean less profit. If an animal is culled early, it does not matter where she placed at the local show or that her sire was a popular bull that left fancy udders.  If he also left poor feet and low fertility, that costs you money.

A More Realistic Approach: Breed for the Bottom Line Not Just the Top Number

Often top bulls for total index are put forward to breeders for their use, without regard for the bull’s limiting factors.  The Bullvine doesn’t support that approach.  We recommendation that minimum sire selection values be set for the reasons cows are culled so that sires used in a herd don’t create new problems while the breeder tries to solve the current ones.

Here are the Bullvine we recommend the following requirements bulls should meet to be considered for use by bottom line focused breeders:

  • In Canada
    • Lifetime Profit Index   > +2000*
    • Daughter Fertility          > 100
    • Somatic Cell Score         < 2.90
    • Feet & Legs                      > +5
  • In USA
    • Total Performance Index        > 2000*
    • Daughter Pregnancy Rate          > 1.0
    • Somatic Cell Score                    < 2.90
    • Feet & Legs Composite               > 1.0

* A high minimum value has been set for both LPI and TPI to address the removal of cows for low production and so animals sold for dairy purposes can be in demand for their milk producing ability.

THE BULLVINE BOTTOM LINE

Every dairy breeder wants a superior herd and wants to eliminate the daily annoyances, costs and loss of valuable cows due to infertility, mastitis and feet problems and low production. Breeders should choose the best sires that correct the actual problems that they face in their herd instead of chasing a fantasy that has nothing to do with their reality.

The Dairy Breeders No BS Guide to Genomics


Not sure what all this hype about genomics is all about?

Want to learn what it is and what it means to your breeding program?

Download this free guide.


[related-posts-thumbnails]

Send this to a friend