Archive for Dairy Revenue Protection

Powder Just Outpriced Cheddar: The $15,000/Month Gap Reshaping Your 2026 Milk Check

NDM’s best week since 2007 exposed a Class III/IV spread that’s costing cheese-pool herds $10,000–$15,000/month. Four moves before spring flush.

Executive Summary: If you’re shipping to a cheese-dominant handler, the Class III/IV spread is costing your operation $10,000 to $15,000 a month on 500 cows. NDM surged 18¢ this week to $1.64/lb — its strongest weekly gain since May 2007 — while Cheddar settled at $1.4725 and Class IV futures pushed into the high $18s versus Class III in the low $17s. The structural driver: U.S. powder output in 2025 fell to its weakest level since 2013 while over $11 billion in new processing capacity flowed to cheese and whey, not dryers. That imbalance has staying power. DMC enrollment closes in 52 days, and four moves — DRP restructuring, DMC stacking, component optimization worth $1.00–$1.50/cwt, and a hard look at your handler alignment — can narrow this gap before spring flush closes the window.

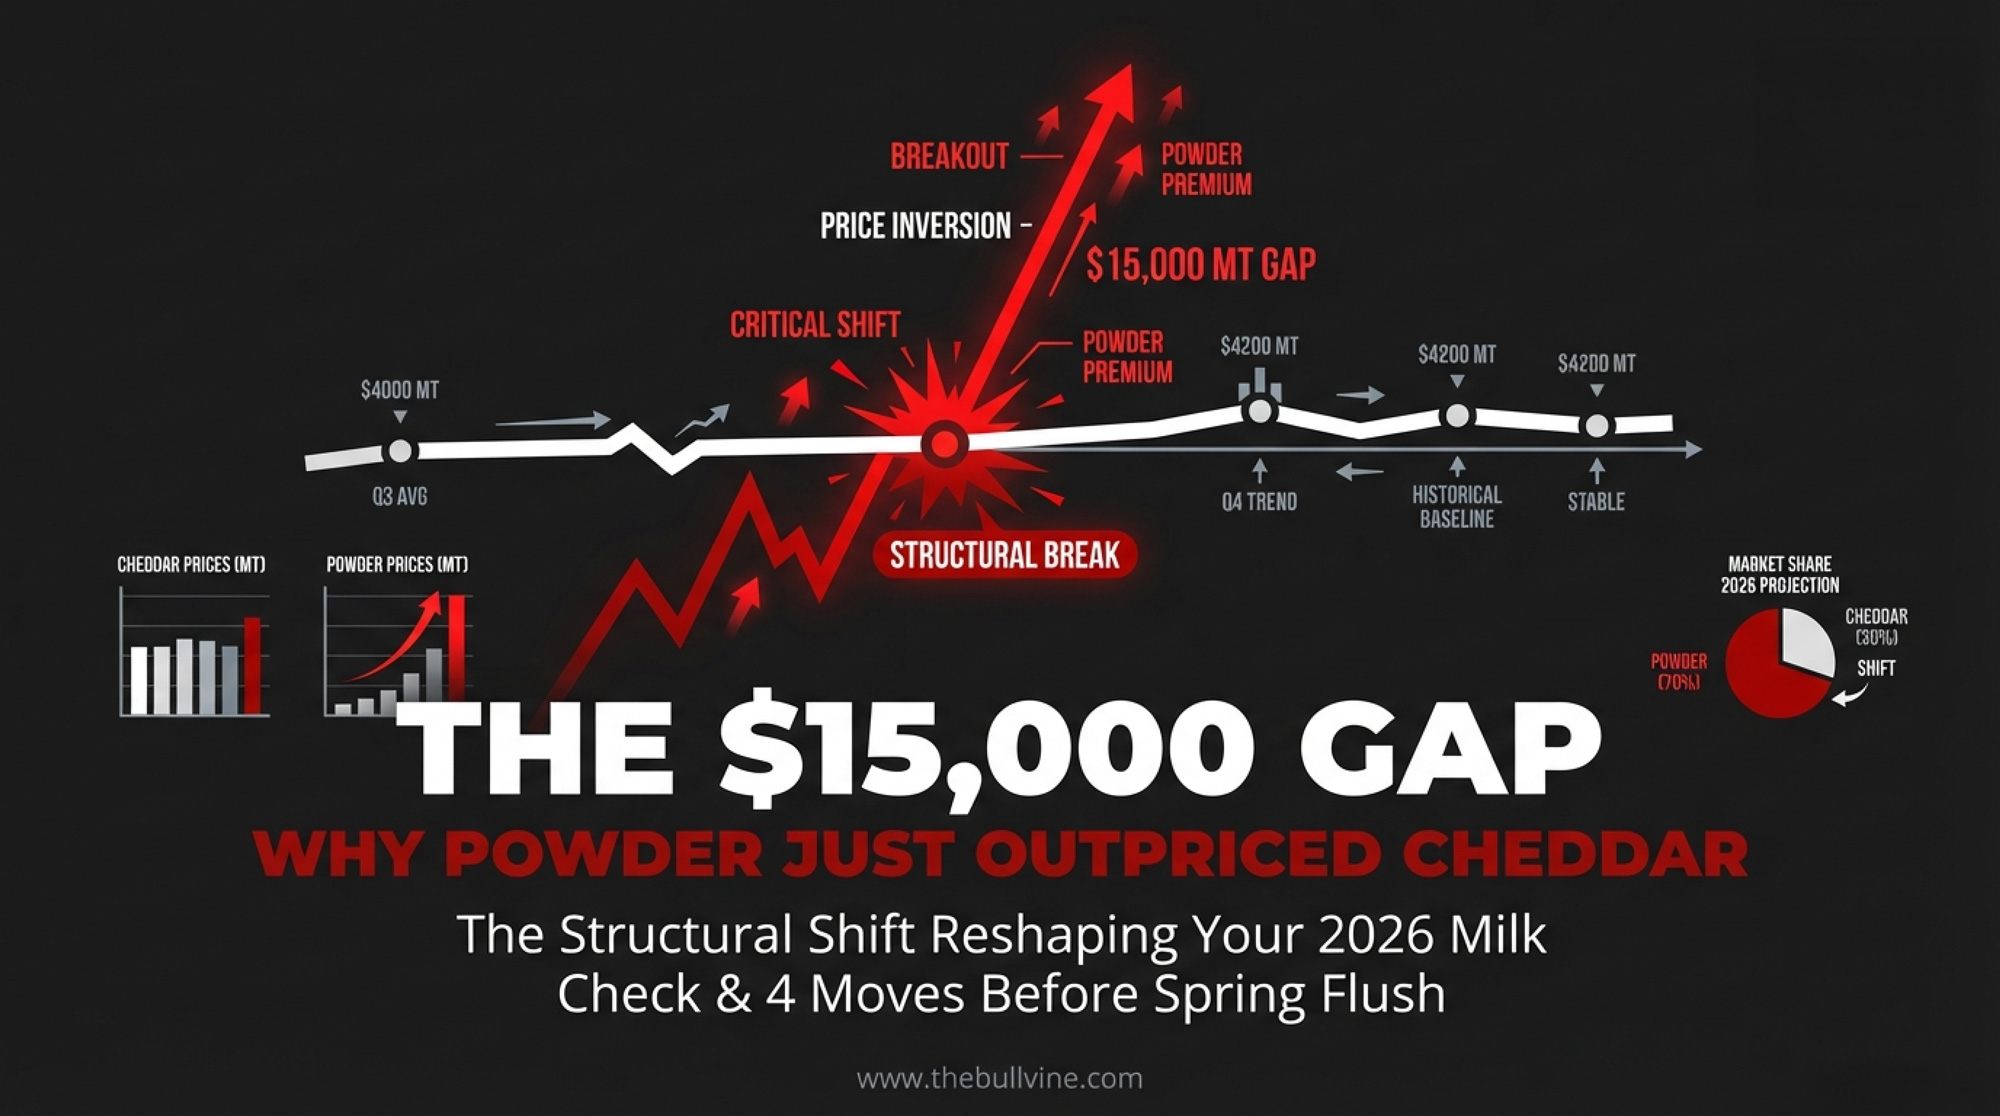
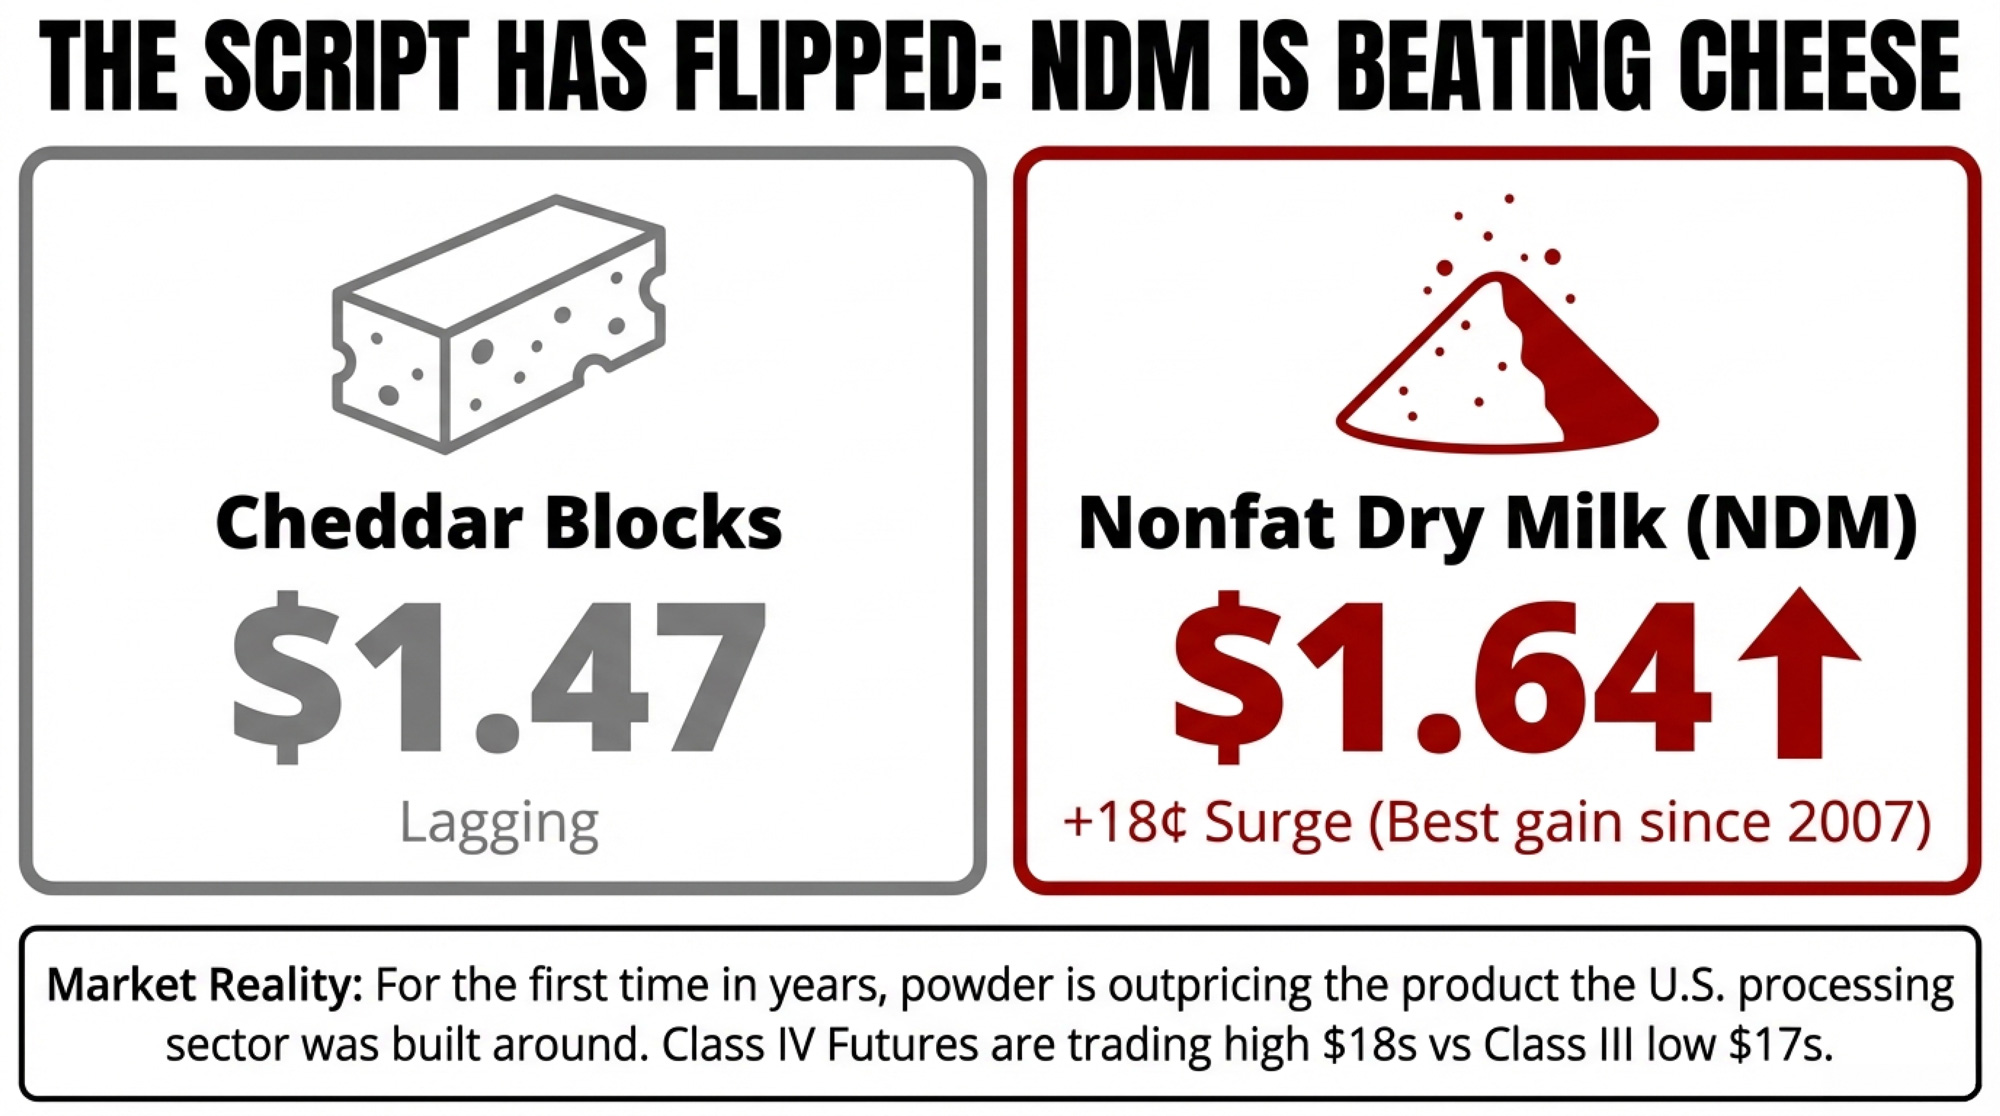
Nonfat dry milk surged 18¢ in a single week to settle at $1.64/lb on Friday, February 6, 2026 — the highest CME spot price since August 2022 and the strongest weekly gain since May 2007, per Jacoby & Associates. That puts powder a full 16.75¢ above Cheddar blocks and within pennies of butter. For the first time in years, milk powder is outpricing the product that the entire U.S. processing sector was built around. 

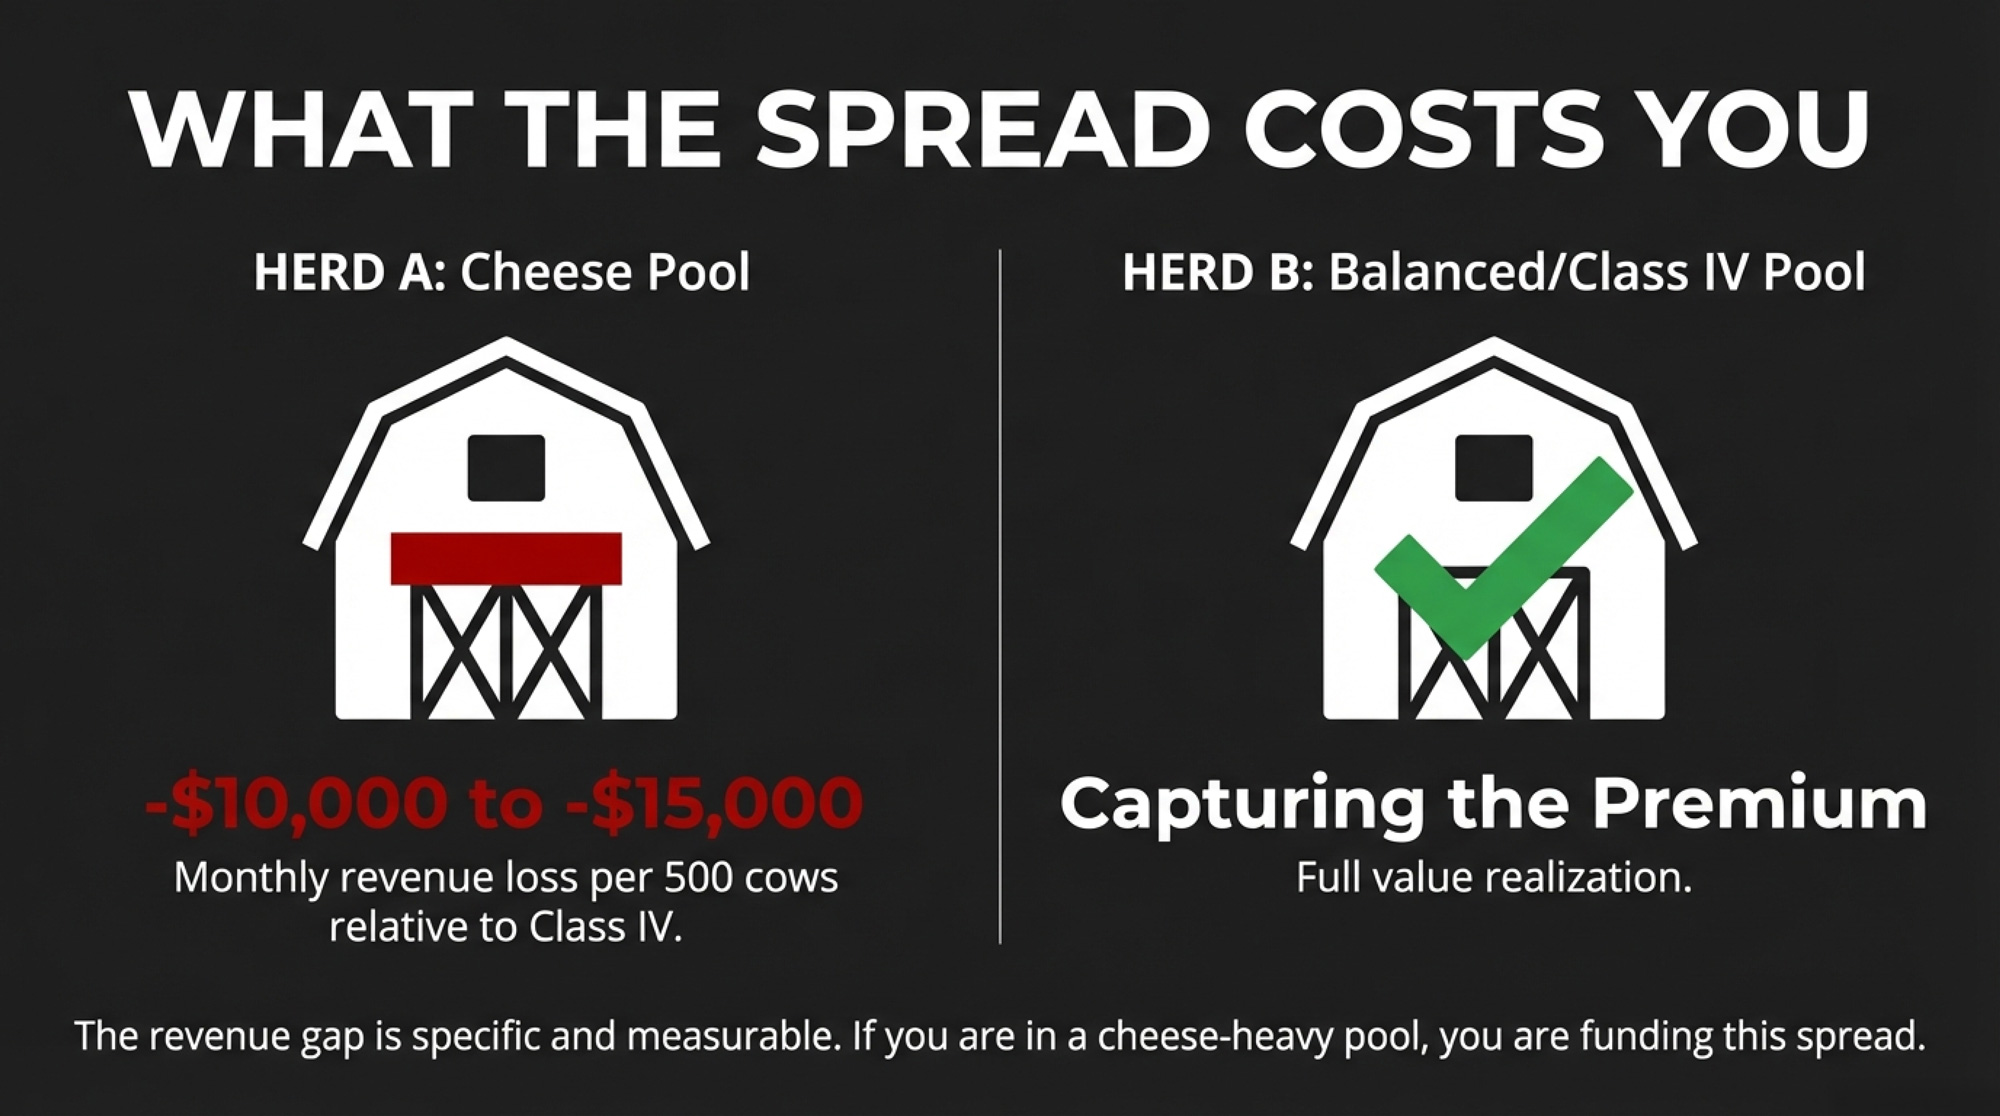
For producers shipping to cheese-dominant handlers — where Class III drives the blend — the revenue gap is specific and measurable. The Bullvine’s October 2025 analysis of two identical 500-cow herds — same genetics, same production, same components, different pool structures — found a monthly revenue disparity of $10,000 to $15,000, with the cheese-heavy operation on the losing end. DMC enrollment closes March 31. Spring flush is six to eight weeks out. The decisions you make about DRP coverage, component targets, and handler alignment in the next 90 days determine which side of that gap you land on. 

MonthClass III Pool (Black Line)Class IV Pool (Red Line)Gap
Sep 2025$310,000$315,000$5,000
Oct 2025$305,000$314,000$9,000
Nov 2025$302,000$314,500$12,500
Dec 2025$298,000$313,000$15,000
Jan 2026$295,000$310,000$15,000
Feb 2026$292,000$307,000$15,000

What $1.64 NDM and $1.47 Cheddar Look Like on Your Check

The week’s CME scoreboard tells a lopsided story. NDM at $1.64/lb. Cheddar blocks up 11¢ to $1.4725/lb on 51 loads — one of the busiest trading weeks in recent memory. Butter jumping 13¢ to $1.71/lb, with dozens of unfilled bids still on the board at Friday’s close. By Friday, MAR26 Class IV was trading in the high $18s to near $20/cwt — well above Class III in the low-to-mid $17s. That spread hits your check directly if you’re in a cheese-heavy pool. 

ProductFeb 6, 2026 CloseWeekly ChangeYOY ChangeTrading Volume (loads)
Nonfat Dry Milk$1.64/lb+18.0¢+42.6%38
Cheddar Blocks$1.4725/lb+11.0¢+8.4%51
Butter$1.71/lb+13.0¢+15.5%42
Class IV Futures (MAR26)~$19.00/cwt+$1.50/cwt+12.2%
Class III Futures (MAR26)~$17.25/cwt+$0.50/cwt+4.1%

Behind those numbers sits twelve months of compounding imbalance. USDA’s Dairy Products report, released February 5, confirmed that combined U.S. NDM and skim milk powder output in December totaled just 170.3 million pounds — down 6.2% year-over-year. Full-year 2025 powder production: 2.143 billion pounds. The weakest annual total since 2013. 

Cheese, meanwhile, has never been higher. December output hit 1.279 billion pounds, up 6.7% year-over-year, with Cheddar surging 9%. Milk production grew 4.6% in December across the 24 major states. More milk than ever is flowing through the system. It’s going into cheese vats, not dryers. 

Where Did All the Dryers Go?

Powder got scarce because the industry was built for cheese, not because the world suddenly needed more milk powder.

IDFA reported in October 2025 that U.S. dairy processors have committed over $11 billion in new and expanded processing capacity across more than 50 projects in 19 states between 2025 and early 2028 — overwhelmingly targeting cheese and whey protein, not drying. IDFA CEO Michael Dykes framed it as a response to “unprecedented demand for American-made dairy products, especially cheese and whey protein”. That investment wave is a supply-side explanation for the powder squeeze—and it suggests the scarcity has staying power. 

Inside the Plant Where Cheese Barely Breaks Even

Ken Heiman lives this math daily. The CEO and co-owner of Nasonville Dairy in Marshfield, Wisconsin — a certified Master Cheesemaker who got his license at 16 — processes 1.8 million pounds of milk daily from roughly 190 Wisconsin farm families, turning out more than 150,000 pounds of cheese every day. By his own account, the operation “just breaks even” on most of the cheese. What keeps Nasonville profitable is whey protein. “We ought to be thanking people who are buying whey protein at Aldi’s,” Heiman told the New York Times last July. “It definitely enhances the bottom line.” 

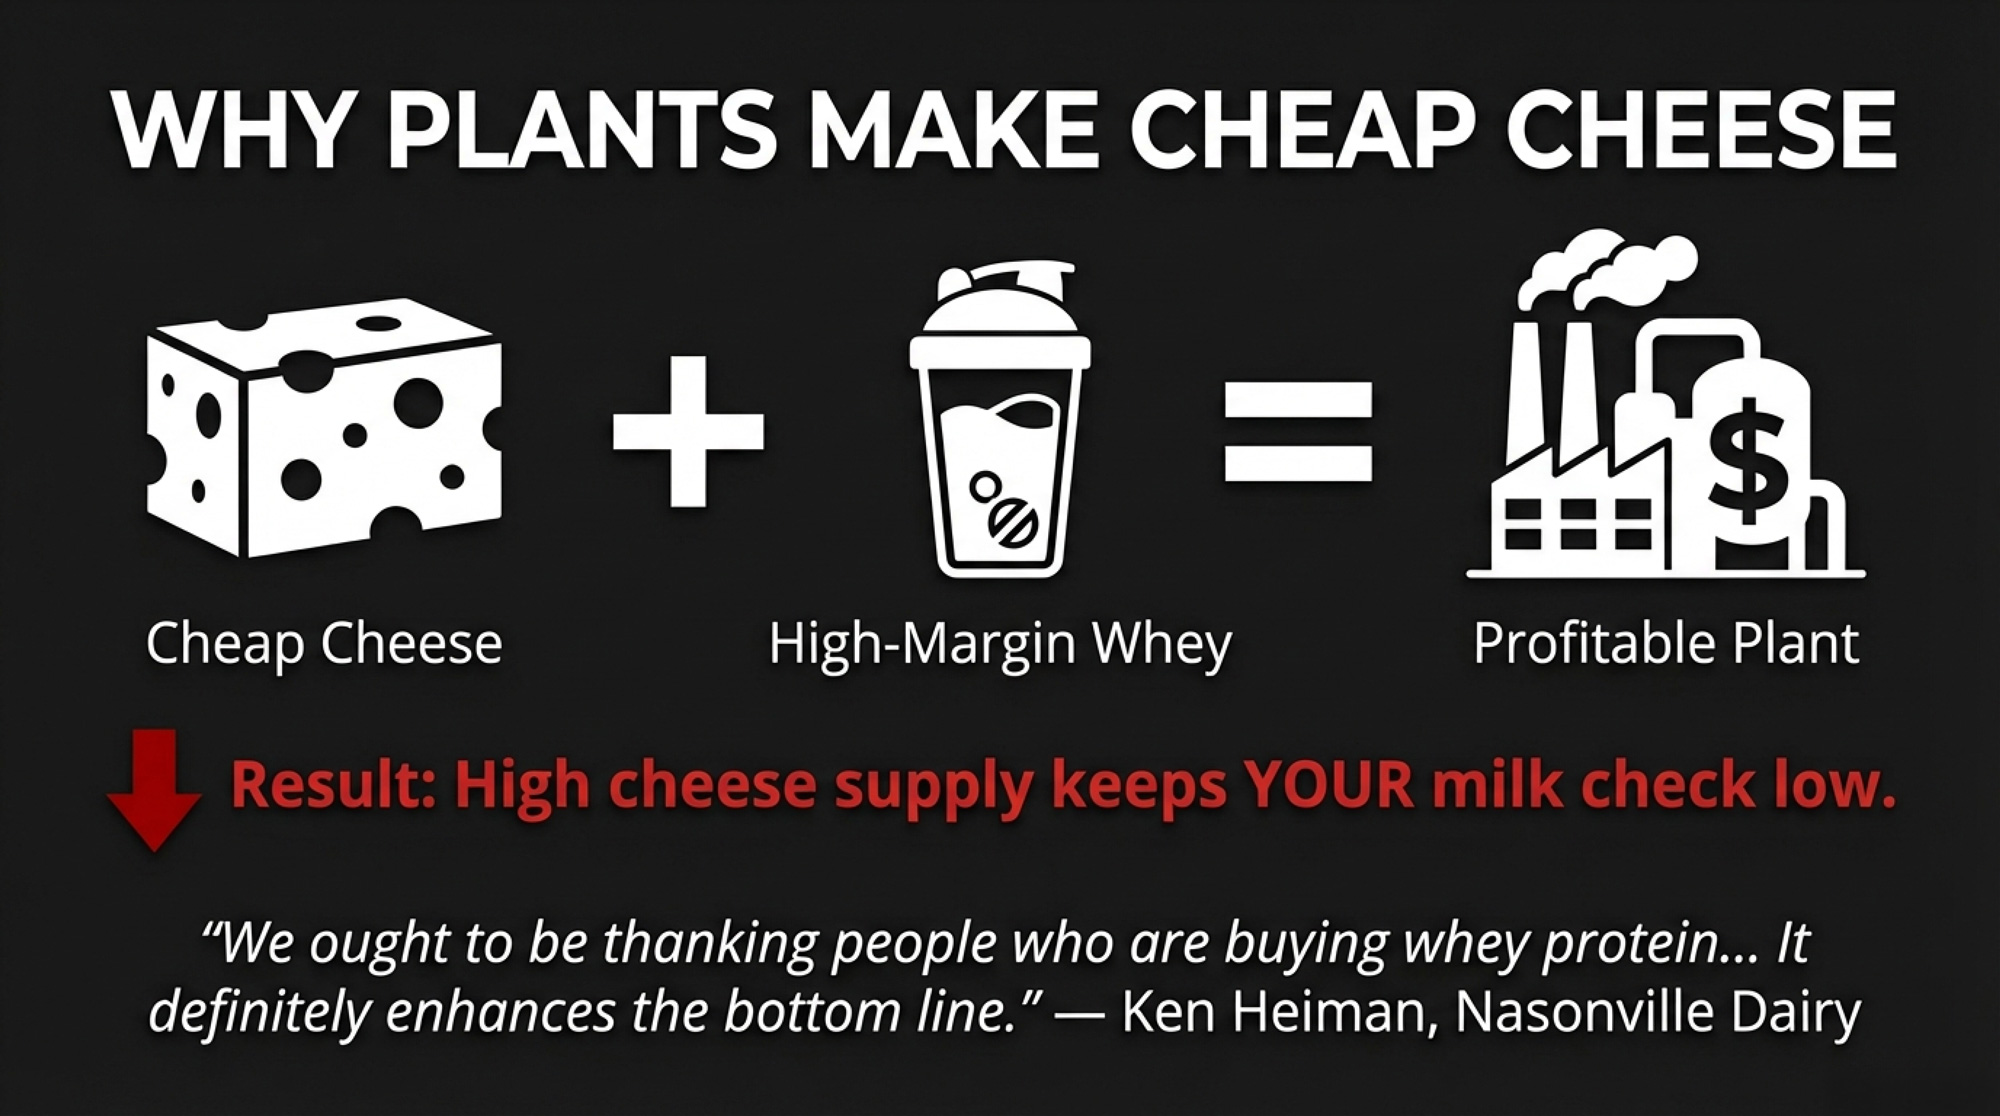
That’s not an outlier — it’s the new economics of processing. December USDA data shows whey protein isolate production at 20.6 million pounds, up 11.7% year-over-year, while lower-protein WPC (25–49.9%) fell 12.8%. Plants keep making cheese — even at thin margins — because the whey stream subsidizes the operation. More cheese keeps Class III supply elevated, which holds down the blend price for every farm shipping to a cheese-dominant handler. Phil Plourd at Ever.Ag framed it bluntly: “It is a street fight, in terms of figuring out ways to stay relevant, to get more productive, to stay ahead of the curve, to manage risk better.” 

What the FMMO Reforms Actually Did to Your Check

Kevin Krentz knows the cost of pool imbalances firsthand. The Wisconsin Farm Bureau President — who milks about 600 cows with his wife, Holly, near Berlin, in Waushara County — testified before USDA in August 2023 that negative PPDs reached $9/cwt, costing his operation nearly $200,000. Those losses accumulated during a PPD crisis that began when the “average-of” Class I mover took effect in May 2019 and persisted through at least 2023. 

The June 2025 FMMO reforms addressed that specific formula — reverting to the “higher-of” Class I mover, with all 11 federal orders voting to accept it. But the reforms also raised make allowances by 5¢ to 7¢ per pound across all four pricing products. In three months, that wiped $337 million from pool values nationally, per AFBF economist Danny Munch, with the Upper Midwest absorbing $64 million of the hit. Class prices dropped 85 to 93 cents per hundredweight, even with make allowances alone. 

UW–Madison extension specialist Leonard Polzin noted that make allowances are “embedded in the federal pricing formulas rather than itemized”—they don’t show up as a line on your check like a hauling charge. Roughly 90% of the component-priced milk check sits on butterfat and protein, per CoBank analyst Corey Geiger. With the spread running this wide, that concentration means your check swings harder on butterfat and protein than on volume — and the structural dynamics driving today’s Class III/IV divergence share some of the same characteristics as the crisis Krentz lived through. 

Component Premiums — Run Your Own Numbers

The gap between high-component and volume-focused herds is calculable from the USDA’s monthly announcements. In January 2026, FMMO component prices were $1.4595/lb for butterfat and $2.1768/lb for protein. The Bullvine’s June and July 2025 market reports estimated that each 0.1% increase in butterfat translates to roughly $0.15–$0.35/cwt in additional revenue, depending on the month. For a farm testing 4.3% fat and 3.3% protein versus one at 3.8% and 3.0%, that cumulative advantage runs $1.00–$1.50/cwt

On a 1,000-cow herd averaging 75 pounds per day, even the low end means roughly $22,000 per month. The high end: $34,000 — over $400,000 annually. This lever works regardless of your pool or handler — as long as component premiums hold. And that’s not guaranteed. Protected fat supplements run $0.35 to $0.55 per cow per day in the Upper Midwest. Genetic gains through sire selection take 6–24 months to show up in the tank. Ask your nutritionist for the breakeven component test level at current premiums.

Component TestButterfat (%)Protein (%)Monthly Revenue Advantage (1,000 cows)Annual Revenue Advantage
Low Components3.6%2.9%
Average Components3.8%3.0%+$8,000+$96,000
Mid-High Components4.1%3.2%+$18,000+$216,000
High Components4.3%3.3%+$28,000+$336,000

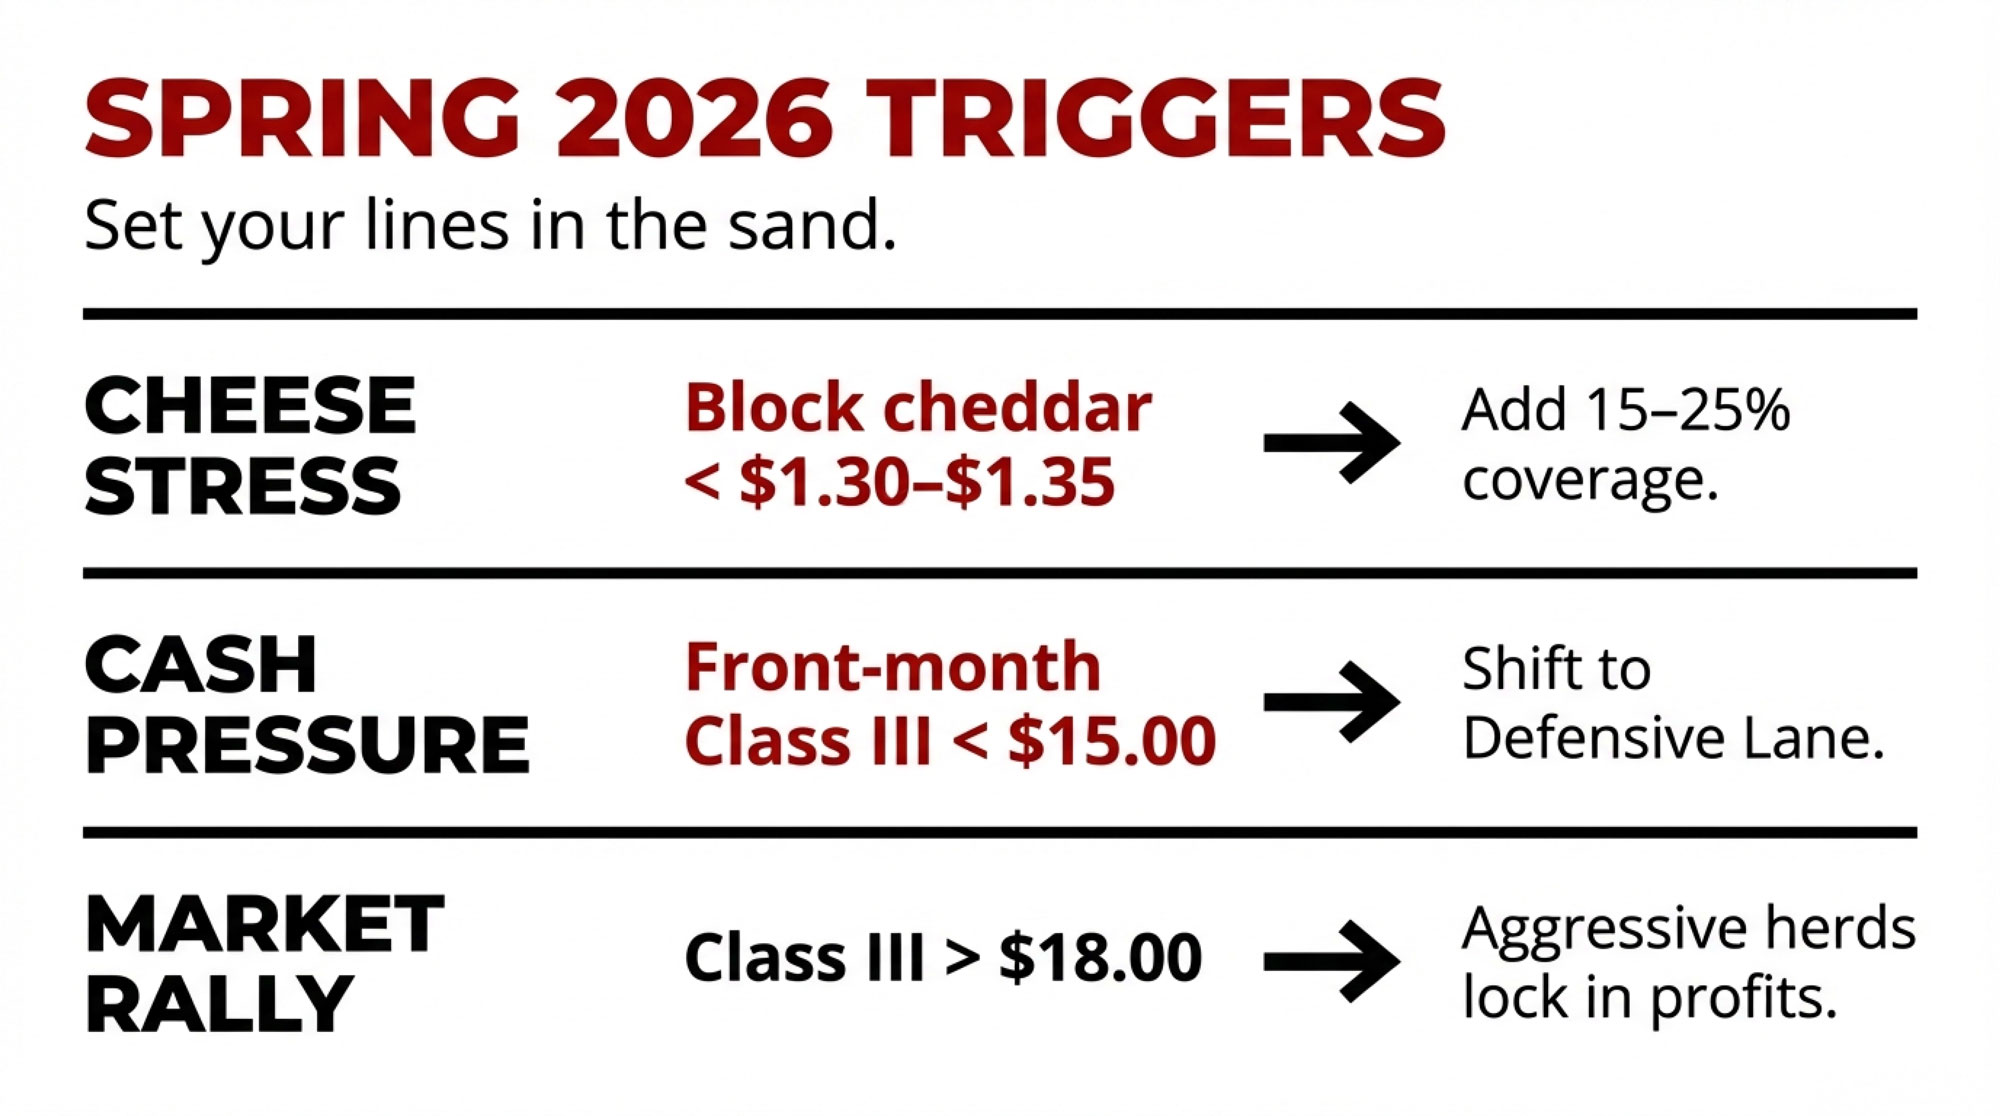
Four Moves Before Spring Flush — and What Each Costs

  • Restructure DRP to match actual pool exposure. If your co-op runs 60% cheese and 40% butter/powder but your DRP is weighted 80% Class III, you’re insuring a milk check that doesn’t exist. High-component herds generally benefit from the Component Pricing option; average-component herds from Class Pricing with accurate III/IV weighting. RMA premium subsidies range from 44% at 95% coverage to 55% at 70%. Compeer Financial’s 2020–2023 analysis found average DRP premiums of $0.31/cwt; HighGround Dairy’s five-year review showed an average net benefit of $0.23/cwt. Get a current quote — premiums fluctuate with volatility. The trade-off:premiums are sunk cost if the spread narrows. That premium stacks against a monthly gap exposure of $10,000–$15,000 on 500 cows. 
  • Stack DMC before March 31. Tier 1 now covers up to 6 million pounds — up from 5 million — giving medium-sized operations an extra million pounds of coverage. You must establish a new production history based on your highest marketings from 2021, 2022, or 2023. For operations with a longer risk horizon, DMC offers a six-year lock-in (2026–2031) with a 25% premium discount — but you give up annual flexibility, and if milk prices surge above $24/cwt, you’re locked into coverage you don’t need. With MAR26 soybean meal at $303.60/ton and corn at $4.30/bu, the feed-cost squeeze is real. DMC covers cost; DRP covers revenue. 
  • Audit your milk check. AFBF economist Danny Munch, at ADC’s Dairy Hot Topics session during World Dairy Expo last October, urged farmers to share milk check stubs with ADC, their state Farm Bureau, or their market administrator. Munch found instances — particularly in Wisconsin — where independent handlers weren’t following existing disclosure requirements. Look for months where your PPD went sharply negative while Class IV traded at a premium. Cost: one uncomfortable phone call. Potential payback: significant. 
  • Explore handler options in competitive milk sheds. In parts of Wisconsin, Idaho, and the Upper Midwest, producers with high-component milk may have leverage to find handlers whose plant mix better captures Class IV value. The trade-off is real: equity stakes in your current co-op, hauling logistics, and relationship costs. But when pool assignment can swing $10,000–$15,000 monthly on 500 cows, the conversation may be worth having.
Coverage ScenarioQuarterly DRP Premium ($/cwt)Monthly Premium Cost (9,000 cwt/month)Monthly Uninsured Pool Gap Exposure
Low Coverage (70%)~$0.05/cwt~$450$10,000–$15,000
Mid Coverage (85%)~$0.20/cwt~$1,800$10,000–$15,000
High Coverage (95%)~$0.40/cwt~$3,600$10,000–$15,000

Running the Numbers: DRP Coverage (500-cow herd, ~9,000 cwt/month)

 Low EstimateHigh Estimate
Quarterly DRP premium (per cwt)~5¢~40¢
Monthly premium cost~$450~$3,600
Monthly Class III/IV pool gap exposure~$10,000~$15,000
Net monthly uninsured risk~$9,550~$11,400

Compeer Financial 2020–2023 avg: $0.31/cwt. HighGround Dairy five-year avg net benefit: $0.23/cwt. RMA subsidies: 44% (95% coverage) to 55% (70% coverage). Gap: Bullvine analysis, Oct 2025. Get a current quote for your operation.

Four Signals That Separate Noise from Structure

  • Q1 2026 powder production (USDA reports, March and April). If NDM/SMP output remains negative year-over-year despite record milk production, drying capacity is confirmed to be insufficient— not just seasonally tight. Monthly sales below 180 million pounds would be historically abnormal. Above 195 million pounds would suggest the system is self-correcting. This is the single most important data point for validating or killing the thesis.
  • Monthly cheese exports to Mexico (USDEC data, ~6-week lag). Mexico accounted for 38% of all U.S. cheese exports through November 2024 — 392 million pounds — per Hoard’s Dairyman, with full-year 2024 volumes reaching 424 million pounds. If monthly volumes drop below 30,000 metric tons for two consecutive months, alternative markets can’t absorb the displacement. 
  • Class III/IV spread duration. A two-month spread is noise. One that persists through six months signals a structural change that even processing allocations will eventually follow. Last July, The Bullvine reported the Class IV premium hit $1.71/cwt over Class III. If the gap holds above $1.00/cwt through June 2026, that would mark the longest sustained Class IV premium driven by powder scarcity in modern FMMO history. 
  • Cheese inventories. USDA’s December 31, 2025, Cold Storage report showed 1.35 billion pounds of natural cheese in warehouses, up 1% year-over-year. Two consecutive months above 1.40 billion pounds would signal the export safety valve is failing — and that cheese is backing up faster than the market can clear it. 

Your Next Moves

Start with three questions: What’s your handler’s cheese-to-powder plant utilization split? What’s your current DRP Class III/IV weighting? What’s your rolling 12-month average butterfat test? If you don’t know all three, that’s your first move.

  • If your DRP is weighted more than 60% Class III but your handler runs significant butter or powder volume, you’re likely insuring the wrong revenue stream. Pull your current parameters this week.
  • DMC enrollment closes on March 31 — 52 days from now. Tier 1 covers 6 million pounds for 2026. Six-year lock-in (2026–2031) saves 25% on premiums but sacrifices annual flexibility. With soybean meal above $303/ton, this is the cheapest margin backstop available. 
  • If your herd averages below 4.0% butterfat and 3.1% protein, you’re leaving an estimated $1.00+/cwt on the table relative to component-optimized herds in the same pool. 
  • If your PPD went negative in any month since October 2025, ask your co-op directly whether Class IV milk was depooled. Danny Munch at AFBF has flagged handlers — particularly in Wisconsin — not following existing disclosure rules. 
  • Run your cash flow at Class III, averaging $16.50/cwt for the next 18 months with current feed costs. If that doesn’t work on your spreadsheet, waiting costs more than acting.
  • Counter-signal: If Q1 NDM/SMP production rebounds above 195 million pounds monthly, the scarcity thesis weakens. The March Dairy Products report is the first real test.

Key Takeaways

  • The Gap: Today’s NDM–Cheddar spread is already costing a 500-cow cheese-pool herd $10,000–$15,000/month compared with the same cows in a more Class IV-exposed pool.
  • Why It Lasts: 2025 powder output fell to its weakest level since 2013 while more than $11 billion in new capacity went to cheese and whey, not dryers — a setup that keeps Class IV firm and cheese-led pools behind.
  • Your Biggest Lever: At current component prices, moving from “average” to high components is worth roughly $1.00–$1.50/cwt — about $22,000–$34,000/month on 1,000 cows — but only if your DRP mix and handler capture that value.
  • The 52-Day Deadline: DMC enrollment closes in 52 days, giving you one tight window to line up DMC coverage, DRP weighting, and component targets with the actual market you’re in before spring flush hits.
  • The Cost of Waiting: Rolling into spring with a cheese-heavy pool, a Class III-heavy DRP, and “good enough” components is a bet that the Class IV premium disappears before your cash does.

Complete references and supporting documentation are available upon request by contacting the editorial team at editor@thebullvine.com.

Learn More

The Sunday Read Dairy Professionals Don’t Skip.

Every week, thousands of producers, breeders, and industry insiders open Bullvine Weekly for genetics insights, market shifts, and profit strategies they won’t find anywhere else. One email. Five minutes. Smarter decisions all week.

NewsSubscribe
First
Last
Consent

Same Cows, $15,000 Apart: Class III Milk Price, DRP, and Your Spring 2026 Risk Plan

Same cows, same milk, $15,000 apart. This spring, Class III won’t decide your future—your DRP and risk plan will.

Executive Summary: Class III and Class IV price swings are quietly putting five‑figure gaps between herds that look almost identical on paper. Using current USDA class prices and the latest 2026 milk production forecast, this piece shows how the same 500‑cow herd can end up roughly $10,000–$15,000 apart in a month, just on pooling and price exposure.It then sorts risk management into three simple lanes—defensive, balanced, and aggressive—with practical DRP and Class III options ideas, suggested coverage ranges, and clear cheese/Class III triggers for when to act. The article also walks through five numbers you’ll want on paper before you call your DRP agent: production, components, basis, utilization mix, and break‑even. If you’re planning for Spring 2026, it’s built to help you move from watching Class III to running a risk plan that actually fits your herd.

You know that feeling when Class III is up on the screen, but your milk check sure doesn’t look like it got the memo? You’re not alone. A lot of 400–800 cow herds are finding that when the Class III/Class IV spread opens up, two 500‑cow dairies with very similar cows, butterfat levels, and fresh cow management can still end up thousands of dollars apart each month, just because their milk is pooled and used differently.

What I want to walk through here is a simple, practical playbook for Spring 2026: three risk “lanes,” five numbers you need in front of you, and some Dairy Revenue Protection (DRP) timing and price triggers that actually help you decide, not just worry.

How the Class III/Class IV Spread Quietly Moves Your Milk Check

Let’s start with what the numbers really look like. USDA’s own class price reports make it pretty clear the spread between Class III and Class IV moves around more than most of us would like. For example, in February 2025, the USDA reported Class III and Class IV milk prices of 20.18 and 19.90 dollars per hundredweight, respectively. So in that month, Class III had a small edge. 

By October 2025, those class prices had shifted again. USDA’s Announcement of Class and Component Prices shows a Class III price of 16.02 dollars per hundredweight and a Class IV price of 14.30 dollars per hundredweight, giving Class III about a 1.72‑dollar advantage. So the story isn’t “Class IV always wins” or “Class III always wins.” The point is that the relationship between the two can change within a year, and your pay price rides on how your milk is used. 

Here’s an easy way to picture it. Say you’ve got a 500‑cow Holstein herd averaging about 60 pounds per cow per day. That’s roughly:

  • 500 cows × 60 lb = 30,000 lb per day
  • 30,000 lb × 30 days ≈ 900,000 lb per month
  • 900,000 lb ÷ 100 = 9,000 cwt per month

Now imagine two different pools:

  • One is effectively 70% cheese (Class III) and 30% butter‑powder (Class IV).
  • The other is closer to 25% Class III and 75% Class IV.

If Class III is a couple of dollars higher than Class IV for a stretch, that cheese‑heavy pool is going to capture a lot more of that value. A 2‑dollar spread on 9,000 cwt is 18,000 dollars on paper. Even if only part of that makes it into your final mailbox price because of pooling and adjustments, you can see why it’s realistic for two similar 500‑cow herds, sitting in two different utilization situations, to be ten‑plus thousand dollars apart in some months. The cows don’t know it, but the blend sure does.

Uniform prices tell the same story in a different way. USDA’s 2025 uniform milk price tables show that the monthly uniform price at 3.5% butterfat can differ by more than a dollar per hundredweight between some Federal Orders, depending on class utilization and the month. Industry coverage of those uniform prices in late 2025 noted that when class prices fell together, all 11 orders saw lower uniform prices, but the actual level on the milk check still varied by order and utilization mix. On 9,000 cwt, a 1‑dollar uniform price gap is 9,000 dollars before you even talk about premiums or penalties. 

And here’s something that’s easy to miss: the FMMO numbers are useful, but they’re still averages. Your co‑op’s monthly statement will often show how your specific pool and plant mix are behaving, and that’s the document you really want to study alongside the federal reports.

The bottom line: you don’t control the spread. You don’t control how your co‑op pools. But you do control how much of your business is exposed to that spread, and that’s where this risk “lane” idea comes in.

Three Risk Lanes: Which One Looks Most Like You?

What I’ve found, sitting at kitchen tables in Wisconsin and the Northeast, is that most herds don’t need a PhD in futures. They need an honest look at their balance sheet and a simple way to decide how much downside they can live with. When you do that, most 400–1,000 cow dairies fall into one of three lanes:

  • Defensive: “We really can’t afford a bad quarter.”
  • Balanced: “Let’s protect the downside, but don’t cap all the upside.”
  • Aggressive: “Feed’s lined up, equity’s good, we’ll ride more risk.”

Here’s an illustrative snapshot for that 500‑cow, 2.7‑million‑lb‑per‑quarter herd:

StrategyProduction CoveredPremium Commitment*Floor StrengthUpside ExposureBest Fits
Defensive65–70%HigherNear sustainable break‑even~30–35%Tight cash, higher leverage
Balanced40–50%ModerateGood, but not maximum~50–55%Moderate leverage, modest reserves
Aggressive20–25%LowDisaster‑only~75–80%Strong equity, feed locked, higher risk

*Premium commitment here is total premiums over several months as a rough share of gross milk revenue, not a quote.

A quick way to check your lane:

  • Defensive herds have less than 6 months of cash cushion, debt-to-asset ratios around 50–60%, and a genuinely scary outlook if one quarter goes badly.
  • Balanced herds have six to twelve months of operating cushion, manageable debt, and enough breathing room to absorb a tough quarter without the banker reaching for the restructuring file.
  • Aggressive herds have strong equity, feed covered through the next harvest at tolerable prices, and enough cash flow to ride out a bad quarter or two without forced cow sales.

What’s interesting is that no lane is “right” or “wrong.” They just come with different trade‑offs. More coverage buys stability but trims upside. Less coverage keeps upside but magnifies the swings. In many cases, producers I work with aim to keep at least 15–20% of production covered with something—DRP, deep out‑of‑the‑money puts, or a mix—just as catastrophic protection. It’s the rest of the milk where the lane really shows up.

If You’re Defensive: “We Can’t Afford a Bad Quarter”

Let’s talk about the herd that’s built new facilities, maybe added robots, and is carrying more debt than they’re comfortable with. If one really bad quarter would have your lender asking hard questions, you’re in the defensive lane, whether you feel like a risk‑taker or not.

You probably recognize yourself if:

  • Your cash cushion is under six months of expenses.
  • Debt‑to‑asset is 50–60% or more.
  • Your sustainable break‑even is at least in the mid‑15‑dollar range, once you account for all costs.
  • A quarter of low prices isn’t just “tight,” it’s a survival issue.

In this lane, it generally makes sense to cover about 65–70% of your projected production. For that 500‑cow herd producing about 2.7 million pounds a quarter, that’s roughly 1.8–1.9 million pounds insured in some way.

A practical defensive toolkit often includes:

  • DRP at around 90% coverage using Class Pricing that leans toward Class III if your plant is largely cheese‑focused. 
  • At‑the‑money or slightly out‑of‑the‑money Class III put options on part of that same milk to pull your effective floor closer to your sustainable break‑even once you factor in basis and component premiums.

The catch with going defensive:

  • DRP coverage is more expensive, net, at higher coverage levels because subsidy percentages are smaller.
  • You’re deliberately giving up some upside in exchange for a tighter floor.
  • You’ll feel the premium cost in a good year—but you’ll sleep better in a bad one.

What DRP materials and risk‑management guides consistently show is that premium subsidies are relatively larger at lower coverage levels and smaller at higher coverage levels, so an 80% policy usually has a larger subsidy share than a 95% policy. That’s why your out‑of‑pocket cost per insured hundredweight rises as you push coverage closer to 95%. 

What I’ve seen in many Wisconsin and Minnesota operations is that herds who accept the premium cost and stick to a consistent DRP and options plan tend to have calmer conversations at the bank when cheese and class prices fall than those who keep riding everything on the cash market. The year might still be tough, but the floor does its job.

If that sounds like you, here’s what this means in practical terms:

  • Your main question isn’t, “Where’s Class III going?” It’s, “What’s the lowest mailbox price we can live with and still pay the bills and keep the lender comfortable?”
  • If your sustainable break‑even is around 16 dollars per hundredweight and a quarter, and a 14‑dollar Class III would put you in real trouble, then your structures need to focus on keeping realized prices above that danger zone, not chasing every rally.
  • Once Q2 Class III futures sit 1.50–2.00 dollars above your sustainable break‑even for a while, you can justify easing off new coverage on part of your milk and letting some upside run. Until then, your priority is staying in business, not maximizing upside.

If You’re Balanced: “Protect the Downside, Don’t Miss the Rally”

A lot of progressive herds fall into this middle lane. You’ve tightened costs, you know your numbers, and your debt and cash position give you room, but you’re not interested in gambling.

You’re probably here if:

  • You’ve got six to twelve months of operating cushion.
  • Debt service fits comfortably into your cash flow most years.
  • You accept that you won’t call the top or the bottom.
  • You want real downside protection, but also want to participate when Class III runs.

In this lane, covering about 40–50% of your projected production often makes sense. For that same 500‑cow example, that’s roughly 1.1–1.4 million pounds hedged, with 1.3–1.6 million pounds left open.

The balanced toolkit usually has two pieces:

  • Slightly out‑of‑the‑money Class III puts—say, in the mid‑15 to low‑16‑dollar range if Q2 futures are in the mid‑16s—on around one‑third to two‑fifths of your milk. That way, a 1.50–2.00‑dollar slide in Class III starts to trigger protection, but you still fully enjoy a strong rally.
  • DRP at 80–85% coverage on another slice of milk as a safety net. Because DRP subsidies are generally more generous at these coverage levels than at 90–95%, the net cost per hundredweight on that insured volume is more manageable. 

In this setup, the options tend to do the heavy lifting for routine price swings, while DRP is there for the really ugly quarters.

For your herd, this lane means:

  • You’re trading moderate premiums for a decent floor and lots of upside.
  • A bad quarter still hurts, but it doesn’t put the whole operation at risk.
  • It helps to define a couple of simple triggers, so you’re not guessing in the heat of the moment:
    • If CME block cheddar sits under roughly 1.30–1.35 dollars per pound for several trading sessions, that’s usually a sign the cheese market is under real stress. In that situation, many balanced or aggressive herds add another 15–25% coverage via DRP or puts. 
    • If front‑month Class III slips under about 15.00 dollars per hundredweight, that’s a reasonable point to shift your posture a little more defensive and protect more of your production.

If You’re Aggressive: “Feed’s Locked, We’ll Ride It”

Then there are the herds that have built equity and efficiency over time and are in a position to withstand more volatility. In these dairies, feed is often locked at a decent price, the cows are producing well, and the balance sheet can take a punch without panic.

You’re in this camp if:

  • Your equity position is strong, and leverage is modest.
  • Feed costs are locked in through the next crop year at levels that still leave a margin.
  • You can live through a bad quarter or two without emergency financing, forced cow sales, or putting off critical maintenance.
  • You genuinely think the current weakness in cheese and Class III is overdone and want more upside exposure.

In this lane, you’re often only covering about 20–25% of projected production, leaving 75–80% to float with the market. For our 500‑cow example, that’s around 500,000–700,000 pounds covered and 2 million pounds uncovered.

The typical aggressive toolkit:

  • A modest DRP policy at 80% coverage on a slice of milk as “disaster insurance.” Because this is the lowest coverage level, it tends to carry a smaller net premium per hundredweight and still gives you something if prices collapse. 
  • Deep out‑of‑the‑money Class III puts—maybe around 14.50–15.00 dollars per hundredweight—that don’t cost much and only kick in if we get a serious wreck.

The trade‑off is pretty straightforward. You’re spending less on premiums, you’ve got maximum upside, but you’re also accepting that a routine 1‑dollar slide in Class III will hit you harder. That only works if your equity, cash flow, and feed position can legitimately handle that risk.

So it’s worth being blunt here: if your balance sheet isn’t genuinely strong, this lane isn’t a badge of honor, it’s just unnecessary risk. Plenty of good operators have gotten hurt by trying to be aggressive when the books said they should’ve been balanced or defensive.

If you are in a position to ride in this lane, it really pays to write down your “I’m wrong” lines:

  • Maybe you decide that if block cheese breaks 1.35 dollars per pound and stays below there for a week, you immediately add 20–25% more coverage.
  • Or you say that if front‑month Class III trades under 15.00 dollars per hundredweight, you’ll move yourself back toward a balanced posture and start building floors.

What’s encouraging is that when aggressive herds set those lines in advance and stick to them, they’re not just guessing. They’re managing risk, even if it’s a higher‑octane version.

DRP and Class III Options: Different Tools, Same Job

It’s easy to get stuck in debates about DRP versus futures and options, almost like it’s a philosophical choice. In practice, they’re just two tools in the same box. The real question is which mix fits your risk lane and your comfort level.

Dairy Revenue Protection is a USDA‑backed insurance program that lets you insure quarterly milk revenue. You pick a coverage level—anywhere from 80% to 95%—and choose between Class Pricing and Component Pricing. Under Class Pricing, your guarantee is based on a mix of Class III and Class IV futures, as you choose. Under Component Pricing, it’s based on futures‑derived butterfat and protein values and your declared component levels. 

Those guarantees are settled against published quarterly revenue indexes specific to your state or region. And because DRP is a federal program, premiums are partially subsidized. The key thing the program documents and industry overviews agree on is that subsidy percentages are higher at lower coverage levels and smaller at higher coverage levels, which is why an 80% policy usually has a lower net cost per insured hundredweight than a 95% policy. 

Class III put options are different. When you buy a put, you’re buying the right (but not the obligation) to sell Class III futures at your chosen strike. There’s no subsidy, and you need a futures/options account, plus some discipline around margin and position management. But the flexibility is hard to beat: you pick the strike, you pick the months, and on that hedged milk you keep all the upside above your floor.

So in many Midwestern dairies, the practical split looks like this:

  • Use DRP—particularly at 80–85% coverage—as relatively simple, subsidized, disaster‑style coverage on at least part of your milk.
  • Layer in Class III puts for the portion where you want a clear floor but don’t want to give up upside, especially in the balanced and aggressive lanes.

Five Numbers You Really Want in Front of You

Here’s something you probably know already from dealing with lenders and nutritionists: the better your numbers, the better the advice you get. Risk management’s no different. Before you call your DRP agent or broker, having these five numbers written down changes the conversation.

1. Projected Quarterly Production

Look back at the last three to six milk checks and average your monthly pounds shipped. Multiply by three to get a starting point for the next quarter. Then adjust for what’s actually happening on your farm:

  • Are you freshening more heifers?
  • Did you change your transition period management?
  • Are you switching to or from a dry lot system?
  • Is a new robotic box coming online?

You don’t need to be exact, but you do need an honest estimate.

2. Butterfat and Protein Averages

Pull your last several milk checks or DHIA tests and take the average butterfat and protein levels. If you’re considering DRP Component Pricing, those declared component levels should reflect the milk you actually ship. DRP resources make it clear that indemnities under Component Pricing are based on futures‑derived component values and your declared quantities, so over‑declaring components can come back to bite you if you don’t hit those numbers in the tank. 

High‑component herds that consistently run above the regional average often like Component Pricing because it lets them insure the value they’re producing. Herds with more variable components often lean toward Class Pricing because they’re not betting on precise tests every quarter.

3. Basis to Class III or Class IV

Basis is one of those words that makes people’s eyes glaze over, but it’s just the difference between the futures‑based price (Class III or IV) and your mailbox price.

For each of the last few months:

  • Take your net milk pay and divide by pounds shipped, then divide by 100 to get your mailbox price per hundredweight.
  • Look up the USDA Class III and Class IV prices for that month. 
  • Subtract Class III (or IV) from your mailbox price.

If your mailbox price has been running, say, about 0.30 dollars per hundredweight over Class III, and you buy puts with a 16.00‑dollar strike, your “real” floor before premiums and fees is closer to 16.30 dollars. That basis number helps you judge whether the protection you’re buying lines up with your actual risk.

4. Class III/Class IV Utilization Mix

This one’s easy to overlook, but it matters. In the U.S. marketing orders, different plants and co‑ops have different utilization mixes—some are heavily cheese‑weighted, others lean more toward butter‑powder. Federal Order documents and policy briefs on current and proposed marketing order reforms spell out just how different those mixes can be between areas. 

A simple call to your co‑op or plant rep with a question like, “Roughly what percentage of our pooled milk ends up in Class III products versus Class IV?” can give you a ballpark figure. And just as important, take a good look at your co‑op’s own monthly statement; that’s often the clearest picture of how your actual milk is being used and paid for, beyond the FMMO averages.

If your herd is effectively 65% Class III‑driven and you structure DRP as if you were a 50/50 Class III/Class IV herd, the policy won’t track your milk check as well as it could.

5. Break‑Even Milk Price

Finally, you need at least a rough survival break‑even and a sustainable break‑even.

  • Survival break‑even covers feed, power, essential repairs, and the minimum debt service to keep the doors open.
  • Sustainable break‑even adds in full debt service, family living, and enough capital replacement that the operation can keep going long term.
Herd ScenarioSustainable Break-Even ($/cwt)$1.00/cwt Drop = Monthly Loss$2.00/cwt Drop = Monthly Loss$3.00/cwt Drop = Monthly Loss
300-cow herd, 36 lbs/cow/day$16.25 (RED)$16,200/month$32,400/month (RED)$48,600/month
500-cow herd, 60 lbs/cow/day$15.75 (RED)$27,000/month$54,000/month (RED)$81,000/month
800-cow herd, 68 lbs/cow/day$15.00$36,480/month$72,960/month$109,440/month
Industry Median Break-Even (2024 USDA ERS)$15.50$25,920/month$51,840/month$77,760/month

A quick back‑of‑the‑envelope calculation is to total your annual cash costs and divide by your annual production (in cwt). It’s not perfect, but if it shows your sustainable break‑even is around 16 dollars per hundredweight, you now know that a 14‑dollar Class III “floor” isn’t really protection. It’s just a more predictable way to lose money.

In DRP and risk management meetings across the Midwest, it’s common to hear agents say that the producers who walk in with these five numbers tend to walk out with coverage structures that fit their lane. The ones who don’t bring numbers usually end up talking about feelings, not risk.

Timing and Triggers: Managing Spring 2026 Without Staring at the Screen All Day

If there’s one thing many of us have learned the hard way, it’s that risk management is as much about timing as it is about tools. You don’t have to watch the market all day. But you do want a few dates and signals written down so you can act on your plan, not your emotions.

How DRP Sales Windows Actually Work

DRP isn’t like corn insurance, where you have one big sales closing date. According to the 2026 DRP Basic Provisions, coverage is sold during specific “sales periods,” and sales are suspended on days when major USDA reports, such as Milk Production and Cold Storage, are released. That means you can buy coverage at multiple points, but not every single day. 

Practically speaking:

  • Q2 2026 endorsements (April–June milk) will mostly be written in the late‑January to March window, outside of those report days. 
  • Q3 2026 endorsements (July–September milk) will mostly be written in the April–June window, again avoiding report days.

So instead of waiting for a single “deadline,” you’re better off deciding in January and April what your lane is, how much milk you want covered, and what coverage levels make sense. Then it’s just a matter of working with your agent during an open sales period.

Watching USDA Production and Stocks

It’s worth noting that USDA’s January 2026 WASDE forecast bumped expected 2026 U.S. milk production up to about 234.3 billion pounds, roughly 3.2 billion pounds more than 2025, which works out to about 1.4% growth. On paper, that doesn’t sound huge, but as many of us have seen, an extra 1–2% milk floating around in a flat demand environment can put real pressure on prices. 

When you pair that with the monthly Milk Production report and the Cold Storage report—especially for cheese and butter inventories—you get a reasonable sense of whether the market is starting to back up or tighten. That can help you decide when to be more defensive and when you can afford to lighten up.

Simple Price Triggers That Help You Act

Most of the herds I talk to don’t want a complicated market model. They just want a few lines in the sand that tell them when it’s time to add coverage or lock in more upside. Here are three that can work as a starting point:

Signal / TriggerLevel (Approx.)Market ConditionDEFENSIVE Lane ActionBALANCED / AGGRESSIVE Lane Action
CME Block Cheddar< $1.30–$1.35/lb for 3+ sessionsCheese market in real stressADD 15–25% coverage immediately via DRP or Class III puts. Do not wait.Monitor closely; consider 10–15% extra coverage if sustained below $1.33/lb.
Front-Month Class III Futures< $15.00/cwtCash market under heavy pressureSHIFT POSTURE DEFENSIVE on 20–30% of unprotected milk.Add DRP or puts without delay.Tighten stops; add 15–25% coverage. This is your warning line.
Front-Month Class III Futures> $18.00/cwt for 2+ weeksRally is real and sustainedMonitor for profit-taking. Keep current coverage. Let upside run.Lock in a slice of gains; protect half your upside with tight stops or modest puts. Consider locking 10–15% at high prices.
USDA Milk Production Forecast1.5%+ YoY growth; cheese stocks risingOversupply buildingAssume downside risk increases Q2–Q3; add 20–30% coverage now while prices near seasonal highs.Add 10–15% defensive coverage on forward Q3 milk. Plan for lower Q3 prices.

These aren’t magic numbers. They’re practical guardrails. The real key is writing down, ahead of time, what each of those triggers will mean for you so you’re not trying to invent a plan on a bad Monday morning.

So What Does This Actually Mean for Your Dairy?

USDA’s current outlook, as summarized in late‑January 2026, is a year with a bit more milk and lower average prices than 2025. At the same time, the official class price series shows that the Class III/Class IV relationship can swing enough within a year to move your milk check by meaningful amounts, especially if your herd is tied heavily to cheese or butter‑powder. 

You don’t get to choose whether that spread exists. But you do get to choose how much of your herd’s future you leave riding on it.

If you’re in the defensive lane, your job this spring is to:

  • Get those five numbers—production, components, basis, utilization mix, and break‑even—on paper.
  • Work with your DRP agent to price 85–90% coverage on 60–70% of your Q2 milk, using Class Pricing that matches your actual exposure.
  • Layer in near‑the‑money Class III puts on part of that volume, so your effective floor comes closer to your sustainable break‑even.

If you’re in the balanced lane, your focus is to:

  • Use DRP at 80–85% coverage on 20–25% of your production as disaster coverage.
  • Use slightly out‑of‑the‑money Class III puts on another 20–30%, so you’ve got a reasonable floor with upside.
  • Put your cheese and Class III price triggers in writing and decide, ahead of time, how much extra coverage you’ll add when those lines get crossed.

If you’re in the aggressive lane and your numbers truly support it, you can:

  • Keep coverage lighter—say 20–25% of production with DRP at 80% or deep out‑of‑the‑money puts—to guard against a real crash.
  • Be honest about your “I’m wrong” lines on cheese and Class III and commit—with your family or business partners—to changing lanes if those lines are crossed.
  • And just as important, make sure your balance sheet is strong enough that you’re not turning your livelihood into a bet you can’t afford to lose.

And there’s one more step that’s worth taking this week, no matter which lane you’re in:

  • Pull your last six months of milk checks and calculate your basic basis and break‑even.
  • Put a ten‑minute weekly price check (cheese, Class III, Class IV) on your calendar.
  • Talk through your lane with whoever else has a stake in the dairy—family, partners, key employees—so everyone understands the plan.

In a 2025–26 world where USDA expects higher milk production and lower prices, and where the Class III/Class IV spread can change direction more than once a year, hoping the market behaves isn’t a strategy. Your balance sheet—not your opinion of cheese—is what should pick your lane. 

The goal isn’t to guess exactly where Class III will be in June. It’s to decide what you can live with now, set your floors accordingly, and make sure the market doesn’t get the final say on whether your dairy makes it through the next year.

Key Takeaways

  • Same cows, big gap: Class III/IV spread and pooling differences alone can put two similar 500‑cow herds $10,000–$15,000 apart in a single month.
  • Pick your lane: defensive herds should cover 65–70% of production, balanced herds 40–50%, and aggressive herds 20–25%—based on cash, leverage, and risk tolerance, not feelings.
  • DRP at 80–85% coverage offers the best subsidy‑to‑protection trade‑off for most operations; add Class III puts when you want a tighter floor with upside intact.
  • Know your numbers: projected production, component averages, basis, utilization mix, and break‑even should be on paper before you call your DRP agent.
  • Set triggers, not hopes: decide now what cheese price and Class III levels will make you add protection—so you’re acting on a plan, not reacting to a bad Monday.

Complete references and supporting documentation are available upon request by contacting the editorial team at editor@thebullvine.com.

Learn More

The Sunday Read Dairy Professionals Don’t Skip.

Every week, thousands of producers, breeders, and industry insiders open Bullvine Weekly for genetics insights, market shifts, and profit strategies they won’t find anywhere else. One email. Five minutes. Smarter decisions all week.

NewsSubscribe
First
Last
Consent

The October 31st Dairy Disaster Your Co-op Won’t Discuss: How Argentina’s Export Tax Scam Just Handed Mexico Your Milk Check

40% of U.S. cheese exports face an immediate threat as Argentina drops 9% dairy tax—while your industry leaders stay silent

EXECUTIVE SUMMARY: Here’s what we discovered: Argentina suspended all agricultural export taxes on September 22nd—a move that instantly makes their dairy products $200-300 per metric ton cheaper than ours in global markets. With Mexico accounting for 40% of U.S. cheese exports (approximately $2-3 billion annually), this “temporary” policy, in effect through October 31st, threatens to crater milk prices by 20% or more. The silence from National Milk, IDFA, and major co-ops isn’t a coincidence—many of these same companies operate profitable facilities in Argentina and Brazil. Historical patterns show that Argentina’s “temporary” measures have a nasty habit of becoming permanent (remember Macri’s 2015 tax elimination, which was reversed in 2018?). The domino effect could be catastrophic: Turkey’s 60% inflation and Brazil’s 20% currency slide make them prime candidates to copy Argentina’s playbook. Suppose you’re shipping to processors with significant exposure to Mexico. In that case, you have exactly 36 days to lock in price protection before this market manipulation, disguised as policy reform, decimates your milk check.

dairy market manipulation

So I’m sitting here at 5 AM—couldn’t sleep, actually—scrolling through the news, and there it is. Argentina suspended their agricultural export taxes. September 22nd. Just… gone. And nobody’s talking about it.

Look, maybe I’m overreacting. My wife says I do that. But I’ve been covering dairy for twenty-something years, and this feels… different. Really different.

You know how sometimes you get that feeling in your gut? Like when you see a fresh cow not eating and you just know something’s off? That’s what this feels like.

The Thing Nobody at Your Co-op Meeting Will Tell You

Alright, so here’s what I’ve been able to piece together…

Argentina’s been taxing agricultural exports for years, right? Different products, different rates. The reports coming out say they were hitting soybeans pretty hard—maybe around 30 percent—and dairy products were also being taxed. I’ve seen numbers anywhere from 8 to 10 percent on dairy, depending on who you ask.

Now they’re saying it’s temporary. Through October 31st, supposedly. Or until they hit some big export revenue target—I’ve heard $7 billion thrown around, but honestly, who knows if that’s accurate.

Temporary. Right.

You know what else was supposed to be temporary? Remember when Macri took over down there… what, 2015? Eliminated export taxes completely. Said it was the new way forward. Permanent change. All that.

Three years later? Boom. “Emergency measures.” Taxes are back.

I’ve been watching this long enough to know—Argentina’s “temporary” has a funny way of becoming permanent. And their “permanent”? That disappears faster than free donuts at a co-op meeting.

Mexico’s Buying HOW Much of Our Cheese?

Mexico’s strategic importance to the U.S. dairy industry is undeniable. The chart shows U.S. cheese exports to Mexico have grown steadily, with a 40% market share. This explosive growth is now directly threatened by Argentina’s sudden export tax elimination.

So I’m at the feed store last week—you know, the one by the old John Deere place in Dodge County—and this trucker’s there. Does the Mexico run for one of the big outfits.

He goes, “You know how much cheese is going south?”

And yeah, I knew it was a lot, but when you actually look at the numbers… Jesus. According to recent trade reports, approximately 40% of all U.S. cheese exports are destined for Mexico. That’s… what, $2-3 billion worth? Wisconsin alone is shipping tens of millions. California? Even more. Texas? Don’t even get me started—those processors down there are basically running on Mexico business.

Mexico’s 40% share of U.S. dairy exports represents $2.3 billion in annual trade now under direct threat from Argentina’s export tax elimination. When your biggest customer has cheaper alternatives, your milk check follows the market down.

But here’s the kicker—and this is what nobody’s talking about—Argentina already ships a ton of dairy to Brazil. They’ve got the infrastructure. The relationships. Brazilian companies have been dealing with Mexican importers for decades.

All Argentina needed was a price advantage.

Putting All Your Eggs in One Basket: How Mexico Became American Dairy’s Single Point of Failure. When 37% of Your Cheese Sales Depend on One Country, You’re Not Diversified—You’re Hostage.

And dropping export taxes? Well… do the math. If they were taxing dairy at 9% and that’s now gone, their products just became that much cheaper overnight. We’re talking maybe $200-300 per metric ton advantage. Maybe more.

You can’t compete with that. Nobody can.

Actually, I was just talking to this producer near Fond du Lac last week—milks about 800 head and has been in the business for forty years—and he says his processor already warned him that Mexico contracts might be “under review” come November. Under review. You know what that means.

Your Co-op Board’s Interesting Side Investments

Now… I’m going to be cautious here due to legal considerations, but…

Have you ever looked at who owns what in the South American dairy industry? I mean, really look?

Some of the same companies buying your milk here have operations down there. Big operations. I’m talking major ownership stakes in Argentine processors, Brazilian plants, the whole nine yards.

I’m not saying it’s a conspiracy. But when something this big happens and National Milk doesn’t say a word? IDFA’s silent? Your co-op board’s acting like nothing’s happening?

Makes you wonder, doesn’t it?

Actually, I ran into… well, let’s just say a former industry bigwig at a conference last week. The guy who used to be pretty high up. Even he looked worried. And this guy’s seen everything.

He says, “this is different. This isn’t market volatility. This is market manipulation.”

It Gets Worse (Because Of Course It Does)

So I’m talking to this analyst—a smart guy who covers global markets—and he starts laying out what happens next.

Turkey’s watching Argentina. Their currency’s trash, inflation’s through the roof—I’ve heard anywhere from 40 to 60 percent, depending on who’s counting. They export billions in ag products to Europe. If Argentina gets away with this, Turkey will likely follow suit, and the same could happen in Brazil. Their currency’s been sliding all year. Down maybe 20% against the dollar. And Brazil controls… what, a fifth of global soybean exports? Something like that. Huge chunk, anyway.

Once they see Argentina getting away with it…

It’s like dominoes. Remember back in ’09 when one bank started dumping assets and suddenly everybody had to? Same thing, but with countries using agriculture to prop up their currencies.

From $17.50 to $10.00: The Currency War Price Collapse That Could Cost You 43% of Your Milk Revenue. Every Day You Wait, Your Window to Protect Yourself Gets Smaller

Actually, wait. This is even scarier than I thought. Because once this starts, how do you stop it? Every country with a weak currency and agricultural exports is gonna look at this playbook and think, “Why not us?”

I was at a meeting in Madison last month—Wisconsin Dairy Business Association thing—and this economist from UW was saying something that stuck with me. She said, “The next trade war won’t be about tariffs. It’ll be about currency manipulation through agricultural policy.”

Guess she was right.

The Cavalry Ain’t Coming

Called the USDA yesterday. You know what they said? “We’re monitoring the situation.”

Monitoring.

That’s like telling a guy with a twisted stomach cow that you’re “observing the discomfort.” Great. Super helpful.

Look, theoretically, somebody should file a trade complaint. WTO, USMCA, whatever. But come on. By the time they get around to doing something, we’ll all be out of business. Or dead.

The market will sort this out long before Washington does. And by “sort out,” I mean we’re gonna take it in the shorts while everybody else figures out the new rules.

What You Can Actually Do (Besides Panic)

Alright, practical stuff. Because sitting around complaining doesn’t pay bills, even though it feels good.

That Dairy Revenue Protection everybody’s always talking about? Figure it out. Now. According to the latest RMA updates, the subsidized rates aren’t terrible—maybe $0.25 per hundredweight for decent coverage. That’s cheap insurance if this thing goes sideways.

Class III futures are still holding above $17.50, as of my last check yesterday. Won’t stay there long if this Argentina thing spreads. Lock something in.

Feed? Corn’s under $4.00 a bushel. Soybean meal’s… what, $280-290 a ton? Not great, not terrible. If you secure a six-month commitment, it.

Oh, and here’s something—you breeding any beef crosses? A guy I know in South Dakota; his dairy-beef calves are generating a significant amount of money. $800-1,000 each. With beef prices where they are… I mean, the math works.

Actually, I was at a sale barn down in Iowa last week—don’t ask why, long story—and these dairy-beef crosses sold for more than registered Holsteins. I’ve never seen that before.

The Part That Really Pisses Me Off

We did everything right, you know?

Got more efficient. Improved genetics. Built these massive freestalls. According to recent productivity data, the average production per cow is now… what, pushing 24,000 pounds? My grandfather would’ve called bullshit on that number.

Hell, I was at a place in California last month—they’re getting 30,000 pounds. Per cow! That’s not farming, that’s… I don’t even know what that is.

And for what? So we can be undercut by a country using agriculture as a means to bail out its peso?

This isn’t a competition. It’s desperation. And we’re the ones who’re gonna pay for it.

October 31st (Yeah, Right)

Argentina says this is temporary. Until October 31st.

And I’m gonna be the next American Idol.

Look at their track record. Every “temporary” measure from the last twenty years? Still there in some form. Or it lasted way longer than promised. Or they brought it back under a different name.

Argentina’s history proves ‘temporary’ policies are anything but. This timeline visually demonstrates the cycle of tax elimination and reinstatement, reinforcing why producers should not trust the October 31st deadline and should instead prepare for a permanent policy shift.

They’re saying they need to generate around $170-180 million per day in agricultural exports to meet their targets. Per day! That’s… come on. That’s fantasy numbers.

I’ll bet you my best heifer they extend this “temporary” measure. Probably call it something else. “Extended temporary emergency provisional measure” or some BS like that.

Maybe I’m wrong. God knows I’ve been wrong before. Remember when I said nobody would pay six figures for a cow? Yeah, that aged well…

But this feels different. The silence from our industry groups. The positioning of the big processors. Nobody wants to talk about it.

That tells you everything, doesn’t it?

The Bottom Line Nobody Wants to Hear

Had drinks with this banker last night—finances a bunch of operations around here. He asks me, “How bad is this, really?”

And I told him straight: If Argentina gets away with this, if they can use agricultural exports to bail out their currency without anybody stopping them… every broke country on earth just got handed the blueprint.

And guess who pays for it?

Not the politicians. Not the multinational processors with operations everywhere. Not the futures traders who’ll make money either way.

Us. The actual farmers.

Look, more details will come out over the next week or two. But don’t wait for some official report to tell you what to do. By then, it’s too late.

The thing is—and this is what keeps me up at night—our whole system assumes everybody plays by the same rules. You compete on quality, efficiency, and genetics. Not on whose government is most desperate for dollars.

But if that’s changing…

Christ. I need more coffee. Or maybe something stronger. It’s 5 AM somewhere, right?

Anyway, pay attention to this Argentina thing. Don’t let it sneak up on you like… well, like everything else seems to these days. October 31st is coming fast. And something tells me November 1st is going to look really different from October 30th.

Actually, hang on—before I forget. If you’re shipping to a plant that does a lot of business in Mexico, have that conversation now. Today. Not next week. Ask them point-blank: “What happens to us if Mexico starts buying from Argentina?”

They know the answer. They just don’t want to tell you.

You know what really strikes me about all this? We spent the last decade getting told to “think globally.” Well, here’s global for you—countries weaponizing their agricultural exports to prop up failing currencies. What did they mean by ‘global markets’?

Trust me on that one.

KEY TAKEAWAYS

  • Lock in Q4 pricing NOW: Class III futures still holding above $17.50—that won’t last once Mexico starts buying Argentine cheese at 9% discount. DRP coverage at $0.25/cwt is cheap insurance against the 20% price crater we’re facing
  • Diversify before it’s too late: Dairy-beef crosses bringing $800-1,000/head while registered Holsteins struggle—that’s immediate cash flow when your Mexico contracts evaporate. Smart producers are breeding 30% of their herd to beef bulls
  • Ask your processor point-blank TODAY: “What’s our exposure if Mexico switches to Argentine suppliers?” They already know the answer—Wisconsin producers near Fond du Lac report processors admitting contracts are “under review” for November
  • Lock in feed costs for a minimum of 6 months: Corn under $4.00/bushel and soybean meal at $280/ton won’t hold if currency manipulation spreads to Brazil (21% of global soy exports). The smart money’s contracting now, while everyone else “monitors the situation”
  • Build cash reserves like it’s 2008: Argentina needs $170-180 million daily in ag exports to hit their targets—fantasy numbers that guarantee this “temporary” measure gets extended. Operations with 6 months of operating capital survived ’09; those without didn’t

Complete references and supporting documentation are available upon request by contacting the editorial team at editor@thebullvine.com.

Learn More:

The Sunday Read Dairy Professionals Don’t Skip.

Every week, thousands of producers, breeders, and industry insiders open Bullvine Weekly for genetics insights, market shifts, and profit strategies they won’t find anywhere else. One email. Five minutes. Smarter decisions all week.

NewsSubscribe
First
Last
Consent

April 2024 DMC Margin Holds at $9.60 per CWT Despite Steady Feed Costs

Discover how April 2024’s DMC margin held at $9.60 per cwt despite steady feed costs. Curious about the factors influencing this stability? Read on to find out more.

April concluded on a reassuring note for dairy producers , with a robust $9.60 per cwt income over the feed cost margin through the DMC program. Despite the challenges posed by strong feed markets, milk prices remained steady, ensuring no indemnity payments for the second time this year. This stability in income is a testament to the reliability of the DMC program. 

MonthMilk Price ($/cwt)Total Feed Cost ($/cwt)Margin Above Feed Cost ($/cwt)
February 2024$21.00$11.10$9.90
March 2024$20.70$11.05$9.65
April 2024$20.50$10.90$9.60

The USDA National Agricultural Statistics Service (NASS) , released its Agricultural Prices report on May 31. This report, which served as the basis for calculating April’s DMC margins, demonstrated how a late-month milk price rally balanced steady feed market conditions

The DMC program, a key pillar of risk management for dairy producers, protects against rising feed costs and milk prices, ensuring a stable income. In addition, programs like Dairy Revenue Protection (Dairy-RP) play a crucial role, covering 27% of the U.S. milk supply and providing net gains of 23 cents per cwt over five years. 

“April’s margin stability shows milk prices’ resilience against fluctuating feed costs, a balance crucial for dairy producers,” said an industry analyst. 

April’s total feed costs fell to $10.90 per cwt, down 15 cents from March, while the milk price dipped to $20.50 per cwt, down 20 cents. This kept the margin at $9.60 per cwt, just 5 cents lower than March. 

Milk price changes varied by state. Florida and Georgia saw a 30-cent increase per cwt, and Pennsylvania and Virginia saw a 10-cent rise. In contrast, Idaho and Texas saw no change. Oregon experienced a $1.10 per cwt drop. 

The market fluctuations observed in April underscore the dynamic nature of the dairy market. In such a scenario, the importance of risk management programs like DMC and Dairy-RP cannot be overstated. As of March 4, over 17,000 dairy operations were enrolled in the DMC for 2023, with 2024 enrollment open until April 29. This proactive approach to risk management is crucial for navigating the uncertainties of the dairy market.

Key Takeaways:

  • April’s Dairy Margin Coverage (DMC) margin was $9.60 per hundredweight (cwt), with no indemnity payments triggered for the second time in 2024.
  • USDA NASS’s Agricultural Prices report detailed April’s margins and feed costs, revealing a robust dairy income despite strong feed markets.
  • Notable changes included Alfalfa hay at $260 per ton (down $11), corn at $4.39 per bushel (up 3 cents), and soybean meal at $357.68 per ton (down $4.49).
  • Milk prices averaged $20.50 per cwt, marking a slight 20-cent drop from March but sufficient to offset stable feed costs.
  • Major dairy states mostly saw a 20-cent decrease in milk price, with a few exceptions like Florida, Georgia, Pennsylvania, and Virginia experiencing modest growth.

Summary: Dairy producers in April reported a robust income of $9.60 per cwt over the feed cost margin through the DMC program. Despite strong feed markets, milk prices remained steady, ensuring no indemnity payments for the second time this year. This stability in income is a testament to the reliability of the DMC program. The USDA National Agricultural Statistics Service (NASS) released its Agricultural Prices report on May 31, which calculated April’s DMC margins. Programs like Dairy Revenue Protection (Dairy-RP) play a crucial role, covering 27% of the U.S. milk supply and providing net gains of 23 cents per cwt over five years. Market fluctuations underscore the dynamic nature of the dairy market, emphasizing the importance of risk management programs like DMC and Dairy-RP.

Send this to a friend