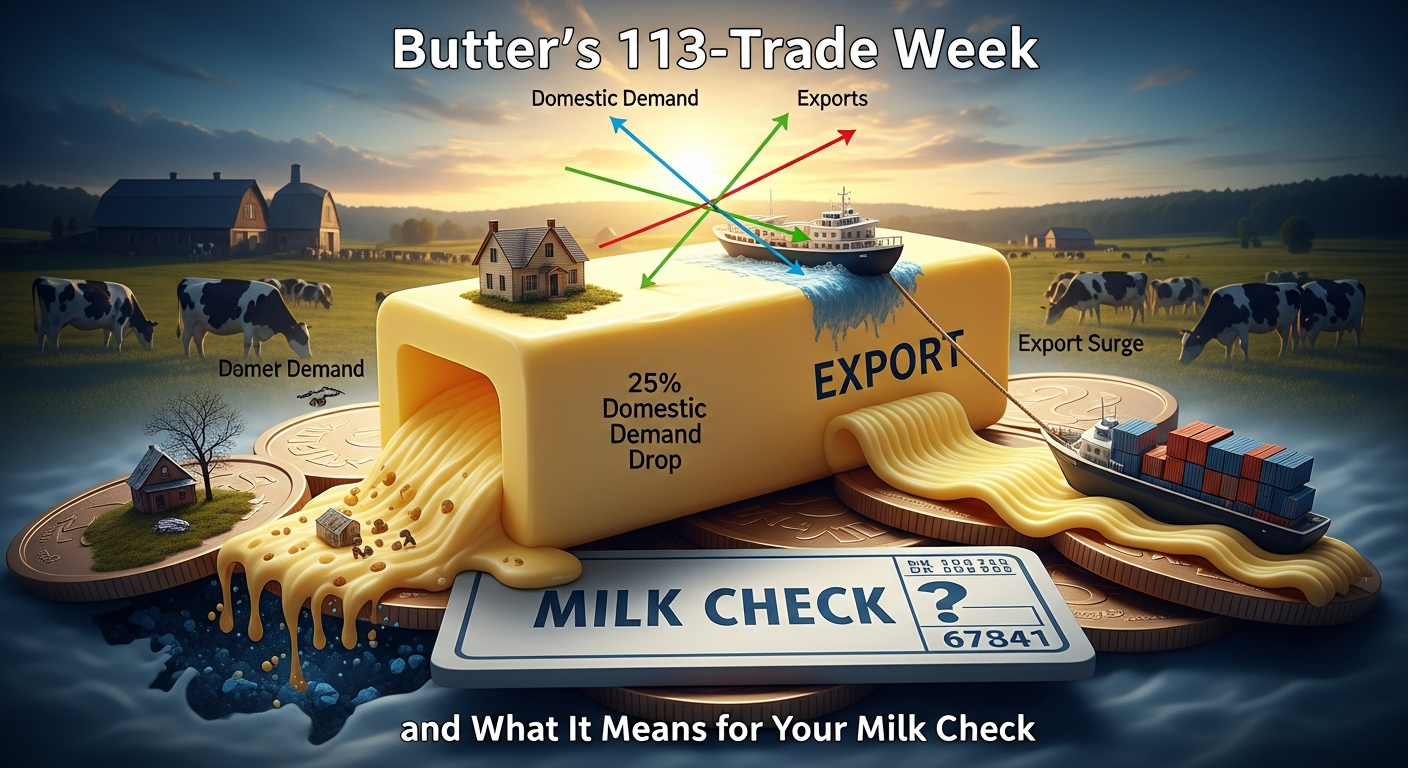
Butter demand fell 25% and 113 loads still traded. The demand didn’t die — it moved overseas. Has your Q2 plan caught up with that math yet?
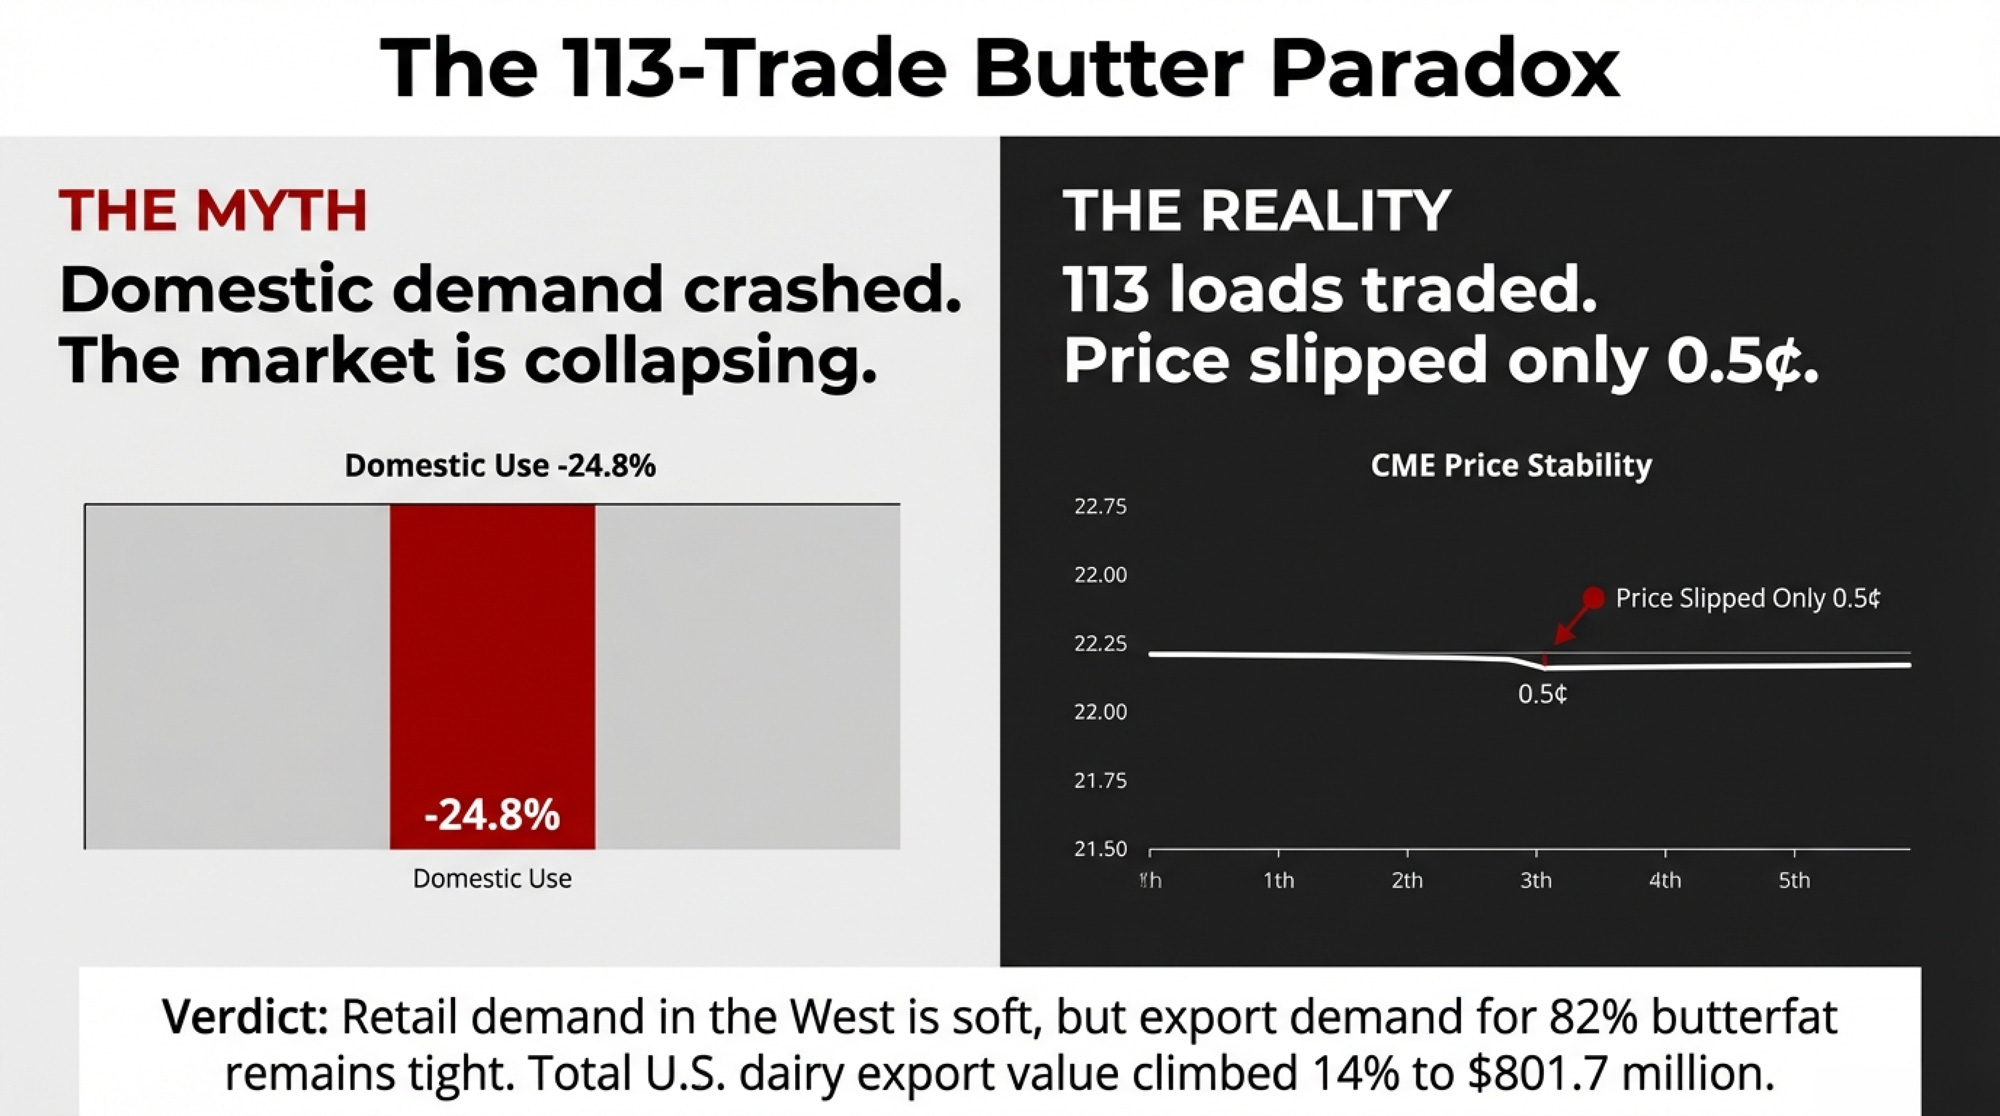
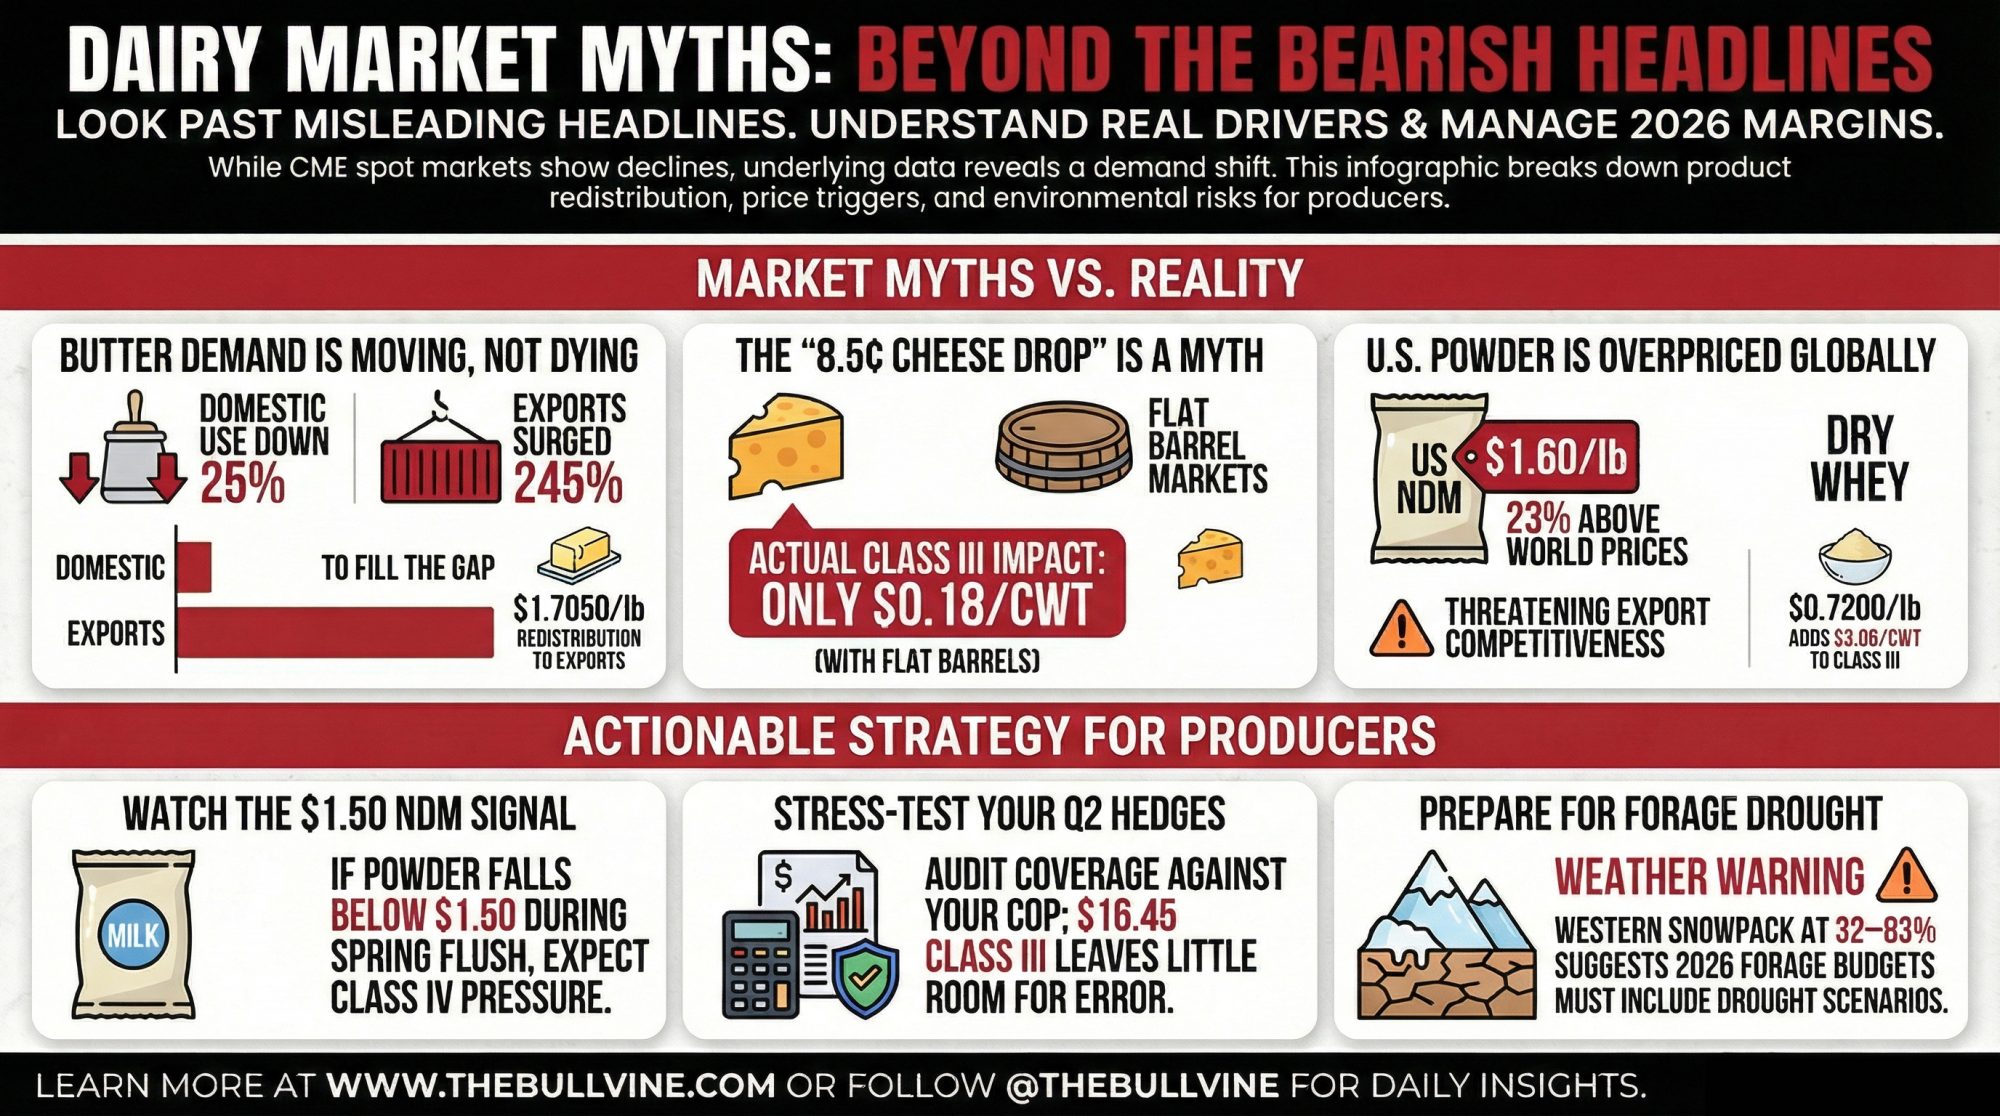
Executive Summary: U.S. butter looked bearish on the surface this week — November domestic disappearance fell 24.8% year over year and every CME dairy commodity finished lower — but 113 butter loads still traded and the price slipped just 0.5¢ to $1.7050/lb. The reason is redistribution, not collapse: ERS shows domestic butter use down sharply while USDEC data shows butter exports up 245% and anhydrous milkfat up 184%, so demand has shifted channels rather than vanished. Cheese followed the same pattern of misleading headlines, with an 8.5¢ block drop translating to only about $0.18/cwt on Class III once a flat barrel market is factored in — roughly $73/day, or $2,200/month, for a 500‑cow herd shipping 80 lb. In contrast, NDM near $1.60/lb and a roughly 34¢ gap over NDPSR averages have pushed U.S. powder about 23% above world prices, making $1.50 a critical spring flush line for whether Class IV at $18.10 proves rich or cheap. Dry whey at 72¢ quietly adds about $3.06/cwt to Class III, while USDA’s latest WASDE lifts the 2026 all‑milk price forecast to $18.95/cwt even as western snowpack sits at just 32–83% of normal, putting forage risk squarely on the 2026 balance sheet. Taken together, this week’s math argues for three concrete moves: stress‑test your Q2 hedge at $16.45 Class III against your true COP, set feed-buy alerts around $4.00 corn and $290 meal, and build a forage plan that assumes the West stays dry longer than anyone would like.
Every CME spot dairy commodity finished in the red for the week ending February 13, 2026. The simple read is bearish: butter down 0.5¢ to $1.7050/lb, blocks down 8.5¢ to $1.3875/lb, NDM down 4¢ to $1.6000/lb, dry whey down a penny to $0.7200/lb.
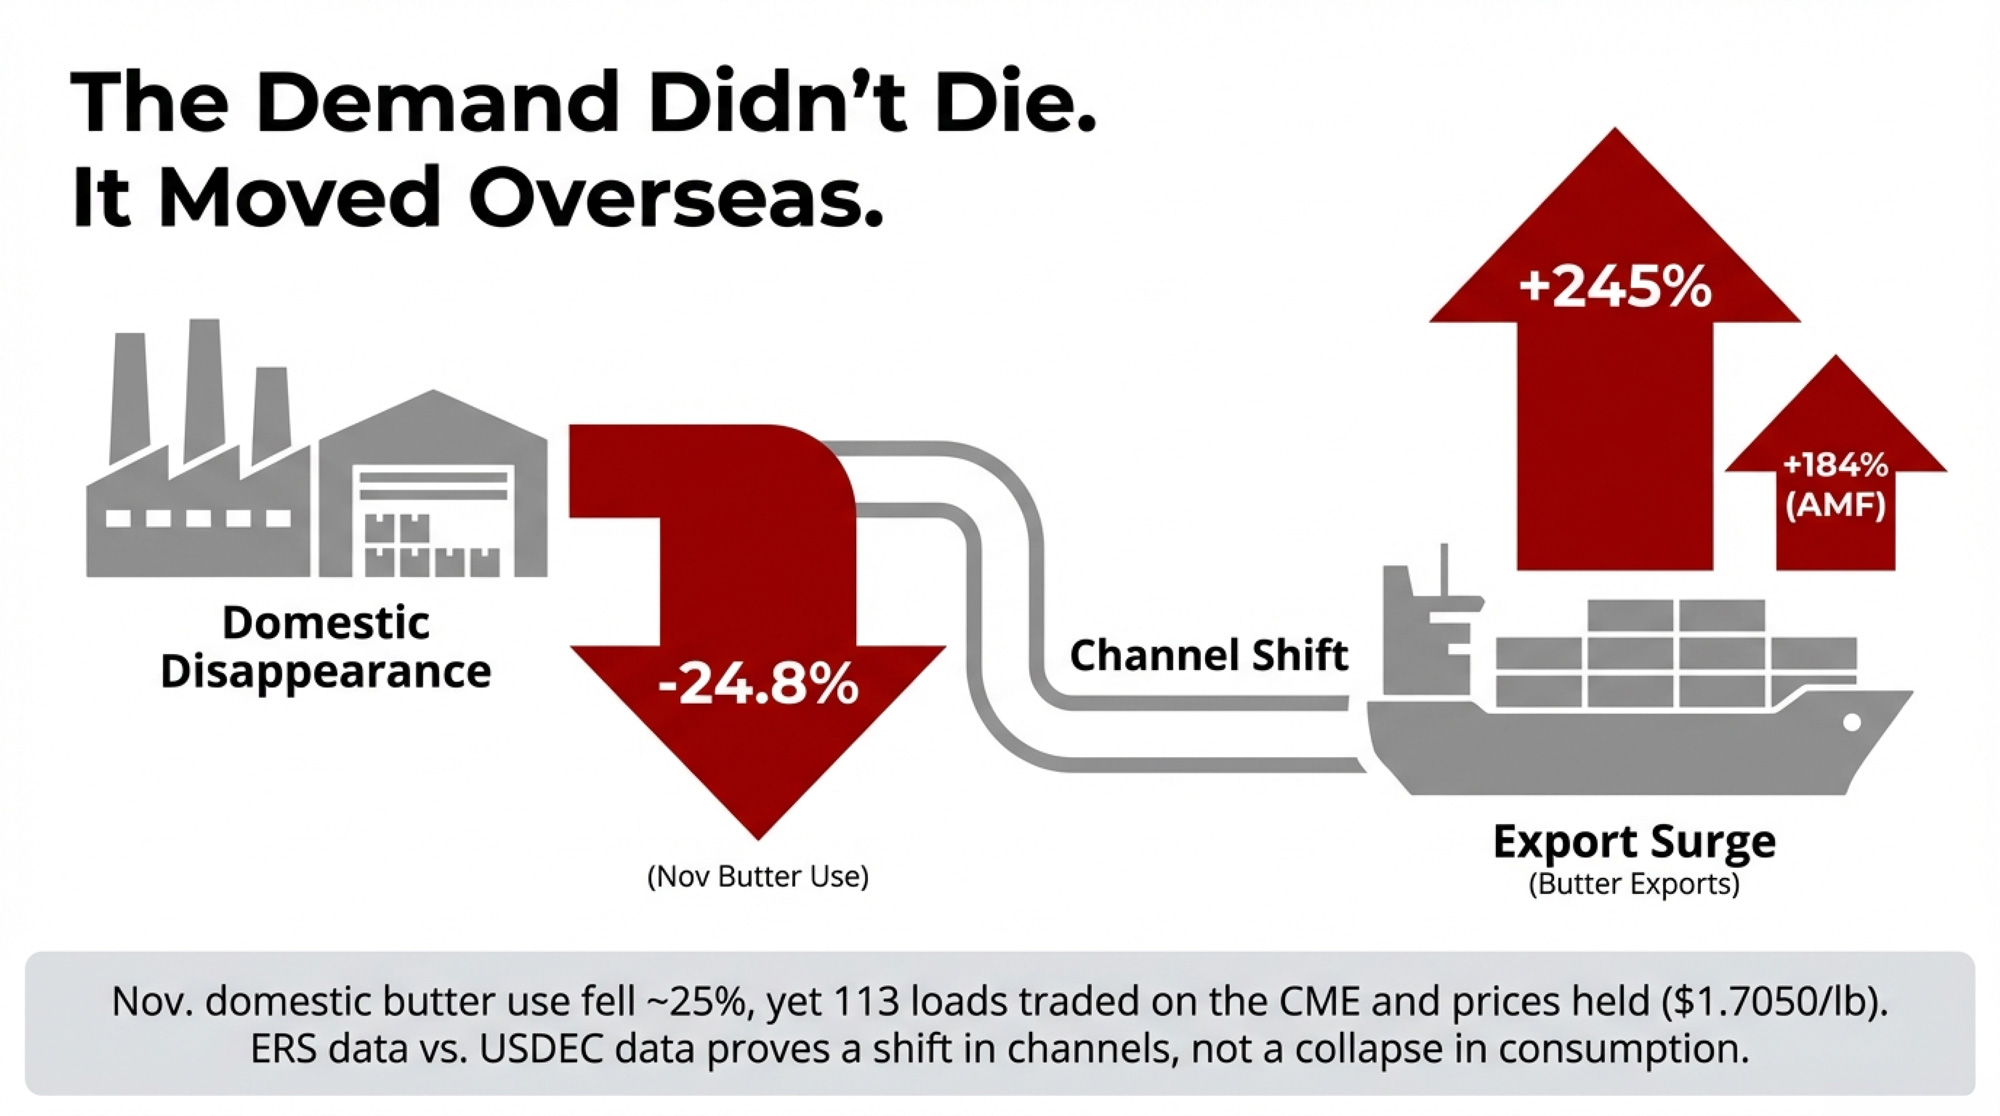
But that simple read is incomplete. USDA’s Economic Research Service published its updated “U.S. Dairy Situation at a Glance” on February 11, and the numbers tell a story the spot market can’t: domestic butter disappearance cratered 24.8% year over year in November — from 235.45 million pounds in November 2024, per the prior ERS release, to 177.15 million pounds.
That same month, butter exports surged 245% and anhydrous milkfat shipments jumped 184%, according to USDEC November 2025 U.S. Dairy Export Trade Data. The butter didn’t vanish. It went overseas. And that redistribution — demand shifting channels rather than evaporating — is the thread running through every commodity this week.
| Commodity | Friday Close ($/lb) | Weekly Change (¢) | Loads Traded | Market Signal |
|---|---|---|---|---|
| Butter | $1.7050 | -0.5 | 113 | High volume = real price discovery |
| Block Cheddar | $1.3875 | -8.5 | 10 | Headline overstates true Class III hit |
| Barrel Cheddar | $1.4400 | NC | 0 | No trades = flat barrel saves protein |
| Nonfat Dry Milk | $1.6000 | -4.0 | 17 | 34¢ above NDPSR = export kill zone |
| Dry Whey | $0.7200 | -1.0 | 1 | Quiet floor holding $3.06/cwt to Class III |
Source: CME Cash Dairy / USDA Dairy Market News, week of Feb. 9–13, 2026
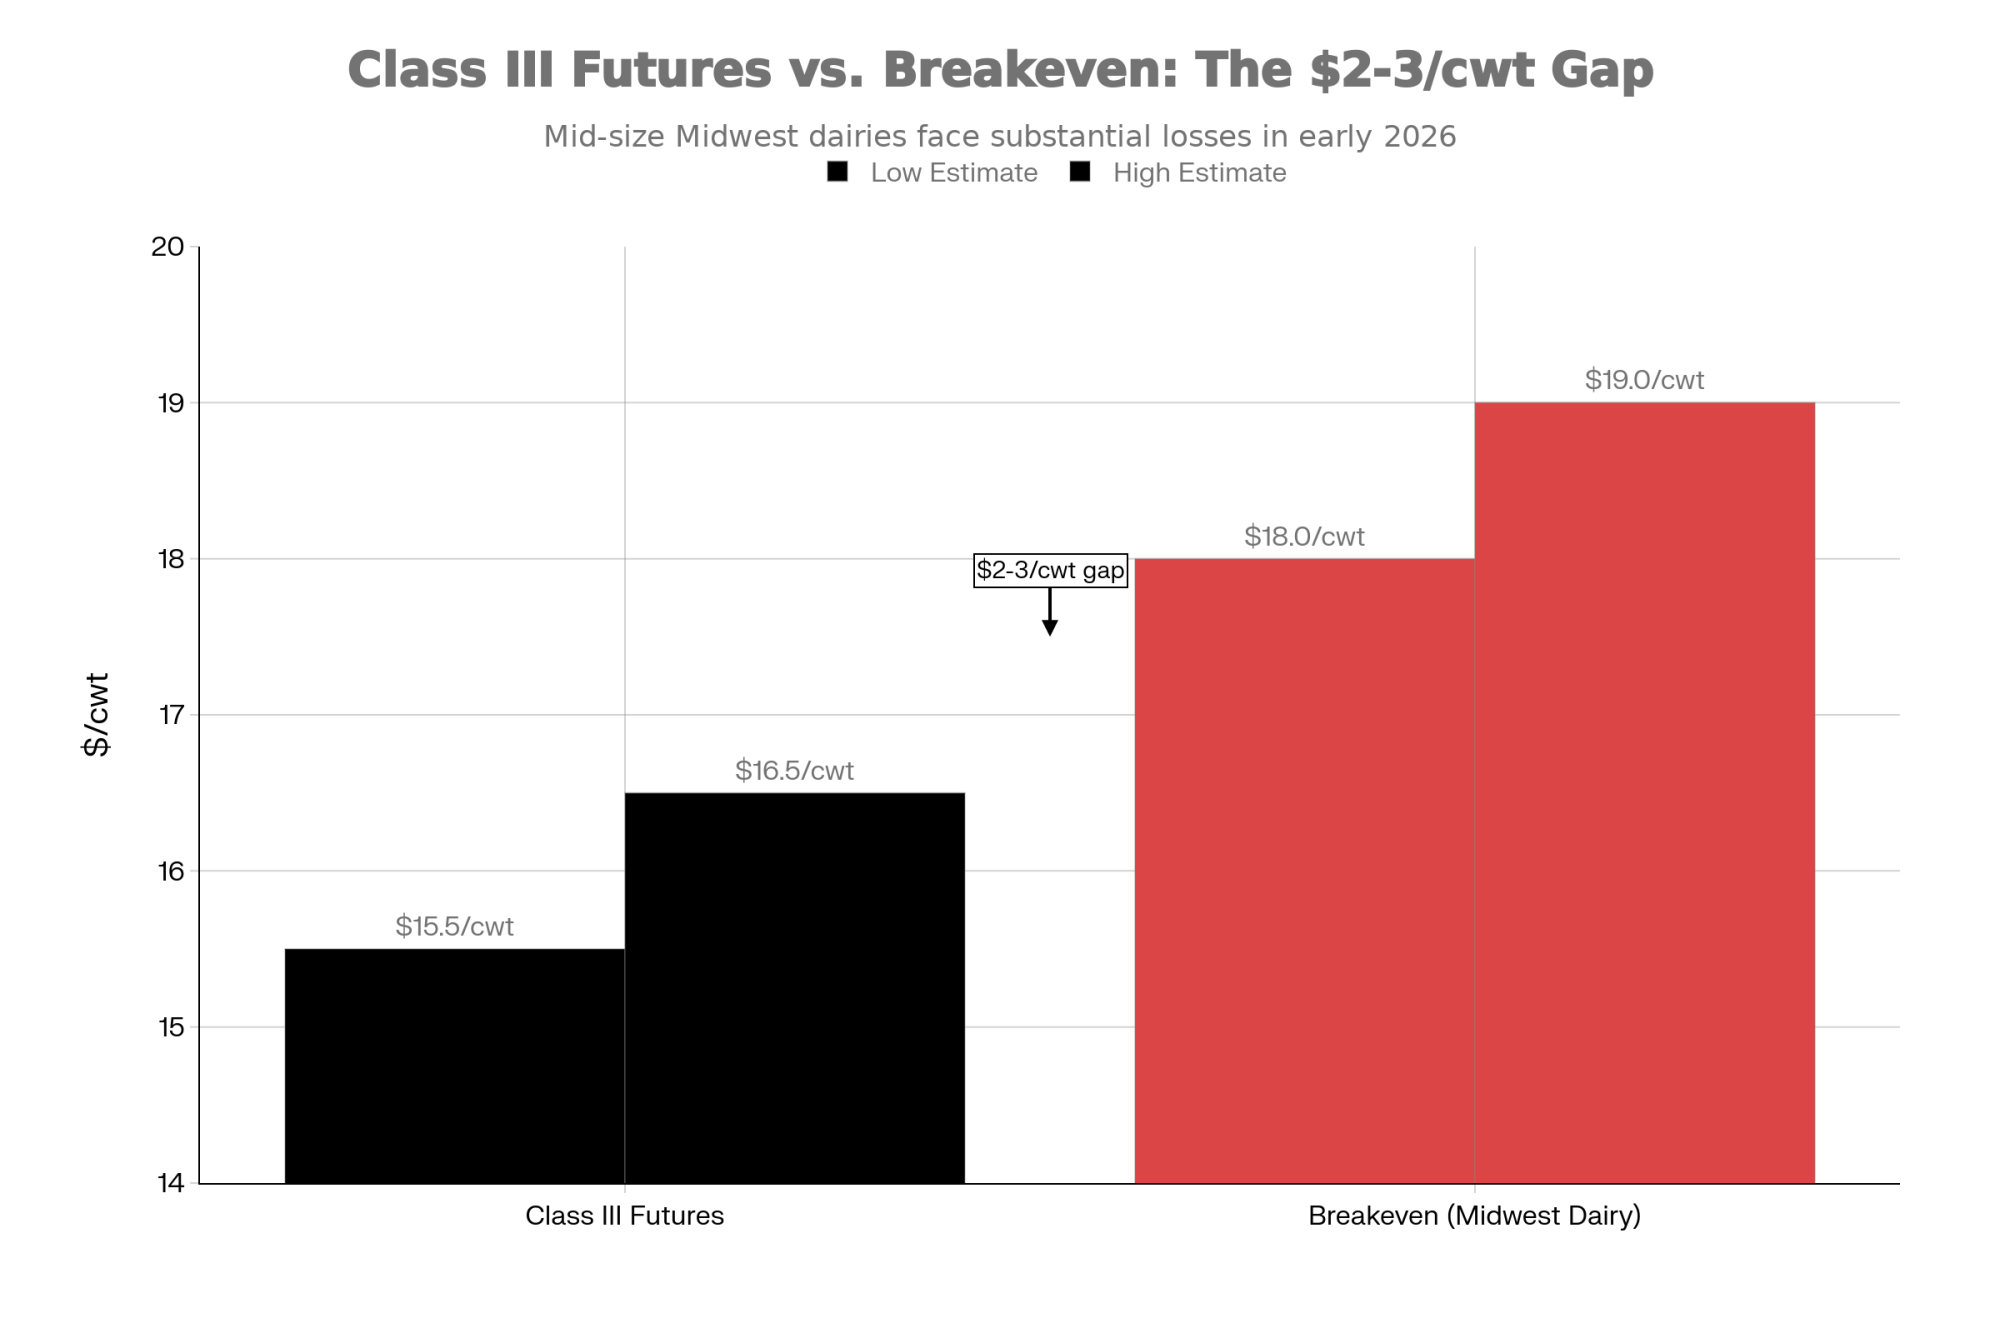
March Class III futures settled Thursday at $16.45/cwt; March Class IV landed at $18.10/cwt.
Butter: 113 Trades, Thin Stocks, and a Demand Map That’s Been Redrawn
Monday opened with a thud — down 8.5¢ to $1.6250/lb. Tuesday clawed back a penny. Wednesday added 1.75¢. Thursday blew the doors off with an 8.25¢ surge to $1.7350/lb, before Friday shaved 3¢ to close at $1.7050/lb. Half a cent lower on the week. A hundred and thirteen trades to get there.
Supply doesn’t look tight on the surface. Dairy Market News reports cream “widely available” and churns running strong. December 2025 butter production totaled 203.85 million pounds, up 2% from December 2024’s 199.75 million pounds, per ERS. But cold storage tells a different story: 199.3 million pounds on December 31, down 5% from November and 7% below year-ago levels.
The demand picture is where the “butter is in trouble” narrative falls apart. Domestic disappearance collapsed in November: 177.15 million pounds, down 24.8% from the year-ago 235.45 million pounds, per ERS. That’s the kind of number that should crater a market.
Except the same month saw butter exports up 245% and total U.S. dairy export value climb 14% to $801.7 million, per USDEC. November cheese exports rose 28%. The butter went overseas.
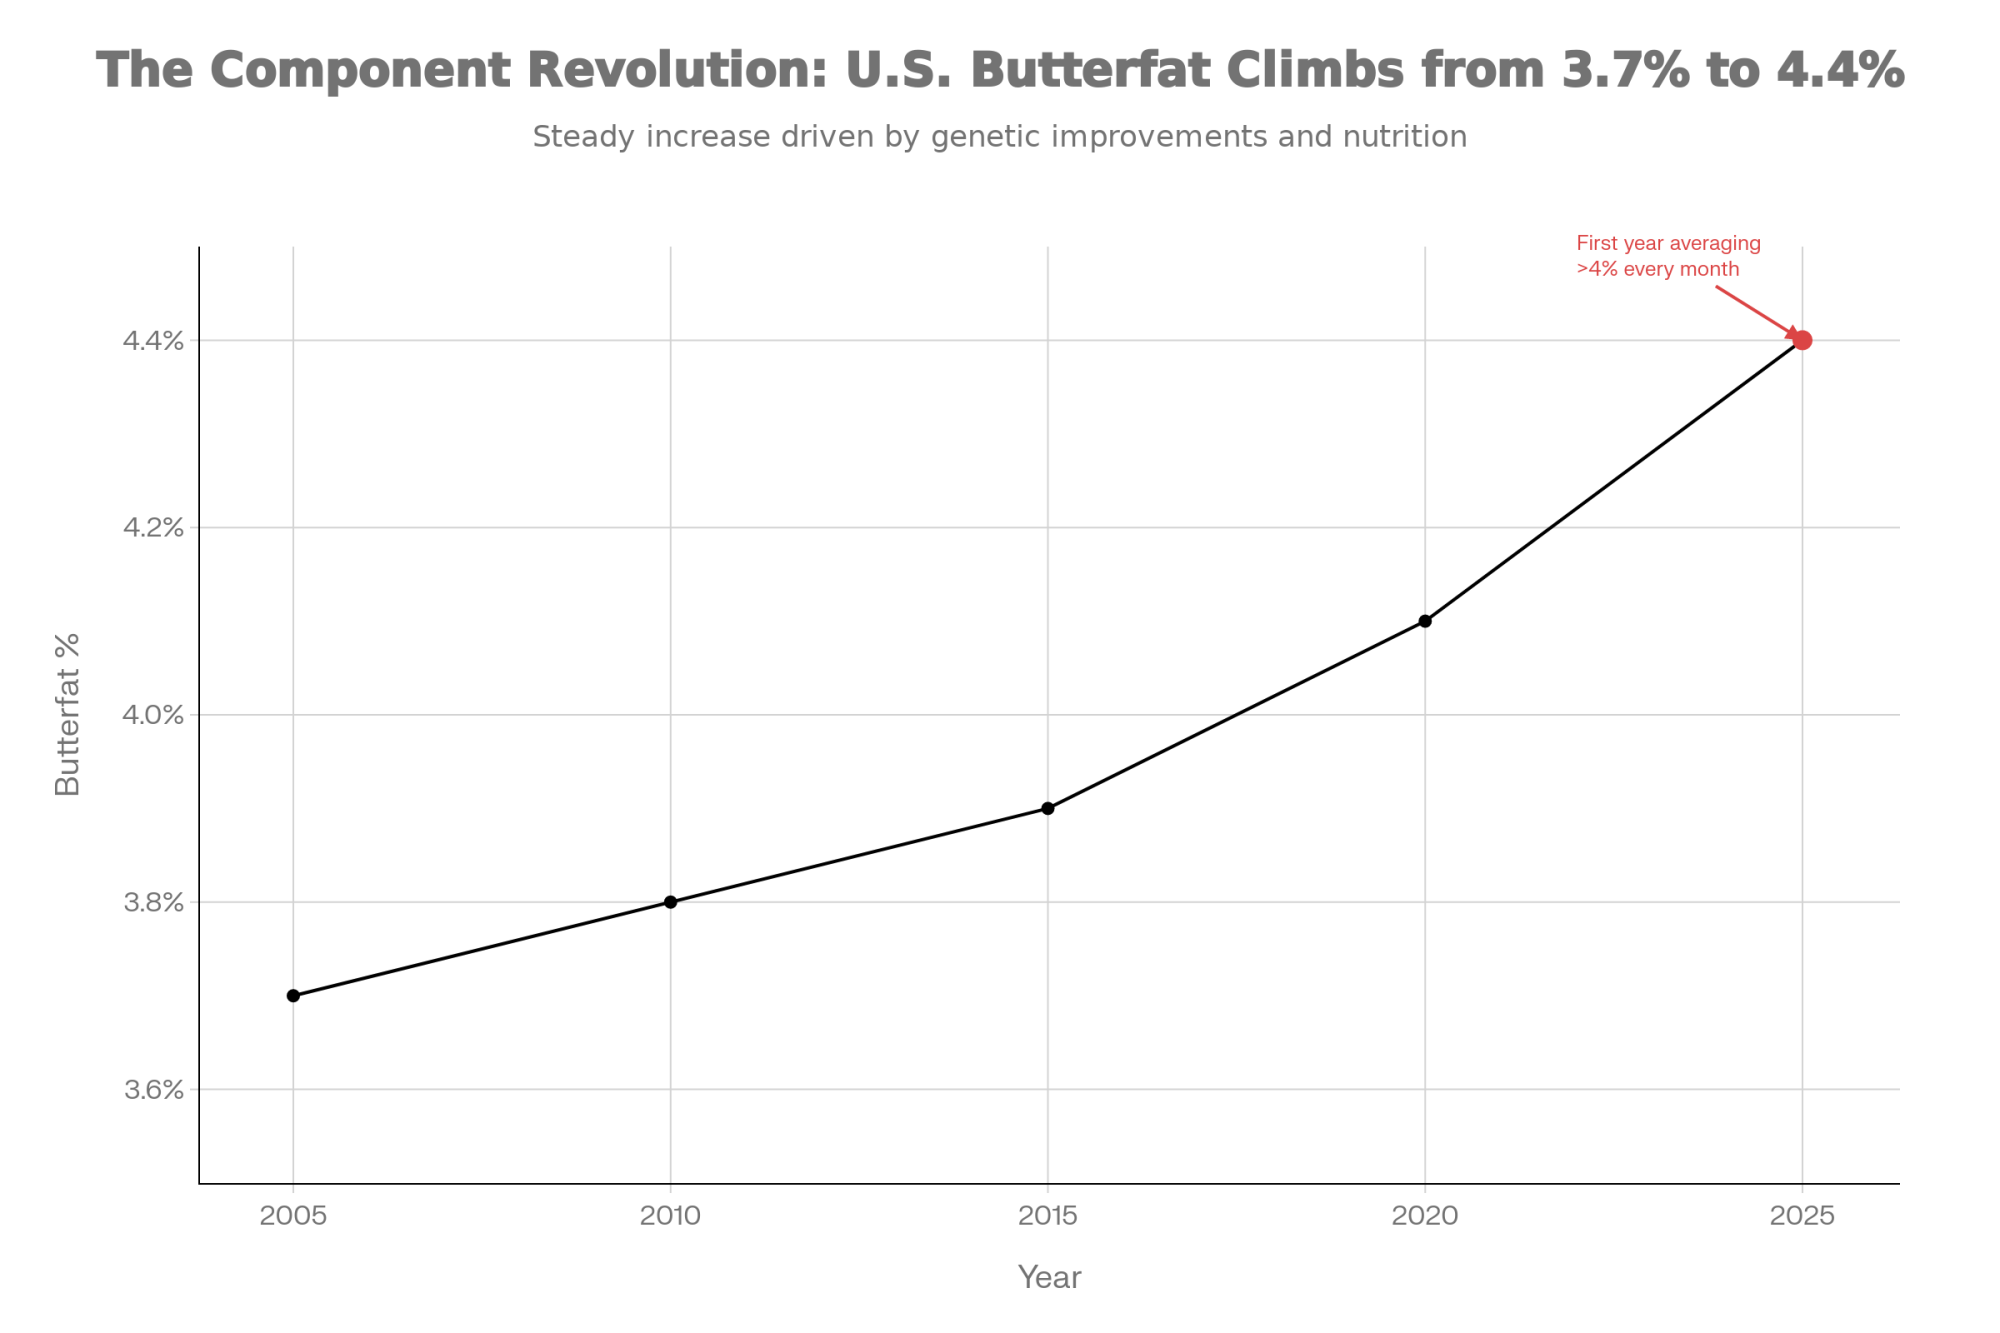
Retail sales in the East “continue to exceed last year,” according to DMN, supported by a 3.4% year-over-year decline in the butter CPI in December 2025, per ERS. Central retail is steady. Western retail is softer as buyers pulled back after the price run-up. Export demand for 82% butterfat product remains “tight” in the Central and Western regions.
As William Loux, senior vice president of global economic affairs at the National Milk Producers Federation, put it in January: butter and cheese prices “are the products that have the biggest influence on the milk check.” He’s right. And right now, butter is the hardest of those products to read — because the demand isn’t weak. It’s just somewhere else.
Cheese: The 8.5¢ Headline That Overstates the Damage
If butter’s story is demand moving overseas, cheese’s story is demand shifting from foodservice to retail and exports, with the headline overstating the hit.
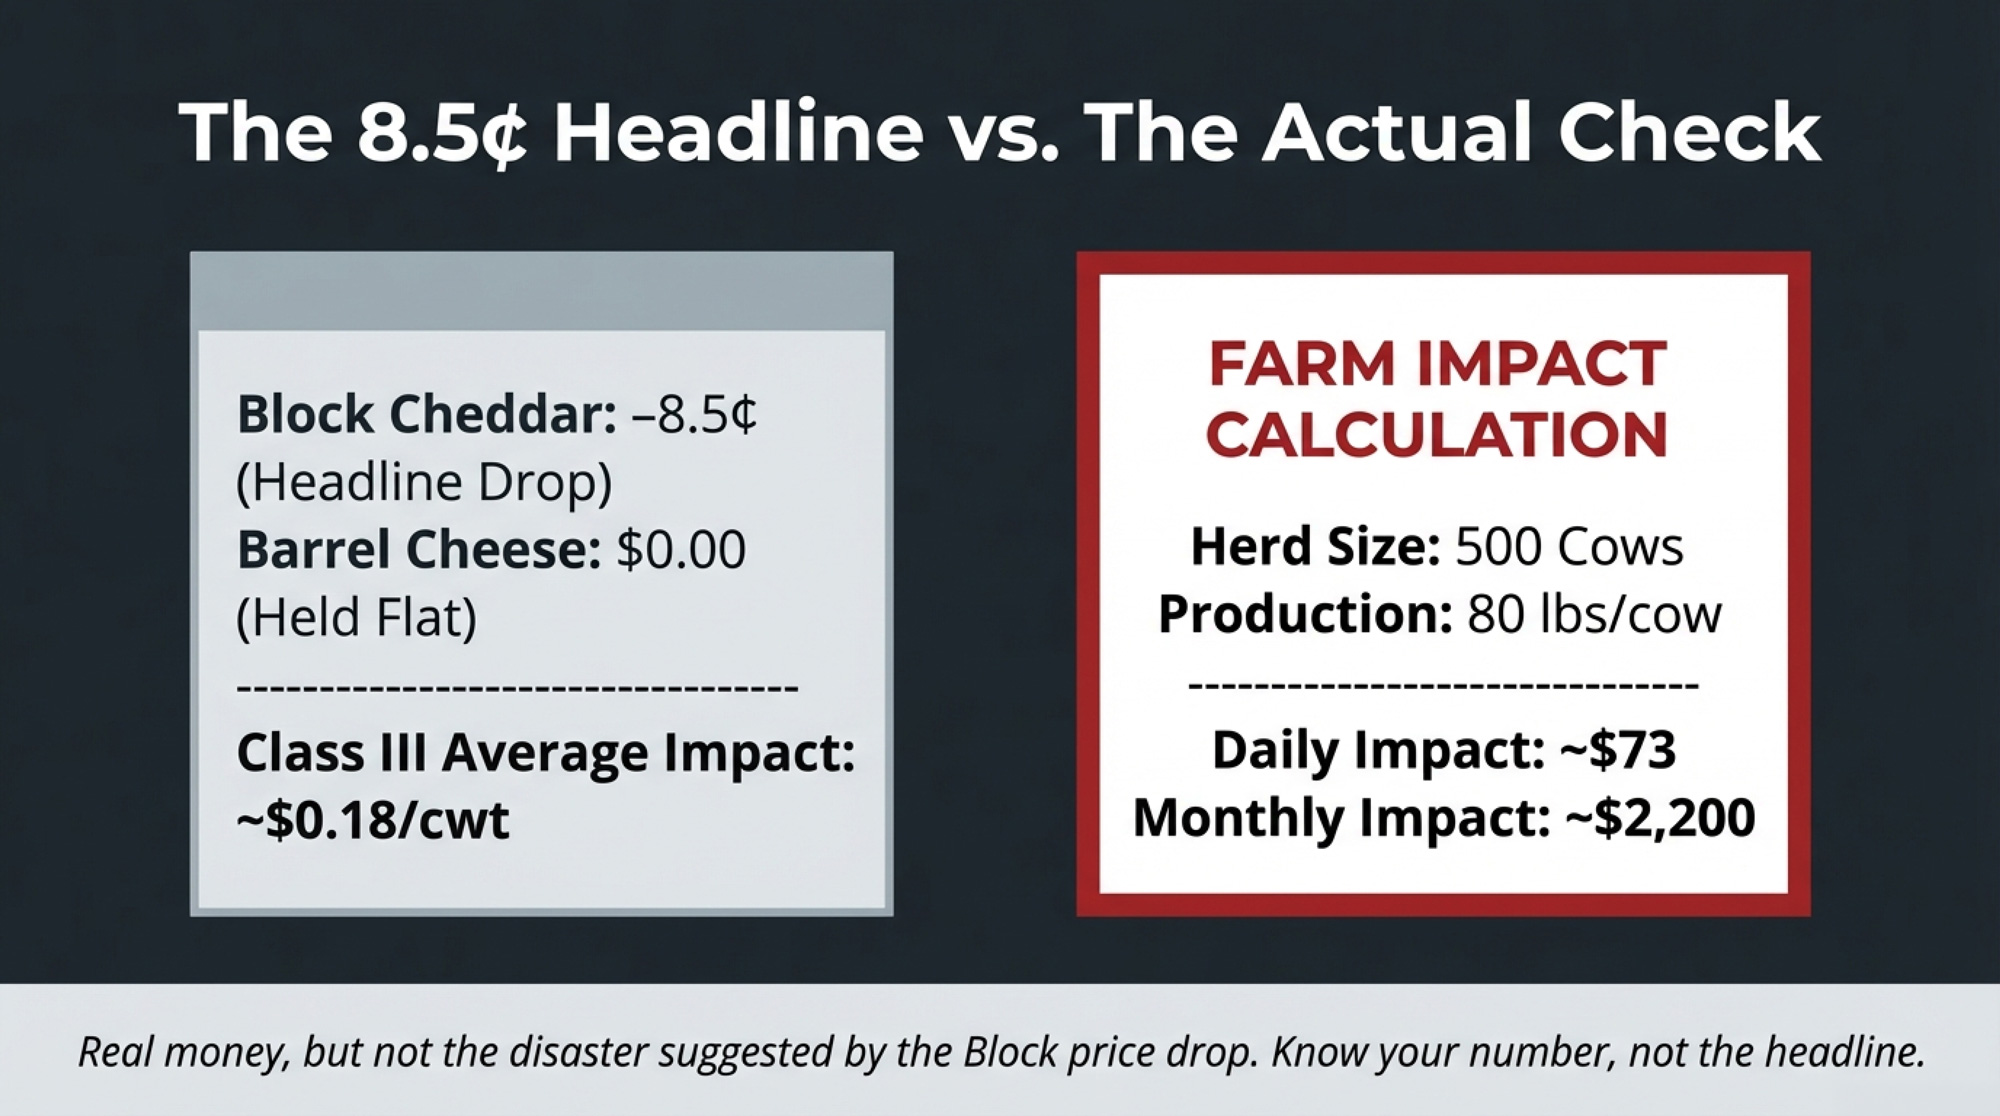
Cheddar blocks stepped down every session Monday through Thursday before steadying on Friday. Close: $1.3875/lb, down 8.5¢ on 10 loads. Barrels didn’t flinch — $1.4400/lb all week, zero trades.
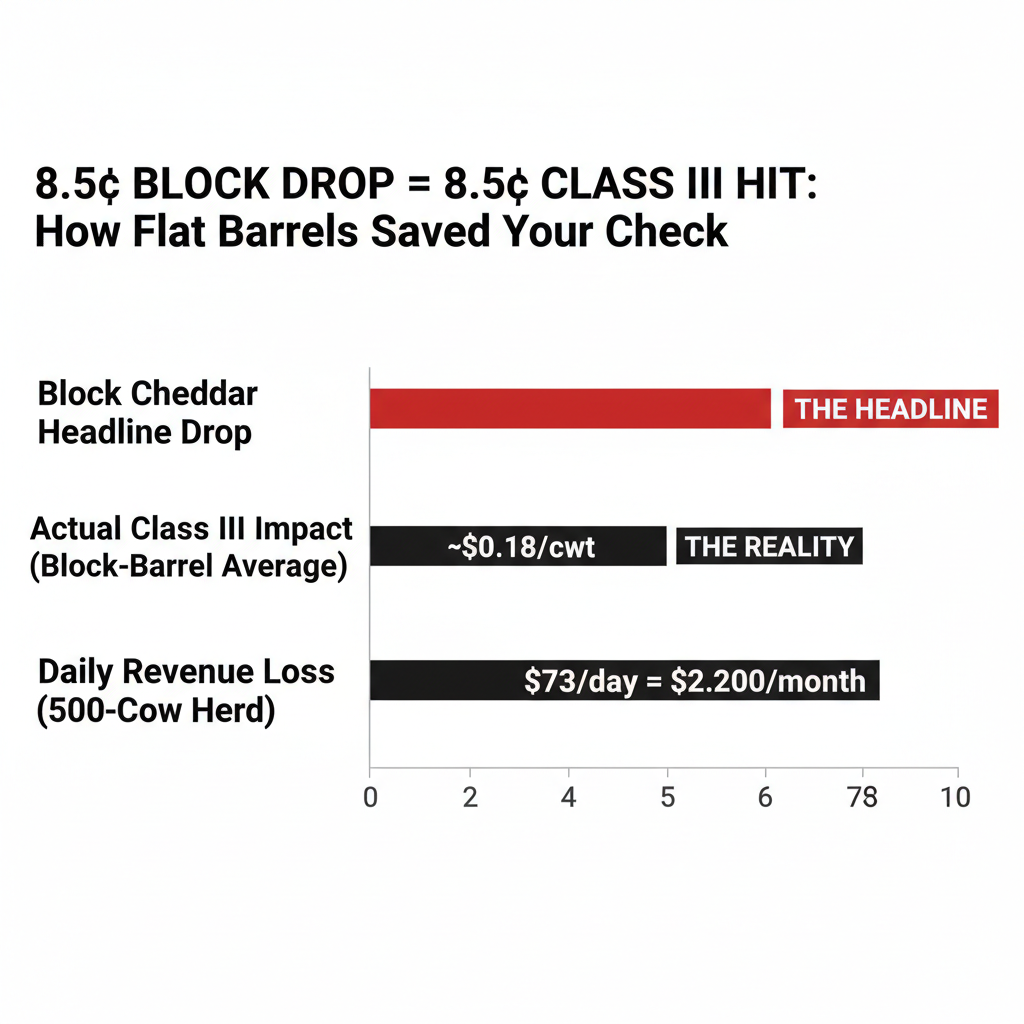
That barrel hold matters. Class III protein pricing uses the block–barrel average. Blocks fell 8.5¢; barrels held flat. The actual impact on the average: about 4.25¢, not 8.5¢. Through the protein formula, that’s roughly $0.18/cwt.
Run the barn math. A 500-cow herd shipping 80 lbs/cow/day moves 400 cwt daily. At $0.18/cwt, that’s about $73/day— roughly $2,200 over a month. Real money, but a different decision context than a panicked 8.5¢ headline suggests.
March Class III at $16.45/cwt puts gross milk revenue at about $13.16/cow/day at 80 lbs. With March corn at $4.3175/bu and soybean meal at $309.30/ton, purchased feed runs roughly $2.78/cow/day before forage, labor, and debt. There’s margin — but not much room for error. Jenny Wackershouser, a dairy marketing advisor with Ever.Ag, warned late last year that domestic demand hasn’t kept pace with the increased U.S. capacity to make more dairy products, and that cheese may need to price “sub-$1.30 to win” export business against European competition that has fallen to around $1.50/lb. At $1.3875, blocks aren’t there yet — but they’re closer than most producers would like.
| Line Item | Unit | Value | Notes / Context |
|---|---|---|---|
| March Class III Price | $/cwt | $16.45 | CME futures close Feb 13, 2026 |
| Gross Milk Revenue | $/cow/day | $13.16 | Based on 80 lb/cow/day production |
| Purchased Feed Cost | $/cow/day | $2.78 | Corn $4.32/bu, SBM $309/ton (concentrates only) |
| Net Margin Before Forage/Labor/Debt | $/cow/day | $10.38 | Tight cushion = hedge decision point |
| Monthly Margin (500-Cow Herd) | $/month | $155,700 | $10.38/cow/day × 500 cows × 30 days |
ERS shows November 2025 American cheese disappearance at 462.89 million pounds, up 5.4% year over year. Total cheese disappearance rose about 4.8% year over year.
But Loux’s observation about foodservice cuts deep: cheese “does better at food service than it does at home.” DMN backs that up — foodservice demand is “light” in the Central region and “weaker to start 2026” in the West.
So where’s the 4.8% growth coming from? Retail and exports. At $1.3875/lb, U.S. block Cheddar undercuts GDT Cheddar near the low $2.20s/lb — a competitive edge driving volume. November cheese exports were up 28% year over year, per USDEC. December production hit 1.28 billion pounds (American + other-than-American combined), up 6.7% year over year, while cold storage ended the year at 1.35 billion pounds — up just 1%. Balanced, not burdensome.
NDM at $1.60: Where the Redistribution Story Breaks Down
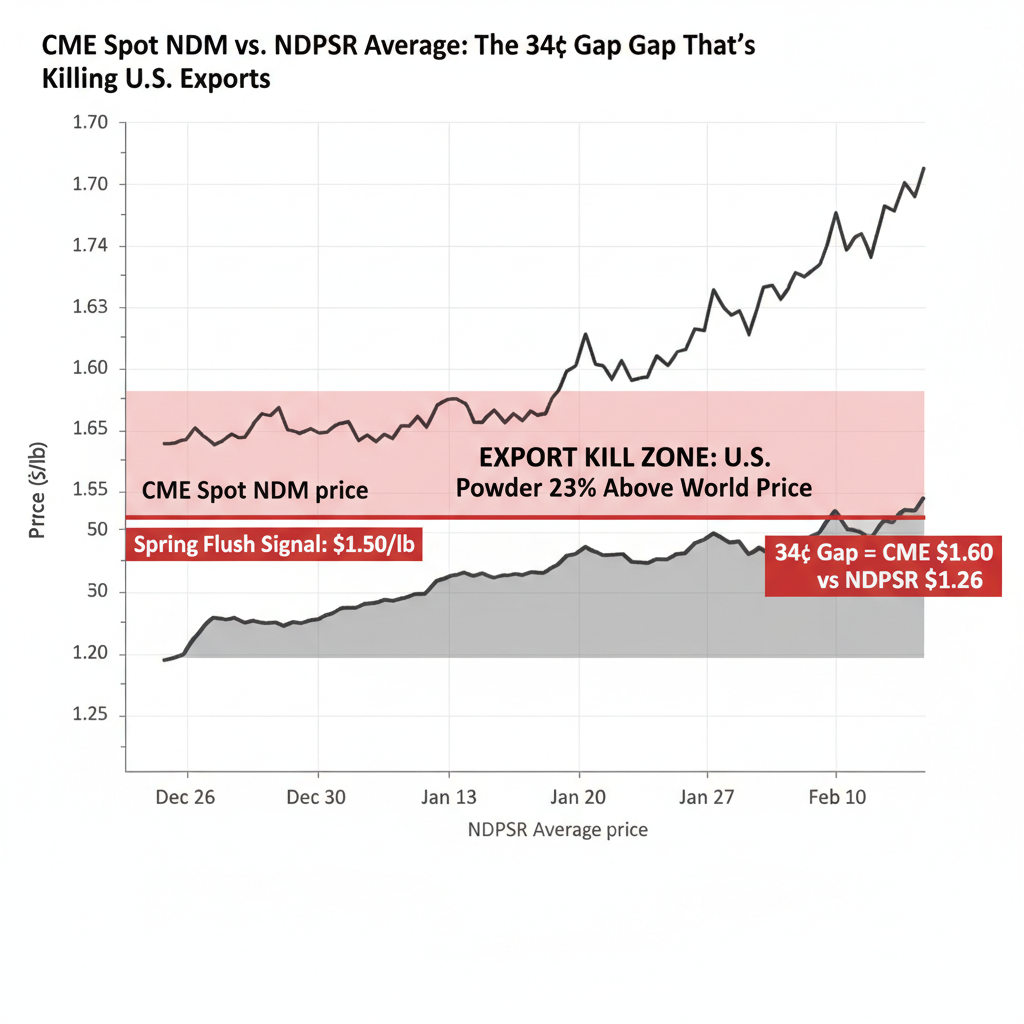
NDM is where the “demand is moving, not dying” narrative hits a wall. At $1.60/lb, U.S. powder isn’t being redistributed to new buyers — it’s being priced out of the global market entirely.
Monday dropped 3.5¢ to $1.6050/lb, followed by half-cent declines Tuesday and Wednesday, then quarter-cent recoveries Thursday and Friday. Close: $1.6000/lb, down 4¢ on 17 loads. The weekly average of $1.5995 is the highest CME spot weekly average since mid-2022, when NDM was still elevated from the post-pandemic rally.
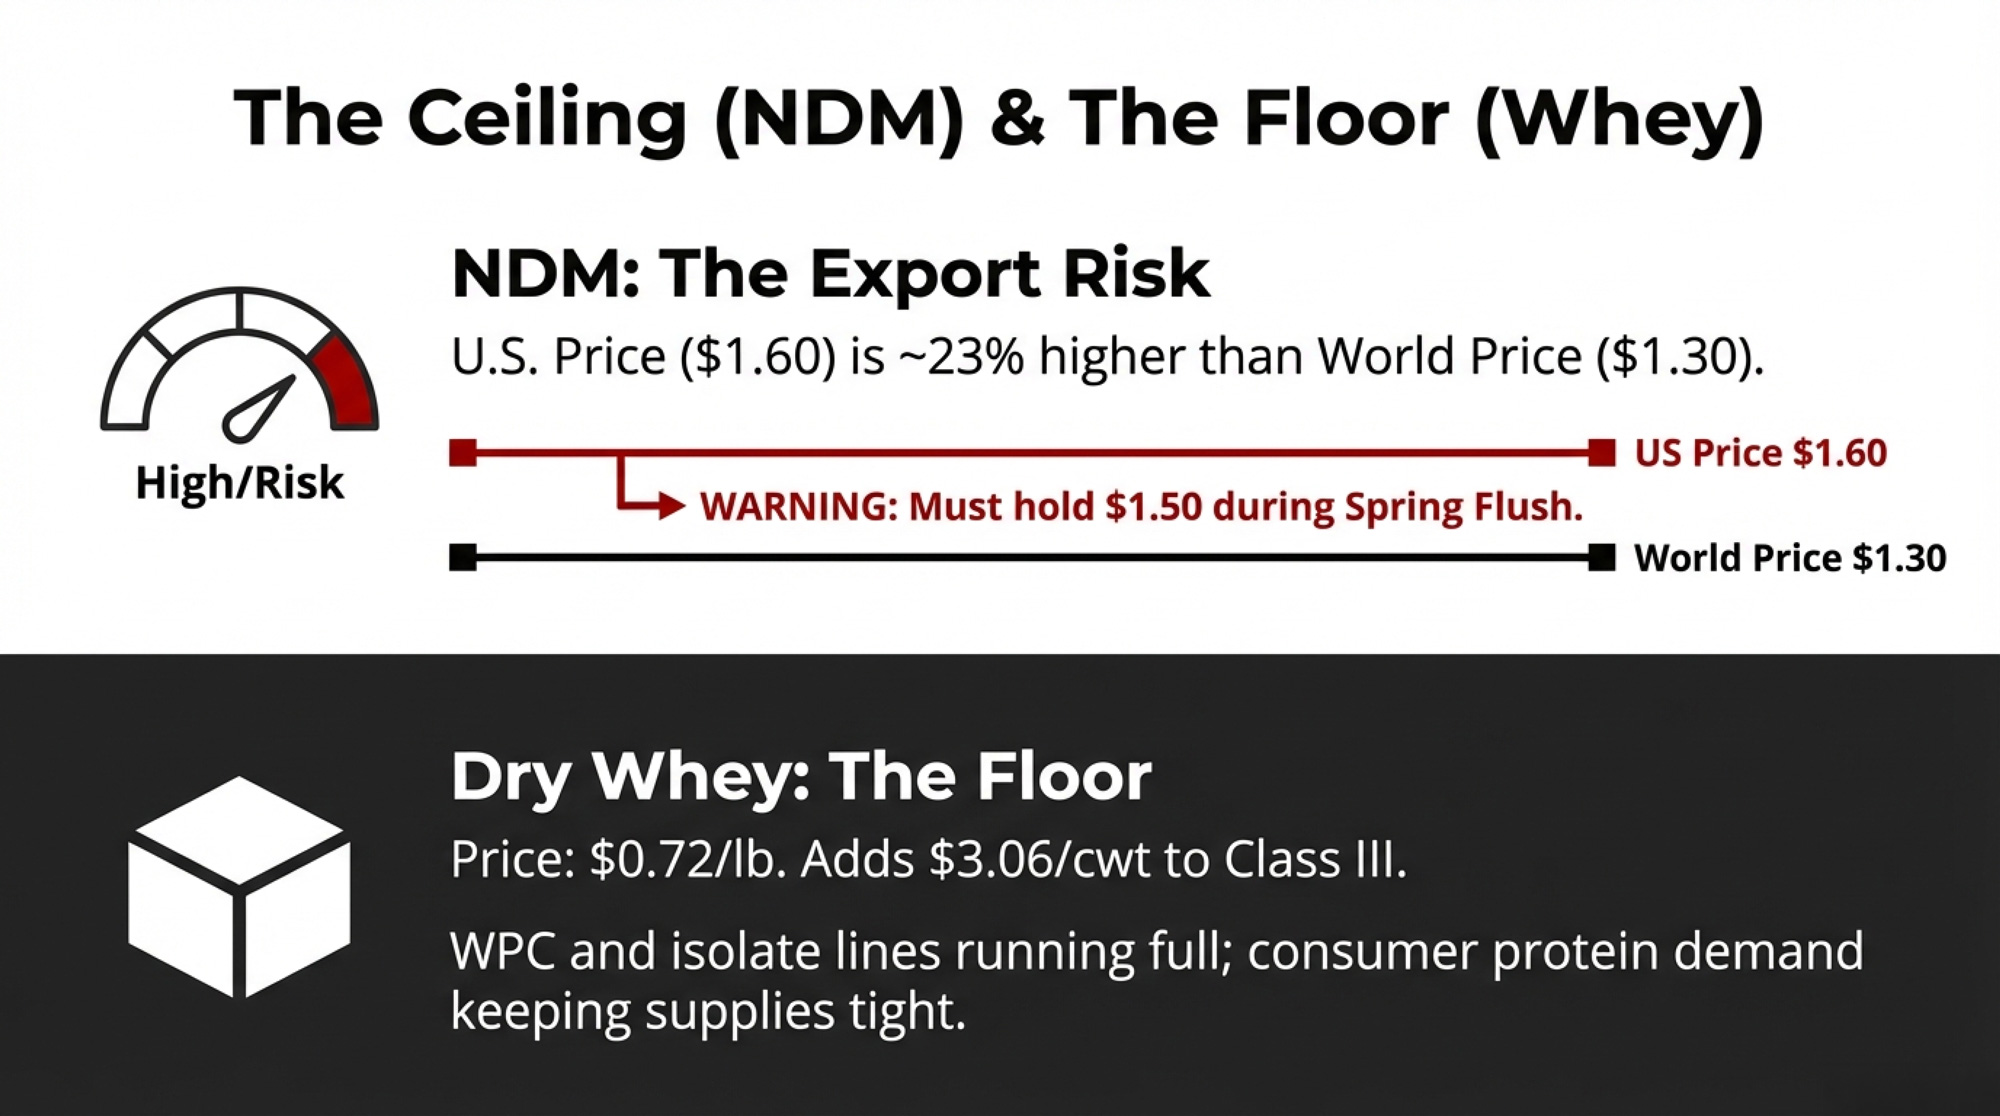
The global math is brutal. GDT Event 397 on February 3 saw skim milk powder average $2,874/MT — roughly $1.30/lb. At $1.60, U.S. NDM carries about a 30¢/lb premium, a 23% markup over world price. DMN notes “higher prices are contributing to lighter export demand,” with Mexican buyer interest softer.
The Ever.Ag Insights team put it plainly in their February 2026 outlook: “The current rally has roots in real supply issues, as cheese plants and other avenues for skim solids keep milk out of dryers.” But they warned: “We will likely see more drying activity seasonally in the weeks ahead, and U.S. marketers will struggle to win exports at prevailing prices.”
Here’s the twist your check cares about. The NDPSR average for the week ending February 7 was $1.2604/lb — more than 33¢ below the CME close. Class IV futures reflect expectations the NDPSR hasn’t yet caught up to that reality.
Dryers aren’t running flat out. In the East, some plants operate at just 25–50% of capacity as skim gets diverted to bottling, ultrafiltered milk, and higher-value uses. December 2025 dry skim milk product output came in at 171.10 million pounds, down from 182.30 million pounds in December 2024 — a 6.1% decline, per ERS.
Spring flush is six to eight weeks away. If NDM can’t hold $1.50/lb through the flush, March Class IV at $18.10 will look expensive in hindsight. If it holds above $1.50, powder is genuinely tight, and component values stay supported. That $1.50 line is your main powder signal.
Dry Whey at 72¢: Quiet but Load-Bearing
Whey gave up a single penny on Tuesday and held — $0.7200/lb, one load. Don’t confuse quiet with irrelevant. At 72¢, whey contributes roughly $3.06/cwt to Class III through the other solids component. That’s quietly holding your check together while cheese protein drags it down.
DMN reports WPC and isolate lines running full, keeping dry whey supply limited. As long as consumer protein demand stays insatiable — and nothing suggests it’s slowing — tight raw whey supplies should keep propping up this floor.
Will Western Snow Drought Hit Your 2026 Feed Budget?
USDA’s February WASDE left the soybean balance sheet unchanged and raised Brazilian soybean output to a massive 180 million metric tons. The season-average corn price received by producers was held at $4.10 per bushel, and the soybean price stayed at $10.20 per bushel. On the dairy page, USDA raised all four product price forecasts for 2026 — cheese, butter, NDM, and whey — on recent prices, lifting the 2026 all-milk price forecast to $18.95/cwt.
Katie Burgess, director of risk management at Ever.Ag, set the margin context in January: milk prices are “quite low to kick off the year,” with DMC payouts projected above $1/cwt for January through April. For a lot of operations, that safety net matters.
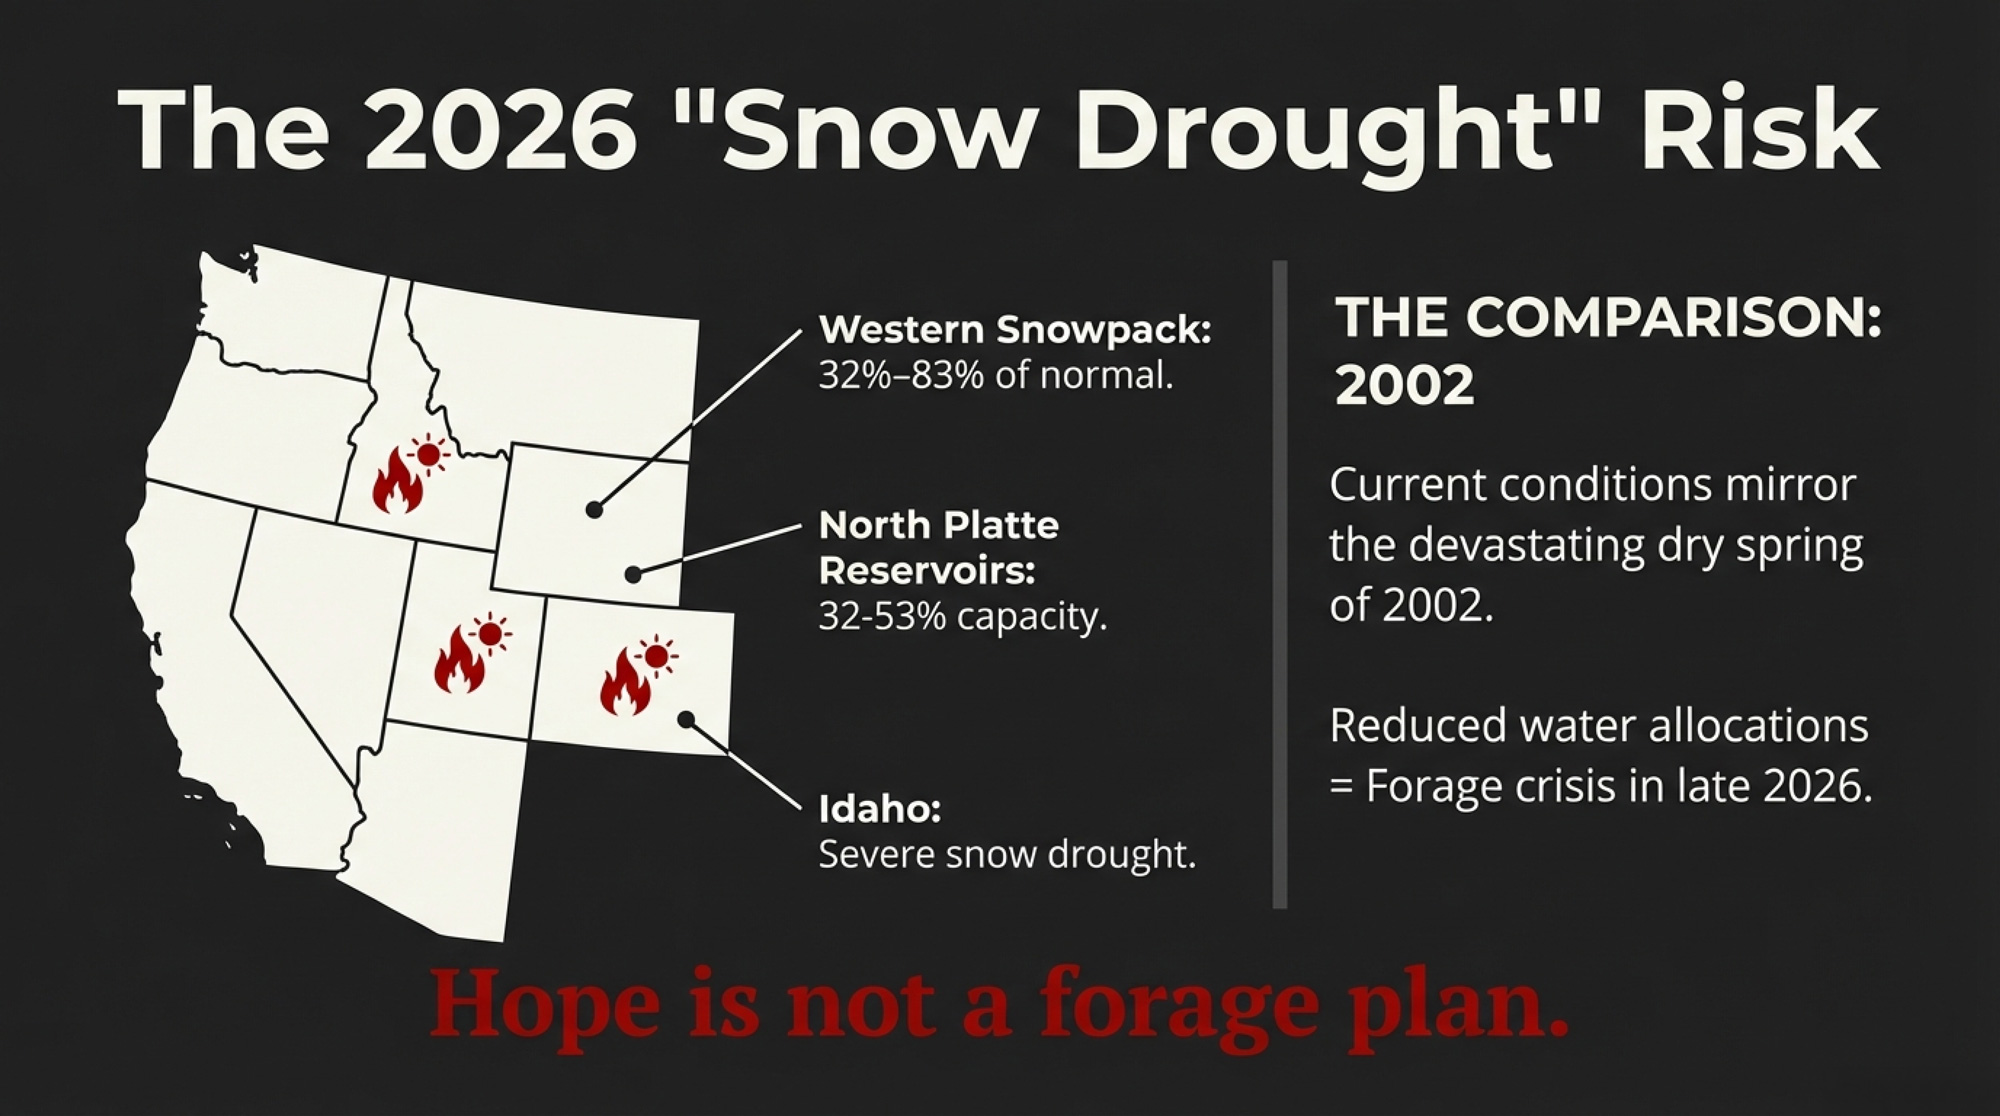
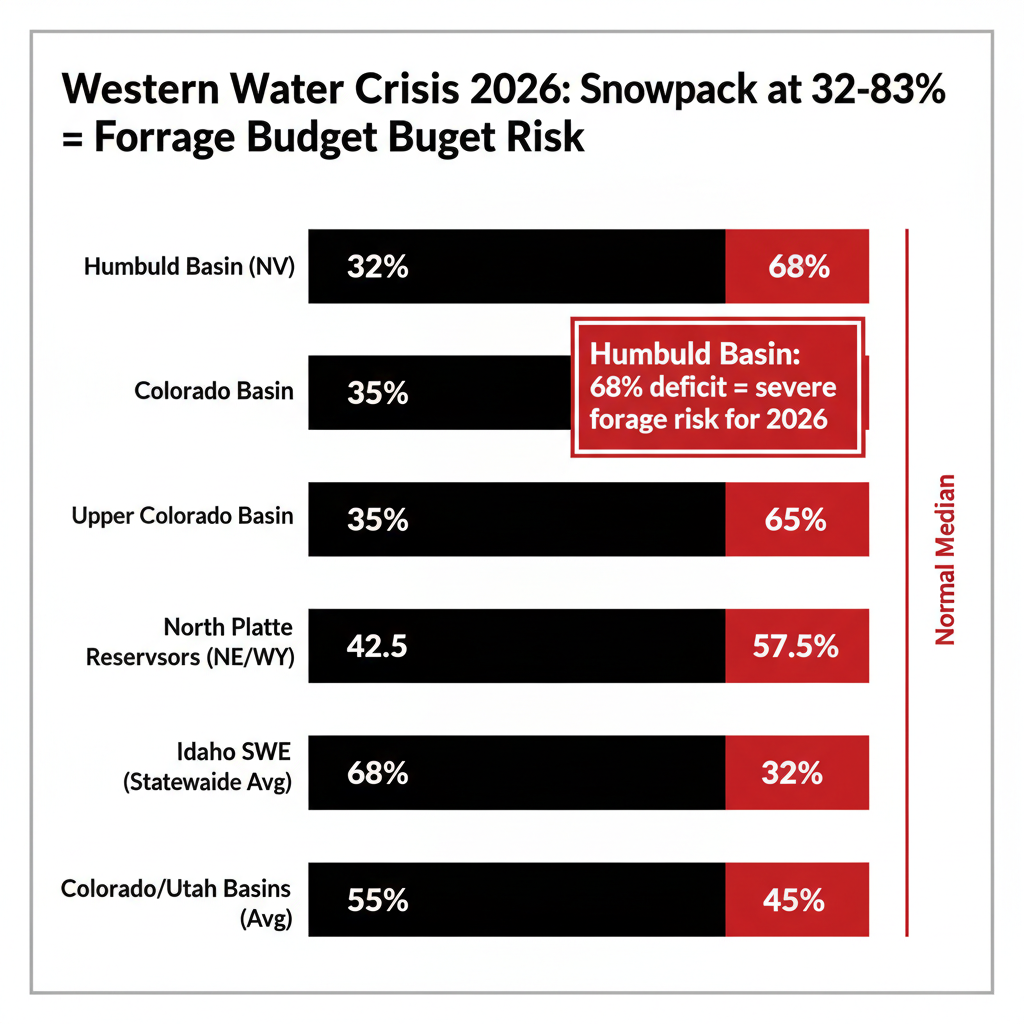
The real wildcard is water in the West. NIDIS’s February 5 update shows record-low snowpack in Colorado and Utah, most basins below 60% of median snow water equivalent, and five Wyoming monitoring sites at record lows. A February 12 update puts the Humboldt Basin at just 32% of median and the Upper Colorado at its lowest since 1986.
Gary Stone, extension crops educator at the University of Nebraska–Lincoln, reported in early February that North Platte River reservoirs are at 32% to 53% capacity. Normal headwater runoff averages about 800,000 acre-feet — roughly matching irrigation demand — and Stone warned reduced water allocations are possible for 2026.
His UNL colleague Aaron Berger, extension beef educator in Kimball, Nebraska, isn’t sugarcoating the comparison. “That year was eerily similar,” Berger said, drawing a line to 2002, which devastated spring yields. “Then we had a very dry spring. It was terrible.” He pointed to late-season storms in 2023 that dropped over 10 inches in April and May as a reason to hope—but hope isn’t a forage plan.
AgWest Farm Credit’s February 2026 drought report noted snow water equivalent at just 53% to 83% across Idaho — the state’s third-largest dairy region — calling it a “snow drought.” If you’re running cows in the West, your back-half 2026 forage budget is at risk.
What This Means for Your Operation
This week’s price declines hit unevenly: butter barely moved, the cheese headline overstated the hit, NDM pulled back from export-killing highs, and whey held the floor. The real risk isn’t what happened on the spot board this week. It’s whether spring flush overwhelms an export-dependent demand structure while western water dries up underneath it.
Next 30 days:
- Audit your Q2 hedge coverage. March Class III at $16.45 and Class IV at $18.10 aren’t disaster prices, but they don’t leave room for margin erosion. If those numbers cover your all-in cost of production, lock in at least part of your spring output. If your COP is above $17.00, the March Class III means you’re underwater before components.
- Run your own cheese math. Blocks fell 8.5¢, but barrels held flat — the real protein hit is about $0.18/cwt. Know your number, not the headline.
- Set feed price alerts. Corn below $4.00/bu or meal below $290/ton is a reasonable trigger to layer in fall/winter 2026 coverage.
Next 90 days:
- Watch $1.50 NDM as your spring flush signal. Above $1.50 into the flush says dryers can’t keep up, and Class IV holds together. Below $1.50 by May says spring milk is overwhelming dryers. Track the NDPSR-to-CME gap ($1.26 vs. $1.60) — once it closes, the price action hits your check.
- Reassess forage contracts if the western snowpack doesn’t improve by April. North Platte reservoirs at 32–53% full and Idaho at 53–83% median SWE aren’t forecasts. They’re current conditions.
Next 12 months:
- Western producers: build your 2026 forage budget with a drought scenario. Price out emergency hay and alternative forages now, while sellers aren’t panicking.
- Layer in feed coverage opportunistically. Brazil at 180 MMT of soybeans means the meal could soften. Having alerts in place lets you move when the market gives you an opening.
Key Takeaways
- A 24.8% drop in November domestic butter disappearance didn’t kill demand; USDEC data shows butter and AMF exports jumped, so the product shifted overseas rather than disappearing at home.
- The 8.5¢ block Cheddar slide translated to only about $0.18/cwt on Class III once flat barrels were averaged in — roughly $73/day, or $2,200/month, for a 500‑cow herd shipping 80 lb, so you need to run the block‑barrel math before reacting.
- NDM near $1.60/lb and a roughly 34¢ gap over NDPSR averages put U.S. powder about 23% above world prices, making $1.50/lb your key spring flush trigger for whether $18.10 Class IV is worth locking in.
- Dry whey at 72¢ is quietly adding about $3.06/cwt to Class III, which means your check is leaning heavily on other solids while cheese underperforms.
- With USDA’s 2026 all‑milk forecast at $18.95/cwt and western snowpack stuck near 32–83% of normal, you should be stress‑testing Q2 hedges against a dry‑year forage budget, not just the board price.
The Bottom Line
The trade-off on all of this: locking in Q2 at $16.45/$18.10 buys certainty but surrenders upside if the flush disappoints and prices rebound. That’s the call you make with your own cost structure.
Pull up your March coverage next to your all-in COP. Does the math still work — and have you priced in a drought scenario for your forage line?
Complete references and supporting documentation are available upon request by contacting the editorial team at editor@thebullvine.com.
Learn More
- Unlock Hidden Dairy Profits Through Lifetime Efficiency: How Modern Genetics and Strategic Nutrition Can Cut Feed Costs by $251 Per Cow – Exposes how a simple 30-day shift in colostrum management and genomic testing can bank an extra $251 per cow. This regional guide delivers immediate protocols to slash feed costs and recapture margins without adding a single stall.
- More Milk, Fewer Farms, $250K at Risk: The 2026 Numbers Every Dairy Needs to Run – Breaks down the brutal “grow or exit” math facing the 2026 dairy landscape. You’ll gain a concrete framework to stress-test your balance sheet against a $17 Class III reality before the market makes the decision for you.
- Breeding Into a Moving Market: What Butterfat’s Crash Reveals About Dairy’s Genetic Timing Problem – Reveals the dangerous 5-year lag between your genetic selections and market crashes. This analysis arms you with a “multiple-scenario” breeding strategy, ensuring you don’t spend 2030 milking for a component the market no longer values.
 The Sunday Read Dairy Professionals Don’t Skip.
 The Sunday Read Dairy Professionals Don’t Skip.
Every week, thousands of producers, breeders, and industry insiders open Bullvine Weekly for genetics insights, market shifts, and profit strategies they won’t find anywhere else. One email. Five minutes. Smarter decisions all week.