Archive for milk powder

China Weaponized Whey – And Just Killed Commodity Trading

China’s 145M-lb whey surge masks a 39% milk powder crash—here’s why that split should terrify every dairy farmer.

EXECUTIVE SUMMARY: China’s August whey imports hit 145.3 million pounds—a 30-month high that most analysts are calling a recovery, but the real story lies in what they’re not buying. While raw whey surged 31.1% from the U.S., China simultaneously slashed consumer dairy purchases by 32-37% across categories, revealing a calculated strategy that’s fundamentally reshaping global dairy trade. Recent Trade Data Monitor analysis shows that China’s combined milk powder imports dropped to a decade-low level, despite a 9.2% decline in their domestic production, indicating a willingness to sacrifice short-term efficiency for long-term control over consumer-facing dairy products. This isn’t random buying—it’s surgical selection between industrial necessities they’ll import and consumer products they’re determined to control domestically, creating what industry observers now recognize as a two-tier global supplier system. The implications extend far beyond export markets, as disrupted trade flows affect regional milk pricing from California to Vermont when excess product seeks new outlets. Forward-thinking dairy operations are already adapting by building flexible processing capabilities and diversifying market relationships, recognizing that supply reliability now often trumps cost advantages in this politically sensitive landscape.

What if China’s latest trade data isn’t a recovery, but a warning? It’s the first sign that they’re no longer playing the commodity game, and that changes everything for us in the dairy industry.

Here’s what the August numbers tell us: China’s dry whey imports hit 145.3 million pounds—the highest we’ve seen in 30 months, according to Trade Data Monitor. Most analysts are calling it a seasonal bounce-back. However, when I began investigating what else they’re purchasing (and what they’re not), a different story emerges.

The whey surge shows a 4.8% increase over last year’s already strong volumes, with U.S. shipments rising 31.1% after the temporary tariff pause following the Trump-Xi TikTok negotiations. But here’s the kicker: while raw whey imports climbed, China simultaneously slashed consumer dairy purchases. Trade Data Monitor shows whey protein concentrate with at least 80% protein dropped 32%, butter fell 37%, and cheese declined 12% compared to August 2024.

This isn’t random buying. It’s surgical. China’s making calculated choices about what it’ll depend on others for and what it wants to control itself. And that selective strategy should make every dairy producer take notice.

China’s Strategic Import Split: Raw whey imports surge to 30-month highs while consumer dairy purchases crater—revealing a calculated two-track strategy that’s reshaping global dairy trade dynamics. The August divergence isn’t seasonal recovery—it’s economic warfare disguised as commerce.

China’s Two-Track Strategy

Looking at these patterns over the past 18 months, China’s developed what you might call a dual approach to dairy imports. Once you see the logic, it’s actually brilliant from their perspective.

Track one: They’re building an iron wall around consumer dairy—milk powders, cheese, yogurt—anything where domestic consumers care about brands and food safety stories. Complete control from farm gate to grocery shelf? That’s the goal.

Track two: They’re maintaining strategic lifelines for industrial ingredients like feed-grade whey that keep their livestock machine running. What I find particularly striking is they’re not trying to replace everything. They’re cherry-picking where they want independence versus where they’ll accept managed dependence.

The data backs this up. Trade Data Monitor reports their combined whole and skim milk powder imports through August reached just over 1 billion pounds—among the lowest January-through-August totals we’ve seen in a decade, despite a modest 1.4% increase from 2024. Meanwhile, the raw whey continues to flow because they have structural protein needs in their feed chains, especially with the ongoing rebuilding of the swine herd after African Swine Fever.

Here’s the smoking gun: China Dairy Industry Association data show that their domestic milk production actually declined 9.2% year-over-year in early 2025, with farmgate prices hitting decade lows of around $19.40 per hundredweight. Yet they’re still pushing self-sufficiency programs. This isn’t market-driven consolidation—it’s a strategic purge of smaller farms while state-connected operations get the backing they need.

The Infrastructure Arms Race Nobody Saw Coming

What surprised me most while researching this piece is the dramatic shift in the rules of export success. The old playbook—seasonal contracts, futures hedging, steady customer relationships—just got torched.

European suppliers learned this the hard way during recent trade disruptions. When Beijing needed to replace American whey volumes at lightning speed, EU exporters looked golden on paper. However, industry observers report that they couldn’t pivot their processing lines and logistics quickly enough. That’s the kind of wake-up call that costs millions and rewrites your entire export strategy.

The winners these days have built what some call flexible infrastructure. From my conversations with producers across different regions, this typically includes:

  • Adaptable processing capabilities that can shift volumes and specifications on a dime—something many Midwest cooperatives are scrambling to build
  • Digital contract systems that handle real-time adjustments when trade winds shift
  • Multi-origin sourcing arrangements so they can blend from different locations as regulations change
  • Strategic storage partnerships in key trade zones
  • Risk monitoring systems that track diplomatic developments alongside milk futures

New Zealand’s the poster child for this approach. Industry reports indicate that their exporters have leveraged duty-free FTA access to command pricing premiums of 15-25%, while maintaining a consistent market share, even during the most severe U.S.-China trade disputes. But it’s not just about lower tariffs—it’s the supply guarantee that Chinese buyers will pay extra for when everything else feels like quicksand.

A perfect example is a Wisconsin cooperative that partnered with processing facilities in three different states, enabling them to blend products to meet shifting regulatory requirements. When one plant faced inspection delays, they pivoted production seamlessly. That kind of flexibility was unthinkable in our industry five years ago, but it’s now table stakes for anyone serious about export markets.

When Politics Hijacked Commodity Trading

Risk CategoryTraditional Dairy TradingPolitical-Aware Trading
Primary ConcernsWeather, Feed Costs, Milk PricesTariff Changes, Trade Wars
Contract Length90+ days standard30-60 days maximum
Price Volatility±15% seasonal variation±40% political swings
Success MetricsLowest cost per unitSupply guarantee premiums
Infrastructure Investment$50K-100K processing focus$150K-400K political hedging
Market Response Time30-60 days planning cycles24-48 hour pivot capability

Here’s something that would’ve sounded like science fiction five years ago: major Chinese importing companies now run specialized war rooms that monitor diplomatic developments 24/7. These aren’t your grandfather’s commodity desks—they’re designed to pounce when political windows crack open.

Early intelligence suggests that when Trump and Xi reached a preliminary agreement on TikTok in September, some buyers responded with remarkable speed to secure additional whey contracts. That response time has forced exporters to tear up their traditional playbooks entirely.

Many are now offering what amounts to “political insurance policies” instead of standard long-term contracts:

  • Rapid-response rolling contracts that buyers can adjust monthly rather than seasonally
  • Price adjustment clauses that activate automatically when trade conditions shift
  • Option-style agreements that give buyers escape hatches without firm commitments
  • Risk-tiered payment structures that fluctuate with political temperature

Bottom line? Supply certainty now trumps rock-bottom pricing. If you can guarantee delivery when the diplomatic weather turns nasty, buyers will pay handsomely for that insurance.

Decoding the Import Data Tea Leaves

China’s buying patterns reveal its master plan, and understanding it matters because these ripple effects also impact domestic markets. You’ve got falling production while farmgate prices crater, yet they’re doubling down on self-sufficiency. Seems backwards until you realize their endgame isn’t maximizing every gallon—it’s owning the consumer narrative while keeping industrial lifelines they can’t easily replace.

This creates genuine opportunities if you can read between the lines. Many exporters are pivoting heavily toward industrial ingredients, such as feed-grade whey, lactose, and protein isolates. These products typically dodge political crossfire and show steadier demand patterns than consumer brands caught in the culture wars.

For most family dairies, you’re not cutting deals with Beijing directly. But grasping these dynamics helps you evaluate your cooperative’s chess moves and ask the right questions about where your milk premiums really come from. When major export channels get choked off, that milk needs somewhere to go, and it usually lands in regional markets at prices you feel.

The milk powder market tells the flip side of this story. Ever.Ag analysis shows skim milk powder imports crashed to an 11-month low at 21.8 million pounds in August—down 39% from last year. This tracks with USDA forecasts as China builds domestic capacity to strangle consumer product imports. For U.S. producers, that means excess powder that used to flow east needs new homes, creating pricing pressure from California to Vermont.

The New Geography of Dairy Power

What’s crystallizing—and the data’s still developing—is a complete redraw of the dairy trade map. The old model, based on production costs and shipping rates, has been replaced by something that resembles geopolitical chess more closely.

You’re seeing the emergence of what might be called preferred suppliers versus spot market survivors. Preferred suppliers build fortress-like relationships for essential industrial ingredients. New Zealand, with its FTA armor, select Canadian operations, and some U.S. cooperatives with the right infrastructure, earns this status. They command premium pricing and steady volumes even when diplomatic storms rage.

Everyone else is relegated to spot markets that surge and crash with the flow of political headlines. U.S. whey shipments exploded 31.1% in August, but that could evaporate overnight if negotiations derail.

This forces brutal choices for cooperatives and larger operations. Either invest heavily in the infrastructure and relationships necessary for preferred supplier status, or accept the rollercoaster ride that comes with opportunistic trading.

Even smaller operations focused on domestic markets can’t ignore these shifts. When export channels slam shut, that milk floods back into regional markets, affecting pricing and cooperative strategies across the board. Northeast operations, for instance, are finding that disrupted export flows from larger processors can create unexpected opportunities in regional specialty markets, but also pricing volatility they hadn’t planned for.

Technology as the Great Leveler

Here’s the silver lining for smaller players: technology and transparency can help narrow the gap. Digital platforms that provide real-time supply chain visibility, inventory tracking, and bulletproof quality documentation help build trust with buyers, thereby managing political risk.

Some forward-thinking operations now offer enhanced traceability using blockchain verification—not just for exports, but also for domestic premium markets. Others have built systems giving buyers instant access to shipment tracking and quality data when their primary channels face disruption.

One development that has caught my attention is that several regional cooperatives are pooling resources to create shared digital documentation systems. Instead of each co-op burning cash on expensive individual platforms, they’re creating shared systems that deliver the transparency buyers demand at a fraction of the cost. A group of Northeast cooperatives recently launched this approach, and early reports suggest it’s opening doors to specialty contracts they couldn’t access before.

Technology investments vary wildly depending on scale and ambition. But producers across different regions tell me better documentation systems help with everything from organic certification to regional branding, not just export markets.

Different Operations, Different Survival Strategies

Scale Matters: Larger dairy operations face higher volatility but gain greater access to premium opportunities, while family farms maintain more stability with fewer investment demands. Know where you stand in the new dairy trade hierarchy.

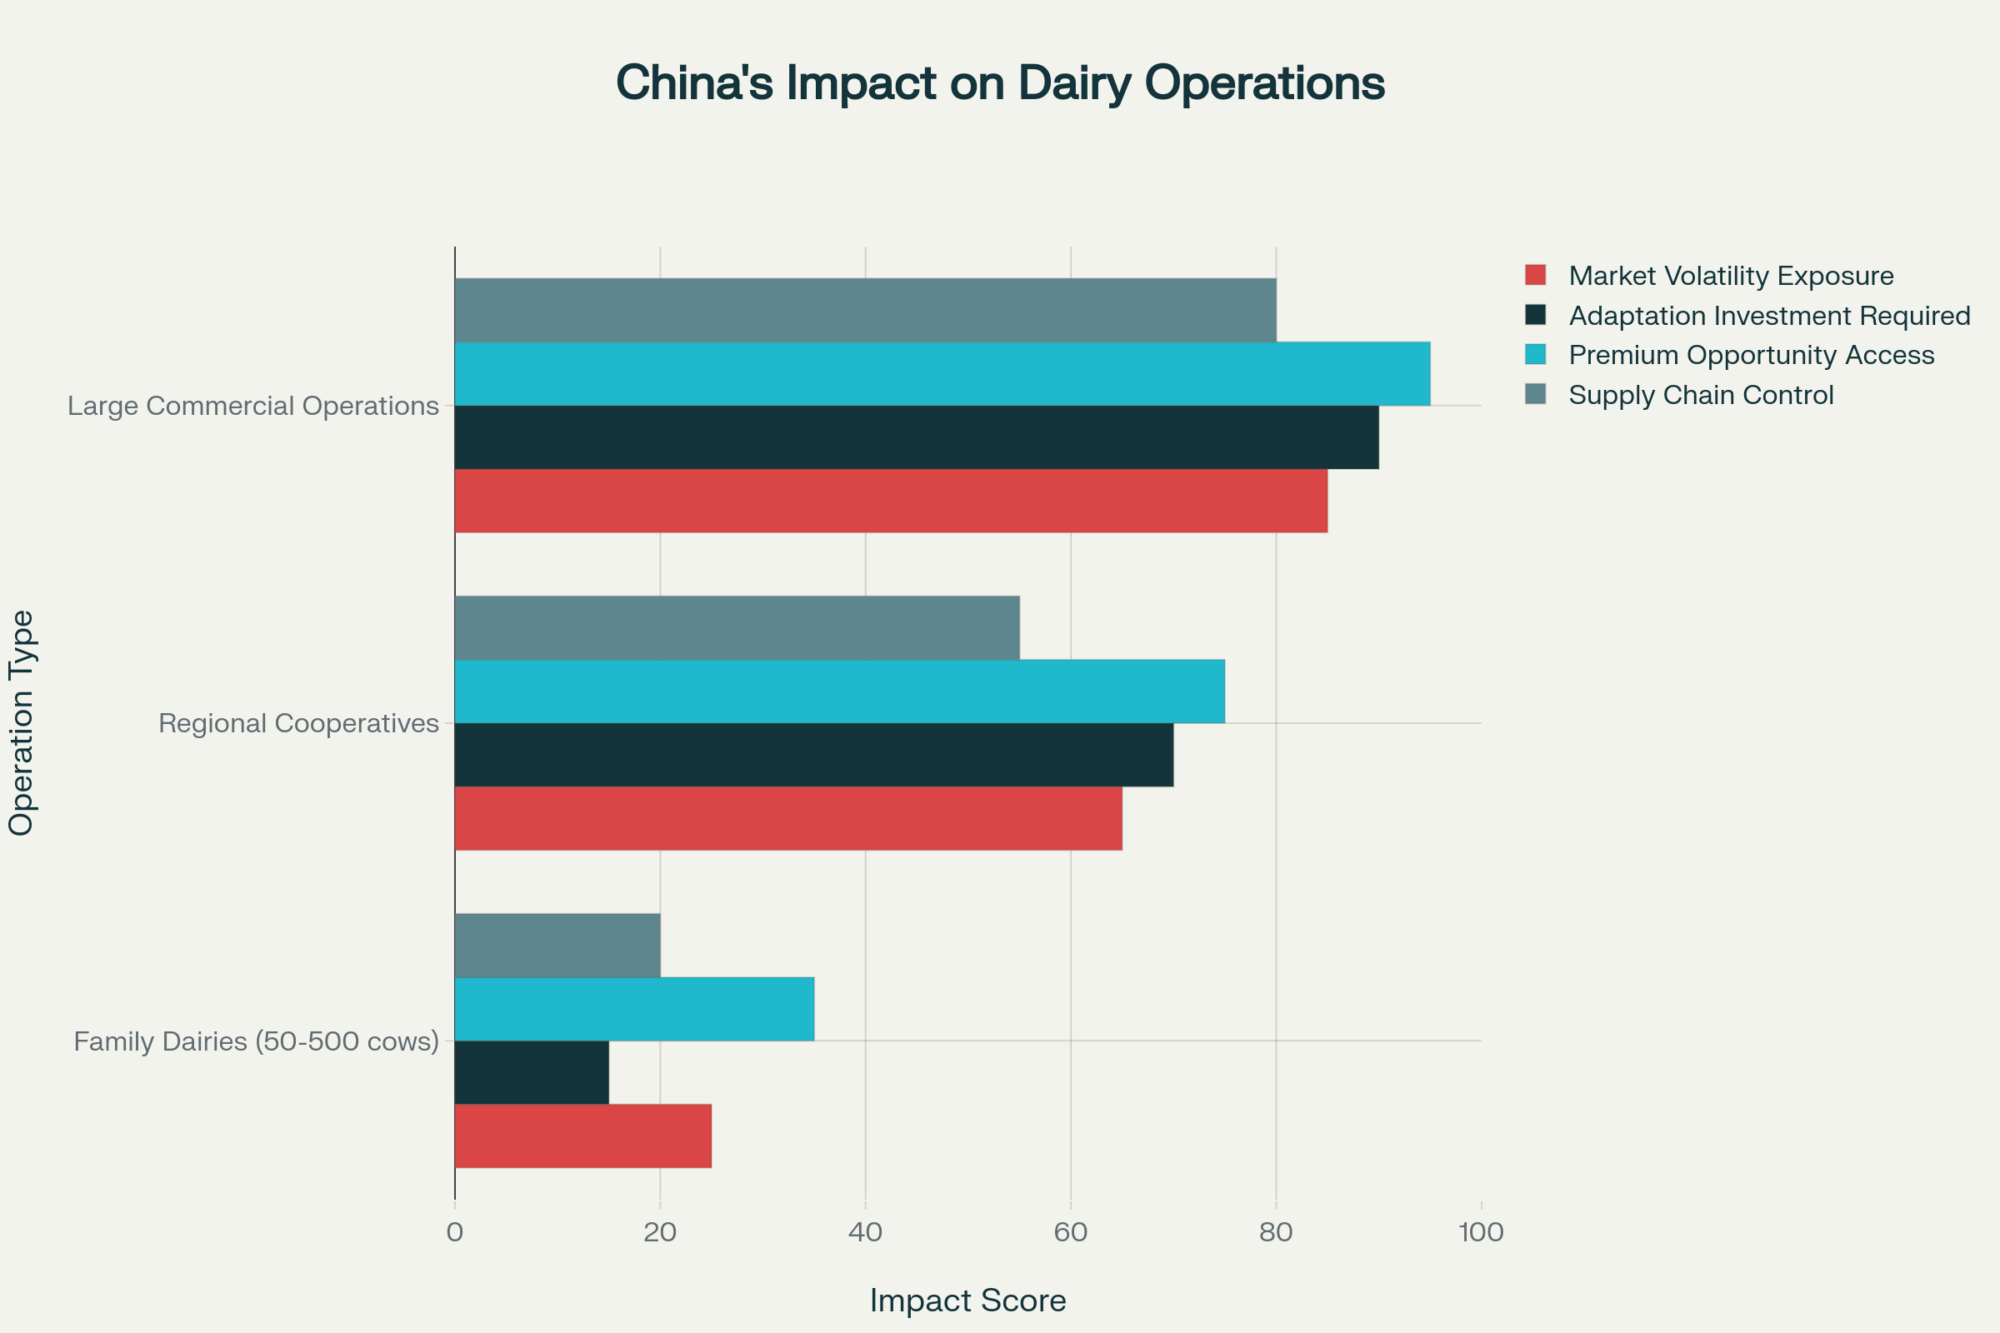
These seismic shifts hit different dairy operations in unique ways:

For family dairies (50-500 cows): You probably aren’t cutting export deals directly, but understanding these currents helps you evaluate your cooperative’s strategic positioning. When co-op leadership talks about export market development, you’ll know what hard questions to ask about infrastructure investments and political risk management.

For regional cooperatives, these changes highlight the critical importance of processing agility and market diversification. The ability to pivot between consumer products and industrial ingredients becomes a survival skill when export channels face political headwinds. The cooperatives weathering this storm best seem to be those that can dance between markets when one door slams shut but another cracks open.

For larger commercial operations, direct export opportunities exist, but they require significant infrastructure investment and sophisticated risk management. The fundamental question becomes whether you want to build those capabilities or double down on domestic market strength where you control more variables.

Early signals suggest that operations with bulletproof domestic market positions—through organic premiums, regional branding, or lean cost structures—may weather export market volatility better than those reliant on commodity export pricing.

Seasonal Rhythms and Market Timing

These trade dynamics interact with our production cycles in ways that amplify their impact. When export markets get strangled during flush season, the pricing pain cuts deeper than during lower production periods. Spring 2025 was particularly brutal when trade tensions peaked just as production ramped up across most regions.

Regional timing differences matter more than ever. California’s steadier year-round flow doesn’t face the same vulnerability to flush season as Wisconsin operations, where peak production typically occurs from April through June. Vermont and other northeastern states often peak later, from May through July, while some southern operations surge earlier. These regional patterns affect how export market disruptions ripple through local pricing.

The August whey surge hit during the sweet spot when many operations plan fall feeding programs and evaluate protein ingredient needs for the coming year. That timing likely amplified the volume response once buyers could reaccess U.S. products.

The Bottom Line

China’s whey surge isn’t just about seasonal recovery—it’s a preview of how agricultural trade has evolved into a landscape where political alliances and supply guarantees often outweigh traditional cost advantages. The old dairy trade model—built on seasonal patterns, cost advantages, and handshake relationships—has evolved into something where political awareness and supply chain agility separate winners from losers.

Those who recognize this shift and adapt accordingly will find tomorrow’s opportunities. Those waiting for yesterday’s patterns to return may find themselves managing more volatility than they bargained for. This season’s whey market performance offers a crystal ball into this transformed landscape—the key question each of us must answer is which changes actually affect our specific operation, and which ones we can safely ignore while focusing on what we do best.

KEY TAKEAWAYS

  • Processing flexibility pays premiums: Operations that can pivot between consumer products and industrial ingredients are commanding 15-25% higher margins during trade disruptions, as buyers prioritize supply certainty over rock-bottom pricing.
  • Infrastructure investment separates winners from survivors: Cooperatives building shared digital documentation systems and multi-origin blending capabilities are accessing specialty contracts worth $0.50-$1.20 per hundredweight above commodity rates while reducing political risk exposure.
  • Regional market diversification protects against export volatility: Dairy operations with strong domestic positions, achieved through organic premiums or regional branding, weather export market swings 40% better than those dependent on commodity export pricing.
  • Technology levels the playing field for smaller players: Shared blockchain traceability systems among regional cooperatives are opening doors to premium markets that were previously accessible only to large-scale exporters, while providing the transparency that buyers now demand.
  • Political awareness becomes essential business intelligence: Understanding diplomatic developments alongside traditional market fundamentals is helping progressive operations time contract negotiations and inventory decisions to capture opportunities when political windows open.

Complete references and supporting documentation are available upon request by contacting the editorial team at editor@thebullvine.com.

Learn More:

Join the Revolution!

Join over 30,000 successful dairy professionals who rely on Bullvine Weekly for their competitive edge. Delivered directly to your inbox each week, our exclusive industry insights help you make smarter decisions while saving precious hours every week. Never miss critical updates on milk production trends, breakthrough technologies, and profit-boosting strategies that top producers are already implementing. Subscribe now to transform your dairy operation’s efficiency and profitability—your future success is just one click away.

NewsSubscribe
First
Last
Consent

Alarming Disconnect: January 2025 Dairy Production Report Reveals Strategic Misalignments as Trade Tensions Loom

Powder inventories surged 41%, while processors accelerated production despite looming trade wars. The January dairy products report exposes alarming disconnects between market signals and manufacturing decisions, threatening processor and farm profitability as spring production increases.

EXECUTIVE SUMMARY: The January 2025 Dairy Products report reveals troubling production misalignments that demand immediate attention. NFDM production jumped 11% despite inventories already 41% above last year, while cheese and butter showed minimal growth despite increased milk supply. Italian cheese varieties (+2.2%) outperformed American types (+0.2%), suggesting shifting market preferences. Meanwhile, processors appear to redirect components toward consumer packaged goods like ice cream (+20.1%) and cream cottage cheese (+18.0%) while neglecting export-oriented products just as trade tensions escalate with Mexico. These patterns create significant price risks as spring flush approaches and raise questions about long-term strategic planning throughout the supply chain.

KEY TAKEAWAYS:

  • NFDM production surged 11% to 154 million pounds while inventories climbed to 299.3 million pounds, up 41% year-over-year, creating a dangerous market imbalance
  • Italian cheese varieties outperformed American types, with mozzarella production up 3.6% while cheddar continued its 15-month decline.
  • Butter production increased merely 0.5% despite high component availability, as processors shifted cream to ice cream (+20.1%) and cultured products.
  • Whey protein concentrate production fell 10.4% while whey protein isolate jumped 19.9%, indicating a strategic shift toward higher-value proteins.
  • Regional production patterns show Western processors focused heavily on NFDM (+15.2%) while Central region facilities led in cheese (+1.8%)
dairy production, NFDM inventory, cheese production, dairy exports, trade tensions, milk powder, dairy market analysis, dairy processing, mozzarella production, butterfat allocation, Mexico tariffs, spring flush

Steam billows from dryers running at full capacity across America’s heartland, transforming rivers of milk into mountains of powder that increasingly threaten to overwhelm warehouse capacity. The USDA’s January 2025 Dairy Products report, released yesterday, exposes troubling misalignments between processor decisions and market realities. Manufacturers appear to be doubling down on precisely the wrong products while ignoring clear warning signals from domestic and international markets.

Cheese Production Reveals Contradictory Strategies

January cheese production data unveils a strategic repositioning that demands closer scrutiny from processors and farmers. Total cheese output reached 1.21 billion pounds, inching up a modest 0.8% from January 2024 despite component-adjusted milk production increasing 2.2% nationally. This restrained growth suggests processors remain cautious amid looming capacity expansions and uncertain demand signals.

ProductJanuary 2025 (million lbs)Change from January 2024Change from Expected
Cheese (Total)1,210.2+0.8%Below forecast
American-Style473.9+0.2%Below forecast
Cheddar326.1-1.4%Below forecast
Italian Types521.7+2.2%Above forecast
Mozzarella412.7+3.6%Above forecast

The most revealing aspect of January’s cheese data is the stark divergence between cheese categories. While American cheese production barely increased, at 0.2% above January 2024 levels, Italian varieties grew substantially stronger, at 2.2%. Mozzarella’s impressive 3.6% increase led this to 412.7 million pounds. This marks mozzarella’s third-highest January production, reflecting processors’ strategic pivot toward export-friendly and foodservice-oriented varieties.

Particularly concerning for farmers focused on American cheese components is cheddar’s continued decline, dropping 1.4% to 326.1 million pounds—marking the fifteenth consecutive month of year-over-year declines. While this represents a moderating decrease compared to previous months, the persistent weakness in a traditionally anchored U.S. dairy processing category raises fundamental questions about shifting consumer preferences and processor responses.

The Butterfat Allocation Mystery

The January report exposes a perplexing contradiction in butterfat utilization that demands explanation. How can butter production grow only 0.5% to 218.3 million pounds when component-adjusted milk production increased by 2.2% and butterfat yields reached near-record levels? The answer lies in a dramatic reallocation of fat to alternative product streams that offer processors better margins—but may ultimately undermine farm-level butterfat premiums.

Processors appear to redirect cream toward frozen and cultured products rather than churning butter, with ice cream production soaring 20.1% to 59.6 million gallons—the highest January level since 2016. Regular hard ice cream led the surge, but other categories followed: low-fat ice cream jumped 10.2%, frozen yogurt increased 14.1%, and cream cottage cheese production jumped 18%.

This strategic pivot coincides with concerning inventory accumulation. According to the USDA’s Cold Storage Report, butter stocks climbed to 270.2 million pounds by January 31st, representing a troubling 26% increase from December and 9% growth year over year. This inventory build-up during what should be the seasonal low point for butter stocks signals potential market imbalances that could eventually transmit back to farm-level component values.

Powder Markets: A Crisis in Waiting

The most alarming element of January’s report is the dangerous inventory accumulation in dry milk products. Despite already bloated warehouses, nonfat dry milk (NFDM) production accelerated sharply by 11.0% to 153.5 million pounds, creating what industry analysts increasingly call “a powder volcano ready to erupt.”

NFDM Inventory MetricsJanuary 2024December 2024January 2025% Change (YoY)
End-of-Month Stocks (million lbs)212.3256.1299.3+41.0%
Monthly Production (million lbs)138.3130.7153.5+11.0%
Monthly Shipments (million lbs)123.0106.5106.5-13.4%
Production-to-Shipment Ratio1.121.231.44+28.6%

The 41% year-over-year inventory increase to 299.3 million pounds represents approximately 90 days of domestic consumption—far exceeding healthy balance levels. Even more troubling, NFDM shipments collapsed by 13.4% compared to January 2024, creating a perfect storm of overproduction and underconsumption.

“Processors appear to be ignoring flashing warning signs in the powder market,” warns industry economist Maria Rodriguez. “With flat or weakening demand from Mexico and reduced interest from other international buyers, these inventory levels create downward price pressure that will only intensify as we approach spring flush.”

This inventory mismanagement becomes more significant given imminent trade disruptions with Mexico, America’s largest dairy export destination. Adding to market pressures, the sharp decline in skim milk powder production (37.6% to 35.5 million pounds) indicates processors may be abandoning products specifically formulated for international markets just as trade tensions escalate—a concerning strategic pivot that could damage hard-won market relationships.

Whey Complex Shows Mixed Results

The whey sector presented contradictory signals in January that further highlight processor indecision. Total dry whey production decreased slightly by 1.9% to 76.2 million pounds compared to January 2024, despite increasing cheese production that would typically generate more whey. This suggests potential processing constraints or strategic decisions to limit whey production amid uncertain markets.

More notably, whey protein concentrate (WPC) production fell sharply by 10.4% to 38.2 million pounds, with the WPC 25.0-49.9% category plummeting 17.6%—reaching record low production levels for January. Despite this production decline, WPC stocks decreased marginally by 3.6%, suggesting weakening demand across domestic and international channels.

Conversely, whey protein isolate production increased substantially by 19.9% to 17.1 million pounds, suggesting manufacturers focus on higher-value protein products. Meanwhile, WPI stocks decreased 5.7%, indicating that demand for these specialized products remains relatively robust.

ProductRegional Change from January 2024
Atlantic
Cheese-1.6%
NFDM+4.1%
Dry Whey-2.9%

Strategic Implications for Dairy Farmers

The January production data demand strategic responses from dairy producers facing these market dynamics. The disconnect between component-adjusted milk production increases (2.2%) and finished product growth rates suggests processors struggle to balance milk utilization against fragmented market signals efficiently. This challenge ultimately transmits financial risk back to the farm level.

Farmers should consider several proactive measures:

  1. Review component optimization strategies, particularly evaluating the ROI on protein-enhancing feed additives, given the weakness in American cheese production and strength in Italian varieties.
  2. Contact processors directly to understand their production plans during the upcoming spring flush period and align herd management accordingly.
  3. Evaluate milk marketing contracts to determine flexibility for directing milk to processors with more diversified product portfolios that are less dependent on NFDM.
  4. Implement voluntary production moderation during peak spring months to avoid contributing to already excessive powder inventory build-up.

Farmers must recognize that the traditional price signals from CME markets may be increasingly disconnected from actual product movement and inventory positions. The January report demonstrates that even as cheese and butter prices show relative strength on paper, the underlying supply-demand fundamentals suggest potential pricing corrections once inventory realities fully manifest in market prices.

Conclusion: Market Reality Check Needed

As the dairy industry navigates these complex production and trade dynamics, the approaching spring flush threatens to exacerbate already significant challenges. The traditional seasonal increase in milk production could trigger substantial price corrections unless processors realign production plans with market realities rather than continuing to build inventory positions that defy economic logic.

For dairy farmers, these production trends underscore the urgent need for greater transparency and coordination across the supply chain. The divergence between component-adjusted milk production increases and finished product growth rates suggests a processing sector struggling to allocate milk components efficiently against fluctuating demand signals. This challenge ultimately transmits financial risk back to those producing the milk.

LEARN MORE:

Join the Revolution!

Join over 30,000 successful dairy professionals who rely on Bullvine Daily for their competitive edge. Delivered directly to your inbox each week, our exclusive industry insights help you make smarter decisions while saving precious hours every week. Never miss critical updates on milk production trends, breakthrough technologies, and profit-boosting strategies that top producers are already implementing. Subscribe now to transform your dairy operation’s efficiency and profitability—your future success is just one click away.

NewsSubscribe
First
Last
Consent

Flying Through Uncertainty: Domestic Cheese Demand Spurs Record Highs in Class III Futures Amid Global Market Shifts

Discover how surging domestic cheese demand is driving Class III futures to record highs. Can U.S. producers keep up amid global market shifts and rising competition?

Robust domestic cheese demand has pushed Class III futures to unprecedented heights. Reflecting worries about U.S. cheese production capacity and intense competition in export markets, third-quarter contracts shot an average of $21.28 per cwt. Attracting new overseas customers will be difficult given that U.S. cheese prices are among the highest worldwide, affecting long-term prospects.

Although high prices discourage new business, domestic consumption lowers cheese inventory. This results in a complicated situation where limited production capacity and competitive exports cause restrictions even as strong demand drives short-term advantages. These dynamics will define present results and future sustainability.

CommodityAvg PriceQty Traded4 wk Trend
Cheese Blocks$1.944517Stable
Cheese Barrels$2.006013Increase
Butter$3.094010Increase
Non-Fat Dry Milk$1.194026Stable
Whey$0.47503Increase

We will investigate the extent and ramifications of these events for the U.S. cheese industry.

Global Shifts: Strategic Cheese Production Adjustments and Their Rippling Effects on the U.S. Market 

RegionProjected Increase (%)Key Factors
Europe3.5%Decrease in fluid milk demand, better margins in cheese production
New Zealand4.0%Higher profitability in cheese, decline in milk powder prices
Australia2.8%Shift from milk powder to cheese due to higher margins
United States2.3%Strong domestic demand, export competition

The global cheese market is undergoing significant changes. USDA experts in Australia, New Zealand, and Europe are anticipating strategic surges in cheese output. This shift is driven by two main trends: a decrease in fluid milk consumption and declining profit margins for milk powder. These forecasts indicate that processors in these regions are adapting to the increased value that cheese markets offer and are prepared to redirect more milk into cheese production. As fluid milk loses its appeal and milk powder becomes less profitable, producers are increasingly focusing on more lucrative cheese manufacturing.

Despite the projected global expansion of cheese production, the U.S. dairy sector has demonstrated remarkable resilience. Currently, robust domestic demand is driving record Class III futures and high U.S. cheese prices. This resilience, coupled with the strategic changes in the global cheese market, is helping to maintain a positive outlook and keep U.S. cheese competitive in other markets.

The expected worldwide rise in cheese output points to fewer export prospects, even if today’s market supports high local pricing and demand. This might finally influence Class III values and cheese prices, stressing the intricate link between the U.S. market and worldwide production policies.

Weathering the Storm: How Strategic Moves and Climate Trends Propel U.S. Cheese Prices

Several key factors are contributing to the current surge in U.S. cheese pricing. Notably, record-breaking cheese shipments from November through April have significantly impacted American cheese supplies. This decrease in supply, combined with strong domestic demand fueled by effective promotional strategies from major retailers, has further tightened the market.

Grasping the strategic movements and climatic patterns that influence U.S. cheese pricing is crucial. An unusually hot June is forecasted for the Midwest, and adverse weather conditions, including searing temperatures in California and the Southwest, have curtailed milk production. These factors are driving up cheese prices and straining the milk supply, thereby creating an expected but challenging market situation. This understanding empowers policymakers to make informed decisions.

Market Surge: Dynamic Movements in the CME Spot Prices for Various Dairy Commodities

The CME spot market for many dairy products saw noteworthy swings this week. Strong domestic demand and inventory changes drove cheddar barrels, which soared by 6.5 cents to $2.02 per pound. Likewise, Cheddar blocks dropped 12.5 cents to $1.97 a pound, underscoring limited supply and strong demand.

Prices in the whey market remained constant at 47 cents per pound, reflecting robust local demand for high-protein goods despite poor exports. This denotes stability at the extreme of the current range.

Strong worldwide demand for butterfat keeps butter prices high even though they marginally dropped 0.25 cents to $3.09 per pound.

Class III Futures Soar Amid Robust Cheese Demand While Class IV Contracts Retreat

ContractMilk ClassPriceChange
July 2024Class III$20.67+0.75
August 2024Class III$21.13+0.75
July 2024Class IV$21.00-0.30
August 2024Class IV$21.00-0.30

Strong demand for domestic cheese has driven Class III futures to unprecedented heights, with July ending at $20.67 and August closing at $21.13. Driven by strong cheese markets and solid whey prices, this spike contrasts significantly with the fall in Class IV contracts, which dropped almost 30ȼ but still above $21 for 2024.

The higher Class III futures present promising financial opportunities for dairy farmers, encouraging increased milk output. Despite potential obstacles such as low slaughter volumes, high heifer prices, and the risk of disease outbreaks, which could complicate milk production, the potential for financial expansion remains excellent. This optimistic outlook should inspire confidence in the audience.

It is still being determined if high prices are sustainable. Strong worldwide demand for U.S. dairy and climate disruptions might sustain high prices longer than usual, presenting a problematic but profitable scene for dairy farmers, even if the decline in Class IV futures would indicate market corrections.

Butterfat Bonanza: Global Demand and Scarcities Propel U.S. Butter Prices to New Heights

Butterfat components must be raised more drastically to fulfill our need for cream-based goods. American butter prices have been so high that they have raised markets. At the height of the pandemic shortage in October 2022, German and Dutch butter values reached their maximum levels. At last week’s Global Dairy Trade auction, butter peaked at a two-year high and exceeded $3 per pound. Butter melted somewhat on LaSalle Street, sliding 0.25ȼ to a still-buoyant $3.09.

Likewise, the markets for milk powder are consistent. CME spot nonfat dry milk (NDM) concluded at $1.1925, down a negligible 0.25ȼ from the start of the week. Due to decreased output and improved consumer demand in important regions outside China, prices are rising in Europe, Oceania, and South America. Tightened milk supply and higher cheese pricing might increase demand for NDM to strengthen cheese vats in Mexico and the United States.

Dairy Dilemmas: Navigating Financial Strains, Disease Outbreaks, and Climatological Threats 

The dairy industry has significant challenges. Low slaughter levels and high heifer prices point to slight expansion. The bottleneck of diminishing replacement heifers hinders herd increase. The spread of avian influenza throughout the Midwest and mountain regions has further taxed chicken production and indirectly affected dairy operations because of complex agricultural supply lines.

Key dairy areas, including California and the Midwest, are dangerous from a developing heat wave. As cows experience heat stress, high temperatures will reduce milk production. This climatic difficulty strikes when consumer demand for dairy is still strong, aggravating the supply-demand mismatch and maintaining high prices.

These elements—limited herd expansion, disease outbreaks, and lower milk output due to weather—suggest that high dairy prices will last longer than usual. The sector finds this problematic as it aims to raise production to satisfy the high customer demand.

Steady Crops Amidst Market Calm: Limited USDA Updates Leave Commodity Prices Mostly Unchanged

Commodity6/10/20246/11/20246/12/20246/13/20246/14/2024Weekly Change
Corn (per bushel)$4.485$4.485$4.485$4.485$4.485
Soybean Meal (per ton)$352.90$353.50$355.20$358.60$360.60+$7.70
Wheat (per bushel)$6.060$6.050$6.045$6.040$6.035-$0.025

The USDA’s most recent crop balance sheet report surprised a few people. Unchanged U.S. corn output projections meant that July corn futures were constant at $4.485 a bushel. July soybean meal jumped to $360.60 per ton, up by $7.70, mirroring lower output from spring downtimes at primary crushers.

Black Sea region’s bad weather reduced forecasts of world wheat yield. Still, the American market was mostly unaffected, paying more attention to local projections. The Western Corn Belt is expected to have heavy rain; warm, sunny Midwest weather has been ideal. These seasons have restored soil moisture, therefore guaranteeing strong summer crop development. Feed costs stay low and steady, which helps dairy farmers, given the robust demand for cheese and butterfat.

The Bottom Line

Strong domestic cheese demand drives Class III futures to fresh highs despite intense worldwide rivalry and rising overseas output. Rising temperatures affecting milk output and strategic market maneuvers have constrained cheese supply, driving stratospheric prices on the CME spot market.

Planned increases in cheese production from Australia, New Zealand, and Europe call into doubt the sustainability of present U.S. pricing levels. Rising U.S. cheese prices make landing new export agreements improbable, which might change world trade dynamics in the following months.

The dairy sector is negotiating obstacles from environmental conditions and the development of illnesses like avian influenza to economic constraints like low slaughter volumes and high heifer prices. In this usually changing sector, these elements might help to maintain high prices longer than usual.

High cheese demand and limited supply help Class III futures to continue firm, yet the long-term prediction hinges on addressing production problems and changes in world market behavior. The larger dairy market will watch these changes as dairy farmers aim to optimize production, balancing optimism with prudence.

Key Takeaways:

  • High Class III Futures: Driven by strong domestic cheese demand, Class III futures have reached new highs, averaging $21.28 per cwt. for third-quarter contracts.
  • Limited Impact on Exports: Current U.S. cheese prices are expected to hinder new export business, with a foreseeable decline in exports later this year.
  • Record Cheese Exports: Between November and April, record cheese shipments helped reduce U.S. cheese inventories.
  • Climate Challenges: Sweltering temperatures in California and the Southwest, coupled with an unusually hot June forecast for the Midwest, have curtailed milk production.
  • Persistent Demand for Butterfat: Global demand for butterfat remains high, with U.S. butter prices influencing international markets.
  • Whey and Nonfat Dry Milk Markets: Steady whey prices and a stable milk powder market, with some regional price increases due to lower production and better demand outside China.
  • Class IV Futures Decline: While Class III futures have surged, Class IV futures have retreated slightly, impacting profit margins for dairy producers.
  • Agricultural Market Stability: USDA’s latest crop updates provided no significant changes, leaving commodity prices mostly unchanged, with corn and soybean meal prices stable.

Summary: The global cheese market is experiencing significant changes, with USDA experts in Australia, New Zealand, and Europe anticipating strategic surges in cheese output due to a decrease in fluid milk consumption and declining profit margins for milk powder. This shift indicates that processors in these regions are adapting to the increased value of cheese markets and are ready to redirect more milk into cheese production. Despite the projected global expansion of cheese production, the U.S. dairy sector has demonstrated remarkable resilience, driving record Class III futures and high U.S. cheese prices. Key factors contributing to the current surge in U.S. cheese pricing include record-breaking cheese shipments from November through April, strong domestic demand, and strategic movements and climatic patterns. An unusually hot June is forecasted for the Midwest, and adverse weather conditions, including searing temperatures in California and the Southwest, have curtailed milk production, driving up cheese prices and straining the milk supply. Class III futures present promising financial opportunities for dairy farmers, encouraging increased milk output. However, it is still uncertain if high prices are sustainable. The butter industry faces significant challenges due to global demand and scarcities, leading to high butter prices. High cheese demand and limited supply may help maintain high prices longer than usual.

Send this to a friend