Archive for milk component optimization

December 1 Deadline: How Cutting 15% of Your Herd Could Add $40,000 to Your Bottom Line

Dairy’s best kept secret: The farms shrinking on purpose are the ones making money. Here’s the $165K proof.

Executive Summary: A Wisconsin dairy farmer cut 150 cows and made $165,000 MORE—proving that in today’s market, strategic shrinking beats growing. With mega-dairies producing at $13/cwt versus your $23/cwt, that $10 spread is mathematically insurmountable through volume. December 1’s new protein requirements (3.3% baseline) will either cost you $8,640 in penalties or earn you $40,000+ in premiums—depending on what you do in the next 31 days. The winning formula: cull your bottom 15% to cut costs immediately, then optimize components through amino acid supplementation for premium capture. This article delivers a tested 90-day playbook with specific actions, real costs, and realistic timelines that have already transformed dozens of operations. Your choice is simple but urgent: adapt now, pivot to alternatives, or exit while you still can.

Strategic Culling Dairy

Part One: The Squeeze Is Real—And Getting Worse

You know that feeling when you’re caught between a rock and a hard place? That’s exactly where mid-size dairy operations sit right now. And if you’re running 200 to 600 cows, you’re probably feeling it every time you look at your milk check.

Let me paint you a picture with some hard numbers from the USDA’s latest Census of Agriculture, released in February. Between 2017 and 2022, we lost 15,866 dairy farms. During that same time? Milk production actually went UP five percent.

How’s that math work? Well, you probably know this already, but it’s worth saying—the big got bigger. Much bigger.
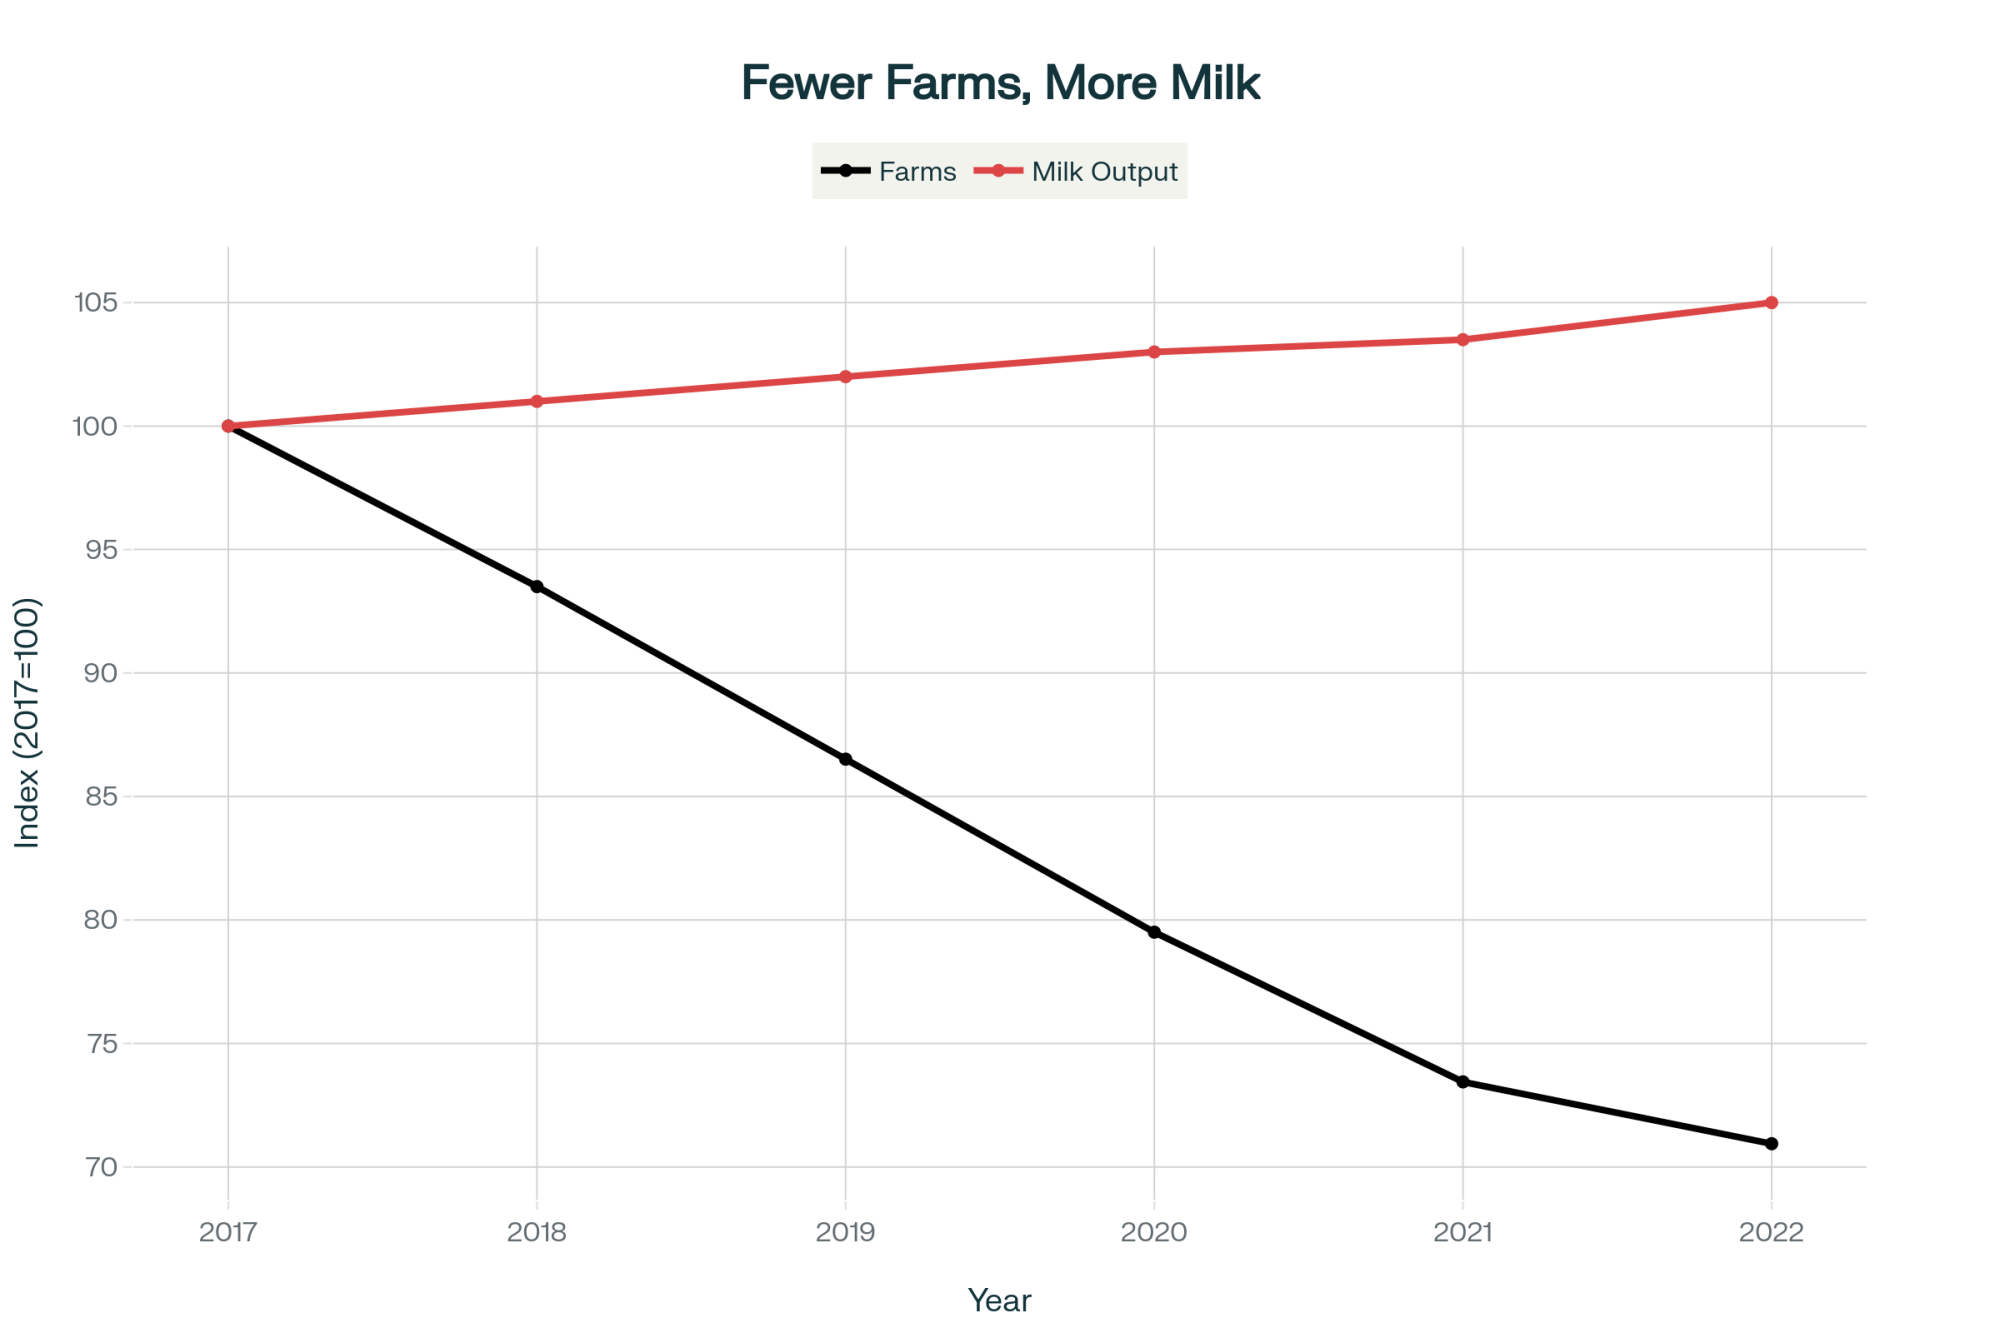
The brutal math of consolidation: 15,866 farms disappeared (29% loss) while milk production rose 5%—proof that 834 mega-dairies now control nearly half of America’s milk supply

Year
FarmsChangeProduction IndexMega Share %
201754,59910042%
201851,050-3,54910143%
201947,235-3,81510244%
202043,410-3,82510345%
202140,100-3,310103.545.5%
202238,733-1,36710546%

The Brutal Economics of Scale

So I visited one of these mega-operations in Texas last spring. Twelve thousand cows. Robotic systems everywhere. The whole nine yards.

Here’s what’s interesting—their CFO, who came from the oil industry, actually, showed me their numbers. Thirteen dollars per hundredweight all-in production costs. Thirteen.

Now, I don’t know about your operation, but Cornell’s PRO-DAIRY program has been tracking costs for typical 100-200 cow herds, and they’re seeing around $23 per hundredweight. That’s… that’s a problem.
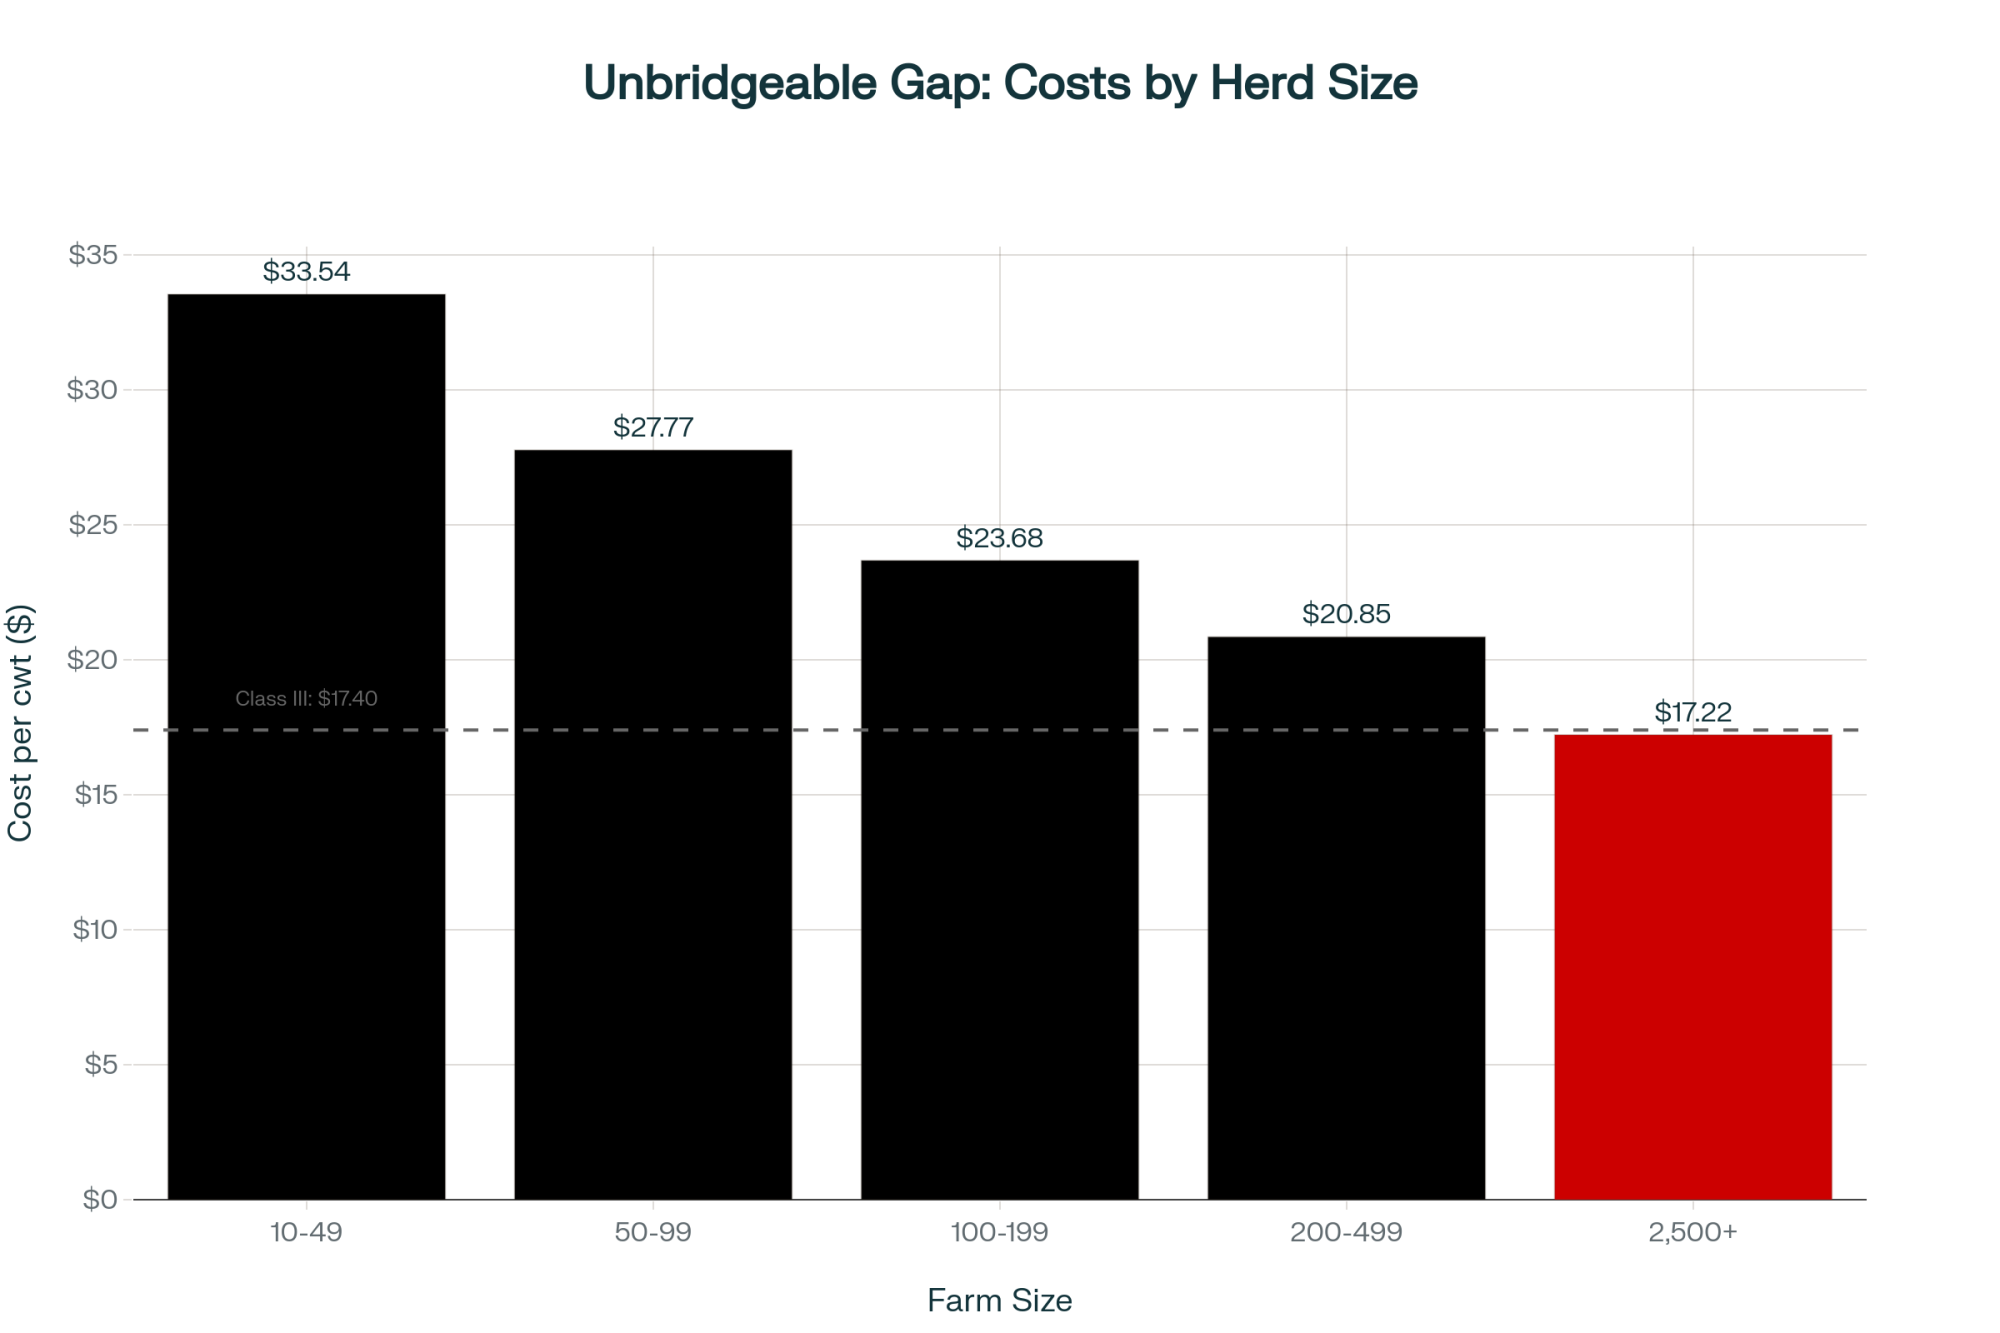
The brutal economics of scale: Mega-dairies operate at $13-17/cwt while mid-size farms struggle at $23/cwt—a $10 gap that volume alone cannot bridge

Farm Size
Cost/CWTStatus
10-49 cows$33.54Loss
50-99 cows$27.77Loss
100-199 cows$23.68Loss
200-499 cows$20.85Loss
2,500+ cows$17.22Profit

At today’s Class III price—what was it this morning, $17.40 on the CME?—smaller operations are losing close to six bucks per hundredweight. Meanwhile, these mega-dairies? They’re making over four dollars.

That’s a ten-dollar spread, folks. Ten dollars!

“I realized I was trying to compete on volume with operations ten times my size. Can’t win that game. So I changed the game—focused on profit per cow, not gallons in the tank.” — Wisconsin dairy farmer who cut his herd from 1,200 to 1,050 cows

And here’s the thing that keeps me up at night—it’s not that these big operations are doing anything wrong. They’re just playing a different game entirely. Feed costs alone, they’re saving $2-3 per hundredweight through direct commodity purchases. Labor efficiency? Another couple of bucks saved. It adds up fast.

The Geographic Earthquake Nobody’s Talking About

While you’re wrestling with those economics, something else is happening that’s maybe even more important. The entire industry map? It’s being redrawn under our feet.

You’ve probably heard about the new processing capacity—Rabobank’s September report put the investment range at $8 to $11 billion. Biggest buildout since the 1990s. But here’s the kicker that nobody really wants to talk about—these plants aren’t where the milk traditionally has been.

Take Hilmar’s new Dodge City facility out in Kansas. Or Valley Queen’s expansion up in South Dakota. These aren’t small operations, folks. They need milk—lots and lots of milk.

And where’s it coming from? Well, USDA’s latest production report tells the story:

Texas added 50,000 cows this past year. Fifty thousand! Kansas jumped by 29,000 head. South Dakota gained somewhere between 18,000 and 21,000, depending on which report you look at.

Meanwhile—and this is what Mark Stephenson, Director of Dairy Policy Analysis at UW-Madison’s Center for Dairy Profitability, calls it—older plants in Wisconsin, Minnesota, parts of New York? They’re taking “strategic downtime.” That’s a polite way of saying they can’t compete for milk at current prices.

What I’m hearing from processing plant managers and dairy economists familiar with these operations is that new facilities are running at maybe 50-70% capacity right now, varying by plant, of course. They’re still ramping up, learning their systems, building those supply chains.

But when they hit full throttle—and most analysts I talk to figure that’ll be late 2026—we’re looking at an additional billion pounds of cheese-making capacity.

Just to put that in perspective… that’s about what the entire state of Vermont produces in a year.

Now, the strategies that work in Texas, with its minimal environmental regulations, aren’t the same as those that work in California, with its water restrictions. And our friends in the Southeast, dealing with heat stress, face different challenges than folks up in Vermont, where land costs are through the roof. But the pressure? That’s universal.

Part Two: December 1—The Trigger That Changes Everything

As if the squeeze wasn’t tight enough already, here comes December 1 with Federal Milk Marketing Order changes that’ll turn chronic pressure into an acute crisis for a lot of farms.

According to USDA’s final rule that came out in October—and I spent way too much time reading through all 147 pages of it—baseline protein jumps from 3.1% to 3.3% starting December 1. Other solids move from 5.9% to 6.0%.

Now, that might not sound like much when you’re sitting at the kitchen table. But let me show you what this actually means for your milk check.

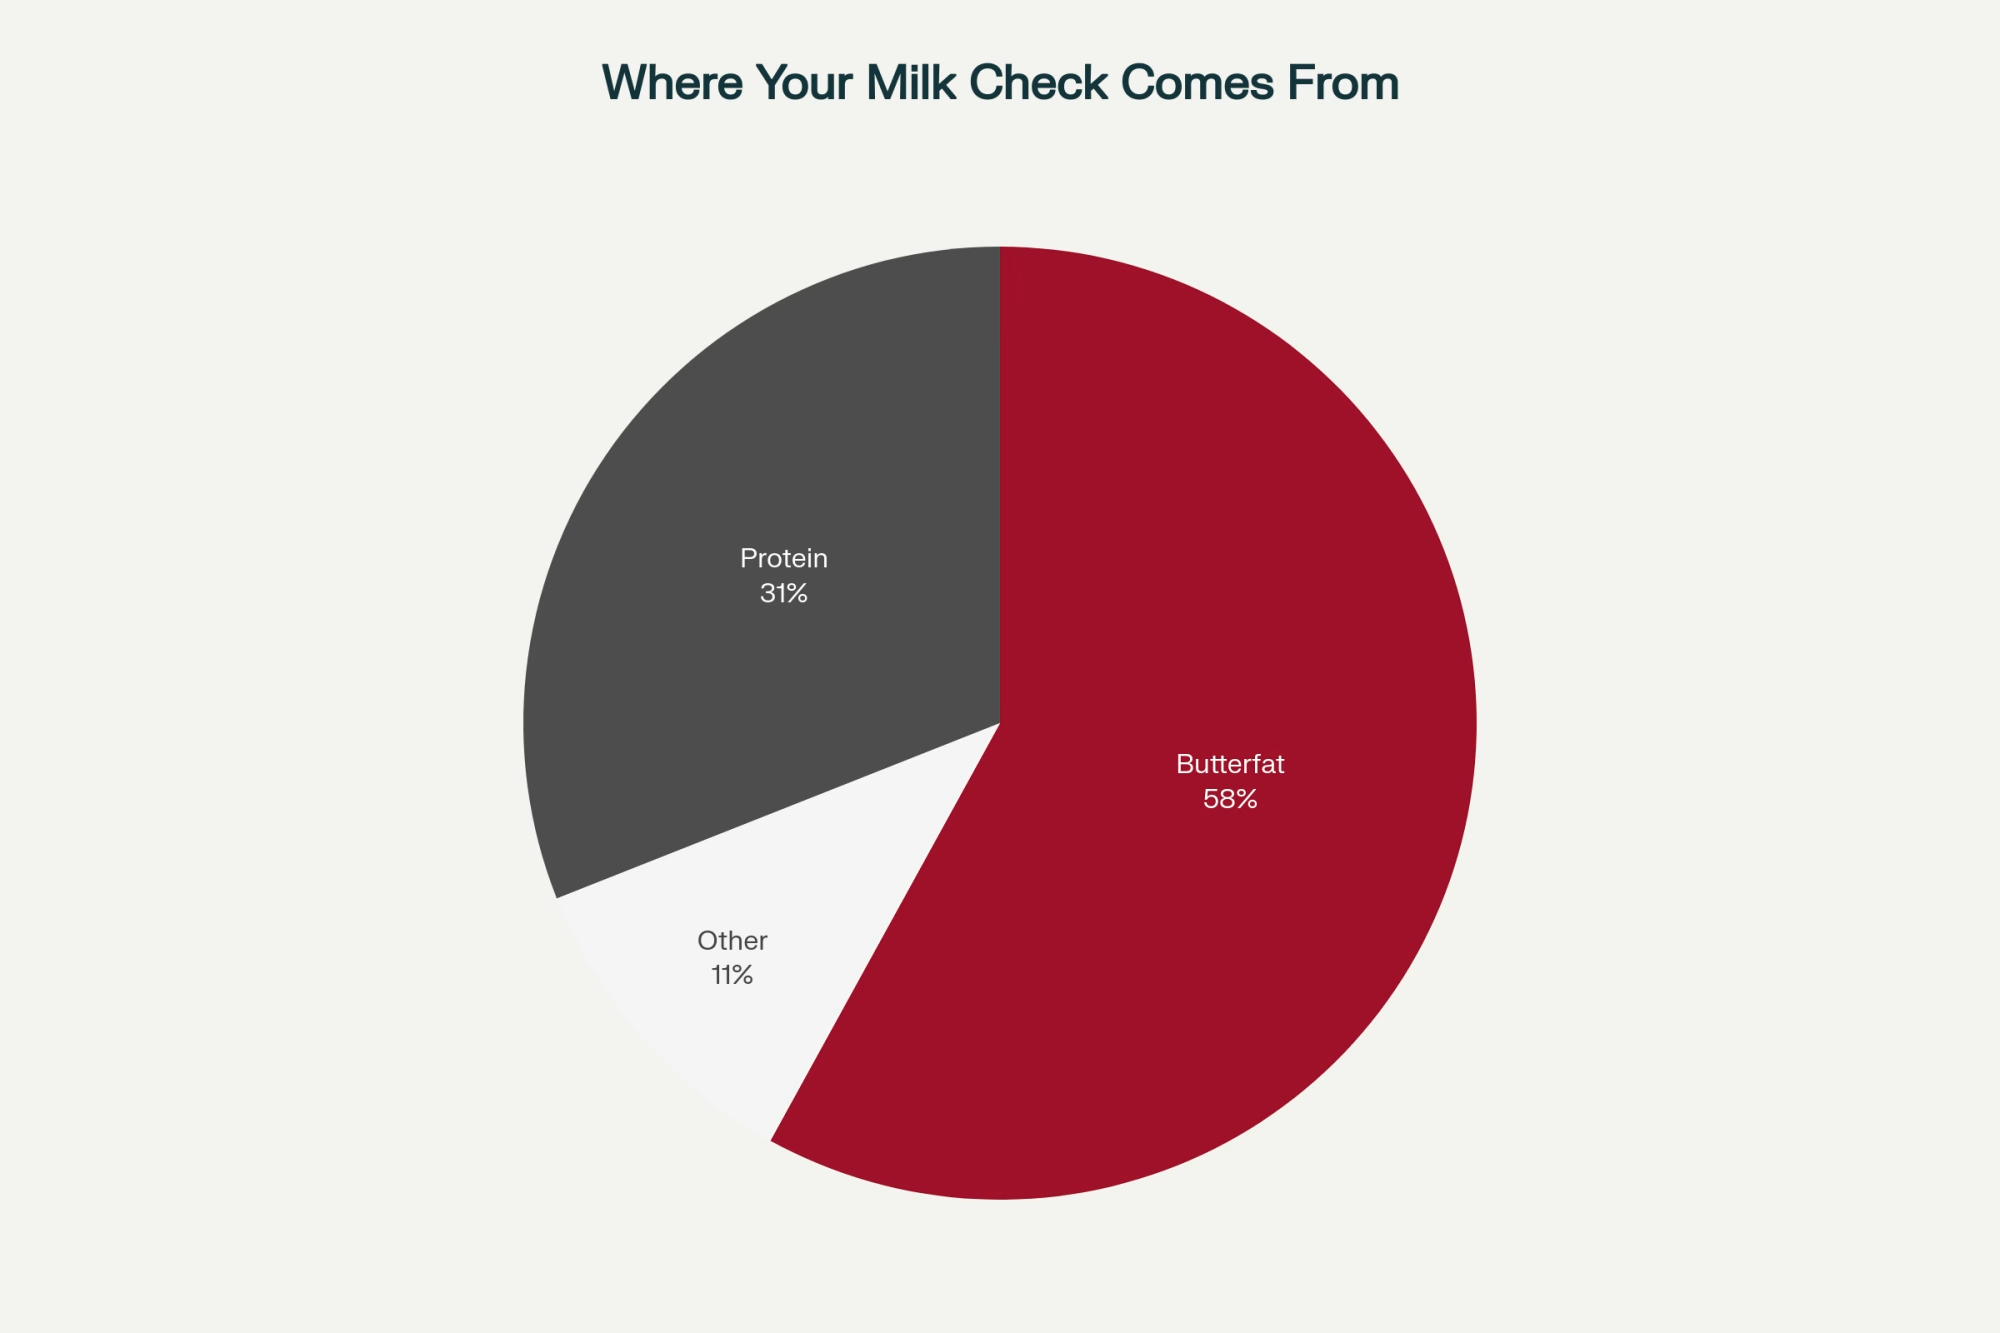
The New Component Reality

A typical 200-cow operation that’s been hitting that old 3.1% protein baseline? Come December 1, they’re suddenly eight cents under water per hundredweight. Just like that—penalty instead of baseline.

On the flip side, farms hitting 3.4% protein capture about 28 cents per hundredweight in premiums under the new formulas.

Let’s do the math here—on 200 cows averaging 75 pounds daily, that’s the difference between losing money and gaining around $8,640 annually. That’s not pocket change, as many of us have learned the hard way.

Karen Phillips, who’s an Associate Professor of Dairy Science at UW-Madison, explained something fascinating at last month’s extension meeting in Marshfield. She said cheesemakers need a protein-to-fat ratio of 0.80 for optimal yield. Know what the U.S. average is right now? We’re sitting at 0.77 according to the DHIA data from January through September.

That three-hundredths difference—it doesn’t sound like much, but it forces plants to add nonfat dry milk powder to standardize their cheese vats. Cuts right into their margins. Makes them real interested in paying premiums for the right milk.
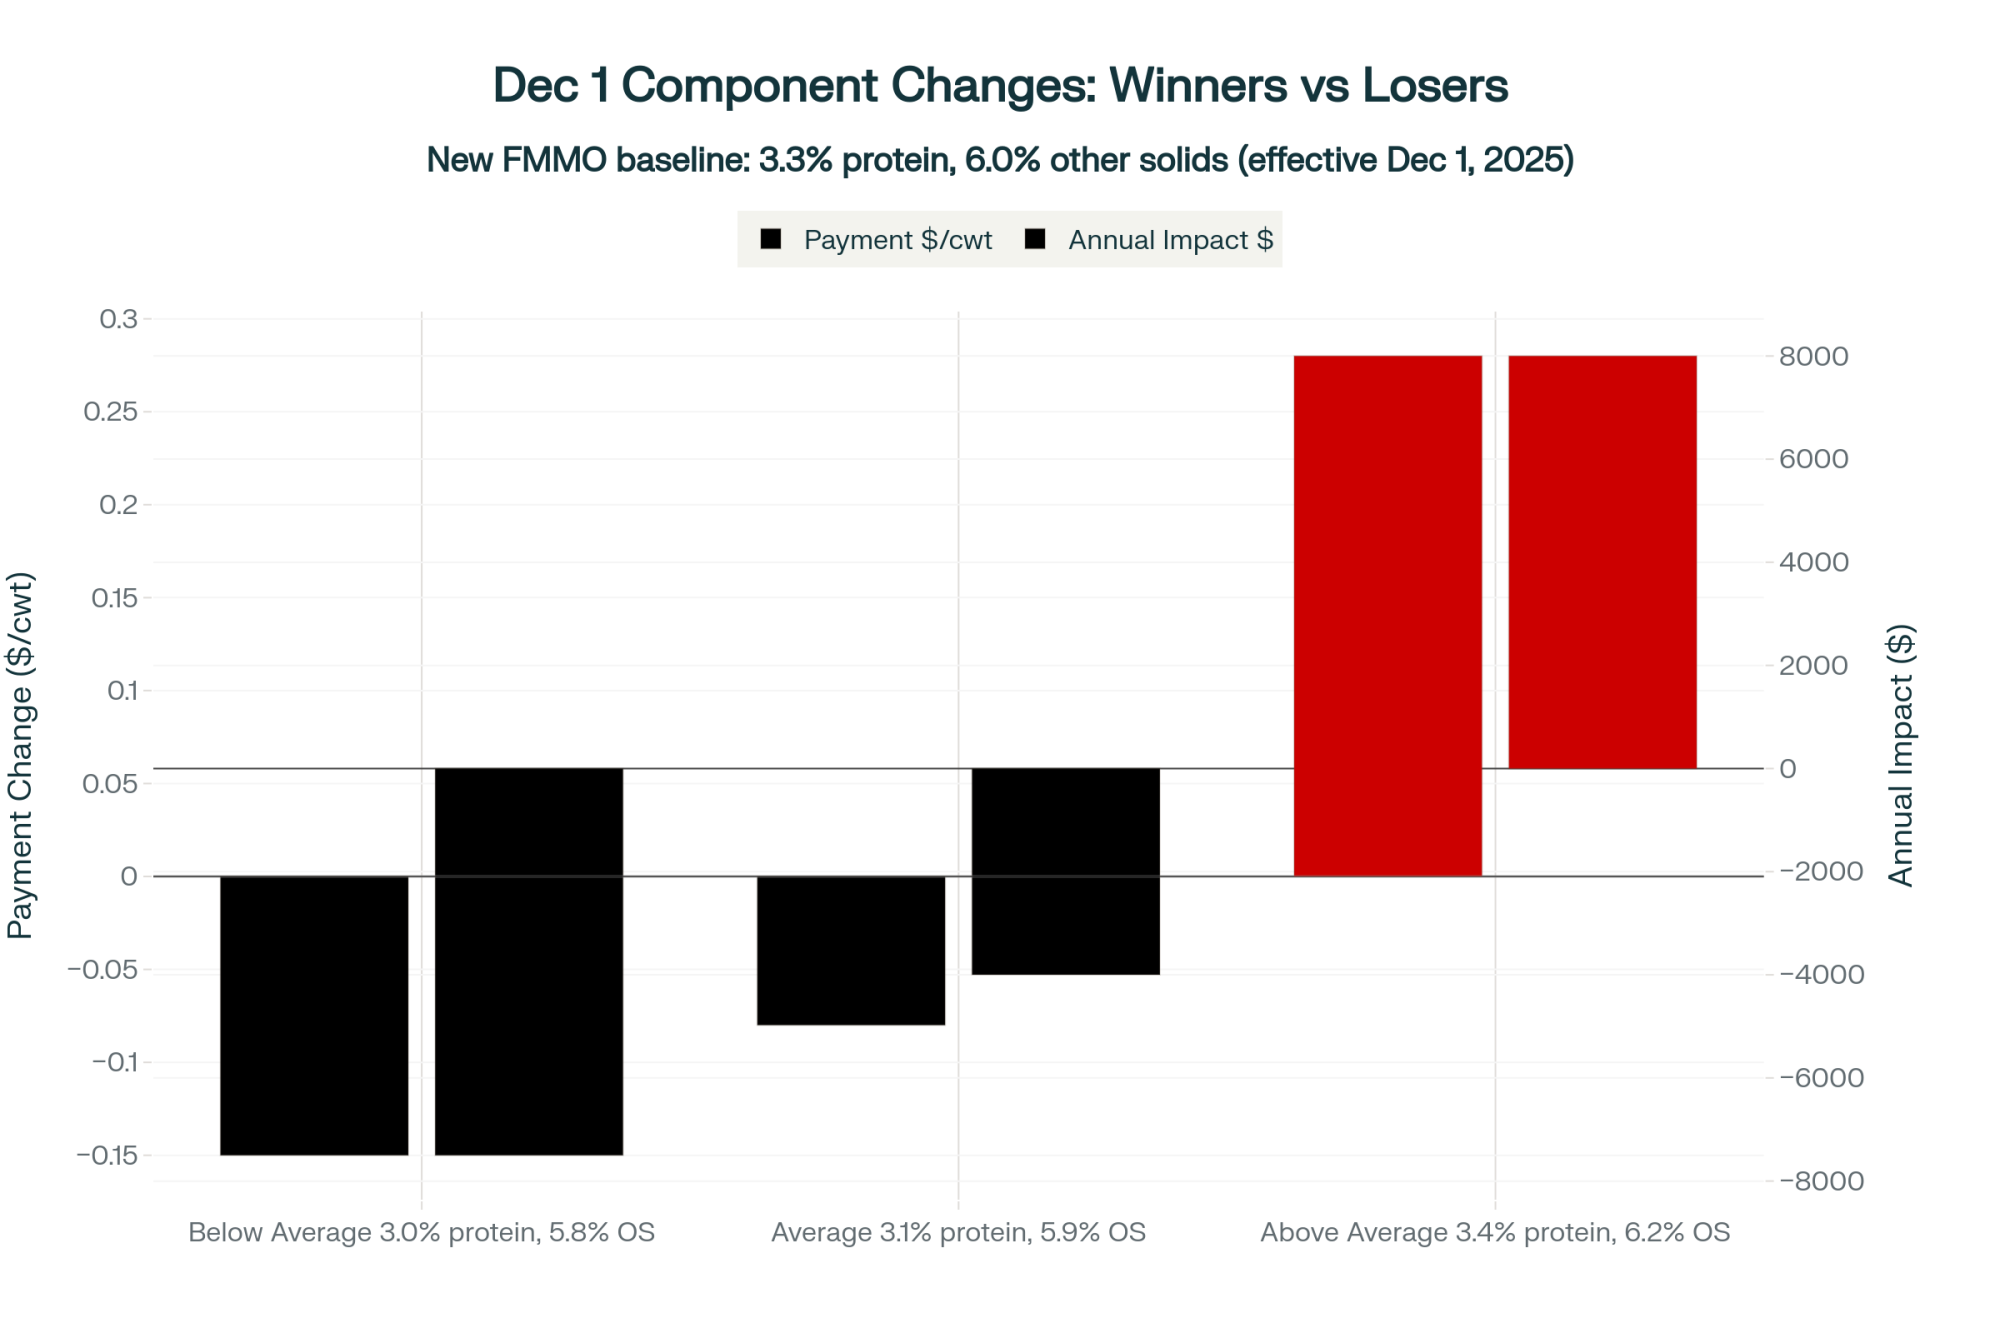
December 1 creates a $15,500 spread between winners and losers: Farms hitting 3.4% protein gain $8,000 annually while those at 3.0% lose $7,500—all based on new FMMO baselines
ScenarioProtein/OSPayment ΔAnnual Impact (200 cows)
Below Average3.0% / 5.8%-$0.15/cwt-$7,500
Average3.1% / 5.9%-$0.08/cwt-$4,000
Above Average3.4% / 6.2%+$0.28/cwt+$8,000

December 1 Component Changes at a Glance:

  • Protein baseline: 3.1% → 3.3%
  • Other solids: 5.9% → 6.0%
  • Below baseline = penalties
  • Above baseline = premiums
  • 200-cow herd hitting 3.4% protein = ~$8,640 annual gain

Part Three: Why “Just Make More Milk” Is a Losing Game

Your first instinct might be to ramp up production, right? Get more cows. Push for higher yields. Try to compete on volume.

Don’t. Just… don’t.

Here’s why that strategy is basically suicide for mid-size operations.

You Can’t Out-Scale the Giants

Those 834 mega-dairies with 2,500-plus cows that USDA’s Economic Research Service tracked in their March 2025 report? They’re producing 46% of America’s milk now. Nearly half of our milk comes from fewer than 1,000 farms.

Think about that for a second.

They’ve got feed costs that run $2-3 per hundredweight lower than yours through direct commodity purchases—they’re buying trainloads, not truck loads. Labor efficiency through automation saves them another $2-2.50 based on university cost studies. Capital costs spread across massive production volumes? That’s another buck-fifty to two-fifty saved.

You can’t win that game. I mean, you literally cannot win it. So stop trying.

The Processing Capacity Trap

Michael Dykes, President and CEO at the International Dairy Foods Association—I had coffee with him at September’s Dairy Forum in Phoenix—he told me something really revealing. He said everyone in the industry was terrified there wouldn’t be enough milk for these new plants.

“I kept telling them,” he said, “farmers will respond to market signals.”

Well, respond they did. Boy, did they respond.

But here’s what nobody wants to say out loud at these industry meetings: The IDFA estimates we’ll have a billion pounds of new annual cheese capacity by the end of 2026. Meanwhile, domestic demand? It’s growing at about 1-2% annually, based on USDA consumption data from their July report.

You see the problem here? More milk into an oversupplied market just drives prices lower. You’re literally racing to the bottom.

Part Four: The Real Solution—Shrink to Grow

This brings me to something that happened last February that really opened my eyes. I was talking to this Wisconsin dairy farmer—let’s call him Tom to protect his privacy—standing in his freestall barn outside Shawano. And he tells me something that seemed absolutely crazy at the time.

He was cutting his herd from 1,200 to 1,050 cows. On purpose.

“You’re going backwards,” his neighbors told him at the co-op meeting.

Eight months later? His net income—not revenue, but actual net income—had jumped dramatically. The University of Wisconsin Extension has been documenting these kinds of strategic culling success stories in its dairy management programs, and the results are prompting many people to rethink everything.

Here’s the two-step strategy that’s actually working:

Step One: Strategic Culling (The Foundation)

Victor Cabrera, Professor in the Department of Dairy Science at UW-Madison, has data showing something really interesting—the average farm has 10-12% of cows that are net negative on profitability.

They’re eating feed. Taking up stall space. Requiring labor. Getting bred. But when you actually run the numbers? They’re not paying their way.

Culling these underperformers does two things immediately:

  1. Reduces your costs right away—less feed, less labor, fewer health issues
  2. Mechanically raises your herd’s average production and components

What Tom did with his 150-cow reduction was eliminate his worst performers. The 1,050 cows he kept? Higher average production. Better components. Lower costs per hundredweight. It’s not magic—it’s just math.

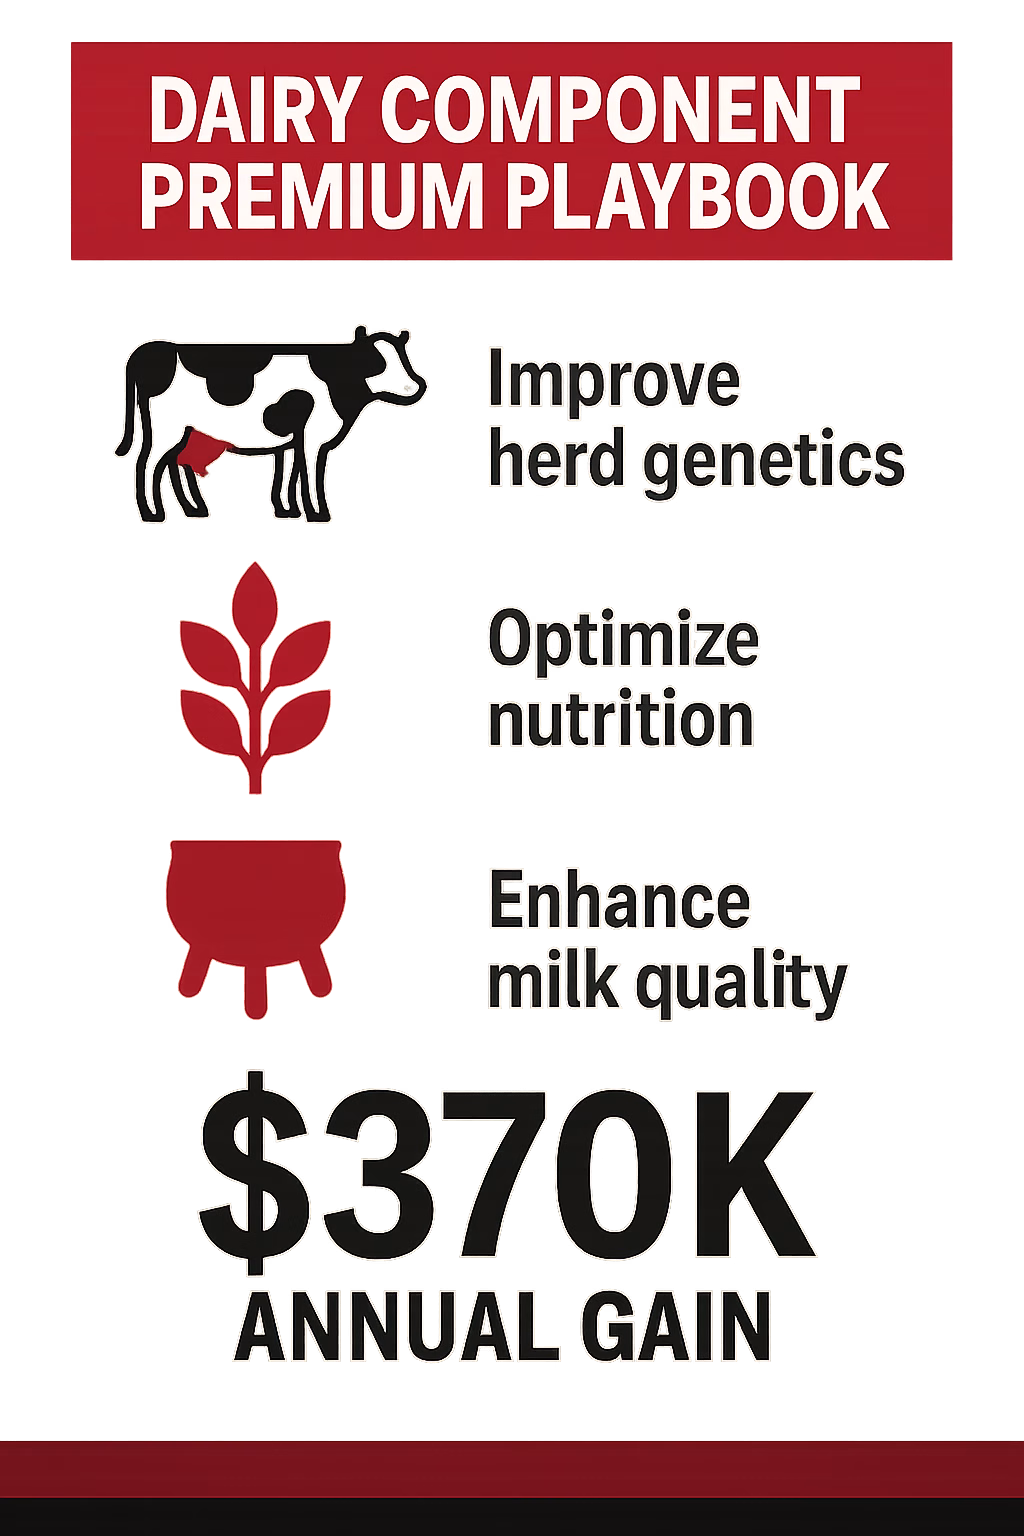
Step Two: Component Optimization (The Multiplier)

Once you’ve got a leaner, higher-potential herd, now you optimize for components through amino acid balancing.

Jim Paulson, Dairy Extension Educator at University of Minnesota Extension in St. Cloud—he’s been working with dairy nutrition for decades—he explains it really well: “Most farms overfeed crude protein while being deficient in the specific amino acids that actually drive milk protein synthesis.”

The fix? Rumen-protected methionine and lysine in the right ratio. The Journal of Dairy Science has published extensive research on this over the past couple of years, and the 3-to-1 lysine-to-methionine ratio keeps coming up as optimal.

Brian Perkins, Senior Dairy Technical Specialist with Vita Plus Corporation out of Madison—he’s worked with 47 different herds on this in 2025—told me: “Target a 0.15 to 0.20 percentage point protein increase. Budget $0.10–$0.15 per cow daily. Based on our field trials, you’ll see results in 8-12 weeks.”

On a now-optimized 200-cow herd, that’s maybe $7,000 annually for the supplements. But if it gets you to 3.3% protein or higher, you’re capturing those December 1 premiums we talked about.

I don’t have all the answers here, and finding qualified nutritionists who really understand amino acid balancing can be challenging in some regions. Your best bet is contacting your state Extension dairy team—they can usually connect you with someone who knows this stuff inside and out.

The Combined Effect

Simple math that works: Invest $7k in amino acids, execute strategic culling, breed 60% to beef—capture $153k in combined gains on a 200-cow operation within 12 months

Component
AmountType
Amino Acid Supplements-$7,000Cost
Component Premiums (3.3%+ protein)+$40,000Revenue
Beef-on-Dairy (60% × 120 calves)+$100,000Revenue
Cost Reduction (15% culling)+$20,000Savings
NET PROFIT+$153,000Total

* 200-Cow Operation

Here’s where it gets really interesting:

  • Culling raises your baseline—removing the bottom 15% might boost your average protein from 3.0% to 3.1% just from that alone
  • Amino acid optimization adds another 0.15-0.20 percentage points on top
  • Now you’re at 3.25-3.30% protein—above the new FMMO baseline
  • Your costs dropped through culling
  • Your revenue increased through premiums

That’s how you shrink to grow. And it’s working for operations across the country—though individual results will obviously vary based on your specific circumstances.

Part Five: Your 90-Day Survival Playbook


Phase
DaysAction FocusKey Metric
11-7Face the Truth<$19 survive / >$21 exit
28-30Execute Cull15% reduction
331-45Fix Components$0.10-$0.15/cow/day
446-60Diversify Revenue$100K+ annual
561-75Lock Premiums$40K-$140K/year
676-90Hard Decision85-95% vs 50-65%

Alright, so you understand the problem and the solution. But what do you actually DO? Like, starting Monday morning?

Here’s your tactical roadmap—and I mean this is what you actually need to do, not theoretical stuff:

Days 1-7: Face the Brutal Truth

Calculate your true all-in production cost. Brad Mitchell, Extension Agricultural Economist at Iowa State University, has this worksheet on their dairy team website that makes it pretty straightforward. Use it.

And here’s the part nobody wants to hear—include your own labor at $20 an hour minimum. That’s the median wage for dairy workers according to the Bureau of Labor Statistics as of October 2025. If you’re working 60-hour weeks—and who isn’t?—that’s $62,400 annually you’re not paying yourself.

Critical benchmarks to know:

  • Under $19/cwt: You might survive with some adjustments
  • $19-21/cwt: Major changes needed NOW
  • Over $21/cwt: You need to consider all options, including… well, including exit

Days 8-30: Execute the Cull

Time to identify your bottom 10-15% performers. Look for:

  • Chronic high SCC—anything over 400,000 consistently
  • Repeated health issues—if she’s been treated 3+ times in 90 days
  • Production under 60 pounds a day in early to mid-lactation
  • Poor components—under 2.9% protein consistently

Remove them. Yeah, I know it’s hard. Your daily tank volume will drop. But your profitability will improve immediately. Trust me on this.

Days 31-45: Fix Your Components

Call your nutritionist this week. Not next month. This week.

Tell them you need amino acid balancing targeting:

  • 0.15-0.20 percentage point protein increase
  • Rumen-protected methionine and lysine
  • That 3:1 lysine to methionine ratio we talked about

Budget $0.10 to $0.15 per cow daily. Based on what we’re seeing in the field, you’ll see results in 8-12 weeks.

For sourcing quality rumen-protected amino acids, companies like Adisseo, Evonik, and Kemin have good products—your nutritionist will have preferences based on what’s worked in your area.

Days 46-60: Diversify Revenue

If you haven’t started breeding for beef-on-dairy yet, you’re leaving serious money on the table.

Superior Livestock Auction’s video sales from October 28—I was watching them—show beef-cross dairy calves bringing around $1,400 for 400-pound steers. Straight dairy bulls? You’re lucky to get $150 at the local sale barn.

Here’s the optimal strategy:

  • Top 40% of your herd: Use sexed dairy semen for replacements
  • Bottom 60%: Beef semen all the way

Matt Akins, Beef Specialist at UW Extension’s Marshfield Agricultural Research Station, has calculated that this generates an extra $100,000-plus annually for a typical 200-cow herd. That’s real money.

The beef-on-dairy revolution: $150 dairy bulls vs $1,400 beef crosses—a $1,250 premium per calf that adds $150,000 annually to a 200-cow operation breeding 60% to beef
MetricTraditionalBeef-on-DairyDifference
Per Calf Price$150$1,400+$1,250
Annual Revenue (120 calves)$18,000$168,000+$150,000
Feed EfficiencyBaseline8-25% betterAdvantage
Finishing TimeBaseline20% faster5-26 fewer days
Carcass GradingLower15-25% Prime/ChoicePremium

200-Cow Herd (60% bred to beef)

Now, fair warning—Les Hansen, Professor Emeritus at the University of Minnesota’s Department of Animal Science, keeps reminding everyone that beef prices won’t stay this high forever. USDA’s January 2025 cattle inventory showed we’re at a 73-year lows. When rebuilding starts—probably late 2026—these premiums will shrink. So use this 18-24 month window wisely.

Days 61-75: Lock in Component Premiums

If you can hit 3.3% protein with a 0.80 protein-to-fat ratio, those new cheese plants want your milk. They really want it.

I know of several Wisconsin operations working with processors like Grande and Foremost Farms that just locked in multi-year contracts at anywhere from 40 cents to $1.40 per hundredweight above Federal Order minimums. The exact premium depends on volume commitments, location, quality history—you know, all the usual factors.

On 200 cows, even at the low end, that’s $40,000 annually. At the high end? We’re talking $140,000.

But here’s the thing—these deals are happening NOW. By January, that window probably closes.

Days 76-90: Make the Hard Decision

Look, if you’ve done all this analysis and you still can’t hit profitable benchmarks, it’s time for the conversation nobody wants to have.

Tom Peters, Senior Farm Transition Specialist at Farm Credit Services of America—he’s tracked 127 dairy transitions across the Midwest since 2020. A planned exit over 18-24 months typically preserves 85-95% of asset value. A forced liquidation in crisis? You’re lucky to get 50-65%.

On a typical $4 million operation, that’s the difference between walking away with $3.4 million or $2 million. One sets you up for retirement. The other… doesn’t.

I know this is tough to hear. But ignoring reality doesn’t change it.

Success Stories That Prove It Works

This isn’t just theory, folks. Real farms are making this strategy work right now.

I visited an operation down in Georgia that’s similar to what folks like Sarah Martinez are doing—280 cows on pasture, focused intensively on components. She’s hitting 3.45% protein consistently and has locked in premium contracts with a regional cheese maker. Her costs run about $18.50 per hundredweight—actually profitable at current prices.

“We’re not trying to compete with the big boys on volume,” she told me. “We’re competing on quality and consistency.”

Up in Vermont, I know of operations similar to the Johnson family’s that pivoted to organic about five years ago. Yeah, the transition was brutal—they lost money for three years straight. But now? They’re capturing $35 per hundredweight through Organic Valley with production costs around $28. That’s a healthy margin in anybody’s book.

And there are plenty of mid-size operations maintaining profitability through other unique strategies—direct marketing, agritourism, value-added processing. The point is, there’s more than one path forward.

Tom in Wisconsin? His remaining 1,050 cows are now averaging strong protein levels after working on amino acid balancing. He’s breeding 65% to beef. His costs dropped to about $17.80 per hundredweight after culling those 150 underperformers. At current prices, he’s actually making money. Not a fortune, but enough.

The Digital Edge You Need

What’s encouraging is the technology available now that we didn’t have even five years ago:

Penn State’s DairyMetrics offers a free component optimization app that lets you model amino acid changes before implementing them. Wisconsin’s Dairy Management website, through UW-Madison Extension, offers calculators for everything from culling decisions to heifer inventory optimization.

Several folks I know are using FeedWatch or TMR Tracker software to dial in their rations precisely. When you’re spending $7,000 on amino acids, you want to make sure they’re actually getting into the cows, you know?

And of course, USDA’s Agricultural Marketing Service and the CME Group sites let you track real-time market prices from your phone.

The Bottom Line: Choose Your Path

Look, I’ve been covering this industry for thirty years. This isn’t just another cycle. The combination of mega-dairy economics, geographic shifts, component revaluation, and processing overcapacity—it’s creating a fundamental restructuring of how this industry works.

The whey processors figured this out already. They cut commodity production by about 30%, shifted to high-value products, and created scarcity. CME spot dry whey hit 71 cents per pound last week—a nine-month high—while cheese races toward oversupply.

As Tom told me: “I realized I was trying to compete on volume with operations ten times my size. Can’t win that game. So I changed the game—focused on profit per cow, not gallons in the tank.”

He gets it. The question is, do you?

The decisions you make in the next 90 days will determine which side of 2027 you land on. For some, that means strategic culling and component optimization. For others, it means transitioning to organic or direct marketing. And yes, for some, it means a well-planned exit that preserves wealth.

What’s not an option? Not choosing. Because not choosing is still choosing—it’s just choosing to let the market decide for you.

The clock’s ticking, folks. December 1 is 31 days away.

Time to decide: Will you shift with the market, or get shifted by it?

Key Takeaways:

  • The Volume Game Is Over: With mega-dairies producing at $13/cwt versus your $23/cwt, competing on size is mathematical suicide—the $10 spread is unbridgeable
  • December 1 Deadline Creates Winners and Losers: Hit 3.3% protein to capture $40,000+ in premiums, or face $8,640 in penalties—you have 31 days to pick your side
  • Strategic Culling Pays Immediately: Your bottom 15% of cows are profit vampires—cutting them saves $20,000+ annually while raising your herd average instantly
  • Simple Math, Big Returns: Invest $7,000 in amino acids → boost protein 0.2 points → earn $40,000+ premiums PLUS add beef-on-dairy for another $100,000 = $133,000 net gain
  • Three Honest Options: Transform through the 90-day playbook (works if costs <$21/cwt), pivot to specialty markets (organic/direct), or exit strategically while assets retain 85-95% value—but decide NOW

Resources: Visit your state Extension dairy website for worksheets and calculators. Component optimization apps are available through Penn State DairyMetrics and Wisconsin Dairy Management. For amino acid suppliers, contact your nutritionist. Track markets via the USDA Agricultural Marketing Service and CME Group.

Complete references and supporting documentation are available upon request by contacting the editorial team at editor@thebullvine.com.

Learn More:

  • Navigating Today’s Dairy Margin Squeeze: Insights from the Field – This article reveals practical feed management strategies (5-15% cost cuts) and modern culling benchmarks, offering immediate, actionable tactics to improve efficiency and component production, directly complementing the main article’s 90-day playbook for cost control and herd optimization.
  • USDA’s 2025 Dairy Outlook: Market Shifts and Strategic Opportunities for Producers – Explore how USDA forecasts impact milk production and prices, and discover strategic opportunities in component optimization, processor alignment, and export markets. This provides essential broader market context and long-term planning insights to safeguard your operation’s future profitability.
  • When Butterfat Isn’t Enough: Adapting Your Dairy to New Market Realities – Delve into the role of technology and innovation in component optimization, with insights on RFID systems, automated feeding, and calculating their return on investment across various herd sizes. This article demonstrates how to leverage modern tools to achieve the profitability goals outlined in the main piece.

Join the Revolution!

Join over 30,000 successful dairy professionals who rely on Bullvine Weekly for their competitive edge. Delivered directly to your inbox each week, our exclusive industry insights help you make smarter decisions while saving precious hours every week. Never miss critical updates on milk production trends, breakthrough technologies, and profit-boosting strategies that top producers are already implementing. Subscribe now to transform your dairy operation’s efficiency and profitability—your future success is just one click away.

NewsSubscribe
First
Last
Consent

The 920% Growth Gap: What Danone’s Asia Success Reveals About North American Dairy’s Future

31,000 farms today. 19,000 by 2035. The 920% Asia growth gap reveals exactly who survives—and how.

Executive Summary: When Danone reported 13.8% growth in Asia versus 1.5% in North America—a 920% difference—it exposed what every dairy farmer already feels: the game has fundamentally changed, and your response determines whether you’re still milking in 2035. Three paths are proving profitable today. Wisconsin farmers optimizing protein for export processors are capturing an extra $140,000-225,000 annually, while small Vermont organic operations are netting $489 per cow—six times conventional returns. Large-scale operations over 1,000 cows achieve $250,000-375,000 higher profits through efficiency, but here’s what any farm can implement tomorrow: beef-on-dairy crossbreeding delivers $122,500-183,750 extra revenue on 500 cows for just $23,500 investment. Geography now matters as much as management, with farms over 100 miles from processors facing $10,000+ annual disadvantages. December 1st’s Federal Order reforms will lock in advantages for those who’ve already optimized components, making the next 30 days critical. Of today’s 31,000 dairy farms, only 19,000 will survive to 2035—and the market is already choosing winners based on who adapts fastest to these new realities.

You know that feeling when you’re looking at your milk check and wondering if you’re missing something? I had that exact conversation with a Wisconsin dairy farmer last month—let’s call him Tom. He’s got his October statement in one hand, tablet in the other showing Danone’s latest earnings report. “Makes you wonder,” he said, pushing back from his kitchen table, “if we’re even in the same business anymore.”

Here’s what caught both our attention: Danone’s reporting 13.8% growth in their Asia-Pacific specialized nutrition business while North America’s crawling along at 1.5%. That’s a 920% difference, folks. Not a typo—920%.

And you know what? That conversation’s been rattling around in my head ever since, because it’s not really about Danone at all. It’s about what’s happening to all of us.

The stark reality: Danone’s 13.8% Asia-Pacific growth dwarfs North America’s 1.5%—a 920% differential that reveals exactly where dairy value is accumulating globally and which farmers are positioned to capture it.”

What’s Really Behind Those Numbers

So here’s what’s interesting—everyone immediately jumps to China’s infant formula market when they see these growth figures. Sure, China represents about two-thirds of the global infant formula market according to industry tracking, somewhere north of $90 billion. Can’t ignore that.

But there’s more going on here, and this is what I’ve been digging into…

The USDA’s Foreign Agricultural Service has been tracking something remarkable: 670 million people have joined Asia’s middle class since 2000. We’re talking about twice the entire U.S. population moving into dairy-consuming income brackets. And get this—another 80 million are expected by 2030.

Now, what really puts this in perspective is per capita consumption. In China, they’re consuming about 42 kilograms of dairy annually. Meanwhile, we’re sitting at 653 pounds per person here in the States according to USDA’s Economic Research Service data from 2024.

That’s… well, that’s about seven times more. Think about that for a second. Seven times more room to grow.

Meanwhile—and this is where it gets uncomfortable for those of us in North America—Dairy Management Inc.’s been tracking fluid milk consumption, and it’s declined for 70 consecutive years. Not quarters, not even decades. Seven decades straight.

The International Dairy Foods Association published some research in September showing Gen Z drinks about 20% less milk than millennials did at their age.

So we’ve got this massive growth potential over there, and over here? We’re basically rearranging deck chairs, fighting over market share in a pie that’s not getting any bigger.

I’ve been talking with economists and processor reps about this disconnect, and what keeps coming up is how differently they’re positioning themselves depending on whether they’re chasing Asian markets or focusing on domestic sales. And that positioning—here’s the kicker—directly affects what kind of milk they need from us.

Three Approaches That Are Actually Working

What I’ve found visiting farms from Vermont to California over the past few months is that there are basically three models that seem to be working. Not perfectly, mind you, and not for everyone, but they’re working.

The brutal math of survival: From 31,000 farms today to 19,000 by 2035, with conventional operations collapsing (red) while strategic ingredient suppliers (black), premium producers (dark grey), and large-scale operators (light grey) capture the future. Which category are you in?

The Strategic Ingredient Approach

I visited a 680-cow operation in Wisconsin recently where the owner showed me something that made my eyes pop. He’s pulling $3.40 per hundredweight above Federal Order minimums. Not from organic. Not from grass-fed. From protein optimization.

“Started working with the university folks on amino acid balancing,” he explained, spreading out his ration sheets on the office desk. “We’re adding about $75 per cow annually in rumen-protected lysine and methionine. But here’s the thing—we went from 3.12% to 3.38% protein in about eight weeks.”

Now, the University of Wisconsin Extension’s research backs this up. They’re showing farms implementing these protocols typically see returns of 2.5 to 1, sometimes up to 5.5 to 1, within 90 days. Income over feed cost improvements of forty to fifty cents per cow daily. That’s real money, not theoretical projections.

What’s driving this demand? Well, the U.S. Dairy Export Council’s been tracking how processors are investing in ultrafiltration systems to extract whey protein isolate. When that product’s selling for $5 to $8 per pound to medical nutrition companies in Singapore or Seoul, that extra 0.3% protein per tanker? Makes a huge difference to their bottom line.

Here’s what this looks like on the ground:

  • Getting your protein to 3.4-3.6%, butterfat to 4.0-4.2%—mostly through nutrition tweaks, not waiting for genetic progress
  • Keeping somatic cells under 100,000—Michigan Milk Producers Association’s paying forty to sixty cents per hundredweight bonuses for this
  • Finding processors who are actually investing in fractionation technology
  • Capturing $2 to $4 per hundredweight above base pricing

Premium Markets That Actually Pencil Out

I’ll be honest with you—I used to roll my eyes at some of these premium market stories. Seemed like a lot of work for uncertain returns.

Then I spent time with an 85-cow operation in Vermont that netted $489 per cow last year according to the Northeast Organic Farming Association’s financial benchmarks.

That’s… let me repeat that… nearly six times what similar-sized conventional operations are achieving.

What really opened my eyes was data from the University of Minnesota’s farm management folks showing Upper Midwest organic operations averaging $131,839 in total net farm income. This isn’t just a Vermont thing anymore. Wisconsin alone sold $125.7 million in organic milk in 2023—that’s third nationally, only behind California and New York.

“Can’t change the global market, but I can sure change how I respond to it.” —Wisconsin dairy farmer

And then there’s this A2 angle that’s fascinating. Visited a small operation in Pennsylvania—maybe 40 cows total—selling A2 milk at their farm store for $8.50 per gallon. “Testing cost us about $40 per cow through one of the genetics companies,” the farmer told me. “One-time expense. Now we’re capturing premiums that make the whole operation work.”

The market research on A2 is pretty compelling—we’re looking at a market that hit $15.4 billion last year and is projected to reach $50.9 billion by 2033. That’s over 14% compound annual growth. Not a fad when you see numbers like that.

Current premium pricing based on what I’m seeing in the market:

  • Organic’s running $31 to $39 per hundredweight versus $18 to $24 conventional
  • Grass-fed with intensive grazing: $36 to $52
  • A2 milk’s capturing 50% to 100% retail premiums
  • Direct-to-consumer: $6 to $10 per gallon versus $2 to $3 commodity

Scaling Up—If You’ve Got What It Takes

Now let’s talk about the other end of the spectrum. Visited a 2,100-cow operation in California that’s expanding to 2,800. Their production costs? $14.80 per hundredweight.

Cornell’s dairy farm business folks show 500-cow operations typically running $16.30 to $17.80. That’s… that’s a massive difference when you multiply it out over millions of pounds.

“Look, this isn’t for everyone,” the owner told me straight up, standing next to his new rotary parlor. “We’re $4.2 million into this expansion. Both my kids have advanced degrees—one’s got an MBA, the other’s a vet. Without that next generation ready and committed? I wouldn’t even consider it.”

USDA’s Economic Research Service data from September backs up what he’s experiencing—operations over 1,000 cows are capturing roughly $250,000 to $375,000 more in annual profit than 500-cow dairies. It’s mostly about labor efficiency and input cost advantages.

But man, that capital requirement…

Your Strategic Options: Side-by-Side Comparison

Business ModelInvestment RequiredTypical Annual Returns*Timeline to ProfitBest Suited For
Strategic Ingredient Supply$20,000-30,000$140,000-225,0003-6 monthsOperations near processors, 300-1,000 cows
Premium Differentiation$10,000-50,000**$130,000-245,0001-3 yearsFarms near urban markets, any size
Strategic Scale$2-5 million$250,000-500,0003-5 yearsOperations with capital access, next generation

*Returns based on actual farm performance data from University of Wisconsin Extension (ingredient supply), Northeast Organic Farming Association and University of Minnesota benchmarks (premium markets), and USDA Economic Research Service analysis (scale operations). Individual results vary based on management, location, and market conditions.

**With USDA organic transition assistance covering 50-75% of costs

The Beef-on-Dairy Opportunity (Seriously, Do This Yesterday)

If there’s one thing—just one thing—that every dairy farmer should’ve started yesterday, it’s beef-on-dairy. And I mean that literally. The economics are almost too good to believe, but the numbers absolutely check out.

UC Davis has been tracking this, and crossbred calf production’s jumped from about 50,000 head in 2014 to 3.2 million in 2024. Current market data shows these crossbred calves averaging around $1,300. Holstein bulls? You’re lucky to get $250 to $600 on a good day.

Talked with a Pennsylvania producer in October who’s all over this. “We genomic test every heifer calf—costs about $40 per head. Bottom third of our genetics gets bred to beef. Using Angus and SimAngus semen at maybe $22 per straw versus $8 for conventional Holstein. But those beef-cross calves? They’re selling for $1,400 at three days old. Three days!”

Stop leaving $131,250 on the table: Beef-cross calves at $1,300 versus Holstein bulls at $425 means a 500-cow operation captures an extra $131,250 annually for just $23,500 investment—this isn’t optional anymore.

CattleFax’s October analysis projects beef-on-dairy could represent one-sixth of the entire fed beef market within two years. Why? Because the U.S. beef cattle herd hit 73-year lows—we’re at 28.2 million head as of January 2024. That shortage isn’t fixing itself anytime soon.

Here’s your action plan—and I mean implement this now:

  • Test your herd if you haven’t already ($40 per cow, one-time expense)
  • Breed the bottom 30-35% to beef (but keep that 25-30% replacement rate)
  • Budget for $600 premiums long-term, not today’s $1,000-plus
  • On 500 cows? You’re looking at $122,500 to $183,750 in additional revenue first year
December 1st splits the industry permanently: Federal Order reforms lock in advantages for farms optimizing components now, with premiums jumping from $0 to $3.80 per CWT—this 30-day window determines who captures profit and who faces deductions.

Critical: Federal Order Changes Coming Fast

Effective December 1, 2025:

  • Protein factors jump from 3.1% to 3.3% per hundredweight
  • Other solids increase from 5.9% to 6.0%
  • If you’re below these levels, you’re facing deductions, not just missing premiums

Source: USDA Agricultural Marketing Service Final Decision

Geography Is Becoming Destiny (Unfortunately)

Your address determines your survival: From $3,600 near processors to $21,900 in remote areas, geography creates an automatic $18,300 annual disadvantage before management even matters—location is no longer just real estate

This is tough to talk about, but we need to face it—your location might matter more than your management now.

Recent research on milk hauling charges across the Upper Midwest is pretty eye-opening. Some Wisconsin counties near Madison? They’re paying less than twelve cents per hundredweight for hauling.

But if you’re in northern Minnesota or parts of North Dakota? You’re looking at fifty to seventy-three cents.

For a 500-cow operation, that’s nearly ten grand in annual disadvantage before you even start talking about market access. Distance to processing infrastructure correlates directly with profitability now. It’s not fair, but it’s real.

That said—and this is encouraging—Midwest operations are finding creative workarounds.

Visited a 240-cow grazing operation near Viroqua, Wisconsin, where they’ve really figured something out. “Our feed costs run about $4.20 per cow daily versus $6.80 for the confinement operation down the road,” the farmer explained while we watched his cows heading out to pasture. “Yeah, we produce less milk—46 pounds versus their 85—but our profit per cow? Actually higher.”

Recent grazing systems research from Missouri backs this up—their pasture-based operations are achieving $14.08 per hundredweight production costs versus $14.52 for conventional confinement. Not a huge difference, but when every penny counts…

What Your Region Means for Your Strategy

If you’re in the Northeast: You’ve got proximity to those premium markets, but land competition is absolutely brutal. Recent data shows Vermont farmland averaging around $4,100 per acre versus about $2,800 in Wisconsin. Your path probably runs through differentiation—organic, grass-fed, or direct marketing. You’ve got the population density to support it. For specific guidance, check with your state extension service—Cornell for New York, UVM for Vermont, Penn State for Pennsylvania.

Midwest folks: Feed cost advantages and land availability are your strengths. But if you’re over 100 miles from a major processor? The math gets tough. I’d be focusing hard on cutting production costs through grazing or looking at partnership models with neighbors. University of Wisconsin-Madison Extension and University of Minnesota have excellent resources on managed grazing economics.

Western operations: Scale is your game, no question. But water rights and environmental regulations keep tightening. California’s new sustainability requirements are adding compliance costs that really bite into margins. You’ve got to factor that in. UC Davis and Oregon State have been doing great work on water efficiency in dairy systems.

The Cooperative Question: Choose Your Risk Profile

When Danone terminated contracts with 89 Northeast organic farms back in August 2022, it sent shockwaves through the whole industry. According to the Northeast Organic Dairy Producers Alliance, fifteen of those farms went out of business entirely.

Organic Valley ended up absorbing 65 of them.

One affected farmer told me—and this still gets me—”We thought we had security with a big buyer. Turns out we were just suppliers they could optimize away when it suited them.”

Here’s the reality: you’re choosing between two different risk profiles. With a corporate buyer like Danone, you might get higher prices short-term, but you’re vulnerable to sudden termination when their strategy shifts. With a cooperative like Organic Valley, you get more stability through member ownership, but you’re subject to supply management decisions and triggering controls.

What’s interesting about Organic Valley’s response is their triggering system. They commit to purchasing milk one to three years before farms even finish their organic transition. Yes, they control who gets triggered based on their supply needs. But once they trigger you, they honor that commitment even when they’re in oversupply. During the 2016 organic oversupply crisis, they kept taking milk from triggered farms even while stopping new enrollments.

The Government Accountability Office did a report back in 2019 on dairy cooperatives—Senator Gillibrand requested it after getting complaints from constituents. They found that these consolidated cooperatives face what they called “competing interests that can create power imbalances” between large and small members.

Organic Valley’s at over 1,600 members now, adding about 84 farms annually. That’s 5.3% growth while overall farm numbers are declining.

The bottom line? Both models have trade-offs. Corporate buyers offer market pricing but zero governance control. Cooperatives provide member ownership but require you to work within their supply management framework. Neither is perfect, but understanding the trade-offs helps you make an informed choice based on your risk tolerance and long-term goals.

For farms considering organic transition, the smart move is securing your buyer commitment—whether cooperative or corporate—before investing in the three-year transition. That $180,000 mistake that Iowa farmer made? Completely avoidable with upfront buyer agreements.

Export Markets: Opportunity and Risk All Mixed Together

Let’s address the elephant in the room—China achieved 85% dairy self-sufficiency in 2023, a full year ahead of their own schedule.

According to Rabobank’s latest quarterly, their whole milk powder imports crashed 36% to just 430,000 metric tons. That’s the lowest since 2010.

Then came April’s tariff mess. By April 10, we hit 125% tariffs going both directions. U.S. dairy exports to China—which were $584 million in 2024—basically vanished overnight.

But here’s what’s interesting—Southeast Asia is a completely different story.

The six ASEAN countries represent 566 million people with a projected 19 billion liter dairy deficit by 2030. That’s actually bigger than China’s 15 billion liter gap, according to the International Dairy Federation’s latest global report.

Industry analysts I’ve talked with increasingly point out that farmers supplying processors focused on Southeast Asian markets have more stable growth prospects than those dependent on China. It’s that old wisdom about not putting all your eggs in one basket, but with real numbers behind it now.

Learning from What Doesn’t Work

Not every strategy succeeds, and we need to talk about that too.

One Iowa operation tried transitioning to organic back in 2019 without securing a buyer first. “We spent three years paying organic feed prices while getting conventional milk prices,” the farmer admitted when we talked. “Lost $180,000 before we pulled the plug.”

Another farm near Fond du Lac expanded from 400 to 800 cows in 2021. “We completely underestimated the management complexity,” they told me. “Thought we’d just double everything. Doesn’t work that way. We’re selling the expansion facilities and going back to 500.”

These aren’t failures of farming—they’re strategy lessons worth learning from before you make the same mistakes.

What Actually Needs to Happen Now

Looking at all this—the growth gaps, what’s working, what isn’t—certain decisions just can’t wait anymore.

If you’re under 500 cows:

Start beef-on-dairy immediately. I can’t stress this enough. The investment’s minimal—about $23,500 for a 500-cow operation. Returns come fast—$122,500 to $183,750 in the first year. And it doesn’t require changing your whole operation.

Also, be honest about your geography. More than 100 miles from processing? Over 200 from a metro area? Your options narrow considerably, and you need to face that reality.

If you’re 500 to 1,000 cows:

You’re in what I call the squeeze zone. Either commit to scaling up—if you’ve got the capital and management depth—or pivot hard to differentiation. Standing still is just slow bleeding at this size.

For everyone:

By November 30, you need to ask your milk buyer these questions:

  • What percentage of our milk goes into export products?
  • Which Asian markets are you actually targeting?
  • What component premiums will you pay after December 1?
  • Are you investing in protein fractionation capacity?

If those answers disappoint you, start exploring options. Now. Not next year.

The View from Here

Danone’s 13.8% Asian growth versus 1.5% in North America tells us exactly where dairy value is accumulating globally. That’s not changing anytime soon.

What can change is how we position ourselves in that reality.

The industry that emerges from all this transformation will have fewer farms—that’s just math. But those remaining will be more specialized, more efficient, or more strategically positioned. That’s not a judgment on anyone. It’s just the economic reality we’re all trying to navigate.

Remember that Wisconsin farmer I mentioned at the start? Tom? He’s implementing beef-on-dairy now, hired a nutritionist for component optimization, and he’s talking to Organic Valley about membership. “Can’t change the global market,” he told me last week. “But I can sure change how I respond to it.”

And that’s really it, isn’t it? The market’s sending us signals—loud ones. The question isn’t whether to adapt anymore. It’s how fast and how smart we can position ourselves for what’s already here.

For the 31,000 dairy farmers operating in North America today, these aren’t abstract discussions over coffee. They’re decisions that compound into survival or exit. Understanding what’s happening—really understanding it—that’s what separates the operations that’ll be milking in 2035 from those that won’t.

Sometimes the kindest thing we can do is be honest about hard truths. Even when they’re uncomfortable.

Especially then, actually.

Whether you’re in Vermont, Wisconsin, or Washington State, the fundamentals remain the same: position yourself strategically, move decisively, and don’t wait for the market to make decisions for you. Because it will.

Don’t wait: Federal Order reforms take effect December 1, 2025. If you haven’t evaluated your component levels and processor relationships yet, you’re already behind. The competitive advantages are about to lock in for those who moved early. Don’t get caught watching from the sidelines while others capture the premiums you could’ve had.

Resources for Next Steps

Northeast: Cornell PRO-DAIRY (prodairy.cals.cornell.edu), UVM Extension (uvm.edu/extension/agriculture), Penn State Extension Dairy Team (extension.psu.edu/animals/dairy)

Midwest: University of Wisconsin Dairy Extension (fyi.extension.wisc.edu/dairy), University of Minnesota Extension Dairy (extension.umn.edu/dairy), Michigan State Extension (canr.msu.edu/dairy)

West: UC Davis CLEAR Center (clear.ucdavis.edu), Washington State Dairy Extension (dairy.wsu.edu), Oregon State Dairy Extension (smallfarms.oregonstate.edu/dairy)

KEY TAKEAWAYS:

  • Beef-on-dairy pays for your next pickup truck: Bottom third of your herd + beef semen = $122,500-183,750 extra revenue this year (500-cow operation, $23,500 investment)
  • The 920% gap reveals three winners: Premium markets (organic/A2 earning 6x conventional), protein optimization ($140-225K extra annually), or 1,000+ cow scale—everything else is managing decline
  • Your address matters more than your management: Same exact operation, wrong zip code = $10,000+ annual penalty if you’re 100 miles from processing
  • December 1 splits the industry in two: Farms hitting 3.3% protein and 6.0% other solids capture premiums; everyone else faces deductions—this deadline won’t come again
  • 19,000 survivors from 31,000 farms: Asia’s exploding demand rewards farmers who adapt to export markets, while domestic-focused operations fight over crumbs—choose your side now

Complete references and supporting documentation are available upon request by contacting the editorial team at editor@thebullvine.com.

Learn More:

Join the Revolution!

Join over 30,000 successful dairy professionals who rely on Bullvine Weekly for their competitive edge. Delivered directly to your inbox each week, our exclusive industry insights help you make smarter decisions while saving precious hours every week. Never miss critical updates on milk production trends, breakthrough technologies, and profit-boosting strategies that top producers are already implementing. Subscribe now to transform your dairy operation’s efficiency and profitability—your future success is just one click away.

NewsSubscribe
First
Last
Consent

Why Your Neighbor’s Making $1,000 More Per Day From The Same Cows (And What You Can Do About It)

$4.60/cwt gap between 4.23% and 3.69% butterfat = $370K annually. Your genomic testing strategy better be dialed in.

EXECUTIVE SUMMARY: Look, I’ve been walking through barns for twenty: years, and the conversation’s completely changed. We’re not in the milk business anymore – we’re in the component business, and most producers are still stuck in the old mindset. Recent Journal of Dairy Science research shows butterfat production jumped 30.2% while milk volume only grew 15.9% since 2011, creating a $4.60 per hundredweight premium for high-component milk. That’s real money – a 500-cow operation shipping 4.23% butterfat versus 3.69% banks an extra $370,000 annually from the same cows eating the same feed. With genomics now driving 70% of production gains and processors investing $8 billion in component-focused facilities through 2026, the writing’s on the wall. You need to get serious about component optimization right now, because while you’re deciding, your competitors are already capturing that premium.

KEY TAKEAWAYS

  • Component Premium Reality Check: Butterfat accounts for 58% of your milk check, protein another 31% – that’s 89% of your income from solids, not water. Start tracking your monthly component trends against regional averages and identify which cow groups are dragging down your bulk tank performance.
  • Genomic ROI That Actually Pays: With over 10 million animals now genotyped and genomics driving 70% of production gains, systematic genomic testing of heifer calves gives you 70% accuracy on future component potential. Implement testing on your top 25% for breeding decisions – the genetic gains are permanent and cumulative.
  • Heat Stress = Money Walking Out the Door: I watched Midwest operations lose 0.3-0.4 percentage points of butterfat during July 2024’s heat waves – that’s thousands in lost revenue. Invest in effective cooling systems ($400-800 per cow) and optimize feeding times to avoid peak heat periods in these 2025 climate conditions.
  • Processing Competition Works in Your Favor: With $8 billion in new cheese and butter plants coming online, processors are competing for component-rich milk that maximizes their efficiency. Farms consistently delivering high-component milk are becoming price makers instead of price takers – leverage this to negotiate better processor relationships.
  • Export Dependency Creates Opportunity: The U.S. exports 69% of its skim solids production while importing butterfat to meet domestic demand. This structural imbalance means component-focused operations are positioned to capture both domestic premiums and global market stability through 2025 and beyond.
dairy farming, milk component optimization, genomic testing, dairy profitability, precision nutrition

You know what caught my attention at the farm show last month? It wasn’t the latest robotic milker or some fancy new TMR mixer. It was a conversation I overheard between two Wisconsin producers in the coffee line.

“Dave’s shipping the same pounds I am,” one guy was saying, shaking his head. “But somehow he’s banking an extra grand every single day.”

What’s the difference? Dave’s cows are averaging 4.23% butterfat, while his neighbor’s herd remains at 3.69%.  That gap—that seemingly small difference in butterfat numbers—is worth $4.60 per hundredweight on every load leaving the farm.

Scale that across a 500-cow operation shipping around 22,000 pounds daily… you’re looking at over $1,000 in additional revenue every single day. That’s $370,000 in incremental income annually from what amounts to the same cows eating roughly the same feed.

Here’s what that difference looks like at a glance:

FactorHigh-Component Herd (4.23% BF)Average Herd (3.69% BF)Edge for High-Component
Butterfat (%)4.233.69+0.54 pts
Component Premium ($/cwt)+$4.60+$4.60
Daily Revenue Gain (500 cows)+$1,000Baseline+$1,000
Annual Revenue Gain+$370,000+$370,000
Feed ProgramSame TMRSame TMRNo added cost
Strategic FocusGenomics + ComponentsVolumeHigher Margin

Here’s the thing, though… this isn’t some future trend we need to prepare for. This transformation is happening right now, and it’s accelerating faster than most producers realize.

The Shift That’s Redefining Everything

The thing about major industry changes is they tend to sneak up on you. One day, you’re doing business the way your dad did, the next day, the entire game has changed. What are we seeing in dairy right now? It’s that pivotal moment when everything clicks into place.

I’ve been walking through barns across the Midwest for over two decades, and the conversations I’m having today are fundamentally different from even five years ago. Maybe it hit you when your nutritionist started asking about butterfat targets instead of milk per cow. Or when your milk check jumped despite shipping fewer pounds last month.

According to recent work from the Journal of Dairy Science, the numbers tell a clear story: from 2011 to 2024, while milk production increased by a modest 15.9%, butterfat production increased by 30.2% and protein production climbed by 23.6%. Think about what this means for your bottom line… the same number of cows, managed with similar protocols, are now producing fundamentally different milk—and way more valuable—than what they produced a decade ago.

What’s happening is we’ve moved from a simple commodity model to something much more sophisticated. Raw milk isn’t just a fluid anymore; it’s become a sophisticated, customizable raw material where value is defined by its solids content, not water.

And this brings us to an important consideration…

The Genomic Revolution That Actually Delivered

Remember when genomic testing was an expensive experiment that only the largest operations could justify? Well, according to the Council on Dairy Cattle Breeding, the industry has now tested over 10 million animals through genomic programs. That’s created what researchers are calling the most comprehensive genetic database of any domestic animal species except humans and lab mice.

What this reveals is that genomics now accounts for over 70% of the production gains on U.S. dairy farms—a complete flip from previous decades when management practices were the dominant factor. This isn’t just about having better bulls in your breeding program (though that’s certainly part of it). It’s about fundamentally altering what comes out of your cows.

The April 2025 genetic evaluations from Holstein Association USA revealed something that would have been considered impossible just five years ago—genetic improvements on butterfat that are honestly pretty remarkable. Because butterfat and protein are among the most heritable traits (with heritabilities of 20-25% according to multiple peer-reviewed studies), the genetic gains we’re making today will compound across generations.

The surprising part is that most producers I work with are still underestimating just how powerful this genetic momentum has become. Every young bull entering your breeding program today has genetic potential that would have been science fiction just a few years ago.

However, here’s the challenge… and this is something that consistently arises in my conversations with producers: genetic change is a generational phenomenon. You’re looking at 18-24 months before you start seeing meaningful improvements in your bulk tank. That’s a long time to wait when your neighbor is already capturing that premium today.

Where Your Milk Check Money Actually Lives Now

Let me ask you something that might surprise you: if you’re still thinking about milk pricing the way you did in 2010, are you missing the biggest profit opportunity in modern dairy farming?

Under Multiple Component Pricing (MCP)—which governs over 90% of the U.S. milk supply through Federal Milk Marketing Orders—butterfat now accounts for 58% of the average milk check, with protein contributing another 31%. That means nearly 90% of your milk check value comes from the components, not the water your cows produce.

Butterfat alone now accounts for more than half of the average U.S. milk check, making it the single most important driver of dairy profitability.

The financial impact is honestly staggering. Recent USDA Agricultural Marketing Service data shows Class III milk prices averaging $18.82 per hundredweight for June 2025, while Class IV prices were $18.30 per hundredweight. But here’s the kicker: butterfat hit $2.7448 per pound, demonstrating just how much premium value fat components carry.

Component Premium Assessment Tool

Take a moment to evaluate your current position:

  • What’s your current herd average butterfat percentage?
  • How does this compare to your county or regional average?
  • What’s the spread between your highest and lowest producing groups?
  • Are you tracking component trends on a monthly basis or just looking at annual averages?

If you can’t answer these questions off the top of your head, you’re probably leaving money on the table.

What’s interesting is that each 0.1% increase in butterfat can add $15-20 in monthly revenue per cow. For a 1,000-cow operation, that translates to $15,000-$20,000 in additional monthly income from what amounts to a relatively small improvement in component levels.

However, this leads to a crucial point: despite this production boom, the U.S. remains a net importer of butterfat. Consumer demand has grown even faster than our supply gains, creating a unique market dynamic where domestic demand continues to outpace production.

The Consumer Story That’s Actually Driving Everything

This isn’t just about supply—it’s about a fundamental shift in how Americans eat dairy, and I’ve watched this play out in real time over the past few years.

Recent USDA Economic Research Service data shows per capita consumption of dairy products reached 661 pounds per person in 2023, matching the all-time record set in 2021. But here’s what’s really fascinating: while fluid milk consumption continues its long-term decline, butter consumption hit 6.5 pounds per person (highest since 1965) and cheese consumption reached 42.3 pounds per person.

Americans aren’t abandoning dairy—they’re fundamentally changing how they consume it. They’re shifting from fluid milk as a beverage toward manufactured, higher-fat dairy products, such as butter, cheese, and premium yogurt. This trend accelerated with everything from the home-baking renaissance during COVID to the rise of social media food trends, such as the elaborate charcuterie boards that are now ubiquitous.

What’s particularly fascinating is the science behind this shift in consumer behavior. Research published in the Journal of Dairy Science shows that dairy fat is the most complex edible fat found in nature, comprising over 400 distinct fatty acids with different chain lengths and chemical structures. The unique milk fat globule membrane (MFGM) that encases fat globules plays a crucial role in the digestion and metabolism of dairy fat.

This brings us to an important consideration from a health perspective: multiple prospective cohort studies now show that consumption of full-fat dairy is associated with neutral or even reduced risk of major health outcomes, including cardiovascular disease, type 2 diabetes, and metabolic syndrome. Some compelling evidence suggests that a high intake of full-fat dairy is actually associated with a decreased risk of developing type 2 diabetes, an outcome not observed with low-fat dairy.

The $8 Billion Processing Bet That’s Changing Everything

Here’s something that should catch your attention: the U.S. dairy industry is investing over $8 billion in new processing capacity through 2026, with approximately half of the investment targeting cheese production. This isn’t just expansion—it’s a massive bet on the continued growth of component-driven demand.

Think about what this means for your operation. When processing capacity is expanding this aggressively, it creates competition for your milk—and that competition is specifically for component-rich milk that can maximize plant efficiency and profitability.

I’ve seen firsthand how this plays out. Operations that can consistently deliver high-component milk are finding themselves with multiple buyers competing for their product, while those still producing average-component milk are becoming price takers rather than price makers.

Regional Variations That Really Matter

The geography of American dairy is changing, and it’s being driven by the same component economic components that are reshaping individual operations. The May 2025 USDA Milk Production report indicates 19.1 billion pounds of milk production in the 24 major states, representing a 1.7% increase from May 2024.

However, the surprising part is that component production has consistently outpaced fluid milk growth, with butterfat levels improving from 4.17% to 4.24% between May 2024 and May 2025. That improvement yielded 1.8 pounds more butterfat per cow, representing a 2% yield gain per cow.

What I’m seeing in different regions is honestly fascinating. In the Upper Midwest—specifically, Wisconsin, Minnesota, and Michigan—producers face different challenges than those in the Southwest or California. Heat stress management becomes absolutely crucial in Arizona and Texas (as we saw firsthand during last summer’s heat waves), while in Wisconsin and Minnesota, producers are focusing more on forage quality and barn ventilation systems.

The spring flood issues we saw across parts of Iowa and Illinois this year? That created some interesting butterfat challenges as producers dealt with compromised forage quality and had to adjust their nutrition programs on the fly.

Regional Component Optimization Strategies

Upper Midwest (Wisconsin, Minnesota, Michigan):

  • Focus on high-quality forage production during short growing seasons
  • Invest in advanced barn ventilation for summer heat stress management
  • Leverage strong genetics programs from local breeding cooperatives

Southwest (Arizona, Texas, New Mexico):

  • Prioritize heat stress abatement systems (evaporative cooling, shade structures)
  • Optimize feeding times to avoid peak heat periods
  • Consider night milking schedules during extreme weather

California Central Valley:

  • Navigate drought conditions with drought-resistant forage varieties
  • Manage seasonal feed cost volatility
  • Balance component production with regulatory compliance requirements

The message for your operation is clear: regardless of where you’re located, you need to be thinking about how to produce the kind of milk that processors are building billion-dollar plants to handle.

How Smart Producers Are Capturing This Component Premium

Now that you understand the forces driving this transformation, let’s discuss its implications for your operation. The primary strategic shift is moving from a “milking for volume” mindset to “milking for margin.”

The Genetics Game-Changer

The genetic gains achieved through genomics are permanent and cumulative, ensuring that strategic breeding decisions you make today will pay dividends for decades. Here’s what that means practically…

You need to leverage component-focused selection indexes, such as Net Merit ($ NM), which now places substantial weighting on butterfat and protein values. Work with A.I. companies that can provide genomic young sires specifically bred for component production, and implement systematic genomic testing of your own heifer calves to identify the top 25% for breeding and the bottom 25% for terminal mating.

The economic weighting for butterfat in selection indexes has increased by 13% to reflect current market values, demonstrating the industry’s commitment to component optimization.

But here’s something I’ve learned from working with producers who’ve made this transition: don’t expect immediate results. Genetic change is generational, and you’re looking at 18-24 months before you start seeing meaningful improvements in your bulk tank.

Decision Framework: Is Your Genetics Program Component-Optimized?

Ask yourself these questions:

  1. What percentage of your breeding decisions are based on component traits versus volume traits?
  2. Are you systematically using genomic testing to replace heifers to identify genetic potential early?
  3. Do you have a clear genetic plan for the next 5 years, or are you just buying the “hot bull” of the moment?
  4. How do you balance component gains with other important traits, such as health and fertility?

If you can’t answer these confidently, you might be missing the biggest opportunity in modern dairy farming.

Nutrition: The Other Half of the Equation

Even the best genetics won’t deliver results without precision nutrition management. The key is creating rumen conditions that maximize acetate production—the direct precursor to milk fat.

University extension research shows that feeding high-quality, highly digestible forages promotes acetate production in the rumen. Maintaining a stable rumen pH through proper fiber management and strategic buffering is critical, as acidosis can disrupt fatty acid metabolism and lead to milk fat depression.

This reveals the crucial role of heat stress management. It causes cows to reduce feed intake, particularly of forages that support fat synthesis. This past summer, I watched operations in the Midwest lose 0.3-0.4 percentage points of butterfat during the July heat wave—that’s real money walking out the door.

Here’s where it gets challenging, though: every operation is different. What works for a 500-cow freestall in Wisconsin might not work for a 5,000-cow operation in California’s Central Valley. Feed costs, climate conditions, and labor availability —all of these factors affect your ability to optimize for components.

I’ve seen producers get so focused on chasing butterfat numbers that they forget about the bigger picture. Cow health, reproductive performance, longevity—these all matter too. The most successful producers I work with are those who optimize for components while maintaining overall herd performance.

The Trade-Off Most Producers Don’t Consider

This leads to a crucial point that honestly keeps me up at night thinking about the industry’s future…

The U.S. dairy industry’s component-focused model creates a critical dependency on skim solids exports. While we consume most of our butterfat domestically, we export massive quantities of skim milk powder, nonfat dry milk, and whey products to balance the market.

According to USDA Agricultural Outlook Forum data, the U.S. exported a record 17.8% of its total milk solids production in 2022, with 78% of those exported solids being in the form of dry skim milk ingredients. The exports-to-production ratio for dry skim milk products reached 69%.

This export dependency makes the industry vulnerable to trade disputes, tariffs, and protectionist policies in key markets, such as Mexico, Canada, and China. A major trade disruption could destabilize the entire domestic milk pricing structure by flooding the market with skim solids that can’t find export homes.

The Risks We Need to Talk About

While the component boom presents tremendous opportunities, it also creates new vulnerabilities that strategic operators must understand and manage.

The Processing Bottleneck Challenge

The $8 billion processing investment wave carries significant timing risks. If these large facilities come online simultaneously and consumer demand fails to keep pace, the industry could face severe oversupply conditions, leading to sharp price declines.

Processors are already experiencing what some call a “cream tsunami,” with butter manufacturers acting as a relief valve to absorb surplus cream, often at discounted prices. This is creating manufacturing imbalances, with butter and American cheese production rising while other traditional uses of butterfat decline.

The surprising part is whether these new plants are truly optimized to handle the increasingly component-rich milk being produced. Traditional processing equipment was designed for lower-solid milk, and running higher-solid milk through it can create inefficiencies that could erode processor margins and, eventually, the premiums paid to farmers.

Implementation Challenges: The Reality Check

Let’s be honest about something that doesn’t get discussed enough: transitioning to component-focused production isn’t easy, and it’s not inexpensive.

I’ve worked with producers who have invested heavily in genomics and precision nutrition, only to see modest improvements in their bulk tank. Why? Because component optimization is a systems approach that requires everything to work together—genetics, nutrition, management, facilities, and even seasonal timing.

Take heat stress management, for example. Installing effective cooling systems can cost $400 to $ 800 per cow, depending on your setup. That’s a significant investment, and the payback period varies dramatically based on your climate, facility design, and current production levels.

Feed costs are another reality check. High-quality, highly digestible forages that support fat synthesis often cost more than maintenance-level feeds. Rumen-protected fats, dietary buffers, precision additives—these all add up. I’ve seen operations increase their feed costs by $0.50-1.00 per cow per day while optimizing for components.

Labor is probably the biggest challenge of all. Component optimization requires more management attention, more frequent monitoring, and often additional skilled labor. In today’s labor market, that’s not always easy to find or afford.

Technology Disruption: The Precision Fermentation Question

Here’s something that honestly makes me uncertain about the long-term future: the emergence of precision fermentation technology, which utilizes microorganisms to produce dairy proteins without the need for cows.

While the technology is still in early commercial phases, companies are already investing heavily in this space. The timeline for significant market impact remains unclear, but if precision fermentation can eventually produce commodity dairy ingredients at lower costs than traditional agriculture, it could potentially disrupt the skim solids export model that supports current component pricing structures.

This reveals how different segments of the industry may be affected differently. Premium, local, and specialty dairy products might be less vulnerable to this disruption than commodity ingredients.

What This Means for Your Operation Going Forward

The component revolution isn’t coming—it’s here. Every day that you operate with a volume-focused mindset rather than a component-focused strategy, you’re potentially leaving money on the table and falling behind competitors who have made the transition.

Your Strategic Roadmap

Right Now (Next 30 Days): Start by auditing your current genetic program to ensure component traits are properly weighted. Analyze your milk checks from the last 12 months to understand your component performance trends. Are you consistently above or below average? What’s your seasonal pattern? Are there specific groups of cows that are dragging down your overall performance?

Evaluate your nutritional program for optimal rumen health and fat synthesis. This may involve collaborating with your nutritionist to review your current ration formulation or investing in more advanced feed management systems.

Most importantly, assess your processor relationships for component pricing competitiveness. Are you getting paid appropriately for the quality of milk you’re producing? If not, it might be time to explore alternatives.

Medium-Term (Next 6-12 Months): Implement systematic genomic testing of heifer calves. This is becoming more common across the industry, and the ROI data is compelling. But don’t just test—develop a systematic approach to using that information in your breeding decisions.

Consider upgrading your nutrition management systems for precision feeding. This may involve investing in new TMR mixers, feed management software, or more sophisticated monitoring systems.

Develop risk management protocols for component price volatility. The reality is that component prices can be more volatile than traditional milk prices, so you need strategies to manage that risk.

Long-Term Positioning (Next 2-5 Years): Build operational flexibility to adapt to changing market demands. This may involve diversifying your product mix, exploring direct-to-consumer opportunities, or developing niche market positions.

Invest in technologies that improve efficiency and reduce labor dependency. Automation, monitoring systems, and decision support tools will become increasingly important as the industry evolves.

Create sustainability metrics that support premium market positioning. Consumers and processors are increasingly interested in environmental and social responsibility, and these factors are likely to become more important in the future.

The Global Context That Matters

What’s happening in the U.S. isn’t occurring in isolation. European dairy producers face similar component-driven market forces, albeit within different regulatory frameworks. New Zealand’s dairy industry—always a benchmark for efficiency—is seeing comparable trends in component optimization.

Research from Teagasc in Ireland shows similar patterns emerging across European dairy systems, with component pricing becoming increasingly important. However, the U.S. market’s unique structure—with our heavy reliance on skim solids exports—creates both opportunities and vulnerabilities that other dairy economies don’t face.

Key Questions to Consider:

  • How will changing trade relationships affect your ability to capture component premiums?
  • What role will sustainability requirements play in future component pricing?
  • How might climate change affect your ability to optimize for components?
  • What new technologies might emerge that could change the game again?

The Bottom Line: Where We Go From Here

The dairy industry has undergone fundamental changes, and the most successful operations of the next decade will be those that recognize and adapt to this new reality. The component boom isn’t just about producing different milk—it’s about building a different kind of dairy business, one that’s optimized for profitability, sustainability, and long-term competitive advantage.

What keeps me optimistic about this industry is seeing how innovative producers are embracing these changes. I’ve watched farms transform their operations, improve their genetics, and build more profitable businesses by focusing on component quality rather than just volume.

But I’d be lying if I said this transition is easy or guaranteed. The producers who succeed will be those who approach it systematically, with realistic expectations about timelines and costs, and with a clear understanding of both the opportunities and the risks.

The question isn’t whether you can afford to make this transition—it’s whether you can afford not to. Because while you’re deciding, your competitors are already capturing the premium, and that gap is growing every day.

This transformation represents the most significant shift in dairy economics since the introduction of bulk tanks… and the producers who master it will be the ones who thrive in the decades to come.

So here’s my challenge to you: stop thinking about milk production the way your dad did. Start thinking about it the way your kids will have to. Because the future of dairy isn’t about more milk—it’s about better milk. And that future? It’s already here.

Complete references and supporting documentation are available upon request by contacting the editorial team at editor@thebullvine.com.

Learn More:

Join the Revolution!

Join over 30,000 successful dairy professionals who rely on Bullvine Weekly for their competitive edge. Delivered directly to your inbox each week, our exclusive industry insights help you make smarter decisions while saving precious hours every week. Never miss critical updates on milk production trends, breakthrough technologies, and profit-boosting strategies that top producers are already implementing. Subscribe now to transform your dairy operation’s efficiency and profitability—your future success is just one click away.

NewsSubscribe
First
Last
Consent

Currency Catalyst Creates Export Goldmine: How Smart Dairy Operators Are Capitalizing on Market Disruption While Others Miss the Boat

Stop chasing volume – smart producers optimize 4.23% butterfat for $1B+ export premiums while competitors miss currency goldmine

EXECUTIVE SUMMARY:  Most dairy producers are completely missing the profit opportunity of a lifetime by chasing milk volume instead of optimizing components for booming export markets. While U.S. butterfat levels hit record highs at 4.23% nationally and protein reached 3.29% in 2024, the industry generated $8.2 billion in exports – yet 70% of operations remain locked into domestic commodity pricing. From 2011-2024, protein climbed 23.6% and butterfat surged 30.2% while milk production only increased 15.9% – proving genomics has fundamentally transformed what’s flowing through your pipeline. With $8 billion in new processing capacity coming online and Mexico absorbing 40% of U.S. cheese exports, processors are getting selective about milk quality. The industry is dividing into two camps: farms meeting export quality standards earning component premiums, versus operations trapped in volatile domestic markets – and the currency advantage amplifying this opportunity won’t last forever.

KEY TAKEAWAYS

  • Component Optimization Pays Premium Dollars: Operations targeting 4.2%+ butterfat and 3.3%+ protein access export channels worth measurable premiums over commodity pricing, with genomic testing enabling breeding decisions that international buyers actually value
  • Export Market Urgency Creates Competitive Advantage: With 16% of U.S. milk production flowing to export markets and Mexico purchasing $2.32 billion in U.S. dairy products annually, farms not optimizing for international quality standards face relegation to lower-value domestic channels
  • $8 Billion Processing Surge Demands Quality: New dairy processing capacity coming online through 2025 means processors can be selective – operations producing commodity-grade milk may face price pressure while export-ready farms benefit from processor competition for premium components
  • Currency Window Won’t Stay Open: The dollar’s weakness creating today’s export advantages is temporary, but component quality improvements driven by genomics are permanent – smart operators are building sustainable competitive advantages through genetic selection while the opportunity exists
  • Implementation ROI Is Immediate: Genomic testing enables predictive breeding decisions based on production and health traits that export markets demand, while component optimization protocols offer measurable returns through access to premium manufacturing channels worth significant per-cwt advantages
dairy export optimization, milk component optimization, butterfat protein levels, genomic testing profitability, dairy export markets

The US dollar’s volatility has created an unprecedented opportunity for American dairy exports, but here’s what most producers are missing: this isn’t just about currency luck – it’s about fundamentally superior milk quality that genomics has quietly engineered. While butter exports surge and cheese finds new global markets, the real winners are farms optimizing components for export premiums that could add significant value to milk checks.

The Component Revolution That’s Rewriting Export Rules

Stop thinking about milk as a commodity. US butterfat levels hit record highs at 4.23% nationally in 2024, according to USDA’s National Agricultural Statistics Service, while protein content reached 3.29%, representing consecutive yearly records that have positioned American dairy as a premium global ingredient.

This isn’t an accident – it’s the result of what CoBank’s lead dairy economist Corey Geiger calls “the game-changing story for the upward movement in milk components.” Here’s the reality most producers haven’t grasped: from 2011 to 2024, while US milk production increased 15.9%, protein climbed 23.6% and butterfat surged 30.2%.

Think about that for a moment. Your cows produce fundamentally different milk than they were a decade ago, and international buyers are paying premium prices for these enhanced components.

Why This Matters for Your Operation: Export processors pay component premiums because international markets demand consistent quality. With over 80% of the US milk supply going into manufactured dairy products that rely on butterfat and protein content, farms are optimizing for components to access export channels that traditional commodity operations can’t touch.

Challenging the “Volume Over Value” Dairy Myth

Here’s where I’m going to challenge conventional wisdom that’s costing producers money: the industry’s obsession with production volume over component optimization.

While everyone talks about increasing milk per cow, the real export success stories come from operations prioritizing component optimization over volume expansion. Multiple component pricing programs place nearly 90% of the milk check value on butterfat and protein, making component quality the determining factor in profitability.

The conventional approach – chasing volume records without considering component value – is like selling wheat by the bushel when buyers pay premiums for protein content. CoBank research shows that 16% or 1 in 6 tankers of milk gets turned into dairy products destined for customers around the globe.

Critical Question: If you’re not genomically testing your heifers and optimizing nutrition for components, are you essentially leaving money on the table while your competitors capture export premiums?

The Export Reality: Numbers That Demand Attention

US dairy exports reached $8.2 billion in 2024 – the second-highest total export value ever, representing a $223 million year-over-year increase. But here’s what the headlines miss: cheese exports hit an all-time record months in 2024, driven not just by favorable exchange rates but by fundamental quality advantages that genomic improvement has created.

Mexico alone accounted for nearly 40% of US cheese exports in 2025, making this relationship critical to every American dairy farmer’s profitability. Mexico and Canada – US dairy’s top two global trading partners – represent more than 40% of US dairy exports at $2.47 billion and $1.14 billion, respectively.

Component Economics Reality Check: With USDA projecting the all-milk price for 2025 at $21.60 per cwt and demand for butterfat and protein driving export growth, the math isn’t complicated – you’re either capturing component premiums through export channels or watching competitors take them.

Technology Integration: The Export Quality Advantage

The export opportunity isn’t just about currency – it’s about meeting international quality standards that basic operations can’t achieve.

The predictive power of genomic testing comes from comparing an individual animal’s DNA sample to the overall population. This enables producers to evaluate animals and make breeding decisions based on production and health traits – essential capabilities for meeting export market demands.

Processing Capacity Reality: The industry has invested $8 billion in new dairy processing plants coming online in 2025, with nearly 20 million pounds of additional milk flowing through these facilities by mid-2025. This massive capacity increase means processors can be selective about milk quality – operations that can’t meet export standards will be relegated to lower-value domestic channels.

The Mexico Opportunity and Trade Dynamics

While US dairy exports face some political headwinds, the opportunity for Mexico continues to expand. Mexico purchased $2.32 billion in US dairy products in 2023, representing one-fourth of all US dairy exports, making this relationship vital for industry profitability.

CoBank’s Corey Geiger notes the critical importance of this relationship: “Mexico currently purchases 4.5% of America’s milk production in the form of dairy products and ingredients”. The growth potential remains strong as Mexico’s average citizen consumes just 45% of the dairy products of the average American.

Strategic Reality: With $8 billion in new processing capacity requiring absorption through domestic or international markets, farms optimizing for export quality have diversified revenue streams that provide greater stability than domestic-only operations.

Global Context: Why US Dairy is Winning

The numbers tell the story of American dairy’s competitive advantage in component production. Butterfat levels have reached record highs for the past four consecutive years, while protein content has posted new consecutive yearly records from 2016 to 2024.

Domestic production continues expanding strategically. USDA raised its 2025 milk production forecast to 227.3 billion pounds, but the critical factor is that component levels are growing faster than historical trends, with demand for butterfat and protein rising as $8 billion of new dairy processing capacity comes online through 2027.

Competitive Advantage Reality: US dairy combines advanced genetics with processing infrastructure that international competitors struggle to match, especially when genomics enables producers to select animals for highly heritable traits associated with milk component levels.

The Processing Capacity Surge: Opportunity or Threat?

Here’s the inconvenient truth most aren’t discussing: $8 billion in new processing capacity coming online in 2025 creates both opportunity and risk. This massive investment means the industry will either find export markets or face domestic oversupply.

University of Wisconsin’s Leonard Polzin warns about market equilibrium: “Once we find a new equilibrium, it could be low for quite some time”. The mathematics are simple: export success becomes essential for market balance when processing capacity increases dramatically.

Critical Success Factor: Operations that can meet export quality standards will benefit from processor competition for premium milk, while farms producing commodity-grade milk may face price pressure as domestic markets absorb new capacity.

The Bottom Line: Export Excellence or Commodity Mediocrity

The currency advantage creating today’s export boom may be temporary, but the component quality revolution driven by genomics is permanent. US butterfat levels averaging 4.23% and protein at 3.29% represent a fundamental shift that positions American dairy as a premium global ingredient.

With exports reaching $8.2 billion in 2024 and cheese exports hitting all-time record months, smart operators aren’t just riding market waves – they’re building sustainable competitive advantages through genomic selection and component optimization that qualify for export premium channels.

The industry is divided into two categories: farms that meet export quality standards and capture international premiums versus operations limited to domestic commodity pricing with its inherent volatility.

Your Strategic Decision Point: With 16% of US milk production going to export markets and $8 billion in new processing capacity coming online, the question isn’t whether export markets matter – it’s whether your operation is positioned to capture them.

Implementation Action Plan:

  1. This Week: Calculate your current component averages using the last 6 months’ data. Farms below 4.0% butterfat and 3.2% protein are missing opportunities in a market where national averages hit 4.23% butterfat and 3.29% protein.
  2. This Month: Contact your nutritionist about component optimization protocols. With genomics driving upward movement in milk components and nearly 90% of milk check value tied to butterfat and protein, genetic and nutritional improvements offer a measurable ROI.
  3. Next Quarter: Evaluate genomic testing for replacement heifers. The predictive power of genomic testing enables breeding decisions based on production and health traits that export markets value.

Critical Success Metrics to Track:

  • Butterfat %: Target 4.2%+ to match national export leaders at 4.23%
  • Protein %: Aim for 3.3%+ to exceed the national average of 3.29%
  • Component Consistency: Essential for export market relationships
  • Processing Premium Access: Qualification for higher-value manufacturing channels

The export opportunity is real, backed by $8.2 billion in 2024 exports and record cheese export months. The processing capacity is being built with $8 billion in new facilities. The genomic improvements are proven through consecutive yearly records in component levels. The only question remains: will you capitalize on this moment or watch competitors capture the premiums your operation could earn?

Complete references and supporting documentation are available upon request by contacting the editorial team at editor@thebullvine.com.

Learn More:

Join the Revolution!

Join over 30,000 successful dairy professionals who rely on Bullvine Weekly for their competitive edge. Delivered directly to your inbox each week, our exclusive industry insights help you make smarter decisions while saving precious hours every week. Never miss critical updates on milk production trends, breakthrough technologies, and profit-boosting strategies that top producers are already implementing. Subscribe now to transform your dairy operation’s efficiency and profitability—your future success is just one click away.

NewsSubscribe
First
Last
Consent

Beat The Summer Component Blues: Why Your Competitors Are Banking Bigger Milk Checks While You’re Watching Profits Melt Away

Don’t let summer heat drain your milk check! While your competitors accept seasonal component drops, science reveals they’re preventable-and costing you thousands.

milk component optimization, heat stress dairy, summer butterfat production, component pricing, nutritional strategies for milk fat

Stop accepting summer component losses as “normal.” The hard truth? While you’re waiting for cooler weather to restore your butterfat and protein levels, progressive producers are maintaining peak components year-round and laughing all the way to the bank. The difference between their approach and yours isn’t luck or genetics’ strategy. And it’s costing you thousands in lost premiums every summer.

According to research published by the University of Florida, heat stress is costing the U.S. dairy industry a staggering $1.5 billion annually. A significant portion of these losses comes from depressed milk components. In Federal Milk Marketing Orders, where multiple component pricing is the norm, these seasonal dips in butterfat and true protein content directly impact your mailbox price. What’s particularly frustrating is that component depression often begins before visible signs of heat stress appear in your herd – your components can be tanking. In contrast, your cows seem to be ruminating normally at the headlocks.

But here’s the truth that will challenge conventional wisdom: summer component depression isn’t inevitable. The latest research shows that with a strategic approach to nutrition and management, you can maintain milk components even through the dog days of summer. This isn’t theoretical – progressive producers nationwide are already implementing these techniques with impressive results, maintaining fat tests above 4.0% and protein above 3.2% year-round.

The Hidden Science Behind Your Summer Component Crash

Most dairy farmers understand that heat stress reduces milk production, but fewer understand how early and dramatically it impacts components. The science reveals some surprising insights about what’s happening inside your cows when temperatures climb.

It Starts Earlier Than You Think

While milk yield typically begins declining when the temperature-humidity index (THI) exceeds 72, research shows that fat and protein yields start dropping at much lower THI values – fat yield begins declining at a THI of just 57. In contrast, protein yield starts decreasing at a THI around 60. This means your components are tanking before you see other apparent signs of heat stress.

A comprehensive analysis of milk produced by 1.67 million cows published in the Journal of Dairy Science confirmed that fat and protein content decreased significantly with increased THI values. For each unit increase in THI above threshold values, protein and fat yield decreased by approximately 0.008 kg and 0.006 kg per cow per day, respectively.

Are you still waiting for panting cows to signal it’s time to implement your heat stress strategy? By then, you’ve already lost weeks of premium components.

What’s Happening Inside Your Cows

When cows experience heat stress, their bodies undergo complex physiological and metabolic changes that specifically impact component synthesis:

  1. Reduced dry matter intake (DMI) – This is the obvious one. Cows eat less and have less raw material to make milk components. However, reduced DMI only accounts for about 50% of the production loss.
  2. Energy diversion for cooling – Panting alone can increase a cow’s maintenance energy requirement by 7% to 25%. This energy could otherwise be used for milk and component production. It’s like running your barn’s cooling system at maximum while trying to operate your milking equipment on half power – something must give.
  3. Altered insulin dynamics – Heat stress increases insulin activity, which has an anti-lipolytic effect. This suppresses the breakdown of body fat reserves that normally release fatty acids used for milk fat synthesis in the mammary gland.
  4. Reduced rumen motility – Heat stress slows rumen contractions and cud chewing, altering the acetate-to-propionate ratio and reducing the volatile fatty acids (VFAs) precursors for milk fat synthesis. For a cow’s rumen to function properly, it needs consistent conditions, just like your forage harvester needs consistent crop flow for optimal performance.

Understanding these mechanisms is crucial because simply addressing cow comfort isn’t enough – you need targeted nutritional strategies to overcome these specific metabolic challenges.

Nutrition Strategies That Work

Conventional wisdom might tell you there’s not much you can do about summer component depression besides wait for cooler weather. That’s dead wrong. Research published in the Journal of Dairy Science confirms that strategic nutritional interventions can significantly mitigate the negative effects of heat stress on milk components.

Rethinking Energy Density

When DMI drops during heat stress, the obvious solution is to increase the energy density of the ration. But there’s a right way and a wrong way to do this.

The wrong way? Simply dumping more grain in the ration. This approach often backfires by creating acidosis risk, which further depresses components and creates health problems. Instead, focus on higher-quality, highly digestible forages that generate less metabolic heat during digestion.

Brown midrib (BMR) corn silage, with its higher NDF digestibility, is a prime example of a “cool” energy source that won’t add to your cows’ heat load. One study found that switching to BMR corn silage during summer maintained an average of 0.15 percentage points higher milk fat than conventional corn silage. That might not sound like much, but on a 70-pound tank average, that’s over 6 cents per hundredweight in your milk check.

Why are you still feeding the same TMR formulation in July that worked in January?

The Power of Protected Fats

Research from multiple sources, including studies published in the Journal of Dairy Science, demonstrates that adding fat to summer rations is particularly effective because:

  • Fats have 2.25 times the energy value of carbohydrates
  • Fats produce less metabolic heat during digestion (lower heat increment)
  • Fats don’t add to the acid load in the rumen like fermentable carbohydrates do
  • Rumen-protected fats provide a direct source of fatty acids for milk fat synthesis

As All About Feed notes, “optimising rumen function could help maintain milk fat content and production efficiency of dairy cows under heat stress.” Awe-inspiring are the results from rumen-protected fats high in palmitic acid (C16:0). Research shows they can increase milk fat percentage by 0.15-0.35 percentage points, with the effect being most pronounced under heat stress conditions.

Are you still trying to increase energy density with starch while your competitors use “cool” fat energy to maintain components?

The Feed Additive Arsenal

Progressive producers are using a strategic combination of additives to combat heat stress effects on components:

Live yeast cultures stabilize rumen pH by stimulating lactate-utilizing bacteria and enhance fiber digestion. Multiple studies have shown they can help lower core body temperature and maintain milk fat during heat stress. One study found a 0.1-0.2% increase in milk fat when properly supplemented.

Buffers like sodium bicarbonate compensate for reduced bicarbonate from panting and maintain rumen pH. Research shows they can prevent milk fat depression by 0.1-0.3% by neutralizing VFAs and lactate. During heat stress, respiratory alkalosis reduces the bicarbonate available for rumen buffering, making supplementation crucial.

Electrolytes replace minerals lost through sweating and altered excretion. According to research cited by Jaylor, heat stress increases the loss of potassium (K) and sodium (Na). Recommendations suggest increasing dietary K to 1.5-1.6% of dry matter and sodium to 0.4-0.6%, significantly higher than standard rations.

When did you last adjust your buffer levels based on temperature forecasts rather than just maintaining the same year-round formulation?

Feeding Management That Makes a Difference

Beyond what you feed, when and how you deliver it can significantly impact summer component preservation.

Research shows that adjusting feeding times to cooler parts of the day (early morning, late evening) can increase feed intake by 5-10% during hot weather. One study found that shifting 60% of feed delivery to between 8 PM and 8 AM resulted in a 3.5% increase in fat-corrected milk without any ration changes.

Increasing feeding frequency maintains freshness, prevents heating, and stimulates more consistent daily intake patterns. For every hour TMR sits in the feed bunk during 90°F weather, its temperature can increase by 3-4°F, dramatically reducing palatability and intake.

Beat The Heat Before It Beats Your Components

Most cooling systems are designed to kick in when cows show visible signs of heat stress. By then, you’re already losing components. Research from the University of Florida has demonstrated that fat and protein production begin declining at much lower THI values than previously thought.

The Cooling Sweet Spot: Earlier Than You Think

The traditional threshold of THI 72 for activating cooling systems comes way too late for protecting components. Consider this alternative approach that leading producers are implementing:

  1. Set up your cooling systems to activate at lower THI thresholds (65-68 rather than 72)
  2. Focus on cooling during critical periods like immediately after milking and before feeding
  3. Use continuous cooling in holding areas where heat stress can be most intense
  4. Don’t forget dry cows – heat stress during the dry period has been shown to reduce components in the subsequent lactation

Does your cooling system come on when your cows need it, or is it too late?

Frequency Matters More Than Intensity

One of the most eye-opening studies in recent heat stress research found that cows cooled eight times daily had significantly higher components than those cooled three times daily, despite similar milk yields.

The study demonstrated that the eight-times-daily cooling group exhibited much lower respiratory rates (60.2 breaths/min) than the three-times-daily group (73.1 breaths/min). This more consistent cooling prevented the metabolic shifts that specifically impair component synthesis.

It’s not just about how much you cool your cows, but how consistently you keep them in their comfort zone throughout the day. Think of it like maintaining your bulk tank temperature – occasional refrigeration isn’t enough; consistent cooling is what preserves quality.

Real-Time Data: The Component Game-Changer

One of the biggest barriers to maintaining summer components has been the delay in feedback. When monthly component tests reveal a problem, you lose significant income. That’s changing with new technology.

In-Line Milk Analysis: Know Today, Not Next Month

Systems like the BROLIS in-line milk analyzer use laser technology to provide real-time data for each cow during milking, measuring fat, protein, lactose, and other parameters without requiring additional reagents or manually taken samples.

These technologies enable you to see the immediate effects of dietary changes or management interventions, allowing quicker optimization of strategies to maintain components during heat stress.

“The ability to see component changes in real-time has completely transformed how we manage summer nutrition,” says Tom Jenkins, a progressive dairy producer from Wisconsin. “We can make a feeding change and know within 24 hours if it’s working for components, rather than waiting for the monthly test. It’s like having a daily bulk tank culture instead of waiting for the monthly SCC report.”

How many days of depressed components can you afford to lose while waiting for your monthly test results? The most profitable dairies aren’t waiting- they monitor and adapt in real-time.

BATTLE-TESTED: Your Summer Component Preservation Checklist

Early Warning System: Monitor THI daily and track early component indicators
Cooling Activation: Set cooling systems to activate at THI 65, not 72
Feed Timing: Deliver 60% of daily feed between 8 PM and 8 AM
Buffer Boost: Increase sodium bicarbonate to 0.8-1.0% of ration DM during hot periods
Protected Fats: Add C16-rich rumen-protected fats at 1-2% of diet DM
Electrolyte Balance: Increase K to 1.5-1.6% and Na to 0.4-0.6% of diet DM
Microbial Support: Include live yeast to stabilize rumen pH and enhance fiber digestion
Water Quality: Clean water troughs daily and ensure unlimited access
Component Monitoring: Check component trends at least weekly
Economics: Calculate your component efficiency (lbs fat + lbs protein ÷ DMI × 100)

The Economics: Making Smart Investments

With tight margins in today’s dairy industry, any investment needs solid economic justification. Look at the numbers behind component preservation strategies in Federal Order pricing.

Quantifying Heat Stress Losses

Heat stress imposes substantial economic burdens on dairy farms through various channels:

  • Direct milk component losses: For every unit increase in THI above critical thresholds, cows can lose approximately 0.008 kg of protein and 0.006 kg of fat per cow daily.
  • Reproductive impacts: Heat stress extends days open and reduces conception rates
  • Health costs: Increased incidence of mastitis, metabolic disorders, and lameness
  • Long-term impacts: Heat stress during the dry period affects the subsequent lactation

Research published by Cornell University’s College of Agriculture and Life Sciences confirms that “even two degrees of warming can make all the difference” in dairy productivity, contributing to the $1.5 billion annual industry loss.

ROI on Component Preservation Strategies

Let’s break down the economics of three common approaches to maintaining summer components:

  1. Nutritional interventions (protected fats, buffers, yeast):
    1. Cost: $0.15-$0.30/cow/day
    1. Potential benefit: 0.1-0.3% increase in fat, 0.05-0.15% increase in protein
    1. For a 100-cow dairy shipping 70 lbs/cow/day with $3.00 butterfat and $2.70 protein:
      1. Additional revenue: $0.45-$1.00/cow/day
      1. ROI: 1.5:1 to 3.3:1
  2. Enhanced cooling systems (additional fans, controllers, sprinklers):
    1. Initial investment: $8,000-$15,000 for a 100-cow facility
    1. Annual operating cost: $2,000-$3,000 (electricity, water, maintenance)
    1. Potential benefit: 0.1-0.25% increase in fat and protein, plus yield preservation
    1. Additional annual revenue: $15,000-$30,000
    1. ROI: 50-100% annually after initial investment

Are you still hesitating to invest in heat stress mitigation because of the upfront costs? Look at these ROI figures again. When properly implemented, these strategies often pay for themselves within months, not years.

Component Efficiency: The New Production Metric

Progressive producers are shifting their focus from just component percentages to “component efficiency” – how efficiently cows convert feed into valuable components. This metric is calculated as:

Component Efficiency = (Pounds of Fat + Pounds of Protein) ÷ Dry Matter Intake × 100

This approach recognizes that the most profitable strategy isn’t always maximizing percentages but component production relative to feed costs. It’s like measuring feed conversion in your replacement heifers – what matters isn’t just how much they grow, but how efficiently they convert feed into valuable growth.

Which would you rather have: 4.0% fat at 70 pounds of milk, or 3.8% fat at 80 pounds? The component efficiency metric gives you a clear answer to these economic questions.

Don’t Wait Until It’s Too Late: Plan Your Summer Strategy Now

Most farms make the critical mistake of waiting until components drop before acting. By then, you’re already playing catch-up. Instead, consider this proactive timeline:

April – Preparation Phase

  • Review the previous summer’s component trends
  • Evaluate cooling system functionality and clean fans
  • Begin introducing heat stress ration adjustments gradually
  • Ensure water systems can meet increased summer demands

May – Early Implementation

  • Implement a complete heat stress ration before the first major heat event
  • Begin using lower THI thresholds for activating cooling systems
  • Increase buffer inclusion in rations
  • Introduce initial rumen-protected fat strategies

June through August – Full Summer Strategy

  • Maximum implementation of all nutritional interventions
  • Regular monitoring of components (ideally daily or weekly)
  • Adjust feeding times to cooler periods
  • Maximize cooling system utilization
  • Regular assessment of water quality and availability

Is your nutrition program reactive or proactive when it comes to seasonal changes? The difference could be worth tens of thousands in your milk check.

The Bottom Line

Summer heat doesn’t have to mean watching your valuable milk components – and your profitability – melt away. The science is clear that component depression during hot weather is a metabolic challenge that can be overcome with the right approach. While your competitors accept seasonal declines as inevitable, you can maintain a competitive advantage by preserving your components year-round.

The most successful dairy operations are already implementing these strategies with impressive results. They’ve recognized that waiting until components crash before action is too late. Instead, they take a proactive, science-based approach that maintains components through even the hottest summer months.

Ask yourself: Are you still managing heat stress reactively instead of proactively? Are you still accepting summer component depression as “just the way it is”? If so, you’re leaving serious money on the table.

The economic benefits are clear: with Federal Order pricing increasingly rewarding components, the farms that maintain fat and protein levels during summer will capture significant premiums over those that don’t. When you consider that heat stress is becoming more frequent and intense with climate change, developing effective component preservation strategies isn’t just about this summer’s milk check – it’s about long-term farm sustainability.

It’s time to challenge the industry norm of accepting seasonal component losses. Start by assessing your current summer component trends, implementing targeted nutritional strategies, optimizing your cooling systems, and considering technologies that provide real-time feedback. The upfront investment will pay dividends in preserved component premiums, improved cow health, and enhanced reproductive performance.

The bottom line? Stop accepting summer component depression as inevitable. Research from leading institutions like Cornell and the University of Florida confirms that the tools and strategies to maintain profitable components year-round are available now. The only question is whether you’ll continue to watch your milk check shrink every summer or join the progressive producers who are banking bigger premiums regardless of the season.

Key Takeaways

  • Components decline before visible heat stress: Fat yield begins decreasing at THI 57 and protein at THI 60-much earlier than the traditional THI 72 threshold for activating cooling systems.
  • Strategic nutrition maintains components: Rumen-protected fats, increased buffers (0.8-1.0% sodium bicarbonate), adjusted electrolytes, and shifting 60% of feeding to cooler hours can significantly preserve components.
  • Cooling frequency trumps intensity: Research shows cows cooled eight times daily maintained significantly higher components than those cooled just three times daily, highlighting the importance of consistent temperature regulation.
  • Real-time monitoring enables rapid response: Modern in-line milk analyzers provide immediate feedback on component changes, allowing for timely intervention before significant losses occur.
  • Component efficiency should replace simple percentages: Progressive producers now track (Pounds Fat + Pounds Protein) ÷ DMI × 100 as a more comprehensive metric of productive efficiency during heat stress.

Executive Summary

Summer heat stress costs U.S. dairy farmers up to $1.5 billion annually, with a significant portion stemming from depressed milk fat and protein levels that directly impact component-based pricing. The scientific research reveals that components begin declining at surprisingly low temperature-humidity index values-well before visible signs of heat stress appear in cows. Through strategic nutritional interventions (protected fats, buffers, adjusted feeding times), environmental management (optimized cooling systems), and real-time component monitoring, producers can maintain premium-worthy components year-round. Economic modeling confirms these interventions typically deliver positive ROI within months, offering a clear competitive advantage to producers willing to challenge the conventional acceptance of seasonal component depression.

Complete references and supporting documentation are available upon request by contacting the editorial team at editor@thebullvine.com.

Learn more:

Join the Revolution!

Join over 30,000 successful dairy professionals who rely on Bullvine Weekly for their competitive edge. Delivered directly to your inbox each week, our exclusive industry insights help you make smarter decisions while saving precious hours every week. Never miss critical updates on milk production trends, breakthrough technologies, and profit-boosting strategies that top producers are already implementing. Subscribe now to transform your dairy operation’s efficiency and profitability—your future success is just one click away.

NewsSubscribe
First
Last
Consent

Digital Dairy: The Tech Stack That’s Actually Worth Your Investment in 2025

Forget fancy gadgets—2025’s winning dairy tech isn’t about collecting data but transforming it into decisions that boost your bottom line.

Dairy technology ROI, predictive analytics dairy, milk component optimization, feed efficiency technology, integrated farm data systems

Let me tell you something that might ruffle some feathers in the dairy tech world: most of what vendors are pushing isn’t worth your hard-earned money. There, I said it.

The dairy industry stands at a technological crossroads. If you’re like most farmers I’ve talked to lately, you’re drowning in sales pitches for gadgets promising the moon but delivering little more than flashing lights and monthly subscription fees.

From Faulty Alerts to Crystal Balls: AHM’s 2025 Transformation

Remember when we all rushed to put activity monitors on our cows? Those early systems were like that weather app that always predicts rain on your day off – technically working, but practically useless.

The False Alarm Problem That’s Draining Your Patience

Let’s be honest – those health monitoring systems we invested in have been crying wolf far too often. That University of Guelph study from earlier this year wasn’t just an academic exercise; it confirmed firsthand what you’ve probably experienced: over 90% of automated health alerts are false alarms. No wonder your night manager has started ignoring them altogether!

The problem gets even worse if you’re running a grazing operation. Those sensors that work reasonably well in climate-controlled barns start acting like they’ve had too much coffee when your cows hit pasture. And don’t get me started on monitoring calves – the technology just isn’t there yet for reliable BRD detection.

But here’s the kicker – most vendors aren’t even trying to prove the economic value of their systems. They’re happy to tell you the hardware costs $75-150 per cow, but good luck getting them to show you actual ROI data from farms like yours.

Why Connected Systems Are Finally Getting Smart

Dr. David Kelton from Guelph says, “The future isn’t sensors—it’s connecting sensors.” The good news is that monitoring technology is finally growing.

Instead of relying on a single data point (like activity), the systems worth investing in for 2025 combine multiple streams – rumination patterns, temperature changes, milk data, and activity – to create a much more accurate picture. It’s like the difference between trying to diagnose a sick cow by looking at her versus doing a full workup, including temperature, auscultation, and bloodwork.

The real game-changer is what happens to all that data. Machine learning algorithms can now spot subtle patterns that precede clinical symptoms – identifying a cow heading for ketosis days before she shows any visible signs or flagging quarter-developing mastitis before SCC even spikes.

For 2025, I’d only consider systems that can show you validation data specific to your type of operation. Ask vendors point-blank: “What’s your false positive rate in operations like mine?” If they dance around the question, keep your checkbook closed.

Does Predictive Analytics Deliver ROI? The Numbers Say Yes

While improved health monitoring might save you some treatment costs, the real money is in predictive analytics applied to your core profit drivers: milk components and feed efficiency.

How Top Dairies Are Boosting Component Premiums

With milk payments increasingly tied to components rather than volume, being able to predict and optimize fat and protein is where the earnest money is.

Mid-infrared (MIR) spectroscopy is the technology used here to watch. It’s been around in milk labs for years, but the exciting development is having these sensors in your milking system. The latest research in the Journal of Animal and Plant Sciences shows these systems can predict fat, protein, and lactose percentages with R² values above 0.94 – that’s statistician-speak for “scary accurate.”

I visited Wisconsin’s Greenfield Dairy last month, and they’ve reduced feed costs by 12% using this approach. Their nutritionist gets automated alerts when components start trending down, allowing ration adjustments before – not after – the milk check takes a hit. That’s the difference between reactive and proactive management.

The Feed Cost Paradox Solved: Cut Your Biggest Expense

Here’s an uncomfortable truth: while technology can save you money, Lactanet found that 58% of farms overspend on unintegrated systems that fail to address their biggest expense – feed.

Advanced monitoring now lets you track key feed efficiency metrics without the specialized equipment previously limited to research farms:

  • Wearable sensors tracking rumination and eating patterns
  • Computer vision systems that estimate individual feed intake by analyzing bunk levels

The economic impact is substantial. According to Lactanet’s latest herd analytics report, AI-driven ration optimization can slash feed costs by 5-10% while maintaining production. On a 500-cow dairy, we’re talking $50,000-100,000 straight to your bottom line annually.

Can One Platform Unify Your Dairy Data? The Integration Revolution

If you’re like most operations I visit, you’ve got milk data in one system, feeding information in another, health records somewhere else, and sensor data scattered across multiple apps. It’s like trying to complete a puzzle when the pieces are in different rooms.

Why Your Farm Software Isn’t Talking (And What It’s Costing You)

This fragmentation isn’t just annoying – it’s expensive. Your nutritionist spends hours manually pulling reports from different systems, your vet can’t easily see the relationship between recent ration changes and health events, and you’re left to piece together the big picture from fragments.

The root cause? Lack of industry-wide standards. Different vendors use proprietary systems that don’t communicate, creating the digital equivalent of equipment requiring various fuel types.

The Central Hub Solution: One Dashboard for Everything

Integration platforms are emerging as the essential backbone of the modern dairy. Companies like Connecterra, MilkingCloud, and Topcon Agriculture’s TAP FEED are creating central hubs that pull data from all your existing systems.

Richard Reed from LH Agro (Topcon’s UK distributor) explained it perfectly: “The new features contained within the latest Horizon update demonstrate Topcon’s commitment to enabling farmers to maximize productivity, accuracy, efficiency, and safety of their operations.”

For 2025, I’d argue that investing in an integration platform might deliver more value than any single monitoring system – it unlocks the potential of everything you already have.

Does Edge Computing Work for 100-Cow Herds? Breaking the Connectivity Barrier

Let’s address the elephant in the barn: not everyone has fiber-optic internet running to their property. Nearly 30% of US farms face connectivity challenges that make cloud-dependent technologies impractical.

Processing Power at the Source: No Internet Required

Edge computing shifts data processing from the cloud to your farm – either on the devices themselves or a local server. Instead of constantly uploading raw data, the system processes information locally and only sends essential results when connectivity is available.

This approach gives you:

  • Real-time insights, even with spotty internet
  • Continued functionality during outages
  • Reduced bandwidth needs
  • Better data security

As Ever.Ag says, “With edge computing, producers can gather meaningful information from digital inputs and take immediate action – no waiting for cloud processing.”

LoRaWAN: The Rural Farm’s Connectivity Solution

For sensors in remote locations, LoRaWAN technology is a game-changer. This system can transmit data up to 15km using minimal power – perfect for monitoring distant pastures or outbuildings.

A single gateway (about $21,000) can cover your entire operation, making it economical for larger herds. The LoRa Alliance’s 2024 report confirms that “a single gateway can cover several kilometers, ideal for large farms where cellular coverage might be spotty or non-existent.”

With over 350 million LoRa devices deployed globally as of last June, this isn’t experimental technology – it’s proven and ready for dairy applications.

2025 Tech ROI Leaderboard: What’s Worth Your Investment

Let’s cut to the chase – here’s what’s delivering returns:

TechnologyAvg. Payback PeriodTop BenefitBest For
Milk Predictive Analytics8 months+$0.30/cwt milk premiumHerds >200 cows
Feed Efficiency AI7-10 months5-10% feed cost reductionAll herd sizes
Data Integration Platforms12 months5.8:1 ROI ratio on 1000-cow dairiesMulti-system farms
Edge Computing14-18 monthsEnables tech in poor connectivityRemote locations

Beyond Purchase Price: Calculate True Technology Cost

Stop focusing on sticker prices. The real cost includes:

  • Initial investment
  • Installation and integration
  • Ongoing subscriptions and maintenance
  • Training time
  • Upgrades and eventual replacement

Once you have the Total Cost of Ownership, calculate ROI using ROI (%) = (Net Profit / Total Investment) * 100

The Payback Period (Initial Investment / Annual Net Profit) tells how quickly you’ll recoup your investment. Be skeptical of vendor claims – run your numbers based on your farm’s specific situation.

Where Your Tech ROI Comes From

The profit from these investments comes from multiple sources:

  • Increased Production/Yield: Better components mean better milk checks
  • Cost Reduction: Feed savings of 5-10% go straight to your bottom line
  • Improved Quality: Lower SCC means quality premiums
  • Enhanced Efficiency: Better reproduction performance reduces replacement costs
  • Risk Mitigation: Fewer disease outbreaks mean fewer emergency vet bills

Early adopters I’ve spoken with are seeing ROI within 7-8 months, particularly with smart calf monitoring systems that have slashed mortality by up to 40%.

Your 90-Day Implementation Roadmap for Success

Buying technology is easy – implementing it successfully is where most farms stumble.

Planning Phase: Before You Buy

Do your homework:

  • Define the specific problem you’re trying to solve
  • Research options based on the ROI framework
  • Develop a comprehensive budget, including TCO
  • Check your infrastructure (power, internet, compatibility)
  • Get your team involved early – they’ll be using this daily

Implementation Phase: Making the Transition

Don’t try to change everything overnight:

  • Start with a small group of animals or one area
  • Work with qualified technicians for installation
  • Ensure proper integration with existing systems
  • Train everyone thoroughly – not just a quick overview
  • Create clear protocols for how the technology fits into daily routines

Post-Implementation Optimization: Maximizing Your Return

The work continues after installation:

  • Monitor system performance and use vendor support
  • Track your KPIs against baseline data
  • Look for additional optimization opportunities
  • Maintain data quality and security

Measuring Success: Key Performance Indicators That Matter

To know if your investment is paying off, track specific metrics:

Production and Quality Metrics

  • Energy-Corrected Milk (ECM)
  • Component yields and percentages
  • Somatic Cell Count
  • Quality premium attainment

Feed Efficiency Metrics

  • Income Over Feed Cost (IOFC)
  • Feed Conversion Ratio
  • Feed cost per unit of milk
  • Feed waste reduction

Reproductive Efficiency Metrics

  • Heat detection, conception, and pregnancy rates
  • Days open
  • Breeding cost reduction

Health and Welfare Metrics

  • Disease incidence reduction
  • Treatment cost reduction
  • Involuntary cull rate reduction

Establish baseline data before implementation, then track consistently afterward to measure the actual impact.

The Bottom Line: Strategic Priorities for 2025

The dairy tech landscape is shifting from isolated gadgets to integrated, predictive systems that deliver measurable ROI. Basic health monitoring systems are giving way to sophisticated platforms that can predict issues before they occur.

For 2025, focus your investments on:

  1. Predictive analytics for milk components and feed efficiency
  2. Integration platforms that connect your existing systems
  3. Edge computing solutions if you’re in a connectivity-challenged area

As I wrote in The Bullvine recently, “The dairy industry isn’t splitting between big and small farms anymore – it’s dividing between tech-savvy operations and those headed for extinction. Size doesn’t matter nearly as much as your willingness to evolve.”

Start your 2025 tech plan today: Audit two data silos, trial one predictive tool, and join our Tech-Tuesday webinar series for implementation templates.

The future belongs not to farms with the most sensors but to those that transform data into actionable intelligence, driving profitability and sustainability. The question isn’t whether you can afford these technologies – it’s whether you can afford to be left behind.

Key Takeaways

  • Basic health monitoring systems are being replaced by integrated sensor fusion and AI-powered predictive analytics that can identify issues before visible symptoms appear, with the most valuable applications targeting milk component optimization and feed efficiency.
  • Data silos represent a critical barrier to technology ROI—integration platforms that connect disparate farm systems (milking, feeding, health records) are becoming essential infrastructure rather than optional add-ons.
  • For farms with poor connectivity, viable solutions exist through edge computing (processing data locally) and alternative networks like LoRaWAN, making advanced technology accessible even in remote locations.
  • Successful technology implementation requires calculating the total cost of ownership, planning for integration with existing systems, comprehensive staff training, and tracking specific KPIs like Income Over Feed Cost and component yields.
  • The digital dairy of 2025 will be defined not by having the most sensors but by effectively transforming integrated data into actionable intelligence that drives profitability and sustainability.

Executive Summary

The dairy industry stands at a technological crossroads where strategic investments in integrated, predictive systems replace basic monitoring tools that often fail to deliver measurable ROI. While current Automated Health Monitoring systems frequently suffer from false positives and lack economic validation, next-generation technologies are shifting toward predictive analytics that directly impacts core profit drivers: milk composition and feed efficiency. The article reveals that the highest-value technologies for 2025 include AI-powered predictive tools for component optimization (showing ROI within 8 months), feed efficiency systems (reducing costs 5-10%), and data integration platforms that break down silos between farm systems. Success requires calculating the total cost of ownership beyond the purchase price, implementing technologies through careful planning and training, and consistently measuring specific KPIs to validate returns.

Complete references and supporting documentation are available upon request by contacting the editorial team at editor@thebullvine.com.

Learn more:

Join the Revolution!

Join over 30,000 successful dairy professionals who rely on Bullvine Weekly for their competitive edge. Delivered directly to your inbox each week, our exclusive industry insights help you make smarter decisions while saving precious hours every week. Never miss critical updates on milk production trends, breakthrough technologies, and profit-boosting strategies that top producers are already implementing. Subscribe now to transform your dairy operation’s efficiency and profitability—your future success is just one click away.

NewsSubscribe
First
Last
Consent

European Dairy Farmers Fight Back: How Trade Deals Threaten Your Market Share and What You Can Do About It

Stop waiting for trade policy salvation. EU farmers cutting losses 15% through component optimization while competitors flood markets with cheap imports.

EXECUTIVE SUMMARY: European dairy farmers are discovering that crying about unfair trade deals won’t save their operations—but strategic component optimization and technology adoption will. While Spanish farmers project €1 billion losses in 2025 from Mercosur and Ukraine import pressure, smart operators are leveraging the fact that cheese production is forecast to increase 0.6% to 10.8 million tonnes despite EU milk production declining 0.2% to 149.4 million tonnes. The uncomfortable truth: farms implementing IoT technology are achieving 5-12% efficiency gains and positioning themselves for premium cheese-quality milk markets, while their neighbors protest quotas allowing 30,000 tonnes of Mercosur cheese into EU markets. Technology adoption isn’t just about staying competitive anymore—it’s about survival in a market where every liter must generate maximum value through optimal butterfat and protein profiles. The EU’s policy shift from “Farm to Fork” to economic sustainability creates a narrow window for operations to build component leadership before import pressure peaks. Instead of hoping politicians will solve your problems, ask yourself: are you producing 4.5% butterfat milk that processors fight over, or 3.5% commodity milk headed for the blending tank?

KEY TAKEAWAYS

  • Component Wars Are Here: With cheese production increasing 0.6% while milk volume drops 0.2%, operations achieving above-average component levels (4.0%+ butterfat, 3.2%+ protein) command premium pricing that cheap imports struggle to match—delivering $120-180 more per cow annually through strategic breeding and precision feeding.
  • Technology = Survival Insurance: Farms implementing precision agriculture and IoT monitoring systems are capturing 5-12% efficiency gains while reducing health-related costs by 30%, creating competitive advantages that work regardless of trade policy changes or import quotas.
  • Policy Pivot Creates Opportunity: The EU’s strategic shift from environmental compliance to economic sustainability under the new “Vision for Agriculture and Food” provides a 2-3 year window for progressive operators to build market positioning before regulatory requirements potentially tighten again.
  • Double Standard = Competitive Edge: While European farmers face strict environmental regulations that Mercosur imports avoid, smart operations are leveraging this “burden” as a marketing advantage, using AI-powered monitoring systems to document quality advantages that consumers and processors increasingly demand.
  • Protest Politics vs. Profit Strategy: Spanish farmers projecting €1 billion losses are learning that waiting for blocking minorities against trade deals wastes time—meanwhile, operations investing in component optimization and technological efficiency are building resilience that survives any import pressure or policy change.
European dairy farming, dairy competitiveness, precision agriculture, milk component optimization, dairy technology adoption

European dairy farmers are facing an unprecedented challenge as massive trade agreements flood their markets with cheaper imports produced under lower standards. While EU milk production is forecast to decline 0.2% in 2025 to 149.4 million tonnes (European Union: Dairy and Products Annual), new quotas allow 30,000 tonnes of Mercosur cheese and 10,000 tonnes of milk powder into European markets at reduced tariffs. With cheese production forecast to increase 0.6% to 10.8 million tonnes despite declining milk supplies (EU Dairy Production Falls as Brussels Pivots from Farm to Fork to New Vision), the question isn’t whether this will impact your operation—it’s how quickly you’ll adapt to survive the component wars ahead.

Why Are European Dairy Farmers Taking to the Streets?

Here’s the uncomfortable truth the industry doesn’t want to discuss: European farmers aren’t just protesting trade policy—they’re fighting against a rigged game where they’re forced to play by premium rules while competing against commodity pricing.

French and Spanish farmers aren’t protesting just for the headlines. They’re fighting for their economic survival against what they see as a fundamentally unfair system that demands premium standards from European operations while opening the floodgates to imports produced under dramatically different rules.

Spanish farmers alone project losses of €1 billion in 2025, largely attributed to trade agreements that have driven prices below sustainable production costs. But here’s what the agricultural establishment won’t tell you: this isn’t just about short-term market disruption—it’s about a systematic dismantling of the European dairy industry’s competitive foundation.

Imagine you’re running a high-SCC penalty system where European farms get docked for anything above 200,000 cells/mL while imports face no somatic cell count requirements. That’s essentially what’s happening with environmental and welfare standards across these trade deals.

But why is this happening now? The answer reveals a fundamental flaw in how European policymakers think about agriculture. They’ve created a regulatory environment that treats farming like manufacturing—optimizing for compliance rather than competitiveness.

According to industry analysis, implementing the European Green Deal could reduce cattle output by 10-15%, with farm revenues varying significantly by region (How the European Green Deal Affects Dairy Farmers). While some farms may see revenue increases, others will face substantial decreases due to regional restrictions and varying CAP fund distributions.

Jean-Michel Schaeffer, head of French poultry industry group Anvol, summed up the core frustration: “Our demands are simple: reciprocity of rules, traceability abroad, and much clearer labeling.” It’s not about protectionism—it’s about fair competition.

What Does the EU-Mercosur Deal Mean for Your Dairy Operation?

Let’s cut through the political rhetoric and focus on the concrete impacts heading your way. The EU-Mercosur agreement, finalized in December 2024, creates specific import quotas that will directly affect your market positioning.

The Dairy-Specific Damage

Here’s the reality nobody wants to discuss: the cheese quota system is designed to fail European producers. The agreement establishes a 30,000-tonne quota for Mercosur cheeses entering EU markets, with gradual tariff reductions from current 28% levels over 10 years, starting with 3,000 tonnes initially.

Milk powder operations face an even bleaker scenario. Quotas expand from 1,000 to 10,000 tonnes over the implementation period, achieving tariff-free status at the end of the 10-year timeline. Considering that EU milk powder exports to major markets declined 20% between January-August 2024 versus 2023, you’re looking at a perfect storm of shrinking export opportunities and increased import competition.

Here’s what the dairy-specific quotas look like:

ProductQuota VolumeTariff ReductionImplementation Timeline
Cheese30,000 tonnes (starting 3,000)From 28% to zero10-year phase-in
Milk Powder1,000 to 10,000 tonnesTo zero tariff10-year phase-in
Infant FormulaVolume unspecified18% reductionImmediate implementation

Why This Matters for Your Operation: These quotas represent more than market access—they’re changing the competitive landscape for component-rich products. The conventional wisdom that European quality commands premium pricing is about to be tested like never before.

How Are Environmental Regulations Creating a Double Burden?

Here’s where conventional dairy industry thinking falls apart completely. The European Green Deal isn’t just an environmental policy—it’s accidentally become the most effective trade protection dismantling mechanism in EU history.

Following the Green Deal requirements could reduce cattle output by 10-15%, with significant variations in farm revenues depending on regional restrictions and CAP fund variations (How the European Green Deal Affects Dairy Farmers). The costs of additional environmental measures represent significant economic considerations for dairy farmers, while imports face no such requirements.

You’re being asked to meet increasingly strict environmental standards while competing against imports without such requirements. These environmental compliance costs aren’t just regulatory boxes to check—they’re substantial cost centers that directly impact your bottom line.

Think of it like this: It’s like running a precision feeding program that optimizes dry matter intake (DMI) to 24 kg/day for maximum metabolizable energy (ME) efficiency while your competitors dump whatever’s cheapest in the feed bunk. Your milk yield per cow might be higher, but their cost per hundredweight crushes yours.

Meanwhile, Mercosur producers operate entirely under different rules. They can use production methods that are restricted or banned in European operations, including GMO feeds and growth promoters. You’re literally being forced to compete with one hand tied behind your back.

But here’s the question nobody’s asking: Why did European policymakers create this system in the first place? The answer reveals a fundamental misunderstanding of how global agricultural markets actually work.

Spanish farmer leader Javier Fatas captured this perfectly: “This happens because of trade deals signed by Spain and the EU as part of geopolitics, bringing us prices too low to sustain our farms.”

The Ukraine Complication: Market Disruption in Real Numbers

The EU’s trade relationship with Ukraine has undergone significant changes that directly impact dairy markets. Following the expiration of the duty-free regime on June 6, 2025, new quotas have been reinstated for Ukrainian agricultural products (European Commission approves quotas for Ukrainian agricultural products).

The specific dairy-related quotas for the remainder of 2025 include:

  • Milk and cream: 5,833 tonnes (from annual 10,000 tonnes)
  • Dry milk: 2,917 tonnes (from annual 5,000 tonnes)
  • Butter: 1,750 tonnes (from annual 3,000 tonnes)

Ukraine could face an estimated loss of $800 million in export revenue for the remainder of 2025 due to these reinstated quotas. However, the damage to European farmers occurred during the period of full liberalization, when Ukrainian products flooded markets with minimal restrictions.

Why This Matters for Your Operation: The initial flood of Ukrainian dairy products during the emergency liberalization period created market disruptions from which neighboring EU farmers are still recovering. Even with quotas back in place, the market memory of that pricing pressure lingers.

Strategic Positioning: How Top Performers Are Adapting

While the trade environment presents challenges, smart dairy operations are already adapting their strategies. But here’s what the industry consultants won’t tell you: the conventional “premium positioning” approach is about to become irrelevant.

Component Optimization: The New Profit Strategy

Despite declining milk production (forecast down 0.2% to 149.4 million tonnes), cheese production is forecast to increase 0.6% to 10.8 million tonnes in 2025 (European Union: Dairy and Products Annual). This shift toward high-value products represents a strategic opportunity for operations willing to invest in specialized production capabilities.

Here’s the uncomfortable truth about component optimization: Most European dairy farmers still think like volume producers in a component world. EU processors are carefully deciding which products to prioritize with available milk supplies, with cheese remaining the primary output goal supported by solid domestic consumption and continued export demand.

This strategic product allocation comes at the expense of butter, non-fat dry milk (NFDM), and whole milk powder production (European Union: Dairy and Products Annual). Smart farmers need to align their production strategies with these processor priorities.

Technology Investment for Efficiency

Here’s where conventional wisdom about technology adoption gets dangerous. With margins under pressure, operational efficiency becomes critical. Technology adoption, including IoT collars and AI milk analyzers, offers 5-12% efficiency gains, helping offset declining cow numbers (EU Dairy Production Falls as Brussels Pivots from Farm to Fork to New Vision).

But here’s what the equipment dealers won’t tell you: Most farms implement technology without understanding the data it generates. The farms that will thrive aren’t just adopting technology—they’re fundamentally using it to rethink their operational philosophy.

Why This Matters for Your Operation: Lower milk production is expected to be only partially offset by lower fluid milk consumption (projected to decrease 0.3% to 23.5 million tonnes in 2025) (European Union: Dairy and Products Annual). This means every liter of milk must generate maximum value through optimal component profiles and efficient production systems.

Policy Response: From Stick to Carrot

Responding to widespread farmer protests, European policymakers have dramatically shifted their approach. The European Commission has replaced its Farm to Fork strategy with a new “Vision for Agriculture and Food” that shifts emphasis from environmental requirements toward economic sustainability, resilience, and simplification (EU Dairy Production Falls as Brussels Pivots from Farm to Fork to New Vision).

This represents a fundamental change in agricultural policy philosophy—moving from “stick to carrot” and “green to lean” approaches prioritizing farm economic viability alongside environmental goals.

But here’s the critical question: Why are European farmers depending on policy solutions instead of building competitive advantages that work regardless of trade policy?

The Vision for Agriculture and Food explicitly emphasizes economic sustainability rather than environmental compliance as the primary driver, marking a clear departure from previous Farm to Fork priorities. However, policy changes alone won’t solve European dairy’s structural competitive challenges.

What This Means for Your Operation’s Future

Here’s the strategic reality the dairy industry doesn’t want to discuss: European dairy farming is entering a new era where traditional competitive advantages no longer guarantee survival.

Immediate Actions You Can Take

Audit your component profile now. With cheese production prioritized despite declining milk supplies, understanding your butterfat and protein percentages becomes critical for strategic decision-making. Operations achieving above-average component levels can command premium pricing that imports struggle to match.

But here’s the critical question: How many European farmers actually know their true component costs versus volume costs?

Implement precision feeding protocols. Optimize dry matter intake and metabolizable energy levels to maximize component production. With technology offering 5-12% efficiency gains, precision feeding systems deliver proven ROI through reduced waste and improved milk composition.

Focus on cheese-quality milk production. Since processors prioritize cheese production (up 0.6% despite milk constraints), positioning your operation to supply high-quality cheese milk provides a competitive advantage and pricing premiums.

Long-Term Strategic Considerations

Technology adoption becomes non-negotiable. The efficiency gains from modern dairy technology aren’t optional luxuries—they’re survival requirements in a more competitive environment.

Here’s the strategic question every European dairy farmer must answer: Will you invest in becoming data-driven, or will you hope that traditional methods somehow remain competitive?

Consider this perspective: Just like transitioning from visual heat detection to activity monitoring collars, adapting to new trade realities requires embracing technology and data-driven decision making rather than hoping traditional methods will suffice.

The Bottom Line

European dairy farmers face their most challenging competitive environment in decades. With EU milk production declining 0.2% to 149.4 million tonnes while cheese production increases 0.6% to 10.8 million tonnes (European Union: Dairy and Products Annual), the farms that thrive will be those who stop waiting for policy solutions and start building component optimization and operational efficiency advantages that work in any competitive environment.

The protest movement across France and Spain represents more than frustration—it’s a wake-up call that traditional European dairy farming approaches are no longer sustainable in a global market. Whether through policy changes or market adaptation, the industry must find ways to ensure that high-standard production becomes economically advantageous, not just morally superior.

The EU-Mercosur deal’s 30,000-tonne cheese quota and 10,000-tonne milk powder quota, combined with reinstated Ukrainian quotas of 5,833 tonnes for milk/cream and 2,917 tonnes for dry milk, represent fundamental shifts in competitive dynamics that require an immediate strategic response.

Here’s your strategic challenge: While your competitors protest trade policies, will you build a component-optimized, technologically advanced operation that can compete regardless of import pressure?

Take action now: Evaluate your component profile using precision testing, identify your competitive advantages through systematic data collection, and start building the operational resilience you’ll need to thrive in Europe’s changing dairy landscape. The farmers who wait for policy solutions will be the ones struggling to survive when the full impact hits their bottom line.

Here’s the final uncomfortable truth: You can either be the operation producing premium cheese-quality milk that processors fight over or the one producing commodity milk that gets relegated to lower-value products. The choice you make today determines which category you’ll occupy when import pressure peaks.

Your decisive moment is now: Are you ready to embrace component optimization, technological efficiency, and data-driven management strategies that successful farms worldwide are already implementing, or will you continue hoping that traditional approaches will somehow compete against operations using every technological advantage available?

The data provides the roadmap. Your response determines whether you’ll lead or follow in European dairy’s rapidly evolving competitive landscape.

Ready to transform your operation? Start with a comprehensive component analysis and technology audit. The farms implementing these strategies today will be the industry leaders tomorrow—while those waiting for easier times may find themselves waiting forever.

Learn More:

Join the Revolution!

Join over 30,000 successful dairy professionals who rely on Bullvine Weekly for their competitive edge. Delivered directly to your inbox each week, our exclusive industry insights help you make smarter decisions while saving precious hours every week. Never miss critical updates on milk production trends, breakthrough technologies, and profit-boosting strategies that top producers are already implementing. Subscribe now to transform your dairy operation’s efficiency and profitability—your future success is just one click away.

NewsSubscribe
First
Last
Consent

2025 Dairy Market Reality Check: Why Everything You Think You Know About This Year’s Outlook is Wrong

Stop chasing milk volume. Component revolution delivers 1.65% production gains while volume drops 0.35%. Smart farmers capture $8B opportunity.

 2025 dairy market outlook, milk component optimization, dairy profitability strategies, FMMO reforms impact, dairy export opportunities

Here’s the brutal truth: While industry cheerleaders point to modest growth forecasts, they’re missing a seismic shift that’s rewriting the rules of dairy profitability. The component revolution creates winners and losers overnight, policy chaos reshapes margins, and most farmers are still making decisions based on yesterday’s playbook.

The Numbers Game Everyone’s Getting Wrong

Let’s cut through the feel-good industry reports and look at what’s really happening. The U.S. dairy sector is projected to produce 226.9 billion pounds of milk in 2025—a modest 0.5% increase that sounds like business as usual. But here’s what those vanilla forecasts don’t tell you: we’re witnessing the death of volume-based thinking.

While total milk production crawls forward, butterfat production exploded 3.4% year-over-year in the first quarter of 2025. Think about that for a second. Your cows aren’t just making more milk—they’re making fundamentally different milk. The average U.S. butterfat test hit 4.36% in March 2025, up nearly nine basis points from last year. Protein tests climbed to 3.38%.

These aren’t just statistics—they’re profit opportunities most farmers haven’t figured out how to capture.

Despite a 0.35% decline in total milk production year-to-date through March, calculated milk solids production increased 1.65%. Your operation is becoming a component factory, and the old milk check calculations no longer reflect true value.

The Price Forecasting Disaster

Here’s where it gets interesting—and concerning. USDA’s all-milk price forecasts have been all over the map. February projections started at $22.60 per hundredweight and dropped to $21.60 in March, with some analysts citing figures as high as $22.75.

That level of volatility in official forecasts within months? That’s not market analysis—that’s educated guessing in a fundamentally changed environment.

Class III Price Comparison: USDA Forecast Revisions

MonthClass III Forecast ($/cwt)Revision Direction
February 2025$19.10Baseline
March 2025$17.95Down $1.15
April 2025$17.60Down $1.50 from Feb

Source: University of Wisconsin Extension, USDA reports

The problem? These forecasts assume traditional milk composition and processing patterns. What happens when the underlying milk supply has fundamentally different economics? The models break down.

The Policy Earthquake Nobody Prepared For

While farmers debate whether milk will hit $22 or $23, Federal Milk Marketing Order reforms taking effect June 1st are reshaping the entire game.

The return to “higher-of” Class I pricing will put more money in the pool, but updated make allowances for cheese ($0.2519/lb), butter ($0.2272/lb), and nonfat dry milk ($0.2393/lb) will initially lower Class III and IV prices.

Here’s the kicker: These changes create regional winners and losers overnight. Farmers in high Class I utilization areas win. Those in manufacturing regions? You’re about to subsidize everyone else.

But the real earthquake is trade policy uncertainty. Research from the University of Wisconsin shows that 25% retaliatory tariffs could:

  • Reduce all-milk prices by $1.90 per hundredweight
  • Decrease U.S. dairy export values by $22 billion over four years
  • Drop Class III prices by $2.86 per hundredweight

With Mexico, Canada, and China accounting for 40% of U.S. dairy export value, those aren’t just statistics—they’re survival numbers.

The $8 Billion Processing Revolution

Here’s a fact that should change how you think about 2025: The U.S. dairy industry has more than $8 billion in processing infrastructure investment happening right now.

Major Processing Investments Creating Demand

CompanyInvestmentLocationCapacity Impact
Walmart$350 millionTexasNew distribution hub
Fairlife$650 millionNew YorkFluid milk expansion
Chobani$1.2 billionNew YorkYogurt/processing

Source: University of Wisconsin Extension analysis

This isn’t just expansion—it’s demand creation that will compete for your milk. Much of this new capacity focuses on cheese production, increasing Class III utilization and eventually pressuring prices as more products hit the market.

Smart farmers are already positioning themselves as strategic suppliers rather than replaceable inputs.

The Component Revolution Most Are Missing

Forget everything you think you know about milk pricing. Despite overall production declining 0.35% year-to-date, milk solids production jumped 1.65% through March 2025.

The updated FMMO composition factors taking effect December 1st will reward farmers producing milk with 3.3% protein and 6.0% other solids. If you’ve been investing in genetics and nutrition to boost components, you will get paid for it. If you haven’t? You’re financing those who have.

Component Performance Reality Check:

  • 2020 average butterfat: 3.95%
  • 2025 average butterfat: 4.36% (+0.41 percentage points)
  • 2020 average protein: 3.181%
  • 2025 average protein: 3.38% (+0.199 percentage points)

This isn’t a gradual change—it’s a fundamental shift in what your cows produce and how you get paid for it.

Export Markets: The Hidden Opportunity

While everyone worries about domestic policies, U.S. cheese exports are crushing it. January 2025 dairy export values surged 20% year-over-year to a record $714 million, driven by butterfat exports up 41%.

Key Export Performance Indicators:

Product CategoryJanuary 2025 PerformanceDriver
Butter exports+41% year-over-yearPrice competitiveness
Anhydrous milkfat+525% year-over-yearGlobal demand
Total export value$714 million (record)Component focus

Source: University of Wisconsin Extension, USDA trade data

U.S. butter prices in May 2025 were $2.33 per pound compared to EU prices of $3.75 and Oceania at $3.54. That’s not a small edge—it’s a massive competitive advantage.

But here’s the catch: exports of nonfat dry milk dropped 20% in January and 28% in February. The winners are those aligned with component-rich products. The losers are stuck in commodity thinking.

Risk Management in the New Reality

Traditional risk management is failing because it’s built on assumptions that no longer exist. Historical models become dangerous when trade policies can slash prices overnight and component premiums reshape milk values.

What Actually Works:

Dairy Margin Coverage Performance: From 2018-2024, DMC issued payments in 66.7% of months, averaging $1.35/cwt after premiums. That’s solid catastrophic protection, but it won’t capture upside opportunities.

Component-Based Strategy: Instead of hedging milk prices, hedge component values. Lock in fat and protein premiums when markets favor them.

Processor Relationship Management: Your biggest risk isn’t market volatility—it’s being replaceable. Processors with expanding capacity need reliable suppliers who deliver consistent quality and components.

Labor Crisis: The Hidden Threat

Labor accounts for 25% of total dairy farm operating costs, and proposed immigration policies that reduce non-U.S. worker availability could increase wage costs by 20% and cause a 10% productivity decline.

Do the math: For operations with $2 million in annual costs, that’s a $100,000 yearly increase plus productivity losses. Research shows this could reduce net farm operating income by $64,482 annually—a 30.9% reduction.

Smart operations already invest in automation, employee retention programs, and cross-training systems.

The Global Chess Game

While U.S. farmers focus domestically, global moves are setting up 2025 opportunities. China’s domestic milk production is forecast to decline 2.6% year-over-year—the second consecutive year of reduced output.

EU cheese prices are up 19% year-over-year in early 2025 as processors prioritize high-value products amid constrained milk supplies. New Zealand production is expected to increase by 1.2%, but U.S. geographic advantages for North American markets remain strong.

The strategic question isn’t whether global markets will grow—it’s whether you’re positioned to capture that growth through the right processor relationships and component optimization.

Why 2025 Separates Winners from Survivors

The conventional wisdom is wrong. 2025 isn’t a stable, moderately profitable year. It’s a pivot point that will separate strategic operators from reactive farmers.

Winners will:

  • Understand milk as a portfolio of components, not a commodity
  • Build processor relationships based on strategic value delivery
  • Invest in genetics and nutrition for component optimization
  • Implement risk management accounting for policy volatility
  • View sustainability as a competitive positioning

Survivors will:

  • Focus on volume over components
  • Compete primarily on cost
  • Rely on outdated risk management tools
  • View policy changes as external threats

The Bottom Line

The dairy industry is transforming faster than most farmers realize. Component economics is replacing volume thinking. Processor relationships are becoming strategic partnerships. Policy volatility is the new normal.

The opportunities are massive for farmers willing to challenge conventional wisdom and implement strategic changes:

Immediate Actions (Next 30 Days):

  • Audit current component production against new FMMO factors
  • Evaluate processor relationships for component premium potential
  • Enroll in appropriate risk management considering policy risks

Strategic Positioning (3-12 Months):

  • Develop component-focused breeding and nutrition programs
  • Build relationships with processors investing in new capacity
  • Implement sustainability practices with immediate ROI

The question isn’t whether the dairy industry will change—it’s whether you’ll lead that change or be forced to follow it.

Your move.

KEY TAKEAWAYS

  • Component Production Surge Creates Profit Opportunities: Milk solids production increased 1.65% while total volume dropped 0.35%, with average butterfat tests reaching 4.36% and protein hitting 3.38%—farmers optimizing genetics and nutrition for components position for FMMO reform premiums starting December 1st
  • $8+ Billion Processing Investment Wave Rewards Strategic Suppliers: Major facilities from Walmart ($350M), Fairlife ($650M), and Chobani ($1.2B) create 55 million pounds daily capacity through 2026, with cheese-focused plants offering component premiums to reliable, high-quality milk producers
  • Export Market Competitive Advantage Through Component Focus: U.S. butter exports jumped 41% and cheese hit record levels in early 2025 due to price competitiveness (U.S. butter $2.33/lb vs. EU $3.75/lb), while nonfat dry milk exports dropped 20-28%—proving component-rich products drive profitable export growth
  • Policy Shock Protection Requires Multi-Layered Risk Management: Potential trade retaliation could slash all-milk prices $1.90/cwt while FMMO reforms initially reduce Class III prices—smart operations combine Dairy Margin Coverage (66.7% payout history), component-based contracting, and processor relationship management beyond traditional hedging
  • Labor Crisis Demands Technology Investment: With labor representing 25% of operating costs and potential 20% wage increases from immigration policy changes, operations investing in automation, cross-training, and retention programs gain sustainable competitive advantages worth $64,482 annually in preserved profitability

EXECUTIVE SUMMARY

The dairy industry’s obsession with milk volume is costing farmers millions while the component revolution reshapes profitability overnight. Despite total milk production declining 0.35% year-to-date, calculated milk solids production surged 1.65% through March 2025, with butterfat tests hitting 4.36%—up nearly nine basis points from last year[1]. While industry cheerleaders point to USDA’s .75/cwt forecasts, they’re missing the + billion processing investment tsunami creating demand for component-rich milk and regional winners overnight[1]. Federal Milk Marketing Order reforms taking effect June 1st will reward farmers producing 3.3% protein and 6.0% other solids, while penalizing volume-focused operations who’ll subsidize those capturing component premiums. Trade policy uncertainty threatens $1.90/cwt price reductions if retaliatory tariffs hit the 40% of U.S. dairy exports going to Mexico, Canada, and China. Progressive farmers who shift from volume thinking to component optimization, build strategic processor relationships, and implement policy-shock risk management will separate themselves from reactive competitors in 2025’s transformed dairy economy.

Learn More:

Join the Revolution!

Join over 30,000 successful dairy professionals who rely on Bullvine Weekly for their competitive edge. Delivered directly to your inbox each week, our exclusive industry insights help you make smarter decisions while saving precious hours every week. Never miss critical updates on milk production trends, breakthrough technologies, and profit-boosting strategies that top producers are already implementing. Subscribe now to transform your dairy operation’s efficiency and profitability—your future success is just one click away.

NewsSubscribe
First
Last
Consent

Spring Pasture Powerplay: Balancing Grazing Efficiency with Milk Component Goals

Spring pastures can slash profits—discover how to protect your milk check with innovative grazing strategies.

So, we’re heading into that critical time of year again when dairy farmers across the Northern Hemisphere face one of their biggest seasonal challenges. You know what I’m talking about – that tricky transition from winter housing to spring pastures. It’s fascinating how about 63% of grazing farms are scrambling to adjust their feeding programs. And while there is tons of advice for barn-feeding systems, what about the 41% of dairy farms running grass-based operations?

The stakes are pretty high, too. I was shocked when I learned that milk component depression during this period can cost between $0.18 and $0.32 per hundredweight in quality premiums. That’s real money walking out the door during what should be your most profitable season!

Spring Pasture Pitfalls: Why Your Herd’s Profitability Is Bleeding

The spring transition typically hits in April and May, though timing varies depending on where you are and what Mother Nature decides to throw at us this year. Some lucky folks in drier regions might start early in February, while organic operations often kick off around mid-April when conditions look decent.

Young spring forage differs from winter rations; it’s a metabolic minefield! With lower structural fiber and higher sugar concentrations, this lush grass creates faster digestion rates that can wreck your cows’ rumen pH—Have you ever seen what happens when those elevated levels of unsaturated fats interfere with normal rumen biohydrogenation? It’s not pretty. These fatty acid intermediates actively block milk fat synthesis, and before you know it, your butterfat yield is down by up to 50%. It’s not just a nuisance – it’s a profit vampire sucking your milk check dry.

And don’t get me started on the moisture content! Early spring pastures often hit 75-85% moisture, limiting dry matter intake and creating nutritional chaos. This perfect storm of high moisture, high sugars, and low fiber increases the risk of sub-acute rumen acidosis – what I call “stealth rumen burnout” – that cripples production and decimates both protein and butterfat.

You might wonder – is your spring grazing plan funding your vet’s vacation home? Those lush pastures often pack elevated levels of rumen degradable protein that, when not efficiently utilized, spikes blood urea nitrogen levels. Next thing you know, you’re dealing with body condition issues, fertility problems, and hoof health nightmares. And don’t forget the mineral imbalances! Spring forages are typically potassium-rich but magnesium-poor, setting your herd up for grass tetany risks.

5 Proven Grazing Strategies That Work

Successfully balancing grazing efficiency with milk component goals starts with a gradual transition. Give your cows 2-3 weeks to adapt – think of it as retooling a factory. Skip this step, and your cows’ gut microbes go on strike! Start with just a few hours of daily grazing while offering dry hay. This provides adequate fiber to keep those rumen bugs happy until they adjust to the new menu.

Implementing rotational grazing isn’t just a good idea – it’s a game-changer. I’ve seen farms divide pastures into smaller paddocks and move cows every 12-24 hours with excellent results. This approach increases grass utilization by about 20% compared to continuous grazing. That’s a free feed! For early spring, graze cool-season pastures relatively closely, leaving about 2 inches of stubble to encourage tillering. Those side shoots will significantly boost your forage availability later in the season.

Do This Now: Walk your pastures tomorrow—if residuals are below 4 cm, slam the brakes on grazing and buffer-feed STAT.

Table: Optimal Grazing Heights for Pasture Health

Forage TypeBegin Grazing HeightPost-Grazing ResidualKey Benefit
Perennial Ryegrass8-10 cm (3-4″)4-5 cm (1.5-2″)Maintains tillering & regrowth
Tall Fescue15-20 cm (6-8″)5-7 cm (2-3″)Prevents stem dominance
Legume Mixes15-25 cm (6-10″)7-10 cm (3-4″)Protects crown for regrowth

You’ll also want to maintain appropriate pre-grazing covers, especially during that second grazing round. Research shows a minimum threshold of 1600kg of dry matter per hectare ensures your cows have access to nutrient-rich sward that supports high dry matter intake. And whatever you do, don’t over-fertilize young grass in spring – you’ll just make the milk fat depression risk worse by creating even lower-fiber, faster-digesting forage.

Myth: Taller grass = better nutrition. Reality: Lush grass over 6 inches tall is a sugar bomb—it’ll crater your rumen pH faster than a Netflix binge.

Unlock Hidden Profits with Regenerative Grazing Approaches

Regenerative grazing isn’t some hippie trend – it’s a profit multiplier! I like to think of soil as your retirement account: diverse roots equal compound interest for your forage. The core principles focus on building soil health and enhancing ecosystem resilience, ultimately improving forage quality and quantity.

I’ve seen excellent results when farms implement rotational grazing with extended rest periods, allowing for complete plant regeneration and more profound root development. Plant diversity within pastures is crucial – different species have varying root depths and nutrient uptake abilities, creating more balanced nutrient cycling in the soil. These diverse root structures improve soil structure and porosity, enhancing water infiltration when needed most in spring.

A buddy of mine in Wisconsin told me, “Rotational grazing cut my feed costs by 30%—it’s like printing money in your paddocks.” And he’s not exaggerating!

Table: Regenerative Grazing Impact on Milk Components

PracticeMilk Fat ChangeMilk Protein ChangeFeed Cost ReductionStudy Duration
10-12 Day Rotations+0.22%+0.12%18-22%2-Year Trial
Diverse Species Mix+0.35%+0.18%25-30%3-Year Study
Strategic Rest Periods+0.15%+0.10%15-20%5-Year Analysis

Regenerative practices positively influence dry matter intake through several mechanisms. Grazing forages at their mid-stage maturity offers the optimal balance of protein, energy, and mineralization to support milk fat synthesis. The improved health and nutrient density of forage from regenerative systems enhances palatability, so cows simply eat more voluntarily.

The research I’ve seen suggests that milk from cows grazing on diverse, regeneratively managed pastures contains higher concentrations of beneficial fatty acids and antioxidants. At Winrock International, studies show that implementing regenerative grazing can boost milk production per cow by 40 to 65% through improved forage digestibility. That’s not incremental improvement – that’s transformational!

4 Supplement Strategies That Rescue Milk Components Fast

Let’s be clear – supplementation isn’t just an expense; it’s an investment with measurable returns during the spring transition. Given the wild variability in spring pasture nutrition, strategic supplementation bridges those gaps and ensures a more consistent diet. Early spring grass is protein-rich but typically provides insufficient energy and fiber for high-producing cows, creating imbalances that smart supplementation can fix.

Rumen-protected amino acids (RPAAs) are my go-to targeted strategy for grazing dairy cows. Methionine and lysine are usually the first limiting amino acids in pasture-based diets. Even with adequate protein intake, deficiencies in these specific amino acids can limit milk production and component synthesis. RPAAs bypass rumen degradation and deliver these essential nutrients directly to the small intestine, with numerous studies showing improvements in milk protein synthesis, overall yield, and often enhanced milk fat content.

Table: Rumen-Protected Fat ROI Analysis (2025 Data)

Supplement TypeMilk Yield IncreaseFat % IncreaseROI at 35pplBreak-Even Period
High-C16 (Mega-Fat 88)1.8 L/day+0.25%49%63 Days
Calcium Salts (Megalac)2.1 L/day+0.35%83%42 Days
Ground Corn1.2 L/day-0.10%28%85 Days

Field observations from European dairy farms show that implementing feeding strategies to minimize milk fat depression can increase milk fat content by 0.14 to 0.40 percentage points. That translates to additional income between 0.28 and 1.07 € per cow daily. For a 100-cow herd over a two-month spring transition period, we’re talking about additional profit ranging from 1664 € to over 6000 €. This isn’t pocket change—serious money left in the field!

Balancing energy and protein intake is critical when supplementing grazing dairy cows during spring. With early spring grass containing high protein but low structural fiber, you need adequate energy supplementation to optimize rumen fermentation. Interestingly, simple energy supplements like ground corn can sometimes be more economically efficient than fancy high-protein commercial concentrates, mainly when your pasture already provides plenty of protein.

Revolutionary Drone Technology That Transforms Pasture Management

Pasture monitoring drones aren’t just fancy toys—they’re profit-maximizing tools that transform guesswork into precision management. I was skeptical initially, but now I’m a convert after seeing them in action! Drones with various sensors provide high-throughput imagery that estimates canopy cover across your entire grazing area. This aerial perspective lets you determine forage utilization patterns that would take hours to assess on foot.

One of the most remarkable applications is getting real-time estimates of pasture dry matter. Drones with high-resolution RGB and multispectral sensors capture detailed images that specialized software converts into pasture height, density, and biomass estimates. Different analytical methods convert this imagery into dry matter estimations, including NDVI calculations and sophisticated machine learning models. The accuracy is impressive – some studies report coefficients of determination (R²) as high as 0.94!

The practical benefits extend beyond simple pasture assessment. The real-time data enables more informed decisions about when to move cattle to new paddocks or whether supplemental feeding is necessary. Drones can also help with herd inspection, locating strays, monitoring estrus signs, observing calving, and checking water sources. All tasks become more challenging when cows transition from winter housing to expansive spring pastures.

8 Spring Pasture Profit Commandments Every Dairy Farmer Must Follow

  1. Transition Gradually: Implement a 2-3 week adaptation period, starting with 2-3 hours of daily grazing while offering dry hay.
  2. Rotate Aggressively: Divide pastures into paddocks and move cows every 12-24 hours in early spring to prevent overgrazing and maintain forage quality.
  3. Monitor Components Daily: Track milk fat and protein percentages as your early warning system—a 0.2% drop in fat should trigger immediate intervention.
  4. Buffer Feed Strategically: Provide 3-5 pounds of adequate fiber (long-stem hay) before turnout to stabilize rumen pH and prevent acidosis.
  5. Supplement Smart: Add rumen-protected methionine at 15-20 grams per cow daily to support milk fat synthesis during the first 4-6 weeks of spring grazing.
  6. Measure Pasture Weekly: Use a rising plate meter or drone technology to quantify available dry matter and adjust rotation schedules accordingly.
  7. Diversify Pastures: Incorporate legumes and deep-rooted forbs to improve nutrient cycling, drought resistance, and overall forage quality.
  8. Manage Minerals: Supplement magnesium at 50-60 grams per cow daily to prevent grass tetany during the first month of spring grazing.

The Ultimate Spring Grazing Decision: Profit or Loss?

Successfully navigating the spring pasture transition is one of the biggest challenges we face as dairy farmers trying to balance grazing efficiency with milk component goals. Everything we’ve covered points to the need for a holistic approach that integrates careful grazing management, strategic nutrition, and innovative technology adoption.

The economic implications are enormous. Milk component depression costs between $0.18 and $0.32 per hundredweight in quality premiums. But flip that around – well-managed pasture-based systems can achieve economic efficiency that rivals or exceeds confinement operations through lower feed costs and optimized resource utilization.

So, here’s my question: Will you keep hemorrhaging milk solids or pivot to profit? The clock’s ticking—spring waits for no farmer.

Takeaway Toolkit: Implement These Actions Today

  • Measure pasture DM daily—if it’s under 20%, supplement with 3 lbs. starch/cow
  • Track milk components twice weekly—respond immediately to any downward trend
  • Implement 12-hour paddock moves during the first 3 weeks of spring grazing
  • Supplement magnesium oxide at 2 oz/cow/day during the first month on pasture
  • Maintain post-grazing residual of 4-6 cm to optimize regrowth quality
  • Consider drone technology for more precise pasture management decisions

Executive Summary

Spring pasture transition poses significant challenges for dairy farmers, with milk component depression risking $0.18–$0.32/cwt in lost premiums. Rapidly growing, nutrient-imbalanced grass disrupts rumen health, slashing up to 50% of butterfat yields. Success hinges on gradual herd adaptation (2–3 weeks), rotational grazing to boost forage use by 20%, and strategic supplements like rumen-protected amino acids to rescue milk components. Regenerative practices enhance soil health and milk quality, while drones provide real-time pasture data for precision decisions. Farmers can turn spring’s risks into profitable opportunities by balancing these strategies.

Key Takeaways

  • Gradual transition (2–3 weeks) prevents rumen shock and maintains milk fat/protein levels
  • Rotational grazing boosts pasture yield by 20% and extends grazing seasons through strategic paddock management
  • Targeted supplements (e.g., methionine/lysine) increase milk fat by 0.14–0.40%—adding €1,664–6,000/100 cows over 2 months
  • Regenerative grazing diversifies pastures, cuts feed costs by 15–30%, and improves milk’s nutritional profile
  • Drone tech delivers 94% accurate biomass data, enabling smarter grazing rotations and healthier herds

Learn more:

Join the Revolution!

Join over 30,000 successful dairy professionals who rely on Bullvine Daily for their competitive edge. Delivered directly to your inbox each week, our exclusive industry insights help you make smarter decisions while saving precious hours every week. Never miss critical updates on milk production trends, breakthrough technologies, and profit-boosting strategies that top producers are already implementing. Subscribe now to transform your dairy operation’s efficiency and profitability—your future success is just one click away.

NewsSubscribe
First
Last
Consent
Send this to a friend