Beef‑on‑dairy made your calf cheque bigger. Did it also steal 29 heifers and $86K–$119K from your next two years?
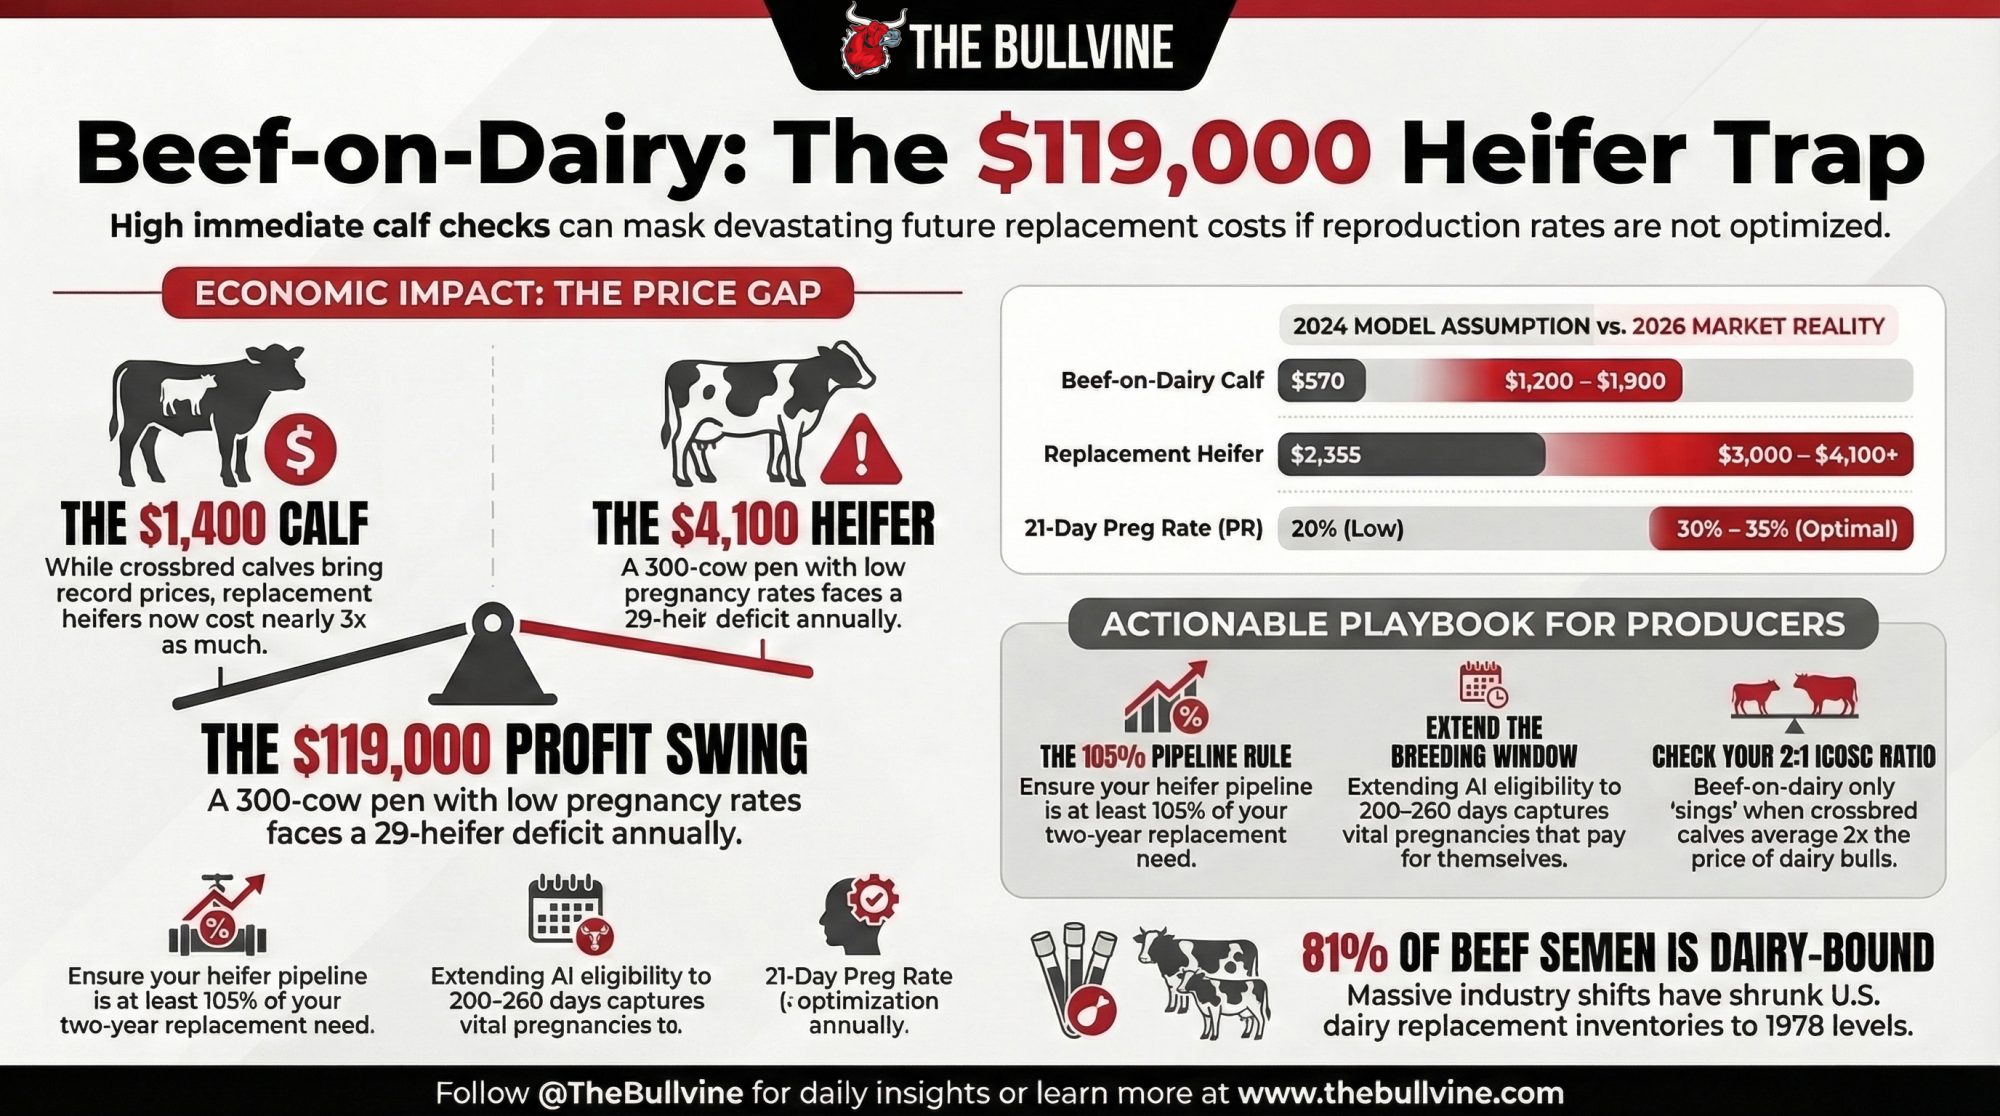
Executive Summary: UW–Madison’s beef‑on‑dairy simulation says a sexed‑plus‑beef program earns about $51/cow/year at 20% preg rate — but that’s built on $570 calves and $2,355 heifers, not today’s prices. In 2026, beef‑on‑dairy calves are bringing roughly $1,200–$1,900, while replacement heifers often cost $3,000–$4,100+, which means the model’s revenue upside is bigger — and the replacement bill is brutal if repro slips. Run the same tiered breeding strategy on a 300‑cow group, and you get two very different outcomes: a high‑PR herd with a 17‑heifer surplus, and a low‑PR herd that’s 12 heifers short — a 29‑head swing worth $86,000–$119,000 a year at current heifer prices. The core takeaway is simple: beef‑on‑dairy is a reproduction strategy first and a calf‑marketing strategy second, and the economics only really work when your 21‑day PR is closer to 30–35% with solid heifer survival. UW–Madison’s most uncomfortable insight is that the optimal insemination window under these calf prices stretches out to around 260 days in milk, so cutting cows at 150–180 days quietly throws away pregnancies and future replacements. The article finishes with a 30/90‑day playbook: pull your PR and 24‑month replacement inventory, check whether your beef‑on‑dairy calves actually average close to 2× your dairy bull calves, and decide how far you can lean into beef‑on‑dairy before you’re forced to buy back heifers at the top of the market.
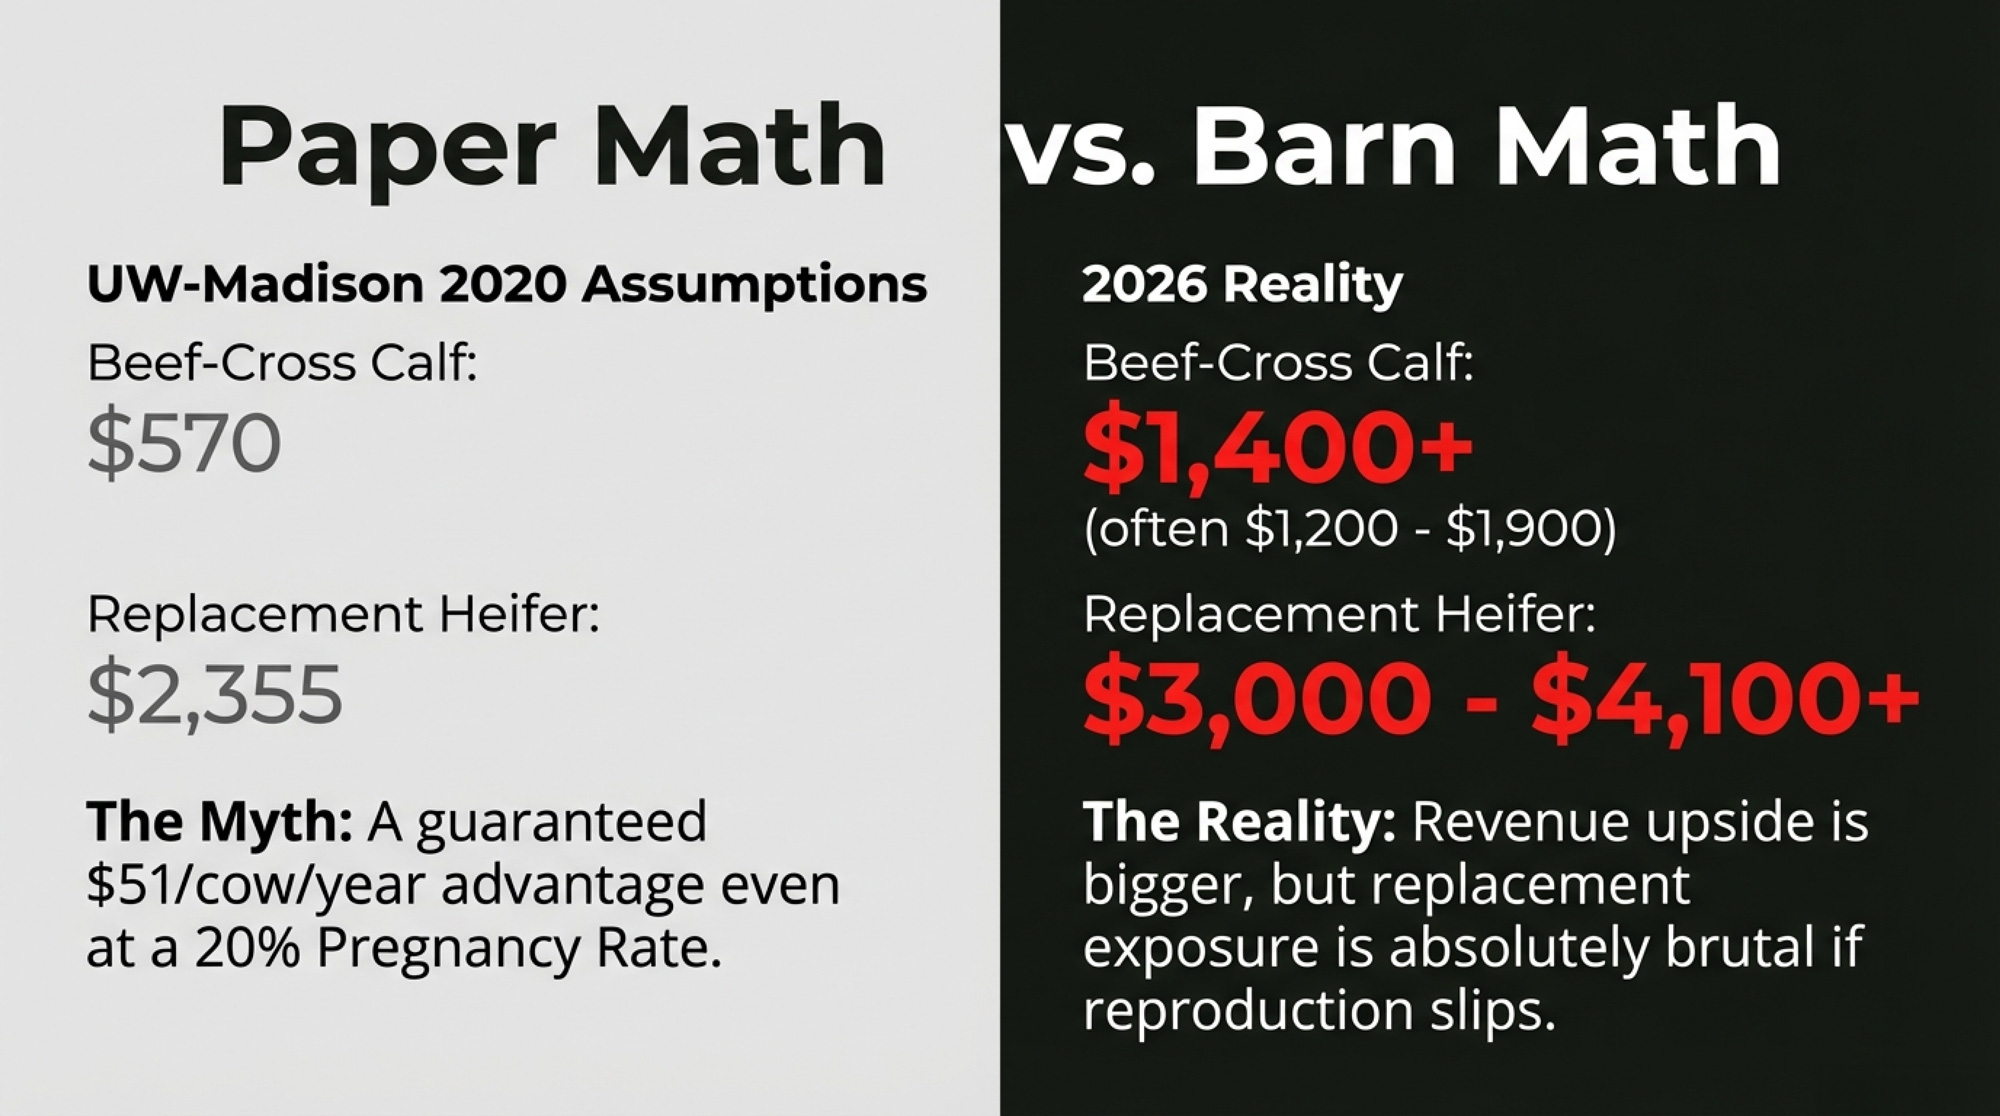
A replacement heifer that cost $2,355 in UW–Madison’s 2024 assumptions is now a $3,000–$4,100 line item in real markets. The same model valued beef‑on‑dairy calves at $570 — calves that now commonly bring $1,200–$1,900 at major auctions. On paper, the strategy adds $51/cow/year at low pregnancy rates. In the barn, the wrong breeding plan can torch $86,000–$119,000 per 300‑cow pen in replacement costs.
| Price Component | UW–Madison Model (2024) | Real Market (Early 2026) | Variance | Impact |
| Beef × Dairy Calf | $570 | $1,200–$1,900 | +111% to +233% | Higher revenue (but see replacement crisis) |
| Dairy Bull Calf | $385 | $900–$1,200 | +134% to +212% | Narrows beef-on-dairy advantage vs. conventional |
| Replacement Heifer | $2,355 | $3,000–$4,100 | +27% to +74% | Replacement bill brutal if PR slips |
| Net Advantage (20% PR) | $51/cow/year | $264+/cow/year | +418% | Looks great—until you’re 12 heifers short |
| 300-Cow Replacement Gap | 29-head swing assumed manageable | 29 heifers × new prices = $86K–$119K/year | — | The bill the calf cheque doesn’t cover |

The Industry Sprint Toward the Calf Cheque
Corey Geiger, lead dairy economist at CoBank, summed up the last five years of beef‑on‑dairy in one line: “What happened was we pivoted too hard, too quick.” The industry didn’t just pivot. It sprinted toward the calf cheque and tripped over the empty heifer pens.

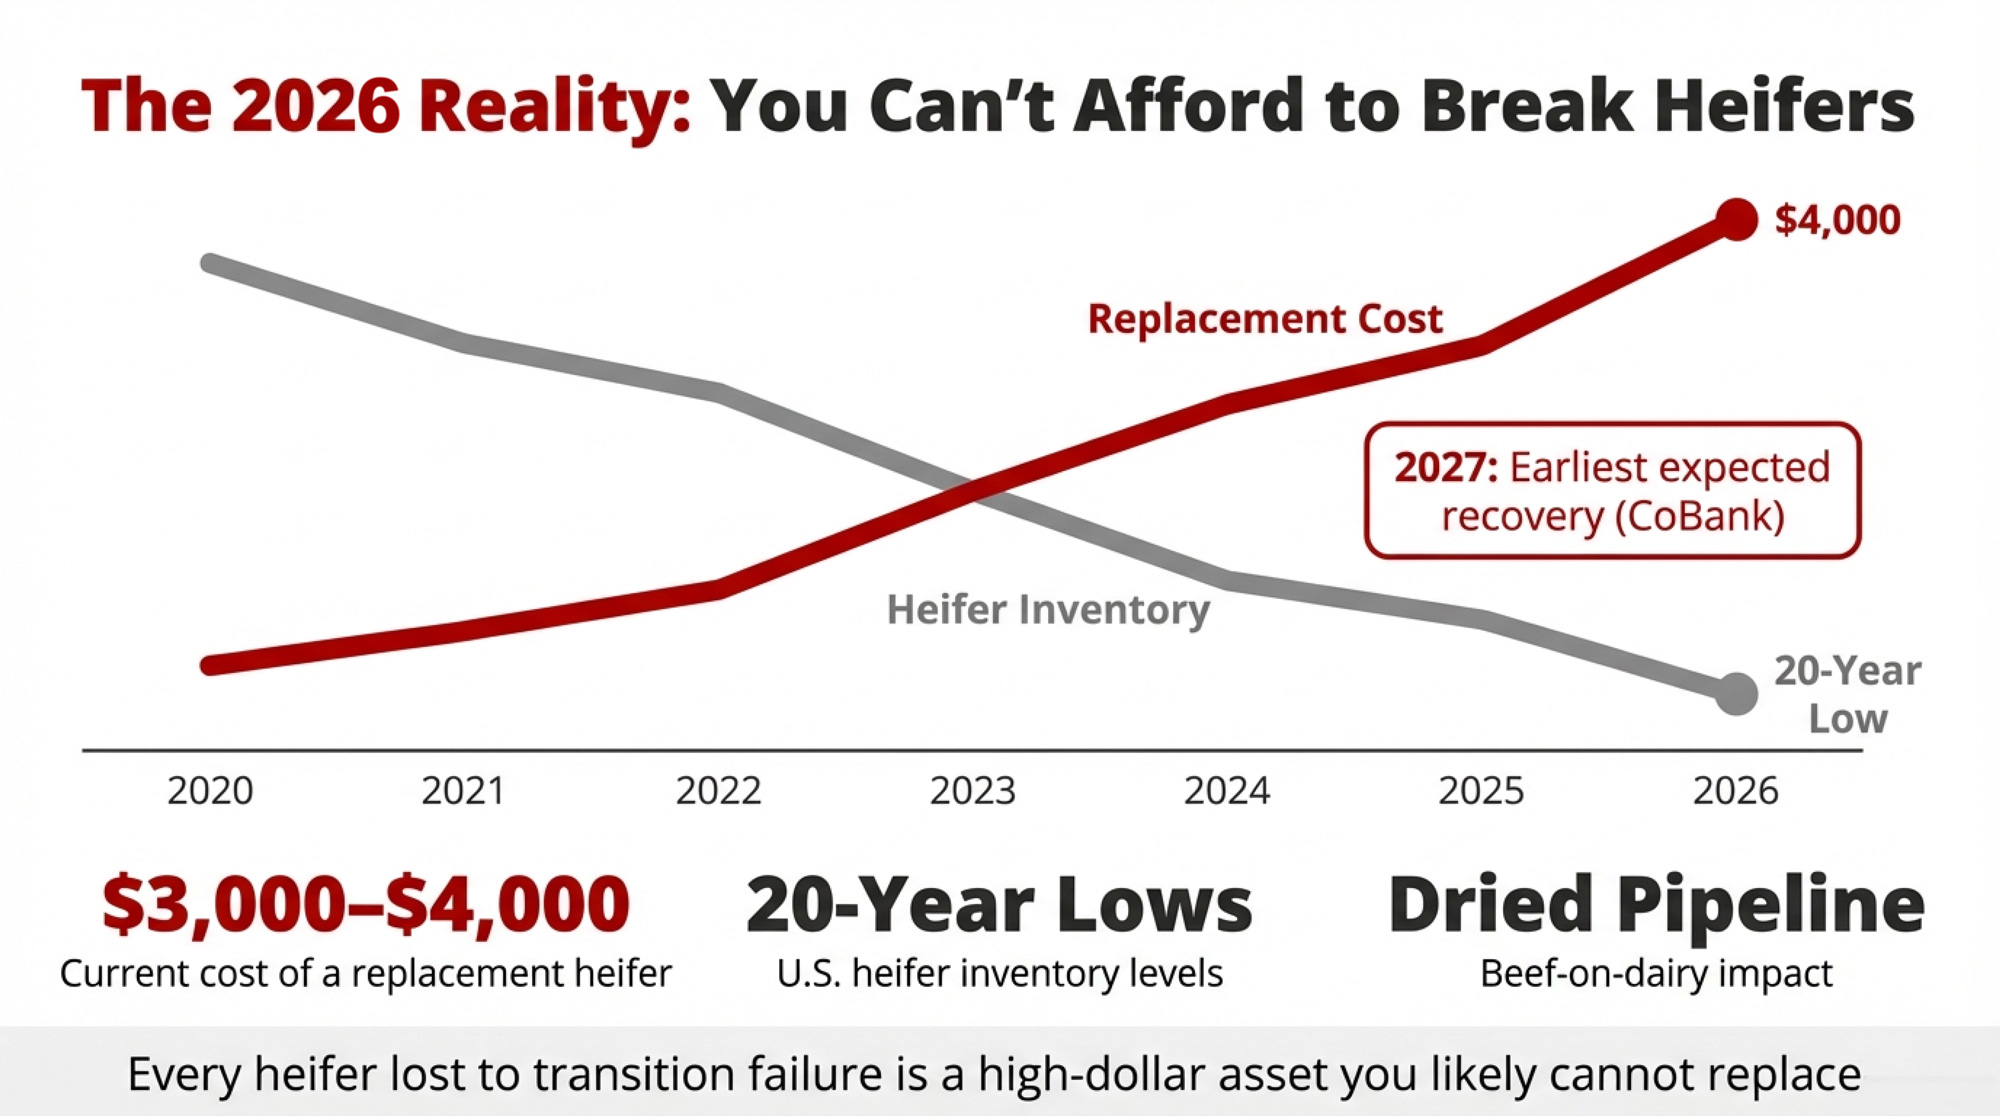
Eighty‑one percent of all beef semen sold domestically now goes into dairy herds — 7.9 million units out of 9.7 million, according to NAAB’s 2024 year‑end report. Conventional dairy semen sales shrank 46.5% in that same window. USDA’s January 2026 Cattle report shows U.S. dairy replacement heifers at 3.905 million head, the lowest since 1978. CoBank projects inventories will shrink by 357,490 head in 2025 and another 438,844 head in 2026 before rebounding by 285,387 head in 2027.
Those numbers mean the calves you’re selling today, and the heifers you’re not making will collide in your barn, not just in a spreadsheet.
The $4,100 Heifer vs. the $1,400 Calf
UW–Madison’s economic simulation — published in Journal of Dairy Science in late 2025/early 2026 — modeled a 1,000‑cow dairy using a tiered breeding program: top cows to sexed semen, middle to conventional, bottom to beef. Their default economics looked like this:
- Beef × dairy crossbred calf: $570 per head.
- Dairy bull calf: $385.
- Dairy heifer calf: $167.50.
- Replacement heifer rearing cost: $2,355.
Using those inputs, a herd at 20% 21‑day pregnancy rate (PR) with a 170‑day insemination eligibility period (IEP)earned about $51 more per cow per year from a sexed‑plus‑beef strategy than from an all‑conventional program. That’s the famous $51.

Now line that up with what you’re seeing in early 2026:
- Premier Livestock’s February 12, 2026, report lists beef‑dairy cross calves at $1,200–$1,910 per head.
- Abbotsford Stockyards’ January 14, 2026, report shows baby calves averaging $1,680 with a $500–$2,500 range and Holstein bull calves at $390–$680.
- USDA’s January 2026 National Dairy Comprehensive Report has No. 1 bull calves (0–14 days) averaging $1,187.42/cwt and No. 2 at $1,094.10/cwt nationally.
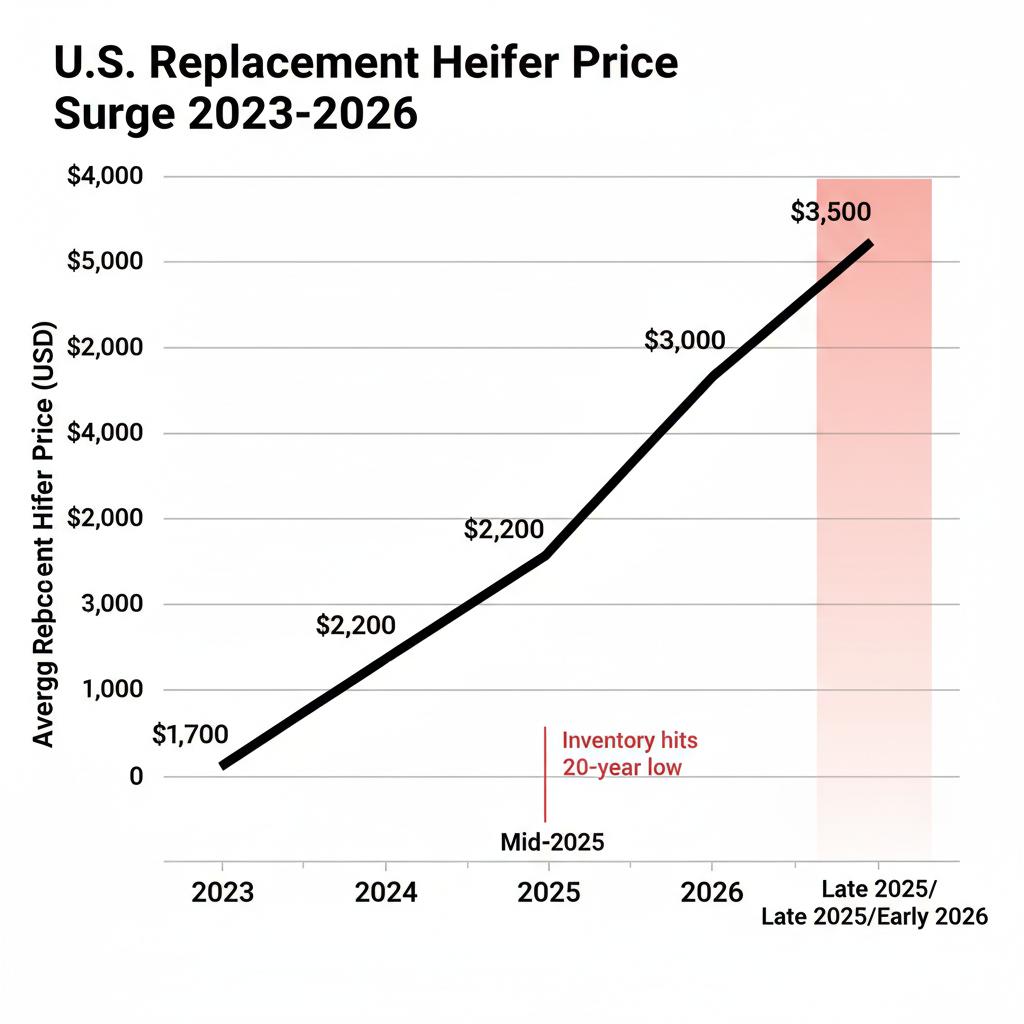
- CoBank’s heifer analysis and multiple auction summaries put replacement heifers consistently at $3,000–$4,000+, with some lots exceeding $4,100.
So the calf UW assumed was worth $570 is now worth closer to $1,400. The heifer priced at $2,355 is now more like $3,000–$4,100. The per‑cow advantage is better than $51 at current prices. The replacement exposure is a lot worse.
UW–Madison’s Simulation vs. Your Barn Math
Dr. Victor Cabrera’s 2021 work clarified why beef‑on‑dairy looked like free money. He defined ICOSC — income from calves over semen costs — and showed that beef‑on‑dairy pencils when the beef‑cross calf brings roughly 2× the dairy calf price in herds with at least a 20% 21‑day PR. That 2:1 ratio became gospel.
In 2026, the ratio’s not that clean:
- Beef‑on‑dairy calves often bring $1,200–$1,900.
- When you translate current cwt and regional reports, Holstein bull calves commonly sit at roughly $900–$1,200equivalent.
Some weeks you’re well past 2:1. Others you’re barely at 1.3–1.5:1. ICOSC advantage has turned into a local, week‑by‑week math problem — not a guaranteed win.
M.R. Lauber, Cabrera, and Paul Fricke went further in their JDS paper, building a discrete Markov‑chain simulation that looked at herd size, semen types, IEP, PR bands from 20–40%, and heifer survival from 75–90%. When they raised the beef‑cross calf value in the model from $570 to $1,125, the net return advantage at 20% PR climbed from $51/cow/year to $264/cow/year. That fits current markets.
But there’s a catch you can’t solve by selling into a hot calf market: the number of dairy heifers the program actually produces.
The Math That Breaks: 300 Cows, Two PRs, One Ugly Gap
Run their logic on a 300‑cow group — something that actually looks like a pen on your place.
Baseline assumptions:
- Herd size (group): 300 cows.
- Annual replacement rate: 35% → 105 heifers/year needed from this group.
- Breeding tiers: top 40% to sexed dairy (120 cows), middle 25% to conventional dairy (75 cows), bottom 35%to beef (105 cows).
Now split that group into two herds: one with strong reproduction, one that’s slipped.
Scenario A — Strong‑PR Herd (35% PR, 85% Heifer Survival)
- Sexed matings: 120 cows × 91.2% female = ~109 heifer calves (Lauber et al. 2020 sexed‑semen estimate).
- Conventional matings: 75 cows × 46.7% female = ~35 heifer calves (Silva del Río et al. 2007 conventional estimate).
- Beef matings: 105 calves = 0 replacements.
Total dairy heifers born: ~144.
After 85% survival: ~122 replacements available.
You need 105. You’ve got a 17‑heifer cushion. That pen can absorb some calf‑barn losses and still hold herd size.
Scenario B — Low‑PR Herd (More Cows Drift to Beef)
Drop the 21‑day PR and something ugly happens. Fewer cows conceive in that early sexed‑semen window. They cycle back, enter later services, and more of them get bred to beef.
Your neat 40/25/35 split slides toward 30/25/45.
- Sexed matings: 90 cows × 91.2% female = ~82 heifer calves.
- Conventional matings: 75 cows × 46.7% female = ~35 heifer calves.
- Beef matings: 135 calves = 0 replacements.
Total dairy heifers born: ~117.
After 80% survival: ~93 replacements available.
You still need 105. Now you’re 12 heifers short. Every year. Same herd size. Same breeding plan on paper. The only difference is reproduction and survival.
The Dollar Hit
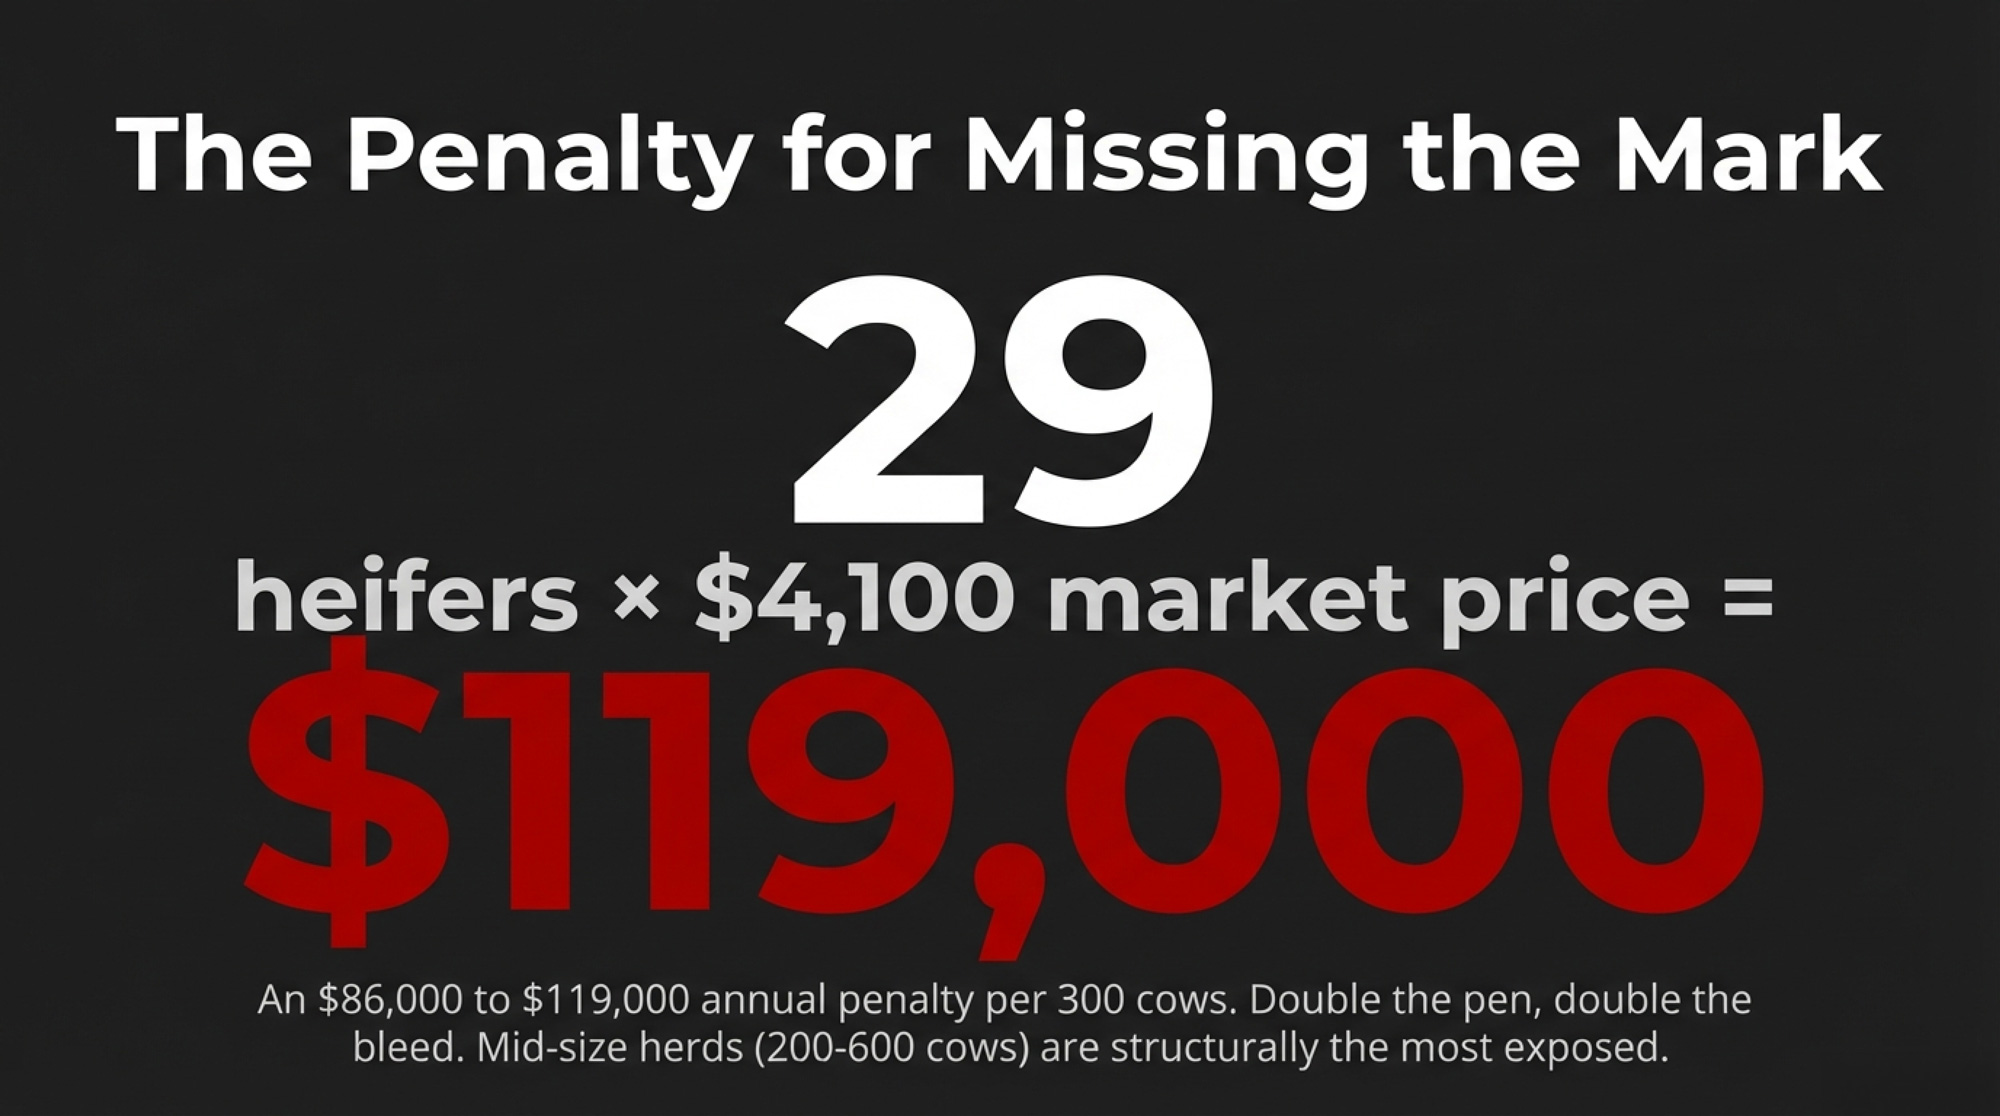
UW–Madison priced replacements at $2,355 based on 2020 rearing costs. CoBank and current sale data now peg them at around $3,000–$4,100. That 29‑heifer swing between Scenario A and Scenario B works out to:
- 29 heifers × $3,000 = $87,000.
- 29 heifers × $4,100 = $118,900.
Call it $86,000–$119,000 per year on a 300‑cow group. Double the group, double the bill.
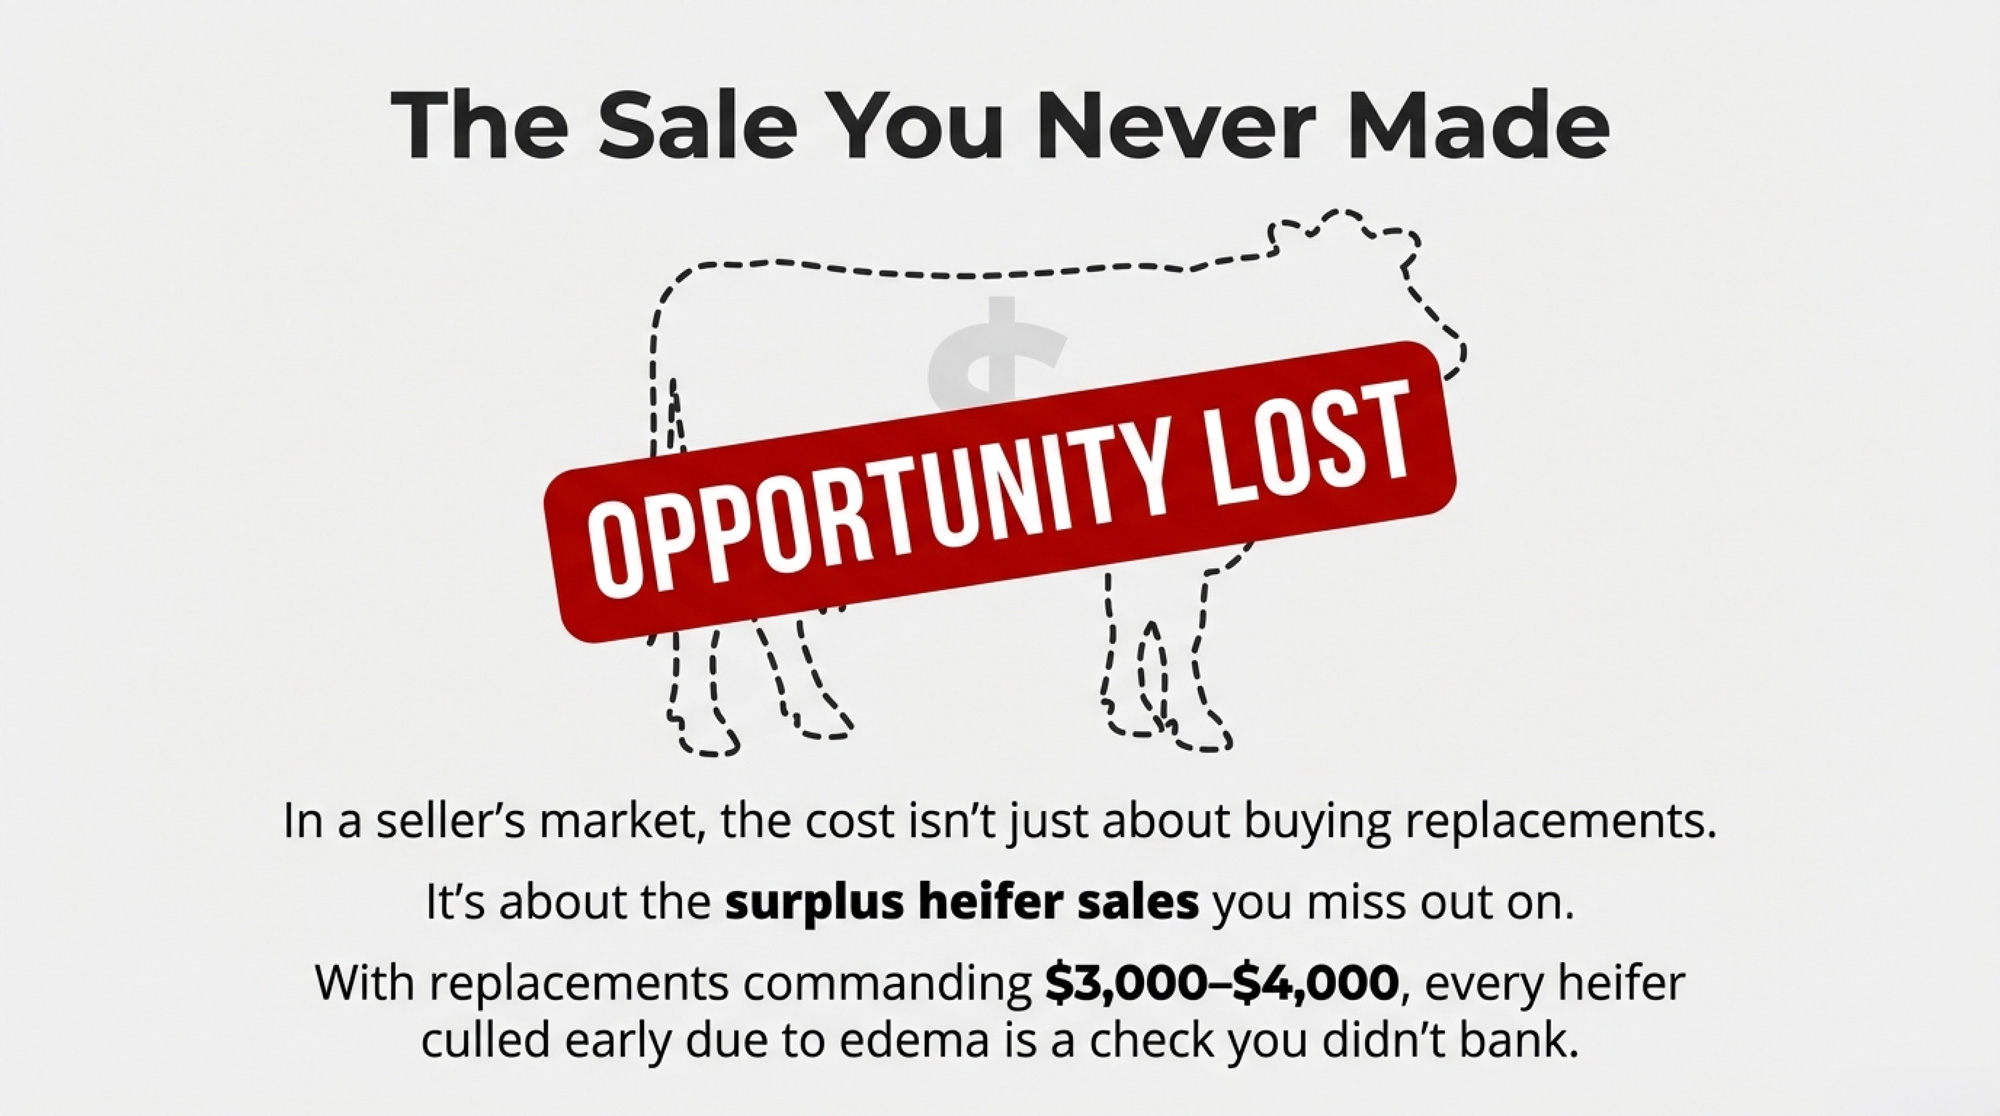
That’s without counting lost milk from cows you culled sooner because you wouldn’t carry them open to 260 days, or the premium you’ll pay if you’re forced into the replacement market when everybody else is short, too.
Mid‑size herds — 200–600 cows running 33–36% replacement rates — are structurally more exposed than 3,000‑cow herds sitting closer to 28–31%. Same program, much less room to miss.
The Hidden Lever: 260‑Day IEP (The One Thing Most Herds Are Getting Wrong)
One of the quiet bombshells in Lauber, Cabrera, and Fricke’s modeling is their answer to a simple question: how long should a cow stay eligible for AI in a beef‑on‑dairy system? Not just “what’s your PR?” or “what semen are you using?” but “when do you stop trying?”
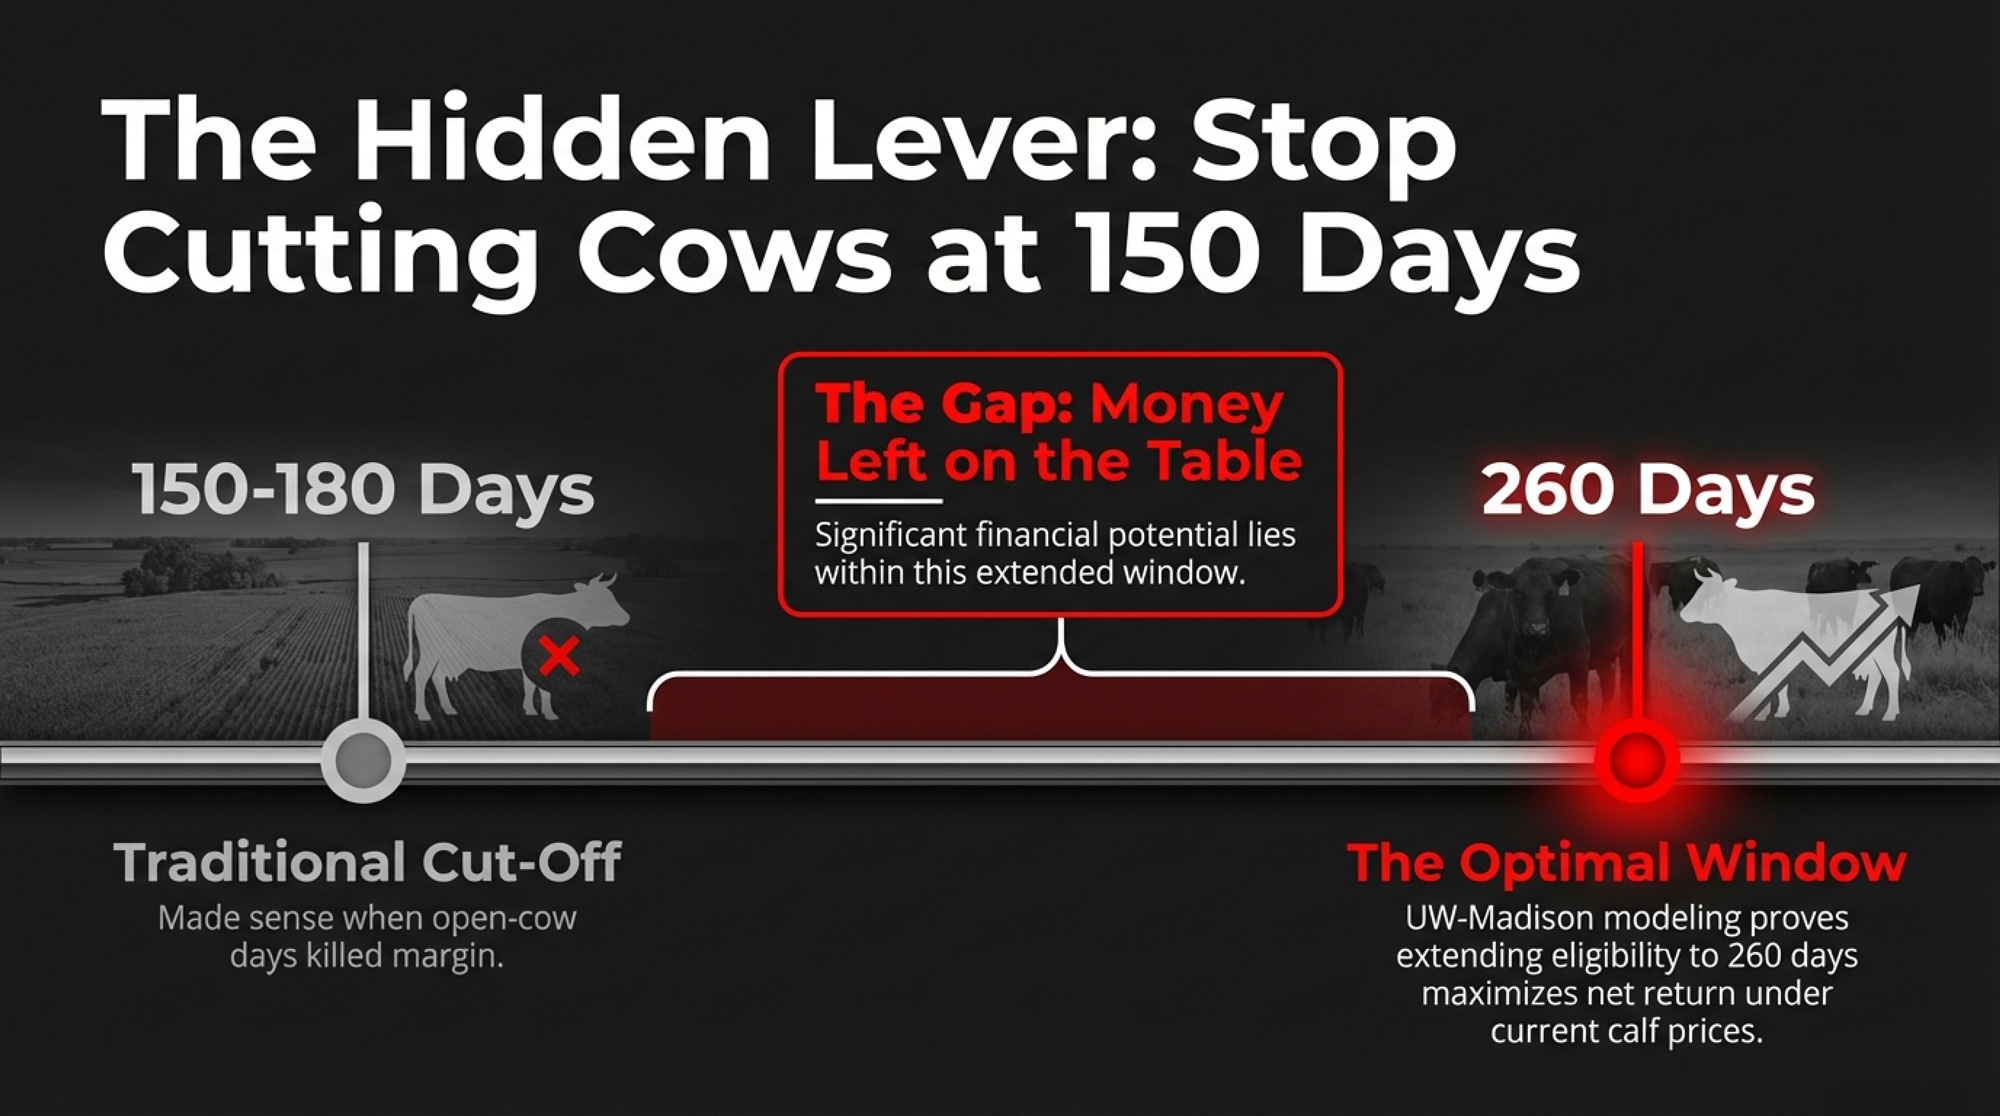
In their model, the optimal insemination eligibility period for sexed+beef herds typically sat around 200 days, and they tested windows all the way out to 260 days. The bigger message is that most herds are stopping far too early in a beef‑on‑dairy world.
Most of you are still removing cows from the breeding pool at 150–180 days in milk. That made sense when every extra breeding had limited upside and open‑cow days killed margin over feed. With beef‑on‑dairy in the mix, the upside of one more pregnancy looks very different.
Pro‑Tip: The 260‑Day Window
- UW–Madison tested IEPs from 50 to 260 days and found that, at today‑equivalent calf values, extending eligibility beyond 170 days — often toward roughly 200 days for sexed+beef programs — moved net return up as long as replacement needs were covered.
- Stopping at 170 days under a beef‑on‑dairy program leaves pregnancies — and replacement heifers — on the table.
- The trade‑off is real: more open days means higher feed and housing costs per pregnancy. But at current beef‑cross prices, the model says those extra calves more than pay for the added days.
So if you’re obsessing over which beef bull to order while quietly chopping your IEP short, you’re probably solving the wrong problem.
Replacement Risk: The PR Table That Should Make You Pause
Strip away the modeling details, and what’s left is a simple grid: your 21‑day PR and how much replacement risk you’re buying.
| Your 21‑Day PR | Net Return Advantage (Sexed+Beef vs. Conventional) | Replacement Risk |
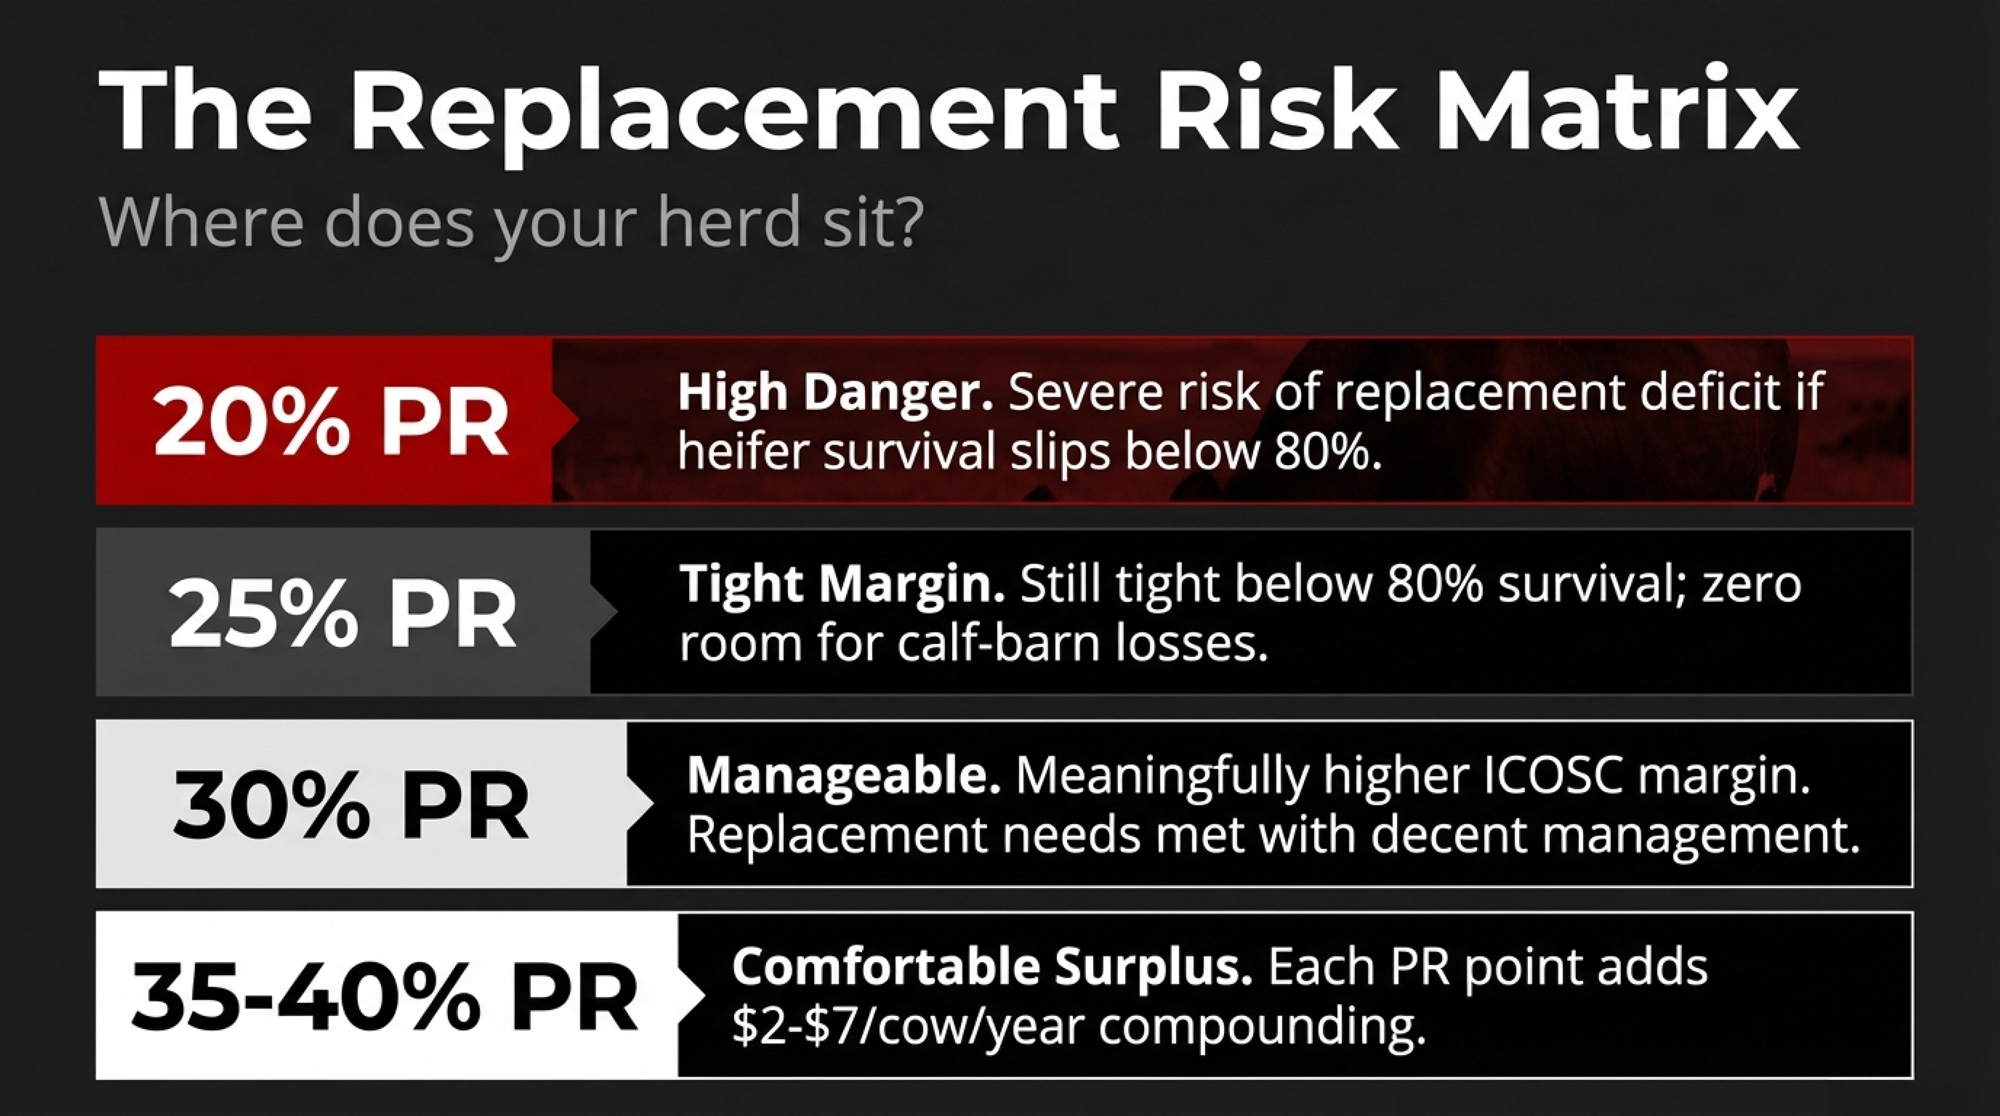
| 20% (low) | ≈ $51/cow/yr at $570 calves; significantly higher at today’s $1,200–$1,900 | High risk of replacement deficit if heifer survival slips below 80%. |
| 25% (below avg) | ~$51 + $10–$35/cow from better PR and tiered breedings | Still tight below 80% survival; little room for calf‑barn losses. |
| 30% (average) | Meaningfully higher ICOSC margin and calf revenue | Replacement needs manageable with decent calf and heifer management. |
| 35–40% (high) | Substantially higher; each PR point adds $2–$7/cow/yr, compounding at herd level | Comfortable surplus in most modeled scenarios, even with lower survival. |
The punchline: beef‑on‑dairy is first a reproduction strategy and only then a calf‑marketing strategy. If you’re playing it at 20–24% PR, you’re taking a high‑wire act that the UW model already flagged as thin at old-heifer prices.
Has Beef‑on‑Dairy Already Peaked?
CattleFax projected beef‑on‑dairy calf production reaching 4–5 million head annually by 2026, putting it firmly into the core of the U.S. beef supply. Purina’s 2025 beef‑on‑dairy report suggests those volumes have “likely reached their peak,” with a gradual 300,000–400,000 head decline expected in the next few years.
Semen sales tell a similar story. CoBank’s August 2025 work shows beef semen sales essentially flat from 2023 to 2024, while gender‑sorted dairy semen sales jumped 17.9% — 1.5 million extra units in a single year. “Those calves hitting the ground will become milk cows in 2027,” Abbi Prins said. The replacement pipeline is refilling. Slowly.
USDA’s January 2026 National Dairy Comprehensive Report shows No. 1 bull calves at $1,187.42/cwt and No. 2 at $1,094.10/cwt. That $93/cwt spread tells you quality already matters in the calf barn — and some of the calves you’d love to ship are the ones you may need to keep.
What This Means for Your Operation
This is where the story stops being about “the industry” and starts being about your next breeding cycle.
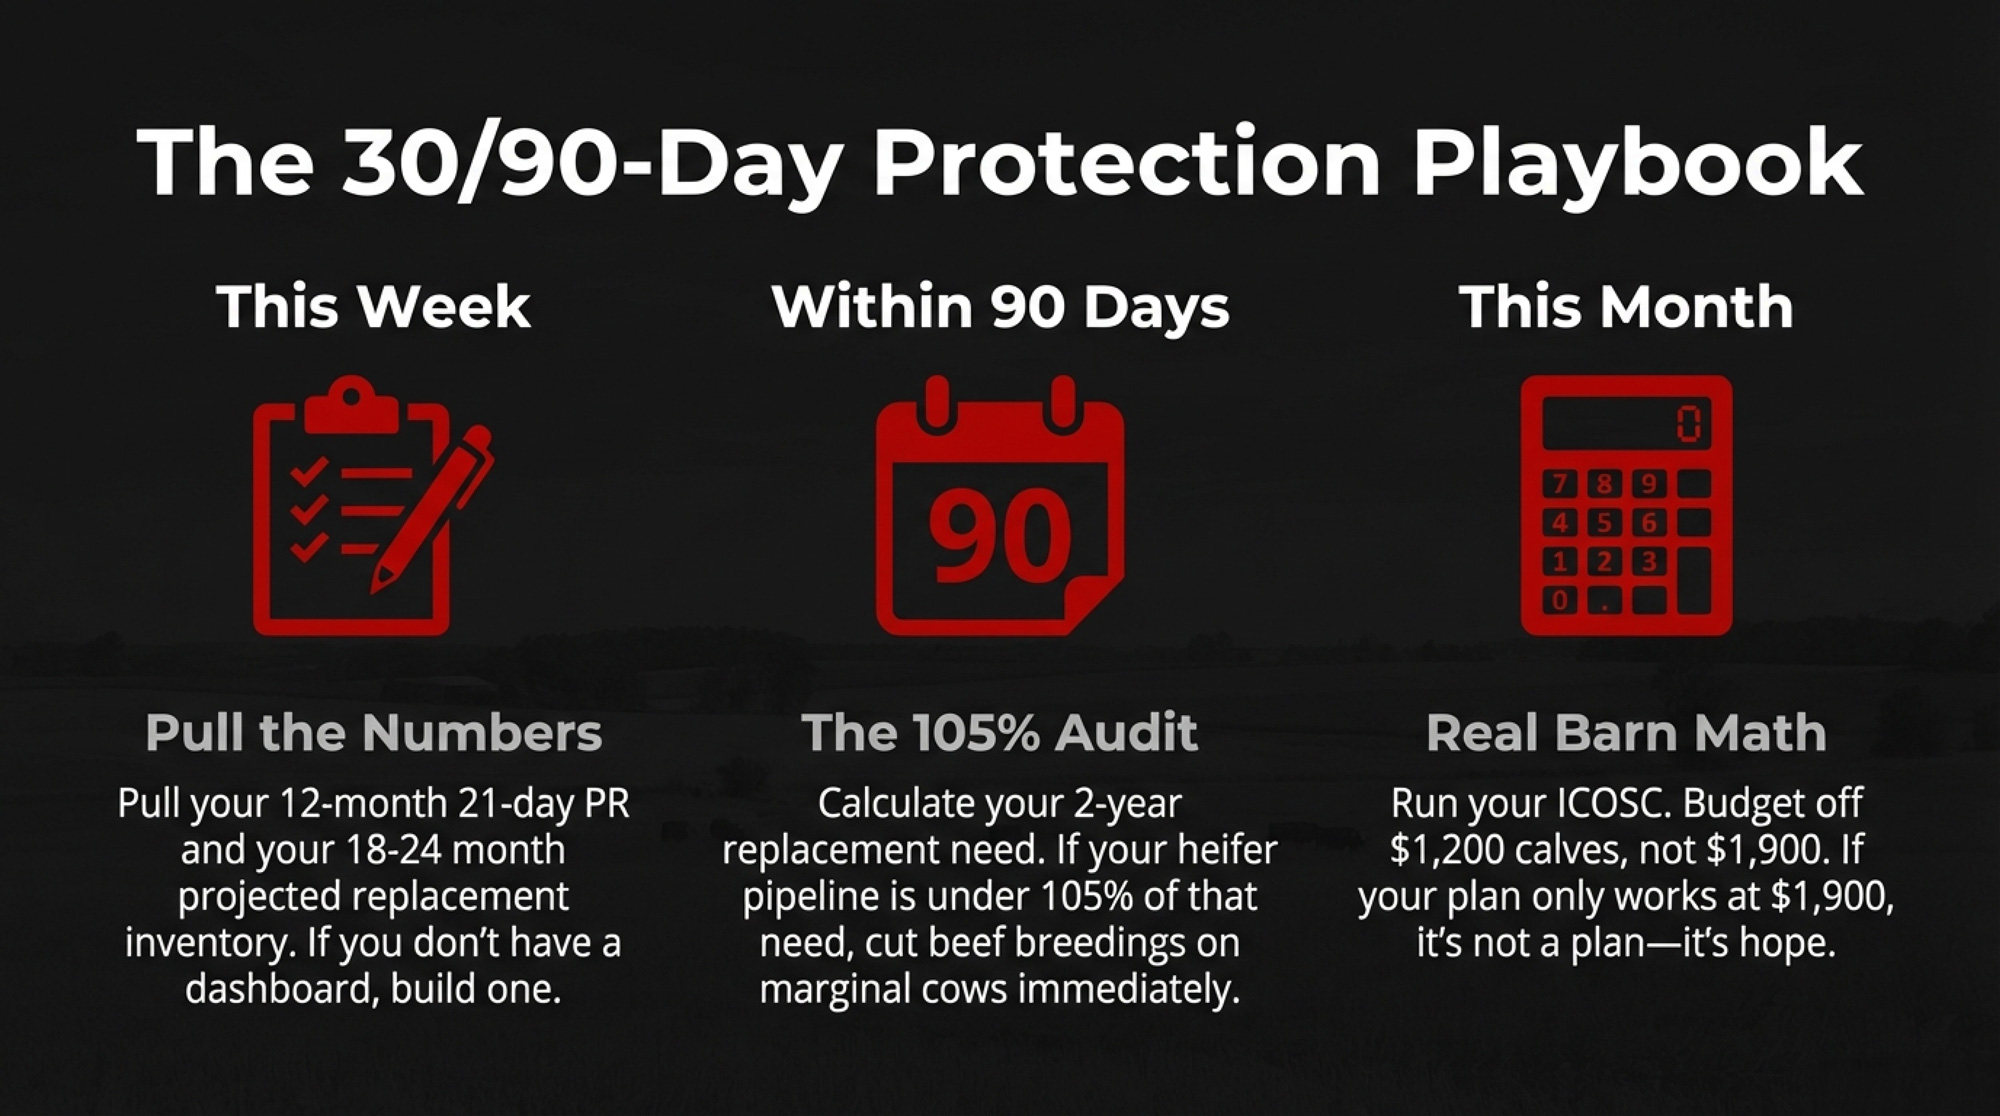
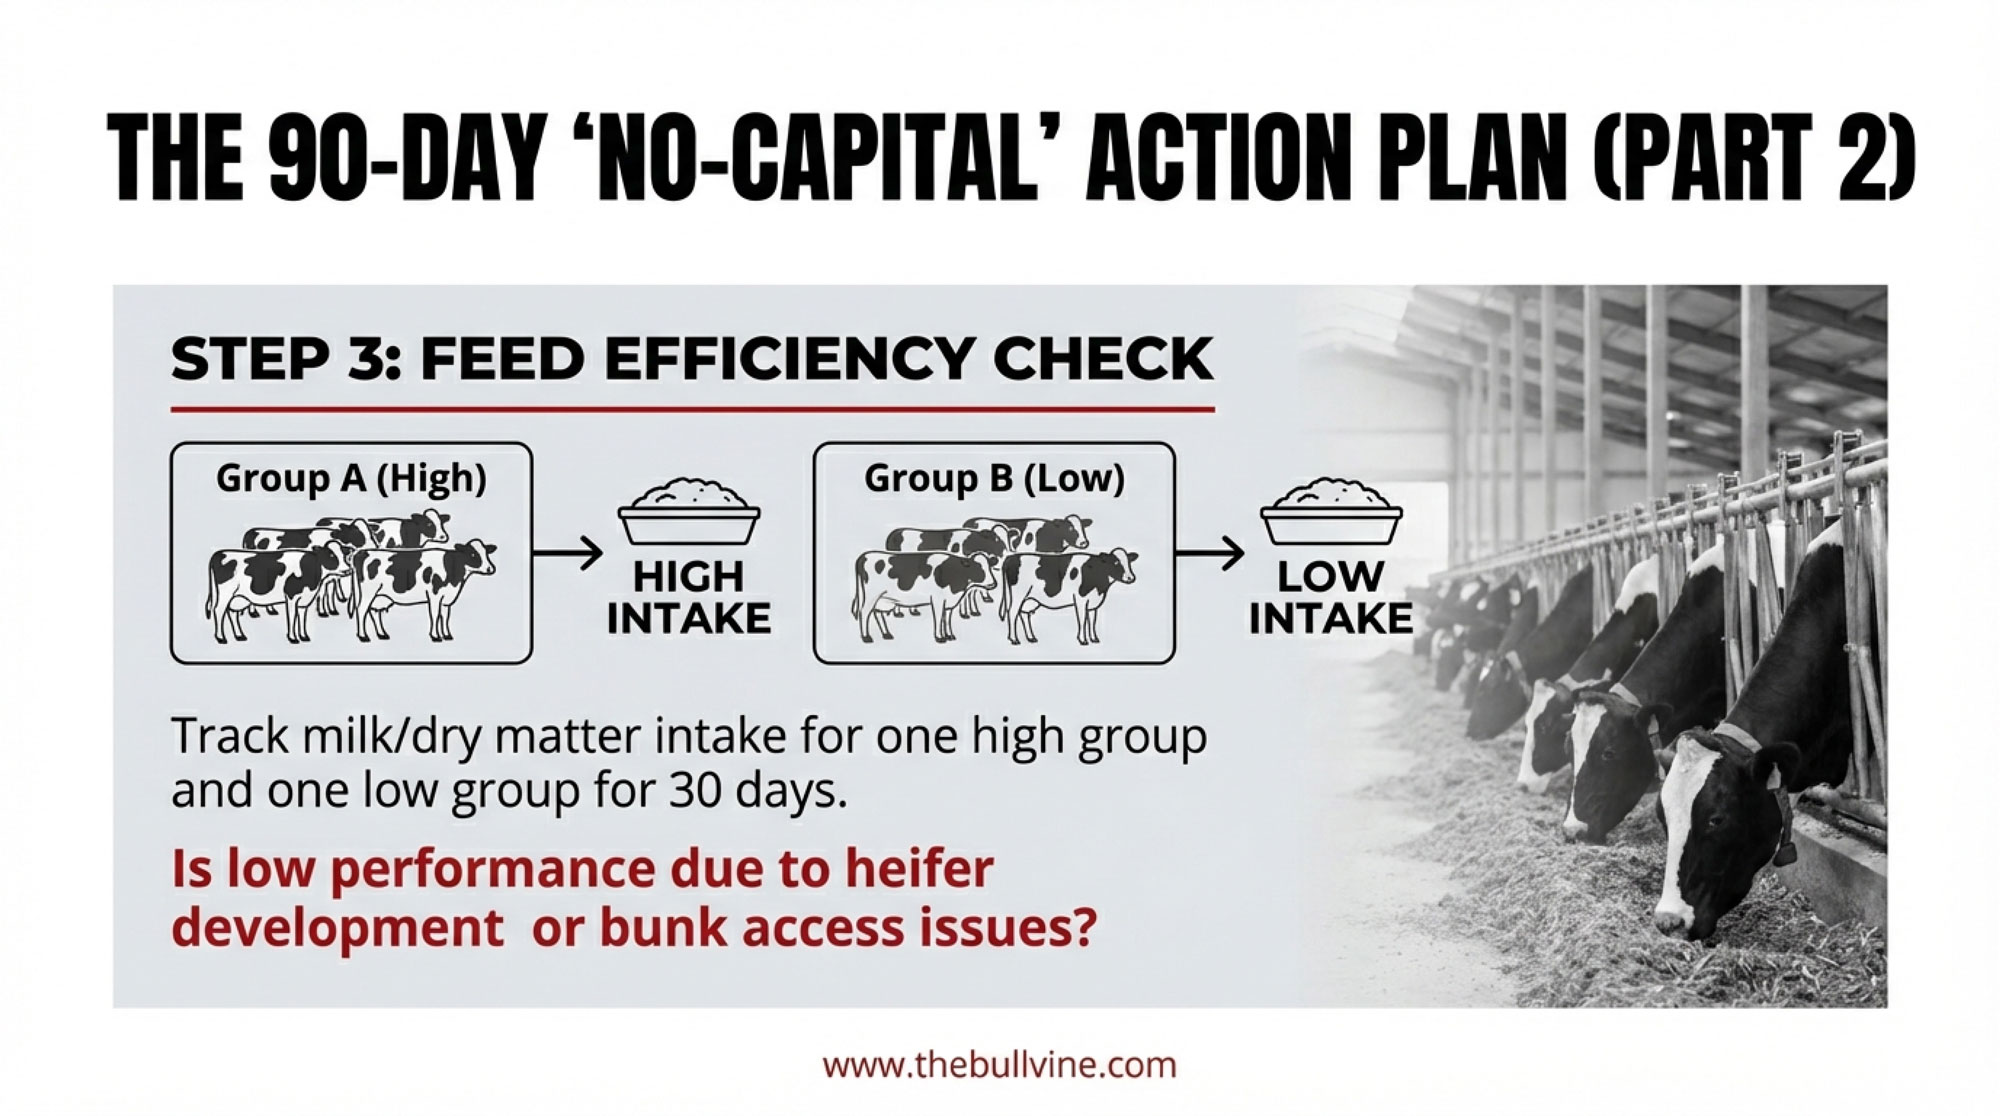
This week: Put PR and replacements on the same page.
Pull two reports:
- Your rolling 12‑month 21‑day pregnancy rate.
- Your projected replacement heifer inventory 18–24 months out (bred heifers + open heifers + heifer calves × your real survival rate).
If you can’t get both out of your herd software or records, that’s the first problem to fix. You’re running a replacement‑sensitive strategy without a dashboard. For a deeper management lens, come back to Bullvine’s beef‑on‑dairy management playbook.
Within 90 days: Run a 24‑month replacement audit.
- Calculate your two‑year replacement need: herd size × (cull rate + death loss) × 2.
- Stack that against your heifer pipeline: breds + opens + calves × survival.
If the pipeline is under 105% of your two‑year replacement need, that’s a yellow light. Under 100%, it’s red. Your next breeding round should cut beef breedings on marginal cows and push more sexed/conventional semen until the pipeline is back above that 105% buffer.
By your next annual breeding review: Put beef‑on‑dairy on a cash basis.
- Add up 12 months of beef‑on‑dairy calf revenue.
- Add up 12 months of replacement heifer costs (purchased and fully costed home‑raised, to first calving).
- Subtract the heifer cost from the calf revenue.
That net number — not your best calf‑sale week — is what beef‑on‑dairy is actually earning your operation.
This month: Run your own ICOSC check.
- Take actual dairy bull calf and beef‑on‑dairy calf prices from the last 12 months.
- If your beef‑cross calves aren’t averaging close to 2× your dairy bull calves, the ICOSC advantage Cabrera modeled at 20% PR gets thinner for your herd.
That doesn’t mean abandon beef‑on‑dairy. It just means the economics only really sing when reproduction has your back.
At your next repro strategy meeting: Talk about 260 days, not just “too many open cows.”
Ask your vet and nutritionist:
- Which cows can realistically stay in the breeding pool to 260 DIM and still make sense in terms of production and health?
- Which cows still need to leave earlier because of feet, legs, mastitis, or poor milk?
Model what happens if you extend the IEP from 170 to 220 to 260 days — how many pregnancies do you pick up, and what does that add in calf revenue vs. extra feed cost? UW’s model says the extra pregnancies pay at current prices; your numbers should verify that.
Budget off $1,200 calves, not $1,900.
If your plan only holds together when beef‑on‑dairy calves bring $1,800–$1,900, it’s not a plan — it’s hope. Build the math on $1,200 and let the good weeks be real upside.
Key Takeaways
- If your 21‑day PR sits near 20%, beef‑on‑dairy is a high‑risk play. The UW model’s $51/cow/year advantage at 20% PR is based on $570 calves and $2,355 heifers. At today’s prices, the revenue is better — but the same model shows you can easily fall short on replacements if heifer survival sags or too many cows drift into beef breedings.
- If you’re above 30% PR, the question isn’t “should we?” It’s “how hard do we lean?” Each PR point adds $2–$ 7 per cow per year to the breeding‑strategy advantage. On a 500‑cow herd, a 10‑point PR jump is $10,000–$35,000/year from semen strategy alone.
- If you haven’t done a forward replacement count, you’re not managing beef‑on‑dairy — you’re hoping the bill isn’t too big. The same breeding plan can leave one 300‑cow group with a 17‑heifer surplus and another 12 heifers short, a 29‑head swing worth $86,000–$119,000 at current heifer prices.
- If you’re still cutting breeding eligibility off at 150–180 days, you’re almost certainly leaving pregnancies and heifers on the table. UW–Madison’s work points to an optimal 260‑day IEP under current calf values. You gain more calves and replacements; you give up some feed efficiency. The money is in deciding where that trade‑off lands on your farm.
The Bottom Line
The calf cheque is immediate. The replacement bill is patient. Geiger’s warning about sprinting toward beef‑on‑dairy and Prins’s view that heifer prices haven’t peaked both land yet in the same place. UW–Madison, working off assumptions that now look cheap, still only found a $51/cow edge at low pregnancy rates.
You already know what your beef‑on‑dairy calves brought last week. The better question is simple and uncomfortable: how many heifers are you short 18–24 months from now, and what’s that really costing you?
Complete references and supporting documentation are available upon request by contacting the editorial team at editor@thebullvine.com.
Learn More
- Beef-on-Dairy’s $6,215 Secret: Why 72% of Herds Are Playing It Wrong – Reclaim your herd’s profitability with a precision blueprint that stops the breeding guesswork. This breakdown reveals the specific reproductive “guard rails” that turn a $2,000 monthly gain into $6,000, arming you with a clear, performance-based strategy for your next pen.
- $3,010 Per Heifer. 800,000 Short. Your Beef-on-Dairy Bill Is Due. – Secure your operation’s future against a structural 800,000-head heifer deficit. This analysis exposes the upcoming 2027 supply collision, delivering the market intelligence you need to navigate $4,000 price tags and lock in essential processor partnerships before the window slams shut.
- 9.57 Million Cows, 3.9 Million Replacements: Genetics Built This Dairy Herd Paradox – and 2027 Ends It – Disrupt the traditional culling cycle by capturing the massive “longevity dividend” hidden in your herd. This investigation breaks down why 2027 marks a hard reset for genetics, revealing how focusing on cow productive life delivers a $9,000 competitive advantage per cow.
 The Sunday Read Dairy Professionals Don’t Skip.
 The Sunday Read Dairy Professionals Don’t Skip.
Every week, thousands of producers, breeders, and industry insiders open Bullvine Weekly for genetics insights, market shifts, and profit strategies they won’t find anywhere else. One email. Five minutes. Smarter decisions all week.