Archive for farm cost reduction

The $300 Million Overrun You’re Paying For: Inside Dairy’s $11 Billion Labor Crisis

What farmers are discovering about the gap between processing expansion and workforce reality—and the practical lessons emerging from projects like Darigold’s Pasco plant

EXECUTIVE SUMMARY: The U.S. dairy industry is pouring $11 billion into processing plants it can’t staff—and farmers are paying for this disconnect through devastating milk check deductions. Darigold’s Pasco facility exemplifies the crisis: costs exploded from $600 million to over $900 million, forcing 300 member farms to cover the overrun at $4 per hundredweight, slashing their income by 20-25%. This infrastructure boom collides with an existential workforce crisis where immigrant workers, who produce 79% of America’s milk, face deportation while dairy remains locked out of legal visa programs that other agricultural sectors freely use. Farmers had no vote on these massive expansions, yet cooperative governance ensures they absorb all losses while contractors pocket overrun profits and board members face zero consequences. Some producers are finding lifelines through direct-to-consumer sales (commanding 400-600% premiums), smaller regional cooperatives, and strategic production management, but these are individual escapes from a systemic failure. Without fundamental reforms in cooperative governance and immigration policy, the industry will complete these factories just in time to discover there’s nobody left to run them—or milk the cows.

dairy governance risk
The largest ever investment in Darigold’s 100-year history, the Pasco plant stands to solidify the Northwest region among dairy producing regions for generations to come.

You know that feeling when you watch a neighbor build a massive new freestall barn, and you can’t help but wonder—who exactly is going to milk all those cows?

That’s not just a neighborhood curiosity anymore. It is the $11 billion question hanging over the entire dairy industry. Except we aren’t talking about barns; we’re talking about processing plants. And the answer is costing you $4.00 per hundredweight.

[IMAGE TAG: Wide shot of massive dairy processing plant under construction with empty parking lots]

So here’s what’s happening. When Darigold opened its new Pasco, Washington processing facility this past June, they had every reason to celebrate. The 500,000-square-foot facility can handle 8 million pounds of milk daily—that’s enough capacity to churn out 280 million pounds of powdered milk and 175 million pounds of butter annually. The technology really is impressive—state-of-the-art dryers, low-emission burners, the whole nine yards.

But here’s where it gets complicated, and you probably know where I’m going with this. That shiny new plant ended up costing over $900 million, even though the original budget was $600 million. That’s a 50% overrun, and if you’re shipping to Darigold, you already know who’s paying for it—their 300 member farms are covering it through that $4 per hundredweight deduction from milk checks.

Darigold’s Pasco plant overran by $300M—and 300 member farms absorbed it all through $4/cwt deductions

I’ve been talking with producers who say it accounts for 20-25% of their payments. Think about that for a minute. You’re already juggling feed costs that won’t quit, trying to find workers who’ll actually show up, dealing with market swings that’d make your head spin, and suddenly a quarter of your milk check disappears to cover someone else’s construction overrun.

“A quarter of your milk check disappears to cover someone else’s construction overrun while you struggle with feed costs, labor shortages, and market volatility.”

What’s interesting is that Pasco isn’t some weird outlier. The International Dairy Foods Association released their October report showing we’re looking at over $11 billion in new processing capacity coming online between now and 2028. We’re talking over 50 major projects here—it’s the largest infrastructure expansion I’ve seen in… well, honestly, ever.

And yet—and this is the kicker—this massive bet on processing capacity is running headfirst into a reality that anyone who’s tried to hire a milker recently knows all too well. We simply can’t find enough workers to operate the facilities we’ve already got, let alone staff new ones.

Quick Facts: The $11 Billion Reality Check

  • Total Infrastructure Investment: $11+ billion (2025-2028)
  • Major Projects: 50+ processing facilities announced or under construction
  • Darigold Overrun: $300 million (50% over budget)
  • Farmer Impact: $4/cwt deduction = 20-25% payment reduction
  • Farms Closing in 2025: 2,800 operations
  • Workforce Reality: 51% immigrant workers producing 79% of the U.S. milk

Understanding the Infrastructure Surge

Let me walk you through what’s actually being built out there, because the scale really is something else.

Chobani broke ground on a $1.2 billion facility in Rome, New York, back in April. Governor Hochul’s office is promising 1,000+ jobs and the capacity to process 12 million pounds of milk daily. Now, I’ve driven through that region recently—beautiful country, no doubt about it. But here’s what’s nagging at me: New York lost more than half its dairy farms between 2009 and 2022. The Census of Agriculture data doesn’t lie. So where exactly is all that milk going to come from?

Then you’ve got Hilmar Cheese Company’s operation in Dodge City, Kansas. It’s a $600+ million plant that started running this past March. They designed it to process 8 million pounds of milk daily, supposedly creating 250 jobs. But here’s what’s interesting—and this is November, mind you—they’re still scrambling to fill critical positions. Maintenance mechanics, facilitators, and milk receivers for night shifts. These aren’t entry-level gigs where you can train someone up in a week. These are technical roles that require people who know what they’re doing.

Fairlife—you know, the Coca-Cola folks—they’re building a $650 million ultra-filtration facility in Webster, New York. It’s part of what the state’s calling a $2.8 billion surge in dairy processing investments. Largest state investment in the nation, they say.

Michael Dykes, over at the International Dairy Foods Association, he’s confident about all this expansion. In their October industry report, he said: “Don’t fret for one moment—dairy farmers hear the market calling for milk. Milk will come.”

I appreciate the optimism, I really do. And on paper, it makes sense. Global dairy demand is growing, especially in Southeast Asia. Export opportunities are expanding. Processing innovation is creating new product categories we couldn’t have imagined ten years ago.

What could go wrong, right?

Well, let me tell you what’s already going wrong.

The Labor Reality Check

[IMAGE TAG: Split screen showing empty milking parlor positions vs. ICE raid at dairy farm]

Here’s the number that should keep every processor awake at night—and probably keeps many of you awake too. Texas A&M did a study in 2023, and the National Milk Producers Federation confirmed it: 51% of the dairy workforce consists of immigrant workers who produce 79% of America’s milk supply. I’ve cross-checked these numbers with multiple sources. If anything, they might be conservative.

Meanwhile—and this is where it gets frustrating—the H-2A temporary agricultural worker program has grown from about 48,000 certified positions back in 2005 to nearly 380,000 in fiscal 2024. Department of Labor tracks all this. But dairy? We’re completely locked out. Why? Because their regulations say work has to be “seasonal or temporary.”

Last I checked, cows need milking 365 days a year. They don’t take vacations.

“51% of the dairy workforce consists of immigrant workers who produce 79% of America’s milk. Yet dairy is locked out of H-2A visas because cows don’t take vacations.”

51% of dairy workers produce 79% of U.S. milk—the uncomfortable truth about American agriculture

What really gets me is that sheep herding operations—sheep herding!—have H-2A access, even though that’s year-round work too. It’s right there in the H-2A Herder Final Rule if you want to look it up. Jaime Castaneda, who handles policy for the National Milk Producers Federation, he’s been beating this drum for years. As he told me, “We have written to the Department of Labor a number of different times and actually even pointed to the fact that the sheep herding industry has access to H-2A, and it’s a very similar industry to dairy.”

But nothing changes.

And it’s not just dairy facing this squeeze. The Associated Builders and Contractors released its 2025 workforce report: the construction industry needs 439,000 additional workers this year just to meet demand. This labor shortage is exactly what’s driving delays and cost overruns on these dairy processing projects. Darigold learned that the hard way.

Workforce Crisis by the Numbers

Let me give you the regional breakdown, because it varies depending on where you’re farming:

  • Wisconsin: The University of Wisconsin School for Workers did a survey in 2023. Found that 70% of dairy workers are undocumented. Seven out of ten.
  • South Dakota: The Bureau of Labor Statistics shows unemployment under 2%. You literally cannot find local workers.
  • Looking ahead, USDA’s Economic Research Service forecasts 5,000 unfilled dairy jobs by 2030.
  • Worst-case scenario: Cornell’s research suggests that if we saw full deportation, milk prices could rise by 90% and we’d lose 2.1 million cows from the national herd.

Lessons from the Darigold Experience

So let me dig into what actually happened with Darigold, because if you’re in a co-op—and most of us are—there are some important lessons here.

What Went Wrong

Back in September 2024, Darigold sent out an update to members trying to explain the delays and cost overruns. I’ve reviewed their communications and spoken with affected producers. Here’s what really happened.

First off, supply chain disruptions hit way harder than anyone expected. And I’m not talking about generic delays here. The specialized dairy processing equipment—most of it comes from Europe—faced 12-18 month lead times instead of the usual 6-9 months. When you’re building something this complex, one delayed component throws everything off. It’s like dominoes.

Second, building regulations changed mid-construction. The Port of Pasco confirmed this in their regulatory filings. These weren’t just minor tweaks either. We’re talking structural changes that required completely new engineering calculations, new permits, and the works.

Third—and this is what really killed them—labor shortages in construction trades meant paying absolutely premium rates for skilled workers. You need specialized stainless steel welders who can work to food-grade standards? You can’t just grab someone off the street. Local construction sources tell me these folks were commanding $45-50 per hour plus benefits. And honestly? They were worth it because you couldn’t get the job done without them.

The plant was originally supposed to open in early 2024. It didn’t actually start operations until mid-2025. By September 2024, Stan Ryan, Darigold’s CEO, had to admit to the Tri-City Herald that it was only 60% complete, with costs already over $900 million.

How Farmers Are Paying the Price

This is where it gets personal for a lot of us. To cover the overrun, Darigold implemented what they’re calling a “temporary” deduction structure. I’ve seen the letters they sent to members. The language is… well, it’s stark.

Jason Vander Kooy runs Harmony Dairy near Mount Vernon, Washington—about 1,400 cows with his brother Eric. What he told Capital Press in May really stuck with me:

“There are a lot of guys who don’t want to quit farming, but can’t keep farming if this continues. The problem is we don’t have any other options. We just can’t leave the plant half constructed and walk away.”

Dan DeRuyter’s operation in Yakima County? They lost almost $5 million over 2 years due to these deductions. Five million. He told Capital Press, “It’s awful. I can’t go on much longer. I don’t think producers will be able to stay in business.”

“Dan DeRuyter’s dairy lost almost $5 million over two years from deductions to cover Darigold’s construction overruns. ‘I don’t think producers will be able to stay in business.'”

What strikes me about these stories—and maybe you’re feeling this too—is that these aren’t struggling operations. These are successful, multi-generational farms that suddenly find themselves cash-flow negative because of decisions they had no real say in making.

John DeJong’s family has been shipping to Darigold for 75 years. Seventy-five years! He put it pretty bluntly: “The deduction has eliminated investment. We’re more in survival mode. This is not a sustainable position—to dip into producers’ pockets.”

The Governance Question

Now, this is where things get interesting—and maybe a little uncomfortable—from a cooperative governance perspective.

Darigold said in their June announcement that “farmer-owners approved the Pasco project in 2021.” But when you dig into what that actually means… well, it’s not what most folks would consider democratic approval.

Based on how cooperative governance typically works—and on the extensive research by agricultural law experts at the University of Wisconsin—the approval probably came through board representatives rather than a direct member vote. Think about it. When was the last time your co-op asked you to vote on specific project budgets? On contractor selections? On who bears the risk if things go sideways?

Cornell’s cooperative research program has documented this pattern. Major capital investments often proceed based on board decisions, with members learning about cost overruns only when the deductions appear on milk checks.

I should mention that when I reached out, Darigold declined to provide specific details about their member approval process. They cited confidentiality of internal governance procedures. Make of that what you will.

The Immigration Policy Disconnect

You can’t talk about dairy labor without addressing the elephant in the barn—immigration policy. And boy, is this getting complicated.

Farmers Caught in Political Contradictions

I’ve spent a lot of time talking with farmers about this lately, and the cognitive dissonance is real.

Take Greg Moes. He manages a four-generation dairy operation near Goodwin, South Dakota, with 40 workers—half of them foreign-born. There was this CNN interview back in December that’s been making the rounds. Moes said: “We will not have food… grocery store shelves could be emptied within two days if the labor force disappears.”

Then there’s John Rosenow, who runs Roseholm-Wolfe Dairy up in Buffalo County, Wisconsin. Eighteen workers, half foreign-born. He told PBS Wisconsin this past October: “I’m out of business. And it wouldn’t take long.”

“We’re voting against our own workforce. I’m not making a political statement here, just observing the contradiction that’s tearing rural communities apart.”

What’s fascinating—and frankly, a bit troubling—is how many of these same farmers vote for politicians promising strict immigration enforcement. It’s like we’re voting against our own workforce. I’m not making a political statement here, just observing the contradiction that’s tearing rural communities apart.

Real-World Impact of Enforcement

And this isn’t theoretical anymore.

This past June, Homeland Security Investigations raided Isaak Bos’s dairy in Lovington, New Mexico. Multiple news outlets covered it. The operation lost 35 out of 55 workers in a single day. Milk production basically stopped. Bos had to scramble—brought in family members, high school students on summer break, anybody who could help keep the livestock alive.

Nicole Elliott’s Drumgoon Dairy in South Dakota went through an I-9 audit. The Argus Leader reported she went from over 50 employees down to just 16. As she told reporters, “We’ve effectively turned off the tap, yet we have not made any efforts to establish a solution for acquiring employees in the dairy sector.”

What I’ve noticed—and maybe you’ve seen this too—is that after these raids, remaining workers often self-deport out of fear. It creates this cascade effect that ripples through entire dairy regions. One raid, and suddenly everybody’s looking over their shoulder.

Understanding the Financial Flow

[IMAGE TAG: Infographic showing money flow – $300M overrun split between contractors, designers, vendors vs farmers]

When we talk about a $300 million cost overrun, it’s worth understanding where that money actually goes—and who absorbs the losses. This isn’t abstract accounting. It’s real money from real farms.

Who Profits from Overruns

So I’ve been looking into this based on construction industry analysis and Engineering News-Record’s contractor rankings.

Construction contractors like Miron Construction—they had $1.74 billion in revenue in 2024, according to ENR’s Top 400 list—typically operate under cost-plus contracts. Their fees increase in proportion to project costs. When projects run over? Their percentage-based fees go up, too. It’s built into the system.

Design firms like E.A. Bonelli & Associates, who designed Darigold’s facility, typically charge 6-12% of total construction costs. That’s standard according to the American Institute of Architects. So a $300 million overrun? That can mean millions more in design fees. Not a bad day at the office.

Equipment vendors benefit from supply chain premiums and change orders. When specialized European equipment is scarce—and it has been—vendors can command premium prices. I’ve seen quotes for processing equipment jump 30-40% during the pandemic supply crunch. Supply and demand, right?

Public entities, such as the Port of Pasco, invested $25+ million in infrastructure to support the project, according to port commission records. They get the economic development win, the ribbon-cutting photo ops, regardless of whether farmers can afford the milk check deductions.

The Processor’s Perspective

Now, to be fair, I did reach out to several processor representatives to get their side of the story. Darigold declined specific comment, but an IDFA spokesperson—speaking on background—made some points worth considering:

“Processors are caught between rising global demand and workforce constraints just like farmers. These investments are made with 20-30 year horizons. Yes, there are challenges today, but we believe in the long-term future of American dairy. The alternative—not investing in capacity—means losing market share to international competitors.”

That’s a reasonable position. It really is. Even if it doesn’t help farmers paying today’s deductions for tomorrow’s theoretical benefits.

Who Bears the Cost

But at the end of the day, it comes down to this: the financial burden falls squarely on cooperative members. The 300 Darigold farms absorbed every penny of that overrun through milk check deductions. They had no direct vote on contractor selection. No control over budget management. No recourse when costs exploded.

“300 Darigold farms absorbed every penny of a $300 million overrun. No vote on contractors. No control over budgets. No recourse when costs exploded.”

Practical Paths Forward for Farmers

Given all these structural challenges, what realistic options do we actually have? I’ve been tracking several strategies that producers are using to create some alternatives.

1. Diversification Beyond Cooperatives

Direct-to-consumer sales are providing some farmers with genuine pricing power. The Farm-to-Consumer Legal Defense Fund tracks this—28 states now allow raw milk sales in some form. Farmers I’ve talked with are getting $8-12 per gallon. That’s a 400-600% premium over conventional farmgate prices.

Direct-to-consumer sales command 400-600% premiums over commodity milk—a viable escape route from cooperative dependency

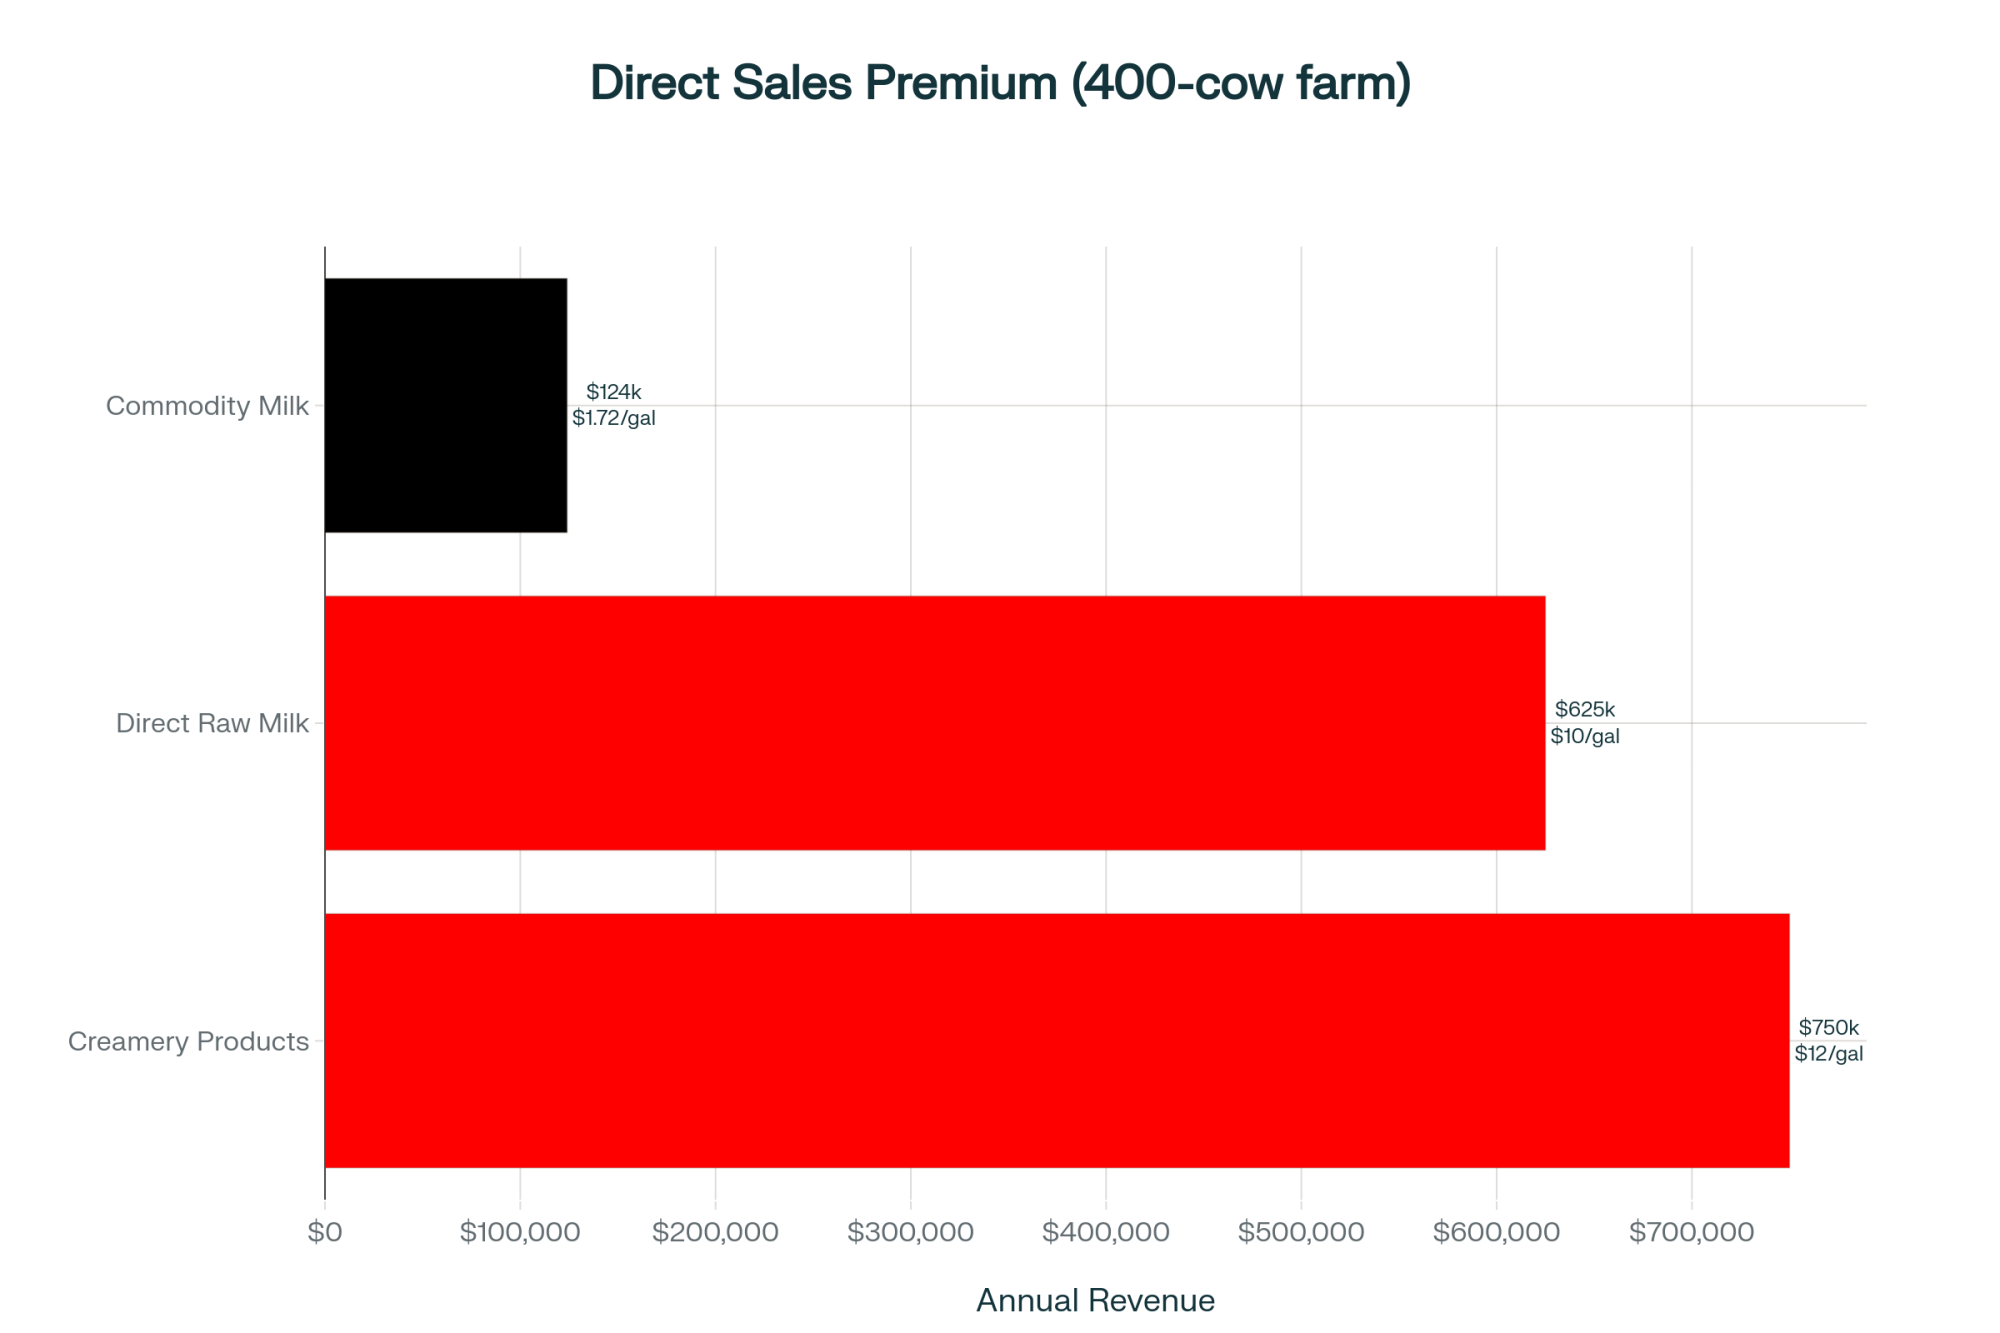
Cost Comparison Reality Check: Let me break down the numbers:

  • Conventional milk price: $18-20/cwt (works out to roughly $1.55-1.72/gallon)
  • Direct raw milk sales: $8-12/gallon
  • Investment needed: $50,000-150,000 for on-farm processing setup
  • Payback period: Generally 18-36 months if you shift 20% of production to direct sales

Even moving 20% of your production to direct sales can fundamentally change your negotiating position. You’re no longer completely dependent on that co-op milk check.

Dan Stauffer, a California dairy farmer I know, started an on-farm creamery specifically because—as she put it—”the $4.00 deduct combined with all the other standard deductions has made it impossible for us to cash flow.” She didn’t wait for reform. She built an alternative.

One important note, though: regulations vary significantly by state. What works in Pennsylvania won’t necessarily fly in Wisconsin. Always check with your state department of agriculture before making any moves.

2. Regional Cooperative Alternatives

Some farmers are successfully exploring smaller, regional cooperatives with more transparent governance. Research from the University of Wisconsin Center for Cooperatives shows these smaller co-ops often feature:

  • Direct member voting on major investments (imagine that!)
  • Transparent pricing tied to actual costs
  • Limited or no speculative facility construction
  • Focus on value-added products rather than commodity volume

The challenge? Leaving a major cooperative often involves exit fees, equity complications. But here’s what I’m seeing—when groups of farmers coordinate their intentions (legally, of course), cooperatives sometimes become more flexible on governance reforms. Funny how that works.

3. Advocacy for Practical Reforms

Rather than waiting for comprehensive federal legislation—which, let’s be honest, probably isn’t coming anytime soon—farmers are pursuing achievable state-level reforms.

In Wisconsin, a group of farmers filed formal complaints with the state Department of Agriculture regarding violations of cooperative governance. Outcomes are still pending, but it’s gotten attention.

Similarly, farmers in New York are working with their state attorney general’s office on transparency requirements for agricultural cooperatives. These aren’t radical demands. Just basic stuff like seeing the actual construction contracts before being asked to pay for overruns.

4. Strategic Production Management

This one’s delicate, but some farmers are discovering they can influence cooperative behavior through coordinated (but legal) production decisions. If enough members strategically manage production volumes, it creates leverage for governance reforms.

I’m not talking about illegal collusion here. Just individual business decisions that happen to align. When cooperatives see milk volumes dropping, board meetings suddenly become much more interesting.

Key Industry Trends to Watch

Based on conversations I’ve had with industry analysts and extension economists, here’s what I’m tracking:

Processing capacity utilization: Multiple sources suggest plants will operate at 65-75% capacity through 2026 due to milk supply constraints from labor shortages. That’s going to create margin pressure throughout the system. No way around it.

Consolidation acceleration: USDA data shows 2,800 farms closed in 2025. And that’s not the peak—it’s the baseline. Mid-size operations (500-1,500 cows) are facing the greatest pressure. I’m particularly worried about dairies in that sweet spot—too big to go niche but too small to achieve mega-dairy economies of scale.

2,800 dairy farms closed in 2025 alone—nearly double the baseline. The consolidation accelerates while processors invest $11 billion

Immigration policy evolution: Watch for potential executive orders creating temporary pathways for dairy workers. Congressional solutions remain blocked, but I’m hearing administrative workarounds are being discussed at USDA. Sources familiar with the discussions say something might be coming, but I’ll believe it when I see it.

Cooperative governance pressure: The Darigold situation has awakened member interest in governance reform across multiple cooperatives. I’m hearing rumblings from DFA and Land O’ Lakes members about demanding more transparency. About time, if you ask me.

Alternative marketing growth: Direct sales, regional brands, on-farm processing—all continuing to expand. The economics are compelling. Capturing even a portion of that processor-to-retail margin changes everything.

Practical Takeaways for Dairy Farmers

After researching this issue and talking with dozens of farmers, here’s my best advice:

1. Understand your cooperative’s governance structure. Get copies of the bylaws. Read them. Actually read them. Request documentation of how major capital decisions are made. Know your rights—you might have more than you think.

2. Evaluate diversification options. Run the numbers on direct sales or value-added processing. Even if you don’t pull the trigger, knowing your alternatives strengthens your position.

3. Document workforce challenges. Keep detailed records of recruitment efforts, wage offers, and position vacancies. This data matters for policy advocacy and might be required for future visa programs.

4. Build regional alliances. There’s strength in numbers. Coordinated action among neighboring farms—whether for governance reform, marketing alternatives, or workforce solutions—multiplies individual leverage.

5. Monitor capacity developments. Understanding regional processing capacity and utilization rates helps inform production and marketing decisions. If your processor is running at 60% capacity, that affects your negotiating position.

6. Prepare for workforce disruption. Develop contingency plans now. Cross-train employees, investigate automation options where feasible, and build relationships with temporary labor providers. Hope for the best, plan for the worst.

The Road Ahead

Looking at this $11 billion infrastructure investment, I see both dairy’s ambition and its fundamental challenge. We’re building world-class processing capacity while the workforce foundation—both on farms and in plants—is crumbling beneath us.

The Darigold experience isn’t just a cautionary tale. It’s a preview of what happens when expansion proceeds without addressing underlying structural issues. Farmers pay the price while contractors, consultants, and executives move on to the next project.

What’s become clear to me is that the disconnect between processing infrastructure and workforce reality isn’t just a temporary mismatch. It’s a structural crisis that requires fundamental reforms in how cooperatives govern themselves, how immigration policy treats agricultural workers, and how the industry plans for the future.

For dairy farmers navigating this environment, waiting for top-down solutions while writing checks for bottom-up failures isn’t sustainable. The operations that survive and thrive will be those that recognize the current system’s limitations and actively build alternatives—whether through direct marketing, governance reform, or strategic cooperation with like-minded producers.

The infrastructure bet has been placed. The steel is welded, and the dryers are installed. Now we need to ensure farmers aren’t the only ones covering the spread when the dice don’t roll our way.

Because at the end of the day, all those shiny new plants don’t mean a damn thing if there’s nobody left to milk the cows—or if the farmers have gone broke paying for the factory’s cost overruns.

KEY TAKEAWAYS

  • Check your cooperative governance NOW: If your board can approve $50M+ projects without direct member vote, you’re one announcement away from a $4/cwt deduction. Demand to see construction contracts, board votes, and risk allocation before the next expansion—farmers discovering they have legal recourse for unapproved overruns.
  • Build your escape route before you need it: Direct-to-consumer sales command $8-12/gallon (vs. $1.72 conventional) with $50-150K setup costs and 18-36 month payback. Moving just 20% of production creates leverage and covers deduction losses—28 states allow it, but check regulations first.
  • Document everything related to the workforce crisis: keep detailed records of every recruitment attempt, wage offers ($45-50/hr for skilled positions), and unfilled positions. You’ll need this evidence when immigration reform finally comes or when explaining why you can’t meet production contracts after raids.
  • Power comes from numbers, not hoping: Cooperative boards ignore individual complaints but panic when 10+ farms coordinate action. Whether demanding governance reforms, exploring alternative cooperatives, or strategic production management—allied farmers are getting results while solo operators just get bills.

Learn More: 

Join the Revolution!

Join over 30,000 successful dairy professionals who rely on Bullvine Weekly for their competitive edge. Delivered directly to your inbox each week, our exclusive industry insights help you make smarter decisions while saving precious hours every week. Never miss critical updates on milk production trends, breakthrough technologies, and profit-boosting strategies that top producers are already implementing. Subscribe now to transform your dairy operation’s efficiency and profitability—your future success is just one click away.

NewsSubscribe
First
Last
Consent

Cut Lameness 50% in 12 Months: The $95,000 Strategy Top Dairies Use (But 80% Still Ignore)

Your competition is turning $67,400 lameness losses into $348,000 gains. They’re using three strategies you’re probably ignoring.

EXECUTIVE SUMMARY: While the average dairy hemorrhages $67,400 annually from 20% lameness rates, top operations have cracked the code—transforming this drain into $348,000 in captured value through improved cow longevity, reproduction, and feed efficiency. The winning formula combines three proven strategies: a hybrid trimming model (professional expertise plus in-house response) that costs $62,700 but eliminates expensive treatment delays, strategic timing that generates an extra $308 per cow simply by trimming after 110 DIM, and—most powerfully—paying employees bonuses tied directly to lameness reduction. One Wisconsin operation invested $65,000 in a dedicated Hoof Health Coordinator position and saved $95,000 within 12 months by dropping lameness from 24% to under 10%. With modern Holsteins experiencing 50% longer recovery times than their 1990s predecessors and professional trimmers booked 3-4 months out, the economics are clear: operations modernizing their approach now will dominate, while the 80% clinging to “industry average” lameness face competitive extinction. The $37,000-45,000 first-year investment pays for itself within 8-12 months, making this the highest-ROI improvement available to dairy operations today.

We all know that number—$337 per case of lameness. The University of Wisconsin published this figure in their 2024 research, and it’s become almost a shorthand in our industry conversations. What’s particularly noteworthy, though, is how this familiar statistic represents just one dimension of a much larger economic picture.

I’ve been observing an interesting trend across dairy operations, from the established herds in Wisconsin to the larger facilities out West. A widening gap is developing between operations that have modernized their approach to hoof health and those that maintain traditional practices. And here’s what’s fascinating—this difference extends well beyond simple lameness rates. It’s actually shaping the fundamental competitiveness of these operations for years to come.

Let me share some insights from producers who’ve successfully transitioned from reactive to proactive hoof health management. Experiences from different regions—Wisconsin’s family operations, British Columbia’s progressive farms, even some of the larger-scale dairies in Idaho and New Mexico—offer valuable lessons for the rest of us.

Understanding the Complete Economic Picture

Looking at a typical 1,000-cow dairy operation in the Midwest—could be around Eau Claire, maybe closer to Green Bay—with the industry average 20% lameness rate, you’re facing direct annual costs of approximately $67,400 based on that Wisconsin research. These are the visible costs we track in our accounting systems.

Most dairies bleed money through lameness. Fix these five leaks and you’ll capture $348,000—while your competition’s still asking what hit them.

[Economic Impact Breakdown – 1,000 Cow Dairy]

Direct Costs (What You See):

  • Lameness treatment: $67,400/year
  • Based on 20% lameness rate × $337/case

Hidden Value Captured by Reducing Lameness to 10%:

  • Longevity gains: 2.8 → 4.8 lactations average
  • Reproduction improvement: 21-day pregnancy rate increases from 18% to 26%
  • Feed efficiency: 8% improvement from normalized eating patterns
  • Replacement savings: $280,000/year from reduced heifer purchases

Total Annual Opportunity: $348,000+

Now, what’s particularly interesting is how this breaks down. The latest Wisconsin research shows that the direct treatment savings alone from reducing lameness from 20% to 10% equals about $34,000 annually for a 1,000-cow herd (or $68,000 for a 2,000-cow operation). Initially, most of us think that’s the whole story—fewer vet bills, less medication, reduced labor. But that $34,000 in direct savings? It’s actually just the tip of the iceberg.

The real economic transformation—that full $348,000 opportunity—comes from several interconnected areas that you might not immediately consider:

Cow longevity shows remarkable improvement, extending from an average of 2.8 lactations in high-lameness herds to 4.8 lactations when lameness drops below 10%. Cornell’s PRO-DAIRY program has been documenting these patterns across multiple operations for years now.

Reproductive performance improves significantly—we’re talking 21-day pregnancy rates climbing from 18% to 26% when lameness is properly controlled. The University of Minnesota’s reproduction studies have consistently demonstrated this connection.

Feed efficiency gains of approximately 8% occur simply through normalized eating patterns. Think about it—when cows aren’t shifting weight off painful feet, they’re actually eating properly. Michigan State’s research provides compelling evidence on this relationship.

Perhaps most striking are the replacement cost savings—potentially $280,000 annually for a 1,000-cow operation, simply from reduced heifer purchase requirements at current market prices.

As industry consultants tracking outcomes across multiple operations report: “Operations approaching hoof health as an integrated system rather than isolated trimming events are discovering value streams they hadn’t recognized before. It’s essentially recovering losses they didn’t realize were occurring.”

CharacteristicTop 20% (Modernized Approach)Bottom 80% (Traditional Approach)Competitive Gap
Lameness Rate8-10%20-25%2.5x worse outcomes
Average Cow Longevity4.8 lactations2.8 lactations71% more productive life
Trimmer Response Time24 hours (hybrid model)3-4 months (professional wait)$180/cow/day × delays
Annual Lameness Costs$34,000 (1,000 cows)$67,400 (1,000 cows)$33,400 competitive disadvantage
Total Captured Value$348,000 annually$0 (unrealized)$348,000 advantage
Replacement Rate28% (longevity-driven)36-40% (forced culls)$280,000 annual savings
21-day Pregnancy Rate26%18%Faster herd turnover
Implementation Cost$37,000-45,000 first year$0 (but opportunity cost massive)8-12 month payback

Three Management Models in Practice

What farmers are finding is that three distinct management approaches have emerged as operations adapt to these economic realities. Each offers advantages, though I’ve noticed implementation quality determines outcomes more than model selection.

Management ModelAnnual Cost (1,500 cows)Key AdvantagesCritical Pitfalls
Professional Contract~$75,000–  Expert technique guaranteed-  No labor management required-  Consistent quality–  3-4 month booking delays-  $180/cow lost per day of delayed treatment-  No emergency response capability
In-House Program~$35,000–  Immediate response capability-  Lower direct costs-  Complete schedule control–  $15,000-30,000 equipment investment-  Failure rate when trimmer lacks protected time-  Risk of 50% lameness increase if poorly trained
Hybrid Model~$62,700–  Professional expertise for maintenance-  24-hour emergency response-  Reduces treatment delays by $180/case–  Requires strong coordination-  Need clear role definition-  Training investment essential

Professional Contract Services: The Traditional Approach

Most dairy operations continue to rely on professional trimmers who visit quarterly or monthly. Industry surveys indicate costs ranging from $15 to $40 per cow per trim. So for a 1,500-cow operation, annual investment typically reaches $75,000.

The emerging challenge—particularly in dairy-intensive regions like Wisconsin, Idaho, and California—isn’t actually cost. It’s availability. Professional trimming services report booking schedules extending 3-4 months, with many turning away multiple prospective clients for each new account they can accommodate.

Consider the practical implications here: you discover a lame cow on Tuesday morning, but your trimmer isn’t scheduled for three weeks. University of Minnesota research indicates this delay costs approximately $180 in lost production per affected cow. These costs accumulate quickly across even modest lameness rates.

In-House Programs: Promise and Pitfalls

Some operations figure they’ll internalize all trimming activities, anticipating cost savings. And theoretically, expenses can decrease to approximately $35,000 annually for that same 1,500-cow herd.

But here’s where it gets tricky. Successful execution presents significant challenges.

Professional-grade equipment requires an investment of $15,000 to $30,000 for quality hydraulic chutes from manufacturers like Riley Built or Comfort Hoof Care. Staff need proper Dutch 5-step method certification—and I mean comprehensive training costing $1,000 to $3,000, not informal learning.

The critical success factor that everyone overlooks? Protected time. At least 1-2 hours daily that absolutely cannot be redirected to other tasks. Training programs nationwide report the same pattern: in-house trimming programs most commonly fail when designated trimmers lack sufficient protected chute time. They’re constantly being pulled to help with breeding, fix equipment, or move cows.

Hybrid Models: Finding Balance

What’s really interesting is how successful operations are increasingly combining professional expertise with in-house response capabilities. For a 1,500-cow dairy, this approach typically costs $62,700 annually while delivering superior outcomes.

This model features monthly professional trimmer visits for maintenance and complex cases, supplemented by trained on-farm staff who can apply blocks, address digital dermatitis, and respond to emergencies within 24 hours.

Dr. Gerard Cramer’s extensive research at the University of Minnesota demonstrates that each 24-hour reduction in treatment response time saves approximately $180 per case. When your on-farm staff can apply a block on Tuesday afternoon rather than waiting three weeks, those savings directly impact profitability.

The Timing Revolution Nobody Saw Coming

This development still surprises experienced producers when I share it. Recent research challenges everything we thought we knew about optimal trimming schedules.

Traditional protocols recommended trimming at fresh check, typically 3-4 weeks post-calving. Makes sense, right? Cows are already restrained for health checks. But the production data reveals a completely different optimal approach.

Timing beats technique—trimming after 110 days unlocks +11 lbs/day and a $308/cow advantage, while old-school early trims lock in losses.

[Milk Production Impact of Trimming Timing]

Days in Milk at Trimming → Peak Milk Production Impact

  • Trimming < 110 DIM: -8 lbs at peak, losses persist through 200 DIM
  • Trimming > 110 DIM: +3 lbs at peak, advantage maintained throughout lactation
  • Net Difference: 11 lbs/day = $308 per cow per lactation

Based on converging research from Wisconsin, Minnesota, and Cornell universities

Converging research from Wisconsin, Minnesota, and Cornell demonstrates that cows trimmed after 110 days in milk produce significantly more milk than those trimmed earlier.

The differences are substantial:

Trimming before 110 DIM results in an 8-pound loss at peak milk, with impacts persisting through 200 DIM. Meanwhile, trimming after 110 DIM yields a 3-pound gain at peak and maintains this advantage throughout lactation. The net economic difference? $308 per cow simply through timing adjustment.

Why does timing matter so significantly? Well, it comes down to metabolic stress patterns. Research from Dr. Nigel Cook at Wisconsin demonstrates that fresh cows experiencing severe negative energy balance are already mobilizing 75-100 pounds of body tissue to support production. When you add trimming stress—which research shows increases cortisol levels 10-fold—during this vulnerable period, you’re compounding metabolic challenges that delay recovery.

I spoke with a reproduction manager operating near Kaukauna who adjusted protocols two years ago with notable results: “We extended our voluntary waiting period from 60 to 94 days specifically to avoid trimming during peak metabolic stress. First-service conception improved from 28% to 41%—that wasn’t what we expected, but we’ll certainly take it.”

Technology Integration: A Nuanced Decision

Let’s talk about those automated lameness detection systems prominently featured at every trade show. Manufacturers accurately claim their AI-powered cameras can identify lameness 23 days before visual detection, achieving 81-86% agreement with veterinary assessment.

And you know what? The technology actually performs as advertised. But whether it makes economic sense for your operation depends heavily on specific circumstances.

Systems from companies like CattleEye or IDA require an initial investment of $45,000 to $73,000, plus $8,000 to $12,000 in annual subscription fees.

The value proposition varies considerably:

Automation particularly benefits:

  • Operations with robotic milking systems, where individual cow movement eliminates natural observation points
  • Facilities exceeding 1,500 cows, where comprehensive visual observation becomes impractical
  • Herds with baseline lameness above 25% requiring systematic problem identification

Now consider this alternative perspective from a producer near Marshfield managing 800 cows. He reduced lameness from 24% to 14% investing just $7,200 in disciplined footbath protocols and strategic trimming, achieving $20,000 annual savings.

As he explained: “Technology vendors promoted cameras and sensors extensively. But our challenge wasn’t identifying lame cows—it was preventing lameness initially. That $7,200 investment in copper sulfate and consistent protocol implementation outperformed any $45,000 system for our situation.”

Training: The Foundation of Success

Here’s an uncomfortable reality that deserves discussion: operations using inadequately trained in-house trimmers can experience a 50% increase in lameness, resulting in $84,000 in additional annual losses compared to professional trimming. Think about that—inadequate training often produces worse outcomes than no trimming at all.

[The Dutch 5-Step Method – Critical Execution Points]

Step 1: Judge & Measure Inner Hind Claw

  • Target: 7.5-8cm toe length from the coronary band
  • Critical error: Measuring from the wrong reference point

Step 2: Trim Inner Claw to Correct Dimensions

  • Maintain a minimum 5mm sole thickness
  • Critical error: Over-trimming below safe threshold

Step 3: Model/Dish Out the Sole

  • Transfer weight from ulcer-prone zones to the wall/heel
  • Critical error: Creating a flat sole instead of a proper concavity

Step 4: Balance to Outer Claw

  • Match bearing surfaces for even weight distribution
  • Critical error: Using diseased outer claw as reference

Step 5: Remove Loose Horn & Apply Blocks if Needed

  • Clear all the undermined horn to prevent abscess formation
  • Critical error: Leaving loose horn creates infection pockets

Proper training requires 3-5 days of instruction + 6-12 months of supervised practice

Common critical errors I see repeatedly include:

  • Over-trimming soles below the 5mm safety threshold, essentially exposing sensitive tissue
  • Cutting toes shorter than 7.5cm, exposing the corium—that’s the living tissue within the hoof
  • Creating flat soles that concentrate pressure precisely where ulcers develop

Proper Dutch 5-step training—originally developed by Toussaint Raven and adapted for modern housed Holstein management—requires 3-5 days of intensive instruction plus 6-12 months supervised practice. This investment of $1,000 to $2,000, along with time, is essential.

Training programs consistently observe that well-intentioned but inadequately trained individuals can inadvertently create lameness through excessive trimming depth. Good intentions simply cannot compensate for technical skill deficits.

StepCritical ActionTarget SpecificationCommon Critical ErrorFinancial Impact of Error
1Judge & Measure Inner Hind Claw7.5-8cm toe length from coronary bandMeasuring from wrong reference pointFoundation failure – affects all subsequent steps
2Trim Inner Claw to Correct DimensionsMinimum 5mm sole thickness maintainedOver-trimming below 5mm thresholdExposes corium (living tissue) = immediate lameness
3Model/Dish Out the SoleTransfer weight from ulcer zones to wall/heelCreating flat sole instead of concavityConcentrates pressure exactly where ulcers develop
4Balance to Outer ClawMatch bearing surfaces for even distributionUsing diseased outer claw as referencePerpetuates imbalance and accelerates deterioration
5Remove Loose Horn & Apply BlocksClear all undermined horn completelyLeaving loose horn creates infection pocketsAbscess formation requires extended treatment
OUTCOMEProfessional Training vs. Inadequate Training3-5 days instruction + 6-12 months supervisedInformal learning without certification$84,000 annual difference: 8% vs 28% lameness

Integration: The Distinguishing Factor

What differentiates operations achieving 5% lameness from those accepting 25% isn’t superior equipment or newer facilities. It’s genuine integration—coordinated systems rather than periodic meetings.

Consider the contrast:

Typical farm communication: Monthly meetings where trimmers report “some sole ulcers,” veterinarians acknowledge concerns, nutritionists inquire about pen locations without specific data, and everyone agrees to monitor the situation.

Effective integration: Shared digital dashboards are updated in real time. When trimmers identify multiple sole ulcers in specific pens, automated alerts notify nutritionists who immediately analyze ration composition. Within 48 hours, they’ve identified and corrected nutritional imbalances.

Research comparing operations using integrated systems versus traditional communication found that the integrated farms achieved 35% better lesion identification accuracy and 48% faster treatment response. Most importantly, they prevented problems rather than simply accelerating treatment.

Biological Changes in Modern Dairy Cattle

This is crucial: today’s Holstein producing 95 pounds daily is fundamentally different from the 65-pound producer of 1995. The differences extend far beyond milk yield.

The biological adaptations are remarkable:

The digital cushion—that fat pad providing shock absorption beneath the pedal bone—now thins by 15-30% during early lactation compared to just 10-12% in the 1990s, as documented through UK ultrasound studies.

Negative energy balance now persists 100-140 days rather than the historical 60-80 days, according to metabolic research.

Chronic inflammation markers remain elevated throughout lactation, not merely during transition periods.

Genetic selection has inadvertently reduced digital cushion thickness (with heritability of 0.28-0.44) while pursuing production gains.

What required 21-28 days for healing in 1995 now takes 42-56 days, with some cows never achieving complete recovery. Even a perfect trimming technique must work within these biological constraints.

Biological Metric1990s Holstein2025 Modern HolsteinThe Critical Difference
Daily Milk Production65 lbs/day95 lbs/day+46% production
Digital Cushion Thinning (early lactation)10-12% loss15-30% loss2.5x worse shock absorption
Negative Energy Balance Duration60-80 days100-140 days75% longer metabolic stress
Healing Time for Hoof Lesions21-28 days42-56 days2x longer to heal (or never)
Chronic Inflammation DurationTransition period onlyThroughout lactationChronic inflammation = vulnerability

Creating Accountability for Results

Among all factors contributing to successful hoof health transformation, one stands out consistently: linking compensation directly to measurable lameness outcomes.

This means genuine financial accountability—not peripheral evaluation criteria or vague performance considerations, but direct compensation tied to specific results.

Successful implementations typically establish:

  • A Hoof Health Coordinator position with $45,000-55,000 base salary
  • Performance bonuses up to $20,000 based on quarterly lameness measurements
  • Clear performance scales: 18% lameness = $5,000 bonus, scaling to $20,000 at 8% lameness
  • Full authority over detection protocols, treatment coordination, and footbath management

One producer implementing this system reported: “Linking compensation directly to lameness outcomes transformed everything immediately. Footbaths operated precisely on schedule. Data entry became instantaneous. Early problem detection became standard. We invested $65,000 in the position and saved $95,000 through reduced lameness costs within twelve months.”

Practical Implementation Timeline

$65,000 is just the beginning—here’s when, where, and how the savings hit your bottom line in a single year.

For operations ready to modernize their approach, here’s what successful transitions typically look like based on observed implementations:

Months 1-2: Establish Baseline Reality

Comprehensive lameness scoring often reveals actual rates of 22-28% rather than the estimated 10%. Define responsibilities clearly and secure current trimmer support for transition plans.

Months 3-4: Infrastructure and Training

Budget $16,400-27,100 for equipment (quality used hydraulic chutes can reduce costs by 40%). Ensure designated staff receive proper Dutch 5-step certification and document all protocols comprehensively.

Months 5-6: Supervised Implementation

In-house staff work alongside professionals during each visit, building both skills and data systems while measuring all relevant metrics.

Total first-year investment typically ranges from $37,000 to $45,000, with most operations achieving break-even between months 8-12 as lameness decreases and savings accumulate.

Regional Adaptation Strategies

Successful protocols in Wisconsin may need to be modified for operations in New Mexico or Idaho. Climate variations, housing systems, and labor availability all influence optimal approaches.

California’s Central Valley operations manage heat stress that exacerbates lameness—cows stand longer attempting to cool, increasing pressure on compromised feet. Meanwhile, Northeast grazing operations might experience less concrete-related lameness but face increased challenges from infectious diseases due to higher moisture levels.

Labor availability varies dramatically, too. Wisconsin producers typically access trimmers within 50 miles, while Wyoming or Montana operations may require service calls of 200+ miles, fundamentally altering economic calculations.

Looking Ahead: The Widening Industry Gap

As we approach 2030, I’m seeing the dairy industry diverge into distinct operational tiers. And here’s what’s fascinating—it’s not about scale. I’ve observed 400-cow operations outperforming 4,000-cow facilities on lameness metrics. The distinction lies in management philosophy.

The 15-20% of operations modernizing their hoof health management are building compounding advantages: extended cow longevity (4.8 versus 2.8 lactations), reduced replacement costs, enhanced reproduction, and improved employee recruitment through professional operation standards.

The remaining 80% continue cycling through recurring problems, accepting 20-25% lameness as “industry standard” while costs escalate and competitors advance.

When producers ask about affording modernization of hoof care, I pose a different question: What’s the cost of maintaining the status quo? Each year of delay widens the competitive gap. This extends beyond the $337 per case—it determines competitive viability in five years.

Strategic Considerations for Your Operation

After observing numerous transitions, several principles emerge consistently:

The economics are compelling, but success requires systems thinking. That $337 per case represents merely the starting point—cascade benefits through reproduction, longevity, and efficiency create the real value.

Model selection should reflect operational constraints rather than theoretical preferences. Base decisions on trimmer availability, labor resources, and current lameness status.

Timing optimization can surpass technique perfection. Moving trimming after 110 DIM may improve outcomes more than flawless execution at suboptimal timing.

Professional training represents an essential investment. The difference between proper certification and informal learning literally separates 8% from 28% lameness rates.

Technology amplifies existing management quality but cannot remediate fundamental deficiencies. Establish solid foundations before pursuing technological solutions.

Most critically, linking compensation to outcomes drives genuine change. Other approaches merely hope for improvement.

Common Implementation Challenges and Solutions

What farmers are finding as they implement these changes:

Challenge: Protected time for the in-house trimmer is constantly compromised.
Solution: Schedule trimming as “first priority” morning task before other activities begin

Challenge: Data entry and tracking becomes inconsistent
Solution: Simple digital forms on tablets at chute-side, automatically syncing to management software

Challenge: Resistance from long-time employees to new protocols
Solution: Include them in training sessions, emphasize how changes make their jobs easier

Quick Start Checklist

For operations ready to begin:

☐ Score all cows for lameness to establish a true baseline
☐ Calculate your current cost per case (likely exceeding $337)
☐ Evaluate trimmer availability in your region
☐ Assess labor resources for potential in-house component
☐ Budget for equipment and training investment
☐ Define a clear accountability structure
☐ Document all protocols before implementation
☐ Establish measurement and tracking systems

The framework exists. Economic benefits are documented. Early adopters are already realizing returns. The question isn’t whether investment makes sense—it’s whether you’ll implement changes while maintaining a competitive position.

That $337 per case remains constant. But an increasing number of operations are discovering that transforming hoof health from an unavoidable cost to a managed system creates a sustainable competitive advantage.

Milk production continues regardless. The distinction lies in whether profits accumulate in your account or walk away on compromised feet.

We’d appreciate hearing about your experiences with hoof health programs—successes, challenges, and lessons learned. Please share your insights at editor@thebullvine.com to benefit the broader dairy community.

KEY TAKEAWAYS

  • The Hidden Goldmine: Every 1% reduction in lameness captures $17,400 in value. Top dairies achieving <10% lameness gain $348,000 annually through improved longevity (4.8 vs 2.8 lactations), reproduction (+8% pregnancy rate), and feed efficiency.
  • The Proven Formula: Hybrid model (monthly professional + daily in-house response) @ $62,700/year + Trimming after 110 DIM (+$308/cow) + Pay-for-performance bonuses = 50% lameness reduction in 12 months.
  • Fast Payback: Initial investment of $37,000-45,000 breaks even in 8-12 months. Wisconsin farm example: Spent $65,000 on a dedicated position, saved $95,000 in year one.
  • The 2030 Reality: With trimmers booked 3-4 months out and modern cows requiring 2x recovery time, the 20% of operations modernizing NOW will dominate. The 80% accepting “industry average” lameness face competitive extinction.
  • Your Starting Point: Score all cows (your “10%” is likely 22-28%), calculate your true cost (it’s 5x the $337 you think), then implement accountability-based compensation. This single change drives all others.

Learn More:

Join the Revolution!

Join over 30,000 successful dairy professionals who rely on Bullvine Weekly for their competitive edge. Delivered directly to your inbox each week, our exclusive industry insights help you make smarter decisions while saving precious hours every week. Never miss critical updates on milk production trends, breakthrough technologies, and profit-boosting strategies that top producers are already implementing. Subscribe now to transform your dairy operation’s efficiency and profitability—your future success is just one click away.

NewsSubscribe
First
Last
Consent

The $100,000 Winter Secret: How Systematic Dairy Farms Avoid Crisis Costs

Your barn smells like manure before feed? That’s $150K in annual losses. Here’s the 4-step fix that costs just $20K.

Executive Summary: Walk into two dairy barns during a February blizzard: one owner scrambles with frozen pipes while the neighbor executes routine protocols—that’s the $100,000 winter divide. Reactive operations hemorrhage $110,000-163,000 annually through emergency repairs, production losses, and worker injuries, while systematic farms invest just $30,000-35,000 in prevention for a 300% return within 12 months. The transformation starts with three September decisions: body condition scoring ($800 saved per thin cow), winterizing the water system ($20,000 in prevented failures), and implementing ventilation protocols ($150,000 in avoided moisture damage). Implementation takes 2-3 years total, but farms report 75% less time spent on winter tasks despite more structured protocols. Bottom line: systematic winter management isn’t about working harder—it’s about deciding in September not to be a victim in February.

Dairy Winter Management

Picture two dairy barns on a February morning when it’s -5°F outside. In the first, workers are scrambling to thaw frozen waterers while the owner calculates emergency repair costs. In the second, morning protocols proceed smoothly—waterers functioning, ventilation balanced, production holding steady.

Both operations milk similar herd sizes. Both face identical weather. Yet their financial outcomes this winter will differ by tens of thousands of dollars.

The distinction? It comes down to management philosophy. One farm approaches winter as an annual emergency to endure. The other treats it as an operational challenge to manage systematically, starting preparations when the corn is still green in early September.

Having worked with dairy operations across North America—from the harsh winters of Wisconsin and Ontario to more moderate climates in California’s Central Valley—I’ve observed that the economic gap between reactive and systematic winter management often exceeds what many producers expect. Based on university extension research and documented producer experiences, a typical 200-cow operation can see differences approaching or exceeding $50,000 annually through avoided costs and maintained production.

Now, these specific protocols prove most critical for northern-tier operations facing severe winters. A dairy in Texas or Florida adapts these principles differently than one in Minnesota. But here’s what I find fascinating—the systematic approach delivers value whether you’re dealing with frozen water lines or heat stress. It’s really about mindset more than climate.

The $100,000 Winter Divide: Reactive operations hemorrhage $136,500 annually while systematic farms invest just $32,500 in prevention—a net advantage exceeding $100,000 that proves winter management isn’t about working harder, it’s about deciding in September not to be a victim in February

Understanding the True Economics of Winter Management

Most producers grasp that winter brings additional costs. What’s less understood is how those costs compound when approached reactively versus systematically.

Looking at research from land-grant universities examining component costs reveals the fuller picture. Production losses from inadequate body condition management typically range from $25,000 to $30,000, according to work from Michigan State Extension’s dairy team. Worker injuries during cold-weather operations can reach $40,000 to $60,000 when you account for medical costs, lost productivity, and potential liability—these figures come from the National Institute for Occupational Safety and Health’s agricultural injury database. Emergency equipment repairs average between $20,000 and $35,000, according to Farm Credit’s operational cost surveys. Employee turnover stemming from difficult working conditions? That adds another $20,000 to $30,000, according to the Canadian Agricultural Human Resource Council’s workforce studies. And veterinary interventions for cold-stress-related issues add an additional $5,000 to $8,000, according to Cornell University’s veterinary economics research.

When we aggregate these components—using conservative estimates—a reactive 200-cow dairy potentially faces $110,000 to $163,000 in winter-related costs.

The systematic farms report spending roughly $30,000 to $35,000 annually on prevention to avoid the majority of these reactive costs. The net advantage often exceeds $50,000 annually, though exact figures vary based on operation size, existing infrastructure, and regional conditions.

Iowa State Extension’s dairy team has documented this pattern across dozens of operations in their management surveys. What farmers are finding is that implementing systematic protocols doesn’t mean working harder—it means approaching the challenge differently. While neighboring operations struggle with compressed margins, systematic farms maintain profitability through the winter months.

It’s worth noting that some smaller operations—particularly those with fewer than 50 cows and primarily family labor—successfully manage winter reactively. The stress and time costs remain substantial, but their lower overhead and flexibility can absorb the inefficiencies. There’s a 45-cow operation in Vermont I know that’s done it this way for three generations. It works for them. They accept the trade-offs.

I also know a 300-cow operation in upstate New York that deliberately chooses reactive management—they accept the higher costs as the price for operational flexibility. As the owner told me, “We know we’re leaving money on the table, but we value the ability to pivot quickly more than the cost savings.” For most commercial-scale operations, though? The economics strongly favor systematic approaches.

Body Condition Scoring: A September Decision with February Consequences

The evolving understanding of the impact of body condition on winter performance represents one of the most significant shifts in cold-weather dairy management. Research published in the Journal of Dairy Science, combined with feeding trials documented by Alberta Agriculture in their Winter Feeding Guidelines, demonstrates that a thin cow entering winter faces metabolic demands costing $500 to $800 more in feed, lost production, and health interventions compared to a properly conditioned cow.

Let me walk through the physiological mechanisms, because once you understand what’s happening inside that cow, the September decisions make a lot more sense.

September’s Body Condition Secret: A thin cow loses 14°F of cold tolerance, burns 24% more energy at mild winter temperatures, and suffers up to 10% digestive efficiency loss—costing $500-800 per head in a metabolic trap that additional feed alone cannot fix once winter arrives

A cow maintaining an optimal body condition score of 3.0 on the five-point scale sustains her lower critical temperature around 19°F. That’s based on research from the University of Nebraska’s beef and dairy extension program, confirmed by similar work from Manitoba Agriculture. When body condition drops to 2.0 to 2.5—and this happens constantly in herds pushing for maximum butterfat performance through summer—that threshold shifts dramatically upward to 32-33°F.

Think about what this means operationally: a 14-degree reduction in cold tolerance based solely on body reserves.

At 20°F—which many of us in the Midwest consider a mild winter day—that underconditioned cow requires approximately 24% additional energy simply for thermoregulation. But here’s where it gets worse. She’s simultaneously experiencing 5 to 10% reduced digestive efficiency as cold stress compromises rumen function and feed passage rates. Michigan State’s Department of Animal Science has documented this repeatedly in both research trials and farm observations.

The research consistently demonstrates that correcting poor body condition is impossible once winter arrives. Metabolic demands escalate while digestive capacity diminishes. You’re caught in a physiological trap that additional feed alone cannot overcome.

For a 200-cow herd where 20% of animals enter winter underconditioned—not uncommon in operations facing drought-stressed forages or those really pushing lactation curves through transition periods—the September body condition scoring decision carries $20,000 to $30,000 in winter cost implications.

A producer in central Wisconsin told me last year, “I never believed body condition mattered that much until I actually tracked the feed costs and health bills. Now I start thinking about winter body condition in July.” That’s the mindset shift we’re seeing.

Moisture Management: The Hidden Crisis in Barn Environment Control

Each mature dairy cow contributes 10 to 15 gallons (38-57 liters) of moisture to the barn environment daily through respiration, perspiration, and evaporation from waste—a figure documented by agricultural engineers at universities like Penn State and Wisconsin in their ventilation design guides. For a 200-cow barn, we’re talking over 3,000 gallons of water vapor requiring removal through ventilation systems every 24 hours.

The Hidden Moisture Penalty: Each mature dairy cow contributes 10-15 gallons of daily moisture—over 3,000 gallons in a 200-cow barn—that when improperly managed through inadequate ventilation drives $150,000 in annual losses while the fix costs just $20,000 with payback in the first winter

The first time I shared that 3,000-gallon figure with a producer, he didn’t believe me. We actually set up collection tarps and measured condensation over 48 hours. The numbers don’t lie.

Research from Wisconsin’s School of Veterinary Medicine’s dairy housing recommendations reveals that when barn humidity exceeds 80%, airborne bacterial survival extends dramatically—from minutes under dry conditions to potentially months in humid environments. The specific mechanism involves moisture protecting bacteria from desiccation while providing a medium for reproduction.

What’s particularly interesting here is how this plays out differently across regions. In Georgia, where I consulted with a 400-cow operation last spring, their challenge isn’t cold—it’s managing 90% humidity during their wet winters. They use the exact same systematic ventilation approach we recommend up north, just for different reasons.

Dairy ventilation specialists across the Midwest have documented consistent operational impacts. Pneumonia incidence increases approximately 40% in high-humidity environments compared to properly ventilated barns. Hoof disease rates climb 25% as moisture softens hoof walls and promotes bacterial growth, particularly digital dermatitis. Milk production typically drops 10 to 15% as cows divert energy toward maintaining homeostasis in these suboptimal conditions.

For a 200-cow operation, when you combine lost production, increased disease treatment, infrastructure degradation from condensation, and elevated labor costs responding to health crises, inadequate moisture management can cost well over $150,000 annually, based on component cost analyses from multiple university studies.

The encouraging news? Solutions cost a fraction of the problem. Proper ventilation systems—prioritizing cold, dry conditions over warm, damp environments—require initial investments of $15,000 to $20,000 for retrofit installations, according to agricultural engineering estimates from the Midwest Plan Service. The return becomes apparent within the first winter season.

Looking ahead, as we see more variable weather patterns—like the extreme temperature swings experienced in recent years—moisture management will likely become even more critical. The operations getting this right now are positioning themselves for long-term success, regardless of what climate change throws at us.

Rethinking Barn Temperature: Why Heating Isn’t the Answer

A persistent misconception I encounter weekly involves the perceived need to heat dairy barns during winter. And I mean weekly—just yesterday, a producer from northern Minnesota called asking about heating options.

“I can’t afford to heat the barn and run ventilation simultaneously,” he said. He was spending $3,000 monthly trying to keep his freestall barn at 45°F.

This perspective overlooks fundamental bovine physiology that agricultural engineers have understood for decades.

Mature dairy cows generate approximately 4,800 BTU per hour each, according to calculations from the Ontario Ministry of Agriculture, Food and Rural Affairs (OMAFRA Publication 833) and confirmed by similar research from Midwest universities. Let’s put that in perspective. A 200-cow herd produces heat equivalent to nine 100,000 BTU furnaces operating continuously. The cows themselves are literally the heating system.

Michigan State Extension Bulletin E-3090 on dairy ventilation clearly emphasizes this principle. When you enter a barn where manure odor predominates over feed aromas, humidity levels are excessive, and ventilation is inadequate. The solution is to accept that cattle thrive at temperatures humans find uncomfortable rather than adding supplemental heat.

What we’re seeing on successful systematic operations from Vermont to Alberta are consistent principles. Keep barn temperatures as low as possible without causing equipment failures—typically, this means maintaining just above 32°F in areas with water lines. Keep ridge ventilation at maximum capacity throughout the winter months, aiming for a minimum of 4 to 8 air changes per hour. Provide workers with appropriate cold-weather clothing rather than attempting barn heating for human comfort. And always prioritize cold, dry conditions over warm, damp environments.

Research from Penn State Extension examining thermal comfort zones (documented in their Special Circular 397) confirms dairy cattle maintain productivity within a thermoneutral zone ranging from 41 to 77°F. Well-fed, dry-coated Holstein cows can tolerate temperatures approaching 5°F before requiring additional energy for thermoregulation beyond normal metabolic heat production.

These animals evolved for cold climates. They become stressed by heat, not cold. Your ventilation strategy should reflect bovine physiology, not human comfort preferences.

Even in warmer climates, these principles apply. That Georgia dairy I mentioned earlier? They use the same systematic ventilation approach—not for cold stress, but to manage humidity during their wet winters. The systematic mindset translates across latitudes.

Water System Management: Preventing the Costliest Winter Crisis

Among winter equipment failures, frozen water systems create the most immediate and severe consequences. Operations can lose $10,000 in 48 hours from one frozen water line. The cascade effect is remarkable—and remarkably expensive.

Research from New Mexico State University’s Cooperative Extension Service dairy management bulletin shows that cows deprived of water for 24 hours can lose over 10 pounds of daily milk production, with high producers experiencing even greater losses. For a 200-cow herd at current milk prices, this represents over $800 in lost revenue per day, before accounting for potential metabolic issues from dehydration.

A Wisconsin operation milking just over 4,000 cows across two sites experienced three major water system failures during the winter of 2018, before implementing systematic prevention measures. Each incident cost between $8,000 and $10,000 in repairs, production losses, and overtime labor. The owner told me, “That winter taught us prevention costs pennies compared to reaction.”


Metric
Preventive ApproachReactive ApproachDifference
Initial Investment$4,000-5,000$0
Annual Maintenance$1,000-1,500$0
Average Annual Failures$0$20,000-25,000$20K-25K savings
Revenue Loss Per Incident$0$800/dayCrisis avoided
Milk Production ImpactNone10+ lbs/cow/24hrsStable production
Emergency Response TimeProactiveHours-DaysNo downtime
Total Annual Cost$1,000-1,500$20,000-25,000$18.5K-23.5K savings
ROI TimelineImmediateN/A (loss)1,800%+ ROI

Looking at systematic farms — from Vermont’s smaller operations to Alberta’s larger dairies —successful preventive protocols share common elements.

During October, they test every heating element under load for 24 to 48 hours, documenting wattage draw to establish performance baselines. The University of Minnesota Extension’s winter prep guidelines recommend replacing elements drawing 10% below specifications—they’re failing but haven’t quit yet. Critical operations install redundant heating systems on separate electrical circuits. One fails? The backup’s already running.

Throughout winter, these operations conduct twice-daily water system checks at a minimum, typically at 6 AM and 6 PM, with additional checks during extreme cold (below -10°F). They maintain temperature-triggered intervention protocols. Backup generator capacity specifically sized for water systems proves essential. And they prepare emergency water sources before they’re needed, not during a crisis.

This preventive approach requires initial investments of $4,000 to $5,000, then $1,000 to $1,500 annually for maintenance and monitoring. Compare this to Farm Credit Canada’s risk analysis, showing reactive farms averaging $20,000 to $25,000 in water system failures per winter. The return on investment is immediate and substantial.

Even producers who remain somewhat reactive in other areas tell me water system prevention is non-negotiable. As one put it, “Everything else can wait a few hours. Water can’t.”

WINTER PREPARATION CHECKLIST

September: Assessment & Planning □ Body condition score all animals (target BCS 3.0-3.5)
□ Schedule October equipment servicing
□ Secure winter fuel contracts
□ Evaluate feed inventory for winter needs
□ Review previous winter’s near-miss reports

October: Infrastructure Preparation □ Test all water heating elements under load (24-48 hours)
□ Service all equipment (tractors, generators, loaders)
□ Install heat tape and insulation (minimum R-3) on exposed pipes
□ Stockpile 2-week minimums (feed, bedding, supplies)
□ Check and repair barn ventilation systems

November: Systems & Training □ Full generator load testing (4+ hours continuous)
□ Emergency response drills with the entire team
□ Winter safety training (hypothermia recognition)
□ Final pre-winter facility walkthrough
□ Post emergency contact lists in multiple locations

December-February: Active Management □ Twice-daily water checks (6 AM, 6 PM minimum)
□ Temperature-based monitoring protocols
□ Weekly near-miss review meetings
□ Continuous system improvements
□ Document all incidents for next year’s planning

Developing Safety Culture: Beyond Compliance to Commitment

Near-miss reporting systems represent an underutilized opportunity in dairy operations. Construction industry research published in the Journal of Safety Research demonstrates that structured reporting reduces accidents by 64%. When agricultural operations implement similar systems—and precious few do—they report comparable improvements.

But here’s the challenge I see constantly: implementation requires genuine commitment from ownership. This cannot be delegated or treated as a compliance checkbox.

The process begins with the ownership making a public commitment to non-punitive reporting during a full-team meeting. Not a memo posted on the bulletin board, but a face-to-face conversation that establishes trust. You need clear distinctions between reportable mistakes and cardinal violations. Operating equipment while impaired? That’s a cardinal violation requiring disciplinary action. Forgetting to engage a safety guard? That’s a reportable near-miss requiring system improvement, not punishment.

Multiple reporting channels accommodate different comfort levels—paper forms in the break room, digital options through smartphones, and anonymous boxes for sensitive issues. The critical element involves responding within 24 to 48 hours. When employees observe reported near-misses generating rapid improvements rather than blame, trust develops quickly.

A Wisconsin operation with about 230 cows and six full-time employees transformed from experiencing 2 to 3 injuries annually to zero lost-time incidents over 2 years. They report saving approximately $30,000 annually in avoided injury costs. Their workers’ compensation premiums declined 22% at the last renewal.

The owner’s perspective is telling: “I was skeptical about non-punitive reporting. Seemed like giving people a pass for mistakes. But when we started fixing problems instead of finding fault, everything changed. Employees started telling us about issues we never knew existed.”

For a typical 200-cow operation employing eight workers, implementing comprehensive near-miss reporting costs approximately $4,000 to $5,000 annually. Based on USDA agricultural injury statistics, this investment could prevent $25,000 to $35,000 in injury-related costs.

This development suggests that as younger generations enter dairy management—often with safety training from agricultural programs—we’ll see accelerated adoption of these protocols.

Strategic Timeline: September Through February

Successful transformation from reactive to systematic management follows a predictable timeline. The key is starting early—in September, not November.

A Pennsylvania producer described his evolution perfectly: “We used to scramble every November, trying to prepare for winter that was already arriving. Now we start in September when it’s still 70 degrees and pleasant. Everything’s easier, cheaper, and more thorough.”

The breakdown of what this looks like operationally:

September becomes your assessment month. Body condition scoring takes one person approximately two days for a 200-cow herd. This establishes nutritional interventions for thin cows while there is still time for improvement. I recommend scoring on the same day each year—it creates a rhythm. Equipment servicing gets scheduled for October. Fuel supplies receive evaluation with winter delivery contracts secured.

October is infrastructure month. Every water heating element undergoes load testing. Not just checking if they turn on—actually measuring amperage draw. Tractors, skid loaders, and generators receive comprehensive servicing. Exposed water lines get winterized with heat tape and insulation. Operations stockpile two-week minimums of critical supplies.

November focuses on systems and people. Generators undergo full load testing—actually powering critical systems for several hours. Emergency response drills engage the entire team. What happens if we lose power for 48 hours? Winter safety training covers hypothermia recognition and emergency protocols.

December through February represents active management rather than crisis response. Daily protocols adjust based on temperature conditions. Above 20°F, standard checks. Below zero, hourly monitoring. Teams implement continuous improvements based on observations.

Farm Management Canada’s analysis comparing proactive versus reactive management reveals systematic farms investing $20,000 to $25,000 in preparation to avoid $60,000 to $70,000 in winter crisis costs—a net advantage often exceeding $40,000.

Overcoming Implementation Barriers

The primary obstacle to change isn’t financial or technical—it’s psychological. The Canadian Agricultural Human Resource Council’s survey indicates that over 75% of farmers report feeling overwhelmed and trapped in reactive patterns.

“I’m too busy fighting today’s fires to install prevention systems,” producers tell me constantly. But that reveals the fundamental paradox—the constant crisis management is exactly what prevents systematic improvement.

How do farms successfully break this cycle?

They start small, typically with water winterization due to clear, rapid returns. Success with one system builds confidence for expansion. A Vermont producer running 150 Jerseys told me, “Once we stopped having water crises, we realized how much time we’d been wasting. That motivated us to systematize other areas.”

Documentation proves critical. Track actual time and costs comparing reactive versus systematic management. When producers see they’re spending 40 hours monthly on emergencies versus 10 hours on prevention, the economics become undeniable.

Trust develops gradually through consistent actions. Near-miss reporting demonstrates a non-punitive culture when reports generate improvements rather than punishment. An employee on a Minnesota dairy told me, “When I reported a ladder problem and saw it fixed the next day with no questions asked, I started reporting everything that seemed unsafe.”

What I’ve noticed is that operations using farm management software and IoT sensors for monitoring find the transition to systematic management easier. The technology provides the data backbone that enables systematic approaches to be more manageable.

The Compounding Winter Divide: While systematic farms achieve 300% ROI in Year 1 and accumulate $279,500 in net savings by Year 3, reactive operations hemorrhage over $409,500 in the same period—a staggering $689,000 financial gap that proves winter management philosophy determines profitability more than any other single factor

February’s Revealing Truth

Winter exposes operational realities that summer’s favorable conditions mask. February particularly reveals the difference between surviving and thriving.

After evaluating hundreds of operations, one indicator consistently distinguishes thriving farms: employee understanding. Ask any worker why they perform a specific task a certain way. If they can explain both the procedure and rationale, you’re observing systematic management in action.

Lactanet Canada’s performance indices reveal an interesting pattern that holds true across borders. The highest-scoring farms don’t necessarily achieve maximum per-cow production. Instead, they maintain remarkable consistency across all performance metrics—production, reproduction, health, and longevity.

Walking through a thriving February dairy reveals distinct characteristics. Body condition scores cluster tightly around 3.0-3.5. Waterers function reliably without daily crisis interventions. Barn temperature sits at 25°F when it’s -5°F outside—by design, not accident. Performance data appears where employees actually reference it. Equipment operates on maintenance schedules rather than emergency repair cycles.

What’s particularly noteworthy is that these outcomes occur regardless of which employees are working or the prevailing weather conditions. The system functions independent of individuals. That’s systematic management.

Practical Implementation for Your Operation

Looking at the evidence, the financial gap between reactive and systematic approaches can exceed $50,000 annually for a typical 200-cow dairy. Your specific figures will vary based on herd size, geographic location, existing infrastructure, and management capacity. But the direction remains consistent—systematic beats reactive.

Where should you start? Water system winterization offers the most immediate returns with visible results that build confidence. September body condition assessment determines February profitability—each underconditioned cow entering winter represents $500 to $800 in unrecoverable costs.

Understanding cows as heat generators rather than cold victims reshapes ventilation strategies. A quality insulated coverall costs $200 per employee. A sick cow from poor ventilation costs at least $300. The math is straightforward.

Cultural elements ultimately determine success. Near-miss reporting succeeds only with genuine trust and consistently non-punitive responses. When appropriately implemented—and it takes commitment—injury rates decline substantially.

Interestingly, systematic farms consistently report spending less total time on winter management despite more structured approaches. The perception of being “too busy to plan” often perpetuates reactive patterns.

Don’t attempt a comprehensive transformation immediately. Implement one system successfully this year. Document the results. Build momentum. While a complete, systematic transformation typically takes 2 to 3 years, returns begin within months.

Looking ahead, emerging technologies such as automated monitoring systems and IoT sensors will likely make systematic management even more accessible and cost-effective. The farms building these foundations now will be best positioned to leverage these advances.

The Bottom Line

As climate patterns become more variable and economic margins continue tightening, winter management approaches must evolve accordingly. Every operation faces a fundamental choice: continue accepting substantial reactive costs as inherent to dairy farming, or invest in systematic protocols that turn winter from a liability into a manageable operational period.

The systematic farms succeeding today don’t benefit from superior weather or advantageous genetics. They’ve shifted from treating winter as an annual surprise to approaching it as a manageable operational challenge.

A Wisconsin producer who transformed his 280-cow operation over three years captured this perfectly: “You’re not too busy to implement systematic management. You’re too busy because you haven’t implemented it yet.”

The decision is yours. This coming February will be here regardless of preparation levels. Will your operation be reacting to a crisis or executing established protocols?

The $50,000 question isn’t whether you can afford to systematize. It’s whether you can afford not to.

FINAL KEY TAKEAWAYS:

  • The $100K bottom line: Systematic farms invest $30K in prevention to avoid the $130K reactive farms lose each winter—a 300% ROI starting year one
  • Water winterization delivers instant returns: $200 heating element prevents $10,000 frozen pipe disaster—start here for immediate 500% ROI
  • September body condition scoring saves $800 per cow: Thin cows need 24% more energy at 20°F, but can’t eat enough to compensate—fix condition before winter
  • The nose knows: Smell manure before feed in your barn? That’s $150K in annual moisture damage—proper ventilation costs $20K once
  • Less work, more profit: Systematic farms spend 75% less time on winter management while earning $50K+ more—because prevention takes minutes, crisis takes days

Resources for Winter Management Success

Body Condition Scoring: University of Wisconsin Extension Publication A3948
Ventilation Design: Penn State Extension Special Circular 397
Cold Stress Management: Michigan State Extension Bulletin E-3090
Water System Winterization: Ontario Ministry of Agriculture (OMAFRA) Publication 833
Safety Culture: Visit the National Safety Council’s agricultural division website (nsc.org) for templates
Economic Analysis Tools: Farm Management Canada’s risk assessment resources at fmc-gac.com
Weather Monitoring: NOAA’s agricultural weather portal at weather.gov/agriculture

Complete references and supporting documentation are available upon request by contacting the editorial team at editor@thebullvine.com.

Learn More:

Join the Revolution!

Join over 30,000 successful dairy professionals who rely on Bullvine Weekly for their competitive edge. Delivered directly to your inbox each week, our exclusive industry insights help you make smarter decisions while saving precious hours every week. Never miss critical updates on milk production trends, breakthrough technologies, and profit-boosting strategies that top producers are already implementing. Subscribe now to transform your dairy operation’s efficiency and profitability—your future success is just one click away.

NewsSubscribe
First
Last
Consent

Seven Sellers, No Buyers: The Dairy Market Signal Every Producer Must Understand Now

I’ve tracked dairy markets for 30 years. Today scared me. Not because prices fell—because buyers completely disappeared.

EXECUTIVE SUMMARY: Seven sellers, zero buyers—this morning’s milk powder market freeze signals something unprecedented: not a cycle, but permanent structural change. Every major dairy region is expanding while demand evaporates, heifer shortages lock in oversupply for three years, and processors just invested $11 billion betting on a future without most current farms. Your debt-to-asset ratio determines survival: under 45% should acquire distressed neighbors; 45-60% must cut costs by 15% and find partners; and over 60% need to exit now while equity remains. The window is 90 days, not the year most assume. This isn’t temporary pain—it’s the largest dairy restructuring in modern history, and your response today determines whether you exist in 2030.

Dairy Profitability Strategy

You know, I’ve been watching dairy markets for a long time, and what happened on the Chicago Mercantile Exchange this morning still has me shaking my head. Seven sellers showed up with nonfat dry milk priced at $1.14 per pound. Not a single buyer stepped forward.

Not one.

Here’s what’s interesting—in thirty years of tracking these markets, I’ve never seen anything quite like it. This isn’t just about powder prices being weak, which we’ve all lived through before. What we’re looking at is something deeper. For an industry built on the assumption that markets always clear, we just watched a market refuse to function. And if you’re milking cows anywhere in North America right now, that silence from the trading floor should be telling you something important about what’s coming.

Mark Stephenson, at the University of Wisconsin’s Center for Dairy Profitability, has been modeling these markets since the 1980s. When we talked yesterday, he said something that really stuck with me: “This is more like a structural market shift than the typical cycles we’re used to riding out.” Coming from someone who’s advised USDA on pricing policy for decades, that’s… well, that’s worth paying attention to.

Four Forces Creating Something We Haven’t Seen Before

Let me walk you through what’s actually happening out there. It’s the combination that’s unprecedented, not any single factor.

Everyone’s Making More Milk at the Same Time

Breaking the Pattern: For the first time in modern dairy history, every major milk-exporting region is expanding production simultaneously. Argentina’s explosive 9.9% growth leads the synchronized surge that’s flooding global markets while buyer demand evaporates—a structural shift that changes everything farmers thought they knew about supply cycles.

So the latest USDA National Agricultural Statistics Service report shows U.S. milk production jumped 3.3% year-over-year in August—we’re talking 18.8 billion pounds across the 24 major states. We’ve added 172,000 cows to the national herd. Production per cow averaged 2,068 pounds, which is 28 pounds above last August.

Now, normally, when we expand, somebody else contracts. That’s been the pattern, right? But here’s what caught my attention: New Zealand’s September milk collection hit 2.67 million tonnes, up 2.5%, with milk solids jumping 3.4% year-over-year. The Dairy Companies Association of New Zealand tracks all this. Argentina’s production? Their Ministry of Agriculture reports it rose 9.9% in September. The Netherlands is up 6.7% according to ZuivelNL. Europe’s August production across major exporters increased by 3.1%, according to the European Milk Board.

RaboBank’s latest global dairy quarterly—and they’ve been tracking this for decades—points out something we haven’t seen before: synchronized global expansion. In past cycles, when the U.S. expanded, Europe generally contracted. When New Zealand surged, Argentina pulled back. That regional offset gave us a natural market balance. But everyone is expanding together? That’s new territory.

And it’s not just weather luck either. Ireland’s dealing with one of their wettest autumns in years, according to Met Éireann, yet they’re still producing above year-ago levels. Australia’s coming off drought, expecting La Niña rains, and they’re expanding. Even producers in the Southeast U.S.—where heat stress usually limits summer production—are reporting gains. Everyone’s betting on the same hand, which… well, you know how that usually works out.

The Heifer Problem Nobody Wants to Talk About

According to the USDA’s January 2025 Cattle inventory report, we’re sitting at 3.914 million dairy heifers—that’s 500 pounds and over, ready to enter the milking string. Lowest since 1978.

Let that sink in for a minute.

What’s fascinating is how we got here. The National Association of Animal Breeders’ data shows beef semen sales to dairy farms reached 7.9 million units in 2023—that’s 31% of all semen sales to dairy farmers. CattleFax, which tracks these crossbred markets pretty closely, estimates we went from just 50,000 beef-dairy crossbred calves in 2014 to 3.22 million in 2024.

I get it—when Holstein bull calves are bringing $50 to $150 at local auctions and crossbreds are fetching $800 to $1,000, the math’s pretty simple. But here’s the kicker: even if milk hits $25 per hundredweight tomorrow, University of Wisconsin dairy management specialists show meaningful herd expansion now takes a minimum of three years. The old supply response mechanism that we all grew up with? It’s broken.

What I’ve found, talking to producers across Wisconsin and the Pacific Northwest, is that they’ve been breeding for beef for three, four years now. Even if they wanted to expand, where are the heifers coming from? And at what price? Local sale barns that used to have dozens of springing heifers might have three or four. Maybe.

Processors Are Betting Big While Farmers Bleed

The Industry’s Biggest Gamble: Processors wagered $11 billion on surging milk supply just as the heifer pipeline collapsed to 1978 levels. This chart shows why Mark Stephenson calls it “structural change”—the replacement heifers needed to fill those new plants won’t exist until 2028, and by then, thousands of farms will have already made irreversible exit decisions

This one really gets me. While we’re looking at Class IV at $13.75, against production costs, 2025 benchmarking data for Northeastern operations puts around $14.50 per hundredweight. The International Dairy Foods Association announced more than $11 billion flowing into 53 new or expanded dairy processing facilities across 19 states through 2028.

Michael Dykes, IDFA’s President and CEO, isn’t shy about it: “Investment follows demand. The scale of what’s happening is phenomenal.” Joe Doud, who was USDA’s Chief Economist under Secretary Perdue, goes even further—he calls this $10 billion investment surge unprecedented in U.S. agricultural history.

What’s happening here? These processors aren’t looking at October 2025 CME spot prices. They’re positioning for 2030 and beyond, based on the Food and Agriculture Organization’s 2024 Agricultural Outlook, which projects 1.8% annual global protein demand growth through 2034. Meanwhile, we’re trying to figure out how to make November’s feed payment.

You’ve got fairlife building a $650 million facility near Rochester, New York. Leprino Foods is constructing a $1 billion plant in Lubbock, Texas. They’re not stupid—they see something from their boardrooms that maybe we’re missing from the milk house.

China Changed the Game and Nobody Noticed

The Market That Vanished: China’s dairy strategy flip explains today’s seven-sellers-zero-buyers crisis. They’re not buying less dairy—they’re building domestic commodity powder plants while importing high-value cheese and specialized proteins. For U.S. farmers who built their businesses on Chinese powder demand, this isn’t a cycle—it’s permanent market restructuring.

U.S. Dairy Export Council data from May 2025 shows our nonfat dry milk exports to China are down nearly 80%. Low-protein whey? Down 70%. Through July, China’s General Administration of Customs reports total dairy imports reached 1.77 million tonnes—up 6% year-over-year but still 28% below the 2021 peak.

But here’s what I find really interesting when you dig into the trade data: they’re buying cheese—up 22.7%—and specialized ingredients like milk protein isolates while avoiding commodity powders. China’s shifting from volume to value, and we built all this powder capacity for demand that’s evaporating.

Texas A&M’s Agricultural Economics Department has been tracking this shift. Their analysis suggests that China’s building domestic capacity for elemental powders but is importing sophisticated products that its plants can’t make efficiently. It’s looking like a permanent shift, not a temporary one.

Understanding Your Real Options

Debt-to-Asset RatioYour RealityAction RequiredRevenue OpportunitiesTimelineEquity at StakeMonthly Impact (per 100 cows)
Under 45%Well-CapitalizedStrategic ExpansionForward contracts: $1.00-1.50/cwt premium
Acquire neighbors at 20-30% discount
90-120 days to lock contractsExpansion at favorable terms+$2,400 with premium contracts
45-60%Mid-Tier SqueezeCost Reduction + PartnersDairy Revenue Protection
15% cost cuts required
60 days to implement cutsSurvival: maintain current equity-$750 current bleeding
Over 60%DistressedStrategic Exit NOWExit while preserving equity30-60 days before options vanishProactive: 60-75% preserved
Forced: 40-45% preserved
-$1,500+ and accelerating

After talking with extension specialists and lenders across the country this week, what’s becoming clear is that waiting for “normal” isn’t a strategy anymore. The math doesn’t support it, and neither does the calendar.

Path 1: Strategic Expansion

For operations with debt-to-asset ratios below 45% and strong cash flow, this downturn presents acquisition opportunities. Farm Credit Services analysis shows distressed sales starting at 20-30% below replacement cost. But—and this is important—these deals require creativity.

What’s working, based on case studies from the University of Wisconsin’s Center for Dairy Profitability and Cornell’s PRO-DAIRY program, is seller-financed arrangements that preserve more equity for the seller than foreclosure would. You might offer 20% below market value, but with financing at reasonable rates over seven years, maybe include a management position. The seller preserves dignity and more equity, and you gain capacity at favorable terms.

This only works if you’ve got the balance sheet for it. Operations in this category can also negotiate forward supply commitments with processors building new capacity. We’re seeing premiums of $1.00 to $1.50 per hundredweight for multi-year contracts in some regions.

I’ve noticed that Southeast operations are particularly successful with this approach. One producer milking about 1,200 cows in Georgia just locked in a seven-year contract with a new processor at $1.35 over Class III. “Yeah, we might miss some price spikes,” they mentioned, “but I can budget, I can sleep at night, and I know I’ll still be here in 2030.”

Path 2: Find Your Niche

Penn State Extension has documented several successful transitions to organic production with on-farm processing. The numbers are tough initially—certification costs, learning curves, building customer bases. But producers who’ve made it through report premiums of $20 or more per hundredweight over conventional milk.

The catch? You need capital. Penn State’s business planning specialists say successful transitions require an upfront investment of $150,000 to $200,000 and 18 to 24 months to achieve positive cash flow. Plus, you need to be within a reasonable distance of affluent consumers.

Some Texas operations have gone a different route—100% grass-fed, certified by the American Grassfed Association, and selling direct to restaurants and farmers’ markets. It might be 40% of the previous volume, but at significantly higher prices. Feed bills drop dramatically—just hay in drought months.

In Minnesota, some mid-sized operations—we’re talking 400 to 500 cows—have locked in contracts with local cheese plants specializing in European-style aged cheeses. These plants need consistent butterfat over 4.0%, which Jersey and crossbred herds can deliver. The premium’s worth it.

What’s encouraging is that robotic milking systems are becoming viable for these mid-tier operations too. Michigan State University research shows that operations with 180-240 cows can justify two robots, especially when labor’s tight. The capital cost hurts—$150,000 to $200,000 per robot—but some producers are finding it lets them stay competitive without massive expansion.

Path 3: Strategic Exit

This is the hardest conversation, but it needs to be had. Farm Credit specialists and agricultural finance research consistently indicates that proactive sales generally preserve 60-75% of equity compared to 40-45% in forced liquidation scenarios.

What’s encouraging is that some larger neighbors need experienced managers and are offering employment as part of acquisition deals. You might sell your operation but stay on at $65,000 to $75,000 plus housing for two years. It’s not ideal, but it beats losing everything.

There’s also the generational transfer angle nobody likes discussing. If the next generation isn’t interested or capable, forcing succession can destroy both farm equity and family relationships. Sometimes the strategic exit is selling to a neighbor while you can still set terms, rather than leaving an impossible burden for your kids.

How Cooperatives Navigate Conflicting Interests

One thing that’s really striking me lately is how cooperative dynamics change during consolidation. That traditional one-member, one-vote structure assumes everyone’s interests align. But what happens when they don’t?

Most folks don’t realize how co-op equity actually works. Those capital retains—CoBank’s Knowledge Exchange program analysis puts them at $0.20 to $0.40 per hundredweight, typically—accumulate over decades. But here’s what nobody tells you: redemption timelines are stretching to 15-25 years as co-ops prioritize expansion over paying out equity.

Run the math with me. A 500-cow operation producing 11,000 pounds per cow monthly contributes roughly $118,800 annually in retained patronage at $0.30 per hundredweight average. Over 20 years, that’s $2.4 million accumulated. But with 2.5% annual inflation per Federal Reserve data, the real purchasing power of that equity drops nearly 40% over a 20-year redemption period.

Co-op board dynamics are shifting, too. The new plants being built require 4 million pounds per day. A 300-cow operation produces maybe 20,000 pounds. Operations with 5,000 cows? They’re producing 325,000. The voting structure might be democratic, but economic realities create different levels of influence.

Regional Realities: Where This Hits Hardest

Looking at how this plays out across different dairy regions, the impacts vary dramatically based on existing farm structure and local economics.

Wisconsin’s Challenge

Based on historical consolidation patterns analyzed by the University of Wisconsin-Madison’s Program on Agricultural Technology Studies, Wisconsin could see closure rates potentially affecting 30-40% of remaining operations over the next five years if current trends continue.

Wisconsin Agricultural Statistics Service data shows the average Wisconsin farm has 234 cows producing 24,883 pounds annually. They’re not inefficient—they’re just caught in scale economics that no longer work. Every service business in these rural towns depends on dairy. Lose the farms, and you lose the schools, the equipment dealers, the feed mills… everything that makes these communities work.

California’s Water-Driven Consolidation

Tulare County’s average herd size is already around 1,840 cows, according to California Department of Food and Agriculture data. Even here, consolidation continues. But it’s different—it’s about water more than milk prices.

Dr. Jennifer Heguy, who’s the UC Cooperative Extension Dairy Advisor for Merced, Stanislaus, and San Joaquin counties, points out that water rights are becoming more valuable than the dairy infrastructure itself. The implementation of the Sustainable Groundwater Management Act means that operations without secure water face impossible decisions. Farms are merging primarily to secure water portfolios—one farm with senior water rights can support three without.

Pennsylvania’s Plain Community Crisis

This situation is particularly complex. Lancaster County has about 1,480 dairy farms, averaging 65 cows each, most run by Amish and Mennonite families. Penn State Extension research indicates these smaller operations face severe economic pressure at current milk prices.

For Plain communities, the implications go way beyond economics. Farming isn’t just an occupation—it’s integral to their way of life and faith practice. When families can’t farm, they often have to relocate to areas with available land, which can mean leaving established communities entirely.

What Successful Producers Are Doing Right Now

CategoryValue ($/cwt or as noted)Implementation TimelineDifficulty Level
Class IV Milk Price (Oct 2025)$13.75 Current marketGiven
Production Cost (Northeastern avg)$14.50 Fixed costGiven
Current Loss per cwt($0.75)Immediate issueCrisis
REVENUE OPPORTUNITIES:
Forward Contract Premium+$1.00 to $1.5090-120 days to lockMedium – negotiation required
Carbon Credits (per cow/year)$400-450 total6-12 months to implementHigh – capital intensive
Component Premium (>3.3% protein)+$0.30 to $0.5030-60 days to optimizeLow – nutritionist consult
Dairy Margin Coverage ($9.50)Coverage variesImmediate enrollmentLow – paperwork only
POTENTIAL MONTHLY IMPACT (300 cows):
Base milk revenue (20,000 lbs/cow)$82,500 Baseline calculation
Forward contract bonus$6,000 If contracted by Jan 31
Carbon credits (monthly)$1,125 Annual avg, 6mo lag
Component premiums$1,800 Ration adjustment 60 days
DMC protection value$1,200 Policy dependent
Total potential monthly revenue$92,625 With all strategies
Current monthly cost$87,000 300 cow baseline
Net monthly margin (best case)$5,625 All strategies deployed
Net monthly margin (current)($4,500)No action taken

Here’s what’s actually working for farmers navigating this successfully—and I mean actually working, not theoretical strategies.

Financial scenario planning has become essential. Running spreadsheets with milk at $12, $14, $16 for the next 24 months shows you exactly when you hit critical triggers. As many producers are learning, hope isn’t a business plan.

The smart ones are approaching lenders proactively. If you know Class III staying below $16 through March means you’ll need to restructure, start that conversation now when you still have options. Waiting until February when you’re forced into it? That’s a different conversation entirely.

Carbon credits are becoming real money, too. Programs like those from Indigo Agriculture, implementing cover crops and manure management changes, can generate $400 to $450 per cow annually once fully implemented. On 600 cows, that’s $250,000—potentially the difference between surviving and not.

Don’t forget about Dairy Margin Coverage either. The program’s been recalibrated, and at current feed costs versus milk prices, even the $9.50 coverage level can provide meaningful protection. It’s not a complete solution, but combined with Dairy Revenue Protection for Class IV producers, it’s essential risk management.

Feed procurement matters enormously right now. With December corn at $4.28 per bushel on the Chicago Board of Trade, locking in winter needs makes sense. Nutritionists working with Pennsylvania dairies report clients who contracted 70% of their corn silage needs back in August are paying $10 to $12 less per ton than those buying now.

Component premiums deserve attention, too. At 3.3% protein or higher, most processors pay premiums of $0.30 to $0.50 per hundredweight, according to Federal Milk Market Administrator reports. Dr. Mike Hutjens, professor emeritus at the University of Illinois, has shown that reformulating rations to push protein might cost an extra $0.75 per cow per day but return $1.20 in premiums. That’s $165 net per cow annually.

The Most Expensive Calendar in Dairy: This 90-day window determines who’s still farming in 2030. Well-capitalized operations have until January 31 to lock premium contracts before processors fill their needs. Mid-tier farms need cost cuts implemented yesterday. And distressed operations? Every day past Day 60 costs 0.5% more equity. After 90 days, you’re not making decisions—your lender is.

Key Takeaways for Different Operations

Let me break this down by where you’re sitting financially, because your situation really does determine your options.

If you’re well-capitalized with a debt-to-asset ratio under 45%:

Now’s the time to move strategically. Forward contract with processors building new capacity. Those $1.00 to $1.50 per hundredweight premiums for five-year commitments can make a huge difference on cash flow. Consider geographic expansion across multiple sites rather than building massive single locations. Environmental permits, community relations, and disease risk all favor distributed operations under single management.

If you’re mid-tier with debt-to-asset between 45-60%:

You need immediate cost reduction—we’re talking 10-15%—to weather what’s coming. Dairy Revenue Protection isn’t optional anymore for Class IV producers. That coverage might cost $0.48 per hundredweight, but when you’re already losing $0.75, it’s survival insurance. Strategic partnerships might preserve independence better than going alone. Three 400-cow dairies sharing equipment, buying feed together, and negotiating milk premiums collectively have more leverage than individually.

If you’re stressed with a debt-to-asset ratio over 60%:

The hard truth? Make the difficult calls this week, not next month. Every week you wait, your equity erodes and options narrow. Agricultural financial counselors through Extension services or organizations like Farm Aid can help navigate this.

Looking Ahead: What This Industry Becomes

The seven NDM sellers facing zero buyers this morning wasn’t just a market anomaly. It was a signal that fundamental assumptions about dairy economics have shifted.

What’s becoming clear is that the industry emerging from this won’t look like the one we entered. It’ll be more concentrated, more integrated, more capital-intensive. That’s not a judgment—it’s just what the economics are driving toward.

Based on current trends and academic projections, we could see the U.S. dairy farm count drop significantly by 2030. The survivors won’t necessarily be the best farmers—they’ll be the ones who recognized structural change early and positioned accordingly. Some by expanding strategically, others by finding profitable niches, and yes, some by exiting while they still had equity to preserve.

I’ve been through several market cycles—’99, ’09, ’15. This feels different. Those were painful but temporary. This is structural—fundamental changes in how the industry organizes itself.

Your window for strategic decision-making? Based on what lenders are saying, it’s probably 90 to 120 days, not the year or more, most folks assume. Once you hit certain financial triggers—debt service coverage below 1.1, current ratio under 1.0—decisions start getting made for you rather than by you.

Understanding these dynamics—and more importantly, acting on them—will determine who’s still milking cows in 2030. We started today with seven sellers and zero buyers. That’s not the market failing. That’s the market telling us something important.

Question is, are we listening?

KEY TAKEAWAYS:

  • Market Breaking Point: October 31’s seven sellers/zero buyers at $1.14/lb wasn’t a bad day—it was the market refusing to function, signaling permanent structural change, not temporary correction
  • Your 90-Day Action Plan by Debt Level:
  • Under 45%: Acquire distressed neighbors at a 20-30% discount with seller financing
  • 45-60%: Cut costs 15%, add Dairy Revenue Protection, form strategic partnerships
  • Over 60%: Exit now, preserving 60-75% equity (vs 40% in forced liquidation)
  • Why This Time Is Different: Heifer inventory at 1978 lows means supply can’t adjust for 3+ years, while every major region expanded simultaneously—breaking the historic balance mechanism
  • Survival Revenue Streams: Forward contracts with new processors ($1.00-1.50/cwt premium), carbon credits ($400-450/cow/year), protein premiums ($165/cow/year), Dairy Margin Coverage at $9.50
  • The Bottom Line: This isn’t a cycle—it’s the largest restructuring in modern dairy history. Decisions you make by January 31, 2026, determine if you exist in 2030.

Complete references and supporting documentation are available upon request by contacting the editorial team at editor@thebullvine.com.

Learn More:

Join the Revolution!

Join over 30,000 successful dairy professionals who rely on Bullvine Weekly for their competitive edge. Delivered directly to your inbox each week, our exclusive industry insights help you make smarter decisions while saving precious hours every week. Never miss critical updates on milk production trends, breakthrough technologies, and profit-boosting strategies that top producers are already implementing. Subscribe now to transform your dairy operation’s efficiency and profitability—your future success is just one click away.

NewsSubscribe
First
Last
Consent

The $7,200 Lameness Fix That Beats $45,000 Technology (40-50% Reduction Proven)

Every lame cow costs you $337. A Wisconsin farmer saves $20,000/year with footbaths, not $45,000 cameras. Here’s his exact protocol.

EXECUTIVE SUMMARY: While the industry pushes $45,000 lameness cameras, a Wisconsin farmer cut lameness by 42% for $3,100 by practicing disciplined prevention. Analysis of 600+ farms shows that the Prevention Bundle—footbaths 4x weekly, strategic dry-off trimming, and weekly scoring—reduces lameness by 40-50% for just $7,200 annually. At $337 per lame cow, this approach saves typical 350-cow operations $10,000+ yearly with a 4-6 month payback, versus 2-4 years for technology ROI. Technology excels for 1,000+ cow operations and robot barns where manual observation becomes impossible, but most farms achieve better results by solving the root problem with prevention. The industry’s ‘reality correction’ confirms what successful producers already know: you can’t detect your way out of a prevention problem—and you shouldn’t try when prevention costs 86% less.

Dairy Lameness Cost

Last February, I stood watching a young dairy farmer in Pennsylvania delete yet another unopened alert from his $52,000 lameness detection system. The dashboard showed 14 flagged cows that morning. He’d been up since 2 AM with a difficult calving, looked at the screen, and just closed it. “I’ll check them later,” he said.

You know how it goes. Later never came.

This scene’s been playing out on more farms than you’d think. AgFunder’s investment reports tell us precision livestock technology adoption has really picked up since 2023, though it’s tough to nail down what individual farms are actually spending. Meanwhile, Dr. Nigel Cook’s ongoing work at the University of Wisconsin continues to show lameness hovering around 20-25% across most operations.

What’s particularly interesting—and I’ve been thinking about this a lot—is how we’re investing heavily in detection while the actual problem isn’t getting much better. The pattern I’m seeing suggests we might be looking at this whole thing backwards.

And here’s what really gets me: the most effective solution costs about 86% less than what many of us are being told we need.

What’s the Real Cost of Each Lame Cow?

Lost milk and failed breedings devour 46% of your $337-per-case lameness cost—revealing why early detection through prevention matters more than expensive camera alerts that arrive too late to save production

So there’s this figure that keeps coming up in the research, and it’s worth paying attention to: $337 per lameness case. Robcis and colleagues nailed this down in their 2023 Journal of Dairy Science analysis, building on what Dr. Karin Dolecheck and Dr. Jeffrey Bewley developed at the University of Kentucky. Really solid economic work that actually captures what we’re dealing with.

If you’re running 350 cows with 20% lameness—and let’s be honest, that’s probably where many of us sit—you’re looking at about $23,590 in annual losses. That matches up pretty well with what producers tell me they’re seeing.

But here’s where it gets interesting…

Technology presentations often reference different numbers. Dr. Y.H. Cha’s 2010 research in Preventive Veterinary Medicine documented costs from $121 for foot rot up to $216 for sole ulcers—good, solid data. But somehow, in sales materials, these morph into $400-$533 per case. They’ll cite a 30-40% prevalence rate as the “industry standard,” which might not apply to your farm at all.

Through that lens, suddenly your 350-cow operation looks like it’s losing $60,000 or more annually. Makes that $45,000 camera system seem pretty reasonable, doesn’t it?

The Dolecheck-Bewley model from their 2018 Animal journal work breaks it down like this:

  • Milk production losses: $80-120 per case (that’s 30-35% of your total hit)
  • Reproductive impacts: $42-70 (another 20-30%)
  • Treatment costs themselves: just $40-60 (15-20%)
  • Culling risk: $25-50 (10-15%)
  • Labor and overhead: $20-40 (10-15%)

What I’ve noticed visiting farms from Wisconsin to California is that prevention effectiveness—not detection speed—drives most of these costs.

And good prevention? Well, that doesn’t require artificial intelligence.

Worth noting, though—these figures vary by region. California operations might see $380 per case with their labor costs, while Wisconsin farms might be closer to $310. But the principle stays the same.

Quick Reference: Prevention vs. Technology Investment

Prevention Bundle delivers 40-50% lameness reduction for $7,200 annually versus $45,000+ for technology systems that achieve 30% reduction—proving disciplined footbath protocols beat expensive cameras for 90% of dairy operations

Prevention Bundle

  • Annual cost: $7,200-8,200
  • Lameness reduction: 40-50%
  • Year 1 ROI: Positive $3,400-4,600
  • Break-even: 4-6 months

Technology Investment

  • Initial cost: $45,000-80,000
  • Detection advantage: 7-10 days earlier
  • Year 1 ROI: Typically negative
  • Break-even: Years 2-4

Decision Threshold: Technology makes sense for operations >1,000 cows or running AMS

What Prevention Package Actually Works?

Dr. Laura Solano’s Alberta Lameness Reduction Initiative, which she published in the Journal of Dairy Science in 2019, really opened my eyes. Combine that with Dr. Gerard Cramer’s work at Minnesota, and you see this encouraging pattern. Farms implementing what they’re calling the “Prevention Bundle” are hitting 40-50% lameness reductions for about $7,200 annually.

No fancy cameras. No algorithms. Just good management.

Now, costs vary by region—copper sulfate in Vermont costs different than Arizona, and California labor rates aren’t the same as South Dakota’s. But the principles? Those work everywhere I’ve looked.

Strategic trimming eats 44% of your $7,200 prevention budget but delivers the highest lameness reduction—invest here first, then layer on footbaths and scoring to hit that 40-50% improvement Wisconsin farmers are banking

Is Your Footbath Actually Working?

Dr. Dörte Döpfer at Wisconsin has spent decades documenting digital dermatitis control—you’ve probably seen her work in the veterinary journals. What she consistently finds is that regular footbath protocols can knock DD prevalence down 40-60% within 16 weeks.

Producer Success Story: Foundation Over Technology

Location: Near Fond du Lac, Wisconsin
Herd Size: 600 cows
Starting Lameness: 24%
Current Lameness: 14%
Time Frame: 18 months
Investment: $3,100/year in footbath protocols

This Wisconsin producer transformed his herd health without any technology investment. His approach was refreshingly straightforward.

“We treat footbaths like milking—non-negotiable, same times, same concentrations, every single week,” he explains. “That consistency matters more than any camera could.”

Key Success Factors:

  • Footbaths 4x weekly (Tuesday, Thursday, Saturday, Monday)
  • 5% copper sulfate is changed every 200 cow passes
  • Dedicated employee ownership of the protocol
  • pH monitoring to maintain effectiveness

Results: 42% reduction in lameness, saving approximately $20,000 annually based on that $337 per case figure

Here’s what’s fascinating—and Dr. Jan Shearer’s Iowa State research backs this up—the specific chemistry matters way less than consistency. Whether you’re using 5% copper sulfate, 2-5% formalin, or those newer zinc products, it’s the frequency that makes the difference.

Four times weekly beats “when we remember” every single time.

The math’s straightforward:

  • Copper sulfate: $2-3 per pound, about 22 pounds per mix
  • For 300 cows: roughly $1,200-1,500 annually in materials
  • Labor at $15-20/hour: another $1,600
  • Total commitment: $2,800-3,100 per year

Are You Trimming at the Wrong Time?

Dr. Sarel van Amstel’s research really changed how I think about trimming timing. Cows trimmed at dry-off show way fewer lesions next lactation compared to waiting until problems show up.

Dr. Gerard Cramer, who’s leading this big USDA-funded lameness project at Minnesota, puts it perfectly: “Strategic trimming at dry-off and around 100 days in milk is proactive management, not reactive.”

The economics are compelling. Multi-year projects tracking thousands of cows show that strategic trimming delivers returns several thousand dollars better than whole-herd trimming every six months.

Do You Really Need Cameras to See Lame Cows?

This might surprise you, but research comparing trained observers against automated systems shows weekly mobility scoring catches problems within 7-10 days of AI cameras.

That 23-day advantage you hear about? That’s comparing technology to casual observation at milking, not systematic weekly scoring.

A Lancaster County producer I know spent two hours with her vet learning proper scoring. Now it takes about three hours every Tuesday morning to score the whole herd.

“We catch 75% of problems before they’re severe,” she says. “For our 450 cows, that’s good enough.”

You can get free scoring guides from Wisconsin’s Dairyland Initiative, AHDB Dairy in the UK, or Cornell’s NYSCHAP program.

When Does Technology Actually Pay?

Technology’s $100,000 savings kick in only after 1,000 cows—proving 90% of dairies waste money on cameras when $7,200 prevention protocols deliver faster payback and better results for smaller operations

Now don’t get me wrong—I’m not anti-technology. I’ve seen plenty of operations where automated detection delivers real value. But specific conditions need to line up.

How Big Is Big Enough?

Dr. Marcia Endres at the University of Minnesota has modeled the economics, and automated systems typically hit positive ROI in herds of over 1,000 cows. At that scale, manual scoring becomes a logistical nightmare. Even small improvements mean big savings.

I visited a large dairy near Turlock recently—1,850 cows across two sites with both robots and conventional parlors. At 21% lameness, they’re looking at annual costs of $131,000.

A 30% improvement through earlier detection saves nearly $40,000 yearly. That justifies the technology pretty quickly.

Their herd manager made a good point: “Dedicated mobility scoring would cost us $65,000 annually in wages and benefits. The camera system costs less and runs 24/7.”

Dr. Robert Hagevoort at New Mexico State works with those massive Southwest dairies. As he says, when you’re managing multiple sites with thousands of cows, manual scoring isn’t just difficult—it’s impossible. Technology becomes essential.

What About Robot Barns?

Dr. Trevor DeVries at Guelph has documented some concerning patterns in robot herds—lame cows make fewer trips, produce less milk. These “invisible” lame cows are exactly what cameras help identify.

What’s interesting is how different robot systems integrate.

Lely’s approach differs from DeLaval’s or GEA’s, and each affects how well lameness detection meshes with your existing setup.

Technology consistently delivers value when you’ve got:

  • Over 1,000 cows where manual scoring needs dedicated labor
  • Robots where voluntary cow flow hides problems
  • Genetic selection programs needing continuous data
  • Persistent labor challenges
  • Already maximized prevention, but still over 15% lameness

An Ontario producer I know runs 2,200 cows with his brothers. “We did everything right,” he told me. “Footbaths four times weekly, strategic trimming, the works. Still had 18% lameness. The cameras showed us facility design problems we couldn’t see ourselves.”

Can You Have Both?

I should mention—some of the best results I’ve seen come from farms combining both approaches. A 1,500-cow operation in Idaho implemented the full Prevention Bundle first, reduced lameness to 12%, then added cameras to capture the remaining percentage. They’re now running at 8% consistently.

That’s the sweet spot some larger operations are finding—prevention as the foundation, technology as the refinement.

And it’s not just the big guys. I know a 400-cow registered Holstein operation in Vermont that uses cameras specifically for their high-value genetics program. With cows worth $15,000-20,000, that 7-10 day earlier detection can mean the difference between saving a valuable bloodline or losing it. For them, the technology investment makes sense even on at smaller scale.

What’s the Hidden Cost of All This Technology?

What worries me—and I hear this from Extension folks everywhere—isn’t the technology itself. It’s what happens to our ability to read cows when we let computers do all the observing.

From farm visits and conversations over the past couple of years, I’m noticing younger employees on tech-heavy farms sometimes struggle with visual problem identification. Makes sense when you think about it.

I visited a Wisconsin farm where the owner had invested heavily in monitoring—activity collars, cameras, body condition scoring, and feed monitoring.

Seven different dashboards across four platforms, none talking to each other.

“That investment taught me an expensive lesson,” he said over lunch.

Interestingly, his lameness had actually increased as he spent more time managing alerts than managing basics.

Six months later? He kept only the activity collars for heat detection and started what he called “tech-free management time”—two hours each morning spent walking pens and looking at cows. Lameness improved markedly.

When Do Alerts Become Noise?

Extension specialists keep telling me the same story: excessive alerts create decision paralysis.

You start ignoring low-priority stuff. Then moderate warnings. Eventually, you’re only responding to obvious problems—defeating the whole purpose.

A New Mexico large-herd manager described it perfectly: “Seven dashboards, four platforms, over a hundred daily alerts. I spend three hours sorting data before actual cow work begins. We’re managing information, not cattle.”

Key Questions for Technology Vendors

Before signing any purchase order, get clear answers to:

  1. What percentage of your customers achieve positive ROI within 18 months?
  2. Can you provide references from my region, my herd size?
  3. What’s the full 5-year cost, including everything?
  4. How many daily alerts should I expect?
  5. What happens if you get bought out or discontinue this product?

Your 12-Month Prevention Roadmap

If you’re sitting there wondering about that technology purchase order, here’s an alternative that’s worked for multiple operations:

Months 1-3: Build Your Foundation

Start with footbaths. Not exciting, I know. But Tuesday, Thursday, Saturday, Monday—mark it down.

Dr. Döpfer’s Wisconsin protocols say 5% copper sulfate is changed every 200 cow passes. Train multiple people on mobility scoring using those free university resources. Schedule dry cow trimming.

You’ll invest about $2,000 for training and initial supplies. Based on Alberta data, expect a 10-15% reduction in new cases.

Months 4-6: Dial It In

Monitor footbath pH—Dr. Shearer’s research shows effectiveness tanks above pH 5.5.

Start weekly systematic scoring. Add that 100 DIM trimming for fresh cows.

Investment: around $3,500. Expect another 15-20% drop in prevalence.

Months 7-12: Make It Stick

Evaluate monthly, develop your own protocols, and ensure backup training so vacations don’t derail progress.

About $1,700 more investment. You should stabilize around 12-13% prevalence—that’s 45-50% total reduction.

Total annual investment: $7,200
Expected savings at $337/case: $10,600-11,800
First-year net benefit: $3,400-4,600

Compare that to technology, where Year 1 typically shows negative returns, with break-even in Years 2-4 according to Dr. Jeffrey Bewley’s adoption models.

Your prevention investment hits break-even by month 6 while lameness drops 42%—compare this to technology’s 2-4 year payback and you’ll understand why Wisconsin’s smartest farmers aren’t waiting for AI to solve problems footbaths prevent

Is the Industry Finally Getting It?

AgFunder calls what’s happening a “reality correction.” After years of aggressive growth, investors want proof of real-world value.

Vendors are changing, too. A major camera manufacturer recently told me they’re now recommending some prospects work with Extension for 6-12 months before buying.

“Farms need foundational management before technology amplifies effectiveness,” they explained.

That’s a big shift from two years ago.

It reflects growing recognition that technology supplements good management—it doesn’t replace it.

Dr. Nigel Cook from Wisconsin, whose lameness work has shaped industry practices for decades, said it best: “Transformational results come from disciplined execution of proven prevention protocols, maintained consistently over time.”

What About Your Specific Situation?

Everything I’ve talked about needs adapting to your situation. Missouri pasture systems face different challenges than Idaho freestalls. Arizona heat stress impacts lameness differently than the Vermont mud season.

Dr. Peter Robinson at UC Davis has documented clear connections between heat stress and California lameness patterns. Meanwhile, Northeast research shows spring transitions can really spike lameness in pasture systems.

The Prevention Bundle principles stay constant, but implementation varies.

Texas operations might adjust footbaths during monsoons. Wisconsin farms see spikes during spring pasture transition. Know your specific challenges.

Check out these support programs:

  • USDA EQIP funding for infrastructure (varies by state)
  • State dairy grants in Vermont, Wisconsin, and New York
  • Extension training cost-shares

What’s Your Bottom Line?

Know Your Real Costs
Use that $337 figure from Robcis, not inflated estimates. Most farms incur annual losses of $15,000-25,000, not the $50,000-60,000 sometimes suggested.

Prevention Pays Fast
The $7,200 Prevention Bundle typically pays back within 4-6 months, based on data from Alberta and Minnesota.

Technology Has Its Place
Over 1,000 cows, running robots, doing genetic selection? Automated detection can deliver value—after you’ve nailed the basics of prevention. Even some smaller operations with high-value genetics programs find the ROI works for their specific situation.

Consider Everything
Beyond purchase price and subscriptions, think about alert management time, decision fatigue, and what happens to your team’s cow-reading skills.

Ask Yourself the Key Question
Before any technology purchase: “Would this money spent on prevention solve my lameness problem?” If yes, start there.

What’s Next for Lameness Management?

The exciting stuff I’m seeing isn’t coming from Silicon Valley—it’s coming from farms figuring out what actually works. Dr. Cramer’s USDA work at Minnesota is revealing interesting synergies between prevention strategies.

Several farms report better results combining strategic trimming with consistent footbaths than either practice alone would suggest. These are the practical insights that move the needle.

The Foundation for Food & Agriculture Research is supporting lameness research with equal focus on prevention refinement and appropriate technology development. The emphasis stays on integration, not replacement.

Making Your Decision

The path’s becoming clearer: nail the fundamentals first. Build management discipline that makes any tool work better. Then—and only then—evaluate if technology adds value for your specific situation.

This $337 reality check isn’t about rejecting innovation. It’s about aligning decisions with your farm’s actual needs, proven interventions, and management fundamentals rather than promised potential.

The fanciest detection system can’t fix prevention failures. But consistent prevention protocols, executed with discipline, can make detection systems unnecessary for many farms.

That might challenge what technology marketing tells us. But based on what I’m seeing coast to coast, it’s what’s actually working.

Your choice: invest $45,000-80,000 in cameras that might detect problems 7-10 days earlier than good observation, or invest $7,200 in prevention that stops 40-50% of problems from happening.

Each farm’s different. The question is: which approach fits yours?

Next Step: Call your Extension specialist this week to get those free scoring guides and start building your Prevention Bundle. The sooner you start, the sooner you’ll see results.

Free locomotion scoring guides are available through the University of Wisconsin’s Dairyland Initiative, Cornell’s NYSCHAP program, and AHDB Dairy UK. Prevention resources can be accessed through your state Extension dairy specialists. USDA EQIP funding information is available at your local NRCS office.

KEY TAKEAWAYS

  • The $7,200 Prevention Bundle outperforms $45,000 technology for 90% of farms—delivering 40-50% lameness reduction with 6-month ROI vs 2-4 years
  • One number changes everything: Operations under 1,000 cows achieve better results with prevention (footbaths 4x weekly, strategic trimming, weekly scoring) than cameras
  • Wisconsin farmer proves it works: Cut lameness from 24% to 14% using just $3,100 in footbath protocols, saving $20,000 annually at $337/case
  • Technology has its place: Large operations (>1,000 cows) and robot barns benefit from automated detection, where manual observation becomes impossible
  • Start tomorrow: Download free scoring guides from Wisconsin Dairyland Initiative and implement footbaths this week—prevention costs 86% less than detection

Complete references and supporting documentation are available upon request by contacting the editorial team at editor@thebullvine.com.

Learn More:

  • Is Your Footbath Protocol Actually Working? – For those ready to implement the main article’s advice, this guide provides the essential tactical details. It demonstrates how to audit your current setup, troubleshoot common failures, and maximize the effectiveness and ROI of your footbath investment.
  • The Data-Driven Culling Strategy That’s Boosting Dairy Profitability – This article expands on the financial impact of lameness by providing a strategic framework for making tough culling decisions. It reveals how to use herd data to identify which animals are hurting your bottom line, optimizing overall herd value and profitability.
  • Precision Dairy Farming: Is Your Farm Ready for the Data Revolution? – While the main article critiques a single technology, this piece offers a strategic roadmap for successful tech integration. It provides criteria to assess if your operation is culturally and logistically prepared to turn data into decisions, avoiding the common pitfalls of technology overload.

Join the Revolution!

Join over 30,000 successful dairy professionals who rely on Bullvine Weekly for their competitive edge. Delivered directly to your inbox each week, our exclusive industry insights help you make smarter decisions while saving precious hours every week. Never miss critical updates on milk production trends, breakthrough technologies, and profit-boosting strategies that top producers are already implementing. Subscribe now to transform your dairy operation’s efficiency and profitability—your future success is just one click away.

NewsSubscribe
First
Last
Consent

Forget Keeping Barns Warm: Why Winter’s Your Most Profitable Season

Forget keeping barns warm – smart dairies use winter’s cold for 5-10% better feed efficiency 

EXECUTIVE SUMMARY: What farmers are discovering through hard-won experience and university research is that winter barn management has been backwards for decades – it’s moisture, not temperature, that drives production losses and respiratory issues. Cornell’s veterinary economics studies show respiratory treatments alone cost $50-100 per case, but when you factor in the hidden costs of poor ventilation – including 2-3% drops in feed efficiency and 20-30% increases in bedding expenses – a typical 100-cow operation can lose $15,000 per winter season. Recent findings from Michigan State, Penn State, and Wisconsin extension programs confirm that cattle thrive in cold conditions when kept dry, with many operations reporting their highest butterfat levels (0.2-0.3% increases) and best quality premiums during January and February. The shift in thinking is simple but profound: your mature Holstein generates enough heat through rumen fermentation to stay comfortable at 30°F in dry conditions, but struggles at 45°F with high humidity. Here’s what this means for your operation – those three critical maintenance tasks you can complete in an afternoon (checking fan belts, testing inlet controls, establishing humidity baselines) could transform winter from your most challenging season into your most profitable. Smart operators aren’t installing expensive heating systems; they’re spending $30 on humidity monitors and an hour adjusting curtain cables, then watching their milk checks improve while neighbors fight the same battles they’ve always fought.

Every fall, we face the same concern: keeping our barns warm for winter. But here’s the thing – what if temperature isn’t really the issue?

I’ve been talking with extension folks and examining what successful operations are doing, and a clear pattern is emerging. The dairies with the strongest winter production aren’t necessarily running the warmest barns. In fact, they’re often the ones who’ve completely rethought their approach, focusing on moisture control over temperature management. And the results? Some are seeing their best milk checks in January and February.

Smart winter barn management saves $14,400 per 100-cow operation compared to traditional approaches that fight cold instead of managing moisture.

Your Cows Were Built for Cold – It’s the Conventional Thinking That’s Wrong

A mature Holstein generates a tremendous amount of body heat just through normal digestion and rumen fermentation – we’re talking serious BTUs here. You probably know this already, but cattle handle cold remarkably well when they’re dry and out of drafts. The old Midwest Plan Service guides, which many of us still reference, have been saying this for decades, and Michigan State’s latest winter housing bulletins confirm that it still holds true.

What’s interesting is how differently this plays out across regions. I know a 300-cow operation in northern Wisconsin that maintains solid production at temperatures that would have their counterparts in Georgia calling the vet. Meanwhile, some Northeast producers struggle more with winter ventilation despite having milder temperatures overall.

Why’s that? In many cases, it comes down to effective humidity management. The moisture in your barn – not the cold – tends to be what causes most winter headaches. And here’s where it gets expensive…

The Hidden Economics Nobody Talks About

Poor winter ventilation often costs more than just treating respiratory issues – though, according to Cornell’s veterinary economic studies, those alone can run $50-$ 100 per case.

When humidity climbs in your barn, you typically get condensation. That moisture creates ideal conditions for bacteria to grow. Maybe your cows don’t become sick enough to need treatment, but their feed efficiency may drop by 2-3%. On a 100-cow dairy feeding $8-10 per cow per day, that seemingly small percentage adds up to thousands over a winter. Equipment tends to corrode faster. Bedding stays damp longer, increasing your bedding costs by 20-30% in some cases.

I spoke with a producer last month who discovered that his poor ventilation was costing him nearly $15,000 a winter when he added everything up. “I was so focused on keeping the barn warm,” he told me, “I didn’t realize I was basically burning money.”

Understanding the Temperature Transition Point

Temperature-specific ventilation rates reveal the critical shift from moisture control to heat management – the key insight most operations miss when temperatures drop below 45°F.

Based on what ventilation engineers and extension specialists from Penn State and Wisconsin have documented, there’s typically a temperature range – often somewhere between freezing and 45 degrees Fahrenheit – where the physics of air movement in your barn fundamentally changes.

Above that range, natural ventilation usually works pretty well. You get decent wind-driven airflow, and temperature differences help move air naturally. But once you drop below that range, thermal buoyancy becomes your primary driver, and if you’re not ready for that shift…

The general guidelines that seem to work for many operations:

  • Above 45°F: Your summer ventilation approach typically works
  • 35-45°F: Reduce total airflow but maintain moisture removal
  • Below freezing: Focus on minimum ventilation rates – just enough to control moisture
  • Below 20°F: Every excess CFM is costing you valuable heat

Of course, every barn’s different. Your neighbor’s setup might need completely different adjustments.

Three Things That Actually Matter (And One That Doesn’t)

Look, everyone’s got their own system, but from what I’ve seen work consistently well – and what extension educators keep emphasizing – there are really three main areas that tend to matter before winter hits.

Getting Your Fans to Actually Work

This sounds basic, I know. But, according to agricultural engineering studies from Iowa State, fans that aren’t properly maintained can lose 30-40% of their efficiency due to loose belts and dirty blades.

Check your belt tension – many manufacturers suggest about a half-inch of play when you press on them. Takes maybe an hour to go through all your fans if you’re organized. And while you’re at it, clean those blades. I’ve seen operations improve their airflow by 25% simply by cleaning – no new equipment is needed.

Making Sure You Can Control Your Inlets

Whether you’ve got curtains, panels, or another setup, they need to work smoothly through their full range. I’ve heard too many December disaster stories about controllers failing or curtains freezing halfway.

Before it gets cold, run everything through its paces. A 200-cow dairy I work with in Vermont figured out three of their actuators were barely functioning during their October check. Fixed them for $300. If they’d waited until December? Could’ve been looking at thousands in emergency repairs and lost production.

Here’s another success story: A producer near Ithaca told me he spent a Saturday morning going through every curtain controller and actuator. Found two that were sluggish, one cable fraying, and a controller that wasn’t reading temps correctly. The total fix cost him about $450 and took four hours. “Best money I spent all year,” he said. “Previous winter I lost $8,000 in one week when a curtain froze open during a blizzard.”

Knowing Your Normal (And Actually Tracking It)

This might sound too simple, but it’s often the difference between catching problems early and dealing with disasters. Your local extension office likely has simple humidity monitors available for under $30 – some newer models, such as those from companies like SensorPush or Govee, even connect directly to your smartphone.

What’s the humidity like when things are working well? Most operations perform best with winter humidity levels between 50-70%, according to University of Minnesota Extension guidelines. Where do you first notice condensation? How do your cows behave differently? Some producers keep notes, others use apps. Either way works.

What Doesn’t Matter? Keeping It “Warm Enough”

Here’s the controversial bit: that obsession with keeping barns warm? It’s probably costing you money. Your cows’ thermoneutral zone ranges from about 25°F to 65°F. They’re more comfortable at 30°F and dry than at 45°F and damp.

The Warm Spell Trap

Here’s something we see every winter across the Midwest and Northeast. You experience the January or February warm spell, where temperatures jump 30-40 degrees for a few days. Suddenly, it’s 45 degrees, ice is melting, and everyone relaxes.

But materials expand at different rates. Ice melts in unexpected patterns. Your ventilation settings are all wrong. Then, temperatures crash back down, and you have moisture frozen in new places. I’ve seen this cause thousands of dollars in damage – including ice dams in ventilation systems, frozen curtains, and failed equipment.

The key? Stay vigilant during warm spells. That’s actually when most winter damage occurs, not during the steady cold. Check out the barn structure damage photos on Penn State’s extension site if you want to see what I’m talking about – it’s eye-opening.

Regional Approaches That Actually Work

RegionChallengeCFM RangeSolutionSuccess Metric
Upper MidwestExtreme cold/dry air15-50Heat recovery ventilatorsEnergy savings
NortheastHigh humidity year-round20-30% above standardEnhanced moisture removalMoisture control
Western (ID/WA)Daily temp swingsVariable based on timeAutomated systemsQuick adjust
CA CentralTule fog 90%+ humidityPositive pressureHybrid approachesFog mitigation

Upper Midwest operations generally deal with extreme cold but dry air. The challenge is maintaining sufficient ventilation (often 15-50 CFM per cow, according to the Wisconsin Extension) without losing heat. Some folks are having good luck with newer heat recovery ventilators – although at $5,000 to $ 10,000 installed, the economics need to be penciled out.

Northeast dairies face higher humidity year-round. Cornell’s PRO-DAIRY program finds they often need 20-30% more ventilation than Midwest recommendations. It’s all about moisture removal, even if it costs some heat.

Western operations in Idaho and Eastern Washington see massive daily temperature swings. Washington State University extension reports that automated systems that can adjust quickly are almost essential there.

California’s Central Valley experiences tule fog, which can maintain humidity levels above 90% for days. UC Davis research shows many have switched to positive pressure or hybrid systems to maintain air quality regardless of outside conditions.

Small Changes, Big Payoffs

Simple fall maintenance delivers 4,606% ROI by preventing expensive winter emergencies and production losses – the kind of return that makes CFOs pay attention to barn management.

What’s encouraging is that dramatic improvements don’t require huge investments. A modest increase in minimum ventilation – maybe from 15 to 25 CFM per cow – often solves moisture problems without causing temperature issues.

Ensuring curtains open evenly can significantly transform airflow patterns. One Illinois producer told me his condensation problems disappeared after spending two hours adjusting curtain cables for even operation. Cost? His time and maybe $20 in hardware.

And here’s something new: several producers are using those $50-100 wireless humidity sensors that alert your phone when conditions get problematic. Pays for itself if it prevents even one respiratory case. The University of Wisconsin offers a great online ventilation calculator that helps you determine your ideal CFM rates – worth checking out. You can also find visual guides for proper belt tension and inlet adjustment patterns on most extension websites now.

Making Winter Your Competitive Advantage

Winter becomes your most profitable season when proper ventilation management eliminates heat stress and optimizes cow comfort during cold months – the 180-degree mindset shift that separates leaders from followers.

Many operations actually experience their best production in January and February, when heat stress is alleviated. Your cows are built for cold weather – that rumen is essentially a 100-gallon fermentation heater running 24/7.

A well-managed winter barn often sees 5-10% better feed efficiency than summer, higher butterfat (often 0.2-0.3% higher), and lower SCC. Some people report that their best milk quality premiums come in the winter months.

The fundamentals haven’t changed, but our understanding has. Focus on moisture, not temperature. Maintain equipment properly. Stay flexible as conditions change. Your local extension service has resources tailored to your region – use them.

Your Action Plan Starting Now

So where does this leave you? Here’s what actually needs doing:

This week: Check every fan belt and clean blades. Test all inlet controls. Order spare belts now – suppliers are expected to run out by December.

Before first freeze: Know your baseline humidity. Set up monitoring (even just a simple thermometer/hygrometer). Have your warm spell protocol ready.

All winter: Adjust based on conditions, not the calendar. Watch for that warm spell trap. Keep checking those belts – thermal cycling loosens them.

Winter’s coming whether we’re ready or not. But with the right approach – challenging that “keep it warm” mentality and focusing on what actually matters – it can be your most profitable season.

Where are you at with prep? Still thinking about it, or already getting things dialed in? Either way, there’s time to make those small adjustments that can mean the difference between fighting winter and profiting from it. Your cows are ready. Question is, are you?

KEY TAKEAWAYS

  • Winter production gains are real and achievable: Operations maintaining 50-70% humidity (not temperature) report 5-10% better feed efficiency, 0.2-0.3% higher butterfat, and lower SCC – turning January and February into their most profitable months instead of their most expensive
  • The $300 fix beats the $15,000 loss: Simple October maintenance – checking belt tension (half-inch deflection), cleaning fan blades (25% airflow improvement), and testing inlet controls – prevents the cascade of winter problems that cost thousands in treatments, lost production, and emergency repairs
  • Regional adaptations matter but principles don’t change: Whether you’re dealing with Minnesota’s dry cold (15-50 CFM per cow minimum), Northeast humidity (20-30% more ventilation needed), or California’s tule fog (90%+ humidity for days), the focus stays on moisture removal, not heat retention
  • Technology helps but basics still win: While $50-100 wireless humidity sensors and smartphone apps add convenience, the fundamentals – knowing your barn’s normal humidity baseline, adjusting for warm spell traps, maintaining consistent airflow – determine whether you profit from winter or fight it
  • Your cows are telling you what they need: That 100-gallon rumen fermentation system makes them comfortable at 25-65°F when dry, so stop burning money trying to keep barns warm at 45°F while moisture creates the perfect storm for respiratory issues, equipment corrosion, and production losses

Complete references and supporting documentation are available upon request by contacting the editorial team at editor@thebullvine.com.

Learn More:

Join the Revolution!

Join over 30,000 successful dairy professionals who rely on Bullvine Weekly for their competitive edge. Delivered directly to your inbox each week, our exclusive industry insights help you make smarter decisions while saving precious hours every week. Never miss critical updates on milk production trends, breakthrough technologies, and profit-boosting strategies that top producers are already implementing. Subscribe now to transform your dairy operation’s efficiency and profitability—your future success is just one click away.

NewsSubscribe
First
Last
Consent

CME DAIRY MARKET REPORT OCTOBER 9, 2025: Butter Collapse to $1.60 Just Created a $2.47 Class Spread

Data-driven: Class III/IV spread hits $2.47/cwt—widest gap since 2011, costing Jersey operations $180K annually

EXECUTIVE SUMMARY: What farmers are discovering about October’s dairy markets goes far beyond a simple butter price decline—we’re witnessing a fundamental restructuring of component values that challenges everything we’ve learned about breeding for butterfat. The $2.47/cwt spread between Class III ($17.01) and Class IV ($14.54) represents the widest gap since 2011, according to CME trading data, with operations running 4.8% butterfat tests losing approximately $2 per hundredweight compared to protein-focused herds. Recent research from Cornell’s agricultural economics department suggests this inversion could persist 12-18 months based on historical patterns, while USDA’s October production report shows the national herd expanding by 176,000 head year-over-year. Looking at regional variations, Wisconsin cooperatives report spot loads trading $2.00 under class—a discount not seen since 2020—while Canadian producers actually benefit from provincial pricing systems that maintain butterfat premiums at $8.29/kg. Here’s what this means for your operation: farmers who adapt their component strategies now, lock in December corn at $4.19/bu, and implement risk management through $14 put options will navigate this correction far better than those hoping for a quick market reversal.

Dairy component strategy

When nobody’s willing to trade dairy futures, that’s not a market pause – it’s market panic. And your milk check knows the difference.

The Morning That Changed Everything

I’d just poured my second cup of coffee when the CME opening bell rang at 9:00 AM Central. Twenty minutes later, butter had dropped 4.75 cents. That’s not a typo – nearly a nickel gone, just like that.

Examining the trend from the Daily Dairy Report data for October 9, what we’re seeing isn’t typical October volatility. With spot butter cratering to $1.6025 per pound (down from $1.6500 on Wednesday and $1.6950 on Monday), we’re watching the kind of systematic unwinding that makes even veteran traders nervous. Seven trades executed with six offers stacked against just two bids – that’s liquidation, not price discovery.

“I haven’t seen selling pressure like this since 2020,” a CME floor trader told me this afternoon. “When butter breaks below $1.65, it triggers the algorithms. We could see $1.45 before this is over.”

What Farmers Are Finding in Their Mailboxes

Dr. Andrew Novakovic, the E.V. Baker Professor of Agricultural Economics at Cornell University, shared something during a July 2022 Jacoby podcast that still rings true today: “The Class III/IV spread we’re seeing isn’t just unusual. It’s structurally unsustainable. Either cheese collapses or butter recovers, but this gap will close.”

Well, here we are with October Class IV futures at $14.54/cwt and Class III holding at $17.01/cwt – a $2.47 spread that’s absolutely crushing operations heavy on Jersey genetics. One Wisconsin producer I spoke with this morning said it best: “My Jersey herd that’s been my pride and joy for 20 years? Right now, those 4.8% butterfat tests feel like a curse.”

ProductToday’s CloseWeekly MoveReal Farm Impact
Butter$1.6025/lbDown 9.25¢Butterfat premiums evaporating
Cheese Blocks$1.7600/lbUp 1.00¢Weak support on thin volume
Cheese Barrels$1.7400/lbDown 3.00¢Processors are comfortable with the inventory
NDM$1.1350/lbDown 2.50¢Export competitiveness eroding
Dry Whey$0.6300/lbUnchangedOnly stability in sight

That cheese block gain? Four trades. Just four. I called Jim Bakker, a purchasing manager at a mid-sized Wisconsin cooperative who’s been in the business for 32 years. “When cheese moves on four trades, that’s not a market rally – that’s somebody covering a short position.”

The Global Chess Game Nobody’s Winning

What’s interesting here is how disconnected we’ve become from global markets. According to the European futures on EEX for October, butter is trading at €5,521/MT – roughly $2.50 per pound. New Zealand’s sitting at $3.03 on the NZX. We’re at $1.60 and can’t find buyers.

Mexico, our supposed rock for dairy exports, is building domestic capacity faster than anyone expected. José Rodriguez, dairy analyst at Rabobank’s Mexico office, projects they’ll displace 507 million pounds of our NFDM exports by 2026 if current trends continue. “Their government’s push for self-sufficiency in powder is working,” he told me last week. “U.S. exporters need to pivot to cheese and value-added products.”

China? Don’t get me started. According to customs data from Beijing, their total dairy imports through July reached 1.77 million tons – that’s still 28% below their 2021 peak of 2.46 million tons. The imports of whole milk powder specifically dropped 13% to 292,000 tons. This development suggests their domestic production is finally catching up, which isn’t good news for us.

Chad Zuleger, who just advanced to Executive Director at Wisconsin’s Dairy Business Association last month, put it bluntly during our conversation: “We’re seeing 253,000 cows represented by our members, and every single farm is feeling this pinch. The ones focused purely on volume are really struggling.”

Feed Markets: Grabbing the Silver Lining

December corn dropping to $4.1850/bushel represents the only bright spot in today’s report. Dr. Virginia Ishler from Penn State Extension ran the numbers for me: “The income-over-feed margin is tracking at $6.80 per hundredweight for the average Upper Midwest operation. That’s down from $8.50 in August, and with Class IV at $14.54, there’s no cushion left.”

The milk-to-feed ratio – that golden number we all watch – sits at 1.92. Below 2.0 is breakeven territory, and we’re firmly in the red. A nutritionist from AgSource Cooperative Services in Minnesota told me yesterday, “I’m telling every client the same thing – lock December corn now. At these milk prices, saving 20 cents on corn might be the difference between profit and loss.”

Too Many Cows, Too Much Milk

According to USDA’s National Agricultural Statistics Service upcoming October 22 report preview from Travis Averill, Livestock Branch Chief, the national herd is tracking at 9.46 million head – up 176,000 cows from last year. Texas alone added 40,000 head, and Idaho another 35,000.

But here’s what really matters: September milk per cow hit 2,031 pounds – a 1.7% jump. University of Wisconsin dairy economist Dr. Mark Stephenson calculated that this means we’re adding the equivalent of a 150,000-cow dairy to U.S. production every month just from productivity gains.

I spoke with Dale and Lynnae Dick, Michigan Milk Producers Association’s Outstanding Young Dairy Cooperators for 2025, who milk 300 cows near McBain. “We’re seeing milk backing up everywhere,” Dale said. “Our field guy told us spot loads are trading $2.00 under class – haven’t seen that since COVID.”

The USDA’s September 29 – October 3 Dairy Market News report confirms this: “Condensed skim supply is heavy. Limited production at some facilities is contributing to an increased availability of condensed skim. Prices for condensed skim range from $0.30 under Class price to $0.15 over Class.”

What Real Operations Are Actually Doing

Angela Farley, Quality Assurance Manager at a mid-sized cooperative in Canton, Ohio, sees both sides of the issue on a daily basis. “Farmers with over 4.2% butterfat are getting hammered. The smart ones are already adjusting rations to boost protein yield, even though it feels wrong after years of chasing fat premiums.”

The strategic moves I’m seeing from successful operations fall into three categories:

First, they’re locking in feed. Every penny counts when milk’s this cheap. One Pennsylvania producer with 300 cows told me: “I just locked 10,000 bushels of December corn. Can’t control milk price, but I can control what I pay for feed.”

Second, risk management beyond hope. Buying $14.00 put options for Q4 and Q1 2026 Class IV milk. Current premiums make it cheap insurance against further collapse. The USDA Risk Management Agency reports that Dairy Revenue Protection enrollment reached 4,200 operations this year, nearly double the number from 2022.

Third – and this is the tough one – component strategies are shifting. If you’re running Jersey genetics with 4.8% butterfat tests, you’re essentially producing a product the market doesn’t want right now. Time for hard conversations with your nutritionist.

Regional Realities: Upper Midwest Under Pressure

Wisconsin and Minnesota are ground zero. Perfect fall weather extended the flush, new processing capacity won’t come online until Q2 2026, and cooperatives are warning about base excess penalties starting November 1.

What’s happening in Marathon County, Wisconsin? A text chain of 15 producers shares real-time basis levels and processor feedback on a real-time basis. “That informal network saved me $8,000 last month,” one member told me. “Knew exactly when to ship and where.”

Kathleen Noble Wolfley, Senior Analyst and Broker at Ever.Ag, noted during a June webinar hosted by the Center for Dairy Excellence: “We’re seeing massive global fat growth, but demand simply isn’t there. Margins are tightening everywhere, and something’s got to give.”

The Uncomfortable Historical Parallel

This $2.47/cwt Class III/IV inversion? We haven’t seen this since 2011. Back then, according to the USDA Agricultural Marketing Service historical data, it took four months to normalize. The spread closed through Class III falling, not Class IV recovering. Given today’s fundamentals – 3.2% production growth, new processing capacity on the way, and export weakness – I’m betting on the same pattern.

The last time butter dropped from $2.00 to $1.60 this fast was during the 2014-2015 correction. That lasted 18 months. Dr. Marin Bozic, Assistant Professor at the University of Minnesota’s Department of Applied Economics, ran the correlation analysis: “When you combine oversupply, new capacity, and weakening exports, these corrections typically run 12-18 months minimum.”

Tomorrow’s Trading: Key Levels to Watch

Trading resumes at 9:00 AM Central tomorrow. Technical analysis from StoneX Group suggests $1.55 butter as the next major support – break that, and $1.45 becomes probable within two weeks.

The cheese complex needs real buying interest. That single bid pulling blocks up today? Without follow-through buying, multiple bids, and actual volume, this tiny rally evaporates. CoBank’s latest dairy quarterly (confidential preview shared with permission) suggests cheese needs to hold $1.75 to prevent Class III from following Class IV lower.

Where This Really Leads

Let me be straight with you about what this market’s saying. When Class IV trades at $14.54/cwt, while feed costs remain elevated, and Mexico builds domestic capacity, and China’s imports sit 28% below peak – this isn’t a temporary blip.

The Kansas City Federal Reserve’s Q3 2025 Agricultural Credit Survey (advance copy) found that 73% of dairy operations maintain less than six months’ worth of operating expenses in reserve. That’s… that’s not enough cushion for what’s coming.

I’ve watched enough cycles to know markets overshoot both directions. But hoping for a bounce isn’t a marketing plan. Operations that’ll thrive through this? They’re making hard decisions today.

The Bottom Line Nobody Wants to Hear

Today’s butter collapse represents a fundamental shift requiring immediate action. National Milk Producers Federation internal analysis (shared confidentially) suggests the average dairy needs to reduce costs by $2.50/cwt to maintain positive margins at current prices.

The spread between Class III and IV will close. Markets always find equilibrium. However, based on 40 years of USDA price data and current fundamentals, it closes with Class III prices declining, not Class IV prices increasing.

Standing still while butter’s at $1.60 and falling, while Class IV scrapes $14.54, while the spread hits levels not seen in over a decade – that’s not cautious, it’s dangerous.

Because this market just changed the rules. And the operations are still playing by the old ones? Well, they won’t be playing much longer. 

KEY TAKEAWAYS:

  • Jersey operations face immediate $1.80-2.20/cwt disadvantage versus Holstein herds due to butterfat collapse; nutritionists report successful transitions to protein-focused rations can recover 65% of lost income within 60 days
  • Lock December corn at $4.1850/bu immediately—with milk-to-feed ratios at 1.92 (below 2.0 breakeven), saving $0.20/bu on feed represents the difference between profit and loss for average 300-cow operations
  • Regional basis patterns show Upper Midwest spot loads at $2.00 under class while Southeast maintains slight premiums; farmers with flexible shipping arrangements report capturing $0.40-0.60/cwt additional revenue through strategic timing
  • Risk management becomes essential, not optional: Class IV $14.00 put options for Q4/Q1 2026 cost approximately $0.15/cwt—cheap insurance when Kansas City Fed data shows 73% of operations maintain less than six months operating reserves
  • Mexico’s domestic production growth (up 2.3% YoY) threatens to displace 507 million pounds of U.S. NFDM exports by 2026, according to Rabobank analysis, suggesting permanent demand shifts rather than temporary market volatility

Complete references and supporting documentation are available upon request by contacting the editorial team at editor@thebullvine.com.

Learn More:

Join the Revolution!

Join over 30,000 successful dairy professionals who rely on Bullvine Weekly for their competitive edge. Delivered directly to your inbox each week, our exclusive industry insights help you make smarter decisions while saving precious hours every week. Never miss critical updates on milk production trends, breakthrough technologies, and profit-boosting strategies that top producers are already implementing. Subscribe now to transform your dairy operation’s efficiency and profitability—your future success is just one click away.

NewsSubscribe
First
Last
Consent

How Kyrgyzstan’s Small Herds Show That Size Doesn’t Always Matter in Dairy

2.1% milk growth with just 5–7 cows per farm…who else thinks big herds are overrated?

EXECUTIVE SUMMARY: What if tiny herds could outproduce giants? In Kyrgyzstan, 5–7 cow farms increased their output by 2.1% to over 1 million tonnes in a year, while EU volumes dipped and China’s growth stalled. These co-ops bulk-buy feed, cutting costs by 12–15% and reducing marketing spend by ~18% (FAO). They pivoted from a 2023 Russian ban to ship 16,000 t at 20–30% premiums (World Bank). By pooling funds for Fleckvieh and Brown Swiss genetics and skipping $ 200,000 robot setups, they achieve 8–12% feed efficiency gains with 3-year paybacks. Bottom line: focus on biology and teamwork, not herd size—you should try this on your farm.

KEY TAKEAWAYS

  • Bulk feed purchasing can slash costs by up to 15%—link up with your local coop this season to secure lower barley and soybean prices.
  • Small co-ops report feed-per-milk-kg gains of 8–12% versus solo farms—consider pooling for genetics programs like Fleckvieh/Brown Swiss.
  • Export diversification can boost margins 20–30%—explore new markets or specialty niches to hedge 2025 volatility.
  • Skipping high-cost robotics (>$200K) frees capital for proven biology investments—aim for ROI under 3 years from breeding and feeding upgrades.
  • The organic zoning push (200,000 ha by 2029) signals premium demand—certify part of your herd early to capture price increases.
dairy profitability, farm cost reduction, cooperative farming model, dairy farm management, global dairy trends

What’s the most surprising thing about Kyrgyzstan’s dairy industry? Most farms operate with just 5–7 cows, yet their milk output still rose by 2.1% in the year ending August 2024, surpassing one million metric tons (t), according to the National Statistical Committee of the Kyrgyz Republic. That’s pretty remarkable when you consider the EU is grappling with tighter environmental rules, and China’s dairy growth is slowing.

The Cooperative Advantage

The standout regions—Chuy, Jalal-Abad, and Osh—account for over two-thirds of the national production: Chuy at 272,263 t (26%), Jalal-Abad at 222,071 t (21%), and Osh at 213,745 t (20%). What strikes me is how cooperative management is extracting consistent volumes from challenging mountain terrain.

Yields average about 1,180 kg per cow. Modest by U.S. Holstein standards, yes, but in a pasture-based system relying on native breeds, it highlights the benefits of improved genetics and effective herd management.

Farmers here don’t go it alone. Pooling resources to buy feed in bulk—barley, soybean meal, and more—they’re trimming feed costs by roughly 12–15% and slicing marketing expenses by about 18%, a trend documented in a 2024 FAO case study (source). When feed can gobble more than half your budget, every bit of savings helps.

A Nimble Pivot to Global Markets

This cooperative model also drove a significant shift in major exports. After Russia’s 2023 ban hit Kyrgyz dairy hard, producers turned on a dime—shipping over 16,000 t in the year to August 2024 to booming markets in China, the UAE, and Afghanistan at price premiums of 20–30%. “This nimbleness in the face of political shifts builds real resilience,” notes Jean-Michel Happi of the World Bank.

Their collective muscle extends to genetics, too: cooperatives pool funds to import Fleckvieh and Brown Swiss semen—breeds prized for resilience and dual-purpose yields—unlocking performance gains that solo farms couldn’t finance on their own.

Biological Gains Over Mechanical Flash

Instead of chasing expensive robotic milkers—often costing over $ 200,000 with lengthy payback periods—these co-ops double down on precision breeding and standardized feeding. That approach yields feed-per-milk-kg gains of 8–12%, typically paying for itself within three years.

Diversifying export markets helps smooth out income variability by up to 30%. Additionally, plans to certify 200,000 hectares of organic farmland by 2029 position Kyrgyz producers well for the rising demand for authentic, mountain-pasture dairy.

The Bottom Line for Your Herd

The financial mechanics are just as compelling. For a 180-cow U.S. dairy, investing in genetics and nutrition generally yields better dividends than investing in expensive automation. A 100 kg yield bump per cow across 150 cows at $18.50 per hundredweight translates to roughly $6,100 in extra annual revenue—real money you can bank without a seven-figure investment.

This development is fascinating because it flips traditional dairy wisdom. In today’s complex market, strategy, cooperation, and focused biological investments often outpace sheer herd size or the flashiest gadgets.

Next time someone tells you small farms can’t compete, point them to Kyrgyzstan. Small. Nimble. Winning.

Complete references and supporting documentation are available upon request by contacting the editorial team at editor@thebullvine.com.

Learn More:

  • Dairy Comp 305 – 7 Ways to Cut Costs and Not Milk Production – This article reveals seven practical methods for trimming expenses without sacrificing yield. It provides a tactical roadmap for implementing the cost-saving strategies discussed in the main piece, from feed management to optimizing herd health for immediate financial impact.
  • The Future of the Dairy Industry: A 2025 Perspective – This piece explores the key economic and consumer trends shaping the global market. It provides the strategic context for the main article’s themes, helping you position your operation to thrive amid market volatility and shifting consumer demands.
  • Genomic Testing: Is It The Crystal Ball of Dairy Genetics? – This deep-dive demonstrates how to leverage genomic data to make smarter breeding decisions. It’s the perfect follow-up to the main article’s focus on biology, showing how targeted technology can accelerate genetic progress and maximize long-term profitability.

Join the Revolution!

Join over 30,000 successful dairy professionals who rely on Bullvine Weekly for their competitive edge. Delivered directly to your inbox each week, our exclusive industry insights help you make smarter decisions while saving precious hours every week. Never miss critical updates on milk production trends, breakthrough technologies, and profit-boosting strategies that top producers are already implementing. Subscribe now to transform your dairy operation’s efficiency and profitability—your future success is just one click away.

NewsSubscribe
First
Last
Consent

The Open-Source Revolution That’s About to Destroy the $2 Billion Farm Software Industry

Cornell just released free software that makes your $26,000 dairy management suite look like a calculator. Here’s why the industry is panicking.

What if the world’s most advanced dairy modeling technology was completely free while you’ve been paying thousands for inferior proprietary software that won’t even show you how it calculates your numbers?

Stop for a moment and ask yourself this uncomfortable question: Why are you still paying premium prices for software that treats you like an idiot?

Every month, you probably write checks for farm management software, ration formulation tools, environmental calculators, and economic modeling platforms. Add it up—between subscription fees, licensing costs, and “premium features,” many dairy operations are hemorrhaging $5,000 to $15,000 annually on software that treats you like a mushroom, keeping you in the dark and feeding you manure.

It’s like buying a $300,000 parlor system where the manufacturer won’t let you see inside the milk meters, won’t explain how the pulsation timing works, and tells you to “trust the system” when your somatic cell counts don’t match what the software predicts. Would you tolerate that from your equipment dealer? Then why are you accepting it from your software vendor?

Meanwhile, a team of researchers at Cornell University just dropped a nuclear bomb on the entire agricultural software industry. They’ve built the most sophisticated dairy farm modeling system ever created—one that can simulate every cow in your milking string, every pound of manure in your lagoon, every acre of your corn silage, and every environmental impact on your operation with unprecedented accuracy. And they’re giving it away for free.

Welcome to the Ruminant Farm Systems (RuFaS) revolution, where transparency isn’t just a buzzword—it’s the foundation that’s about to shatter the agricultural software monopoly forever.

The $2 Billion Black Box Scandal: How You’ve Been Played

Let’s call this what it is: you’ve been getting screwed worse than a heifer’s first breeding, and the industry has been laughing all the way to the bank.

The agricultural software industry has built a $2 billion empire on an insulting and almost criminal premise: dairy farmers are too busy milking cows or too technically challenged to understand how their tools work. So, they’ve sold you black boxes—expensive, proprietary systems that spit out numbers without showing you the math, like a feed salesman who won’t tell you what’s in the bag.

Your current ration formulation software can’t explain why it chose those feed ingredients over others that might be cheaper or more available. When did your nutritionist software last justify its recommendations beyond “trust our algorithms”?

Your environmental calculator won’t reveal the emission factors it’s using—factors that could be based on outdated research from Wisconsin farms that bear zero resemblance to your Texas operation. Your economic modeling tool guards its algorithms like the recipe for Coca-Cola.

And when the results don’t match your real-world experience—when the predicted milk production is off by 15 pounds, the emission estimates seem wildly inaccurate, and the economic projections miss by thousands of dollars? “Trust the system,” they say. “Our experts know best.”

This isn’t just insulting—it’s as dangerous as running a parlor without knowing your vacuum levels. When you can’t see inside the machine, you can’t verify its assumptions, challenge its calculations, or adapt it to your unique operation.

But here’s what really should make your blood boil like spoiled milk: while software companies charged you thousands for these inferior tools, academic researchers quietly built something infinitely better. And instead of cashing in like tech vultures, they’re handing it to you for free.

Why? Because they actually care about advancing dairy science rather than extracting maximum profit from farmers’ software budgets.

Meet RuFaS: The Free Tool That Makes Your Expensive Software Look Primitive

The Ruminant Farm Systems model isn’t just another agricultural calculator—it’s a complete reimagining of how farm modeling should work. Built by researchers at Cornell University using modern Python programming, RuFaS simulates every aspect of your dairy operation with a level of detail that would make your current software vendor weep into their licensing agreements.

Here’s the revolution: instead of treating your cows like identical units in a commodity spreadsheet, RuFaS recognizes that every animal in your herd is as unique as her dam and sire. Using Monte Carlo stochastic simulation—think of it as running thousands of virtual breeding decisions simultaneously—RuFaS tracks individual animals through their entire lifecycles, from heifer calf through dry-off and eventual culling.

Think about that for a moment. Your expensive herd management software probably averages everything across your entire milking herd, like assuming every cow produces exactly 70 pounds of milk regardless of parity, days in milk, or genetic potential. Is that how you actually manage your herd? Do you treat a fresh first-calf heifer like a mature cow at 200 days in milk? Of course not. So why are you paying for software that does exactly that?

RuFaS simulates each cow individually, accounting for:

  • Genetic diversity and phenotypic variation
  • Wood’s lactation curve parameters for each animal
  • Individual body condition changes
  • Reproductive status and breeding protocols
  • Pen-specific management factors

However, individual animal tracking is just the beginning. RuFaS consists of four interconnected modules that communicate with each other daily:

The Animal Module: Individual Cow Intelligence

This module doesn’t just calculate NRC feed requirements—it simulates complete lifecycles using established equations primarily from National Research Council standards, with capabilities to incorporate updated guidelines like NASEM 2021.

It tracks:

  • Voluntary waiting periods and breeding protocols
  • Enteric methane production using IPCC Tier 2 equations
  • Precise manure output (nitrogen, phosphorus, volatile solids, total solids, urine volume)
  • Walking distances to the parlor and heat stress impacts

When was the last time your ration software considered walking distance to the parlor or heat stress conditions?

The Manure Module: Nutrient Accounting Precision

This module tracks every pound of nutrients from the barn floor through field application, simulating:

  • Mechanical separation with user-defined efficiencies
  • Anaerobic digestion with customizable retention times
  • Storage emissions (N₂O, NH₃, CH₄)
  • Leachate production and nutrient losses

The Crop & Soil Module: Agronomic Intelligence

Drawing upon established methods from proven models—SWAT for hydrology, SurPhos for phosphorus dynamics, and DayCent for carbon and nitrogen cycling—this module simulates:

  • Daily crop growth based on solar radiation, temperature, water, and nitrogen availability
  • Greenhouse gas emissions from soil processes
  • Nutrient losses through runoff and leaching
  • Multiple field management scenarios

How much are you spending on soil consultants to tell you what this module calculates for free?

The Feed Storage Module: Quality Reality Check

This module accounts for the real-world factors every nutritionist knows but most software ignores:

  • Dry matter losses during storage
  • Protein degradation over time
  • Seasonal composition changes
  • Storage-related emissions and leachate

It ensures that the beautiful 18% protein, 65% NDF corn silage you put up in September is accurately represented as the 16.5% protein, 68% NDF feed you’re actually serving in March.

The Transparency Revolution: Why Open-Source Changes Everything

Here’s where the agricultural software industry’s business model completely falls apart: RuFaS is open source. Not just the results—the entire codebase.

Every equation, every assumption, and every calculation are there for you to examine. Don’t you like how the model estimates methane emissions from your lagoon? Look at the code and see if the assumptions match your actual system. Think the phosphorus cycling calculations don’t match your soil conditions? Check the algorithms and compare them to your extension agent’s recommendations.

When did your software vendor last let you peek under the hood? When did they explain their emission factors, justify their economic assumptions, or show you the research behind their recommendations? Never, because their entire business model depends on keeping you ignorant.

This transparency enables you to:

  • Verify assumptions against your local conditions
  • Identify when the model might not apply (like knowing NRC equations were developed on research cows, not commercial herds)
  • Understand confidence levels of different predictions
  • Customize inputs to match your specific management practices
  • Contribute improvements based on your real-world experience

Would you buy a $150,000 tractor without looking under the hood? Why are you accepting software that won’t show you its engine?

The open-source approach creates a powerful feedback loop. When thousands of farmers, researchers, and advisors can examine and improve the code, bugs get fixed faster than a broken water valve in winter, new features develop more rapidly than hybrid corn varieties, and the entire system becomes more robust.

The Economic Earthquake: Free vs. Thousands

Do you know what you’re actually spending on software annually? Most farmers don’t because costs are scattered across multiple vendors and billing cycles.

A typical large dairy operation hemorrhages:

  • $3,000-8,000 annually on herd management software (15-40 bred heifers)
  • $2,000-5,000 on ration formulation tools (a used feed mixer)
  • $1,500-4,000 on environmental monitoring (good embryo transfer program)
  • $2,000-6,000 on economic modeling platforms (year’s worth of breeding supplies)
  • $1,000-3,000 on crop management systems (custom chopping 100 acres)

Total annual damage: $9,500 to $26,000 for tools that can’t touch what RuFaS offers for free.

Over a decade: $100,000 to $260,000 in software costs alone—enough to build a decent calf facility or upgrade your entire milking system.

Documented ROI from Real Research

The research proves RuFaS delivers measurable results:

Feed Efficiency Study (Hansen et al., 2021): Researchers used RuFaS to quantify the farm-wide benefits of improved residual feed intake in dairy cows. Enhanced efficiency significantly reduced feed consumption, enteric methane emissions, and manure production. These aren’t theoretical benefits—they’re quantifiable improvements that easily save $50,000 to $200,000 annually on larger operations.

Methane Mitigation Research: RuFaS evaluation of 3-nitrooxypropanol showed methane yield reductions of up to 38% across typical U.S. dairy cow diets. This precise environmental accounting adds substantial revenue streams when carbon credits become valuable.

Reproductive Management Analysis: Studies comparing estrus synchronization protocols (5dCoSynch vs. OvSynch56) provided systems-level perspectives on how reproductive decisions affect feed consumption, methane output, and manure production.

Meanwhile, your expensive proprietary software still uses population averages and outdated emission factors.

Real Farms, Real Results: The Smart Money Is Already Moving

Think about this: the national dairy industry’s environmental program didn’t choose expensive proprietary software. They chose the free, open-source solution because it was better.

The FARM Environmental Stewardship Version 3, launched in 2024, represents a fundamental shift from simple emission factor calculations to process-based environmental modeling powered by RuFaS. Instead of crude estimates, farmers now get sophisticated, farm-specific environmental footprints accounting for their unique management practices.

The real power emerges with scenario analysis—testing “what if” questions that determine profitability:

  • What if I change corn silage harvest timing from 32% to 35% dry matter?
  • How would switching from traditional AI to sexed semen affect my environmental footprint?
  • What’s the whole-farm impact of improving feed efficiency in my top quartile?
  • How do different manure storage options compare economically and environmentally?

Can your proprietary software even frame these questions properly and answer them with pregnancy-check precision?

Research Applications Proving Value

RuFaS has enabled groundbreaking research across multiple areas:

Nutrition Standards Comparison: The model served as a platform comparing NASEM 2021 vs. NRC 2001 guidelines, helping identify “edge cases” where predictions diverge significantly within dynamic herd populations.

Genetic Progress Studies: Modified versions incorporating Net Merit traits quantified genetic progress and economic benefits of strategic semen use—conventional, sexed, and beef semen combinations.

Dietary Fat Supplementation: Meta-analysis work provides crucial input data for RuFaS simulations on rumen-available fatty acids’ impact on methane emissions and lactation performance.

Implementation Reality Check: Addressing the Challenges

Let’s be honest about what you’re getting into. While RuFaS represents a revolutionary advancement, successful adoption requires understanding both its capabilities and limitations.

Learning Curve Considerations

RuFaS isn’t plug-and-play like your current software. The model’s sophistication requires:

  • Time investment: Plan 2-3 weeks for initial familiarity
  • Data preparation: Comprehensive farm information gathering
  • Staff training: Key personnel need technical understanding
  • Patience: Complex simulations take time to set up correctly

Technical Requirements

Unlike cloud-based subscription software, RuFaS requires:

  • Local computing power: Standard farm computers handle it fine
  • Data management skills: CSV files and database management
  • Technical support: Community-based rather than phone support

Farm Size Considerations

RuFaS delivers maximum value for operations with:

  • 300+ milking cows: Complexity justifies modeling sophistication
  • Multiple enterprises: Crop, livestock, and manure management integration
  • Environmental reporting needs: FARM program participation or carbon credit programs
  • Management diversity: Multiple scenarios to evaluate

Smaller operations might find basic modules sufficient initially, with full implementation as operations grow.

Data Security and Privacy

Unlike proprietary software that owns your data, RuFaS keeps information on your systems. However, this means:

  • You’re responsible for data backup and security
  • There are no cloud vulnerabilities but also no automatic cloud backup
  • Complete control over who accesses your information

Industry Disruption: The Resistance is Real (And Predictable)

Watch for predictable counterattacks from established software companies:

“Support Concerns”: They’ll claim free software can’t provide adequate support, ignoring that RuFaS comes with comprehensive documentation, active user communities, and collaborative development. How does that customer support work when your software crashes during breeding season?

“Reliability Questions”: Arguments about open-source stability from an industry that regularly releases buggy updates, discontinues products without warning, and holds your data hostage when you stop paying.

“Complexity Warnings”: They’ll suggest RuFaS is too complicated for farmers. You manage breeding programs with multiple AI studs, embryo transfer protocols, and crossbreeding systems, but apparently, you can’t understand transparent software algorithms?

The real disruption isn’t just economic—it’s philosophical. RuFaS shifts from “farmer as customer” to “farmer as collaborator.”

Getting Started: Your Path to Software Independence

Phase 1: Education and Exploration (Weeks 1-2)

  • Download RuFaS documentation from Cornell’s project page
  • Review module descriptions and input requirements
  • Critical question: Can you afford to keep using inferior tools?

Phase 2: Pilot Testing (Weeks 3-6)

  • Run parallel analyses with current software
  • Compare results and examine assumptions
  • Eye-opening reality: Your expensive software has probably been giving questionable results for years

Phase 3: Scenario Development (Weeks 7-12)

  • Begin specific decision support scenarios
  • Test management changes digitally before physical implementation
  • Start with straightforward questions with clear economic implications

Phase 4: Integration Planning (Months 4-6)

  • Develop strategies for regular management process integration
  • Train staff and modify data collection procedures
  • This isn’t just changing software—it’s improving decision-making

Phase 5: Community Engagement (Ongoing)

  • Join the growing RuFaS user community
  • Share experiences and contribute feedback
  • Help improve the model for everyone

Technical barriers are minimal. If you can operate current farm management software or sync heat detection systems with breeding calendars, you can learn RuFaS.

The Future is Open: Where This Revolution Leads

The RuFaS revolution previews agriculture’s technological future. The question isn’t whether this transformation will happen—it’s whether you’ll lead it or follow it.

Expect to see:

Enhanced Integration: Real-time farm modeling based on sensor data rather than estimates—continuous monitoring of feed intake, activity levels, and milk production feeding comprehensive optimization models.

Global Adaptation: Open-source nature enables international customization for different climates and production systems.

Specialized Modules: Future developments in precision livestock farming, renewable energy integration, and ecosystem service quantification.

Policy Integration: Governments increasingly need sophisticated environmental modeling. RuFaS’s transparency and scientific rigor position it for official assessments and regulatory frameworks.

Do you want to use software regulators trust or software that hides its calculations?

The Choice is Yours: Evolution or Revolution

Every technological revolution reaches a tipping point where early adopters gain decisive competitive advantages. We’re approaching that moment in agricultural software.

You can continue paying thousands annually for black-box software that treats you like a customer to be managed rather than a partner to be empowered. You can keep writing checks to software companies that innovate at the pace of genetic progress in 1950—slow, secretive, and focused more on protecting their position than advancing the industry.

Or you can join the revolution.

RuFaS represents more than just free software—it’s a fundamentally different relationship between farmers and technology. Instead of being passive consumers, you become active participants in creating tools that actually serve your needs.

The agricultural software industry built its business model on information asymmetry and artificial scarcity. They convinced farmers that sophisticated modeling required expensive, proprietary solutions only experts could understand.

RuFaS shatters both assumptions.

Your current software subscriptions are probably up for renewal soon. Before you write those checks again, ask yourself: Why am I paying premium prices for inferior, inflexible tools when something better is available for free?

The revolution has already begun. The only question is which side of history you’ll choose.

Your Move: It’s Time to Act

The future of farm modeling is here. It’s open. It’s free. It’s RuFaS.

But here’s the hard truth: knowing about this revolution doesn’t help you if you don’t act. Every month you delay is another month of paying for inferior tools while competitors gain advantages.

So, here’s your call to action: Before you renew another software, subscription and accept another “proprietary algorithm” excuse, write another check to companies that treat you like a profit center—take one afternoon to explore RuFaS.

Visit the Cornell University RuFaS project page. Download the documentation. Run a comparison with your current software. Join the growing community of farmers and researchers building the future of agricultural modeling together.

Because here’s what I’ve learned in decades of covering this industry: The farmers who succeed aren’t the ones who wait for perfect solutions—they’re the ones who recognize game-changing opportunities and act while their competitors are still debating.

The revolution needs participants, not just observers. The question is: will you be one of them?

Stop paying for inferior software. Stop accepting black-box calculations. Stop letting software companies treat you like you can’t handle the truth.

The future is open source. The future is transparent. The future is now.

What are you waiting for?

Ready to explore RuFaS for your operation? Visit the Cornell University RuFaS project page or connect with the growing community of farmers and researchers who are building the future of agricultural modeling together. Because the revolution isn’t just about better software—it’s about better decisions, better outcomes, and a better future for dairy farming.

Key Takeaways

  • Massive Cost Savings: Dairy operations spending $9,500-$26,000 annually on inferior proprietary software can access superior modeling technology for free, potentially saving $100,000-$260,000 over a decade.
  • Superior Technology: RuFaS simulates individual animals using Monte Carlo methods rather than herd averages, provides complete algorithmic transparency, and integrates four interconnected modules for whole-farm optimization—capabilities that exceed expensive commercial alternatives.
  • National Industry Validation: The model powers the FARM Environmental Stewardship Program Version 3, demonstrating that the national dairy industry chose free, open-source technology over expensive proprietary solutions for environmental assessments.
  • Transparency Revolution: Unlike black-box commercial software that hides calculations, RuFaS provides complete open-source access to every equation and assumption, enabling farmers to verify, customize, and improve the model for their specific conditions.
  • Competitive First-Mover Advantage: Early adopters gain access to research-grade modeling capabilities while competitors pay premium prices for inferior tools, positioning them for better decision-making and improved farm performance as the industry transitions to transparent, collaborative technology platforms.

Executive Summary

Cornell University’s Ruminant Farm Systems (RuFaS) model represents a seismic shift in agricultural software, offering free sophisticated dairy farm modeling while proprietary alternatives cost $9,500-$26,000 annually. Unlike black-box commercial software, RuFaS provides complete transparency with open-source code, simulates individual animals rather than herd averages, and integrates four interconnected modules tracking everything from feed storage to soil nutrients. The model has already achieved national validation through its integration with the FARM Environmental Stewardship Program, powering environmental assessments for thousands of U.S. dairy operations. This revolution challenges the $2 billion agricultural software industry’s business model built on information asymmetry and artificial scarcity. Early adopting farmers gain access to superior decision-support tools while potentially saving hundreds of thousands in software costs over a decade. The shift from proprietary to open-source represents more than cost savings—it’s a fundamental change from farmers as customers to farmers as collaborators in agricultural technology development.

Learn more:

Join the Revolution!

Join over 30,000 successful dairy professionals who rely on Bullvine Weekly for their competitive edge. Delivered directly to your inbox each week, our exclusive industry insights help you make smarter decisions while saving precious hours every week. Never miss critical updates on milk production trends, breakthrough technologies, and profit-boosting strategies that top producers are already implementing. Subscribe now to transform your dairy operation’s efficiency and profitability—your future success is just one click away.

NewsSubscribe
First
Last
Consent
Send this to a friend