A structural shift in dairy economics is creating new opportunities for farms producing protein-rich milk—and understanding these dynamics can help inform decisions in the months ahead.
Executive Summary: Dairy processors just made an $11 billion bet on protein—and that changes the equation for every milk check in America. With whey protein isolate trading above $8.50 per pound and the April 2025 Net Merit revision boosting Feed Saved from 12% to nearly 18%, the industry is signaling where value is heading for the next decade. Producers combining targeted genetics with amino acid nutrition are seeing protein improvements worth $60,000-70,000 annually on 500-cow operations. The catch? Your pricing structure determines whether you actually capture that value. Farms in large pooled cooperatives often keep only a fraction of their component gains, while those on direct Class III pricing retain most of what they produce. Before investing in protein optimization, one comparison matters most: what you received per pound of protein versus the Class III protein price over your last three months. That gap reveals whether this opportunity is real for your operation—or whether you’d simply be subsidizing someone else’s premium.

You know, if you’ve been watching your milk checks closely over the past year or so, you’ve probably noticed something shifting. Back in May 2024, USDA Cold Storage data showed butter inventories climbing to nearly 380 million pounds—the highest we’d seen since 2020. That’s a lot of butter sitting in warehouses.
| Metric | 2020 | 2024 | Change |
| Butter Cold Storage (million lbs) | 282 | 380 | +35% |
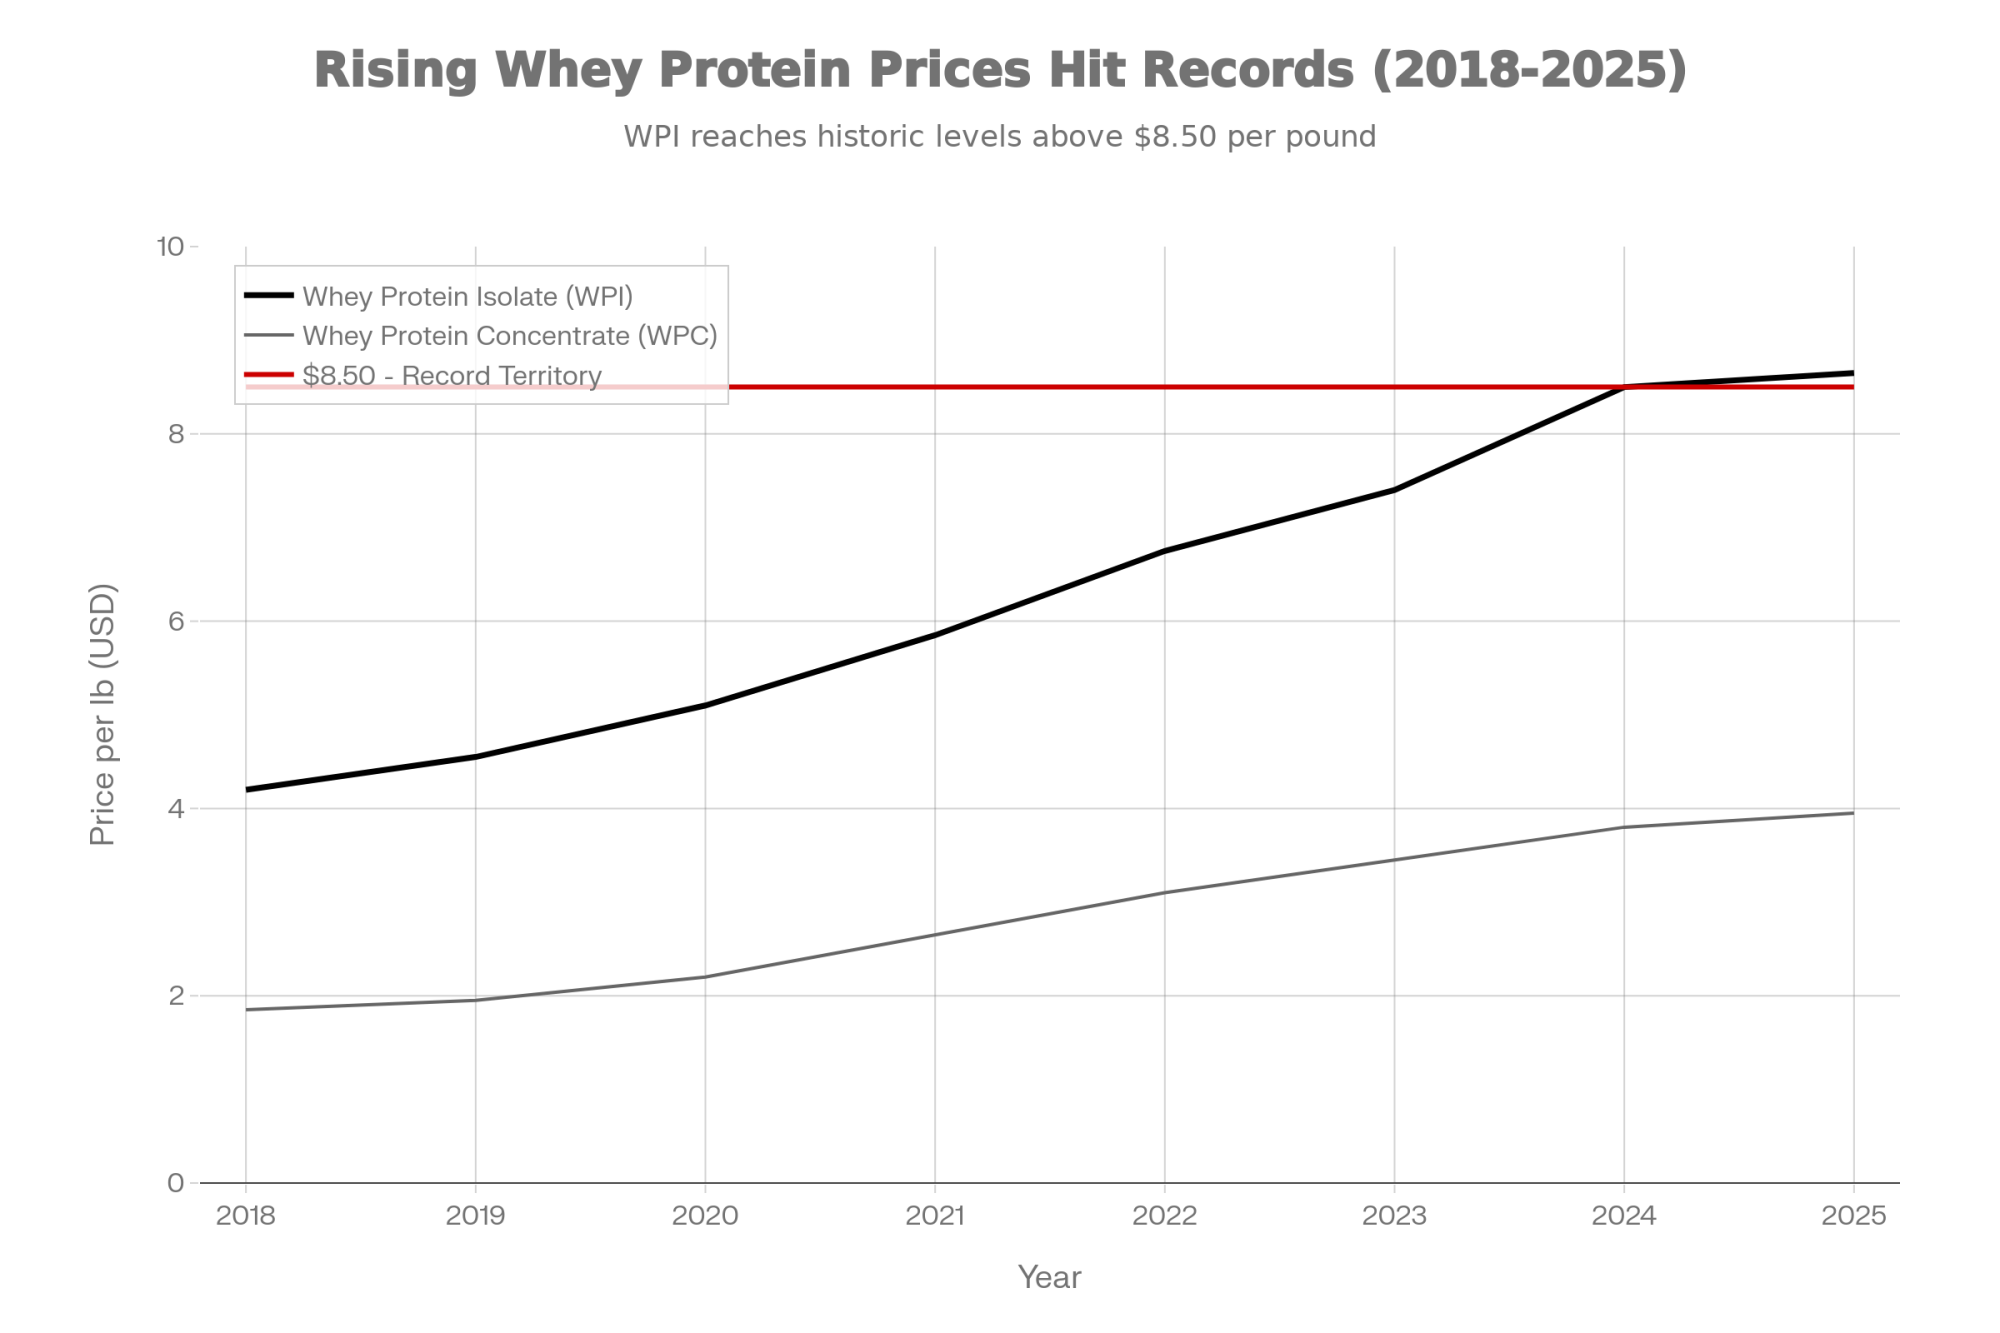
| Whey Protein Isolate Price ($/lb) | $5.10 | $8.50 | +67% |
| New Protein Facility Investment | $2.1B | $11.0B | +424% |
And here’s what got my attention: around the same time, cheese processors across the Upper Midwest started signaling they were receiving more cream than they needed for optimal cheese production. For those of us who remember when butterfat premiums seemed like they’d climb forever, it was a notable moment.

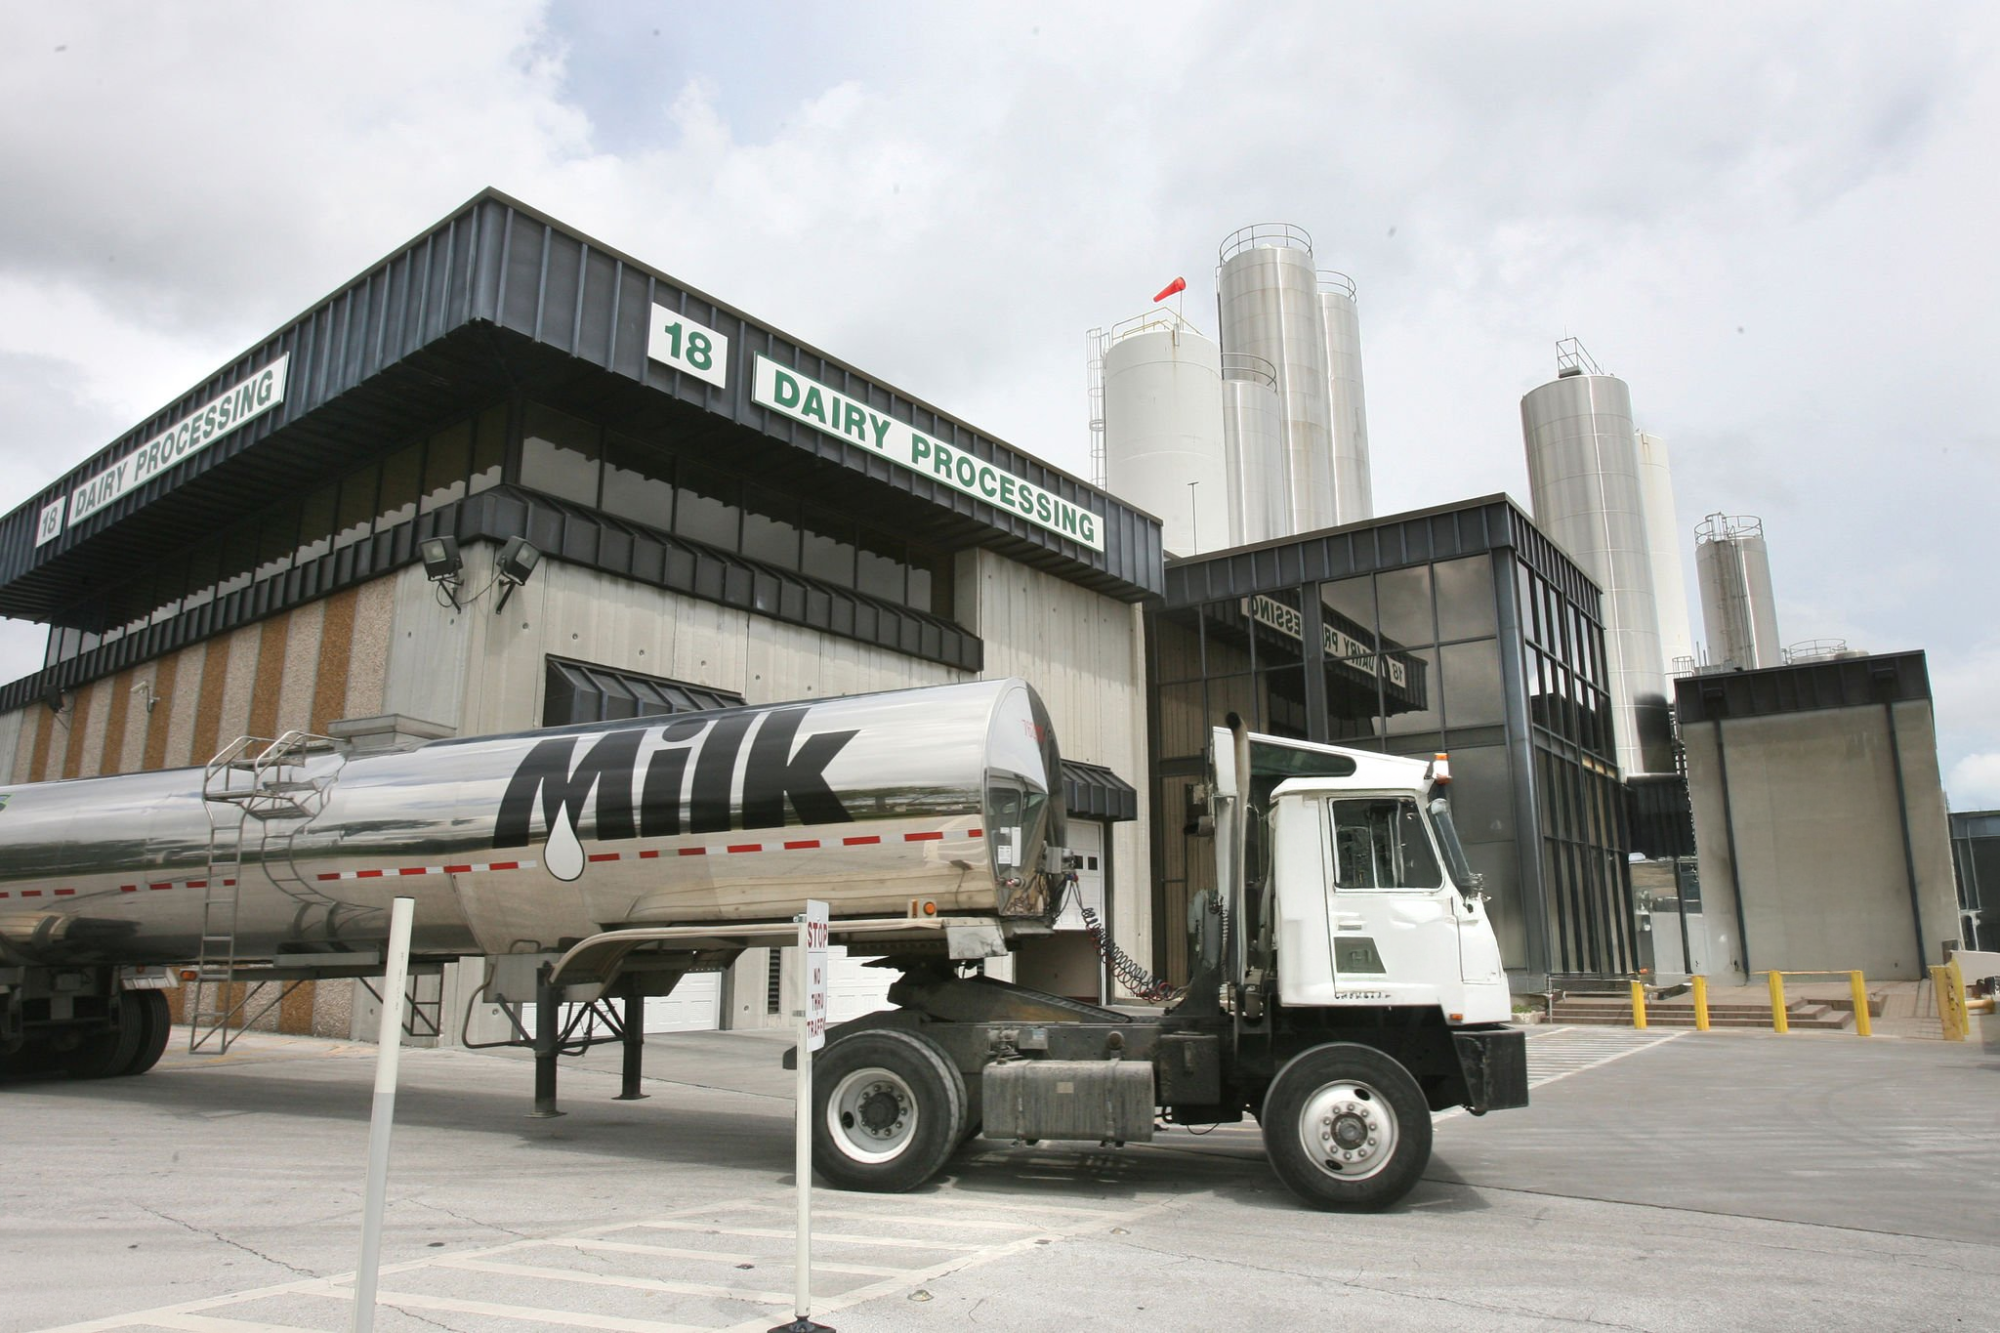
What’s happening isn’t that butterfat suddenly lost value—it hasn’t. It’s that processors have committed serious capital to cheese and whey protein facilities, and that’s changing what they need from the milk supply. The International Dairy Foods Association announced in October 2025 that America’s dairy processors have invested more than $11 billion in new and expanded manufacturing capacity across 19 states—with over 50 projects coming online between now and 2028.
That’s not a small bet. And it tells you something about where the industry sees value heading over the next decade.
Following the Investment Money
When I’m trying to understand where dairy markets are heading, I’ve always found it useful to watch where processors actually put their capital. Talk is cheap, but $870 million facilities tell you something.
That’s what Leprino Foods committed to their Lubbock, Texas plant—a decision the Texas Governor’s office and Texas Tech Research Park both documented back in April 2022. We’re talking about an 850,000-square-foot facility designed from the ground up for integrated mozzarella and whey protein production. When you build that kind of infrastructure, you’re making a decade-long bet on where value will come from.
And Leprino isn’t alone in this. Hilmar cut the ribbon on a $600 million facility in Dodge City, Kansas, back in March 2025—Dairy Processing magazine covered the opening extensively. Fonterra invested $240 million in New Zealand mozzarella capacity a few years back. Across Wisconsin and Minnesota, regional processors have been adding whey protein recovery equipment alongside cheese expansion projects.
What’s interesting is that this isn’t just a U.S. phenomenon. You’re seeing similar capital flowing toward protein and whey infrastructure in the EU and Oceania—which suggests this shift reflects global demand patterns rather than a temporary domestic trend. When processors on three continents are making the same bet, it’s worth paying attention.
What’s different about these investments compared to previous buildouts? The explicit focus on capturing whey value. I remember hearing Dr. Mark Stephenson—who recently retired as Director of Dairy Policy Analysis at UW-Madison—make this point at an industry meeting. Modern cheese plant economics increasingly depend on monetizing both the cheese and whey streams. Processors who can efficiently convert whey into high-value protein products have developed a meaningful competitive advantage.

The pricing reflects this shift. USDA data from late 2024 showed whey protein isolate climbing above $8.50 per pound—record territory—and prices have continued strengthening into 2025. If you look at USDA Dairy Market News reports, whey protein concentrate has more than doubled in many markets from where it sat back in 2018.
Why such sustained strength? Several factors have converged globally, which is part of what makes this feel structural rather than cyclical. China remains one of the world’s largest importers of dairy ingredients, with significant demand for infant formula components. Sports nutrition markets in Asia and Europe continue expanding. Meanwhile—and this one caught most of us off guard—the rapid adoption of GLP-1 weight-loss medications has created substantial new protein demand. Industry analysts have noted that patients on drugs like Ozempic are advised to maintain high protein intake, and that’s flowing through to whey consumption in ways nobody predicted five years ago.
When processors can generate meaningful revenue from whey alone, their willingness to pay for protein-rich milk makes straightforward economic sense.
What the Net Merit Changes Tell Us
The April 2025 revision to Net Merit offers another window into where the industry sees value heading. If you haven’t looked at the updated trait weights from the Council on Dairy Cattle Breeding, they’re worth examining.

Here’s how the emphasis shifted:
| Trait | Previous Weight (2021) | New Weight (2025) | Change |
| Feed Saved | 12.0% | 17.8% | +5.8% |
| Butterfat | 28.6% | 31.8% | +3.2% |
| Protein | 19.6% | 13.0% | -6.6% |
| Productive Life | 11.0% | 8.0% | -3.0% |
| Cow Livability | 7.0% | 8.0% | +1.0% |
| Heifer Livability | 1.3% | 2.0% | +0.7% |
That decrease in protein weight catches people off guard at first—it seems to contradict everything we’ve been discussing about protein demand. But dig into the methodology, and it makes more sense. Protein value is now being captured through multiple pathways in the formula—feed efficiency, component relationships, and longevity factors. A bull producing efficient daughters with strong components and a good productive life captures protein value across several trait categories rather than just one line item.
What does this means practically? Bulls that looked middling under older indexes—solid on efficiency and percentages but perhaps not flashy on production—are ranking considerably higher now. I’ve talked with several producers who’ve gone back through old sire catalogs and found bulls they’d passed over now sitting in the top tier.
One Wisconsin dairyman put it well: “Same genetics, completely different economic picture. The index finally caught up with what processors want to buy.”
The Nutrition Piece
Farms seeing the strongest protein gains are generally combining genetic direction with targeted nutrition work. The approach that’s gotten the most traction centers on rumen-protected amino acid supplementation—specifically methionine and lysine.

The science here is fairly well established at this point. Research published in the Journal of Dairy Science and extension work from programs like Penn State has documented that methionine and lysine are frequently the first-limiting amino acids for protein synthesis in typical corn silage-based Midwest rations. When you can get adequate methionine past the rumen and into the small intestine, cows can convert more of their dietary protein into milk protein.
What does implementation actually look like? Based on extension recommendations from Wisconsin, Minnesota, and Cornell, most successful protocols run around 15 grams of rumen-protected methionine per cow daily, balanced with lysine at roughly a 3:1 ratio. But the amino acids aren’t magic—they work best when the underlying ration is already well-balanced.
And here’s something I’ve noticed: farms often see protein responses from improving the basics before they even add supplements. Better feeding frequency, improved bunk management, attention to fresh cow nutrition during those critical first 60 days… sometimes the fundamentals matter most.
The transition period deserves particular attention. Research from land-grant universities has shown that close-up dry cow nutrition influences early lactation performance in meaningful ways. Getting that pre-fresh nutrition right sets the table for everything that follows.
When farms execute this well, they’re typically seeing protein improvements of 0.15 to 0.25 percentage points within a month or two—though results vary depending on the baseline diet and management. Run that math on a 500-cow herd, and you’re looking at meaningful dollars—potentially $60,000-70,000 annually at current component premiums.
Of course, there’s investment required on the front end. Amino acid programs run $25,000-35,000 per year for a herd that size, plus genetic program costs. Most farms doing this well are seeing positive returns within about a year.
But—and this is important—that math depends heavily on how your milk is actually priced.
The Pricing Question That Matters Most

Here’s where individual circumstances become crucial, and where I’ve seen producers make costly assumptions.
Not all milk payment systems reward improvements to components equally. Depending on your situation, the same investment might generate very different returns.
If you’re on component-indexed pricing—straight Class III or IV federal order payments—protein improvements generally flow through to your check within a few weeks. These operations typically capture a significant portion of the commodity value from their component gains.
Pooled cooperative pricing is more complicated. When your milk blends with dozens or hundreds of other farms before payment calculations happen, individual component improvements get diluted across the pool. I spoke with a producer in central Wisconsin who learned this the hard way—invested significantly in nutrition and genetics, moved his tank from 3.05% to 3.28% protein, but his cooperative pools 94 farms, and the pool average barely budged. He got paid on the pool number, not his individual achievement.
Fixed contracts present another scenario. Multi-year arrangements may not reflect component changes until renegotiation, regardless of what’s happening in commodity markets.
⚠️ A Word of Caution for Large-Pool Operations


If you’re shipping to a cooperative that pools 100+ farms, it’s worth getting written confirmation of how your individual component improvements will be valued before ramping up amino acid spending. Ask specifically: “Will my protein be paid out above the pool average, or blended into the pool before my check is calculated?”
I’ve seen situations where producers invested $30,000+ annually but captured only a fraction of the value their cows actually produced—in some cases, by my rough math, maybe 20-30% of what they’d have received under direct component pricing. Your numbers will be different, so pull your last few settlement sheets, compare your protein line item to the Class III protein price during those months, and see what the gap actually looks like for your operation.
Get the details in writing before you write that first feed additive check.
| Pricing Structure | Component Capture | Payment Lag | Annual Impact (500-cow) | Risk |
| Direct Class III | 90-98% | 2-3 weeks | +$68,000 | Low |
| Small Pool Co-op (20) | 70-85% | 4-8 weeks | +$52,000 | Moderate |
| Large Pool Co-op (100+) | 25-35% | 8-12 weeks | +$22,000 | High |
| Fixed Multi-Year | 0% until renewal | 12-36 months | $0-$15,000 | High |
Before committing resources to protein optimization, have a direct conversation with your cooperative or processor. Some questions worth asking:
Questions for Your Processor
- How exactly is protein valued in my payment?
- What premium applies per point above baseline?
- Is my pricing tied to commodity markets or fixed?
- How does my individual production factor into payment versus pool averages?
- Are changes to component pricing under consideration in the next few years?
Getting clear answers—ideally in writing—helps ensure your investments match your actual payment reality.
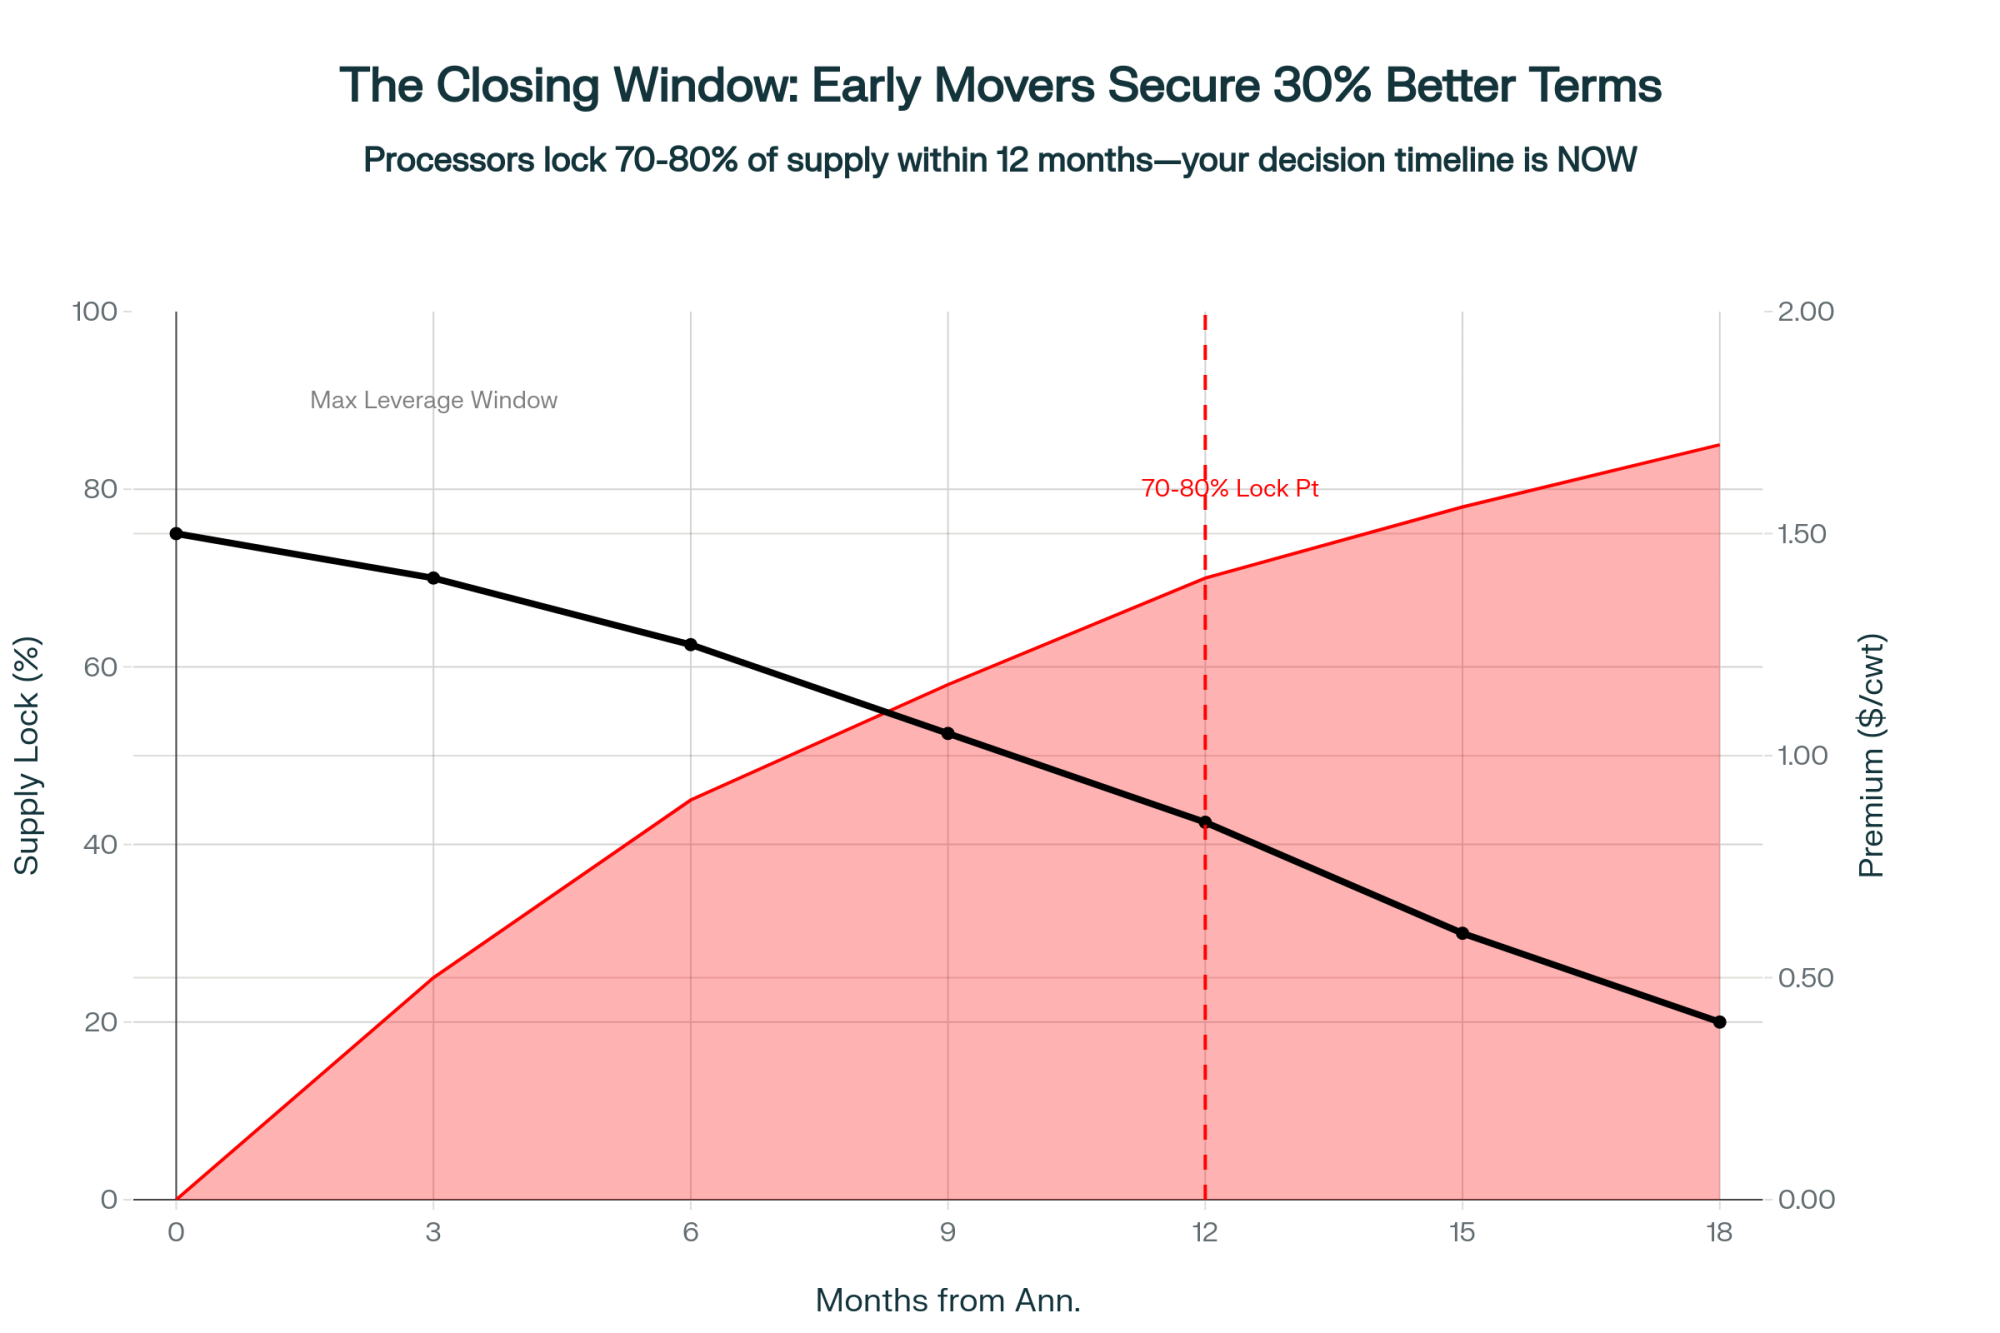
Thinking About Timing
Farms that started this work back in late 2024 have developed certain advantages—genetic progress, processor relationships, and, in some cases, contract terms that reflected the recruitment phase of new facility buildouts.
Looking at how things are unfolding: 2024-2025 represented the buildout phase, with new capacity coming online and processors actively seeking milk to fill facilities. Premium arrangements were more available during that window.
Through 2026-2027, we’ll likely see that capacity reaching target utilization. Processor relationships are solidifying, and the terms available to new suppliers may differ from what early movers secured.
By 2028-2029, assuming demand projections hold, markets should approach something like equilibrium. Premiums probably moderate from current peaks—not disappear, but normalize.
For operations starting now, this means entering somewhat behind early movers. Genetics compound over time, so there’s a gap that doesn’t fully close. But farms that begin today can still achieve meaningful improvement compared to operations that make no changes. The opportunity looks different from than it did in 2024, but it’s certainly not gone.
A Few Things Worth Thinking Through
Every strategic direction involves tradeoffs, and the protein focus is no exception. Here are a few considerations that deserve honest attention.
Component ratio balance matters for cheese manufacturing. Research from the American Dairy Products Institute indicates that most cheese production works best with protein-to-butterfat ratios in the 0.80-0.90 range. CoBank economist Corey Geiger has noted that cheesemakers strive for ratios near 0.80—anything significantly lower can affect cheese quality. Farms that substantially increase protein while butterfat falls may find their milk components less desirable for certain applications.
Input cost variability has surprised some operations. Rumen-protected amino acid prices spiked significantly back in 2021-2022 when supply disruptions hit. Building some flexibility into nutrition programs helps manage that exposure.
Genetic diversity deserves ongoing attention, too. With genomic selection concentrating breeding on popular sire families, inbreeding levels have climbed substantially over the past couple of decades—recent CDCB data shows levels exceeding 15% in some young Holstein bull populations. The costs show up in fertility and health over time, though they’re easy to overlook in the short term. Maintaining reasonable sire diversity isn’t just academic—it’s practical risk management.
Regional market variation matters quite a bit as well. Upper Midwest farms near major cheese processors are well-positioned for this approach. Operations in fluid milk markets or regions where butter production dominates may see more limited benefit regardless of their component achievements. Knowing your market matters before optimizing for it.
The Sustainability Angle
When sustainability premiums first entered industry conversations, I’ll admit to some skepticism about whether they’d actually show up at the farm level. That picture seems to be evolving.
With the EU’s Carbon Border Adjustment Mechanism set to take full effect next month, in January 2026, processors exporting cheese to Europe will face new carbon-intensity-based costs. This creates real incentive to source lower-emission milk. Paying farmers for documented carbon reductions becomes economically rational when it saves on export compliance costs.
Here’s what connects this to protein work: farms improving feed efficiency while maintaining strong milk components inherently reduce emissions per unit of output. Research from universities including Penn State and UC Davis suggests that improved efficiency translates to lower carbon intensity per pound of milk solids produced.
Done thoughtfully, component optimization and emissions reduction can complement each other rather than compete.
Several European cooperatives have already implemented farmer incentive programs along these lines. U.S. processors are developing pilot programs. This probably isn’t the primary reason to pursue protein optimization today, but it’s an increasingly relevant factor that may strengthen the case over time.
Getting Started Thoughtfully

For operations considering this direction, the first 90 days often matter more than elaborate long-term plans. Based on conversations with producers who’ve navigated this successfully, here’s a reasonable framework:
The first month should focus on understanding your actual situation. Document current milk composition—protein, butterfat, and their ratio. Have honest conversations with your processor about how components are valued in your payment. Look at your current genetics through the updated Net Merit lens.
The second month is for testing at conservative levels. Maybe start amino acid supplementation around 10-12 grams rather than full protocols. Focus on feeding fundamentals and bunk management. Track composition weekly rather than waiting for monthly tests.
By month three, you should have enough information to determine whether this fits your operation. If the response looks positive, genomic testing can identify your strongest replacement genetics. Continue building processor relationships with real data. Evaluate whether deeper investment makes sense given what you’ve learned.
This approach generates actual information before requiring major commitments.
The Bottom Line
The dairy industry is working through its most significant component value evolution in quite some time. How individual farms respond will depend substantially on their specific circumstances—pricing structure, regional market, capital situation, and risk tolerance.
A few things seem reasonably clear from the data and from conversations with producers navigating these decisions:
The underlying shift appears structural. Processor investments of $11 billion don’t respond to temporary signals. The infrastructure going in will influence economics for years.
Individual circumstances determine actual returns. Understanding precisely how your milk is priced matters enormously before committing resources.
Nutrition typically shows results faster than genetics. Amino acid work can demonstrate effects within weeks; genetic progress compounds over years. Using nutrition gains to fund genetic investment creates sustainable momentum.
Thoughtful risk management enhances outcomes. Maintaining component balance, reasonable fertility standards in genetic selection, sire diversity, and program flexibility all contribute to durable success.
Some farms will determine, after careful analysis, that their situation makes this direction less attractive. That’s genuinely useful information.
For others, there’s still an opportunity to develop a thoughtful approach aligned with where the industry appears headed. The terms differ from early mover advantages, but the fundamental economics remain sound for many operations.

Here’s your challenge: Pull your milk checks from the last 3 months this week. Calculate exactly what you received per pound of protein versus what the Class III protein price was during those months. If the gap is more than 15%, you’re losing money to your payment structure—and no amount of genetic progress or nutrition investment will close that gap until you address the pricing problem first.
The processors have placed their bets. The question is whether your operation is positioned to benefit—or whether you’re subsidizing someone else’s protein premium.

Key Takeaways
- $11 billion in new facilities signals processors are betting long-term on protein—this is structural, not cyclical
- Net Merit 2025 reshuffled genetics—Feed Saved jumped from 12% to 18%; some bulls you overlooked now rank at the top
- Nutrition delivers faster than genetics: 15g daily methionine + 3:1 lysine ratio can boost protein 0.15-0.25 points within 60 days
- Your pricing structure is everything—farms in large pooled co-ops may capture only 20-30% of component improvements
- Do the math before you invest: Compare 3 months of protein payments to Class III prices—a gap over 15% means fix pricing first
Complete references and supporting documentation are available upon request by contacting the editorial team at editor@thebullvine.com.
Learn More:
- The $38,000 Question: Why Components Beat Volume in Dairy’s New Reality – Reveals the specific mathematics behind shifting from volume to components, demonstrating how hitting 4.3% butterfat targets can generate an additional $38,000 annually per 500 cows while reducing overhead costs.
- $11 Billion in New Processing Capacity Is Creating Winners and Losers – Analyzes the geographic footprint of 50+ new processing facilities coming online through 2028 and provides a 6-month strategic roadmap for positioning your milk supply to capture emerging premiums.
- CDCB’s 2025 Genetic Base and Merit Indices Update: Everything You Need To Know – Provides a technical deep dive into the April 2025 Net Merit formula revisions, explaining exactly how the new “Feed Saved” and component weightings impact sire selection and long-term herd profitability.
 Join the Revolution!
 Join the Revolution!
Join over 30,000 successful dairy professionals who rely on Bullvine Weekly for their competitive edge. Delivered directly to your inbox each week, our exclusive industry insights help you make smarter decisions while saving precious hours every week. Never miss critical updates on milk production trends, breakthrough technologies, and profit-boosting strategies that top producers are already implementing. Subscribe now to transform your dairy operation’s efficiency and profitability—your future success is just one click away.