Archive for dairy heifer inventory

CoBank’s 800,000 Heifer Warning: Is Male Sexed Beef Pushing U.S. Dairies Into a $3,010 Trap?

You chased beef premiums. CoBank says 800,000 heifers vanished. Where does your breeding plan land in that math?

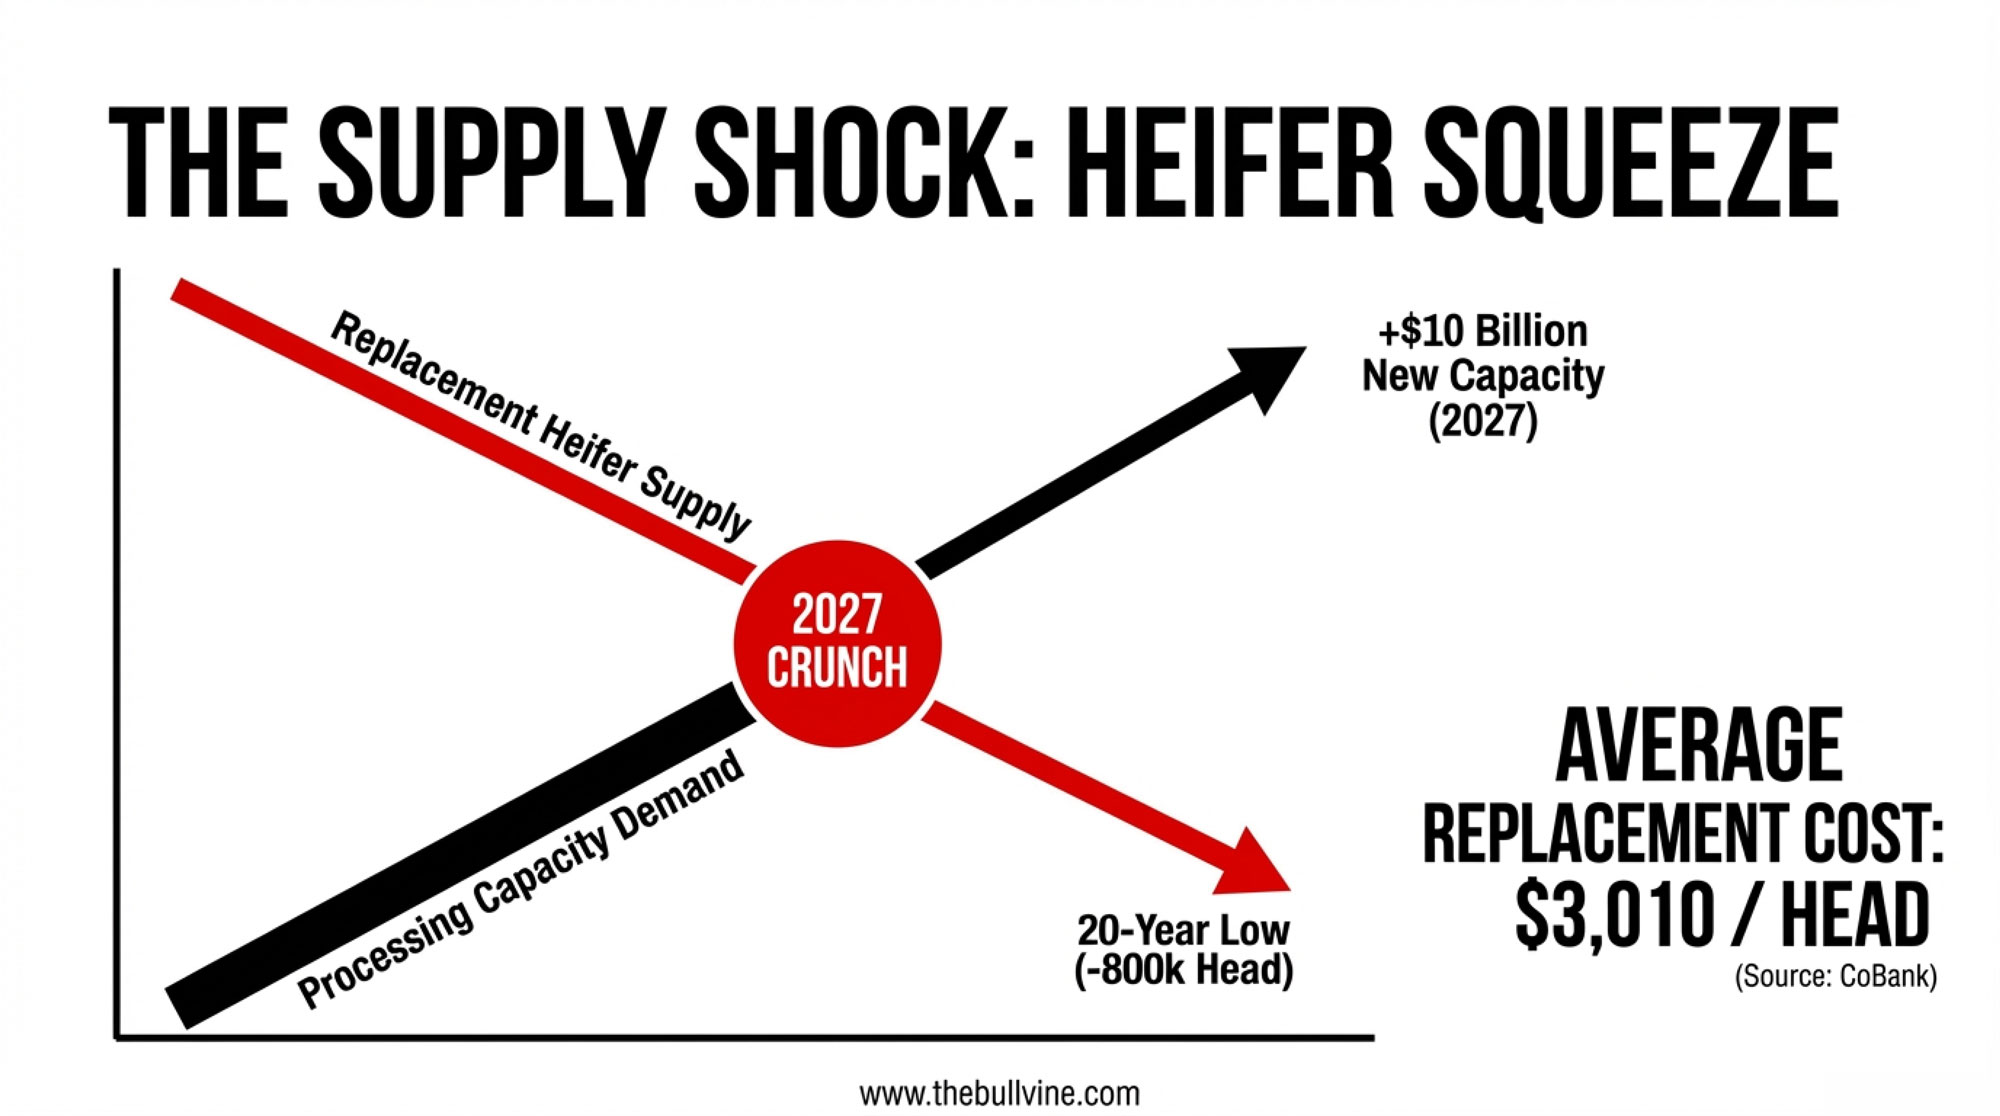
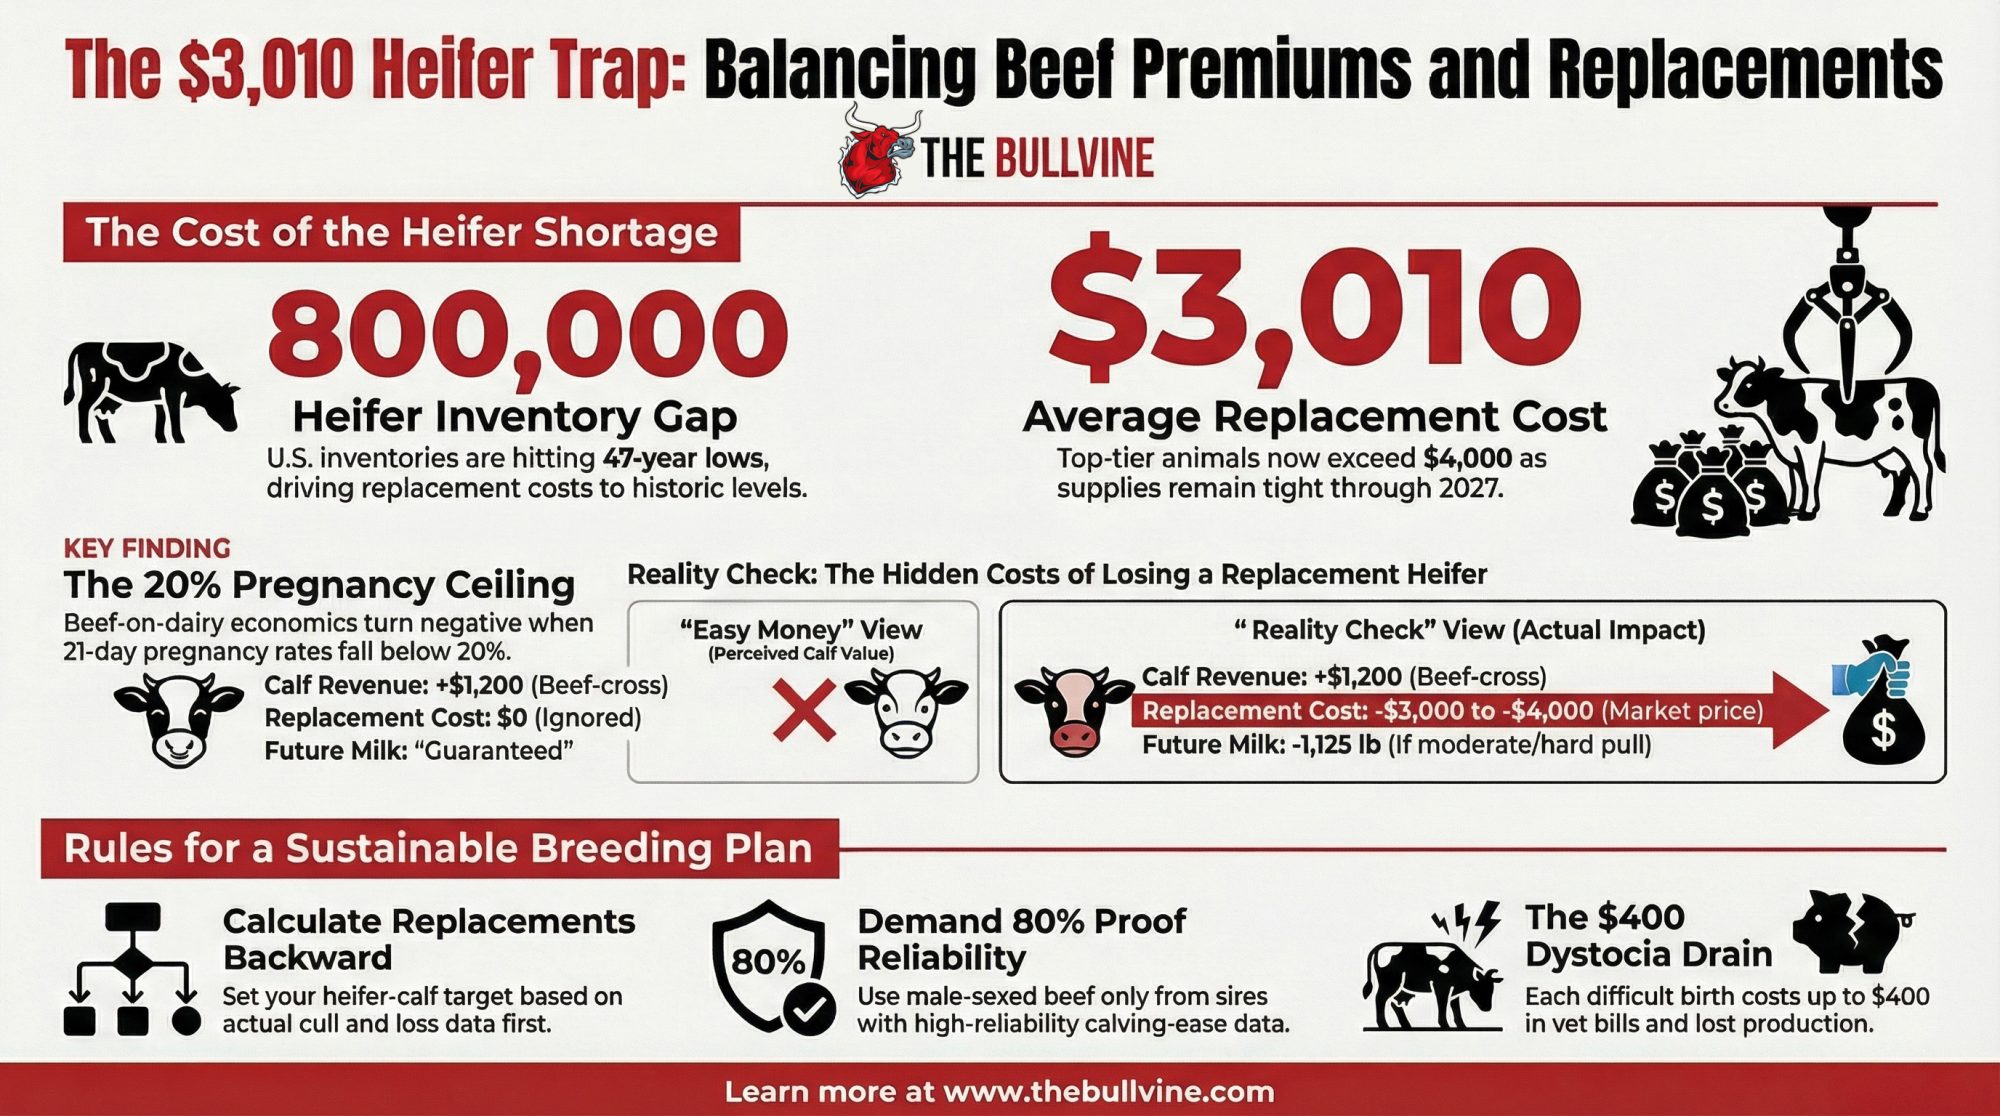
Executive Summary: CoBank is warning that U.S. dairy heifer inventories will drop by about 800,000 head through 2026, pushing average replacements to roughly $3,010 and over $4,000 for top animals in some regions. In the same window, U.S. dairies used 7.9 million beef semen doses in 2024 — more than 80% of all beef semen sold — which guarantees fewer dairy heifer calves in the pipeline. That’s turned male sexed beef from an $1,000–$1,500 “easy money” calf into a potential replacement trap if 21‑day pregnancy rates sit below about 20% or if calving‑ease proofs aren’t rock‑solid. Dystocia research shows each moderate–hard pull can cost $150–$400 plus around 1,125 lb of lost milk per lactation, and early culls now mean paying $3,000–$4,000 to bring in a heifer. Herds working with UW‑Madison’s Victor Cabrera and others have already cut beef use from the mid‑30s down toward 20–30% after realizing they’d “used too much beef semen” and didn’t have enough replacements. The piece lays out simple rules: use your actual cull and loss data to set a minimum heifer‑calf target, treat 21‑day pregnancy rate as the ceiling for beef‑on‑dairy, and demand high‑reliability calving‑ease data before betting on male sexed beef. For executives and herd decision‑makers, the core question is whether your current beef‑on‑dairy plan still works if calf premiums soften and you have to buy 10–20 heifers at today’s prices in 2028.

CoBank warned us in ’25. Now the bill is due.

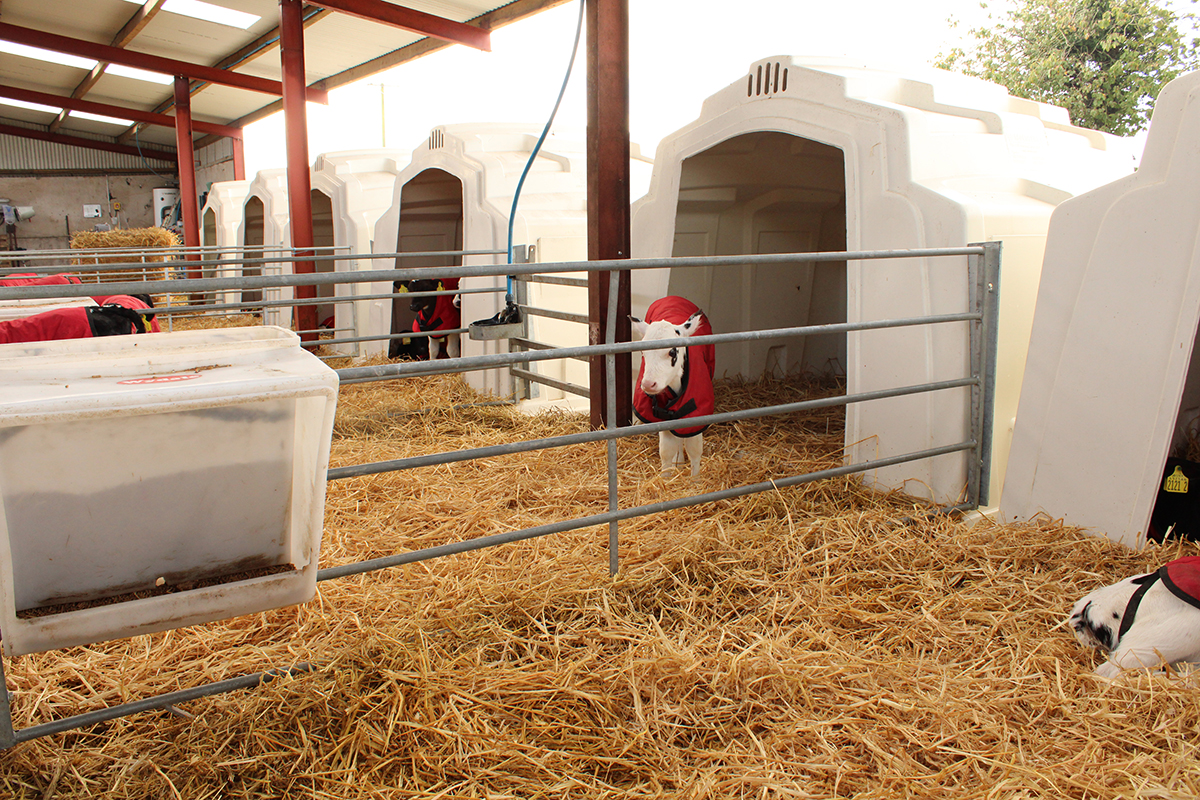
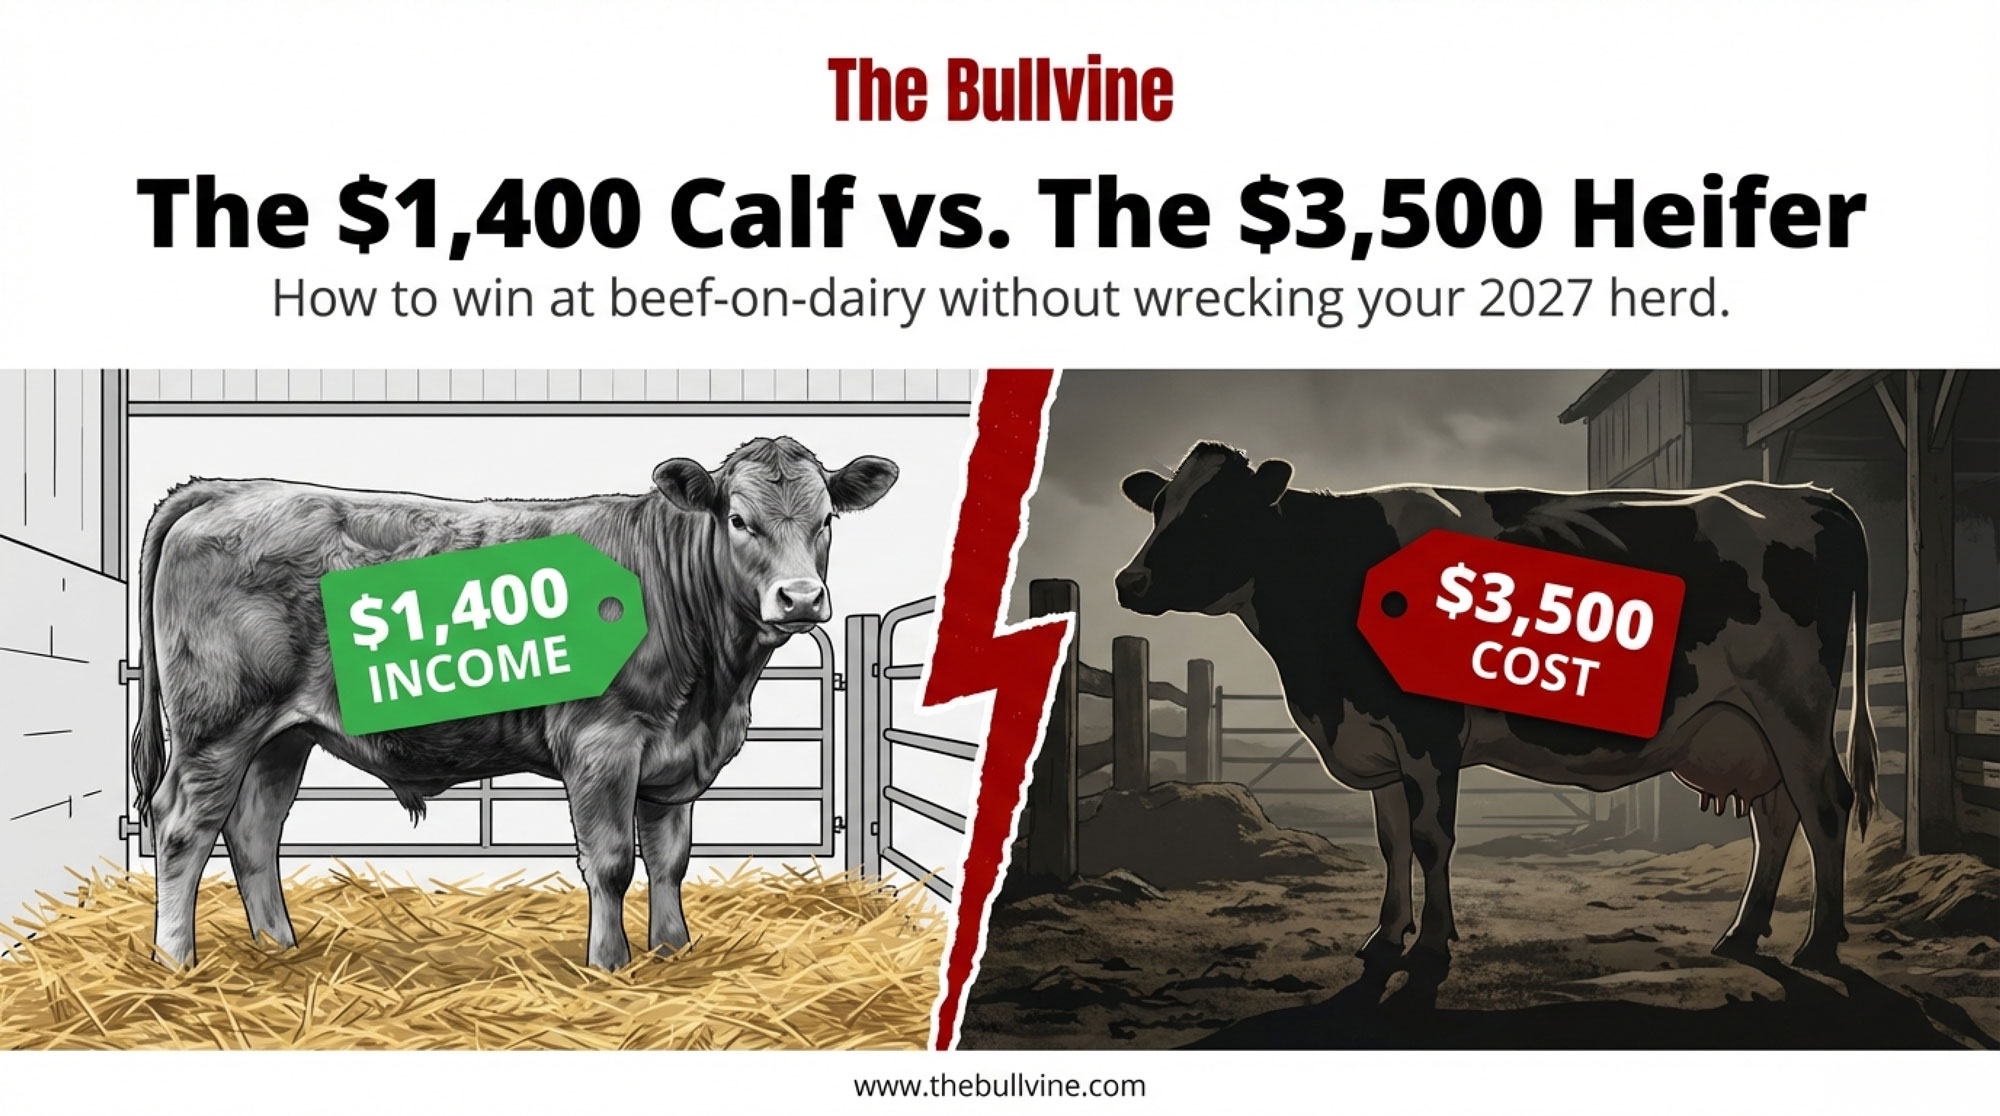
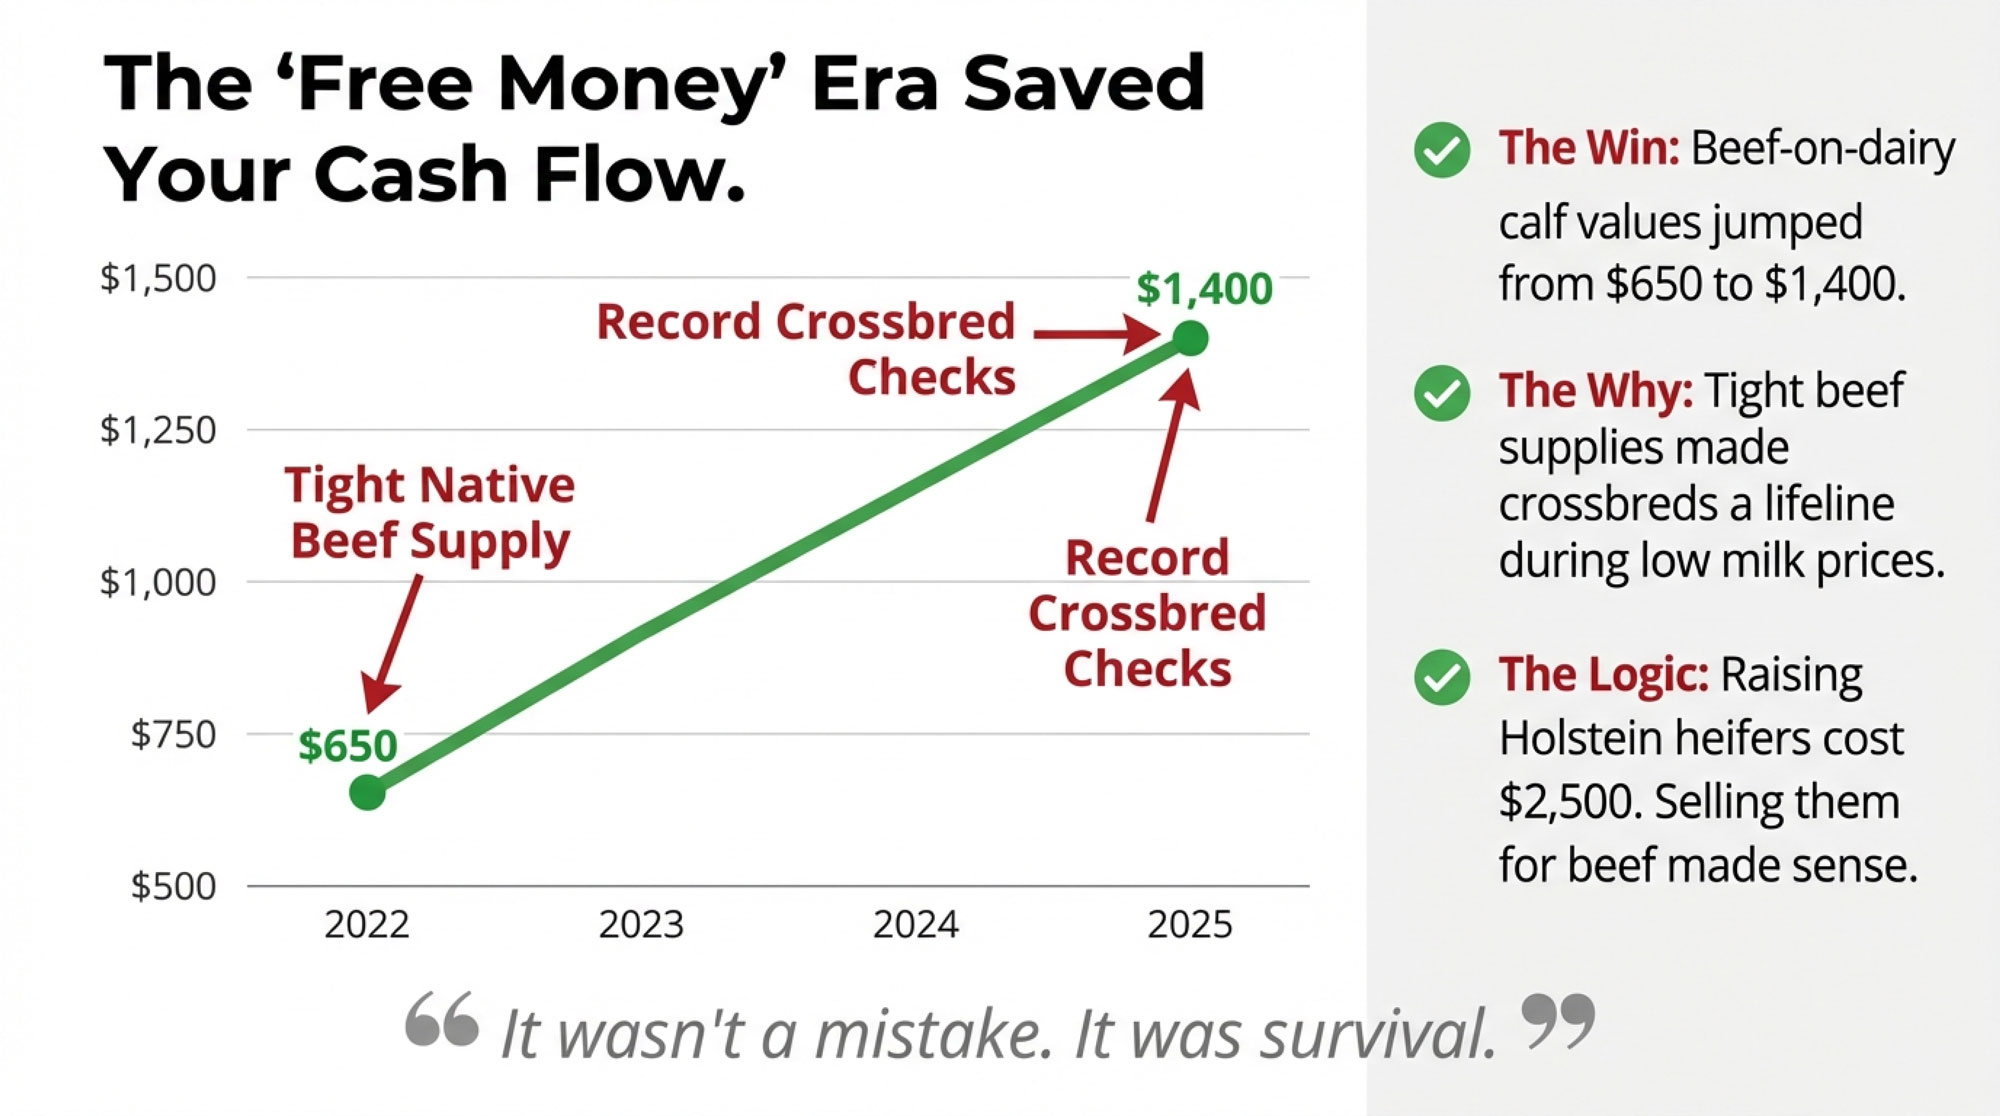
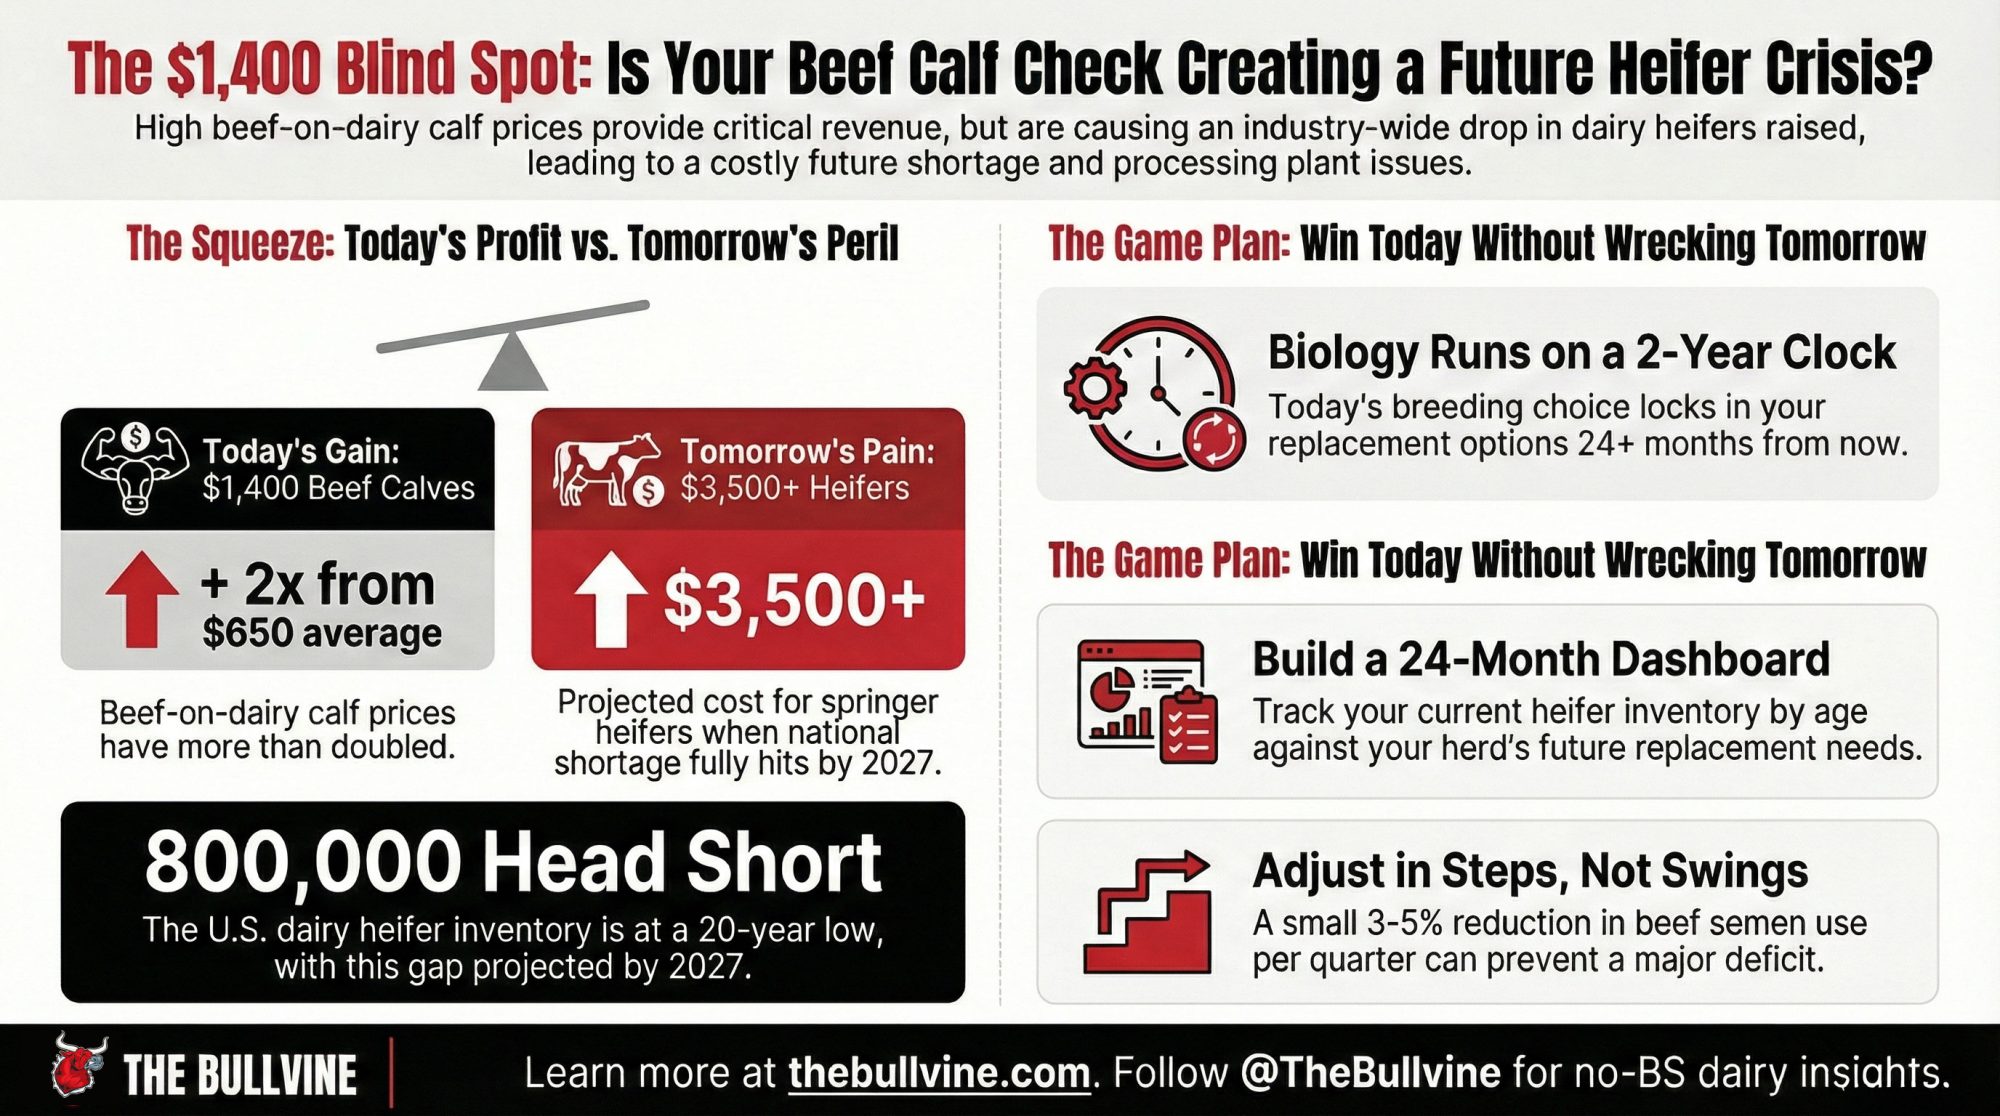
The conversation usually starts the same way. A lender, a calf buyer, or a trusted advisor looks across the desk at a 300‑cow dairy and says, “You should be maximizing beef value.” Beef‑on‑dairy calves are bringing $1,000–$1,500, and in some regions newborn crossbreds have topped $1,600. Straight Holstein bull calves are usually $500–$1,000, depending on quality and region, which makes paying $15–$20 more for Y‑sorted beef semen feel like easy money. In real U.S. sale barns through late‑2025 and early‑2026, that’s often a $300–$700 premium for a beef‑cross calf over a straight Holstein bull, depending on region and weight.

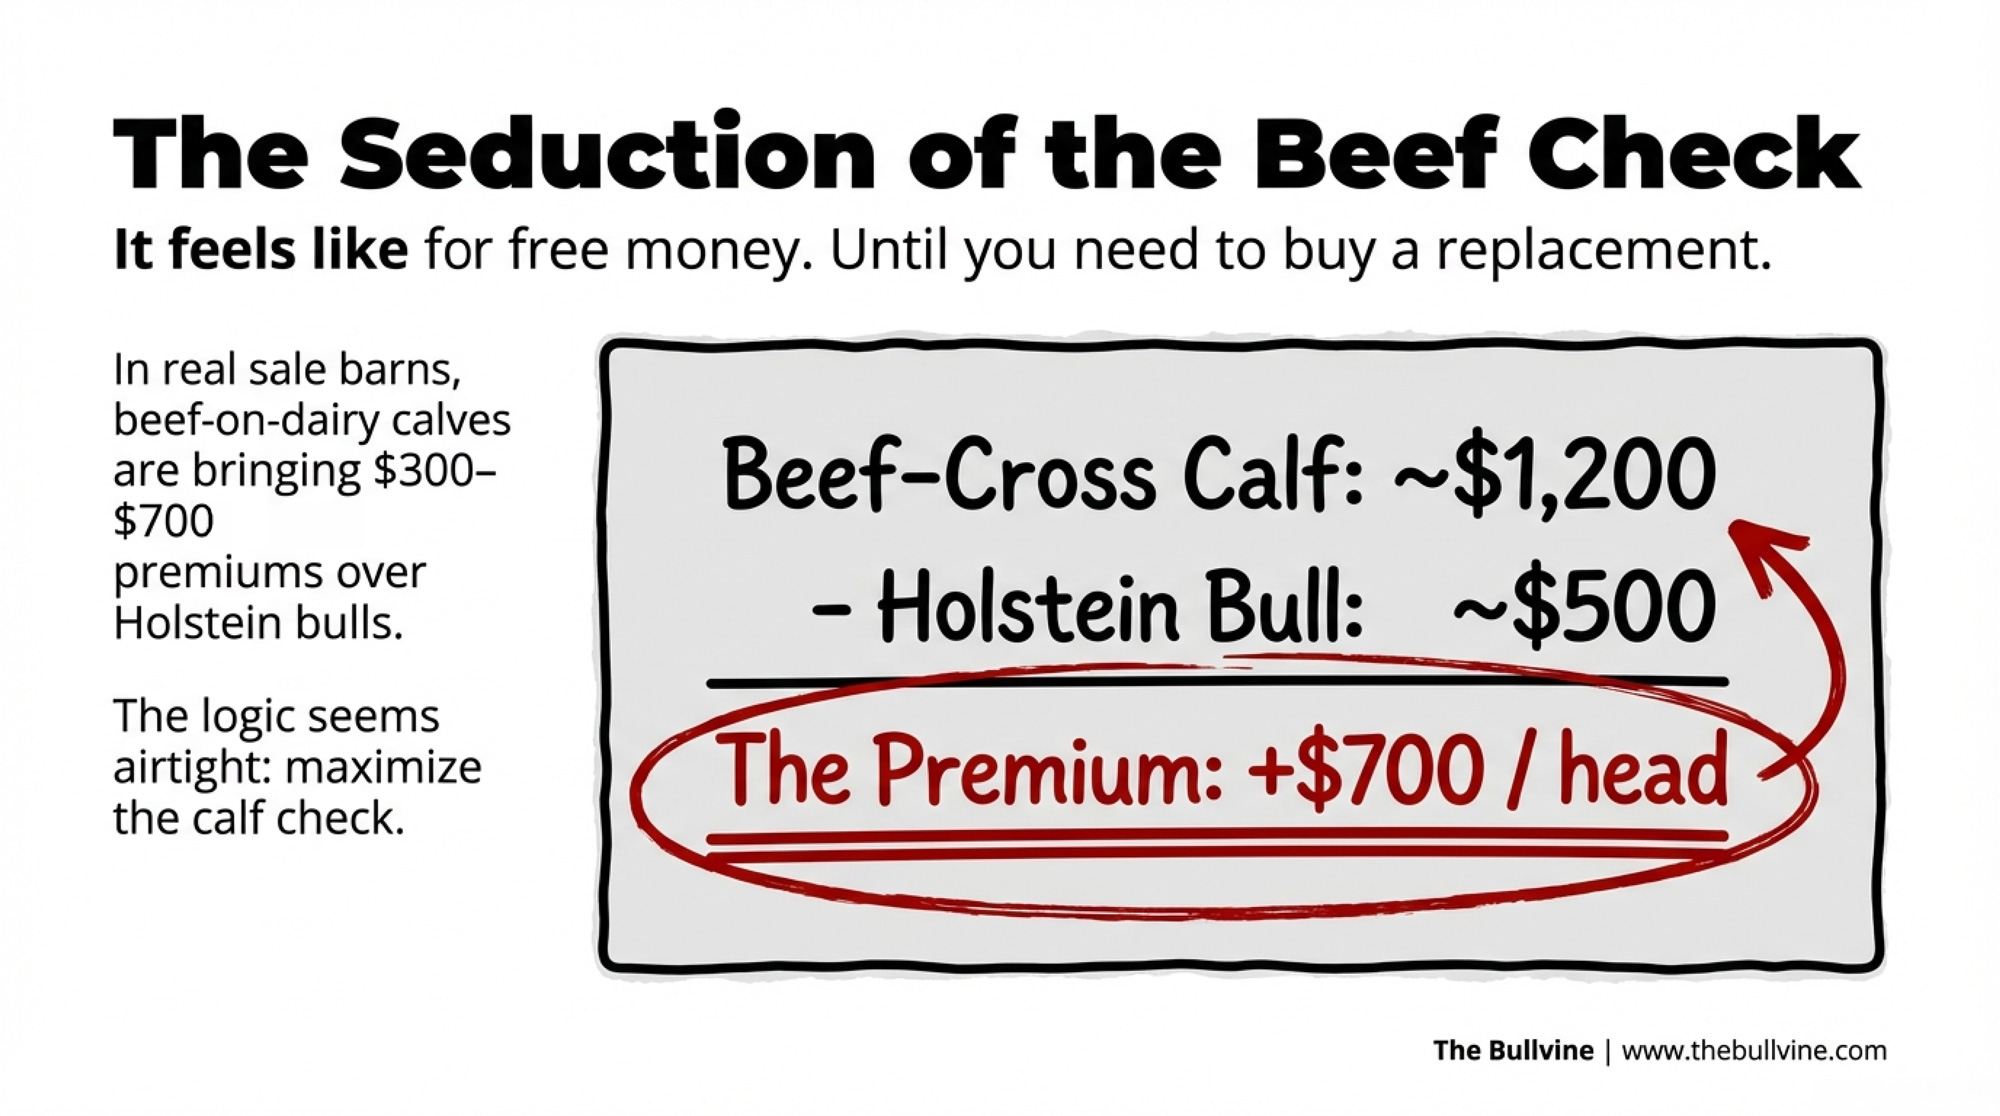
It is — until you stack that strategy against a U.S. replacement heifer inventory that’s already 800,000 head short and ask how many heifers your own breeding plan actually produces. 

The CoBank Numbers Behind the Heifer Squeeze

In August 2025, CoBank’s Knowledge Exchange group dropped a report that should’ve been required reading before anybody loaded more sexed beef straws into the tank. Economist Corey Geiger and co‑author Abbi Prins modeled what beef‑on‑dairy is doing to replacement heifer supplies. 

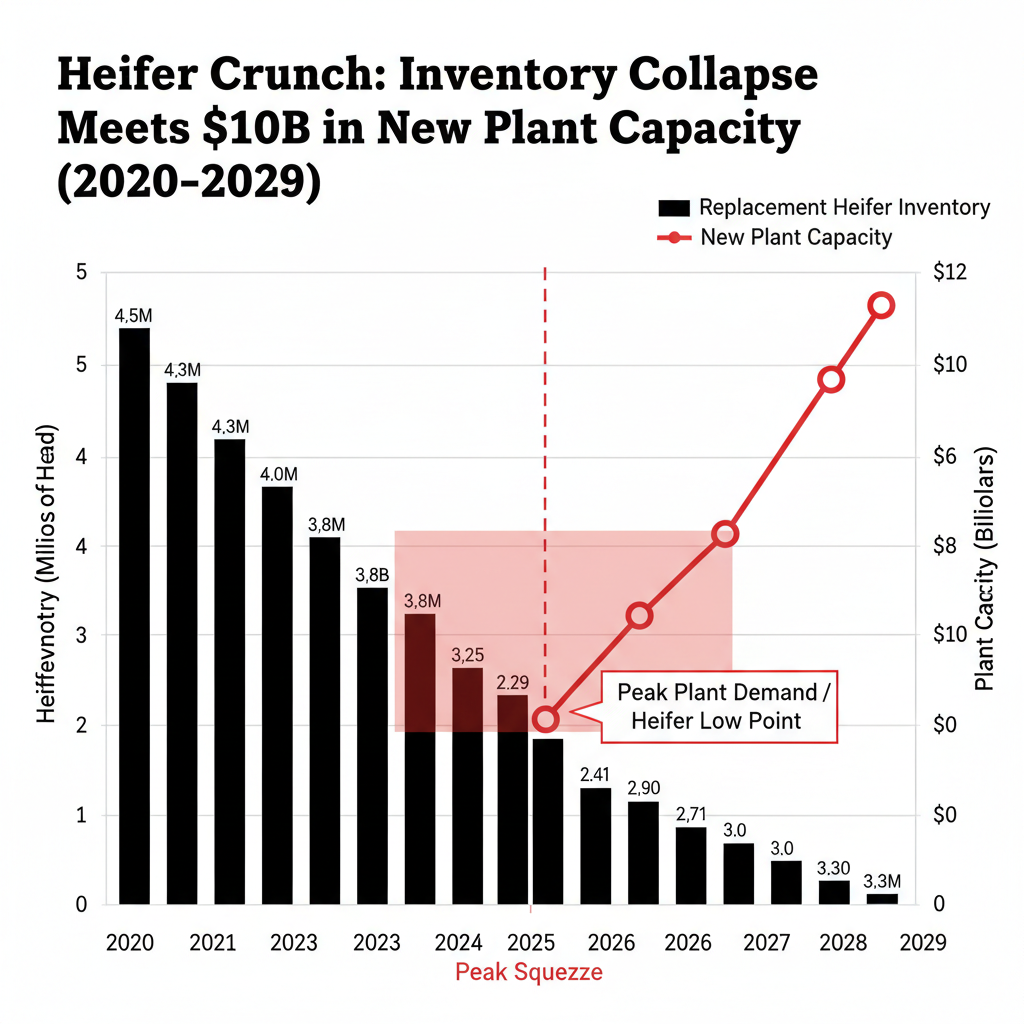
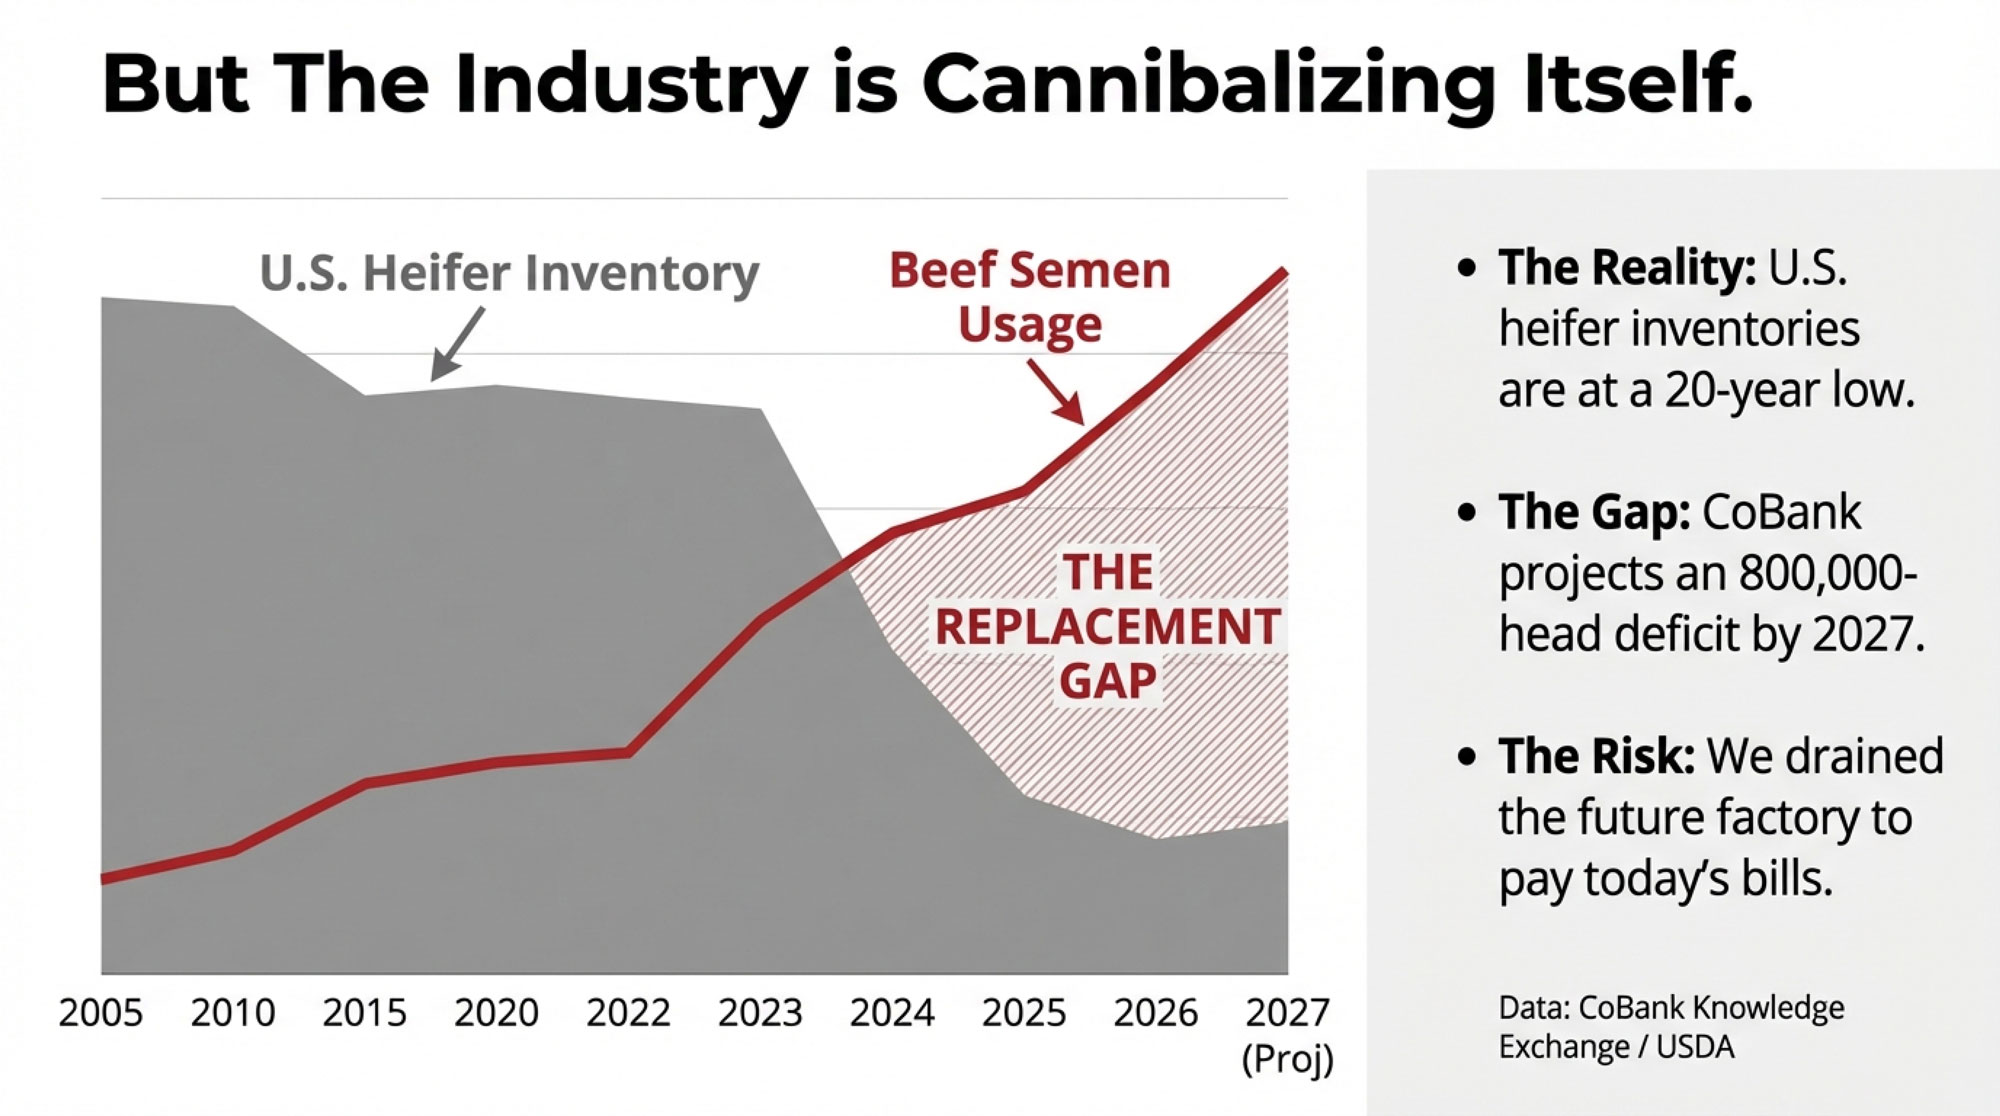
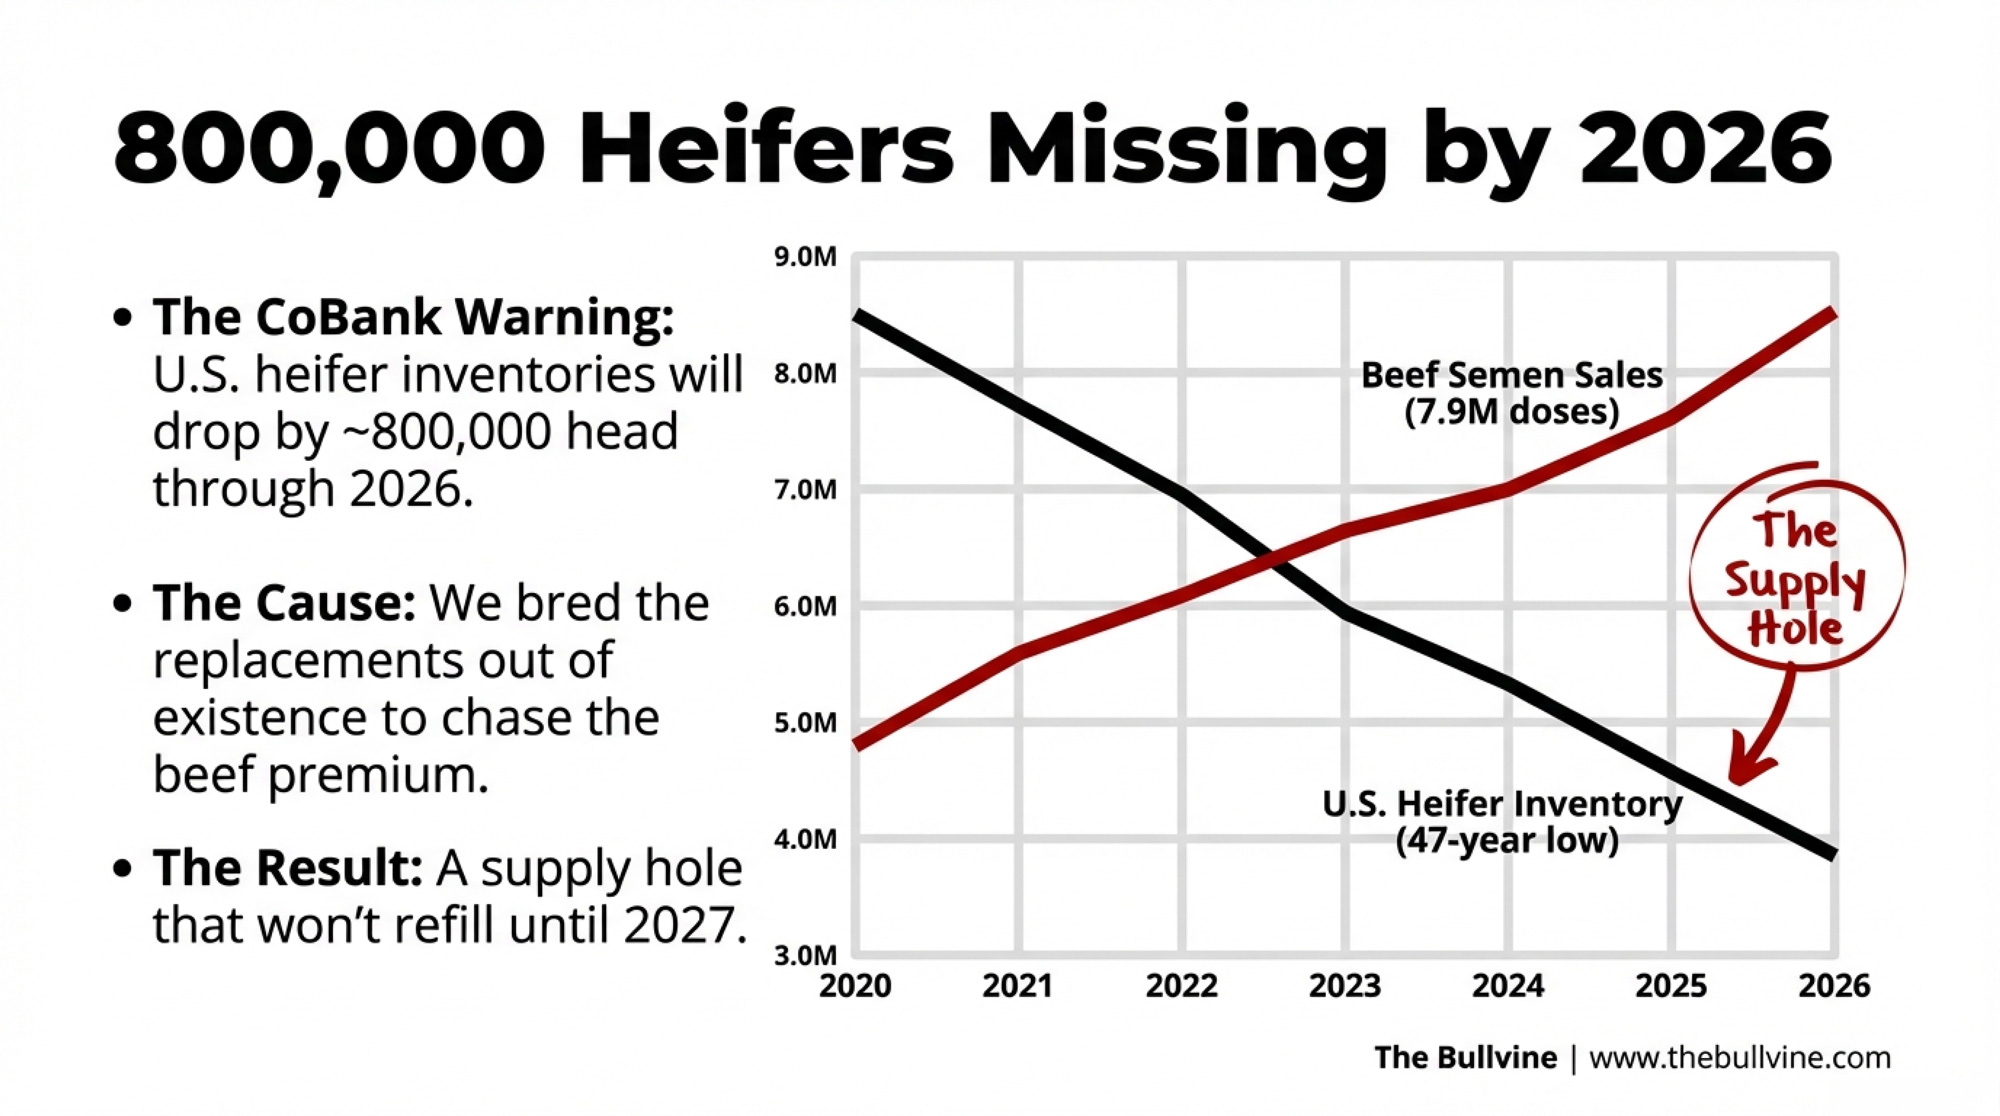
Their conclusion: dairy heifer inventories will shrink by an estimated 800,000 head over 2025 and 2026 before they even begin to rebound in 2027. That rebound is only about 285,000 heifers, which doesn’t come close to filling the hole.

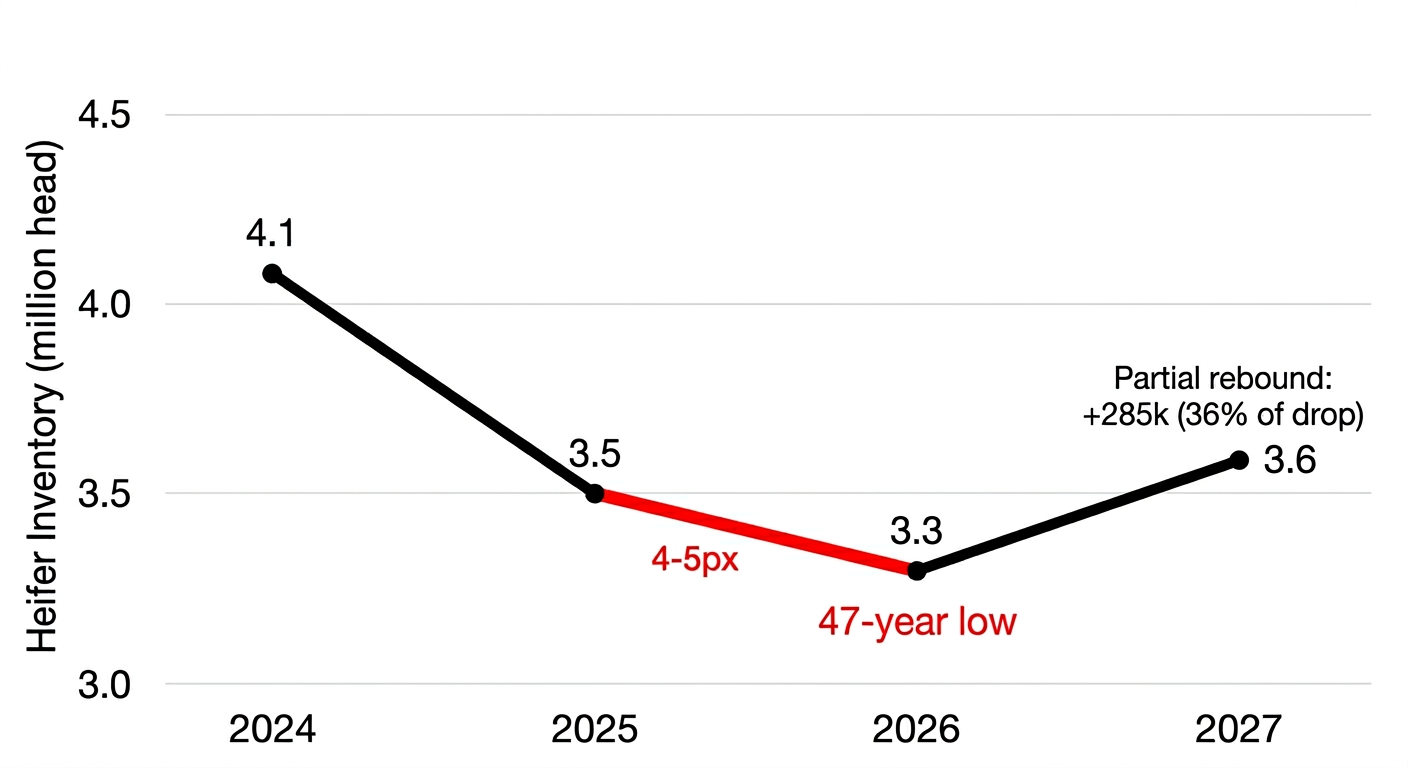
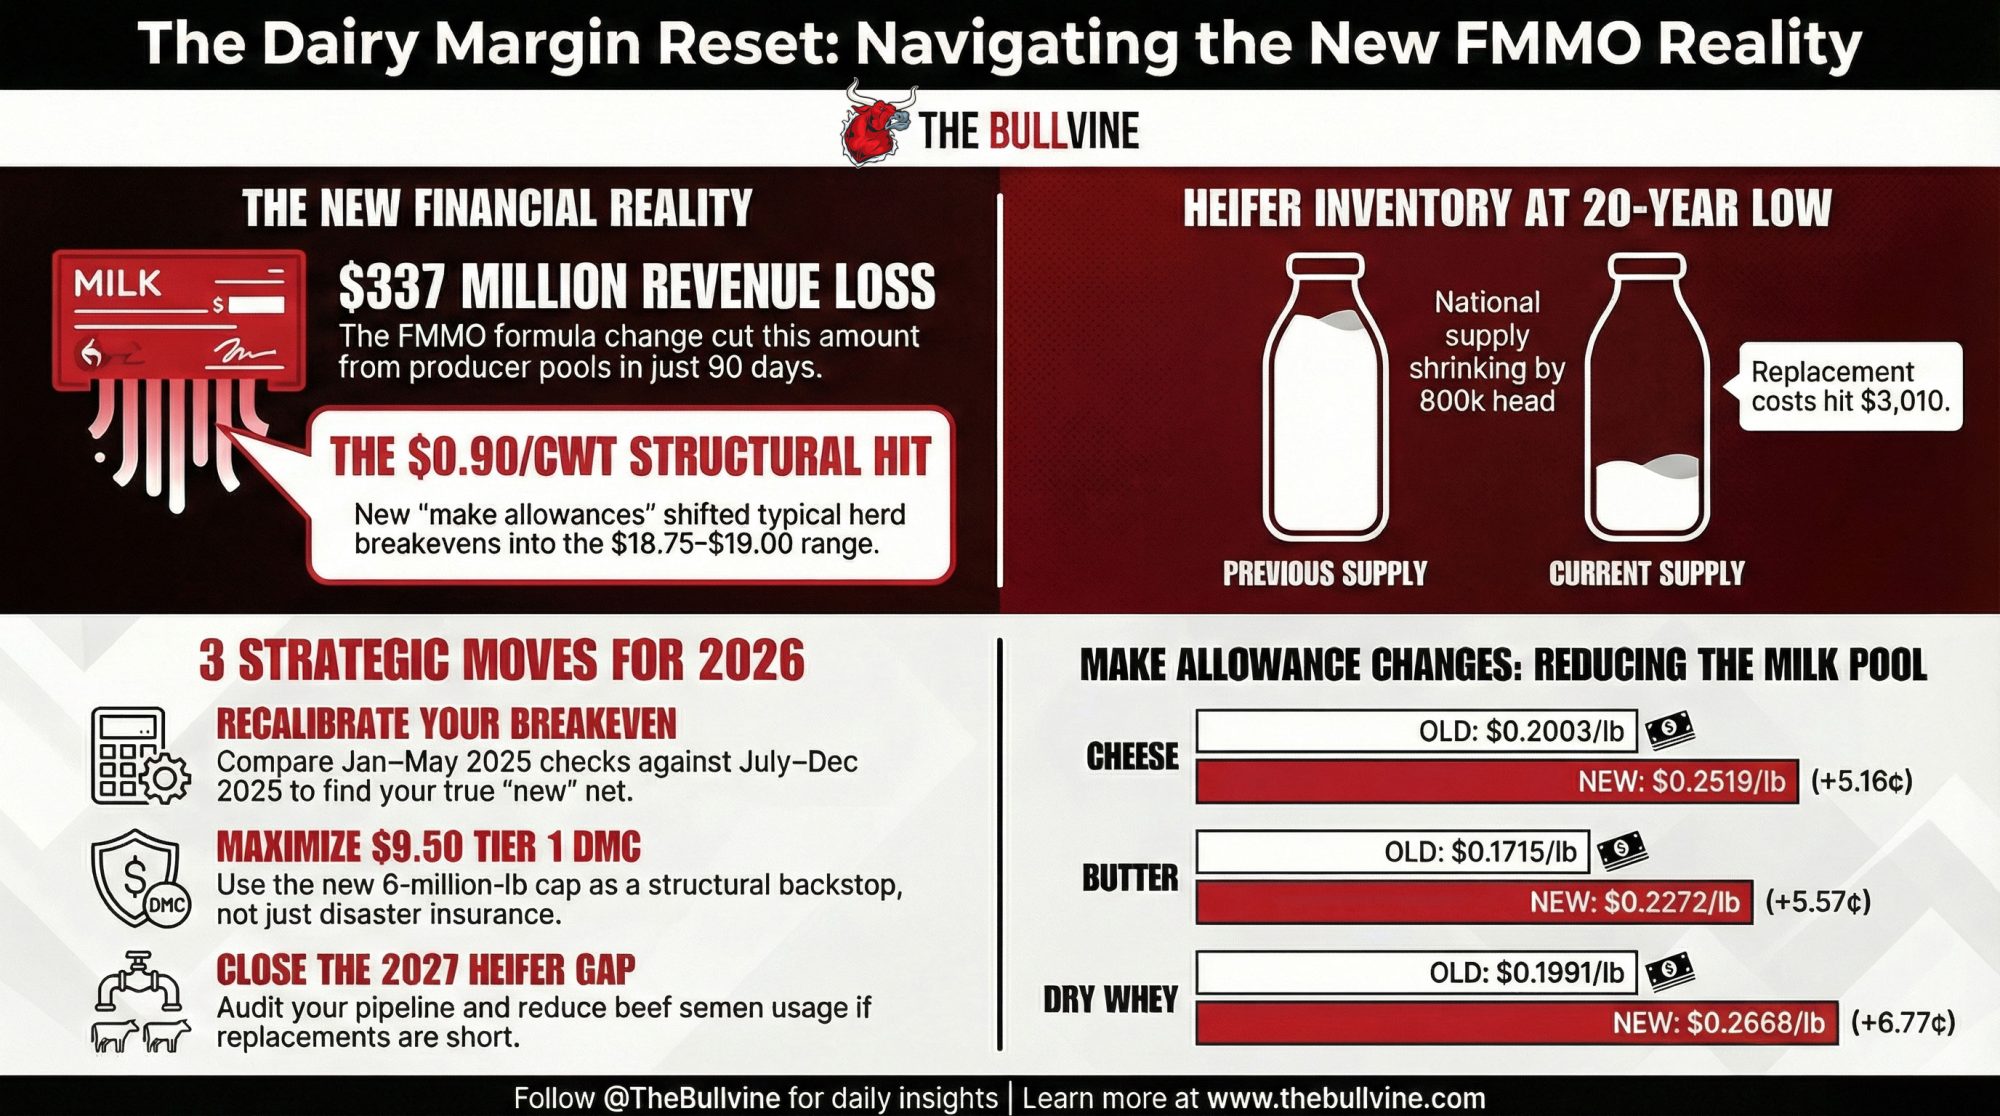
USDA’s January 2025 cattle report put U.S. dairy replacement heifers at 3.914 million head, the lowest level since the late 1970s — a 47‑year low. Trade coverage has been blunt: supplies remain tight, and the heifers that are out there are expensive. 

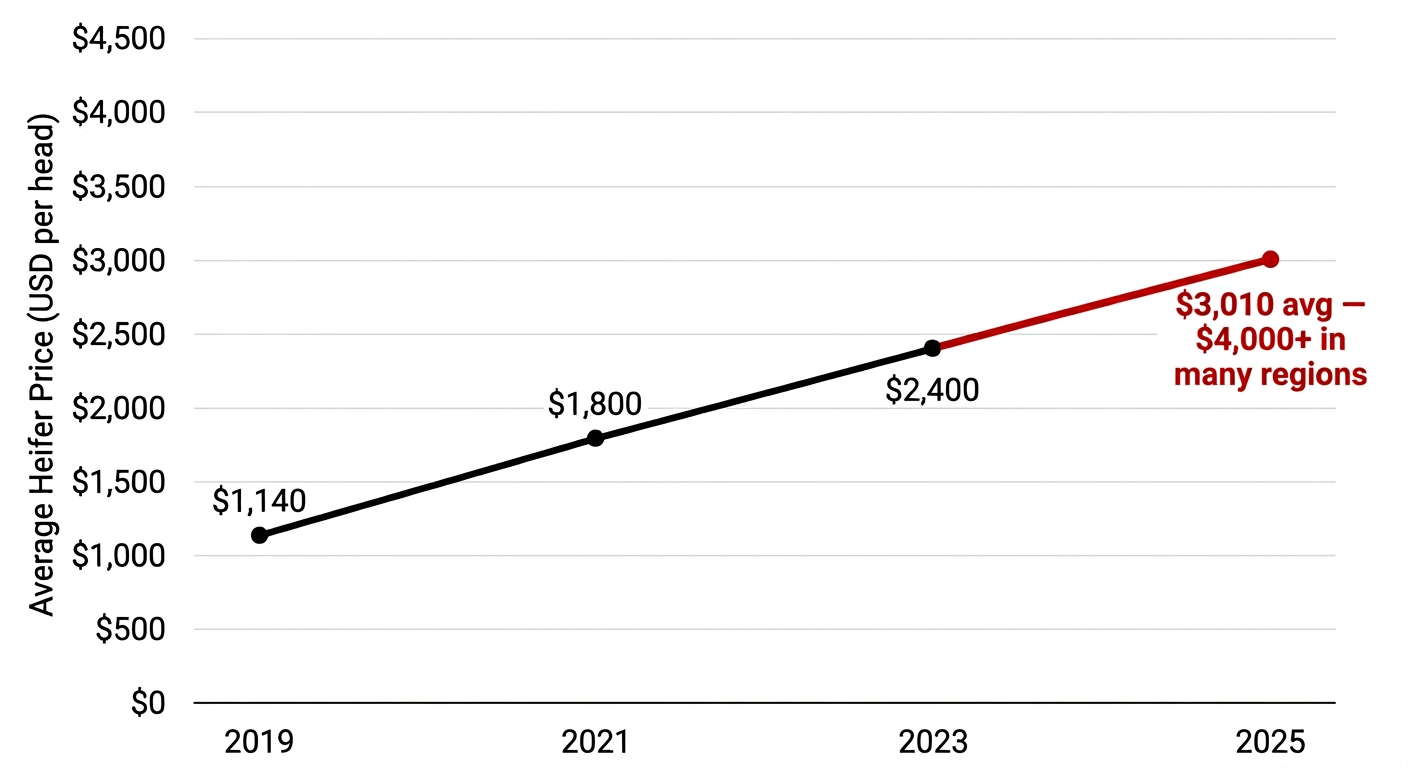
CoBank leans on USDA data showing that average replacement heifer values climbed from roughly $1,140 per head in April 2019 to about $3,010 by mid‑2025, with many regions seeing $4,000‑plus for the kind of heifer you’d actually want in your own string. That’s not a gentle slope. That’s a cliff in the rearview mirror — and it’s reshaping replacement heifer prices in every serious dairy region. 

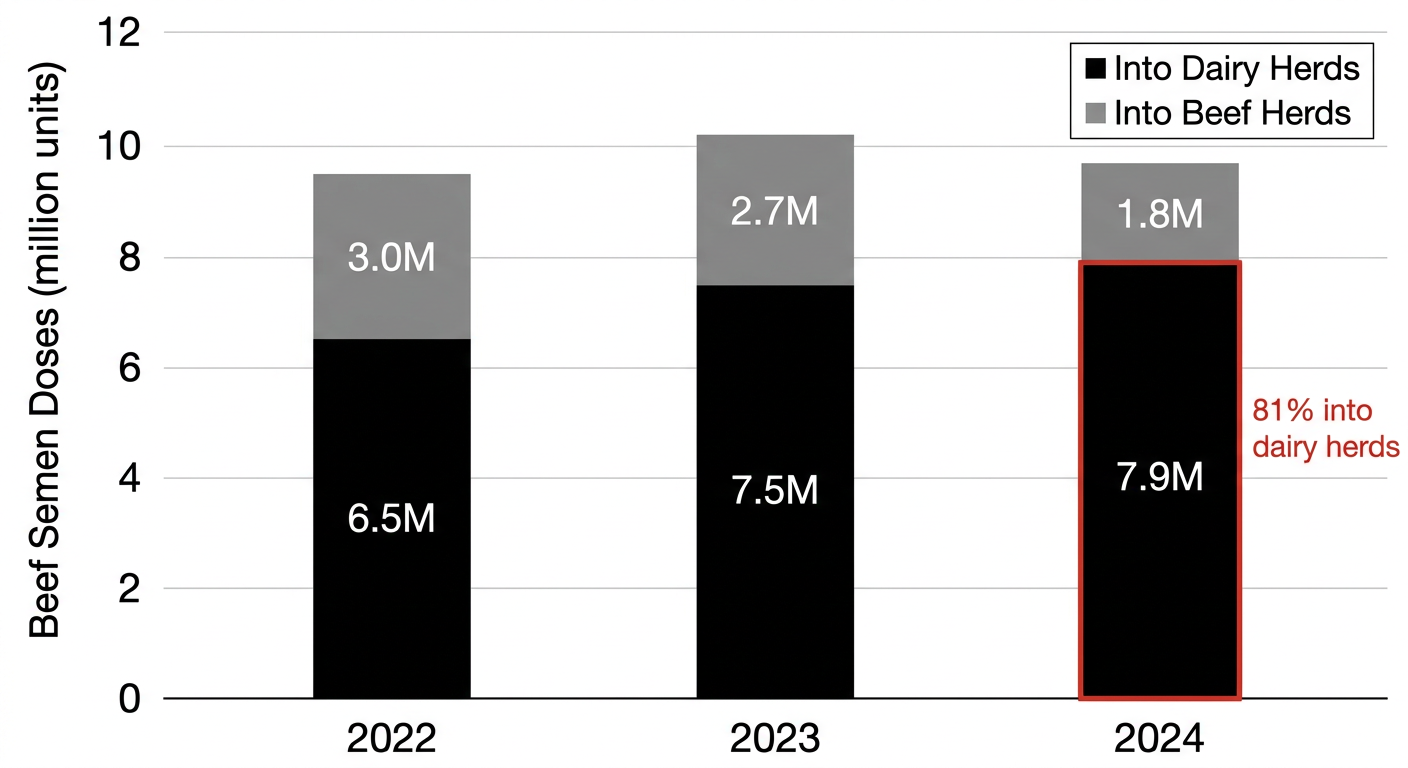
In that same window, the National Association of Animal Breeders reports that U.S. studs sold 9.7 million units of beef semen in 2024 — and 7.9 million of those doses went into dairy herds. That’s about 81% of domestic beef semen sales, up 4% from the year before. 

CoBank’s wording is direct: “This market dynamic has pushed dairy farmers to send more calves to beef feedlots and fewer to milk barns”. That’s where the replacement crunch starts. 

The De Vries Math — and the Double Whammy of Male Sexed Beef

On paper, beef‑on‑dairy looks bulletproof — as long as your repro engine is humming.

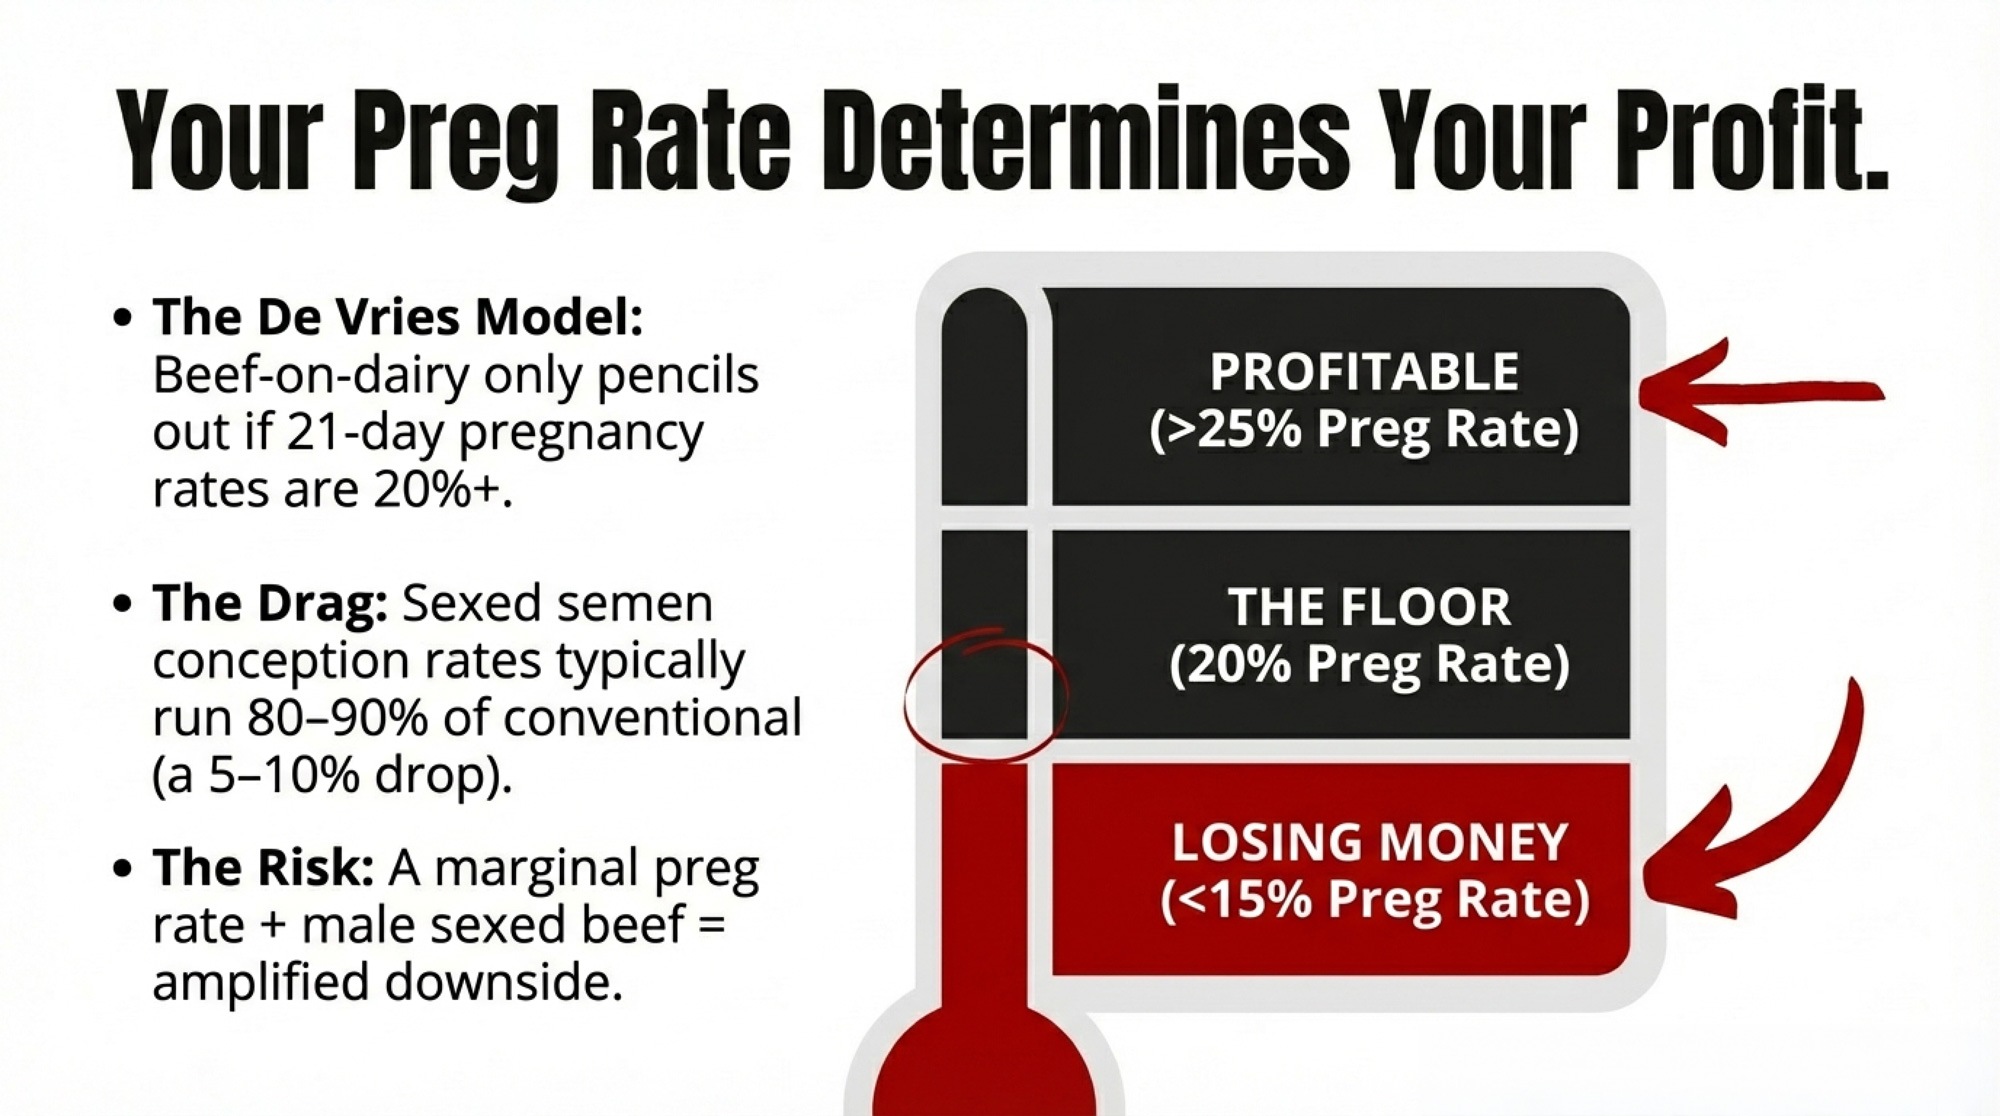
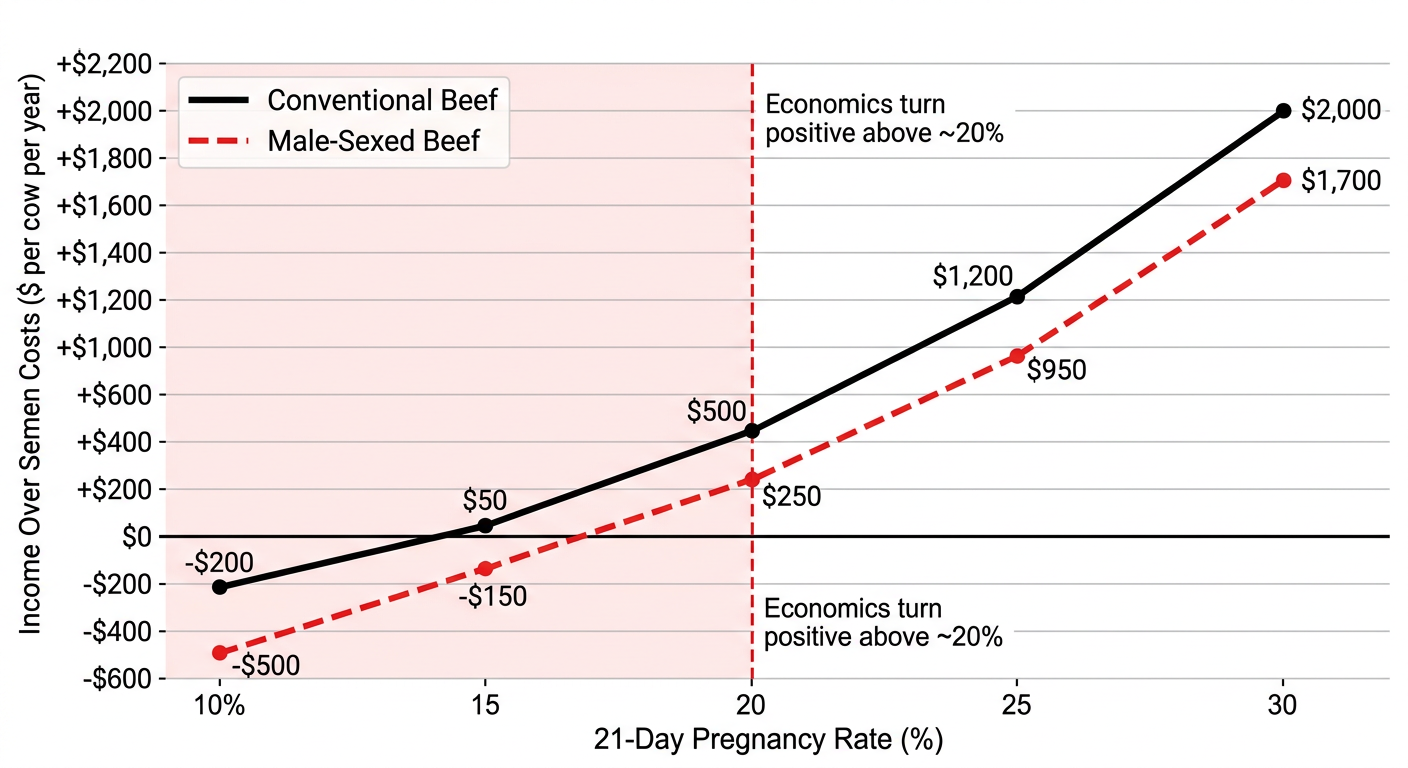
A 2021 simulation by Dr. Albert De Vries and colleagues at the University of Florida looked at the economics of using beef semen in dairy herds. In their model, beef calves sell for about  the price of dairy calves, and sexed semen costs about 2.3× that of conventional semen. When 21‑day pregnancy rates are 20% or higher, the optimal breeding strategy generated roughly: 

  • $2,001 in income from calves over semen costs (ICOSC) for average‑performance herds.
  • $6,215 for high‑performance herds with 30%+ 21‑day pregnancy rates. 

That’s real money. But De Vries’ team also showed that once 21‑day pregnancy rates drop to ~15%, optimal ICOSC becomes negative or marginal. And they explicitly noted that their model didn’t include gestation‑length changes or calving‑difficulty effects from beef semen on dairy cows. 

Now, stack male sexed semen on top of that.

Sexed semen conception rates typically run 80–90% of conventional. In practice, that’s about a 5–10‑percentage‑pointdrop in pregnancy per AI for many herds. If your 21‑day rate is already 16–17%, you’re getting hit twice: 

  • You’re already below the economic sweet spot for beef‑on‑dairy in the De Vries model.
  • Then you give away more conception with male‑sorted semen, and every conception you do get is a bull calf, which makes any calving‑ease miss more expensive.

The double whammy is simple: a marginal pregnancy rate plus male sexed beef doesn’t just shave profit. It amplifies the downside when calving goes sideways.

Heavier Calves, Higher Stillbirth — and More Rough Nights in the Maternity Pen

Sex‑biased beef semen doesn’t change the biology of calves. It just ensures that every beef‑cross calf you get is a bull.

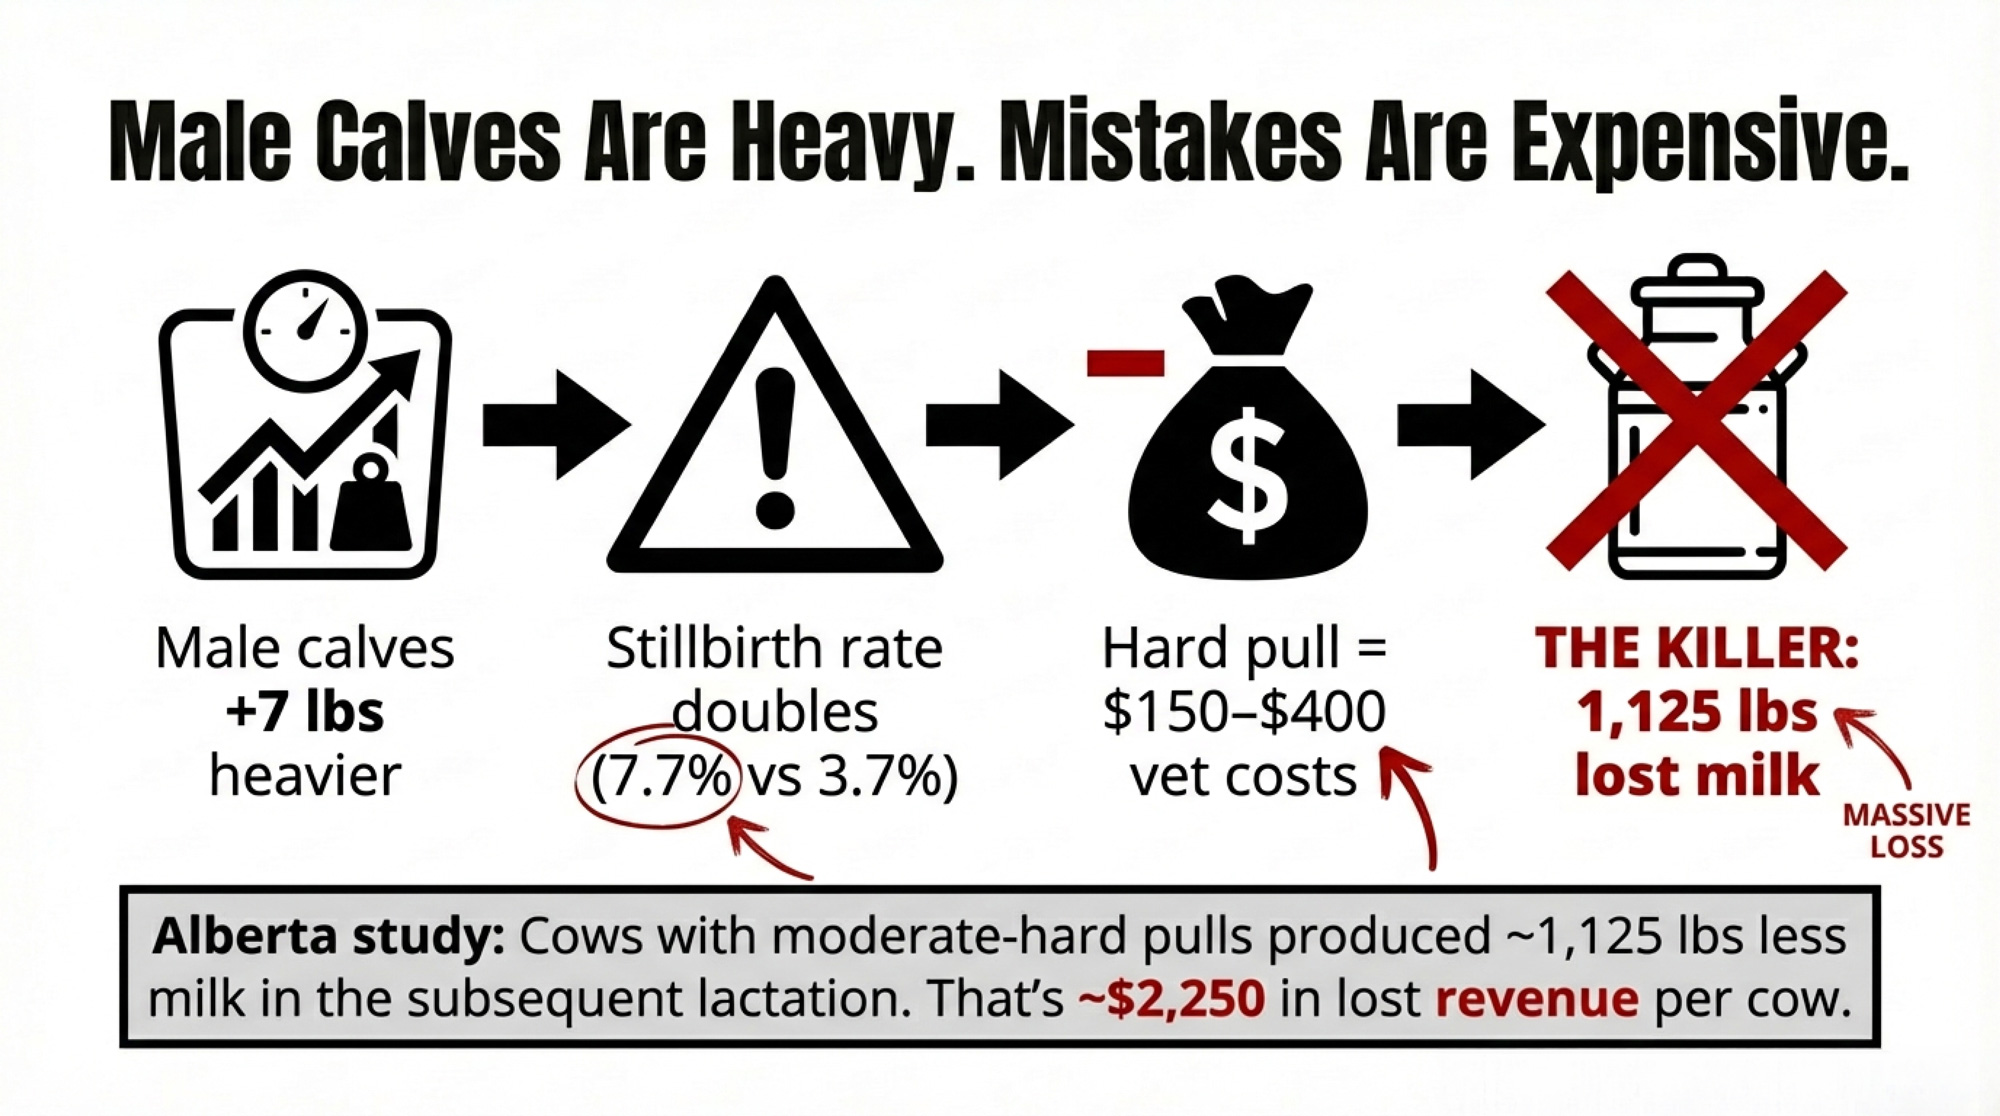
Across studies, male calves average about 3.2 kg (7 lb) heavier at birth than females. That extra weight shows up in stillbirth and calving‑ease numbers. One large study reported stillbirth rates of 7.7% for male calves vs 3.7% for females — more than double. 

European data behind the Nordic Beef‑on‑Dairy Index tells a similar story. Beef‑cross bull calves out of dairy cows show a higher stillbirth risk than heifer calves, and cow mortality jumps as calvings move from “no help” to “hard pull with the vet in the pen”. A 2025 review on dystocia management clearly pulled the pattern together: more assistance at calving increases the risk of retained placenta, metritis, metabolic disease, reduced milk production, and earlier culling. 

Each of those steps carries a cost. Guard and other herd‑level cost studies put a moderate dystocia case in roughly the $150–$400 band once you factor in vet time, drugs, lost milk, and reproductive setbacks. 

The dollars aren’t the worst part. It’s the way those cases pile up in a fresh‑cow pen that’s already under pressure.

The Hidden Cost of “Just a Few Tough Calvings”

You don’t need a horror story year for male sexed beef to sting. A “normal” bad patch is enough.

Take a 300‑cow herd where 80 cows freshen to two beef sires that were a little too optimistic on calving ease. If 10–15% of those calvings turn into moderate–hard pulls, that’s 8–12 difficult births tied to those bulls.

A 2023 study from 21 Alberta dairy farms found that cows with a moderate–hard pull produced 510 kg less milk per lactation than unassisted cows — roughly 1,125 lb. If you’ve got 10 cows in that bucket, that’s roughly 11,250 lb of milk you don’t ship. 

At $20/cwt, you’ve just given up about $2,250 in milk income — and that’s before we talk vet bills.

Now add in transition disease. Extension summaries based on Guard and others put retained placenta/metritis and related issues in the $150–$250 per‑case range, and ketosis/DA cases often in the $250–$375 band once you include follow‑on losses. If half of those 10 hard‑pull cows each pick up at least one extra transition disease, you’re easily looking at another few thousand dollars spread across that group. 

Cows that calve hard don’t breed back like cows that calve easily. The Alberta team also found cows with moderate–hard pulls had a higher hazard of being culled over that lactation. Other work has shown lower conception rates and more services per conception after dystocia. Even if you assume each of those 10 cows needs just one extra service and stays open 20–25 days longer, you’ve added a few hundred dollars in extra semen and labor and roughly $700–$800 in days‑open opportunity cost across those cows. 

And then there’s the part the ledger doesn’t show until months later: early culls. If 2–3 of those 10 cows leave the herd a lactation earlier than planned, you’re replacing them with heifers that now cost around $3,000 to $4,000 per head in many U.S. markets. That’s $6,000–$12,000 in replacement cost alone. 

Finally, each dead beef‑cross bull calf is a $1,000–$1,500 cheque that never shows up in most U.S. markets today, with some regions seeing even more. If those two bulls cost you even 2–3 extra dead calves compared to a truly easy‑calving sire, that’s another $1,600–$3,300 gone.

Cost Category“Easy Money” View“Reality Check” View
Calf revenue+$1,200+$1,200 (same — not “free” once costs counted)
Replacement cost$0 (ignored)−$6,000 to −$12,000 (2–3 early culls @ $3–4k each)
Dystocia + vetMinimal (assumed)−$1,500 to −$4,000 (10 hard pulls @ $150–400 each)
Lost milk“Guaranteed”−$2,250 (~1,125 lb/cow × 10 cows, $20/cwt)
Transition diseaseRare (assumed)−$1,000 to −$2,000 (5 cases @ $200–400 each)
Extra repro + days open$0−$1,000 to −$1,500 (extra services + opportunity cost)
Dead/discounted calves$0−$1,600 to −$3,300 (2–3 stillbirths @ $1,000–1,500 each)
TOTAL NET IMPACT+$1,200 per calf (pure upside)−$12,150 to −$22,850 for one calving season

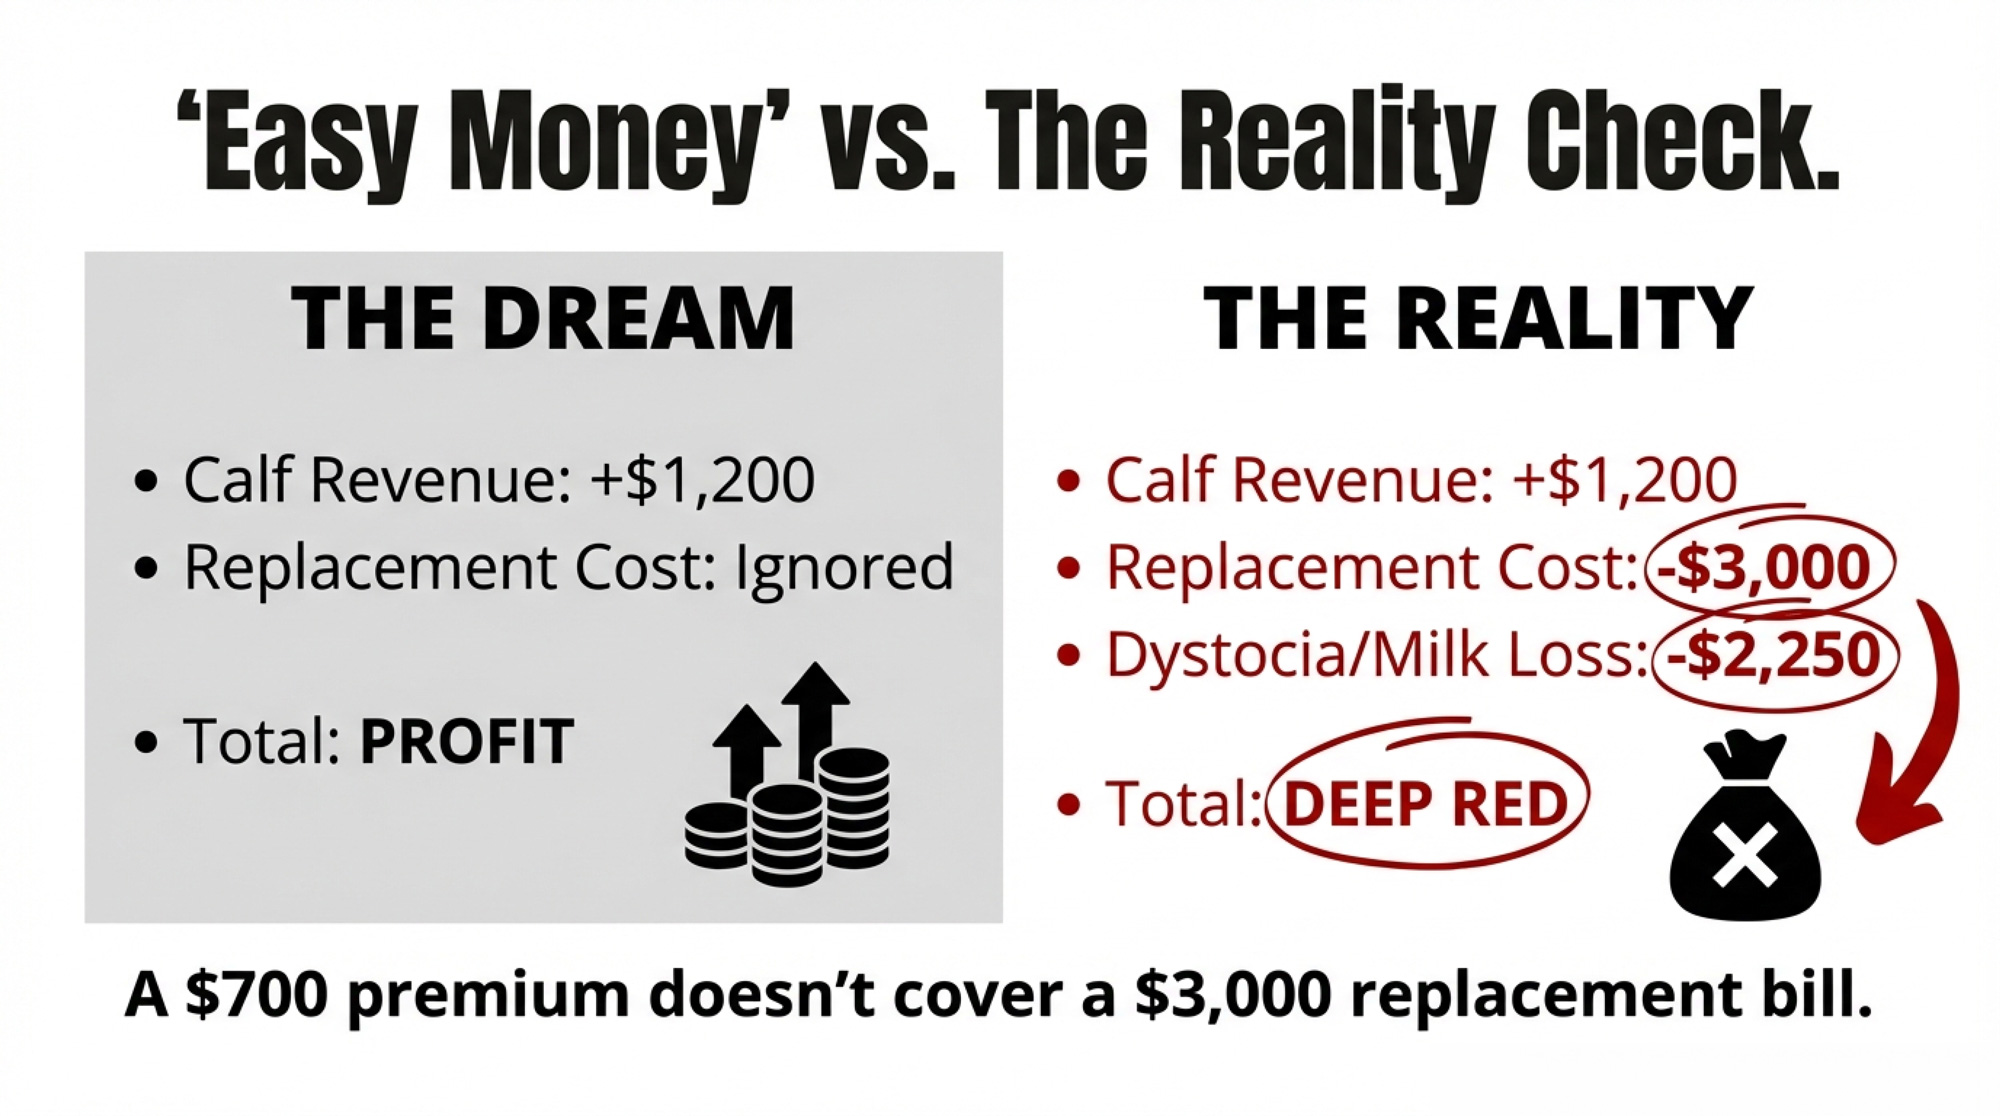
Easy Money vs Reality Check — at a Glance

MetricThe “Easy Money” ViewThe “Reality Check” View
Calf revenue+$1,200 (beef‑cross bull calf, mid‑range of $1,000–$1,400 in many markets)+$1,200 (same cheque — just not “free” once replacements and calving risk are counted)
Replacement cost$0 (ignored in the moment)−$3,000 to −$4,000 if a replacement heifer has to be bought later  
Dystocia riskMinimal (assumed)$150–$400 per hard calving in vet, drugs, and lost milk  
Future milk“Guaranteed”1,125 lb per lactation if that calving was a moderate–hard pull  

Stack conservative numbers across that season:

  • Milk loss: about $2,250.
  • Transition disease: a few thousand dollars more across that group.
  • Extra repro + days open: roughly $1,000–$1,500.
  • Early culls and replacements: $6,000–$12,000.
  • Dead/discounted calves: $1,600–$3,300.

You’re in the low‑to‑mid five figures for one calving season tied to the wrong bulls. On paper, it looks like “just” 8–12 tough calvings. In the books, it looks like $12,000–$20,000+ that quietly evaporated when a calving‑ease prediction missed. 

How Many Heifers Does Your Breeding Plan Actually Produce?

CoBank’s 800,000‑head gap is the national picture. The barn math is the part you control.

Start with what actually leaves. A 200‑cow herd turning over at 35–38% needs 70–76 replacements entering the string each year. Add a realistic 15% loss from birth to freshening — dead calves, do‑not‑breeds, heifers sold or culled — and you’re looking at the low‑80s to high‑80s dairy heifer calves born annually to stand still. 

That’s before anyone talks about growth.

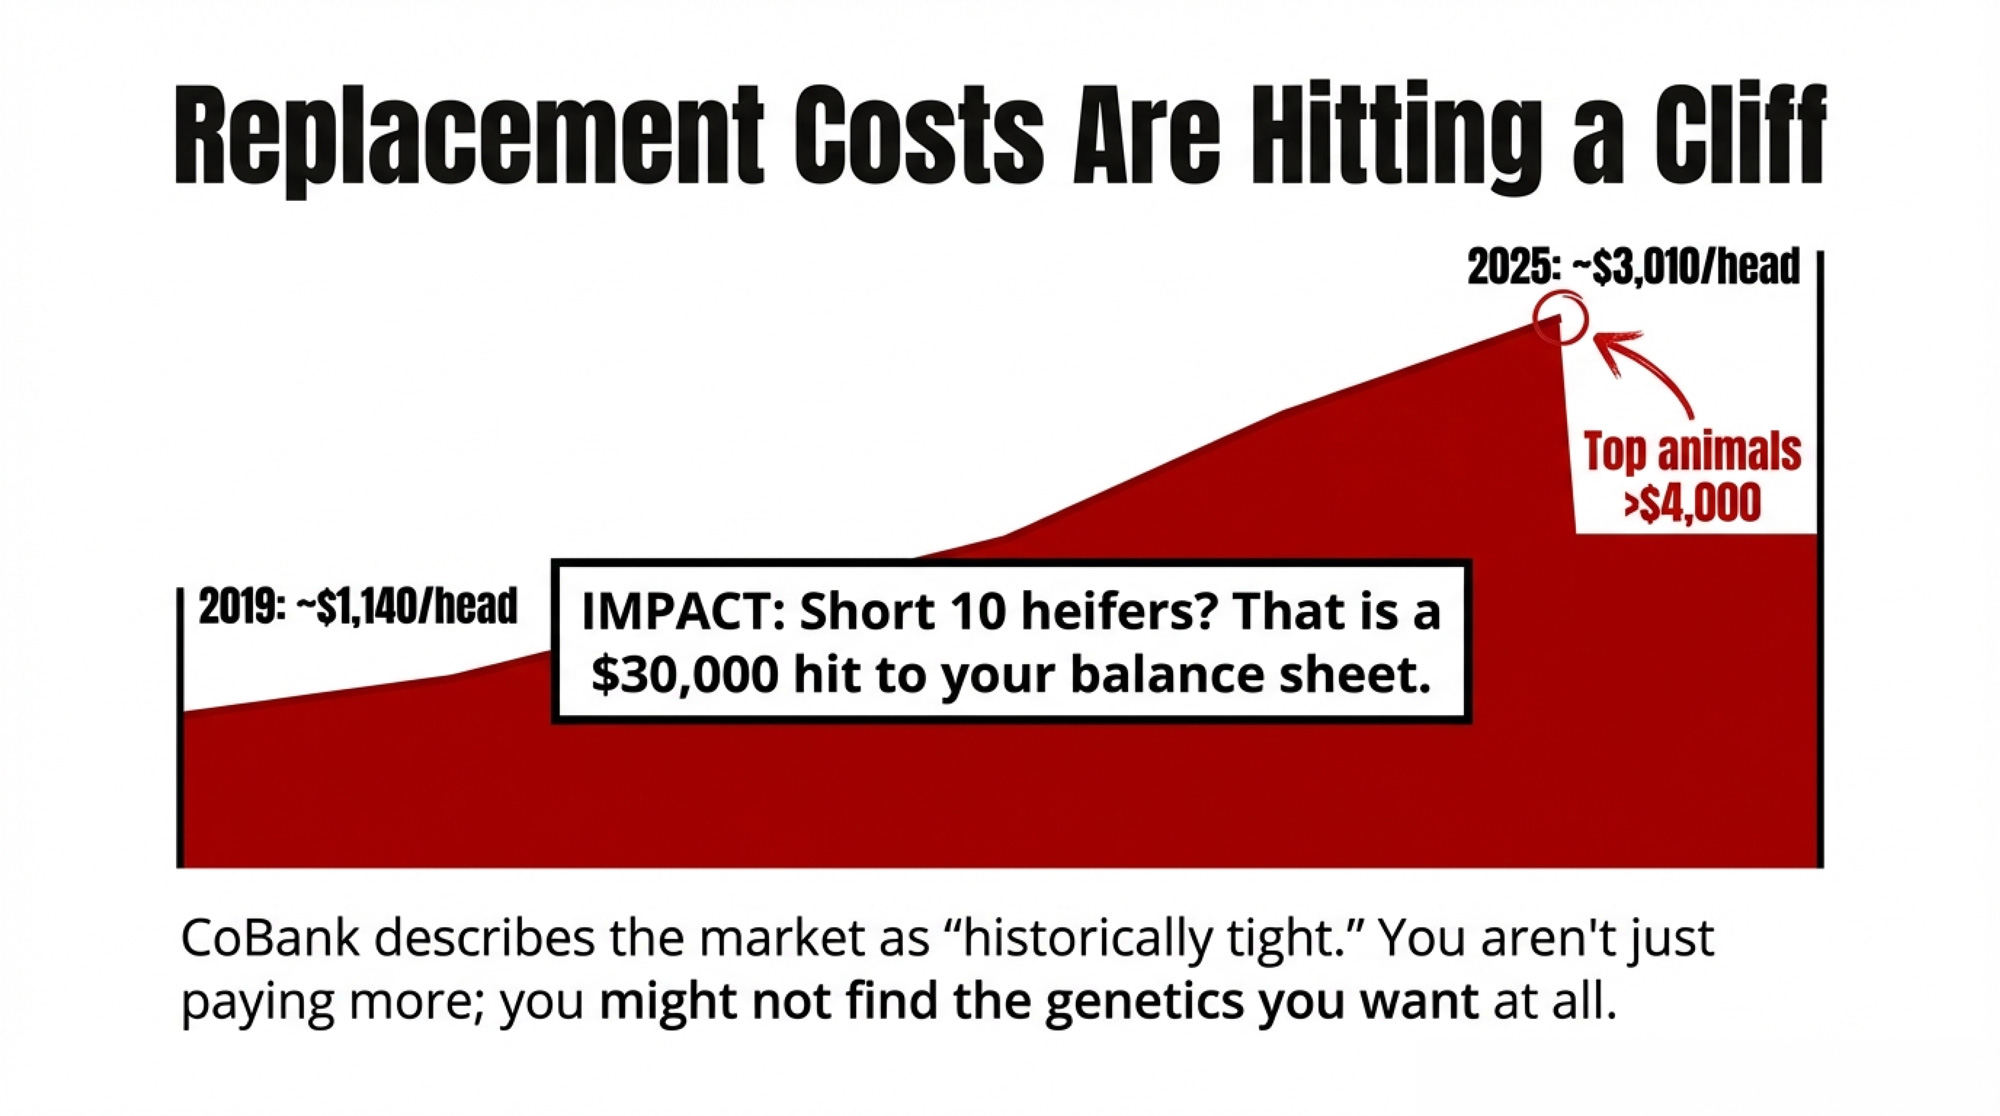
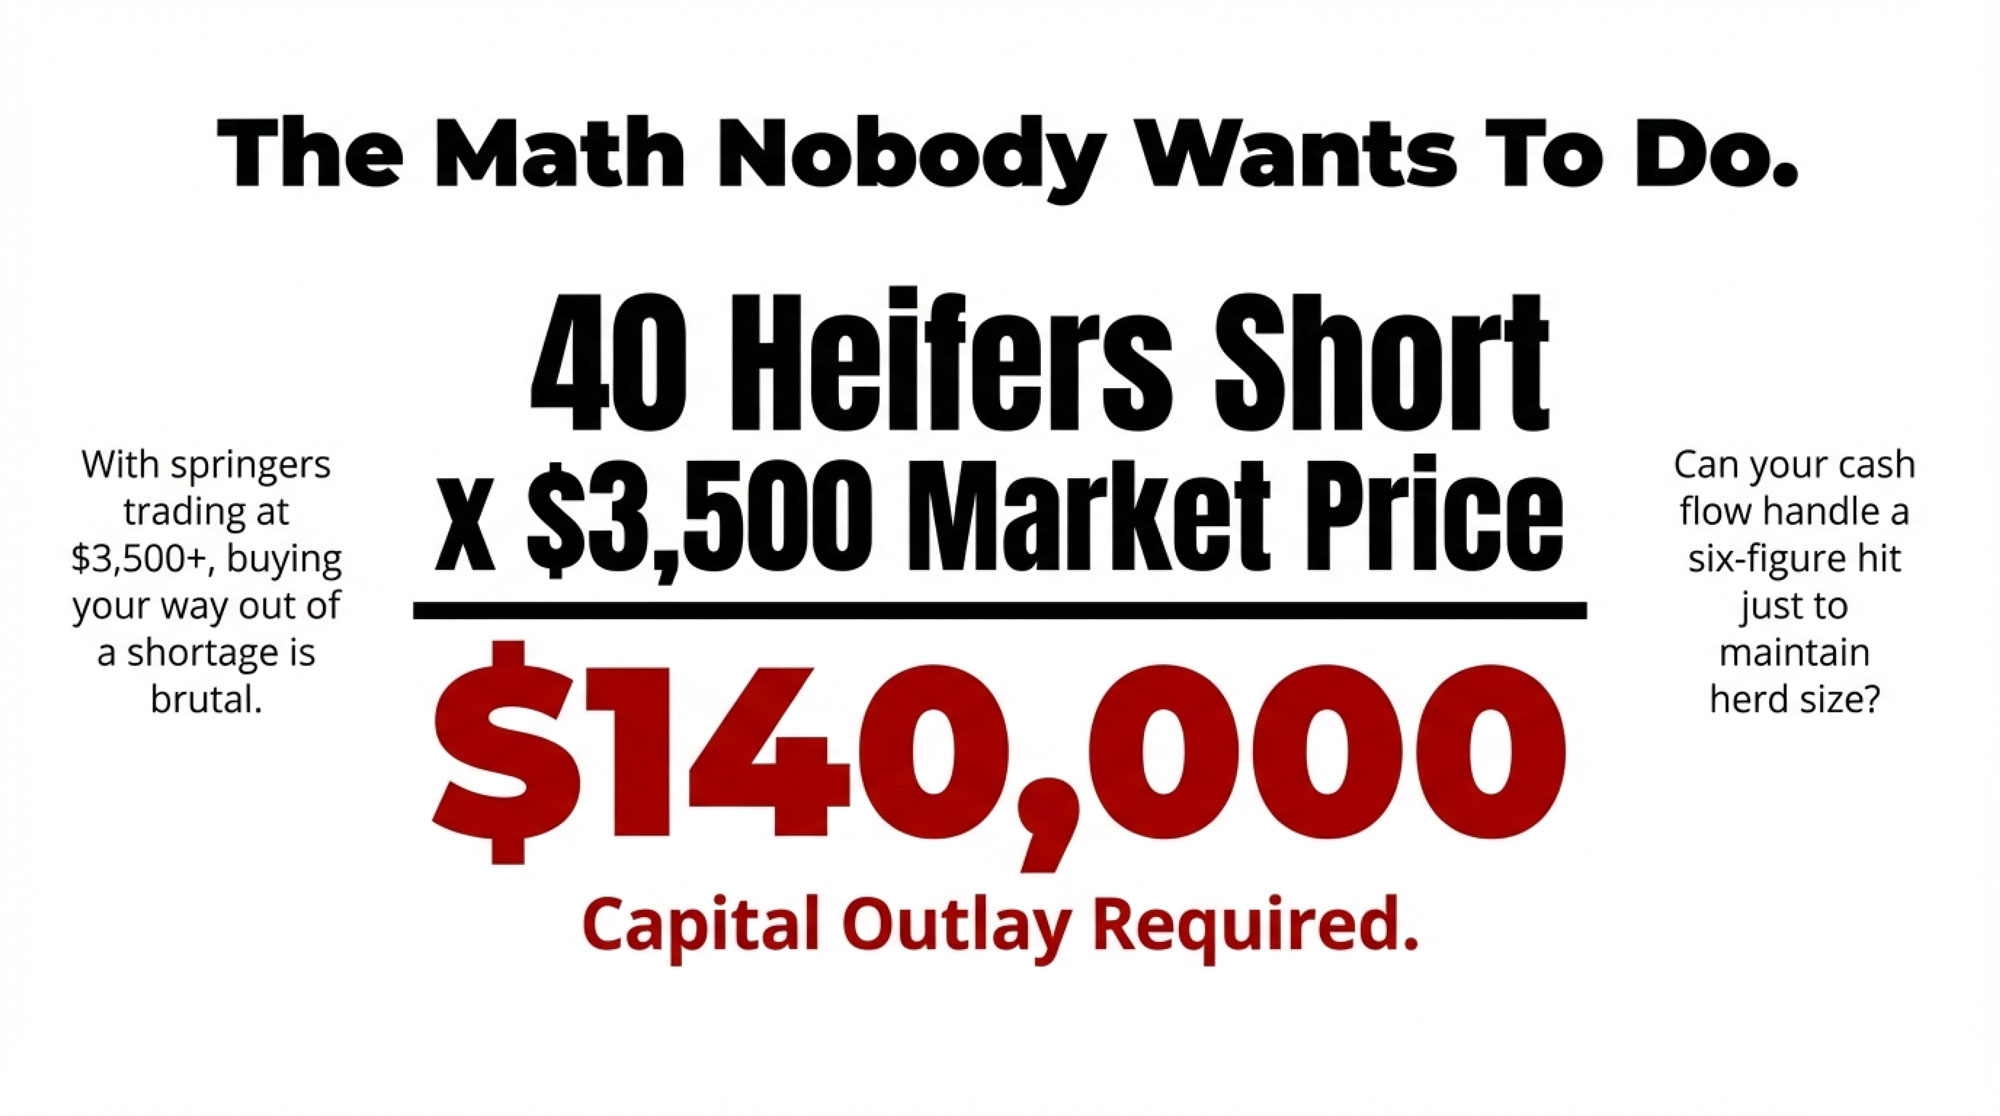
With CoBank’s mid‑2025 replacement value at roughly $3,010 per head, a shortfall of 10 heifers costs about $30,000. A shortfall of 20 — entirely plausible if you’ve been breeding 40–50% of the herd to beef for a few years without counting backward — pushes you north of $60,000. And that assumes you can even find 20 heifers with the genetics and health status you want, in a market CoBank describes as historically tight. 

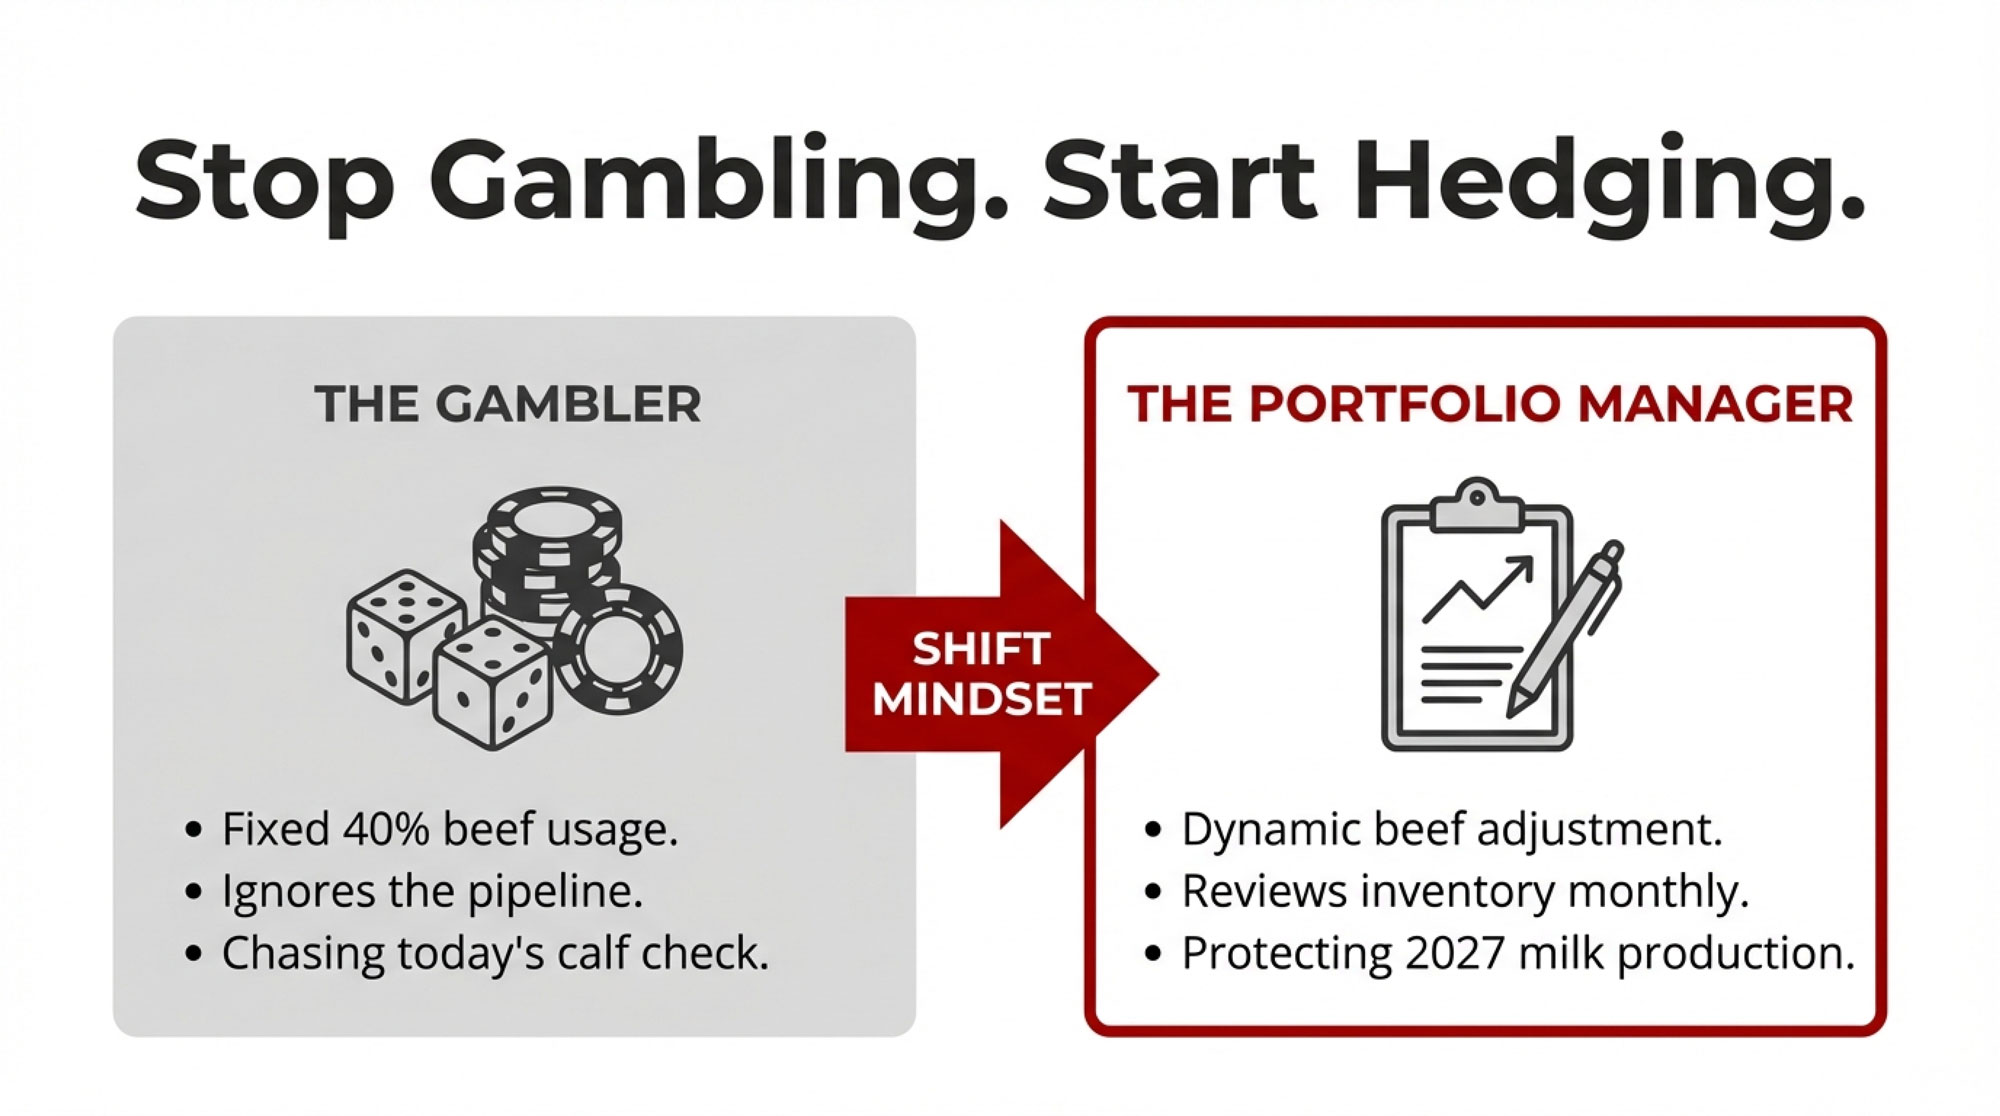
The default planning mistake is to start with a beef percentage (“We’ll go 40–50% beef”) and then hope the replacement math works itself out. The smarter move is the opposite: figure out how many heifer calves you need born per year from your own records, then see what male sexed beef percentage is left after that target is covered.

Herd Size (cows)Cull + Death RateReplacements Entering StringHeifer Calves Needed Born(15% loss)Safe Beef % Available
20035%7082~25–30%
50038%190224~20–25%
1,00036%360424~22–28%

Two Very Different Ways to Think About Calving‑Ease Risk

North American studs are understandably excited about beef‑on‑dairy demand. In 2024, beef semen volume into dairy herds grew to 7.9 million units, and male sexed beef is where the premium sits. The question is how much calving‑ease risk they’ll carry before sex‑sorting — and how much of that risk falls back on your cows. 

In Scandinavia, VikingGenetics has drawn a hard line. Head of beef, Reni Nielsen, says they wait for actual calving ease data from progeny before they lean into beef‑on‑dairy use. In practice, that means large numbers of recorded calvings before a bull is promoted heavily for this role, with calving‑ease reliability in the high 80s or above.

Viking points to Danish Blue sires like VB Nase, with more than 8,000 crossbred offspring and 97% reliability on the Nordic Beef‑on‑Dairy Index, as the kind of data density they want behind a beef‑on‑dairy sire. When you’re working with that many recorded calvings, you’re making a bet with much firmer odds than a genomic bull with no daughters on the ground. 

The Nordic Beef‑on‑Dairy Index (NBDI) even models what happens when male sexed semen is used — the economic value of calf survival and calving ease increases sharply in those scenarios. The downstream message is simple: when every calf is a bull calf, the cost of getting calving ease wrong multiplies, so the bar for data should go up. 

In Ireland, Dunmasc Genetics leans harder into genomics. Their leading Angus and Hereford sires — Legacy and Very Smart — are genomic selections backed by ICBF evaluations for calving ease, carcass traits, and commercial performance, but they don’t wait for Viking‑level progeny numbers first. 

Dunmasc notes that these sires have already generated strong interest among progressive dairy farmers, even though they’re still early in their breeding careers, because of the combination of calving‑ease predictions and carcass potential backed by the ICBF system. ICBF data summarised in the Irish Farmers Journal shows that, over a recent five‑year window, daughters of genomic sires have averaged about €25 higher EBI than daughters of proven sires — roughly 3–4 years of genetic gain compressed into one. The flip side is that proofs still move as more daughters are born, especially for younger genomic bulls. 

On the dairy‑replacement side, that volatility is often manageable — you’re betting on cows that live in your own barn. On the beef side with male sexed semen, you’re betting on heavier calves meeting pelvic limits in fresh cows.

Bullvine Note: North America’s “speed‑first” genomic model and Europe’s “prove it in thousands of calvings” model both work — but they carry different risks. With male sexed beef, you’re not just choosing a bull; you’re choosing which risk profile you’re comfortable calving into your fresh pen.

The uncomfortable North American question is this: if Viking insists on high‑reliability calving‑ease data before really pushing a bull in beef‑on‑dairy programs, and even Ireland’s genomic‑first programs acknowledge proof movement, why is almost nobody on this side of the Atlantic requiring that level of validation before marketing male sexed beef?

Why Won’t Your Index Sheet Save You at 2 AM?

The NBDI and Ireland’s Dairy Beef Index are genuine advances. They let you line up different beef sires across breeds and sort them on a single scale for dairy cows. But they do what indices always do: average across traits. 

A bull with a composite score of 120 can get there a couple of ways:

  • Very easy calving and average carcass.
  • Average calving, very strong growth, and carcass.

The composite doesn’t tell you which story you’re buying. With conventional semen and mixed‑sex calves, that averaging is manageable. With male sexed semen — all bulls, all the time — the calving‑ease piece matters more than the growth piece, and the index doesn’t automatically reweight itself because you chose Y‑sorted.

Your index doesn’t know your cows. It doesn’t see the thin second‑calver that milked off her back last lactation, or the crossbred with a narrow pelvis, or the heifer that already had a rough pull the first time she calved. When you bet on male‑sexed beef, you’re betting she can handle a bull calf — and if you’re wrong, the index won’t pay the vet bill.

Parity, body size, body condition, and previous calving history are enormous drivers of dystocia risk, and none of them lives in the bull proof. 

Use NBDI or DBI to build the short list. Then, before you ever think about male‑sorting a bull or using male sexed beef on a given cow group, look straight at:

  • Calving‑ease or “Birth” sub‑index.
  • Gestation length.
  • Reliability on those traits, and whether it comes from daughters or just a genomic chip.

Heifers, small‑framed cows, and fresh cows with any history of calving trouble should only see the highest‑calving‑ease sires — even if that means giving up some carcass index. That’s true even with conventional semen. With male sexed beef, it’s non‑negotiable.

What Happens When U.S. Herds Dial Back from 50% Beef?

Dr. Victor Cabrera at the University of Wisconsin‑Madison — the researcher behind much of the foundational beef‑on‑dairy economics — saw it happen in the herds he works with. “We looked at the opportunity, and we were having better reproduction performance, and we used too much beef semen,” Cabrera told The Bullvine. “We entered into the problem — which I think now we are coming out of — which was having not enough replacements”. 

He’s not alone. After CoBank’s August 2025 report landed, Wisconsin producers who read the numbers closely immediately reduced their beef breeding from 35% to 25% and locked in contracts with custom heifer growers at $1,250 per head before prices climbed further. As one of them put it at a co‑op meeting: “The premiums are great, but you can give it all back in one bad heifer‑buying spring”. 

When herds actually run this math on their own cull rates, heifer losses, and contract terms, the “safe” beef percentage often ends up closer to the 20–30% range than the 40–50% some advisors pitch. They discover three things at once:

  • At their actual cull and death rate, plus heifer losses, 40–50% beef leaves them one rough repro year away from a very expensive heifer hole.
  • Their 21‑day pregnancy rate isn’t consistently strong enough to carry aggressive sexed‑dairy plus high beef and still hit replacement targets every year.
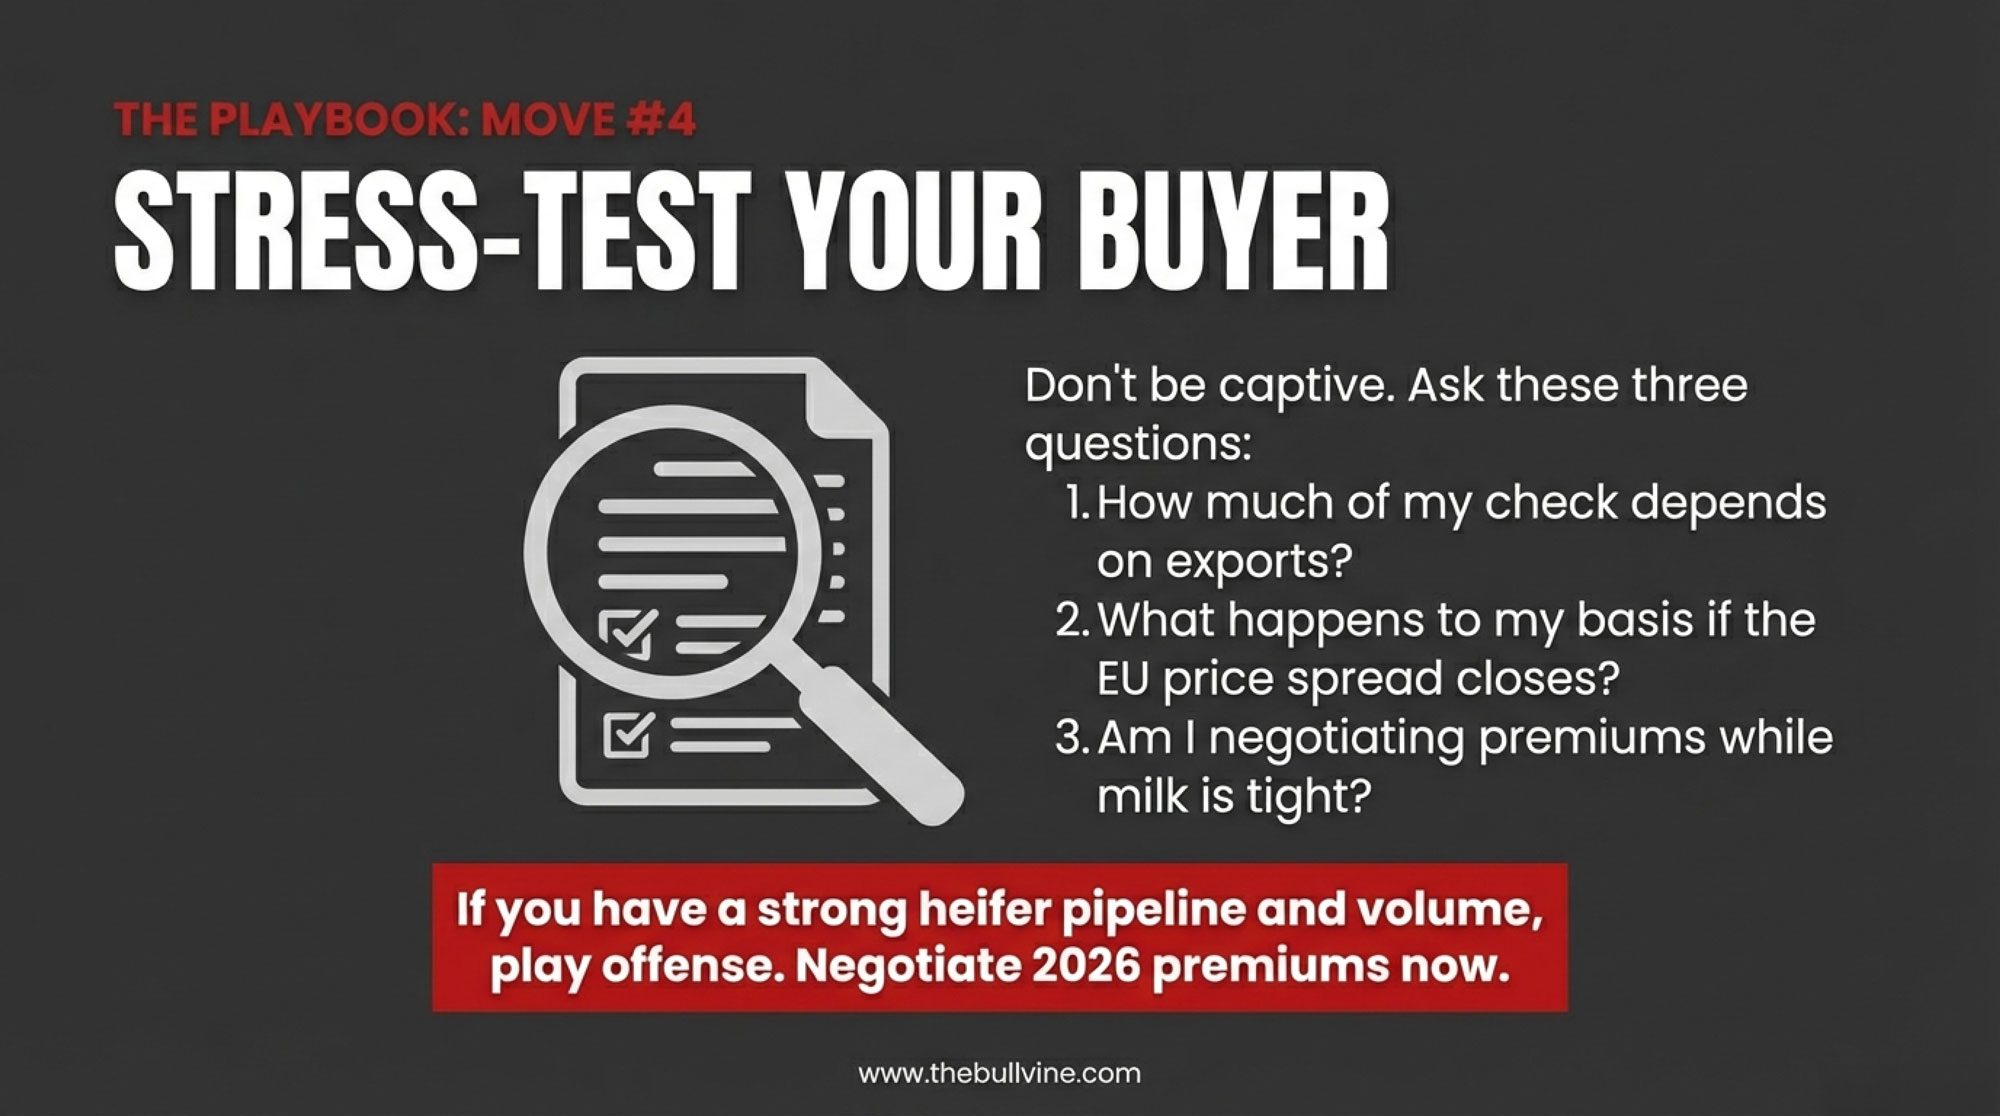
  • The calf buyer’s or lender’s “maximize beef value” line doesn’t include any guarantee of future calf prices or replacement costs.

Those herds don’t abandon beef. They reshape the plan.

Sexed dairy semen leans hard into the top 30–40% of cows and heifers. Beef goes on later‑service cows, lower‑merit animals, and groups where the calving‑ease and gestation‑length proofs really fit. There’s a hard ceiling on beef percentage tied to a specific heifer‑calf target, not a round number that sounded good in a meeting.

Herds that do manage to keep 40–50% beef in the mix without wrecking their replacement pipeline almost always share the same basic profile: 25–30%+ 21‑day pregnancy rates, tight genomic testing and cow grouping, a clear replacement plan counted in dollars, and stronger beef‑calf contracts where specs and premiums are more predictable, not just promised.

What This Means for Your Operation

  • Flip the starting point. Don’t start with “What percent beef can we run?” Start with, “At our real cull and death rate, plus heifer losses, how many dairy heifer calves do we need born each year?” Work backward from a replacement target, not forward from a round beef percentage. 
  • Use your 21‑day pregnancy rate as a ceiling, not a logo. De Vries’ work shows the economics soften below a 20% 21‑day pregnancy rate when you throw beef into the mix. If you’re living in the mid‑teens, the priority is fixing repro, not doubling down on sexed beef. 
  • Ask harder questions about calving‑ease reliability. For every beef bull in your tank, write down his calving ease or Birth index, gestation length, and reliability. If you can’t tell whether those numbers come from daughters or a DNA chip, you don’t know enough to bet male sexed semen on him. 
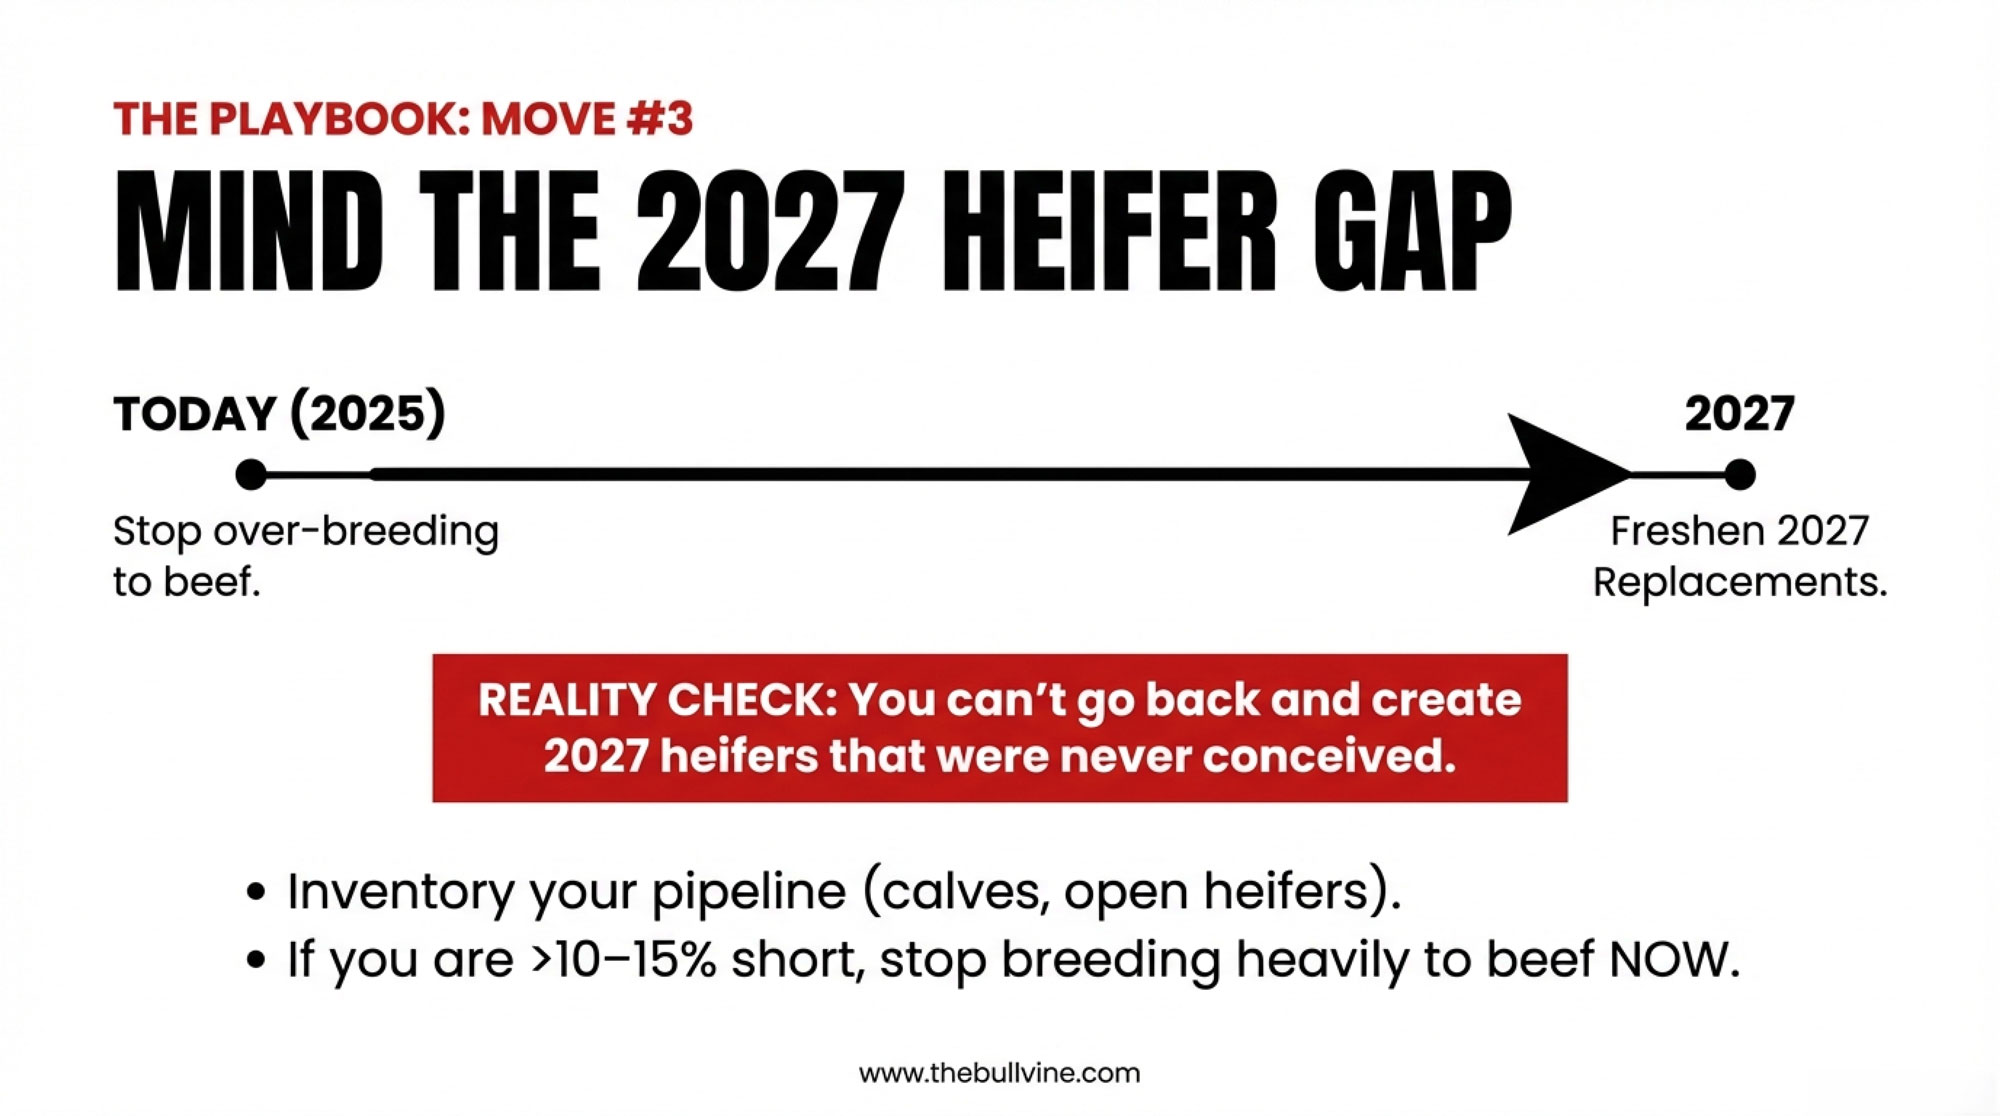
  • Treat beef‑on‑dairy like a three‑year bet, not a three‑month bonus. CoBank is clear that the heifer squeeze runs through at least 2027. If your breeding plan only pencils with today’s calf prices and today’s replacement costs, you’re not managing risk — you’re hoping the market stays put. 

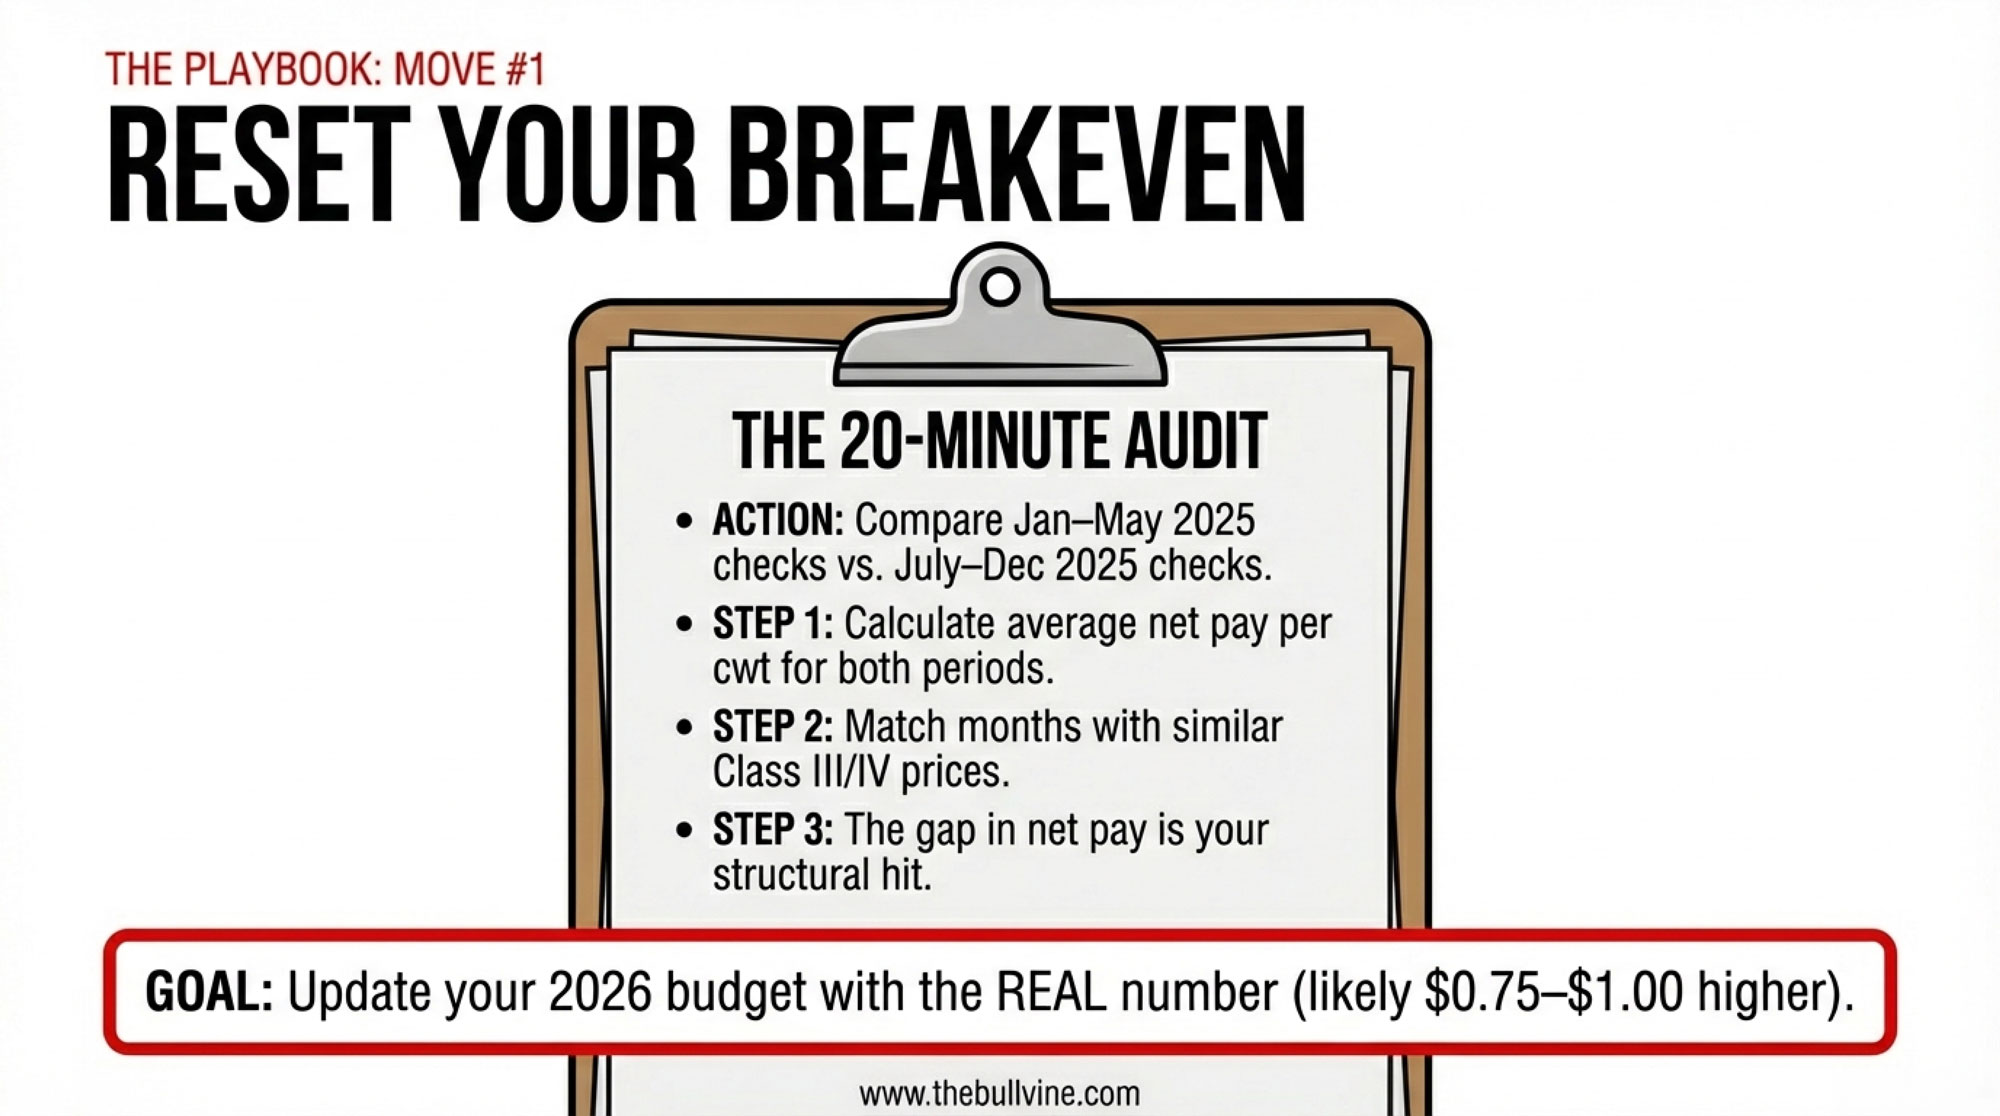
Within the next 30 days: Pull your last three years of cull and death data — including cows quietly sold as “do‑not‑breed.” From that, calculate your real replacement rate and how many heifer calves you need born per year after losses to keep the herd at its current size. Put that number on paper before the next conversation about “maximizing beef value”. 

Within 90 days: For every beef bull you’re actually using, list calving‑ease reliability and gestation length. Any bull under about 80% reliability on calving ease should be off the male‑sexed list for heifers and second‑calvers until you have more data. No exceptions.

Within a year: Run two simple scenarios with your lender or advisor:

  1. Beef‑cross calf prices stay where they are, and your heifer plan works perfectly.
  2. Beef‑cross premiums drop 20%, and you have to buy 10–20 heifers at roughly $3,000–$4,000 each in 2028. 

If scenario two blows up your cash flow, your current beef-and-sexed-semen plan is more aggressive than your balance sheet can handle.

Key Takeaways

  • If your 21‑day pregnancy rate is under 20%, male sexed beef is a luxury, not a base plan. Fix repro first; then decide how much beef your herd can carry. 
  • If you don’t know how many heifer calves you need born each year, you don’t know how much beef you can safely run. Count backward from actual cull and loss data, not forward from a beef percentage. 
  • If a beef bull’s calving‑ease numbers are mostly genomic with low reliability, think twice before betting male sexed semen on heifers and second‑calvers. Use those bulls where the pelvis and the calving history give you more margin. 
  • If your beef‑on‑dairy plan only works at today’s calf prices and today’s heifer costs, you’re not managing risk; you’re gambling that CoBank’s 800,000‑heifer hole won’t matter at your mailbox.

The Bottom Line

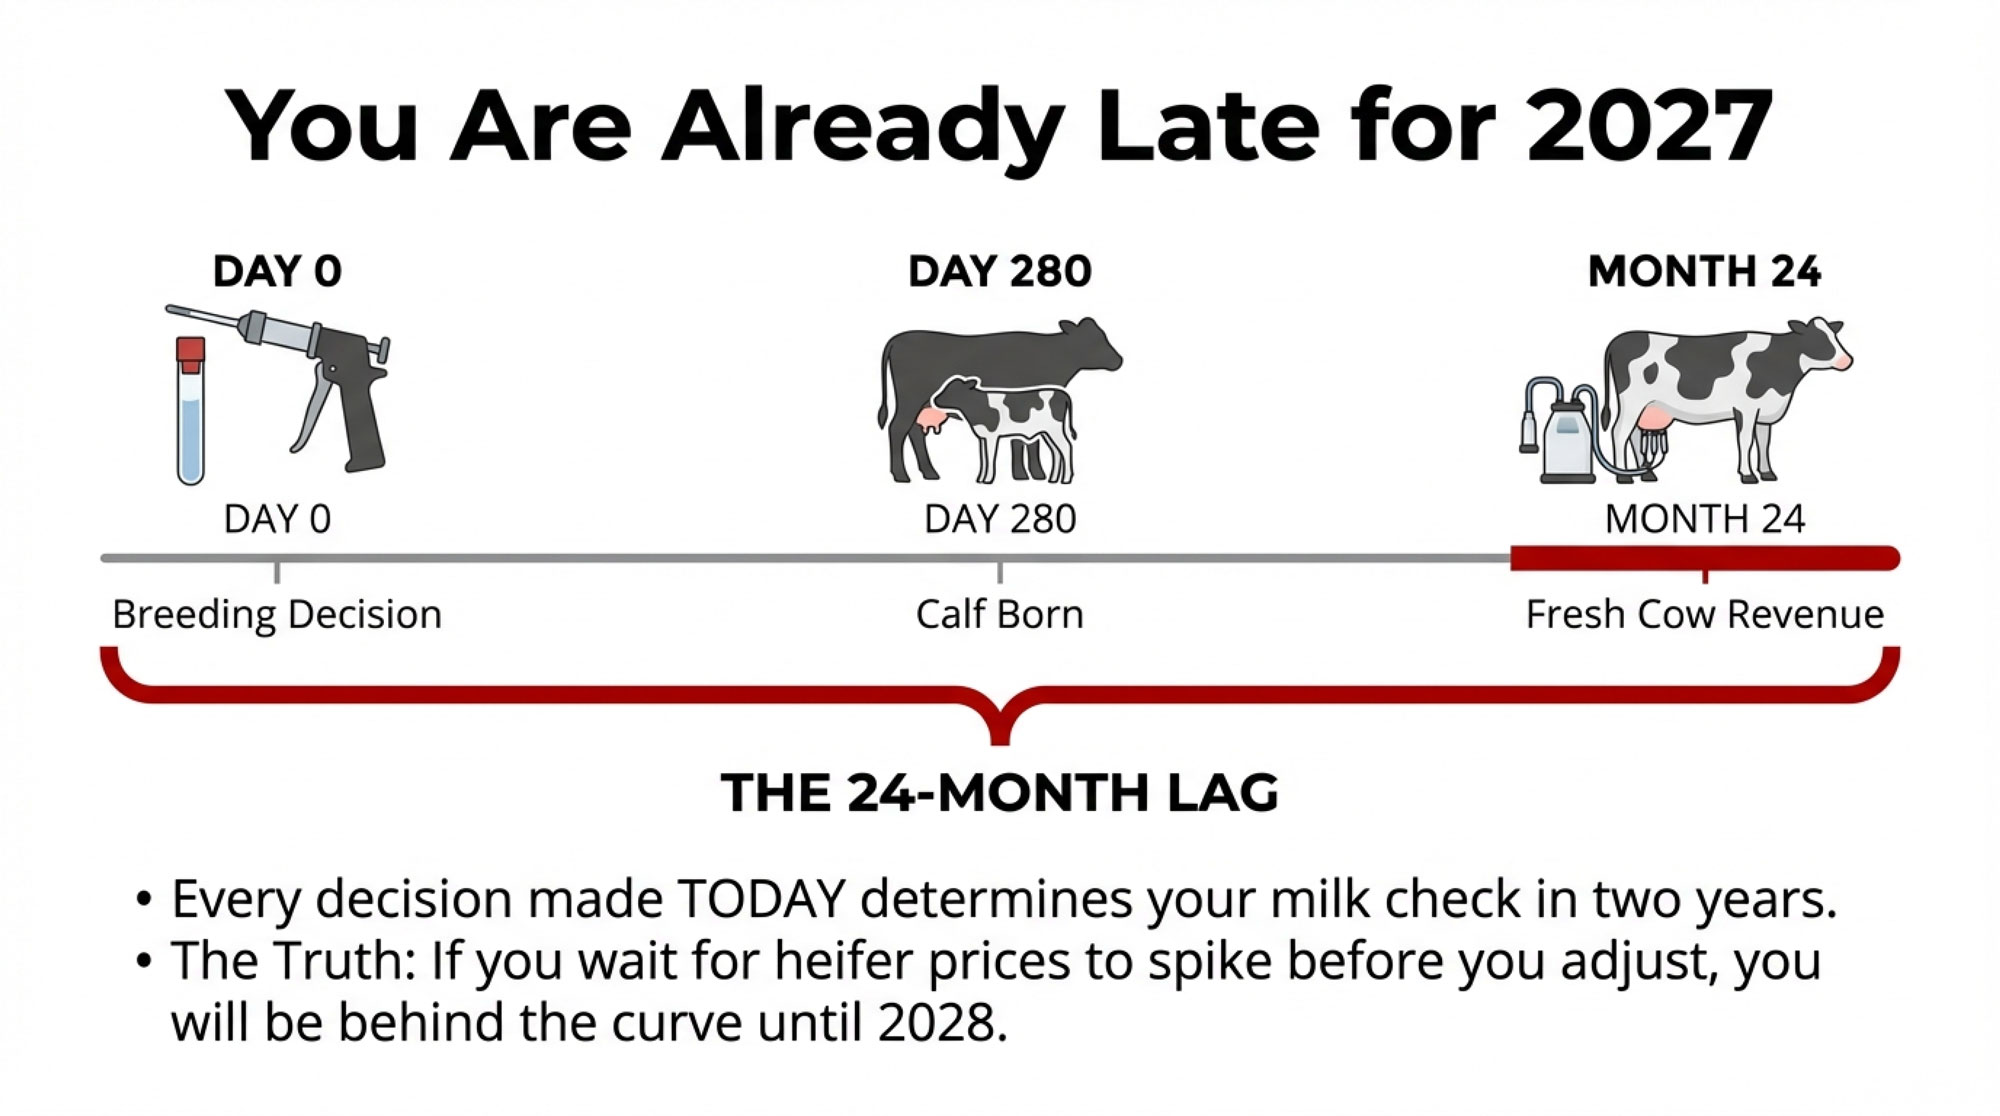
CoBank projects no real rebound in the heifer supply before 2027. The breeding decisions made in 2024 and 2025 already locked in what will be freshened in 2026 and 2027. The choices you make this spring lock in 2028. 

How many heifers does your breeding plan actually produce — and what happens if the market moves before they get there?

Complete references and supporting documentation are available upon request by contacting the editorial team at editor@thebullvine.com.

Learn More

The Sunday Read Dairy Professionals Don’t Skip.

Every week, thousands of producers, breeders, and industry insiders open Bullvine Weekly for genetics insights, market shifts, and profit strategies they won’t find anywhere else. One email. Five minutes. Smarter decisions all week.

NewsSubscribe
First
Last
Consent

The $0.90/Cwt FMMO Hit: Reset Your Breakeven, DMC Coverage, and Heifer Strategy for 2026

A 90¢/cwt FMMO cut, $3,010 heifers, and DMC at $9.50. Are your 2026 plans actually built for this math?

Executive Summary: USDA’s June 2025 FMMO changes cut 85–93¢/cwt from class prices and $337 million from producer pool revenues in 90 days, effectively shifting many herds’ breakevens into the $18.75–$19.00/cwt range. For a 300‑cow, 7,500‑lb herd, that’s roughly $19,000–$21,000 gone from annual milk income before feed or futures even enter the conversation. CoBank’s latest work adds another pressure point: replacement heifer inventories at a 20‑year low, projected to shrink by 800,000 head while $10 billion in new processing capacity comes online and average replacements hit about $3,010/head. U.S. cheese and butter exports are booming only because they’re cheap—cheddar 40–60¢/lb under the EU and butter $1.09/lb lower—so that “good news” can flip fast if spreads close. This article lays out four hard‑nosed moves: rebuild your breakeven off 2025 milk checks, use $9.50 Tier 1 DMC as a structural margin tool, close 2027 replacement gaps before pushing more beef semen, and stress‑test your buyer and export exposure before basis and premiums do it for you.

If your milk check feels lighter than your markets suggest, you’re not imagining it. The problem isn’t just price volatility anymore. It’s the formula.

June 2025 didn’t just tweak how milk prices are calculated. It pulled 85–93 cents per hundredweight out of U.S. class prices in the first three months under the new Federal Milk Marketing Order rules, cutting about $337 million from nationwide pool revenues for farms shipping into U.S. FMMOs, according to American Farm Bureau Federation Market Intel’s “Three Months In: Early Impacts of FMMO Amendments” (September 21, 2025). For a 300‑cow herd averaging 7,500 pounds per cow per year—about 22,500 cwt—that single structural shift works out to roughly $19,125–$20,925 less annual revenue.

One 350‑cow Wisconsin herd that sat down with their advisor and two stacks of milk checks—January through May vs. July through December—watched their effective breakeven move from about $17.90 to $18.80/cwt. Same Class III levels on paper. Nearly a dollar less landing in the tank. If you haven’t rerun your own numbers since the June 1 change, you’re planning off a milk check that no longer exists.

What Changed in June 2025 FMMO Pricing

For the first time since 2000, USDA’s Agricultural Marketing Service raised the make allowances used to calculate Class III and IV prices in all 11 U.S. FMMOs. These are the built‑in processing cost deductions that come off wholesale product prices before any value flows back into the pool.

Under USDA’s final decision, effective June 1, 2025, the key make allowances moved from:

  • Cheese: $0.2003/lb → $0.2519/lb (+5.16¢)
  • Butter: $0.1715/lb → $0.2272/lb (+5.57¢)
  • Nonfat dry milk: $0.1678/lb → $0.2393/lb (+7.15¢)
  • Dry whey: $0.1991/lb → $0.2668/lb (+6.77¢)

Take cheese at $1.60/lb CME blocks as a simple example:

  • Old formula: $1.60 − $0.2003 = $1.3997 flows into Class III component values.
  • New formula: $1.60 − $0.2519 = $1.3481 flows in.
ProductOld Make Allowance ($/lb)New Make Allowance ($/lb)Increase (¢/lb)Impact on Class Prices
Cheese$0.2003$0.2519+5.16¢Class III down ~$0.92/cwt
Butter$0.1715$0.2272+5.57¢Class IV down ~$0.85/cwt
Nonfat Dry Milk$0.1678$0.2393+7.15¢Class IV down ~$0.85/cwt
Dry Whey$0.1991$0.2668+6.77¢Class III down ~$0.92/cwt
Combined Impact5–7¢/lb avg−$0.85–$0.93/cwt

That extra 5.16 cents per pound of cheese never hits the pool. It stays with the plant as cost recovery.

AFBF’s early‑impacts analysis of June–August 2025 found:

  • Average Class I prices were $0.89/cwt lower.
  • Class II down $0.85/cwt.
  • Class III down $0.92/cwt.
  • Class IV down $0.85/cwt.

That’s roughly a 4–5% drop in class prices driven solely by higher make allowances, pulling about $337 million out of combined pool revenues in just three months. The largest dollar losses occurred in the Upper Midwest ($64M), the Northeast ($62M), and California ($55M), where more milk runs through manufacturing classes. 

If your local Class III and IV prices in late 2025 look a lot like early 2025, but your milk check is down close to a dollar per cwt, that’s not bad luck. That’s the formula change doing what it was designed to do.

How the New Formulas Show Up in DMC

Dairy Margin Coverage was built as disaster insurance. You bought it for the years when milk cratered or feed blew up. Higher make allowances are slowly turning it into something else.

AFBF’s math shows the new formulas alone lowered class prices by 85–93¢/cwt in the first three months after June 1. That structural gap sits on top of whatever the market throws at you. fb

USDA FSA’s DMC margin series for 2024 shows several months where the national margin came uncomfortably close to $9.50/cwt, even without a full‑blown crisis. Now imagine one of those months under the new formulas:

  • All‑Milk price not far below $19/cwt.
  • Feed cost index near $9.50/cwt.
  • DMC margin scraping around $9.50/cwt.

If you take that 85–93¢/cwt impact and simply “add it back” to see what things might have looked like under the old make allowances, you’d be looking at a margin over $10/cwt in that same environment—comfortably above the Tier 1 trigger. That’s back‑of‑the‑envelope, not an official USDA series, but it tells you something important:

DMC is now catching structurally thinner “normal” years as well as train‑wreck years.

Katie Burgess, dairy analyst at Ever.Ag, expects real payouts in 2026: “Our model right now is showing payouts of more than $1 per hundredweight for January through April, and then some smaller payments for May through July as well.” William Loux at NMPF “certainly expect[s] to see some DMC payments here through the first quarter and probably through the first half of the year.”

For a lot of Tier 1‑eligible herds, $9.50 coverage is drifting from “catastrophe coverage” toward baseline margin backstop.

Rerunning Your Breakeven with 2025 Milk Checks

If your 2026–2028 plan still assumes $18/cwt is a safe breakeven because that used to work, you’re flying on old instruments.

You don’t need a fancy model to fix that. You need your milk checks and 20 minutes.

Step 1 – Two windows of checks

  • January–May 2025: pre‑reform.
  • July–December 2025: fully under the new formulas.

For each window, figure out:

  • Average net pay price per cwt (after hauling, co‑op fees, assessments).
  • Average Class III and/or IV values (USDA announced prices).

Step 2 – Compare like for like

Pick months where Class III/IV levels are similar before and after June. Then ask: how much lower is my net pay in the post‑June window?

If your Class III/IV values match but your net is 80–90¢/cwt lower, that’s the policy shift, not just “a bad month,” and lines up with AFBF’s 85–93¢/cwt range. 

On herds that have walked through this math with their advisors, the pattern often looks something like this:

  • A pre‑June “safe” breakeven around $18.00/cwt.
  • A post‑June reality that needs closer to $18.75–$19.00/cwt to land the same margin once you factor in the structural hit.

For that 300‑cow, 7,500‑lb/cow example:

  • Annual production: about 22,500 cwt.
  • Structural shift: $0.85–$0.93/cwt.
  • Annual revenue loss: $19,125–$20,925.
Herd Size (cows)Avg Production per Cow (lbs/year)Total Production (cwt/year)FMMO Revenue Loss @ $0.85/cwtFMMO Revenue Loss @ $0.93/cwt
1007,5007,500−$6,375−$6,975
3007,50022,500−$19,125−$20,925
5007,50037,500−$31,875−$34,875
7507,50056,250−$47,813−$52,313
1,0007,50075,000−$63,750−$69,750

You don’t have to like that number. You do have to plan off it—on budgets, on debt service, and on any expansion or robot that depends on your next five years of milk checks.

A 20‑Year‑Low Heifer Inventory Colliding with $10B in New Plants

While the FMMO formulas were changing, semen guns were rewriting the supply side.

CoBank’s August 27, 2025, analysis, Dairy heifer inventories to shrink further before rebounding in 2027, puts the U.S. replacement heifer supply at a 20‑year low. They project inventories will shrink by about 800,000 head over the next two years and only start to rebound in 2027 as breeding strategies adjust. 

At the same time, CoBank flags a $10 billion wave of new U.S. dairy processing investment, much of it scheduled to be running at full speed by 2027. As CoBank senior dairy economist Corey Geiger puts it: “The short answer is that it will be tight. Those dairy plants will require more annual milk and component production, largely butterfat and protein. And it will take many more dairy heifer calves in future years to bring the national herd back to historic levels.” 

Driving the heifer squeeze:

  • Strong beef prices pulled more beef semen into dairy herds.
  • Straight dairy heifer calves often didn’t pencil when bred heifers were cheap, and rearing costs were high.
  • Sexed dairy semen focused replacements on the top genetics but didn’t fully replace the volume lost to beef‑on‑dairy.

That logic made sense when beef‑on‑dairy calves were hot and USDA “Ag Prices” showed average replacement values in the neighborhood of $1,700/head, with many bred heifers trading somewhere in the $1,500–$2,000 range in local markets. 

It looks a lot riskier in a world where CoBank shows average replacement prices climbing to about $3,010/head and warns they could go “well above $3,000 per head” in a tight market. 

And the biology doesn’t care about your budget:

  • Breed a heifer in early 2025 → she freshens in 2027.
  • Those decisions are locked in.

The heifers that will fill the 2027 plant capacity are already on feed, or they were left as beef‑cross calves. You can still fix your 2028 and 2029 pipeline. You can’t go back and create 2027 heifers that were never conceived.

Why U.S. Cheese and Butter Are Moving—and Vulnerable

Exports have been the good‑news line on a lot of market calls. It’s worth looking under the hood. U.S. cheese and butter are moving because they’re cheaper than EU and New Zealand product. Using USDEC and USDA data, they show: 

  • U.S. cheese exports through October 2024 hit about 941 million pounds, and were on pace to surpass the previous annual export record. 
  • Butterfat exports reached 80 million pounds through October, up 18.6% (about 13 million pounds) year‑over‑year. 

The price spreads are doing the heavy lifting:

  • In January and March 2024, U.S. cheddar was roughly 40–50¢/lb cheaper than EU and New Zealand cheese. 
  • By November–December, that spread widened to about 45–60¢/lb
  • In early December, EU butter sat around $3.62/lb, while U.S. butter had slipped to about $2.53/lb—a $1.09/lbU.S. price advantage. 

That’s great for exports. It’s also fragile.

If U.S. prices rally 15–20% on domestic factors while EU/Oceania values sit still—or if EU/NZ soften while U.S. prices hold—those spreads can shrink fast. As discounts narrow, importers in Mexico, Asia, and the Middle East have less reason to choose U.S. products.

At that point:

  • Cheese meant for export stays domestic.
  • American‑type cheese inventories—which Hoard’s noted were already elevated relative to where many traders thought prices should be—could build further. 
  • U.S. prices may have to drop enough to re‑open the export valve.

One simple rule‑of‑thumb some risk‑managers use for export‑exposed herds: when the U.S.–EU cheddar discount shrinks below about 25¢/lb for more than a month, it’s a yellow light to start paying closer attention to what that means for your plant’s export book and your basis.

MonthU.S. Cheddar ($/lb)EU/NZ Cheddar ($/lb)U.S. Butter ($/lb)EU Butter ($/lb)
Jan 2024$1.55$2.05$2.45$3.50
Mar 2024$1.58$2.10$2.50$3.55
Jun 2024$1.62$2.15$2.60$3.65
Sep 2024$1.70$2.25$2.68$3.70
Nov 2024$1.75$2.30$2.55$3.60
Dec 2024$1.78$2.38$2.53$3.62
Feb 2025 (hypothetical tightening)$1.95$2.20$2.85$3.15
Avg Spread (2024)45–60¢/lb U.S. discount$1.05–$1.15/lb U.S. discount

Export “strength” built on deep price discounts is a useful buffer. It isn’t a guarantee.

Four Concrete Moves in a $0.90/Cwt World

You can’t change Washington’s formulas or CoBank’s heifer math. You can change how your own numbers line up.

1. Reset Breakeven Off Your 2025 Checks

This one applies to every U.S. herd shipping into an FMMO.

  • Pull your milk checks for January–May 2025 and July–December 2025.
  • For each period, calculate average net pay per cwt and average Class III/IV prices from the USDA.
  • Match months where Class III/IV were similar before and after June.
  • The gap in net pay is your structural hit from the new rules, in the same ballpark as AFBF’s 85–93¢/cwt estimate. 

If that math shows your realistic breakeven has climbed $0.75–$1.00/cwt compared with pre‑June, that’s the number you should plug into 2026–2028 cash‑flow plans, debt‑service conversations, and any capital decisions on barns, robots, or land.

2. Treat $9.50 DMC as a Structural Margin Tool

Best fit: herds under the Tier 1 pound cap, especially in cheese‑heavy or basis‑noisy orders.

Tier 1 DMC covers a capped chunk of your production history—and for 2026, that cap jumped from 5 million to 6 million lbs per year under recent farm‑bill changes. At the $9.50/cwt coverage level, Tier 1 premiums run $0.15 per cwt, according to USDA FSA’s current premium schedule. Enrollment for 2026 coverage closes February 26, 2026, and producers who lock in coverage through 2031 receive a 25% premium discount

If your updated breakeven is $18.75–$19.00/cwt and the margin outlook hangs close to $9.50, then $9.50 Tier 1 isn’t a lottery ticket; it’s a structural margin backstop.

The trade‑off is straightforward: in fat years, premiums feel like a waste; in thin structural years, DMC payments won’t erase the 85–93¢/cwt hit—but they can plug a meaningful slice of the gap.

3. Check Your 2027 Replacement Gap Before More Beef Semen

Best fit: herds where a majority of services are going to beef semen.

Step 1 – Inventory your pipeline: cows in milk by lactation, bred heifers with due dates, open heifers by age class, and heifer calves on the ground.

Step 2 – Run 2027 replacement math: target annual replacements = herd size × target cull rate (many herds land between 30–38%). Estimate how many heifers will freshen in 2027 based on current pregnancies and heifer numbers. Compare projected 2027 fresh heifers to replacement needs. 

If your projection is more than roughly 10–15% short, you’ve got a built‑in problem that most lenders and advisers would flag sooner rather than later.

Step 3 – Adjust semen mix, not just cull rate: problem cows and bottom genetics → beef semen; middle group → conventional dairy; top cows and heifers → sexed dairy.

If your records show 60+ percent of services going to beef semen, it may be worth dialing that back to a 30–40% banduntil your 2027 replacement gap closes. You give up some real beef‑cross calf cash now. In return, you reduce the odds of buying replacements “well above $3,000 per head” in a tight market or shrinking faster than you planned because you simply run out of heifers. 

4. Stress‑Test Your Plant and Export Exposure

Best fit: herds shipping into export‑oriented cheese and butter plants in the Southwest, Pacific Northwest, Upper Midwest, or similar regions.

Ask yourself three questions:

  1. How much of my milk check depends on my buyer’s export book?
  2. What happens to my basis and premiums if U.S. cheese and butter lose a big part of their discount to the EU and Oceania?
  3. Do I have more than one serious buyer, or am I effectively captive to a single plant?

Practical moves:

  • Track U.S. vs EU/New Zealand butter and cheddar price spreads monthly using public series from USDEC, USDA, and market summaries. 
  • Use DRP, forward contracts, and basis tools anchored to your updated breakeven, not the old one.
  • If you have multiple buyers, don’t wait for a crisis—start talking now about 2026–2027 volumes and premiums. When heifers and milk are both tight, plants don’t treat all suppliers the same.

What This Means for Your Operation

You don’t control FMMO formulas, CoBank’s heifer math, or EU butter prices. You do control how honestly your own numbers line up with them.

  • Rebuild your breakeven using pre‑ and post‑June 2025 checks. If that exercise shows your true breakeven has crept into the $18.75–$19.00/cwt range and you’re still planning off $18.00, that’s a silent risk your lender will spot before you do.
  • Look at Dairy Margin Coverage as a structural tool, not a Hail Mary. If your costs sit near $19/cwt and the national margin now scrapes $9.50/cwt more often, Tier 1 coverage at $9.50—now up to 6 million lbs with a $0.15/cwt premium in 2026—belongs in the core of your risk toolkit, not the “maybe” pile. Enrollment closes February 26, 2026.
  • Run a 2027 replacement gap check before another heavy beef‑on‑dairy year. If your math shows a deficit of more than 10–15% on 2027 replacements and you’re running high beef semen percentages, pulling back now may be cheaper than buying very expensive bred heifers or losing scale later in a 20‑year‑low heifer environment. 
  • Watch spreads and plant behavior, not just export headlines. Record exports driven by big discounts can flip fast. Pay more attention to U.S.–EU/NZ spreads and what your plant does with premiums and basis than to national export tonnage alone. hoards
  • Monitor these signals going forward: U.S.–EU cheddar spreads narrowing below 25¢/lb for more than a month; bred heifer prices pushing past $3,200–$3,500/head in your region; and any DMC margin prints below $9.00/cwt that would trigger larger payouts than current projections. 
  • If you have a strong heifer pipeline and more than one serious buyer, you’re in rare company. That’s a chance to play offense: negotiate better premiums, selectively expand, or lean harder into components while other herds are stuck just hanging on.

Key Takeaways

  • The 85–93¢/cwt hit from the new FMMO make allowances is structural until policy changes again. It’s built into the formulas and shows up even when CME prices look “normal,” with an estimated $337M pulled from pools in the first three months alone (AFBF, Sept. 2025). 
  • Dairy Margin Coverage is drifting from disaster insurance toward a structural margin backstop. With class prices permanently trimmed and margins regularly near $9.50/cwt, DMC is more likely to trigger in tight but “normal” years, not just in blow‑ups.
  • Replacement heifers are at a 20‑year low and projected to shrink by another ~800,000 head before rebounding in 2027 (CoBank, Aug. 2025). That makes your replacement strategy and semen mix real risk‑management levers, not just breeding preferences. 
  • U.S. export “strength” in cheese and butter is running on price discounts. Hoard’s and USDEC data show U.S. cheese and butter winning business because they’re 40–60¢/lb and more than $1/lb cheaper, not because demand is bulletproof. 

The Bottom Line

The rules changed faster than most budgets, breeding plans, and risk strategies. You can either recalibrate now while you still have choices—or wait until your milk check, your heifer buyer, or your plant forces the decision for you.

Where does your post‑June breakeven actually sit?

Complete references and supporting documentation are available upon request by contacting the editorial team at editor@thebullvine.com.

Learn More

The Sunday Read Dairy Professionals Don’t Skip.

Every week, thousands of producers, breeders, and industry insiders open Bullvine Weekly for genetics insights, market shifts, and profit strategies they won’t find anywhere else. One email. Five minutes. Smarter decisions all week.

NewsSubscribe
First
Last
Consent

The $1,400 Calf vs. the $3,500 Heifer: How to Win at Beef‑on‑Dairy Without Wrecking Your 2027 Herd

Beef-on-dairy doubled your calf checks. It also drained 800,000 heifers from the U.S. pipeline. Here’s how to keep winning without wrecking your 2027 herd.

EXECUTIVE SUMMARY: Beef-on-dairy has been a lifeline—$650 calves three years ago now bring $1,400, and those checks have kept plenty of operations in the black. But there’s a cost building in the background. U.S. heifer inventories just hit a 20-year low, CoBank projects an 800,000-head gap by 2027, and $10 billion in new processing plants are coming online hungry for milk and butterfat. The math nobody wants to do: every breeding decision today locks in your replacement options two years out. Herds running 35-40% beef semen without a clear pipeline picture could face $3,500+ springer bills when the shortage really bites. The good news is that a simple 24-month dashboard can help you keep cashing beef checks without building a hole you can’t fill come 2027.

You know that feeling when you open the calf check from your buyer and think, “Wait, this can’t be right”? A lot of us have had that moment over the last few years. What used to be a drag on cash flow—those plain Holstein bull calves nobody wanted—has turned into serious money when you cross the right cows with beef sires.

Average day-old beef-on-dairy calf prices have climbed more than 100% in just three years, turning calf checks into a major revenue stream 

And the numbers back it up. Average day‑old beef‑on‑dairy calves have climbed from roughly 650 dollars to around 1,400 dollars over the last few years, depending on your region and calf weights. Dairy‑beef cross calves keep breaking records at sales—often bringing 1,000–1,500 dollars per head in strong markets.

So that’s the good news. Here’s where it gets more complicated.

A 2025 CoBank Knowledge Exchange report flagged something that should get our attention: U.S. dairy heifer inventories have dropped to a 20‑year low, and they’re projected to shrink by about 800,000 head before starting to recover in 2027. That’s not a small number. And on top of that, Rabobank analysis shows Brazil overtook the U.S. as the world’s top beef producer in 2025—roughly 12.5 million metric tons versus 11.8 million for us.

Year0–3mo3–6mo6–12mo12–18mo18–24moTotal
20230.850.801.100.950.904.60
20240.820.781.050.920.854.42
20250.780.751.000.880.804.21
2027E0.800.771.020.900.914.40

What does that mean for your operation? Well, in practical terms, many of us aren’t just selling milk with some cull cows on the side anymore. We’re running dual‑market protein businesses—milk plus cattle—and how those two sides interact over the next 24 months will have a lot to say about herd stability, fresh cow management, butterfat performance, and honestly… who’s still milking come 2030.

Here’s what’s encouraging, though: you don’t have to abandon beef‑on‑dairy to protect your future herd. But you probably do need to think differently about time, replacements, and risk.

How Beef‑on‑Dairy Got So Big, So Fast

Looking back just a few years, the shift toward beef semen on dairy cows made a lot of sense. The economics lined up almost too well.

Why Those Beef Calf Checks Took Off

A few big forces hit at the same time:

  • Native beef supplies got tight. USDA’s 2024 cattle inventory report showed the U.S. beef cow herd at its smallest level since the early 1960s, years of drought‑driven liquidation finally catching up. By 2025, U.S. beef output had declined to approximately 11.8 million tons, according to Rabobank figures.
  • Brazil stepped on the gas. They expanded feedlot capacity, improved genetics, and increased carcass weights. Rabobank estimates Brazilian beef production hit roughly 12.5 million tons in 2025, nudging past the U.S. and easing the global squeeze a bit.
  • Beef‑on‑dairy premiums exploded. As packers and feeders got comfortable with crossbred performance, prices followed. Calves that averaged around 650 dollars three years ago were commonly selling near 1,400 dollars by 2025. Dairy‑beef crosses repeatedly setting highs, often more than doubling what straight Holstein bulls once brought.
  • Raising every heifer stopped penciling. You probably know this already, but economic analyses from land‑grant universities and journals like Journal of Dairy Science consistently show it costs 2,000–2,500 dollars in direct costs to raise a heifer from birth to calving once you factor in feed, housing, labor, and health. When you could buy Holstein springers for less than that for several years running… well, it made sense to sell more calves for beef.

And the genetics side backs this up, too. A 2022 board‑invited review in Translational Animal Science found that beef × dairy crossbreds—when sires are chosen correctly—can deliver better average daily gain, feed conversion, and carcass weights than straight Holsteins. A companion carcass perspective analysis, also in Translational Animal Science, showed that these crosses can capture real carcass premiums through good marbling and red meat yield when genetic and management decisions align.

So when you put it all together—tight native beef, strong calf prices, underpriced Holstein heifers, better beef × dairy genetics—it’s no surprise so many herds leaned into beef‑on‑dairy. The behavior made sense at the time.

But Here’s the Other Side of That Ledger

On the replacement side, the picture looks very different.

That CoBank report from August 2025 spells it out pretty clearly:

  • The number of dairy heifers expected to calve into the U.S. herd has dropped to a two‑decade low.
  • Based on their modeling, heifer inventories will shrink by roughly another 800,000 head over the next two years before starting to rebound—assuming breeding patterns adjust.
  • At the same time, we’re in the middle of an historic 10‑billion‑dollar wave of dairy processing investment. New plants coming online through 2027, all of which will need more milk—and in many cases, more butterfat and protein—once they’re fully running. While plants are being built, the industry is cannibalizing the very ‘units of production’ (heifers) needed to fill them. It’s a collision course between steel and biology.
MetricCurrent State (2025)Projected Need (2027)Heifer Pipeline SupportGap / Risk
U.S. Dairy Herd9.4M cows9.5M–9.7M cows800,000 fewer heifers availableSHORTAGE: –2.5M gal/day by 2028
New Processing Capacity$10B investedAssumes +2–3M gal/day milkSupply assumption unmet
Annual Heifer Output Needed2.8–3.0M dairy calves3.2–3.4M dairy calvesBeef 35–40% of breedingDeficit: –300K–400K heifers/yr
Heifer Replacement Rate28–32% average32–35% neededCurrently 22–26% netCulls > freshening. Herd flat.
Heifer Price Impact$3,000–$3,500$4,000–$5,000 projectedLimited availabilityMargin erosion: +$1,000–$1,500

CoBank economist Tanner Ehmke put it bluntly: those new plants will require more annual milk and component production, and it’s going to take many more heifer calves in future years to bring the national herd back to where it needs to be. The thing is, It will be tight.

On the ground, what many producers are seeing matches that:

  • In 2024–2025, according to classifieds and sale reports, good Holstein and Jersey springers have commonly been listed in the 3,000–3,800‑dollar range, with high‑end animals bringing more where supply is really thin. In parts of the Upper Midwest, springers have been trading $200–400 above the national average in recent sales
  • CoBank reminds us that rebuilding the replacement pipeline is a “three‑plus year proposition” from the time you adjust your semen strategy to when that bigger wave of heifers actually freshens.

So right now we’ve got:

  • Beef‑on‑dairy calves are generating record checks in many barns.
  • Heifers are getting more expensive and, in some areas, genuinely hard to source.
  • Global beef supply easing a bit as Brazil grows, but domestic replacement supply staying tight.

That’s the setup most of us are working with.

Three Ways Dairies Are Playing the Dual‑Market Game

Talking with producers and advisors across different regions, you start to see some patterns in how herds are handling beef‑on‑dairy and replacements. These aren’t formal categories—just what I’ve observed.

1. The “Set It and Forget It” Approach

Plenty of herds—small, mid‑size, and big—land here:

  • At some point, they decided, “We’re a 40% beef herd,” or “We’ll breed 35–50% of cows to beef,” based on the calf checks and semen promotions at the time.
  • That percentage doesn’t move much unless something feels really broken—maybe calf prices collapse, or the vet mentions they’re running light on replacements.
  • They know roughly how many heifers are in the hutches, but there’s no regular projection of heifer inventory by age group against expected culls over the next 18–24 months.

And look, many of these operations used beef‑on‑dairy to get through some tough milk price years. When milk checks were barely covering feed, beef‑on‑dairy gave them non‑milk income they simply didn’t have before.

The risk is that, because biology runs on a long clock, you can slowly build a replacement deficit without feeling it—right up until you suddenly need 40 more springers than you’ve got coming.

2. The “Portfolio Managers.”

On the other end, there are herds—often 800 cows or more, though not always—that treat milk and cattle as one revenue and risk package.

What that typically looks like:

  • Quarterly breeding strategy meetings where they review heifer inventory by age band (0–3, 3–6, 6–12, 12–18, 18–24 months), target replacement rate (usually 28–32%), current beef‑on‑dairy calf prices, and recent heifer values from auctions.
  • Dynamic beef percentages. Instead of locking in 40% year‑round, they might run 20–25% when short on heifers and 30–35% when they’ve built a cushion.
  • Targeted semen use. Genomic tests to rank cows, then sexed semen for the top group and beef semen for lower‑index or problem cows.
  • Some are exploring tools like Livestock Risk Protection (LRP) for feeder cattle or talking to commodity brokers about limited CME feeder cattle futures.

Extension educators note that many larger, more risk‑focused herds use some form of forward pricing or revenue protection for a portion of their milk. A smaller but growing subset are starting to apply similar thinking to cattle revenue.

What you hear from managers in this group isn’t about hitting home runs—it’s about smoothing the ride so they can keep investing steadily in fresh cow management, dry cow facilities, and butterfat performance instead of lurching from crisis to crisis.

3. The Relationship‑Driven Opportunists

There’s also a healthy group—often 250‑ to 1,000‑cow family dairies—that lean less on spreadsheets and more on market relationships and timing.

Their system often looks like:

  • A standing weekly call with a trusted calf buyer: “What are you seeing? Are beef‑on‑dairy calves trading up, down, or sideways?”
  • Regular touchpoints with a heifer broker or custom grower: “What are folks paying for springers? How many do you have for Q1 next year?”
  • Ongoing conversation with their nutritionist about feed markets, including how Brazil’s growing grain exports are shaping costs.

When that three‑way radar starts blinking—calf prices softening, heifer bids climbing, feed markets shifting—they move quickly. Maybe they sell a group of calves a little early, grab springers out of a dispersal, or pull their beef percentage back sharply for a trimester.

The common thread among producers who operate this way? They’re willing to move when conditions change. It’s not about perfection—it’s about responsiveness.

The Two Mechanics That Really Matter

Once you get past the day‑to‑day, two things stand out as the real drivers of future pain or stability: biological lag and unhedged cattle revenue.

Biology Runs on a Two‑Year Clock

Every breeding decision is really a 24‑month decision, whether we think of it that way or not.

Here’s the rough math:

  • Day 0: You breed a cow—beef, conventional dairy, or sexed—based on today’s cash flow and cull list.
  • ~280 days later: A calf hits the ground. Beef‑cross bull? That’s a sale within days. Heifer? She heads into the replacement stream.
  • ~22–26 months after breeding: That heifer, if she makes it, walks into the parlor as a fresh cow and starts contributing to your milk and component pool.

CoBank and university extension educators have been clear on this: if the industry waits until heifer prices are screaming and auctions are thin to pull back on beef breedings, we’re reacting to a shortage set in motion a couple of years ago. Replenishing that pipeline is a multi‑year project, not a one‑season fix.

So when someone says, “We’ll cut back on beef when we really see heifer prices take off,” what they’re really saying is, “We’ll accept being behind for a couple of years before we start catching up.” That’s not necessarily wrong if you have strong access to outside replacements. But it’s important to see the trade‑off clearly.

Hedging Milk, Letting Cattle Ride

Here’s the other pattern that jumps out: how uneven our risk management has become.

On the milk side, many herds now use Dairy Revenue Protection (DRP) or LGM‑Dairy to cover a portion of their milk, or have forward contracts with their cooperative.

On the cattle side, it’s different. Even though beef‑on‑dairy calves and cull cows can represent a significant share of gross farm revenue—by some industry estimates, 10–15% or more on certain operations—relatively few dairies use formal tools like LRP, CME feeder cattle futures, or structured forward contracts in a consistent way.

And cattle markets still show their usual volatility. 20% price swings over a season aren’t unusual for feeder and live cattle futures.

For a 600‑cow herd, that might mean 250–300 beef‑on‑dairy calves a year at 1,200–1,400 dollars each, plus cull cow checks. Total cattle revenue in the low‑ to mid‑six figures. Leaving that entire stream unprotected while carefully hedging milk is a bit like putting a surge protector on your parlor controls but plugging the compressor straight into the wall.

Nobody needs to become a commodities trader. But it’s worth asking: is there room to set a floor under even 25–40% of that beef revenue, especially when prices look historically high?

From 90‑Day Survival to 24‑Month Planning

At the heart of all this is a basic question:

Are we making breeding and culling decisions based mainly on what we need this quarter, or on what we know we’ll need two years from now?

What 90‑Day Thinking Feels Like

Most of us have been there. Milk prices barely covering costs. Feed isn’t cheap. Loan renewal coming up. And you’re standing in the office thinking:

  • Beef semen costs a bit more per straw, but that crossbred calf brings three or four times what a Holstein bull would.
  • Raising every possible heifer feels like pouring expensive feed into animals you might not need.

So you push another 5–10 cows into the beef column. Understandable. You’re solving for cash flow.

The tough part is that you’re also chipping away at your 2027 and 2028 replacement pool. Unless you’ve got a clear plan—strong access to custom heifer growers, a standing agreement with a broker, confidence in cross‑border sourcing—those decisions add up.

What 24‑Month Thinking Looks Like

On herds that seem to navigate this with less drama, a few habits show up:

  • They know their replacement need. For example: 1,000 cows × 30% replacement rate = 300 heifers/year. About 25 freshening per month just to stay flat.
  • They know their pipeline. How many heifers are in each age band? How many are due to freshen each month over the next year?
  • They connect that to breeding. Before deciding “35% beef for six months,” they ask, “What does our January 2028 heifer count look like if we do that?”

Once you put those numbers on one page, many decisions become clearer. You might still run 30% beef because your region has decent heifer access. But you’ll be doing it with eyes open.

A Simple Tool: The 24‑Month Replacement Dashboard

So let’s talk about something practical you can do this month that doesn’t require a consultant or fancy software.

MetricCurrent Herd (2025)Conservative Scenario (25% Beef)Balanced Scenario (35% Beef)Aggressive Scenario (45% Beef)Projected Status (2027)
Milking Cows700700700700
Annual Replacement Need210 (30% cull)210210210210
Dairy Breedings (%) / Year75%65%55%
Beef Breedings (%) / Year25%35%45%
Expected Heifer Calves / Year210–215185–190160–165
Projected Heifer Inventory (18–24mo, 2027)180–195215–225185–195155–165 (–45 SHORT)Shortfall cost: $3,500 × 45 = $157,500

Think of it as a 24‑month replacement dashboard—a one‑page reality check you update monthly.

What This Usually Includes

  1. Basic herd math.
    1. Current milking + dry cows.
    1. Target replacement rate (26–32%, depending on culling and growth).
    1. Annual and monthly replacement needs.
  2. Heifer inventory by age.
    1. 0–3 months, 3–6 months, 6–12, 12–18, 18–24 months.
    1. Apply a reasonable pre‑fresh attrition factor—many extension sources use 6–10% based on historical data.
  3. Projected heifer calf output.
    1. Monthly dairy breedings with conventional semen × conception rate × ~48% female ratio.
    1. Monthly dairy breedings with sexed semen × conception rate × 70–90% female ratio (varies by bull and program).
    1. Beef breedings counted as zero heifers.
  4. A simple projection.
    1. For each month over the next 18–24 months, how many heifers are scheduled to freshen?
    1. Compare that to your replacement needs.

Several land‑grant extension bulletins use similar frameworks for “raise vs. buy” decisions. The key is making the future visible in a way that’s easy to revisit.

How It Changes the Conversation

Once that’s on the wall in your office:

  • When your AI tech asks, “How many are we doing beef this month?”, you’re not guessing. You can say, “We’re 40 heifers short 18 months out. Let’s pull beef back a few points and revisit in 30 days.”
  • When your lender comes by, you can show them exactly why you’re trimming beef breeding—to avoid an ugly replacement bill in two years. That goes over better than a surprise heifer spending spree later.
  • When calf prices spike, you’ve got context. Heifer‑long? Maybe bump beef to capture those checks. Heifer‑short? Resist the urge to chase every dollar.

This tool doesn’t make decisions for you. It just prevents the “I didn’t realize it was that bad” moment that’s put more than a few herds in a bind.

Here’s an example of how this plays out: A herd running around 700 cows might build a simple spreadsheet version and discover they’re on track to be 40–50 heifers short in 20 months. Rather than slamming on the brakes, they trim beef breeding by 5–7 points over two quarters and push more sexed semen on top cows. A year later, they’re almost exactly on target—and they never had to scramble for expensive springers.

Not Everyone Sees the “Crisis” the Same Way

It’s worth noting that not all experts agree on how severe or long‑lasting the replacement squeeze will be.

  • CoBank sees a clear, multi‑year shortage keeping a lid on how quickly U.S. milk output can grow, especially as new plants come online.
  • Some producers, especially in regions with strong custom heifer grower networks—think parts of Wisconsin, New York, or Quebec—argue that while things are tighter, they’re not in crisis mode. They point to increased sexed‑semen use on top cows, growing interest in contract‑raising, and potential to import replacements when prices justify it (though that brings disease, adaptation, and logistics questions).

There’s also a valid point that some of this shortfall is a correction from years when we over‑raised marginal heifers with little genetic upside. Some industry observers have noted that a chunk of this is the industry finally being more selective—and that’s healthy. The trick is not overshooting the mark.

From a practical standpoint, the takeaway isn’t that you must agree with the most pessimistic forecast. It’s that you probably can’t afford to ignore the possibility that replacements stay tight and expensive while new processing capacity ramps up. A simple dashboard lets you stress‑test your own farm against both scenarios.

Practical Takeaways

So what can you actually do with all this? Here are a few points to chew on.

1. Treat Cattle Checks as Core Business

If beef‑on‑dairy calves plus cull cows bring in a significant share of your revenue, it’s time to:

  • Track that income as its own line in your financials.
  • Ask about tools like LRP feeder cattle coverage or forward‑price agreements with trusted buyers.
  • You don’t have to hedge every animal. Even protecting 25–40% can take a lot of edge off.

2. Make Replacements a Standing Agenda Item

Before setting this year’s beef percentage, take one evening to:

  • Write down current cow numbers and a realistic replacement rate.
  • Pull the heifer inventory by age group.
  • Sketch a rough 18–24 month projection.

Then ask directly: “If we keep breeding 40% beef, do we have a plan—and capital—to buy the heifers we’ll be short?”

3. Adjust in Steps, Not Swings

If you’re on track to be 50 heifers short two years out, you don’t have to yank the wheel:

  • Drop beef breedings by 3–5 points this trimester.
  • Shift more sexed semen onto your best genomic cows.
  • Re‑evaluate quarterly.

Gradual change is usually more realistic and easier on cash flow than dramatic one‑time shifts.

4. Bring Your Lender In Early

Most farm credit officers are reading CoBank and our own analysis—they know the heifer story. What they don’t always know is how you’re thinking about it.

Show them a simple replacement projection and a modest rebalancing plan. You’re more likely to get support for small proactive adjustments than for emergency financing later.

5. Respect Regional Realities

What makes sense on a 3,000‑cow dry lot in western Kansas isn’t identical to a 300‑cow tie‑stall in eastern Ontario or a 1,200‑cow free‑stall in Wisconsin.

  • In some western regions, access to custom heifer raisers changes the calculus.
  • In parts of the Northeast and the Upper Midwest, strong local demand can push heifer prices above the national average.
  • In quota systems like Quebec or Ontario, butterfat incentives may tilt decisions toward maximizing fresh cow performance rather than just head count.

The point isn’t to copy your neighbor’s beef percentage. It’s to understand how your replacement pipeline, local markets, and processor signals fit together.

Managing the Whole Game

What’s become clear is that beef‑on‑dairy is here to stay. Peer‑reviewed work in Translational Animal Science and Journal of Dairy Science confirms what the market already knew: beef × dairy calves are now a recognized, important part of the North American beef supply chain.

That’s good news. There’s real value on the table, and it’s helping a lot of dairies keep doors open and invest in what matters—better fresh-cow facilities, healthier transition programs, more comfortable housing, improved butterfat performance.

At the same time, reports from CoBank remind us we can’t pull replacements out of thin air. If everyone leans too hard into beef‑on‑dairy at once, the industry doesn’t magically get the heifers it needs in 2027 or 2028. Somebody ends up short—and often it’s the operations that didn’t see the shortfall coming.

The goal here isn’t to scare anyone away from beef‑on‑dairy. It’s to help you turn today’s beef premiums into durable, long‑term profit—without waking up two years from now wondering where the replacements went.

If there’s one step worth taking in the next 30 days:

  • Put your current heifer numbers and realistic replacement needs on a single page.
  • Project them out 18–24 months.
  • Let that picture have a real say in how much beef semen you use this year.

It doesn’t require perfect data. Just honest numbers. And that quiet little habit is often what separates the herds that “manage to get by” from the ones that keep growing and improving—no matter what Brazil, the cattle futures, or the next drought throws at them.

At The Bullvine, we’ll keep tracking these shifts so you’ve got the information and tools you need to play the whole game, not just the next move.

Key Takeaways:

  • $1,400 calves today, $3,500 heifers in 2027: The beef-on-dairy math only works if your replacement pipeline can handle it—and for many herds, it can’t
  • The shortage is already locked in: U.S. heifer inventories hit a 20-year low, CoBank projects 800,000 head short by 2027, and new processing plants are coming online hungry for milk
  • Every breeding decision is a 24-month bet: By the time heifer prices scream, the shortage was set two years ago—waiting for signals means you’re already behind
  • Adjust in steps, not panic: Dropping beef semen 3-5 points per quarter protects your pipeline without blowing up this year’s cash flow
  • A one-page dashboard can save you six figures: Track heifers by age against replacement needs monthly, and you’ll see the gap before it becomes a $3,500-per-head crisis

Complete references and supporting documentation are available upon request by contacting the editorial team at editor@thebullvine.com.

Learn More

The Sunday Read Dairy Professionals Don’t Skip.

Every week, thousands of producers, breeders, and industry insiders open Bullvine Weekly for genetics insights, market shifts, and profit strategies they won’t find anywhere else. One email. Five minutes. Smarter decisions all week.

NewsSubscribe
First
Last
Consent

Dairy Heifer Shortage Deepens as Beef-Cross Calves Gain Market Share

Record-low dairy heifer numbers and soaring beef-cross calf prices are reshaping the U.S. dairy landscape. As farmers embrace profitable beef-on-dairy breeding, with crossbred calves fetching nearly $300 more than Holsteins, the industry faces tough choices between immediate profits and future milk production.

Summary:

The U.S. dairy industry faces a critical turning point as heifer inventories hit a 47-year low of 3.914 million head, down 0.9% from last year. This shortage, driven by farmers increasingly breeding dairy cows with beef bulls for premium calf prices, threatens to constrain future milk production growth. While beef-cross calves command nearly $300 more per head than purebred Holsteins at auction, this profitable trend creates a challenging balance between immediate returns and long-term sustainability. Adding to these concerns, potential 25% tariffs on trade with Mexico and Canada could disrupt crucial export markets, forcing dairy producers to carefully weigh their breeding strategies and market approaches in an increasingly complex industry landscape.

Key Takeaways:

  • The U.S. dairy sector faces a 47-year low in dairy heifer inventories, complicating future milk production growth.
  • Beef-cross calves are gaining traction, selling for higher prices than traditional Holsteins, affecting the availability of pure dairy replacements.
  • Retaliatory tariffs from Canada and Mexico in response to U.S. policy changes could disrupt dairy export markets.
  • The ongoing shortage urges farmers to innovate and find solutions that balance immediate gains with sustainable growth.
  • Dairy farmers are encouraged to focus on enhancing herd productivity, considering careful breeding, and exploring new export markets.
dairy heifer inventory, beef-cross calf prices, U.S. dairy industry, milk production sustainability, export market challenges

The U.S. dairy landscape faces an unprecedented transformation. Heifer inventories hit a 47-year low of 3.914 million head, down 0.9% from last year. With crossbred calves commanding nearly $300 more than purebred Holsteins, producers must balance lucrative beef-cross opportunities against future milk production capacity. 

Current Inventory Crisis 

YearDairy Heifers (Million Head)% Change from Previous Year
20204.34
20214.25-2.07%
20224.15-2.35%
20234.07-1.93%
20244.06-0.25%

“Farmers are now trying to decide how long to keep a cow. These cows are paid to produce milk, yet they’re worth as much as beef. You cannot afford to have any die on the farm.”— Gary Sipiorski, Independent Dairy Financial Advisor

Market Economics 

Calf TypeAverage Price (USD)Premium Over Dairy
Holstein Bull$703.75
Beef-Cross Bull$986.43+40%

The beef-on-dairy strategy offers immediate financial rewards but creates long-term challenges. While crossbred calves command significant premiums, the USDA projects only 2.5 million replacement heifers will enter milking herds in 2025—insufficient to maintain current production levels. 

“Beef-on-dairy calves showcase an opportunity to tell a sustainable story of productivity and efficiency. Their feed efficiency significantly reduces greenhouse gas emissions.”— Dr. Dale Woerner, Meat Scientist, Texas Tech University

Export Market Challenges 

Current Export Data (Jan-Nov 2024) 

  • Mexico: $2.25b (30% of U.S. dairy exports)
  • Canada: $1.1b (14% of exports)

President Trump’s proposed 25% tariffs on Canadian/Mexican imports threaten to disrupt crucial export markets. Industry analysts project: 

  • 15-20% reduction in cheese export volumes
  • 1.2b pounds increase in domestic dairy surplus
  • $0.50/cwt decrease in farmgate milk prices

“If these tariffs take effect, Mexican buyers could pivot to EU suppliers. Our logistical advantage erodes when facing 25% price hikes.”— Dr. Emily Chen, Agricultural Economist

Strategic Adaptation 

StrategyKey BenefitImplementation Timeline
Precision Herd Management+12% Milk Yield per Cow6-18 Months
Strategic Beef-Cross Breeding+$280/Calf RevenueImmediate
Export Market DiversificationReduce Mexico/Canada Reliance2-3 Years

Market Outlook 2025-2026 

IndicatorCurrent12-Month Forecast
Heifer Inventory3.914m3.85m (-1.6%)
Milk Production227.5b lbs225.8b lbs
Beef-Cross Premium$282/head$290-310/head

Action Items for Producers 

  • Inventory Management
    • Calculate replacement needs through 2026
    • Review breeding programs
    • Evaluate herd demographics
  • Market Positioning
    • Secure export contracts before tariff implementation
    • Explore alternative markets
    • Consider value-added processing
  • Genetic Strategy
    • Balance beef-cross with dairy genetics
    • Implement targeted use of sexed semen
    • Select for longevity traits

“Most farms have fallen so in love with producing beef-on-dairy that they don’t have the replacement heifers needed.”— Dr. Geoff Smith, Dairy Technical Services Veterinarian, Zoetis

The Bottom Line

The dairy industry stands at a pivotal crossroads, balancing lucrative beef-cross opportunities against sustainable milk production capacity. With heifer inventories projected to decline another 1.6% by 2025 and export markets facing potential disruption, producers must carefully weigh short-term profits against long-term sustainability. Success will depend on implementing data-driven breeding decisions, maintaining flexible marketing strategies, and building strong replacement heifer programs. Share your operation’s strategy for navigating these challenges in the comments below.

Learn more:

Join the Revolution!

Bullvine Daily is your essential e-zine for staying ahead in the dairy industry. With over 30,000 subscribers, we bring you the week’s top news, helping you manage tasks efficiently. Stay informed about milk production, tech adoption, and more, so you can concentrate on your dairy operations. 

NewsSubscribe
First
Last
Consent
Send this to a friend