Archive for dairy cost reduction

The $42,000 Transition Mistake: Why Blanket Protocols Are Failing Your Best Cows

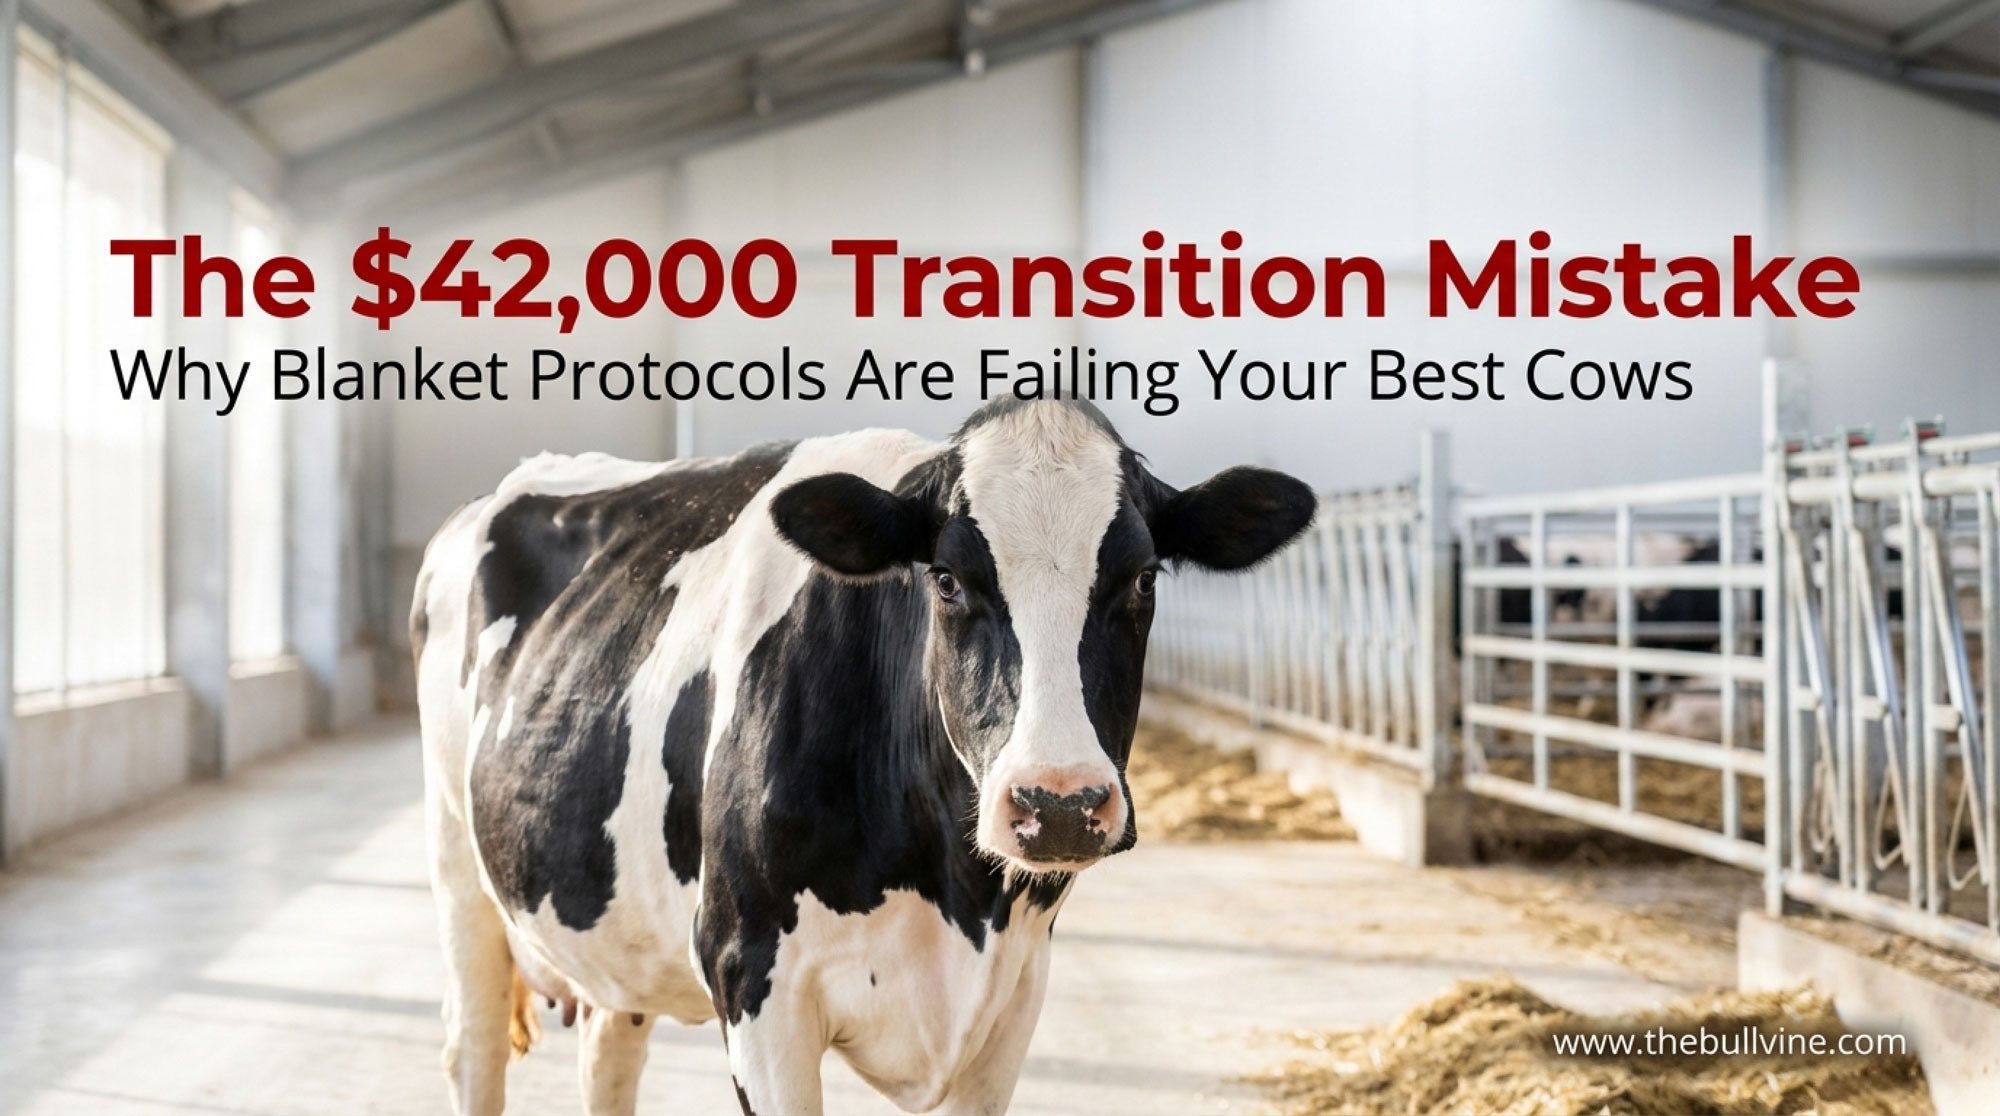
What if your transition disease rate isn’t 20%—it’s 35%? That measurement gap costs $42K/year. Worse: your best cows pay the genetic price.

EXECUTIVE SUMMARY: Most dairy operations estimate their transition disease rate at 20%—but farms that actually measure often find it’s closer to 35%. That gap represents roughly $42,000 in annual losses on a 400-cow dairy: lost milk, extra treatments, reproductive delays, and elite cows that never reach their genetic potential. The research points to a clear fix. Work from Guelph, Minnesota, Ohio State, and Wisconsin Extension consistently shows that risk-stratified protocols outperform blanket approaches—intensive care for high-risk mature cows, reduced spending on heifers who don’t need it. The numbers back it up: $500 per disease case, $1,000 for multiple diseases, and subclinical hypocalcemia hitting 73% of mature cows at $150 each. For operations investing in superior genetics, every cow that struggles through transition is a cow whose breeding value may never reach the bulk tank—or produce the next generation of your herd’s best females. The research-backed first step? Stop bolusing first-lactation heifers and redirect those resources where they’ll actually make a difference.

transition cow management

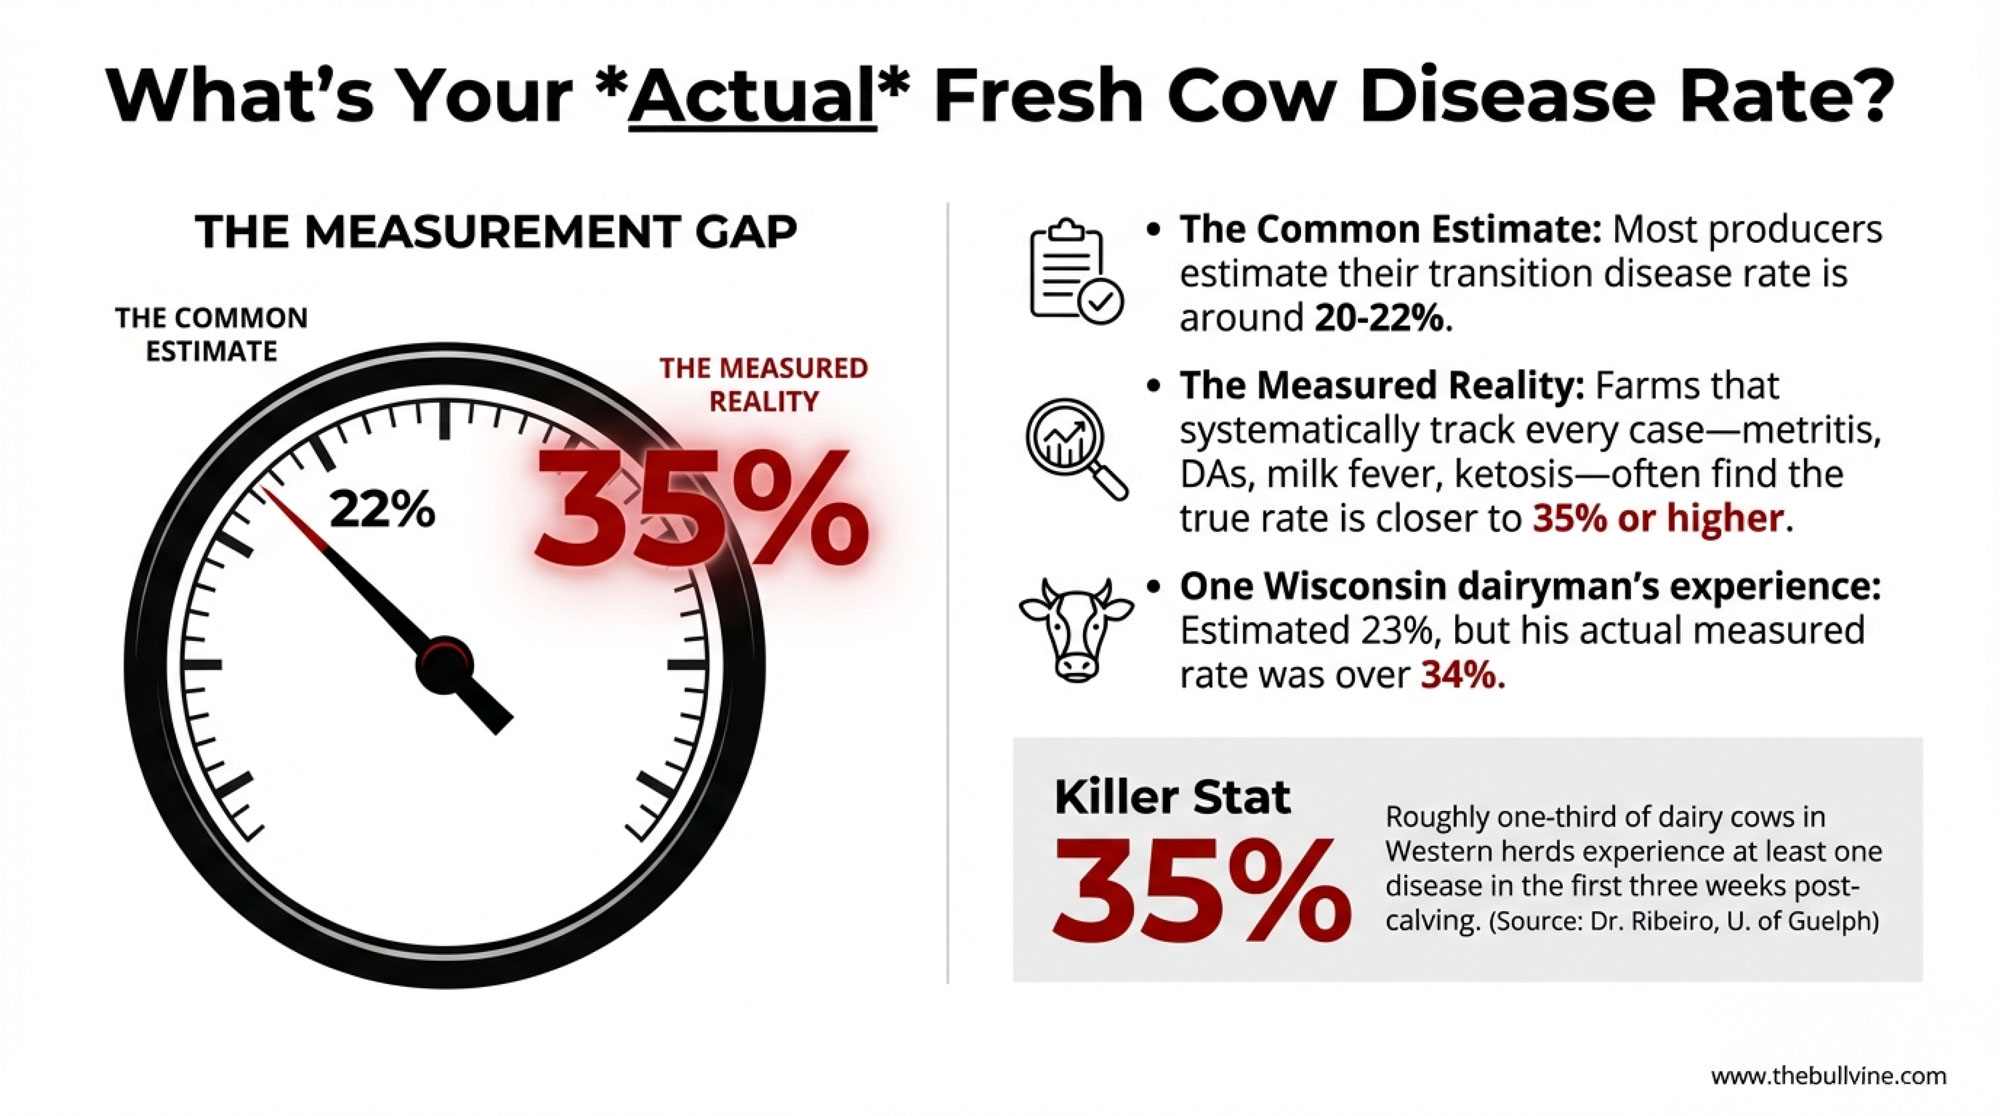
Here’s something that catches a lot of producers off guard. Walk into almost any dairy operation—doesn’t matter if it’s a 200-cow tie-stall in Vermont, a 3,000-cow freestall in California’s Central Valley, or a grazing operation in New Zealand—and ask about fresh cow disease rate. You’ll probably hear something like “Oh, we’re running around 20%, maybe 22%.” Reasonable estimate. Feels about right based on what they’re seeing day to day.

But when farms actually start measuring… well, that’s when things get interesting.

I’ve heard from producers who decided to track every single fresh cow event for 90 days—metritis cases, DAs, milk fever, ketosis treatments, all of it—and discovered their numbers were way off. One Wisconsin dairyman figured he was running about 23%. His actual number? North of 34%. And he’s not alone. When farms start systematically tracking every treatment event, every cow that doesn’t quite hit her stride in early lactation, that 20% estimate often turns out to be closer to 30% or higher.

Farm Type & RegionProducer’s EstimateActual Measured RateDisease Rate GapAnnual Cost Gap (400-cow herd)
200-cow tie-stall, Vermont20%34%+14 percentage points$39,200
400-cow freestall, Wisconsin22%35%+13 percentage points$36,400
800-cow freestall, Minnesota18%31%+13 percentage points$72,800
3,000-cow freestall, California21%33%+12 percentage points$252,000
600-cow grazing operation, New Zealand19%29%+10 percentage points$42,000

Dr. Eduardo de Souza Ribeiro, over at the University of Guelph, puts it pretty directly: cows with a poorer transition produce less milk, take longer to get pregnant, and are more likely to lose a pregnancy or be culled from the herd. That adds up to substantial economic losses. And here’s what’s sobering—his review of the research, published in Dairy Global, found that roughly one-third of dairy cows in Western herds experience at least one disease process in the first three weeks after calving. That’s not outliers. That’s typical across the industry.

So what does that cost? Work by Carvalho and colleagues back in 2019 tried to put a price tag on it, estimating about $500 for a single postpartum disease case and around $1,000 when a cow has multiple problems during that critical window. On a 400-cow dairy, it doesn’t take many extra disease cases to add up to tens of thousands of dollars in lost milk, extra treatments, and reproductive delays—even if the exact number varies by herd and region.

What’s interesting—and honestly, a bit frustrating—is that the research showing how to cut those disease rates significantly has been accumulating for over two decades. The barrier isn’t knowledge. It’s how that knowledge moves (or doesn’t) from research journals to actual farm practice.

“You can have the best genetics in the world, but if your cows can’t get through transition healthy, you’ll never see that potential expressed in the bulk tank or the breeding program.”

The Measurement Gap Nobody Talks About

The foundation of any improvement starts with a surprisingly basic question: What’s your actual disease rate?

You know, most dairies have never systematically answered this. They track individual treatments, sure. They know when a cow develops metritis or throws a DA. But calculating an overall incidence rate—the percentage of cows experiencing any metabolic or reproductive disease in the first 21 days—that’s different. And without that number, you’re essentially flying blind.

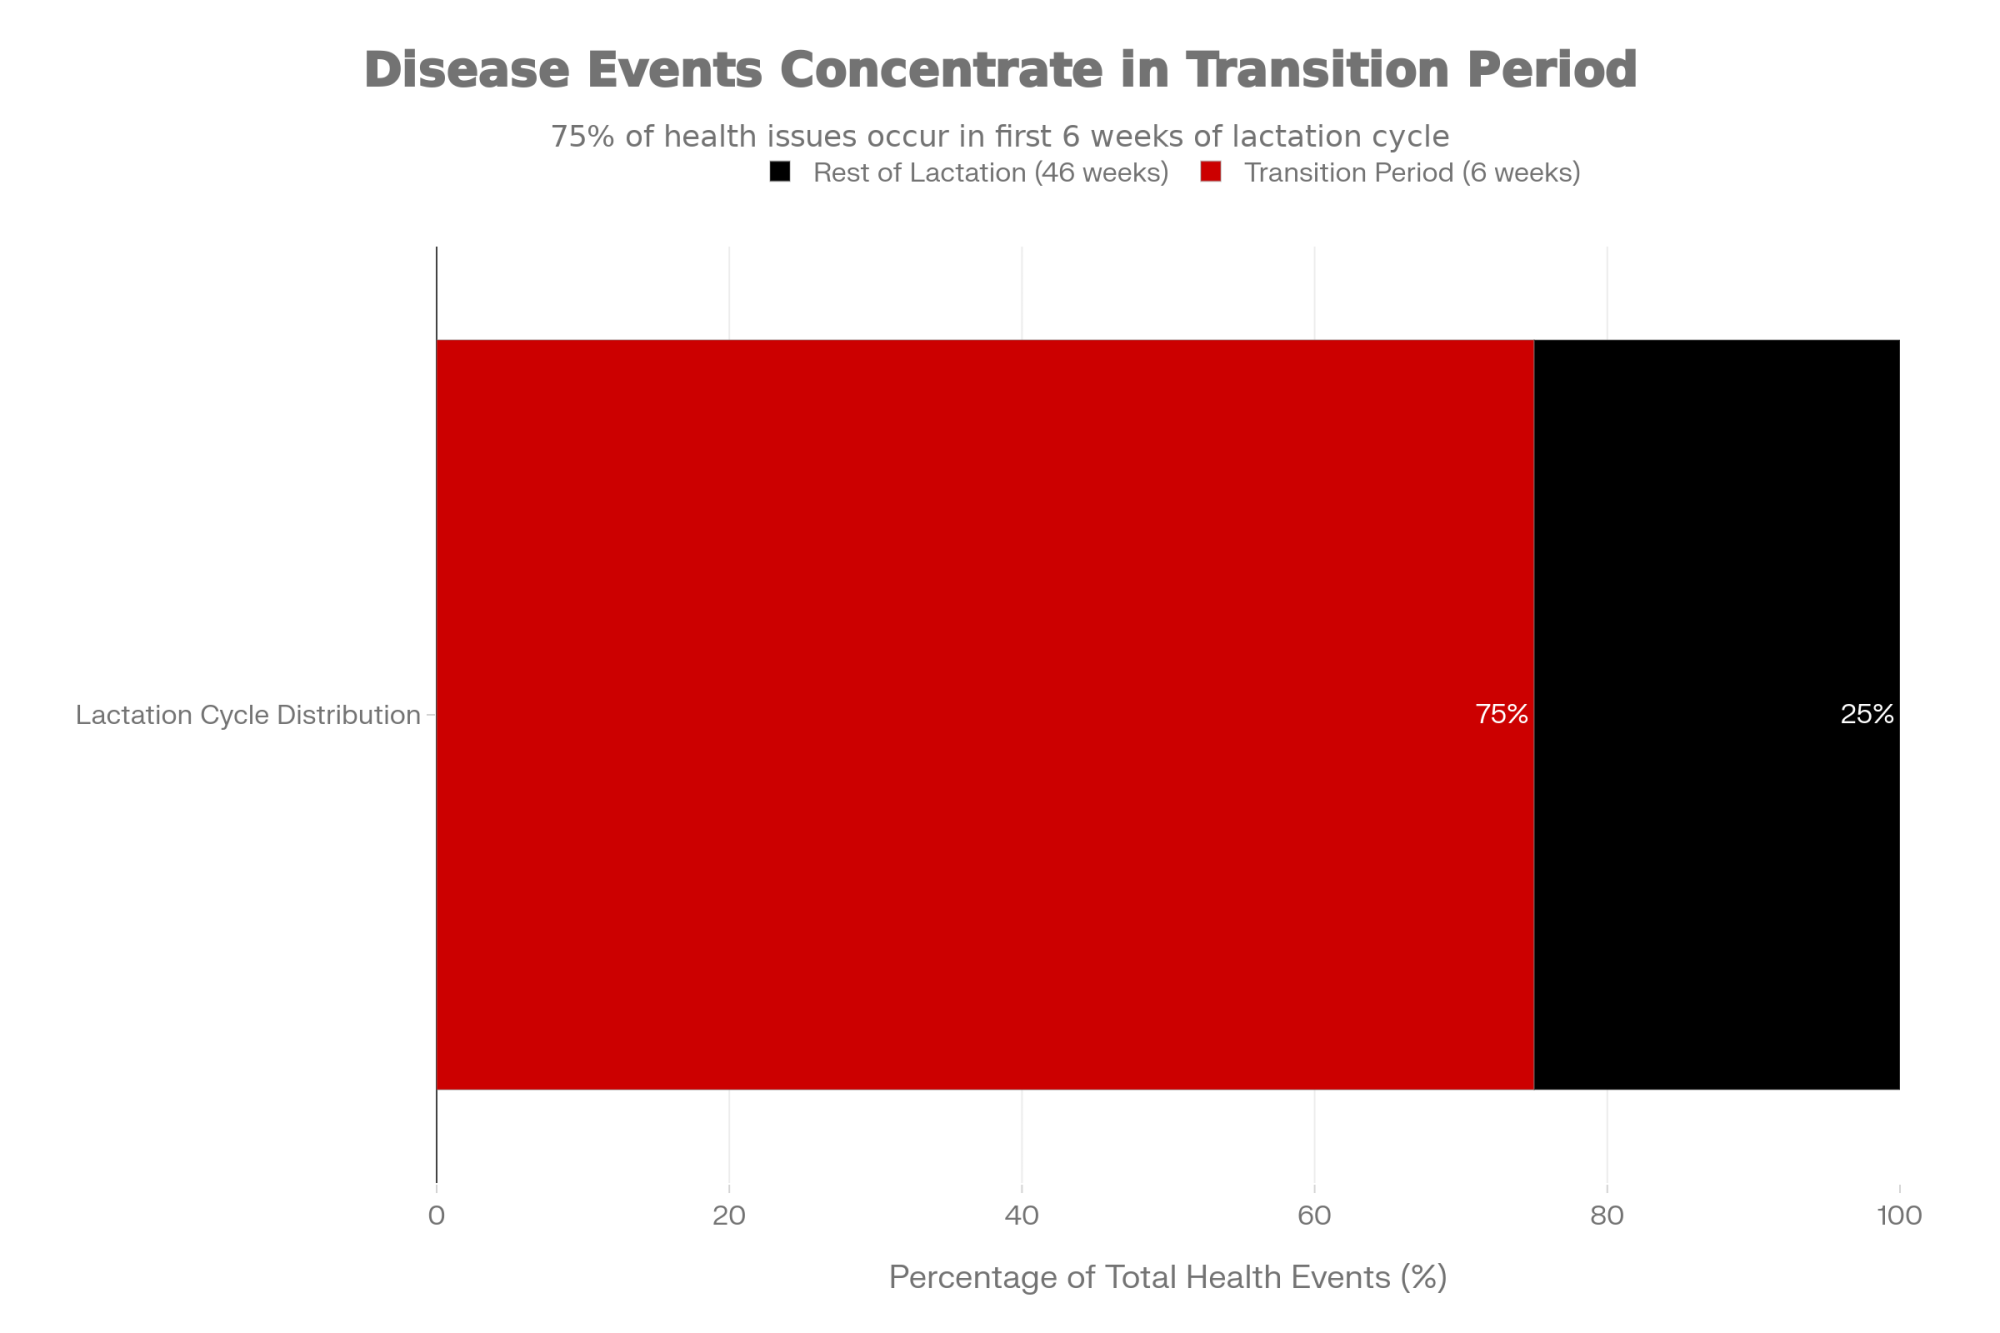
Why does this matter so much? Multiple sources—University of Maryland Extension, Dairy Global, research published in Frontiers in Veterinary Science—all point to the same finding: about 75% of health problems in dairy cows occur during the transition period. That’s the window from roughly two weeks before calving to four weeks after. Three-quarters of your health challenges, concentrated in about six weeks. That’s a massive concentration of risk in a pretty short timeframe, whether you’re running a confinement operation in the Midwest or a pasture-based system in the Southeast.

When farms start systematically tracking, many discover their disease rates are higher than they’d estimated. A 2019 study in the Journal of Dairy Science looked specifically at barriers to successful transition management and found that variation in both farmer attitude and veterinarian involvement significantly affects outcomes. One of the key barriers they identified? Simply not having a clear picture of what’s actually happening. Hard to fix a problem you haven’t quantified.

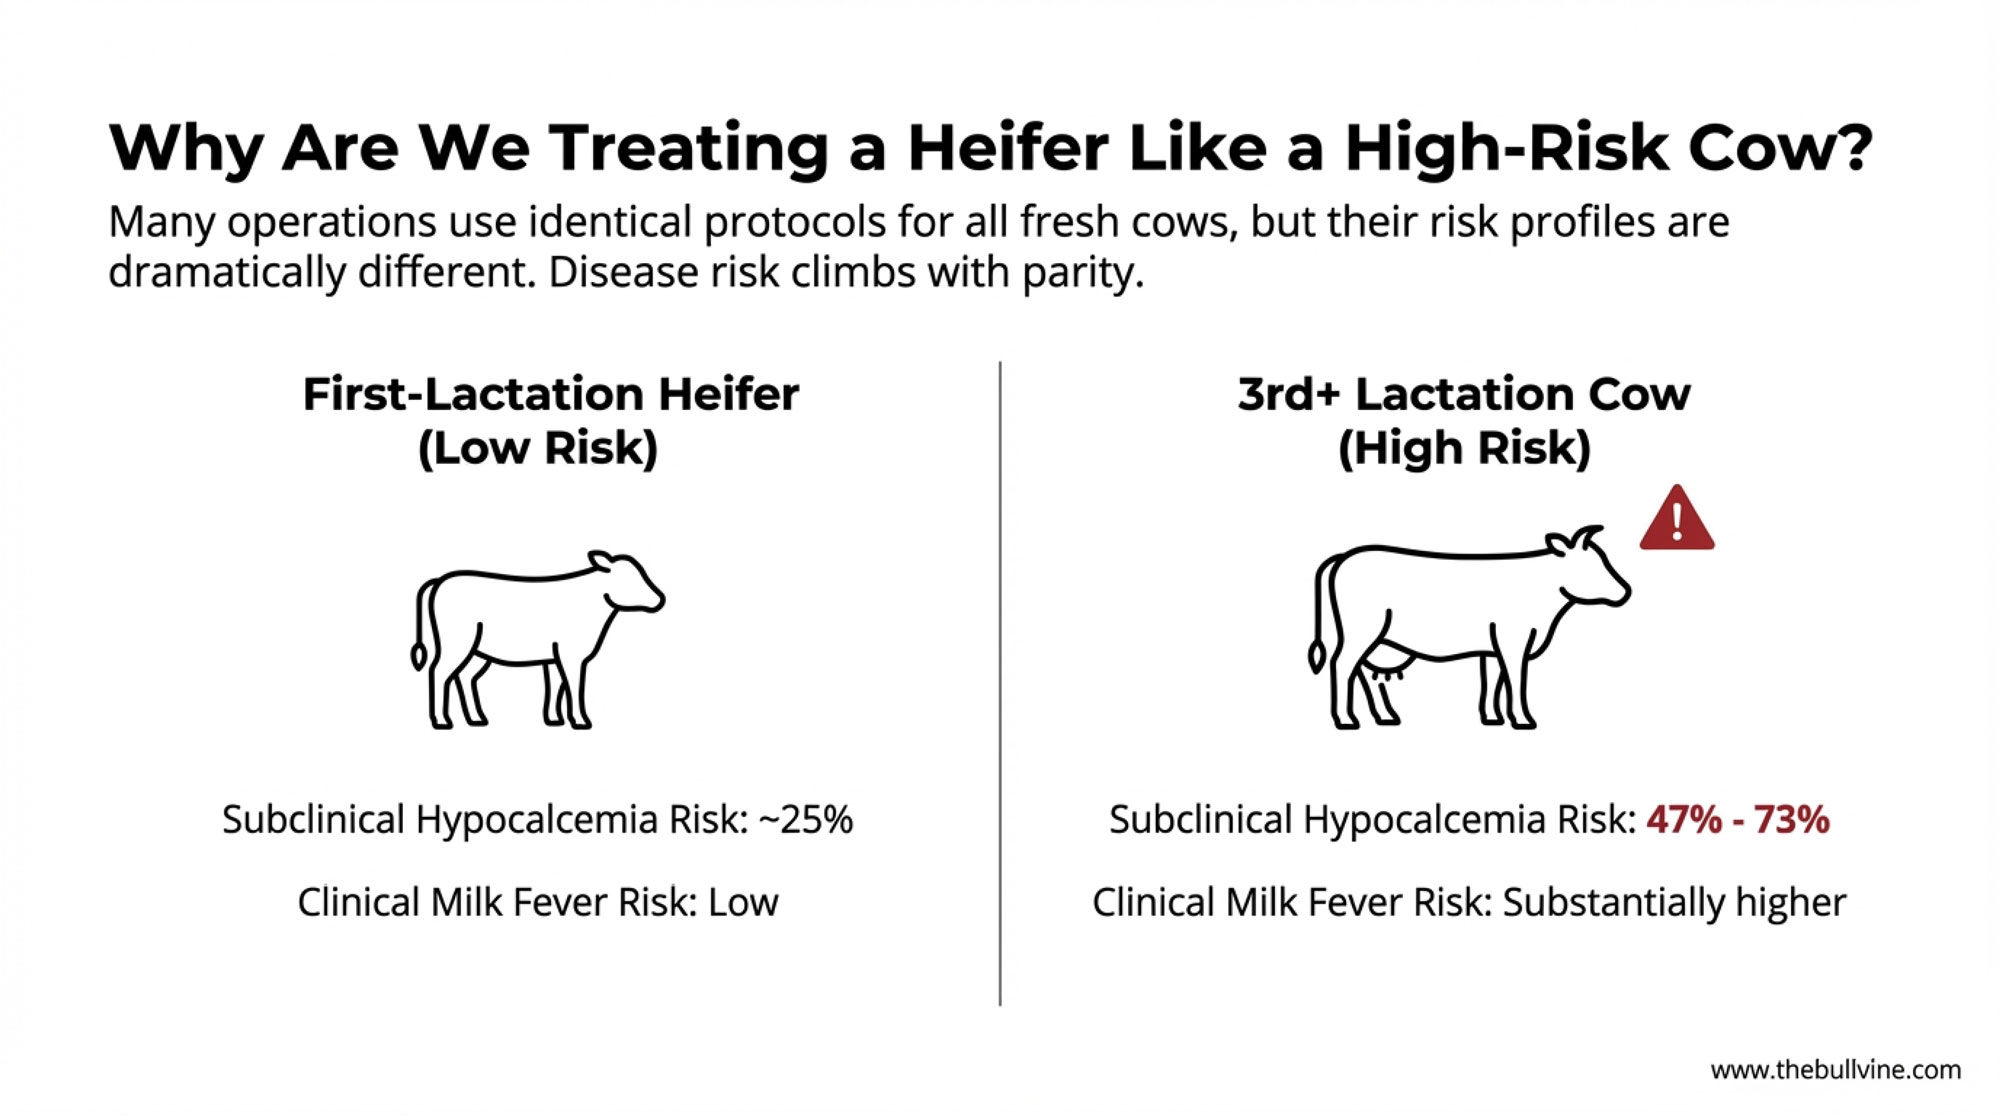
Now, break down the disease by parity, and the picture gets even clearer. This is where it gets really practical for protocol decisions. Field data and NAHMS surveys consistently show that disease risk climbs with parity—first-lactation animals typically have substantially lower rates of metabolic and reproductive disease than third- and fourth-lactation cows. Research showed subclinical hypocalcemia affecting around 47% of second-or-greater lactation cows but only about 25% of first-lactation heifers. Clinical milk fever follows the same pattern—it’s far more common in older cows than in first-lactation animals.
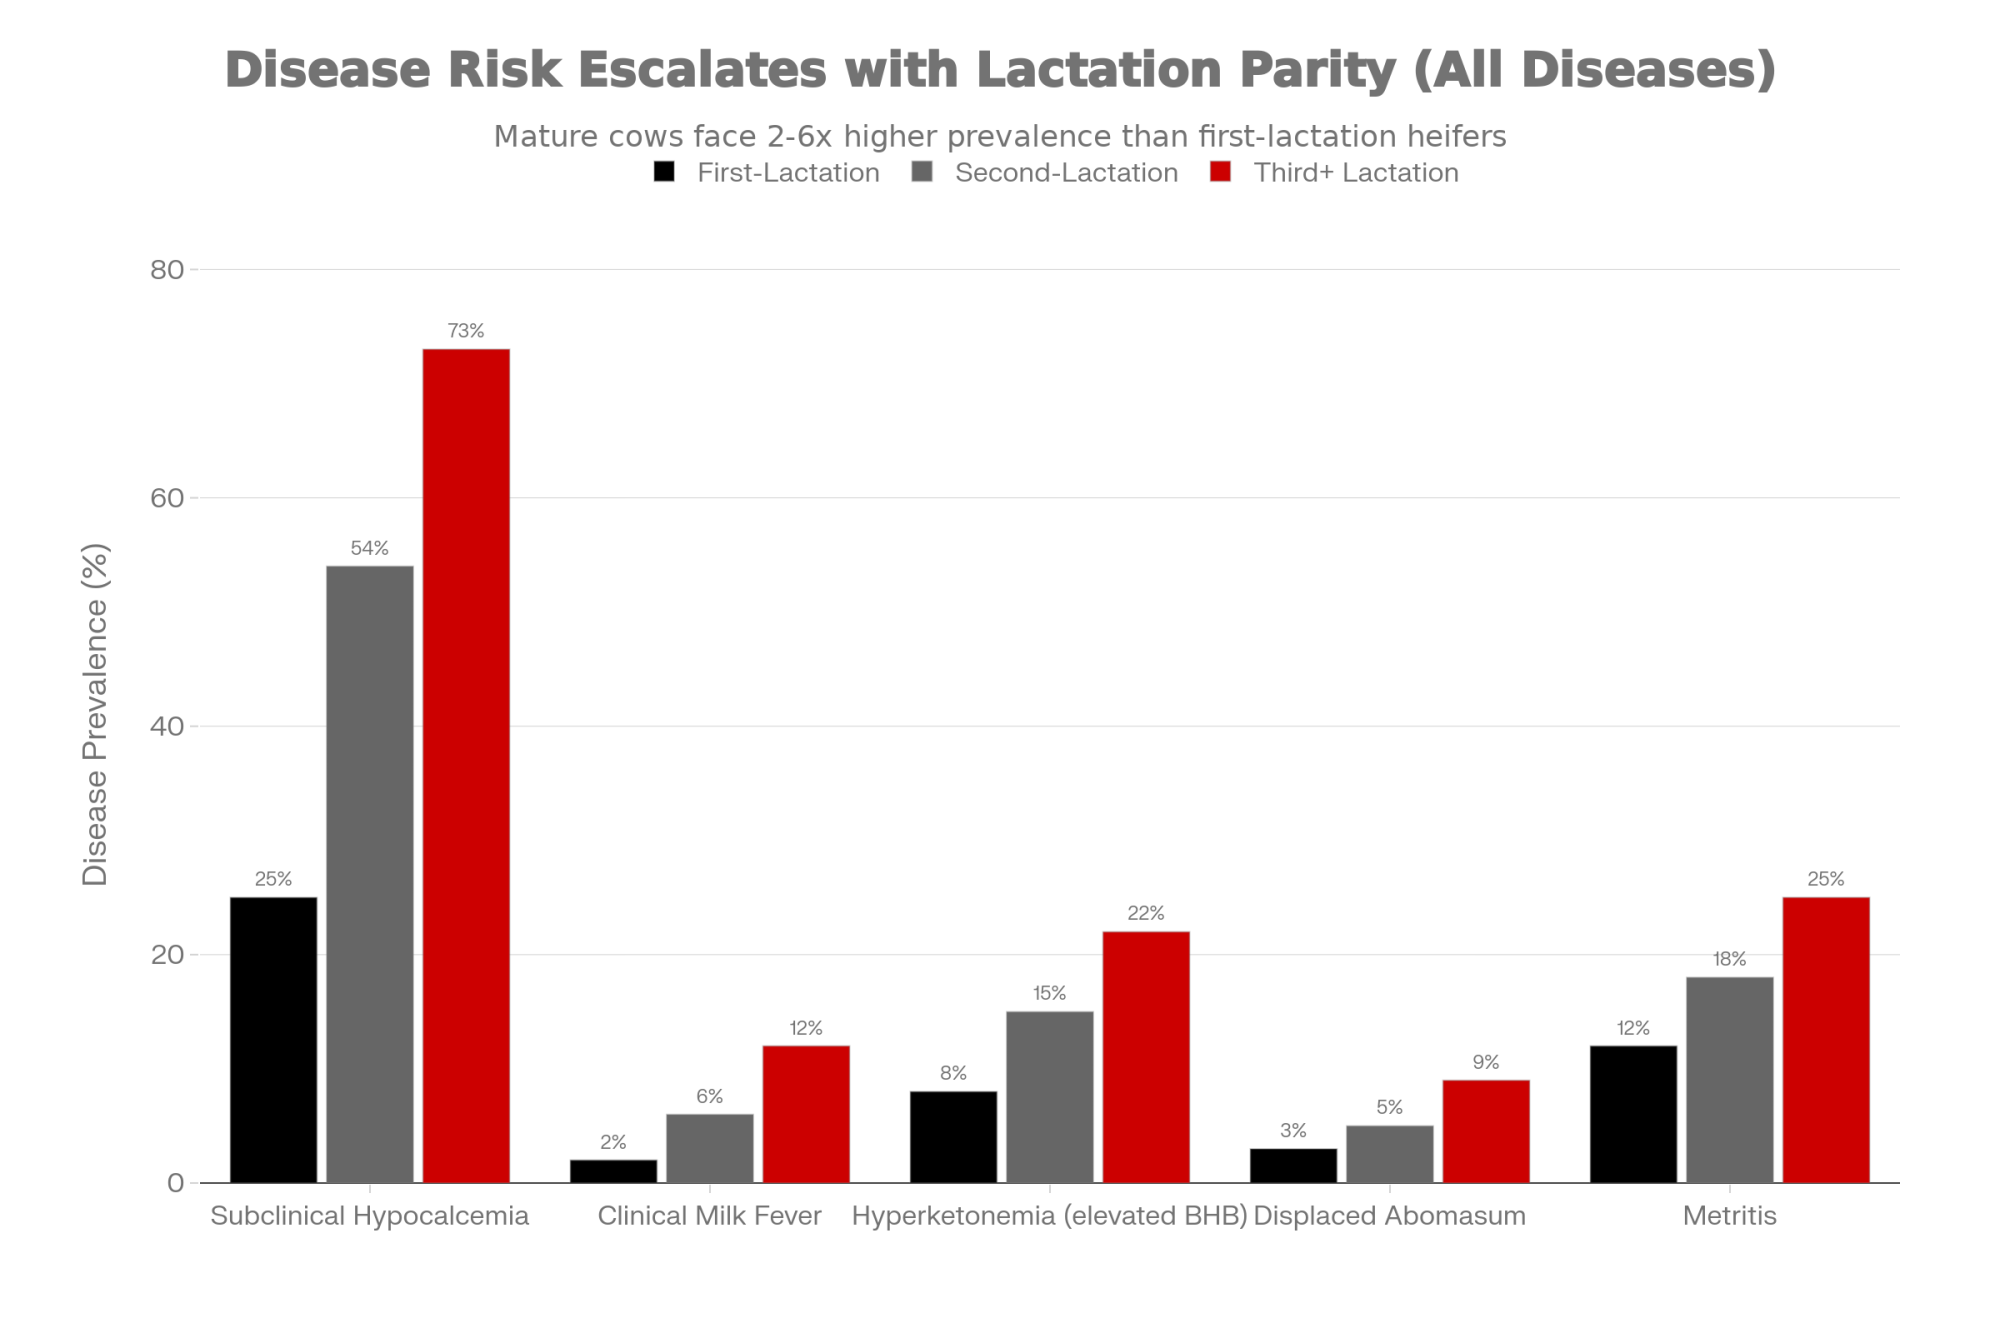
Disease TypeFirst-Lactation HeifersSecond-Lactation CowsThird+ Lactation CowsRisk Multiplier (3rd+ vs. 1st)
Subclinical Hypocalcemia25%54%73%2.9×
Clinical Milk Fever2%6%12%6.0×
Hyperketonemia (elevated BHB)8%15%22%2.8×
Displaced Abomasum3%5%9%3.0×
Metritis12%18%25%2.1×
Average Treatment Cost/Cow$82$156$2473.0×

Here’s what that tells us: many operations treat all fresh cows identically—same calcium bolus protocol, same propylene glycol regimen, same monitoring intensity. But different animals have dramatically different risk profiles. And the research is pretty clear that they respond differently to interventions too. So why are we treating a first-calf heifer the same as a fourth-lactation cow? That’s the question worth asking.

What the Research Actually Shows

The scientific literature on transition cow management has reached a level of maturity that’s frankly unusual in agricultural research. We’re not talking about preliminary findings or single studies here. We’re talking about meta-analyses combining decades of data from operations across North America, Europe, and beyond.

On calcium supplementation: Research consistently shows multiparous cows benefit significantly from calcium support, while first-lactation heifers show minimal response. A 2024 review in the journal Animals noted that dairy cows are at considerable risk for hypocalcemia at the onset of lactation, when daily calcium excretion suddenly increases from about 10 grams to 30 grams per day. Think about that—tripling calcium output almost overnight. But—and this is important—that risk concentrates heavily in mature cows, not heifers.

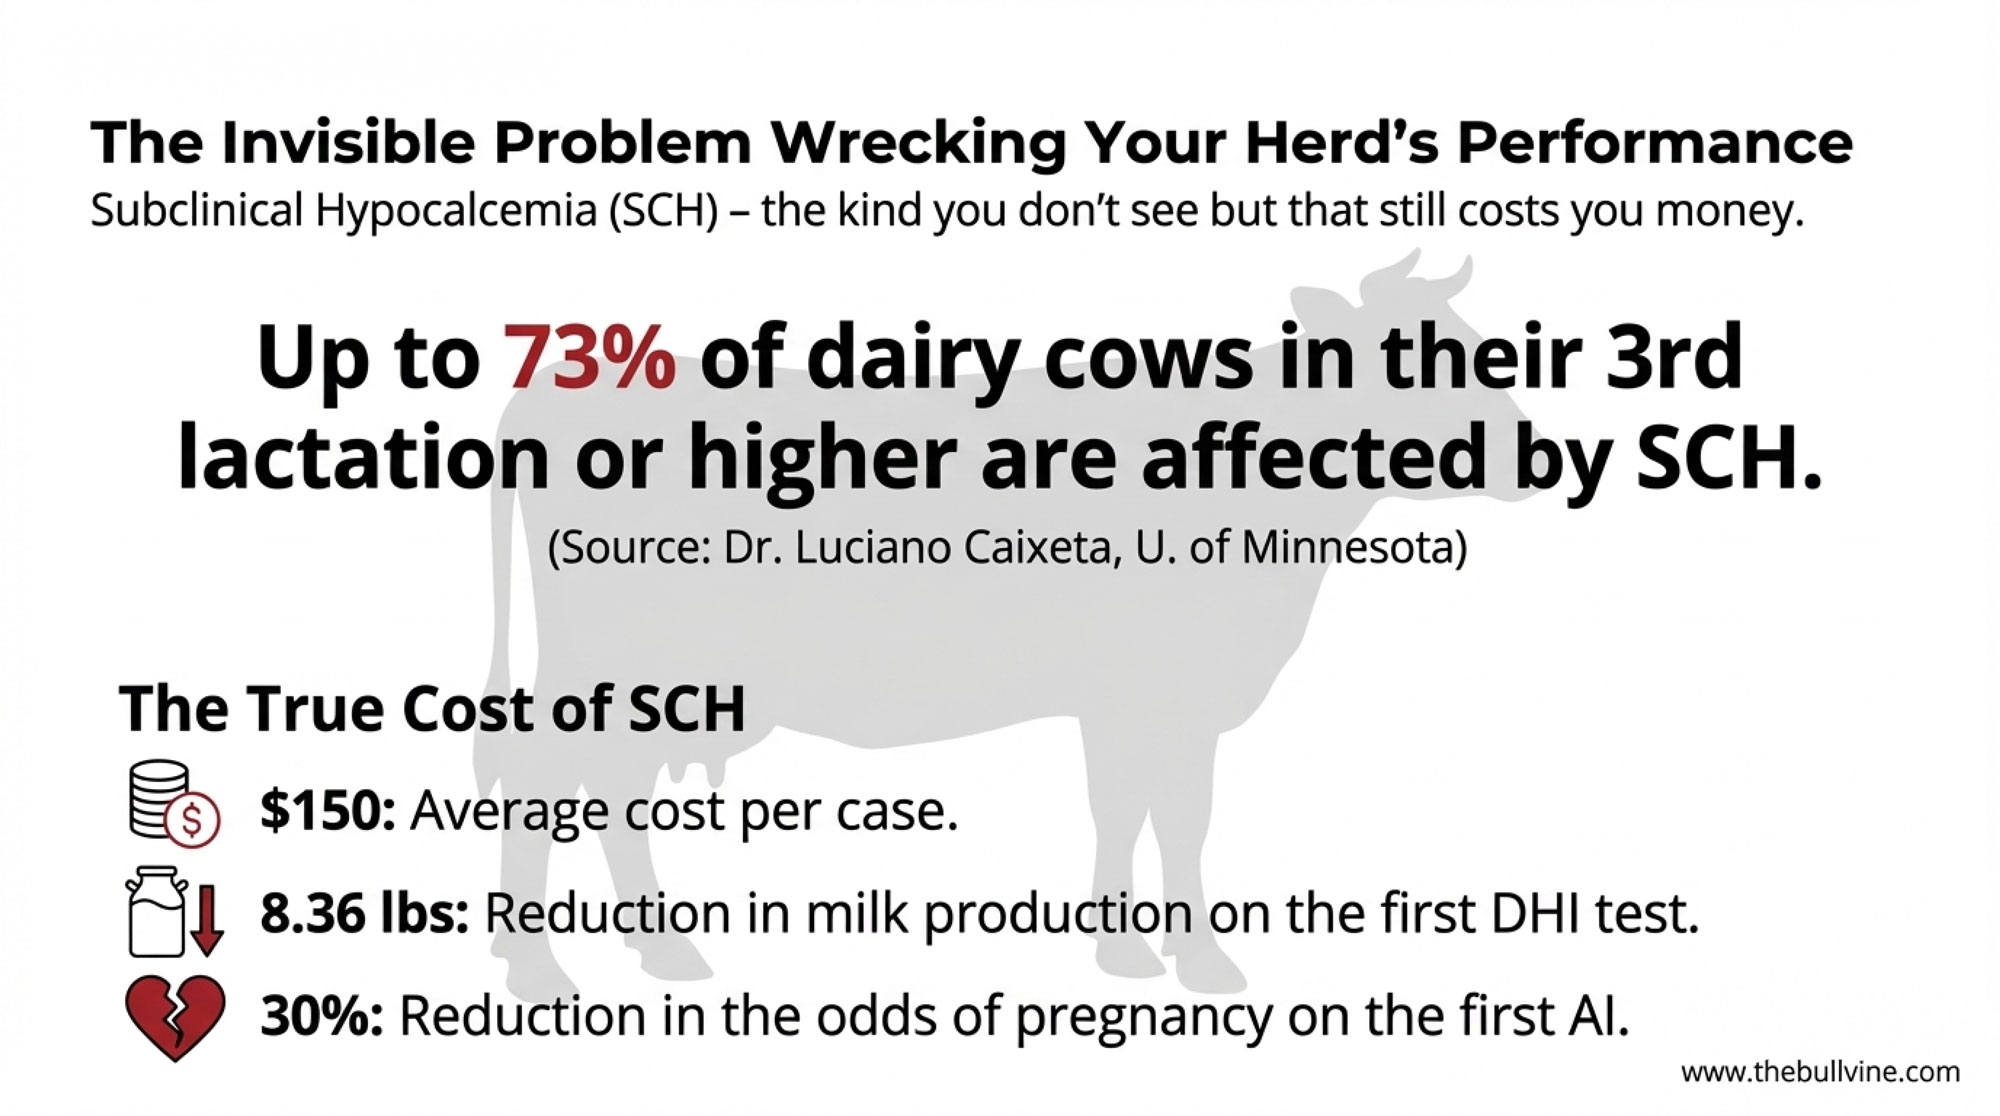
Dr. Luciano Caixeta at the University of Minnesota has noted that subclinical hypocalcemia (the kind you don’t see clinically but still causes problems) has been reported to affect as many as 73% of dairy cows in third or higher lactations, costing an average of about $150 per case. Researchers at the University of Guelph found that herds with a higher incidence of subclinical hypocalcemia experienced an 8.36-pound reduction in milk production on the first test day and a 30% reduction in the odds of pregnancy on the first AI. That’s real money—and real reproductive performance—left on the table.

Dr. Mark van der List, a veterinarian with Boehringer Ingelheim who’s spoken at numerous industry events on this topic, explains the supplementation approach this way: administering an oral calcium supplement to cows at calving, and again 12 hours later, provides much-needed calcium when blood levels are at their lowest. He also cautions about reading product labels carefully—watch out for products containing calcium carbonate, which is limestone. It’s the cheapest form of calcium, but it’s too slowly absorbed to really make a difference when you need rapid uptake.

On negative DCAD diets: This is one where the research is really solid. University of Wisconsin Extension confirms that feeding a negative DCAD diet during the pre-fresh dry period—that last 21 days before calving—successfully increases blood calcium levels before and immediately after calving. The result is a lower incidence of both clinical and subclinical milk fever.

Meta-analyses and field trials show that properly formulated negative DCAD diets can cut the risk of clinical milk fever by well over half. Some studies report relative risks in the 0.2-0.4 range compared with neutral DCAD diets. That’s substantial protection for your high-risk animals.

But here’s the nuance that matters for your operation—and this is where a lot of folks are spending money they don’t need to spend. The same Wisconsin Extension research notes that while negative DCAD diets can benefit heifers in some ways, studies have shown their impact on productive performance has been either neutral or negative. Heifers have a much lower risk of developing milk fever than multiparous cows, so feeding them a negative DCAD diet is likely unnecessary. That’s a cost you can redirect elsewhere.

On propylene glycol: A 2025 study published in Frontiers in Veterinary Science demonstrated that a targeted propylene glycol protocol effectively decreased ketosis incidence from 33.3% in control cows to 6.7% in treated cows at 14 days postpartum. The research confirms propylene glycol’s efficacy—but notice that word “targeted.” When used appropriately and aimed at cows that actually need it, rather than blanket-treating everyone, the results are strong.

What’s emerging from all this research is a consistent pattern: targeted, risk-stratified protocols generally outperform blanket treatment approaches, both economically and in terms of animal outcomes. Treat the cows that need treatment. Don’t treat the ones that don’t. Seems obvious, but it requires knowing who falls into which category.

Body Condition: The Early Warning System Many Farms Miss

This is where things get really practical—and where, honestly, a lot of farms are leaving money on the table.

Kirby Krogstad at Ohio State has been doing some fascinating work on the connections between body condition score, hyperketonemia, and downstream health outcomes. His research, published in the Journal of Dairy Science, tracked approximately 900 cows and found some pretty compelling relationships that should inform how we manage transition cows.

Here’s what stood out: cows who lost more than 0.375 BCS in early lactation were nearly five times more likely to lose their pregnancy. Five times. That’s not a subtle effect—that’s a flashing warning sign. And mature cows—third lactation and beyond—testing above 1.2 mmol/L of BHB produced about 11.8 pounds less milk per day than their non-hyperketonemic counterparts. On a 400-cow dairy with even modest prevalence of hyperketonemia in older cows, that adds up fast.
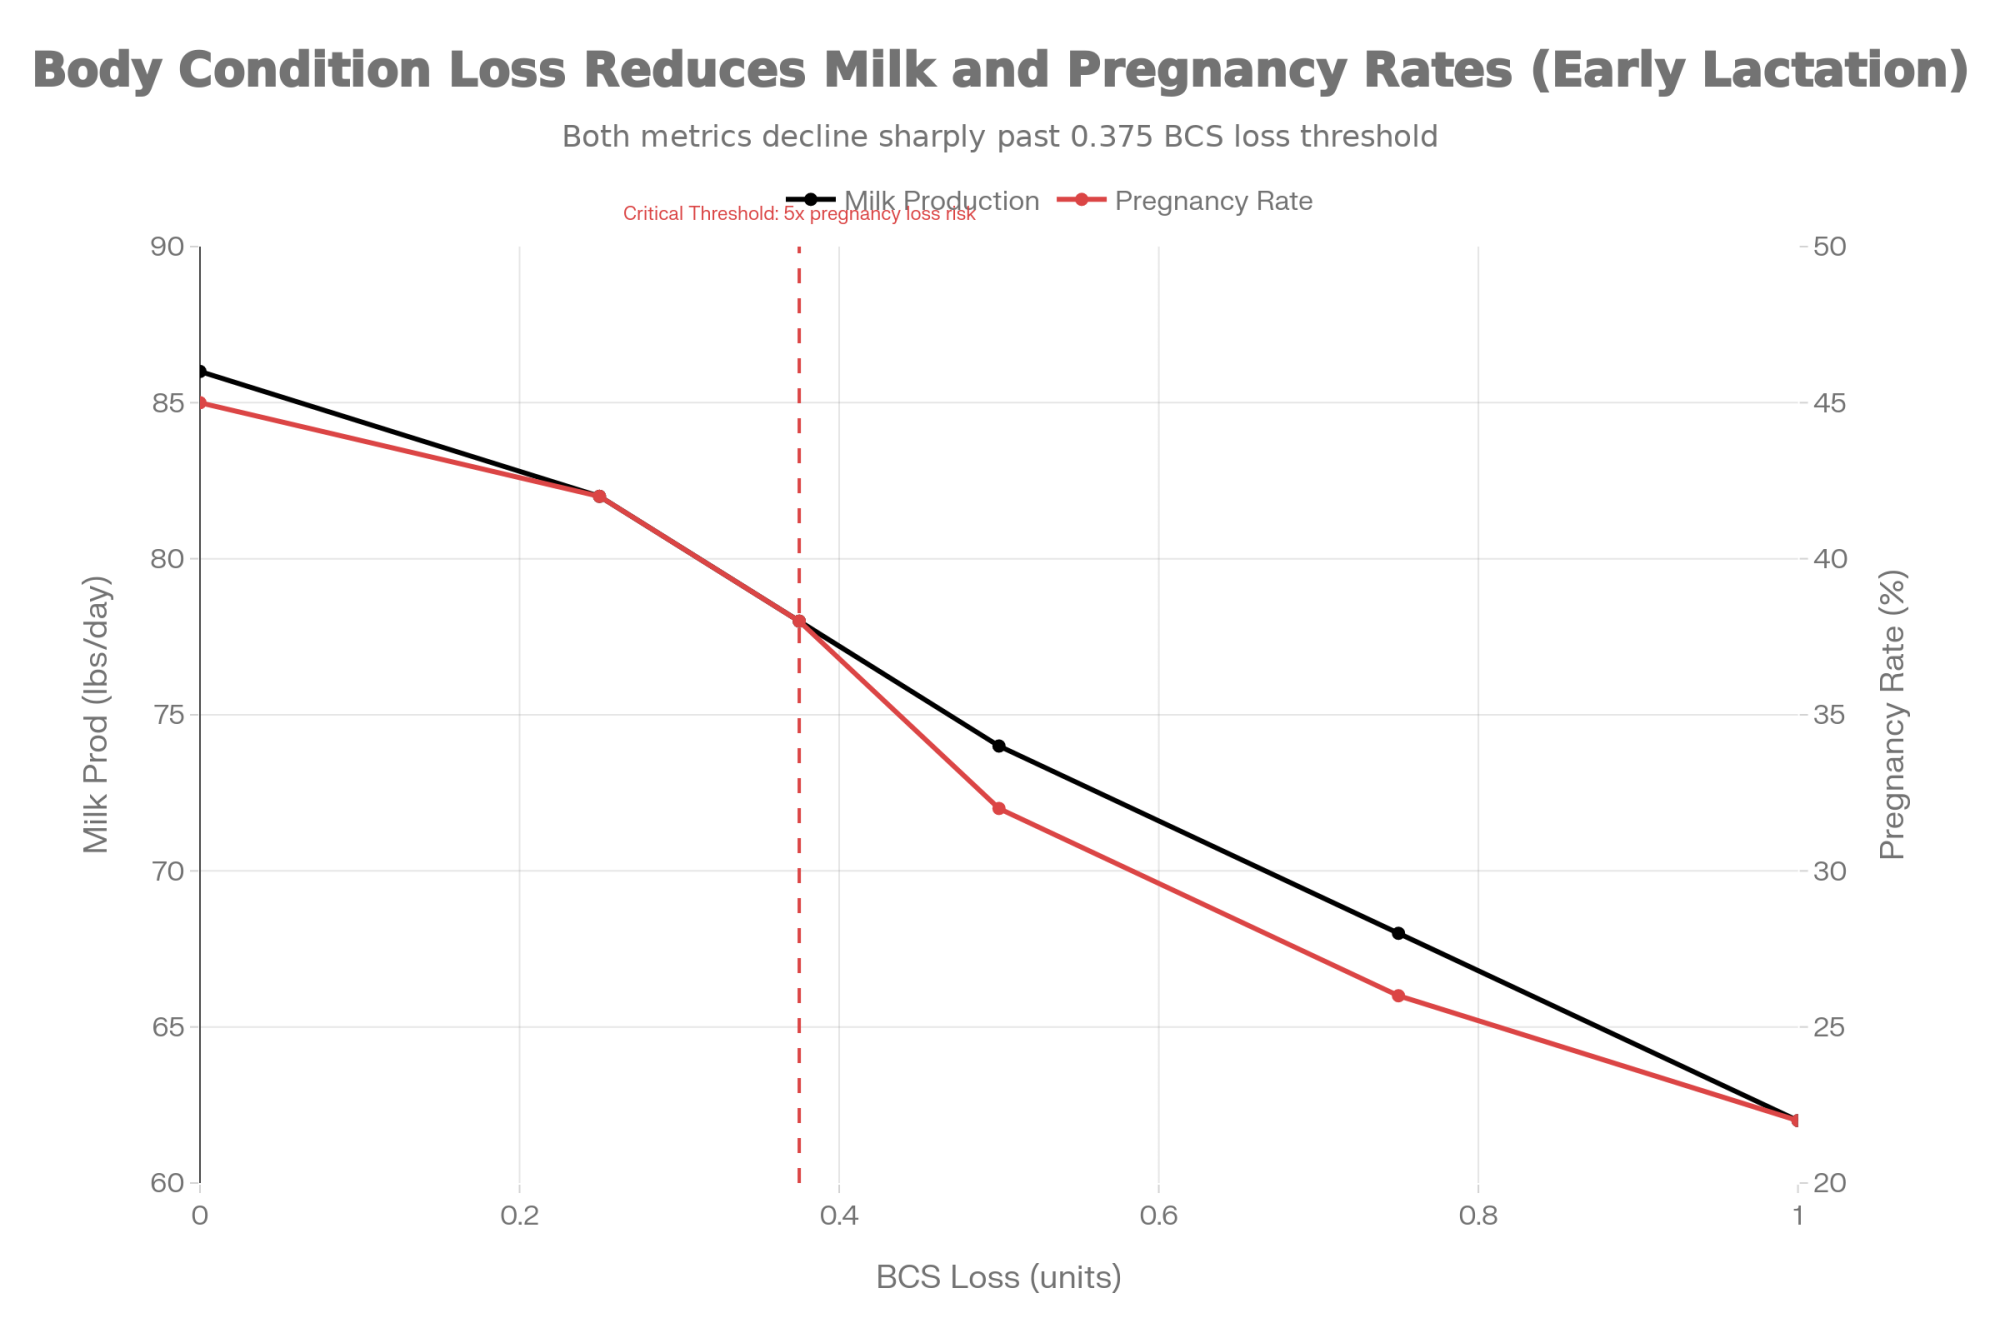
BCS Loss (units)Milk Production (lbs/day)Pregnancy Rate (%)
0.08645
0.258242
0.3757838
0.57432
0.756826
1.06222

Key Benchmarks (Krogstad, Ohio State): Target ≤10% of 2nd-lactation cows and ≤20% of 3rd+ lactation cows with elevated BHB in week one. Exceeding these thresholds signals protocol problems.

What’s particularly useful is Krogstad’s benchmark recommendations for the first week in milk. He suggests that 10% or less of second-lactation cows should show elevated BHB, and 20% or less of third-plus lactation cows. If your herd exceeds these thresholds, that’s a signal worth paying attention to. It’s a simple metric you can track that tells you whether your transition protocols are working.

Dr. Ribeiro at Guelph recommends that body condition scoring at dry-off should be moderate—3.0 to 3.25 on a 1-to-5 scale—and maintained through calving. The intervention point, importantly, is 100-plus days before calving, not at calving itself. By the time a cow reaches the close-up pen, overconditioned, you’re already playing catch-up. The time to manage body condition is back in late lactation, not when she’s three weeks from freshening.

I’ve heard from California producers who started scoring every cow at 200 DIM and adjusting rations for the overconditioned ones. Several report noticeable drops in fresh cow disease within a couple of lactation cycles. Not because they were doing anything fancy at calving—they were just preventing the problem from developing in the first place. That kind of proactive approach works whether you’re in a dry lot system in the Southwest or a freestall barn in the upper Midwest.

Why This Matters for Your Elite Genetics

Here’s something that doesn’t get talked about enough in the transition cow conversation: the genetic implications.

If you’re investing in elite genetics—whether that’s genomic-tested heifers, embryo transfer calves from proven cow families, or semen from high-ranking sires—transition disease can undermine that entire investment. A cow from an exceptional dam line who struggles through her first lactation due to ketosis or metritis may never express her true genetic potential. Worse, she might get culled before she ever gets a chance to prove herself or contribute daughters to the herd.

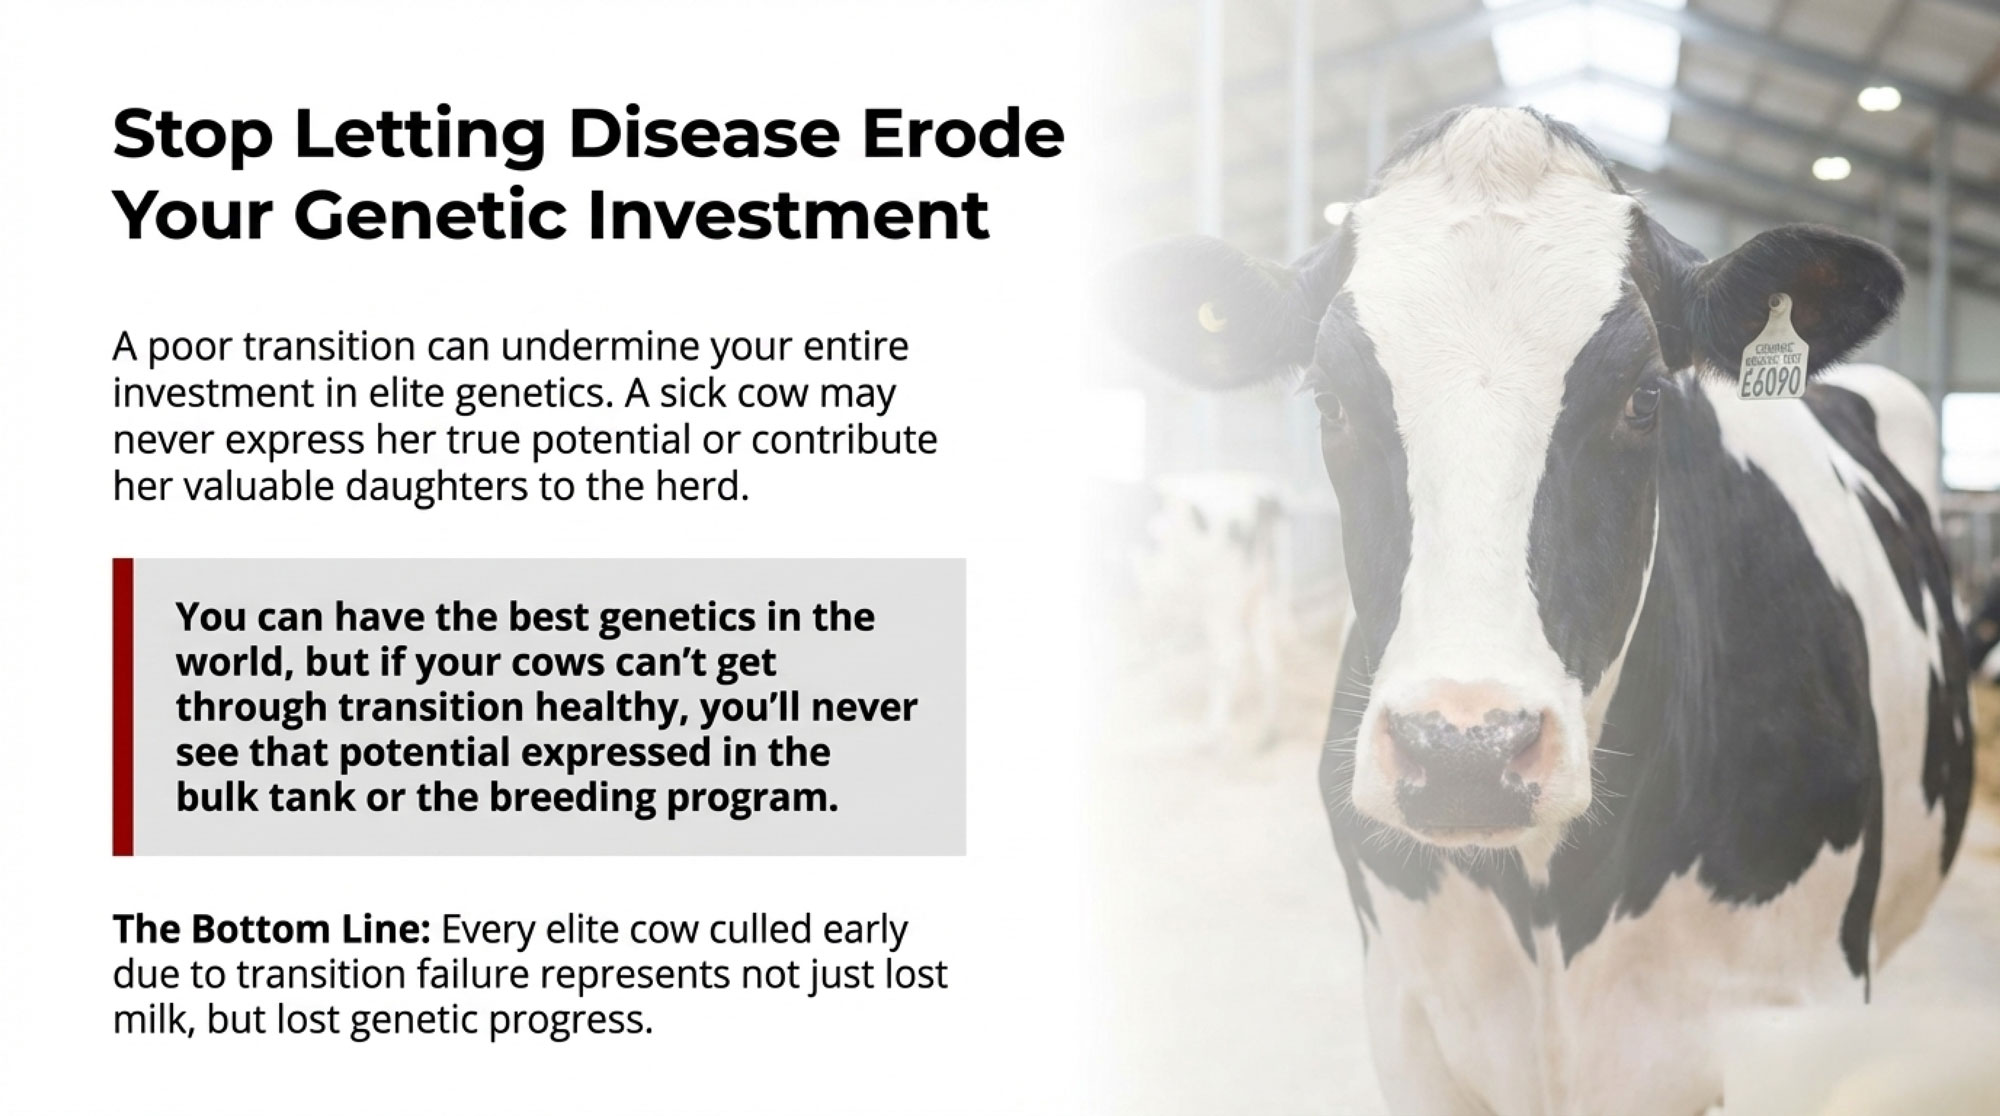
Think about it this way: that heifer calf from your best cow family represents years of breeding decisions. She carries genetics for high components, longevity, fertility—whatever traits you’ve been selecting for. But if she hits the fresh pen and immediately battles subclinical hypocalcemia followed by a DA, her first lactation becomes a salvage operation rather than a showcase of her genetic merit.

The research from Guelph on subclinical hypocalcemia showed a 30% reduction in the odds of pregnancy at first AI. For a cow you’re counting on to produce the next generation of your herd’s genetics, that reproductive hit is devastating. You need her pregnant early to get that next heifer calf. You need her healthy to produce enough milk to justify keeping her. Transition disease compromises both.

Dr. Ribeiro’s point about cows with poor transitions being “more likely to get culled from the herd” hits especially hard when you’re talking about animals carrying superior genetics. Every elite cow that leaves the herd early due to transition-related complications represents not just lost milk revenue but lost genetic progress. Her potential replacement heifers never get born. Her genomic contribution to your herd’s improvement disappears.

This is why getting transition management right matters beyond just the immediate economics. It’s about protecting your genetic investment and ensuring your best animals live long enough, and stay healthy enough to reach their potential and pass those genetics forward.

Building Momentum: The First Move That Actually Works

For operations looking to bridge the gap between current practice and what research supports, the question becomes practical: where do you actually start?

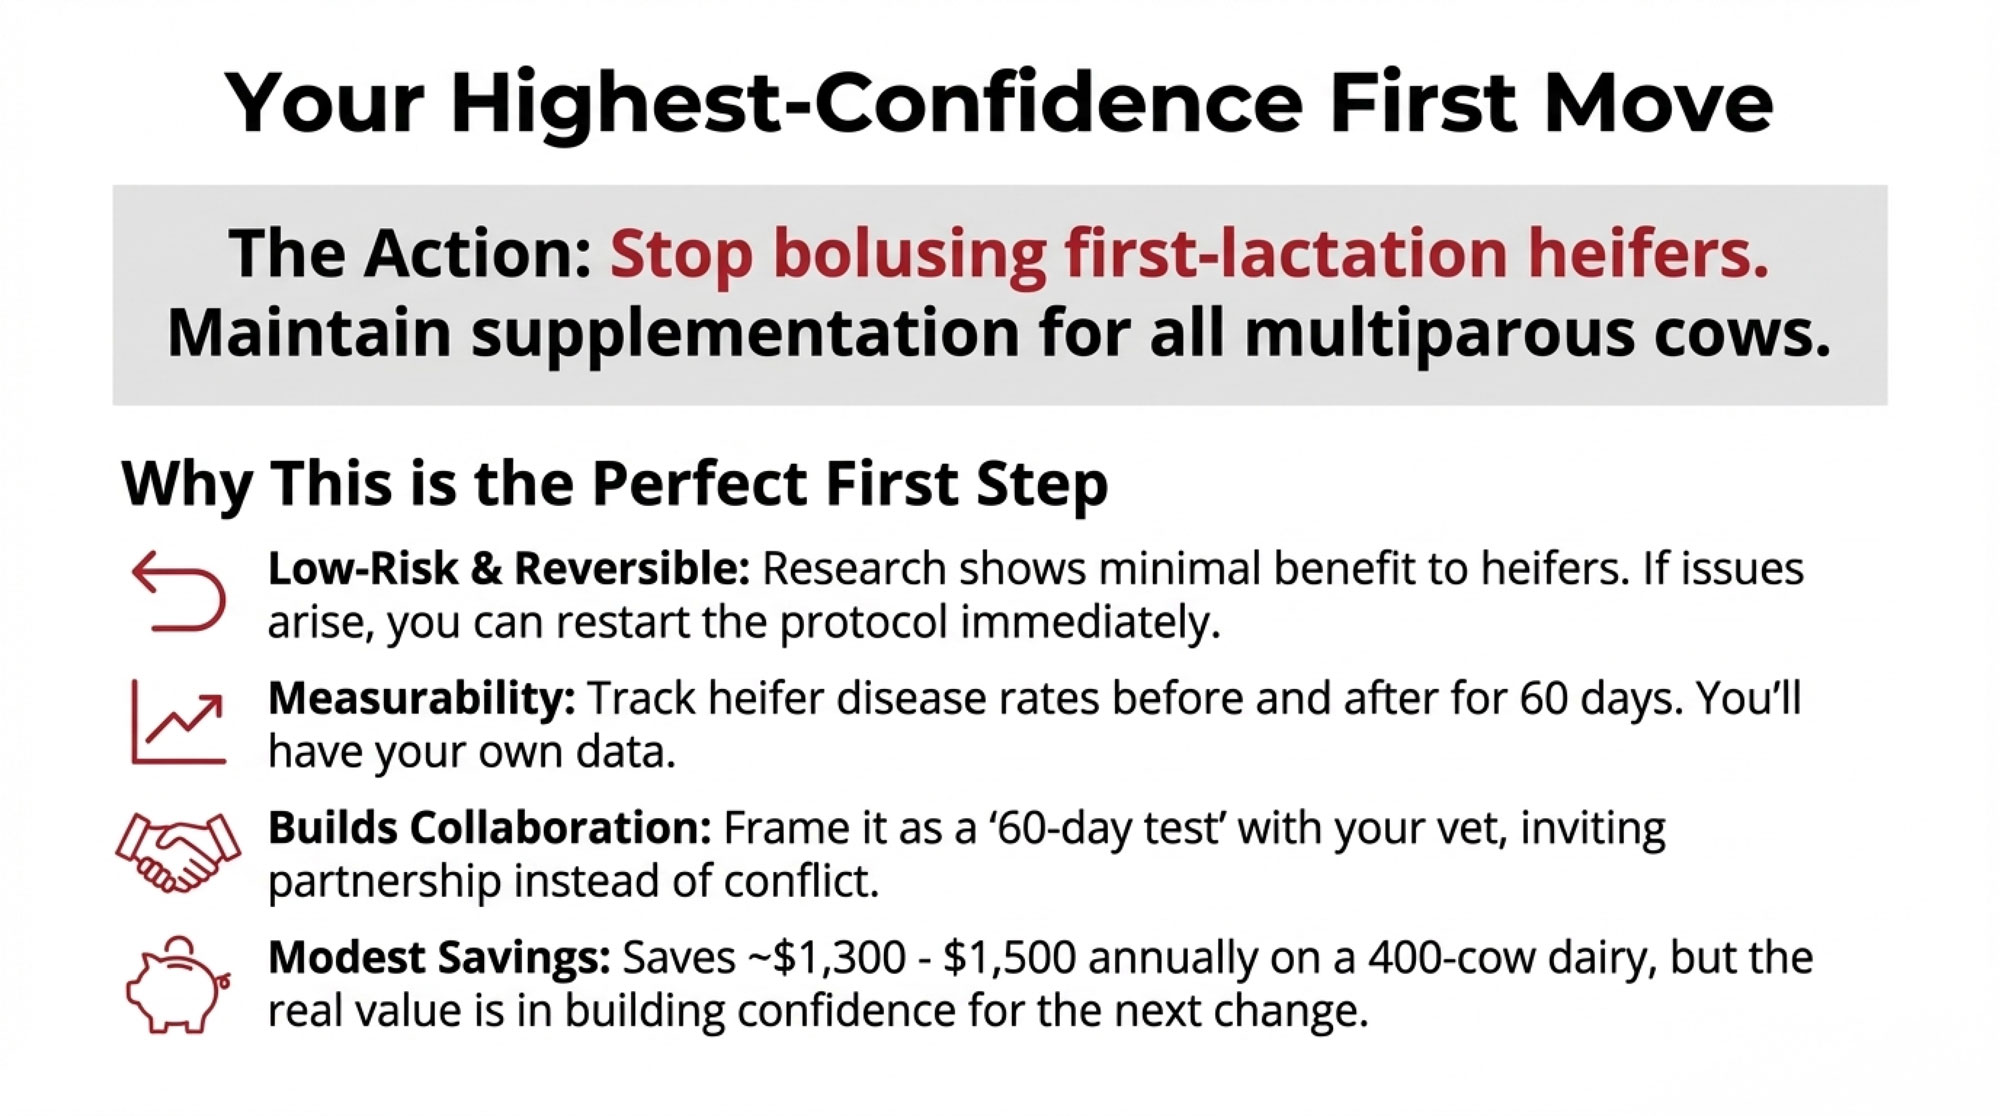
The answer, based on both research and what we’re seeing on progressive farms from the Northeast to the Pacific Northwest, might surprise you. Rather than overhauling everything at once (which rarely sticks anyway), the highest-confidence first move is often the simplest: stop bolusing first-lactation heifers while maintaining supplementation for multiparous cows.

The economics here are modest but illustrative. A 400-cow dairy with 33% heifer rotation spends roughly $1,300 to $1,500 annually on heifer calcium boluses. Research suggests this spending produces minimal benefit because heifers face naturally low hypocalcemia risk—remember that Wisconsin Extension finding about neutral or negative performance impacts? You’re spending money for essentially no return.

But more valuable than the direct savings is what this change accomplishes organizationally:

  • It’s reversible. If heifer disease somehow increases—unlikely based on research, but possible—you restart the protocol immediately. No permanent commitment required.
  • It’s measurable. Track the heifer disease rate before and after. You’ll have concrete evidence of whether it works for your specific operation, your genetics, and your facilities.
  • It builds collaborative relationships. Approaching your vet with “Can we try this as a 60-day test?” creates a partnership rather than conflict. You’re not challenging their expertise; you’re inviting them into an experiment.
  • It establishes a template. Successfully implementing one evidence-based change creates permission—and confidence—for the next.

Dr. van der List emphasizes this collaborative approach: ask your veterinarian about blood calcium testing, he suggests. They can help you evaluate the results and develop the right supplementation strategies for your herd. That kind of data-driven partnership is exactly what makes protocol changes stick long-term.

The farms achieving the best transition outcomes didn’t get there through revolutionary overnight changes. They built systematic improvement through sequential small wins. One protocol adjustment at a time, measuring as they went.

The Three-Tier Framework: How It Works in Practice

Operations that have successfully reduced fresh cow disease often employ some version of risk stratification. The basic principle is straightforward: different animals get different protocols based on their probability of developing disease. Here’s how one common framework breaks down.

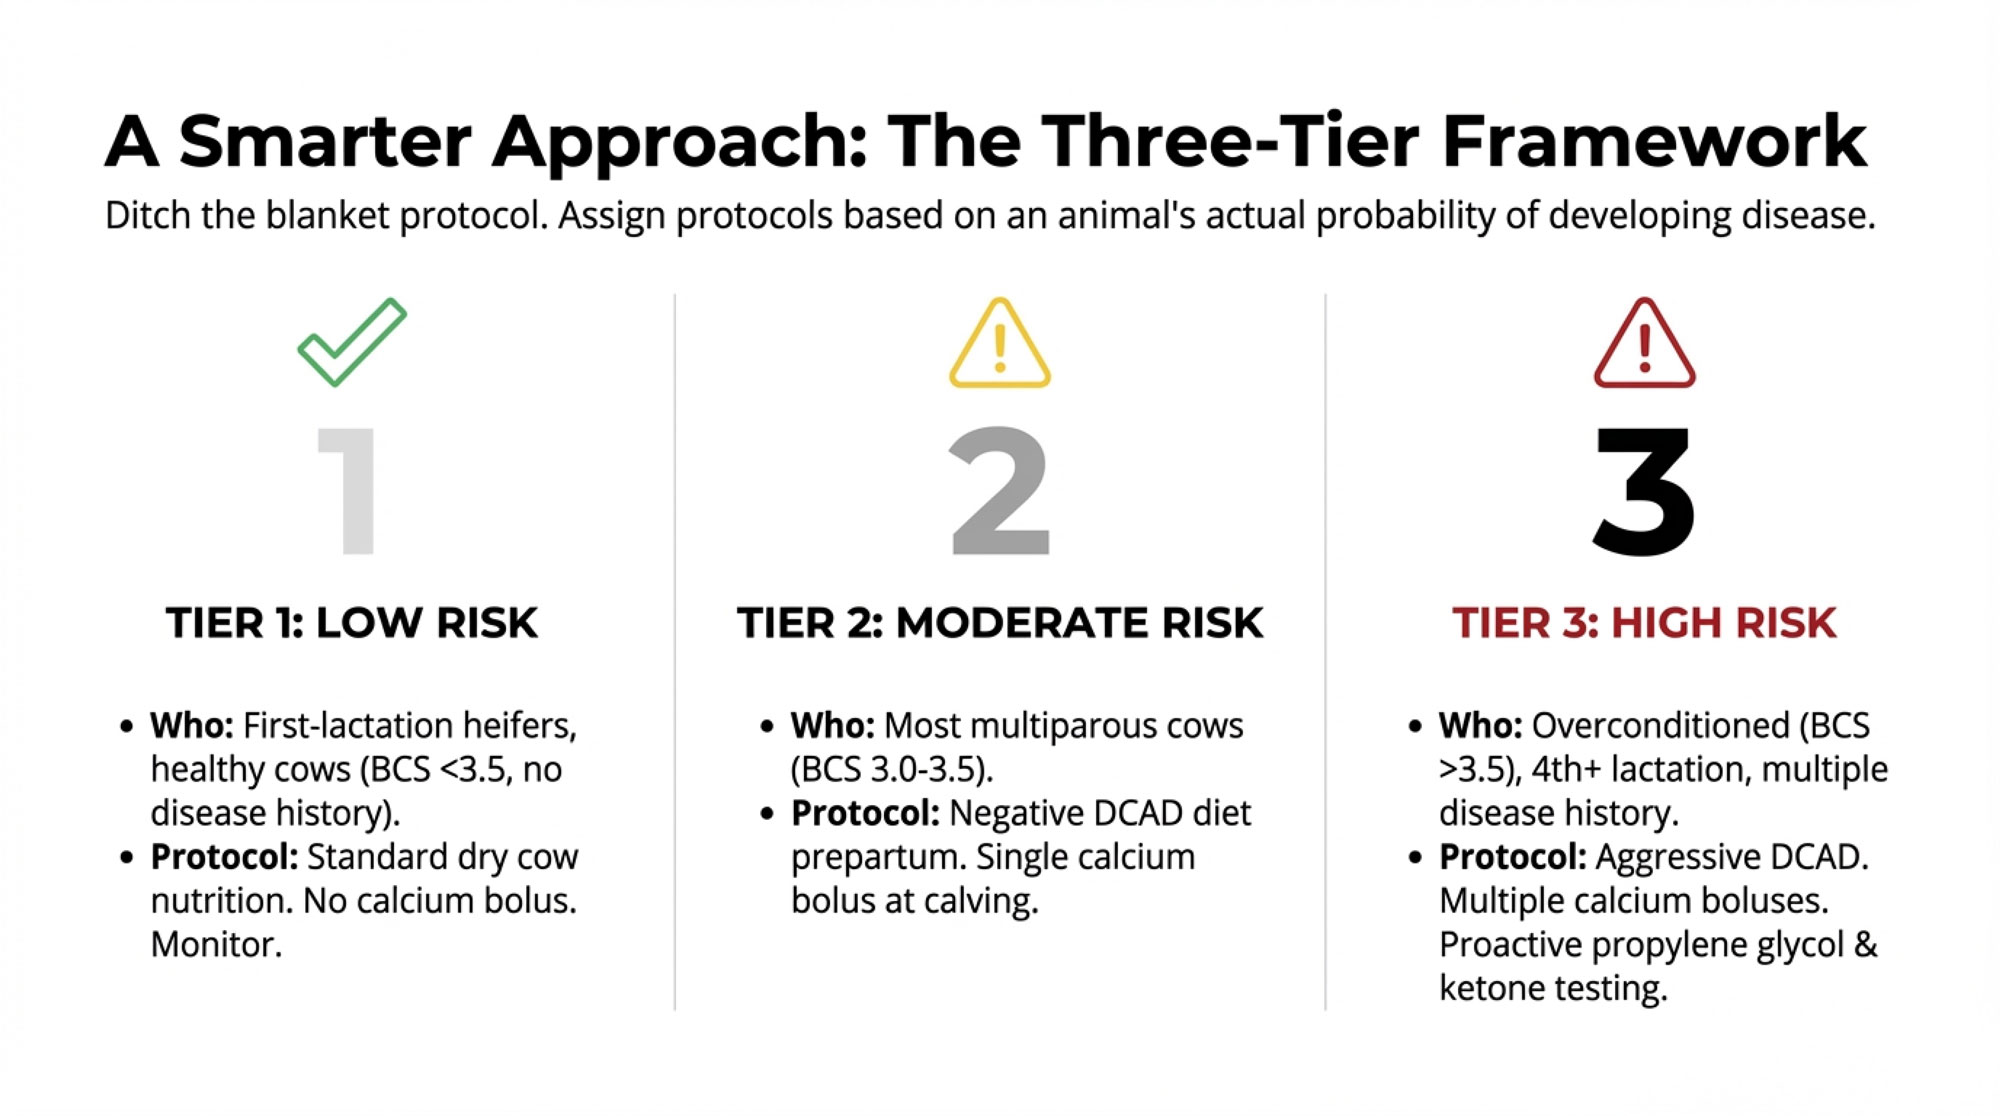
Tier 1 (Low Risk): First-lactation heifers and multiparous cows with body condition under 3.5 and no disease history

  • Standard dry cow nutrition without DCAD manipulation
  • No calcium supplementation at calving
  • Propylene glycol only if clinical signs emerge
  • Standard monitoring protocols

These are your low-maintenance animals. They don’t need aggressive intervention, and providing it anyway just costs money without improving outcomes.

Tier 2 (Moderate Risk): Multiparous cows with normal body condition (3.0-3.5) or single-episode disease history

  • Negative DCAD diet for the final 21 days prepartum
  • Single calcium bolus at calving
  • Propylene glycol is based on ketone testing, not blanket treatment
  • Enhanced daily observation during the fresh period

This is probably your largest group numerically. They need targeted support, based on what we know works.

Tier 3 (High Risk): Overconditioned cows (BCS above 3.5), fourth-plus lactation cows, or those with multiple disease episodes

  • Controlled-energy ration beginning at 150 days in milk (because you’re managing body condition early)
  • Aggressive DCAD protocol for 21-plus days prepartum
  • Multiple calcium boluses (at calving and 12 hours post-calving)
  • Propylene glycol protocol from day -7 to +21
  • Blood ketone testing days 5-9 postpartum
  • Intensive daily monitoring
Protocol CategoryTier 1: Low Risk (1st-lactation heifers, BCS <3.5)Tier 2: Moderate Risk (Multiparous, normal BCS)Tier 3: High Risk (BCS >3.5, 4th+ lactation, disease history)
DCAD Diet (Prepartum)Standard dry cow rationNegative DCAD for final 21 daysAggressive negative DCAD for 21+ days
Calcium SupplementationNone at calvingSingle bolus at calvingMultiple boluses (calving + 12 hrs post)
Propylene GlycolOnly if clinical signs emergeBased on ketone testing, not blanketProtocol from day -7 to +21
Body Condition ManagementStandard monitoringMonitor at dry-off and calvingControlled-energy ration starting 150 DIM
Monitoring IntensityStandard fresh cow checksEnhanced daily observationBlood ketone testing days 5–9; intensive daily monitoring
Estimated Annual Cost/Cow$18$62$147
Target Disease Rate<8%<15%<25% (vs. 45%+ without intervention)

These are your problem children—the cows you know are going to struggle if you don’t get ahead of it. They deserve the intensive protocols because, for them, it actually pays off. And if these happen to be your highest-genetic-merit animals in their fourth or fifth lactation, protecting them through transition protects your breeding program.

The ROI Snapshot: Tier 3 cows receive significantly more intervention, but overall spending frequently decreases because low-risk animals no longer receive unnecessary treatment. You’re reallocating resources, not adding them.

A note on infrastructure: Implementing this kind of stratification does require some basic capabilities. Lactanet’s housing guidelines for dry and transition cows note that well-designed facilities are built with a transition and calving management strategy in mind, addressing factors such as management group sizing, cattle movement, and health needs for different groups.

At minimum, you’ll want the ability to separate close-up cows into at least two groups—or clearly identify high-risk individuals within a mixed group—plus access to DCAD ration formulation through your nutritionist and either cow-side ketone testing or a protocol with your vet for blood work.

Now, I know what some of you are thinking: “We don’t have separate pens for that.” Fair enough. Operations without separate close-up pen capacity can still implement modified stratification by identifying and flagging high-risk individuals for enhanced monitoring and intervention. Some farms use colored leg bands. Others use separate feeding times or headlock sorting. Robotic milking operations sometimes leverage their existing cow identification systems to trigger different supplement protocols. It’s not as clean as separate pens, but it works. The principle matters more than the specific implementation.

A note on seasonality: If you’re running a seasonal calving operation—spring calving in the Upper Midwest, fall calving in parts of the South—you’ll want to think about how heat stress or cold stress might compound transition challenges. The tier assignments don’t change, but your monitoring intensity during environmental stress periods probably should. Summer calvings, in particular, tend to have elevated disease rates even in otherwise healthy cows.

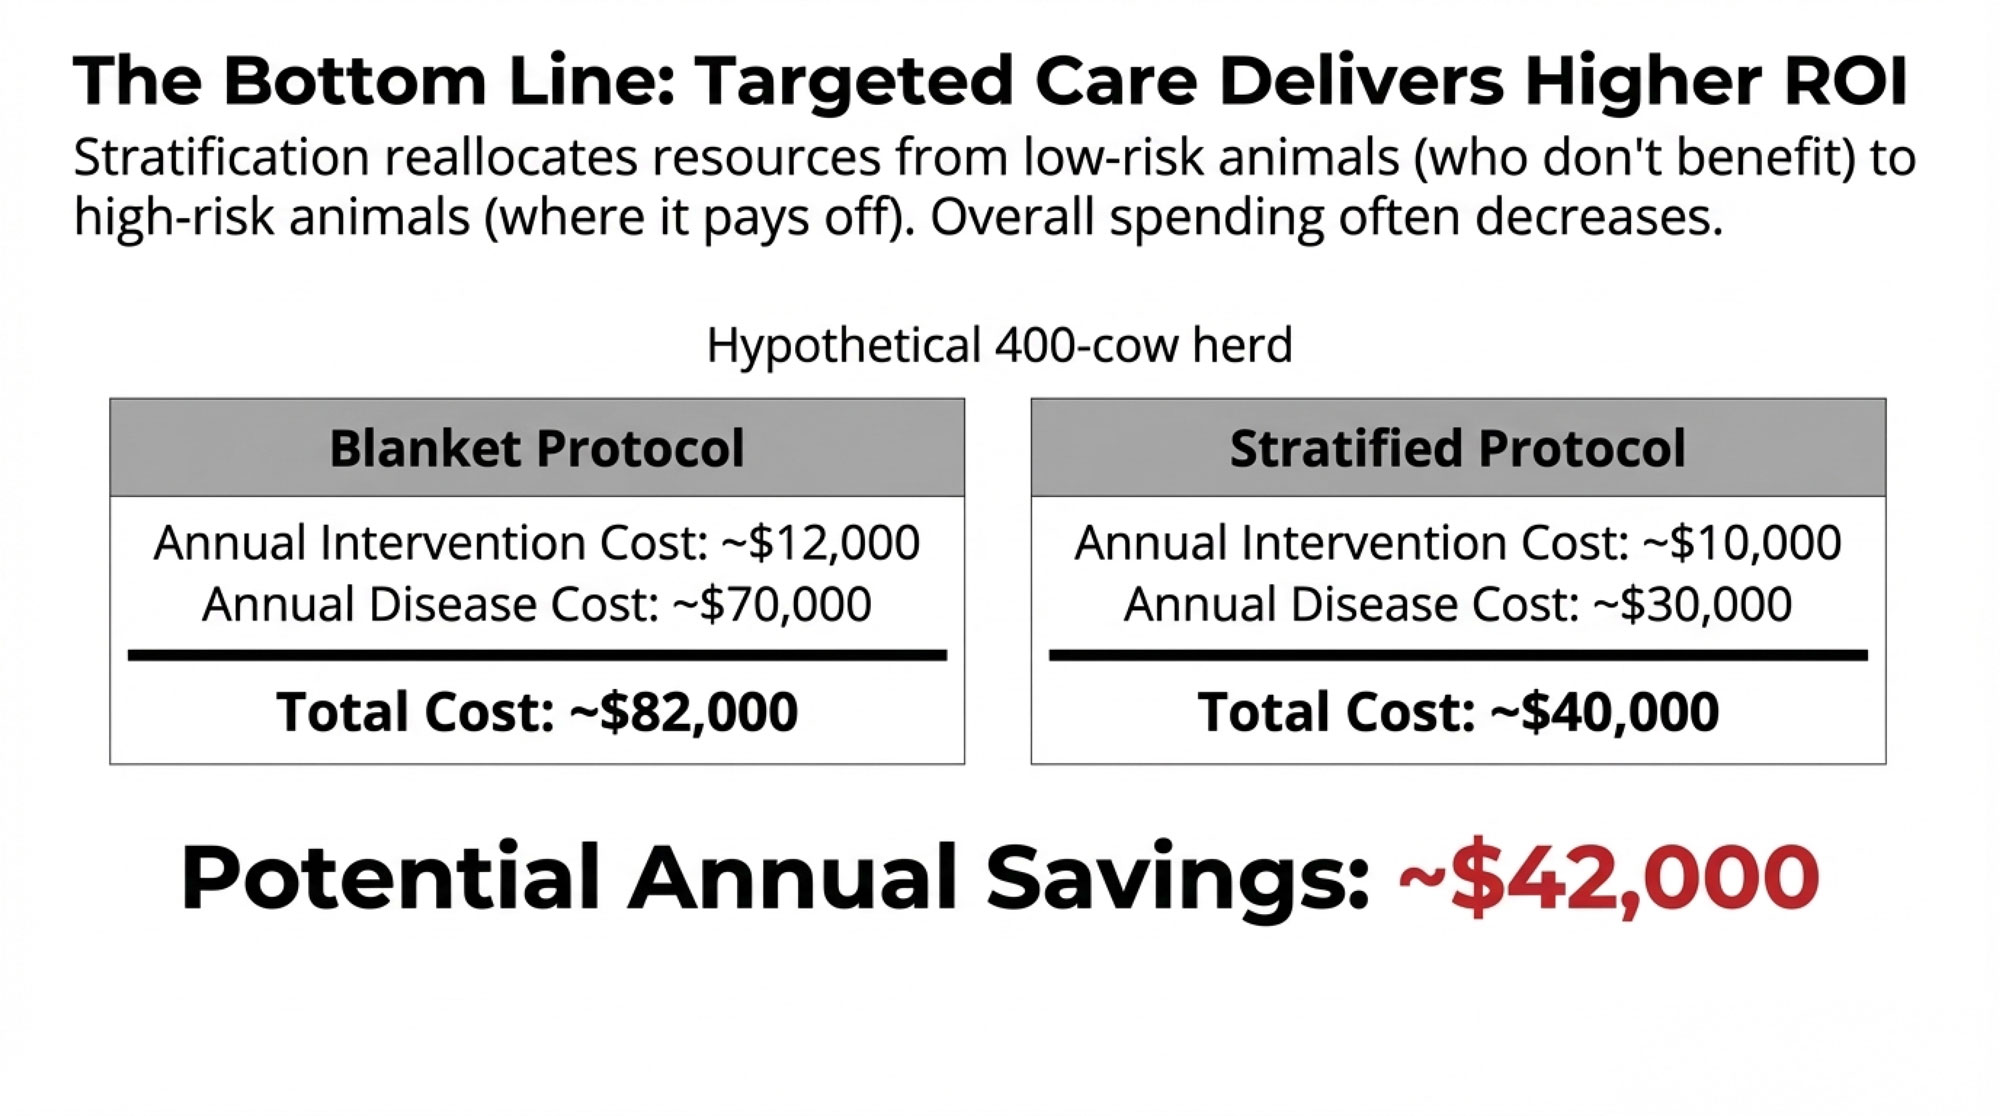
An example scenario for a 400-cow herd might look something like this:

ApproachAnnual Intervention CostDisease EventsDisease CostTotal Cost
Blanket Protocol~$12,000~140~$70,000~$82,000
Stratified Protocol~$10,000~60~$30,000~$40,000
Potential Annual Savings   ~$42,000

Your actual numbers will depend on your baseline disease rate, local costs, milk price, and specific herd conditions. But the general principle holds: targeting resources toward high-risk cows while reducing unnecessary interventions in low-risk animals tends to improve both outcomes and economics. It’s not magic—it’s just matching the intervention to the animal that needs it.

Quick Reference: Key Benchmarks

BHB targets (Krogstad, Ohio State, Journal of Dairy Science):

  • ≤10% of 2nd-lactation cows with elevated BHB in week 1
  • ≤20% of 3rd+ lactation cows with elevated BHB in week 1

Body condition targets (Ribeiro, University of Guelph):

  • 3.0-3.25 BCS at dry-off (1-5 scale)
  • Maintain through calving; intervene at 200 DIM if needed

Disease cost estimates (Carvalho et al., 2019):

  • ~$500 per single disease case
  • ~$1,000 for multiple diseases in the same cow

Subclinical hypocalcemia cost (Caixeta, University of Minnesota):

  • ~$150 per case
  • Affects up to 73% of 3rd+ lactation cows

DCAD timing (University of Wisconsin Extension):

  • Final 21 days prepartum for multiparous cows
  • Generally unnecessary for first-lactation heifers

When Good Enough Is Good Enough: Knowing Your Optimization Limit

One finding worth noting: operations that substantially reduce their disease rates often shift their optimization focus. Rather than continuing to push on disease reduction, many move toward production and reproduction metrics.

This makes economic sense when you think about it. Some level of transition disease is simply unavoidable—due to genetics, environment, and factors unrelated to nutrition. Retained placenta and certain cases of metritis aren’t fully preventable with nutritional protocols alone. More than 35% of all dairy cows have at least one clinical disease event during the first 90 days in milk, as Dr. Caixeta at Minnesota has noted. Some of that is just the biology we’re working with. You can optimize, but you can’t eliminate.

The research frontier is increasingly focused on inflammation management and precision monitoring technologies. There’s growing evidence that we’ll have more refined best management practices in the coming years—approaches that address dry matter drop, metabolic stress, and inflammation together, because all three are interconnected. Penn State and other extension programs are actively working in this space. It’s worth watching.

The return on investment for moving from high disease rates down to more moderate levels is typically substantial—that’s the $40,000 or more we’ve been discussing. But at some point, the economics of further disease optimization start to diminish relative to improvements in production and reproduction. You’ve reached a point of diminishing returns in disease prevention, and your attention is better directed elsewhere.

What progressive operations tend to optimize once they’ve addressed the big disease issues:

  • Early lactation production—targeting 80-plus pounds per day at first DHI test
  • Days to conception—pushing below 80 days versus the industry standard of around 100
  • Heifer development—getting fresh heifers producing at 90-plus percent of mature cow potential within the first few months

These become your next frontiers once transition health is reasonably controlled.

Why Knowledge Transfer Takes So Long

Perhaps the most thought-provoking aspect of transition cow research is how long it takes proven practices to reach widespread adoption. Negative DCAD feeding was demonstrated to be effective in the late 1980s. More than three decades later, many dairies still don’t use it consistently. Why is that?

That 2019 Journal of Dairy Science study on barriers to successful transition management found something interesting: the lack of a single definition of the transition period emerged as one barrier to improvement. Everyone’s talking about “transition cows,” but not everyone means the same timeframe or the same priorities. And barriers varied significantly across farms, suggesting that a tailored approach is required to achieve meaningful change. There’s no one-size-fits-all solution here—which makes extension work and consulting more challenging.

A 2025 study of Ontario dairy veterinarians published in the Journal of Dairy Science found that trust and communication emerged as critical components of veterinarian-client relationships—and it was acknowledged that these relationships take time to build. The researchers noted that veterinarians observed that proactive producers who implemented preventive strategies achieved better outcomes, whereas others exhibited greater resistance to change, often shaped by multigenerational traditions and economic constraints.

And you know what? None of these dynamics reflect bad intentions. They reflect the practical reality that changing established practices requires more than just evidence—it requires aligned incentives, collaborative relationships, and operational systems that support implementation. A protocol that works great in theory but doesn’t fit your labor situation or facility layout won’t actually be implemented.

What seems to accelerate adoption, based on what we’re seeing across the industry:

  • Producers who measure baseline disease rates and calculate their own economics (hard to argue with your own numbers)
  • Veterinarians who engage with current literature on transition research
  • Nutritionist partnerships focused on outcomes rather than product volume
  • Peer networks where successful protocol changes get shared and validated (sometimes the neighbor’s experience is more convincing than any research paper)

The operations achieving the best transition outcomes typically share a common characteristic: they’ve developed collaborative relationships with their advisory team where data-driven protocol adjustments are welcomed rather than resisted. It’s not adversarial—it’s problem-solving together.

Practical Takeaways

Start with measurement. Before changing any protocol, establish your actual disease rate by parity. The exercise takes about 60 days and requires only consistent tracking. Many operations discover rates higher than they’d estimated—and that discovery itself often motivates change.

Consider the parity difference. First-lactation heifers face fundamentally different metabolic challenges than fourth-lactation cows. The research is clear that treating them identically often leaves money on the table. Match your protocols to your animals.

Begin with low-risk changes. Discontinuing calcium supplementation for first-lactation heifers represents one of the lowest-risk, highest-confidence first moves. Frame it as a 60-day test with your veterinarian. Collect data. See what happens.

Collaborate rather than confront. Successful protocol changes typically emerge from partnerships between producers and their advisors. Come with data and questions rather than demands. As the Ontario veterinarian research found, trust and communication are the foundation.

Assess your infrastructure honestly. Stratified protocols work best with separate close-up pen capability, but modified approaches can work with careful individual-cow identification even in mixed groups. Don’t let perfect be the enemy of good.

Protect your genetic investment. Your best cows—the ones carrying the genetics you’ve spent years developing—deserve protocols that keep them healthy through transition. A cow that can’t get through the fresh period without complications may never show you what she’s capable of producing or passing on.

Calculate your specific economics. The general principle—that targeted protocols tend to outperform blanket approaches—is well-supported by the research. Your specific numbers will vary, but they’re worth calculating. It’s hard to prioritize what you haven’t quantified.

There’s a real gap between what the research shows and what’s actually happening on many farms—and that gap represents opportunity. The knowledge is there. The economics generally work out. What remains is finding the right starting point for your operation and building from there.

For operations willing to invest the time in systematic measurement and collaborative protocol development, the research suggests meaningful improvement is available—not through revolutionary change, but through thoughtful, evidence-based adjustments applied consistently over time. Small wins, stacked up, become significant results.

The Bullvine brings dairy producers research-backed insights for informed decision-making. For detailed guidance on transition cow protocols, consult with your herd veterinarian and review resources from university extension programs, including University of Wisconsin, Penn State, University of Minnesota, and University of Guelph.

Learn More:

Join the Revolution!

Join over 30,000 successful dairy professionals who rely on Bullvine Weekly for their competitive edge. Delivered directly to your inbox each week, our exclusive industry insights help you make smarter decisions while saving precious hours every week. Never miss critical updates on milk production trends, breakthrough technologies, and profit-boosting strategies that top producers are already implementing. Subscribe now to transform your dairy operation’s efficiency and profitability—your future success is just one click away.

NewsSubscribe
First
Last
Consent

The $16/CWT Reality: Why Mid-Size Dairies Can’t Out-Work Structural Economics – And What Actually Works

Mid-size dairies face a $16/cwt cost gap against mega-operations. You can’t out-work structural economics. But you might out-think them.

Executive Summary: The gap between thriving dairies and struggling ones isn’t about who works harder—it’s structural. Mid-size operations (250-1,000 cows) face a cost disadvantage of up to $16 per hundredweight compared to mega-dairies, driven by differences in labor efficiency, purchasing power, and organizational capacity that longer hours alone can’t bridge. These aren’t cyclical pressures waiting to pass; USDA data shows 40% of dairy farms exited between 2017 and 2022, while operations with 1,000+ cows now produce 68% of U.S. milk. Three strategies are helping producers navigate this divide: beef-on-dairy breeding programs capturing significant calf revenue, component-driven culling aligned with today’s pricing, and precision feeding that compounds efficiency gains over time. For farms facing margin pressure, timing proves critical—acting early preserves substantially more equity than waiting for conditions that may not improve. Understanding these dynamics won’t guarantee any particular outcome, but it enables clearer decisions while meaningful options still exist.

dairy profitability strategies

There’s a number from the latest Zisk Report that’s worth pausing on. Looking at their 2025 profitability projections, operations milking more than 5,000 cows were expected to earn around $1,640 per cow. Smaller herds under 250 cows in the Southeast? Roughly $531 per cow. That’s not just a performance gap you can chalk up to management differences. It reflects fundamentally different economic realities.

What makes this moment feel different from the cyclical downturns we’ve weathered before is that this gap isn’t closing. The farms caught in the middle—those 250- to 1,000-cow operations that have traditionally formed the backbone of American dairy—face a structural squeeze that traditional approaches alone may not address.

I want to be clear about something upfront. This isn’t a story about who deserves what outcome. It’s about understanding what’s actually driving profitability, why certain strategic moves create compounding advantages, and what realistic options exist for operations navigating an increasingly challenging landscape.

The Scale of Change Already Underway

Before digging into strategy, it’s worth sitting with how much has already shifted. USDA’s 2022 Census of Agriculture shows licensed dairy farms with off-farm milk sales declining from 39,303 in 2017 to 24,082 in 2022—a reduction of almost 40%. University of Illinois economists at Farmdoc Daily noted that it was the largest decline between adjacent Census periods since 1982.

The consolidation squeeze: Total dairy farms dropped 59% between 2012-2022, while mega-operations now control 68% of U.S. milk production—up from 52% a decade ago

Here’s the part that surprises people: total milk production actually increased slightly during that same period.

Why? Because remaining farms are larger, more productive, and increasingly concentrated. Rabobank’s analysis of the Census data estimates that farms with 1,000 or more cows—roughly 2,000 operations—now produce about 68% of U.S. milk, up from 60% in 2017. Meanwhile, farms with fewer than 500 cows account for about 86% of all operations but contribute only about 22% of total production.

The profitability chasm: Large dairies earn triple what mid-size operations make per cow, driven by structural cost advantages rather than management quality

The profitability breakdown by herd size tells the story. According to Zisk’s 2025 projections, those massive 5,000+ cow herds were looking at $1,640 per cow, with profitability declining steadily as herd size decreased. Their 2026 projections suggest smaller herds will continue to lag, with sub-250-cow farms hovering near break-even and mid-size herds projected somewhere in the low hundreds per cow.

These aren’t random variations. They reflect structural cost advantages that compound at scale—advantages in labor efficiency, feed purchasing, risk management infrastructure, and capital access that mid-size operations struggle to replicate, regardless of management quality.

The “No-Man’s Land” Problem: Why 750 Cows Is the New 100

Here’s something I’ve been thinking about a lot lately. Back when I started paying attention to this industry, a 100-cow operation was considered the minimum viable scale for a full-time dairy. Based on current cost structures and margin realities, that threshold has shifted dramatically upward.

Mid-size operations—those running roughly 250 to 1,000 cows—find themselves stuck in what I’d call economic no-man’s land. They’re too big to run primarily on family labor, the way smaller operations can. But they’re not big enough to justify the specialized management teams, dedicated risk managers, and infrastructure investments that large operations deploy.

Consider what a 300-cow operation still needs:

  • Full-time hired labor (family alone can’t handle 24/7 milking schedules)
  • Modern parlor equipment and maintenance
  • Compliance infrastructure for environmental and labor regulations
  • Professional nutritional consulting
  • Financial management beyond basic bookkeeping

But that same 300-cow operation typically can’t afford:

  • A dedicated herd manager separate from the owner
  • Full-time HR staff to handle employee recruitment and retention
  • A risk management specialist monitoring DRP enrollment and forward contracts
  • The volume discounts in feed purchasing that large operations secure

University of Minnesota Extension data in FINBIN show the math clearly: herds with up to 50 cows face costs of around $20.22 per cwt, compared to $16.70 for herds over 500 cows. That gap of several dollars per hundredweight? It often represents the entire margin at current milk prices.

At stressed margins, a mid-size operation can lose approximately $15,000-$20,000 per month, according to industry analysis. That’s not a sustainable position, and no amount of 80-hour weeks changes the structural economics.

Reality Check: The Cost of Waiting

The hardest conversation I have with producers involves timing. Industry analysis from agricultural lenders suggests that farms making strategic decisions during months 8-10 of financial stress preserve significantly more equity—often hundreds of thousands of dollars more—than those waiting until months 16-18.

The cost of waiting: Farms that delay strategic decisions until month 18 preserve half the equity of those acting at month 12—a difference often exceeding $200,000 in lost family wealth

Every month of delayed decision-making at stressed margins burns equity that families will never recover. The pattern is consistent across regions: waiting for conditions to improve when structural forces are at work rarely improves outcomes.

The difficult truth is that the only wrong choice is often no choice at all.

Understanding What Creates the Cost Gap

When we talk about economies of scale, it can sound abstract. On working farms, though, this shows up in tangible ways.

Structural Cost Comparison: Mid-Size vs. Large Operations

Cost FactorMid-Size Operation (250-1,000 cows)Large Scale (5,000+ cows)
Total Cost per CWT$19-22 (University of Minnesota FINBIN)$16-18 (USDA ERS, Cornell data)
Labor StructureOwner + generalist hired workersSpecialized department managers
Risk ManagementOwner-operated, part-time attentionDedicated full-time staff
Feed SourcingMarket price/spot purchasesContracted volume discounts
Genomic TestingSelective/occasional useUniversal/systematic across the herd
Equipment Cost per CowHigher (fixed costs spread across fewer animals)Lower (fixed costs spread across more animals)

Sources: University of Minnesota FINBIN, USDA ERS milk cost studies, Cornell

Where the Differences Come From

Cost ComponentMid-Size Operations (250-1,000 cows)Large Scale (5,000+ cows)Gap Impact
Labor Cost per CWT$4.50$2.80$1.70 disadvantage
Feed Cost per CWT$11.20$9.90$1.30 disadvantage
Equipment Cost per CWT$3.50$2.00$1.50 disadvantage
Total Operating Cost per CWT$20.22$16.70$3.52 total gap
Net Cost Disadvantage+$3.52BASELINE21% higher costs

Labor efficiency represents the most significant structural gap. MSU Extension research found labor costs ranging from less than $3 per cwt on well-organized, larger farms to more than $4.50 per cwt on operations averaging around 258 cows. University benchmarking consistently shows large herds support substantially more cows per full-time worker—often roughly double the cows per FTE compared to smaller family operations.

Think about what this means practically. A 500-cow farm requiring 10 employees at an average cost of $45,000 runs $450,000 in labor annually. A 3,000-cow operation with better labor efficiency spends significantly less per cow. And there’s only so much you can do about this—someone still needs to be monitoring fresh cows at 2 AM, whether you’re milking 400 or 4,000.

Feed purchasing power compounds the advantage. What I’ve found, talking with nutritionists and lenders, is that larger dairies consistently secure meaningful volume discounts on purchased feed compared to smaller buyers who purchase at spot prices. With feed typically accounting for the majority of operating costs, even modest percentage savings translate into real-dollar advantages.

Capital costs follow similar patterns. Equipment amortization illustrates this well: the same piece of equipment costs more per cow annually when spread across 350 animals than when spread across 3,000. That’s not about management quality—it’s pure math. And it affects everything from parlor systems to feed storage to manure handling.

When you stack these factors together, USDA ERS research found that dairy farms with fewer than 50 cows had total economic costs of $33.54 per cwt while herds of 2,500+ cows achieved costs of $17.54 per cwt. That’s a $16 difference—nearly the entire milk price in some months.

The Organizational Capacity Challenge

Here’s something that doesn’t get discussed enough, and honestly, it’s an aspect I didn’t fully appreciate until digging into this data: organizational infrastructure may matter as much as any single cost factor.

Organizational Comparison: Who’s Managing What?

Critical FunctionMid-Size (250-1,000 cows)Large Scale (5,000+ cows)Impact
Risk ManagementOwner part-timeDedicated marketing staffLower DRP enrollment
Genetic Program StrategyAI tech recommendationsIn-house geneticistReactive vs. systematic
Nutritional ManagementConsultant quarterly visitsFull-time on-staff nutritionistSlower optimization
Employee Recruitment & TrainingOwner handlesHR departmentHigher turnover costs
Financial Planning & AnalysisAnnual lender meetingCFO with monthly analysisDelayed interventions
Regulatory ComplianceOwner learns as neededCompliance officerViolation risk

Consider risk management specifically. Large dairy operations increasingly employ dedicated staff for milk marketing, futures hedging, and Dairy Revenue Protection enrollment. A much higher share of large operations actively use DRP and forward contracting than mid-size farms do. What’s interesting is that the tools themselves are identical—DRP costs the same per hundredweight regardless of herd size.

So why the adoption gap?

The answer comes down to organizational capacity. Effective risk management requires:

  • Accurate cost-of-production projections 6-12 months forward
  • Quarterly decision-making discipline for DRP enrollment
  • Understanding of basis risk and Class III correlations
  • Coordination between the lender, the nutritionist, and the marketing decisions

Large operations have staff dedicated to these functions. Mid-size farms have owner-operators trying to manage risk alongside daily operations, employee supervision, equipment maintenance, and family responsibilities. As extension economists often note, it’s not that mid-size farms can’t afford the premiums—they don’t have the bandwidth to execute consistently. And inconsistent execution often performs worse than no strategy at all.

From the Field: A Wisconsin Operation’s Strategic Pivot

I recently spoke with operators running a 480-cow dairy in Dane County, Wisconsin, who implemented beef-on-dairy breeding starting in early 2024. They moved from modest bull calf revenue to well over $200,000 in beef-cross calf sales within 18 months. The key was starting with genomic testing to identify which cows warranted investment in sexed semen. “Once we knew our top 35% genetically, the breeding decisions got clearer. We’re not guessing anymore.” They acknowledged that the transition took about two complete breeding cycles before they felt the system was truly optimized.

Three Strategic Moves Separating Top Performers

What are genuinely successful operations doing differently? Three specific strategies keep appearing among farms outperforming their peer groups. These aren’t theoretical—they’re moves I’m seeing executed on working dairies right now.

Beef-on-Dairy as a Revenue Strategy

The shift toward beef-on-dairy breeding represents one of the most significant strategic pivots in dairy today. American Farm Bureau analysis describes beef-on-dairy crossbreeding as one of the fastest-growing trends in dairy genetics, with a substantial share of commercial herds now breeding part of the milking string to beef sires.

The traditional approach—breeding all cows to dairy sires and selling bull calves for whatever the market offers—often yields disappointing returns. Top performers instead use genomic testing to identify their top 35-40% of cows genetically, breed those with sexed semen for replacement heifers, and breed the remainder to beef sires.

USDA Agricultural Marketing Service reports show that well-grown beef-cross calves bring several hundred dollars more than straight dairy bull calves at auction. Recent sale barn data often shows beef-on-dairy calves trading in the low four figures while dairy bull calves bring a fraction of that (depending on weight and region).

Based on current price differentials, that gap can translate into substantial additional annual calf revenue—potentially six figures for a 500-cow herd, depending on local market conditions.

The beef-on-dairy revenue multiplier: A 500-cow herd switching to strategic beef breeding can add $225,000 in annual calf revenue—enough to cover several full-time employees

Execution requires infrastructure that many mid-size farms lack, though:

  • Genomic testing: $35-55 per head, depending on test panel (one producer reported average costs around $38)
  • Breeding discipline: Consistent heat detection and sexed semen protocols
  • Market development: Building feedlot relationships that value beef-on-dairy genetics
  • Timeline: 2-3 years to fully optimize the program

Component-Driven Culling Decisions

Traditional culling logic focuses on milk volume: keep high producers and cull low producers. What I’m seeing among top performers is a shift to income-over-feed-cost analysis that accounts for component value—and it’s changing which cows stay and which go.

Why does this matter more now than it did five years ago? Federal order component pricing in 2025 has rewarded solids heavily, with butterfat prices often in the $2.50-2.70 per pound range and protein in the low-to-mid $2.00s per pound. It’s worth noting there’s been significant month-to-month volatility—August 2025 saw butterfat above $2.70, while October dropped closer to $1.80. That kind of swing matters for planning.

This pricing structure means a cow producing 60 pounds daily with average components generates different revenue than one producing 48 pounds at notably higher butterfat and protein tests. In many cases, that “lower-producing” high-component cow delivers more monthly value than her high-volume counterpart.

Recent USDA/NAHMS-based summaries indicate the typical overall cull rate runs about 37% of the lactating herd annually, with roughly 73% of those culls classified as involuntary in Northeast datasets—driven by reproductive failure, mastitis, and lameness. Penn State Extension reported similar figures. Extension specialists emphasize that moving more culling into the voluntary category (strategically removing low-IOFC cows rather than reacting to health breakdowns) improves long-term herd economics.

Here’s a number worth sitting with: it takes more than three lactations to recoup the cost of raising a replacement heifer—about $2,000 per head—but average productive life currently runs about 2.7 lactations. That gap between investment and return is where considerable money quietly disappears.

Precision Feeding Implementation

Emerging technology enables individual-cow nutritional optimization rather than pen-based feeding. While still early in adoption, farms implementing precision feeding systems report meaningful gains in milk income minus feed costs, with results varying by implementation quality and starting-point efficiency.

Systems like Nedap or SCR by Allflex integrate with automated milking and grain dispensers, continuously analyzing individual cow data to optimize nutrient delivery. Initial investment varies significantly by herd size and configuration, representing a substantial capital commitment for mid-size operations.

Early adopters are building optimization data that compounds into structural advantages as the technology matures. This isn’t something you implement overnight—farms report 12-18 months before fully realizing efficiency gains.

The Premium Market Reality

For struggling mid-size operations, “go premium” often sounds like an obvious solution. Organic, grass-fed, and A2 milk command notable premiums. So why not transition?

The economics prove more complicated than they appear.

Organic transition requires 2-3 years of certification, during which farms follow organic protocols while selling at conventional prices. Case studies and extension reports note that transition periods typically involve lower yields, higher purchased-feed costs, and additional capital investments. Producers and lenders describe the certification window as a period of thinner or negative margins, with favorable returns often appearing only after full certification and stable market access.

That’s a considerable risk for farms already under financial pressure.

Market access presents additional challenges. Organic Valley, the largest organic dairy cooperative, added 84 farms to its membership in 2023—meaningful, but limited given interest levels. What’s encouraging for the broader market: USDA AMS data show organic fluid milk accounting for around 7.1% of total U.S. fluid milk sales by early 2024-2025, up from 3.3% in 2010. The market continues growing, but processor capacity limits how quickly supply can expand.

Regional dynamics matter considerably. Premium markets concentrate near urban population centers. A farm in central Wisconsin faces different market access than one in Pennsylvania’s Lehigh Valley or New York’s Hudson Valley. Transportation costs for specialty products often determine viability as much as production capability.

Regional Realities: How Geography Shapes Options

The geographic dimension of this profitability divide deserves more attention than it typically receives. Recent USDA data shows milk production expanding in parts of the High Plains—Texas reached 699,000 head of dairy cows this year, the most in the state since 1958, according to the USDA. Production in Texas has increased approximately 8-10% year-over-year.

Meanwhile, California output has flattened under higher costs, water constraints, and tightening environmental regulations. I recently spoke with a Central Valley producer running 1,200 cows who noted their cost structure has shifted dramatically—water costs alone have nearly doubled over five years, and labor competition keeps pushing wages higher.

Mid-size operations in expanding regions face structural disadvantages when competing with neighbors that are rapidly adding scale. Your region shapes strategic options more than generic industry advice typically acknowledges.

Understanding Decision Timelines

For operations facing compressed margins without premium market access or scale advantages, understanding realistic timelines becomes essential. This is difficult territory, I know. For families who’ve farmed for generations, these calculations extend beyond spreadsheets to identity, legacy, and community.

Industry data from Farm Credit Services and agricultural lenders suggests the progression from sustained negative margins to necessary transition decisions typically spans 18-36 months, depending on starting financial position.

Months 1-6: Working capital reserves absorb losses. Operators often don’t recognize the structural nature of the challenge—it feels like a temporary downturn, another cycle to ride out.

Months 6-12: Operating lines get drawn, and lenders request more frequent reporting. Equity erosion accelerates in ways that become clear on balance sheets.

Months 12-18: The decision window opens. Farms acting during this period typically preserve substantially more equity through planned transitions—strategic sales to neighboring operations, partnership restructuring, or managed wind-downs.

After month 18: Options narrow significantly. Crisis liquidation scenarios preserve far less—often a difference of hundreds of thousands of dollars.

What economists and lenders consistently emphasize: timing matters as much as the decisions themselves. Farms that recognize structural challenges early and act decisively preserve substantially more equity than those that wait for conditions to improve.

The Labor Factor Reshaping Everything

Beyond financial metrics, labor availability increasingly shapes farm viability in ways that profitability data doesn’t fully capture. This is something I’ve been watching closely, and the implications concern me.

National Milk Producers Federation research (conducted by Texas A&M) found that immigrant employees make up about 51% of the U.S. dairy workforce, with farms employing immigrant labor contributing roughly 79% of the nation’s milk supply. UW-Extension confirmed these figures remain current in their 2024 workforce research. Unlike seasonal crop agriculture, dairy can’t access H-2A visa programs—the program specifically excludes year-round operations. This leaves the industry uniquely exposed to changes in immigration policy.

What I’m noticing among top-performing operations is aggressive automation investment—not primarily for current efficiency gains, but as hedges against labor volatility. Automated milking systems, robotic feeders, and activity monitoring reduce labor dependency while maintaining or improving productivity.

For mid-size operations, meaningful automation investments require careful analysis. But farms that view automation solely through current efficiency metrics may be underweighting the risk-management dimension.

Practical Guidance Based on Where You Stand

Understanding these dynamics creates opportunities for informed decision-making. Here’s how I’d think about next steps based on the current situation.

For operations with 18+ months of financial runway:

  • Take beef-on-dairy seriously as a revenue strategy—budget $35-55 per head for genomic testing and expect 2-3 breeding cycles before full optimization
  • Know your actual cost-of-production within a dollar per hundredweight
  • Consider organizational partnerships—shared services, consulting relationships, and peer learning groups provide capacity that individual operations struggle to build alone
  • Evaluate automation economics as risk management, not just efficiency

For operations facing immediate financial pressure:

  • Act earlier rather than later—the equity preservation difference between early and delayed decisions often runs hundreds of thousands of dollars
  • Understand your full range of options—strategic sales, partnership structures, and planned transitions typically preserve more value than crisis liquidations
  • Engage advisors before crisis mode, not during
  • Look at succession realistically—if it’s uncertain, that should factor into timing decisions

For operations positioned for growth:

  • The acquisition environment favors prepared buyers with capital access and clear expansion plans
  • Infrastructure quality matters more than simple herd additions
  • Acquiring cows from liquidating operations while building modern infrastructure often outperforms acquiring aging facilities

Questions Worth Discussing With Your Advisor

  • What’s our precise break-even milk price, and how does it compare to current projections?
  • Are we capturing full value from our genetic program through beef-on-dairy or other strategies?
  • What’s our debt service coverage ratio, and what milk price would put us below 1.0?
  • Do we have a written plan for labor disruption scenarios?
  • If we needed to transition the operation in 18 months, what would that look like?

The Bottom Line

The profitability divide reshaping American dairy isn’t primarily about who works hardest or cares most about their cows. It’s about structural economics, organizational capacity, and strategic positioning in a rapidly evolving industry.

Understanding these dynamics won’t guarantee any particular outcome—but it helps you make decisions with a clear vision. And in an industry where timing and positioning increasingly determine outcomes, that understanding may be the most valuable asset available.

Key Takeaways:

  • The gap is structural, not cyclical. Mid-size dairies face up to $16/cwt in cost disadvantages that longer hours can’t close—driven by differences in labor efficiency, purchasing power, and organizational capacity.
  • 750 cows is the new 100. Operations running 250-1,000 cows are caught in economic no-man’s land: too large to run on family labor, too small to support specialized management teams.
  • Three strategies are creating real separation: Beef-on-dairy breeding, adding significant calf revenue, component-driven culling optimized for current pricing, and precision feeding that compounds gains over time.
  • Timing matters more than optimism. Farms acting early in financial stress preserve substantially more equity than those waiting for conditions to improve—often by hundreds of thousands of dollars.
  • Labor is the underpriced risk. With immigrant workers comprising 51% of dairy labor and producing 79% of U.S. milk, workforce disruption could reshape the industry faster than consolidation.

Complete references and supporting documentation are available upon request by contacting the editorial team at editor@thebullvine.com.

Learn More:

Join the Revolution!

Join over 30,000 successful dairy professionals who rely on Bullvine Weekly for their competitive edge. Delivered directly to your inbox each week, our exclusive industry insights help you make smarter decisions while saving precious hours every week. Never miss critical updates on milk production trends, breakthrough technologies, and profit-boosting strategies that top producers are already implementing. Subscribe now to transform your dairy operation’s efficiency and profitability—your future success is just one click away.

NewsSubscribe
First
Last
Consent

December’s 6ppl Cut Exposes UK Dairy’s Reality: Why 800 Farms Face Impossible Math While Processors Invest Billions

Farmer loses £17k/month. Processor makes £20.5M/year. December’s 6ppl cut forces UK dairy to its moment of truth. Math doesn’t lie.

Editorial Note (Updated November 10, 2025): Following feedback from AHDB, we have updated this article to clarify data sources and correct a attribution error. Where data was previously attributed to AHDB without verification, we have now cited the correct sources or clarified these as industry estimates. Production cost figures vary significantly by source, region, and methodology—we’ve added context to reflect this complexity. We value accuracy and transparency in our reporting and welcome continued dialogue about UK dairy economics.

Executive Summary: Jack Emery asked the BBC if it’s worth getting up at 4 AM anymore—a question now haunting 7,040 UK dairy farms facing £17,000 monthly losses from December’s 6ppl cut. Meanwhile, processors post record profits: First Milk’s £20.5M is called “exceptional.” With farmgate prices at 35.85ppl against estimated 49p/liter production costs (based on industry benchmarking), the math has become impossible. Five strategic paths exist—organic conversion, scaling up, diversification, cooperation, or exit—but most demand capital and time that hemorrhaging farms simply don’t have. Irish farmers reversed similar cuts in 47 days through cooperative ownership; the UK’s different structure blocks that option. The next 90 days determine whether UK dairy finds an unprecedented collective response or accelerates toward just 4,200 farms by 2030, down from today’s 7,040. Behind every statistic, farm families face math that doesn’t work anymore—in an industry where suicide rates already run 3.5 times the national average.

You know that feeling when you open a letter you’ve been dreading? That’s what Jack Emery was describing to the BBC last month. He runs Thistle Ridge Farm down in Hampshire—about 5,000 liters daily, same as a lot of operations I talk with. When he calculated that First Milk’s 6 pence cut means over £100,000 gone from his annual revenue, then asked whether it’s even worth getting up at 4 AM anymore… well, that resonated with pretty much everyone I’ve spoken to since.

The revealing part is how December’s announcement is forcing us to confront something we’ve been dancing around for years. After digging through processor reports, talking with farmers from Scotland to Devon, and watching what happened with those Irish producers in September—I’m convinced we’re seeing the whole structure of UK dairy that’s evolved since the Marketing Board ended in ’94 finally showing which farms have a path forward and which ones honestly don’t.

The Numbers We’re All Running

So let’s talk about the math that’s keeping everyone up at night—because I know you’re doing the same calculations I am. First Milk announced a price of 35.85 pence per liter, effective December 1st, including the member premium. Müller’s Advantage program drops to 40ppl. Arla sits at 42.71ppl from November.

Now, industry benchmarking from various sources suggests average production costs running 48-50 pence per liter, though these figures vary significantly by region and farm type. While AHDB provides valuable market data, comprehensive production cost averages come from multiple sources including Kingshay’s annual Dairy Costings Focus report and regional farm business surveys. That matches what I’m seeing in actual farm accounts, though, as a couple of Scottish producers reminded me recently, if you’re dealing with Highland transport or you’re way off the main tanker routes, add another 2-3ppl just for getting milk to market. Down in Wales, First Milk’s members in Pembrokeshire face similar transport premiums. And operations in Cornwall? They’re looking at some of the highest logistics costs in the country.

Here’s where it gets rough. At First Milk’s 35.85ppl against estimated production costs around 49p (based on industry benchmarking and producer interviews, not a single national average), you’re potentially losing about £13 per liter. For a modeled 250-cow operation doing 1.6 million liters annually—that could mean monthly losses approaching £17,000. This is an illustrative calculation based on reported cost ranges—individual farm economics vary significantly. Not sustainable. Not even close.

The structural challenge of UK dairy economics: Based on industry benchmarking, processors pay farmers significantly below estimated production costs of 48-50ppl, with First Milk’s 35.85ppl potentially creating substantial monthly losses for typical 250-cow operations. This represents systematic market pressure rather than temporary adjustment.

The timing couldn’t be worse. We all lived through this spring’s drought—the Met Office confirmed it was the driest of the century. I was talking with Cumbria farmers who’d already fed a third of their winter silage by August. Down in Somerset, a 180-cow producer I know went through 40% of his reserves. Now they’re buying concentrate feed at £310-340 per tonne for dairy compounds, according to recent market reports, though forage costs vary widely—AHDB reports large bale hay averaging around £120 per tonne. The combined impact of both concentrate and forage costs, while milk checks are about to drop by thousands monthly, creates severe pressure.

Jack Emery mentioned there’s a two-million-liter surplus in the UK. What he didn’t say—but we all know—is that surplus happened because UK production jumped over 6% this year just as global commodity markets started sliding. Classic timing, right?

What Processors Aren’t Telling Us

You know what makes these cuts particularly hard to swallow? First Milk just reported their best year ever. Turnover up 20% to £570 million. Operating profit is hitting £20.5 million. CEO Shelagh Hancock called it “exceptional” in their August report.

The great dairy wealth transfer: First Milk’s ‘exceptional’ £20.5M profit represents systematic extraction from 700 members now facing collective £146M annual losses. When processors profit while suppliers fail, this isn’t market forces—it’s market power abuse worthy of regulatory scrutiny.

So I spent time really understanding processor economics, and what I found is enlightening. Sure, First Milk reports a 3.6% operating margin—doesn’t sound like much. But that number masks what’s actually happening between the farmgate and the final sale.

When processors buy our milk at 35.85ppl, they’re getting basic commodity input. But look what they’re producing—First Milk’s got commodity cheddar going to Ornua, yes, but they’re also making whey protein concentrates that command serious premiums. They’ve got specialty products through BV Dairy, which they bought in February. And their Golden Hooves regenerative cheddar? That’s capturing 50-75% premiums according to their sustainability reporting.

The company line is that commodity markets weakened—AHDB wholesale data shows butter fell £860 per tonne and cheese dropped £310 per tonne between specific trading periods in late summer/autumn—so they need competitive pricing to maintain market access. Note these are short-term price movements, not necessarily indicative of longer trends. We attempted to reach First Milk for additional comment, but received no response by publication.

What really tells the story is where they’re putting their money. Arla announced £179 million for Taw Valley mozzarella capacity in July. Müller’s investing £45 million at Skelmersdale for powder and ingredients. These aren’t maintenance projects—they’re building capacity for global markets that bypass UK retail’s stranglehold on liquid milk.

Kite Consulting’s September 2025 report “Decoding Dairy Disruption” lays it out pretty clearly—processors can achieve much higher margins on specific product lines while reporting modest overall margins. That BV Dairy acquisition is particularly clever… it lets First Milk redirect commodity milk into specialty channels while still pricing our milk based on bulk markets.

Here’s the thing that stands out: this situation isn’t unique to the UK. In New Zealand, Fonterra’s dealing with similar processor-farmer tensions, while U.S. dairy continues its decades-long consolidation, with operations above 5,000 cows becoming the norm rather than the exception. The difference? Those markets have different support structures and scale economics.

Why Ireland’s Success Won’t Work Here

In September, 600 Irish dairy farmers organized through WhatsApp and reversed Dairygold’s price cuts within 47 days. The Irish Farmers Journal covered it extensively, and I’ve had plenty of UK farmers asking, ‘Why can’t we do that?’

It’s not about courage or determination. It’s about structure, and this is crucial to understand.


Factor
Ireland: DairygoldUK: First Milk
Ownership StructureTrue cooperative — farmers own equityCorporate co-op with professional management
Farmer PowerDirect voting rights, board controlLimited influence, no true ownership
Member Base~3,000+ farmer-shareholders~700 members (supplier relationship)
Reversal Timeline47 days via WhatsApp coordinationNO ACTION after 30+ days
Legal FrameworkEstablished Cooperative Society ActNew Fair Dealing Obligations (July 2025—untested)
Organizational Cost£0 (infrastructure existed)£10k+ legal fees + 6 months coordination
Key DifferenceSHAREHOLDERS with legal powerSUPPLIERS with petition power

When those Irish farmers confronted Dairygold management at Mitchelstown, they weren’t suppliers asking for mercy—they were shareholders demanding accountability from a company they legally own. Dairygold, like most Irish processors, operates as a true farmer cooperative, with members holding actual equity and voting rights. The Irish Co-operative Organization Society shows it has 130 enterprises structured this way.

Compare that to us. First Milk claims cooperative status with about 700 members, but check their Companies House filings—it operates more like a traditional company with professional management. Arla UK? We’ve got 2,300 British farmer-owners, but we’re a minority within a 9,500+ member European cooperative historically dominated by Danish and Swedish interests.

Several First Milk members in Scotland and northern England have pointed this out to me: we’ve had the same Fair Dealing Obligations regulations for forming Producer Organizations since July. Same legal framework as Ireland. But forming a PO requires lawyers, coordination, months of work—all while you’re hemorrhaging money and working 90-hour weeks. The Irish? They just activated what already existed.

Five Options—And Why Most Won’t Work

Industry advisors keep presenting these strategic options. After examining each through actual farm finances and talking with producers trying different approaches, let me share what’s actually realistic.

Premium differentiation sounds great at conferences. Organic and regenerative systems can capture the 50-75% premiums reported by the Soil Association. First Milk’s got their Golden Hooves programme. But here’s what nobody mentions: organic conversion takes 3 years at zero premium, while you’re paying 20-30% higher costs, according to the Organic Milk Suppliers Cooperative. Capital requirement? Based on SAC Consulting and Promar International estimates, organic conversion for a 250-cow operation typically requires £500,000-750,000, though it varies by system. Timeline to positive returns? Five to seven years minimum.

Let’s be realistic… show me a farmer losing £17,000 monthly who has half a million pounds and seven years to wait.

The strategic impossibility matrix: Based on modeled calculations showing potential £17,000 monthly losses, typical UK dairy farms face a brutal reality—five of six strategic options require capital and timelines that lie beyond survival horizons. Only strategic exit sits in the viable zone, preserving £300-400k equity before forced liquidation eliminates it. This isn’t pessimism—it’s mathematical reality driving 40% toward exit by 2030.

Scaling for efficiency absolutely works—if you’ve got millions. Industry consultancy benchmarking and international case studies suggest operations over 3,500 cows achieve much lower per-unit costs. But expanding from 250 to 3,500 cows? You’re looking at £26-39 million at current development costs of £8,000-12,000 per cow. Banks want 18 months of positive cashflow before discussing expansion. Current trajectory? Negative £17,000 monthly.

Strategic diversification offers possibilities, but timeline matters. UK Agricultural Finance research shows that glamping units cost £15,000-30,000 each and take 12-18 months to develop, including planning. On-farm processing? That’s £50,000-100,000 minimum plus all the Food Standards Agency requirements. Solar installations take 18-24 months from agreement to the first payment. These might help in the long term, but December’s cash flow crisis needs immediate solutions.

Cooperative formation could theoretically work. The Fair Dealing Obligations regulations, effective in July, provide the framework for Producer Organizations. But NFU Legal Services estimates £5,000-15,000 just for setup, plus coordination and months of organizing. I know of attempts in northern England that stalled because farmers simply didn’t have bandwidth while managing daily crises.

Strategic exit—nobody wants to discuss this, but it’s increasingly the only rational choice for some. A 250-cow operation might extract £300,000-400,000 in equity through planned liquidation now, based on current values. Wait until forced insolvency? That equity evaporates. Solar leases generate £800-1,200 per acre annually according to Solar Energy UK. Environmental schemes offer £200-400 per hectare under Countryside Stewardship. The math is harsh but clear.

What the Next 90 Days Will Tell Us

Key Dates to Watch:

  • December 1: First Milk price cut takes effect
  • January 15: Deadline for meaningful PO formation activity
  • Late January: Processor pricing announcements for February
  • March: AHDB quarterly producer numbers released
Mark your calendar—these six dates determine everything: From December’s price cut through March’s revealing producer numbers, this 90-day window will expose whether UK dairy mounts unprecedented collective resistance or accelerates toward 40% farm losses by 2030. Watch cull volumes (liquation signal), PO registrations (organization capacity), and Q1 exits (acceleration confirmation)—The Bullvine will track each milestone.

December through February’s going to be critical. Looking at historical patterns and current dynamics, here are the indicators I’m watching:

Producer Organization registrations with DEFRA—if farmers are organizing, we should see applications by mid-January. The public registry’s accessible, and as of early November, there’s been nothing significant since October’s announcements.

Cull cow markets are telling. AHDB data shows volumes typically rise 10-15% in winter normally. While some regional auctioneers report elevated activity, AHDB’s national data through early November does not show significant increases above seasonal averages. December data will tell the full story of whether localized reports translate to national trends.

January processor pricing will signal direction. If First Milk, Müller, and Arla maintain or cut further, they’ve calculated that we lack the capacity to respond. Movement toward 40-42ppl might suggest they see organizational stirrings worth heading off.

The Agricultural Supply Chain Adjudicator can impose penalties of up to £30 million under the 2024 regulations. Their annual report shows that UK dairy receives maybe 1 or 2 complaints per year from 7,000+ producers. If that doesn’t change by February despite this crisis… well, it confirms we’re too stretched to fight.

Come March, AHDB publishes Q1 producer numbers. If exits accelerate beyond 190 farms annually toward 240-320, December becomes an inflection point—just not the kind we’d hope for.

Family dairy farming’s extinction timeline: If December’s price cuts trigger projected exit rates, UK dairy contracts from 7,040 to 4,200 operations by 2030—a 40% industry wipeout in five years. Each data point represents 450+ farm families facing impossible decisions, with 2029-2030 showing crisis acceleration as remaining farms hit breaking point.

The Human Side Nobody Talks About

What statistics miss is what’s happening in farm kitchens right now. The Farm Safety Foundation’s research shows farmers are 3.5 times more likely to die by suicide than the general population. But that’s not just a number—it’s about identity.

When you’re third-generation dairy, when your kids show calves at county shows, when your whole sense of self is wrapped in being a good farmer—losing the farm isn’t just business failure. A study in the Journal of Rural Mental Health found that farmers couldn’t separate their personal identity from their farm identity. When the farm failed, they felt they’d failed as humans.

The University of Guelph’s agricultural mental health research documents the progression. First comes problem-solving—cutting costs, deferring maintenance, and longer hours. Then isolation. Farmers stop attending meetings, skip social events, and withdraw. When cognitive distortions take hold—every option looks impossible, exit feels like complete failure—intervention becomes critical.

I’ve noticed that December’s cuts aren’t hitting farmers in isolation. They’re hitting operations already stressed by drought, inflation, and the watching of neighbors exit. For someone already questioning whether it’s worth continuing, that £600 monthly loss can accelerate a psychological crisis dramatically.

What Success Actually Looks Like

Not every story ends in exit, and that’s important to remember. I’ve been talking with operations, finding ways through this that deserve attention.

One farm in Cheshire I visited started transitioning to artisan cheese three years ago—began at local farmers’ markets and now supplies regional delis. Over those three years, they invested about £85,000 total, but they’re now achieving £1.20-1.40 per liter equivalent on cheese versus 36p farmgate. The key was starting small, reinvesting profits, and growing gradually.

Five farms near Dumfries formed an informal buying group last year—nothing fancy, just neighbors coordinating feed orders through WhatsApp for 8-12% better pricing. As the organizer told me, “We can’t control milk prices, but we can optimize what we spend.”

Several farms moved into contract heifer rearing, maintaining dairy expertise while reducing capital requirements and price exposure. Margins are lower—typically £350-400 per heifer based on current arrangements—but it’s predictable income with less stress. One farmer who made the switch two years ago told me simply: “I sleep at night now. Can’t put a price on that.”

What’s encouraging is that these aren’t following standard strategic paths exactly—they’re hybrid approaches that match specific circumstances, available capital, and family goals.

Where This Is Probably Heading

Looking at current industry exit patterns and talking with dairy economists at Harper Adams and Reading… if trends continue, UK dairy by 2030 would likely have 4,200-4,800 operations, down from today’s 7,040. Average herds approaching 300-350 cows. The middle tier—150-400 cow operations—is largely disappearing, replaced by either large-scale operations or small niche producers.

This doesn’t necessarily mean milk shortage. The UK will maintain production, keep shelves stocked, and meet demand. But through a fundamentally different structure than even five years ago.

What December represents isn’t the breaking point—it’s more like the revelation point. When we can’t pretend anymore that working harder, cutting costs, or waiting for recovery will save operations that are structurally challenged in this system.

Practical Guidance for Right Now

If you’re looking at impossible math, here’s what I’d suggest based on conversations with advisors and farmers who’ve navigated this:

First, calculate the true break-even point, including family living. Not just production costs—everything, including realistic family drawings. If that’s above 45 ppl, act immediately rather than hope for recovery.

Second, assess a realistic timeline. How many months can you sustain current losses? Not theoretical credit or hoped-for recovery—actual reserves against actual losses. Most operations I’ve analyzed have lasted no more than 3 to 6 months.

Third, if considering exit, move quickly. Asset values are highest in planned liquidation, not in forced sales—any auctioneer will confirm this. Farms exiting in 2026 will find stronger January markets than June.

Fourth, if staying, commit fully. Half-measures don’t work now. Whether diversification, scale, or differentiation, successful transitions require complete commitment and adequate capital. Without both… it might be time to reconsider.

Finally—and this really matters—remember this isn’t personal failure. The UK dairy’s structure creates these outcomes. You didn’t fail. You’re operating in a system where structural forces favor consolidation, and margin capture happens downstream. Understanding that won’t change outcomes, but it matters for how you frame what comes next.

Support When You Need It

For those struggling with these decisions, support exists. RABI’s 24-hour helpline (0800 188 4444) offers confidential assistance from counselors who understand farming. The Farming Community Network (03000 111 999) provides practical and emotional support from staff with agricultural experience. Rural Support combines business planning with mental health resources.

These aren’t just numbers—they’re staffed by people who understand losing a farm isn’t just losing business. It’s losing identity, legacy, purpose. No shame in needing support through that.

The Bottom Line

December’s 6ppl cut isn’t really about December. It’s about whether the UK dairy’s structure can sustain family-scale farming or whether consolidation toward fewer, larger operations is simply inevitable. Looking at processor investments, organizational challenges, and the mathematics… the direction seems increasingly clear.

Yet within that larger story, individual farmers are writing their own chapters. Some will find innovative adaptations. Others will make dignified exits, preserving family wealth for different futures. Maybe some will catalyze collective action that could still influence the narrative.

What matters now isn’t predicting which unfolds—it’s ensuring farmers have clear, honest information for family decisions. Because behind every statistic, market report, price announcement, there’s a family at their kitchen table, doing math that doesn’t work anymore, trying to figure out what comes next.

That’s the real story for December 2025. Not the 6ppl cut itself, but what it reveals about who has options and who’s running out of time.

A Note on Data Sources UK dairy production costs vary significantly based on source, methodology, and sample. This article draws from multiple sources including:
• Industry benchmarking reports (Kingshay, Promar, SAC Consulting)
• Producer interviews and farm business accounts
• AHDB market price data (where specifically cited)
• Processor annual reports and public statements
• Academic research from UK agricultural universities

We encourage readers to examine multiple data sources when making business decisions. Cost figures presented here represent reported ranges and modeled examples, not definitive national averages. Individual farm circumstances vary considerably. The core analysis and conclusions remain unchanged—UK dairy farmers face severe economic pressure requiring urgent attention and structural solutions.
We welcome input from all industry stakeholders, including AHDB, processors, and producers, to refine our understanding of UK dairy economics. If you have additional data or perspectives to share, please contact editorial@thebullvine.com.

Key Takeaways:

  • December’s Impossible Math: Based on industry cost estimates, many farms face potential losses of £17,000 monthly (35.85ppl milk vs estimated 49p/liter costs) while First Milk reports “exceptional” £20.5M profits—this gap won’t close without structural change
  • Why Ireland’s Fix Won’t Work Here: Irish farmers reversed cuts in 47 days through cooperative ownership UK doesn’t have—forming Producer Organizations requires lawyers, time, and bandwidth you lack while hemorrhaging money
  • Your Real Options: Of five paths forward, only planned exit guarantees equity preservation; organic needs £750k and 7 years; scaling requires £26-39M; diversification takes 18-24 months; cooperation needs resources you don’t have
  • The 90-Day Test: Watch DEFRA PO registrations by January 15, processor pricing late January, AHDB Q1 numbers in March—if nothing shifts, UK dairy accelerates from 7,040 to 4,200 farms by 2030

Learn More:

Join the Revolution!

Join over 30,000 successful dairy professionals who rely on Bullvine Weekly for their competitive edge. Delivered directly to your inbox each week, our exclusive industry insights help you make smarter decisions while saving precious hours every week. Never miss critical updates on milk production trends, breakthrough technologies, and profit-boosting strategies that top producers are already implementing. Subscribe now to transform your dairy operation’s efficiency and profitability—your future success is just one click away.

NewsSubscribe
First
Last
Consent

Decide or Decline: 2025 and the Future of Mid-Size Dairies

Decide or decline: 2025 is the year mid‑size dairies prove that clarity—not cow count—decides success.

If you’ve been milking through the last 20 years, you already know how fast the middle has lost ground. The 800‑cow herds that once anchored local supply chains are now caught between higher costs and tighter credit. It’s not a lack of effort that’s hurting these farms—it’s the system moving faster than most can react.

Rising input costs, tighter labor markets, new regulations, and rising interest rates are changing what “sustainability” means. But what’s interesting here is that the challenge isn’t purely economic. It’s directional.

According to the USDA Economic Research Service, farms milking more than 2,000 cows now produce over 50% of U.S. milk, and they do so 20–25% more efficiently than smaller commercial herds. Meanwhile, Cornell Dairy Markets data shows that smaller farms—under 500 cows—are re‑emerging through organic, grass‑fed, and local marketing models, earning 30–60% above commodity prices.

And that leaves the middle squeezed. Roughly 2,800 U.S. dairies closed in 2024, many of them right in that 700‑ to 1,200‑cow range.

So, what can farms in this category do? Choices look different for everyone—and sometimes hesitation isn’t fear, it’s fatigue. But the operations pulling ahead are finding ways to convert that fatigue into focus, using data, advice, and discipline to move forward deliberately rather than reactively.

Three Viable Paths Forward

That pressure has created three distinct strategies that are working across 2025. Each one is viable—but only with clarity, discipline, and execution.

1. Expansion with Intention

Growth still works in regions where infrastructure supports it, particularly in Idaho, Texas, and parts of the Southern Plains. The Idaho Dairymen’s Association reports milk production up 3% year‑over‑year, driven by mid‑size operations expanding to 2,500‑cow scale.

Land values in productive regions remain reasonable—$6,000–$8,000 per acre, according to USDA NASS Land Values—and processors continue adding demand to match consolidation trends.

The most successful expansions share three core strengths:

  • Debt ratios under 35%. Leverage only where cash flow already proves out.
  • Trained management teams. Family ownership paired with experienced outside managers works best.
  • Nutrient management foresight. Expansion means more scrutiny—planning here protects future flexibility.

Producers in new freestall and dry lot systems report labor efficiency gains of 25–35%, but these gains materialize only when training and system design precede construction. As one veteran Idaho producer put it recently: “Scale magnifies everything—your efficiency and your inefficiency.”

2. Right‑Sizing and Smarter Technology

For many in the Northeast, Upper Great Lakes, and Atlantic Canada, expansion isn’t realistic. The focus has shifted toward doing fewer things better—and technology is the enabler.

The University of Vermont Extension’s 2024 Robotic Dairy Study found that herds between 400 and 600 cows reduced labor costs by about 30% while maintaining or improving milk yield. Precision feeding and cow‑monitoring technology allowed smaller herds to compete through performance rather than scale.

Why 400-600 Cow Operations Are Going Robotic: The Numbers Behind the Revolution

What’s fascinating is that this same pattern holds north of the border. In Ontario and Quebec, under supply management, the economics differ, but the management philosophy doesn’t. Canadian producers are pushing robotics, automation, and stall utilization to maximize returns per kilogram of quota. As one Ontario nutritionist remarked, “Efficiency isn’t negotiable just because prices are stable. It’s the only real lever left.”

A Vermont dairy that converted to organic alongside robotic milking saw its milk price climb to $31.50 per hundredweight—right in line with national organic averages—but its bigger victory was time. Streamlined routines meant more focus on genetics, forages, and cow health.

These examples don’t make smaller easier—they make it more intentional. For the producers making it work, every investment serves a clear purpose: finding a way to manage cattle and people without burning out either one.

3. Optimization over Expansion

Across Wisconsin, Minnesota, and parts of Eastern Canada, the sweet spot has become refining economics within existing boundaries.

A benchmarking study reports farms that lifted their income over feed cost (IOFC) from $7.50 to $10 per cow per day captured roughly $820,000 more annual margin in 900‑cow herds.

That didn’t come from spectacular innovation; it came from fundamentals: tighter TMR consistency, better feed push‑up frequency, controlled parlor scheduling, and enhanced reproductive consistency.

Those farms also focused on butterfat performance above 4.0%, earning premiums of $0.50–$0.75/cwt. Meanwhile, strategic use of beef‑on‑dairy genetics added $350–$400 per calf, according to University of Wisconsin Dairy Research, 2025.

Optimization is about reliability—the daily grind of doing the same things more precisely than the week before. As one Wisconsin producer told me, ‘We stopped chasing bigger and started chasing better—the shift from production expansion to business refinement. And it’s changing how success is measured: not more cows, but more predictable profit.

The Profit Illusion: Why Size Doesn’t Always Mean Success

Scale doesn’t guarantee success—strategy does. Expansion works best for 2,000+ cow operations ($1,640/cow), while premium organic models deliver consistent returns across all sizes, and optimization shines in the 500-1,000 cow sweet spot

At first glance, most producers expect small family dairies to earn more profit per cow, while large commercial herds rely on volume to make up thinner margins. But the data — shown in the chart below — tells a more nuanced storyAt first glance, most producers expect small family dairies to earn more profit per cow, while large commercial herds rely on volume to make up thinner margins. But the data — shown in the chart below — tells a more nuanced story.This visualization, “Three Paths to Profitability: Annual Profit Per Cow by Herd Size (2025),” reveals how performance and efficiency—not size alone—shape economic outcomes across the industry. The chart compares three strategic paths mid-size dairies are following today:

  • Expansion with Intention – scaling to 2,000+ cows in strong infrastructure regions like Idaho and Texas.
  • Right-Sizing + Technology – mid-tier herds (400–600 cows) adopting automation, robotics, and precision management.
  • Optimization over Expansion – 700–1,200-cow herds refining feed, reproduction, and butterfat performance instead of adding capacity.

The higher bar for larger herds doesn’t simply mean big farms take more money home. Instead, their fixed costs — buildings, equipment, professional staff, financing — are spread over thousands of cows, so cost per unit drops while profit per cow rises modestly. Conversely, smaller farms, even when they receive premium prices for organic, grass-fed, or local milk, often operate with higher feed and labor costs per cow, which narrows daily profit margins.

But here’s the twist: while smaller dairies may show lower profit per cow, the total income is often concentrated in a single family. A 300-cow family farm might return $250,000 in annual profit that supports one household. In contrast, a 2,500-cow operation could generate $2 million in total profit — but that figure is usually divided among multiple owners, investors, lenders, and management teams.

That’s why this chart matters. It debunks the myth that a larger herd size automatically leads to better take-home profit. The true divide isn’t just scale — it’s about who captures the value. Whether driven by volume, precision, or premium branding, profitability in today’s dairy industry is still deeply personal.

Regional Realities Still Matter

The Mid-Size Squeeze Is Real: Wisconsin Alone Lost 313 Dairies in 2024

It’s tempting to think every dairy could apply the same model, but geography dictates strategy more than ever.

In the Western U.S., large‑scale operations thrive on efficiency, infrastructure, and climate.
In the Midwest and Ontario, cooperative structures and component‑based pricing reward consistency and milk quality over expansion.
In the Northeast and Quebec, sustainability and locality drive brand value, with consumers drawn to transparency and traceability.

No matter the region, the takeaway is the same: you can’t copy‑paste a business plan from across the border. The economics—and the culture—demand regional authenticity.

Lessons Learned from Those Who Tried

The $950 Bull Calf Revolution: How Genetics Turned Dairy’s Biggest Liability Into Nearly 6% of Revenue

Every evolution comes with its scars. One Midwestern family who downsized from 850 to 500 cows underestimated the adjustment period after installing robots. Production dropped nearly 15% for a year as cows and staff adapted. They built it back, but only thanks to strong lender trust and patience.

Meanwhile, in Idaho, several expansions paused midway as interest costs bit into construction financing. Those who made it through had one thing in common—extra contingency funds.

The common thread in both cases is timing. Transition phases nearly always take longer and cost more than projected.

The Habits of Survivors

The dairies still standing out—on both sides of the border—tend to have three things in common:

  1. Financial clarity. Debt ratios under 30% and three‑month operating cash reserves. Equipment and upgrades are justified only by measurable efficiency gains.
  2. Revenue diversification. Beef‑on‑dairy programs, custom forage work, or digesters providing supplemental income that stabilizes the primary enterprise.
  3. Generational transparency. Farms with succession plans already in motion make faster, cleaner business decisions.

At the 2025 Canadian Dairy XPO, one Quebec producer put it best: “You can borrow money for cows, not for uncertainty.” It’s a kind of clarity every mid‑size farm needs right now.

The Price of Standing Still

The Compeer Financial Producer Insights 2024 Report warned that dairies without defined five‑year plans lost 6–8% of equity annually due to deferred maintenance, inefficiency, and missed opportunities.

As one producer shared at a Dairy Strong conference in Wisconsin, “We thought doing nothing was the safe move. Turns out, the slow leak was killing us.”

A decade ago, waiting felt like patience. Today, it feels like pressure. Between higher interest, constant tech change, and unpredictable milk prices, even standing still costs money. Most farmers know what they need to do—it’s finding the time, cash, and confidence to do it that’s the battle.

Why 2025 Matters

When the dust settles, 2025 may be remembered less for its milk price trends and more for its management decisions. Expansion, specialization, or optimization—all three can succeed. The real test for mid‑size dairies is whether they’ll commit to one.

As one Idaho producer said, ‘The biggest gamble we took was standing still.’ Across barns and borders, you hear the same thing now: success starts when you stop waiting for the perfect signal. Nobody’s certain—but everyone who’s moving, is learning.

The Bottom Line

Whether you’re milking 200 cows in Quebec or 2,000 in Idaho, the shift facing mid‑size dairies isn’t about capacity—it’s about clarity. The farms that emerge stronger will be those that choose their lane and drive it with intent.

This year, the biggest risk isn’t expansion or automation—it’s indecision. As the market keeps changing, so does the window for action.

What steps are you taking on your operation to define your path for 2025 and beyond?

Key Takeaways

  • Decisiveness defines survival. The mid‑size dairies thriving in 2025 are those that choose a direction and commit fully.
  • Play to your region’s strengths. Expansion works out West, optimization excels in the Midwest, and value branding wins in the East and Canada.
  • Technology can level the field. Automation and precision tools make smaller herds competitive again—but only when data drives decisions.
  • Measure like a business, not a tradition. Top dairies track IOFC, butterfat, and repro weekly to stay ahead of volatility.
  • The real cost is waiting. Every season without a plan quietly drains equity, opportunity, and control.

Executive Summary:

Across the U.S. and Canada, mid-size dairies are facing a make-or-break moment. Once the steady foundation of milk production, 800–1,200 cow farms are now being squeezed between large-scale efficiencies and small-farm premiums. But what’s interesting is how the survivors are rewriting the playbook. From robotic systems in Vermont to data-driven optimization in Wisconsin and quota-smart efficiencies in Ontario, producers are proving that success doesn’t depend on herd size—it depends on clarity. The dairies making bold, informed decisions—whether to expand, modernize, or specialize—are staying strong. In 2025, waiting for perfect conditions isn’t safety anymore—it’s surrender.

Complete references and supporting documentation are available upon request by contacting the editorial team at editor@thebullvine.com.

Learn More:

  • Why This Dairy Market Feels Different – and What It Means for Producers – This strategic analysis provides the latest market data behind the consolidation trends mentioned in the main article. It reveals specific technology costs and ROI timelines, helping you financially plan for the necessary strategic shifts your operation needs to make now.
  • Robotic Milking Revolution: Why Modern Dairy Farms Are Choosing Automation in 2025 – For producers considering the “Right-Sizing” path, this article offers a deep dive into the real-world impact of automation. It demonstrates how robotic systems deliver measurable gains in labor efficiency, data collection, and herd health, justifying the capital investment.
  • BST Reapproval: The Key to Unlocking Dairy Sustainability – This piece offers a tactical guide for the “Optimization” strategy, focusing on a specific tool to improve feed efficiency and profitability without expansion. It provides clear protocols and data to enhance your farm’s economic and environmental performance within your current footprint.

Join the Revolution!

Join over 30,000 successful dairy professionals who rely on Bullvine Weekly for their competitive edge. Delivered directly to your inbox each week, our exclusive industry insights help you make smarter decisions while saving precious hours every week. Never miss critical updates on milk production trends, breakthrough technologies, and profit-boosting strategies that top producers are already implementing. Subscribe now to transform your dairy operation’s efficiency and profitability—your future success is just one click away.

NewsSubscribe
First
Last
Consent

How One Island Lost £5.44 Million Preventing Nothing—And Why Your Operation Should Care

What happens when biosecurity economics don’t add up? Ask the 30 farms losing millions on an island

EXECUTIVE SUMMARY:  What farmers are discovering through the Isle of Man’s dairy crisis is that well-intentioned biosecurity measures can create more economic damage than the diseases they’re designed to prevent—particularly for operations caught in the vulnerable 100-200 cow range. The island’s 30 dairy farms have lost £5.44 million (40% of production capacity) implementing prevention measures for a disease that never reached their shores, while the UK recorded just 129 Bluetongue cases total according to DEFRA’s July reports. This situation mirrors challenges facing isolated operations from Hawaii to Vermont, where geographic constraints multiply compliance costs while limiting adaptation options. Recent AHDB data showing 440 UK farm closures last year—predominantly in that challenging middle scale—suggests this isn’t an isolated incident but part of a broader pattern where regulations unintentionally accelerate consolidation. The key insight emerging from multiple regions is that operations finding success are those building resilience through diversification, with direct sales capturing nearly double farmgate prices (85p versus 44p per pint in Huxham’s case) and collaborative approaches to processing and purchasing showing promise. For producers navigating similar pressures, the lesson is clear: understanding your operation’s true vulnerabilities and building flexibility before crisis hits has become as important as production efficiency itself.

dairy biosecurity economics

Award-winning dairy operations that lose 40% of their production reveal important insights about biosecurity economics—with practical applications for farms navigating similar regulatory challenges. As I’ve been digging into the numbers and talking to people about this, what’s emerging is… well, it’s something we all need to think about.

The Numbers That Tell the Story

The brutal reality: 92.3% of the £5.44 million loss came from milk production collapse, not animal deaths or treatment costs. This wasn’t a disease impact—it was an economic strangulation.

So here’s what we’re looking at. The Isle of Man Creamery processes about 26 million litres annually from 30 local farms—that’s according to their own reports and government statistics. A fairly standard setup for an island of that size. However, they’ve lost 40% of their production capacity, which translates to approximately £5.44 million being lost from a dairy sector worth around £13.6 million in total.

Now, here’s where it gets interesting. DEFRA’s July report documented 129 Bluetongue cases across the entire UK. The Isle of Man? Zero cases. Not one. Yet they’re hemorrhaging millions because of prevention measures.

It’s worth noting that we’ve all seen disease prevention work brilliantly—FMD never got here, and that saved countless operations. But when prevention costs exceed any reasonable estimate of disease impact… that’s when we need to ask hard questions.

Carl Huxham runs Cronk Aalin Farm on the island—40 cows, getting about 6,000 to 7,000 litres per cow annually. He’s been pretty open about the challenges, particularly the shipping costs. Everything that comes to an island—feed, equipment, replacement parts—it all costs more. And that’s before you even factor in these disease restrictions.

How Things Compound on Each Other

Here’s the uncomfortable math: Isle of Man farmers paid £300 per cow preventing a disease that typically costs £135 per cow when it actually hits. Meanwhile, H5N1 shows what happens when prevention fails—£950 per affected animal.

What’s particularly noteworthy about this situation is how multiple pressures have converged. And honestly, many of us are dealing with at least some of these same challenges…

The disease control measures have been in place since November 2023—we’re now nearly two years into a complete livestock import ban from the UK. Meanwhile, mainland operations can move cattle within England relatively freely as of this July. So, you have island farmers who can’t bring in replacement heifers or new genetics, while their mainland counterparts are operating almost normally.

Then there’s the feed situation. You probably felt it too—AHDB documented hay yields running about 60% below normal this year. Tough everywhere, right? But when you’re on an island, or even just in a remote area, those transportation costs can double or triple. Many operations in Hawaii face similar challenges, and increasingly, those of us in more isolated mainland regions are seeing comparable dynamics as local suppliers disappear.

The September equipment failure at their butter production line… well, that hits close to home for many of us. USDA processing efficiency studies generally show you need somewhere between 30 and 50 million litres annually for optimal efficiency, depending on your setup. When you’re running below that threshold—and most smaller regional operations are—every breakdown becomes critical because you can’t justify the expense of backup systems.

And here’s something interesting: the island attracts over 329,000 tourists annually, generating approximately £212 million, according to their tourism board. That creates wild seasonal swings in demand. Think about operations near Yellowstone or in Vermont’s ski country—same dynamic. You need production flexibility exactly when regulations eliminate it.

The Middle-Scale Challenge We’re All Facing

The data reveals dairy’s dirty secret: mid-size operations face 20% higher costs than small direct-sales farms or large-scale dairies. Isle of Man’s 124-cow average puts them squarely in the death valley.

The Isle of Man farms average about 124 cows each, which puts them right in that challenging middle zone. You know what I mean—too big for effective direct marketing in most cases, too small for real processing efficiencies.

The Center for Dairy Profitability up in Wisconsin has been documenting this for years. Operations between 100 and 200 cows often face the highest per-unit costs. It’s not just a US phenomenon either—the latest AHDB data shows that 440 UK farms closed last year, a 6% decline, bringing the total to about 7,130. And which operations are surviving? Generally, the small, nimble ones are those doing direct marketing, or the large ones with significant scale advantages.

What makes island situations particularly tough—and this applies to geographically isolated mainland areas too—is the limited ability to adjust. You can’t just buy more land when you’re surrounded by water. Same problem if you’re in a valley where all the good ground’s taken, or where development pressure has driven land prices through the roof.

Different Approaches, Different Results

Examining how various regions are addressing these pressures offers some insight…

New Zealand’s interesting. Fonterra controls somewhere between 90% and 95% of its milk supply, according to its annual reports. You’d think that level of coordination would guarantee good prices, but many producers there are struggling with profitability, especially when global prices dip. Market concentration doesn’t automatically mean farmer prosperity—something to keep in mind as we observe consolidation in the industry.

India went a completely different direction. According to the National Dairy Development Board, the Amul cooperative model serves approximately 100 million farmers. They’ve maintained substantial import protection, and you know what? They’re now the world’s largest milk producer. Different system, different philosophy, but it’s working for them.

Iceland’s doing something really creative—using its abundant renewable energy to develop alternative proteins, such as Spirulina. Their 2021 Food Policy outlines this shift pretty clearly. Sometimes the answer isn’t competing harder in the same game; it’s finding a different game altogether.

In North America, we’re seeing various adaptive strategies emerge. Some regions are developing collaborative approaches to processing and purchasing. Others are investing heavily in renewable energy to offset costs. Each area seems to be finding its own path forward, though the specific models vary considerably based on local conditions and regulations.

Practical Considerations Worth Thinking About

Based on what’s happening on the Isle of Man and patterns emerging elsewhere, several things deserve our attention…

On biosecurity economics: It’s worth sitting down with your vet and running real numbers. What would a disease outbreak actually cost your specific operation? Are there graduated response options—such as testing, short quarantines, or targeted vaccination—that could provide protection without shutting everything down? These conversations are better had before a crisis hits.

Building resilience into operations: The farms weathering challenges best seem to have multiple approaches working. Direct sales can capture significant premiums—Huxham gets 85p per pint direct versus the 44p farmgate average. That’s not small change. Having some feed production capability, maintaining genetics that work in your environment… these buffers matter more than ever.

Understanding your real position: Geographic location cuts both ways. Being isolated can mean higher input costs, but it can also mean loyal local customers who value what you produce. The key is matching your strategy to your actual circumstances, not what you wish they were.

The Regulatory Reality We’re All Navigating

Here’s something we need to acknowledge: regulations have different impacts on different scales. And it’s not necessarily intentional—it’s just how the math works out.

Small operations often find ways to work within or around certain requirements through direct sales and simplified processes. Large operations spread compliance costs across a massive volume. However, that middle segment—where many of us operate—carries the full regulatory burden without the scale to truly absorb it.

According to Dairy UK’s analysis, approximately 87% of the UK market’s processing capacity is controlled by three major companies. Each new regulation, regardless of intent, tends to accelerate this concentration. It’s not a conspiracy; it’s just a matter of economics.

From the processors’ perspective, they’re dealing with retailer demands, food safety requirements, and international market access needs. Regulators generally aim to protect both animal and human health. The disconnect occurs when on-farm economic realities are not adequately factored into these decisions.

What This Means Going Forward

Climate variability isn’t going away. Disease pressures will continue. And regulatory complexity tends to increase over time. These are realities we need to plan around…

Supply chain resilience has taken on new importance. COVID taught us about sudden disruptions, but this Isle of Man situation shows that regulatory disruptions can be equally impactful—and potentially longer-lasting.

The scale required for efficient processing continues to rise. Most analyses suggest you need at least 30 to 50 million litres annually for competitive efficiency now. That has real implications for regional processing availability and producer options.

Perhaps most importantly, we need better frameworks for evaluating the costs of prevention versus the actual risk. This requires dialogue between all stakeholders—producers, veterinarians, processors, and yes, regulators. Everyone needs to understand the full picture.

Moving Forward Together

What the Isle of Man situation ultimately teaches us is about adaptation and resilience…

Some operations are finding creative solutions through cooperation, including shared processing, group purchasing, and collaborative marketing. These aren’t perfect solutions, but they show that working together can create opportunities that don’t exist individually.

The key seems to be recognizing challenges early enough to adapt proactively rather than reactively. This requires an honest assessment of our situations, learning from others’ experiences, and sometimes making difficult decisions about the future direction of our operations.

It’s worth remembering that this industry has always been built on resilience and innovation. We’ve weathered challenges before, and we’ll weather these too. But it helps to learn from each other’s experiences—whether those experiences come from an island in the Irish Sea or a farm down the road.

What patterns are you seeing in your region? Because they’re there, even if they haven’t made headlines yet. Sometimes the best insights come from comparing notes before a situation reaches a crisis level.

Feel free to share your thoughts at news@thebullvine.com. After all, we’re all in this together, whether we’re on actual islands or just dealing with our own unique challenges that can make us feel that way.

These are indeed interesting times in the dairy industry. But then again, when haven’t they been?

KEY TAKEAWAYS:

  • Calculate your biosecurity ROI: Operations spending more than £300 per cow on disease prevention should reassess—actual outbreak costs often run £120-150 per infected animal based on European data, meaning many farms are overspending by 200% or more
  • The 124-cow trap is real: Farms between 100-200 head face 15-20% higher per-unit costs than either smaller direct-marketing operations or 300+ cow dairies according to Wisconsin’s Center for Dairy Profitability—knowing which side of this divide you’re on shapes every strategic decision
  • Direct sales change everything: Producers capturing retail prices (like Huxham’s 85p per pint) generate margins that can offset compliance costs that would sink commodity-focused operations—even partial direct marketing can improve resilience by 30-40%
  • Geography multiplies challenges: Remote and island operations face feed cost premiums of 200-250% plus limited genetic improvement options—if you’re paying more than £50/tonne above regional averages for inputs, alternative production models deserve serious consideration
  • Collaborative solutions work: Regional processing cooperatives, shared equipment purchases, and group feed buying are helping mid-size operations achieve economies of scale—Minnesota and Ohio examples show 20-30% cost reductions through cooperation

Complete references and supporting documentation are available upon request by contacting the editorial team at editor@thebullvine.com.

Learn More:

  • HPAI H5N1: The 2025 Science-Based Dairy Farm Survival Guide – This article provides a tactical blueprint for effective biosecurity, revealing specific herd health protocols and low-cost prevention strategies that can reduce your risk without the massive financial outlays seen in the main article’s example. It details how to optimize PPE, manage farm visitors, and leverage herd status programs.
  • Why This Dairy Market Correction Feels Different – and What It Means for Our Farms – Beyond the Isle of Man, this piece offers a broader strategic perspective on the global dairy market. It breaks down the forces driving industry consolidation and provides data-backed insights on how to build resilience against volatile prices and survive the extended market pressures forecast through 2026.
  • AI and Precision Tech: What’s Actually Changing the Game for Dairy Farms in 2025? – This article explores the innovative solutions farmers are using to overcome the “middle-scale challenge.” It provides specific return-on-investment numbers for technologies like AI-driven feeding and automated health monitoring, helping you prioritize capital investments that deliver tangible cost savings and efficiency gains.

Join the Revolution!

Join over 30,000 successful dairy professionals who rely on Bullvine Weekly for their competitive edge. Delivered directly to your inbox each week, our exclusive industry insights help you make smarter decisions while saving precious hours every week. Never miss critical updates on milk production trends, breakthrough technologies, and profit-boosting strategies that top producers are already implementing. Subscribe now to transform your dairy operation’s efficiency and profitability—your future success is just one click away.

NewsSubscribe
First
Last
Consent

Navigating Today’s Dairy Margin Squeeze: Insights from the Field

How can your dairy adapt to tighter margins and changing market realities in 2025? Here’s what to know.

EXECUTIVE SUMMARY: Margin pressures across the dairy industry are intensifying, with the Dairy Margin Coverage dropping nearly $1.40 per hundredweight year-over-year as of July 2025, while feed costs hold steady near $9.86 per hundredweight. This squeeze is prompting many producers to rethink their strategies, especially as butter production surged to 180 million pounds in July — the highest since 1942 — and cheese output climbed 2.1% year-over-year. What farmers are discovering is that component quality, particularly butterfat and protein percentages, now plays a critical role in farm profitability, often adding $400+ more income per cow annually compared to volume-focused approaches. Feed management strategies ranging from modest 5% cost trimming to more aggressive 15% reductions are becoming essential tools, alongside evolving culling benchmarks that favor efficiency and component production over herd size. These trends vary significantly by region, with Midwest producers finding different opportunities compared to drought-impacted operations on the West Coast. As we move through 2025, producers with proactive, data-driven mindsets who can adapt to these shifting realities are positioning themselves for long-term success and profitability.

KEY TAKEAWAYS:

  • Margin reality check: Dairy Margin Coverage dropped nearly $1.40/cwt year-over-year while feed costs remain elevated at $9.86/cwt, requiring strategic adjustments to maintain profitability
  • Component focus pays: Optimizing butterfat and protein levels can boost individual cow income by $400+ annually, making quality management more valuable than volume production
  • Strategic feed management: Cost reduction approaches from 5% to 15% trimming help operations navigate tight margins while maintaining sustainable production levels
  • Evolved culling standards: Industry benchmarks now favor cows producing above 18,000 pounds annually with controlled health and reproduction expenses under $300 per year
  • Regional adaptation matters: Successful producers are tailoring strategies to local conditions, from Midwest corn basis opportunities to California drought management challenges
dairy profitability, herd management, dairy cost reduction, farm efficiency, butterfat protein

You know, when butter prices dropped from $2.37 to $1.77 a pound this summer, it wasn’t just a market correction — it was a serious wake-up call for many of us in the dairy community. At a recent industry conference, I spoke with producers from across the Midwest and Northeast, and it was clear folks were split on how to handle what we’re facing.

Some jumped in right away, making hard calls to reshape their operations for what looks like a longer stretch. Others, and I understand this completely, are hoping prices bounce back to levels we’ve grown used to.

This all goes to show it’s not just about the numbers on paper. It’s about mindset — how we process what’s coming at us and decide what our next move should be.

The Reality Check

Here’s what the latest USDA data shows us: the Dairy Margin Coverage margin dropped to about $10.94 per hundredweight last July. That’s nearly $1.40 less than the previous year.

At the same time, feed costs held steady around $9.86 per hundredweight, meaning our profit margins are getting squeezed from both ends.

I was talking with a producer near Eau Claire, Wisconsin, who stayed up one night running calculations. She figured out that her 100 lowest-producing cows were costing her about $25 every single day — nearly $9,000 a year just from those underperformers. That’s real money walking out the gate.

And here’s the thing — this impacts us all differently depending on where we farm. Many Midwest operations report some breathing room with corn and soybean prices stabilizing, but producers in places like California are still dealing with drought conditions and higher feed costs.

The Supply Picture

Nationally, the production numbers tell quite a story. U.S. butter production hit 180 million pounds in July — the highest we’ve seen since 1942. Cheese production reached 1.21 billion pounds, up about 2.1% from last year.

That’s a lot of product hitting the market, and it’s creating pressure we haven’t experienced in decades.

But here’s what’s really catching my attention: the milk check is changing. We’re seeing a clear shift toward rewarding butterfat and protein performance rather than just volume.

Component Focus Becomes Critical

Current USDA pricing shows butterfat at about $2.73 a pound, with protein close behind, around $1.96. Getting those component levels right can add hundreds of dollars per cow annually.

I’ve been hearing from producers who’ve made this transition successfully. One operation I am familiar with in central Wisconsin focused on increasing butterfat levels to 4.8% and protein to 3.6%. That producer told me it adds roughly $440 per cow each year compared to animals with lower components.

So we’re not just talking about small adjustments here. These component improvements can make a meaningful difference in your bottom line.

Feed Strategies That Work

Feed management has become absolutely critical. University of Minnesota Extension research emphasizes the importance of what they call “smart feeding” — trimming costs strategically without sacrificing the nutrition needed to maintain production.

I’m seeing farms take generally three approaches:

Light adjustments — cutting about 5% of feed costs with minimal impact on milk production. This might save around $62,500 annually on a 500-cow operation.

Moderate cuts — accepting 10% reductions in feed expenses, knowing milk output might drop a few percentage points. We’re talking about $125,000 in potential savings here.

Aggressive moves — some operations are making 15% cuts to feed costs. It’s tough medicine, but for farms in survival mode, it can mean $187,500 in annual savings.

Feed costs consistently represent about half of most dairy operations’ total expenses. That means how you handle this piece can really make or break you during tight margin periods.

Strategic Culling Decisions

We need to talk about culling, too, because the standards have definitely shifted.

Where once a cow producing 16,000 pounds annually might have earned her keep, now we’re looking at closer to 18,000 pounds as the minimum. Animals earning less than $4,500 annually or costing more than $300 in health and reproduction expenses are becoming harder to justify keeping.

These benchmarks come from Pennsylvania and Kentucky extension research, and they match what I’m hearing from producers throughout the Midwest and Northeast.

What’s particularly noteworthy is the trend toward smaller, more focused herds — generally 200 to 300 cows — emphasizing efficiency and component production rather than just herd size.

This reflects broader industry changes we’re all witnessing… a move toward what I’d call precision dairying, where every animal’s contribution really matters.

The Mindset Factor

And that brings me to something crucial — mindset.

The producers who ask themselves, “How will this situation affect my farm five or ten years from now?” tend to be the ones making proactive decisions today.

Others are taking a wait-and-see approach, which honestly can be the right call depending on your specific circumstances. However, it does leave some operations more vulnerable if these margin pressures persist longer than expected.

From what I’ve observed, staying close to the data — tracking cold storage levels, production statistics, processor demand patterns — helps keep you ahead of the curve rather than just reacting to what’s already happened.

Simple Math That Matters

Ready to run some numbers on your own operation? Here’s a calculation that often opens eyes:

Take your 100 slowest-producing cows. If they’re averaging 45 pounds daily and you’re losing about 55 cents per hundredweight on their milk, that means you’re losing roughly $25 every day from that group.

Multiply that out over weeks and months — it becomes a real drain on cash flow.

This is why managing butterfat and protein levels, along with fresh cow care and transition period management, has become such a game-changer for operations trying to stay profitable.

Regional Considerations

It’s worth noting how different regions are adapting based on their specific challenges.

In Wisconsin operations, where corn basis has stabilized somewhat, producers have more flexibility in feed formulation strategies. Pennsylvania farms are often leveraging their proximity to Northeast premium markets. Even in challenging areas like California’s Central Valley, innovative producers are finding ways to optimize water usage while maintaining high-quality components.

These regional differences remind us there’s rarely a one-size-fits-all solution to current market pressures.

The Bottom Line

All these operational changes aren’t comfortable, and they require shifting away from approaches that worked well in different market conditions. But they represent the kind of strategic thinking that helps farms not just survive challenging periods, but position themselves for whatever comes next.

The producers I see adapting most successfully aren’t necessarily those with the biggest operations or the most capital. They’re the ones willing to analyze data objectively, make difficult decisions promptly, and focus on long-term sustainability rather than short-term comfort.

Such focus on operational efficiency — though demanding — has proven essential for many producers staying competitive during this margin squeeze.

If you want to compare notes, work through some calculations, or just talk through your specific situation, I’m here. We’re all better when we share what we’re learning.

Complete references and supporting documentation are available upon request by contacting the editorial team at editor@thebullvine.com.

Learn More:

Join the Revolution!

Join over 30,000 successful dairy professionals who rely on Bullvine Weekly for their competitive edge. Delivered directly to your inbox each week, our exclusive industry insights help you make smarter decisions while saving precious hours every week. Never miss critical updates on milk production trends, breakthrough technologies, and profit-boosting strategies that top producers are already implementing. Subscribe now to transform your dairy operation’s efficiency and profitability—your future success is just one click away.

NewsSubscribe
First
Last
Consent

China’s $198 Million Dairy Collapse Exposes the Fatal Flaw in Volume-First Thinking

Stop chasing milk yield records. China’s $198M loss proves volume-first thinking destroys profits—optimize cost efficiency instead.

EXECUTIVE SUMMARY: The dairy industry’s long-held assumption that maximizing milk production per cow equals maximum profits has been catastrophically disproven by China’s $198 million dairy collapse. Despite achieving impressive yields of 11,000-12,000 kg per cow and hitting 85% dairy self-sufficiency two years early, China’s largest producers are hemorrhaging billions because they optimized for the wrong metric. Modern Dairy posted a staggering RMB 1.417 billion loss in 2024, while raw milk prices crashed by 17% as production costs nearly doubled in New Zealand due to its dependency on imported feed. The brutal math reveals China’s fatal flaw: production surged 31.6% while consumption grew only 3.3%, creating a 27-month consecutive price decline that’s destroying margins industry-wide. Meanwhile, New Zealand’s “inefficient” 4,500 kg per cow system maintains the world’s lowest production costs at US$0.37 per liter compared to China’s US$0.48+ per liter. This crisis highlights how volume-obsessed operations often sacrifice profitability per dollar invested—the only metric that truly matters for long-term survival. Every dairy operation needs to immediately calculate its true cost per unit of milk solids and evaluate whether it is optimizing for profitable efficiency or excessive volume.

KEY TAKEAWAYS

  • Cost Structure Beats Volume Every Time: New Zealand’s pasture-based system produces 400 kg of milk solids at US$0.37 per liter while China’s high-input model costs US$0.48+ per liter—proving that operations above US$0.48 per liter are in the danger zone regardless of impressive per-cow yields.
  • Feed Dependency Creates Structural Disadvantage: China’s reliance on imported feed for over 50% of production costs demonstrates why operations should evaluate feed conversion ratios against domestic feed availability rather than chasing maximum DMI through expensive supplements.
  • Market Diversification Trumps Volume Optimization: With China’s infant formula imports declining 37.1% between 2021 and 2024 and the demographic winter reducing the number of children aged 0-3 from 47 million to 28 million, smart operations are pivoting to premium products that command price premiums of 60% or more, rather than focusing on commodity volume.
  • Geopolitical Risk Now Exceeds Production Risk: New Zealand captured 46-51% of China’s import market through FTA access while U.S. exports collapsed under 125% tariffs, proving that diversified market portfolios and political risk management are now as critical as genetic merit and feed efficiency.
  • Robotic Milking ROI Requires Strategic Focus: Before investing $150,000-$250,000 per robot, operations must evaluate whether automation optimizes profit per dollar invested or just automates volume-obsessed thinking—China’s high-tech approach is proving that maximum throughput doesn’t equal maximum profitability.
dairy profitability, milk production efficiency, feed efficiency technology, global dairy markets, dairy cost reduction

What if the dairy industry’s obsession with maximizing milk per cow is actually destroying profitability? China’s spectacular dairy implosion has just shattered one of agriculture’s most sacred assumptions: that higher production automatically equals higher profits. With Modern Dairy posting catastrophic losses of RMB 1.417 billion (USD 198.4 million) for 2024, and raw milk prices crashing 17% in a single year, the world’s largest dairy market has proven that volume-first thinking is financially catastrophic.

This isn’t just China’s problem—it’s a wake-up call for every dairy operation worldwide.

The Volume Trap: Why China’s Production Success Became Its Biggest Failure

Here’s the story nobody saw coming: China actually won the production game. They hit their ambitious 2025 target of 41 million tons two years early, achieved 85% dairy self-sufficiency, and built some of the most technologically advanced dairy operations on the planet. Their elite farms are cranking out 11,000-12,000 kg per cow annually—numbers that would make any consultant drool.

So why are they hemorrhaging billions?

The answer reveals everything wrong with conventional dairy thinking. While China focused on maximizing milk production per cow through expensive imported feed and intensive systems, it created production costs nearly double those of pasture-based competitors, such as New Zealand. New Zealand’s pasture-based system achieves a five-year average total cost of production of US$0.37 per liter, compared to around US$0.48 per liter for other regions.

But here’s where it gets really brutal. While raw milk production surged 31.6% between 2018 and 2024, per capita dairy consumption grew by merely 3.3% in the same period. You don’t need an economics degree to see the problem—they built a production Ferrari without checking if anyone wanted to buy gas.

The Perfect Storm That Nobody Predicted

Three devastating forces hit China’s dairy market simultaneously, and each one exposes a flaw in volume-first thinking:

Economic headwinds crushed consumer spending. With the Consumer Price Index falling 0.7% in February 2025 and youth unemployment reaching record highs, Chinese families are cutting dairy purchases first. When you’re optimizing for maximum volume instead of profitable efficiency, you can’t adapt to demand shocks.

Demographics turned brutal. China’s birth rate decreased from 10.48% in 2019 to 6.77% in 2024, with the number of children aged 0-3 years dropping from over 47 million to just under 28 million. The infant formula market, which had driven premium dairy demand, collapsed, with China’s infant formula imports declining 37.1% between 2021 and 2024.

The cost structure was backwards from day one. China copied America’s high-input, confinement model without America’s cheap feed base. With over 50% of production costs tied to imported feed, they built a system that could never compete on cost, exactly the wrong foundation for a volume-focused strategy.

The Price Collapse That’s Rewriting the Rules

The numbers tell a story that should terrify every volume-obsessed operation. As of May 2024, dairy producers in China experienced a 27-consecutive-month, year-over-year decline in milk prices due to overproduction.

Let that sink in: 27 straight months of falling prices.

Raw milk prices crashed from a peak of 4.38 yuan per kilogram in 2021 to just 3.14 yuan by late 2024. However, here’s the kicker—current prices have fallen to 2.6 yuan per kilogram, while feeding costs alone average 2.2 yuan per kilogram. They’re essentially paying to give milk away.

The financial carnage is historic. Mengniu Dairy saw its net profit plummet by 97.8% in 2024, falling to approximately RMB 105 million (USD 14.7 million). Modern Dairy’s loss of RMB 1.417 billion represents more than just bad luck—it’s evidence that their entire business model was fundamentally flawed.

The Desperate Powder Play That’s Making Everything Worse

Here’s where the crisis becomes almost comical in its predictability. Faced with a daily surplus, Chinese processors convert an average of 20,000 tons of raw milk into powder every single day, accounting for about 25% of their total milk collection.

Sounds logical, right? Convert perishable milk into storable powder. Except there’s one tiny problem: with production costs around 35,000 yuan per ton and selling prices of only 15,000-19,000 yuan, processors lose more than 10,000 yuan for every ton of powder they produce.

Think about that business model for a second. They’re deliberately producing a product that loses money on every unit, hoping to make it up in volume. It’s the volume-first mentality taken to its logical, devastating conclusion.

Why Robotic Milking Might Be the Next Volume Trap

Now here’s where this gets uncomfortable for North American producers. The global milking robot market reached $2.98 billion in 2024 and is projected to hit $3.39 billion in 2025, with North America holding 30.8% market share. The sales pitch is always the same: automate to increase efficiency and maximize production.

But what if we’re making the same mistake as China?

Robotic systems are designed to maximize throughput, not optimize profitability per unit of milk. While these systems reduce labor hours by 20-40%, they often increase total production costs through higher capital depreciation, maintenance, and electricity expenses. Projections indicate that by 2025, 70% of Northwestern European cows will be milked by automated systems, whereas China’s adoption rate remains under 15%. However, China’s high-tech, high-cost approach is incurring significant financial losses.

Before you invest $150,000-$250,000 per robot, ask yourself this: Are you optimizing for the right metric, or are you just automating the same volume-obsessed thinking that destroyed China’s profitability?

The Strategic Alternative: Think Like New Zealand

Michigan operates 243 robotic milking units across 55 farms, and the successful operations share one critical insight: they focus on strategic facility design and cow traffic optimization rather than maximum throughput. They’re not trying to milk more cows faster—they’re trying to milk the right number of cows more profitably.

That’s the difference between automation as a tool and automation as a crutch for a flawed strategy.

The Geopolitical Reality Nobody Talks About

China’s crisis has revealed something that challenges everything we thought we knew about global competition: political relationships now matter more than production efficiency.

New Zealand dominates China’s market not because it is the most efficient producer, but because it has tariff-free access through its Free Trade Agreement. They captured 46-51% of China’s total dairy import volume in 2024 and control 92% of China’s WMP imports and 68% of SMP imports. Meanwhile, U.S. SMP exports to China effectively ceased, falling to zero in February 2025 for the first time since the 2019 trade war.

Here’s the uncomfortable truth: when tariffs hit 125% and non-tariff barriers create welfare losses six times greater than official tariffs, your cost advantage becomes meaningless overnight.

The Smart Money Is Moving

While everyone was competing for China’s shrinking market, smart operators began diversifying. Southeast Asia projects a 3.14% CAGR, while the Middle East/North Africa region shows a 4.6% CAGR, offering profit margins 15-20% higher and payment terms 30-45 days faster than those in China.

U.S. dairy export forecasts for fiscal year 2025 are raised by $100 million to $8.5 billion, but the growth isn’t coming from China—it’s coming from markets that actually want what we’re selling at prices that make sense.

The Value Revolution That’s Already Happening

Here’s the part that gives me hope: not all of China’s market is collapsing. While sales of regular pure milk fell 8.6% in 2024, organic pure milk and A2 milk grew by 0.2% and 5.7% respectively, commanding price premiums of over 60%.

The lesson is crystal clear: consumers will pay for value, but they won’t pay premium prices for commodity products just because you produced them expensively.

What This Means for Your Operation

The farms that will thrive in this new reality are those that optimize for profit per unit rather than volume per cow. Instead of asking “How can I produce more milk?” start asking “How can I produce the right milk at the right cost for the right market?”

Calculate your true cost per unit of milk solids. If you’re above US$0.48 per liter, you’re in China’s danger zone. Use the cost methodology that shows New Zealand’s structural advantage at US$0.37 per liter.

Before your next expansion decision, challenge yourself with these questions:

  • Can your operation maintain profitability in a scenario where China’s milk price declines by 28%?
  • Are you investing in volume capacity or profit-generating efficiency?
  • Do you have market diversification beyond geopolitically volatile trade partners?

The Bottom Line: Efficiency Beats Volume Every Time

China’s $198 million lesson is both painful and straightforward: a volume-first approach can undermine profitability when it overlooks cost structure and market realities.

New Zealand’s “inefficient” system maintains the world’s lowest production costs and highest returns on investment because they optimizes for the right metrics. They produce less milk per cow but more profit per dollar invested.

The future belongs to operations that optimize total system profitability rather than maximum per-cow production. Build cost structures that remain profitable during periods of price volatility, rather than maximizing output during favorable conditions.

Your action plan starts now: Contact your regional USDA export specialist to explore diversified markets with verified growth potential. Shift toward premium products that command price premiums rather than commodity volume. Most importantly, evaluate every production investment against profit per dollar rather than volume per cow.

The controversial truth that will separate winners from losers: In the post-China dairy market, efficiency beats volume, diversification beats dependency, and profit per dollar invested beats milk per cow every single time.

Don’t let China’s expensive education become your own. The biggest opportunities in dairy often lie behind the most significant conventional wisdom failures, and China’s volume-obsessed collapse has just revealed which approach actually works.

Complete references and supporting documentation are available upon request by contacting the editorial team at editor@thebullvine.com.

Learn More:

Join the Revolution!

Join over 30,000 successful dairy professionals who rely on Bullvine Weekly for their competitive edge. Delivered directly to your inbox each week, our exclusive industry insights help you make smarter decisions while saving precious hours every week. Never miss critical updates on milk production trends, breakthrough technologies, and profit-boosting strategies that top producers are already implementing. Subscribe now to transform your dairy operation’s efficiency and profitability—your future success is just one click away.

NewsSubscribe
First
Last
Consent
Send this to a friend