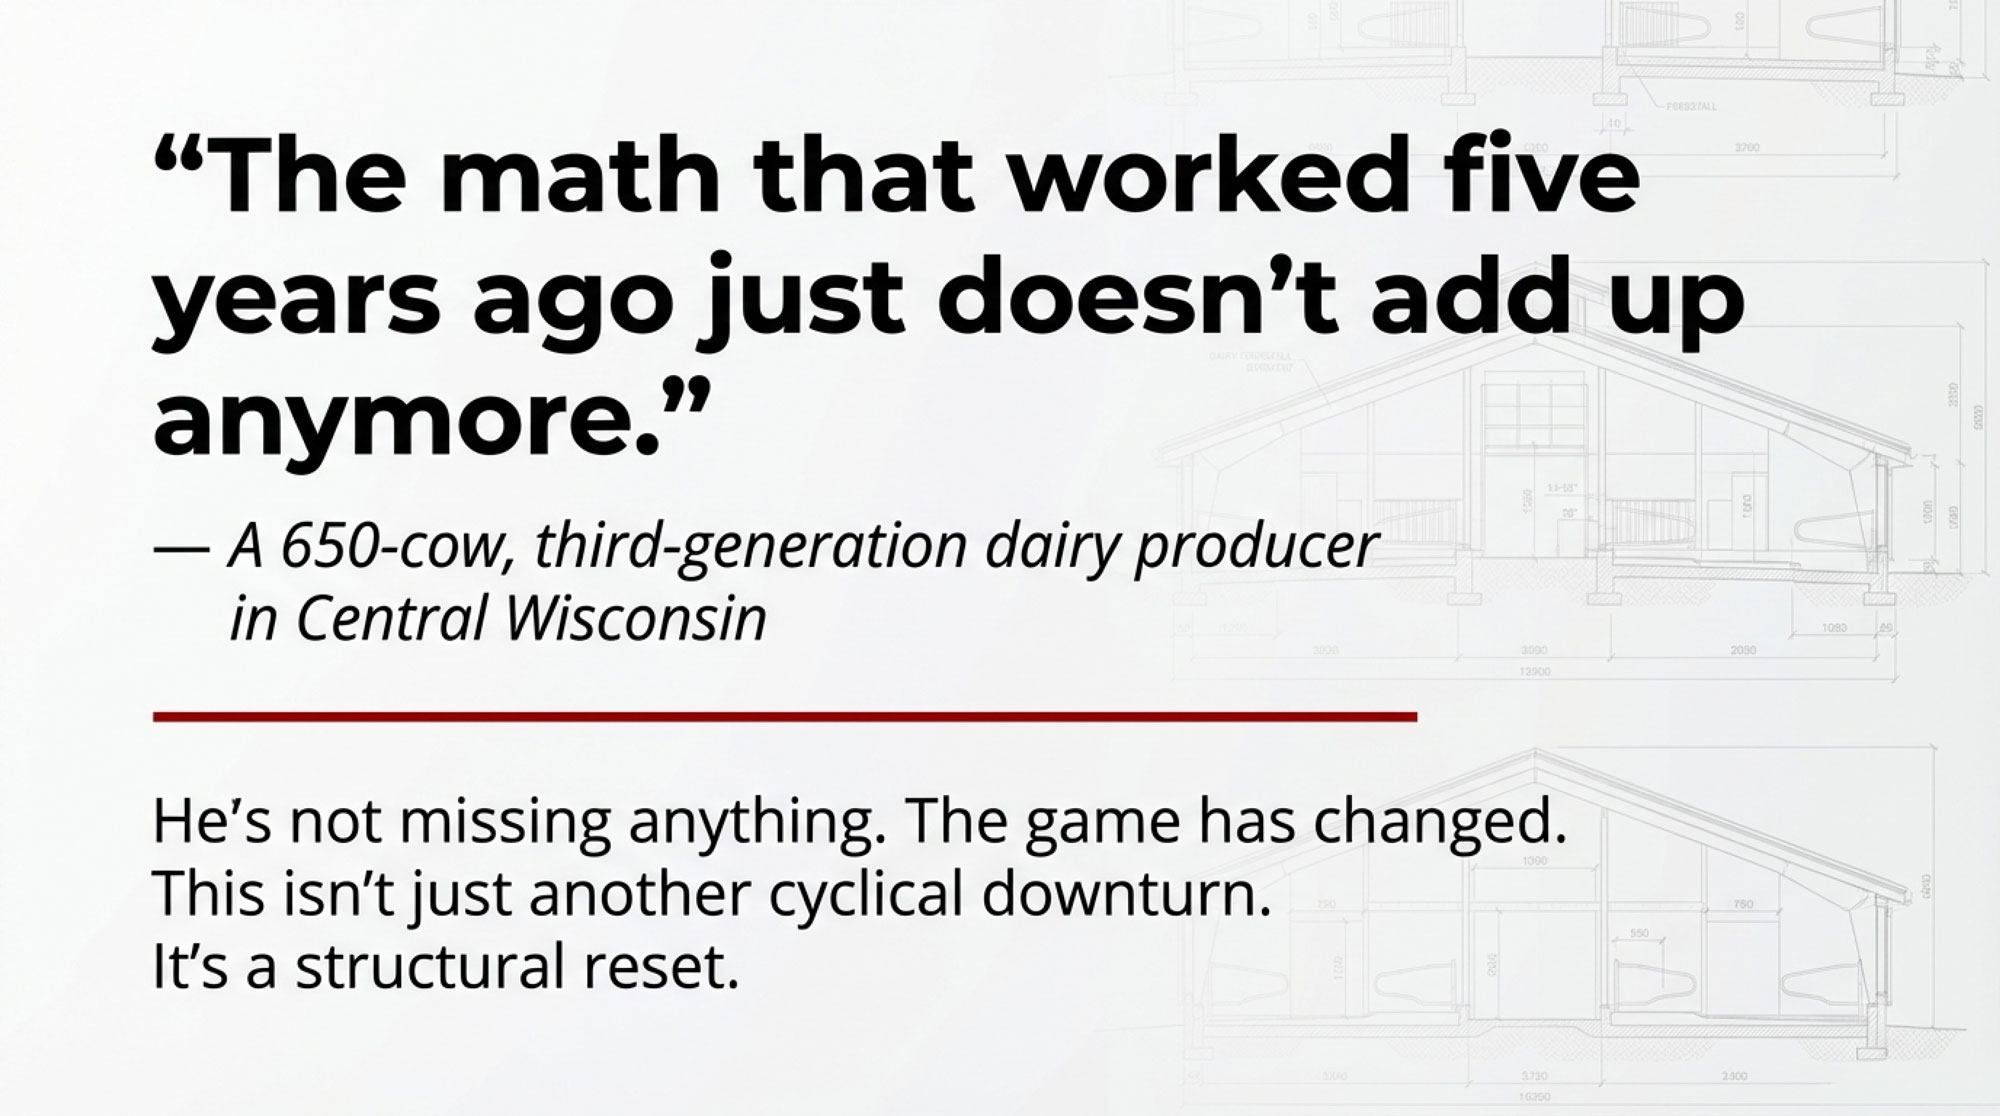
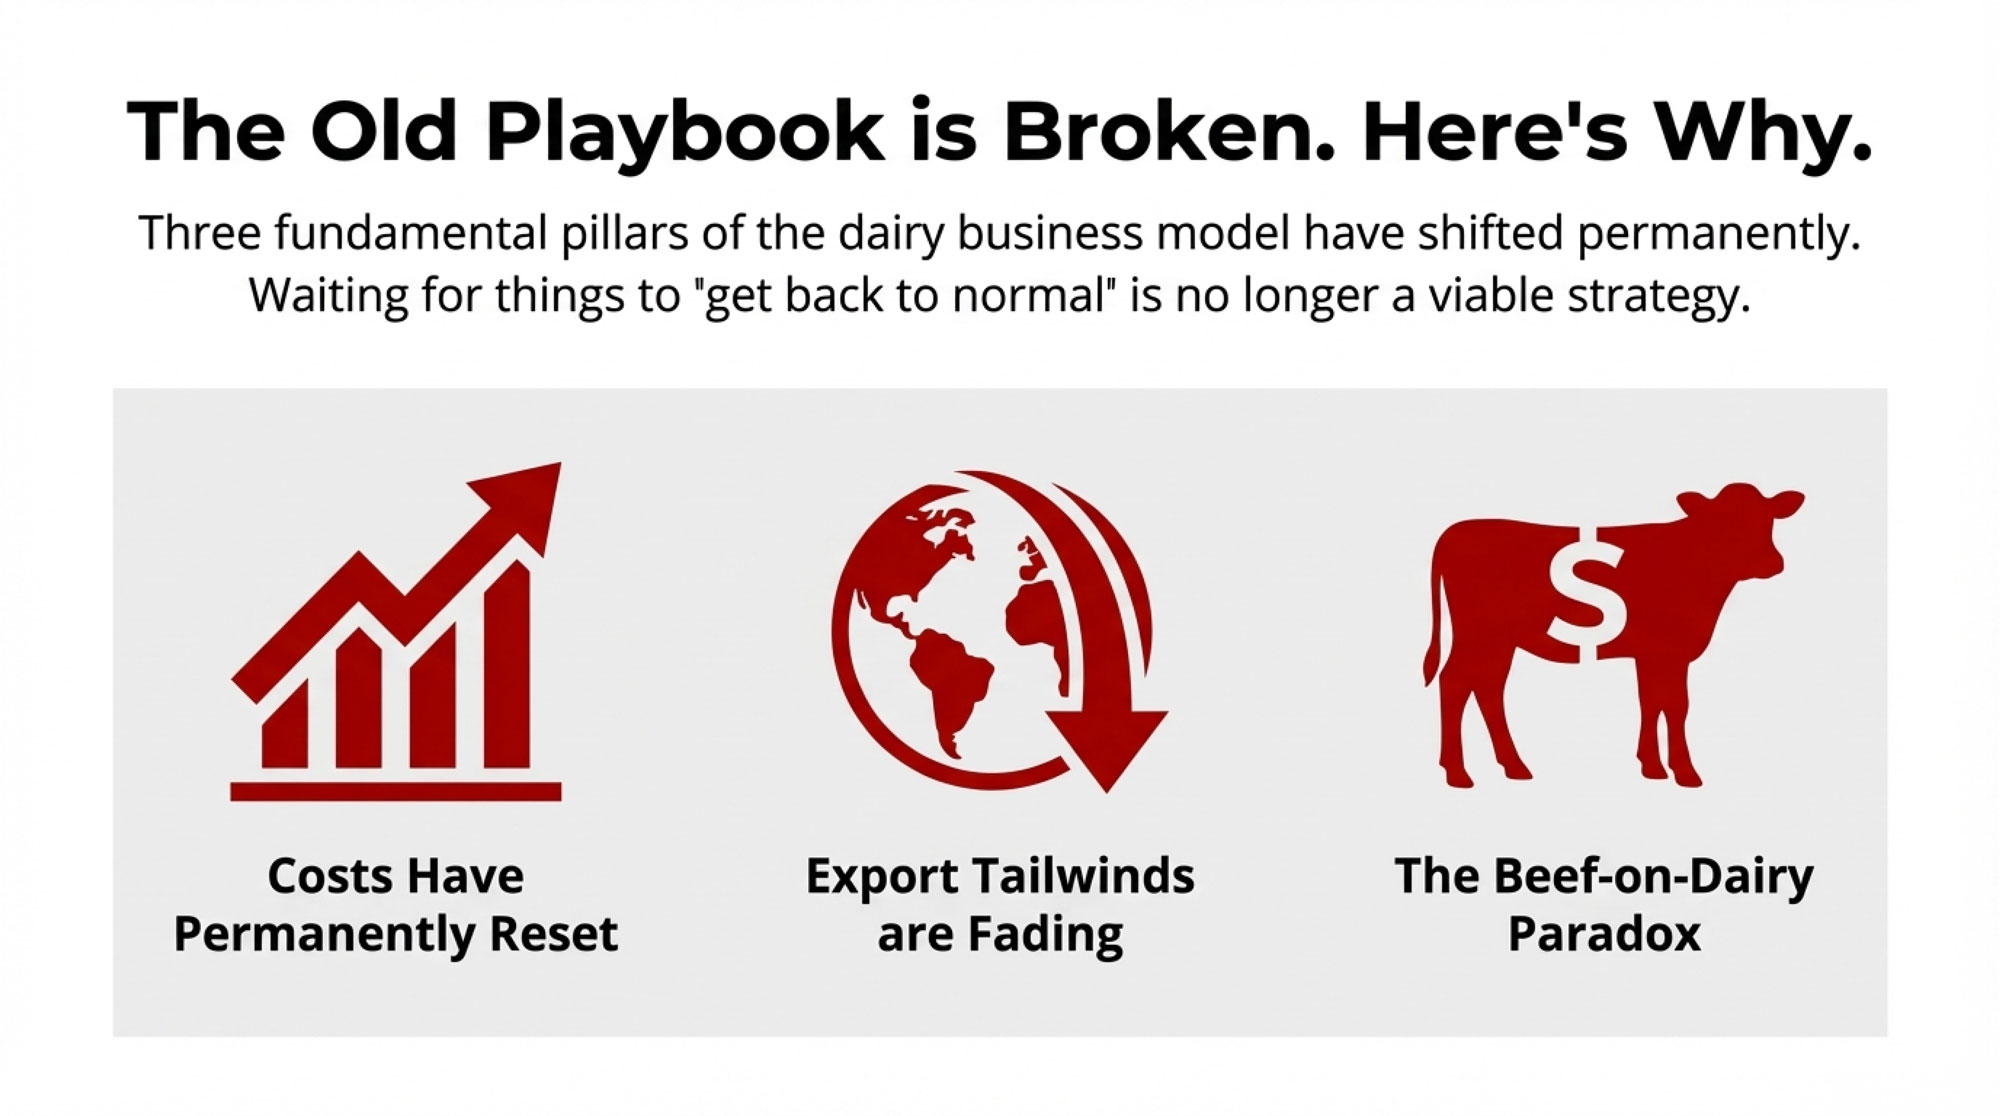
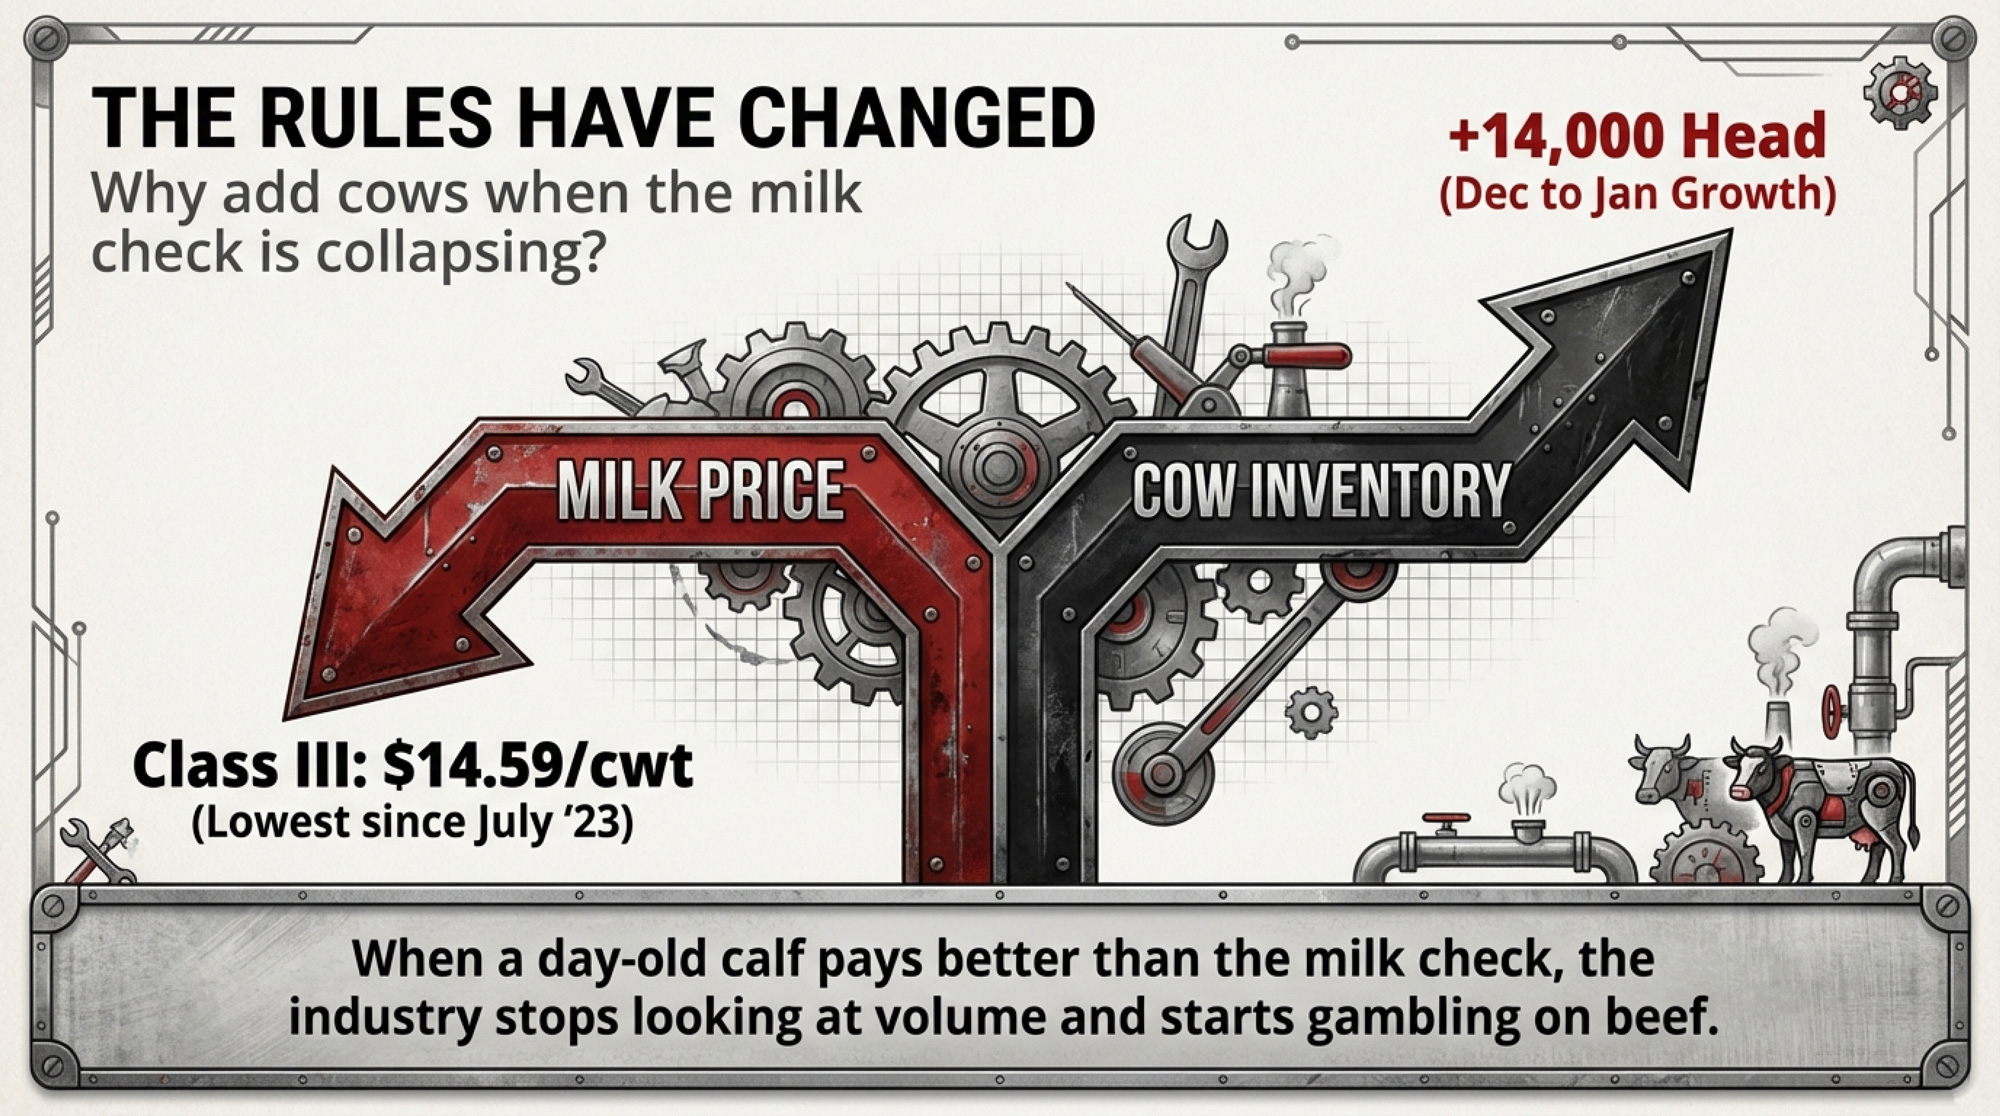
When a day‑old calf pays better than the milk check, the rules change. The question isn’t volume anymore. It’s survival math.
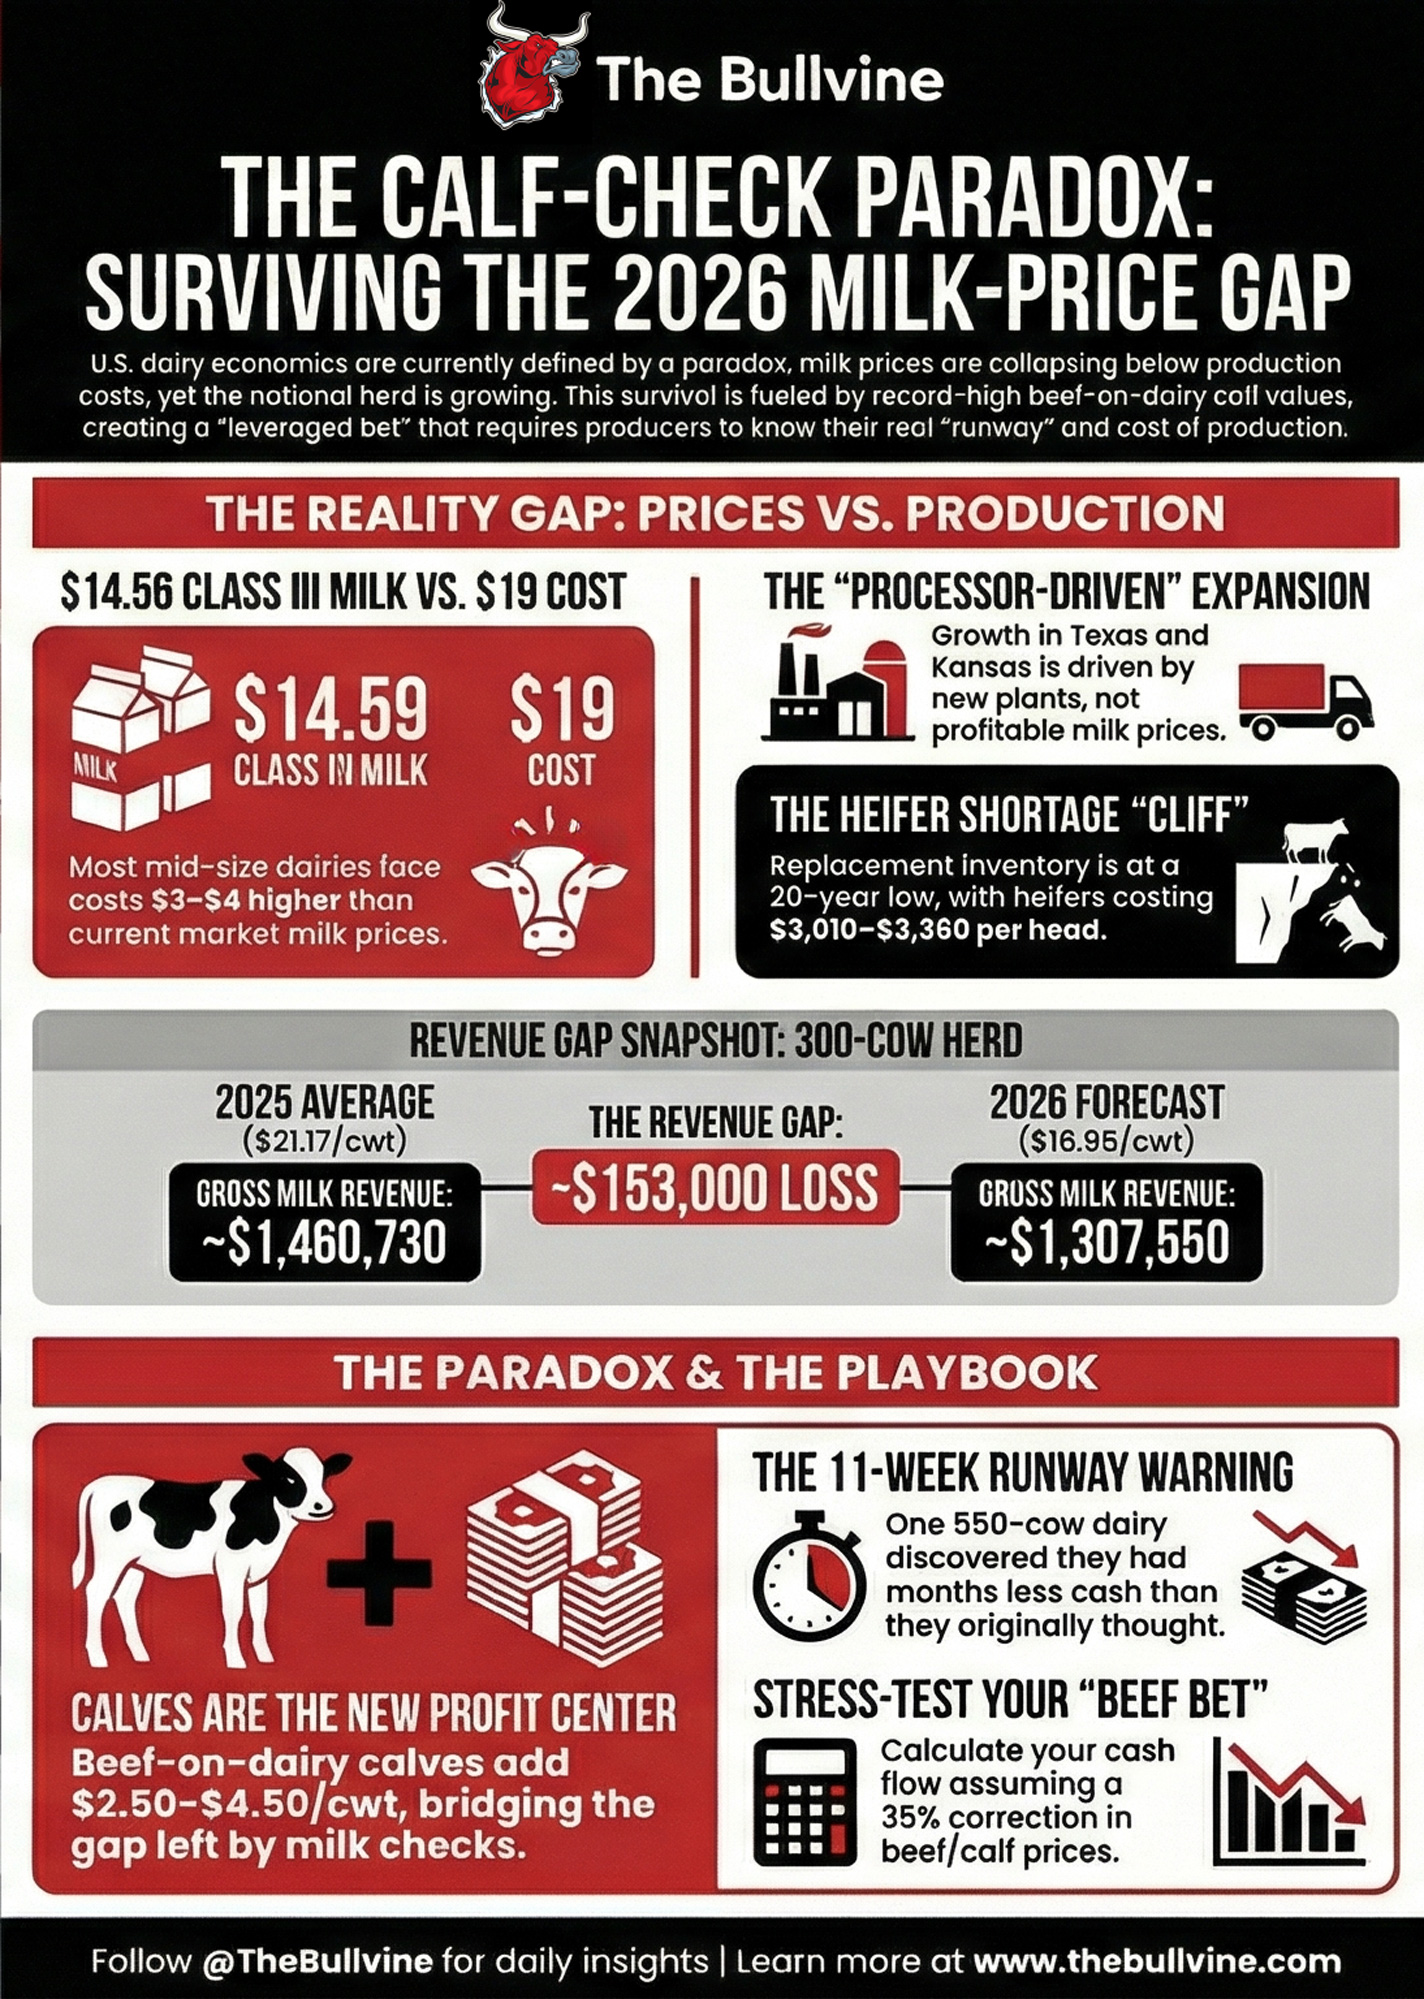
Executive Summary: January’s USDA report exposed a deep disconnect in U.S. dairy economics: milk prices are collapsing while cow numbers and output still climb. Production was up 3.2% year‑over‑year with 14,000 more cows on line, even as Class III fell to $14.59/cwt and Class IV to $13.55/cwt against full costs that often sit near $18–$19/cwt. The missing margin is coming from cattle, with beef‑on‑dairy calf and cull checks routinely adding $3–$4.50/cwt, but that turns your dairy into a leveraged bet on the beef cycle. Using USDA and CoBank numbers, a 300‑cow herd faces roughly a $153,000 drop in milk revenue for 2026, and closer to $261,700 when you layer in a realistic 35% correction in calf values. At the same time, replacement heifers are at a 20‑year low, trading around $3,010–$3,360 per head, even as more than $11 billion in new processing capacity comes online and demands more milk. One 550‑cow Midwest dairy that thought it had six months of cash discovered it had just eleven weeks, then bought time by culling its worst converters and restructuring debt inside 48 hours. For your operation, the takeaway is blunt: treat calf income as volatile bonus money, know your real cost of production to the penny, and set 30‑, 90‑, and 365‑day plans that assume milk and beef could both move against you at the same time.
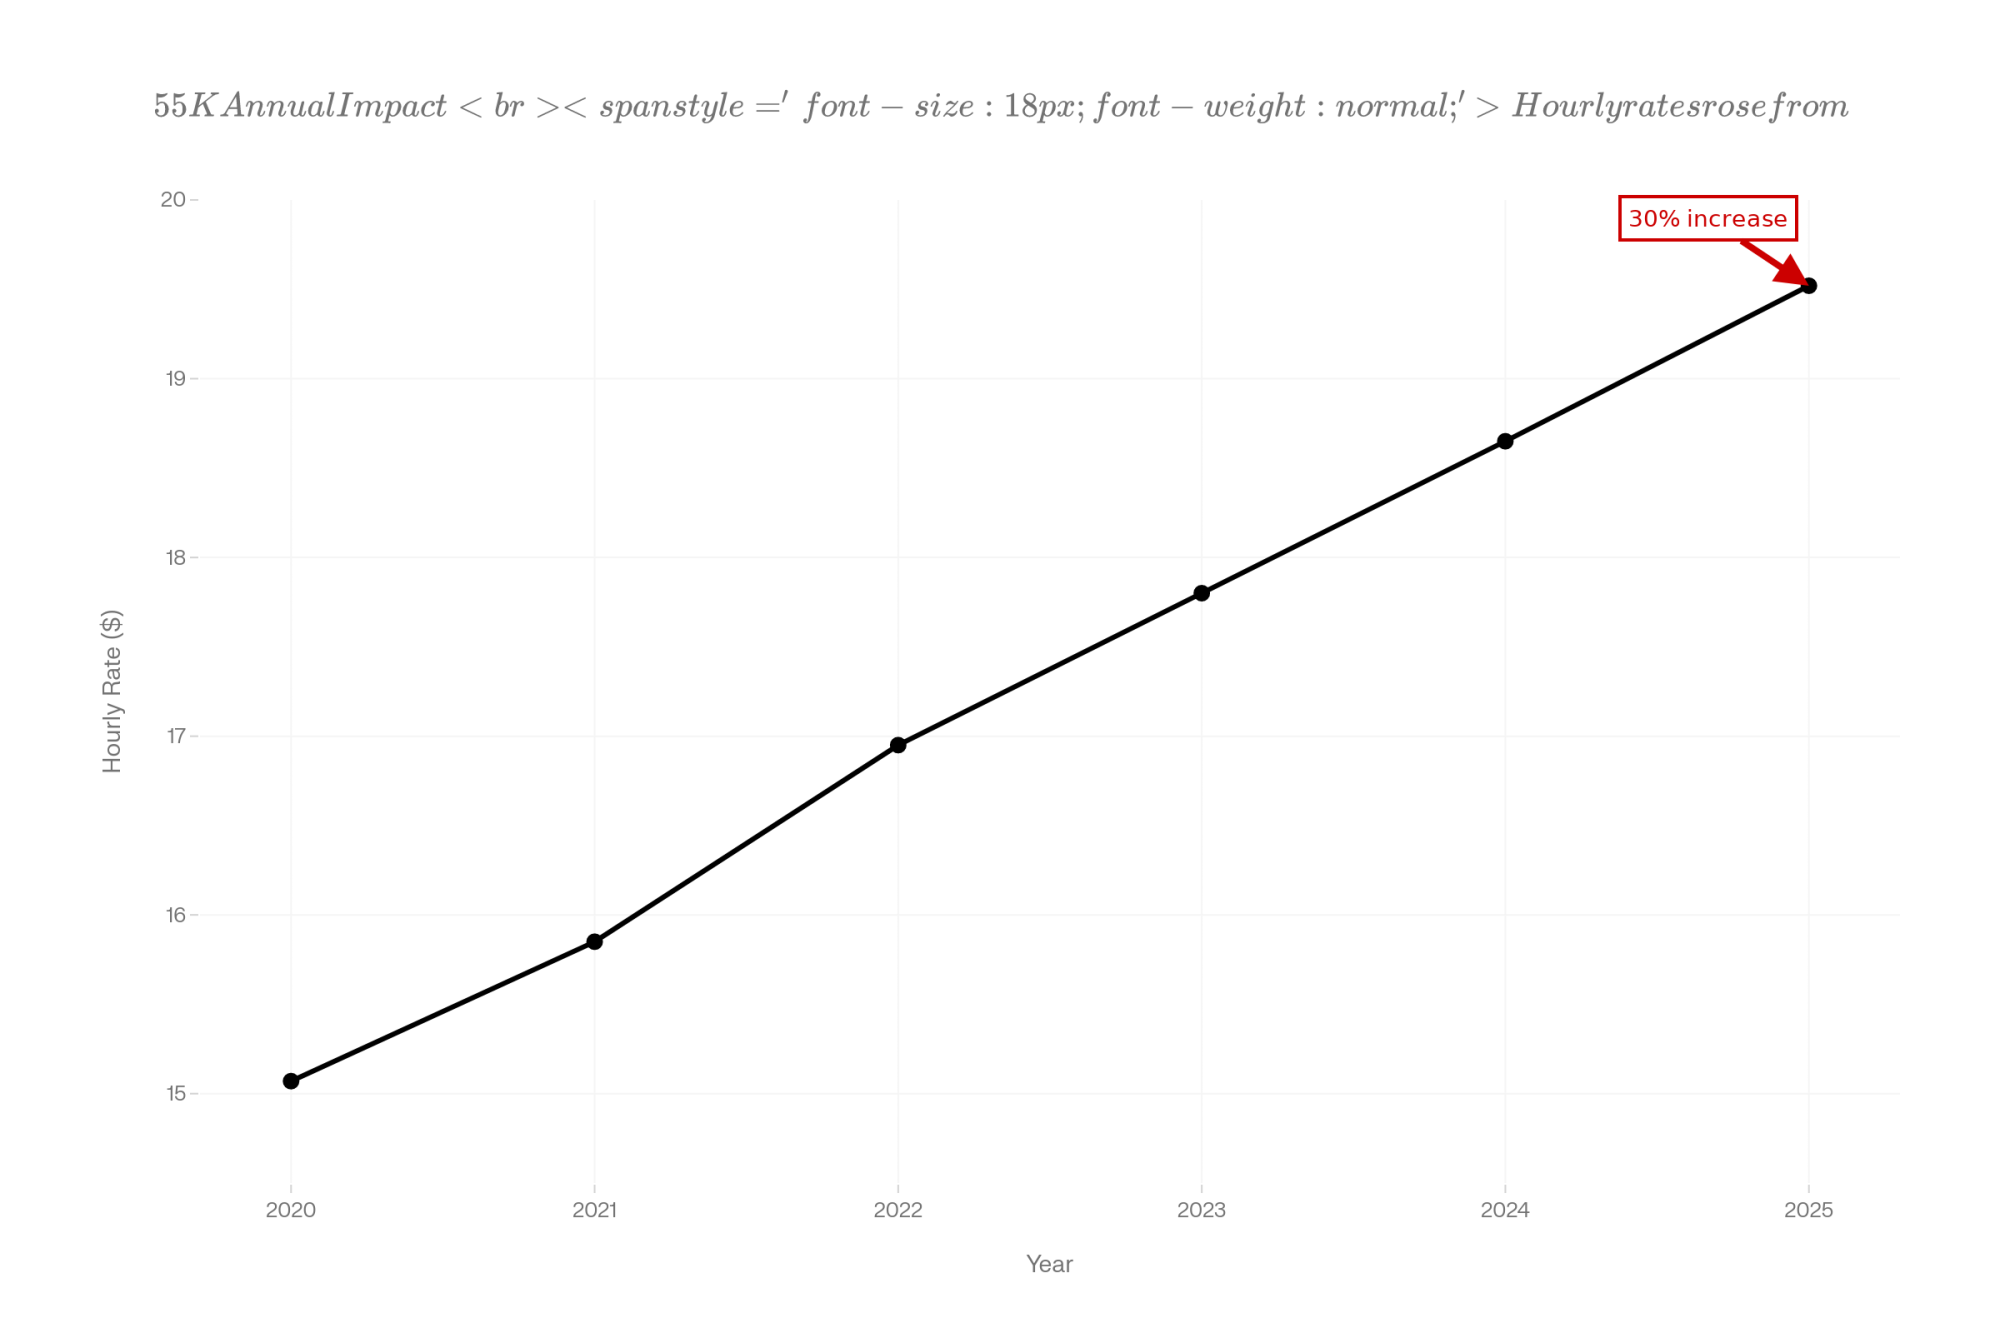
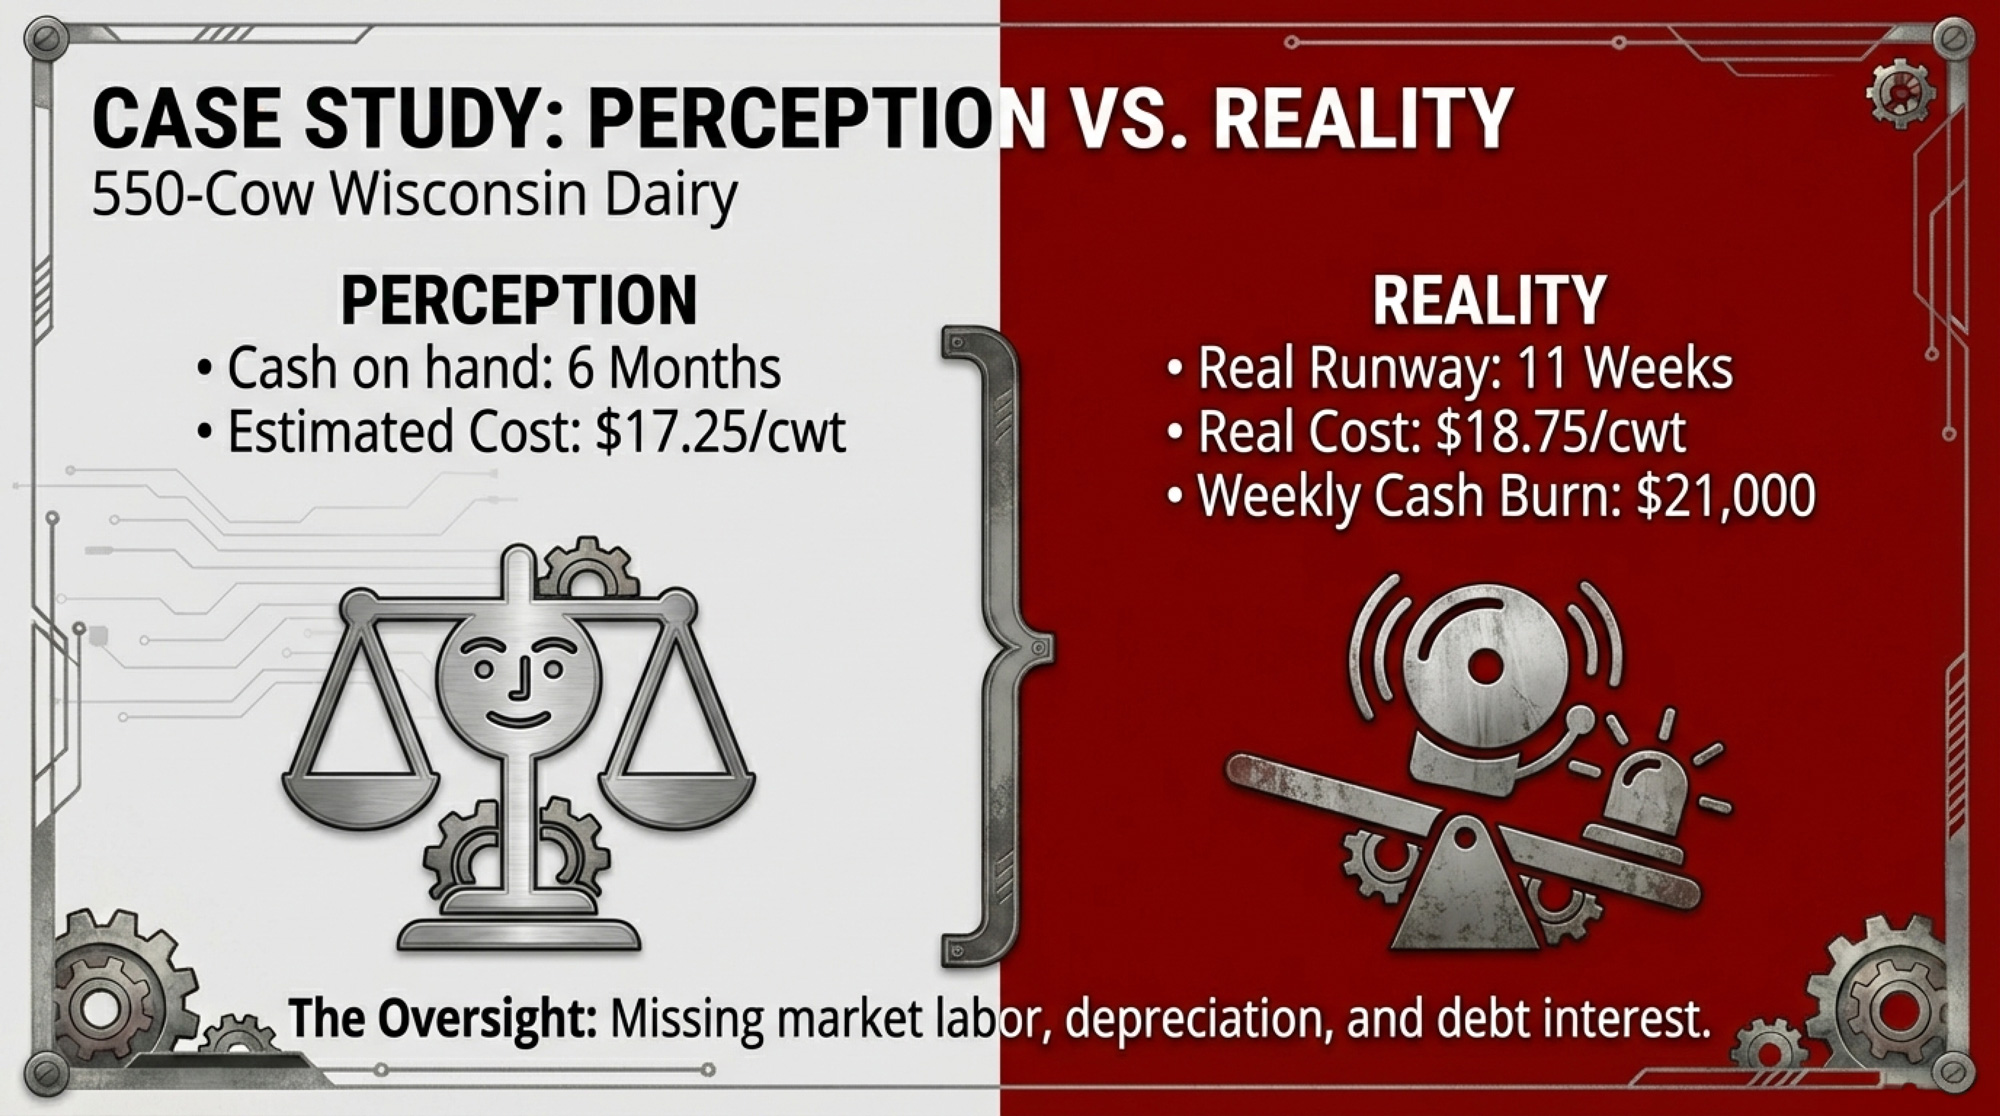
A 550-cow Wisconsin dairy sat down with a farm financial counselor earlier this month and pulled a full cost-of-production analysis. The producer thought his all-in cost was around $17.25/cwt. When the spreadsheet included market-rate family labor, real depreciation, current interest on all repriced debt, and health insurance, the number came back at $18.75/cwt — right in line with UW Extension’s cost-of-production benchmarks, which put average COP at $18–$19/cwt for mid-size Midwest dairies. Then he checked his liquidity: $227,000 total. Net weekly cash drain at current prices: about $21,000. That’s roughly eleven weeks of runway — not the five or six months he’d been carrying in his head.
| Cost Category | Napkin Math | Market-Rate Reality | Delta |
|---|---|---|---|
| Feed & Nutrition | $7.50 | $7.80 | +$0.30 |
| Labor (Family = $0) | $2.00 | $3.10 | +$1.10 (red text) |
| Veterinary & Health | $0.85 | $1.05 | +$0.20 |
| Depreciation (Book) | $1.80 | $2.20 | +$0.40 |
| Interest (Pre-2022 Rates) | $1.10 | $1.75 | +$0.65 (red text) |
| Utilities & Fuel | $0.90 | $0.95 | +$0.05 |
| Repairs & Maintenance | $1.20 | $1.30 | +$0.10 |
| Insurance & Taxes | $0.60 | $0.90 | +$0.30 |
| Miscellaneous | $1.30 | $1.45 | +$0.15 |
| TOTAL COP | $17.25 | $18.75 | +$1.50 (red text, bold) |
That producer’s math collided with today’s USDA NASS report. U.S. milk production came in at 19.81 billion poundsfor January — up 3.2% year-over-year but a clean miss against the +3.8% that StoneX had penciled in. January’s Class III price printed at $14.59/cwt, the lowest since July 2023, and $5.75 below a year ago. Class IV was even uglier: $13.55/cwt, the lowest in nearly five years, per the AMS announcement. And yet USDA says farmers added 14,000 head between December and January, pushing the national herd to 9.58 million — up 2.0% from last year. StoneX had modeled roughly 9,000 head of growth; the actual came in about 5,000 head hotter.
When your milk check is falling that fast, and your cow numbers are still climbing, something other than milk economics is driving the bus.
Where Did 14,000 Cows Come From?
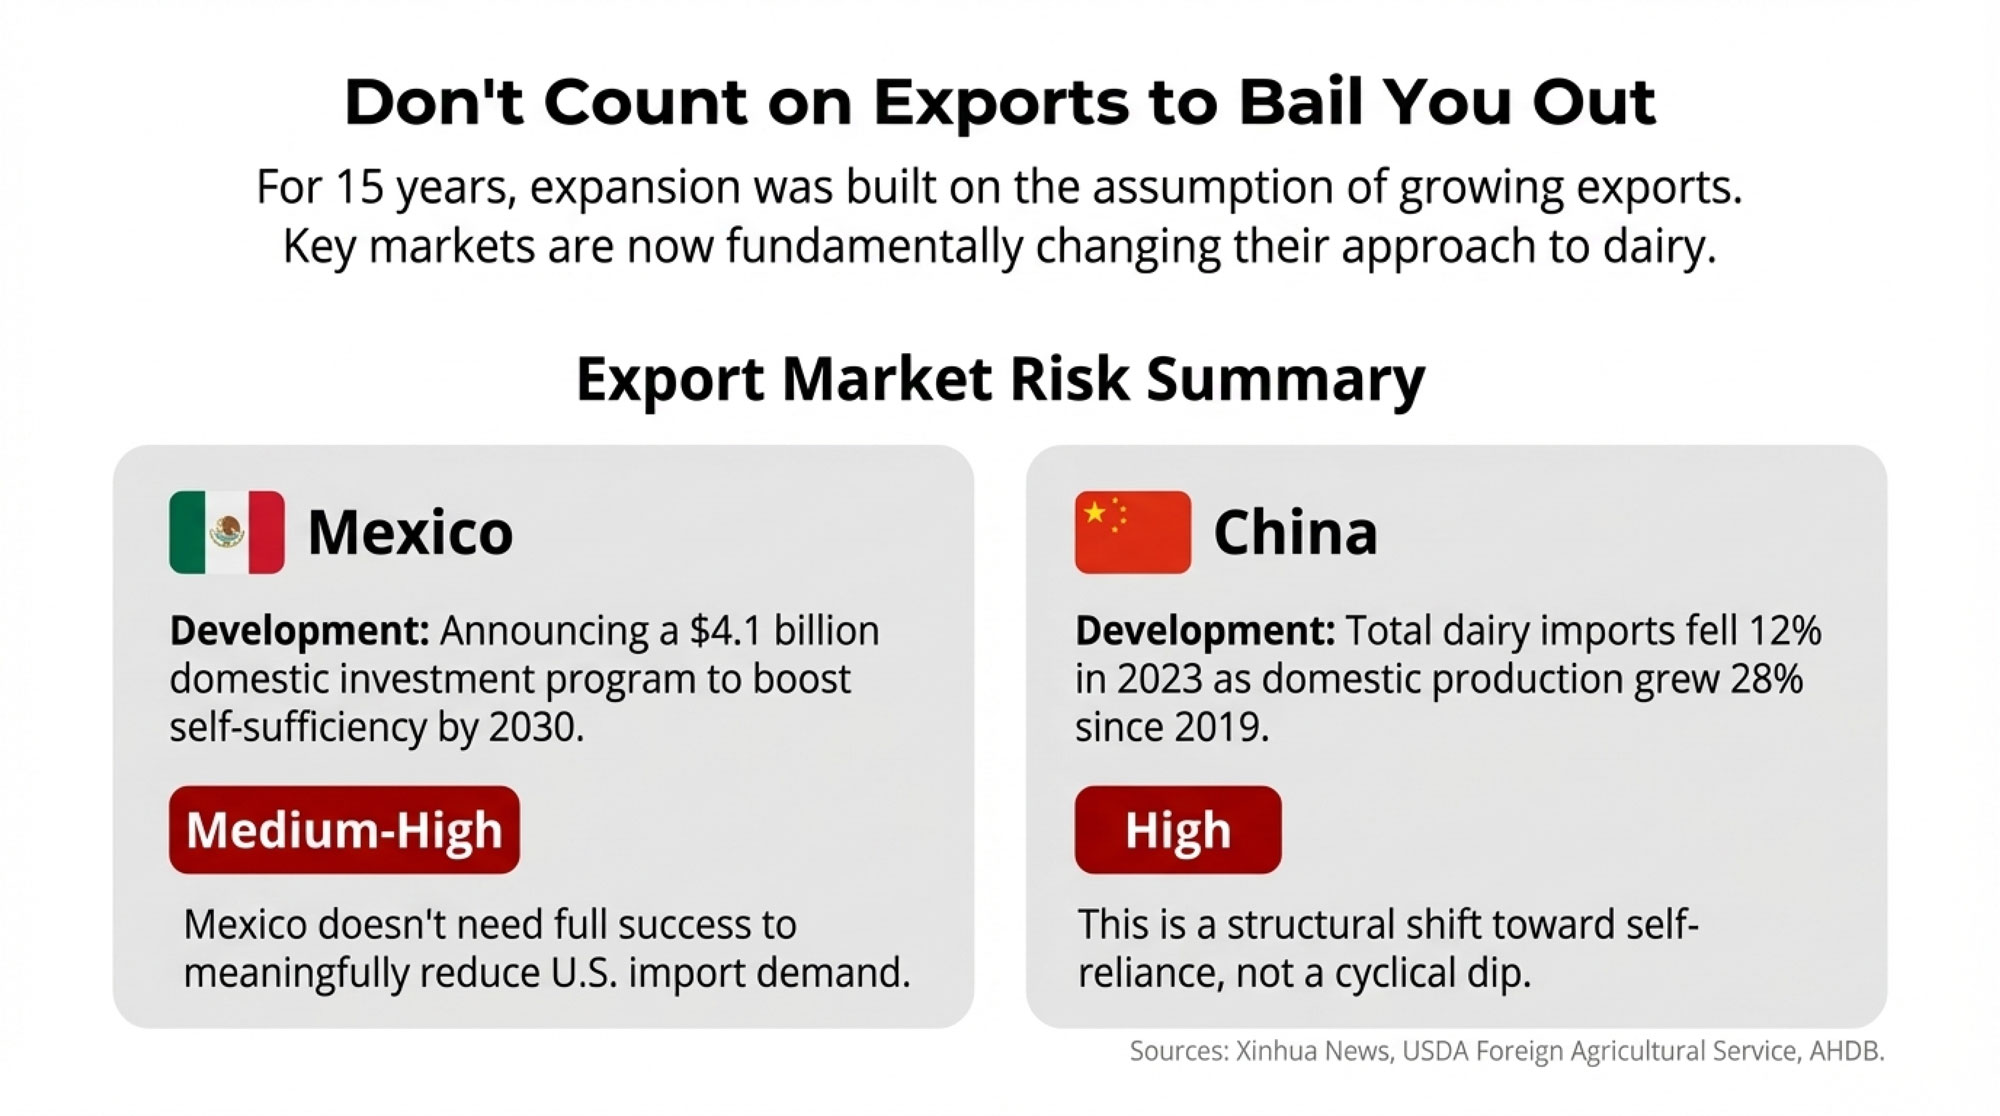
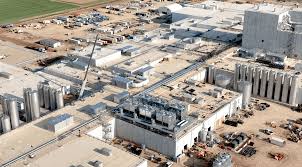
Of that 14,000-head surprise, about 10,000 appeared in Texas. The state’s inventory hit 715,000 head, and production jumped 7.6% year over year to 1.598 billion pounds. That’s not organic growth — it’s a direct response to Leprino Foods’ mozzarella facility in Lubbock. Phase 1 of the 850,000-square-foot plant began production in January 2025, with its formal opening ceremony in March. Phase 2 is slated for completion in early 2026. At full capacity, the facility is designed to handle roughly 200 milk trucks per day.
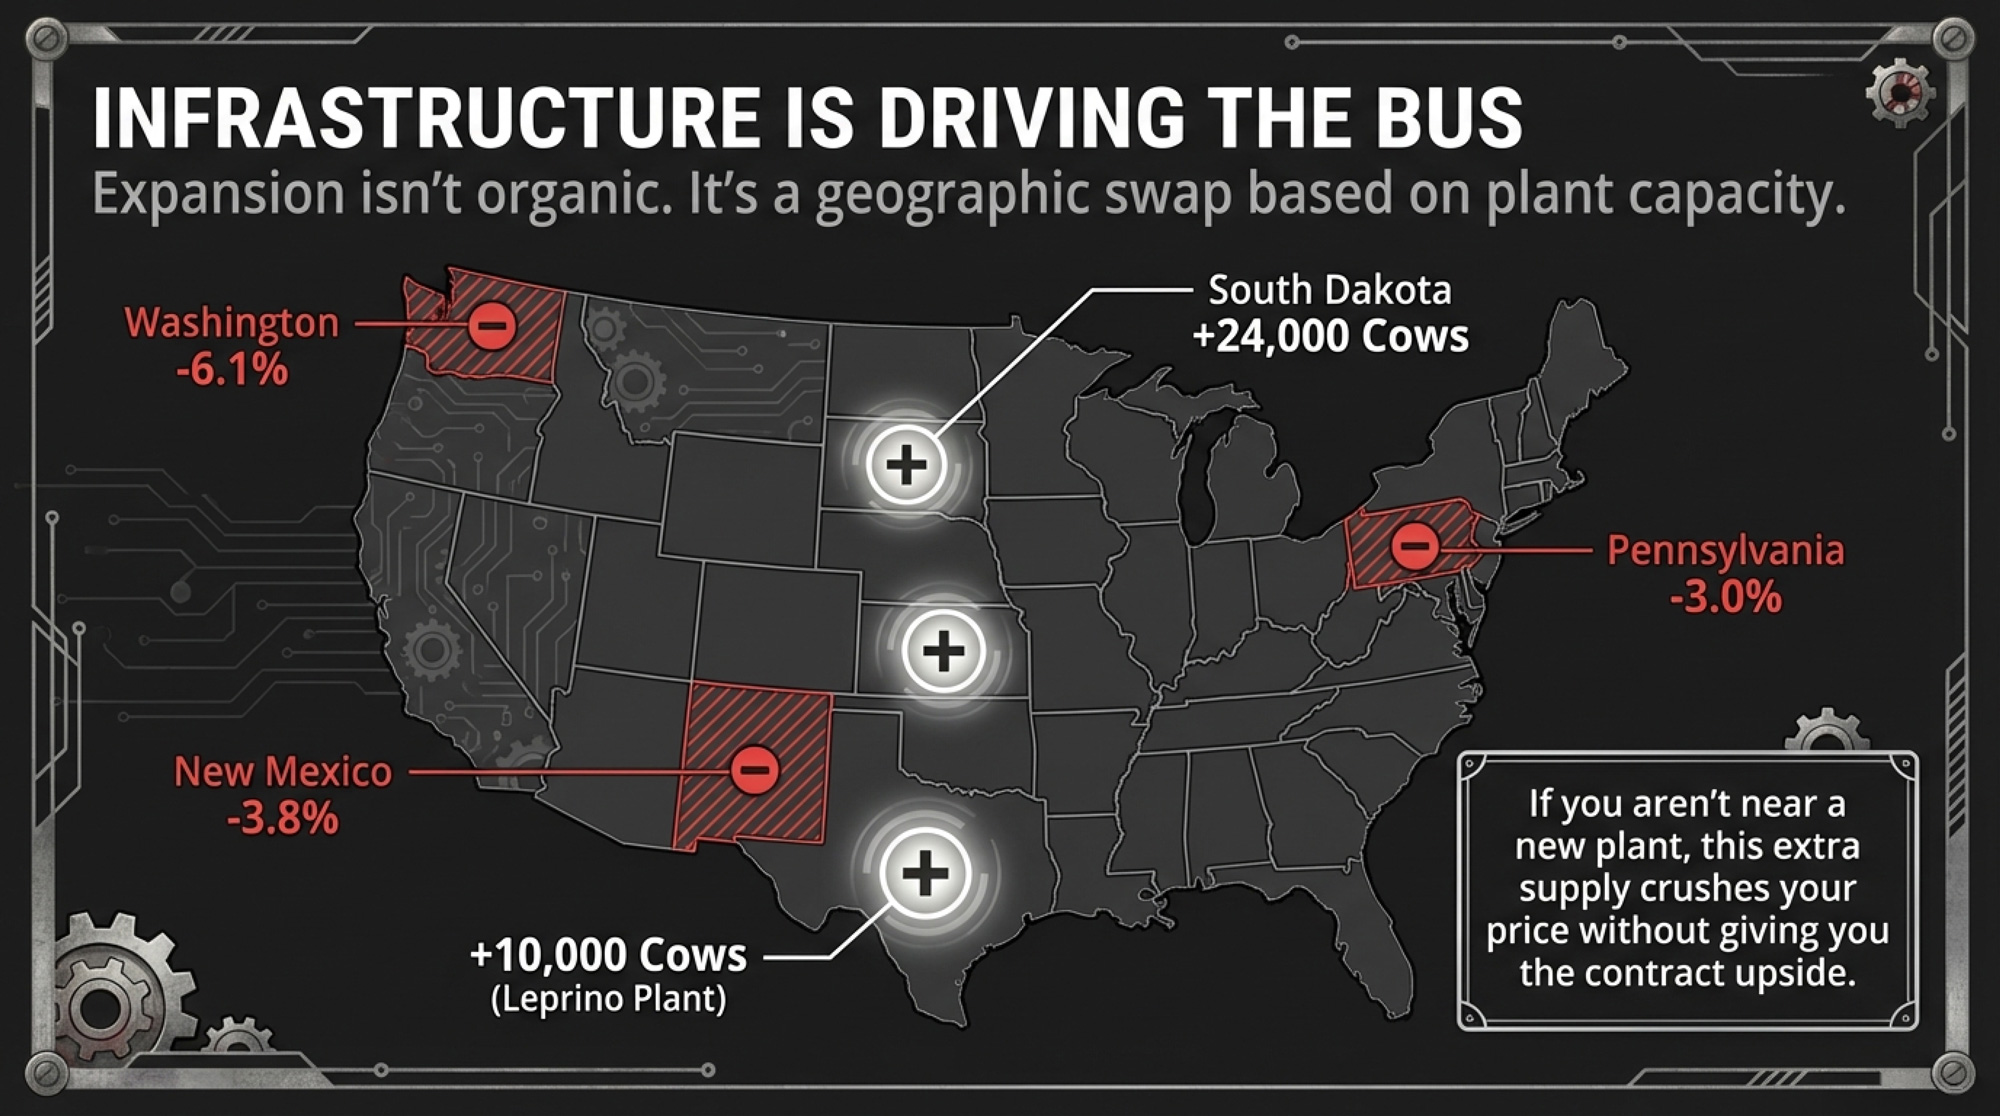
Kansas tells an even bigger story. Production exploded 26.1% year-over-year — the largest jump of any state — on 45,000 additional head since January 2025. Hilmar’s $600 million Dodge City cheese plant is pulling milk into existence across the High Plains. South Dakota added 24,000 cows and saw production rise 10.9%.
But flip to the other column. Washington dropped 6.1%. New Mexico fell 3.8%. Pennsylvania slipped 3.0%. The expansion isn’t national — it’s a geographic swap. And if you’re not near a new processing asset, this extra supply pushes your price down without giving you any contract upside.
What Does $14.59 Class III Mean for a 300-Cow Dairy?
Here’s the barn math that should be taped to every office wall right now.
USDA’s February 10 WASDE projects the 2026 all-milk price at $18.95/cwt. That’s down $2.22/cwt from the revised 2025 average of $21.17/cwt. If the back half doesn’t rally, that number won’t hold.
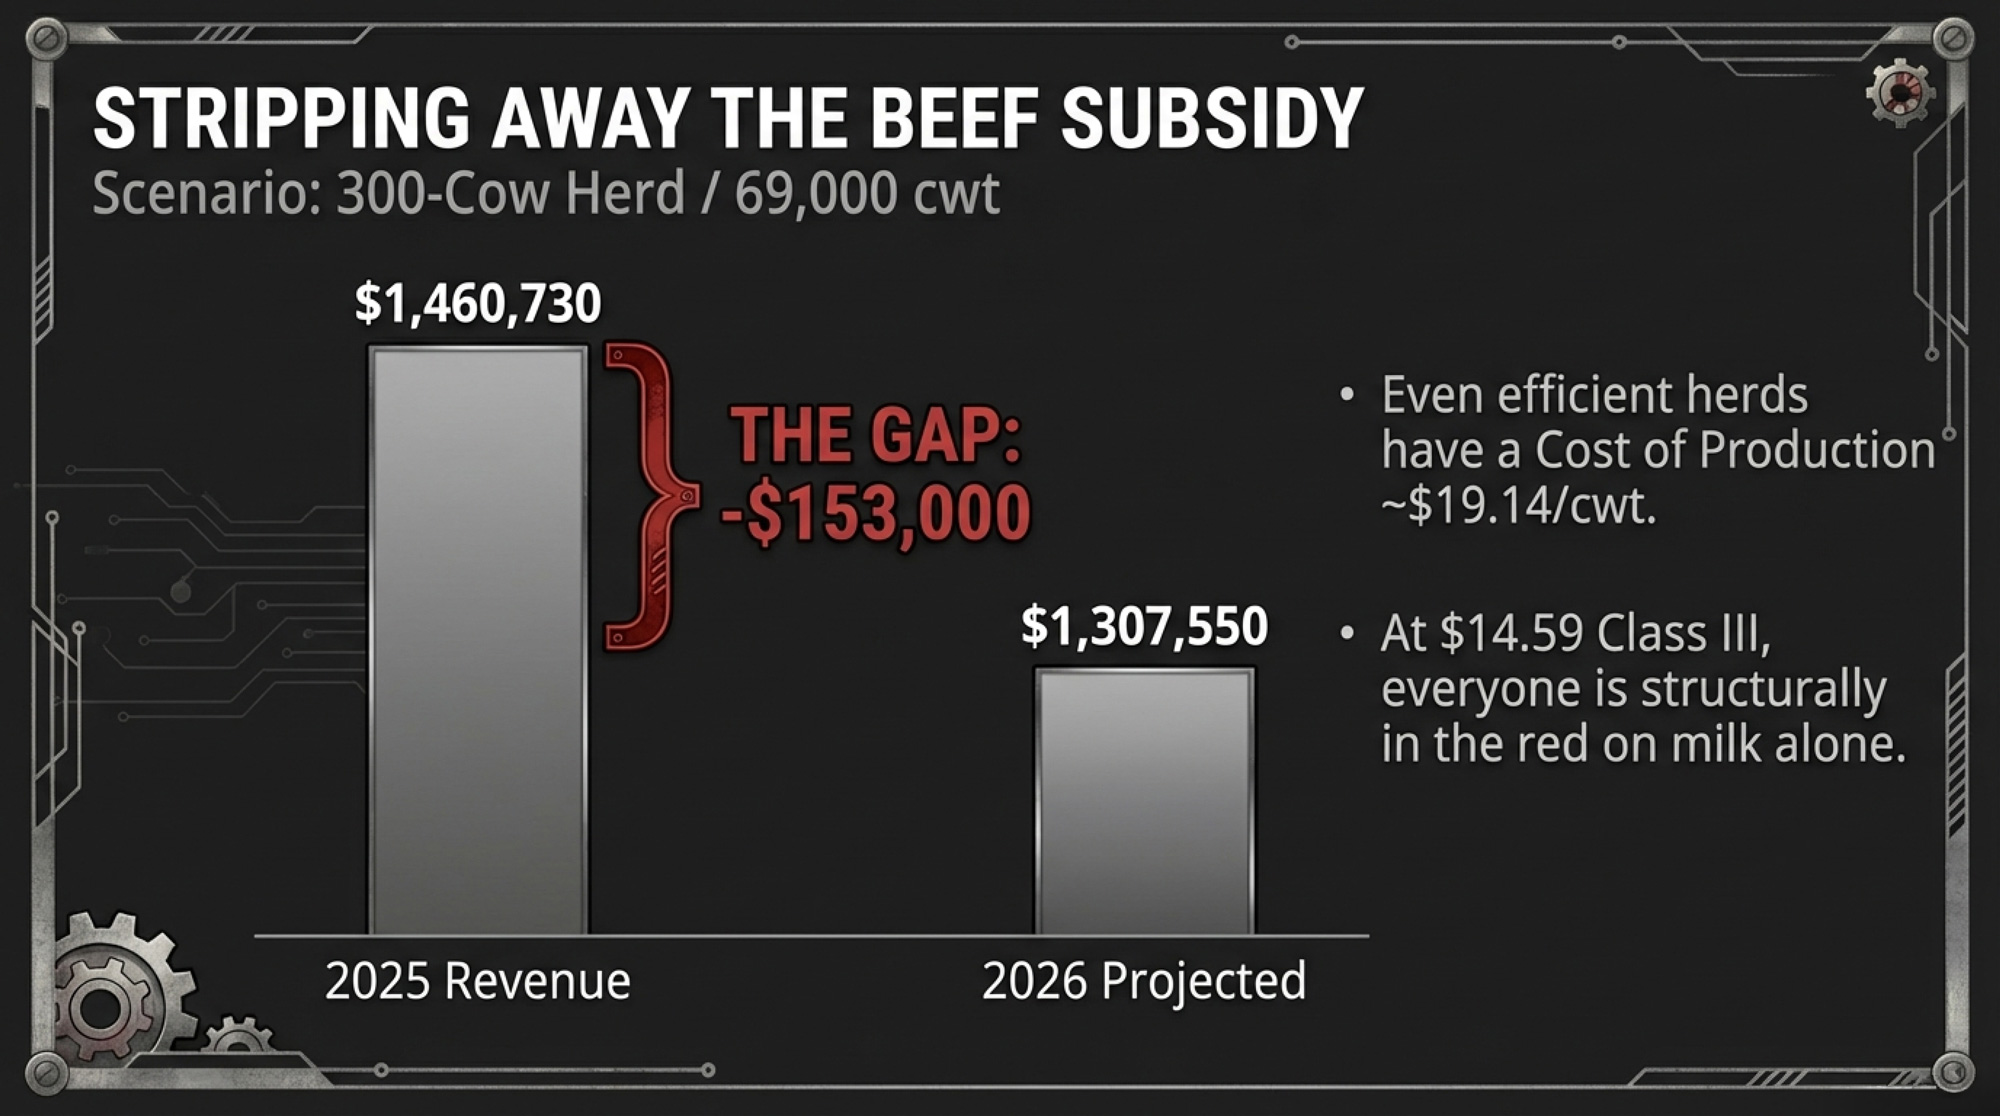
Take a 300-cow herd shipping roughly 69,000 cwt annually (at about 23,000 lbs/cow — below the national average of 24,390, which gets skewed upward by the largest herds):
- 2025 gross milk revenue (at $21.17/cwt): ~$1,460,730
- 2026 gross milk revenue (at $18.95/cwt WASDE forecast): ~$1,307,550
- The gap: roughly $153,000 in lost gross milk revenue
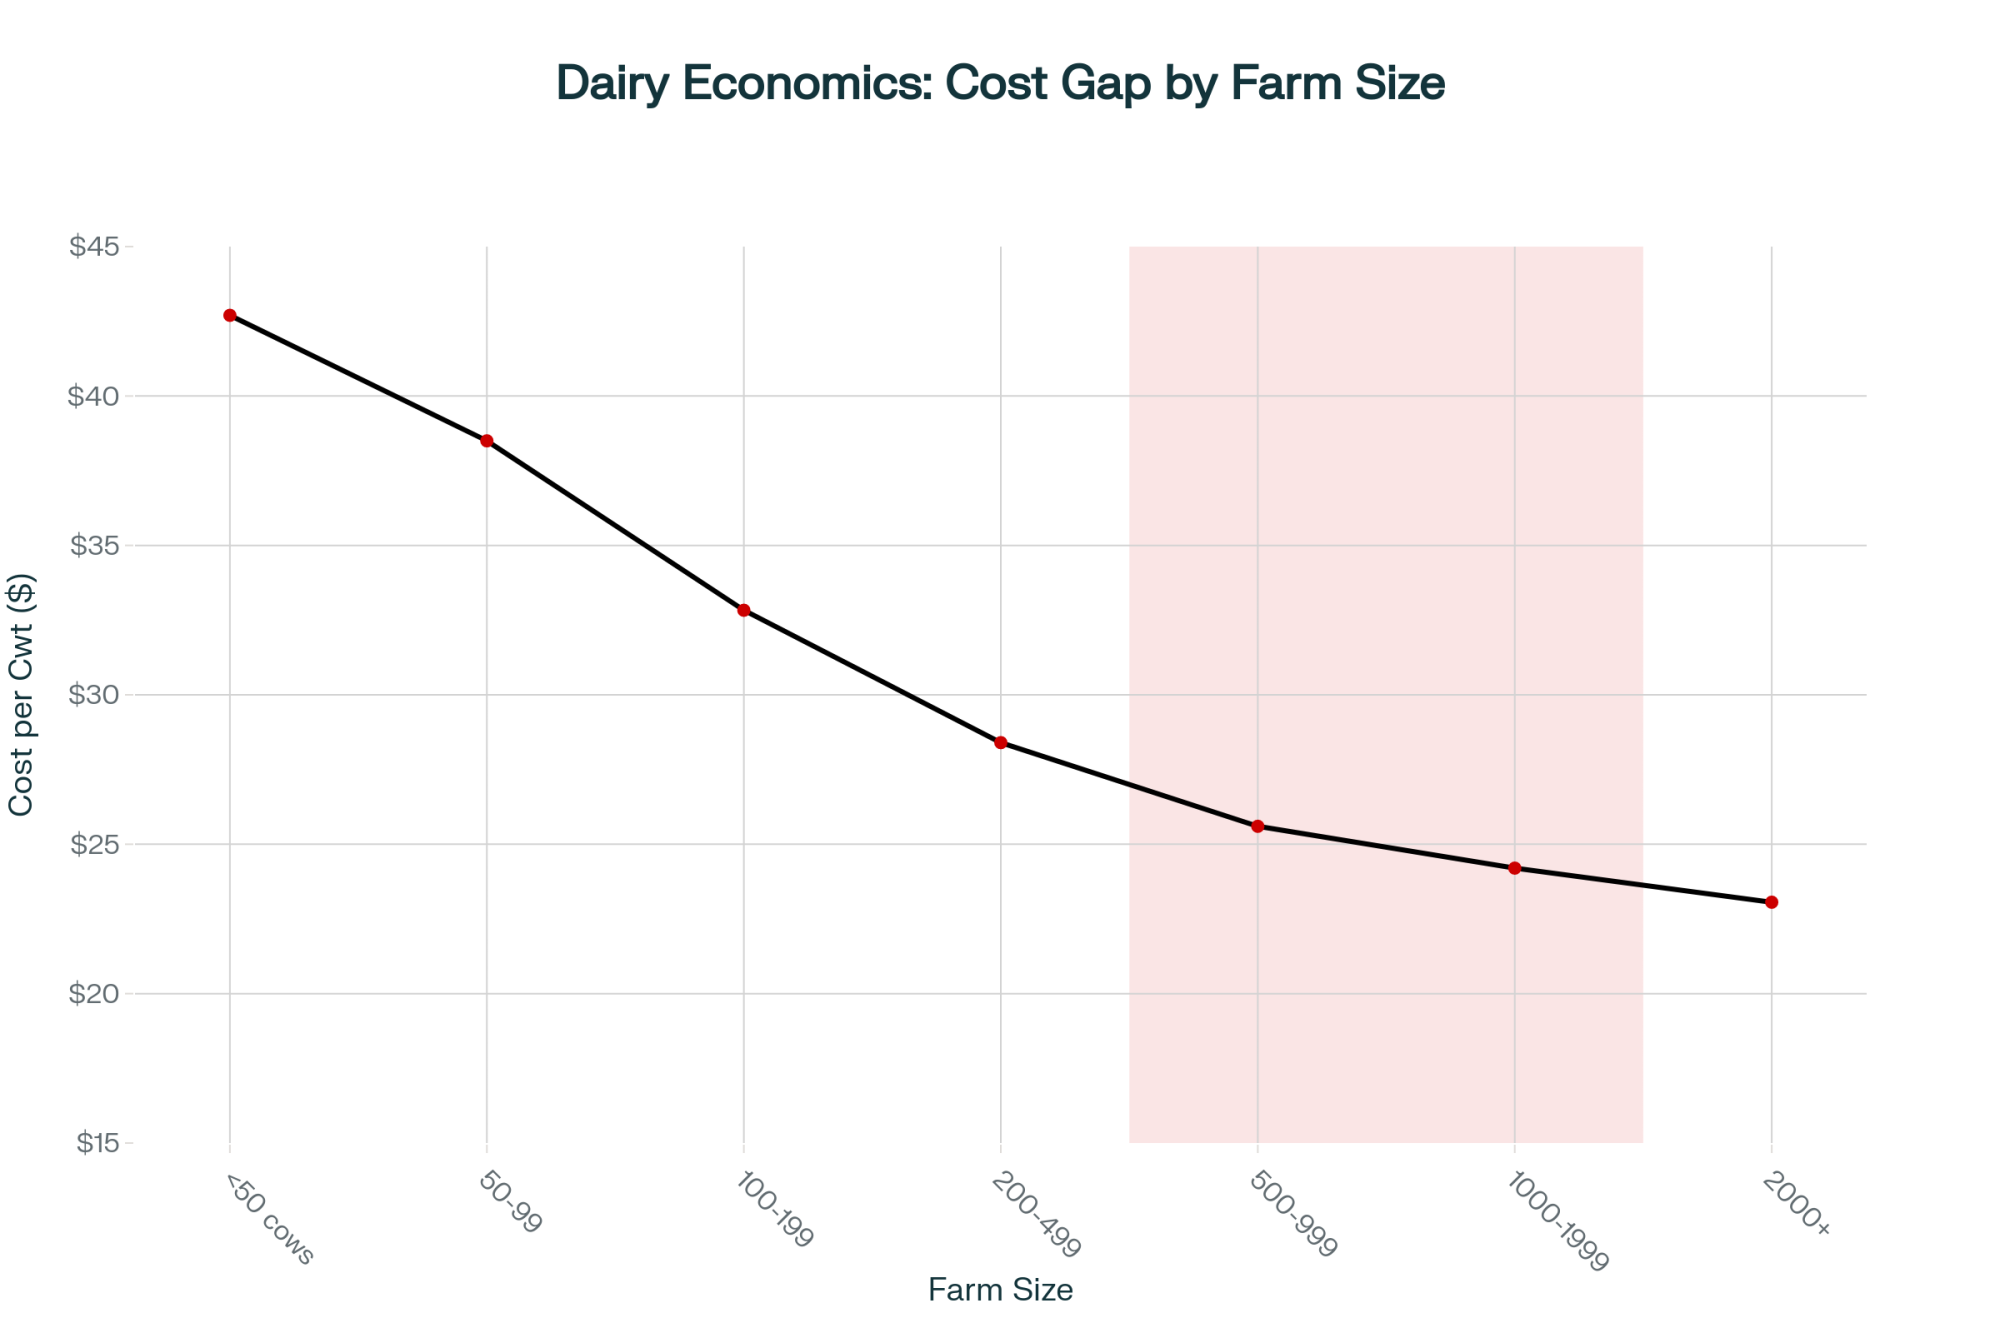
That’s before feed, labor, or debt service. ERS cost-of-production data puts a 2,000-plus-cow operation at $19.14/cwt— which means even the largest, most efficient herds are structurally in the red on a full-cost basis at current spot prices. That Wisconsin producer’s $18.75/cwt looked tight against $21 milk. Against $14.59 Class III, it looks like a countdown.
As of mid-February, CME Class III futures had March at roughly $16.68 and April around $17.24, with the curve reaching $18 by November. There’s a path to USDA’s annual average, but it requires a back-half rally that hasn’t started yet.
Why Per-Cow Output Missed — and Why Ration Cuts Are the Real Story
Nationally, per-cow production averaged 2,068 pounds in January — 10 pounds below StoneX’s 2,078 forecast. That 1.2% year-over-year gain is a real downshift from the stronger increases through mid-2025.
The explanation is ration economics. When your December Class III drops to $15.86 — down $2.76 from the prior year — you cut feed intensity. StoneX’s analysis notes these adjustments have “probably cut the fat content in the milk and slowed the growth in milk production per cow”. Component-adjusted production still rose 4.2%, with butterfat at 4.50% and protein at 3.45%, but the year-over-year gains are narrowing.
January’s FMMO butterfat price came in at $1.4525/lb — roughly 40% below the 2025 average of about $2.44/lb. Chasing components at those returns is a different proposition than it was a year ago.
Dairy economist Bill Brooks of Stoneheart Consulting puts 2026 milk income over feed costs at $10.14/cwt — still above the $8/cwt threshold generally needed to maintain production, but $2.30/cwt below 2025. The cushion is thinning.
The Real Profit Center: Calves, Not Milk
This is the paradox at the heart of today’s report. Milk prices are terrible. Farmers keep adding cows anyway.
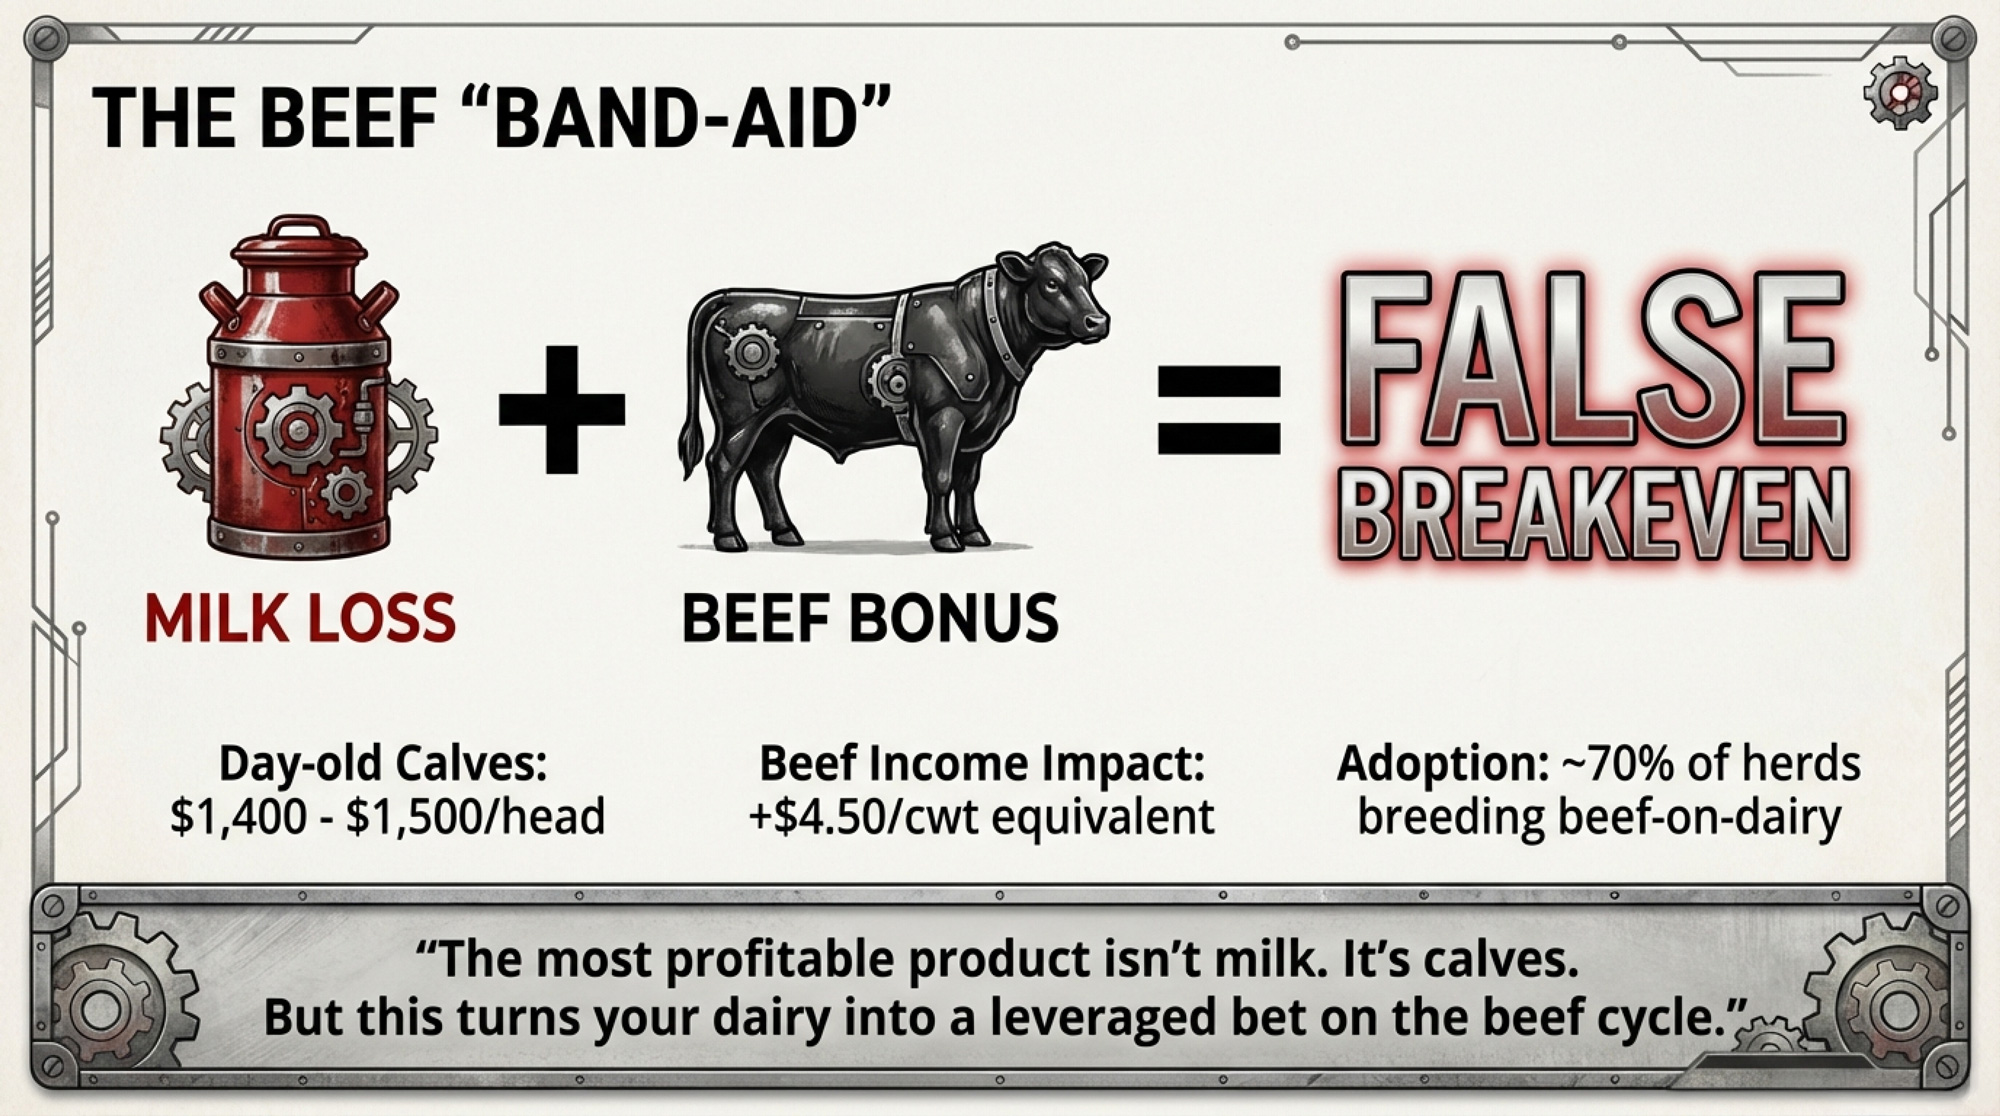
The answer walks out the barn door on four legs. Nationally, day-old beef-on-dairy calves are bringing $1,400 to $1,500 per head — up from roughly $650 just three years ago. High Ground Dairy’s modeling shows that beef-on-dairy calf values surged by more than 533% between August 2022 and August 2025. In strong Wisconsin markets, premiums push that figure higher still.
DFA’s Corey Gillins, the co-op’s chief milk marketing officer, estimates that about 70% of DFA’s dairy farmer members are now engaged in beef-on-dairy breeding, adding roughly $2.50 to $3.00/cwt in calf revenue alone. That’s a DFA membership estimate, not an independent industry audit, but it tracks with NAAB semen sales data. High Ground Dairy’s October 2025 modeling on a 1,000-cow operation (55% bred to beef, 28% annual cull rate) pegs total beef-related income — calves plus cull premiums — north of $4.50/cwt of milk shipped.
On a 300-cow dairy shipping 69,000 cwt, that’s roughly $310,000 a year coming from the cattle market, not the milk market.
CattleFax’s outlook at CattleCon 2026 in Nashville forecast the average 2026 fed steer price at $224/cwt, roughly steady with 2025, and utility cows around $155/cwt. That suggests beef could stay supportive through 2026. But that’s not an excuse to skip the stress test.
What If Beef and Milk Prices Drop at the Same Time?
Walk through it step by step for that same 300-cow herd:
- 2025 total gross revenue: ~$1,460,730 (milk) + $310,000 (beef) = ~$1,770,730
- 2026 if WASDE holds + beef holds: ~$1,307,550 + $310,000 = ~$1,617,550 — down ~$153,000
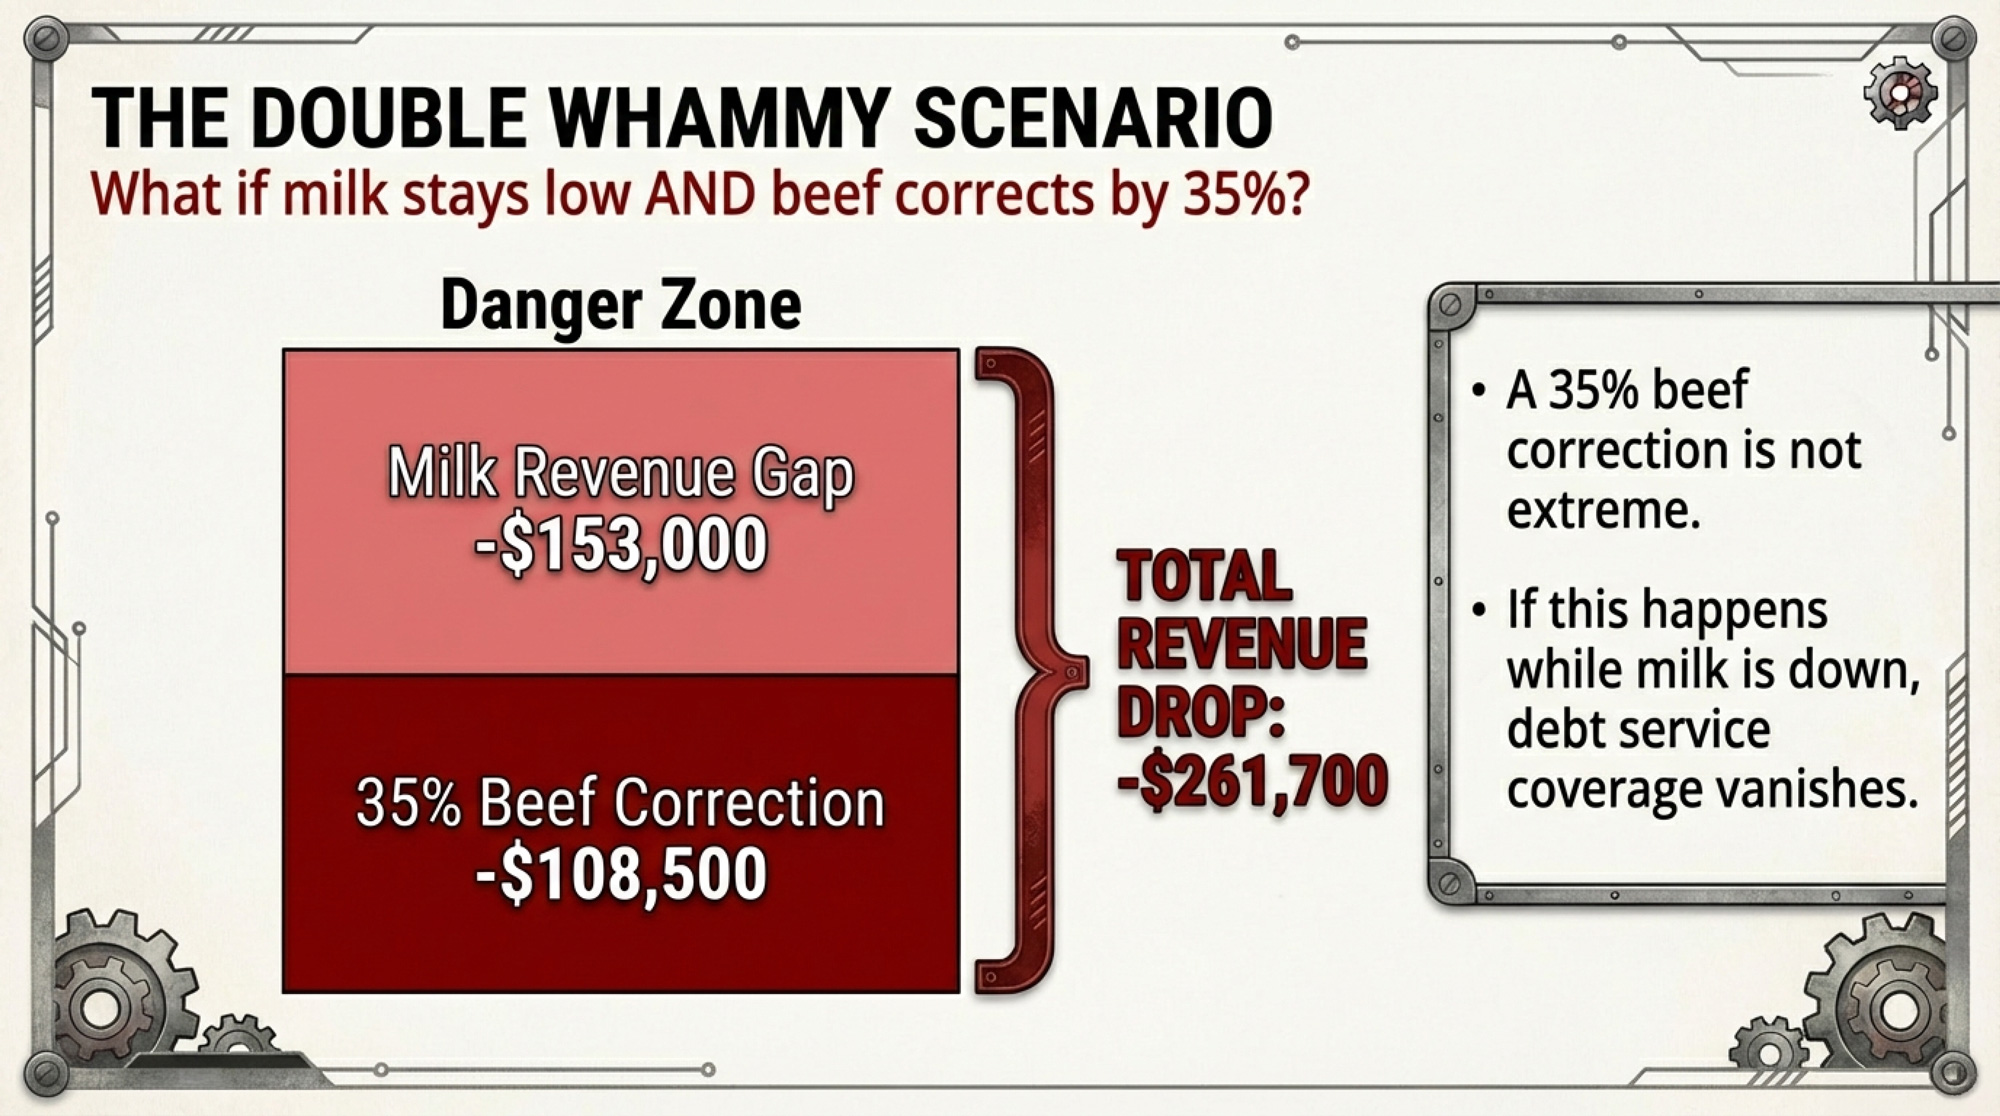
- 2026 if WASDE holds + beef corrects 35%: ~$1,307,550 + ~$201,500 = ~$1,509,050 — down ~$261,700
That 35% correction in beef isn’t extreme — it’s within range for a normal cattle cycle turn. And the hit compounds because roughly $108,500 of your beef income disappears on top of the $153,000 milk gap you were already absorbing. If your total annual debt service is anywhere near $200,000, that second scenario puts you in the danger zone.
CoBank’s August 2025 analysis estimated that dairy producers held back roughly 611,600 cows from slaughter between Labor Day 2023 and mid-2025. But the dam is starting to crack. USDA data shows December 2025 dairy cow slaughter hit 248,400 head — up 10.6% from December 2024. And the uptick continued into January, with the week ending January 10 logging 60,300 head, up 8.8% year-over-year. If beef softens enough that everyone ships at once, those cows hit the rail together — and the cull market falls harder than the correction alone would suggest.
The Heifer Cliff Behind the Beef Check
There’s a price for breeding the bulk of your herd to beef genetics.
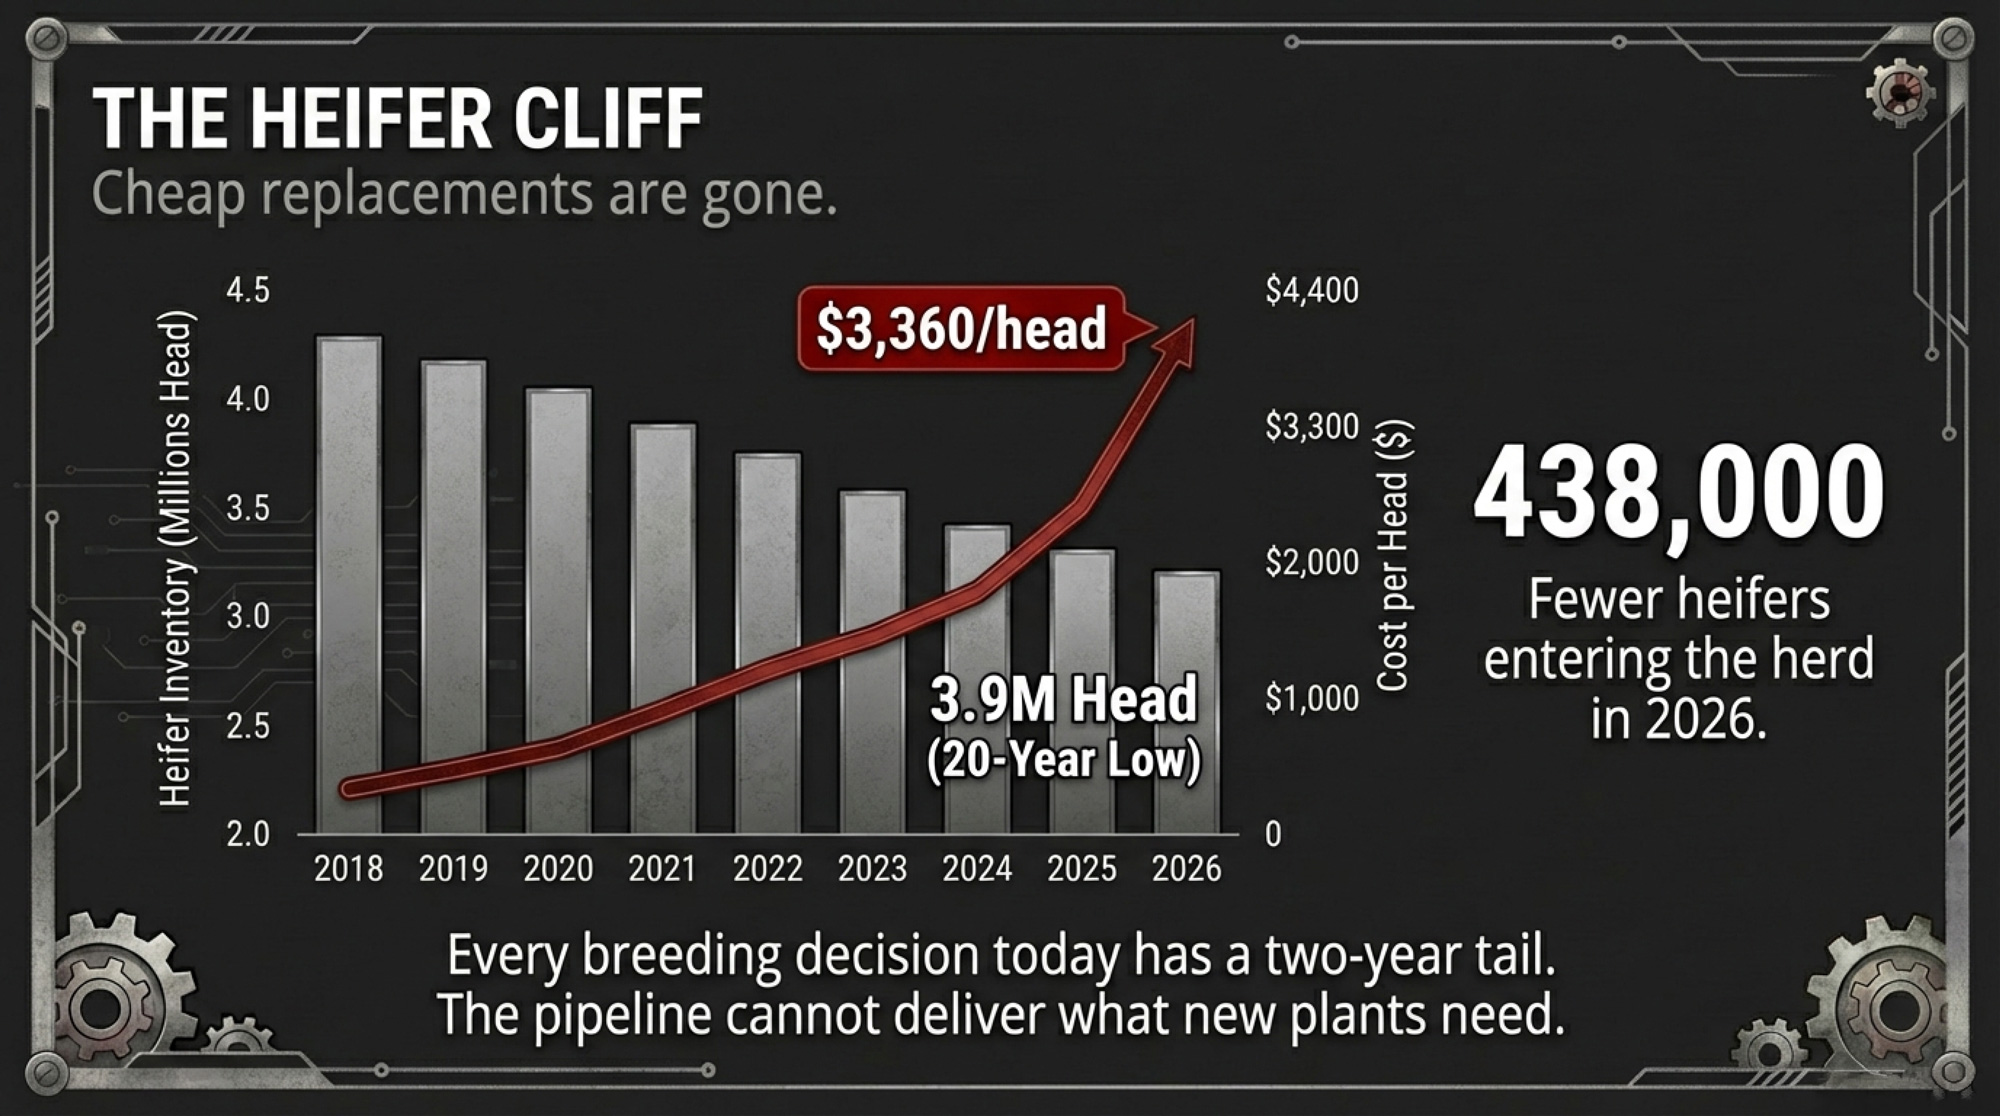
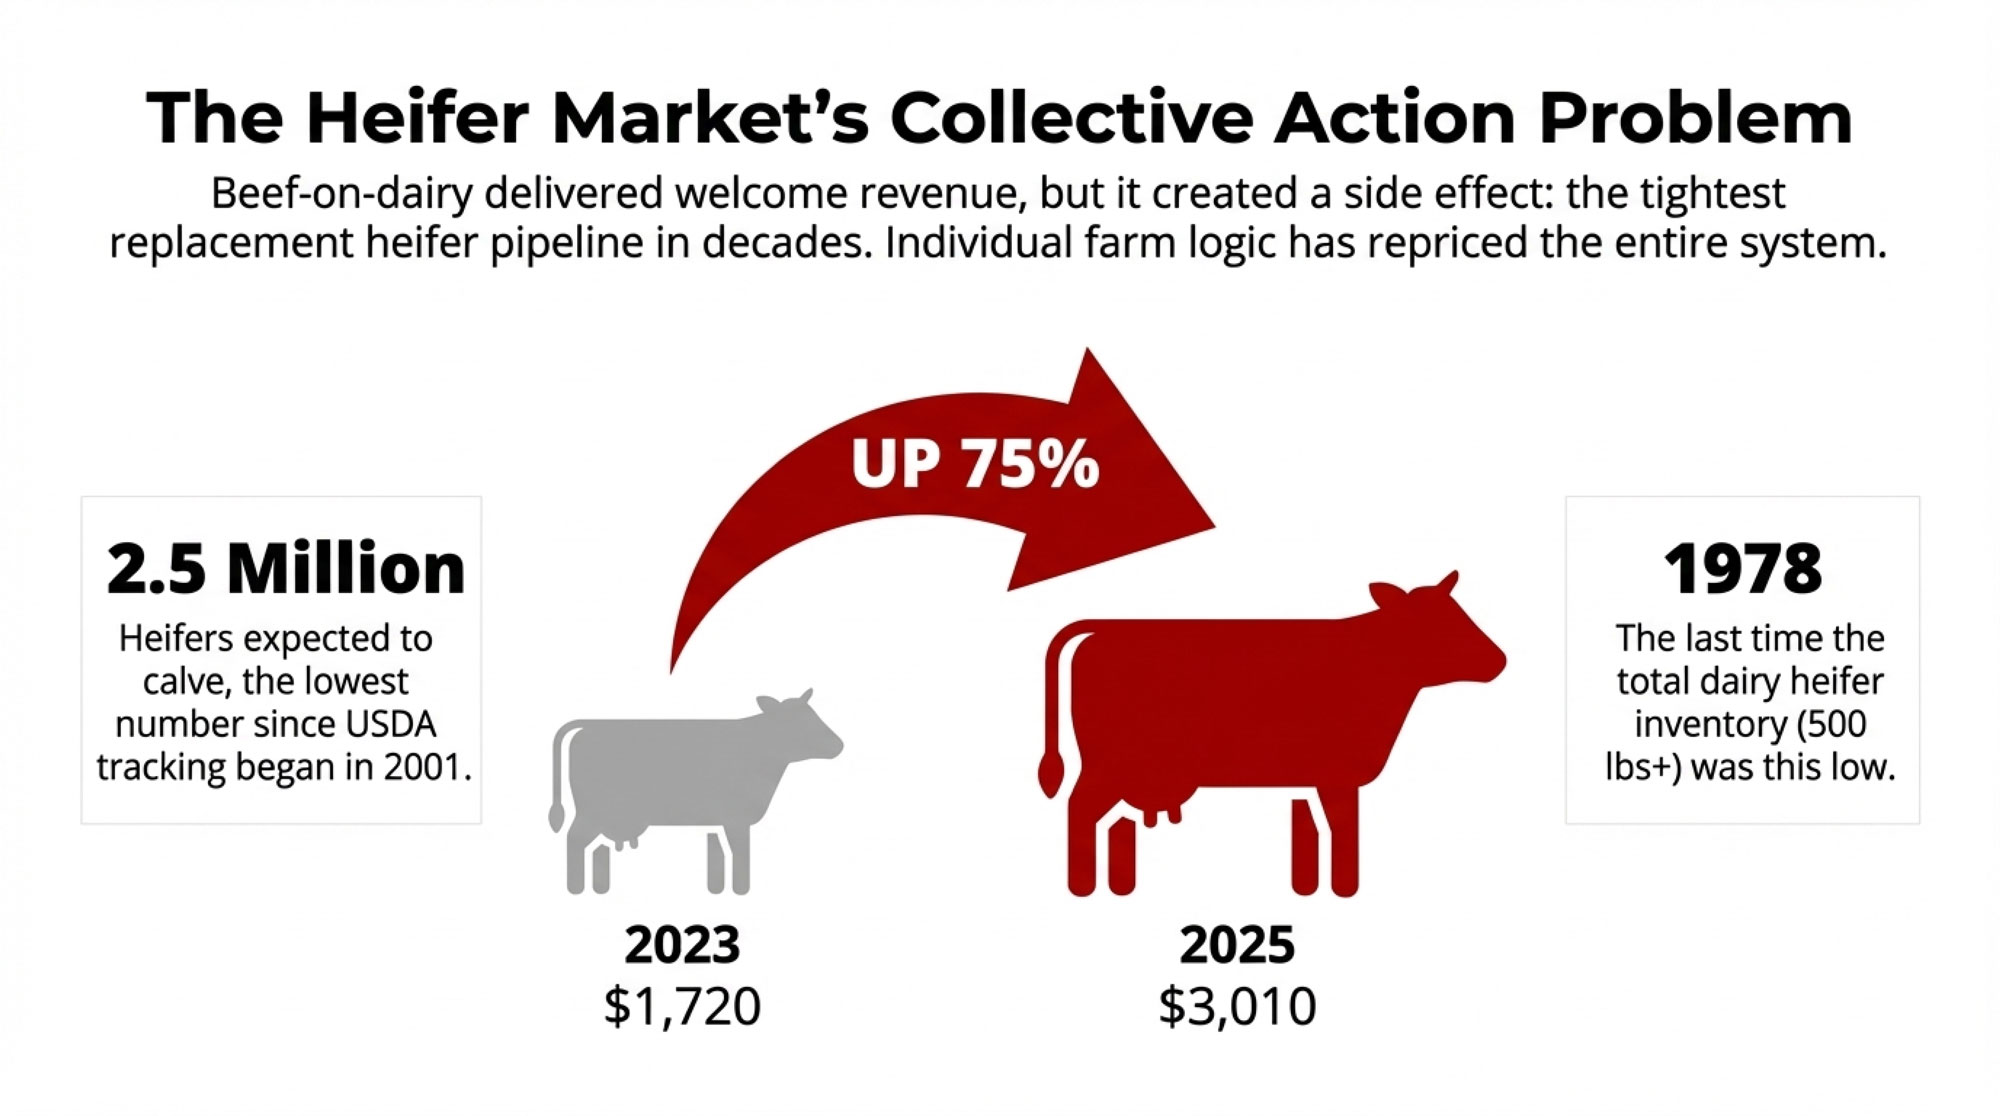
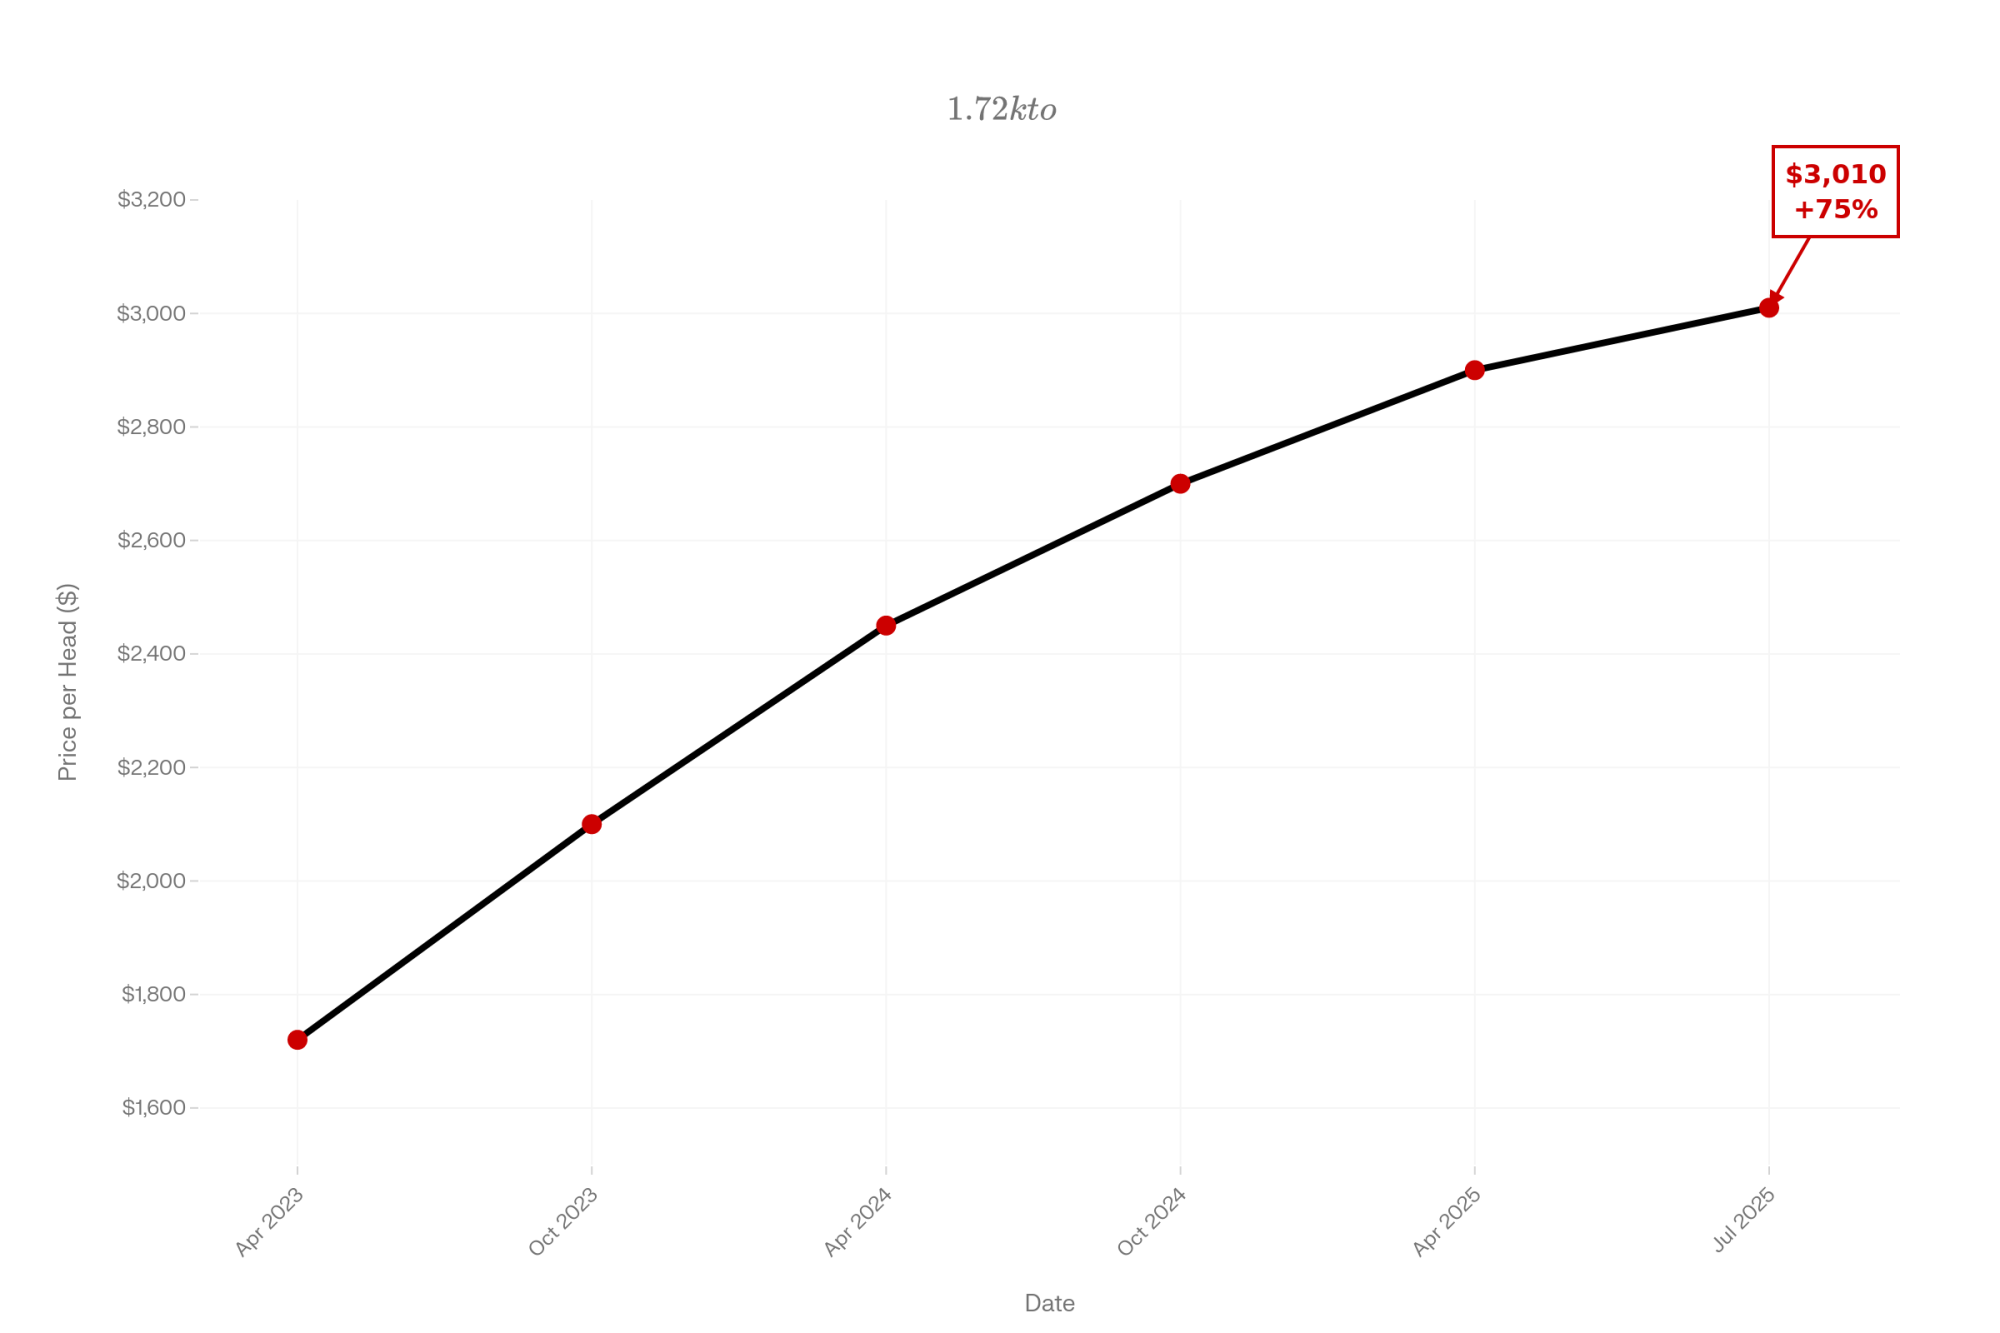
The U.S. now has its lowest dairy heifer replacement inventory in more than two decades — about 3.9 million head as of January 1, 2026. CoBank’s Corey Geiger, in a September 2025 report, projected 300,000 fewer dairy animals entering the milking stream in 2025 and nearly 438,000 fewer in 2026 — the year we’re living through. A rebound of about 285,000 isn’t expected until 2027, but that comes after a cumulative 800,000-head deficit.
| Year | Heifers Entering Stream | Change vs. Baseline | Cumulative Deficit | Replacement Cost/Head |
|---|---|---|---|---|
| 2023 | ~900,000 (baseline) | — | — | ~$2,100 |
| 2024 | ~850,000 | –50,000 | –50,000 | ~$2,400 |
| 2025 | ~600,000 | –300,000 (red) | –350,000 (red) | $2,600–$2,850 |
| 2026 | ~462,000 | –438,000 (red, bold) | –788,000 (red, bold) | $3,010–$3,360 (red) |
| 2027(proj.) | ~615,000 | –285,000 | –1,073,000 (red) | $3,200–$3,500 (est.) |
| 2028(proj.) | ~775,000 | –125,000 | –1,198,000 | TBD |
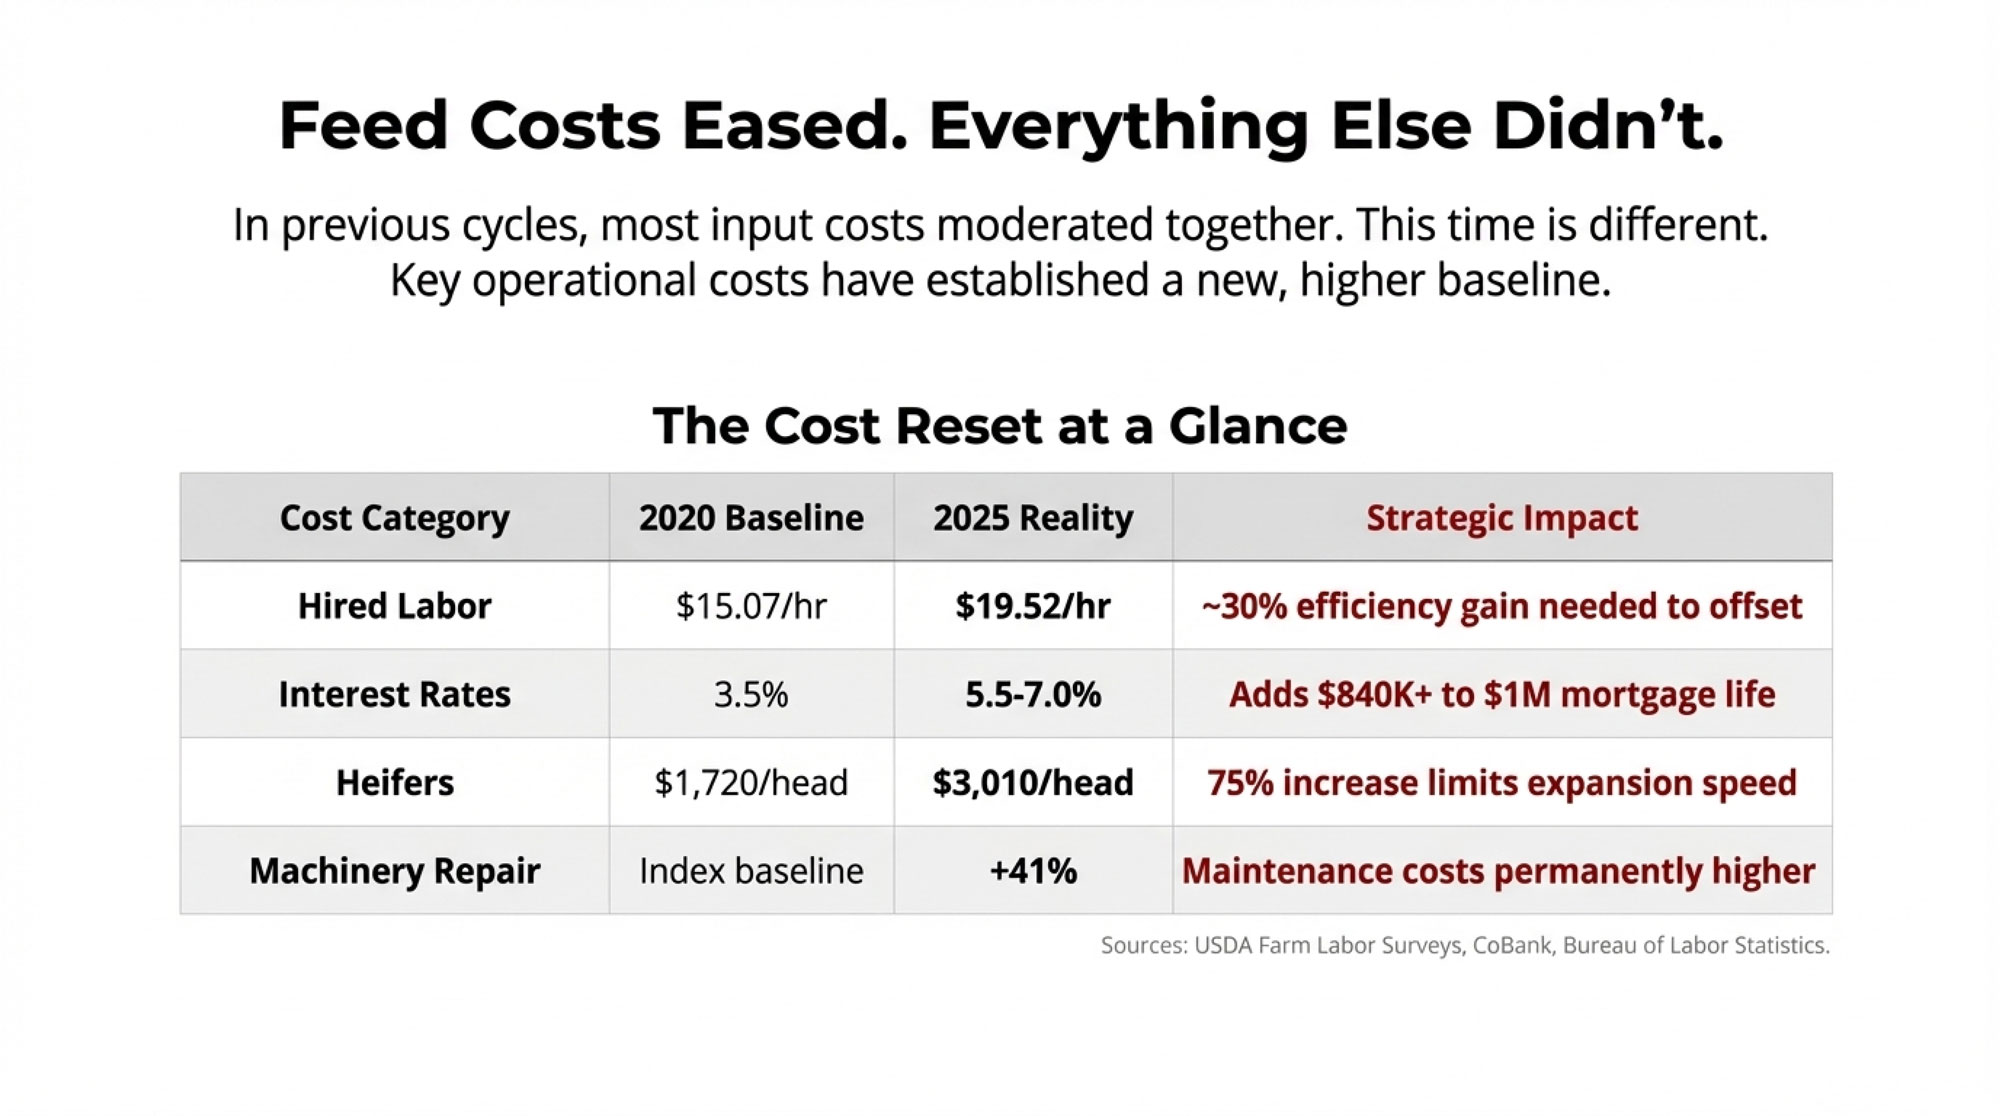
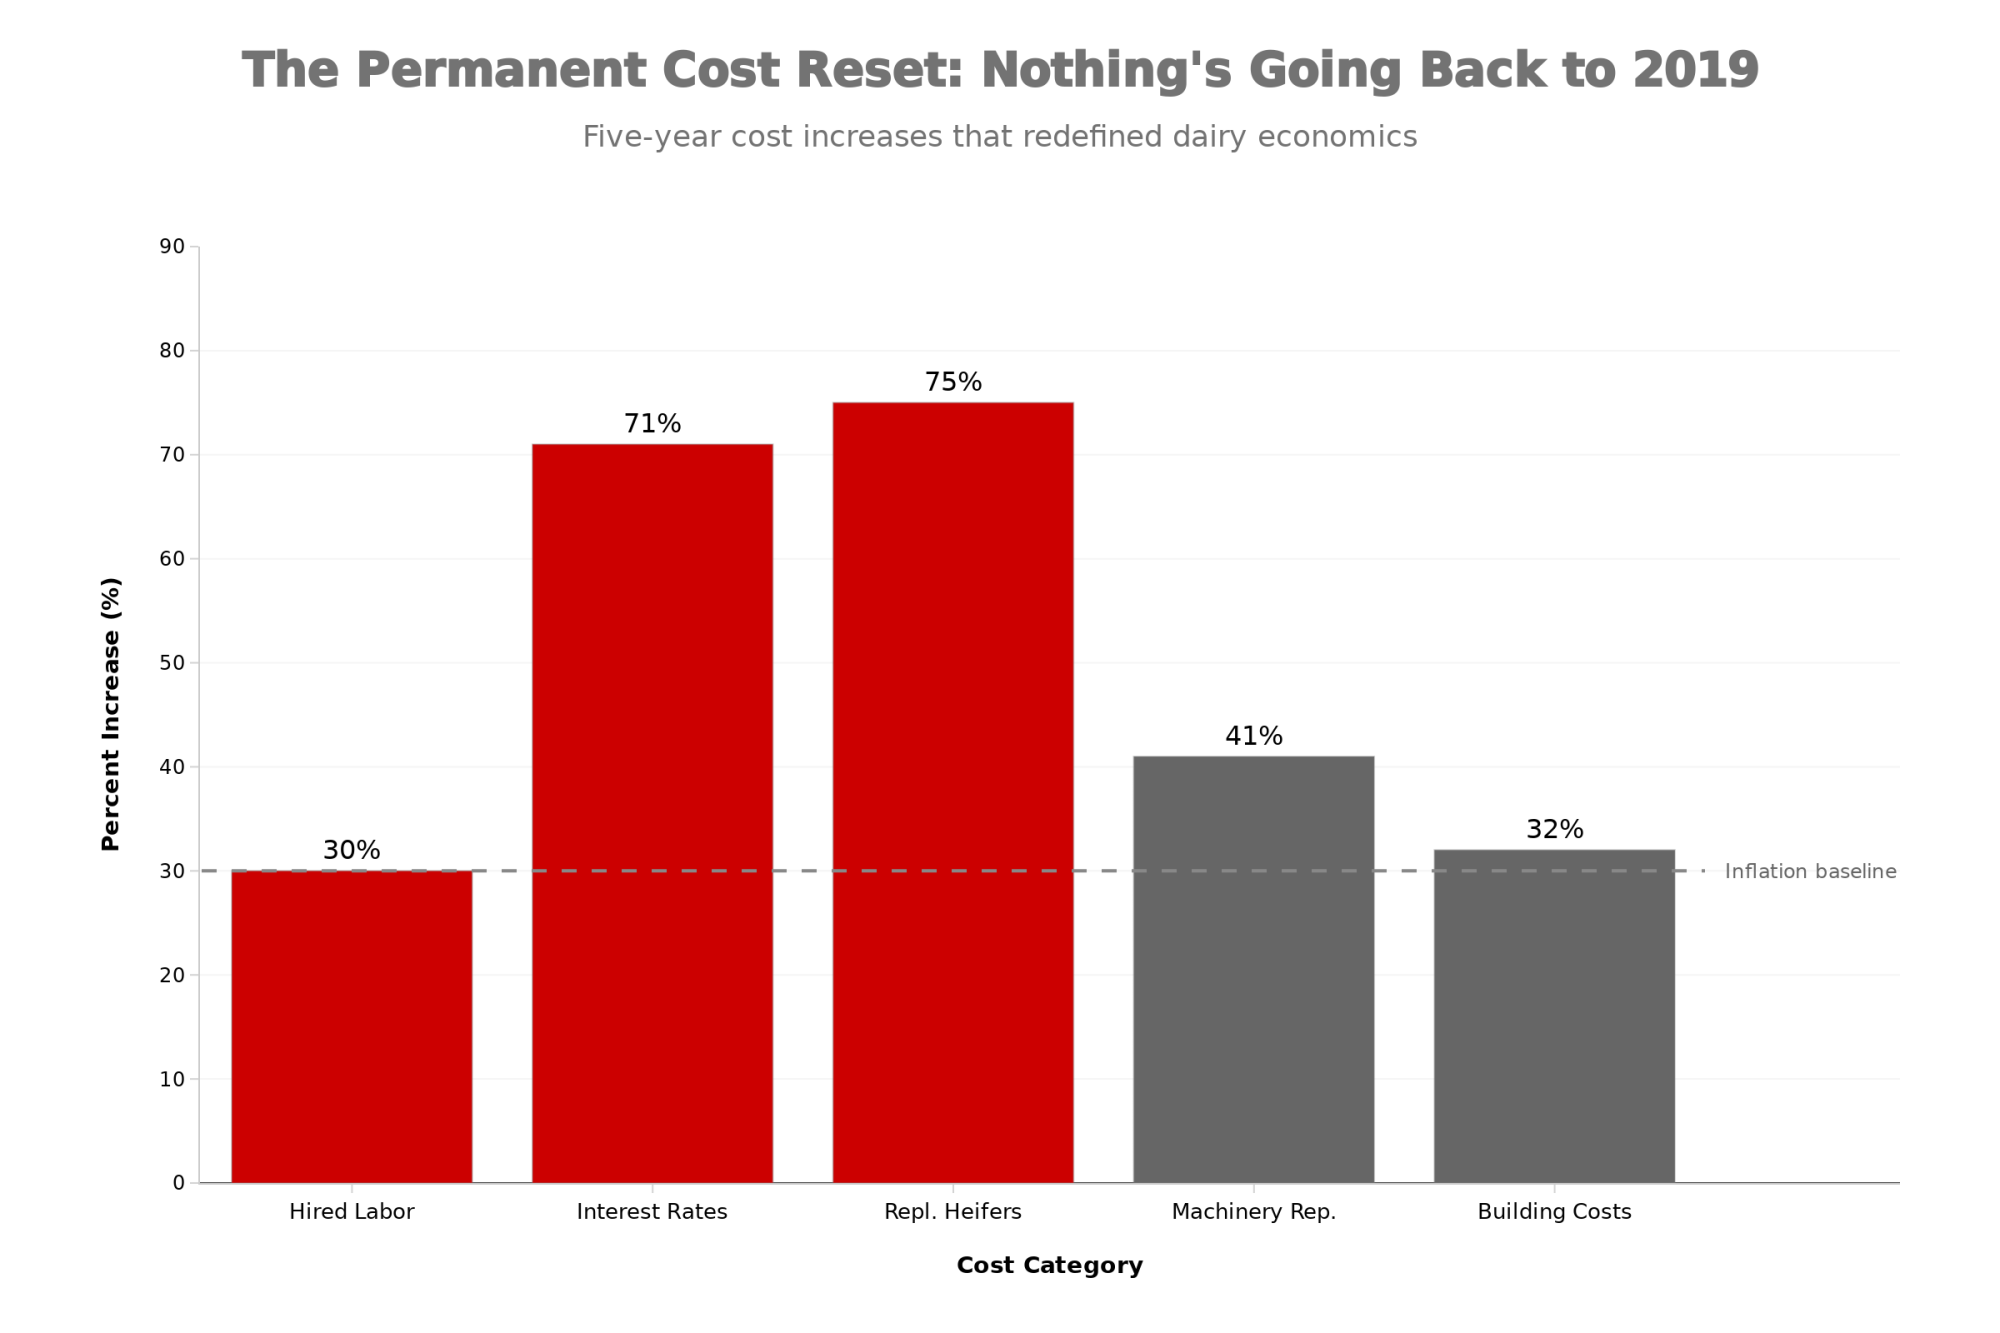
USDA’s January 2026 cattle inventory report pegs replacement heifer costs in the range of $3,010 to $3,360 per head. Wisconsin sits at the top of that range. These prices are up roughly 20–30% from a year ago, and the pipeline isn’t getting any fatter.
More than $11 billion in new dairy processing capacity is scheduled to come online through 2028 (much of it in Texas and the High Plains). Every breeding decision you make this month has a two-year tail — and the replacement pipeline can’t deliver what those new plants need.
The 48-Hour Playbook: What the Wisconsin Dairy Did
Remember that 550-cow operation with eleven weeks of cash? Here’s what happened next.
Within 48 hours, the producer culled his 10 worst feed-to-milk converters, bringing in roughly $22,000 in cash and cutting daily feed costs by about $85. He walked into his lender’s office with a 12-month projection of $18/cwt milk and a real cost-of-production sheet—not the optimistic version, but the one with market-rate labor and repriced debt. Then he negotiated reamortization of equipment debt (from seven to twelve years) and four months of interest-only on real estate.
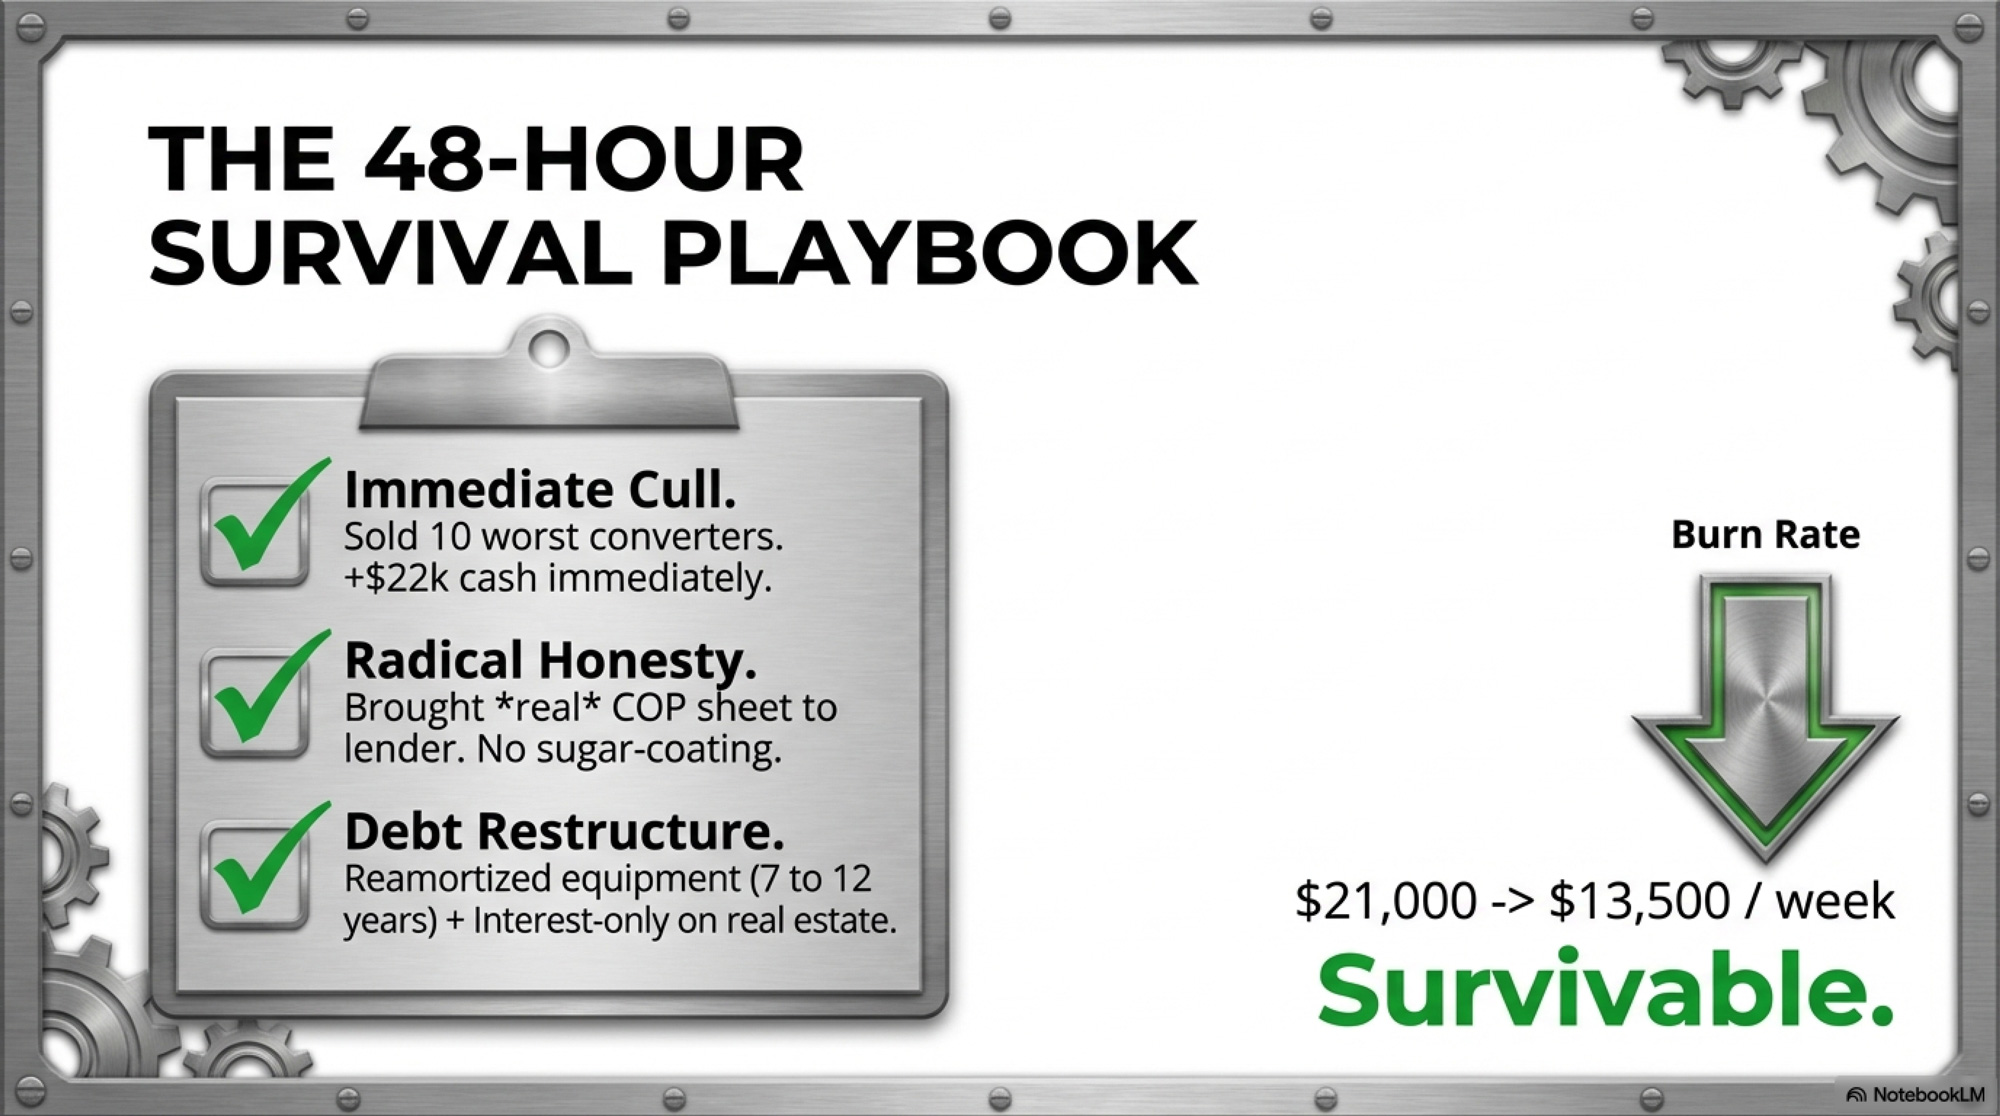
Weekly burn dropped from $21,000 to roughly $13,500. Same cows. Same parlor. New math. His runway went from eleven weeks to something survivable.
That’s what saved him. Not a magic ration. Not a unicorn contract. Just running the real numbers, believing what they told him, and moving before the runway disappeared.
What $14.59 Class III and $1,500 Calves Mean for Your 2026 Budget
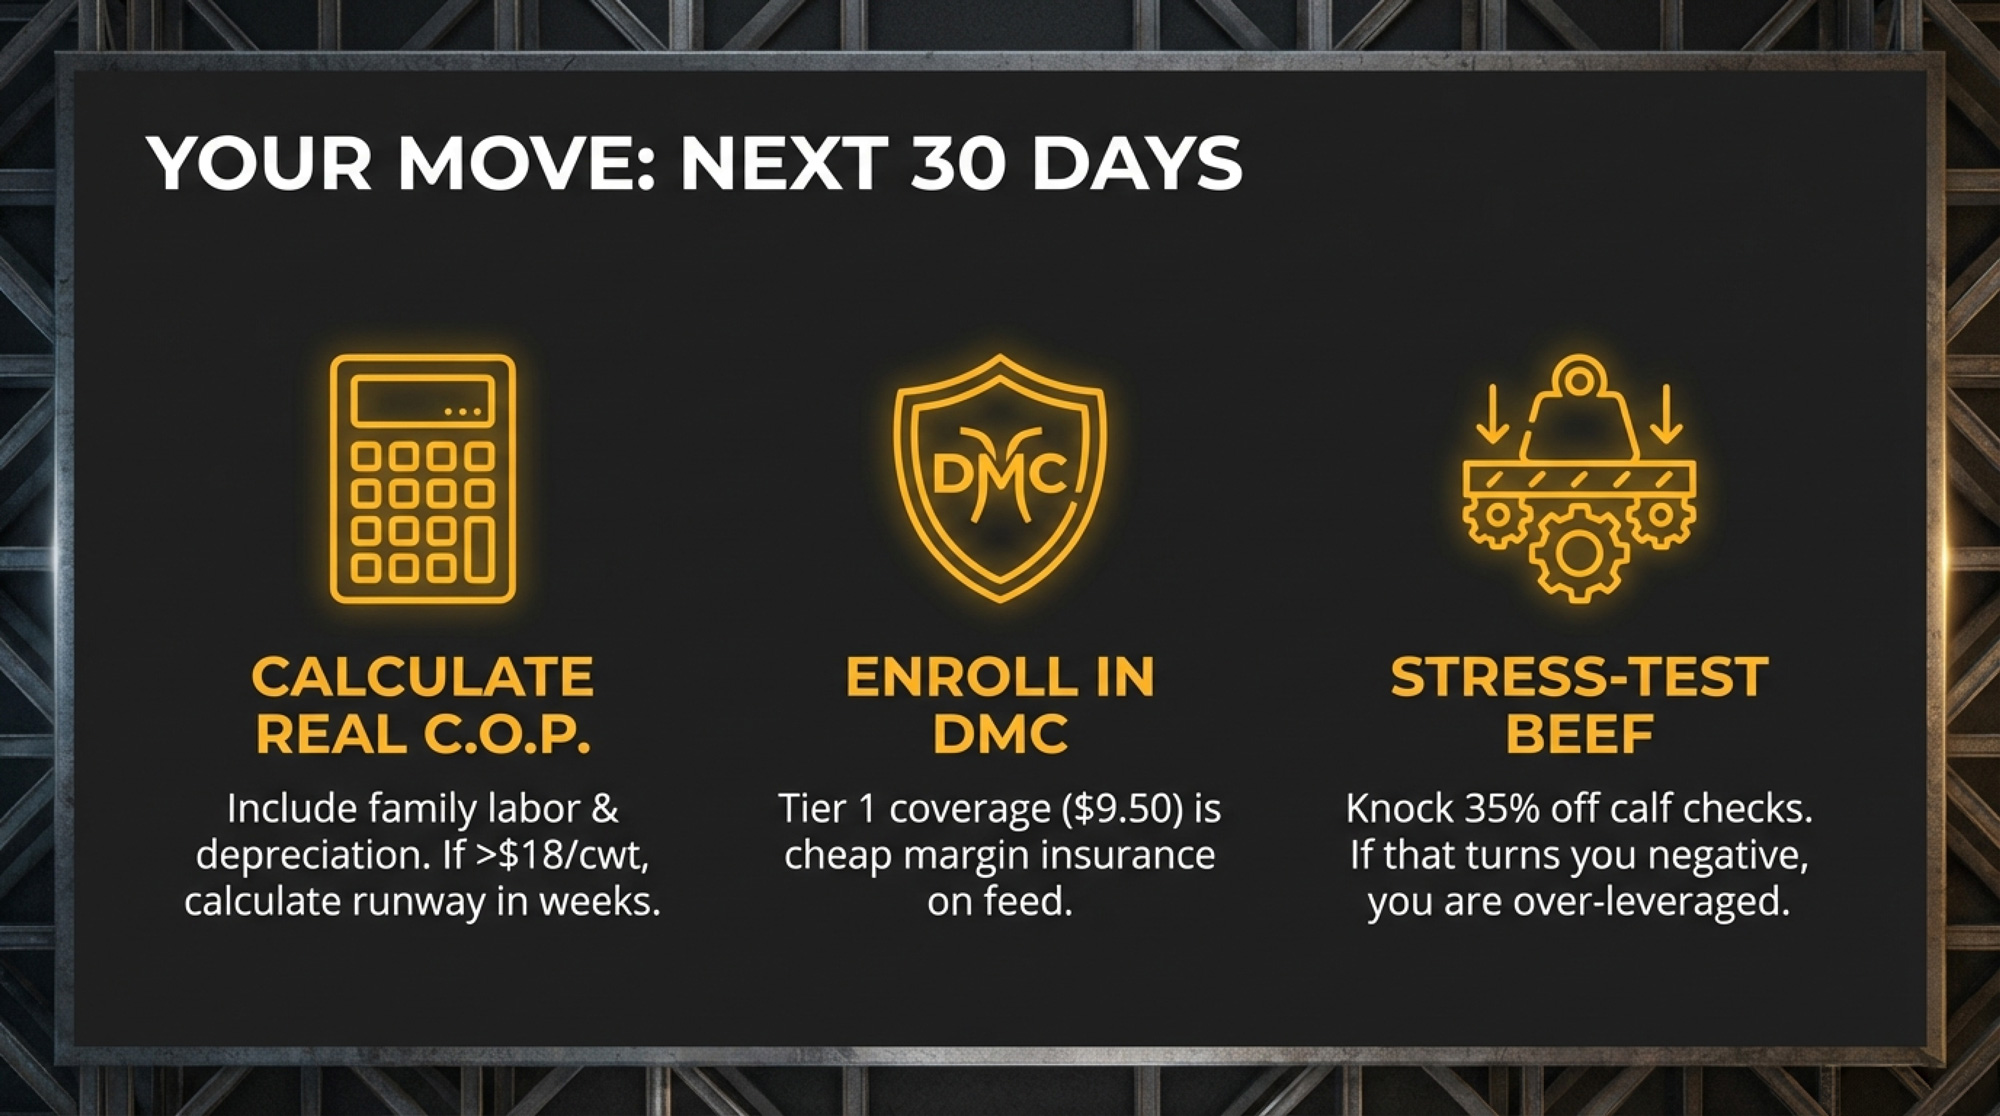
In the next 30 days:
- Pull your real cost of production — market-rate family labor, depreciation, repriced interest, and insurance. If your COP exceeds $18/cwt and your Class III check is printing $14–$16, you need to know your actual weekly burn and your runway in weeks, not months. That Wisconsin producer’s eleven-week wake-up call could be yours.
- Enroll in DMC before February 26 if you’re eligible. At $9.50/cwt, Tier 1 on 6 million pounds is cheap margin insurance on the feed side. And if you commit to the full 2026–2031 enrollment window, OBBBA gives you a 25% premium discount — though that’s a six-year lock-in, so weigh it against your planning horizon. Keep in mind DMC covers milk-over-feed margin, not the milk price itself. If your problem is the milk price and feed costs are already low, DMC alone won’t bridge the gap.
- Stress-test your beef income. Take your last 12 months of calf and cull revenue per cwt. Knock it down 35%. If that single change swings your operation from positive to negative cash flow, you’re not just a dairy — you’re a leveraged beef play.
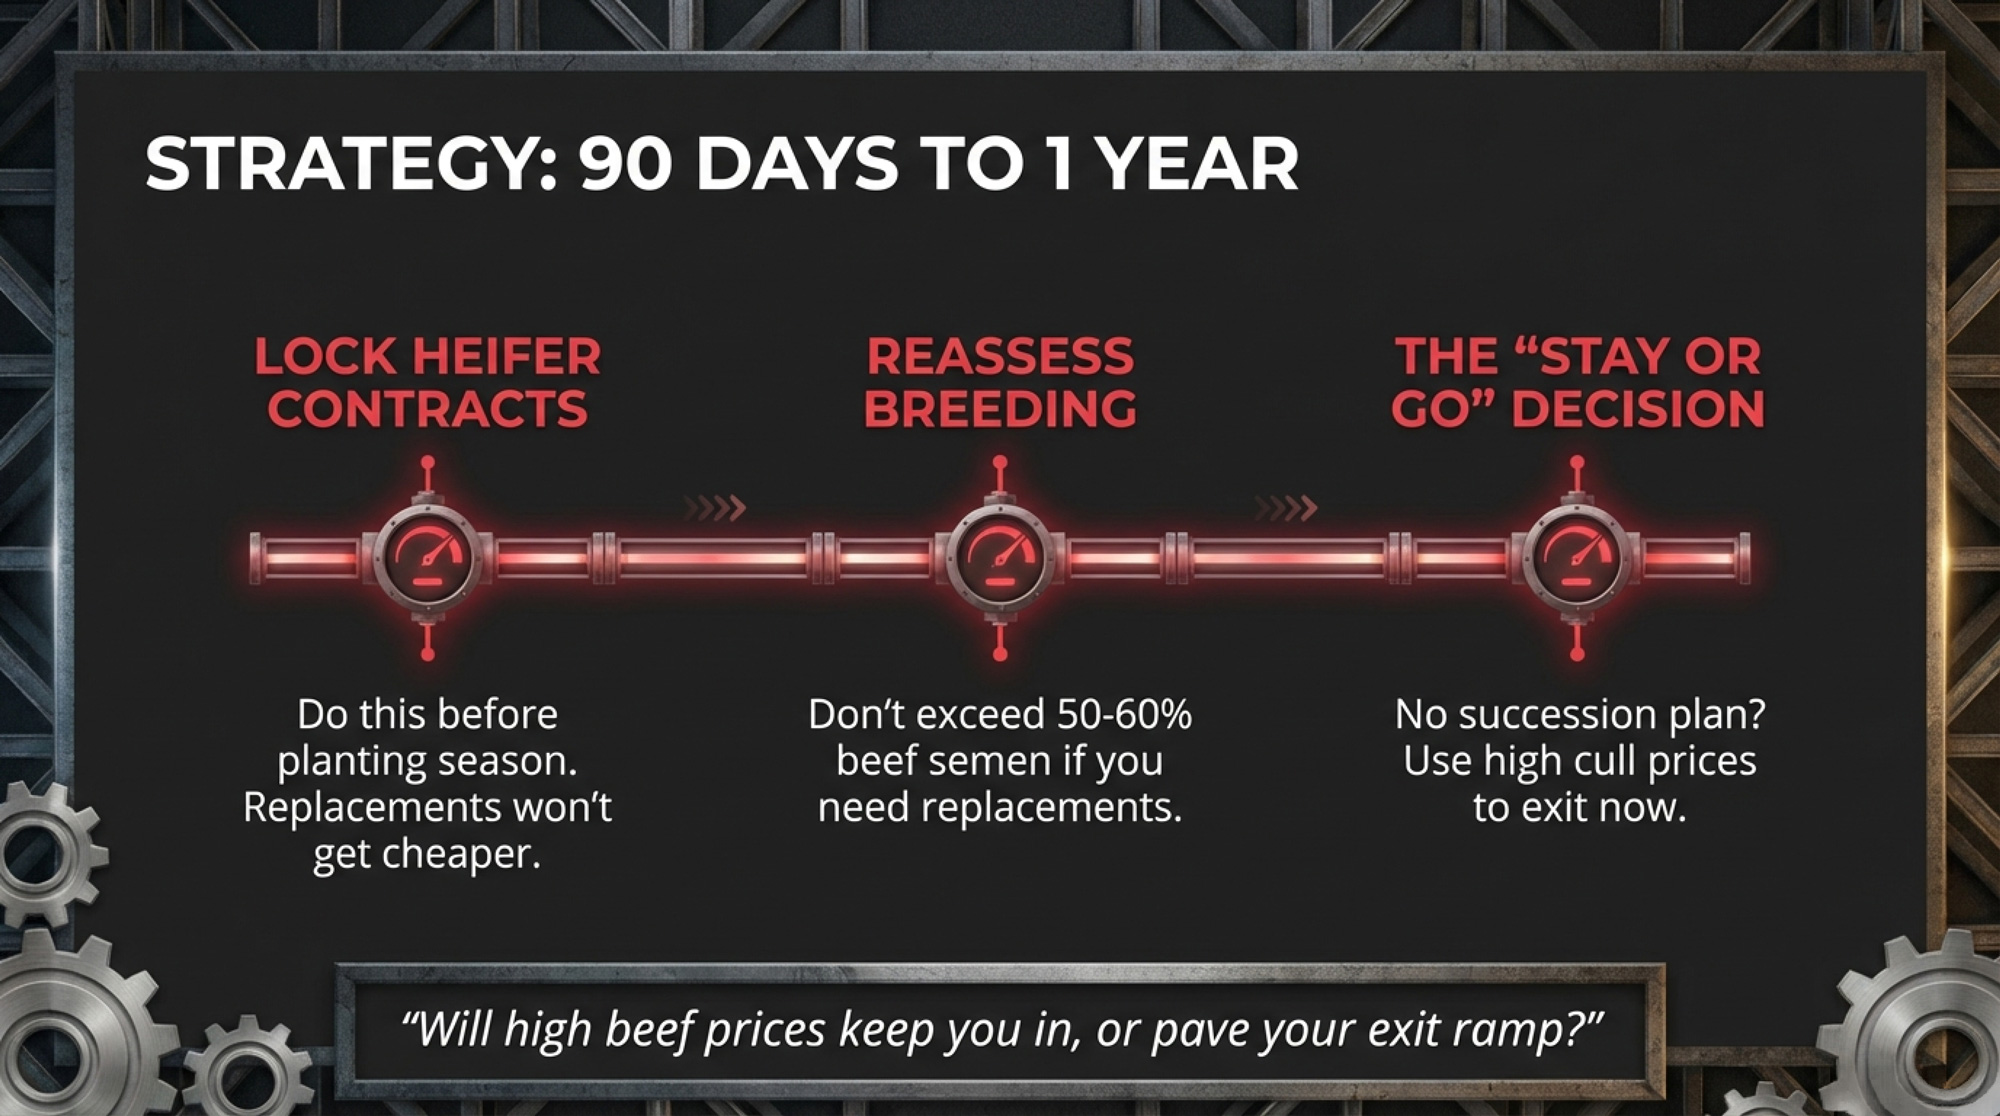
In the next 90 days:
- Lock heifer grower contracts before the planting season, as feed and land compete for replacement heifers — replacements at $3,010-plus aren’t getting cheaper with 438,000 fewer heifers entering the pipeline this year.
- Decide your fall AI breeding percentage. At current calf prices, the temptation is to beef at 70%+ or more. But every point above 50% further mortgages your replacement supply.
- If your cash flow requires a lender conversation, have it now—with a full COP sheet and a 12-month projection at $18.95 all-milk, not $21. Early conversations are get restructuring. Late ones get foreclosure.
Over the next 12 months:
- Reassess herd size against 2027 heifer availability and processor volume commitments. If you’re contracted to deliver a volume you can only hit by adding cows, price those cows at $3,010–$3,360 and run the payback against $16–$17 Class III.
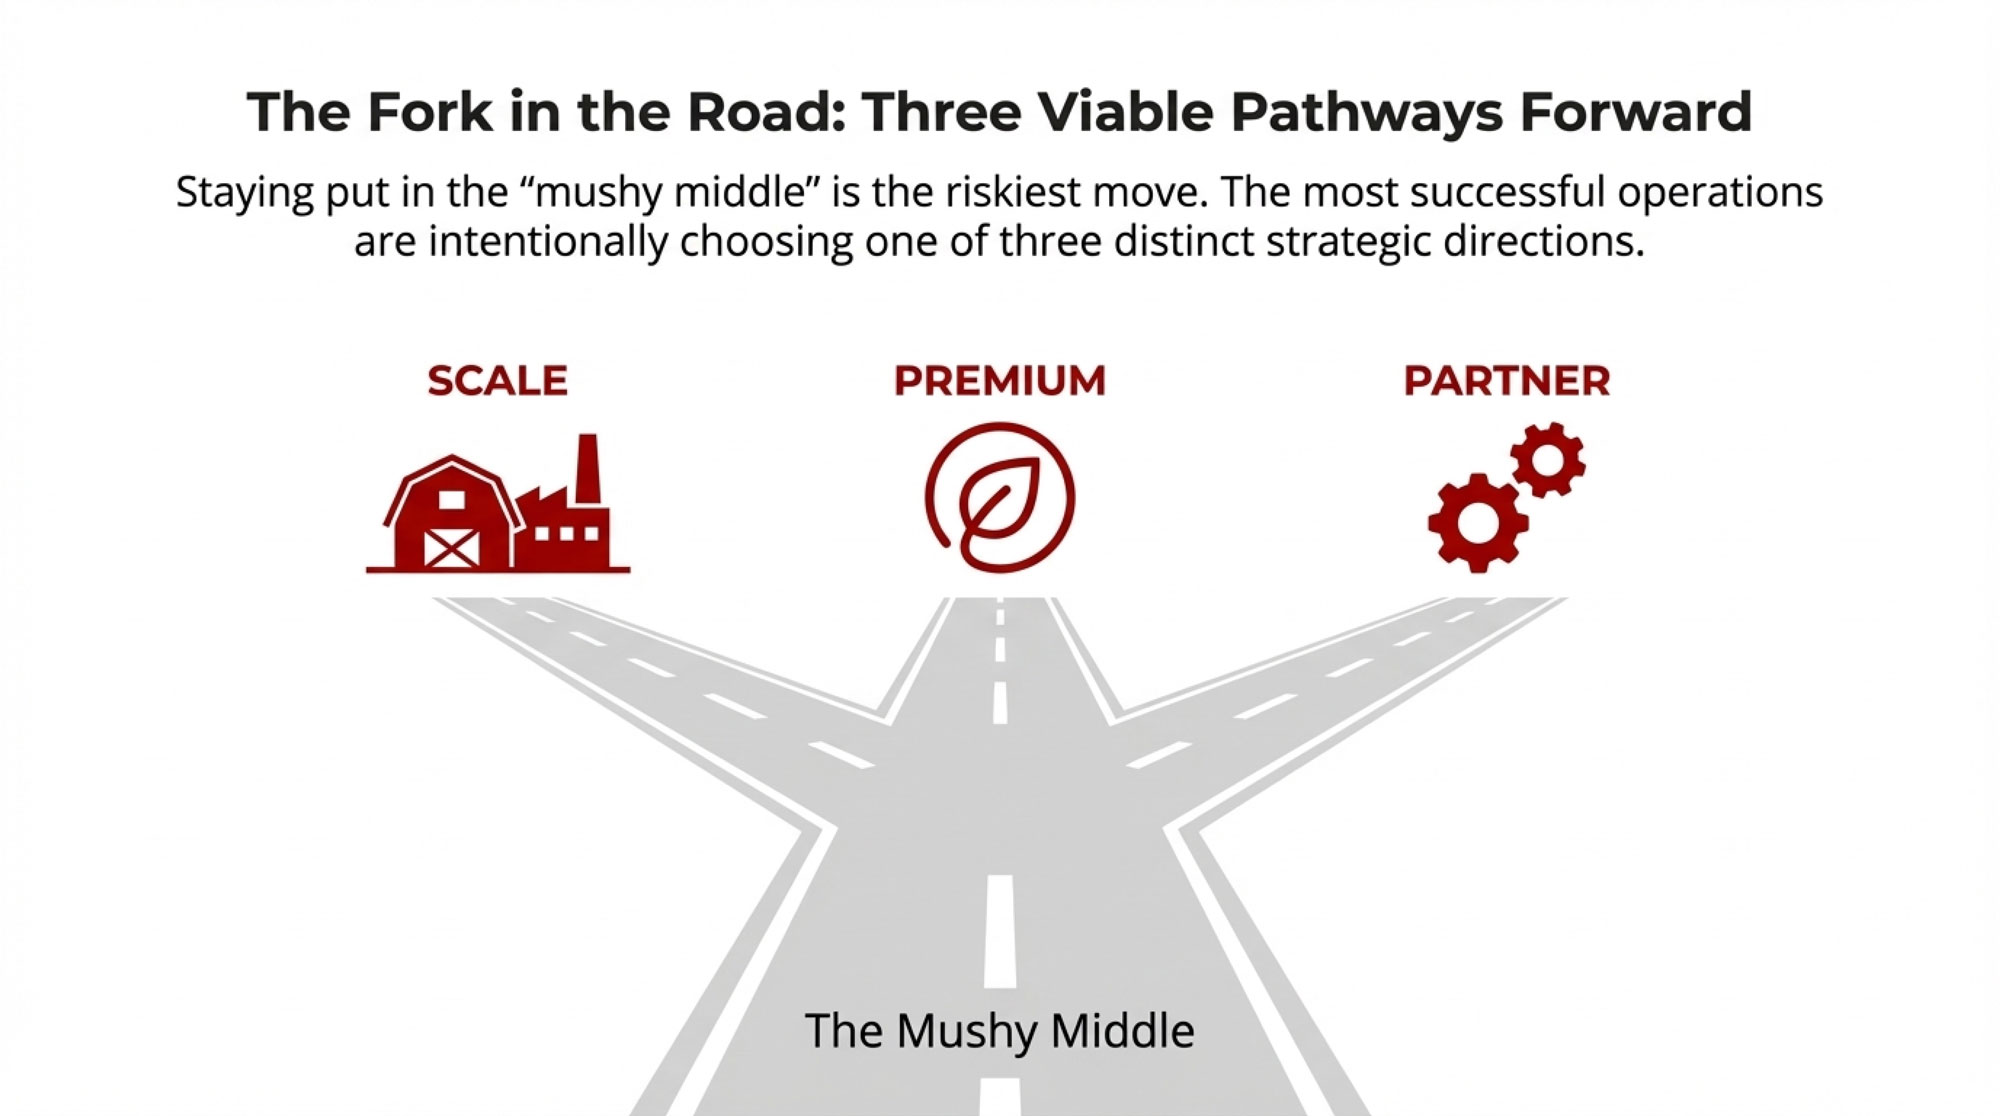
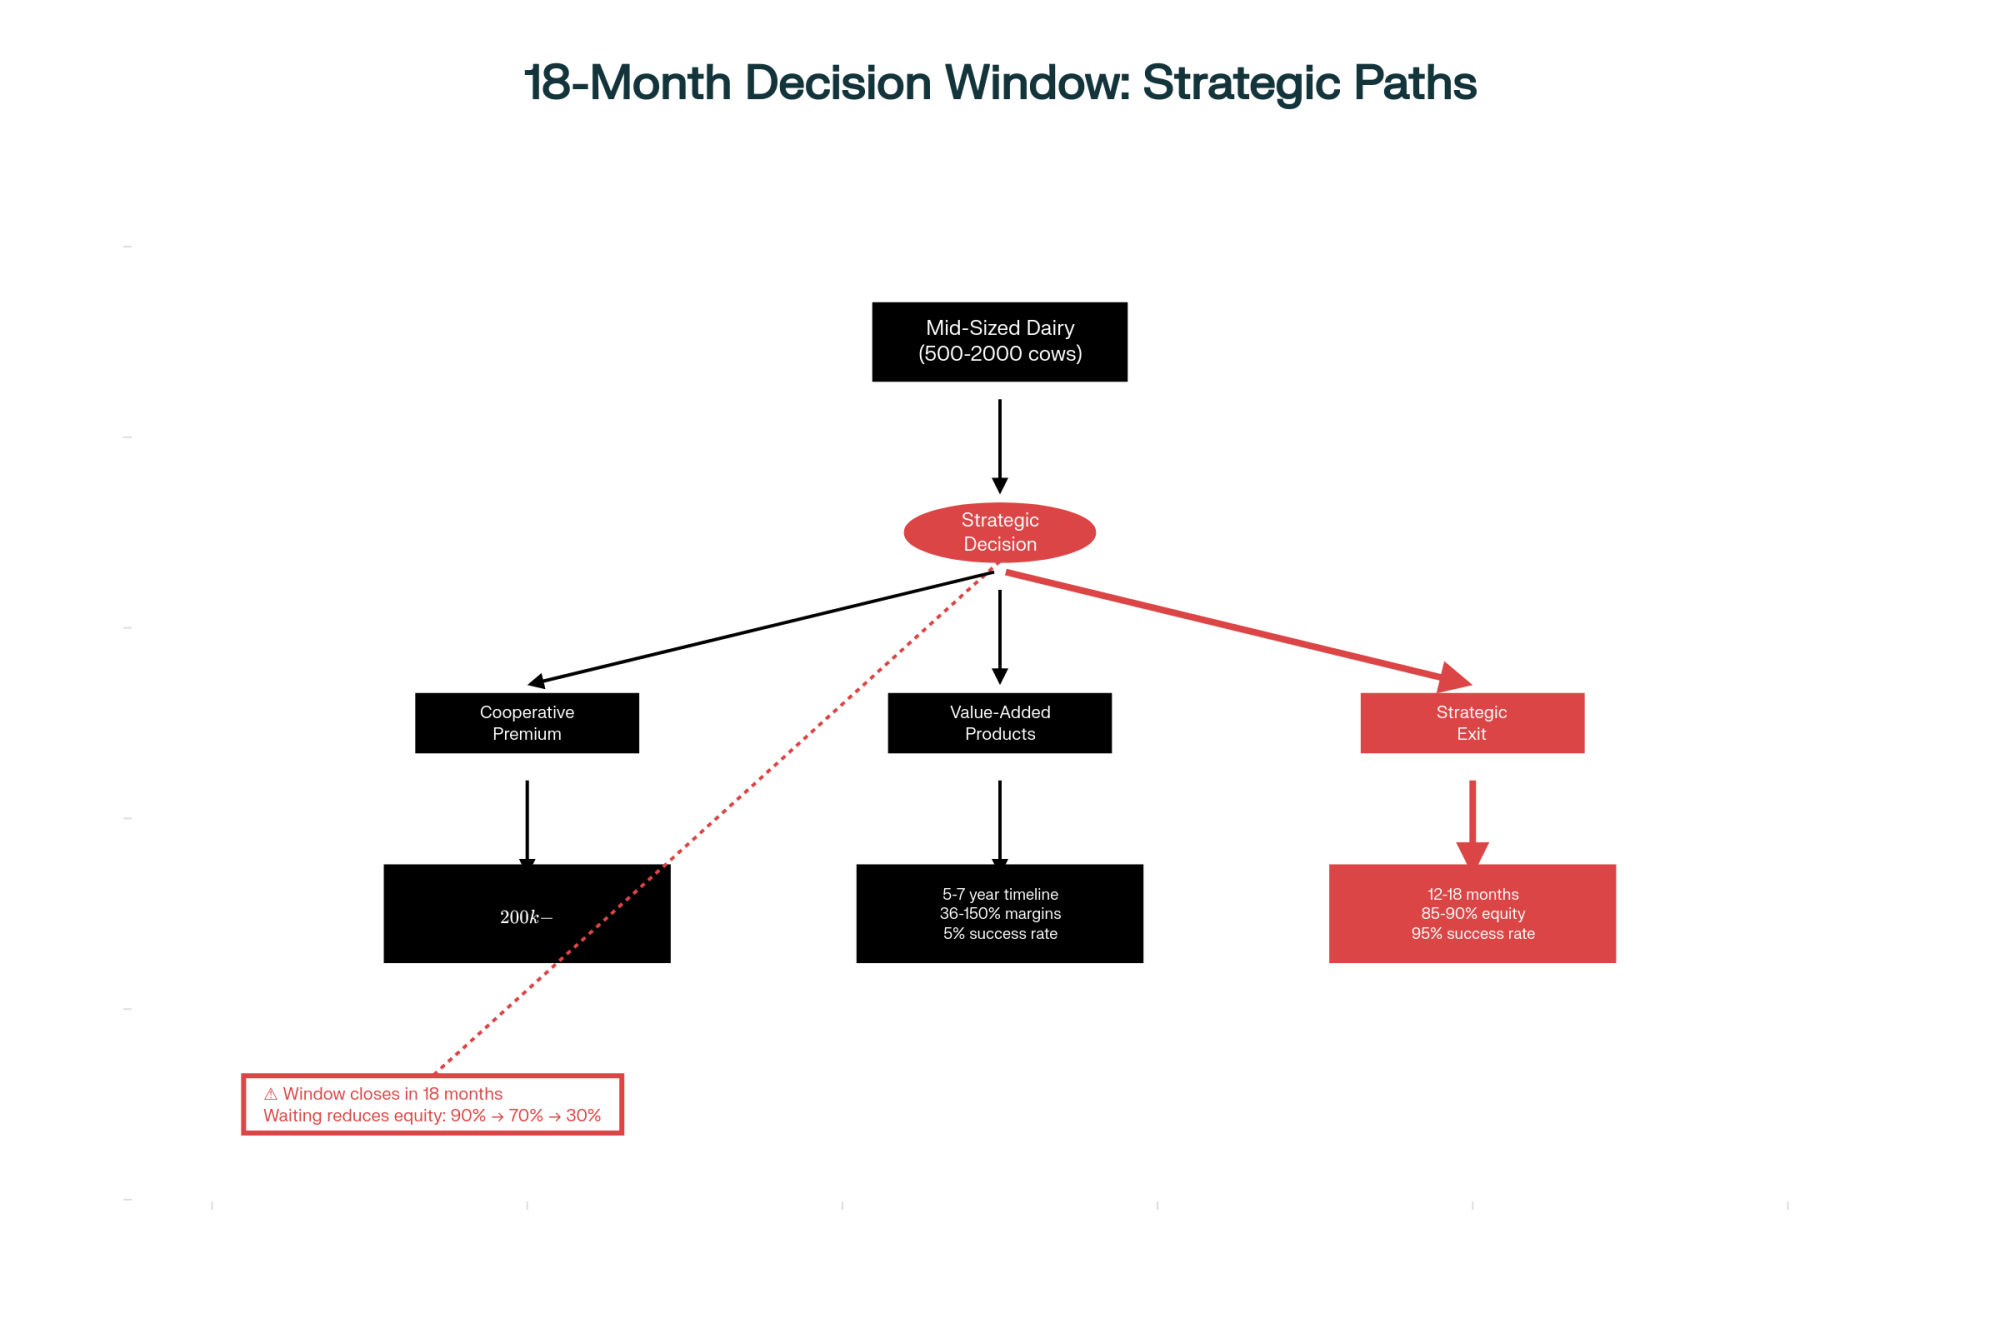
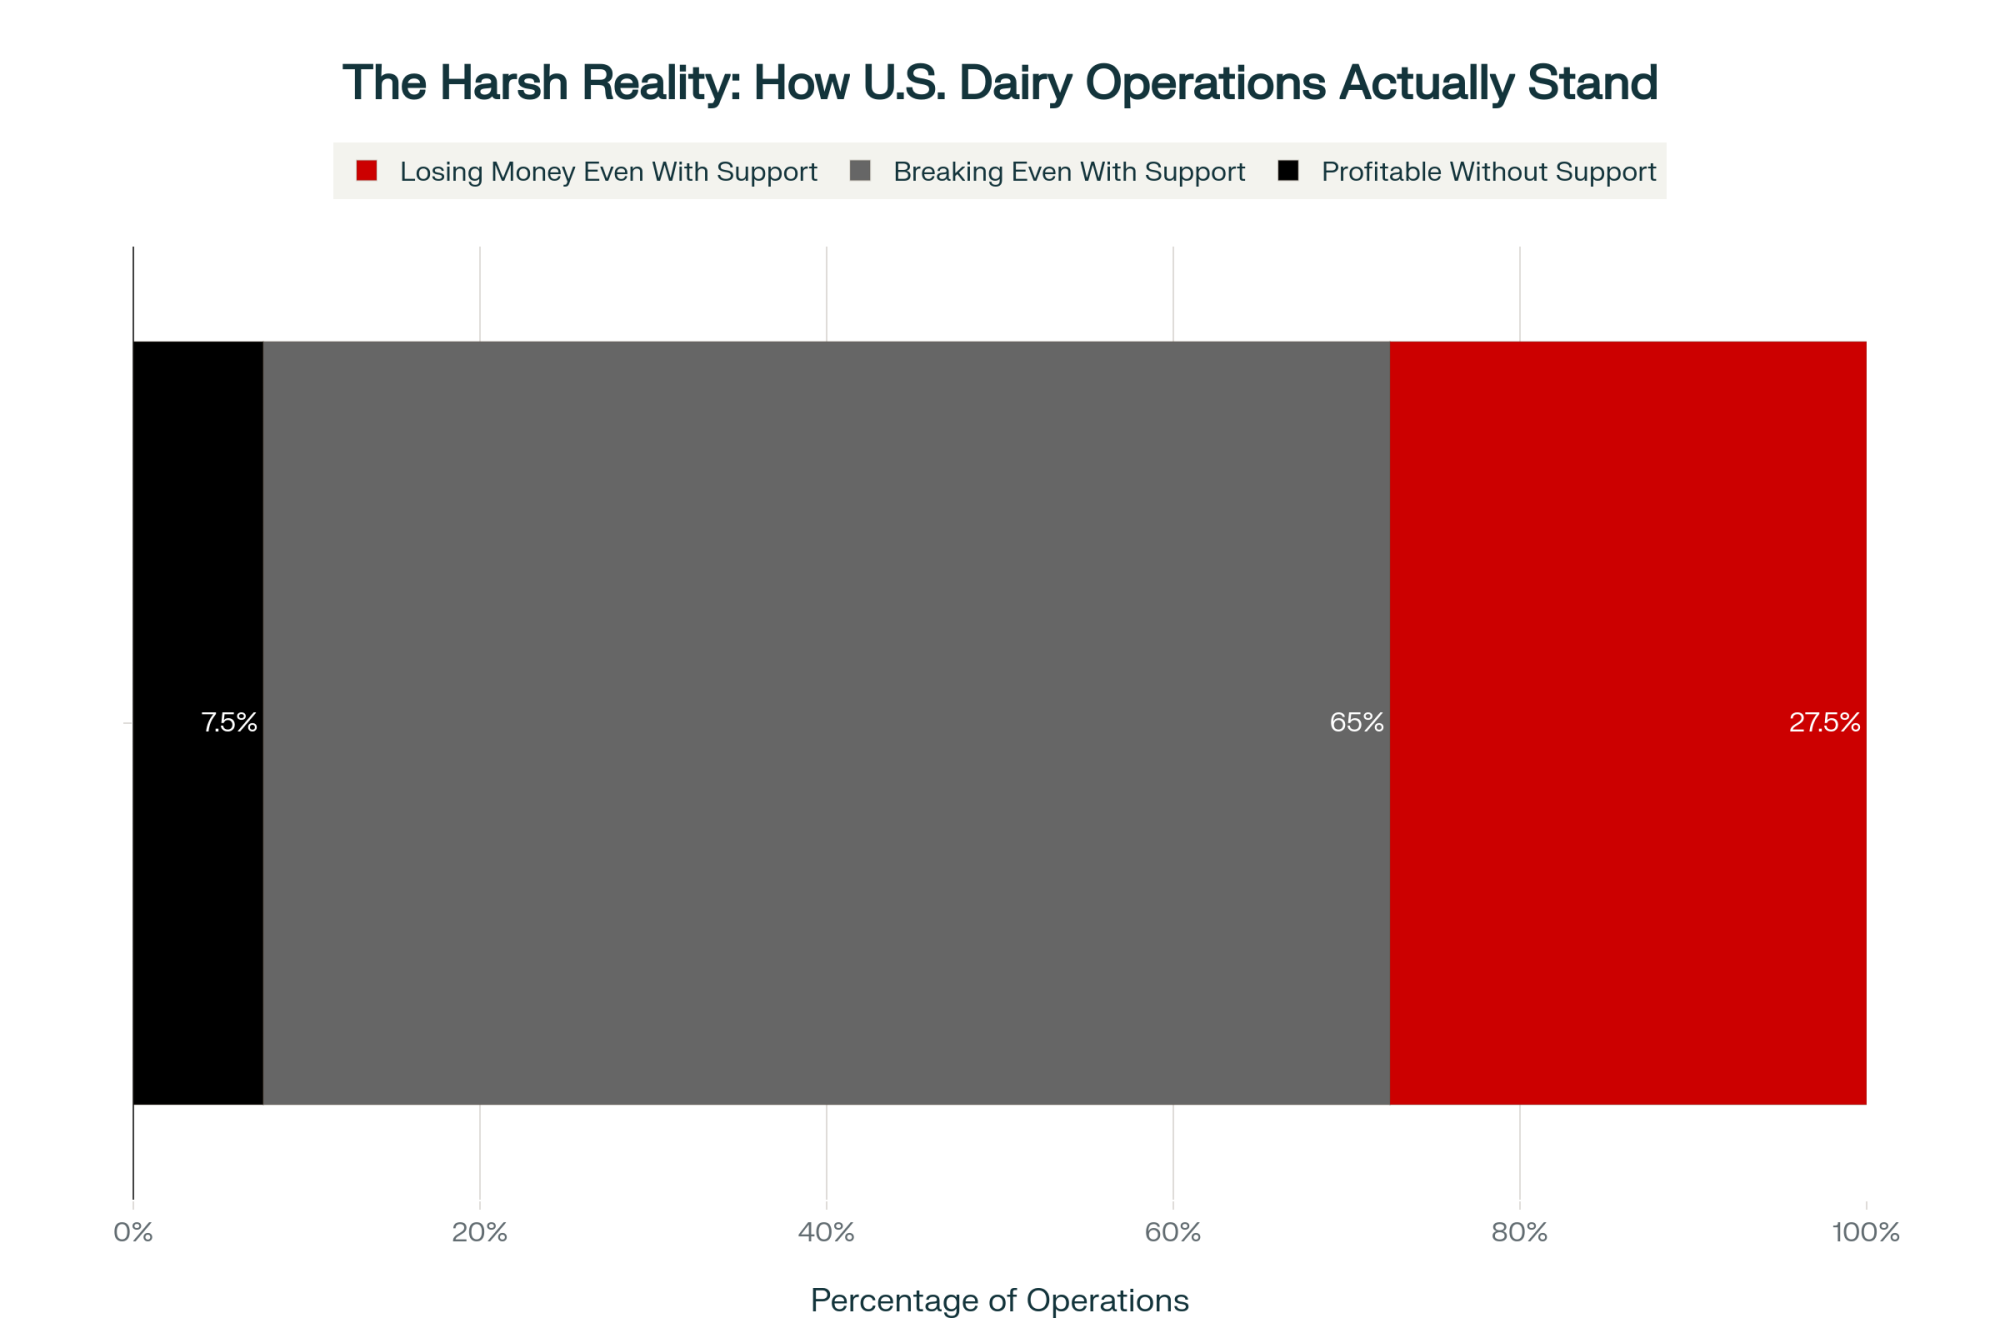
- If you’re a sub-200-cow operation without a succession plan, strong calf and cull values offer a historically good exit window. Phil Plourd of Ever.Ag Insights frames the question directly: will high beef prices keep producers in — keep the quasi-cow-calf thing going — or will they push them out, using high cattle prices to pave the exit ramp? Put hard numbers on “stay” versus “go” before the market decides for you.
Key Takeaways
- If your operating costs exceed $17/cwt and you aren’t generating $4+/cwt in beef-related income, January’s $14.59 Class III puts you in cash-burn territory. Run the numbers before planting season locks in your feed costs.
- The 14,000-head January herd expansion is processor-driven, not price-driven. Texas and Kansas accounted for the lion’s share. If you’re not near a new processing asset, this expansion adds supply that pressures your mailbox price without giving you contract upside.
- A 35% beef correction on top of the ~$153K milk revenue gap costs a 300-cow herd roughly $261,700 in total gross. That math is within normal cattle-cycle range. Check your debt service against that number.
- Geiger’s CoBank modeling says 438,000 fewer replacement heifers enter the milking stream this year. Every breeding decision you make this month has a two-year tail — and replacements above $3,000 aren’t getting cheaper.
The Bottom Line
The most profitable product on a lot of U.S. dairy farms right now isn’t milk. It’s calves. A Wisconsin producer with 550 cows and eleven weeks of runway learned that survival isn’t about which product pays best — it’s about knowing your real numbers and moving before the math moves you. Where does your operation sit if the cattle market and the milk check both soften in the same quarter?
Complete references and supporting documentation are available upon request by contacting the editorial team at editor@thebullvine.com.
 The Sunday Read Dairy Professionals Don’t Skip.
 The Sunday Read Dairy Professionals Don’t Skip.
Every week, thousands of producers, breeders, and industry insiders open Bullvine Weekly for genetics insights, market shifts, and profit strategies they won’t find anywhere else. One email. Five minutes. Smarter decisions all week.