Archive for butterfat value

USDA’s $148 Million Section 32 Dairy Purchase, Zero Dollars Guaranteed: What It Actually Means for Your Milk Check

NMPF asked USDA for exactly $148 million in dairy purchases last November. On February 19, USDA delivered — to the dollar. That’s not luck. That’s the advocacy pipeline working. Who benefits?

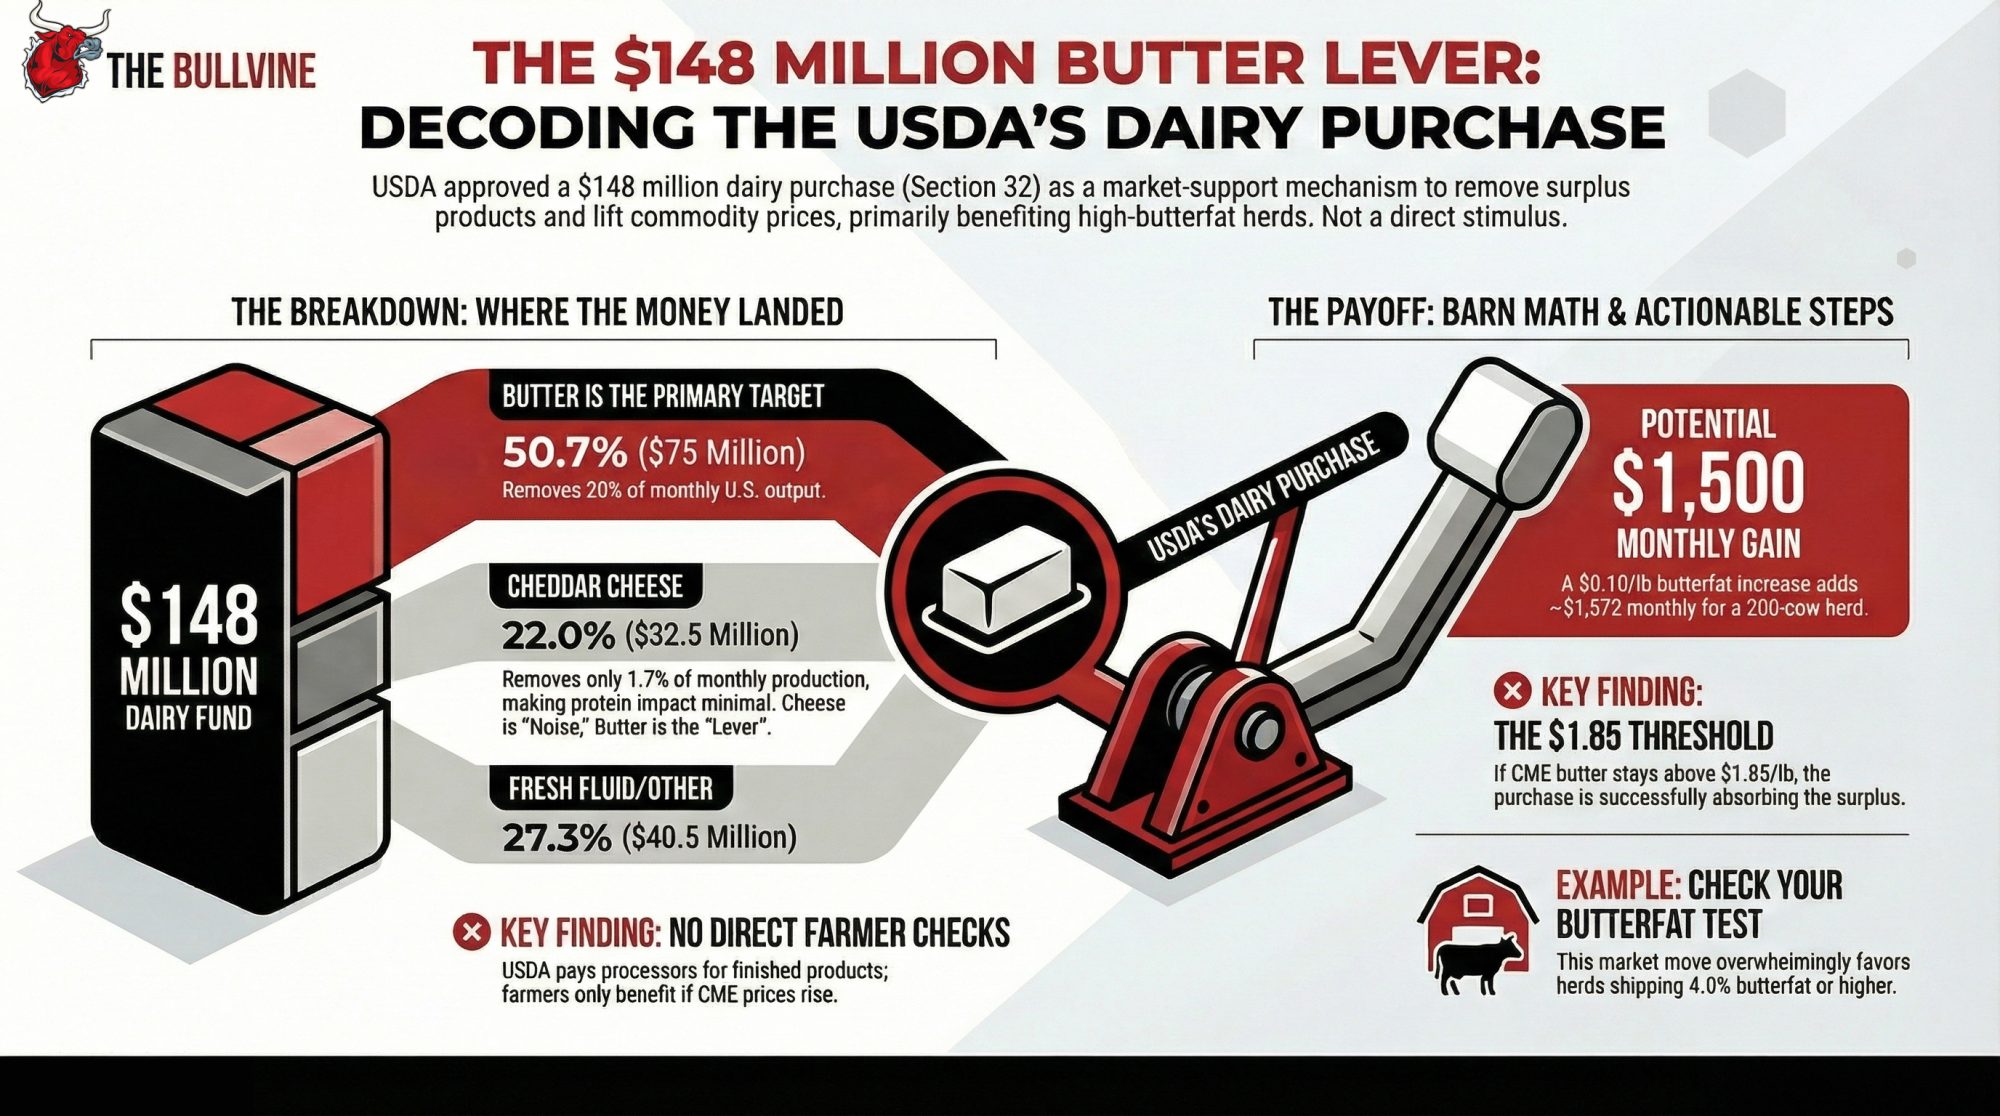
Executive Summary: USDA has approved $263 million in Section 32 food purchases, including $148 million for dairy — the exact figure NMPF asked for last November and the largest dairy round since the COVID programs. That money goes to processors for butter, cheese, and milk, not directly to farms, so any benefit shows up only if it lifts CME prices enough to move FMMO component values on your milk check. Butter is the main story: $75 million at current prices pulls roughly 40 million pounds — about 20% of a typical month of U.S. butter output — out of the commercial market, and CME butter already jumped $0.165/lb during the announcement week. The $32.5 million cheddar buy, by comparison, removes only about 1.7% of a month’s cheese production, so it’s unlikely to change protein checks on its own materially. For high‑butterfat herds, a sustained $0.10/lb increase in butterfat value can add more than $1,500/month per 200 cows, but only if the rally holds and your co‑op’s component premiums pass that value through. The article breaks down that barn math, compares this purchase to earlier Section 32 and COVID‑era interventions, and provides a 30/90/365‑day playbook so you can track CME butter, scrutinize your component statement, and adjust your risk‑management strategy in response to this one‑time demand boost.

$148 million. That’s the dairy industry’s share of USDA’s $263 million Section 32 purchase announced on February 19, 2026 — and it’s the exact figure the National Milk Producers Federation requested in a letter to USDA last November. Not one dollar more. Not one dollar less. 

Every ag newswire ran the number. Secretary Brooke Rollins called it “delivering wholesome, real food to Americans while injecting critical dollars into local economies”. NMPF President and CEO Gregg Doud said the purchases “will provide important relief to producers who will benefit from the additional demand”. The International Dairy Foods Association applauded. Headlines everywhere. 

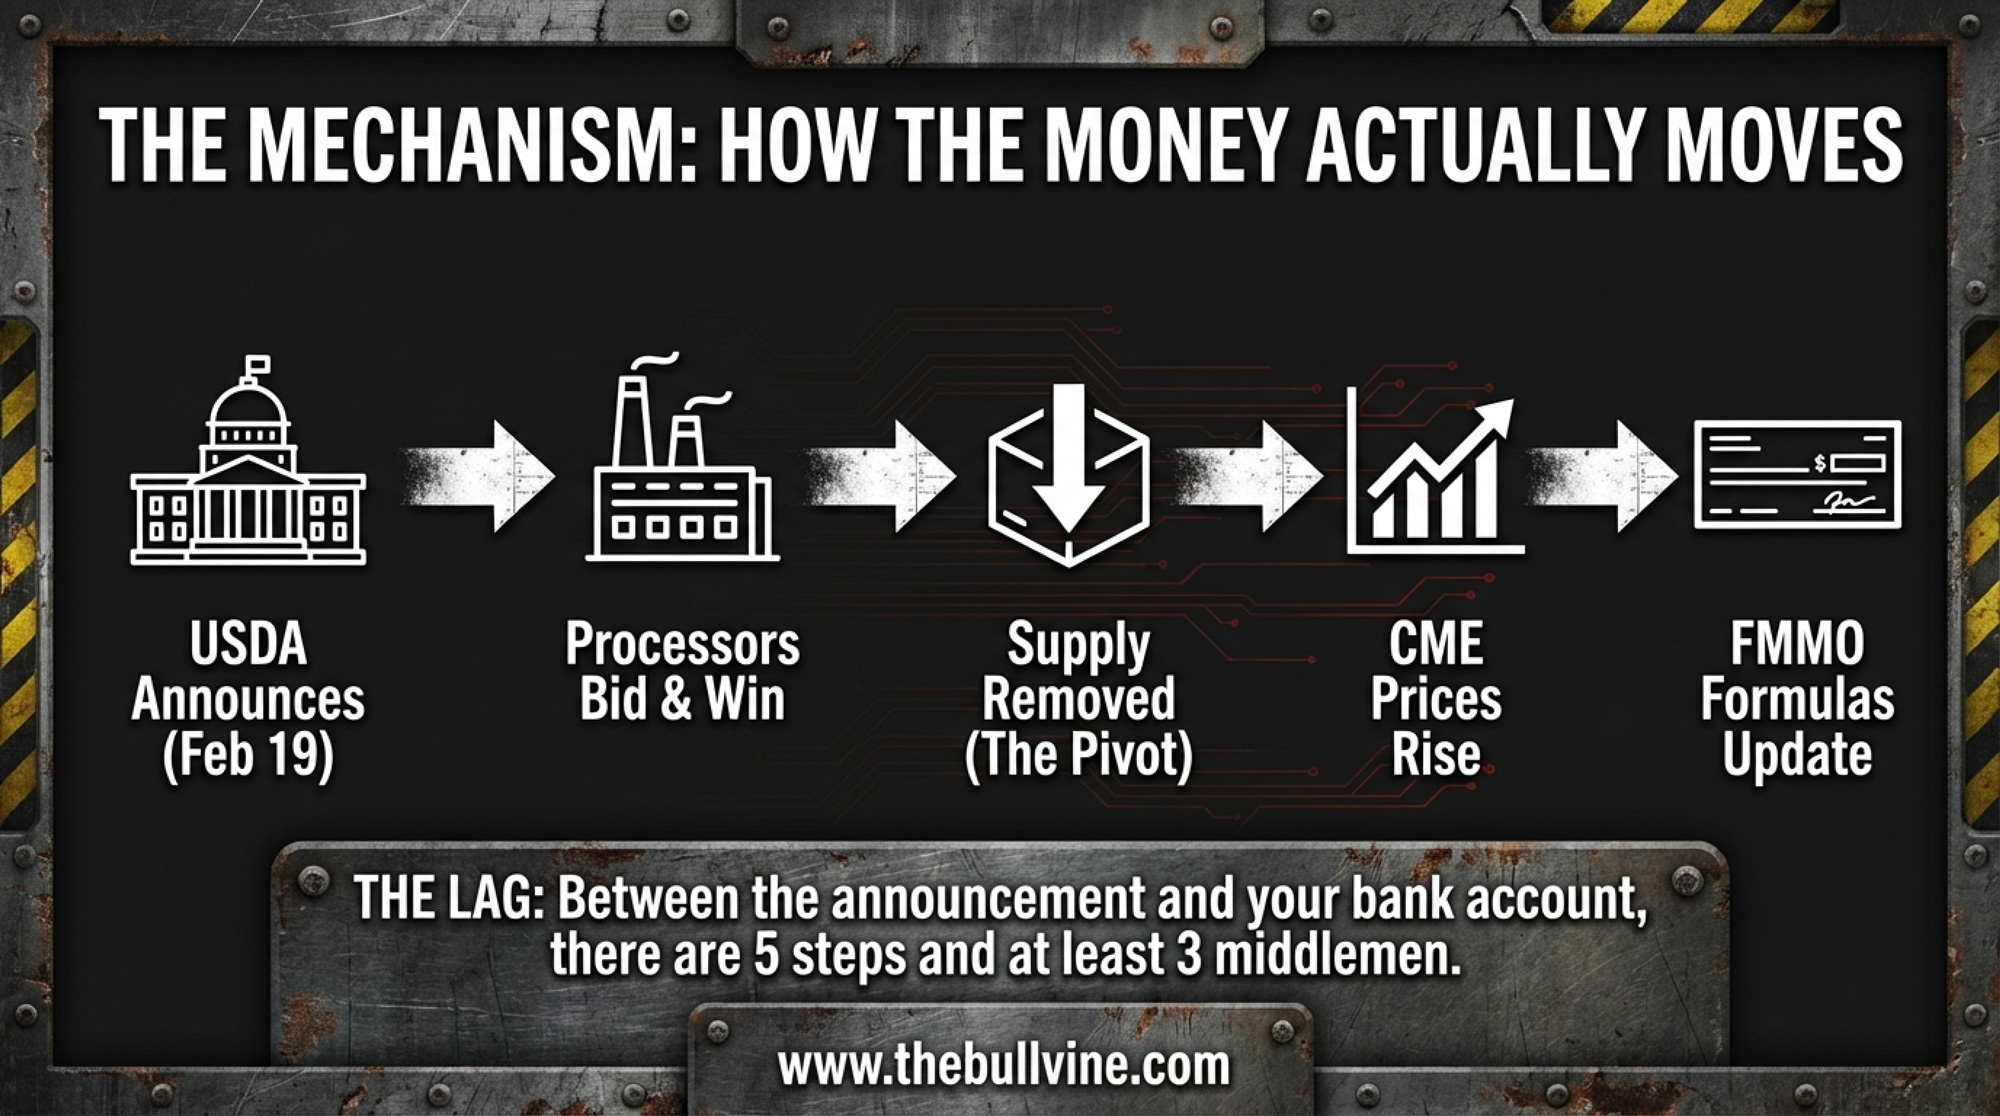
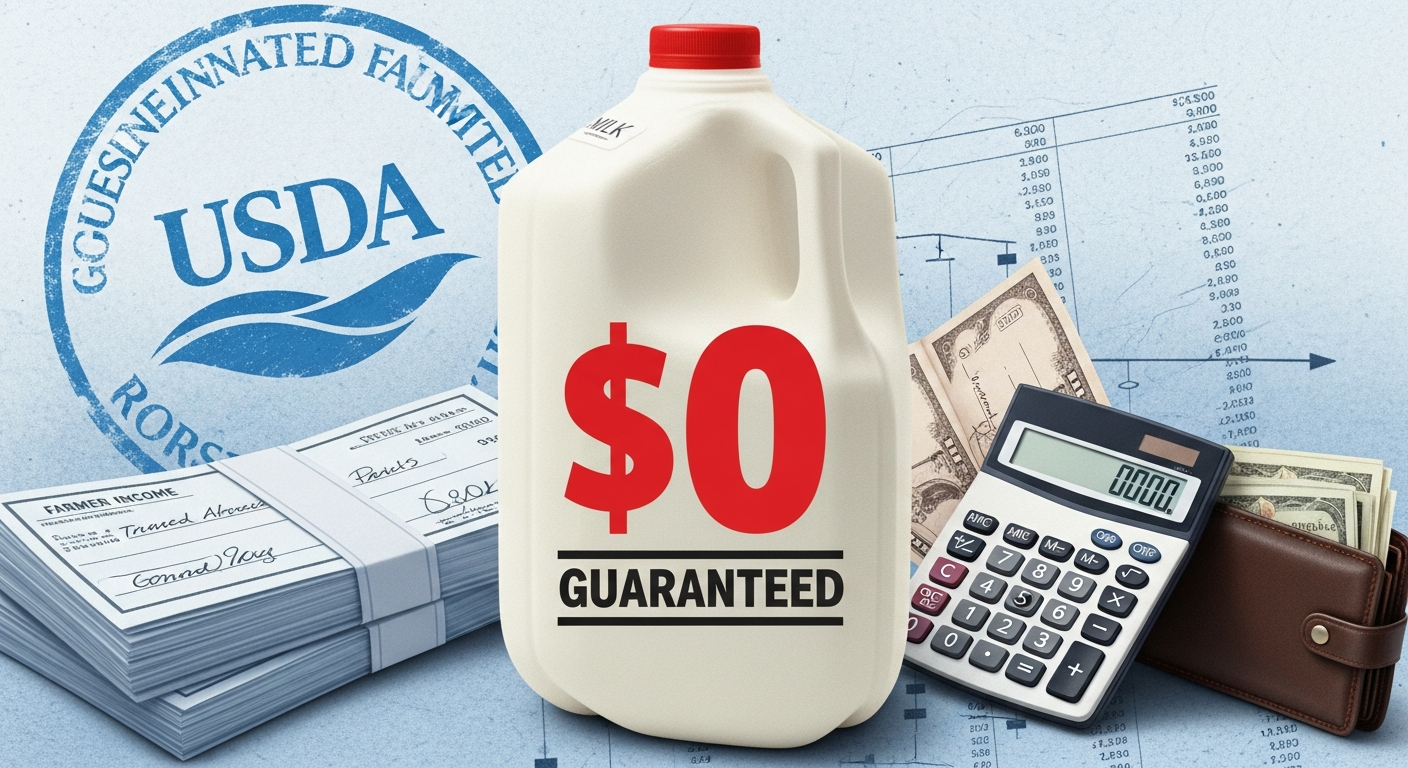
But here’s what nobody’s explaining: Section 32 doesn’t write checks to dairy farmers. It buys finished products from processors. Between that $148 million announcement and your milk check, there are five steps, at least three middlemen, and zero guaranteed dollars. Let’s walk through what this purchase actually buys, who actually gets paid, and what it could — could — mean for the price of your milk.

What USDA Is Actually Buying

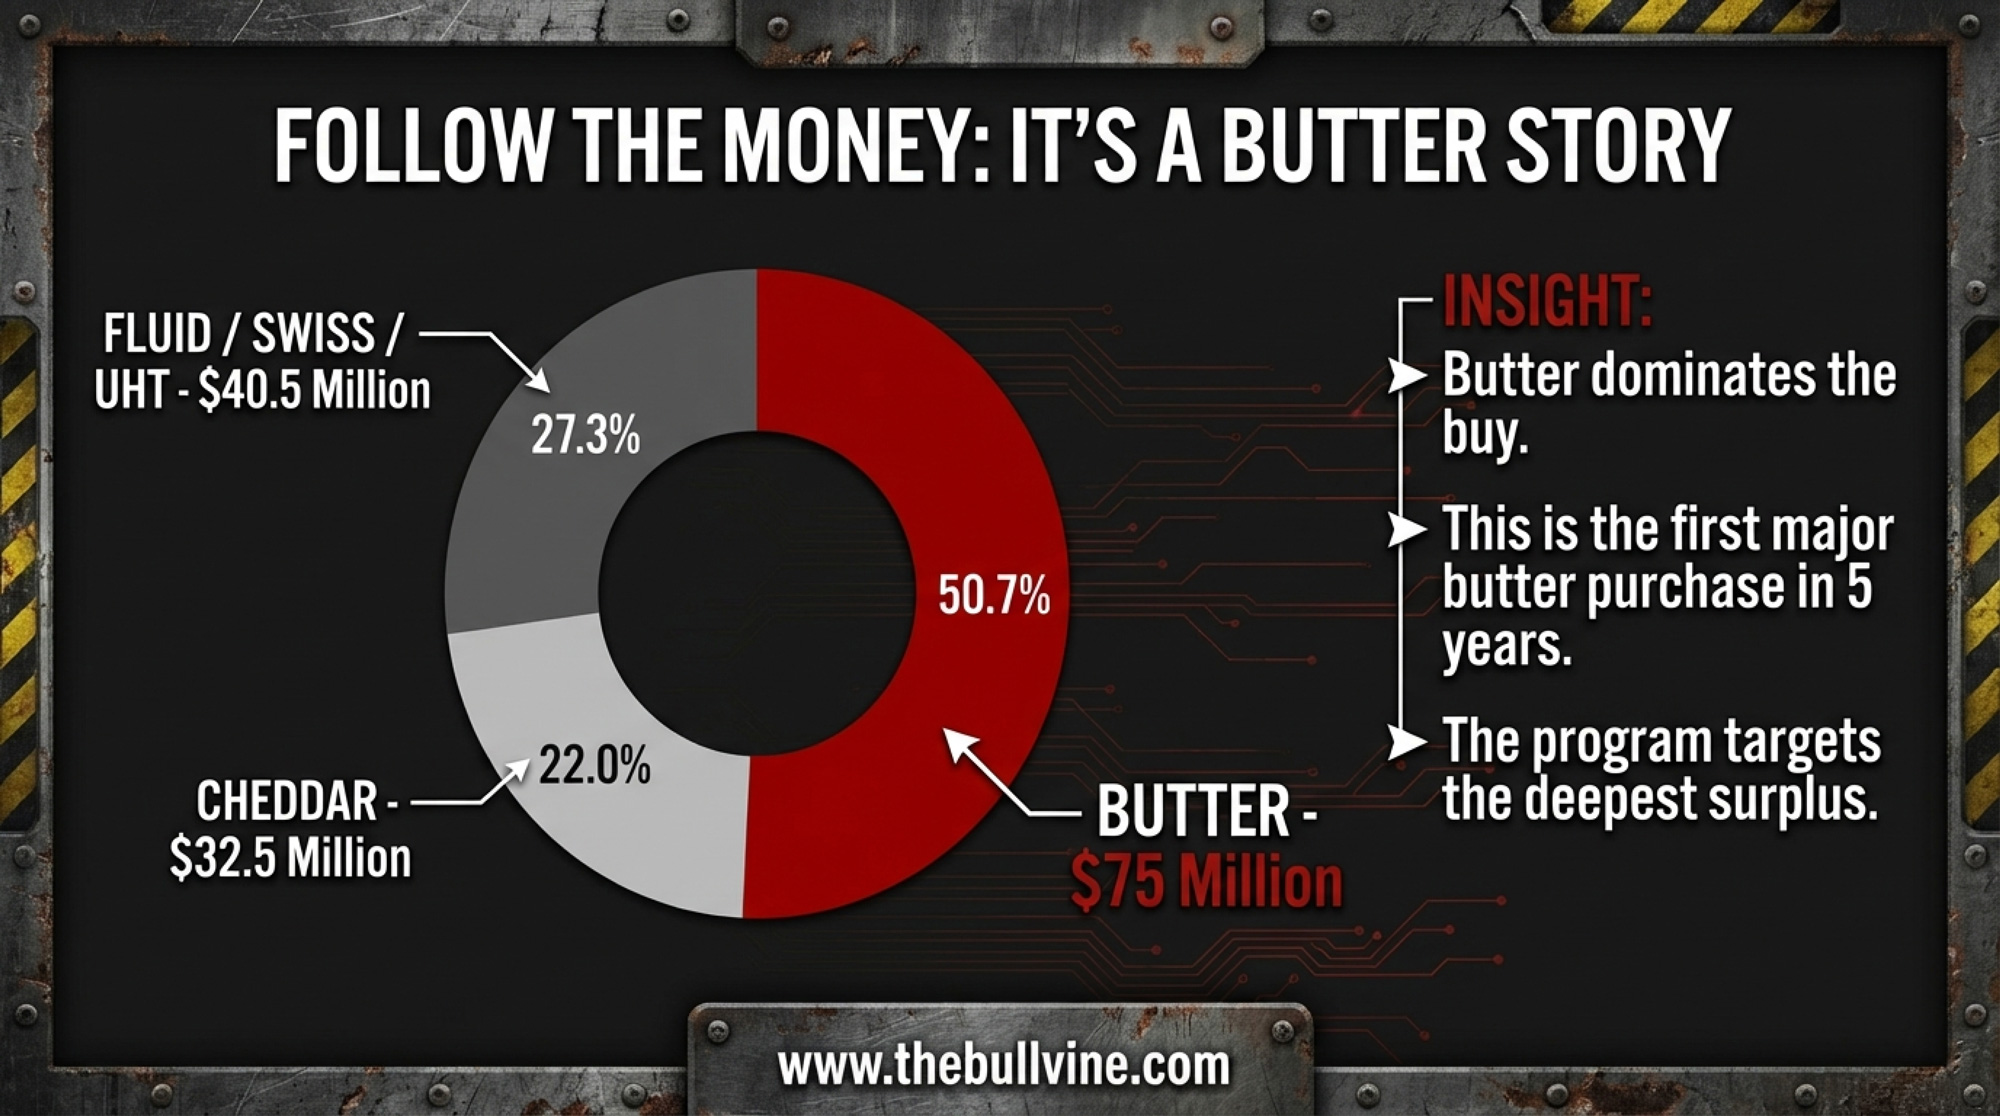
The $148 million breaks down into five commodity categories, and the allocation tells you exactly where USDA sees the deepest surplus problem: 

  • Butter: $75 million (50.7% of dairy total)
  • Cheddar cheese: $32.5 million (22.0%)
  • Fresh fluid milk: $20.5 million (13.9%)
  • Swiss cheese: $10 million (6.8%)
  • UHT (shelf-stable) milk: $10 million (6.8%)

Butter dominates. That’s not random — it’s where the price crash has been worst. NMPF specifically noted that these are “the first major butter purchases in five years.” The remaining $115 million in the broader announcement covers non-dairy commodities: dried beans ($25 million), split peas ($24 million), fresh pears ($15 million), walnuts ($15 million), lentils ($14 million), chickpeas ($12 million), and pecans ($10 million). 

Dairy got the single largest allocation of any category. That matters.

How $148 Million Became the Number

This wasn’t a surprise. NMPF sent USDA a letter last November requesting exactly $148 million in dairy purchases. What followed, in NMPF’s own words, were “extensive conversations and further official communication with USDA”. When the announcement dropped on February 19, it matched the request to the dollar. 

Gregg Doud — NMPF’s president and CEO since September 2023, a former Chief Agricultural Negotiator under President Trump’s first term, and a Kansas farm kid who still runs cattle — framed it as demand support: “Dairy farmers have shared in the struggles faced throughout the agricultural economy.” 

That’s the advocacy pipeline working. NMPF identified the surplus problem, built the case with USDA, and delivered a specific ask. Whether you’re an NMPF member co-op shipper or not, this is what organized lobbying looks like when it produces results. The question is whether those results reach your bulk tank. 

If you ship to an NMPF member co‑op, this is your dues at work; if you don’t, you’re still riding the same CME prices, just without the direct contract upside.

What Is a Section 32 Purchase and How Does It Work?

Section 32 of the Agricultural Adjustment Act of 1935 authorizes the USDA to buy surplus U.S.-produced agricultural products for two purposes: stabilize farm markets and supply food to federal nutrition assistance programs. 

Here’s the mechanism, step by step:

  1. USDA’s Agricultural Marketing Service issues Purchase Program Announcements.
  2. Approved vendors — processors, not farmers — submit bids.
  3. USDA awards contracts to winning bidders.
  4. Processors deliver products to food banks and nutrition programs.
  5. The purchased volume exits the commercial market, reducing available supply.

That fifth step is where farm‑level impact starts, in theory. Removing surplus from the market tightens supply, which supports commodity prices on the CME, which flows through FMMO formulas into component pricing, which eventually — weeks to months later — appears on your milk check.

Five steps. None of them is “USDA writes a check to a dairy farmer.” This is a market-support mechanism, not a direct payment. That distinction matters.

The Per-Cow Reality Check: Why $15.46 Is a Meaningless Number

You’ll see this math on social media: $148 million ÷ 9.57 million U.S. dairy cows = $15.46 per cow. Sounds underwhelming, right?

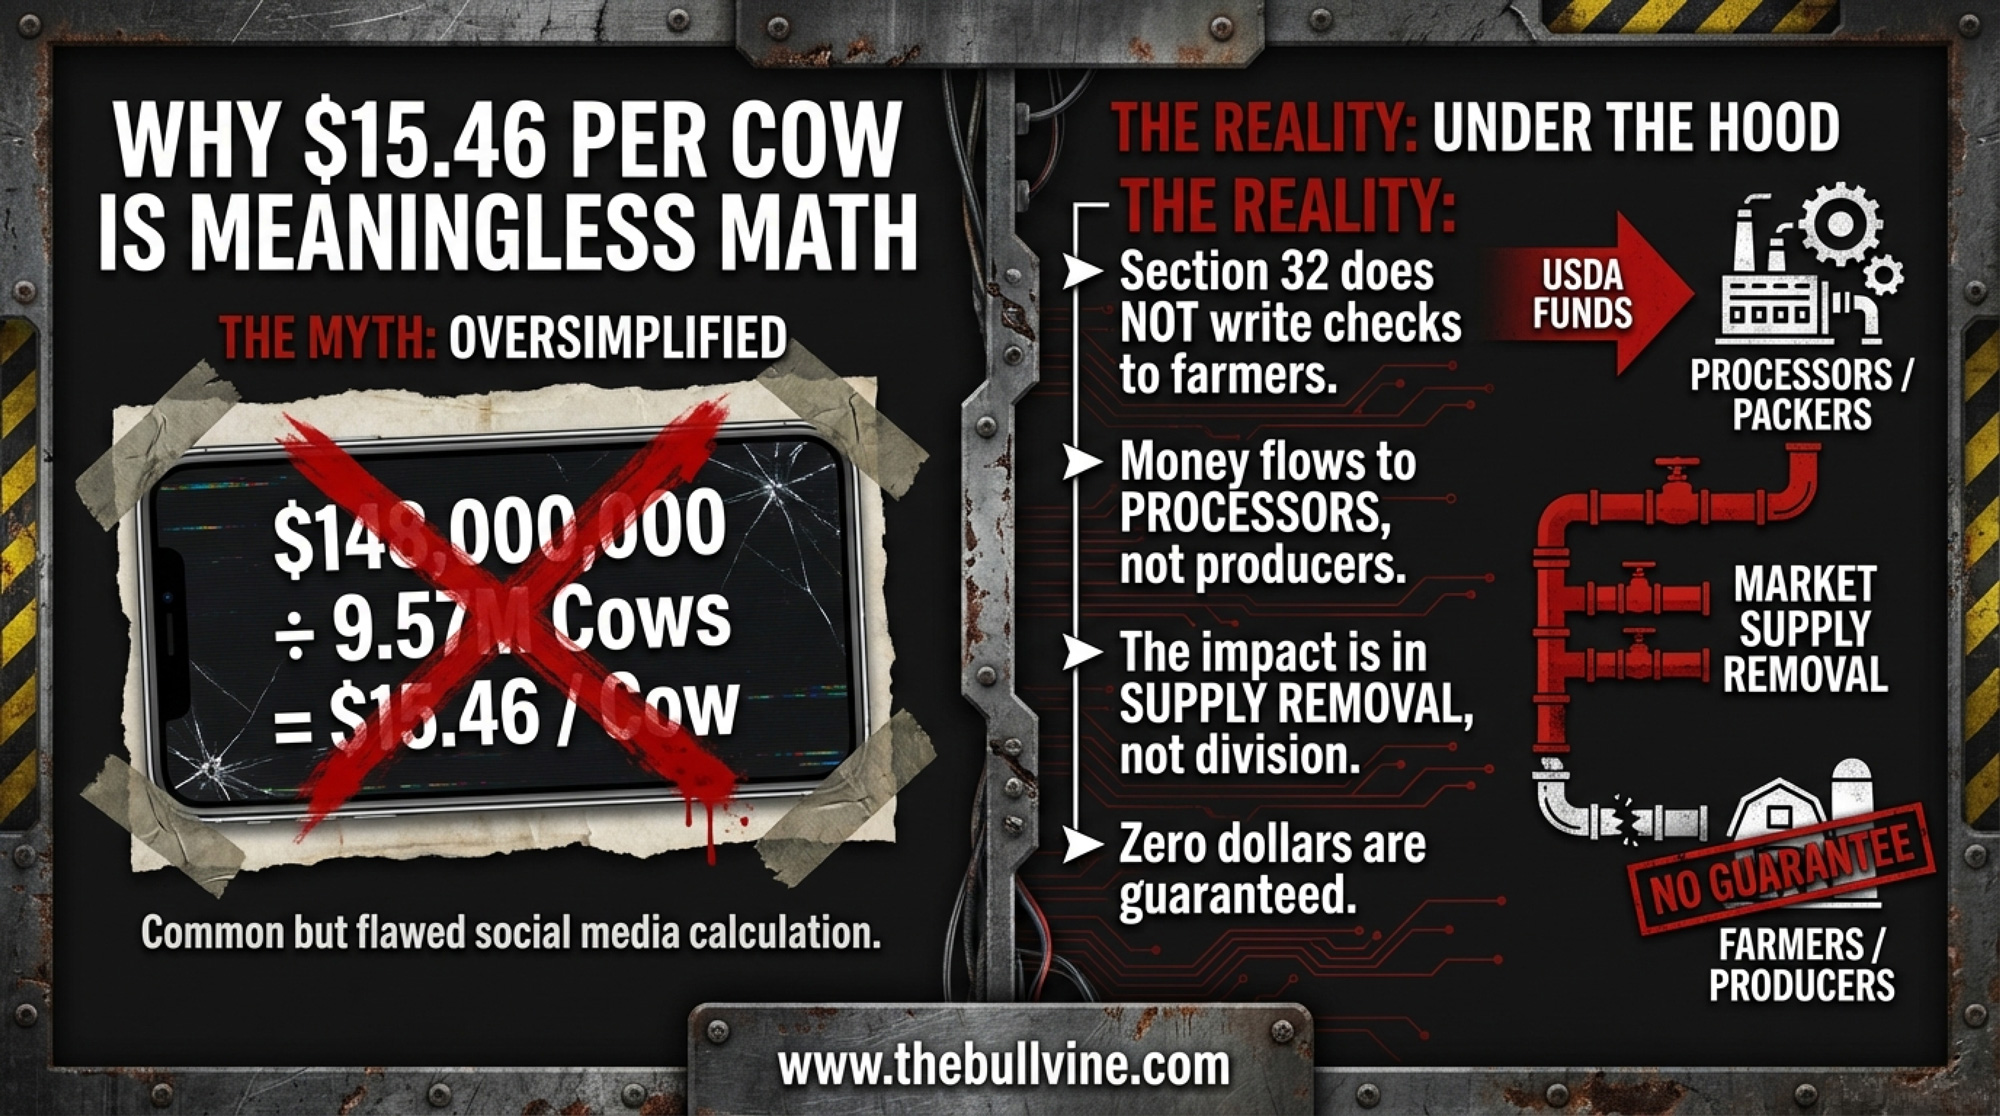
It’s also completely irrelevant. Section 32 doesn’t distribute money per cow. It removes the product from the market. The $15.46 figure tells you nothing about the actual price-support effect, which depends on how much volume gets pulled, from which markets, at what prices, and how CME traders respond.

The per-cow math is a useful headline killer, though. And that’s the point: $148 million sounds massive until you spread it across the national herd. The real impact isn’t in the division. It’s in the market math.

Butter vs. Cheese: One Big Lever, One Tiny One

This is where the numbers get interesting. The $75 million butter purchase is the headline within the headline. Here’s why.

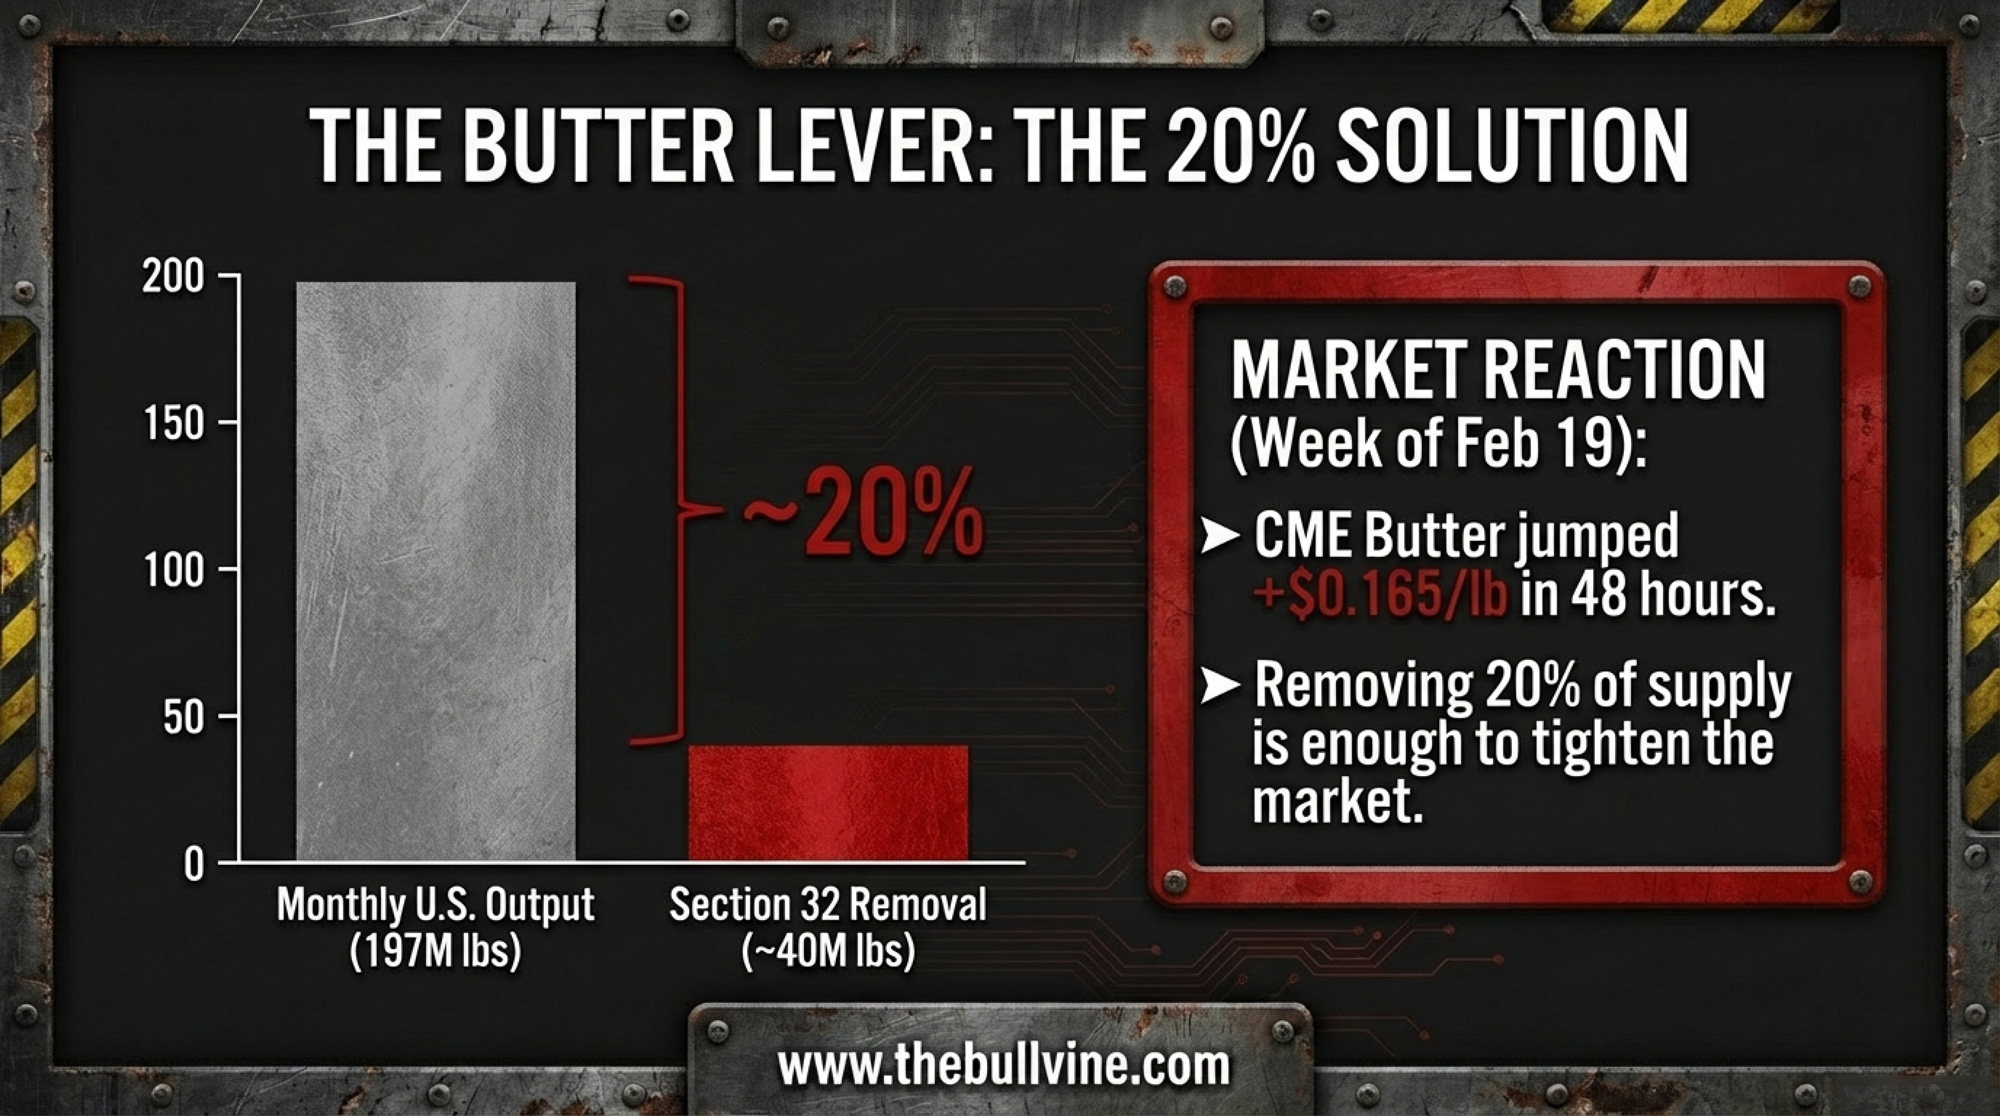
Butter math: At CME cash butter prices of $1.8700/lb on Friday, February 20, 2026, $75 million buys roughly 40 million pounds of butter. December 2025 U.S. butter production was 204 million pounds, according to USDA NASS’s Dairy Products report released on February 5, 2026. Full-year 2025 butter output hit 2.36 billion pounds — an average of about 197 million pounds per month. That $75 million purchase removes roughly 20% of one month’s productionfrom the commercial market. 

MetricButterCheddar Cheese
Purchase Amount$75 million$32.5 million
Pounds Purchased~40 million lbs~21.7 million lbs
Typical Monthly Production~197 million lbs~1.28 billion lbs
% of Monthly Output Removed20.3%1.7%
Likely CME Price Impact$0.10–0.15/lb$0.01–0.02/lb

Twenty percent is significant. It’s not catastrophic-surplus territory, but it’s enough to tighten the market meaningfully — especially with butter already climbing. CME cash butter opened the announcement week at $1.7050 on Tuesday and closed Friday at $1.8700, a $0.165/lb gain in four trading sessions. That’s not all Section 32 — other factors are in play — but the timing is hard to ignore. 

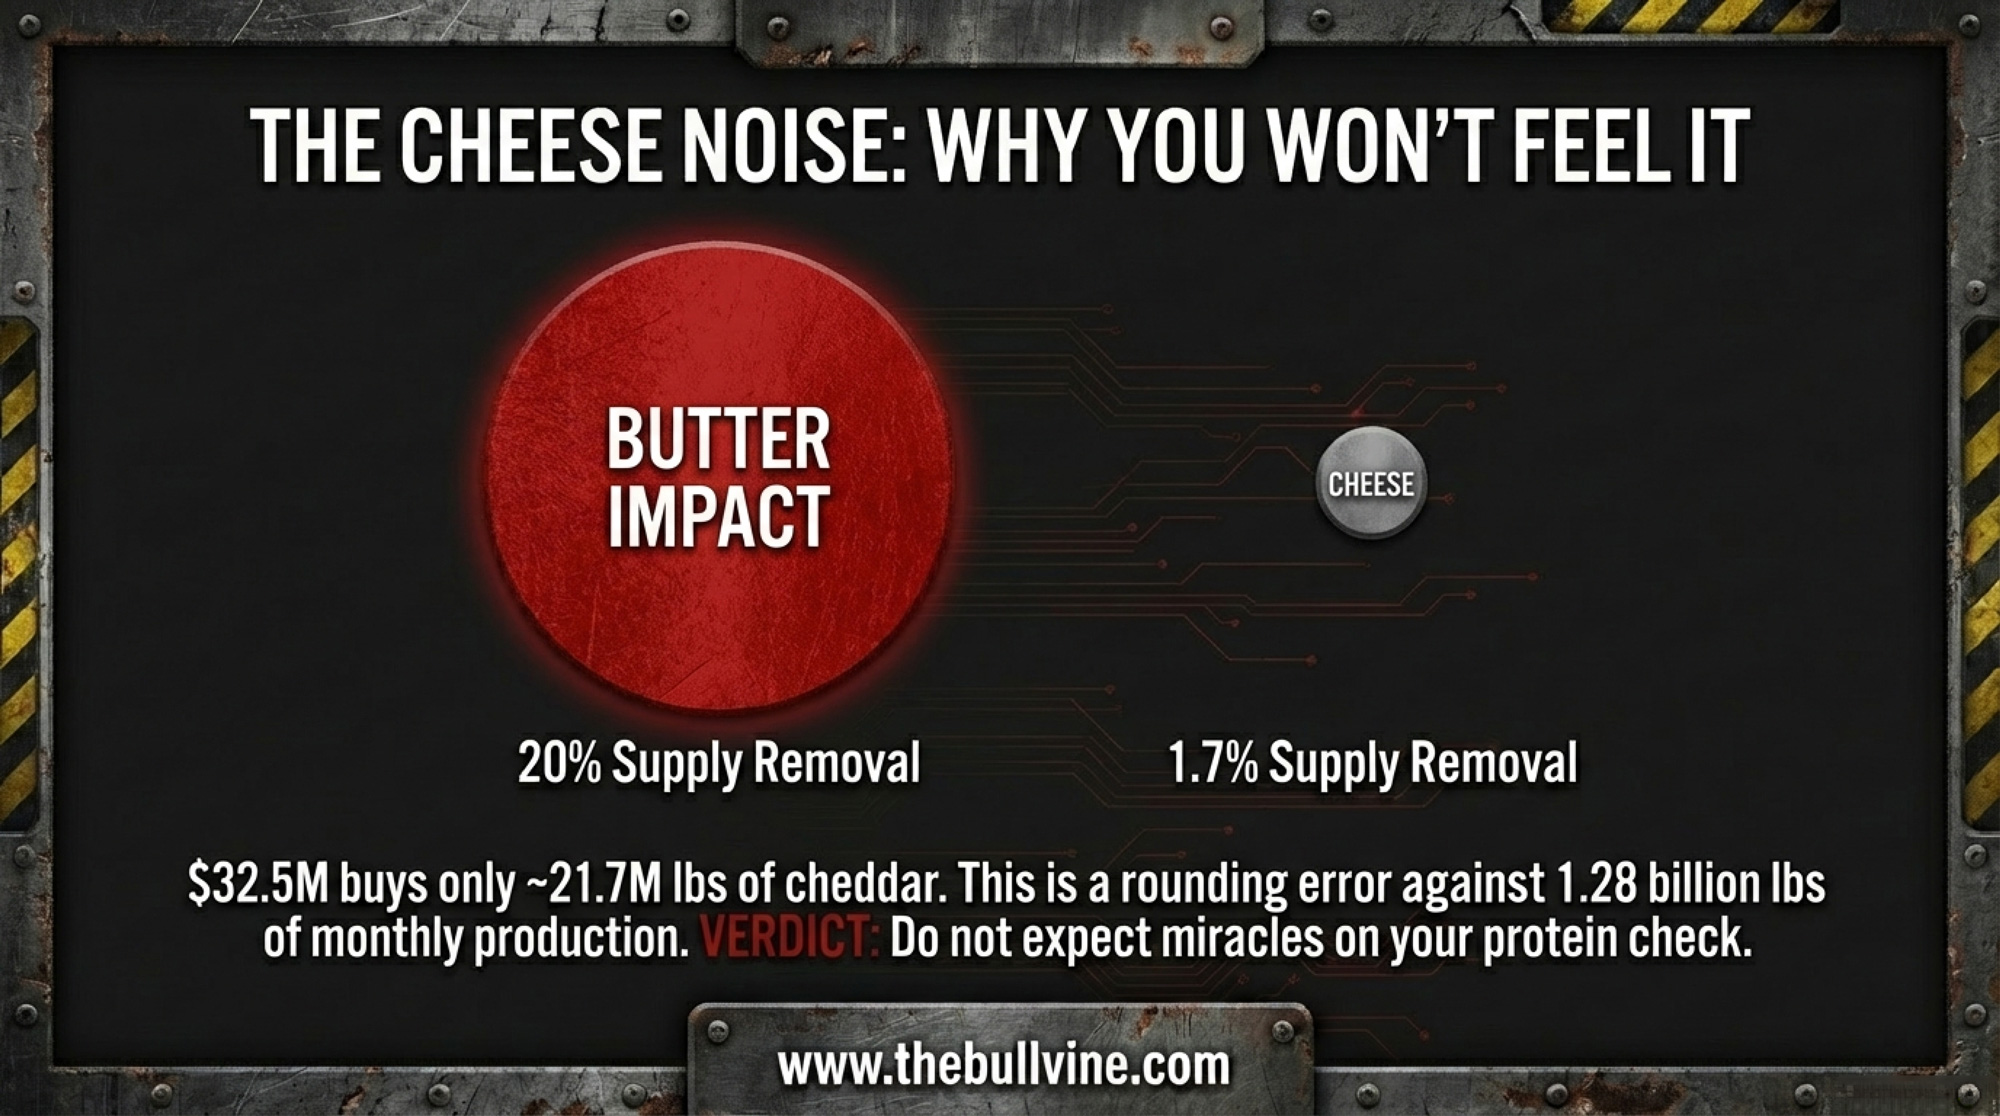
Cheese math: The $32.5 million cheddar purchase at roughly $1.50/lb buys about 21.7 million pounds. December 2025 total cheese production was 1.28 billion pounds. That’s barely 1.7% of one month’s output. Meaningful for cheddar specifically, but a rounding error for the broader cheese market. 

The takeaway: If you’re a high-butterfat herd, this purchase tilts in your favor. If your income depends more on protein and cheese prices, the direct effect is minimal. Butter is the big lever here. Cheese is noise.

How Much Will This Actually Affect Milk Prices?

Now for the barn math that connects the announcement to your component statement.

Start with butter. If the Section 32 purchase contributes even $0.10/lb to sustained butter price support — and the $0.165/lb rally this week suggests that’s conservative — here’s what it means at the farm level:

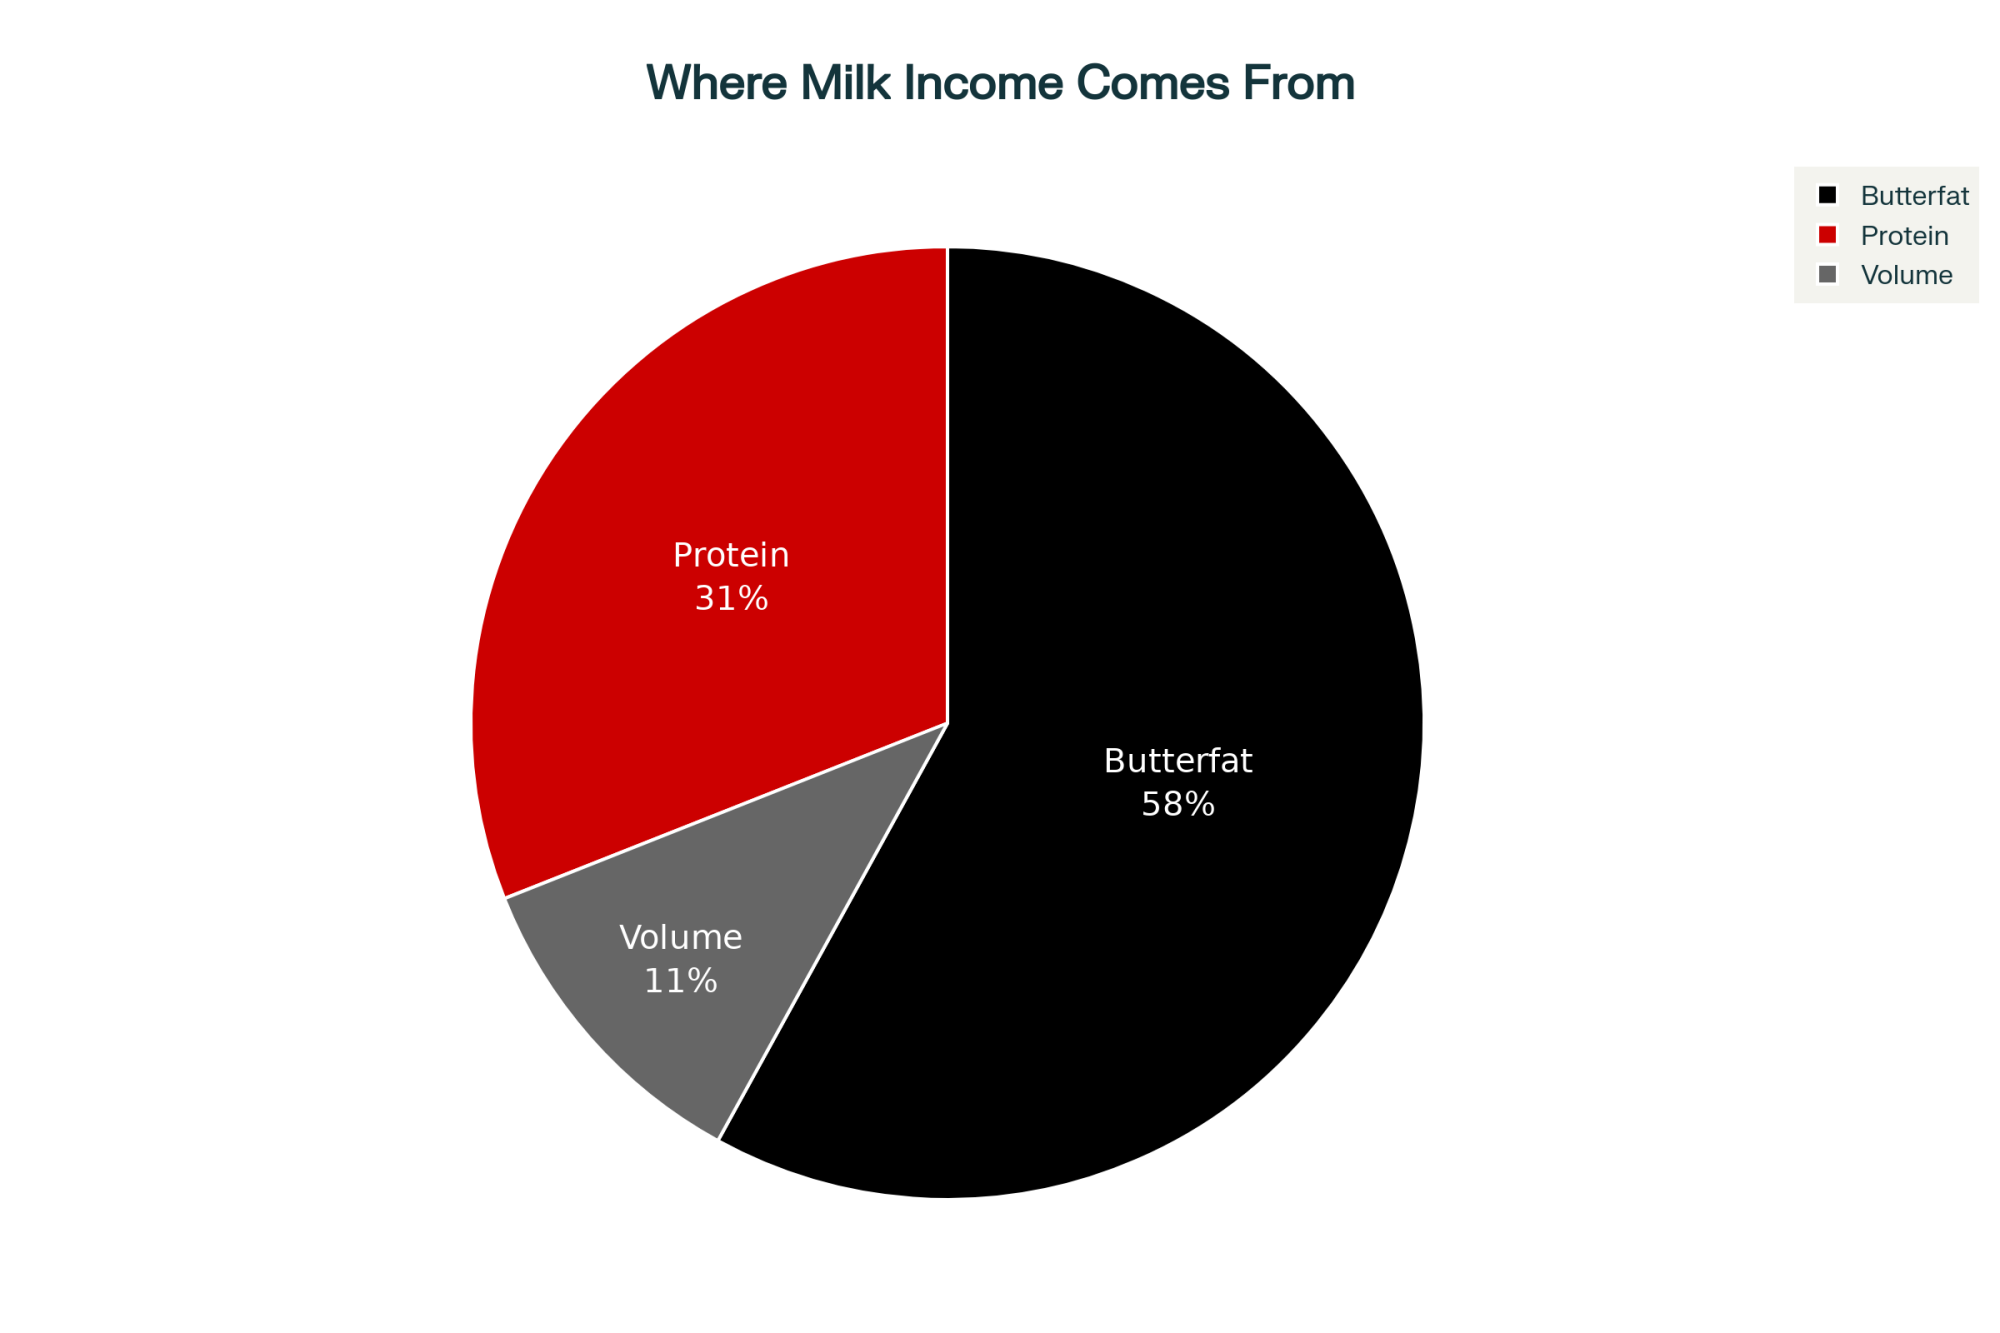
The Class IV butterfat price is derived directly from CME butter. A $0.10/lb butter increase translates to roughly $0.10/lb on your butterfat component price. For a 200-cow herd shipping 23,000 lbs/cow/year at 4.1% butterfat:

  • Monthly milk shipped: ~383,333 lbs
  • Monthly butterfat lbs: ~15,717 lbs
  • Value of $0.10/lb BF increase: ~$1,572/month, or $18,860 annualized

For a 400-cow herd at the same test? Double it: roughly $3,144/month.

That’s real money — if the butter rally holds and if your co-op’s component premiums reflect it. Two big ifs.

Now cheese. A $32.5 million purchase removing 1.7% of monthly production might support block prices by $0.01–0.02/lb at best. On your protein check, that’s almost invisible.

Bottom line: This purchase is a butterfat story. Your Class IV components — butterfat specifically — are where the action is. If your herd tests 3.6% fat, the impact is noticeably smaller than at 4.2%. Run it with your own numbers.

Why Now — and How Does This Compare?

Butter prices crashed from roughly $2.50/lb in mid-2025 to around $1.50/lb by January 2026 — a 40% decline in six months. CME cheese blocks were sitting at $1.45/lb before the announcement week. Global milk production — what analysts have called the “wall of milk” — has been pressuring commodity prices across the board. 

NMPF called this the first major butter purchase in five years. That’s significant context. For comparison: 

  • 2020 COVID-era: USDA purchased roughly $1.33 billion in dairy products across multiple programs, including about $100 million/month in Section 32 alone. That removed an estimated 238 million pounds of cheese and 64 million pounds of butter over the year. 
  • 2020 Section 32 specifically: A $120 million cheese-and-butter purchase removed about 23 million pounds of cheese and 3.6 million pounds of butter per month. 
  • January 2026: USDA bought $80 million in specialty crops under Section 32 — no dairy in that round. 

At $148 million, this is the largest single-round Section 32 dairy purchase outside of COVID emergency spending. It’s substantial. It’s also one-time, not recurring. The 2020 program ran for months. This is a single injection.

The Market Already Moved

Here’s what happened on the CME the week of the announcement: 

CommodityTue 2/17Wed 2/18Thu 2/19 (Announcement)Fri 2/20Weekly Change
Butter ($/lb)$1.7050$1.7050$1.7800$1.8700+$0.1650
Blocks ($/lb)$1.4500$1.5000$1.5100$1.4975+$0.0475
Barrels ($/lb)$1.4500$1.4700$1.4700$1.4900+$0.0400
NFDM ($/lb)$1.5900$1.5975$1.6225$1.6850+$0.0950

Butter jumped $0.075/lb on announcement day alone and added another $0.09 on Friday. That’s a two-day move of $0.165/lb — the kind of swing that moves component checks. Blocks and barrels gained modestly. NFDM surged nearly a dime on the week.

The market is pricing in the volume removal. Whether it holds through March and April — when the actual Purchase Program Announcements are issued, and contracts are awarded — is the open question.

What $148 Million in Section 32 Purchases Means for Your Component Check

  • Check your butterfat test. This purchase overwhelmingly favors high-BF herds. At 4.0%+ test, the butter rally has meaningful upside for your Class IV components. At 3.5%, the effect is roughly half as large.
  • Watch CME butter through March. If butter sustains above $1.85/lb through mid-March, the Section 32 volume removal is working as intended. If it fades back below $1.70, the purchase wasn’t enough to absorb the surplus.
  • Don’t expect cheese miracles. The $32.5 million cheddar purchase is too small relative to monthly production (1.28 billion pounds in December alone ) to meaningfully move block or barrel prices. Your protein check won’t feel this. 
  • Know the timeline. USDA hasn’t issued the Purchase Program Announcements yet. Approved vendors still need to bid. Contracts need awarding. Product needs to ship. The actual volume won’t leave the commercial market for weeks, possibly months. 
  • Ask your co-op. Does your cooperative supply USDA commodity programs? If so, this purchase directly increases demand for your co-op’s output. If not, you’re relying entirely on the indirect price-support effect.
  • Review your risk coverage. DRP (Dairy Revenue Protection) is available for purchase on any business day when prices are published on RMA’s website — there’s no fixed quarterly enrollment window. If butter holds its rally, Class IV DRP coverage premiums will rise as expected revenue increases. Locking in current premium levels sooner rather than later may make sense for Q2 and Q3 2026 quarters. Separately, DMC enrollment for 2026 closed February 26  — if you missed it, DRP is your remaining federal safety-net option. 

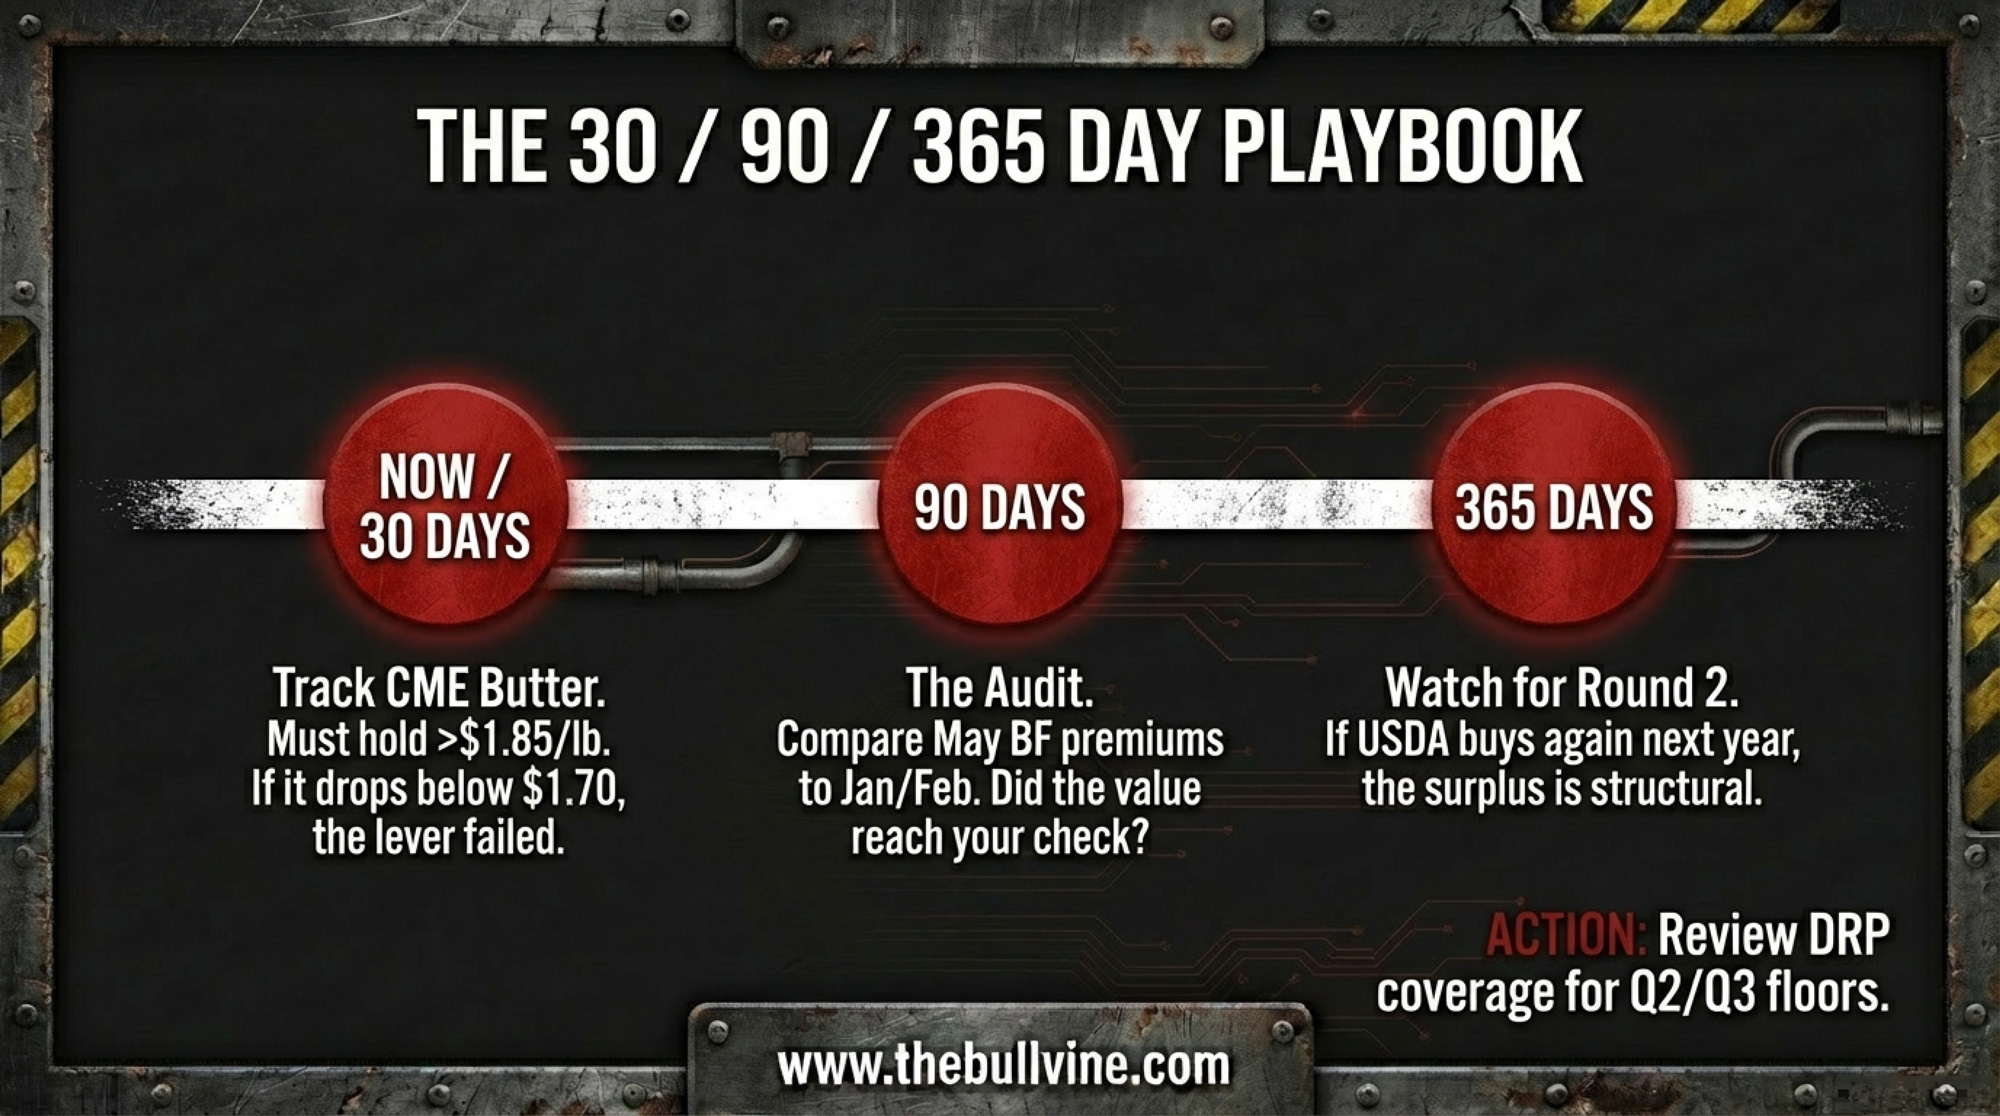
Your 30/90/365-Day Playbook

TimelineWhat to TrackKey ThresholdAction If Threshold Met/Missed
This WeekUSDA AMS Purchase Program AnnouncementAnnouncement postedRead for delivery windows, product specs, quantity breakdowns
30 DaysCME butter & cheese block pricesButter holds above $1.85/lbPrice support working; below = surplus bigger than $75M can fix
90 DaysYour co-op component statement (April/May)BF premium reflects butter rallyIf butter held but BF premium flat = question for co-op field rep
365 DaysTotal 2026 Section 32 dairy purchases vs. 2024/2025Second round announcedSignals structural surplus, not seasonal—NMPF pipeline now recurring

This week: Read the USDA AMS Purchase Program Announcement when it posts. It will specify exact product forms, quantities, and delivery windows. That’s when you’ll know whether this is a 60-day buy or a 6-month program. 

30 days: Track CME butter and cheese block prices. The $1.85/lb butter threshold is your marker. Above it, the purchase is supporting prices. Below it, the surplus is bigger than $75 million can fix.

90 days: Pull your co-op component statement for April or May. Compare your butterfat premium to January and February. If butter held above $1.85 through March and your BF premium didn’t move, that’s a question for your co-op field rep.

365 days: Compare the total 2026 Section 32 dairy purchases to 2025 and 2024. If USDA comes back for a second round, it signals the surplus problem is structural, not seasonal — and that NMPF’s advocacy pipeline is becoming a recurring feature of dairy price support.

Key Takeaways

  • USDA’s $148 million dairy allocation under Section 32 is exactly what NMPF asked for last November and marks the largest non‑COVID dairy purchase in five years.
  • None of that money arrives as a farm check — it pays processors, and the only way you see it is if it pushes CME prices high enough to lift FMMO component values on your milk check.
  • Butter is where it bites: $75 million pulls roughly 40 million pounds — about 20% of a typical month of U.S. butter output —, and CME butter already moved $0.165/lb higher during the announcement week.
  • The cheddar piece is small by comparison: $32.5 million removes only about 1.7% of a month’s cheese production, so don’t expect a big protein or Class III bump from this round alone. ​
  • If your herd ships 4%‑plus butterfat, a sustained $0.10/lb increase in butterfat value can add more than $1,500/month per 200 cows, which makes watching butter hold above roughly $1.85/lb and checking how your co‑op adjusts component premiums a key decision point.

The Bottom Line

$148 million isn’t a rescue. It’s a market lever—and specifically, a butter lever. NMPF asked for it, USDA delivered it, and the CME responded with a $0.165/lb butter rally in 48 hours. Whether that holds depends on what happens when the actual contracts hit and the product starts moving. 

Pull your last component statement. Find the butterfat line. Now add $0.10/lb and multiply by your monthly butterfat pounds. That’s the upside scenario from this purchase — not $148 million divided by your herd size, but butter price × your components × time.

Complete references and supporting documentation are available upon request by contacting the editorial team at editor@thebullvine.com.

Learn More

The Sunday Read Dairy Professionals Don’t Skip.

Every week, thousands of producers, breeders, and industry insiders open Bullvine Weekly for genetics insights, market shifts, and profit strategies they won’t find anywhere else. One email. Five minutes. Smarter decisions all week.

NewsSubscribe
First
Last
Consent

What Lactalis’s 270-Farm Cut Really Means for Every Producer

Only 11% of dairies under 300 cows are profitable. But three paths still work—if you move in the next 18 months.

EXECUTIVE SUMMARY: Lactalis cutting 270 dairy farms while investing $11 billion in processing isn’t a contradiction—it’s the clearest signal yet that commodity milk is finished and component quality now rules everything. The stark reality: 89% of dairies over 1,000 cows are profitable while only 11% under 300 cows make money, and this isn’t about management skill—it’s structural economics you can’t overcome with hard work alone. Three converging crises (interest rates doubling to 8%, heifer inventory at 20-year lows, and labor costs up 73%) have compressed what was once a gradual 5-year industry shift into an urgent 18-month decision window. Every dairy faces three paths: invest $6.75-10.25 million to scale beyond 1,000 cows, transition to premium markets (organic/specialty) despite 3-year losses, or exit strategically while you can still preserve family wealth. Real farmers are already choosing—a Minnesota couple successfully scaled to 1,100 cows, Vermont neighbors transitioned to organic, and a Wisconsin family preserved $2.1 million through strategic sale. The difference between 3.6% and 4.2% butterfat is now worth $529,000 annually for a 500-cow operation, making component performance literally the difference between survival and closure. Your window to control this decision closes in 18 months—after that, circumstances decide for you.

You know, when Lactalis—the world’s largest dairy processor—announces they’re cutting 450 million liters and ending contracts with 270 French farmers, we should probably pay attention. I’ve been digging into this, talking with producers, looking at the numbers… and what’s interesting is this isn’t just another market cycle. We’re seeing something bigger here, something that’s going to affect all of us, whether we’re milking 50 cows or 5,000.

What I’ve found is that the traditional commodity dairy model—you know, the one most of us grew up with—it’s changing faster than anyone expected. And the timeline to adapt? Well, that’s gotten surprisingly short.

The 89/11 Rule reveals the stark reality: structural economics, not management quality, determines survival in modern dairy

Understanding Why Processors Are Making These Moves

So here’s what caught my attention in Lactalis’s 2024 financials: €30.3 billion in revenue, but only 1.2% net profit margins. That’s down from 1.45% the year before. Now compare that to their premium products—the yogurt division they bought from General Mills is generating 15-20% operating margins. Premium cheese? Consistently 8-12% margins.

Lactalis’s supply director explained in their October statement that the valuation of excess milk is often very low and subject to market volatility—language that really reflects how processors are viewing commodity markets these days. When a processor that size essentially says commodity milk isn’t worth the trouble… well, that’s not just complaining, is it?

FrieslandCampina’s been going through similar challenges. They’ve talked about timing mismatches—buying milk at one price, processing it, then having to sell into a lower market. That kind of volatility makes it really tough to plan, and shareholders don’t like uncertainty.

The Component Game Has Changed Everything

Component performance is now non-negotiable—volume alone won’t pay the bills anymore

I was talking with a Wisconsin producer last week—he’s running 650 cows near Fond du Lac—and he helped me understand just how much components have shifted the whole economics of dairy farming. USDA data from November shows butterfat now represents 58% of your milk check value, and protein adds another 31%. Think about that… 89% of your income comes from components, not volume.

His neighbors who consistently hit 4.23% butterfat compared to the regional average of 3.69%? They’re capturing about $4.60 more per hundredweight. For a 500-cow operation producing 23,000 pounds per cow annually, that works out to roughly $529,000 in additional revenue—though your actual numbers will vary with production levels and regional premiums, of course.

Cornell’s latest farm business data shows some interesting patterns:

  • The big operations—1,000+ cows—they’re hitting 4.0-4.3% butterfat with 3.3-3.5% protein pretty consistently
  • Mid-sized farms, say 300-500 cows, generally average 3.6-3.8% butterfat, 3.0-3.1% protein
  • And here’s what’s telling: large farms maintain about 2% daily variation in components while smaller operations see 5-10% swings

Now, getting those high components isn’t just about genetics. You need systematic management—a good nutritionist runs $80,000 to $120,000 a year, based on what I’m hearing. Feed testing programs add another $15,000 to $25,000. Those precision feeding systems? Dealers are quoting $250,000 to $500,000, depending on what you need.

The math gets tough for smaller operations. When you spread the combined cost of nutritionist, vet services, and consultants across a thousand-cow operation, it might come to $0.08-0.12 per hundredweight. But for a 200-cow farm? You’re looking at $0.40-$0.60 per hundredweight for the same level of professional support. That’s a huge competitive disadvantage.

Three Things Hitting Us All at Once

Cornell’s dairy economics team has been documenting what they’re calling a compressed decision timeline, and I think they’re onto something. Three things have converged, forcing us to make decisions faster than we’re used to.

Three converging crises compressed a gradual 5-year industry shift into an urgent 18-month decision window

Interest Rates Hit Like a Hammer

Federal Reserve data shows operating loan rates doubled—went from about 4% in 2021 to over 8% by late 2023. Haven’t seen rates like that in 20 years. A lender in Pennsylvania told me that operations that were barely profitable at 4% are now losing $3,000 to $5,000 monthly.

The Illinois farm management folks found that farms carrying significant debt saw interest costs per tillable acre jump from $33 to $60 in three years. That’s 82% more in fixed costs, and you can’t pass that along to your milk buyer.

What really concerns me is the Q3 2024 ag lending data—operating loan volumes are up over 30% for the third quarter in a row. A Wisconsin banker friend put it best: “This isn’t growth borrowing, it’s survival borrowing.”

The Heifer Shortage Nobody Saw Coming

CoBank’s August report lays out a fascinating situation—dairy heifer inventory’s at a 20-year low just when we need expansion for all this new processing capacity.

Here’s how we got here: the breeding data shows beef semen sales to dairy farms tripled from 2.5 million units in 2017 to 7.2 million by 2020. Last year? 7.9 million of the 9.7 million total units were beef semen.

Can’t blame anyone really. When beef calves were bringing $1,000 to $1,500 last October, while it costs $2,200 to $2,500 to raise a heifer worth maybe $1,600… the math was obvious. Problem is, we all did the same math at the same time.

CoBank thinks we’ll lose another 800,000 head before things turn around in 2027. An Idaho producer told me he’s been offered $3,200 for breeding-age heifers—if he had any. “Five years ago at $1,400, I had too many,” he said. “Now I can’t find them at any price.”

Labor Is Getting Impossible

Texas A&M’s 2024 research shows that immigrant workers make up 51% of dairy labor and milk 79% of our cows. Their models suggest losing that workforce would cut U.S. milk production by 48.4 billion pounds annually. That’s not a typo.

And it’s not just finding workers—it’s affording them. USDA data shows dairy wages went from $11.54 an hour in 2015 to $18-20 by 2024. A large operations manager in New Mexico told me they’re at $28 an hour when you factor in housing, benefits, and recruitment. “And we still can’t stay fully staffed,” he added.

Three Producers Who Found Their Way Through

Despite all these challenges, I’ve met several operations that have successfully navigating this transition. Let me share what they did differently.

Smart Scaling in Minnesota

There’s a couple in central Minnesota who expanded from 350 to 1,100 cows between 2019 and 2023. They saw their co-op’s base program would limit growth for mid-sized farms, so they moved early. Got financing at 3.5% before rates spiked, used sexed semen exclusively for three years to build internally, and partnered with an experienced Venezuelan family.

What’s smart is they expanded in phases over four years—each phase had to cash flow before they moved to the next. They’re now shipping butterfat at 4.1% consistently and have signed a five-year contract with a cheese plant 40 miles away. Their breakeven’s around $17.50 per hundredweight, so they’ve got a cushion even when markets get tough.

Going Organic in Vermont

A Vermont family with 480 cows went organic in 2021—right when everyone said that market was full. Key thing? They got Organic Valley’s commitment in writing before starting the transition. They lost $210,000 over three years, but off-farm income and some timber sales bridged the gap.

Today, they’re netting $3.80 per hundredweight after all costs. “We focused on keeping cows healthy and production steady rather than trying to expand during transition,” the son told me. They maintained 92% of conventional production throughout the transition—well above the 85% average.

Making the Tough Call in Wisconsin

This one’s harder to talk about. A couple near Eau Claire sold their 280-cow operation in March 2024 after recognizing they were in what economists call the 18-month window—sustained losses with limited options. At 58, with kids established off-farm, expanding to a competitive scale meant $6 million in new debt.

They sold into a strong cull market, leased the cropland to a neighbor, and kept the house and 40 acres. The husband’s now using his 30 years of experience as a co-op field rep. “I sleep better, my wife’s happier, and financially we’re ahead,” he told me. They preserved about $2.1 million in equity that probably would’ve disappeared if they’d hung on another year.

Where All This New Processing Investment Is Going

Processors already chose their future—understand their strategy to predict yours

IDFA announced $11 billion in new processing capacity, and where that money’s going tells you everything about industry direction. Their October breakdown shows:

  • Cheese gets $3.2 billion—32% of everything
  • Milk and cream processing: $2.97 billion—30%
  • Yogurt and cultured products: $2.81 billion—28%
  • Butter and spreads: $1.23 billion—12%

Three new cheese plants in the Texas Panhandle need 20 million pounds of milk daily by mid-2025. But these aren’t commodity operations—they’re component extraction facilities making mozzarella for export while capturing valuable whey proteins.

What they’re NOT building? Commodity powder plants or basic fluid bottling. A processing engineer in Wisconsin explained it well: “We’re maximizing value from every component now. Just removing water to make powder doesn’t cut it anymore.”

And here’s something else—up in the Northeast, a couple of smaller specialty cheese operations just expanded. They’re not huge, but they’re finding success focusing on local markets and agritourism. Different model entirely from the big Texas plants, but it shows there’s more than one way forward. Out in California’s Central Valley, I’m seeing similar patterns with artisan operations carving out niches even as the big players consolidate.

The Cooperative Evolution We Need to Talk About

This is uncomfortable for many of us, but cooperatives have changed dramatically since DFA was formed in 1998 through regional mergers. They now control 30% of U.S. milk production, and after buying 44 Dean Foods plants in 2020, they’re both the biggest milk marketer AND processor.

A former board member explained how this creates tension: “When your co-op owns processing plants, optimizing those facilities becomes as important as your milk check—sometimes more important.”

Base-excess programs show this complexity. Cornell’s research indicates these programs typically use your best three consecutive months over three years as “base.” Milk over that? You might pay penalties of $5 to $13.30 per hundredweight.

A Vermont producer shared his frustration: “We wanted to add 50 cows to get more efficient, but overbase penalties would’ve killed any benefit. We’re locked at the current size.”

Meanwhile, operations that were already large when base programs started? They’re fine. It’s the 300-cow farms trying to grow to 500 that get squeezed.

Your Three Paths Forward—Let’s Look at Real Numbers

Path Comparison at a Glance

FactorScale UpGo PremiumStrategic Exit
Investment$6.75-10.25M$210-275K lossesPreserve equity
Timeline4-5 years3-year transition8-10 months optimal
Success Rate~20%Varies by market100% if timed right
Key RiskDebt burdenMarket saturationWaiting too long

Extension economists from Cornell and Wisconsin show that farms with sustained losses typically face critical decisions within 12-18 months. So what are your actual options?

Path 1: Scale Up to Compete

Investment Required: $6.75-10.25 million total

  • Buildings and infrastructure: $3.5-5.0 million
  • Cattle at current prices: $2.25-3.0 million
  • Feed base expansion: $500,000-1.5 million
  • Working capital: $500,000-750,000

Success Rate: According to lending industry estimates, about 20% achieve projected returns. Key Factor: Usually need family money for unexpected challenges. Financing Options: USDA FSA offers beginning farmer programs and guaranteed operating loans through participating lenders, though eligibility and terms vary by operation and region. Some states also have specific dairy expansion programs worth exploring.

Path 2: Find Your Premium Market

Organic Transition Example:

  • Typical losses: $210,000-275,000 over 3 years
  • Pay organic feed prices (30-50% higher) while getting conventional prices
  • Need written buyer commitment before starting
  • Must maintain 85%+ production through transition

Potential Returns: $2.45/cwt net (vs. -$5.29 for conventional, based on USDA 2023 data). Reality Check: Most regions aren’t currently seeking new organic production. Alternative Options: Consider grassfed certification, A2A2 markets, or local/regional branding

Path 3: Strategic Exit While You Can

Timing Matters—Example for 300-cow operation with $2M debt:

Exit at 8-10 months:

  • Assets bring ~$4.65 million
  • After $2M debt and costs ($230,000-390,000): $2.26-2.42 million preserved

Forced sale at 16-18 months:

  • Assets bring ~$3.4 million (discounted)
  • After everything: $650,000-970,000 retained

The difference: Over $1.4 million in family wealth

Three paths still work—but only if you move in the next 18 months. After that, circumstances decide for you

The Technology Wave is Coming Fast

I attended the Protein Industries Summit in Chicago last month, and what I heard was eye-opening. McKinsey’s early 2025 biotech analysis shows precision fermentation has already hit cost parity for certain dairy proteins. Boston Consulting thinks these proteins will be five times cheaper than ours by 2030.

Here’s what’s already happening—Perfect Day’s animal-free whey is in Ben & Jerry’s ice cream right now. Not someday. Today. Fonterra’s partnerships with Superbrewed Food and Nourish Ingredients show where big players are heading. Fonterra indicated in its August 2024 announcements that ingredients from these technologies can be used alongside traditional dairy products. Translation: they’re building systems that can use proteins from cows or fermentation tanks—whatever’s cheaper.

And it’s not just startups anymore. I’m seeing major food companies quietly building fermentation capacity. They’re hedging their bets, preparing for a world where they can source proteins from multiple streams.

How This Hits Different Regions

This transformation affects regions differently, and understanding your local dynamics matters.

California: UC Davis research shows farms with less than 22% quota coverage pay more into the system than they get back. “We’re subsidizing the big quota holders,” a Tulare County producer told me.

Southeast: Maintains higher Class I fluid use—over 60% according to Federal Orders—which provides some buffer since processors need consistent daily deliveries. But even there, consolidation pressure is building.

Upper Midwest: All about cheese, so components rule everything. Wisconsin processors consistently tell me 4% butterfat is their practical minimum for preferred suppliers.

Plains States: Seeing aggressive expansion with new processing, but these plants want a minimum of 50,000+ pounds daily per farm. Can’t deliver that volume? You won’t get a contract.

Pacific Northwest: Interesting developments with smaller operations finding niches in farmstead cheese and direct marketing. Not for everyone, but it’s working for some.

Northeast: Beyond the specialty cheese operations, there’s also growth in agritourism and on-farm processing. Entirely different economics, but viable for the right location.

Western States: Water rights and environmental regulations adding another layer of complexity to expansion decisions.

Questions to Ask Yourself Right Now

Before you make any big decisions, honestly assess:

  • Are you covering all costs, including family living?
  • Can you achieve 4%+ butterfat consistently?
  • Do you have succession lined up?
  • What’s your debt-to-asset ratio?
  • Could you survive another year like 2023?
  • What would happen if you lost two key employees tomorrow?
  • Is your processor investing in commodity or specialty capacity?
  • Are there emerging environmental regulations that could affect you?

What This All Means for Your Planning

After looking at all this, here’s what I think matters most:

Component performance isn’t negotiable anymore. The difference between 3.6% and 4.2% butterfat can mean hundreds of thousands annually for a 500-cow operation. That fundamentally changes farm economics.

That 12-18 month window Cornell documented? It’s real. Interest rates, heifer availability, and labor costs compressed what used to be a multi-year adjustment into a much shorter period. Within the next 12-18 months—essentially by mid-2026, based on the timeline Cornell economists have documented—many operations will have made their choice, voluntarily or not.

Scale economics show clear breaks. USDA data showing 89% profitability for 1,000+ cow operations versus 11% for under 300 cows… that’s not about who’s a better manager. It’s structural advantages smaller operations can’t overcome.

Your processor’s strategy matters more than ever. If they’re investing in commodity powder, you’ve got time. If they’re building component extraction or specialty facilities, that tells you something different.

Technology adoption keeps accelerating. The Good Food Institute tracked $840 million in precision fermentation investment last year. Alternative proteins are moving from the experimental to the commercial stage faster than most of us expected.

Risk management tools—like Dairy Margin Coverage and Dairy Revenue Protection—might buy you time but won’t change the fundamental economics. They’re Band-Aids, not cures.

The Bottom Line

What Lactalis is doing—cutting 450 million liters while investing in premium capacity—makes sense when you understand their strategy. They’re consolidating relationships with farms that can deliver consistent, high-component milk at scale while preparing for fermentation-derived proteins.

The Minnesota couple who scaled smart, the Vermont family succeeding in organic, the Wisconsin couple who preserved wealth through planned exit—they all made different choices. But they shared a realistic assessment of where things are heading and made decisions accordingly.

For those of us still figuring out our path, an honest assessment of where we fit in this evolving structure is critical. Whether that means pursuing scale, finding premium markets, or planning transition, the key is making informed decisions while we still have options.

And if you’re wondering about the next generation—I talked with several young farmers recently. The ones succeeding are incredibly sharp, using technology in ways we never imagined, and they’re not afraid to try completely different models. That gives me hope, even as things change.

The dairy industry will keep producing milk—consumers guarantee that. But who produces it, how it’s valued, and what matters most? That’s changing fundamentally. Understanding where your operation fits in that transformation might be the most important analysis you do this year.

Because waiting for things to “go back to normal”? Well, I think we all know that ship has sailed.

The Bullvine provides ongoing analysis and resources at www.thebullvine.com. Cornell’s Dairy Markets and Policy program and Wisconsin’s Center for Dairy Profitability offer valuable planning tools. The producer experiences shared here reflect confidential discussions, with identifying details modified for privacy.

KEY TAKEAWAYS

  • You Have 18 Months to Decide: Cornell economists confirm sustained losses trigger forced decisions within this window—control your choice now or lose that option forever
  • Three Paths Still Work: Scale to 1,000+ cows ($6.75-10.25M investment, 20% success rate) | Go premium (organic/A2/grassfed, 3-year transition) | Exit strategically (preserves $1.4M more than waiting)
  • Components = Survival: The 0.6% butterfat difference between average and top herds is worth $529,000/year, and processors are making this gap the entry requirement
  • The 89/11 Rule: 89% of 1,000+ cow dairies profit while only 11% under 300 cows survive—this is structural economics, not management quality
  • Processors Already Chose: They’re investing $11B in component extraction while cutting commodity suppliers—understand their strategy to predict your future

Complete references and supporting documentation are available upon request by contacting the editorial team at editor@thebullvine.com.

Learn More:

The Sunday Read Dairy Professionals Don’t Skip.

Every week, thousands of producers, breeders, and industry insiders open Bullvine Weekly for genetics insights, market shifts, and profit strategies they won’t find anywhere else. One email. Five minutes. Smarter decisions all week.

NewsSubscribe
First
Last
Consent

CME Daily Dairy Report for September 8, 2025: When the Cheese Pit Goes Silent and Your Milk Check Stays Flat

5 loads. That’s all that traded across the entire CME dairy complex Monday. We haven’t seen markets this dead since..

EXECUTIVE SUMMARY: Monday’s CME session was a wake-up call we didn’t see coming. With only five loads trading across the entire dairy complex, we’re witnessing market apathy that should terrify anyone counting on Class III recovery. But here’s what caught our attention… while domestic cheese markets flatline, U.S. butter is trading at a staggering $1.16/lb discount to Europe – creating the biggest export arbitrage opportunity we’ve seen in years.The math is brutal right now: milk-to-feed ratios sitting at 1.85 mean most operations are bleeding money, especially with September Class III stuck below $17.00/cwt. Yet Upper Midwest producers showing 2.8% production growth are doubling down on component optimization, shifting focus from protein to butterfat as global markets signal where the real money is.Private forecasters we track are more pessimistic than USDA projections, suggesting Q4 won’t bring the relief everyone’s expecting. The smart money is already repositioning for a prolonged margin squeeze – and the producers who adapt their component strategies now will be the ones still profitable when this market finally turns.

KEY TAKEAWAYS:

  • Butter export goldmine hiding in plain sight: U.S. butter at $2.02/lb vs Europe’s $3.18/lb creates immediate opportunities for Class IV premiums – work with your co-op now to capture export demand before competitors catch on
  • Component strategy pivot pays off: Upper Midwest producers optimizing for butterfat over protein are seeing $0.50-$0.75/cwt premiums in current market conditions – review your ration with your nutritionist this week to maximize the butter advantage
  • Risk management isn’t optional anymore: With milk-to-feed ratios below 2.0 and December Class III futures only 50¢ higher than September, LGM-Dairy or DRP protection is the difference between surviving and thriving through Q4
  • Feed cost window is closing: December corn at $4.21/bushel offers reasonable entry points, but harvest volatility could push prices lower – lock in winter feed now while you can still pencil out positive margins
  • Production moderation signals coming: Private sector forecasts suggest tighter supplies ahead as 47-year low heifer inventory and margin pressure force culling decisions – position for the recovery that always follows these cycles

You ever have one of those days where you check the CME numbers and think… “Did everyone just decide to take a nap?” That was today, folks. I mean, we’re talking five total loads across the entire dairy complex. Five! I’ve seen more action at a church social.

But here’s the thing that’s keeping me up at night – this isn’t just market noise. The underlying weakness in cheese prices keeps putting a ceiling on our Class III potential, and with September futures stuck below $17.00/cwt, we’re looking at margin pressure that’s making a lot of us seriously uncomfortable.

What’s fascinating, though… and I keep coming back to this… is how ridiculously cheap our butter has gotten compared to the rest of the world. I’m talking almost embarrassingly cheap. That might actually set up some interesting export opportunities for Class IV down the road, but we’ll see.

What These Numbers Actually Mean When You’re Writing That Feed Check

Let me break this down like we’re sitting around the kitchen table after chores:

ProductClosing PriceToday’s MoveMonth TrendWhat This Really Means
Cheese Blocks$1.6950/lb+0.50¢-2.4%That tiny bump? Can’t overcome the monthly slide that’s capping your Class III
Cheese Barrels$1.7000/lbFlat-2.9%Zero trades today… processors just aren’t interested
Butter$2.0250/lb+0.25¢+0.5%Modest strength, but we need bigger moves to really help Class IV
NDM$1.2200/lbFlat-1.3%International buyers see fair value, not a steal
Dry Whey$0.5700/lb+0.50¢+0.3%Welcome news – helps offset some cheese weakness

The story here isn’t about these tiny price moves… it’s about what didn’t happen. Five loads total – three blocks, one NDM, one whey. That’s it. Compare that to a typical busy day when we might see 20-25 loads change hands, and you start to understand why I’m concerned.

What’s particularly telling is that barrels are trading at a half-cent premium to blocks right now. That’s backwards, and anyone who’s been watching these markets knows it. Typically, blocks carry the premium because grocery store demand for natural cheese stays pretty steady. This flip suggests food service demand (which uses more processed cheese made from barrels) might be holding up slightly better. But honestly, with zero barrel trades today… even that signal is pretty weak.

When Nobody Shows Up to the Party

I reached out to a few contacts on the floor today – you know how it is, sometimes you need to hear it straight from the people actually making the trades. The consensus was pretty clear: this market is stuck in neutral, and nobody wants to be the first to make a move.

Zero registered bids in the barrel market against a single offer. That’s not panic selling, folks. That’s apathy. When buyers are sitting on their hands like this, waiting for something – anything – to give them a reason, you know confidence is running pretty thin.

Market technicians are suggesting spot blocks have support around $1.68/lb, with resistance near $1.75/lb. But honestly? Getting to that resistance level feels like wishful thinking given what we’re seeing in terms of buying interest. If we break through that $1.68 support on any real volume… well, let’s just say it could get interesting in a hurry.

The Tale of Two Dairy Markets – And It’s Getting Weird

This is where things get really interesting, and frankly, a bit frustrating if you’re trying to make sense of what’s happening in dairy right now. We’re essentially operating as two completely different exporters.

On the butter side… guys, we’re practically giving it away. Our cash butter at $2.0250/lb compares to about $3.18/lb equivalent in Europe and $3.14/lb in New Zealand. That’s not a small discount – that’s a “buy American or you’re crazy” kind of price gap.

The powder game? That’s a street fight. Our NDM at $1.22/lb ($2,690/MT equivalent) is right in the thick of it with European SMP around $1.15/lb and New Zealand SMP at $1.17/lb. We’re competitive, sure, but we’re not cheap. Every international sale requires aggressive marketing and sharp pencils.

What this means for your milk check is pretty straightforward – the butter discount should provide some decent support for Class IV pricing, but in the powder arena, we’re going to earn every export sale the hard way.

Feed Costs and the Math That Actually Pays Your Bills

Let’s talk about the numbers that really determine whether you’re making money or just keeping busy. Current feed landscape has December corn sitting at $4.2150/bushel and December soybean meal at $285.20/ton. Those aren’t terrible numbers, honestly.

The problem? It’s not feed costs killing us. It’s the milk price.

The milk-to-feed ratio right now is sitting around 1.85. For those keeping score at home, that’s using September Class III at $16.90/cwt against a standard dairy ration cost. Anything below 2.0 means your margins are getting squeezed, and we’re well into that territory.

Here’s what’s really frustrating – feed costs have actually been relatively manageable. But when milk is bringing what it’s bringing… your income over feed costs stays uncomfortably tight. That’s putting a lot of operations in tough spots for cash flow planning, especially heading into fall when you’re thinking about winter feed purchases.

What’s Really Moving These Markets (Or Not Moving Them)

Industry reports suggest the domestic demand story is fairly straightforward. We’re in that post-Labor Day sweet spot where retailers are stocking up for back-to-school lunch programs. That provides a steady baseline for cheese demand, which is good… but it’s not great.

Food service appears to be in one of those transition periods between the summer travel season and the year-end holiday push. You know how it goes – hotels and restaurants are kind of in limbo right now.

What’s become clear from conversations with industry sources is that processors seem pretty comfortable with current inventory levels. Nobody’s scrambling to buy milk or build cheese inventory, which explains the lackluster bidding we’re seeing in spot markets.

On the export side, Mexico continues to be our rock. They’re consistent buyers of U.S. cheese and skim milk powder, though their 2025 milking herd forecast at 6.8 million head means their production growth could displace about 100 million pounds of our NFDM exports – roughly 11% of what we send them. That’s… not ideal.

But here’s where the butter story gets interesting. The Middle East imported 99,000 tons of butter in 2024, with Saudi Arabia taking 53,000 tons. With U.S. butter this competitively priced, market analysts are suggesting we could see some significant sales announcements in the coming weeks. That would be a game-changer for Class IV.

Looking Ahead – And the Forecasts Are All Over the Map

The futures market isn’t painting a rosy picture right now. September Class III at $16.90/cwt pretty much reflects the weakness we’re seeing in spot cheese markets. But here’s what’s interesting – when you compare the CME futures to various forecasts, there’s quite a spread.

The USDA is projecting 2025 milk production at about 228 billion pounds with increased commercial dairy exports. Their Q3 average projection for Class III sits around $17.50/cwt. But private sector analysts like those at StoneX and Rabobank are being more cautious, suggesting Q3 averages closer to $17.20/cwt based on current demand patterns and production trends.

What’s particularly noteworthy is that some private forecasters are suggesting we might see production moderation as margins stay tight – especially in regions dealing with higher feed costs or labor challenges. That could provide some underlying support, but timing is everything in this business.

Class IV futures at $17.03/cwt are holding that slight premium over Class III, and that’s entirely due to butter and NDM strength relative to cheese. The forward curve suggests more stability in Class IV than Class III, which makes sense given our export positioning.

What People Are Actually Saying

Industry sources report that market sentiment remains… well, let’s call it cautious. One longtime trader I know mentioned that “the market feels dead in the water right now. Nobody wants to be a hero buying cheese at these levels, but there aren’t any aggressive sellers either. We’re basically stuck until we get a catalyst.”

A processing plant manager up in Wisconsin told contacts that “inventories are in good shape. We’re filling our regular orders without any issues, but we don’t see any reason to chase milk prices higher or build extra inventory right now. If prices dip, we’ll buy. But we’re not driving this market higher.”

What’s particularly interesting is hearing from dairy economists who are really focusing on this split between Class III and Class IV. As one analyst put it: “The world clearly wants our butter at these price levels, but the domestic cheese market is struggling to find its footing. Producers with flexibility in component management should really be focusing on butterfat optimization right now.”

Regional Reality Check – What’s Happening in the Heartland

For those of us in Wisconsin and Minnesota, today’s cheese market action hits pretty close to home. The Upper Midwest is showing milk production growth of about 2.8% with processing plants running at full capacity. When you consider that the majority of milk in our region flows into cheese vats, that sub-$1.70 block price translates directly into pressure on milk checks.

I’ve been talking to producers across southern Wisconsin, and the story is pretty consistent. Plants are running full schedules – that’s the good news. There’s no shortage of homes for milk. But the value proposition… well, that’s tied directly to a spot cheese market that’s showing zero ambition right now.

What strikes me is how many producers are starting to work with their nutritionists to optimize for butterfat rather than just protein, given the relative strength we’re seeing in butter markets. Others are looking more seriously at forward contracting opportunities, even at these lower levels, just to establish some cash flow certainty going into fall.

The thing about our region is that we’ve got the infrastructure and the cow comfort systems to maintain production even when margins get tight. But that doesn’t make the tight margins any easier to live with.

What You Should Actually Do Right Now (And I Mean This Week)

Look, I’m not going to sugarcoat this – if your cost of production is anywhere near these Class III levels, you need to be thinking seriously about risk management. Like, this week. The December Class III contract is only trading about 50 cents higher than September, which doesn’t give you much cushion for improvement.

Risk management tools worth considering: Dairy Revenue Protection (DRP) can help establish price floors without limiting your upside potential. If you want to lock in a specific margin level, Livestock Gross Margin (LGM-Dairy) might make sense for your operation. And don’t ignore forward contracting opportunities with your co-op or milk buyer – even at these levels, certainty has real value when you’re trying to manage cash flow.

Feed cost management: Today’s corn and meal prices offer reasonable entry points if you still need to cover fall and winter feed needs. With the uncertainty we’re seeing in milk prices, locking in your biggest expense provides some certainty. Several analysts I follow are suggesting corn could test the $4.00 level if harvest proceeds smoothly, but that’s not guaranteed.

Component optimization: This might be the most important near-term strategy. With cheese prices this weak, maximizing butterfat and protein content becomes critical for milk check improvement. Work with your nutritionist to fine-tune those rations – even small improvements in component levels can add meaningful dollars to your monthly check.

Industry Intel That’s Actually Worth Knowing

The cooperative landscape continues to evolve, with major co-ops significantly expanding their sustainability programs this fall. They’re working to secure “green” premiums from food companies for producers who can document environmental stewardship efforts. It’s not huge money yet, but every little bit helps when margins are this tight.

On the regulatory front, those Federal Milk Marketing Order reforms that went into effect June 1 are still working their way through the system. The updated make allowances and composition factors are gradually impacting regional price relationships, though it’s too early to see the full effects.

We’re also dealing with some production challenges that could eventually provide market support. H5N1 avian flu continues impacting California dairy production, and dairy replacement heifer inventory hit a 47-year low at 3.91 million head as of January. These supply-side factors could eventually tighten things up, but timing… well, timing is everything in this business.

Putting Today in Context – And Looking for Light at the End of the Tunnel

Here’s the bottom line – today’s quiet session wasn’t a turning point, it was just another day in what’s become a fundamentally challenging pricing environment. That spot block price of $1.6950/lb is a far cry from the $2.00+ levels we were seeing this time last year.

The market has basically repriced cheese lower due to ample milk supplies meeting good, but not great, demand. Until we see a meaningful shift in that supply/demand balance, this challenging environment will likely persist.

What I’m watching for as potential catalysts: the next USDA Milk Production report, any significant export sale announcements (particularly in butter), weather developments that could affect either feed costs or production, and early holiday season demand patterns.

Markets like this… they don’t turn on a dime. When we do see a shift, it’ll likely be gradual at first. But the thing about dairy markets is they always turn eventually. They have to.

For now, focus on what you can control – production efficiency, component optimization, cost management, and smart risk management strategies. The producers who position themselves well during tough periods are usually the ones who benefit most when conditions improve.

And they will improve. This industry has been through tougher times, and we’ve always come out the other side. The key is making sure you’re still in the game when things turn around.

Complete references and supporting documentation are available upon request by contacting the editorial team at editor@thebullvine.com.

Learn More:

The Sunday Read Dairy Professionals Don’t Skip.

Every week, thousands of producers, breeders, and industry insiders open Bullvine Weekly for genetics insights, market shifts, and profit strategies they won’t find anywhere else. One email. Five minutes. Smarter decisions all week.

NewsSubscribe
First
Last
Consent

Cheese Yield Explosion: How Dairy Farmers Can Reclaim Billions in Lost Component Value

Your cows are pumping out record butterfat, creating a 12.5% cheese yield windfall worth billions. But who’s pocketing the profits? (Not you.)

EXECUTIVE SUMMARY: American dairy farmers have engineered a component revolution, pushing butterfat from a 60-year plateau of 3.65% to today’s record 4.19%, dramatically increasing cheese yields from 10.14 to 11.41 pounds per hundredweight since 2010. This 12.5% yield improvement creates approximately $2.50 in additional value per hundredweight, generating billions in new revenue that’s fueling a $7 billion processor expansion boom while milk prices remain relatively flat. Though Federal Orders will finally update component standards in December 2025, farmers must act now to calculate their true component value, demand fair compensation from processors, and potentially explore direct marketing opportunities to capture more of the value they’re creating through genetic and nutritional advancements.

KEY TAKEAWAYS

  • Follow the money: While your components create 12.5% more cheese per vat, processors are building billion-dollar plants – calculate what YOUR components are truly worth using our simple formula
  • Regional advantage: Pacific Northwest producers are leading with 4.3% butterfat (vs. national 4.19%), creating a significant competitive edge in component revenue
  • Mark your calendar: Federal Order composition updates coming December 1, 2025 finally acknowledge higher components, but don’t wait – demand fair compensation now
  • Component revolution just starting: With 58% of milk check revenue coming from butterfat alone, your genetics and nutrition strategies should prioritize components over volume
  • Collective action required: Join industry organizations fighting for updated pricing formulas that reflect today’s higher-component reality
dairy component pricing, butterfat value, cheese yield increase, milk component revolution, dairy farmer profitability

While dairy farmers have been pushing their herds to new genetic heights – pumping out record-breaking component levels never before seen in American dairy history – processors are quietly celebrating a 12.5% cheese yield windfall, transforming their bottom lines. For six decades, 100 pounds of milk reliably yielded about 10 pounds of cheese. Today, that same milk is producing a whopping 11.41 pounds – creating billions in new value in the dairy economy.

The question burning up milkhouses across America: Are YOU getting YOUR fair share of this component-driven gold rush?

YOUR COMPONENTS, YOUR CASH COW: THE REVOLUTION NOBODY’S TALKING ABOUT

The numbers don’t lie, and they’re frankly staggering. What started as a slow climb in 2010 has become an all-out component revolution reshaping dairy economics from farm to factory.

The most current verified data shows meteoric component growth. Butterfat and protein levels have consistently risen year after year:

  • 2020: 3.92% butterfat and 3.18% protein
  • 2021: 3.97% butterfat and 3.21% protein
  • 2022: 4.06% butterfat and 3.25% protein
  • 2023: 4.11% butterfat and 3.26% protein
  • 2024: 4.19% butterfat and 3.28% protein (through November)

From 1966 to 2010, the butterfat content in the U.S. milk supply hovered in a very narrow range from 3.65% to 3.69%. That’s over FOUR DECADES of virtually no movement!

Then everything changed. According to USDA’s National Agricultural Statistics Service, annual averages have soared, with 2024 on track to set yet another record as the fourth consecutive year of butterfat breaking new ground.

The Production Math That Changes Everything For YOUR Bottom Line

Here’s where this gets truly interesting for YOUR operation. While traditional milk production has been falling—down in 14 of the last 17 months since July 2023—component production has continued to climb.

The 2023 to 2024 period marks the first time U.S. milk production fell in back-to-back years since the late 1960s, as confirmed by the USDA Dairy Market News. Despite this volume downturn, milk component production—as measured by butterfat and protein pounds—keeps climbing, even modestly, at 0.19% in recent months.

In cold, complex cash terms, this component-driven model is now your economic lifeline as a dairy producer. According to Federal Milk Marketing Order statistics, in 2023, a whopping 58% of milk check income came directly from butterfat, with protein commanding an additional 31%.

That’s nearly 90% of your milk check tied directly to components!

WHO’S WINNING THE CHEESE YIELD LOTTERY WHILE YOU STRUGGLE?

Let’s get straight to the question nobody wants to ask: With cheese yields climbing from 10.14 pounds per hundredweight in 2010 to today’s 11.41 pounds, who’s pocketing the extra value?

The math here is brutally simple. That 12.5% yield improvement translates to an extra 1.27 pounds of cheese from every hundred pounds of milk. At current wholesale cheese prices, we’re talking about approximately $2.50 in additional value per hundredweight that didn’t exist before.

“Consider, for example, that a one-point decrease in casein retention can translate into a loss of almost .05 pounds of cheese per every 100 pounds of milk.” – USDA ARS Dairy Processing Research.

When processors calculate yields to the hundredth of a pound, YOU can bet they’re tracking every fraction of component value. Multiply that across the billions of pounds of cheese produced annually in America, and you’re looking at billions in new value creation.

The inconvenient question: Is this windfall fairly distributed back to YOU, the farmer who made it possible through YOUR breeding programs and management practices?

FOLLOW THE MONEY: Processing Expansion Tells All

If you want to know who’s cashing in on these component gains, follow the money. According to Dairy Foods magazine, the dairy industry is currently pouring over $7 billion into new processing facilities, with a significant portion dedicated to cheese plants scheduled to come online through 2027.

Processors are building billion-dollar cheese plants while your milk price barely budges. Coincidence?

“Standardization refers to the practice of adjusting the composition of cheese milk to maximize economic return from the milk components while maintaining both cheese quality and composition specifications.” – Journal of Dairy Science.

Processors aren’t just passively benefiting from your improved components – they’re actively optimizing every drop of your milk to extract maximum economic value.

These processing investments require substantial capital risk and create essential infrastructure for farmers’ milk. However, the question remains whether the economic benefits of higher-component milk are being equitably distributed throughout the supply chain.

What’s driving this investment? Simple economics. In 2000, cheese production absorbed 37.7% of the U.S. milk supply. Fast forward two decades and that figure has climbed to 42.5%, according to the USDA Economic Research Service. Butter demand has similarly increased, growing from 16.3% of milk production in 2000 to 18.6% two decades later.

Consumers are driving this change by demanding more nutrient-dense products like cheese and butter.

COMPONENT PRICING: IS THE SYSTEM RIGGED AGAINST YOU?

With its component pricing formulas, the Federal Milk Marketing Order system was supposed to ensure farmers got paid for what mattered. But here’s the uncomfortable reality: these formulas were developed when components were far lower than today’s levels.

With multiple component pricing (MCP) as the pricing mechanism for over 90% of the nation’s milk, getting the formulas right isn’t just an academic exercise – it’s the difference between thriving and barely surviving for thousands of dairy families like YOURS.

Even USDA finally acknowledges this reality. After decades of using outdated component standards, they’re updating the milk composition factors in Federal Orders as outlined in the Federal Register:

  • True protein: increasing from 3.1% to 3.3%
  • Other solids: rising from 5.9% to 6.0%
  • Nonfat solids: rising from 9.0% to 9.3%

This change will take effect on December 1, 2025—a full 10 months from now—but it represents official recognition of what you’ve been delivering for years.

REGIONAL COMPONENT SHOWDOWN: WHERE DOES YOUR FARM STAND?

The component geography of American dairying reveals dramatic differences across regions and shows how far we’ve come from historical baselines:

For producers in these high-component regions, the advantage compounds with every tanker of milk that leaves the farm. However, this geographic disparity also raises serious questions about whether the federal order system fairly compensates all producers when component levels vary dramatically by region.

EXPORTS EXPLODING ON THE BACK OF YOUR COMPONENTS

While domestic processors benefit from higher cheese yields, they’re not the only ones. According to the U.S. Dairy Export Council, U.S. cheese exports have been setting new records, fueled by competitive prices made possible by higher component milk.

This export boom is directly tied to competitive U.S. cheese prices. The higher-component milk produces more cheese per vat, lowering unit costs and making American cheese more competitive globally.

But again, the question persists: Are YOU seeing YOUR fair share of this export-driven demand?

BOTTOM LINE CALCULATOR: ARE YOU GETTING PAID FOR YOUR COMPONENTS?

Use this simple formula to estimate how much additional value YOUR components are creating versus what you’re receiving in YOUR milk check:

  1. Take YOUR butterfat test and subtract 3.65% (the historical average)
  2. Multiply that difference by 2.5 (pounds of additional cheese per 0.1% butterfat increase)
  3. Multiply by YOUR milk volume in hundredweights
  4. Multiply by the current cheese price per pound
  5. Compare this value to your component premiums

This simple calculation will show if YOU’RE capturing the full value of YOUR genetic investments.

“I’ve pushed our herd’s butterfat from 3.8% to 4.4% over the past five years through aggressive genetic selection and nutrition management. The payoff has been substantial – our income per cow is up over 15% even with relatively flat milk prices.” – Tom H., Progressive Wisconsin Dairy Producer, Green County.

THE PATH FORWARD: CAPTURING YOUR COMPONENT VALUE

For forward-thinking dairy producers, several strategies emerge from this component revolution:

1. Push YOUR Components Even Higher

The genetic ceiling for butterfat and protein hasn’t been reached. With consistent year-over-year increases in components nationwide, the upward trend continues. Every 0.1% increase in components creates significant additional value for YOUR operation.

2. Demand Answers From YOUR Processor NOW

At your next cooperative or processor meeting, ask these specific questions:

  • How much additional cheese is my milk-producing compared to 2010 levels?
  • What percentage of that additional value flows back to me as the producer?
  • How have component premiums adjusted to reflect today’s higher yield environment?

3. Mark December 1, 2025 On YOUR Calendar

The Federal Order composition factor updates will take effect on this date, finally acknowledging the protein revolution occurring on farms across America. But this is just the beginning of making the system genuinely fair. Keep pushing for component pricing that reflects the actual value YOU create.

4. Get Involved With Industry Organizations Fighting For YOU

Several dairy farmer organizations are actively working on component pricing reform and fair value distribution:

5. Consider Direct Marketing Opportunities

The consumer demand for high-component dairy products has never been stronger. According to USDA-ERS consumption data, Americans continue to shift toward nutrient-dense dairy products like cheese and butter.

In 2000, cheese production absorbed 37.7% of the U.S. milk supply, climbing to 42.5% two decades later. Producers with entrepreneurial spirit might capture more of their milk’s value by processing their high-component products.

THE BOTTOM LINE: YOUR COMPONENTS, YOUR MONEY

The dairy industry is witnessing a historic shift in how milk becomes cheese, and the economic implications are massive. Despite milk production falling in 14 of the last 17 months since July 2023, the real story is what’s in that milk, not how much farmers produce.

Processors are already betting billions on this new reality, building the capacity to turn YOUR components into high-value cheese. The question isn’t whether components matter – they do.

The real question is whether you, as a producer, are getting your fair share of the revolutionary value you’re creating.

The component revolution is here. Make sure YOU’RE not left behind when it comes time to divide the spoils.

Learn more:

Join the Revolution!

Join over 30,000 successful dairy professionals who rely on Bullvine Daily for their competitive edge. Delivered directly to your inbox each week, our exclusive industry insights help you make smarter decisions while saving precious hours every week. Never miss critical updates on milk production trends, breakthrough technologies, and profit-boosting strategies that top producers are already implementing. Subscribe now to transform your dairy operation’s efficiency and profitability—your future success is just one click away.

NewsSubscribe
First
Last
Consent
Send this to a friend