Archive for butterfat prices

Stop Tightening Your Belt: Dairy’s $6.35/cwt Gap and Your 90-Day Window to Close It

90 days to reposition before 2026 hits. The top 25% of dairy operations already moved. This is the playbook they’re using.

EXECUTIVE SUMMARY: Tightening your belt won’t save you this time. The shifts hitting dairy in 2025-2026—production running 4.7% above year-ago levels, replacement heifers at a 47-year low, butterfat collapsed from $3.00 to $1.40/lb, processors leveraging billions in new capacity—aren’t cyclical headwinds that reverse when prices recover. They’re structural changes to how this industry operates. Cornell Pro-Dairy data makes the stakes clear: a $6.35/cwt efficiency gap separates top-quartile from bottom-quartile farms, a difference exceeding $100,000 annually between similar-sized operations. The producers repositioning now—locking in feed costs, enrolling in risk management before January deadlines, recalibrating breeding programs for the beef-on-dairy era—will be the ones thriving in 2028. You have a 90-day window. This is the playbook.

Dairy Market Shift 2026

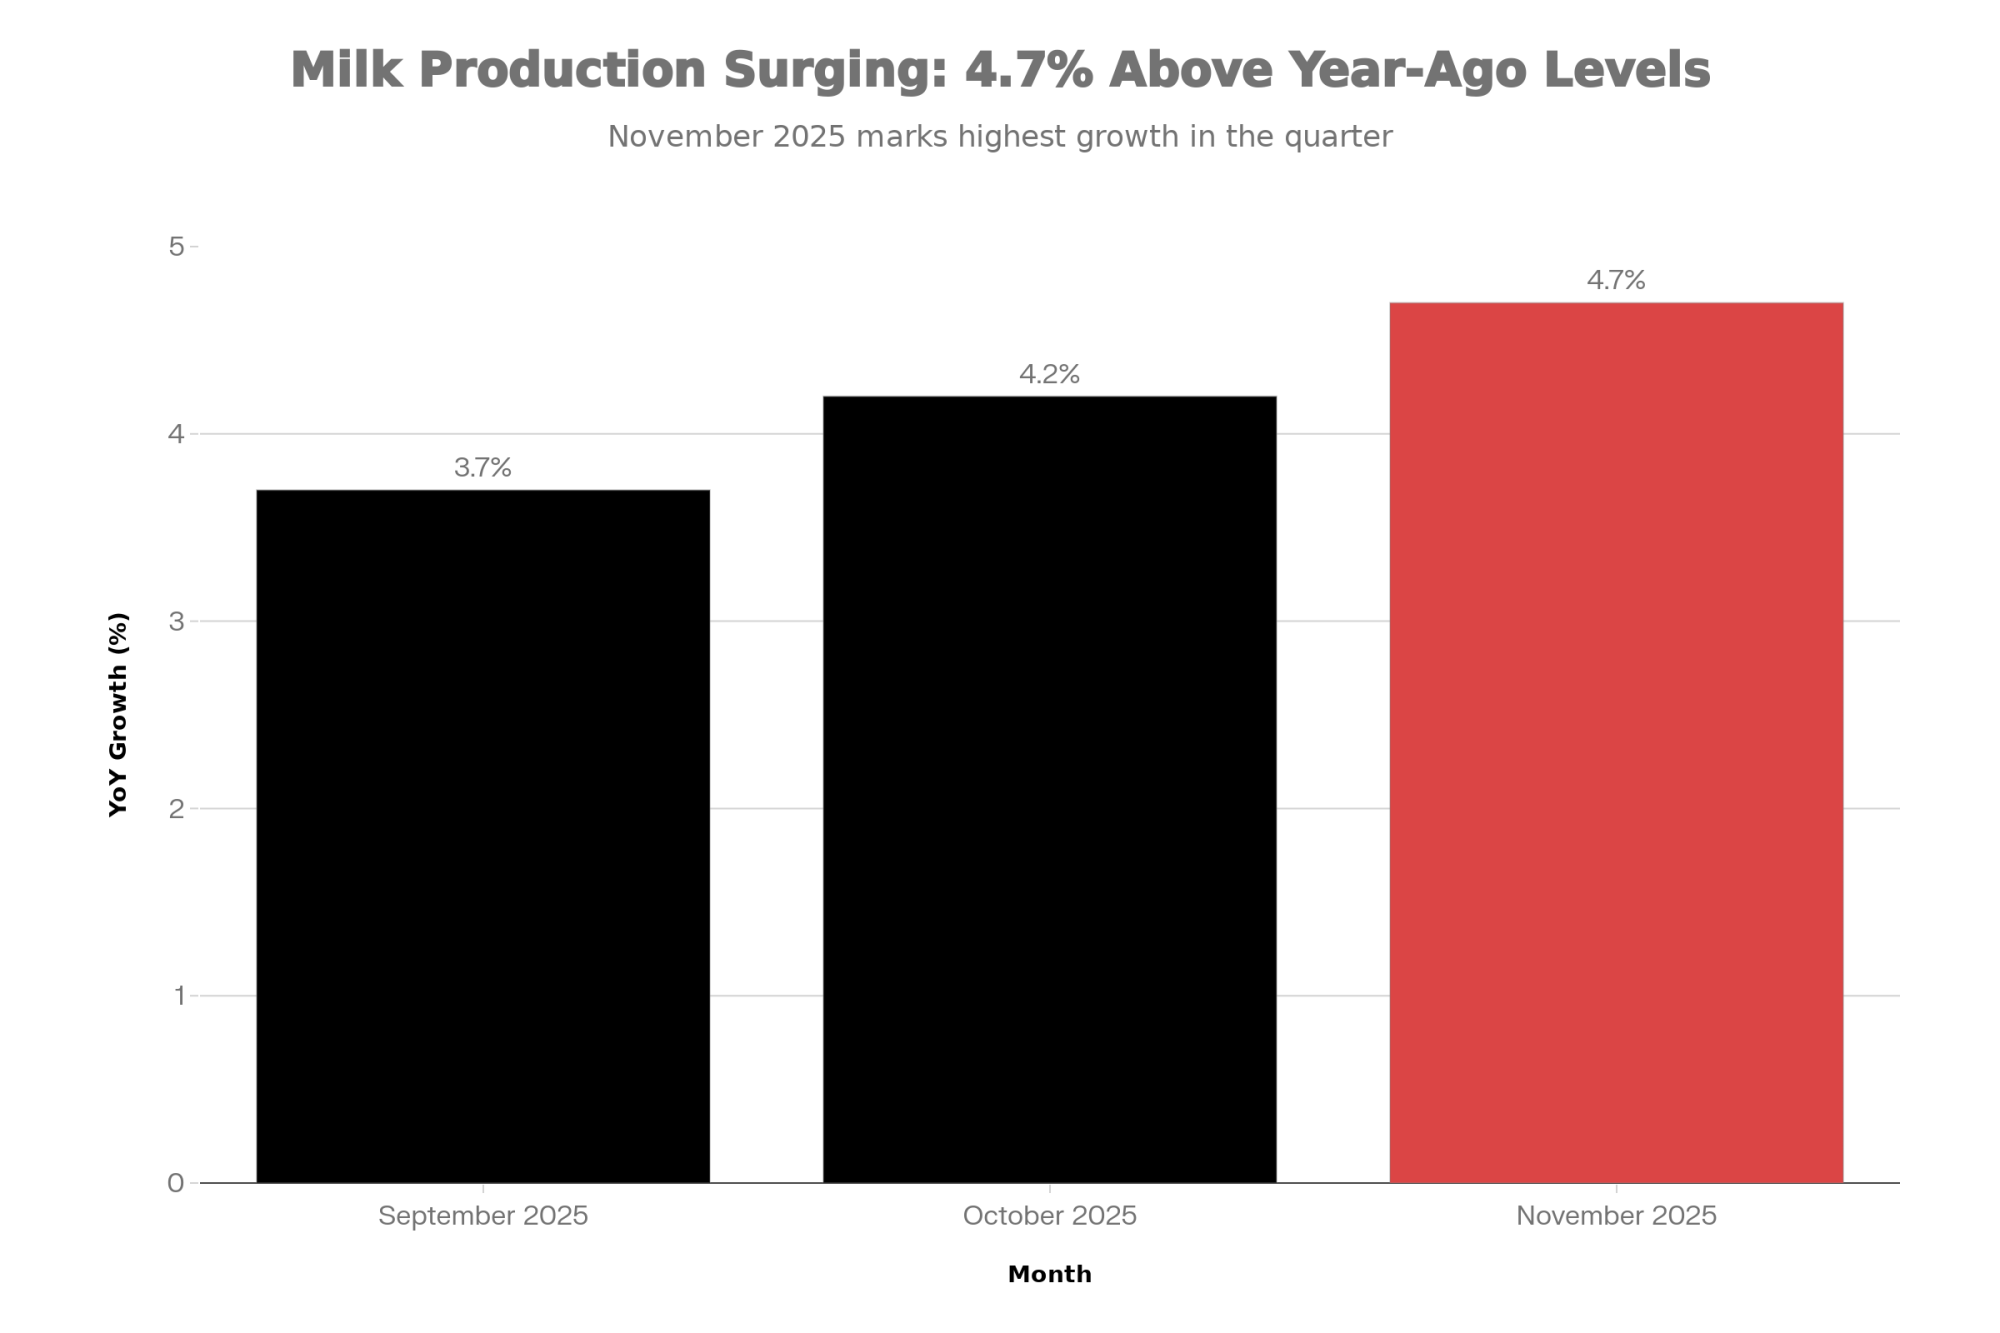
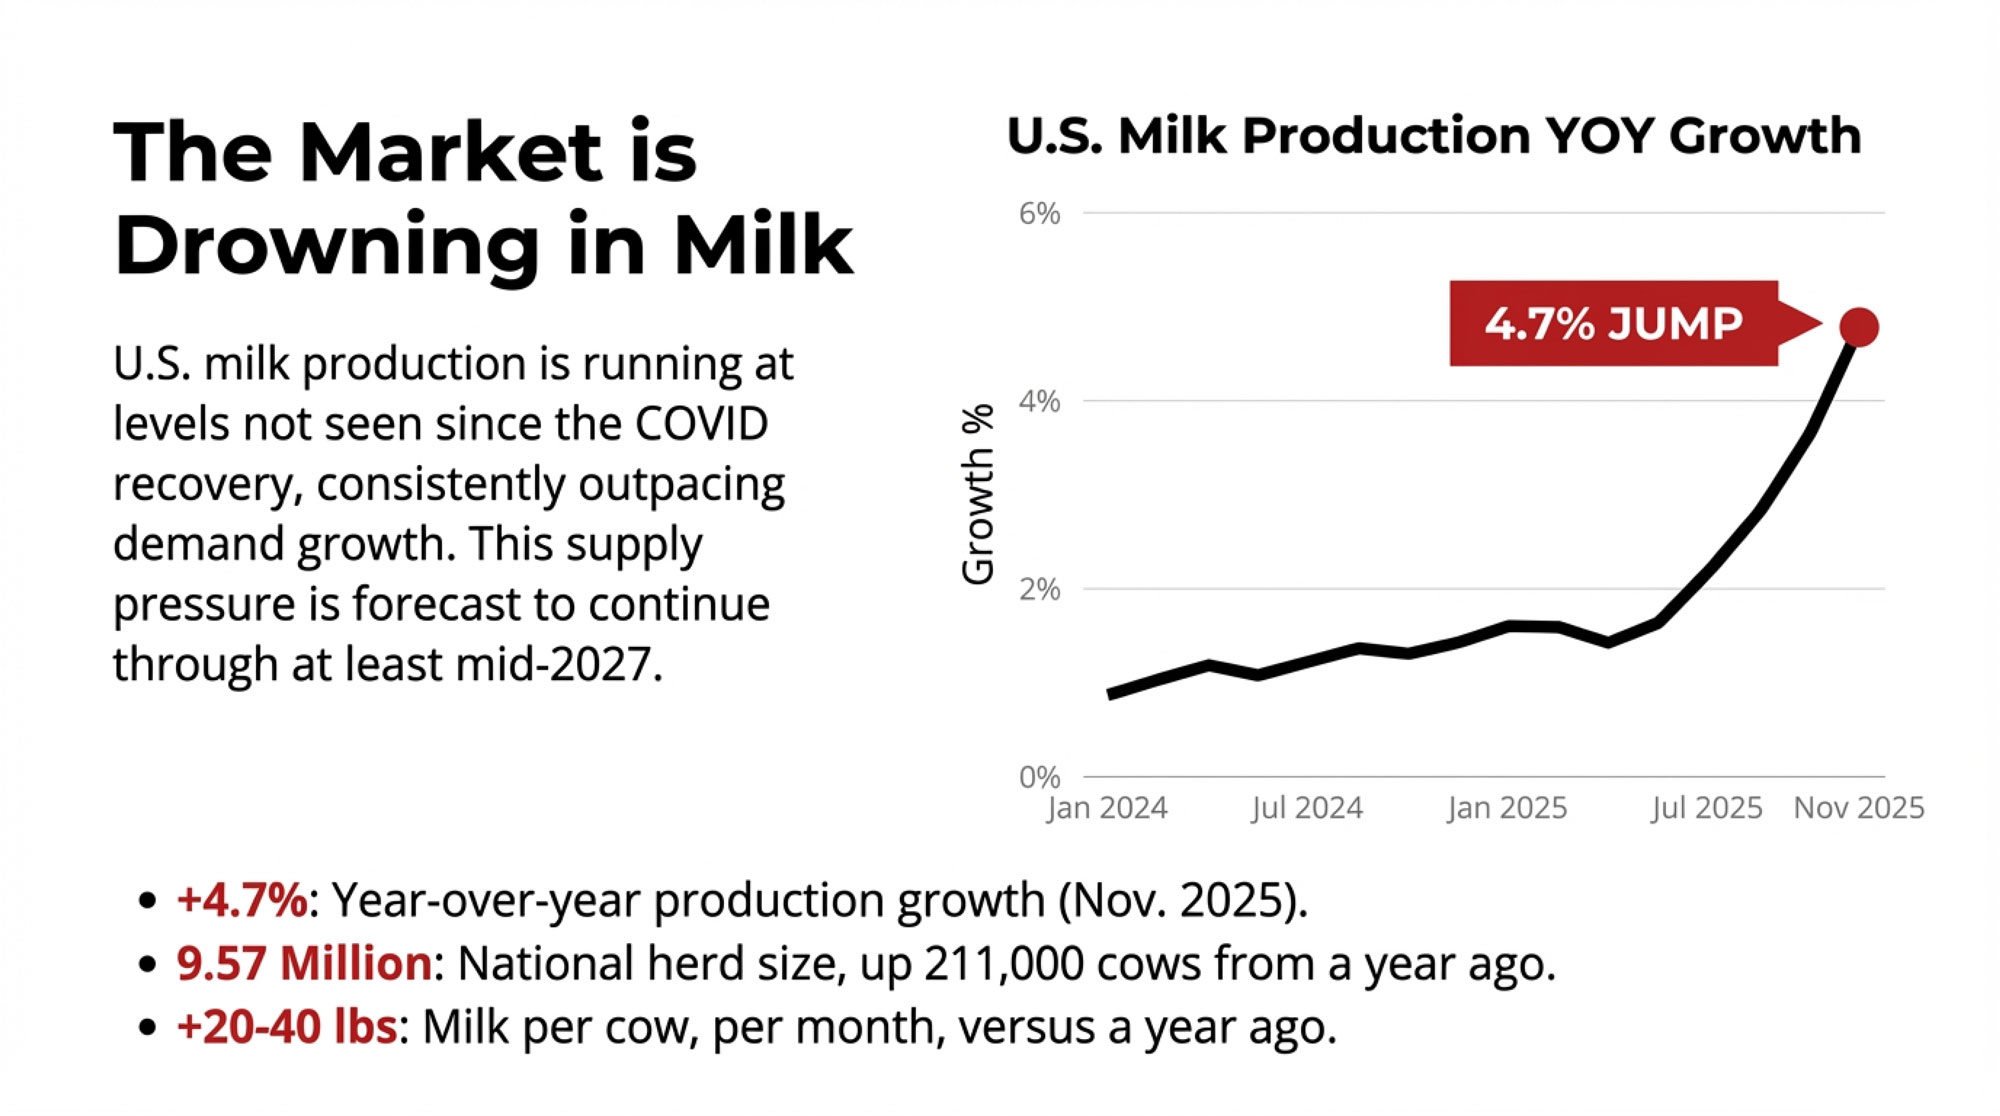
You’ve probably seen the headlines by now. U.S. milk production has been running hot—really hot—through the back half of 2025. We’re talking 3.7 to 4.2 percent above year-ago levels in September and October, and then November came in at 4.7 percent higher than the same month in 2024, according to USDA’s latest milk production reports and Cheese Reporter’s analysis of the data. That’s the kind of year-over-year growth we haven’t seen since the COVID recovery period.

And the industry is still figuring out where all that extra milk should go.

USDA’s November estimates show the national dairy herd has grown to approximately 9.57 million head—up 211,000 cows from a year ago. Per-cow productivity keeps climbing, too. USDA data shows milk per cow running 20 to 40 pounds higher per month than a year earlier across the major dairy states.

When you multiply those gains across millions of cows, you end up with substantial incremental production that needs to find a home.

I’ve been tracking dairy markets for a long time, and this moment feels genuinely different. Not catastrophically so—dairy will remain viable, and there are real opportunities for well-positioned operations—but different enough that the playbook from 2016 or 2020 may need some adjustment in 2026.

Let me walk through what’s actually happening and what it might mean for your operation.

The Production Picture That’s Emerging

The supply situation requires some unpacking because it’s not just about one factor. It’s several forces converging at once.

Herd numbers have expanded meaningfully after years of modest growth, and productivity gains keep compounding. Modern genetics and management practices—better transition cow protocols, improved fresh cow management, tighter reproduction programs—keep pushing output higher. That additional 20-40 pounds per cow per month doesn’t sound dramatic until you’re looking at the national numbers.

The regional story has gotten interesting, too. Some areas hit by HPAI and weather challenges in 2024 saw temporary production setbacks, but by late 2025, USDA data show California’s milk output actually rising sharply—up about 6.9 percent year-over-year in October—as both cow numbers and per-cow production recovered.

Meanwhile, expansion in Texas, parts of the Upper Midwest, and states like South Dakota continues to reshape the geography of the U.S. milk supply.

I recently spoke with a producer in the Texas Panhandle who has been farming for 30 years. He noted that five years ago, he could count the large dairies in his county on one hand. Now there are several major operations within a reasonable drive, all competing for the same labor pool and feed resources. That kind of regional shift creates both opportunities and new competitive pressures.

What economists like Dr. Marin Bozic at the University of Minnesota have been tracking is a fundamental geographic redistribution of U.S. milk production. The industry is less concentrated in traditional dairy regions, which has real implications for processor logistics and regional pricing.

For our Canadian readers, the contrast is striking—while U.S. producers navigate oversupply pressure, Canada’s supply management system, with quota prices ranging from CAD $24,000 to over $56,000 per kilogram of butterfat per day, depending on province (according to Agriculture Canada’s 2025 data) and tariffs of 200-300% on imports creates an entirely different market reality. That protection comes with its own trade-offs, but it insulates Canadian producers from the volatility American farmers are facing.

So what does this mean practically? USDA forecasts indicate domestic production will likely continue exceeding consumption growth through at least mid-2027. That suggests continued pressure on milk prices—though as always, unexpected developments could change the trajectory.

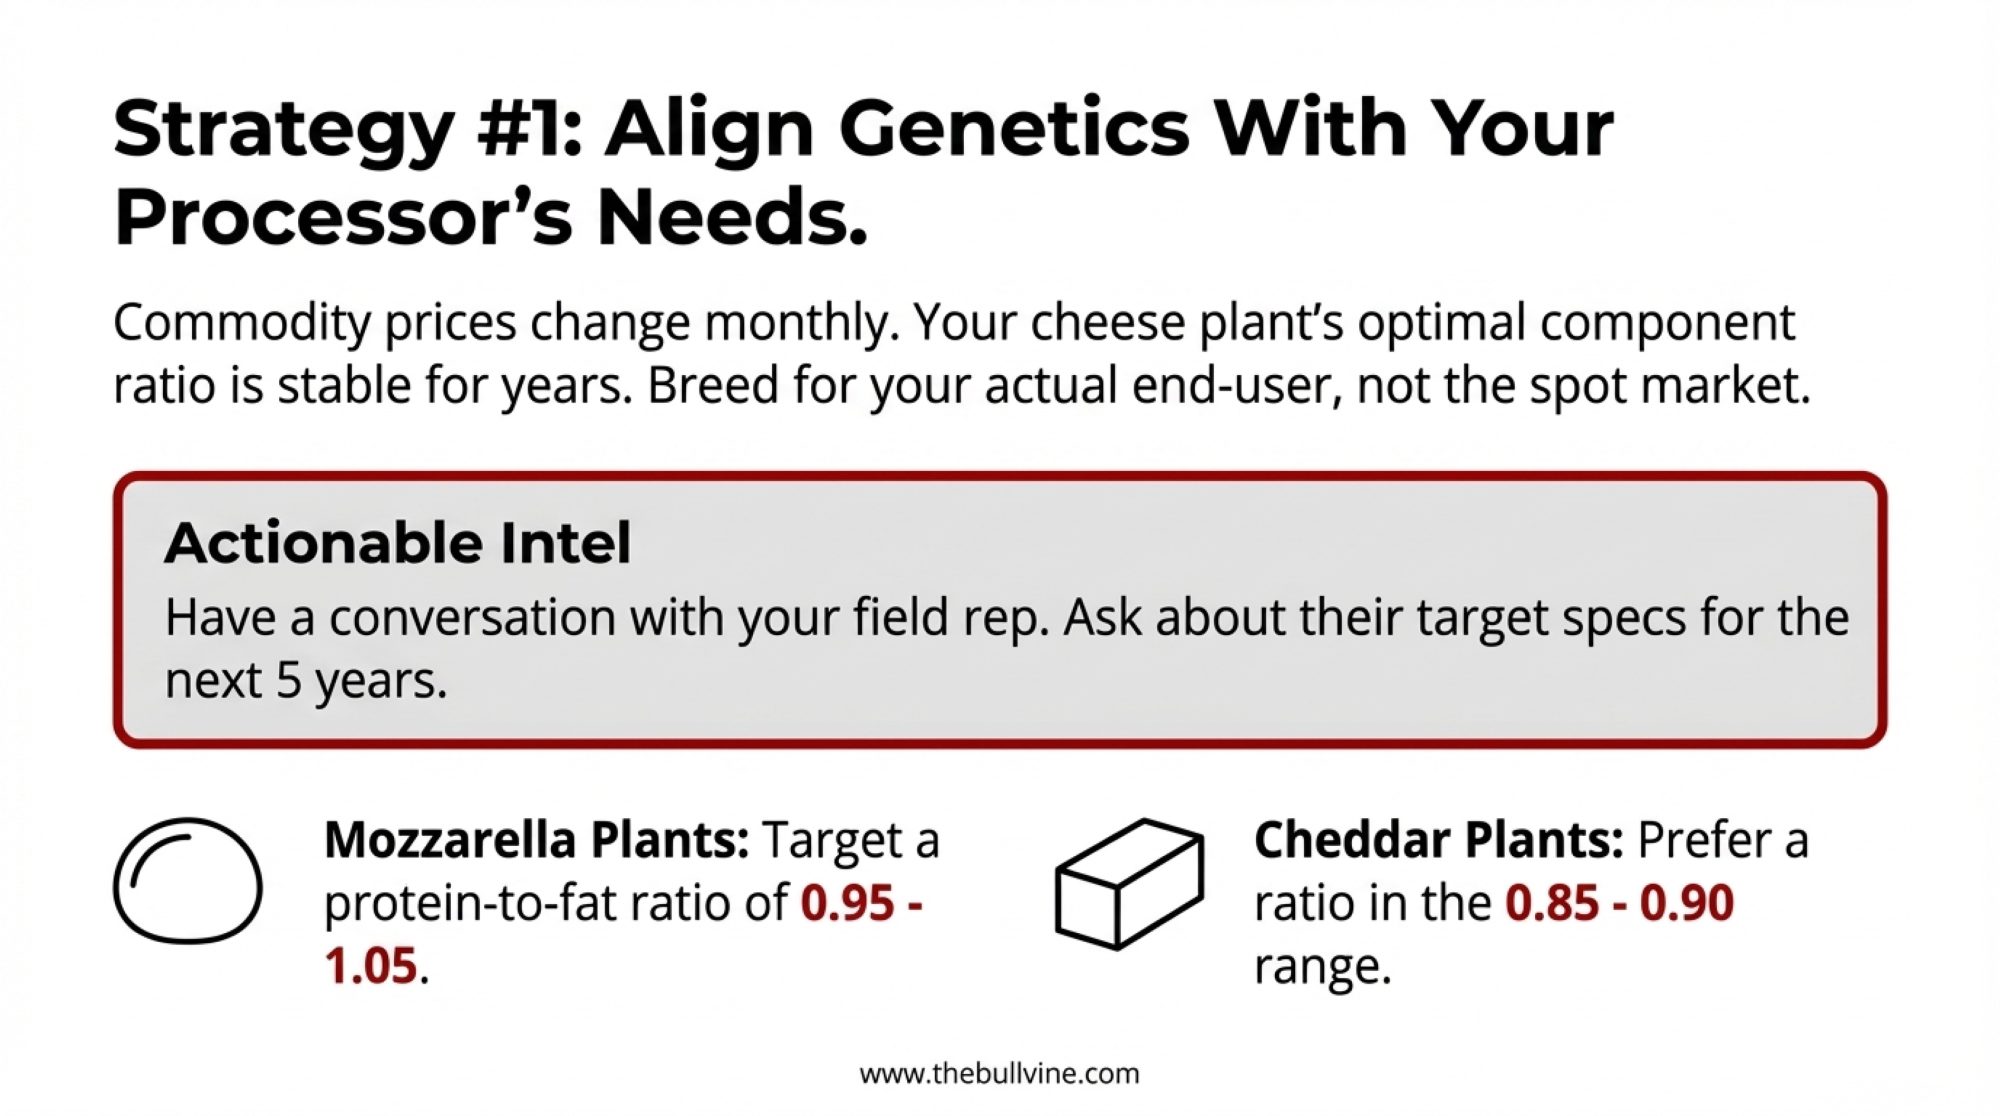
What’s Actually Happening to Component Premiums

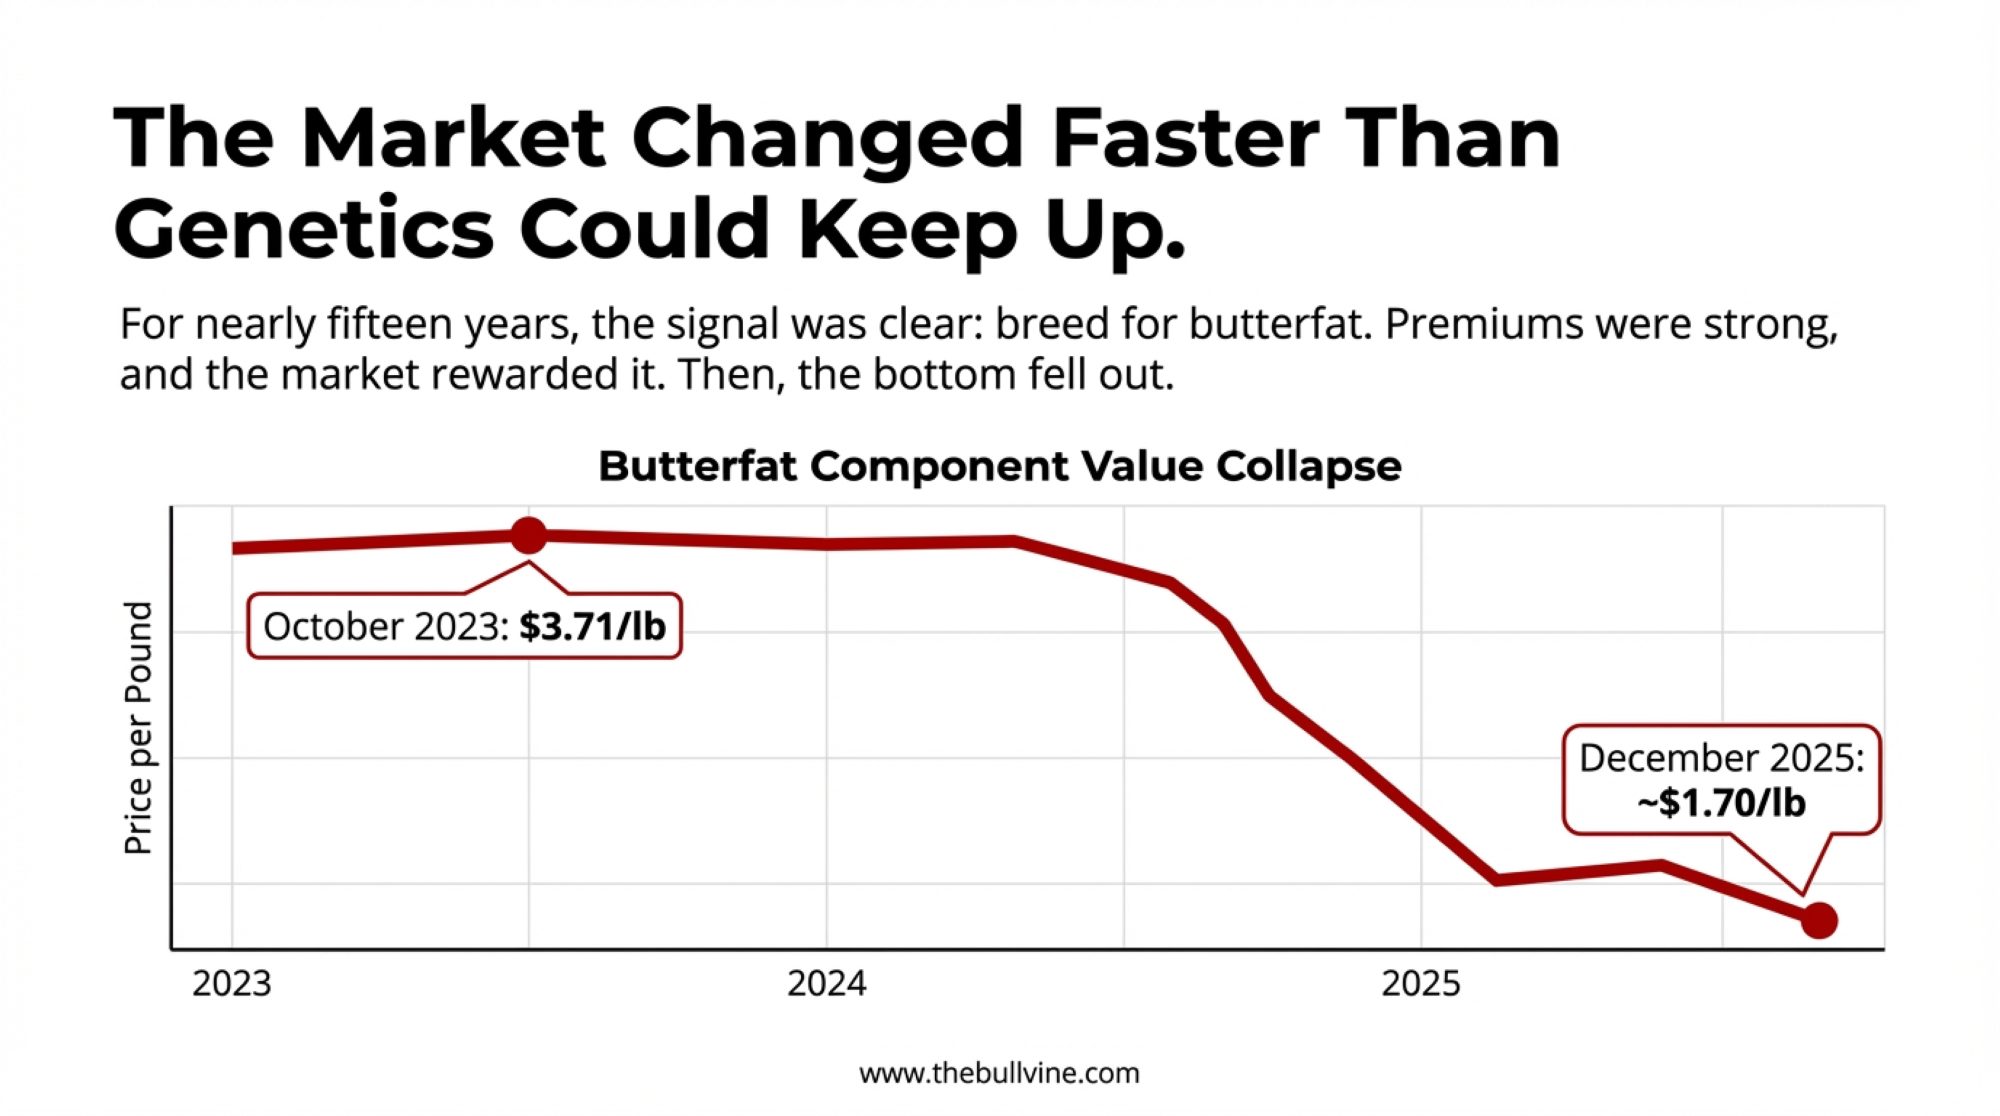
For a lot of operations, component pricing—particularly butterfat premiums—has been a crucial margin driver over the past several years. That dynamic is shifting in ways worth understanding.

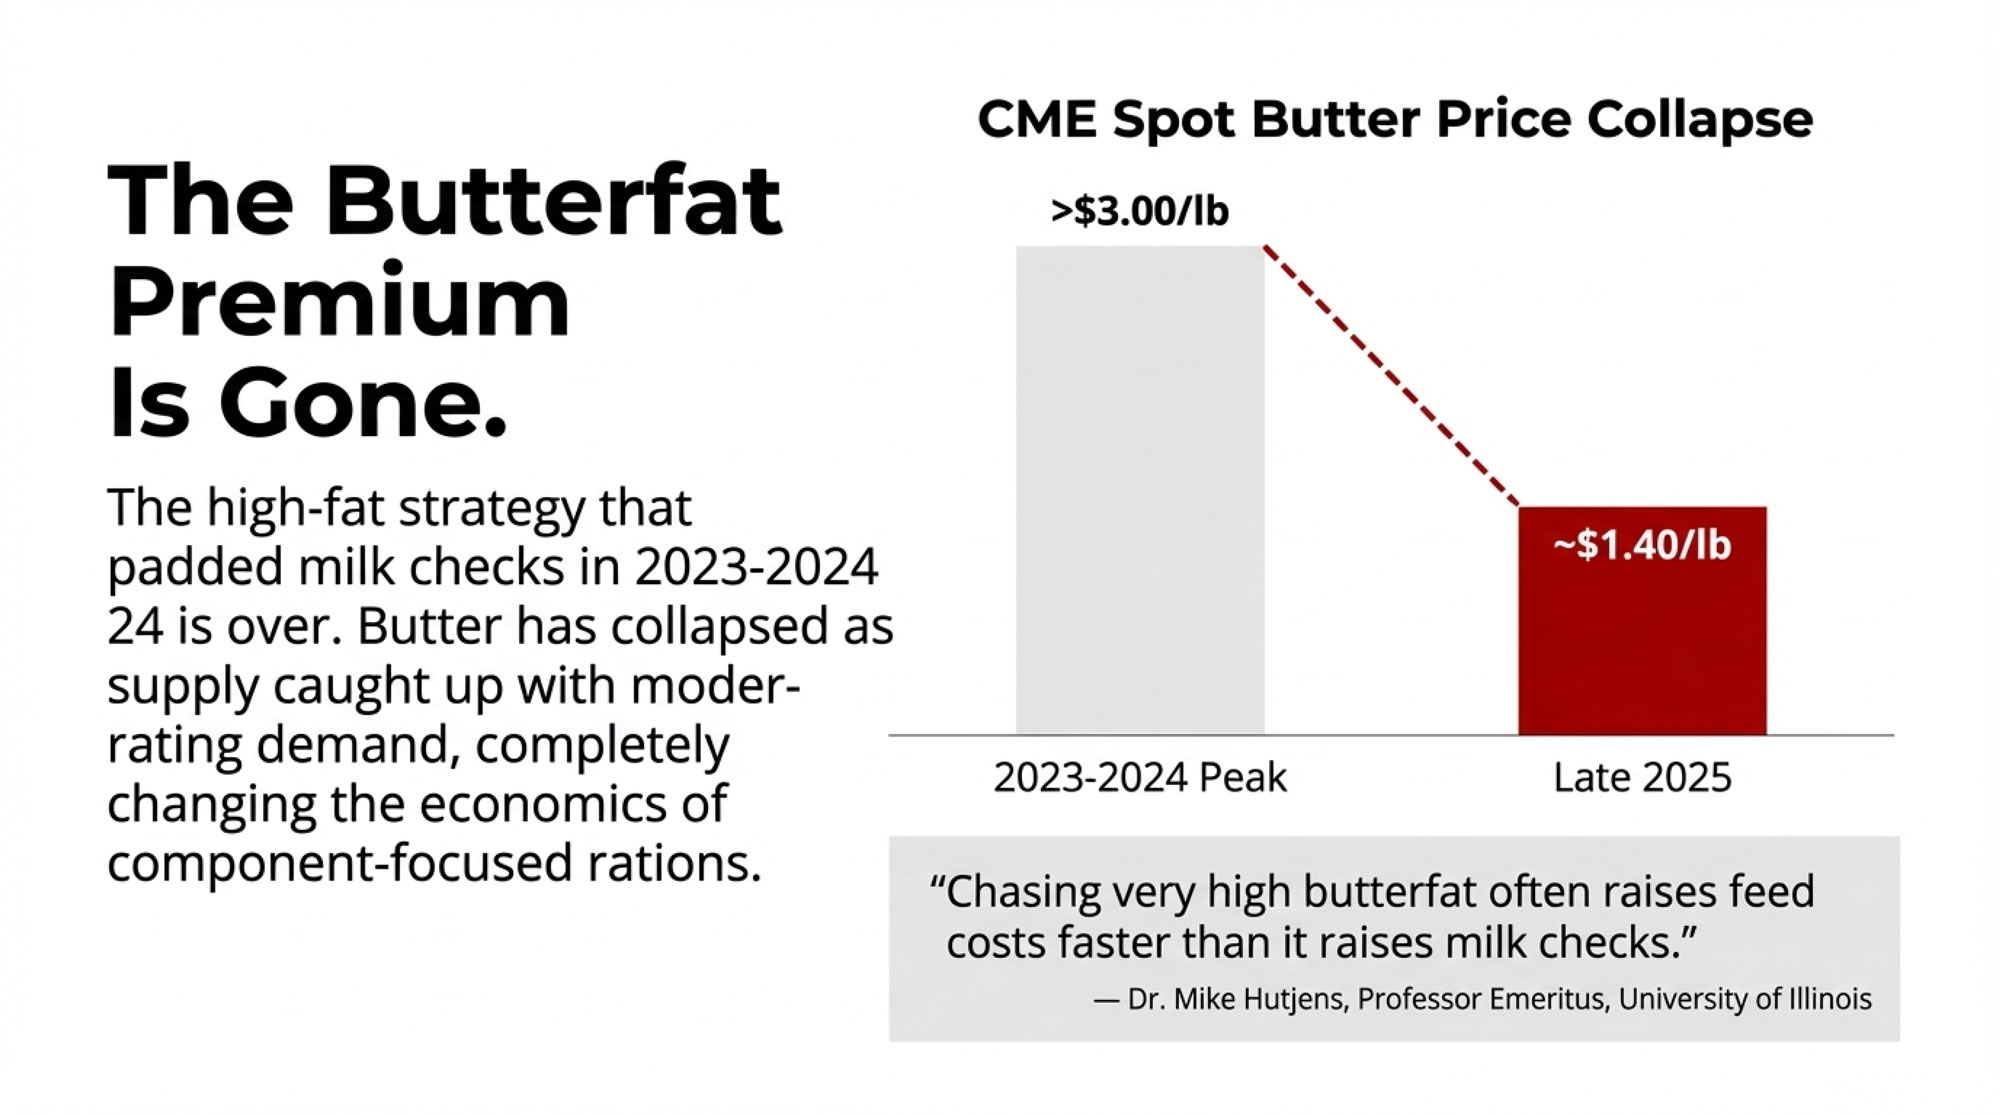
Butterfat values have come down significantly from their recent peaks. CME spot butter prices, which topped $3.00 per pound at various points in 2023-2024, have declined through 2025. By August, prices had dropped to around $2.18 per pound according to market tracking. September brought a new year-to-date low of around $2.01.

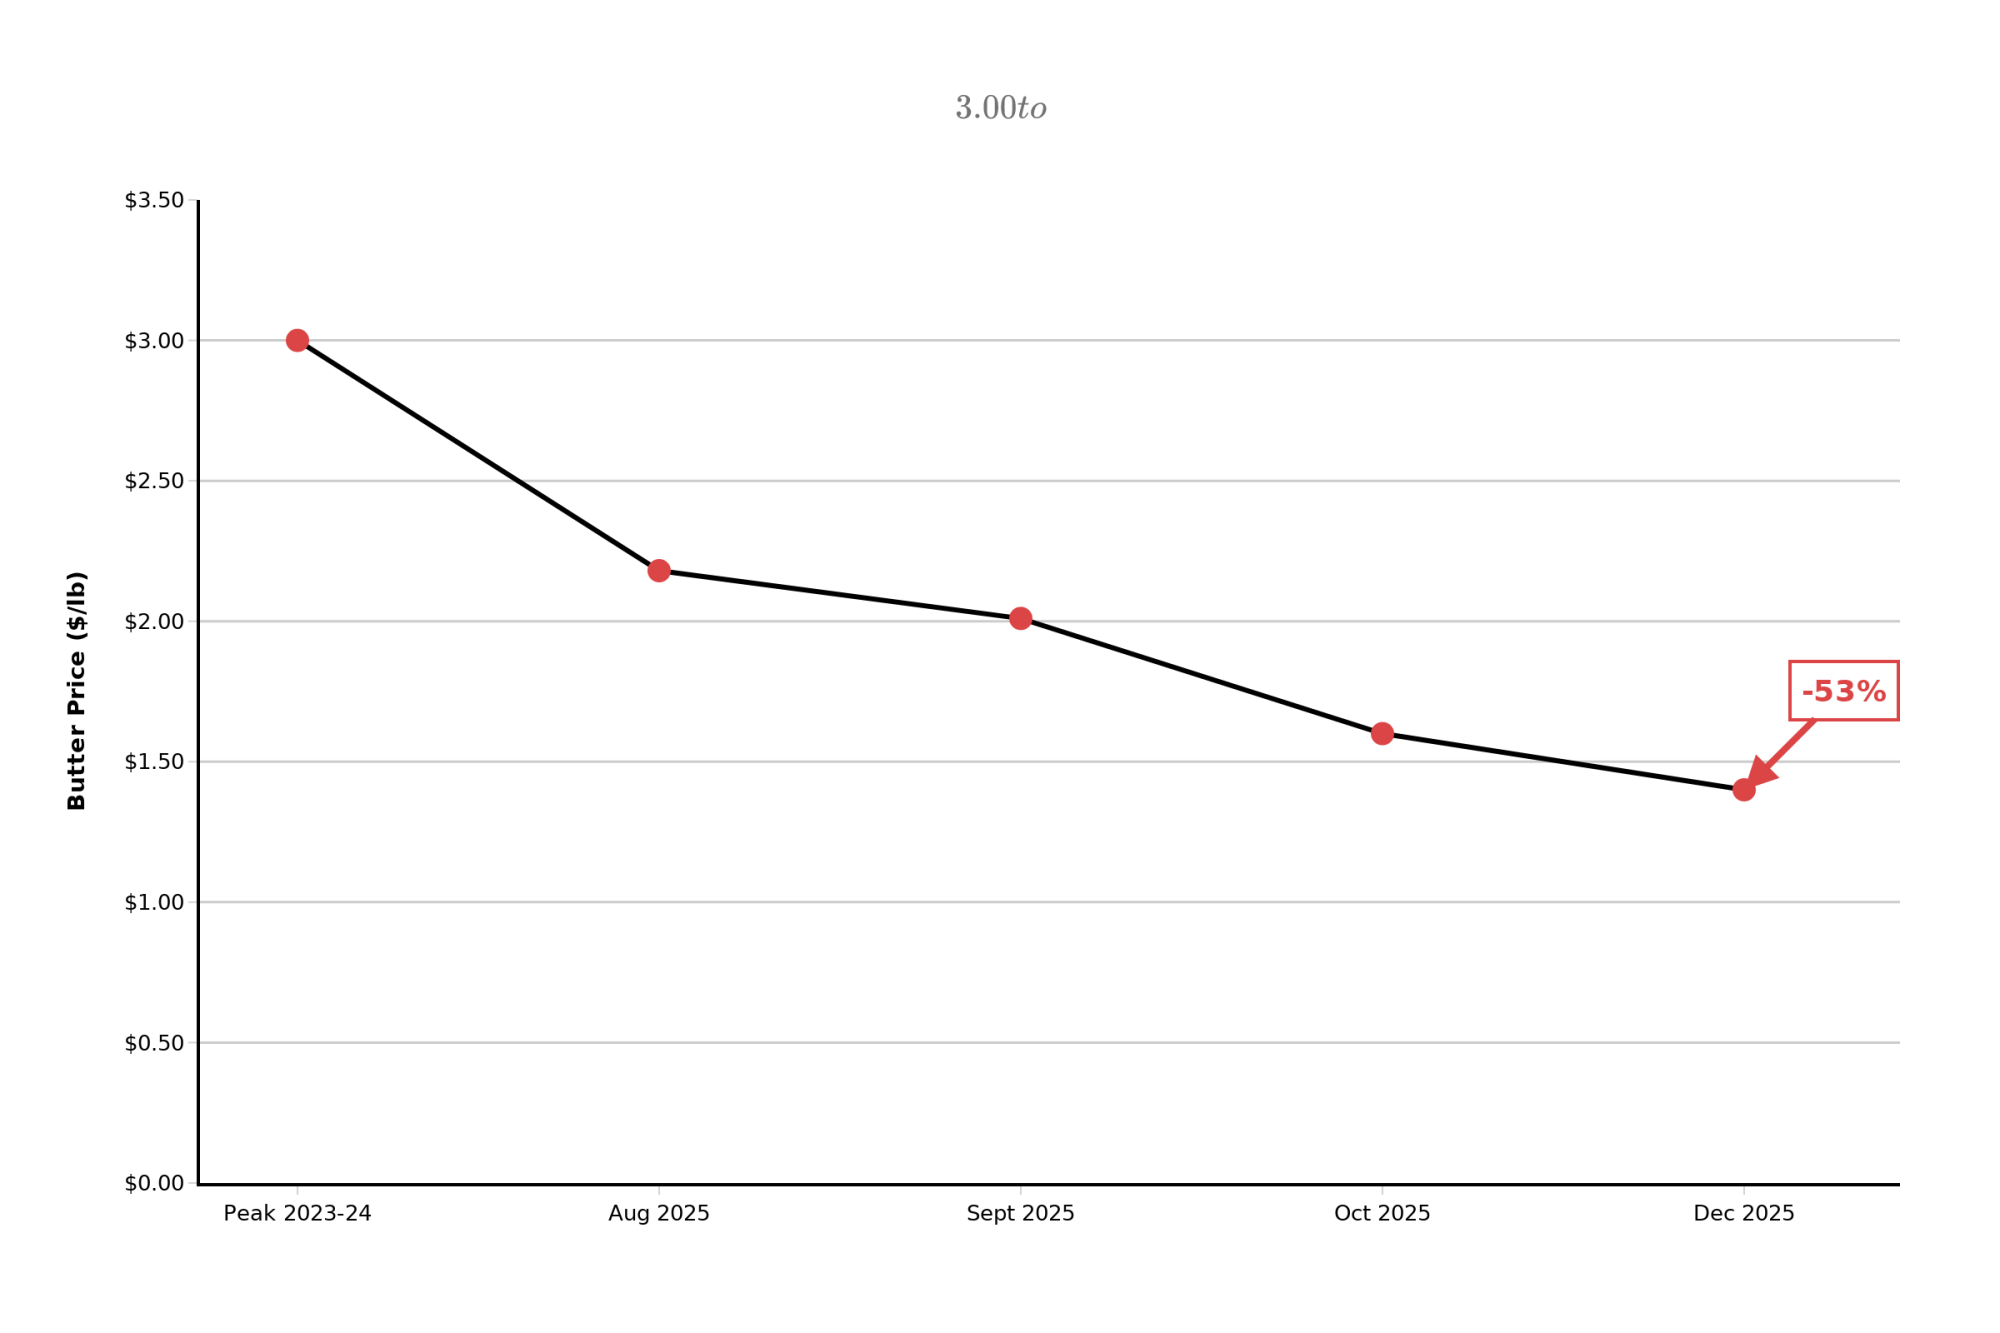
And by October, butter had fallen to $1.60 per pound. As of late December, we’re looking at butter trading in the $1.40 range—a meaningful change in butterfat economics that affects the math for many feeding strategies.

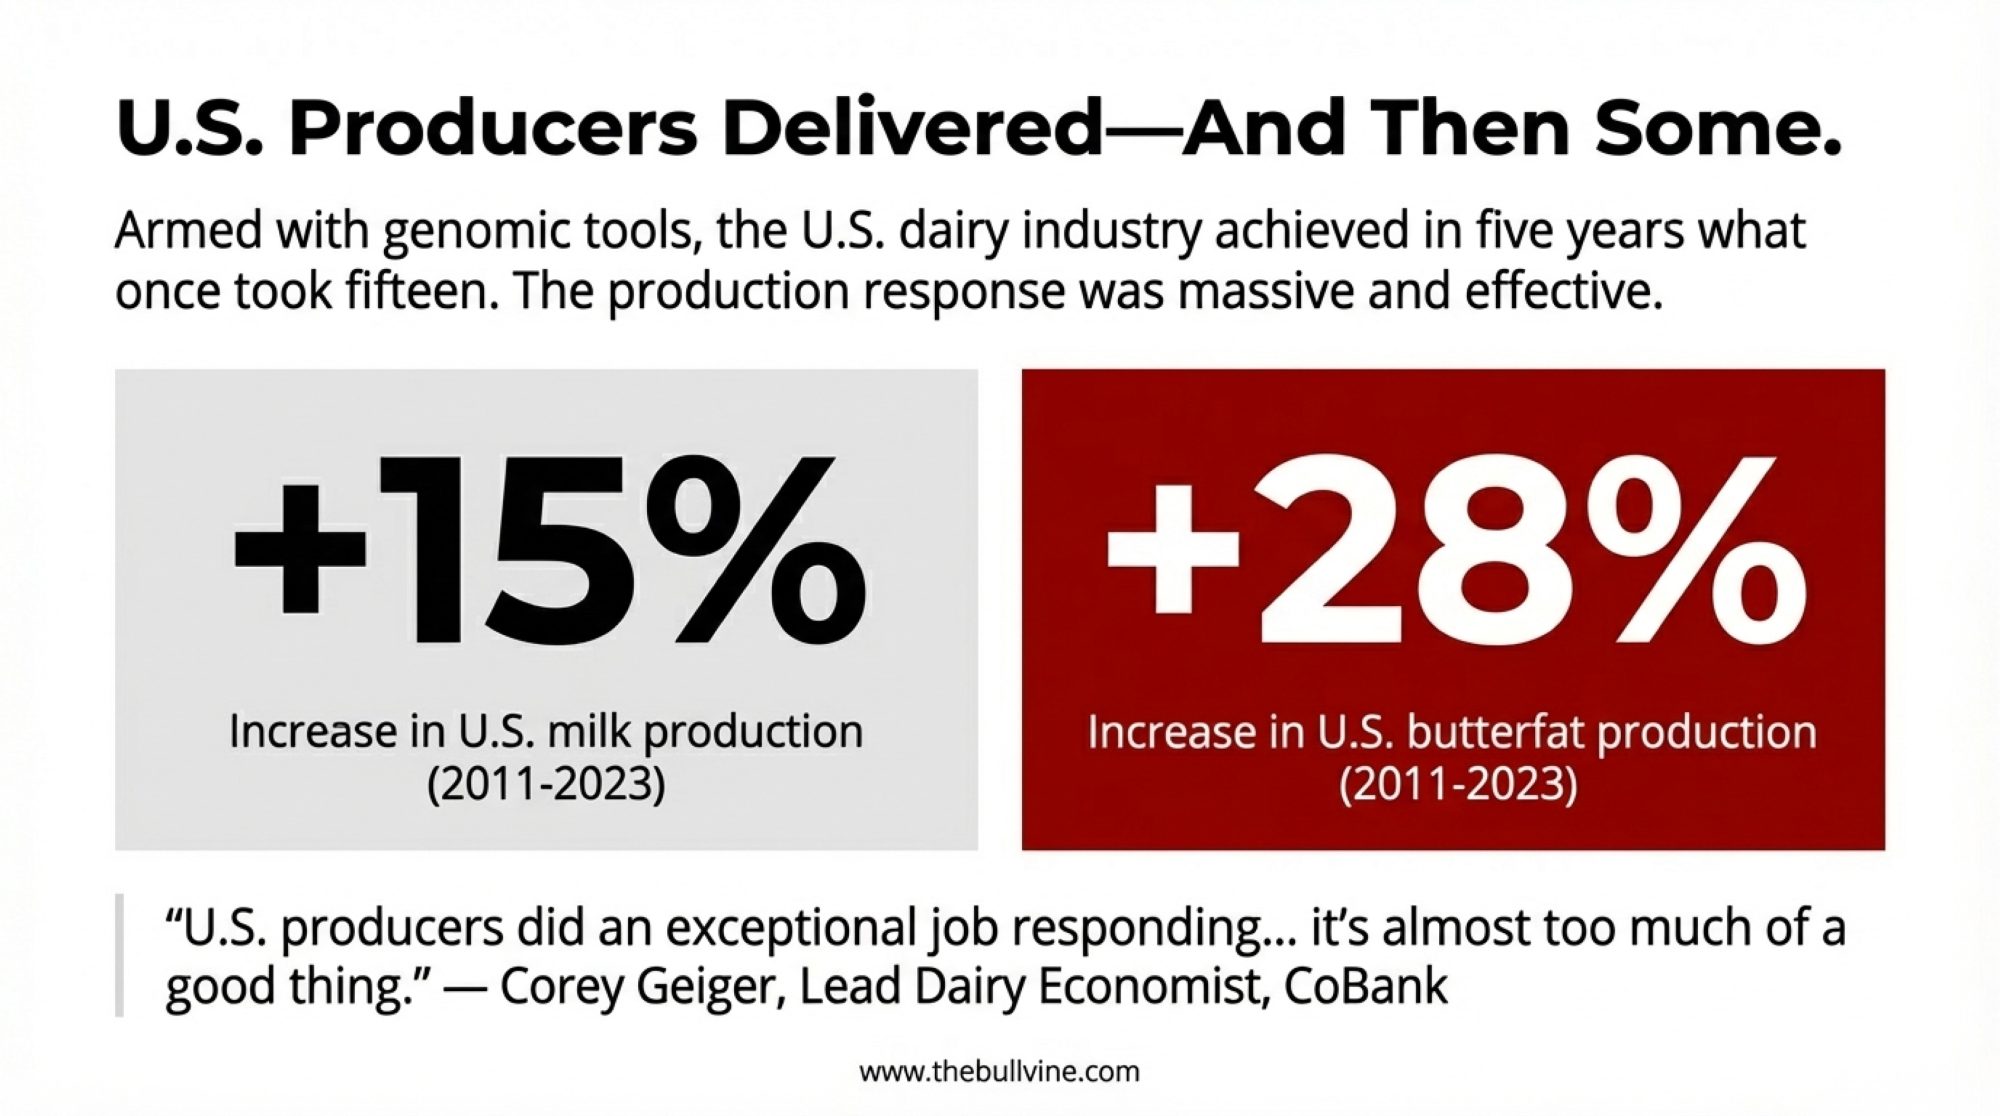
What’s driving this? A combination of factors. Farmers responded to high premiums by selecting for higher-fat genetics and adjusting rations—exactly what economic incentives encourage. At the same time, retail demand for butter and full-fat products has moderated somewhat. Supply caught up with demand, and premiums softened accordingly.

As Dr. Mike Hutjens, Professor Emeritus of Animal Sciences at the University of Illinois, has emphasized in his extension work over the years, chasing very high butterfat often raises feed costs faster than it raises milk checks. Many herds find better margins around moderate butterfat—say, 3.8 to 4.0 percent—with solid protein performance, rather than pushing fat above 4.2 percent and paying for the extra inputs.

That guidance feels particularly relevant given where butter is now.

Of course, every operation is different. Farms with cost-effective access to high-fat supplements may still find the economics work. The key is running the numbers for your specific situation rather than assuming what worked in 2023 still pencils out today.

It’s also worth noting that Federal Milk Marketing Order modernization proposals released by USDA in late 2024 are expected to adjust how components are valued over time. How butterfat and protein strategies pay going forward may look quite different than what we’ve seen in the past few years.

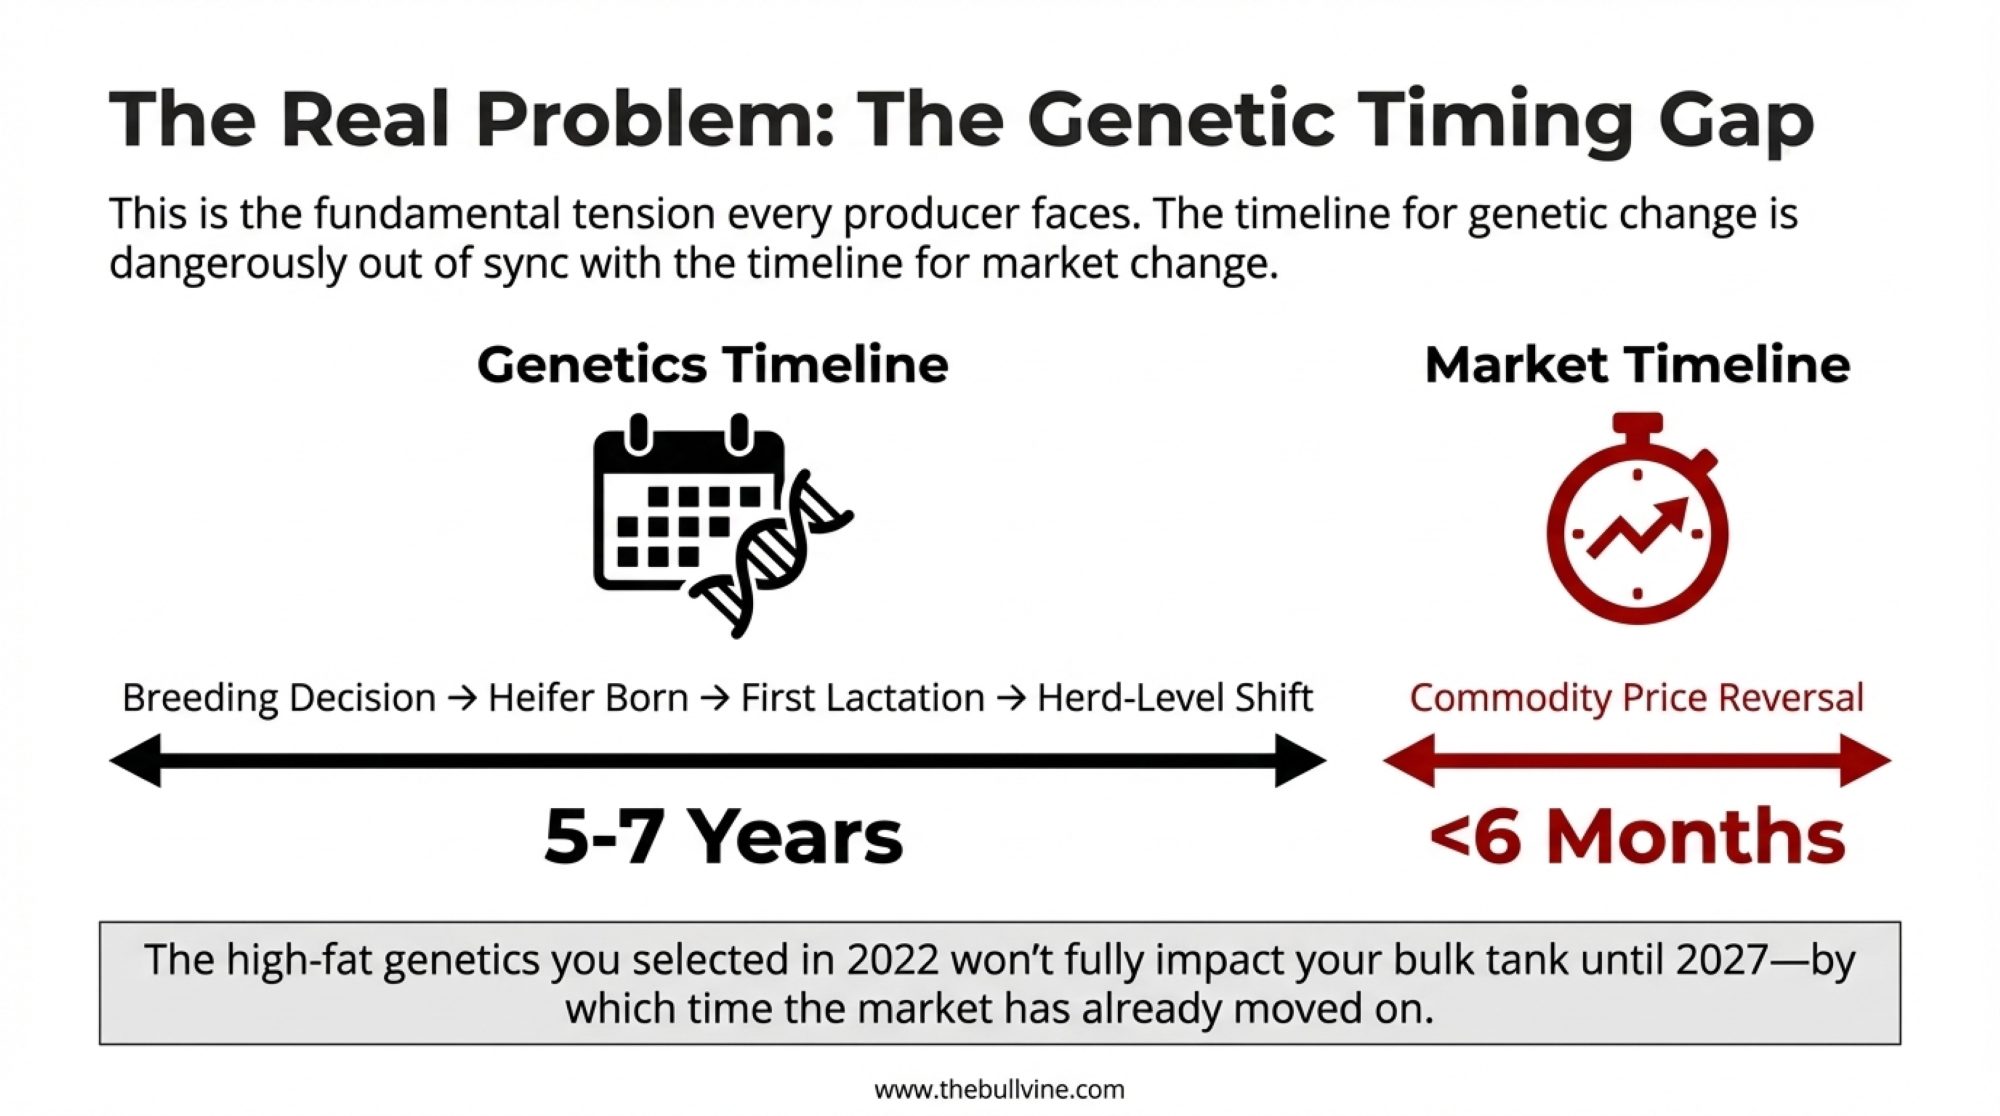
The Genetic Revolution That’s Rewriting Replacement Math

Let’s be direct about something: What’s happening with replacement heifers isn’t just a market trend or a temporary shortage. It’s a genetic revolution that has fundamentally altered how dairy farmers must think about herd replacement—and most operations haven’t yet fully grasped the implications.

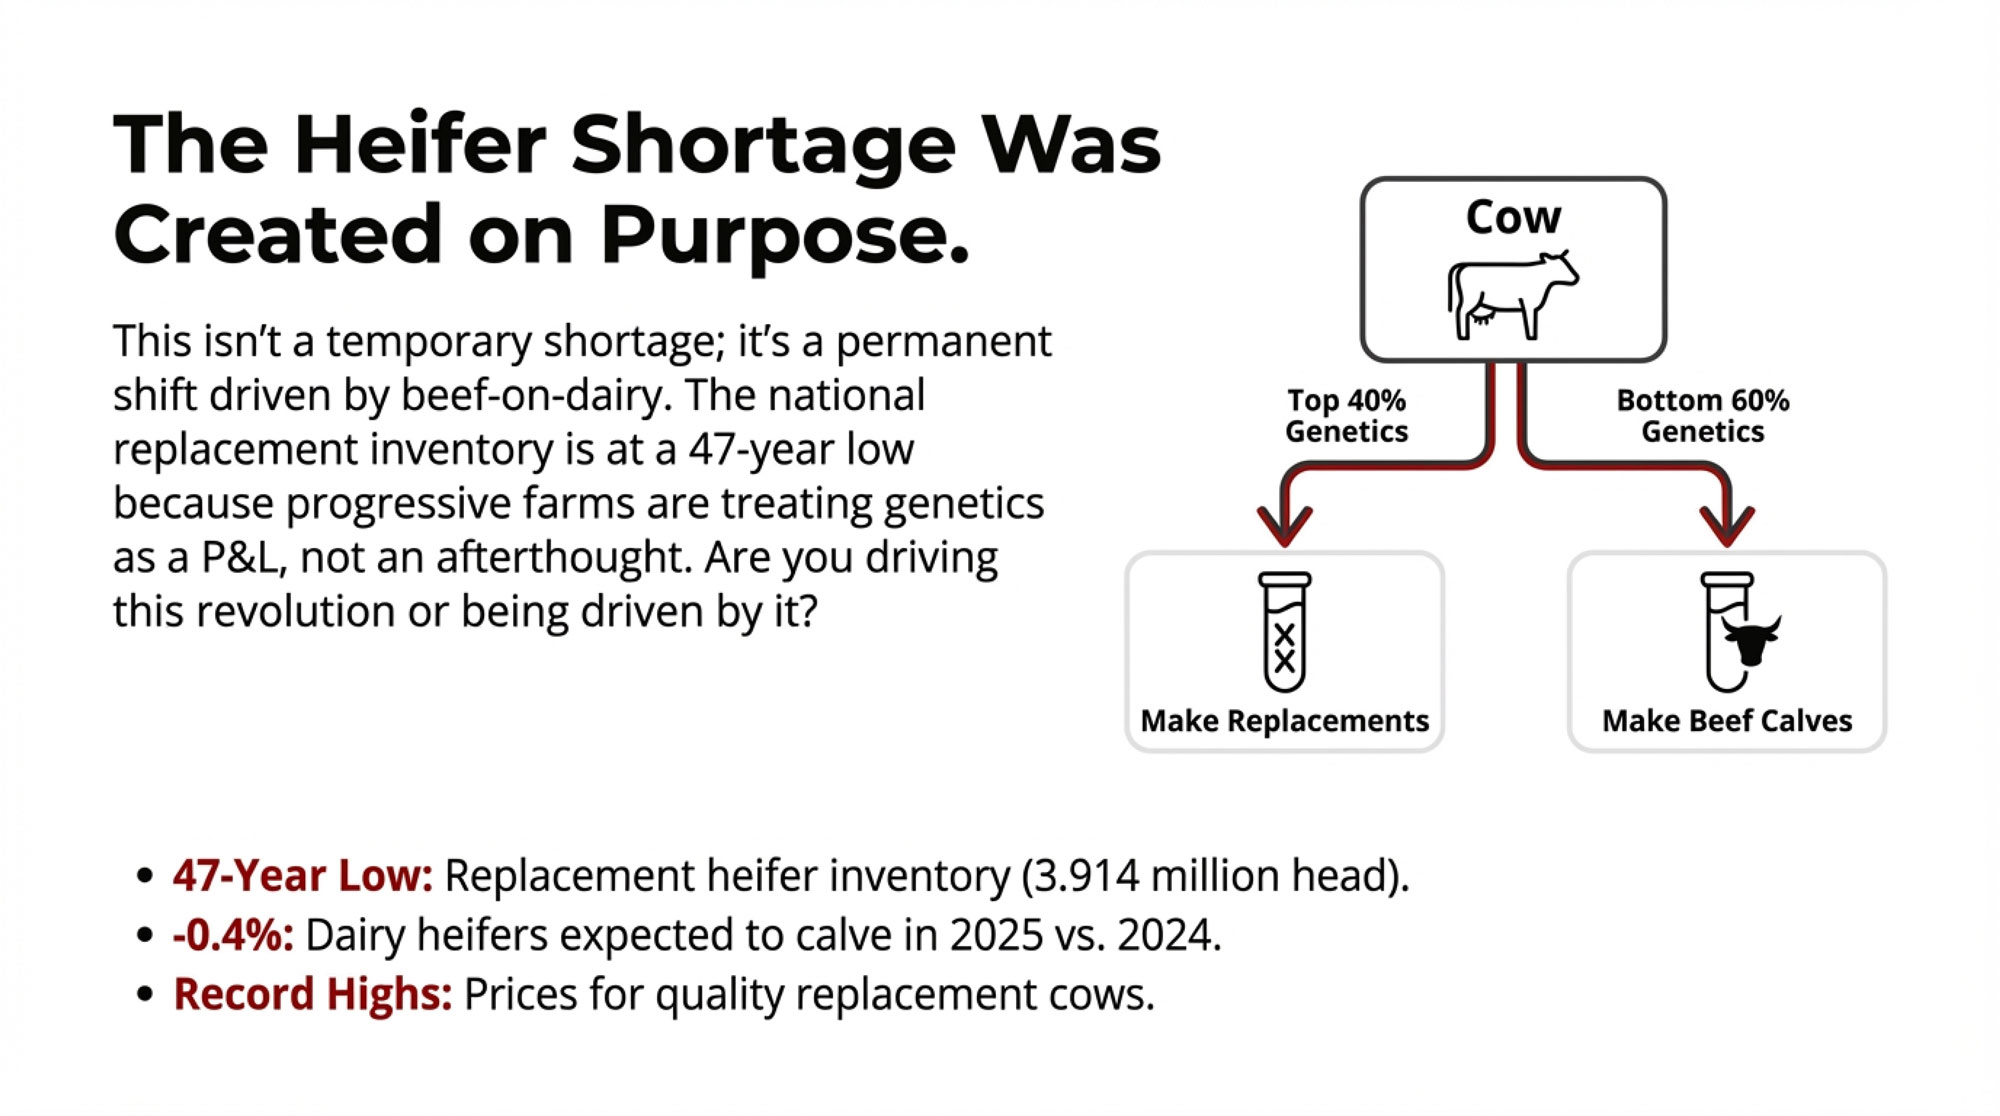
USDA’s January 1, 2025, Cattle Inventory report shows 3.914 million dairy heifers 500 pounds and over. That’s the smallest number since 1978, as Dairy Reporter and multiple other outlets have noted. We’re at a 47-year low for replacement inventory.

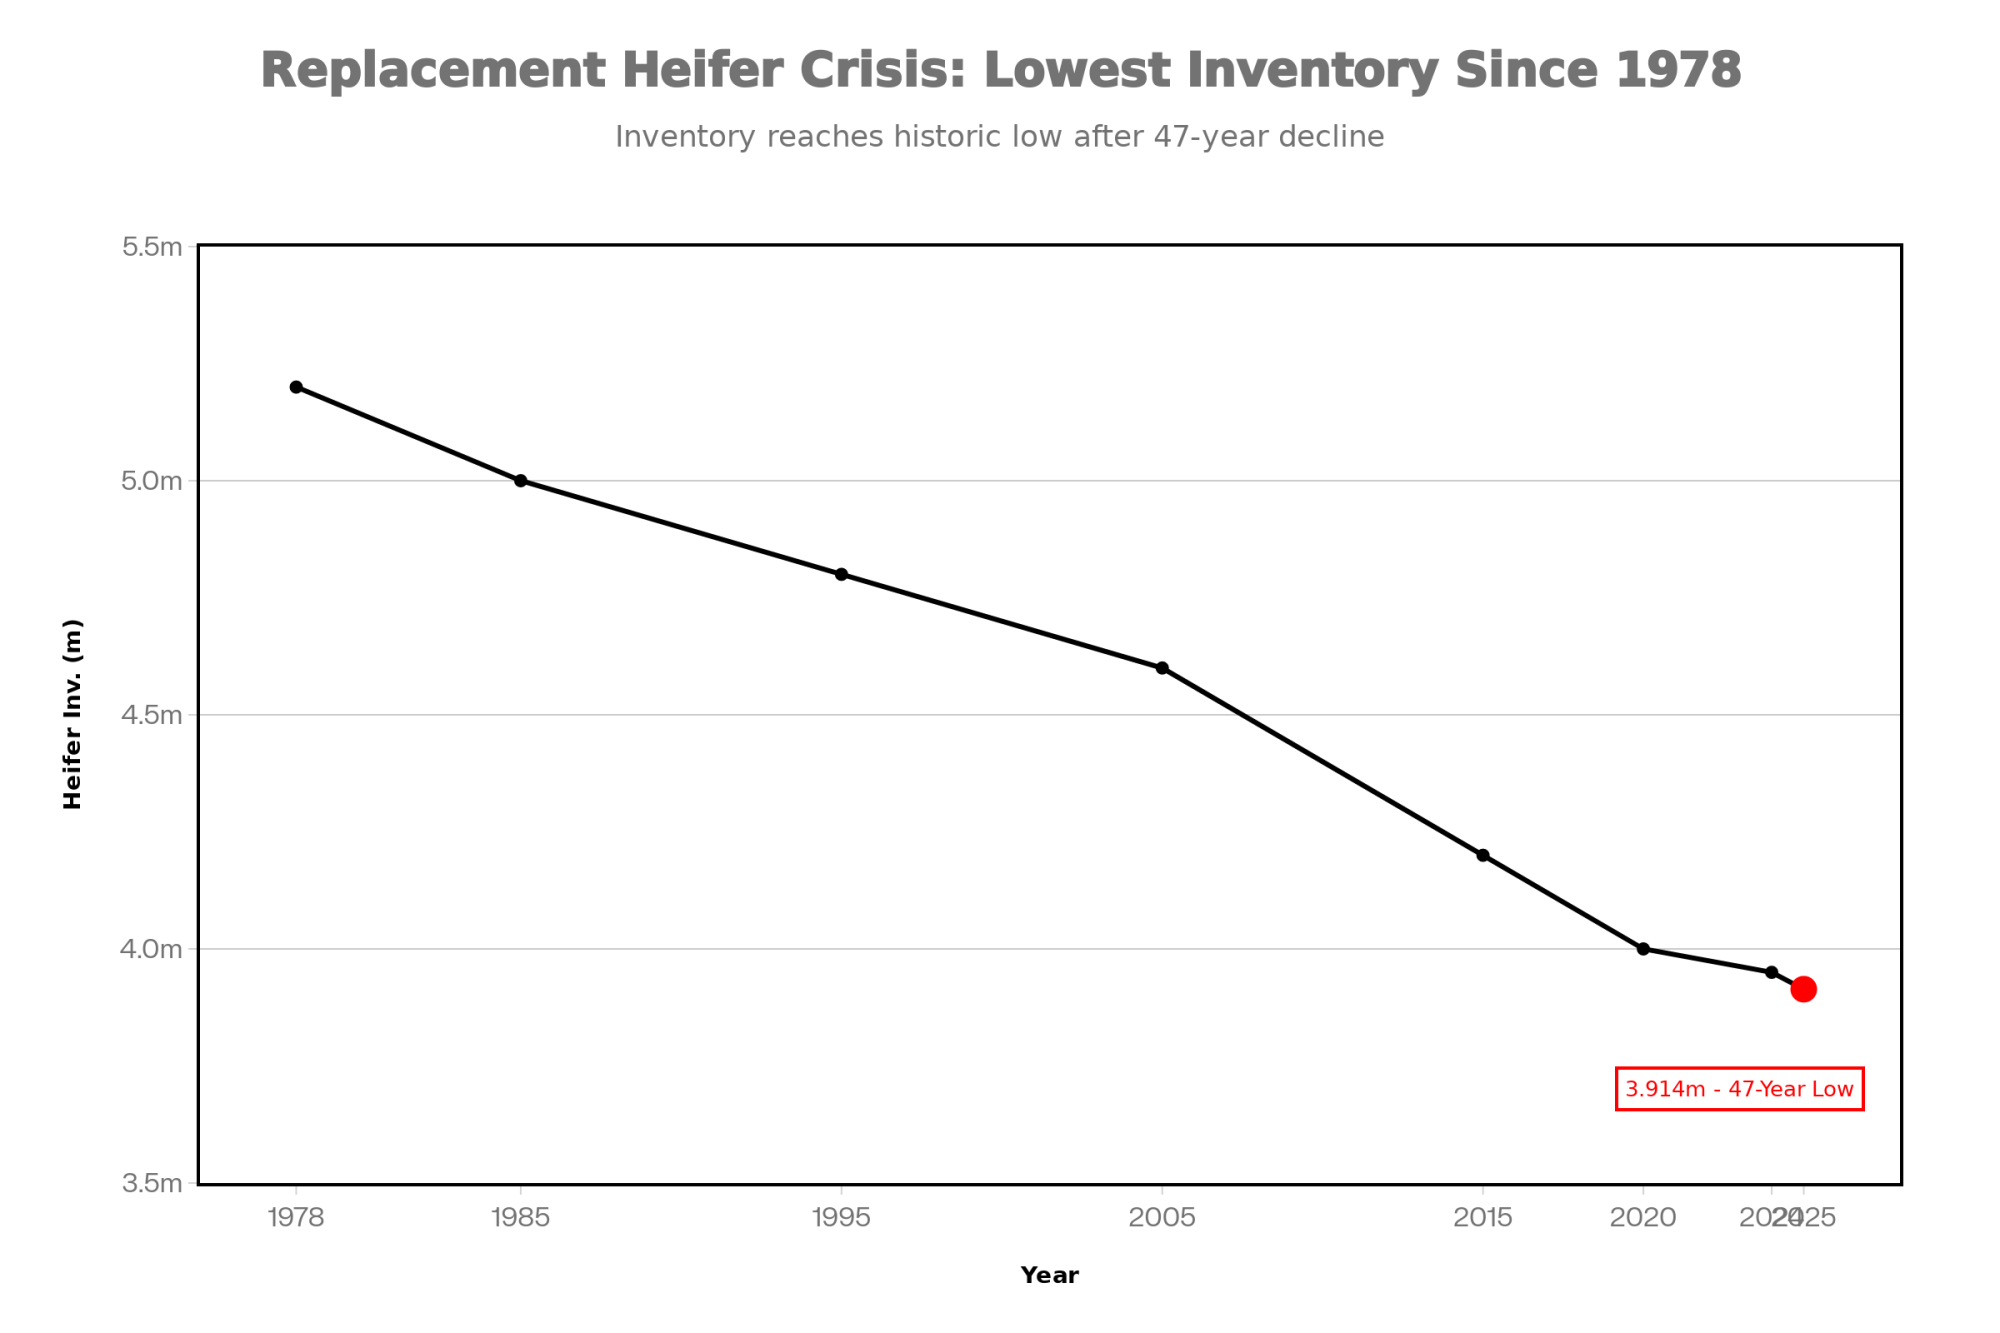
The data from USDA and HighGround Dairy shows just 2.5 million dairy heifers expected to calve in 2025—the lowest level since that dataset began in 2001. That’s a drop of 0.4 percent compared to 2024, and industry analysts suggest tight replacement numbers will keep heifer availability constrained for several years.

Here’s what makes this different from previous heifer shortages: this one was deliberately created through breeding decisions.

The beef-on-dairy movement isn’t some accident of market forces—it represents a fundamental shift in how progressive dairy operations view their genetic programs. Every breeding decision is now a strategic choice about whether you’re in the business of making milk, making beef, or both.

The old mental model—breed everything dairy, cull what doesn’t work—is obsolete. The new reality requires treating your replacement pipeline as a distinct enterprise with its own P&L, not an afterthought of your breeding program.

The economic forces driving this shift were compelling. When beef calves were bringing $750 more than they had been two years prior, concentrating dairy genetics on your best animals while capturing beef premiums on the rest made perfect sense. USDA and industry commentary explicitly connect lower replacement inventories to increased use of beef semen on dairy cows.

But here’s what the numbers don’t always show: The farms that executed this strategy well didn’t just chase beef premiums—they simultaneously intensified their genetic selection on the dairy side. They used genomic testing to identify the top 30-40% of females, bred them aggressively with sexed dairy semen, and captured beef value on the rest.

The April 2025 CDCB genetic base change—moving the reference population from cows born in 2015 to cows born in 2020, with updated Net Merit formula weights—gives producers better tools for these decisions. The December 2025 evaluation updates added further refinements to health and type trait data, according to CDCB. Farms making breeding decisions without current genomic information are essentially flying blind in this new environment.

The farms that got caught were the ones who saw beef-on-dairy as a revenue grab rather than a genetic strategy. They reduced dairy breedings without upgrading the genetic intensity of the ones they kept.

Consider a scenario many Midwest operations have navigated: A 600-cow Wisconsin dairy that shifted from 70 percent gender-sorted dairy semen to 40 percent in 2024 might have captured an additional $300,000 in beef calf revenue that year. But that same operation now faces needing 75-100 more replacement heifers than their breeding program will produce—a gap that requires careful planning to address at current prices.

The gain was immediate and visible. The cost is delayed and often larger.

“We got caught up in the beef premium along with everyone else,” one 700-cow operator in central Wisconsin told me. He asked to stay anonymous, which is understandable. “The checks were great in 2024. Now I’m looking at replacement costs that eat into those gains significantly. Looking back, I might have maintained a higher percentage of dairy breedings. But the economics at the time pointed toward beef.”

Recent reports show that U.S. replacement dairy cow prices are reaching record highs in late 2025, with many quality cows and bred heifers trading well above earlier levels of $2,000-$2,200. At those prices, buying your way out of a heifer deficit isn’t just expensive—it may not be possible at scale.

The strategic question every operation needs to answer: What percentage of your herd represents your genetic future, and are you breeding them accordingly?

The good news is that farmers are recalibrating. The National Association of Animal Breeders reports gender-sorted dairy semen sales grew by 1.5 million units in 2024—a 17.9 percent growth rate in just one year—as producers adjust their programs.

The farms that will thrive in this new environment aren’t abandoning beef-on-dairy—they’re getting smarter about it. They’re using genomics to make precise decisions about which animals deserve dairy genetics and which should produce beef calves. They’re treating replacement inventory as a strategic asset, not a byproduct.

This is the genetic revolution in action. The question is whether you’re driving it or being driven by it.

The Power Shift to Those Who Own the Stainless Steel

Let’s talk plainly about something the industry doesn’t always acknowledge directly: The power dynamic between dairy farmers and processors has fundamentally shifted. The leverage now belongs to those who own the stainless steel.

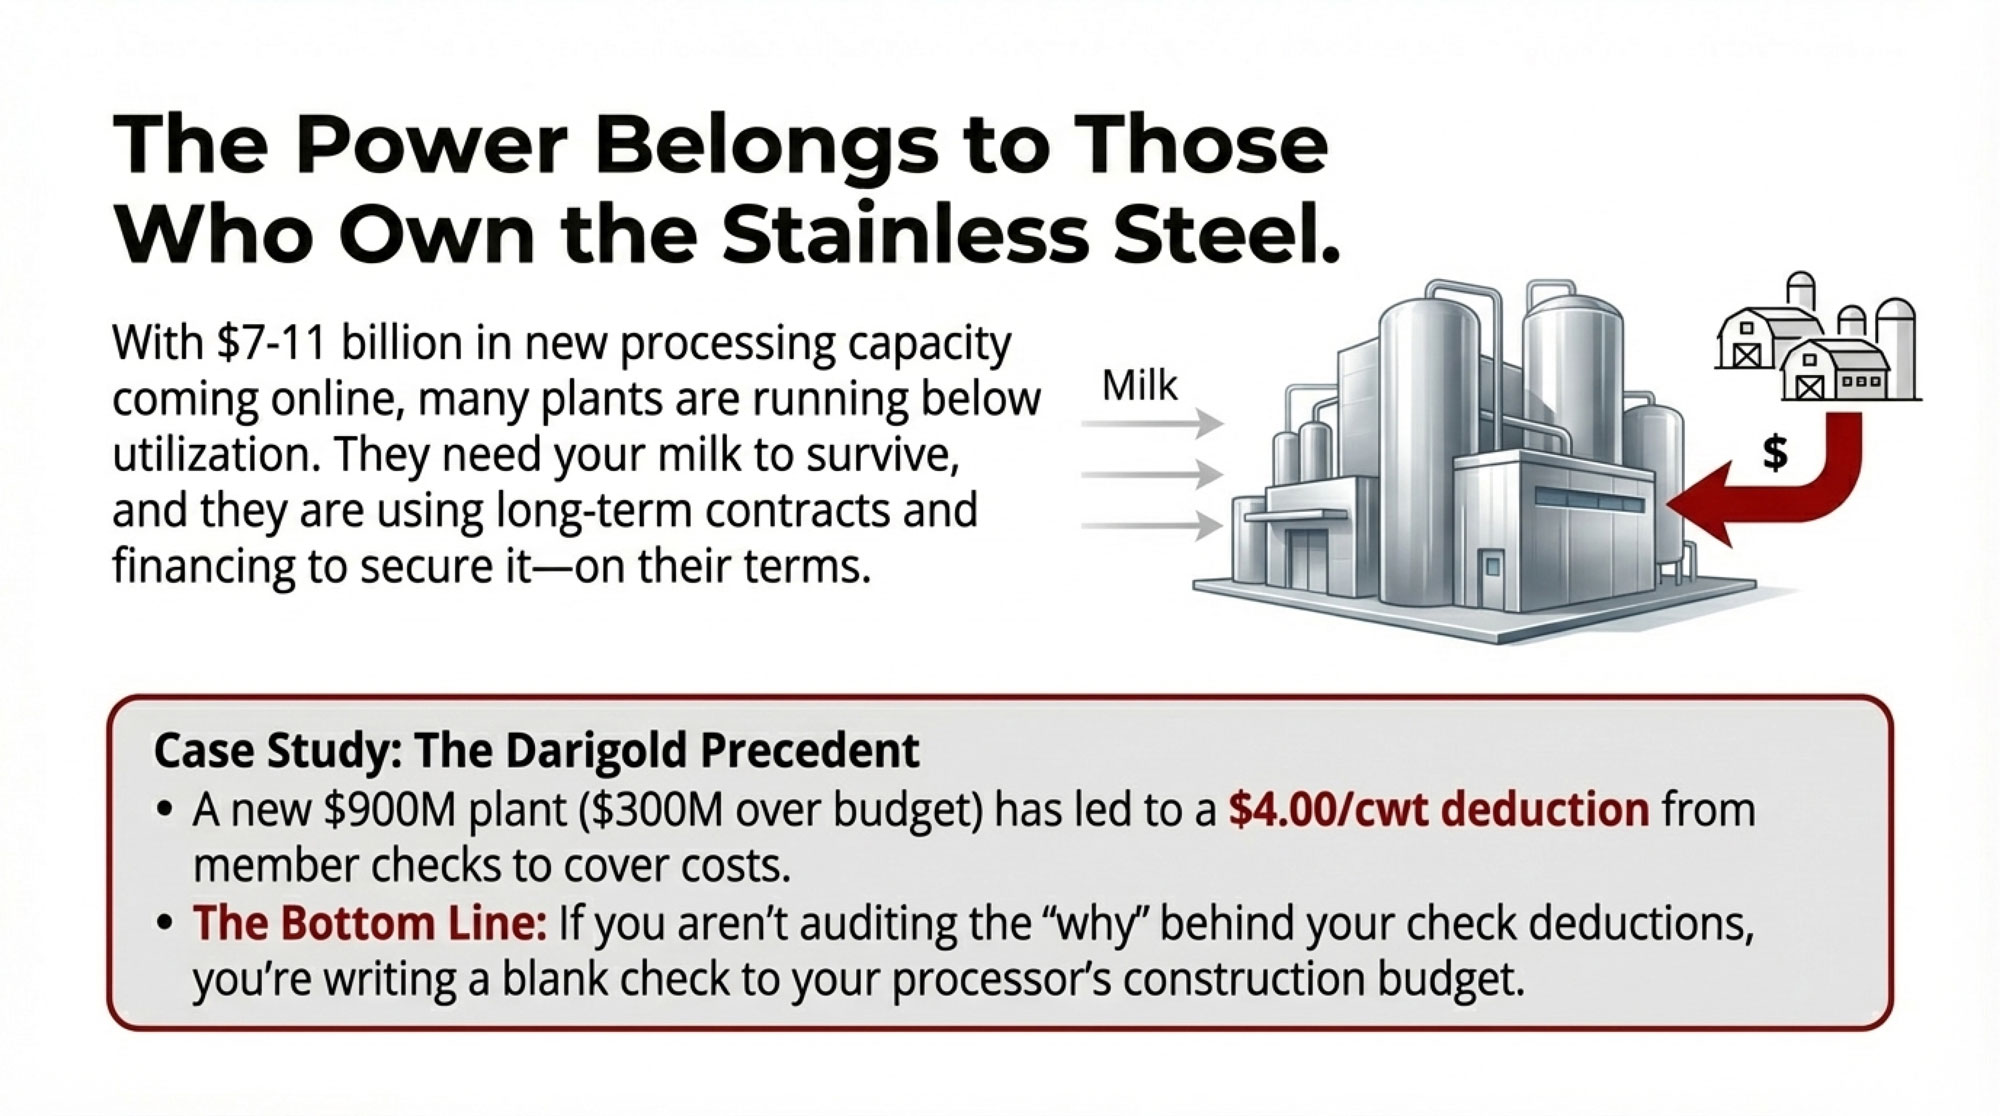
Significant processing capacity has come online over the past several years. Industry reports from Cheese Reporter, CoBank, and others tally multi-billion-dollar investments in new cheese, butter, and specialty dairy plants in the U.S.—with estimates ranging from $7 billion to $11 billion in committed or recent capacity additions, depending on the source and timeframe.

Major projects from Hilmar, Bel Brands, Leprino, and others were predicated on expectations of continued milk supply growth and strong export demand. These processors made massive bets on dairy’s future—and now they need milk to justify those investments.

Here’s where it gets uncomfortable: Analysts and trade publications report that several recently commissioned cheese and powder plants are running below their designed capacity.

That creates enormous pressure for processors carrying major capital investments. And that pressure flows directly to farmers in the form of supply commitments, pricing structures, and partnership terms that increasingly favor the processor’s position.

Run the numbers from their side. A $500 million cheese plant sitting at 70 percent utilization is bleeding money. The incentive to lock up milk supply through multi-year agreements, financing arrangements, and expansion partnerships isn’t altruism—it’s survival.

The Darigold situation in the Pacific Northwest illustrates this dynamic clearly. Local reports indicate their new Pasco, Washington plant has seen its price tag rise from initial estimates of $600 million to over $900 million—approximately $300 million over budget. As a result, the cooperative has implemented a $4 deduction per hundredweight from member milk checks, with $2.50 allocated explicitly to construction costs.

Even in a cooperative structure—where farmers theoretically own the processing—the capital requirements of modern dairy manufacturing mean producers are effectively captive to infrastructure decisions made on their behalf. For a farm shipping 5 million pounds monthly, that $4 deduction represents $200,000 annually coming out of your check. Whether you are in a co-op or independent, if you aren’t auditing the ‘why’ behind your check deductions in 2026, you’re essentially writing a blank check to your processor’s construction budget.

When processors offer financing for heifer purchases, equipment upgrades, or expansion projects in exchange for multi-year milk supply commitments, understand what’s really happening: They’re converting your flexibility into their supply security. That’s not necessarily bad—capital access and price stability have genuine value—but you need to recognize the trade.

Economists like Mark Stephenson, Director of Dairy Policy Analysis at the University of Wisconsin-Madison, have observed that processors who invested billions in new capacity now face utilization challenges.

When evaluating these arrangements, consider them with clear eyes:

  • Who benefits more from the locked-in supply? In a rising market, fixed pricing hurts you. In a falling market, it helps. But the processor gets supply certainty regardless.
  • What are the exit provisions? If your situation changes, what does it cost to get out?
  • Are you financing their utilization problem? Expansion commitments that serve processor capacity needs may or may not align with your operation’s optimal scale.
  • What’s the opportunity cost of reduced flexibility? Five-year agreements made in 2025 lock you into a world that might look very different by 2028.

None of this means you shouldn’t engage with processors or consider partnership structures. It means you should engage as a businessperson who understands that the party with the capital makes the rules. Get independent financial advice. Model the downside scenarios. Understand what you’re giving up, not just what you’re getting.

The Export Picture: Opportunity and Uncertainty

Exports have absorbed substantial U.S. dairy production in recent years, with 2024 reaching $8.2 billion—the second-highest export value ever, according to USDEC and IDFA reporting. Understanding the current export environment helps put domestic market dynamics in context.

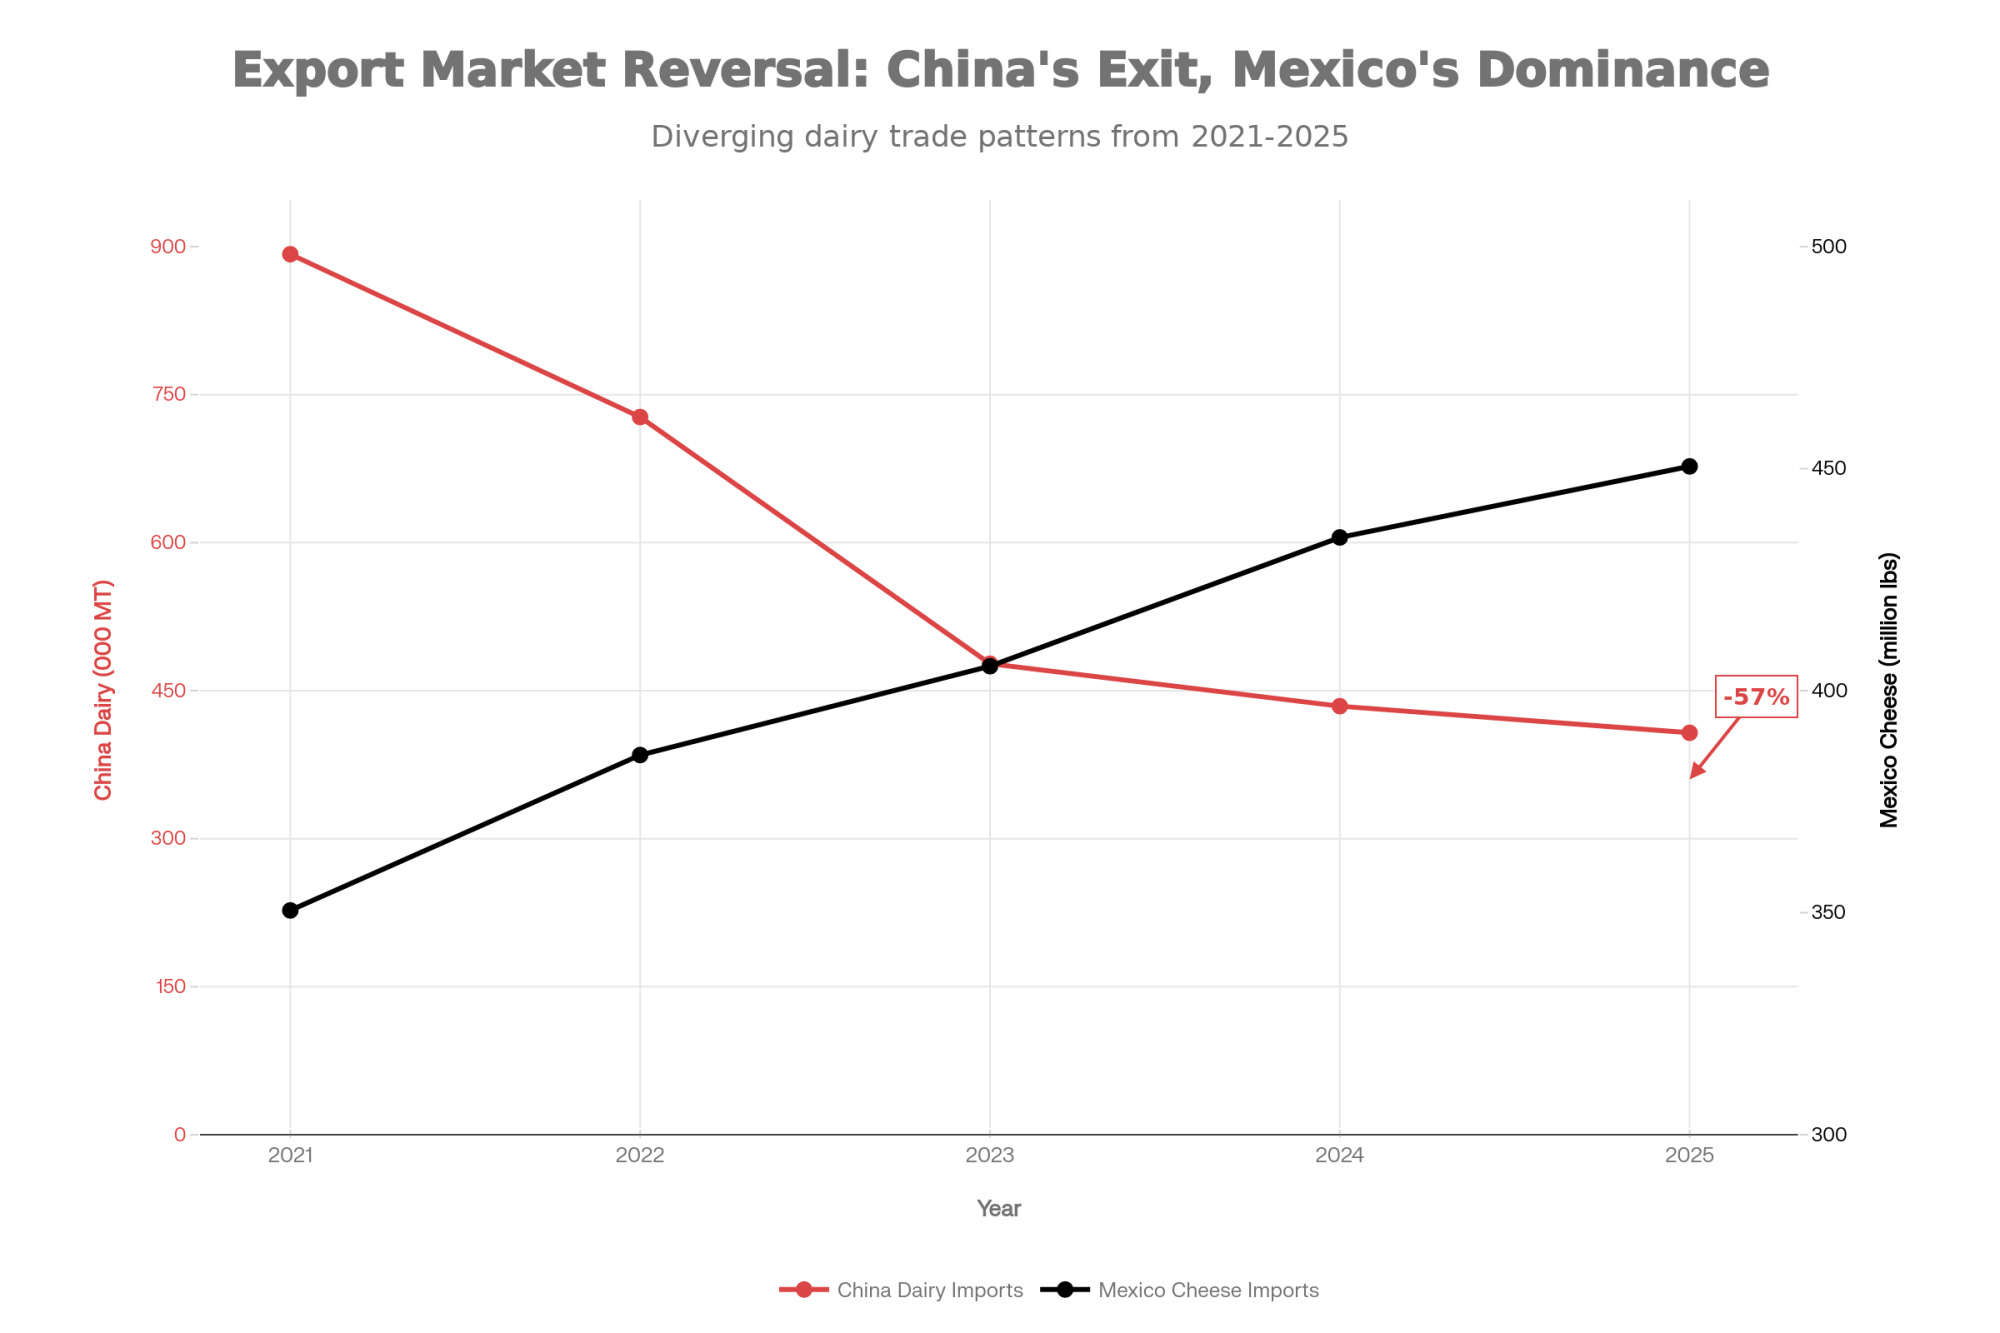
Mexico remains the dominant destination—and deserves close attention. USDA Foreign Agricultural Service data and USDEC reporting show Mexico accounts for more than a third of all U.S. cheese export volume—by far the largest single destination. Mexico purchased 37 percent of all U.S. cheese sold to international customers through September 2024, and Cheese Reporter confirms 424 million pounds of cheese were exported to Mexico in 2024.

This concentration creates both opportunity and exposure. Mexican economic conditions—including inflation pressures and remittance flows—directly influence demand. The relationship has been remarkably durable, but it’s worth monitoring.

The China situation represents a more structural shift. USDA and Rabobank analysis show Chinese dairy imports dropping from a peak of nearly 845,000 metric tons in 2021 to about 430,000 metric tons in 2023—a decline of nearly 50 percent in just two years, as Dairy Reporter and Capital Press have documented.

USDA GAIN reports and Rabobank describe China’s strategy to boost domestic raw milk production and reduce import dependence. Chinese dairy imports were down roughly 10-14 percent in early 2024, with forecasts suggesting continued pressure.

The consensus among economists studying global dairy trade is that China deliberately increased self-sufficiency. That suggests planning for Chinese demand to return to 2021 levels may not be realistic—though trade relationships can shift in unexpected ways.

On a more positive note, other markets continue developing. Southeast Asia, the Middle East, and parts of Latin America offer growth potential. And USDEC confirms U.S. dairy export volume was up 1.7 percent through the first three quarters of 2025, indicating continued demand despite the China headwinds.

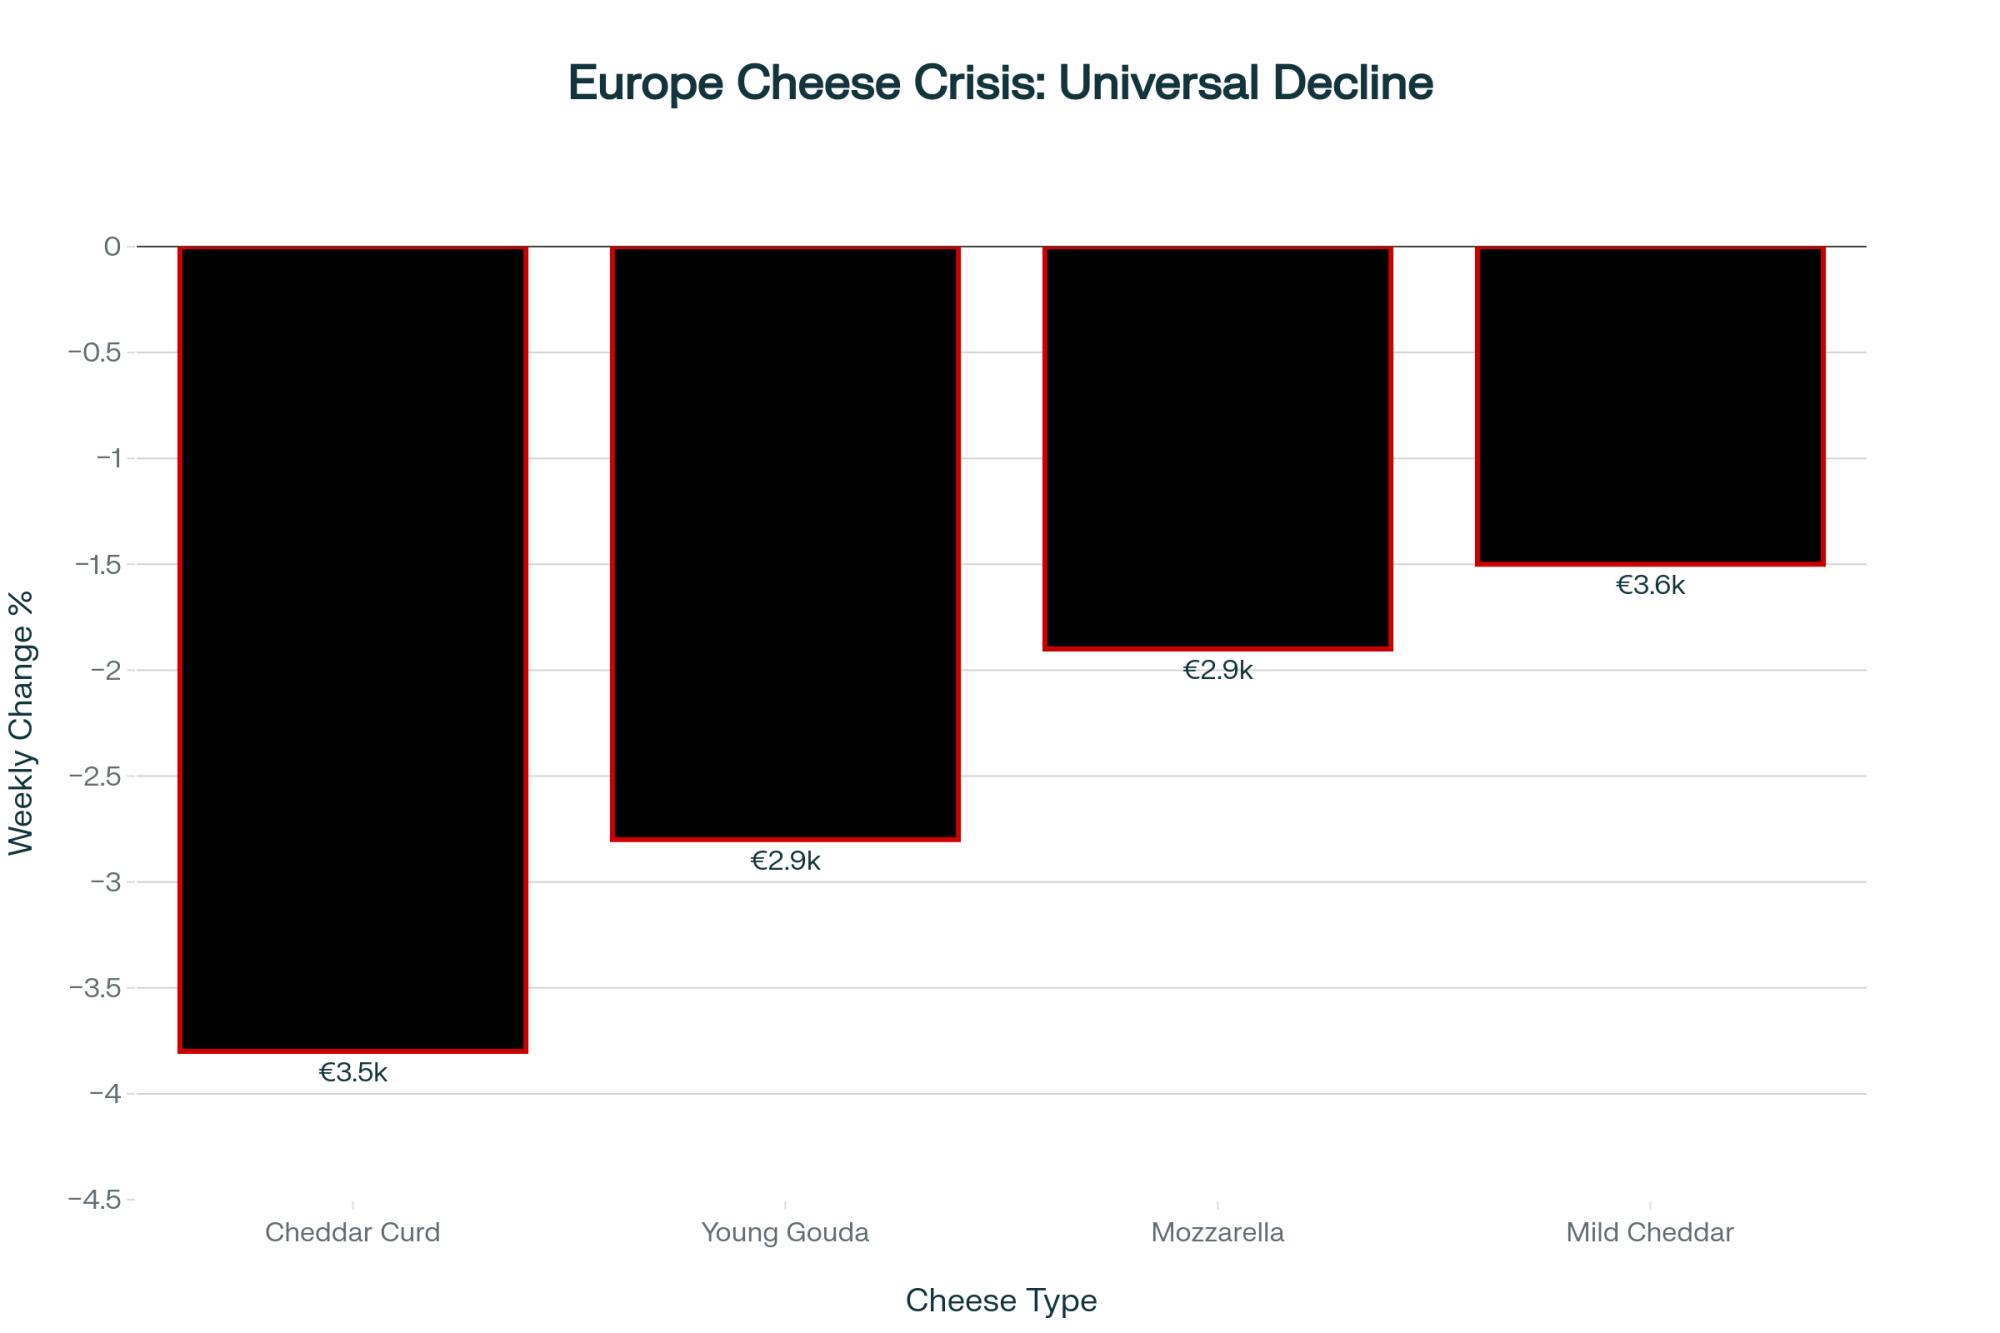
Global competition remains a factor. EU milk production is forecast to decline modestly in 2025, according to European Commission data—about 0.2 percent—as environmental regulations and cost pressures affect European producers. New Zealand, Australia, and South American producers continue competing in key markets.

Building business plans that work at realistic domestic price levels, while remaining positioned to benefit from export opportunities, seems like a prudent approach.

What Could Change This Outlook

Markets regularly surprise us, and it’s worth considering scenarios where conditions might improve faster than current projections suggest.

Weather or disease events could tighten global supply. A significant drought in New Zealand or production challenges in European herds would reduce global competition. U.S. dairy would benefit from being a reliable supplier in that environment.

China’s approach could evolve. Economic pressures, food security priorities, or trade negotiations could reopen Chinese import demand. It’s not the base case, but it’s possible.

Domestic demand could strengthen. Cheese consumption has grown modestly but consistently. A shift in consumer preferences or successful product innovation could accelerate demand. The foodservice recovery post-COVID continues developing.

Trade policy could create openings. New trade agreements or the resolution of existing disputes could improve access to markets that are currently restricted.

I wouldn’t build a business plan assuming these developments, but they’re worth monitoring. They’re also reasons for measured optimism rather than pessimism about dairy’s long-term prospects.

Practical Steps for the Months Ahead

For dairy operators assessing their position, several action areas warrant attention in the near term. These aren’t theoretical—they’re decisions with specific windows. And while the priorities may vary based on your operation’s size and situation, the core principles apply broadly.

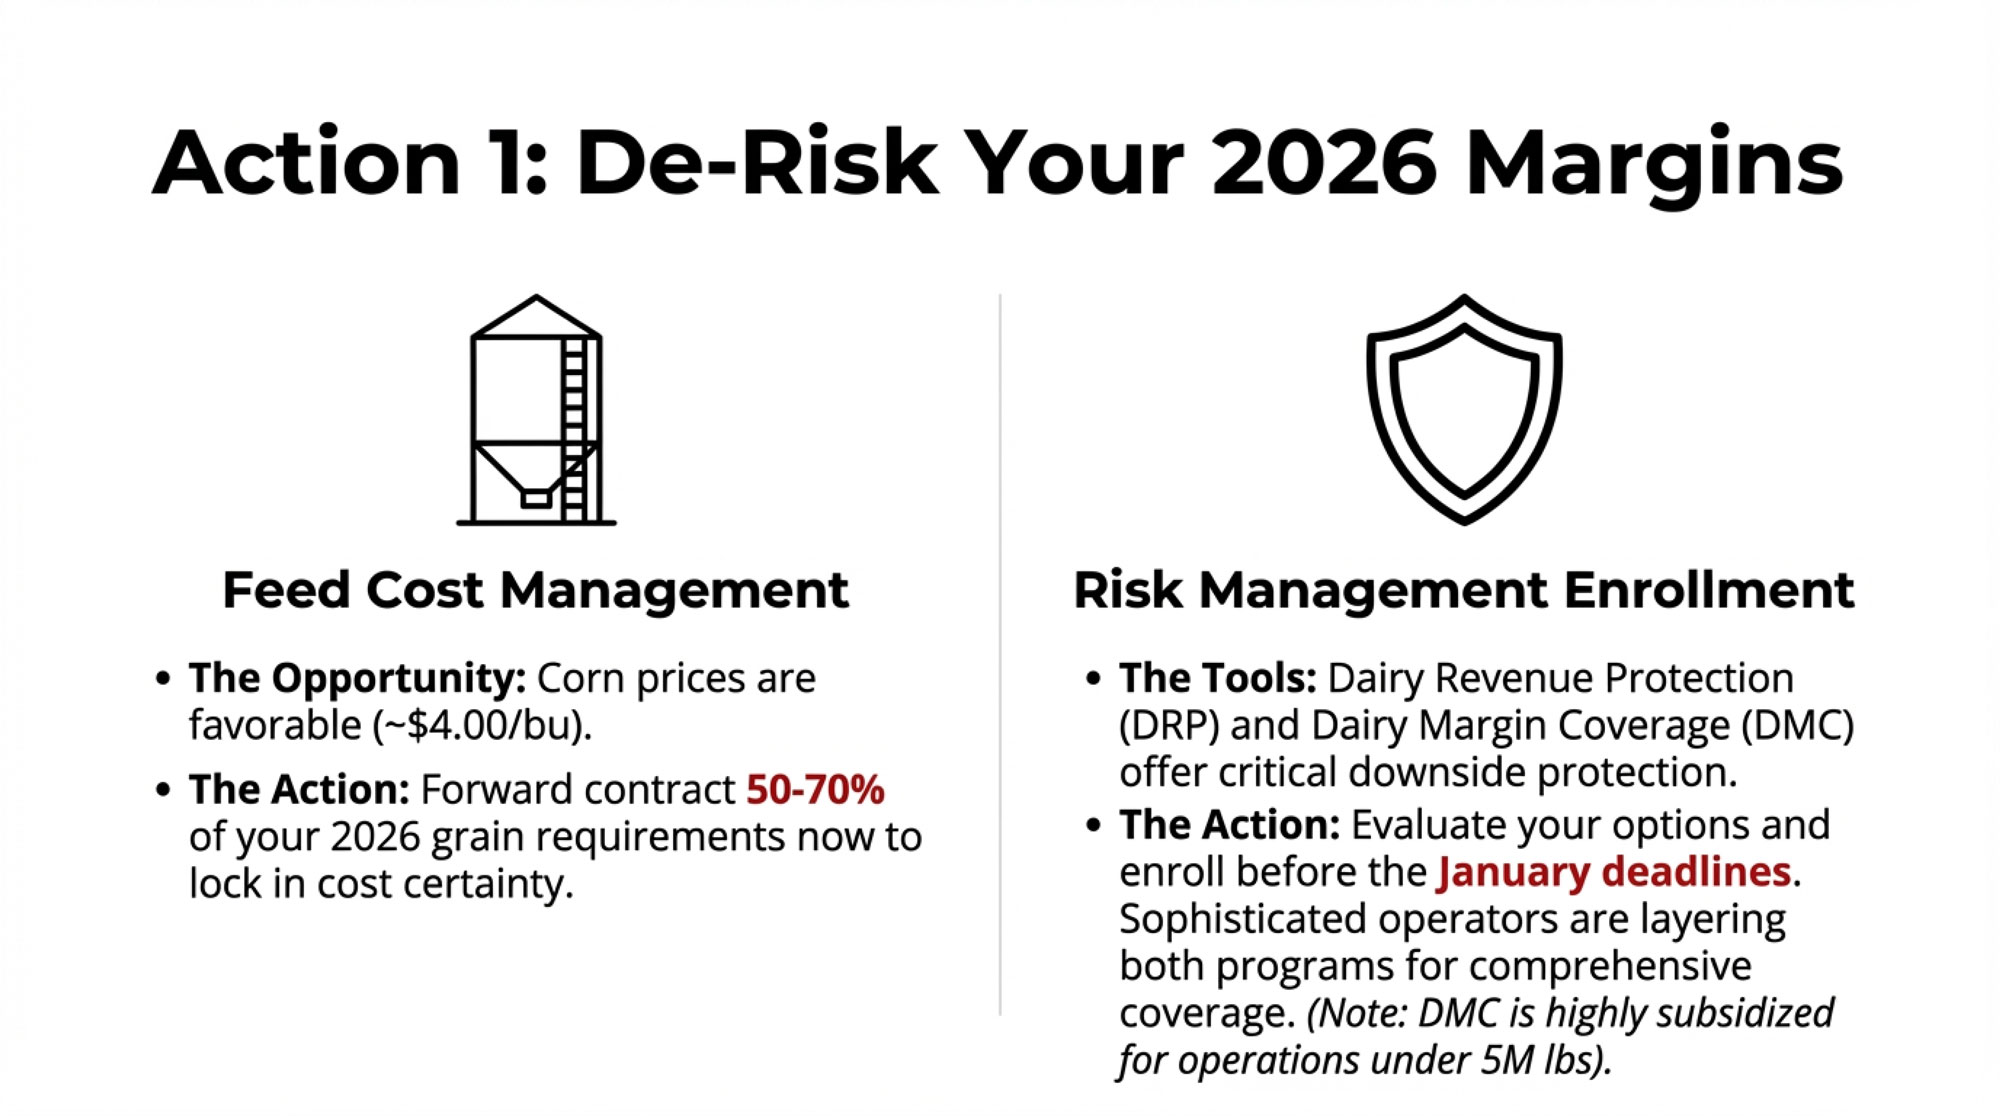
Feed Cost Management

With corn prices running around $4.00-4.05 per bushel in late December—down from $4.20-plus earlier in the fall and well below the $5-plus levels of 2023—this represents a genuine opportunity, according to USDA and CME data.

Forward contracting 50-70 percent of the anticipated 2026 grain requirements provides cost certainty regardless of how commodity markets move. For a 600-cow operation, that’s roughly 1,200-1,800 tons of corn equivalent. If prices move higher by spring, you’ve protected yourself.

Smaller operations—say, 100-200 cows—might target the lower end of that range to preserve cash flexibility, while larger commercial dairies with dedicated nutritionists and storage capacity might push toward 70 percent or higher.

I spoke with a nutritionist in the Northeast who mentioned that several of her clients locked in corn in October and are already seeing the benefit as prices have firmed. “It’s not about timing the absolute bottom,” she noted. “It’s about knowing your costs and removing uncertainty.”

The window for favorable pricing exists now, though markets can always move in either direction.

Risk Management Tools

Both the Dairy Revenue Protection and Dairy Margin Coverage programs offer downside protection worth evaluating. Each works differently:

DRP protects revenue and allows customizable coverage levels. Recent quotes in the Upper Midwest have shown producers can often secure Class III price floors in the high-$17 to low-$19 range, with premiums typically running a few dozen cents per hundredweight, depending on coverage level and quarter. These numbers move with the market, so working with your agent on current pricing makes sense.

DMC protects margins—milk price minus feed costs—and offers subsidized rates for smaller operations. As Wisconsin Extension and Ohio State confirm, Tier 1 coverage at $9.50 margin costs just $0.15 per hundredweight for qualifying operations—genuinely affordable protection for smaller producers.

Dr. John Newton, Vice President of Public Policy and Economic Analysis at the American Farm Bureau Federation, has noted that more sophisticated operators are layering both programs. DMC provides base margin protection; DRP covers revenue risk on top of that. The combination requires some investment, but it’s comprehensive.

A note on operation size: DMC’s Tier 1 subsidized rates make it particularly attractive for smaller operations with a production history of under 5 million pounds production history. Larger operations may find DRP more cost-effective on a per-hundredweight basis.

Insurance enrollment deadlines typically fall in mid-to-late January. This is an immediate decision point worth prioritizing.

ProgramWhat It ProtectsCoverage Cost ($/cwt)Best ForEnrollment Deadline
Dairy Revenue Protection (DRP)Milk revenue (price × volume)$0.30 – $0.70 (varies)Larger operations, revenue focusMid-January (quarterly)
Dairy Margin Coverage (DMC) Tier 1Margin (milk price – feed costs)$0.15 (subsidized)Small farms (<5M lbs history)Mid-January (annual)
DMC Tier 2Margin (milk price – feed costs)$1.11 – $1.53Mid-size operationsMid-January (annual)
No Coverage (Exposed)Nothing$0High-risk strategyN/A

Balance Sheet Assessment

Operations carrying significant debt—particularly debt originated at lower interest rates that’s now repricing—benefit from proactive lender conversations.

The math matters. A $4.5 million debt portfolio repricing from 3.5 to 7.5 percent adds roughly $180,000 in annual interest expense. On a typical-size operation, that extra interest alone can add $1.00-1.50 per hundredweight to your cost of production—money that comes straight off your margin.

Options worth discussing with your lender:

  • Amortization extensions that reduce annual payments by stretching repayment
  • Refinancing into FSA programs—USDA’s December 2025 announcement confirms current rates at 4.625 percent for direct farm operating loans and 5.75 percent for farm ownership loans
  • Covenant modifications that provide flexibility during market transitions

A lender I know in the Upper Midwest told me that producers who come in early with clear projections and a realistic plan typically achieve the best outcomes. “It’s the ones who wait until they’re already stressed who have fewer options,” he observed.

Initiating these conversations proactively, with clear financial projections showing you understand market conditions, typically produces better results than waiting.

Herd Composition Review

Evaluating whether lower-producing animals justify their feed and labor costs becomes more important as margins compress.

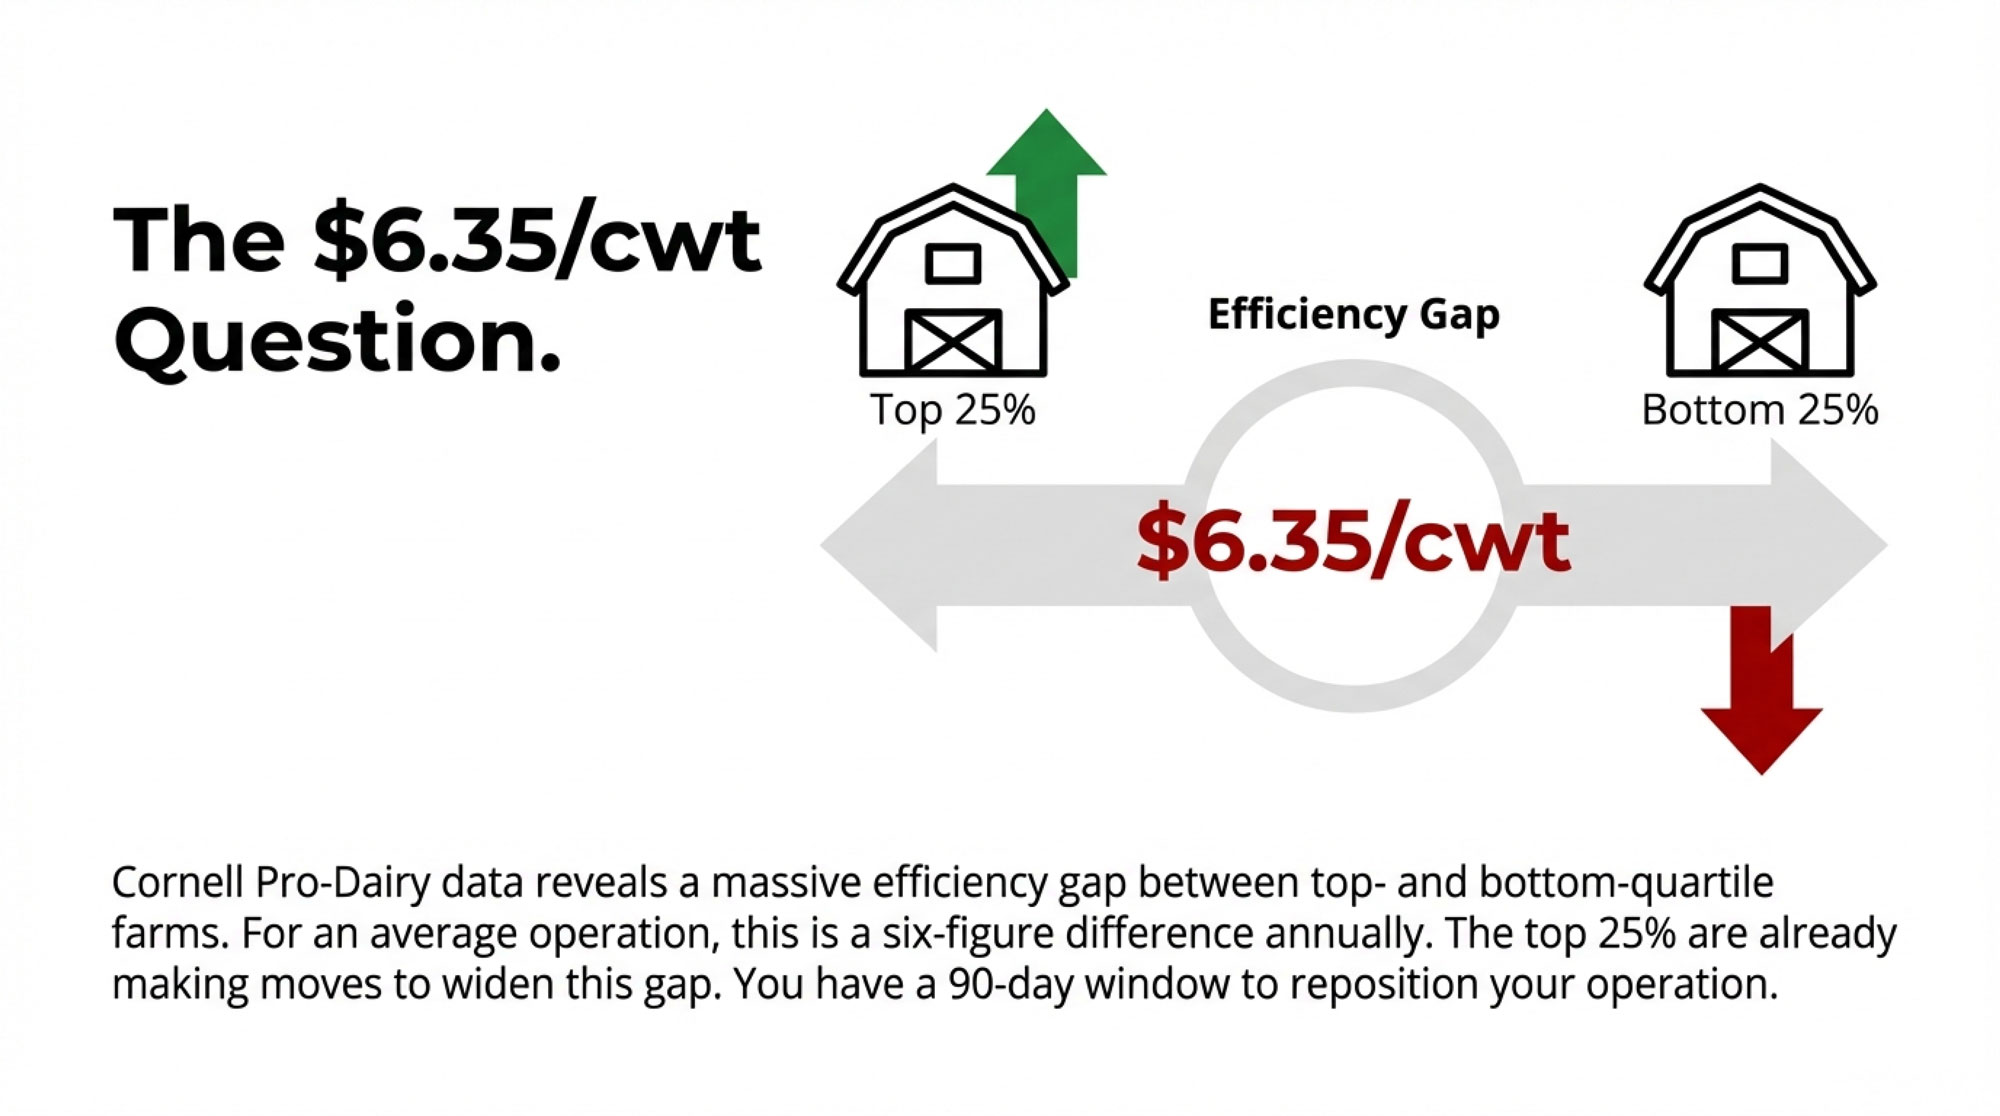
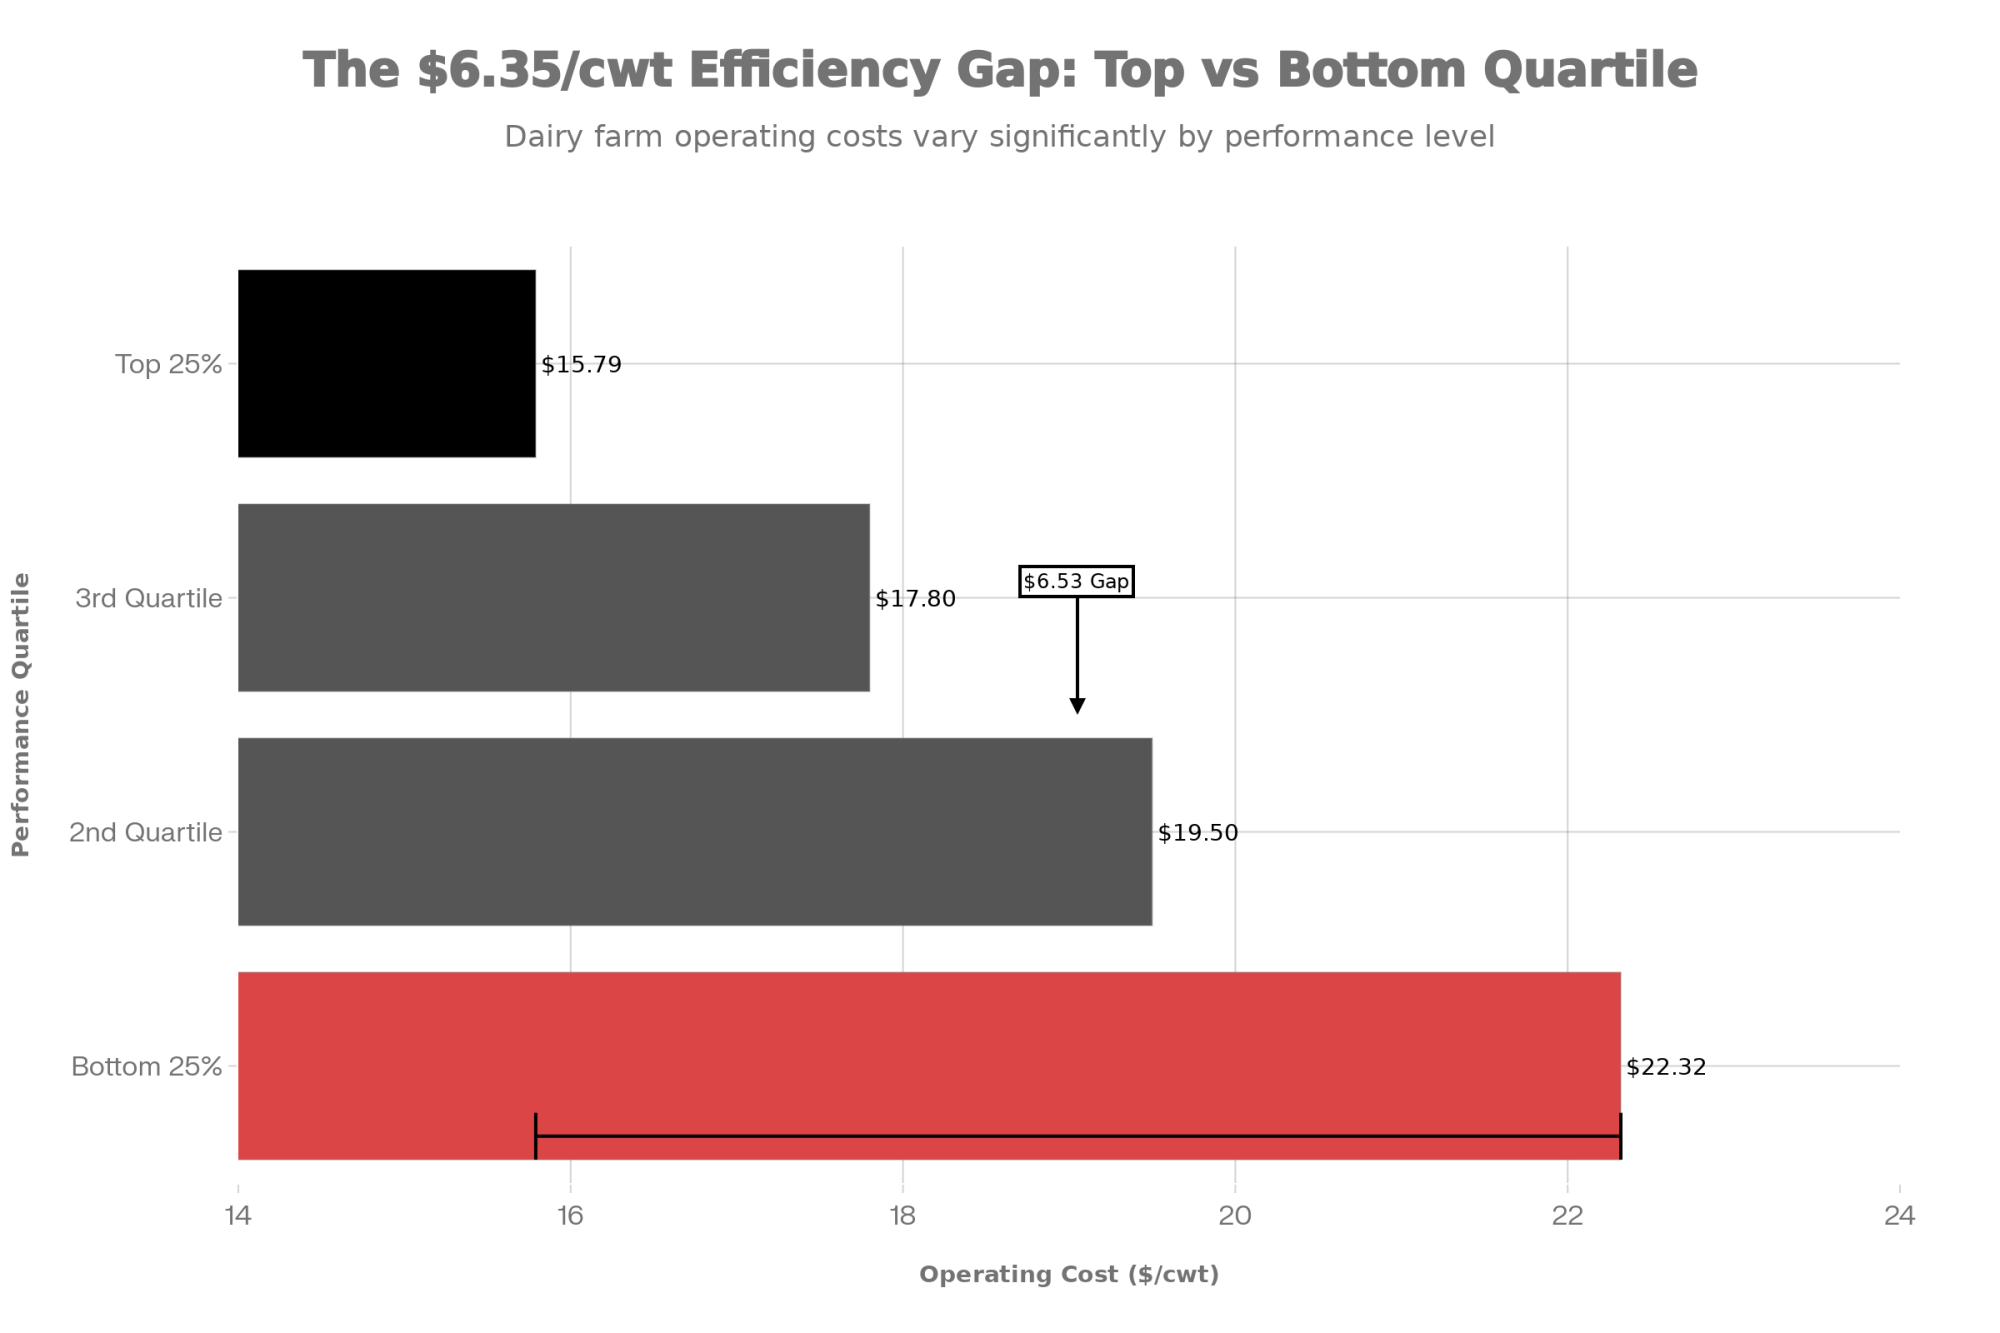
The efficiency gap between top and bottom performers in most herds is larger than many farmers realize. Cornell Pro-Dairy data shows the lowest quartile of farms averaging operating costs of $22.32 per hundredweight, while the highest quartile averages just $15.79—a difference of $6.35 per hundredweight that translates to performance gaps exceeding $100,000 between similarly-sized operations.

The math often favors addressing the bottom 10 percent of producers rather than carrying them through a soft market. For a 600-cow herd, that’s 60 animals consuming feed, requiring labor, and potentially affecting rolling herd average.

This doesn’t necessarily mean culling aggressively—it might mean more intensive management of problem cows, faster culling decisions on chronic cases, or adjusting breeding priorities. The right approach depends on your specific situation.

Regional Considerations

These strategies apply broadly, but regional variations matter.

Operations in Texas and the expanding Southwest face different labor markets and heat stress considerations than Wisconsin or Michigan dairies. California operations navigating recovery from recent challenges have unique constraints. Farms in traditional dairy regions may have more processor options and competitive milk pricing than those in emerging areas.

Working with your local extension specialists and financial advisors to calibrate these recommendations to your specific situation makes sense. Generic advice only goes so far.

The Efficiency Conversation—What It Actually Means

“Get more efficient” has become standard advice. But what does meaningful efficiency improvement actually involve at a practical level?

Milk quality management delivers measurable returns. Operations maintaining somatic cell counts below 200,000 capture quality premiums while avoiding the production losses, treatment costs, and discarded milk associated with elevated SCC.

Extension economists at Cornell, Penn State, and elsewhere estimate that reducing bulk tank SCC from the 400,000 range to under 200,000 can improve returns by several hundred dollars per cow per year, including quality premiums, reduced discarded milk, and lower treatment costs.

I visited a 400-cow operation in Pennsylvania last spring that had invested significantly in parlor upgrades and milking protocols. Their SCC dropped from 280,000 to 140,000 over eighteen months. The owner estimated the combination of premium capture and reduced mastitis treatment was worth about $350 per cow annually. “It wasn’t cheap to get there,” he acknowledged, “but the payback has been solid.”

For operations considering larger capital investments, robotic milking systems are showing compelling economics for the right situations—studies cited by Progressive Dairy and industry analysts show payback periods of 5-7 years when labor savings, production increases, and improved herd health detection are factored together, though ROI varies significantly based on herd size, labor costs, and management intensity.

Feed efficiency metrics matter more than ever. Tracking pounds of milk produced per pound of dry matter intake reveals opportunities many operations overlook.

Research documented in the Journal of Dairy Science and confirmed by Michigan State’s extension work shows each 1 percent improvement in forage NDF digestibility translates to approximately 0.55 pounds additional milk per cow per day and about 0.38 pounds more dry matter intake, according to a summary of the research.

On a 600-cow herd, that 0.55 pounds daily adds up to 330 pounds across the herd, or roughly 120,000 pounds annually. At $16 milk, you’re looking at around $19,000 in additional revenue from a single percentage point improvement in forage quality. That’s why forage testing and harvest timing decisions carry such significant economic weight.

Labor productivity varies widely across operations, too. Farms running 120-140 cows per full-time equivalent generally outperform those at 80-100 cows per FTE on a cost-per-hundredweight basis. This doesn’t mean minimizing staff—it means ensuring labor investments produce proportional output through good systems, appropriate automation, and reduced turnover.

The farms navigating current conditions most successfully tend to excel across multiple efficiency dimensions simultaneously rather than focusing narrowly on any single metric. It’s the combination that creates a durable competitive advantage.

Why ‘Tightening Your Belt’ Won’t Save You This Time

Here’s what I keep coming back to when I look at all of this: The biggest risk for dairy farmers right now isn’t any single market factor. It’s the assumption that this is just another cycle that will correct itself if you tighten your belt and wait it out.

Dairy farmers are extraordinarily resilient. You’ve navigated 2008-2009, 2015-2016, 2020, and everything in between. Every time you cut costs, got more efficient, and made it through to better prices.

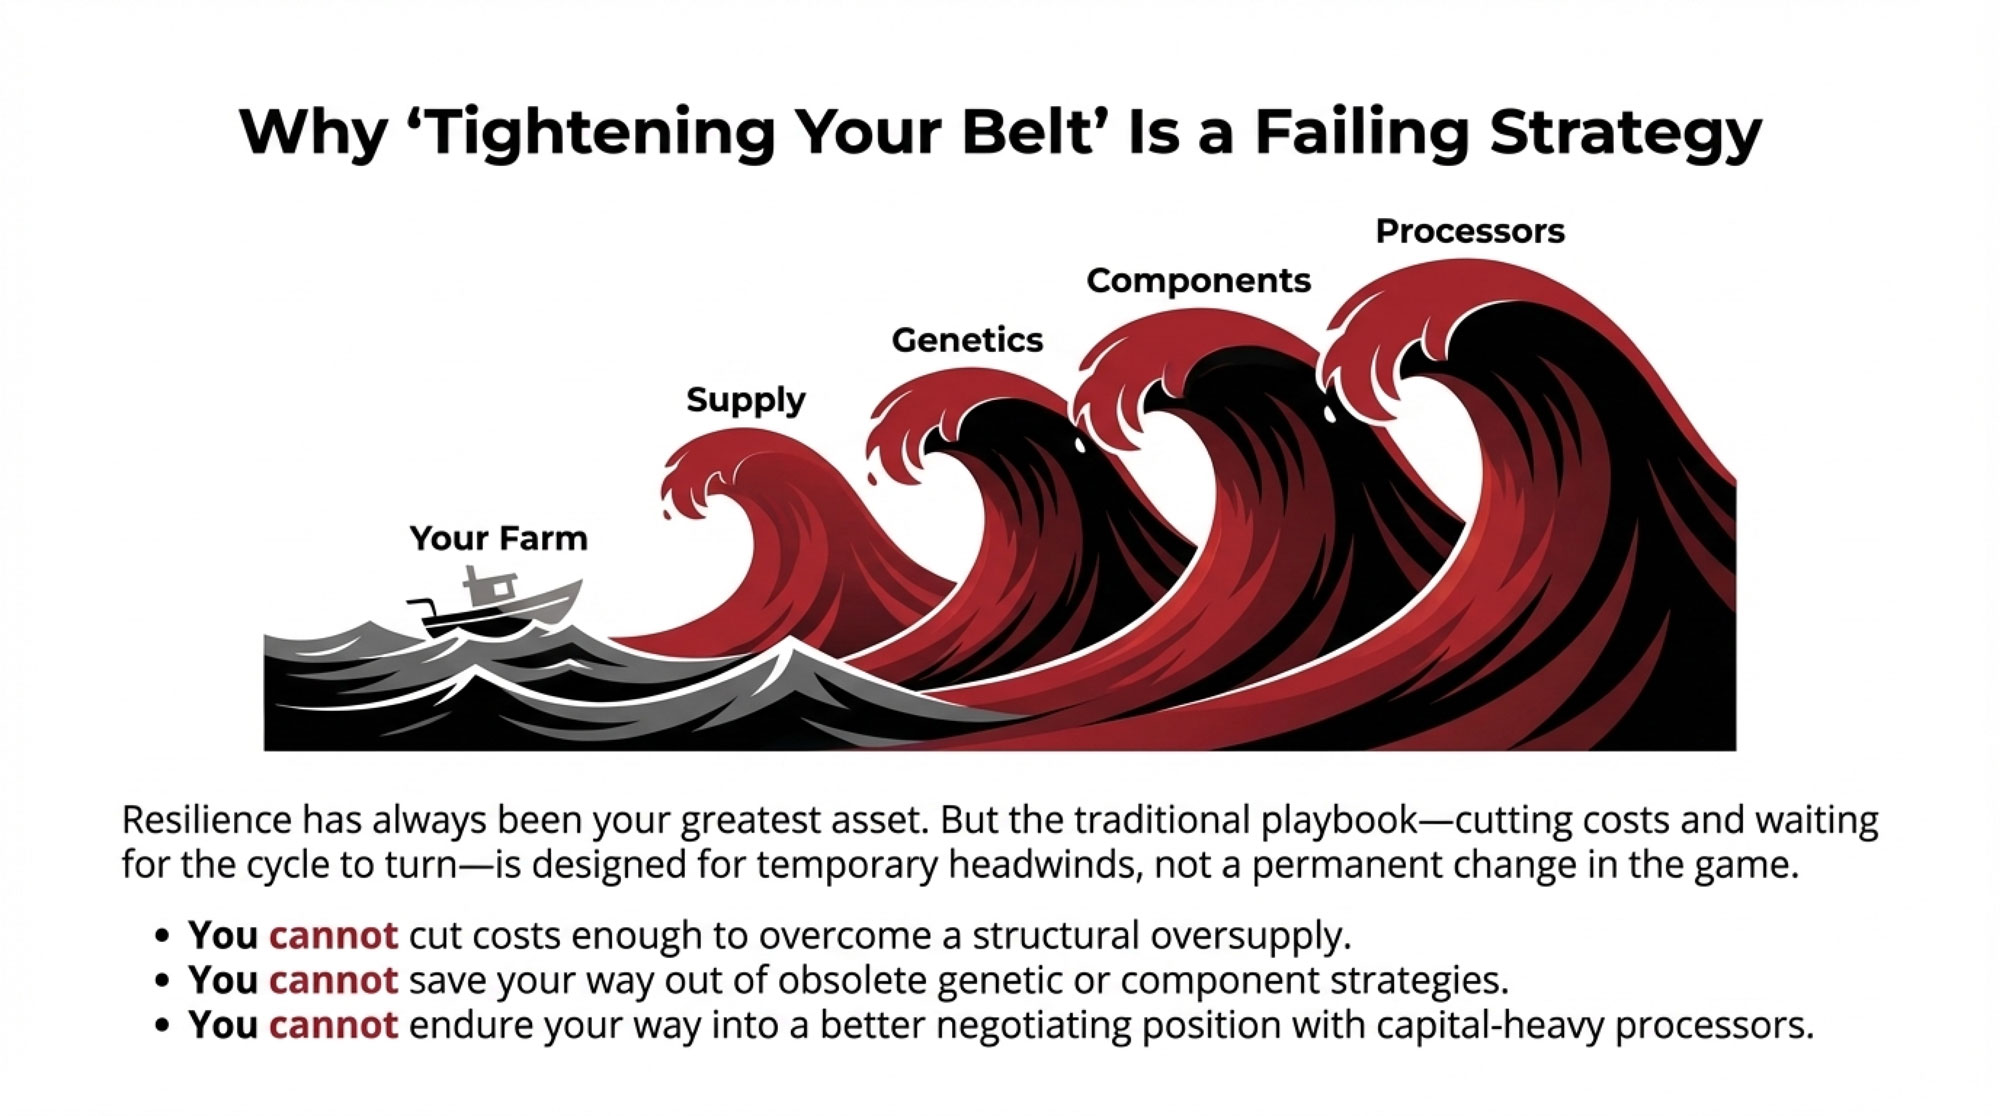
That resilience has been your greatest asset. But in this environment, the traditional playbook has limits.

The structural changes we’re seeing—the genetic revolution reshaping replacement dynamics, the power shift toward processors, the permanent loss of Chinese import demand, the capital intensity that favors scale—these aren’t cyclical headwinds that will reverse when milk prices recover. They’re fundamental changes in how the industry operates.

Tightening your belt works when you’re waiting out a temporary downturn. It doesn’t work when the game itself has changed.

The farms that will emerge strongest from 2026-2028 aren’t necessarily the biggest. They’re the ones that recognized early that some operating conditions have shifted permanently and adjusted their approaches accordingly.

That means:

  • Building cost structures that work at $16-18 milk, while remaining positioned to benefit if prices improve
  • Managing debt proactively rather than assuming refinancing will always be available on favorable terms
  • Making breeding decisions that balance near-term revenue with longer-term replacement needs—and treating your genetic program as a strategic asset
  • Evaluating processor partnerships with clear eyes about who holds the leverage
  • Focusing on profitability at the current size rather than assuming growth solves margin challenges

The Bottom Line

The dairy industry has weathered difficult periods before, and it will navigate this one as well. Domestic and global demand for quality dairy products remains substantial. Well-managed operations will continue finding paths to profitability.

The question is which operations will position themselves to thrive in the industry’s next chapter. And that positioning is happening now, in the decisions being made over the next 90 days.

The farmers who approach this moment with clear-eyed realism—neither panic nor complacency—and take deliberate action to strengthen their operations will look back in 2028 with satisfaction at the choices they made.

That outcome is available to you. That window closes faster than you think.

Key Takeaways

The market reality:

  • U.S. milk production running 3.7-4.7 percent above year-ago levels through fall 2025—the strongest growth since the COVID recovery
  • National herd at 9.57 million head, up 211,000 from a year ago
  • Domestic supply projected to exceed demand growth through at least mid-2027
  • China’s import decline—from 845,000 to 430,000 metric tons—represents a structural policy shift
  • Mexico accounts for more than a third of U.S. cheese exports

The structural shifts:

  • Beef-on-dairy isn’t a trend—it’s a genetic revolution requiring new replacement math
  • Power has shifted to processors who control the stainless steel and need milk to justify their investments
  • Butterfat premiums have collapsed—butter from over $3.00/lb to around $1.40/lb
  • Replacement heifer inventory at 47-year lows (3.914 million head); record prices

Action items for the next 90 days:

  • Evaluate forward contracting 50-70 percent of the 2026 feed needs
  • Review DRP and DMC options before January enrollment deadlines
  • Initiate lender conversations—FSA operating loans at 4.625%
  • Reassess breeding strategy: What percentage of your herd represents your genetic future?
  • Model breakeven at $16-18 milk and identify improvement areas

The mindset shift:

  • “Tightening your belt” is a failing strategy when the game has changed
  • Resilience means proactive adaptation, not passive endurance
  • Q1 2026 decisions will significantly influence outcomes through 2028

Complete references and supporting documentation are available upon request by contacting the editorial team at editor@thebullvine.com.

Learn More

Join the Revolution!

Join over 30,000 successful dairy professionals who rely on Bullvine Weekly for their competitive edge. Delivered directly to your inbox each week, our exclusive industry insights help you make smarter decisions while saving precious hours every week. Never miss critical updates on milk production trends, breakthrough technologies, and profit-boosting strategies that top producers are already implementing. Subscribe now to transform your dairy operation’s efficiency and profitability—your future success is just one click away.

NewsSubscribe
First
Last
Consent

Breeding Into a Moving Market: What Butterfat’s Crash Reveals About Dairy’s Genetic Timing Problem

The same genomic tools that delivered record milk components are now prompting producers to rethink how they approach breeding decisions—and the lessons extend well beyond butterfat.

Executive Summary: Butterfat prices dropped from $3.71 to $1.50 per pound in two years—but the genetics selected during the boom won’t fully express until 2027. That timing gap is the real story here. Producers who invested in high-fat genetics weren’t making bad bets; they were responding rationally to a decade of strong market signals. The problem is structural: genomic selection moves in 5-year cycles while commodity markets can reverse in 5 months. Now, with protein commanding higher premiums in many Federal Orders and replacement heifers at their lowest since 1978, breeding decisions made this season will shape herd economics through 2030. The operations that thrive won’t be those who predicted the protein shift earliest—they’ll be producers who built enough genetic flexibility to perform whether butterfat, protein, or neither pays the premium.

Dairy breeding strategy

For about fifteen years, the playbook seemed pretty clear. Butterfat was the component everyone wanted more of. Global shortages, strong butter demand, and Federal Order component prices that reached $3.71 per pound in October 2023 made aggressive selection for high-fat genetics look like a solid strategy. Producers who pushed their herds from 3.7% to 4.2% butterfat watched their milk checks respond accordingly.

Then things shifted faster than most of us anticipated.

By late 2024, average butter prices had dropped to $2.65–$2.70 per pound—still workable for most operations, but a significant change from those earlier highs. And the adjustment continued from there. By December 2025, USDA Agricultural Marketing Service reports showed CME butter around $1.50 per pound, with butterfat component values near $1.70—a correction that surprised even some seasoned market watchers.

What changed more fundamentally was the relationship between butterfat production and butterfat value. Processors who struggled to source cream in previous years were now describing 2025 as “a buyer’s market” for butterfat-based products.

What makes this situation worth examining—beyond the price movement itself—is what it reveals about how genomic selection interacts with commodity markets. For producers making breeding decisions right now, there are some genuinely practical lessons here.

How We Got Here

To understand the current landscape, it helps to recall why butterfat became so valuable in the first place.

In the early 2010s, global butterfat supplies were genuinely constrained. The European Union was working to phase out milk quotas, causing production disruptions across the continent. New Zealand faced drought conditions. Meanwhile, consumer preferences were shifting—full-fat dairy products were regaining favor after decades of low-fat messaging.

The U.S. responded by importing increasing quantities of butter and anhydrous milkfat. USDA Foreign Agricultural Service data shows imports climbed from about 10 million pounds in 2011 to over 100 million pounds by 2021—then jumped to 172 million pounds by 2023. The signal to American dairy producers was clear: butterfat demand was outpacing domestic supply.

Genomic selection, which arrived around 2008–2009, gave producers the tools to respond effectively. With the ability to evaluate animals at birth and make breeding decisions based on predicted genetic merit, the industry could achieve in five years what once required fifteen or more.

The production response tells the story. Between 2011 and 2023, U.S. milk production increased about 15%—while butterfat production climbed roughly 28%, according to USDA data analyzed by CoBank economist Corey Geiger. The industry essentially doubled the rate of butterfat improvement relative to overall milk output. By 2024, national milkfat levels had reached 4.23%.

One Wisconsin producer put it to me this way: “We did exactly what the market told us to do. The premiums were there, the genetics were available, and it penciled out.” And he’s right—producers responded rationally to clear economic signals. Those were logical business decisions given the information available at the time.

Geiger has emphasized that U.S. producers responded exceptionally to butterfat demand—and that supply growth has shifted the market from tightness toward relative balance. By April 2025, Holstein genetics had improved so significantly that the Council on Dairy Cattle Breeding rolled back the butterfat genetic base by 45 pounds—almost double any previous adjustment in the breed’s history.

The Timing Challenge Every Producer Faces

Here’s where things get particularly instructive for anyone evaluating their breeding program.

There’s a fundamental tension in dairy genetics that this butterfat cycle illustrated clearly: the timeline for genetic change doesn’t align with the timeline for market change. Not even close.

Timeline StageGenetic Expression TimelineMarket Cycle Timeline
Initial DecisionEvaluate genomic young sires, select matingsRespond to current component prices
Early PhaseBreeding + gestation (0-24 months)Prices can shift 20-40% in 6-12 months
First ExpressionHeifers enter lactation (24-36 months)Market conditions completely different
Herd-Level ImpactGenetic shift reaches 50%+ of herd (48-84 months)8-16 complete market cycles have occurred
Full ExpressionTotal timeline: 5-7 yearsTotal reversal possible: 6 months

Extension data from Penn State, University of Wisconsin-Madison, and industry genomic selection studies. Market cycle data from USDA Agricultural Marketing Service CME component pricing.

When you’re evaluating a genomic young sire and making a breeding decision today, the consequences of that decision won’t fully appear in your bulk tank for at least 3 to 4 years. Meaningful herd-level shifts? Those generally take five to seven years to materialize—that’s standard extension guidance from places like Penn State and Wisconsin. Meanwhile, component prices can move 30% or more in six months. We just watched butterfat drop from $3.71 to $1.70 in about two years.

Dr. Chad Dechow, associate professor of dairy cattle genetics at Penn State, has written extensively about this dynamic in the Journal of Dairy Science. His research has documented how genomic selection has accelerated genetic change to the point where market conditions sometimes shift before the genetics fully express in production.

What this means in practical terms: A producer who selected aggressively for butterfat in 2021 and 2022, responding to then-strong prices, won’t see those genetics fully express until 2025–2027. By then, market conditions will have already evolved—and the genetic direction will be largely set.

You know, this creates a challenging planning environment. Producers are essentially making long-term commitments based on market conditions they can’t fully predict. When those decisions align with where markets ultimately go, results are excellent. When they don’t, adjustments take time.

“U.S. producers did an exceptional job responding to butterfat demand. For 10 years, the market couldn’t supply enough of it, and now there’s a relative balance—it’s almost too much of a good thing.” — Corey Geiger, Lead Dairy Economist, CoBank

What This Looks Like Across Different Operations

For farms that followed market signals and invested in high-butterfat genetics, current conditions present real considerations. But the impact varies meaningfully depending on operation size, financial structure, and regional market.

Consider a typical Upper Midwest cheese milk producer with 800 to 1,200 cows who increased herd butterfat from 3.8% to 4.2% over the past decade. At peak butterfat prices, component calculations suggest that improvements could have added six figures to the milk check annually. The exact amount varies by market and pricing formula, but the direction was consistently positive during the premium period.

Many of those operations reasonably invested in facility improvements, purchased replacement heifers, and structured financing around component premiums that appeared sustainable. Those were logical business decisions given the information available.

Mark Stephenson, director of dairy policy analysis at the University of Wisconsin-Madison, has tracked these dynamics in his monthly Dairy Situation and Outlook reports. He’s observed that Upper Midwest cheese plants face different economics than fluid milk processors in the Southeast or butter-powder operations in the West—so the regional experience varies considerably.

What’s also important to recognize: some operations that emphasized butterfat genetics timed things well. Farms that built equity during 2018–2023 and maintained manageable debt loads are navigating this transition reasonably. The greater pressure tends to fall on operations that expanded more recently with higher leverage.

As one California producer explained to me: “Every cycle looks obvious in hindsight. The question is always whether you’re positioned to handle the turn when it comes.”

The Export Development

One factor that’s helped absorb domestic butterfat supply is significant growth in U.S. dairy exports.

According to the U.S. Dairy Export Council, through the first three quarters of 2025, U.S. butterfat export value reached almost $400 million—surpassing the previous full-year record of $351 million set in 2013. The U.S. has essentially shifted from a consistent butter importer to a competitive exporter.

This export growth has provided meaningful market support. But some context is helpful.

Much of the growth reflects price competitiveness rather than permanent structural demand. In late 2024, U.S. spot butter was around $2.65 per pound, versus $3.17 in New Zealand and $3.60 in the EU—roughly 30% below European suppliers’ prices. That price differential attracts buyers, though it may not represent a permanent market position.

Trade policy considerations also matter. The American Farm Bureau Federation noted in mid-2025 that “dairy’s trade balancing act” remains sensitive to geopolitical developments affecting markets like Canada, Mexico, and Asia.

The practical implication: exports help balance supply, but building a long-term strategy for export markets requires careful attention to factors beyond domestic control.

The Protein Discussion

As butterfat values have moderated over the past 18 months, protein has emerged as the more valuable component in several Federal Milk Marketing Orders—a shift from the pattern of recent years.

YearButterfat Value ($/lb)Protein Value ($/lb)Premium WinnerAdvantage ($/lb)
2021$2.85$2.12Butterfat+$0.73
2022$3.45$2.38Butterfat+$1.07
2023$3.20$2.55Butterfat+$0.65
2024$2.25$2.40Protein+$0.15
2025$1.70$2.65Protein+$0.95

Federal Order component pricing basis. Actual values vary by region and specific co-op formulas. For a typical Holstein producing 24,000 lb milk annually at 4.0% fat (960 lb) and 3.2% protein (768 lb), this swing represents significant per-cow value shifts.

So what’s driving this? Several factors are worth watching.

Growth in GLP-1 weight loss medications like Ozempic and Wegovy appears to be influencing dairy consumption patterns. Circana research found that consumers using these medications often increase protein intake to preserve muscle mass—with Danone reporting roughly 40% growth in yogurt sales among GLP-1 users based on that data. Greek yogurt and other high-protein dairy products are showing measurable gains among this demographic.

The broader high-protein trend also continues. The International Food Information Council’s national consumer surveys show that the percentage of Americans actively trying to increase protein intake rose from 59% in 2022 to 71% in 2024, then settled at 70% in their 2025 survey.

And with well over half of U.S. milk flowing into cheese production according to USDA utilization data, processors continue to value milk with favorable protein-to-fat ratios for optimal yields.

This naturally raises a question: Could the butterfat experience repeat with protein?

The dynamics differ somewhat. Protein has biological constraints that limit how quickly it can increase. Extension specialists like Dr. Kent Weigel at the University of Wisconsin-Madison have noted that protein percentage is more physiologically constrained than butterfat and tends to improve more gradually, even under strong selection pressure.

That said, the basic market structures—selection indices that primarily reflect current prices, commercial incentives that favor trending traits—haven’t fundamentally changed.

What this suggests: responding to protein market signals makes sense, while the butterfat experience offers a useful perspective on building flexibility into longer-term genetic planning.

Thinking Differently About Breeding Decisions

For producers making breeding decisions this season for heifers that won’t enter the milking string until 2028 or 2029, what approaches are worth considering?

Conversations with producers who’ve thought carefully about this reveal some common themes.

Consider scenarios rather than single predictions. Rather than optimizing entirely for current market conditions, there’s value in selecting genetics that perform reasonably well across multiple possible futures. This isn’t about being overly cautious—it’s about acknowledging genuine uncertainty about what component values will look like in 2029.

In practice, this might mean maintaining some genetic diversity even when current prices favor a particular trait. Keeping 25–30% of replacement genetics in “non-premium” lines might cost 1–2% in near-term milk check value while providing meaningful flexibility if conditions shift. Think of it as a relatively inexpensive form of insurance.

Align genetics with processor requirements. This consideration sometimes gets overlooked. Commodity prices fluctuate considerably quarter to quarter. But your cheese plant’s preferred protein-to-fat ratio? That tends to be fairly stable over multi-year periods.

Different cheese types have different optimal compositions. Mozzarella plants typically target protein-to-fat ratios around 0.95 to 1.05 for optimal stretch and yield. Cheddar operations often prefer ratios in the 0.85-0.90 range. If your milk goes to a specific plant, selecting toward that specification may make more sense than following monthly component price movements.

Cheese TypeOptimal Protein:Fat RatioTarget Protein %Target Fat %Why It Matters
Mozzarella0.95 – 1.053.3 – 3.5%3.4 – 3.6%Too much fat = poor stretch & oil-off; too little = rubbery texture
Cheddar0.85 – 0.903.1 – 3.3%3.6 – 3.8%Lower ratio optimal for aging; high protein reduces yield
Swiss0.90 – 0.953.2 – 3.4%3.5 – 3.7%Balance critical for eye formation; ratio affects gas production
Cream Cheese0.40 – 0.502.8 – 3.0%6.0 – 7.0%High fat essential for texture; protein secondary consideration
Parmesan/Asiago0.95 – 1.003.4 – 3.6%3.5 – 3.7%Long aging demands protein; low fat reduces rancidity risk

Optimal ranges vary by specific plant equipment, cultures, and product specifications. Contact your field representative for your plant’s specific targets. Component ratios shown are protein:fat on a percentage basis.

Having a conversation with your fieldman or co-op representative about end-user requirements over the next five years is time well invested. Useful questions include: What’s your target protein-to-fat ratio? Are anticipated product mix changes expected to shift component preferences? What component levels create operational challenges for your plant?

Use financial tools alongside genetic planning. Programs like Dairy Margin Coverage and Dairy Revenue Protection, along with component futures, can help manage margin volatility regardless of herd genetic composition.

DMC enrollment for 2026 coverage is approaching—evaluating whether current coverage levels match your risk profile makes sense given margin trends. USDA’s Farm Service Agency offers enrollment details and decision tools through local offices and at farmers.gov.

Monitor genetic diversity metrics. Holstein inbreeding has accelerated under genomic selection. Average inbreeding for Holstein females reached 8% by 2020, with young genomic bulls averaging 13.7%. The trend has continued upward, with average female inbreeding rising each year since 1981.

Beyond fertility and health considerations, genetic similarity increases collective exposure when market conditions or disease pressures change unexpectedly.

Evaluating a sire’s expected inbreeding contribution alongside his PTAs reflects recognition that diversity has practical value in uncertain environments. Inbreeding data is available on CDCB’s website at uscdcb.com, and most AI companies include this information in sire catalogs and mating programs.

Regional and Operational Considerations

A few additional factors for producers working through these decisions:

Regional context matters. Upper Midwest cheese milk producers face different dynamics than Southeast fluid milk shippers or California producers selling into butter-powder markets. The component value discussion plays out differently depending on your market channel. Understanding your specific situation helps calibrate how national trends apply to your operation.

Scale affects flexibility. Larger operations generally have more capacity to maintain diverse genetic lines within their herd. Smaller operations may need different approaches—perhaps breeding group strategies or working with AI representatives to build diversity into mating programs with fewer animals.

Financial structure shapes options. Operations with lower leverage and stronger equity positions can more readily weather margin compression while genetic adjustments work through the herd. Operations with recent expansion debt face different calculations. Honest assessment of your situation helps identify which strategies fit best.

The replacement market is constrained. USDA’s January 2025 inventory report showed dairy replacement heifers at 3.914 million head—the lowest since 1978. CoBank’s August 2025 analysis reported average heifer prices around $3,010 per head, with top heifers at California and Minnesota auctions reaching $4,000 or more.

If your approach involves significant culling and replacement, current heifer market conditions meaningfully affect the economics. This makes breeding decisions on your existing herd inventory more consequential when outside replacements are both expensive and limited.

The Bottom Line

The butterfat boom is over, but the lesson is permanent: Chasing the hot market of the moment is a slow-motion gamble.

Genomic selection delivered exactly what it promised—unprecedented genetic progress toward the traits producers selected for. The problem wasn’t the tool. The problem was selecting into a market environment that proved more temporary than the genetic changes themselves.

The winners in 2030 won’t be the ones who chased today’s milk check. They’ll be the ones who bred for the cow that works in any market.

That means building herds with enough flexibility to perform when butterfat pays, when protein pays, and when neither pays particularly well. It means matching genetics to processor needs rather than spot prices. It means treating diversity not as a compromise but as a genuine competitive advantage.

The operations that thrive through the next cycle—and there will always be a next cycle—will be those that learned this lesson now, while the butterfat correction is still fresh.

The question for every producer making breeding decisions today is simple: Are you building a herd for this year’s premium, or for the decade ahead?

Key Takeaways:

  • The timing gap is structural and permanent. Breeding decisions take 5-7 years to express; markets can reverse in months. Build for multiple scenarios, not today’s price sheet.
  • Chasing butterfat wasn’t a mistake—the signals were real. The lesson isn’t to ignore markets; it’s to avoid over-concentration in any single trait when you can’t predict what pays in 2030.
  • Protein now commands higher premiums, but the same mismatch applies. Don’t repeat the butterfat pattern by going all-in on the next hot component.
  • Your processor’s requirements beat spot prices for planning. Cheese plants have stable protein-to-fat targets (mozzarella: 0.95-1.05; cheddar: 0.85-0.90). Align genetics to your actual market channel.
  • Diversity is insurance with a cheap premium. Maintaining 25-30% of replacements in balanced genetics costs 1-2% short-term but provides real optionality when—not if—markets shift again.

Complete references and supporting documentation are available upon request by contacting the editorial team at editor@thebullvine.com.

Learn More:

Join the Revolution!

Join over 30,000 successful dairy professionals who rely on Bullvine Weekly for their competitive edge. Delivered directly to your inbox each week, our exclusive industry insights help you make smarter decisions while saving precious hours every week. Never miss critical updates on milk production trends, breakthrough technologies, and profit-boosting strategies that top producers are already implementing. Subscribe now to transform your dairy operation’s efficiency and profitability—your future success is just one click away.

NewsSubscribe
First
Last
Consent

Butterfat Finds a Floor, Powders Keep Sliding: This Week’s Global Dairy Market Recap (Oct 27, 2025)

Milk keeps flowing, but markets aren’t keeping up — here’s why butter still wins while powder takes the hit.

EXECUTIVE SUMMARY: Milk keeps flowing, and that’s both the good and the bad news this week. Global markets are clearly split: butterfat found support, while powders keep sliding under the weight of spring flushes from New Zealand and South America. The GDT fell for a fifth straight time, confirming that buyers remain hesitant despite stronger global GDP signals. European cheese prices softened again, squeezed by heavy milk flows and stiff export competition from the U.S. Meanwhile, domestic U.S. butter and whey showed small but meaningful rebounds, hinting that seasonal demand is still alive. The story heading into Q4 is crucial but straightforward — fats are holding the line, but milk powder markets are testing just how low they can go.

The global dairy market feels a bit like a full bulk tank these days — there’s plenty of volume, but the challenge lies in finding enough demand to keep things moving. As seasonal production swells across the Southern Hemisphere and buyers take a more cautious approach, markets are struggling to find equilibrium. The story this week is one of contrast: fats holding firm, proteins still under pressure, and a tug-of-war between optimism and oversupply.

EEX Futures – Butter Builds Strength

Volume on the European Energy Exchange (EEX) reached 1,730 tonnes last week, spread across butter, skim milk powder, and whey. Butter led the pack, climbing 1.6% to €5,226 for the Oct 25–May 26 strip.

What’s interesting here is how butter continues to defy broader weakness. European cream supplies remain comfortable, but steady retail demand and ongoing export inquiries — particularly for high-fat butter used in industrial formulations — are helping maintain price momentum (EEX, Oct 2025). Skim milk powder (SMP) slipped 0.2% to €2,163, showing that supply comfort and limited tenders are keeping buyers sidelined. Whey, meanwhile, gained 2.0%, settling around €975, driven by active demand for protein fortification in feed and human nutrition sectors.

SGX Futures – Fat Prices Hold Ground

Across the Singapore Exchange (SGX), 13,123 tonnes traded last week — the majority in Whole Milk Powder (WMP), which eased 0.4% to $3,546. SMP crept up 0.2% to $2,591, while Anhydrous Milk Fat (AMF) added 1.0%, finishing at $6,666.

It’s worth noting that AMF’s firm tone isn’t just about premium dairy fats — it’s about diversification. Food manufacturers are migrating toward AMF for better shelf stability and consistency, widening the AMF–butter spread to $376 per tonne. That gap signals stronger demand in processed and export channels versus commodity butter sales.

Butter on SGX slipped 1.4% to $6,420, reflecting the usual shoulder-season slowdown before Q4 holiday orders gain traction. The NZX milk price futures market traded 426 lots (2.56 million kgMS), keeping farm gate projections near $10/kgMS, supported by the weaker New Zealand dollar.

European Quotations – Region by Region Reality

The EU Butter Index dipped €39 (–0.7%) to €5,390, but the national picture tells more of the story. Dutch butter fell sharply (–3.4%), French butter rose 1.2%, and German butter held steady. The SMP Index fell 1.2% to €2,097, weighed by slow export booking and cautious EU buyers. By contrast, whey improved 1.7% to €912, another sign that protein derivatives continue to offer bright spots amid the softness.

Year-over-year, SMP has dropped more than 15%, while butter remains nearly 30% below 2024 levels. The key here is that fats are still profitable to produce, while powder processors are watching their margins shrink (EU Commission Market Observatory).

EEX Cheese Index – A Tough Stretch

vef

Cheese prices continue to grind lower. Cheddar Curd fell by 3.8% to €3,501Mild Cheddar lost 1.5% to €3,636Young Gouda dropped 2.8% to €2,909, and Mozzarella eased 1.9% to €2,928.

What’s driving this? In short, too much milk, not enough elasticity downstream. European processors have faced strong milk deliveries and limited export momentum, particularly as the U.S. continues to compete aggressively in cheese exports with lower prices and a steadier currency.

GDT Auction – Fifth Consecutive Decline

Fats (Butter & AMF) maintain price stability while powders (WMP & SMP) slide for five consecutive auctions, revealing the fundamental market split: butterfat wins as oversupply crushes powder values

The Global Dairy Trade (GDT) Price Index fell another 1.4% to $3,881, its fifth straight dip — a clear indicator that the global balance between supply and consumption is still correcting.

Whole milk powder dropped 2.4% to $3,610, and skim milk powder declined 1.6% to $2,559. By contrast, AMF rose 1.5% to $7,038, maintaining its premium over butter. Butter fell slightly (–0.8% to $6,662). That persistent AMF premium shows sustained appetite for high-purity fats, particularly in Asian and Middle Eastern markets (GDT Event 390, Oct 2025).

Cheddar and mozzarella prices fell 1.9% and 5.3%, respectively. Volumes sold at the event totaled 40,621 tonnes, down modestly from the previous auction.

Southern Hemisphere – Production Ramps Up

Spring flush delivers production surge across the Southern Hemisphere: Argentina leads with nearly 12% solids growth, New Zealand milk solids jump 3.4%, and Dutch collections rise 6.7%—all combining to flood global markets and pressure powder prices downward

Down south, spring flush is living up to its name. New Zealand’s September milk collection hit 2.67 million tonnes, up 2.5%, while milk solids jumped 3.4% year over year (DCANZ, Oct 2025). A weaker NZD continues to bolster local payouts, and with PKE (palm kernel expeller) imports up 35%, many herds are maintaining condition through the flush.

Argentina’s production rose 9.9% year over year in September, and solids were up 11.7%, driven by improved pasture and feed efficiency under stable weather (OCLA Argentina, Sept 2025). Meanwhile, the Netherlands reported +6.7%milk collections and a stronger butterfat yield, signaling broad European abundance.

These gains are great news for efficiency metrics but apply downward pressure on global dairy pricing, particularly across SMP and WMP.

Trade and Demand – China Sends Mixed Signals

China’s September imports reveal calculated market strategy: massive 65% surge in butter and 41% jump in WMP contrasts sharply with 12.5% drop in SMP, proving buyers are restocking premium fats while avoiding oversupplied powders

China’s September milk-equivalent imports rose 4.7% year over year — but that number hides the nuance. WMP imports surged 41%, a recovery from last year’s depressed base, while SMP fell 12.5% and butter jumped an impressive 64.7% (Chinese Customs Data, Oct 2025).

This suggests that Chinese buyers are being tactical. They’re restocking high-fat categories but remain cautious on large-volume powders. New Zealand exports, up 8.7% y/y, captured much of that growth, though SMP flows remain uneven. Demand is stabilizing—not accelerating yet.

U.S. Markets – Glimmers of Recovery

ProductWeekly ChangeCurrent PriceMarket Signal
Dry Whey$+3.5¢$$\$0.69/\text{lb}$Strong protein
Butter$+0.75¢$$\$1.6025/\text{lb}$Holiday build
Cheddar Blocks$+0.25¢$$\$1.7775/\text{lb}$Moderate food
Nonfat Dry Milk$+\$0.05$$\$1.16/\text{lb}$Steady demand

Domestic dairy markets found small pockets of strength. CME cheddar blocks ticked up 0.25¢ to $1.7775/lbbutter gained 0.75¢ to $1.6025/lb, and nonfat dry milk rose a nickel to $1.16/lbDry whey continued to climb, up 3.5¢ to $0.69/lb, thanks to unflagging demand for high-protein ingredients (USDA Dairy Market News, Oct 2025).

Cream supplies remain ample, butter churns are busy, and foodservice activity is moderate. As one Wisconsin marketing manager put it this week, “We’re not seeing panic buying, but holiday pipeline building is real.” Feed remains a bright spot, with DEC25 corn at $4.28/bu and JAN26 soybeans at $10.62/bu, though both trended higher late in the week.

The Bottom Line

Looking ahead, the key takeaway this week is the growing divide between resilient fats and fragile powders. Butter and AMF continue to attract strong retail and manufacturing interest, offering some price floor protection. But with milk collections swinging higher across the Southern Hemisphere, SMP and WMP are likely to remain under pressure through the year’s end.

Short-term volatility may persist, especially if China’s buying remains uneven. Still, there’s cautious optimism. Farm-level profitability in regions like New Zealand and the Midwest is holding better than last year — proof that leaner operations, feed cost management, and smarter hedging have made this downturn more manageable.

As always, milk will find a home — but the home it finds this season might be one more driven by butterfat than by bulk powder. And that’s a story worth watching as we head toward the new year.

Key Takeaways:

  • Fats are holding firm, powders aren’t. Butter and AMF prices found support, but SMP and WMP remain under pressure from surging milk supply.
  • GDT slipped again (-1.4%), its fifth straight decline — a reminder that buyer confidence isn’t back yet, even as global GDP nudges higher.
  • Europe’s cheese values slid once more, squeezed by full silos, steady milk flows, and competitive U.S. export pricing.
  • Southern Hemisphere production is booming — New Zealand up 2.5%, Argentina nearly 10% higher — ensuring plenty of product but few price rallies.
  • In the U.S., butter and whey are bright spots, lifted by retail holiday demand and strong protein interest.

Complete references and supporting documentation are available upon request by contacting the editorial team at editor@thebullvine.com.

Learn More:

Join the Revolution!

Join over 30,000 successful dairy professionals who rely on Bullvine Weekly for their competitive edge. Delivered directly to your inbox each week, our exclusive industry insights help you make smarter decisions while saving precious hours every week. Never miss critical updates on milk production trends, breakthrough technologies, and profit-boosting strategies that top producers are already implementing. Subscribe now to transform your dairy operation’s efficiency and profitability—your future success is just one click away.

NewsSubscribe
First
Last
Consent

Cream Crisis: Can U.S. Dairy Exports Drain the Butterfat Lake?

U.S. dairy drowning in cream: Can exports save the day? Discover why selling abroad isn’t a quick fix and what smart farmers should do now.

EXECUTIVE SUMMARY: The U.S. dairy industry faces a massive cream surplus, driven by record-high butterfat content, rebounding milk production, and weak food service demand. While exports have surged due to a significant price advantage (U.S. butter at $2.30/lb vs. Europe’s $8,600/MT), structural hurdles prevent a quick fix. These include mismatched butter standards (80% U.S. vs. 82% global), high market entry costs, and volatile tariffs (e.g., Canada’s 25% retaliation). Exports alone won’t drain the glut short-term, but long-term strategies like targeting Latin America, adapting products, and building export infrastructure offer hope. Success requires a shift from opportunistic selling to sustained international market development, potentially transforming U.S. dairy’s global role.

KEY TAKEAWAYS:

  • Cream glut stems from multiple factors: 4.43% butterfat content, 1.7% milk production surge, cheese production shifts, and weak food service demand.
  • Export growth is impressive (butter +126%, AMF +525% in early 2025) but faces hurdles like 80% vs. 82% butter standards and complex tariffs (e.g., China’s 125% on U.S. dairy).
  • Short-term export relief is unlikely due to the scale of surplus (270M lbs butter stocks) and structural barriers.
  • Long-term success requires strategic shifts: sustained market development, product adaptation (e.g., 82% unsalted butter), and targeting regions like Mexico/Central America.
  • Industry collaboration is crucial: processors must invest in export capabilities, while organizations like USDEC need to address trade barriers and provide market intelligence.
U.S. dairy exports, cream surplus, butterfat prices, anhydrous milkfat (AMF), global butter market

The dairy industry’s swimming in cream right now, with butter prices hitting rock-bottom while international markets are paying nearly double. Everyone’s asking the same question at the co-op meetings: can we export our way out of this mess? The short answer isn’t simple – while our exports are taking off, real-world hurdles mean exports alone won’t bail us out overnight. But with some smart moves, we could turn international sales from an occasional relief valve into a consistent market for our butterfat.

The Perfect Storm: How America’s Cream Glut Formed

Let’s break down how we got here:

Milk Floodgates Open: Big Herds, Bigger Output

Our cows are pumping out richer milk than ever before. Butterfat hit a whopping 4.43% earlier this year – numbers we’ve never seen before. Years of selecting components and feeding for fat have paid off too well.

“We’re making butter Americans don’t want to buy,” says Wisconsin churn operator Mark Tolbert. “Our cows keep pumping out more butterfat while processors scramble to find homes for it all.”

Milk production hasn’t dropped a bit despite losing 39% of our dairy farms between 2017 and 2022. The big operations with 1,000+ cows now make up two-thirds of all milk sales, up from 57% just five years ago.

Production jumped 1.7% late last year, dumping another 160 million pounds of milk fat onto an already flooded market. That’s a lot of butter churns running over.

Cheese Shift Dumps More Cream on Markets

The cheese side isn’t helping either. While cheese production hit a record 14.25 billion pounds last year, the high-fat varieties like Cheddar dropped by 5.8%. That trend’s continuing this year, with American-type cheese production down another 1.3% in February.

Meanwhile, those fancy new cheese plants in Wisconsin and Texas are diverting 15% of our milkfat away from butter – 50% more than last year. More cheese overall, but less fat being used up.

Food Service Weakness Compounds the Problem

Restaurants and bakeries aren’t buying like they used to. The food service sector’s been soft, hitting cream prices hard.

Cream values have tanked to decade lows—farmers now earn just $1.10 for every dollar of butterfat. That’s about as bad as the COVID crash in 2020. Butter churns are running at 92% capacity, just trying to handle all the excess cream.

Export Explosion: U.S. Butterfat’s Global Price Advantage

Here’s where things get interesting – our cheap butter looks mighty attractive overseas.

Fire Sale Prices: U.S. Butter’s Dramatic Discount

Our butter’s selling for $2.30/lb while European butter’s fetching nearly $8,600/MT – a 30% discount even after adjusting for fat differences. We’re practically giving it away compared to world prices.

RegionJan 2025 AvgFeb 2025 AvgMar 2025 AvgEarly Apr 2025 Spot/Range
U.S. CME Grade AA~$5,470/MT~$5,246/MT~$5,129/MT~$5,110-$5,180/MT
Europe (W. Europe 82% FOB)~$7,400/MT~$7,700/MT~$8,687/MT$7,975-$8,600/MT
Oceania (82% FOB / GDT)~$6,800/MT~$7,280/MT~$7,550/MT$7,400-$7,600/MT

Record-Breaking Export Growth

Buyers overseas aren’t stupid – they’re loading up on our cheap butterfat. Butter exports jumped 41% in January and then exploded by 126% in February, hitting 11.5 million pounds. For the first two months of this year, we’ve shipped 84% more butter than the same time last year.

Anhydrous milkfat (AMF) exports have gone wild – up 525% in January alone. Canada’s buying 239% more, and Mexico’s purchases jumped nearly 1,600%.

ProductJan 2025 (MT)Jan 2024 (MT)% ChangeFeb 2025 (MT)Feb 2024 (MT)% ChangeKey Destinations
Butter3,1882,261+41%5,2162,308+126%Canada, C. America, MENA
AMF3,897623+525%N/AN/AN/ACanada, Mexico, MENA
Total Butterfat7,0852,884+146%N/AN/AN/A

For the first time in over two years, we exported more butter than we imported in February. That’s a big shift.

Why Selling Overseas Isn’t a Quick Fix

So why can’t exports solve everything? There are some real roadblocks:

The 80% vs. 82% Butter Battle

Our standard butter is 80% fat and usually salted. The rest of the world wants 82% unsalted. That’s not just a small detail – it means retooling production lines and changing processes. You can’t just take butter meant for Kroger and ship it to Saudi Arabia.

AMF: America’s Secret Export Weapon

AMF (that’s almost pure butterfat at 99%) doesn’t have the same standards problem as butter, which explains why it’s selling like hotcakes overseas. For processors looking to move butterfat fast, AMF is the easier path than reformulating butter production.

The Tariff Minefield

The trade situation is a mess right now. The White House slapped 25% tariffs on Canada and Mexico in March, and they hit back hard. Canada put 25% tariffs on our dairy, and China went nuclear with 125% tariffs on U.S. dairy products.

Trading PartnerU.S. Tariff ActionPartner Retaliation on DairyImpact on Exports
Canada25% on non-USMCA goods25% on U.S. dairy productsPotentially negates price advantage
Mexico25% on non-USMCA goodsRetaliation announced, but details pendingCreates uncertainty for the largest export market
China20% IEEPA tariff + existing tariffs125% on U.S. dairy productsChallenges the third-largest dairy market

The National Milk Producers’ Federation admits these tariffs will “certainly be a hit to our exports to China.” Even with USMCA exemptions, the uncertainty has everyone on edge.

Market Entry Costs and Historical Inertia

Breaking into export markets isn’t like selling to the following country. Companies need international sales teams, specialized paperwork experts, and relationships with buyers overseas. All that takes time and money.

The U.S. has traditionally imported butter rather than exported it, so we don’t have the connections and systems we do for powder or cheese. You can’t flip that switch overnight.

Exporting the Surplus: Short-Term Pain, Long-Term Gain

Why Exports Won’t Immediately Eliminate the Cream Glut

Let’s be realistic – exports alone can’t fix this overnight:

  1. The sheer scale of the problem is massive. Butter stocks jumped 26% in January alone to over 270 million pounds.
  2. The hurdles we discussed – different butter standards, export costs, and crazy tariff situations – all slow down the export machine.
  3. Building international relationships takes time. You can’t just call up a buyer in Saudi Arabia and ship tomorrow.

So while exports will help, we’ll likely need other fixes too – maybe producing less milk fat or finding new uses here at home.

Strategic Path Forward: Building Long-Term Export Capacity

But there’s good news for the long haul. If we play this right, exports could become a reliable outlet for our butterfat:

  1. Sustained Export Investment: Processors must stop treating exports as a dumping ground for surplus and start building a real, long-term international business.
  2. Strategic Market Targeting: Mexico and Central America make natural targets – they’re close by and have favorable trade deals like CAFTA-DR with zero dairy tariffs.
  3. Product Adaptation: Plants should consider dedicated lines for 82% unsalted butter or focus more on AMF production since it’s already selling well overseas.
  4. Enhanced Industry Collaboration: The U.S. Dairy Export Council needs everyone’s support to open doors and fight trade barriers.

Cream Rising: The Future of U.S. Butterfat Exports

This cream glut is both a crisis and an opportunity. While exports won’t immediately drain the lake, they’re becoming crucial to the solution. The export boom we’re seeing proves that when the price is right, buyers will come.

Going forward, we need a multi-pronged approach. On the export side, we must build lasting relationships, adapt our products, and navigate the trade minefield. We might need to rethink milk composition, production volumes, or processing capacity at home.

Can we export our way out of the cream glut? Not overnight. But with smart investments and a long-term view, exports can become a consistent market for our butterfat rather than just an emergency outlet when prices crash.

3 Steps to Survive the Cream Glut

  1. Audit your herd’s butterfat trends with your nutritionist. Are you still selecting and feeding for maximum components when the market’s drowning in fat?
  2. Demand export-ready pricing from your co-op. If they’re selling cream at rock-bottom prices domestically, ask what they’re doing to capture higher international values.
  3. Attend USDEC’s June webinar on navigating tariff complexities. Understanding the rapidly changing trade landscape is essential for long-term planning.

Exports might seem distant for those of us with our boots in the barn every day, but they’re becoming crucial to our bottom line. Those who see the global market as a real opportunity – not just a place to dump surplus – will still be milking cows when this shakes out. The U.S. can become a consistent global supplier of high-quality butterfat, but it’ll take patience, investment, and a long-term vision.

Learn more:

Join the Revolution!

Join over 30,000 successful dairy professionals who rely on Bullvine Daily for their competitive edge. Delivered directly to your inbox each week, our exclusive industry insights help you make smarter decisions while saving precious hours every week. Never miss critical updates on milk production trends, breakthrough technologies, and profit-boosting strategies that top producers are already implementing. Subscribe now to transform your dairy operation’s efficiency and profitability—your future success is just one click away.

NewsSubscribe
First
Last
Consent

Why Boosting Butterfat and Protein Is Key to Higher Profits

Boost your dairy profits by increasing butterfat and protein. Are you maximizing your milk’s revenue potential?

Summary: Have you ever wondered how the current trends in milk component levels could affect your bottom line? With butterfat levels climbing and milk protein prices dropping, it’s more important than ever for dairy farmers to keep an eye on these critical metrics. Recent data shows that actual butterfat levels are now at 4.2% and milk protein at 3.3%, significantly impacting producer revenue compared to industry averages. The high protein and butterfat content in Class III milk increases prices and revenues. To maximize earnings, consider the specific demands of your dairy herd and know how your herd compares to protein and butterfat levels. Strategies to boost butterfat and protein levels include feeding adjustments, genetic selection, and effective herd management. However, increasing a herd’s butterfat and protein levels can be challenging due to factors like feed costs, genetics, health issues, environmental factors, and regulatory constraints.

  • Recent trends show a rise in butterfat levels to 4.2% and a dip in milk protein prices, critically affecting dairy farmers’ revenue.
  • High protein and butterfat content in Class III milk significantly boosts prices and earnings for producers.
  • Ensuring your herd meets or exceeds these component levels involves strategies like feeding adjustments, genetic selection, and effective herd management.
  • Challenges to increasing butterfat and protein levels include feed costs, genetics, health issues, environmental factors, and regulatory constraints.
milk components, butterfat, protein, dairy farms, Class III milk, high protein, high butterfat, milk prices, revenue, butterfat prices, milk protein prices, dairy herd, earnings, farm profits, feed adjustments, genetic selection, herd management, high-fiber forages,

Have you ever wondered why specific dairy farms prosper and others struggle? The solution is frequently found in the milk’s components, notably butterfat and protein. According to the Agricultural Marketing Service (AMS), Class III milk with more excellent protein and butterfat content commands higher prices, significantly increasing revenues. Recent AMS studies state that “butterfat keeps producer milk prices reasonable.” Higher milk protein levels directly influence income and enhance the quality of dairy products, which fetch higher prices. According to industry statistics, Class III milk has 3.0% protein and 3.5% butterfat. In contrast, the averages for 2024 are 3.3% and 4.2%, respectively, with a current protein-butterfat pricing spread of $5.21 per cwt and an actual average spread of $6.87 per cwt. Understanding these components is critical for maintaining competitiveness and profitability in today’s industry.

Butterfat and Protein: The Hidden Lifelines of Your Dairy Business 

Whether you milk cows in a conventional or contemporary dairy state, it’s essential to understand that butterfat and protein are more than simply indicators of milk quality. They have the keys to your income.

Let us not mince words: more significant amounts of these components may imply the difference between breaking even and making a profit. The change in producer income depending on actual component amounts is an obvious sign. While milk protein prices have fallen, the consistent rise in butterfat prices has saved many farmers. Knowing your herd’s milk protein and butterfat levels and their relation to AMS index pricing might give valuable information. Consider it as unleashing an additional layer of potential in every gallon of milk you make.

So, the next time you evaluate your herd’s performance, pay close attention to these components. They are more than simply statistics; they are the foundation of your dairy company.

Focus Your Farm’s Future on Current Market Trends 

YearButterfat Price ($/lb)Milk Protein Price ($/lb)Butterfat Level (%)Milk Protein Level (%)Price Spread ($/cwt)
20212.403.503.73.14.92
20222.803.203.83.25.21
20233.202.804.03.26.21
20243.502.604.23.36.87

Current market patterns reveal a lot about where our priorities should be. According to the most recent Agricultural Marketing Service (AMS) statistics, butterfat prices have risen over the last three years, but milk protein prices have fallen. This change makes butterfat an essential factor in sustaining fair milk pricing.

Is Your Herd Meeting Its Full Potential? Focus on Protein and Butterfat Levels 

Consider the specific demands of your dairy herd. Do you know how your herd’s milk compares to protein and butterfat? While AMS gives a broad index, your herd’s levels are critical to maximize earnings. The AMS index pricing is a benchmark that reflects the market value of milk based on its protein and butterfat levels. Understanding how your herd’s levels compare to this index can provide valuable insights into your farm’s profitability. Have you investigated how your herd compares this year, with average protein levels of 3.3% and butterfat at 4.2%? Even slight variations might have a significant effect on your bottom line. Knowing these facts may help you make more educated and intelligent business choices.

Boost Your Dairy Farm’s Profits by Focusing on Butterfat Levels 

Let’s look at the revenue impact: the difference between protein and butterfat pricing is significant. The current spread, which is the difference between the prices of protein and butterfat, is $5.21 per cwt., but recent data suggests it might rise to $6.87 per cwt. Concentrating on butterfat may significantly increase your income. Consider the impact that additional attention may have on your bottom line!

To paint a clearer picture, let’s break down the potential return on investment (ROI) if you concentrate on elevating your butterfat levels: 

Let’s consider the potential for increased profitability. If you can achieve the higher spread of $ 6.87 per cwt., the Revenue from Butterfat alone would be: 

Revenue from Butterfat = 100,000 pounds / 100 * $5.21Revenue from Butterfat = $5,210 per month 

Let’s consider if you can achieve the higher spread of $6.87 per cwt.: 

Revenue from Butterfat = 100,000 pounds / 100 * $6.87

Revenue from Butterfat = $6,870 per month 

This difference translates to: 

Additional Revenue = $6,870 – $5,210

Additional Revenue = $1,660 per month 

Over a year, this focus could net you an extra: 

Annual Additional Revenue = $1,660 * 12

Annual Additional Revenue = $19,920 

Understanding and adapting to these market trends can significantly impact your dairy farm’s profitability. Have you considered how your herd’s makeup stacks up? Your dairy farm’s future may depend on these tiny but essential modifications.

Ready to Boost Your Herd’s Butterfat and Protein Levels? Here’s How: 

Are you looking to increase your herd’s butterfat and protein levels? Here are some practical strategies: 

  • Feed Adjustments 
    What your cows consume directly influences the quality of their milk. Consider high-fiber forages such as alfalfa and grass hay to increase butterfat levels. Soybean or canola meals may be valuable sources of protein. Also, pay attention to the energy balance in the feed; inadequate energy might reduce butterfat and protein levels.
  • Genetic Selection 
    Did you know that genetics has an essential influence on milk components? Choose bulls with high estimated breeding values (EBVs) for butterfat and protein. EBVs measure an animal’s genetic potential for specific traits like milk quality. Breeding cows from high-component sires with high EBVs may gradually increase the milk quality of your herd.
  • Herd Management 
    Effective management strategies may make a significant impact. Ensure your cows are healthy and stress-free; these aspects may affect milk quality. Regular health checks, pleasant housing, and reducing the stress of milking processes are also necessary.
  • Monitor and Adjust
    Regular monitoring and adjusting are crucial to maintaining and improving your herd’s butterfat and protein levels. Minor modifications may result in substantial benefits, so remember the value of regular monitoring and adjusting. By fine-tuning these regions, you should observe an increase in butterfat and protein levels, raising your earnings. Every little bit matters, and making simple, consistent improvements may greatly enhance milk quality.

Hurdles to Higher Butterfat and Protein Levels: What You Need to Know

Let’s be honest: increasing your herd’s butterfat and protein levels can be challenging. What are the major problems here?

  • Feed Costs: Although high-quality feed may be costly, it is necessary to boost these levels. Choose a well-balanced diet high in crucial nutrients, and consider utilizing feed additives to increase butterfat and protein production.
  • Genetics: Not every cow is made equal. Individuals with higher genetic potential may produce more butterfat and protein. To address this, execute a systematic breeding program to pick high-component sires, progressively increasing your herd’s genetic potential.
  • Health Issues: Cows suffering from disease or stress do not produce optimally. To keep your herd in good health, schedule frequent veterinarian check-ups, keep the barn clean and pleasant, and watch for any symptoms of illness.
  • Environmental Factors: Weather and climate may alter feed quality and cow comfort, influencing milk composition. Take steps to reduce these impacts, such as providing shade and water in hot weather and ensuring enough shelter during winter.
  • Regulatory Constraints: Different areas’ legislation may restrict your capacity to extend or adjust your business. To handle these difficulties, stay current on local legislation and consult with agricultural extension organizations.

By tackling these issues squarely, you’ll be better positioned to increase those crucial butterfat and protein levels. Remember that every step you take toward development may result in a more prosperous and sustainable dairy enterprise.

The Bottom Line

Prioritizing greater butterfat and protein levels is critical for remaining competitive in today’s market. Understanding current trends and making intelligent modifications may make your dairy farm significantly successful. So, are you prepared to increase your farm’s profitability?

Learn more:

Join the Revolution!

Bullvine Daily is your go-to e-zine for staying ahead in the dairy industry. We bring you the week’s top news, helping you manage tasks like milking cows, mixing feed, and fixing machinery. With over 30,000 subscribers, Bullvine Daily keeps you informed so you can focus on your dairy operations.

NewsSubscribe
First
Last
Consent

Why Are Class III Milk Prices So Low? Causes, Consequences, and Solutions

Uncover the factors behind the low Class III milk prices and delve into practical measures to enhance milk protein and butterfat content. What strategies can producers and processors implement for adaptation?

The U.S. dairy industry faces a critical challenge: persistently low Class III milk prices. These prices, which comprise over 50% of the nation’s milk usage and are primarily used for cheese production, are vital for the economic stability of dairy farmers and the broader market. The current price indices reveal that Class III milk prices align with the average of the past 25 years, raising concerns about profitability and sustainability. This situation underscores the urgent need for all stakeholders in the dairy industry to come together, collaborate, and explore the underlying factors and potential strategies for improvement.

Class III Milk Prices: A Quarter-Century of Peaks and Troughs

Over the past 25 years, Class III milk prices have fluctuated significantly, reflecting the dairy industry’s volatility. Prices have hovered around an average value, influenced by supply and demand, production costs, and economic conditions. 

In the early 2000s, prices rose due to increased demand for cheese and other dairy products. However, the 2008 financial crisis led to a sharp decline as consumer demand dropped and exporters faced challenges. 

Post-crisis recovery saw gradual price improvements but with ongoing unpredictability. Stability in the mid-2010s was periodically interrupted by export market changes, feed cost fluctuations, and climatic impacts on milk production. Increased production costs from 2015 to 2020 and COVID-19 disruptions further pressured prices. 

In summary, while the average Class III milk price may seem stable over the past 25 years, the market has experienced significant volatility. Understanding these trends is not just important; it’s critical for navigating current pricing issues and strategizing for future stability. This understanding empowers us to make informed decisions and take proactive steps to address the challenges in the dairy industry.

The Core Components of Class III Milk Pricing: Butterfat, Milk Protein, and Other Solids

Examining Class III milk prices reveals crucial trends. Due to high demand and limited supply, butterfat prices have soared 76% above their 25-year averages. Meanwhile, milk protein prices have dropped by 32%, impacting the overall Class III price, essential for cheese production. Other solids, contributing less to pricing, have remained stable. These disparities call for strategic adjustments in pricing formulas to better align with market conditions and ensure sustainable revenues for producers.

Dissecting the Price Dynamics of Butter, Cheese, and Dry Whey in Class III Milk Pricing 

The prices of butter, cheese, and dry whey are crucial to understanding milk protein prices and the current state of Class III milk pricing

Butter prices have skyrocketed by 70% over the 25-year average due to increased consumer demand and tighter inventories. This marks a significant shift from its historically stable pricing. 

Cheese prices have increased slightly, indicating steady demand both domestically and internationally. This trend reflects strong export markets and stable milk production, aligning closely with historical averages. 

In contrast, dry whey prices have remained steady, reflecting its role as a stable commodity in the dairy sector—consistent demand in food manufacturing and as a nutritional supplement balances any supply fluctuations from cheese production. 

Together, these trends showcase the market pressures and consumer preferences affecting milk protein prices. Understanding these dynamics is critical to tackling the broader challenges in Class III milk pricing.

Decoding the USDA Formula: The Intricacies of Milk Protein Pricing in Class III Milk

Understanding Class III milk pricing requires examining the USDA’s formula for milk protein. This formula blends two critical components: the price of cheese and the butterfat value of cheese compared to butter. 

Protein Price = ((Cheese Price – 0.2003) x 1.383) + ((((Cheese Price – 0.2003) x 1.572) – Butterfat Price x 0.9) x 1.17) 

The first part, ((Cheese Price—0.2003) x 1.383) depends on the cheese market price, which has been adjusted slightly by $0.2003. Higher cheese prices generally boost milk protein prices. 

The second part, ((((Cheese Price – 0.2003) x 1.572) – Butterfat Price x 0.9) x 1.17), is more intricate. It adjusts the cheese price by 1.572, subtracts 90% of the butterfat price, and scales the result by 1.17 to match industry norms. 

This formula was based on the assumption that butterfat’s value in cheese would always exceed that in butter. With butterfat fetching higher prices due to increased demand and limited supply, the formula undervalues protein from cheese. This mismatch has led to stagnant protein prices despite rising butter and cheese prices. 

The formula must be reevaluated to align with today’s market, ensuring fair producer compensation and market stability.

Unraveling the Web of Stagnant Pricing in Class III Milk

Stagnant pricing in Class III milk can be traced to several intertwined factors. Inflation is a key culprit, having significantly raised production costs for dairy farmers over the past 25 years—these increasing expenses span wages, health premiums, utilities, and packaging materials. Yet, the value received for Class III milk has not kept pace, resulting in a perceived price stagnation. 

Another factor is the shift in the value relationship between butterfat and cheese. Historically, butterfat’s worth was higher in cheese production than in butter, a dynamic in the USDA pricing formula for milk protein. Today’s market conditions have reversed this, with butterfat now more valuable in butter than in cheese. Consequently, heavily based on cheese prices, the existing formula must adapt better, contributing to stagnant milk protein prices. 

Also impacting this situation are modest increases in cheese prices compared to the substantial rise in butterfat prices. The stable prices of dry whey further exert minimal impact on Class III milk prices. 

Addressing these challenges requires a multifaceted approach, such as reconsidering USDA pricing formulas and strategically managing dairy production and processing to align with current market realities.

Class III Milk Producers: Navigating Low Prices through Strategic Adaptations

Class III milk producers have adapted to persistently low prices through critical strategies. Over the past 25 years, many have expanded their herds to leverage economies of scale, reducing costs per gallon by spreading fixed costs over more milk units. 

Additionally, increased milk production per cow has been achieved through breeding, nutrition, and herd management advances. Focusing on genetic selection, high-productivity cows are bred, further optimizing dairy operations

Automation has also transformed dairy farming, with robotic milking systems and feeding solutions reducing labor costs and improving efficiency. These technologies help manage larger herds without proportional labor increases, counteracting low milk prices. 

Focusing on higher milk solids, particularly butterfat, and protein, offers a competitive edge. Producers achieve higher milk quality by enhancing feed formulations and precise nutrition, yielding better prices in markets with high-solid content.

An Integrated Strategy for Optimizing Class III Milk Prices

Improving Class III milk prices requires optimizing production and management across the dairy supply chain. Increasing butterfat levels in all milk classes can help align supply with demand, especially targeting regions with lower butterfat production, like Florida. This coordinated effort can potentially lower butterfat prices and stabilize them. 

Balancing protein and butterfat ratios in Class III milk is crucial. Enhancing both components can increase cheese yield efficiency, reduce the milk needed for production, and lower costs. This can also lead to better control of cheese inventories, supporting higher wholesale prices. 

Effective inventory management is critical. Advanced systems and predictive analytics can help producers regulate supply, prevent glutes, and stabilize prices. Maintaining a balance between supply and demand is crucial for the dairy sector’s economic health. 

These goals require collaboration among producers, processors, and organizations like Ohio State University Extension, which provides essential research and services. Modernizing Federal Milk Marketing Orders (FMMO) to reflect current market realities is also vital for fair pricing. 

Addressing Class III milk pricing challenges means using technology, improving farm practices, and fine-tuning the supply chain. Comprehensive strategies are essential for price stabilization, benefiting all stakeholders.

Strategic Collaborations: Empowering Stakeholders to Thrive in the Class III Milk Market

Organizations and suppliers play a critical role in optimizing Class III milk prices. Entities like Penn State Extension, in collaboration with the Pennsylvania Department of Agriculture and the USDA’s Risk Management Agency, offer valuable resources and guidance. These organizations provide educational programs to help dairy farmers understand market trends and best practices in milk production. 

The Ohio State University Extension and specialists like Jason Hartschuh advance dairy management and precision livestock technologies, sharing research and providing hands-on support to enhance milk production processes. 

The FMMO (Federal Milk Marketing Order) modernization process aims to update milk pricing regulations, ensuring a more equitable and efficient market system. Producers’ participation through referendums is crucial for representing their interests. 

Processors should work with packaging suppliers to manage material costs, establish contracts to mitigate financial pressures and maintain stable operational costs

These collaborations offer numerous benefits: improved milk yield and quality, better financial stability, and a balanced supply-demand dynamic for butterfat and protein. Processors benefit from consistent milk supplies and reduced production costs. 

In conclusion, educational institutions, agricultural agencies, and strategic supply chain collaborations can significantly enhance the Class III milk market, equipping producers and processors to handle market fluctuations and achieve sustainable growth.

The Bottom Line

The low-Class III milk prices, driven by plummeting milk protein prices and stagnant other solids pricing, highlight an outdated USDA formula that misjudges current market conditions where butterfat is valued more in butter than in cheese. Compared to the past 25 years, inflation-adjusted stagnation underscores the need for efficiency in milk production via larger herds, higher yields per cow, and automation. 

To address these issues, increasing butterfat and protein levels in Class III milk will improve cheese yield and better manage inventories. Engaging organizations and suppliers in these strategic adjustments is crucial. Fixing the pricing formula and balancing supply and demand is essential to sustaining the dairy industry, protecting producers’ economic stability, and securing the broader dairy supply chain.

Key Takeaways:

  • Class III milk, primarily used for cheese production, constitutes over 50% of U.S. milk consumption.
  • Despite an increase in butterfat prices by 76%, milk protein prices have plummeted by 32% compared to the 25-year average.
  • The USDA formula for milk protein pricing is a critical factor, with its reliance on cheese and butterfat values leading to current pricing challenges.
  • Inflation over the last 25 years contrasts sharply with stagnant Class III milk prices, necessitating strategic adaptations by producers.
  • Key strategies for producers include increasing butterfat levels, improving protein levels, and tighter inventory management for cheese production.
  • Collaborations between producers and processors are essential to drive changes and stabilize Class III milk prices.

Summary:

The U.S. dairy industry is grappling with a significant challenge: persistently low Class III milk prices, which account for over 50% of the nation’s milk usage and are primarily used for cheese production. These prices align with the average of the past 25 years, raising concerns about profitability and sustainability. Over the past 25 years, Class III milk prices have fluctuated significantly, reflecting the dairy industry’s volatility.

In the early 2000s, prices rose due to increased demand for cheese and other dairy products. However, the 2008 financial crisis led to a sharp decline as consumer demand dropped and exporters faced challenges. Post-crisis recovery saw gradual price improvements but with ongoing unpredictability. Stability in the mid-2010s was periodically interrupted by export market changes, feed cost fluctuations, and climatic impacts on milk production. Increased production costs from 2015 to 2020 and COVID-19 disruptions further pressured prices.

The core components of Class III milk pricing include butterfat, milk protein, and other solids. Butterfat prices have soared 76% above their 25-year averages due to high demand and limited supply, while milk protein prices have dropped by 32%, impacting the overall Class III price, essential for cheese production. Other solids, contributing less to pricing, have remained stable.

Understanding the price dynamics of butter, cheese, and dry whey in Class III milk pricing is crucial for navigating current pricing issues and strategizing for future stability. Butter prices have skyrocketed by 70% over the 25-year average due to increased consumer demand and tighter inventories. Cheese prices have increased slightly, indicating steady demand both domestically and internationally, while dry whey prices have remained steady, reflecting its role as a stable commodity in the dairy sector.

Understanding Class III milk pricing requires examining the USDA’s formula for milk protein, which blends two critical components: the price of cheese and the butterfat value of cheese compared to butter. This formula undervalues protein from cheese, leading to stagnant protein prices despite rising butter and cheese prices. The formula must be reevaluated to align with today’s market, ensuring fair producer compensation and market stability.

The stagnant pricing in Class III milk can be attributed to several factors, including inflation, the shift in the value relationship between butterfat and cheese, and modest increases in cheese prices. To address these challenges, a multifaceted approach is needed, such as reconsidering USDA pricing formulas and strategically managing dairy production and processing to align with current market realities.

Class III milk producers have adapted to persistently low prices through critical strategies, such as expanding herds to leverage economies of scale, increasing milk production per cow through breeding, nutrition, and herd management advances, and focusing on higher milk solids, particularly butterfat, and protein. This has led to better control of cheese inventories, supporting higher wholesale prices.

Improving Class III milk prices requires optimizing production and management across the dairy supply chain. Balancing protein and butterfat ratios in Class III milk is crucial, as it can increase cheese yield efficiency, reduce milk needed for production, and lower costs. Effective inventory management is essential, and advanced systems and predictive analytics can help producers regulate supply, prevent glutes, and stabilize prices.

Collaboration among producers, processors, and organizations like Ohio State University Extension, which provides essential research and services, and modernizing Federal Milk Marketing Orders (FMMO) to reflect current market realities is also vital for fair pricing. Comprehensive strategies are essential for price stabilization, benefiting all stakeholders.

Organizations and suppliers play a critical role in optimizing Class III milk prices. Entities like Penn State Extension, in collaboration with the Pennsylvania Department of Agriculture and the USDA’s Risk Management Agency, offer valuable resources and guidance to dairy farmers. They provide educational programs to help dairy farmers understand market trends and best practices in milk production.

The FMMO modernization process aims to update milk pricing regulations, ensuring a more equitable and efficient market system. Producers’ participation through referendums is crucial for representing their interests. Processors should work with packaging suppliers to manage material costs, establish contracts to mitigate financial pressures, and maintain stable operational costs.

In conclusion, educational institutions, agricultural agencies, and strategic supply chain collaborations can significantly enhance the Class III milk market, equipping producers and processors to handle market fluctuations and achieve sustainable growth. The low-Class III milk prices, driven by plummeting milk protein prices and stagnant other solids pricing, highlight an outdated USDA formula that misjudges current market conditions where butterfat is valued more in butter than in cheese.

Send this to a friend