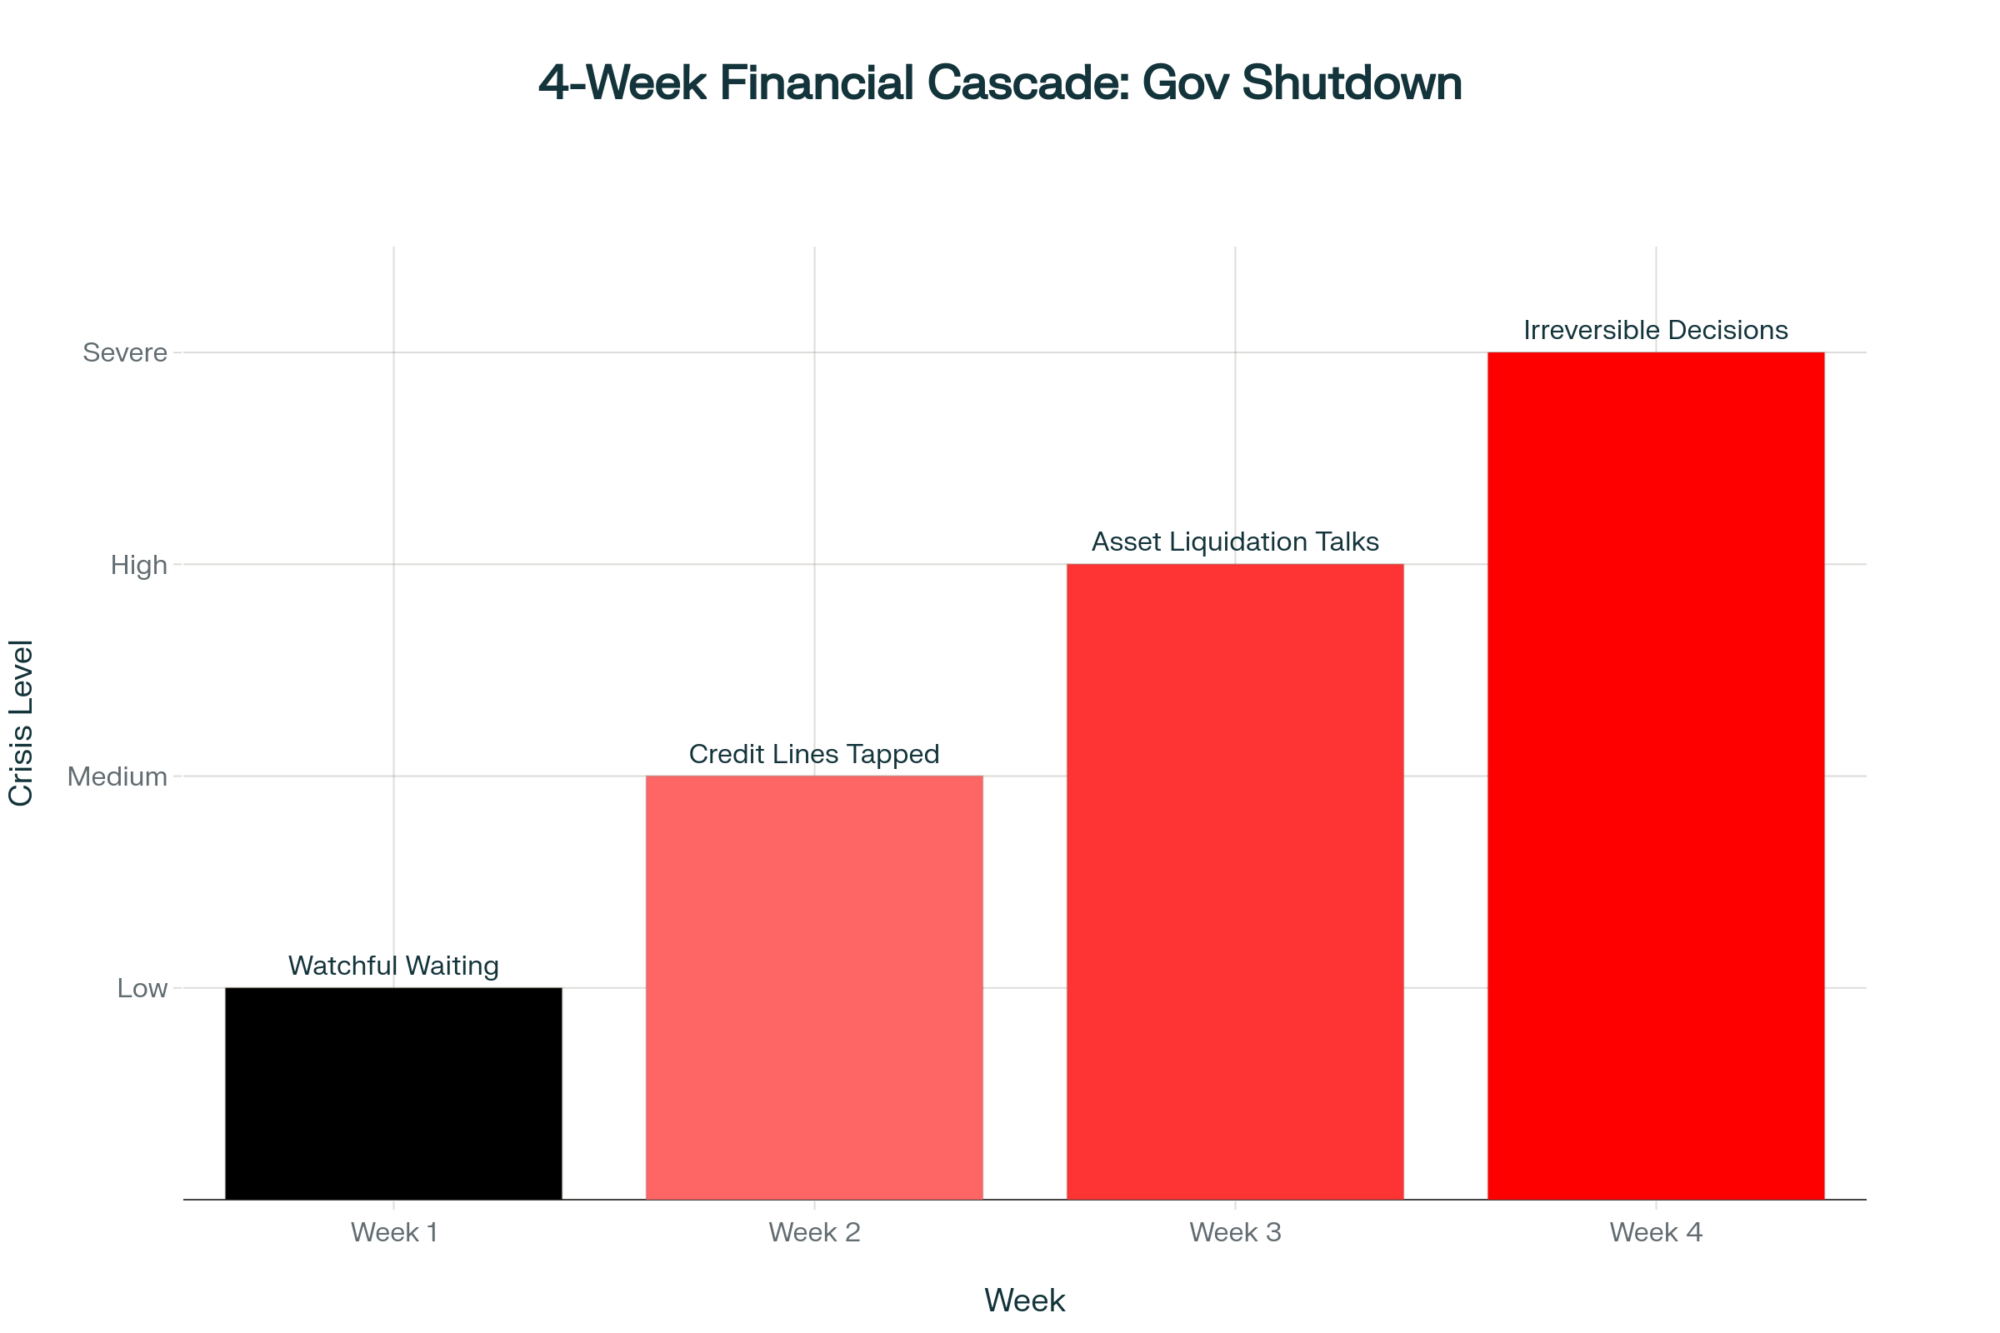
When thousands of farmers from across Europe shut down the EU capital, they weren’t just protesting a trade deal. They were raising questions that dairy producers on both sides of the Atlantic would do well to consider.
EXECUTIVE SUMMARY: On December 18, 10,000 farmers from 25 European countries blocked the streets of Brussels and forced a delay of the EU-Mercosur trade agreement—the largest in EU history. The deal would open European markets to 99,000 tonnes of South American beef and 30,000 tonnes of cheese produced at costs 40-60% below EU operations. Here’s why that matters if you’re milking cows in Wisconsin or shipping from Ontario: displaced European production will intensify competition in export markets where North American dairy sells—Mexico, North Africa, Southeast Asia. The timing is challenging. U.S. consolidation continues to accelerate, with 65% of the national herd now on 1,000+ cow operations, and farm numbers falling from 39,000 to 24,000 in five years. European farmers won a postponement until January 2026, but the structural pressures behind both the protest and the consolidation aren’t slowing down. Now is the time to reassess your operation’s exposure to global market dynamics.

There’s something about the sight of hundreds of tractors blocking a major European capital that cuts through the usual trade policy noise. You know how it goes: trade negotiations happen behind closed doors, and by the time farmers hear the details, the framework is already set. But on December 18, 2025, that dynamic shifted in Brussels.
What struck me about last week’s protest wasn’t just its scale—Copa-Cogeca estimated around 10,000 farmers showed up, with some news reports putting the number closer to 20,000. It was the composition. French dairy farmers standing alongside Dutch cattle producers. Polish grain growers are coordinating with Italian beef operations. German dairy cooperatives are working in lockstep with Spanish agricultural unions. Copa-Cogeca pulled off something genuinely rare: unified, cross-border agricultural action.
The target? The EU-Mercosur free trade agreement—25 years in negotiation, and now potentially weeks away from ratification.
What’s Actually in This Deal
Let’s walk through the numbers, because they explain why farmers drove their tractors into the heart of European governance.

| Product Category | Mercosur Annual Quota (tonnes) | Total EU Production (tonnes) | Quota as % of EU Production |
| Beef | 99,000 | 7,800,000 | 1.3% |
| Poultry | 180,000 | 15,500,000 | 1.2% |
| Cheese | 30,000 | 11,200,000 | 0.27% |
| Milk Powder | 10,000 | 1,850,000 | 0.54% |
The EU-Mercosur agreement would create the world’s largest free trade zone, spanning roughly 780 million consumers across 31 countries. For European agriculture, the provisions are substantial. According to European Commission factsheets released in late 2024, the deal grants Mercosur producers access to EU markets for:
- 99,000 tonnes of beef annually at reduced tariffs
- 180,000 tonnes of poultry
- 30,000 tonnes of cheese duty-free, plus significant milk powder quotas
These aren’t trivial volumes. What stands out here is that the challenge isn’t really the percentage of total EU consumption these imports represent. It’s that they’ll compete directly in commodity beef and dairy segments where European producers already operate on tight margins. The displacement effects tend to concentrate rather than spread evenly across the market.
Understanding the Cost Differential
Here’s where the economics become challenging for European producers—and where North American dairy farmers might recognize some familiar dynamics.
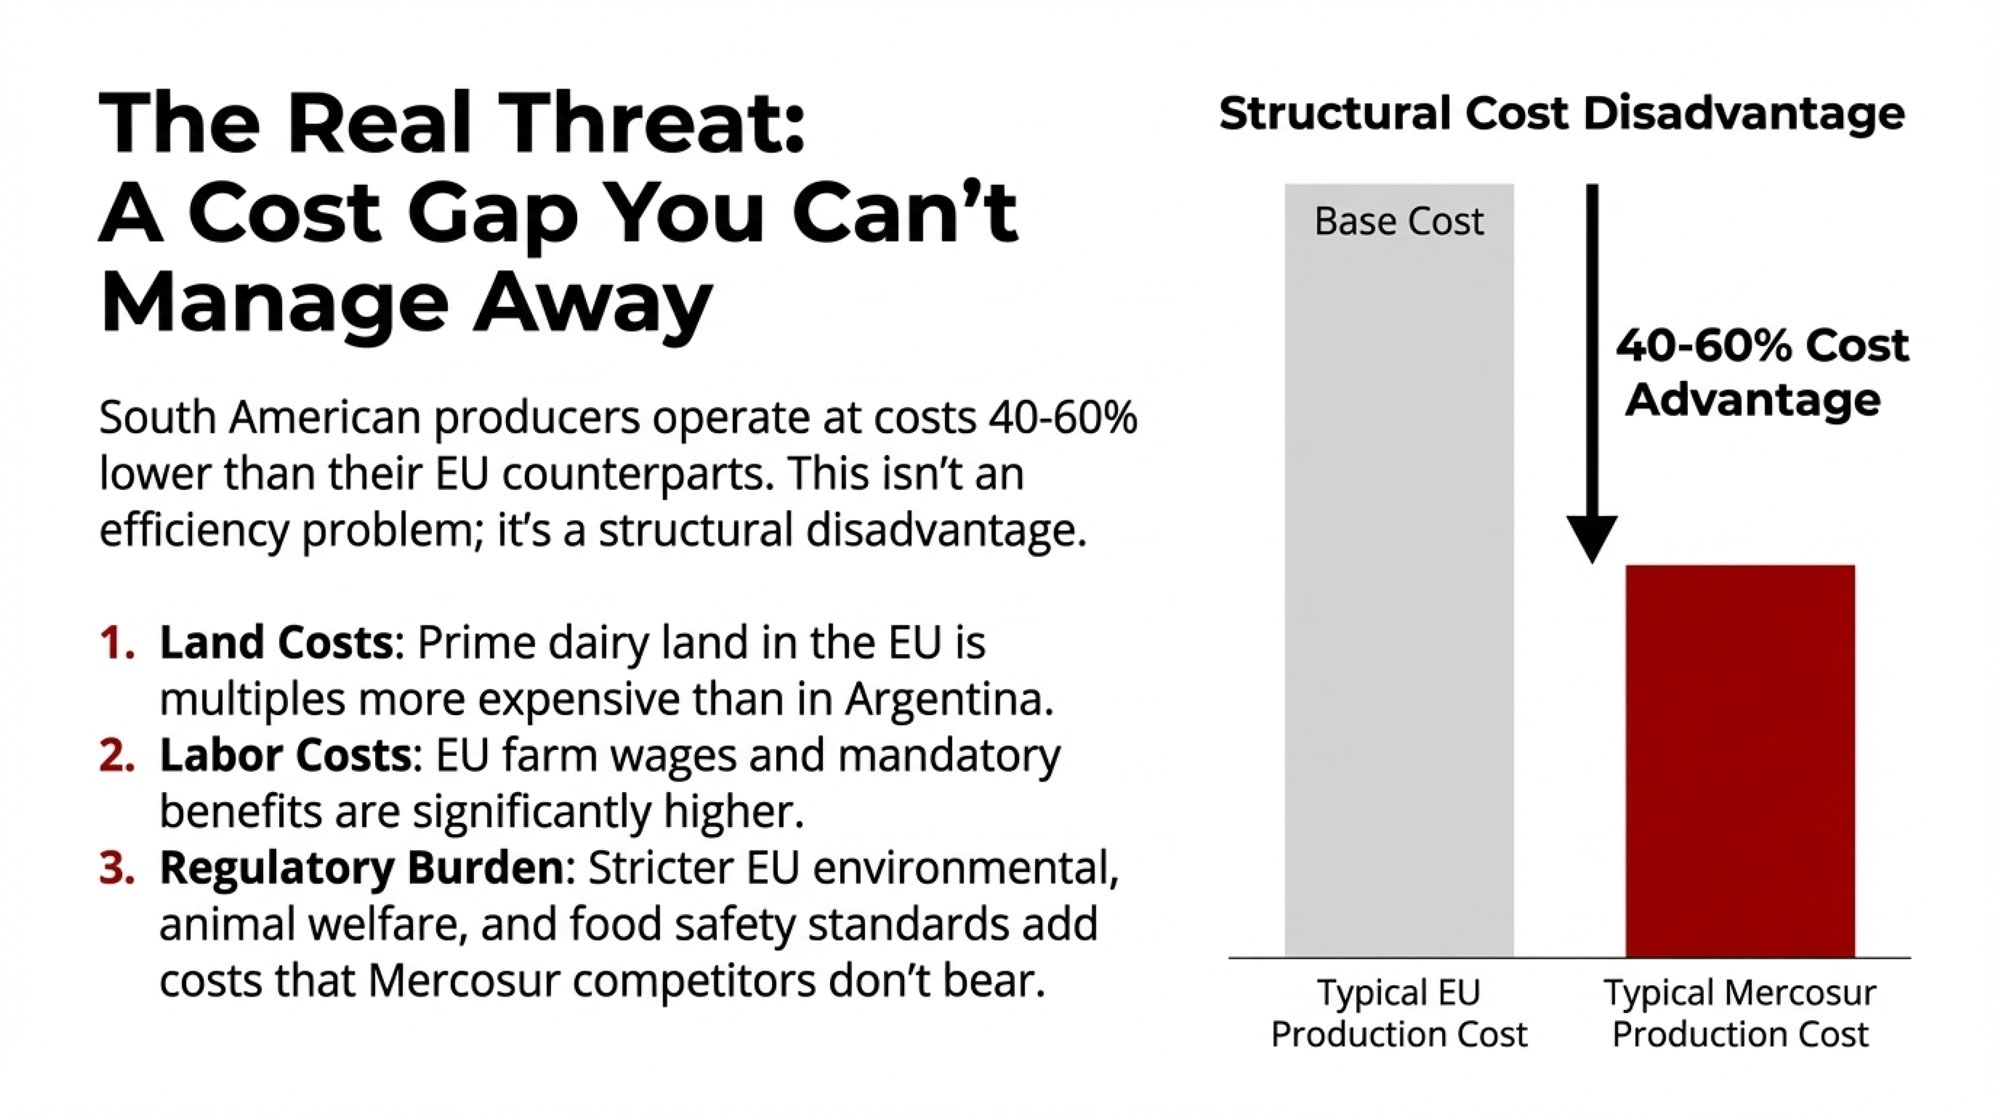
The International Farm Comparison Network tracks dairy production costs across more than 100 countries, and their data helps explain why European farmers view Mercosur competition with such concern. EU production costs typically run somewhere in the €40-50 per 100kg range, while South American producers often operate at costs 40-60% lower. That’s not a gap you can close through better feed efficiency or tighter fresh cow management alone.
The differential is structural. Brazilian and Argentine cost advantages don’t stem from superior efficiency or management practices that European farmers could readily adopt. They reflect fundamental input cost differences.
| Region | Production Cost per 100kg Milk (EUR) | Cost vs. EU Average | Primary Cost Drivers |
| Netherlands | €48 | +14% | Land costs, environmental compliance, labor |
| Germany | €45 | +7% | Animal welfare standards, energy costs |
| France | €42 | Baseline | Regulatory compliance, farm wages |
| Brazil | €22 | -48% | Low land costs, minimal regulation, cheaper labor |
| Argentina | €20 | -52% | Currency advantage, export infrastructure, scale |
| Uruguay | €24 | -43% | Grass-based systems, lower input costs |
Land costs tell part of the story. Prime dairy land in the Netherlands or Denmark is many times more expensive than comparable land in Argentina’s dairy regions. I recently spoke with a Dutch producer who’d done the math on expanding his operation—the land costs alone made the numbers nearly impossible to justify.
Labor compounds the picture. EU dairy farm wages, including mandatory benefits and social contributions, are significantly higher than South American dairy labor costs. We’re talking multiples, not percentages.
Then there’s regulatory compliance. Environmental regulations, animal welfare requirements, and food safety standards significantly increase European milk production costs. These are standards that European consumers broadly support—but they entail costs that Mercosur competitors largely don’t bear. Keep in mind, this isn’t about one system being right or wrong; it’s about the competitive implications when different regulatory environments meet in the same marketplace.
Voices from the Protest
The frustration was evident in Brussels. Belgian dairy farmer Maxime Mabille, speaking to reporters during the protest, put it directly:
“We’re here to say no to Mercosur.”
He accused the European Commission leadership of seeking to “force the deal through,” and sharply criticized the decision-making process.
That frustration is real, and it runs deep among producers who feel caught between rising compliance costs and changing market protections. As many of us have seen in our own markets, when farmers feel unheard through normal channels, they find other ways to make their voices carry.
The sentiment echoed across the protest. Farmers from France, Poland, Italy, and beyond raised similar concerns: they’re being asked to compete on price with operations that face fundamentally different cost structures. Whether you agree with their position or not, it’s a question worth taking seriously.
The Enforcement Question
European Commission officials have pointed to “mirror clauses” in the agreement—provisions requiring Mercosur products to meet EU standards—as the answer to farmer concerns. French President Macron has championed these clauses as a means of ensuring fair competition.
Many farmers remain skeptical. And their caution has some historical grounding worth examining.
The USMCA dairy dispute between the United States and Canada offers an instructive parallel—a case study in how trade agreement enforcement can play out differently than expected.
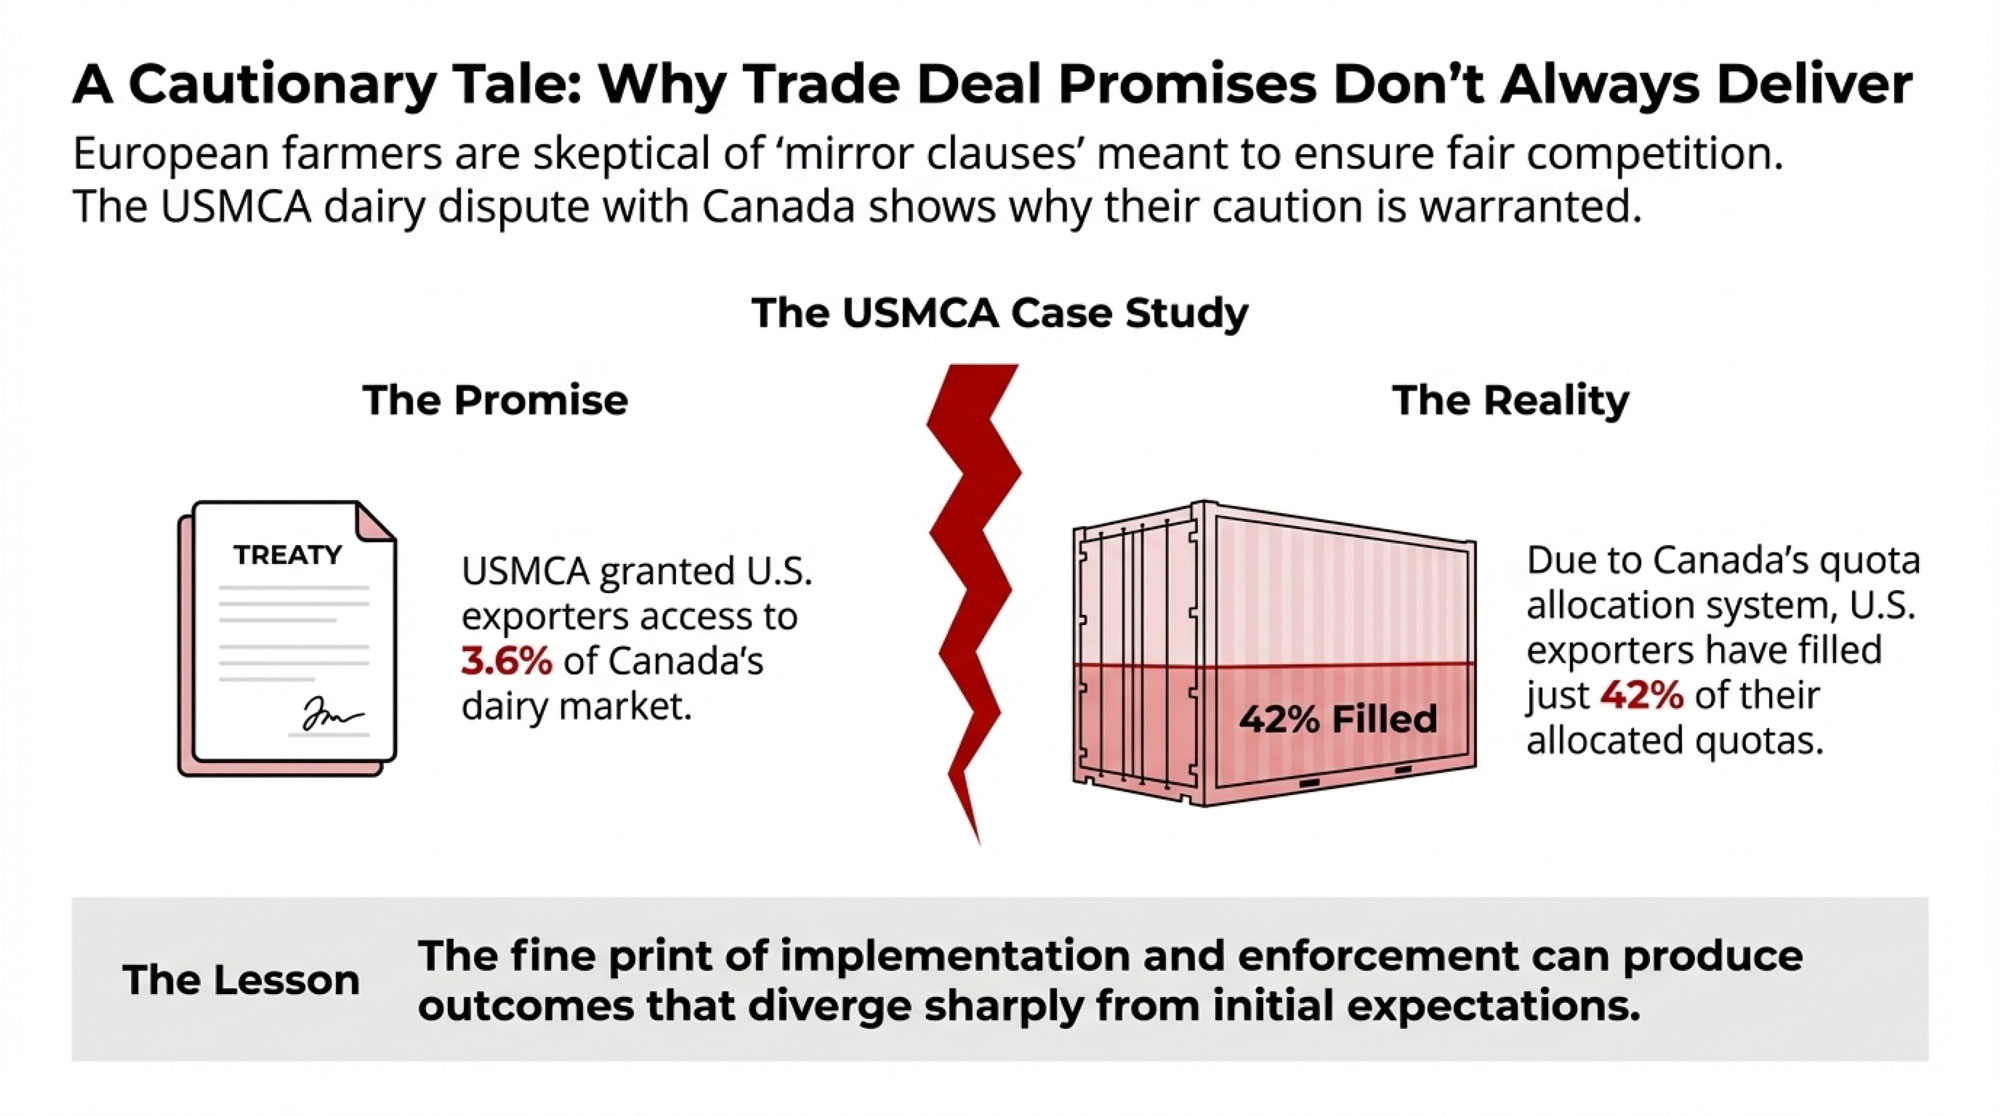
Here’s the background, and you probably know some of this already: When USMCA replaced NAFTA in 2020, U.S. dairy organizations celebrated provisions granting access to 3.6% of Canada’s dairy market through tariff-rate quotas. The U.S. Dairy Export Council projected meaningful market gains once fully implemented.
What actually happened? Canada restructured its quota allocation system in ways that technically complied with USMCA language while producing practical outcomes different from those U.S. negotiators anticipated. The U.S. Trade Representative filed a formal dispute. A USMCA panel ruled in January 2022 that Canada had violated the agreement. Canada was directed to revise its system within 45 days.
Canada complied—by implementing a new allocation methodology. The U.S. filed a second dispute. In November 2023, that panel ruled 2-1 in Canada’s favor, finding the revised system technically compliant.
The result? According to USDA Foreign Agricultural Service data and industry analysis, U.S. exporters have filled just 42% of their allocated Canadian dairy quotas since USMCA implementation—not because of a lack of supply, but because of how the allocation system functions.
Now, reasonable people can disagree about whether Canada acted within its rights or circumvented the agreement’s intent. What’s less debatable is that the outcome differed from what U.S. dairy exporters expected when the agreement was signed. European farmers see potential parallels with Mercosur mirror clauses—standards get written, implementation gets negotiated, and outcomes can diverge from initial expectations. Whether that concern proves warranted remains to be seen.
The View from South America
Something I keep coming back to when analyzing trade disputes: every story has more than two sides. Brazilian and Argentine dairy farmers aren’t operating in some agricultural paradise, even with their cost advantages.
Brazilian agricultural economists note that the dairy sector faces significant infrastructure challenges. Transportation costs to ports can erode much of the production cost advantage. Currency volatility makes planning difficult—the real has moved considerably against the dollar in recent years. And domestic consumption absorbs most production. Brazil isn’t necessarily positioning to flood global markets; they’re working to meet their own growing demand.
Argentina’s situation may be even more challenging. Recent economic reforms have significantly affected Argentine export economics. Argentine farmers face their own structural pressures—just different ones than their European counterparts.
This doesn’t change the competitive dynamics European farmers face. But it’s a useful reminder that agricultural economics rarely produce clear winners, even in seemingly advantageous markets. Dairy farming presents challenges everywhere. The specific difficulties just vary by geography. That’s something producers worldwide can relate to, regardless of which side of any trade agreement they’re on.
The Processor Perspective
Here’s the thing about trade debates—they rarely split cleanly along obvious lines. Not everyone in the European dairy sector views Mercosur with concern. Some processor members of the European Dairy Association see potential opportunities—particularly in sourcing ingredients for value-added products or accessing Mercosur consumer markets for European specialty cheeses.
This split between farmer and processor interests isn’t unique to Europe. North American dairy has long navigated similar dynamics, where processor priorities around ingredient sourcing and market access don’t always align perfectly with producer concerns about farmgate prices. If you’ve sat through cooperative meetings where these tensions surface, you know exactly what I mean—the coffee gets cold while those debates run long. It’s a dynamic worth watching as the Mercosur debate continues, and worth remembering that “the dairy industry” isn’t monolithic in its interests.
Implications for North American Dairy
So what does a European trade fight mean for farmers milking cows in Wisconsin, California, Ontario, or Alberta? More than you might initially think.
The direct exposure isn’t Mercosur products flooding North American markets—tariff structures and USMCA provisions limit that pathway. The indirect effects are more subtle and potentially more meaningful over time.
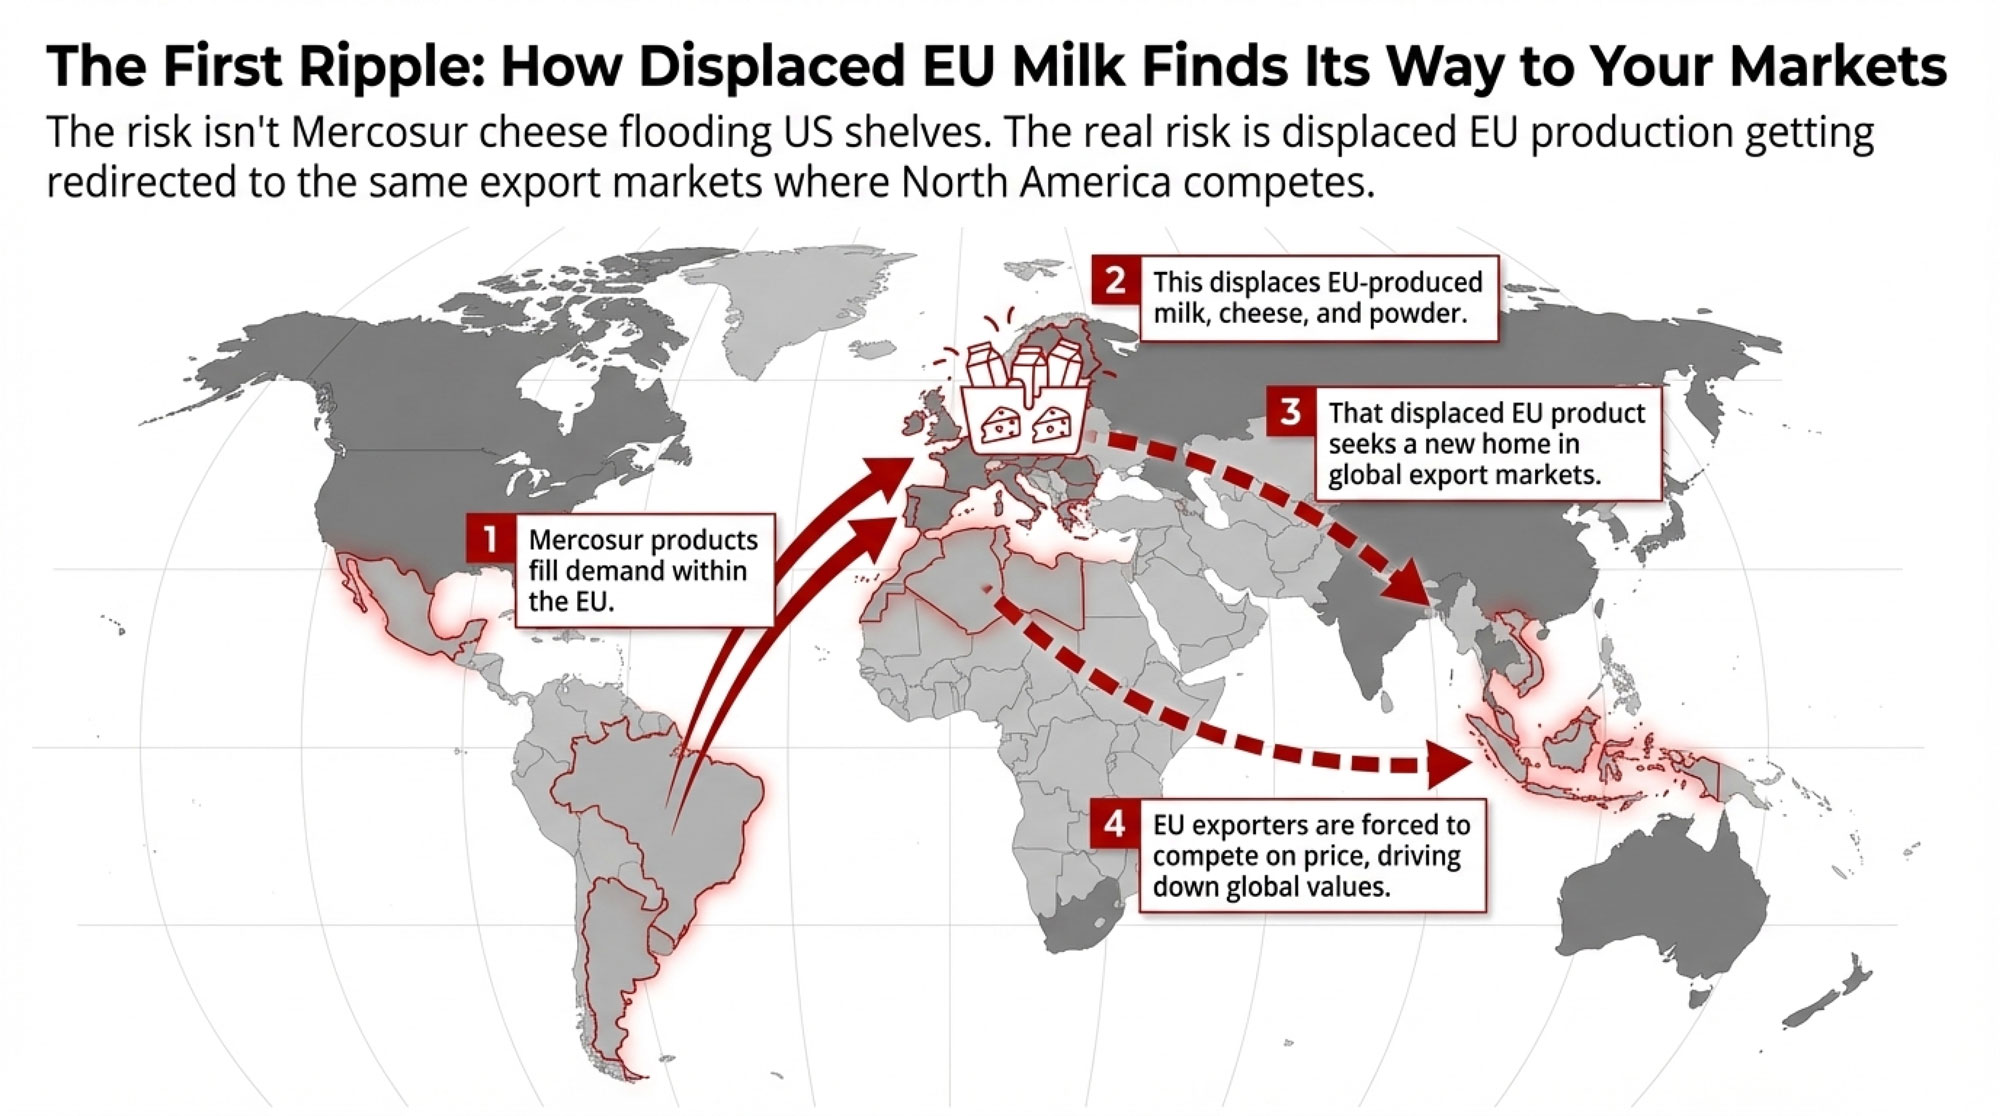
Consider the dynamics: When Mercosur beef and dairy fill European market demand, that production potentially displaces EU output that previously served those markets. But European dairy infrastructure doesn’t simply shut down. Instead, that displaced production seeks alternative export destinations—the same destinations where U.S. and Canadian dairy currently competes.
| Export Market | US Dairy Exports 2024 (million USD) | EU Dairy Exports 2024 (million USD) | Market Growth Rate 2024-25 |
| Mexico | $1,680 | $420 | 5.2% |
| Algeria | $245 | $890 | 8.1% |
| Egypt | $198 | $754 | 6.7% |
| Saudi Arabia | $156 | $423 | 4.3% |
| Indonesia | $134 | $89 | 9.4% |
| Philippines | $112 | $67 | 7.8% |
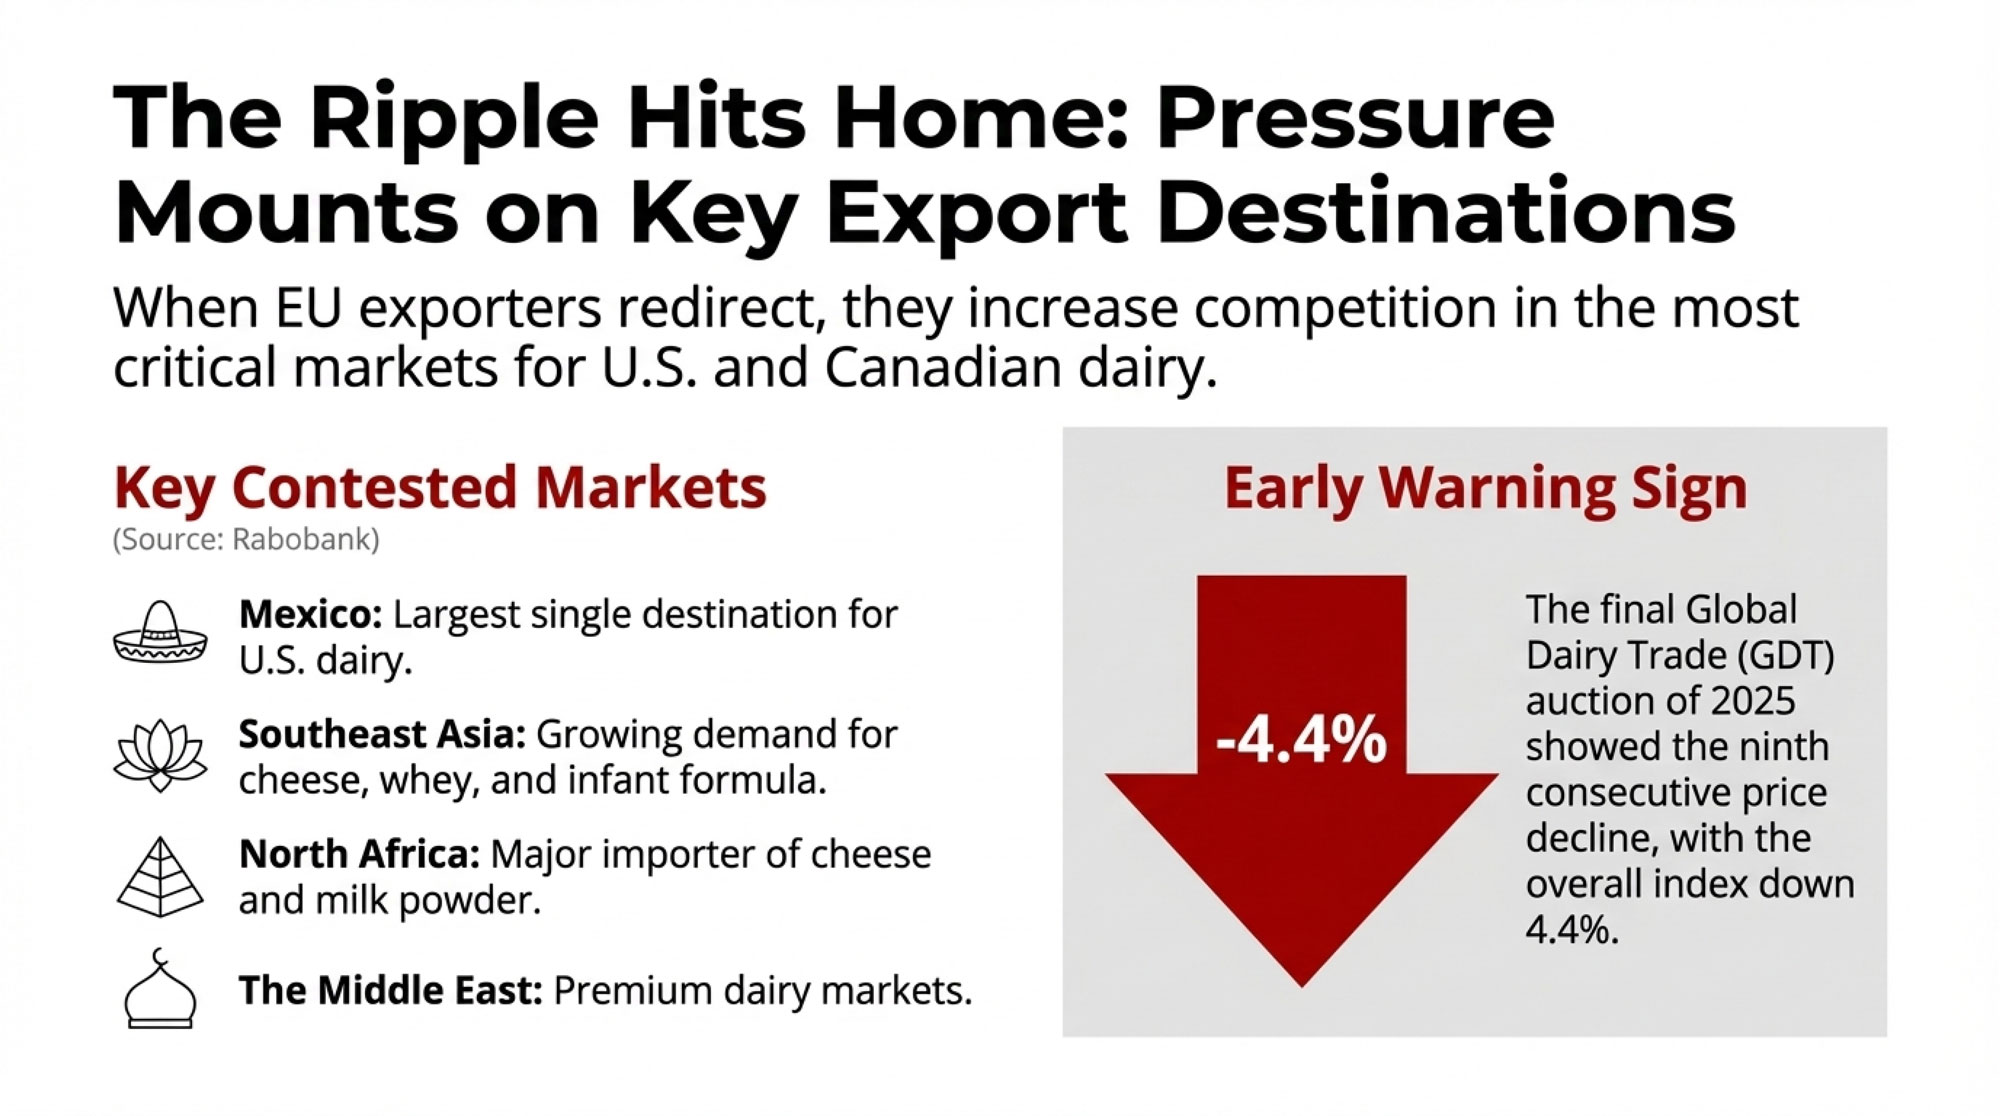
Rabobank’s Q4 2025 Global Dairy Quarterly identified the key contested markets:
- North Africa, particularly Algeria and Egypt, which import significant cheese and milk powder volumes currently supplied by EU, U.S., and New Zealand exporters
- Southeast Asia, with growing demand for cheese, whey protein, and infant formula
- Mexico, which remains the largest single export destination for U.S. dairy
- The Middle East, with its premium dairy markets
When EU exporters facing domestic market pressure redirect to these regions at competitive prices, American and Canadian exporters face a choice: match prices or accept volume adjustments.
For large California operations running thousands of cows with thin margins and significant Class IV exposure, shifts in export market prices can mean the difference between profitability and loss on substantial production volumes. I’ve talked with producers in the Central Valley who watch GDT auction results as closely as their bulk tank readings. Smaller Midwest family operations may feel less direct exposure, but the pricing ripples eventually reach everyone through regional market dynamics.
We’re already seeing some of this in auction data. The final Global Dairy Trade auction of 2025 showed the ninth consecutive price decline, with the GDT Price Index down 4.4% overall. Whole milk powder, skim milk powder, and cheese have all softened from earlier 2025 levels. While many factors influence these prices, the supply-demand balance appears to be shifting.

| Month | GDT Price Index | Change from Peak (%) |
|---|---|---|
| Jan 2025 | 3,520 | 0.0 |
| Mar 2025 | 3,480 | -1.1 |
| May 2025 | 3,390 | -3.7 |
| Jul 2025 | 3,310 | -6.0 |
| Sep 2025 | 3,240 | -8.0 |
| Nov 2025 | 3,180 | -9.7 |
| Dec 2025 | 3,040 | -13.6 |
The Consolidation Picture
Whatever happens with Mercosur specifically, the broader consolidation trend in dairy continues on both sides of the Atlantic. This affects all of us, regardless of where we’re milking cows.
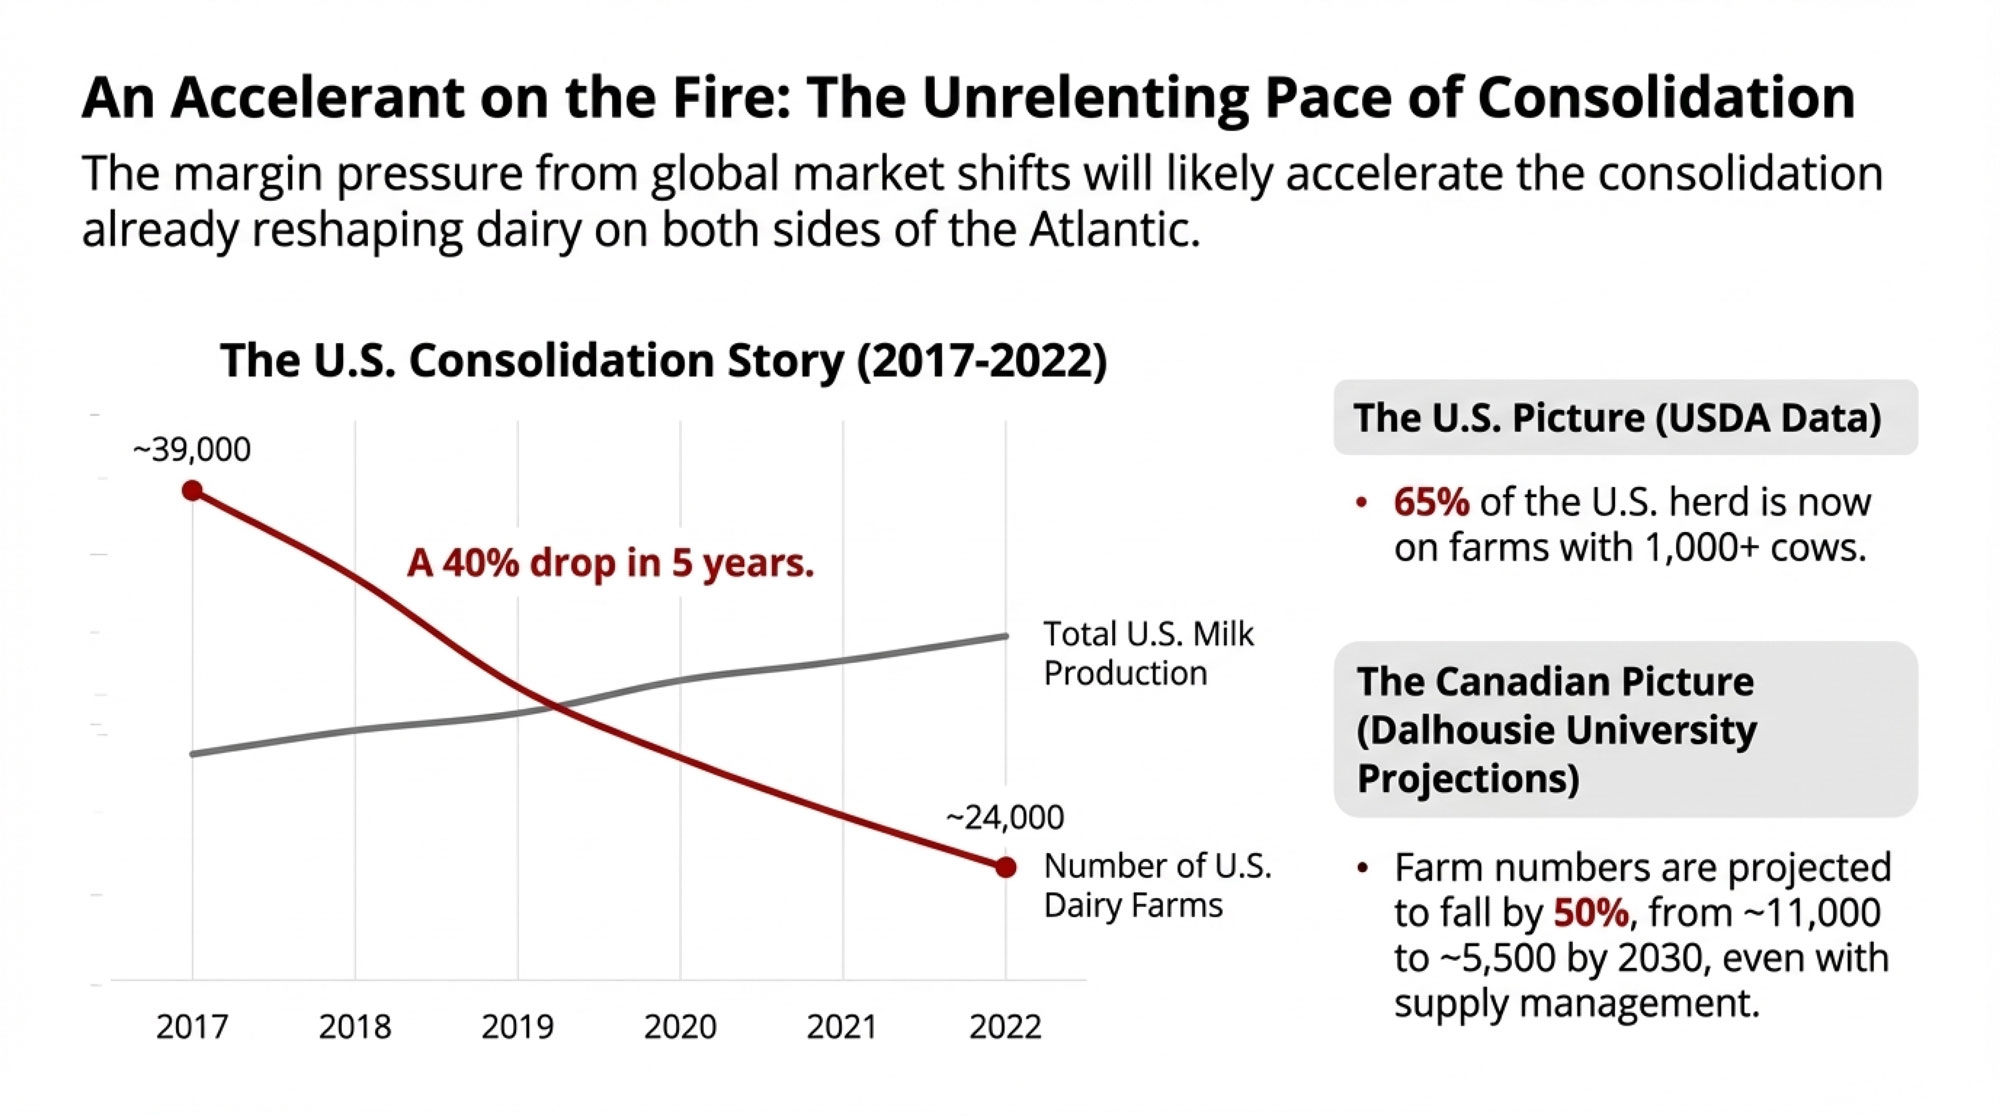
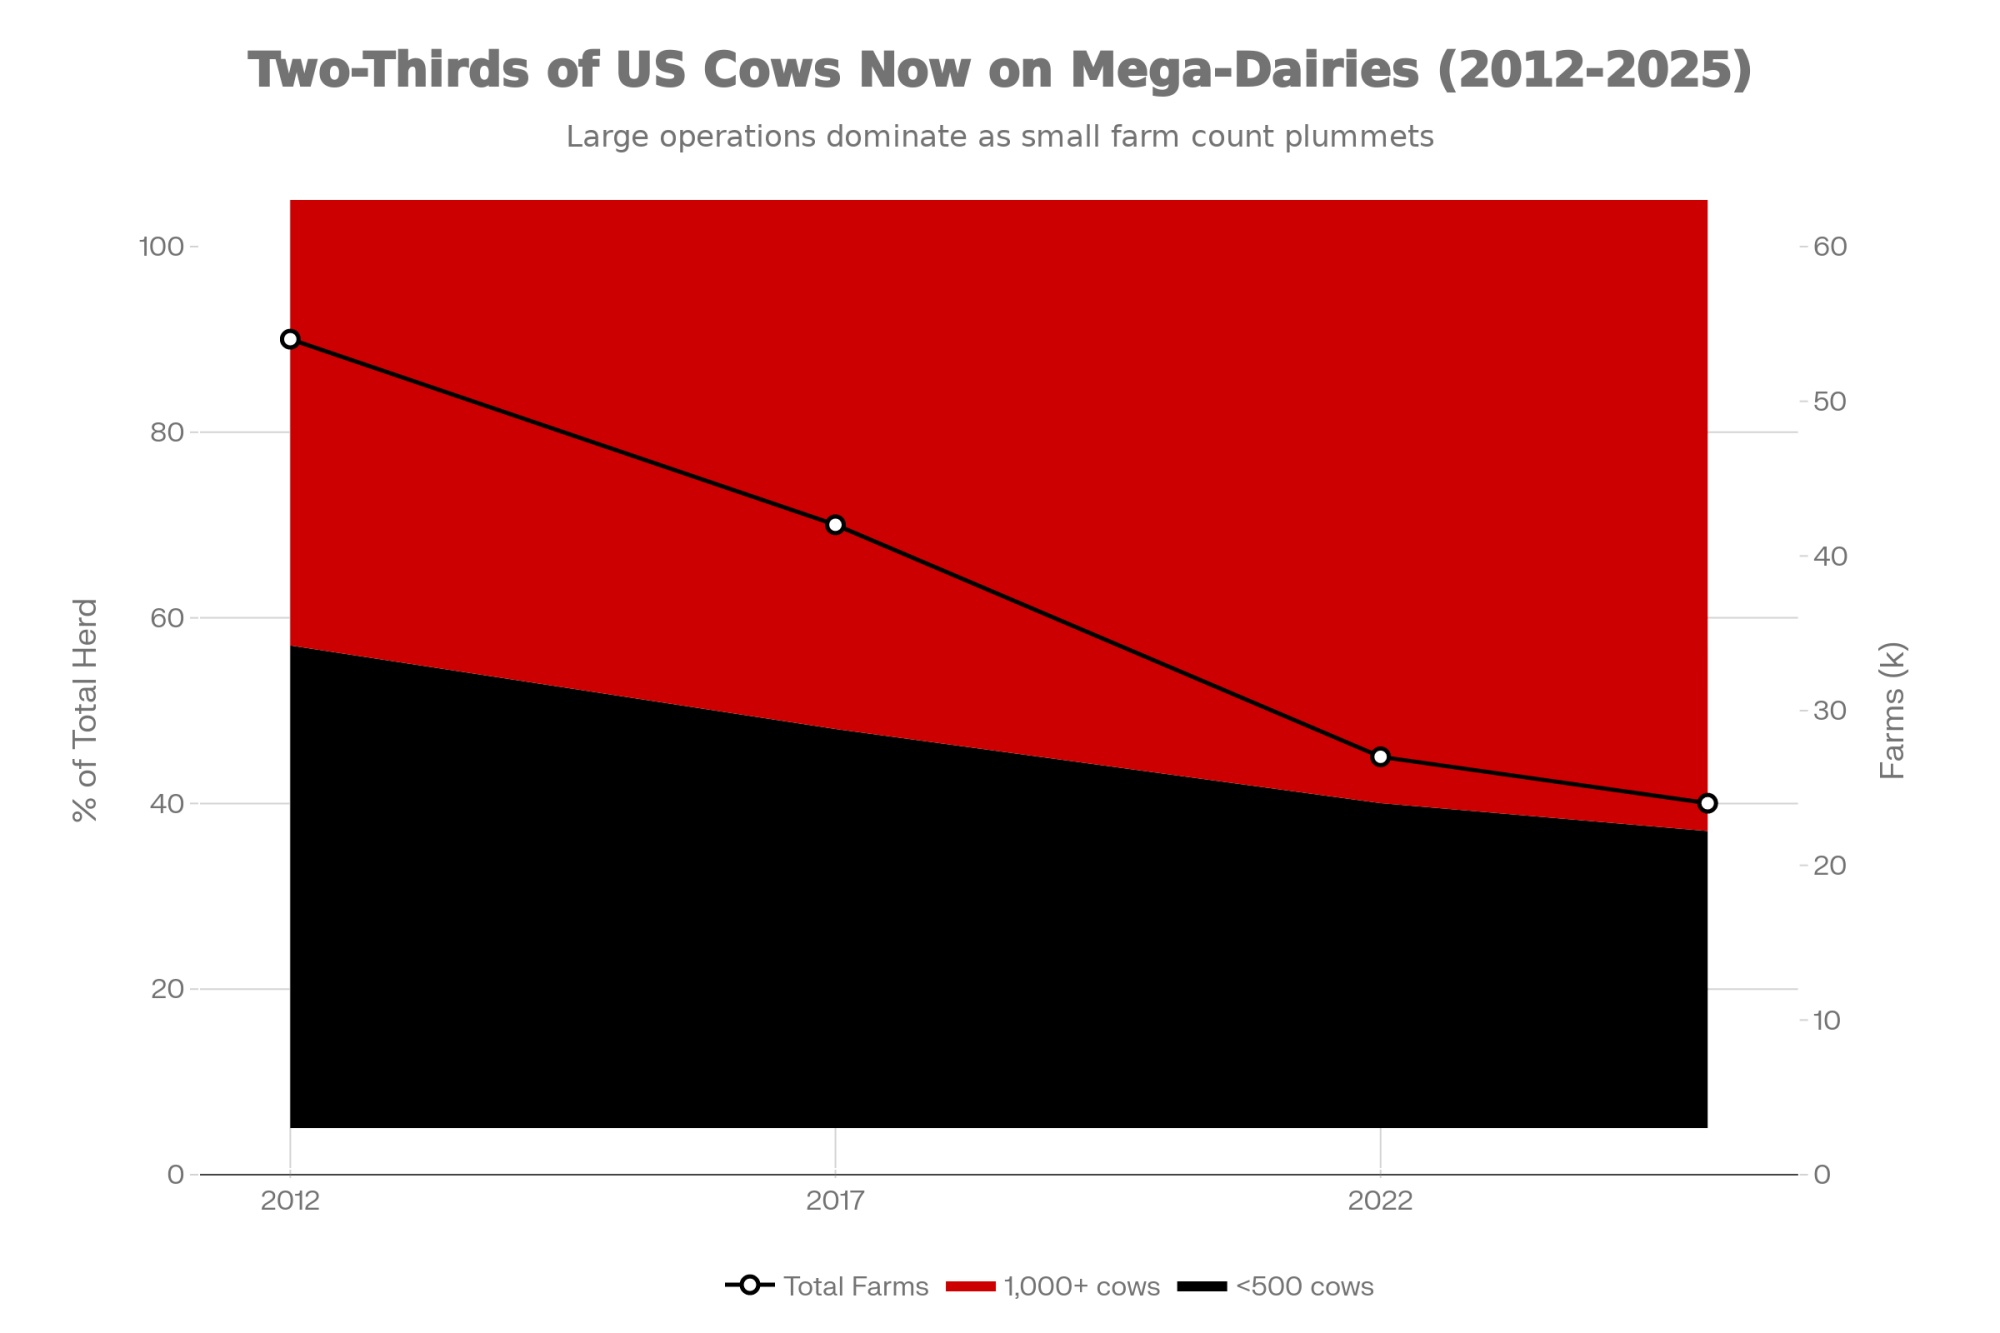
The USDA’s 2022 Census of Agriculture documented that 65% of the U.S. dairy herd now lives on operations with 1,000 or more animals. The number of U.S. dairy farms fell from approximately 39,000 in 2017 to roughly 24,000 in 2022, even as total milk production continued growing. If you’ve watched neighbors exit over the past decade, these numbers won’t surprise you.
| Year | Total Farms (thousands) | Herd Share: 1,000+ Cows (%) | Herd Share: Under 500 Cows (%) |
|---|---|---|---|
| 2012 | 51 | 48 | 52 |
| 2017 | 39 | 57 | 43 |
| 2022 | 24 | 65 | 35 |
| 2025 | 21 | 68 | 32 |
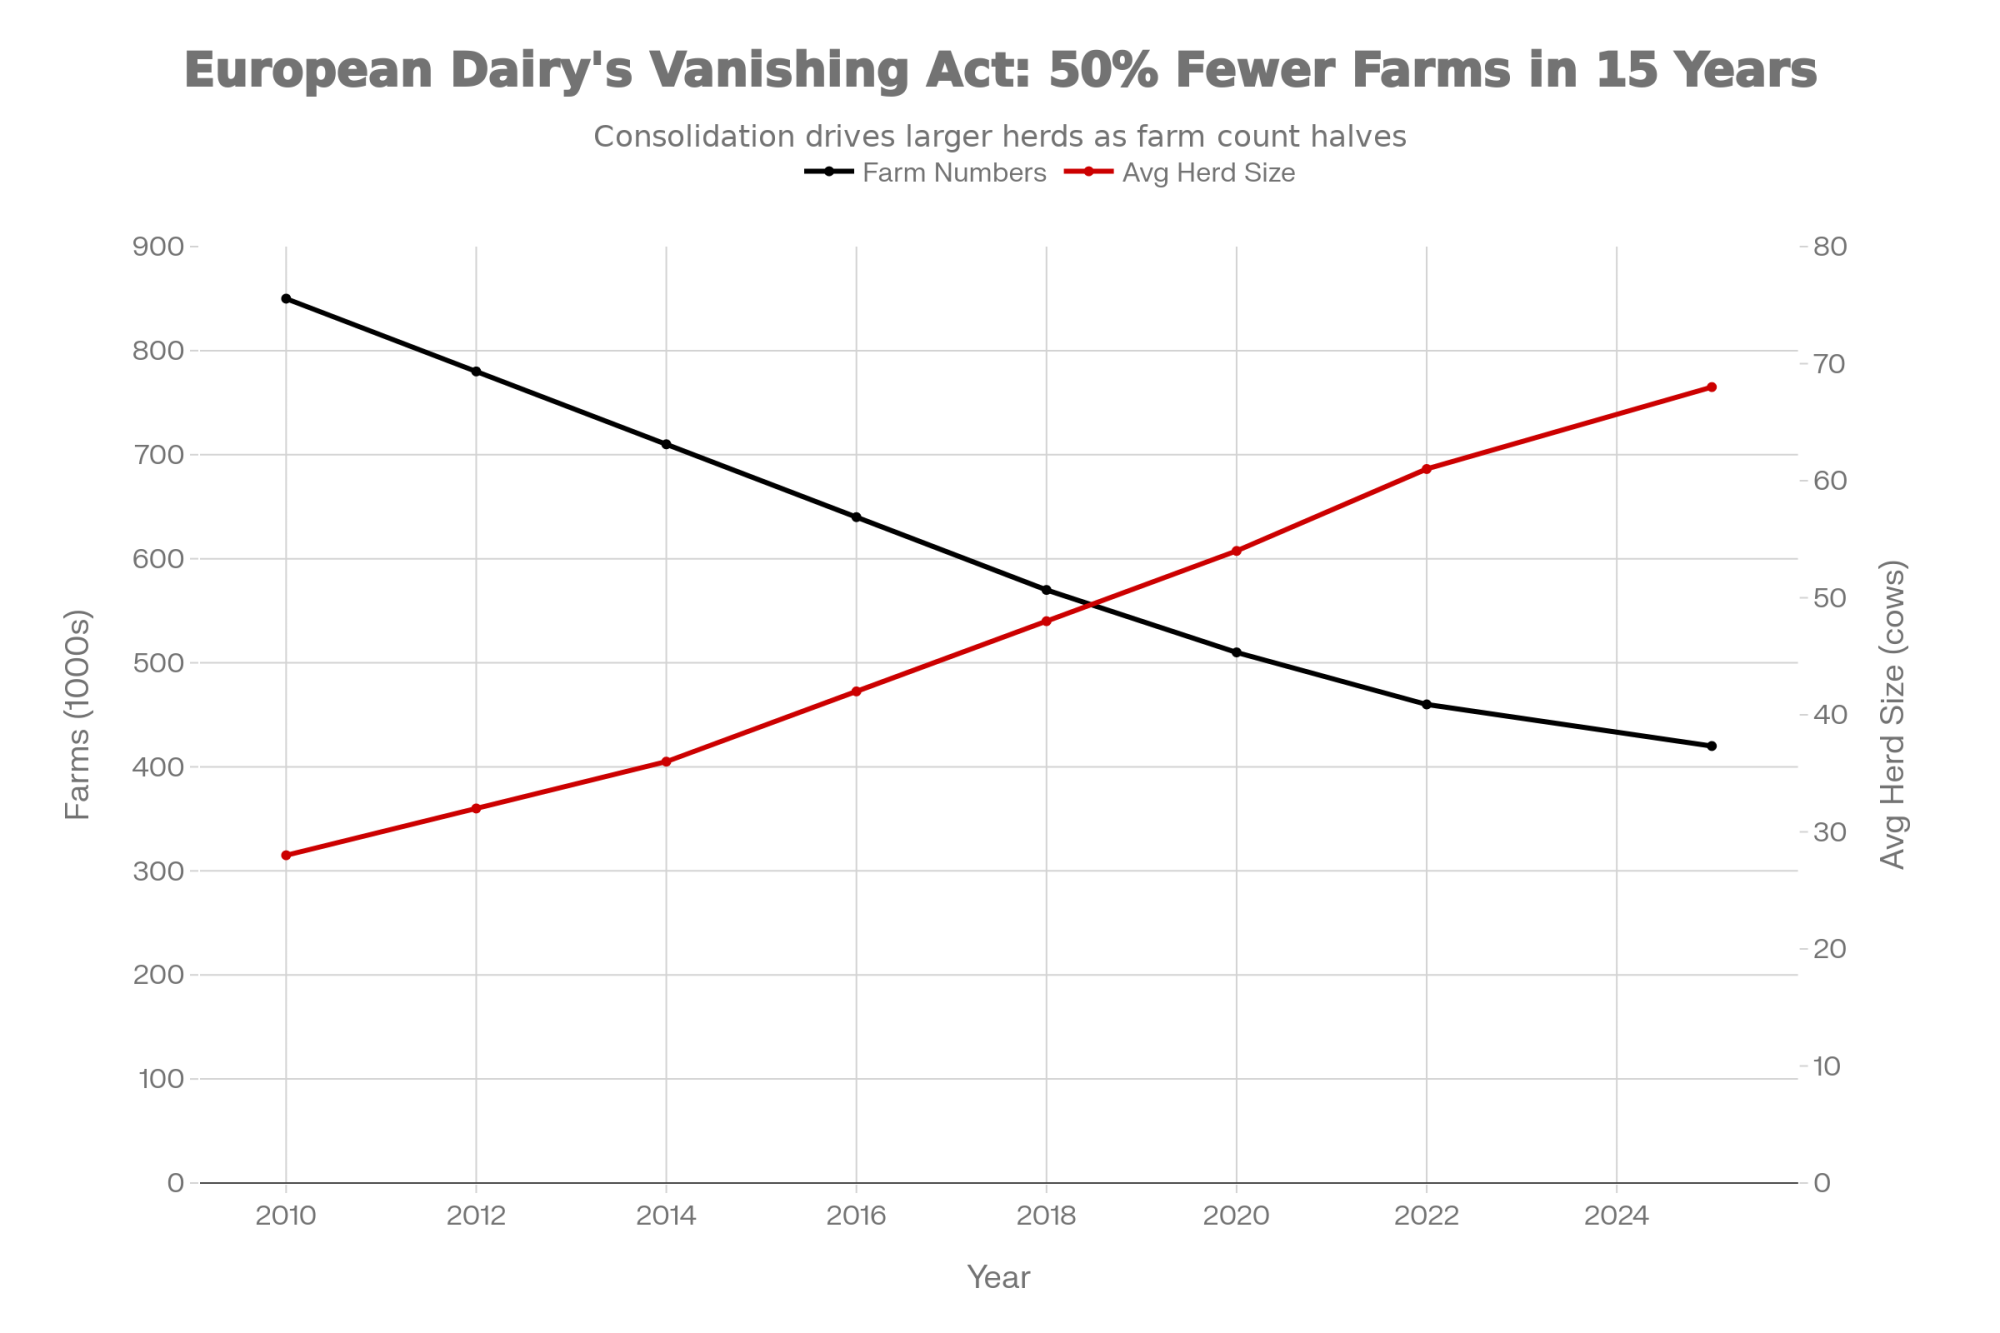
European dairy follows a similar pattern with a time lag. Eurostat data shows EU dairy farm numbers declining 3-4% annually, with production increasingly concentrated in larger, more specialized operations.
| Year | Number of Farms (thousands) | Average Herd Size (cows) |
|---|---|---|
| 2010 | 850 | 28 |
| 2012 | 780 | 32 |
| 2014 | 710 | 36 |
| 2016 | 640 | 42 |
| 2018 | 570 | 48 |
| 2020 | 510 | 54 |
| 2022 | 460 | 61 |
| 2025 | 420 | 68 |
What concerns me—and I think many of you share this—is how consolidation tends to accelerate during periods of margin pressure. Industry analysts have projected that U.S. dairy farm numbers could decline further by 2030 under sustained price compression scenarios.
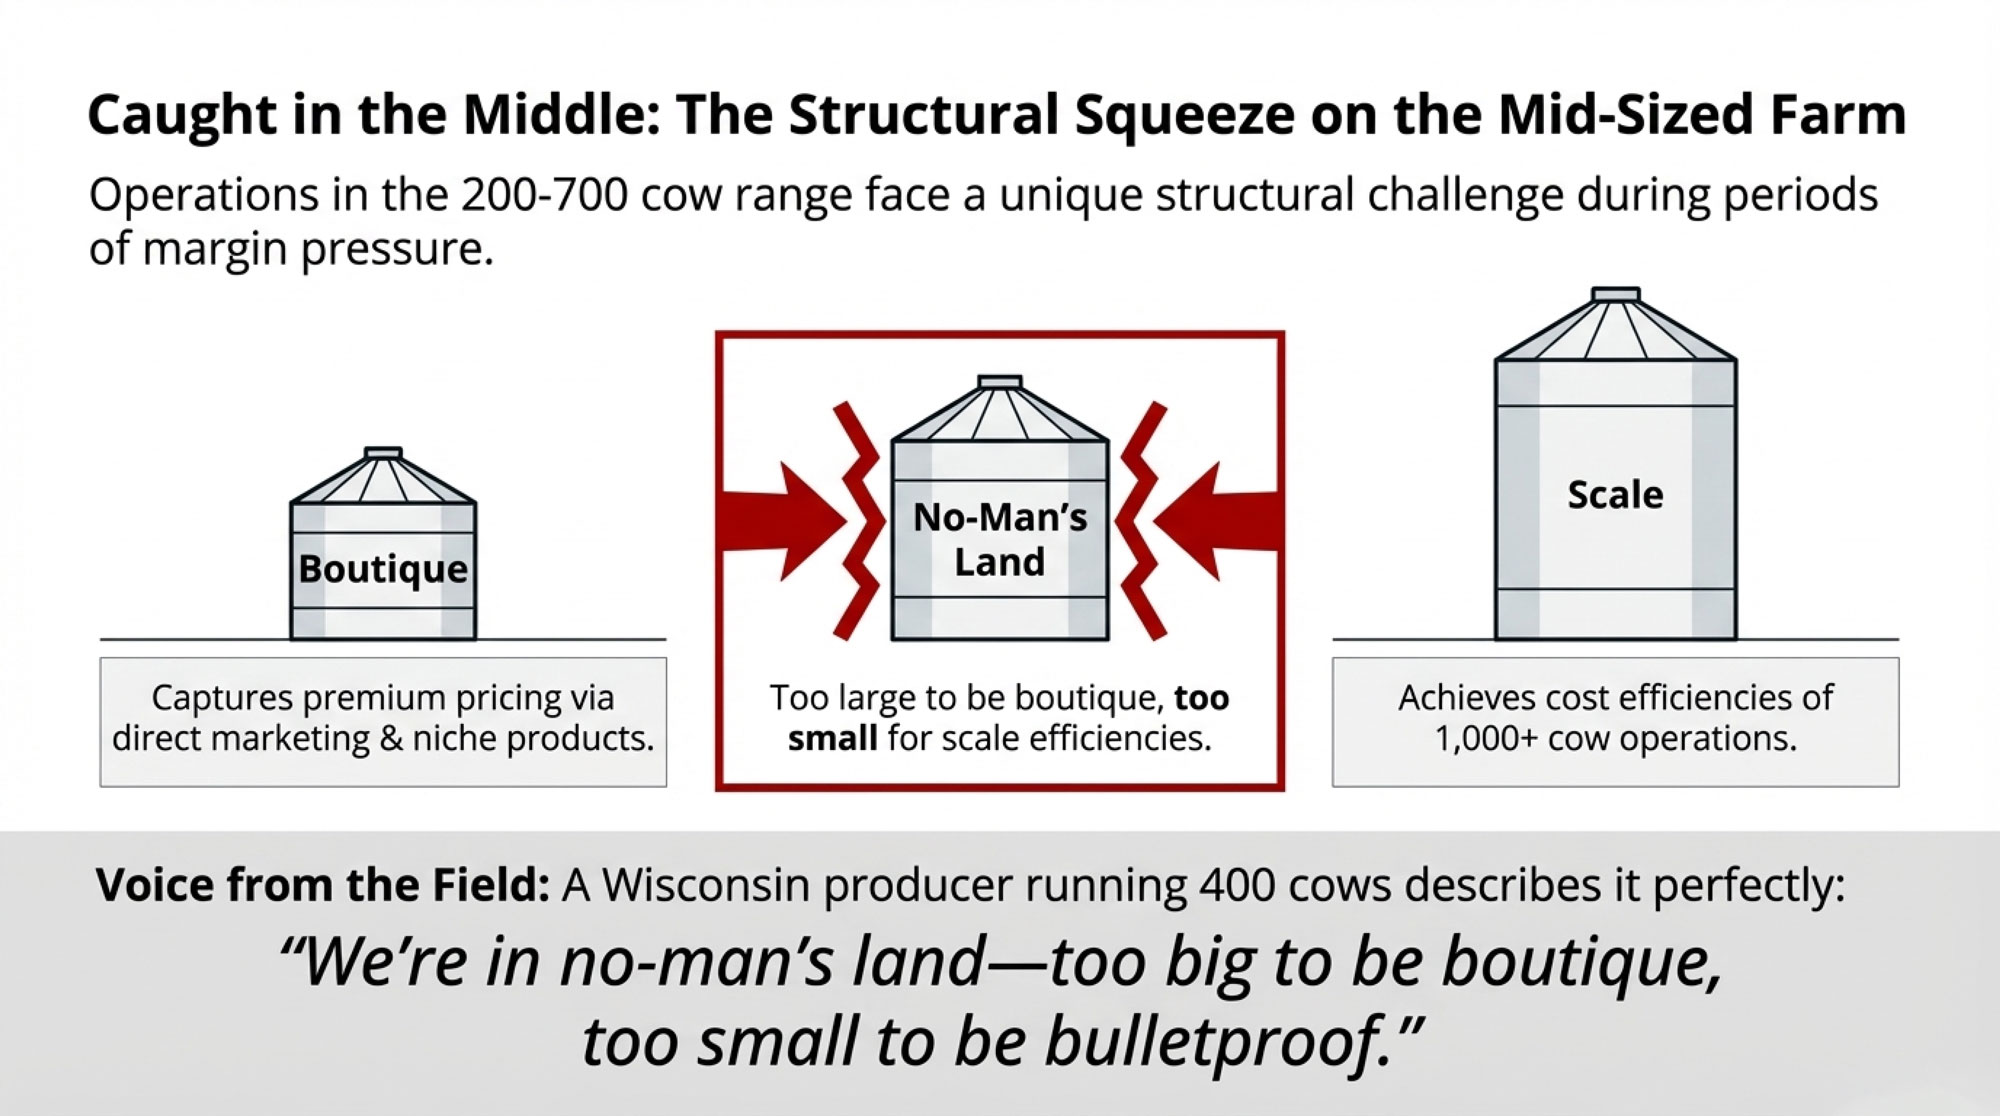
The mid-size operator—somewhere in that 200 to 700 cow range—faces a particularly challenging structural position. Often, it is too large to capture premium pricing through direct marketing and niche positioning. Sometimes, it is too small to achieve the cost efficiencies that larger operations rely on during thin-margin periods. I was talking with a Wisconsin producer running about 400 cows last month, and he described it perfectly:
“We’re in no-man’s land—too big to be boutique, too small to be bulletproof.”
That segment may undergo significant change in the years ahead.
The Canadian Calculus
Canada’s supply management system provides some insulation but hasn’t prevented domestic consolidation. Research from Dalhousie University’s Agri-Food Analytics Lab, led by Dr. Sylvain Charlebois, projects that Canadian dairy farm numbers will decline from approximately 11,000 today to around 5,500 by 2030—a 50% reduction, even under supply management.
The calculus for Canadian producers is complicated. Quota values represent significant wealth—but also significant debt loads for younger operators looking to expand or enter the industry. Succession planning gets thorny when the next generation looks at those numbers and wonders whether the investment makes sense over a 20-year horizon. And there are real questions about whether the regulatory framework will hold steady through USMCA review cycles.
Canadian producers I’ve spoken with are weighing these factors carefully. The protection supply management offers is real, but it’s not a complete shield against the structural pressures reshaping dairy worldwide. While projections always involve uncertainty, the directional trend appears clear.
Approaches That Are Working
Against this challenging backdrop, certain operational models are demonstrating resilience. They’re worth understanding, even recognizing they don’t apply to every situation.
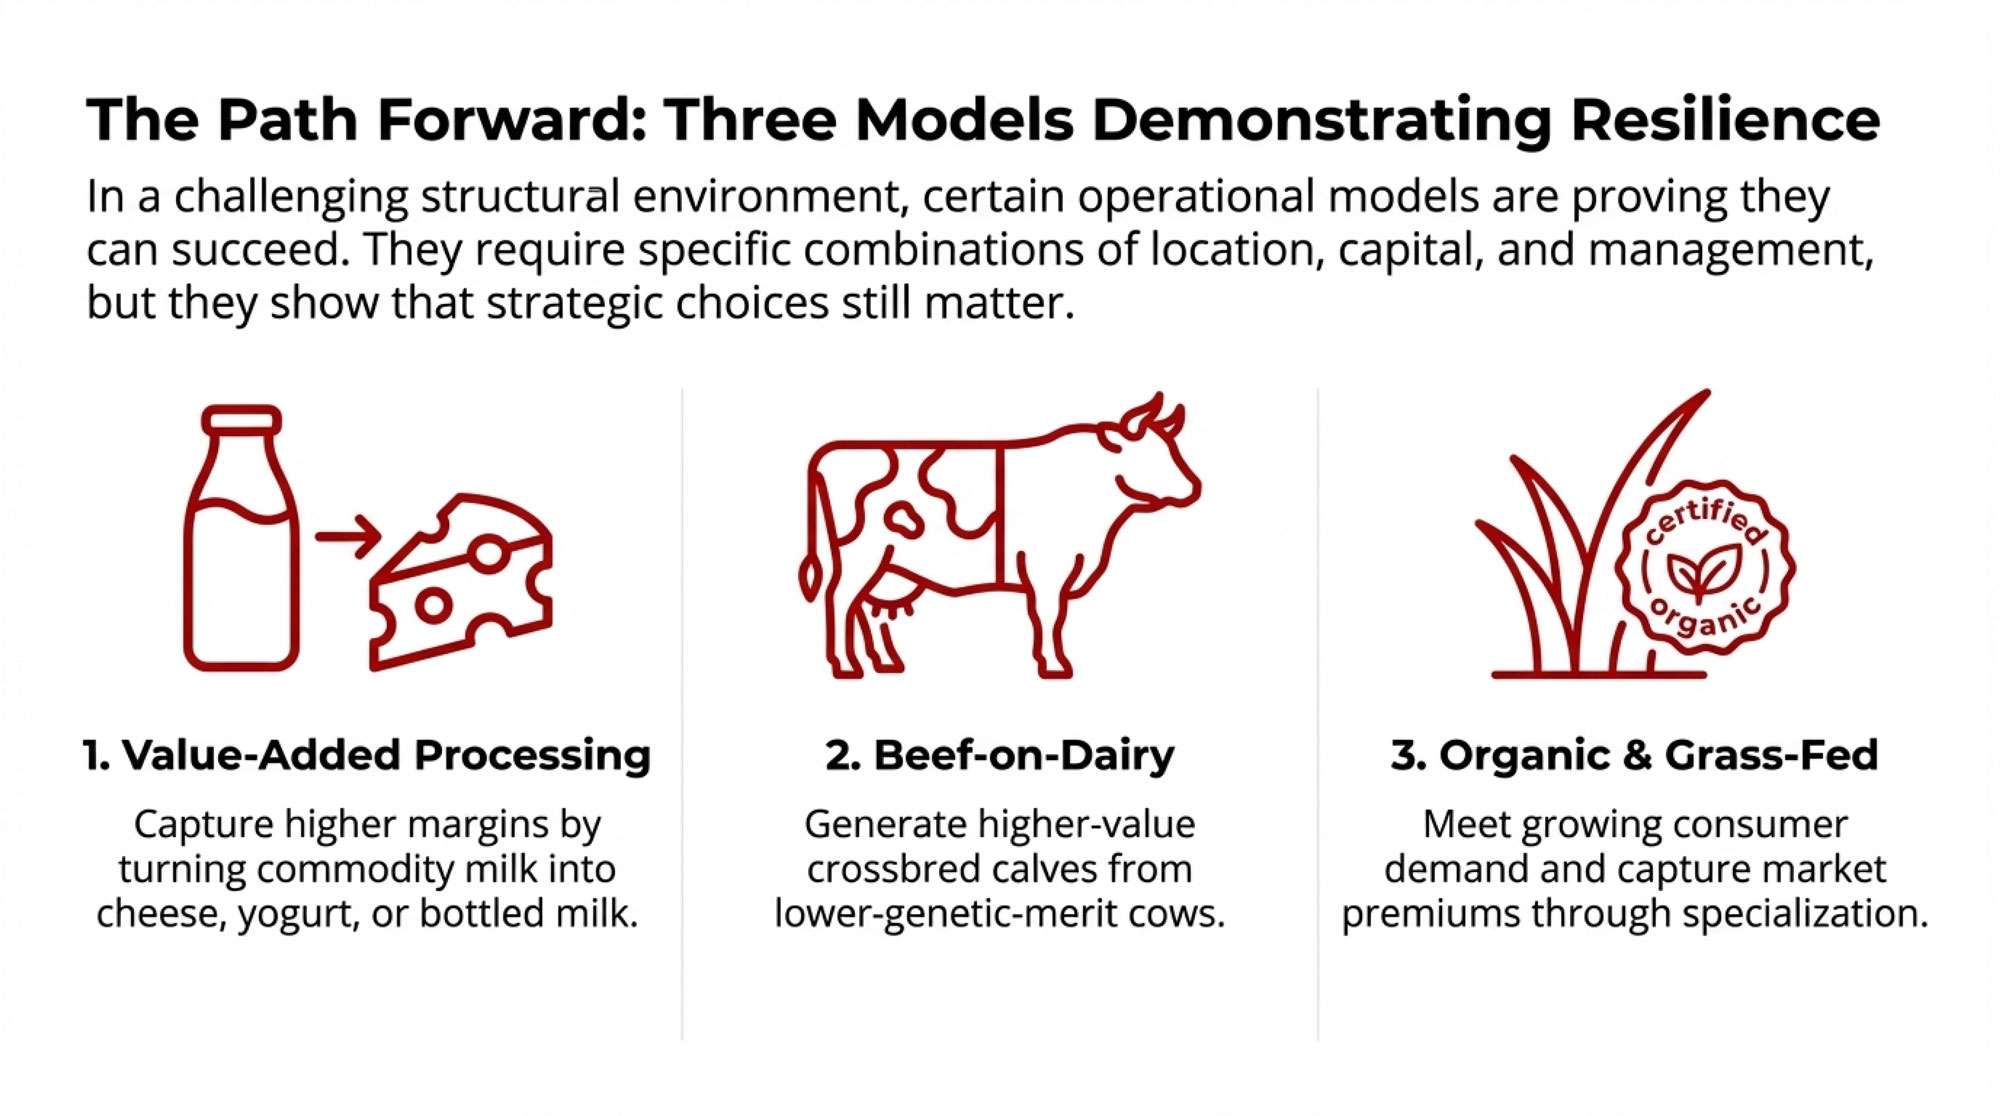
Value-added processing continues showing strong economics for farms with appropriate geography and capital access. Research on dairy farm diversification consistently finds that operations producing cheese rather than selling commodity milk can capture substantially higher margins per hundredweight. Those combining processing with direct marketing channels—farmers markets, farm stores, local restaurant accounts—often add further value.
For operations seriously exploring this path, facility investment typically ranges from €200,000 to €310,000 or morefor licensed cheese or bottling operations. In the U.S., USDA Value-Added Producer Grants can cover up to $250,000 in eligible costs for working capital, meaningfully improving the feasibility of qualifying operations. The timeline to breakeven generally runs 18-24 months for well-executed transitions—not quick, but achievable with solid planning and realistic expectations.
The key constraint? Geographic proximity to consumers. Direct-to-consumer channels generally work best within 90-120 minutes of significant population centers. Rural operations distant from metropolitan markets face more limited diversification options. A Vermont producer I spoke with last year captured it well:
“Location isn’t everything, but it’s probably 60% of whether value-added pencils out.”
Beef-on-dairy programs are expanding rapidly, particularly in North America. By breeding lower-genetic-merit dairy cows to beef sires, operations generate crossbred calves with meaningfully higher market values than dairy bull calves—while focusing replacement heifer production on their top genetics. Industry observers estimate the segment could produce over 3 million calves annually, as growing acceptance from feeders and packers continues. It’s not a complete solution to margin challenges, but it represents additional revenue without requiring new infrastructure or marketing channels. And for herds with solid reproductive programs already in place, the implementation is relatively straightforward.
Organic and grass-fed specialization maintains premium capture for farms that can meet certification requirements and access appropriate markets. University of Vermont research tracking organic dairy profitability over a multi-year period found that organic farms generated greater net farm revenue than comparable conventional operations in 4 of 5 years studied. The key requirements are geographic access to consumers willing to pay premiums and the management capacity to meet certification standards—which, as anyone who’s gone through organic transition knows, involves a considerable learning curve and attention to detail in pasture management, dry cow protocols, and treatment record-keeping.
None of these represent universal solutions. They require specific combinations of location, capital, management capacity, and market access. But they illustrate that operational choices still create meaningful differences, even in challenging structural environments.
Where Things Stand Now
The December 18 mobilization succeeded in forcing a postponement of the EU-Mercosur vote until at least January 2026. That represents real political achievement—thousands of farmers blocking the EU capital creates attention that decision-makers can’t easily dismiss.
But postponement isn’t resolution. The underlying political dynamics remain largely unchanged. Germany’s industrial sector—automobiles, machinery, chemicals—wants Mercosur market access. Spain and Portugal see export opportunities. The European Commission’s trade directorate remains committed to the agreement.
The real question: Can farmers convert this tactical delay into lasting structural changes?
What farmers achieved is time. How they use that time will determine whether this mobilization produces a lasting impact or merely delays an eventual outcome. The next few months will likely include European Council discussions, parliamentary committee reviews, and continued negotiations over the details of the mirror clause. Those watching closely should pay particular attention to French parliamentary positions—France has been the most vocal opponent, and its stance will significantly shape what happens next.
Copa-Cogeca has announced plans for continued engagement through the winter and spring. National farmer organizations in France, Italy, and Poland are coordinating advocacy efforts. Whether agricultural constituencies can maintain focus and unity long enough to achieve meaningful changes to the agreement—or whether momentum fades and ratification proceeds largely as drafted—remains uncertain. History suggests maintaining coalition unity across months is the harder challenge.
Considerations for Dairy Producers
For European farmers: The Brussels demonstration showed that coordinated agricultural action can still capture political attention. The January 2026 timeline creates a defined window for continued engagement. Maintaining coalition alignment across sectors and borders will likely determine outcomes.
For North American producers, the EU-Mercosur dynamics may create export-market pricing pressure regardless of direct import effects. Planning that accounts for potential commodity price adjustments in contested markets through 2027 seems prudent. Operations with significant export market exposure face the most direct implications.
For all dairy operations: The structural consolidation trend continues. Operations in the 200-700 cow range face particularly complex economics under sustained margin pressure. Strategic decisions made in the next 18-24 months—whether toward scale, toward differentiation, or toward well-planned transition—will shape outcomes for the coming decade.
Questions worth sitting with:
- What percentage of your operation’s economics depends directly or indirectly on export market pricing?
- Does your geography realistically support value-added or direct-to-consumer diversification?
- If pursuing scale, what’s your realistic timeline for achieving those economics?
- If neither scale nor differentiation fits your situation, what does thoughtful transition planning look like while asset values remain supportive?
These aren’t easy questions. But current conditions make them worth serious consideration.
The Bottom Line
The farmers who gathered in Brussels understand something important: this isn’t really about one trade deal or one protest. It’s about whether agriculture maintains sufficient standing to influence the policies shaping its future meaningfully. What happens in the coming months will affect European farming for a generation—and offers relevant lessons for agricultural communities watching from elsewhere.
KEY TAKEAWAYS:
- 10,000 farmers just bought time: The December 18 Brussels blockade forced an EU-Mercosur postponement until January 2026. What happens next depends on whether that coalition holds.
- The cost gap can’t be managed away: South American producers operate at costs 40-60% below EU operations. That’s structural—land, labor, regulatory burden—not an efficiency problem.
- North American dairy feels this indirectly but meaningfully: Displaced EU production will compete harder in Mexico, North Africa, and Southeast Asia. Those are your export markets, too.
- Decision time for mid-size operations: With 65% of U.S. cows on 1,000+ head dairies and farm numbers down 40% since 2017, the next 18-24 months will shape outcomes for a decade. Scale, differentiate, or transition—but don’t wait.
Complete references and supporting documentation are available upon request by contacting the editorial team at editor@thebullvine.com.
Learn More:
- The Beef-on-Dairy Wake-Up Call: What Some Farms Are Still Missing – This tactical guide reveals how to deploy genomic testing and build specific buyer relationships to turn your lowest-merit cows into high-margin profit centers, providing a practical roadmap for surviving current price compression.
- The Wall of Milk: Making Sense of 2025’s Global Dairy Crunch – Provides a strategic deep-dive into the “global supply collision” and the 24-month biological trap, helping producers understand why current market corrections are slower than usual and how to protect margins through 2026.
- Your Cheese Plant’s New Bacteria Can Run 56% Faster – Why This Technology Decides Which Processors (and Farms) Survive 2030 – Demonstrates how cutting-edge fermentation and CRISPR technologies at the processor level are reshaping supply chain requirements, offering a vision of which farm models will remain relevant in a tech-driven market.
 The Sunday Read Dairy Professionals Don’t Skip.
 The Sunday Read Dairy Professionals Don’t Skip.
Every week, thousands of producers, breeders, and industry insiders open Bullvine Weekly for genetics insights, market shifts, and profit strategies they won’t find anywhere else. One email. Five minutes. Smarter decisions all week.