West River’s expansion near Morris could quietly cost every 500‑cow herd in the Upper Midwest shed $57,000–$86,000 a year — and the warning signs aren’t where you’d expect.
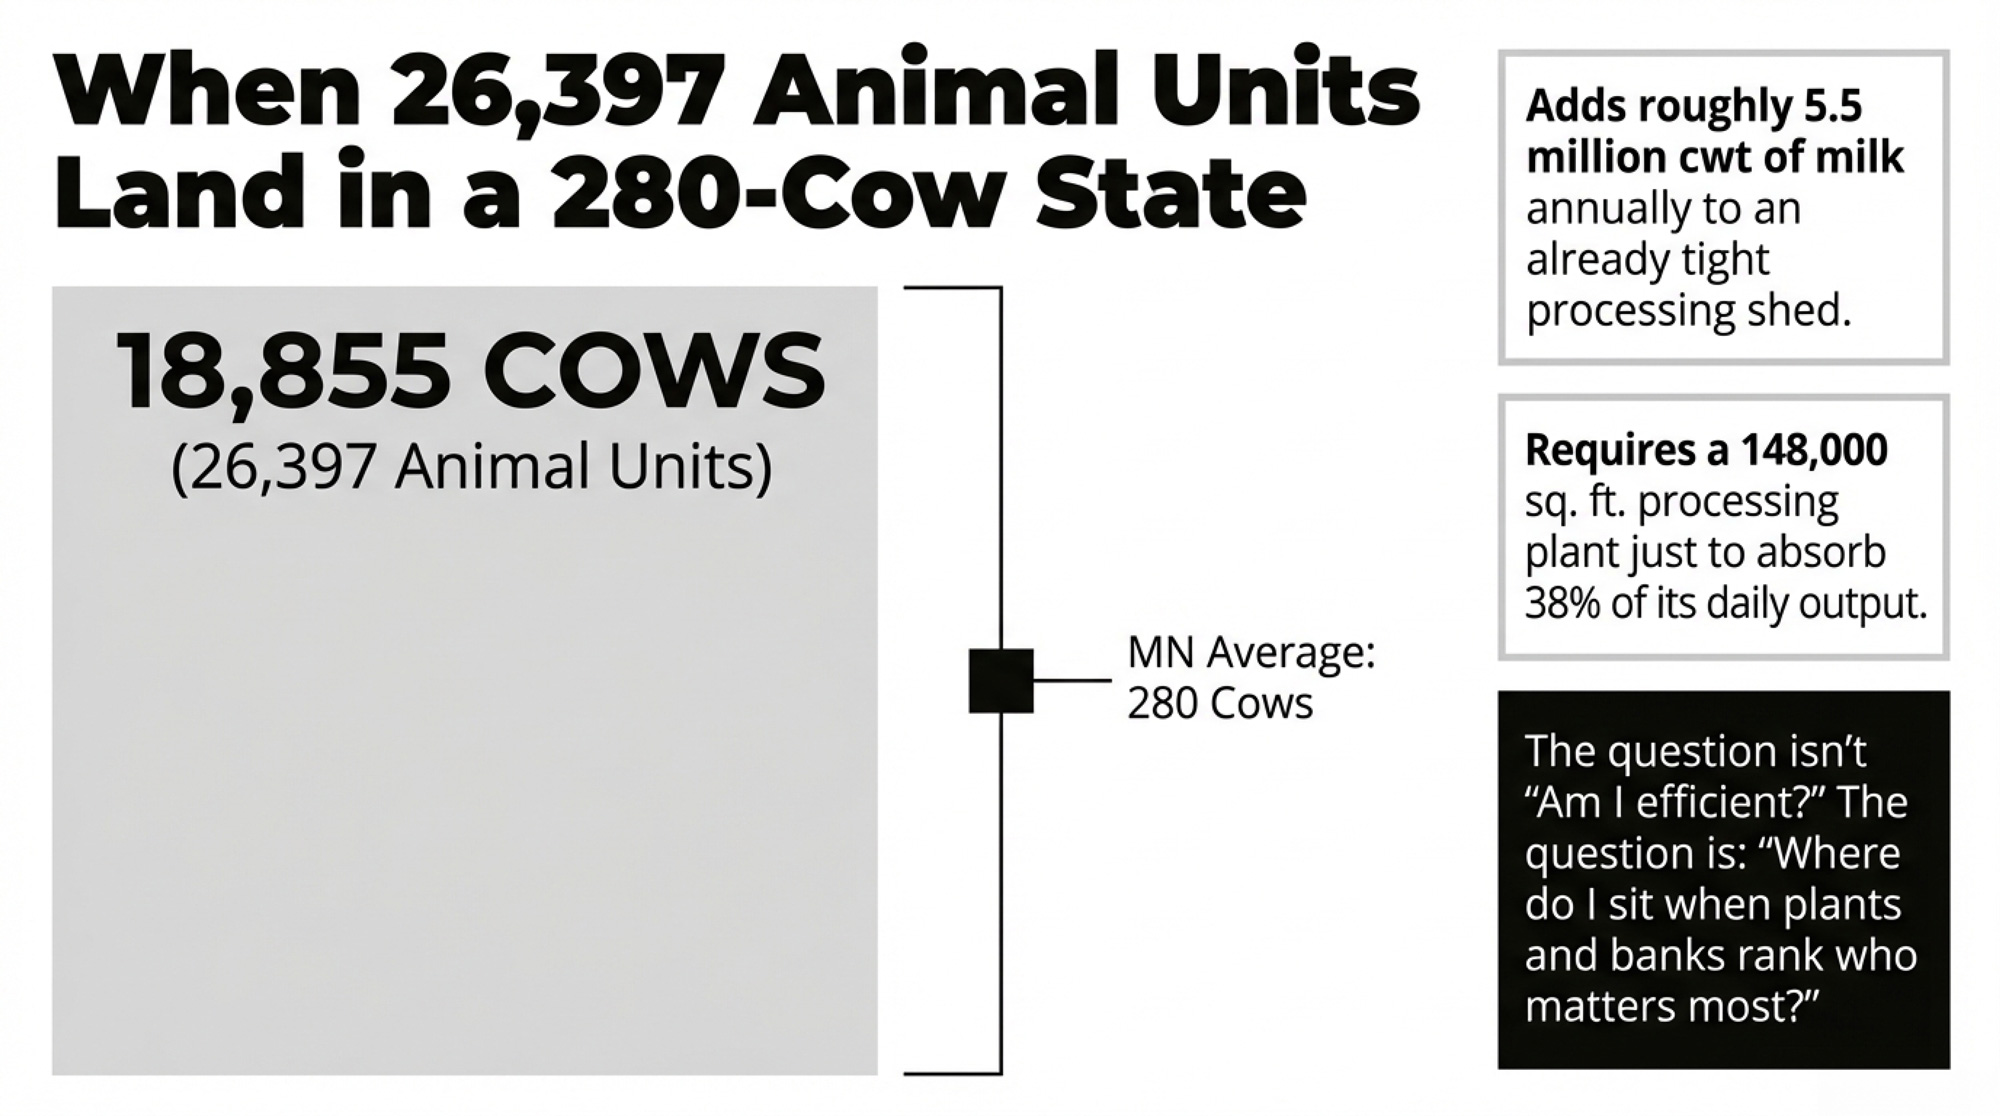
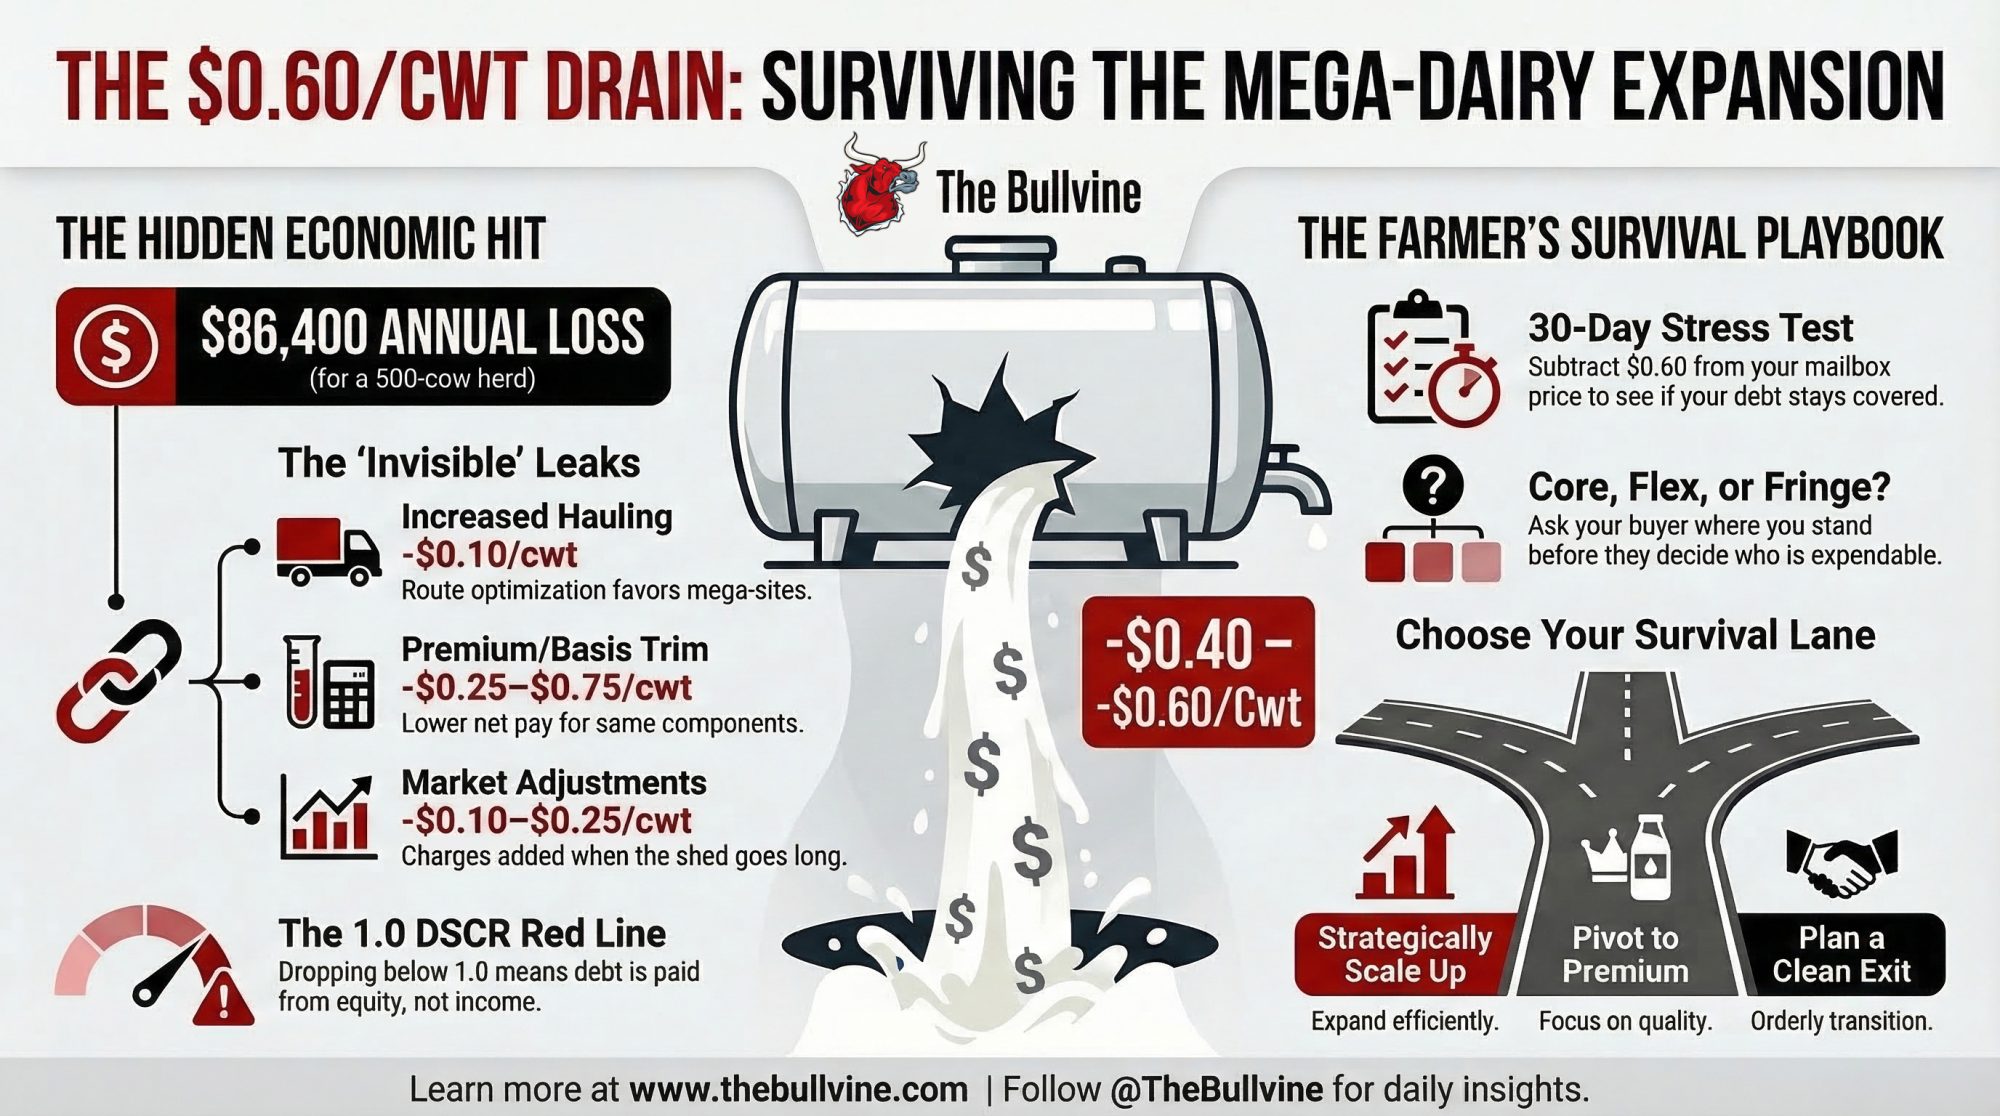
Executive Summary: Riverview’s proposed West River expansion near Morris, Minnesota, would take the site to 18,855 cows and add roughly 5.5 million cwt of milk a year into an already tight Upper Midwest processing shed. For a 500‑cow herd shipping 12,000 cwt a month, the article walks through how that single permit can realistically translate into a $0.40–$0.60/cwt hit on net mailbox price — about $57,600–$86,400 per year gone even if you don’t change a thing on your own farm. It shows how that pressure actually lands first in higher hauling charges, thinner component premiums, and quiet “market adjustment” lines, not in an obvious crash on the front of your milk check. Using current FO30 hauling data and Minnesota FBM debt‑service coverage ratios, it gives you a simple margin and DSCR stress test you can run on your last 12 months of milk checks. From there, it lays out a 30/90/365‑day playbook and three realistic lanes — scale, pivot to premium/efficiency, or plan a clean exit — with clear trade‑offs for each. The core takeaway: you can’t control Riverview’s 18,855‑cow bet, but you can decide now whether you’re treated as “core, flex, or fringe” before a $0.60/cwt drain quietly closes off your best options.
Riverview LLP wants to take West River Dairy near Morris, Minnesota, from 7,855 to 18,855 cows — 26,397 animal units on a single site in Synnes Township, Stevens County. The Minnesota Pollution Control Agency is taking public comments on the environmental assessment worksheet through April 9, 2026, after an administrative error forced the agency to re‑notice the EAW and extend the deadline.
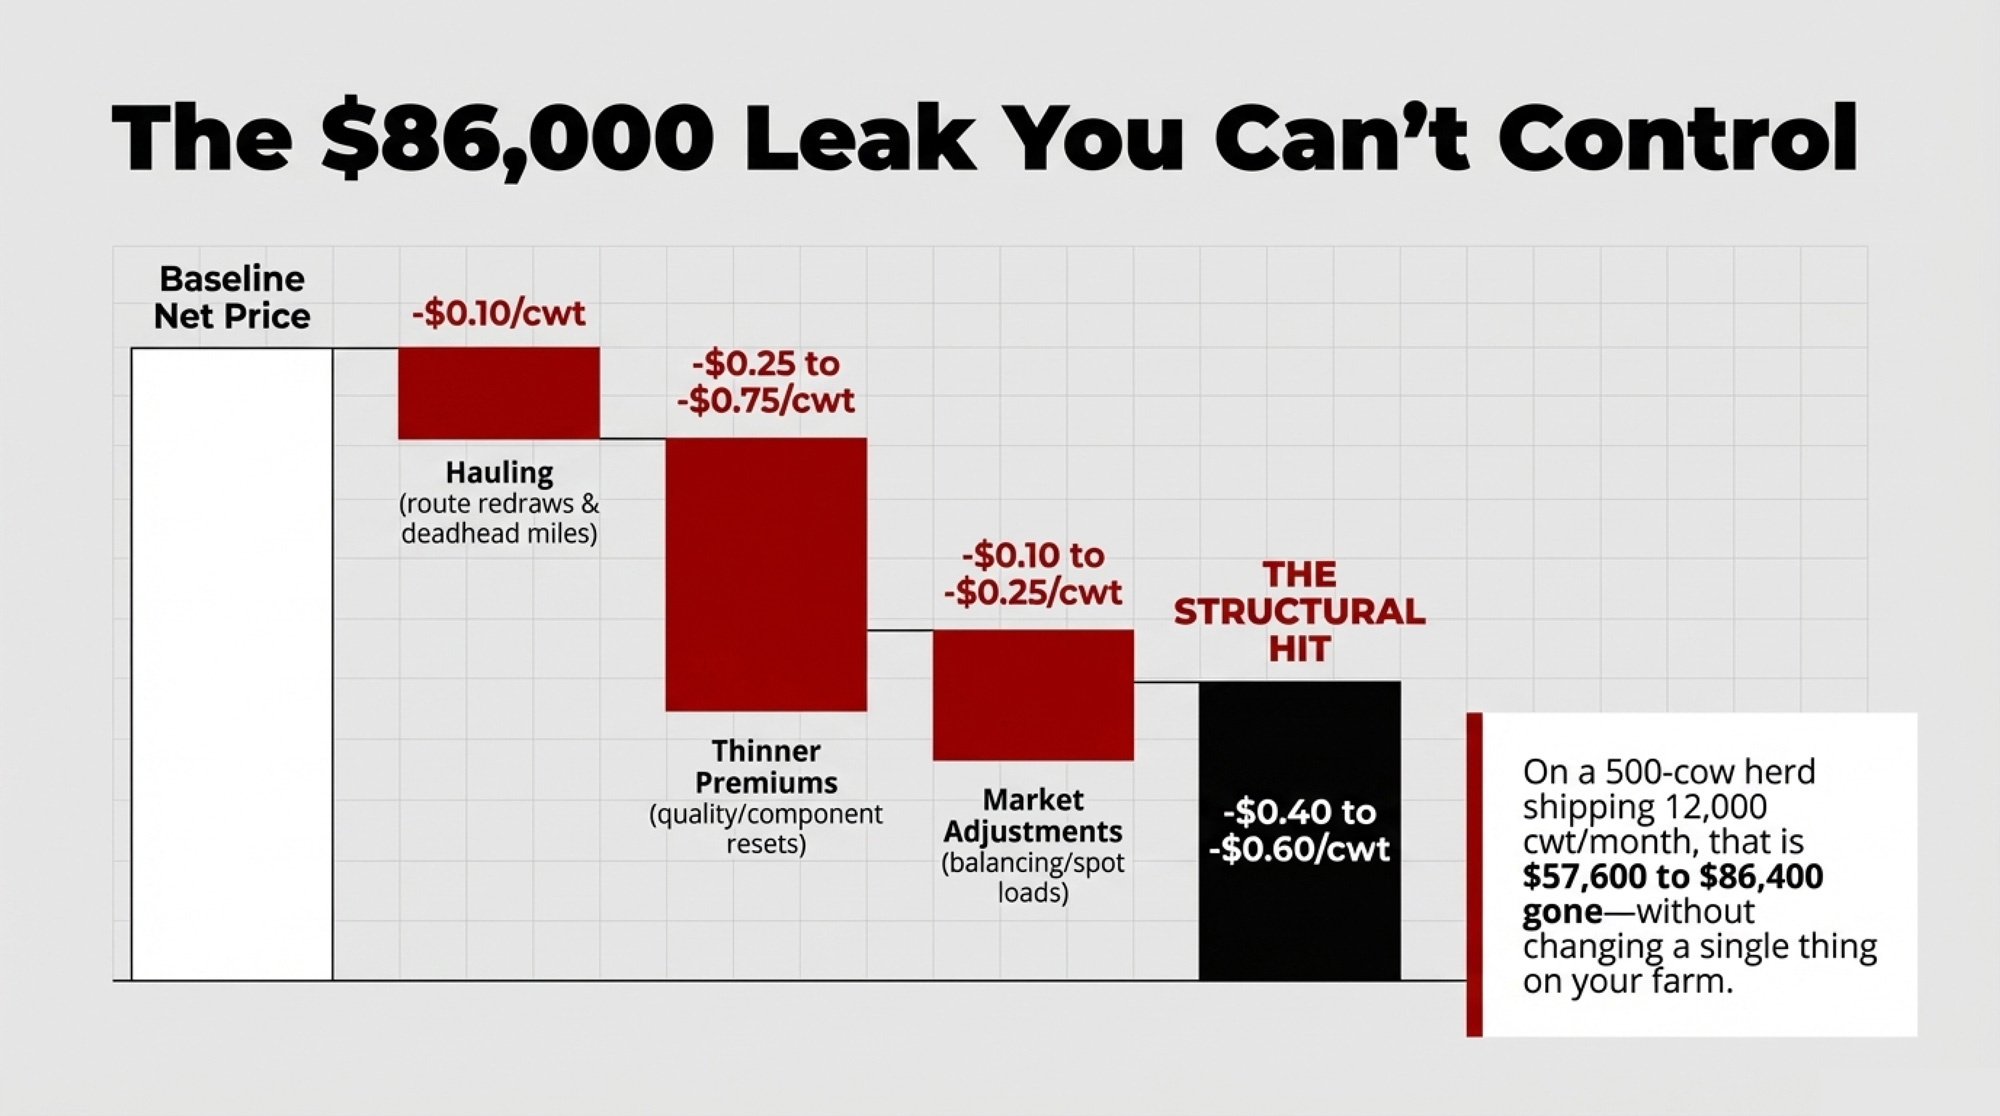
If you’re milking 400–600 cows in that same marketing shed, the real question isn’t whether the permit gets approved. It’s what happens to your net mailbox price once roughly 5.5 million cwt of annual milk starts flowing from one driveway. Based on how hauling, premiums, and base programs have behaved in past long‑milk episodes across the Upper Midwest, a realistic band is −$0.40 to −$0.60/cwt. On a 12,000‑cwt monthly milk check, that’s $4,800–$7,200 per month gone without you changing a thing on your own farm.
When 26,397 Animal Units Land in a 280‑Cow State
If you’re running a 500‑cow herd in west‑central Minnesota, you don’t read that MPCA notice as abstract policy. You read it like a weather warning for your balance sheet. You’re already watching your debt‑service coverage ratio (DSCR), scanning every line on the milk check, and wondering if your kids will have a business to come home to.
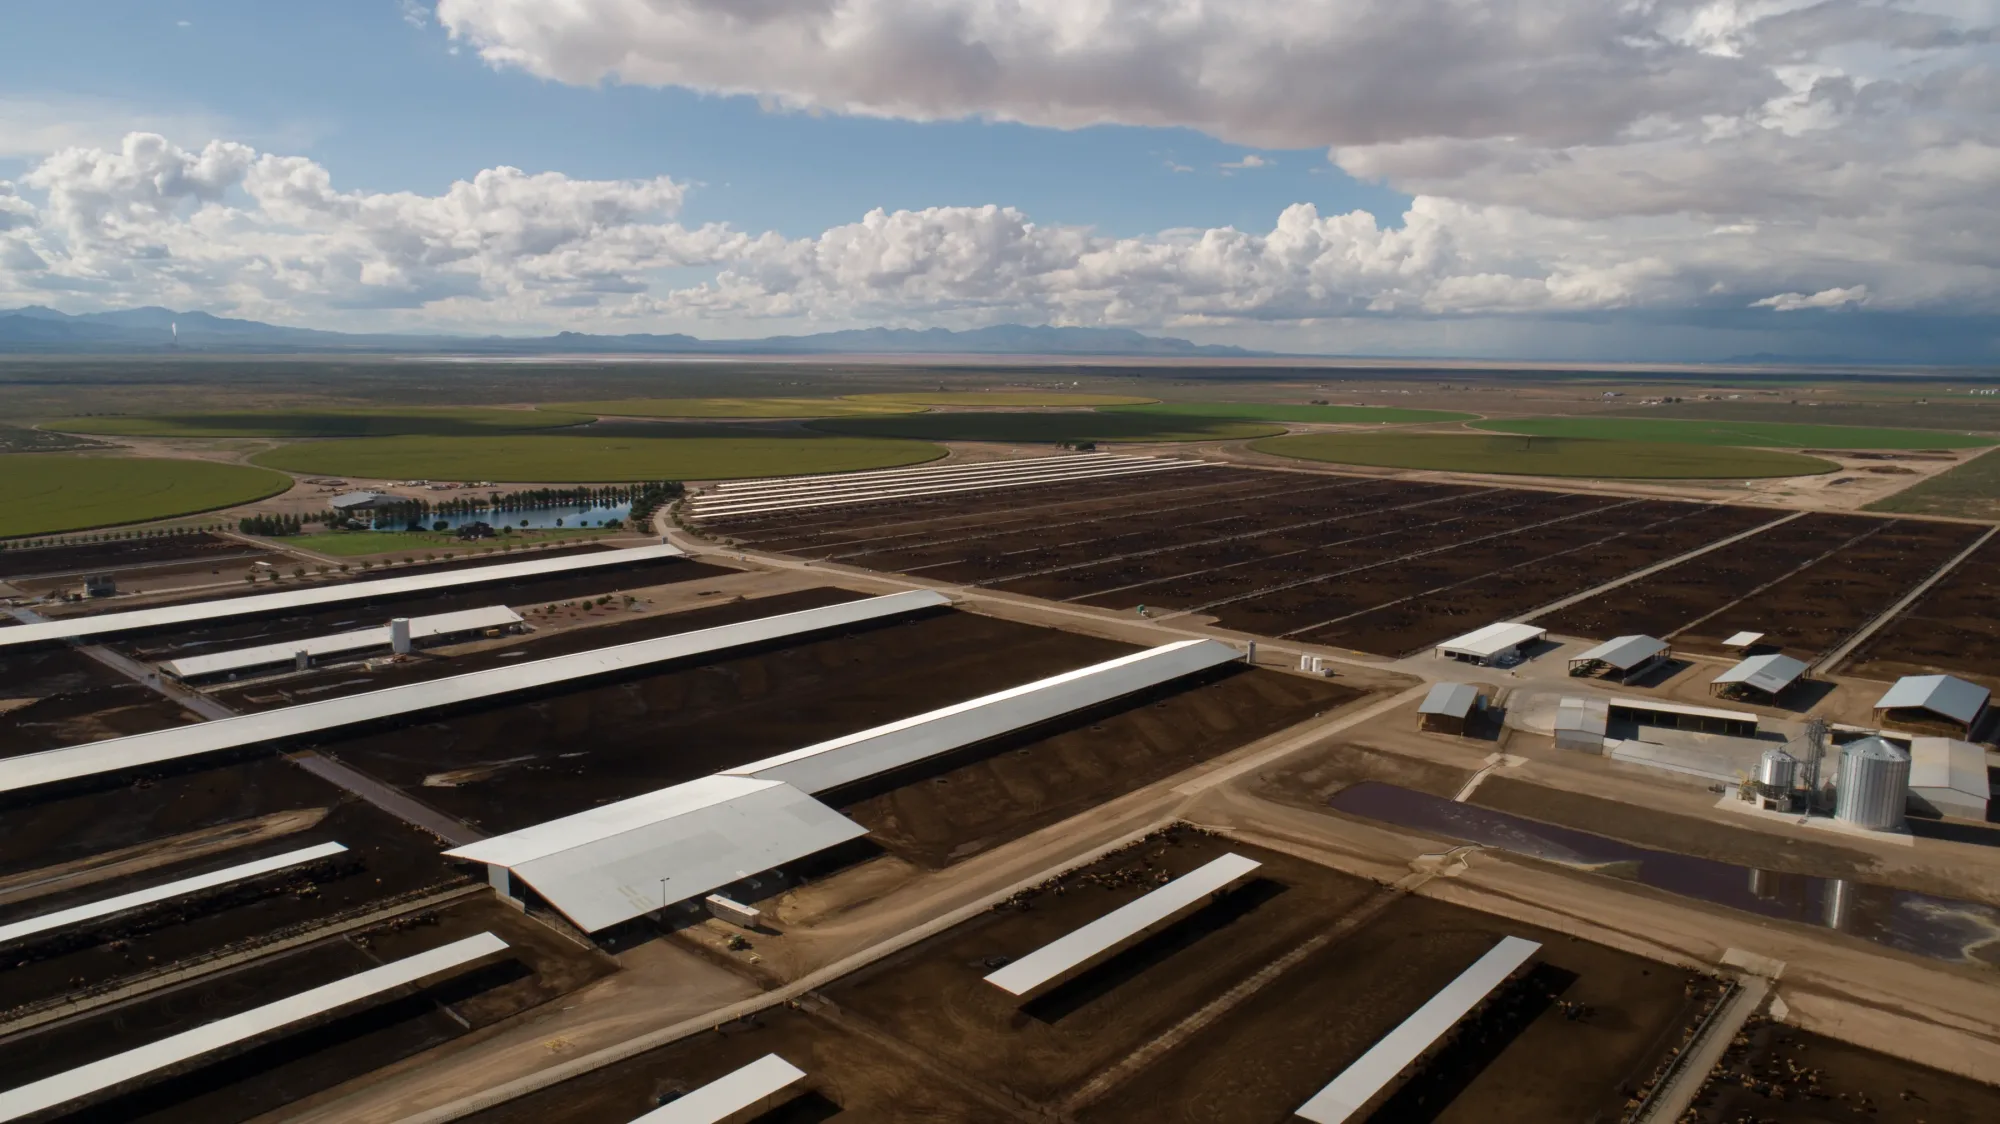
West River’s expansion plan adds an 11,000‑cow dairy (15,400 AU) to the existing 7,855‑cow (10,997 AU) facility. The build includes a cross‑ventilated, total‑confinement freestall barn, covered clay‑lined liquid manure basins expanding storage from roughly 102 million to 250 million gallons, and about 13,200 acres of cropland in the manure application plan. Riverview is also seeking a water appropriation permit to pump up to 226 million gallons per yearfrom an off‑site well.
Environmental groups — Land Stewardship Project (LSP), Food & Water Watch, and others — are hammering away at water usage and watershed impact. That’s the whole point of the EAW process. Riverview, for its part, says its dairies are “designed and managed to meet or exceed strict environmental standards” and that this expansion “must comply with the state’s stringent permitting requirements.” The environmental fight will play out on its own track. For you, the more immediate issue is simpler and nastier: what does an 18,855‑cow barn do to hauling, base, and mailbox for a 500‑cow herd in a tight processing shed?
Minnesota’s average dairy herd has fewer than 280 cows, according to federal structure data cited by the Star Tribune in March 2026. West River comes in at more than 67 times that average. This isn’t about good vs bad, big vs small. It’s a capital signal. When regulators, lenders, and processors are being asked to sign off on a facility shipping more milk than dozens of family herds combined, the question shifts from “Am I efficient?” to “Where do I sit when plants and banks start ranking who matters most?”
| Metric | Minnesota Average Dairy | Riverview West River (Proposed) | Gap |
|---|---|---|---|
| Herd Size (cows) | 280 | 18,855 | ×67 larger |
| Animal Units | ~392 | 26,397 | ×67 larger |
| Daily Milk (lb) | 22,400 | 1,508,400 | ×67 larger |
| Annual Milk (cwt) | 81,760 | 5,500,000 | ×67 larger |
| Manure Storage (gal) | ~500,000 | 250,000,000 | ×500 larger |
| Water Use (gal/year) | ~8,000,000 | 226,000,000 | ×28 larger |
How Does an 18,855‑Cow Mega‑Dairy Hit 500‑Cow Mailbox Prices?
In public meetings and local coverage, Riverview partner Brady Janzen has argued that West River’s growth is a rational response to rising U.S. cheese demand. He points to USDA data showing per‑capita cheese consumption climbing from roughly 15 pounds in the mid‑1970s to around 40 pounds today. The logic is straightforward: if Americans keep eating more cheese, plants need consistent, high‑volume milk to stay efficient.
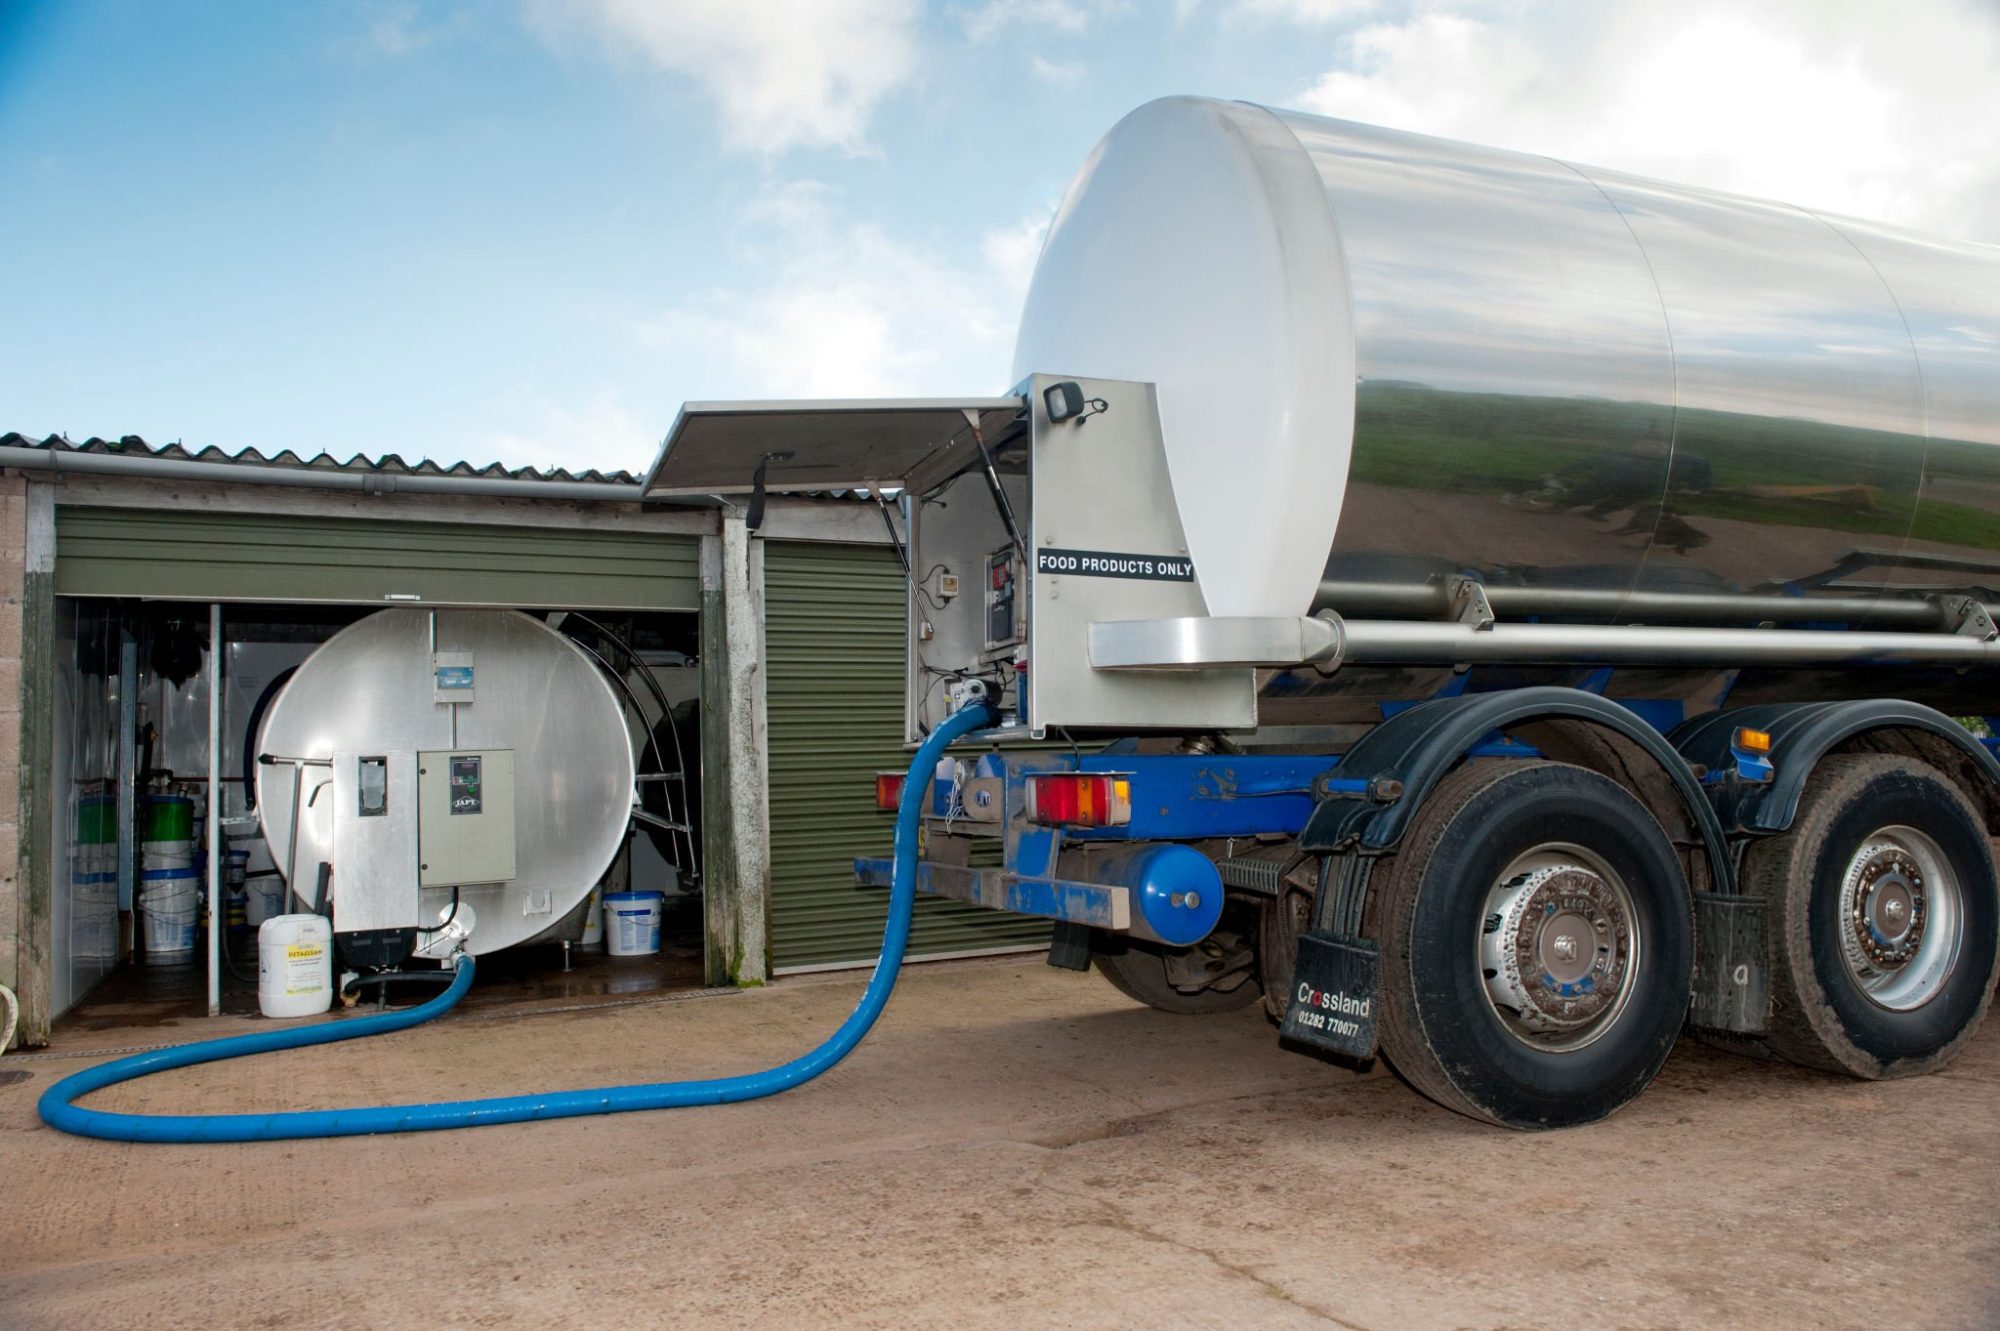
Riverview isn’t just adding cows. It’s also building the Stevens Milk Plant in Morris — an approximately 148,000‑square‑foot facility designed to process about 4 million pounds of milk per day into nonfat dry milk, skim milk powder, cream, and evaporated condensed skim milk, with roughly 65 jobs tied to it. The plant broke ground in mid‑2025 and is scheduled to start processing in November 2027, roughly the same timeline that LSP and local coverage expect for West River’s expansion to be fully online, if approved.
That timing matters. Riverview is building processing capacity alongside the new cows — not just dumping milk into a fixed system. But 4 million pounds of daily plant capacity absorbs only about 38% of West River’s expanded daily output at a conservative 80 lb/cow/day. The rest of the shed’s existing production still needs homes, and Riverview’s more than 125,000 cows in Minnesota already produce well over 10 million pounds each day.
Progressive Dairy’s 2024 “State of Dairy” series summed up the broader context: Upper Midwest processing capacity was “very tight”, milk was being hauled “crazy distances,” and switching processors often wasn’t an option. In that kind of shed, a new 18,855‑cow site doesn’t just “add supply.” It can help fill a new plant, yes — but it also reshapes every conversation about base, hauling, and which farms get treated as core vs expendable.
Renville County dairy farmer James Kanne sees the expansion through a very different lens. In LSP’s March 8, 2026, release, he argues that mega‑operations like Riverview’s have “glutted the market and tightened the stranglehold milk giants have on the industry,” pushing small and medium‑sized farms off the land. Whether you agree with that or not, his point matches what’s been happening when the Upper Midwest goes long: base programs kick in, over‑base milk gets discounted hard, and hauling plus “market adjustment” lines quietly bleed margin.
Family Dairies USA’s base program, rolled out in 2017, is one of the most transparent examples. The co‑op set a three‑month rolling production base plus a 1% cushion. Anything over that base wasn’t blocked, but general manager David Cooper shared that spot and over‑base milk often moved with $3–$4/cwt discounts, plus extra hauling and marketing costs, whenever the region was long.
At 80 lb/cow/day, an 18,855‑cow barn throws 1,508,400 lb of milk into the system daily — about 551 million pounds per year, or 5.5 million cwt, from a single site. That doesn’t guarantee your 500‑cow herd gets hammered. But it absolutely raises the odds that your shed crosses from “tight but manageable” into “structurally long,” where co‑ops lean harder on base, discounts, and balancing charges.
The $7,000 Monthly Leak Nobody Warns You About
Here’s the math you can actually run at your kitchen table.
Baseline 500‑cow scenario:
- Herd: 500 cows.
- Ship weight: 80 lb/cow/day.
- Daily cwt shipped: 500 × 80 ÷ 100 = 400 cwt/day.
- Monthly cwt (30 days): 12,000 cwt/month.
Plug your own herd and cwt into the same structure.
Step 1: Hauling — the small punch that still hurts
Once a mega‑site becomes a route anchor, haulers redraw for density. Long lanes get built around big barns. Smaller, out‑of‑the‑way farms pick up more deadhead miles.
A 2025 FO30 staff paper on Upper Midwest hauling charges found the weighted average hauling deduction jumped from $0.4202/cwt (May 2023) to $0.5033/cwt (May 2024) — a 19.8% increase in a single year, before West River’s expansion even comes online. Stevens County itself sits below that average because Morris is a processing magnet. But if you’re 30–40 miles out and not on the optimized path to a giant barn, you’re on the wrong side of those averages.
| Period / Scenario | Hauling Charge ($/cwt) | Monthly Cost (12,000 cwt) | Annual Cost | Change |
|---|---|---|---|---|
| May 2023 (FO30 Weighted Avg) | $0.4202 | $5,042 | $60,508 | — |
| May 2024 (FO30 Weighted Avg) | $0.5033 | $6,040 | $72,475 | +19.8% |
| Stevens County (Current Est.) | $0.45 | $5,400 | $64,800 | — |
| Your 500-Cow Scenario (Post-Expansion) | $0.55 | $6,600 | $79,200 | +$1,200/mo |
Use a conservative scenario: your hauling inching up by $0.10/cwt over a couple of route changes.
- $0.10/cwt × 12,000 cwt = $1,200/month extra hauling.
- That’s $14,400/year to get the same milk to a plant.
On its own, you can probably eat that. The real trouble is what shows up on the same check.
Step 2: Basis and premiums — where the real damage happens
When a shed goes long, and plants are full, the pain doesn’t show up in one big blood‑red line. It shows up in a bunch of small ones. Based on prior Upper Midwest long‑milk runs:
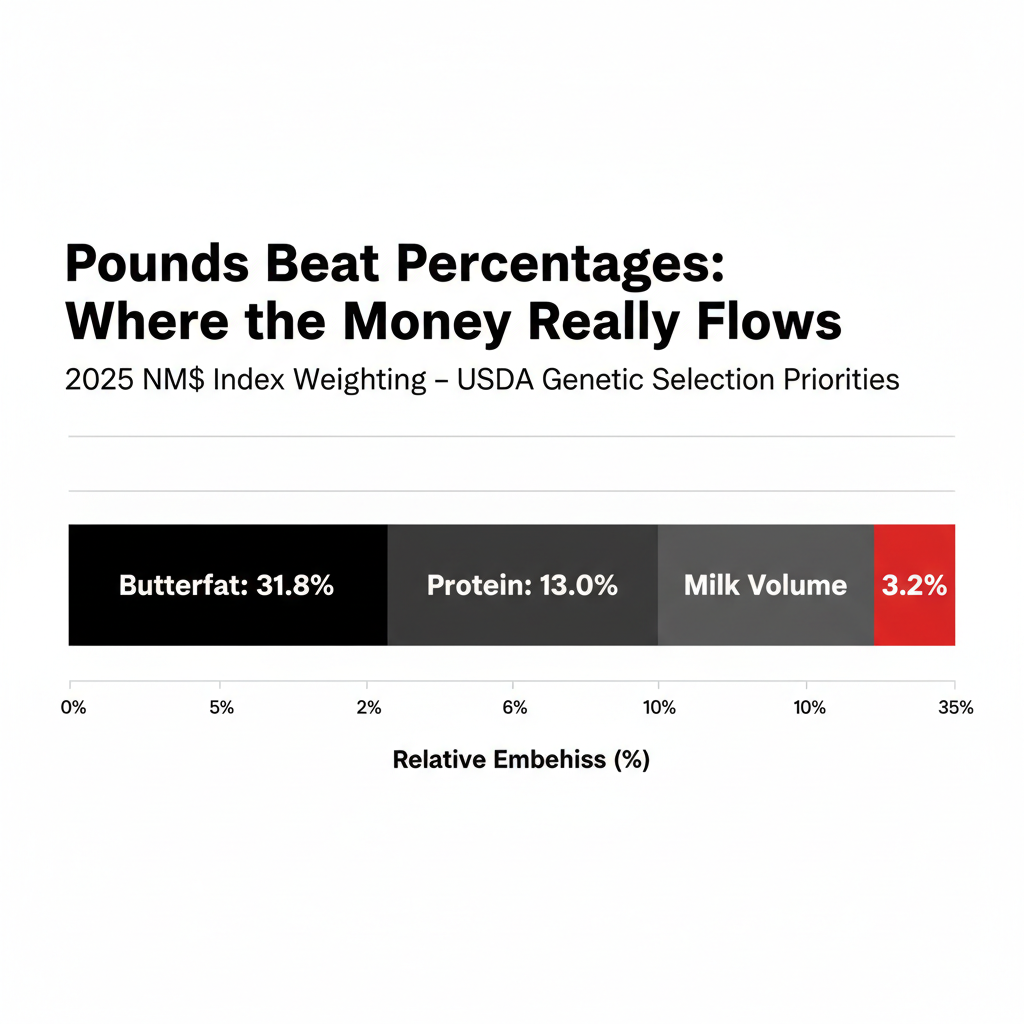
- Quality/component premiums get trimmed, or their formulas reset, so the same butterfat and protein net $0.25–$0.75/cwt less.
- Balancing and “market adjustment” charges take another $0.10–$0.25/cwt when milk has to move farther or into weaker outlets.
You don’t assume the full $3–$4/cwt spot‑load pain from Family Dairies USA across every pound. You assume you keep your core base, but your shed is now structurally long, and the weaker parts of the check start bleeding.
A realistic combined band: −$0.40 to −$0.60/cwt.
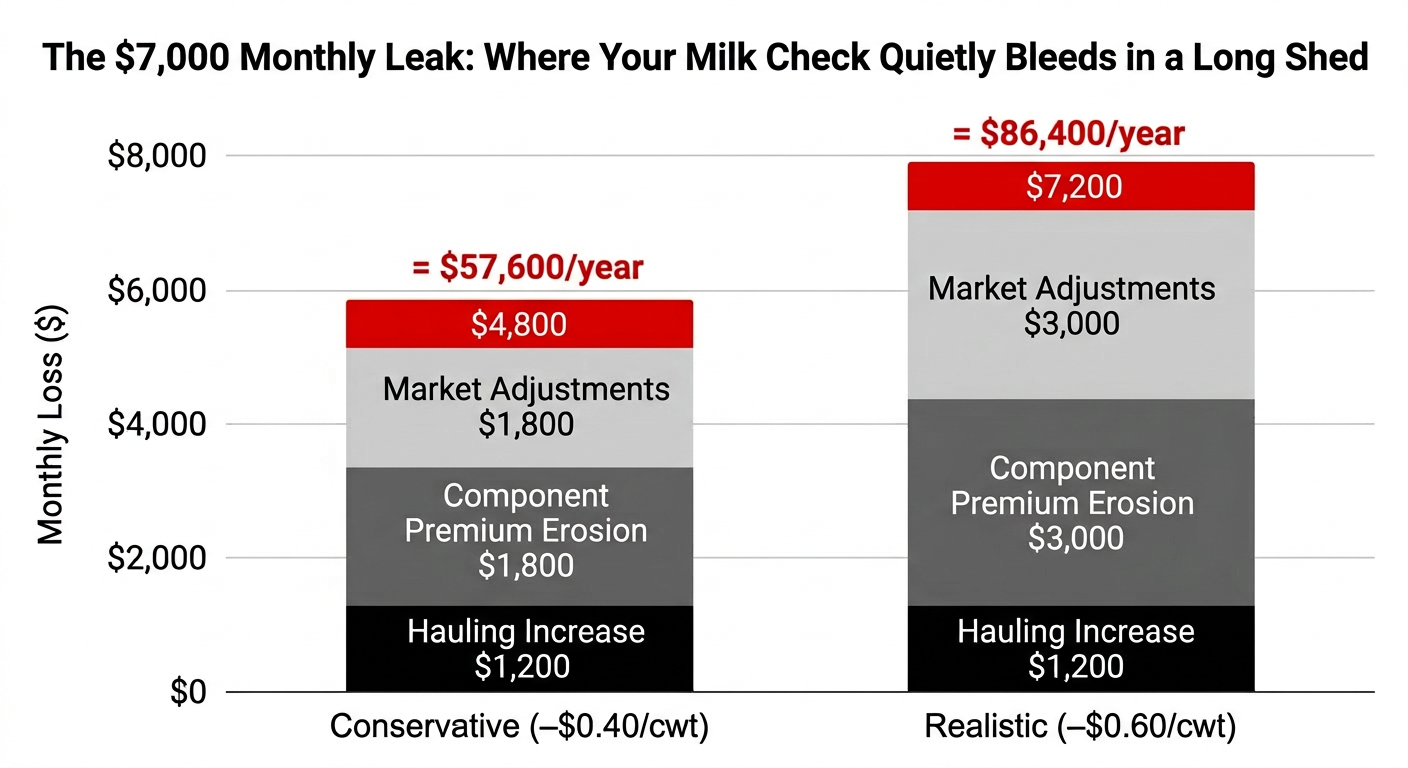
On 12,000 cwt per month:
- $0.40 × 12,000 = $4,800/month → $57,600/year.
- $0.60 × 12,000 = $7,200/month → $86,400/year.
That’s the $7,000‑ish leak. It doesn’t come all at once. It trickles out through hauling, weaker premiums, and quietly rising “market adjustments.”
How fast does your cushion disappear?
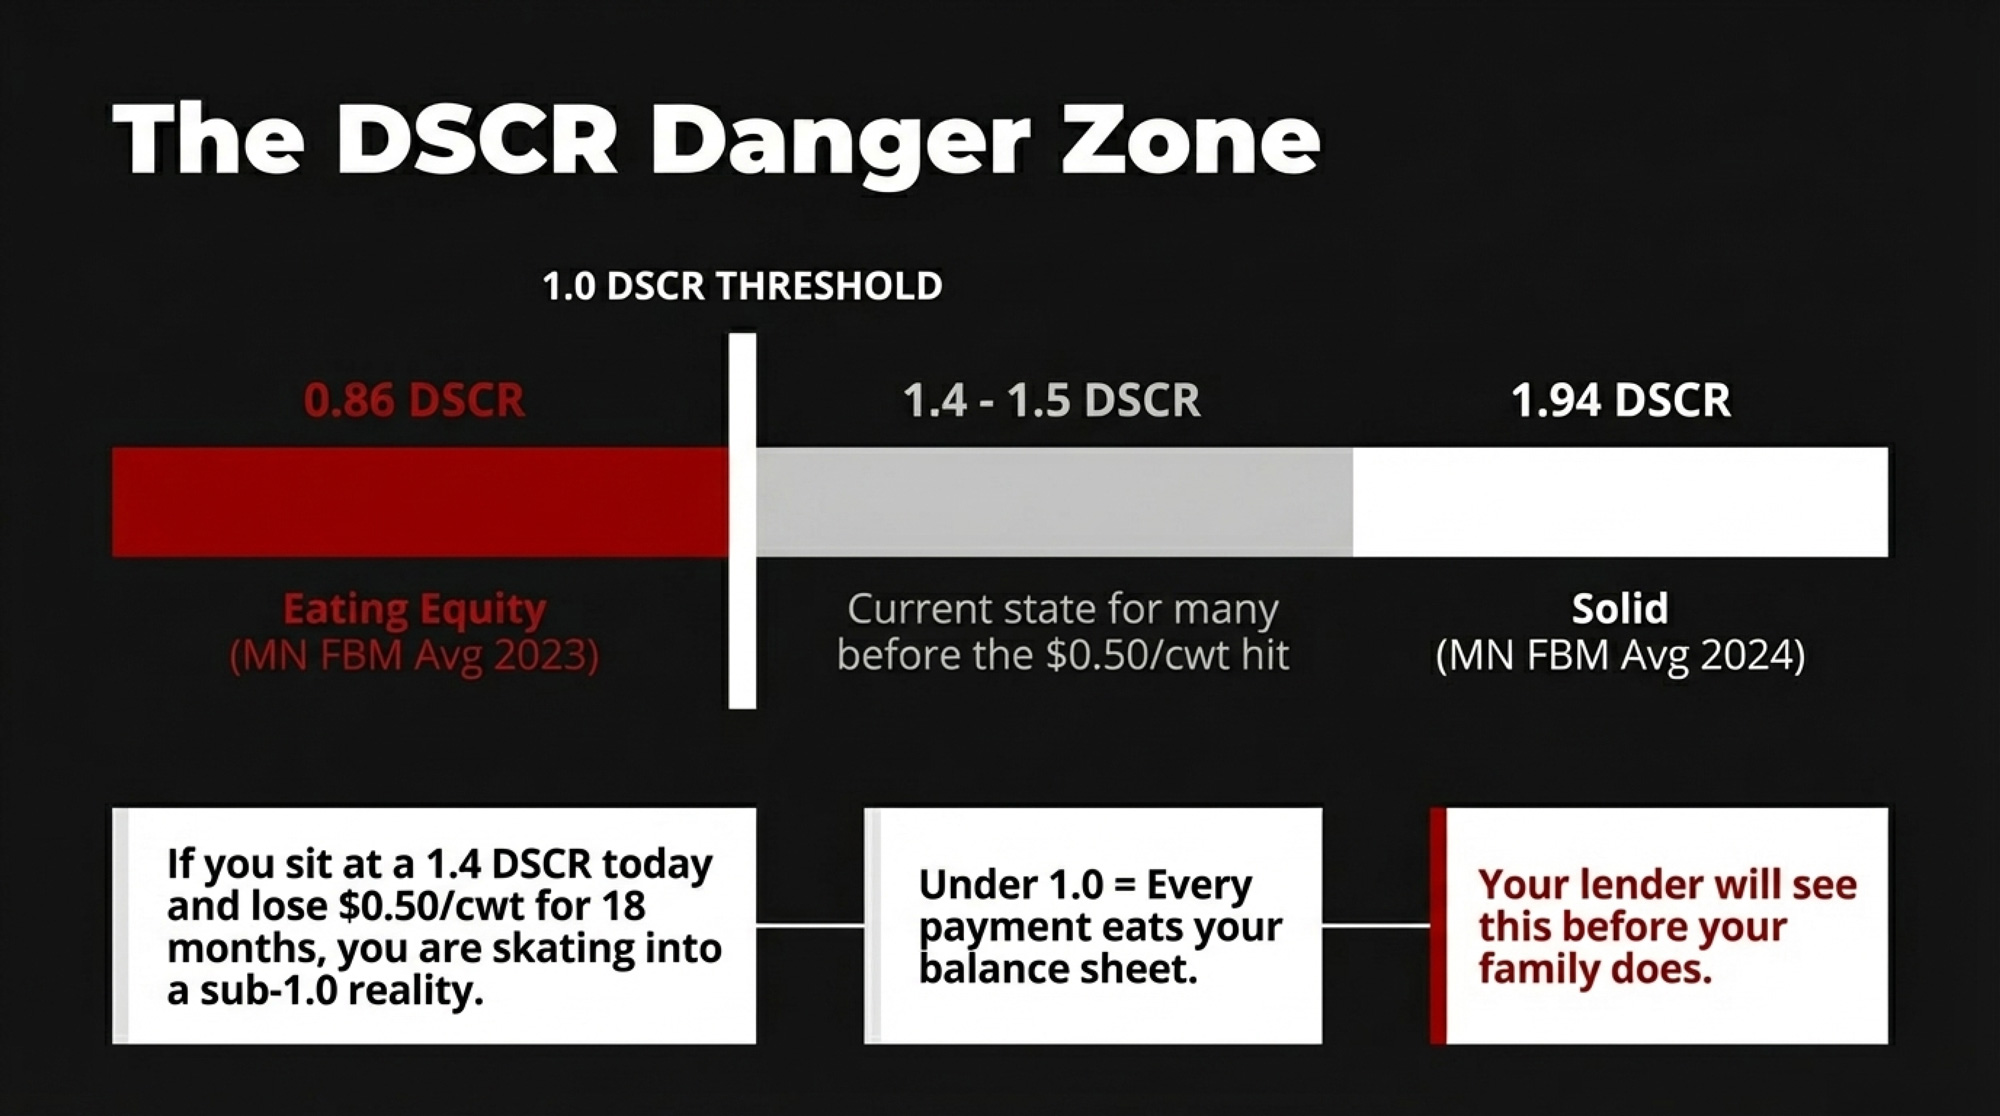
Minnesota dairy herds in the FBM program had a DSCR of 1.94:1 in 2024 — solid on paper. The year before, the dairy‑specific DSCR was 0.86:1. That means the average Minnesota dairy in that dataset couldn’t fully cover its debt service from operating income in 2023.
One year took DSCR from healthy to “eating equity.” Another year clawed it back. That’s how volatile the floor really is.
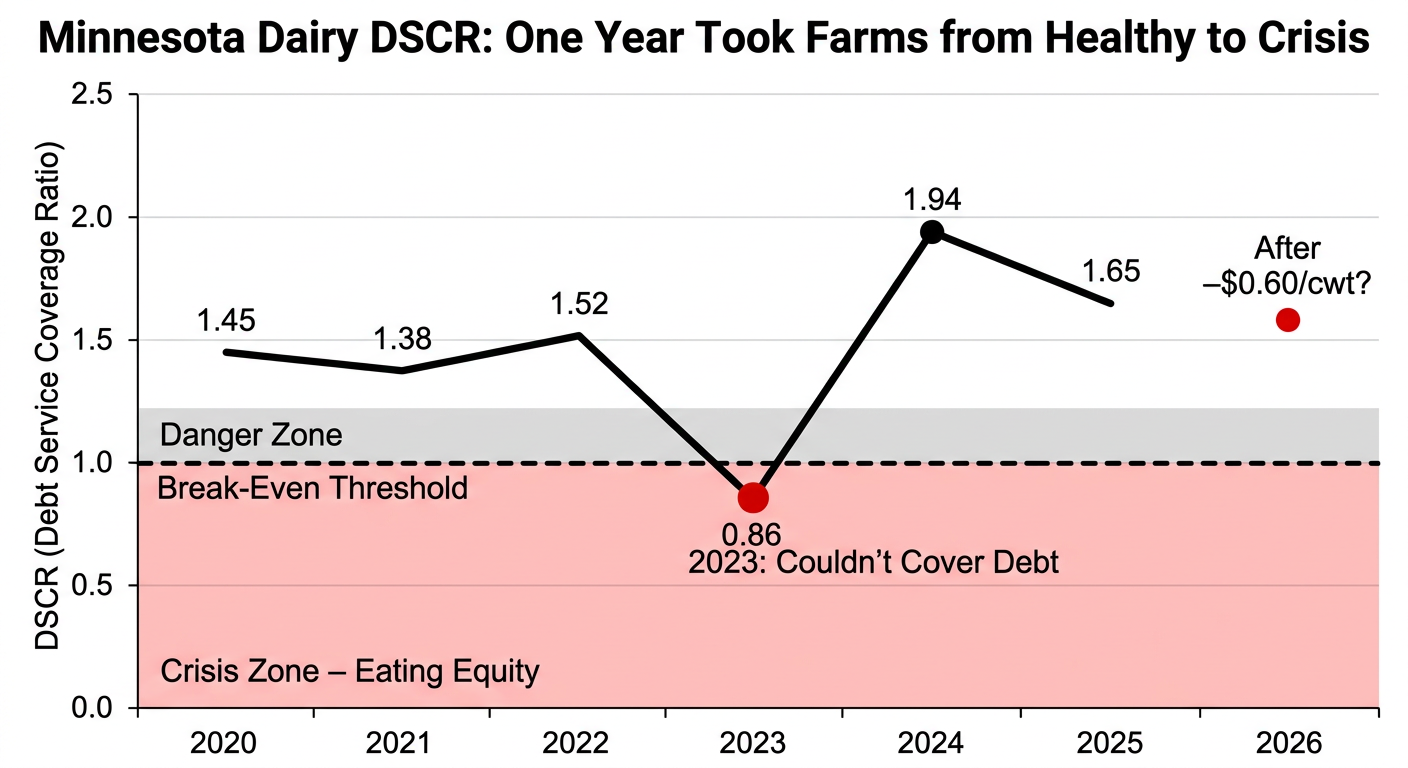
Now overlay the $0.40–$0.60/cwt shed hit:
- If you’re sitting at 1.4–1.5 DSCR today and lose $0.50/cwt for 12–18 months, you’re skating very close to that 0.86 world again.
- Once you drop below 1.0, every payment comes partly from your balance sheet, not just your milk.
That’s the part your lender will see before your family does.
Quick Margin Check: Your Shed, Your Numbers
Don’t guess. Pull your actual numbers and run this:
- Grab your last 12 months of milk checks.
- Calculate your average net mailbox price — that’s after hauling and all adjustments.
- Subtract $0.40/cwt, then $0.60/cwt.
- Multiply each by your average monthly cwt shipped.
- Call your lender and ask: “If my net price dropped by that much for 12–18 months, what would my DSCR look like compared to 2023 dairy portfolios?”
If that math puts you under 1.0 — or even under 1.2 — you now know how much clock you actually have if your shed goes long.
The Turn: When the Check Still Looks Fine, But Your Options Don’t
For a while, your milk check still looks “okay.” Components haven’t crashed. Basis hasn’t blown out. There’s no single ugly line that screams “You’re in trouble.”
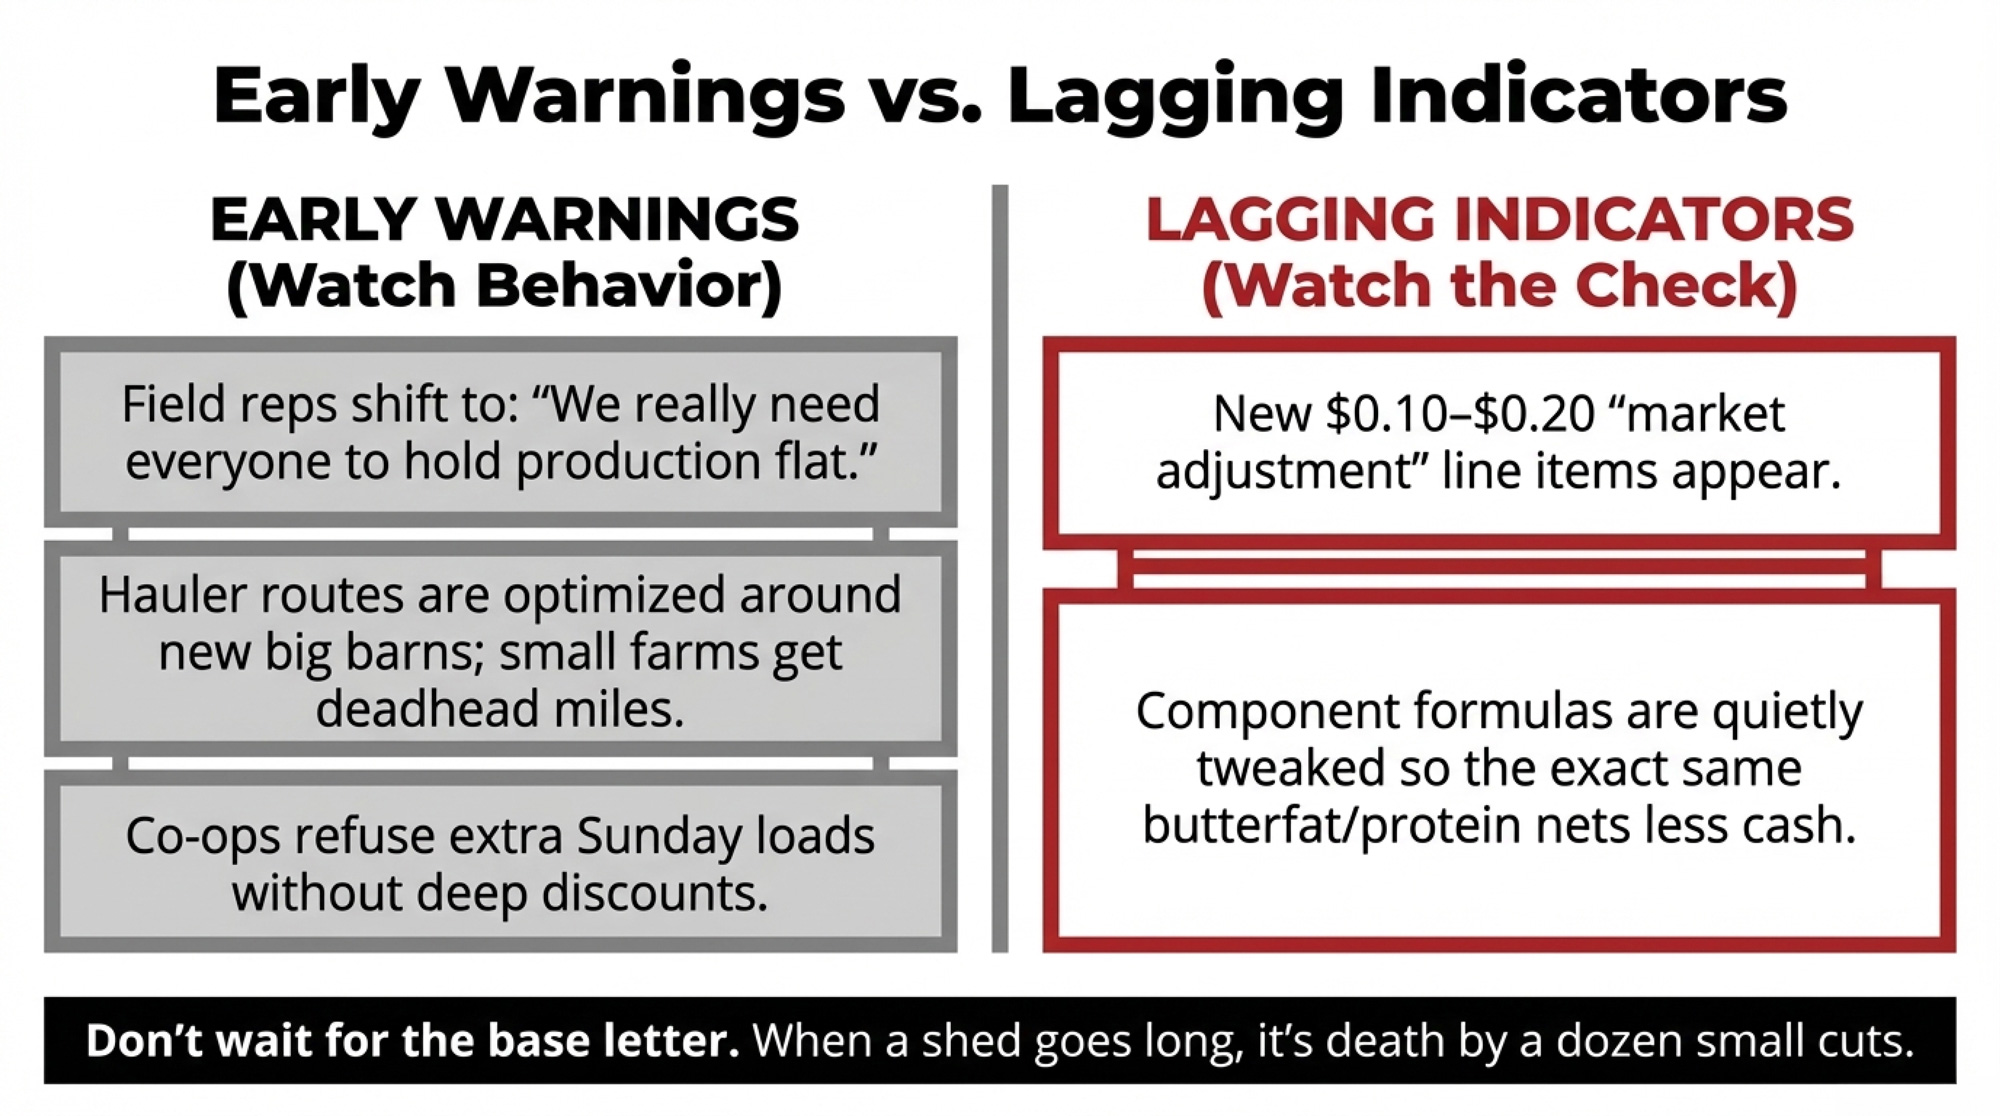
The early warnings show up in how people talk to you:
- Your field rep shifts from “We need all the milk we can get” to “We really need everyone to hold production flat this year.”
- A neighbor gets told the co‑op won’t take an extra Sunday load without a deep discount.
- Someone else mentions getting a quiet warning: “If you add those heifers, you might land in a new over‑base bucket.”
On the check, you start seeing:
- A new “market adjustment” line shaving $0.10–$0.20/cwt.
- Component formulas tweaked so the same butterfat and protein pull in a bit less.
It’s death by a dozen small cuts.
The “Core vs Fringe” Reality Nobody Likes to Say Out Loud
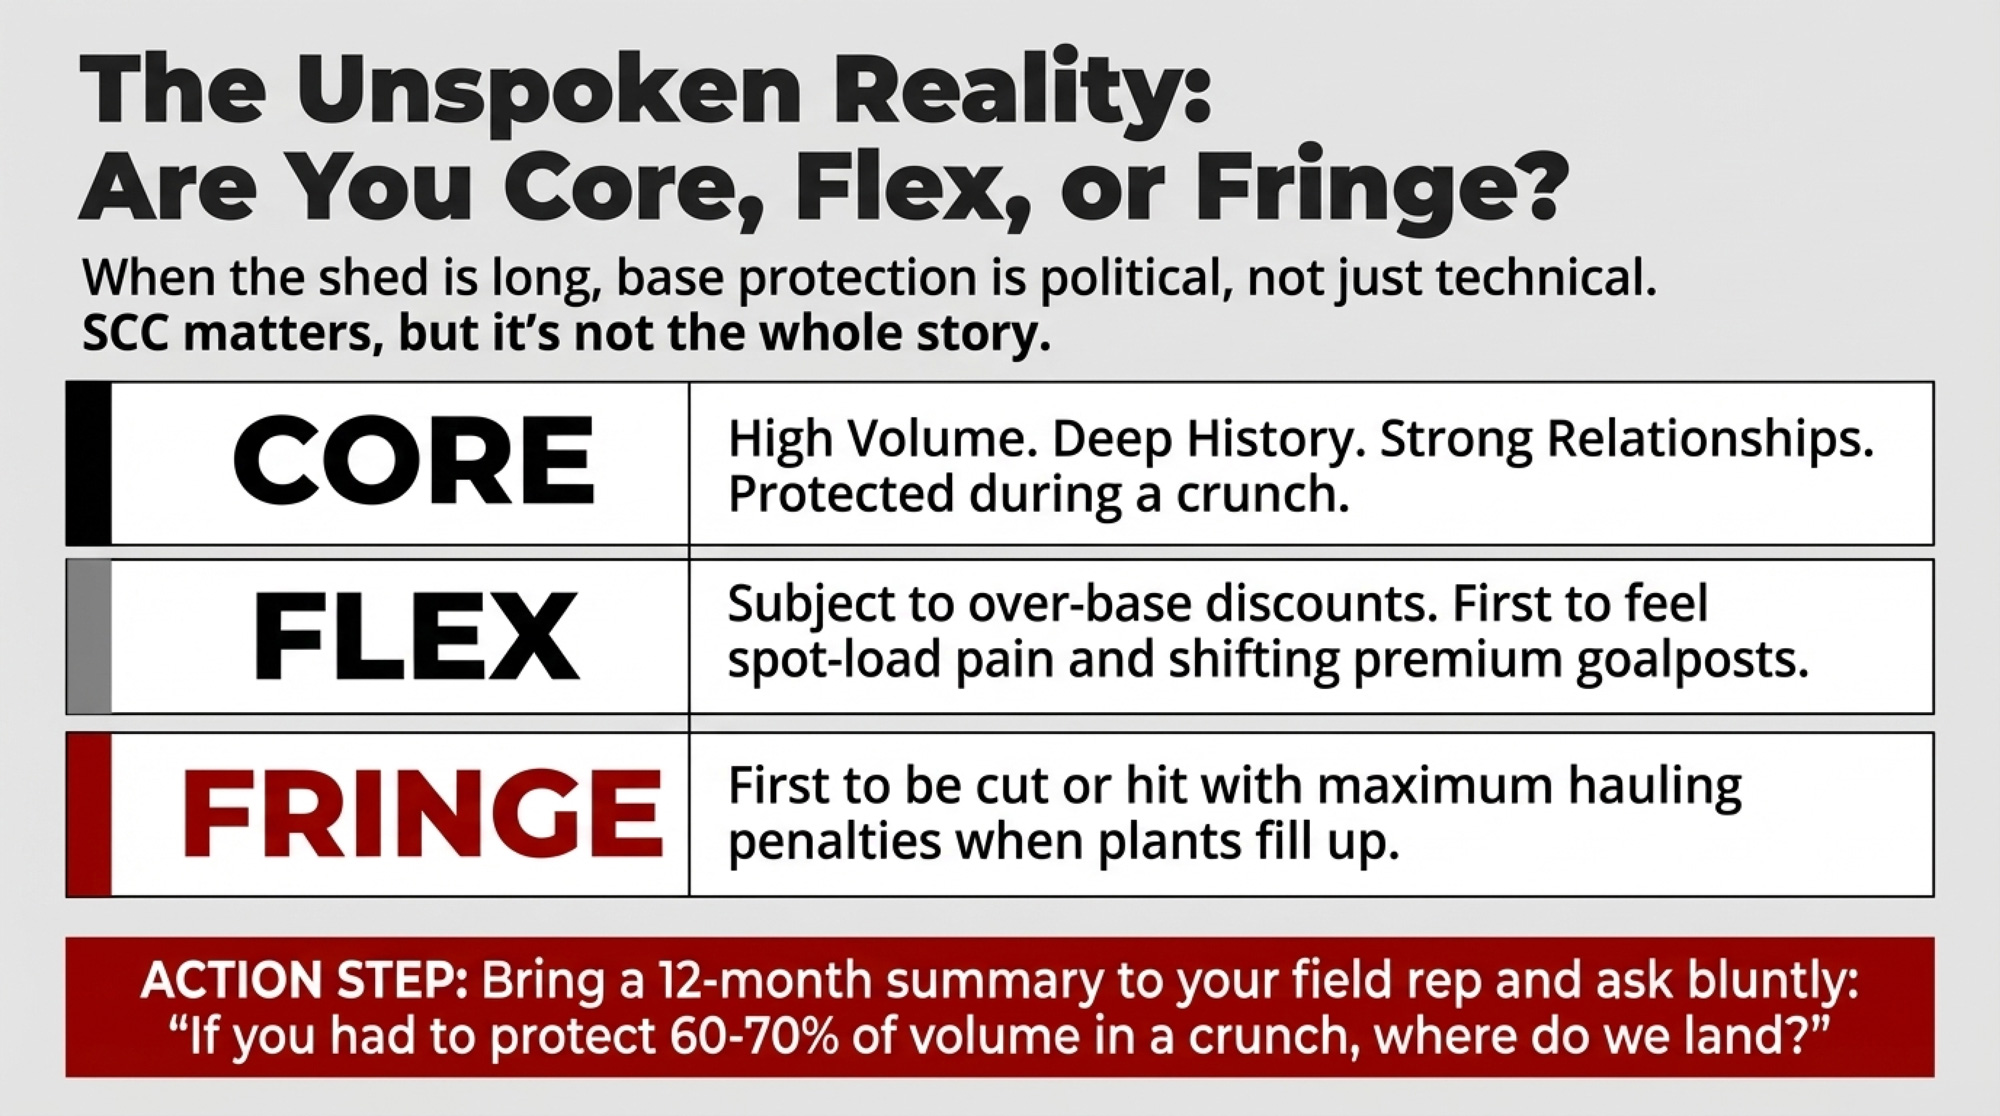
Here’s the part you never see in a newsletter. When a shed goes long, who keeps base and who gets squeezed is only partly about SCC and components. It’s also about politics.
A Family Dairies USA federal order brief years ago described local producers as “intent on protecting their markets” and pushing for regulatory fences around who got pool access. That fight was about interstate pooling, but the same instincts show up inside a shed when base‑allocation gets tight. When managers sit down to decide who’s “core,” three things matter:
- Volume. Bigger, consistent loads are easier to build routes and plant schedules around.
- History. How long you’ve shipped, how you behaved in the last crunch.
- Relationships. Whether your field rep goes to bat for you in that meeting.
SCC and components matter. But they’re not the whole story.
Instead of waiting for a base letter to officially label you, you can force that conversation early.
- Sit down with your field rep with a one‑pager: 12‑month CWT, SCC, components, and a couple of years of history.
- Ask three blunt questions:
- “Today, are we core, flex, or fringe?”
- “If you had to protect 60–70% of volume in a crunch, where would we land?”
- “What two things in the next 12 months would move us closer to core?”
Then take that same one‑pager, plus your −$0.40 and −$0.60/cwt margin scenarios, to your lender.
- Ask: “At these three margins — current, −$0.40, −$0.60 — where does my DSCR land? How many months could we tolerate each before my file starts to look like 2023 again?”
Most bankers will tell you straight:
- About a year at a lower margin if it’s planned.
- Two years start chewing equity.
- Three years make expansion or refinancing a hard sell in the credit committee.
The myth you’ve got to drop is: “I’ll know I’m in trouble when my milk check tanks.” By the time that happens, your best options — core base protection, decent refinance terms, or a clean exit — are already narrowing.
The 30/90/365‑Day Playbook After a Mega‑Dairy Permit
You don’t control West River’s permit. You do control how your operation is positioned when 10,000‑plus cows show up in your shed.
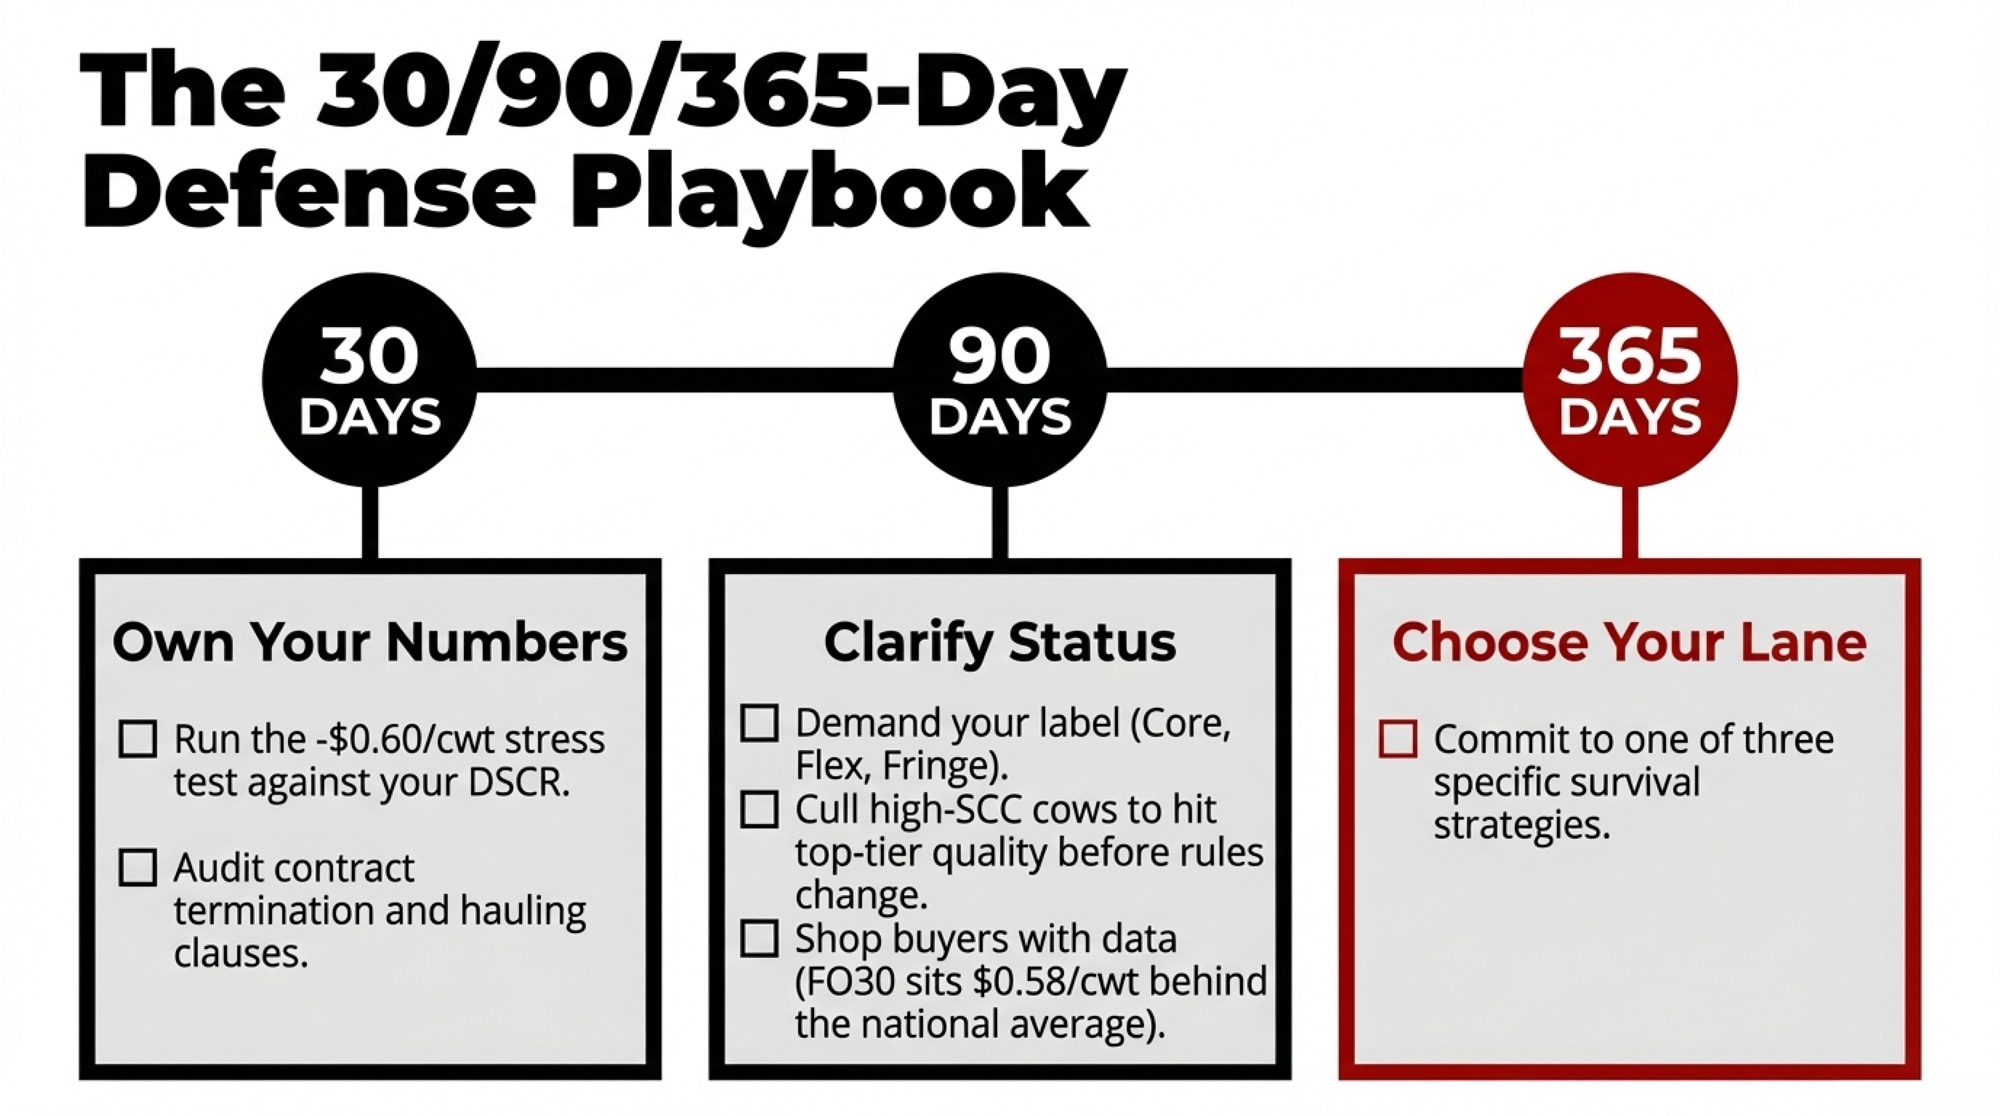
30 Days: Own Your Numbers
- Run your “minus $0.60/cwt” stress test. Use the quick margin check above. If your DSCR drops under 1.0, you’ve identified a structural risk, not a nuisance.
- Get ahead of your lender. Bring three numbers: your actual margin and the two stress‑test margins. Ask for your last two years of DSCR trends. If 2023 already shows a dip, you know how thin the ice is.
- Audit your contracts. Highlight:
- Termination clauses and notice periods.
- Base vs over‑base rules.
- Who’s on the hook for hauling if a route changes?
- Any “discretionary” premium language.
If your contract says “market conditions” can trigger changes on 30–60 days’ notice, and premiums are at the buyer’s discretion, that’s a big red flag in a long‑milk shed.
90 Days: Clarify Your Status
- Get your label from your buyer. Core, flex, or fringe. Don’t let it be a secret. Ask what specific changes would move you up a rung — better components, steadier volume, less drama on pickups.
- Shop alternatives with real data, not promises. FO30’s 2024 weighted average mailbox price was $21.22/cwt, versus $21.80/cwt for all federal order areas. You’re starting $0.58 behind. A new buyer only makes sense if you can document at least +$0.25–$0.50/cwt net after hauling and with equal or better base security — and only if they can show you 12 months of real checks.
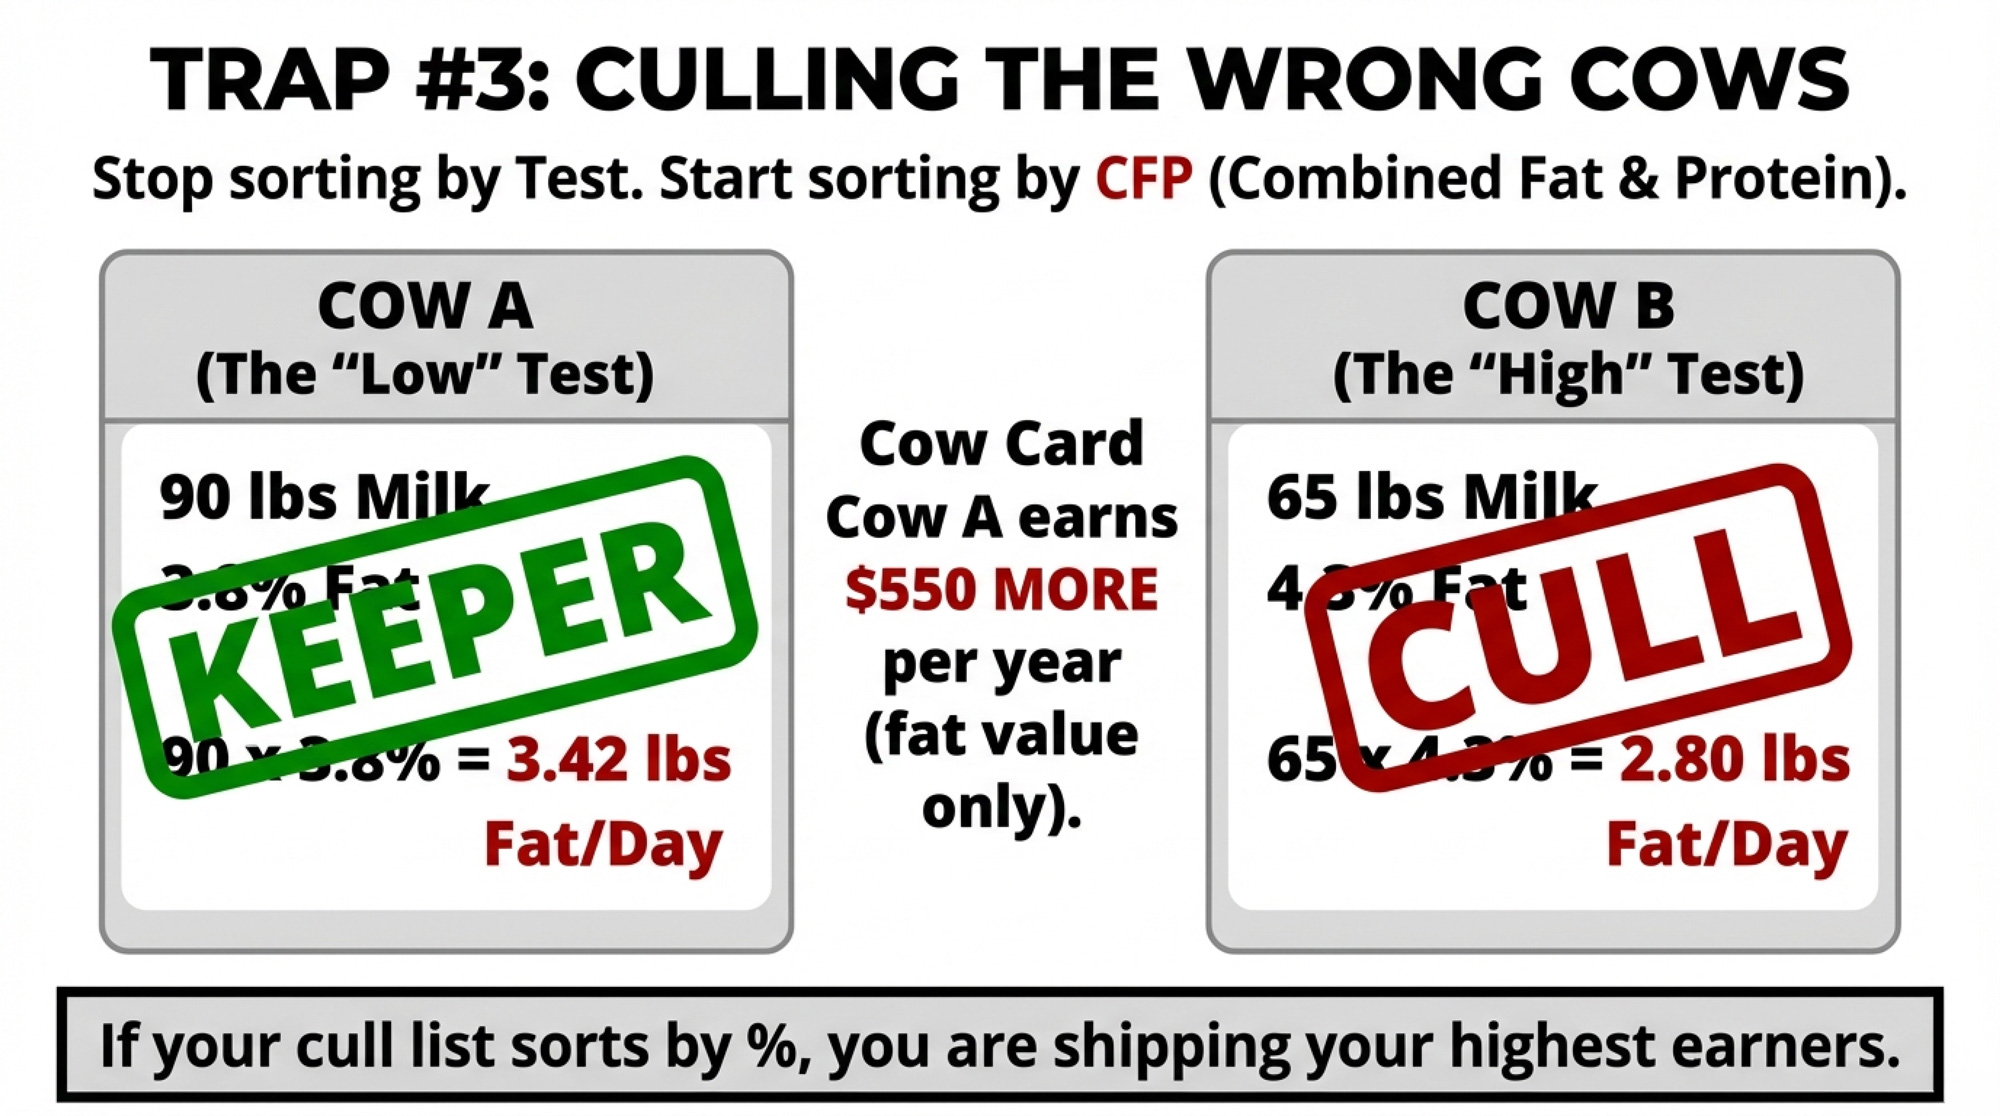
- Tighten your quality profile. Cull chronic high‑SCC, low‑production cows that drag your herd average. Get yourself into your buyer’s top quality tier now, before they reset how premiums are paid when the shed goes long.
Scale Up, Pivot, or Get Out: Choosing Your Survival Lane
As MPCA works through the EAW and Rep. Kristi Pursell pushes for mandatory Environmental Impact Statements on 10,000‑AU feedlots, mega‑builds are formally on the table in Minnesota. You’ve got roughly a year to decide which game you’re playing.
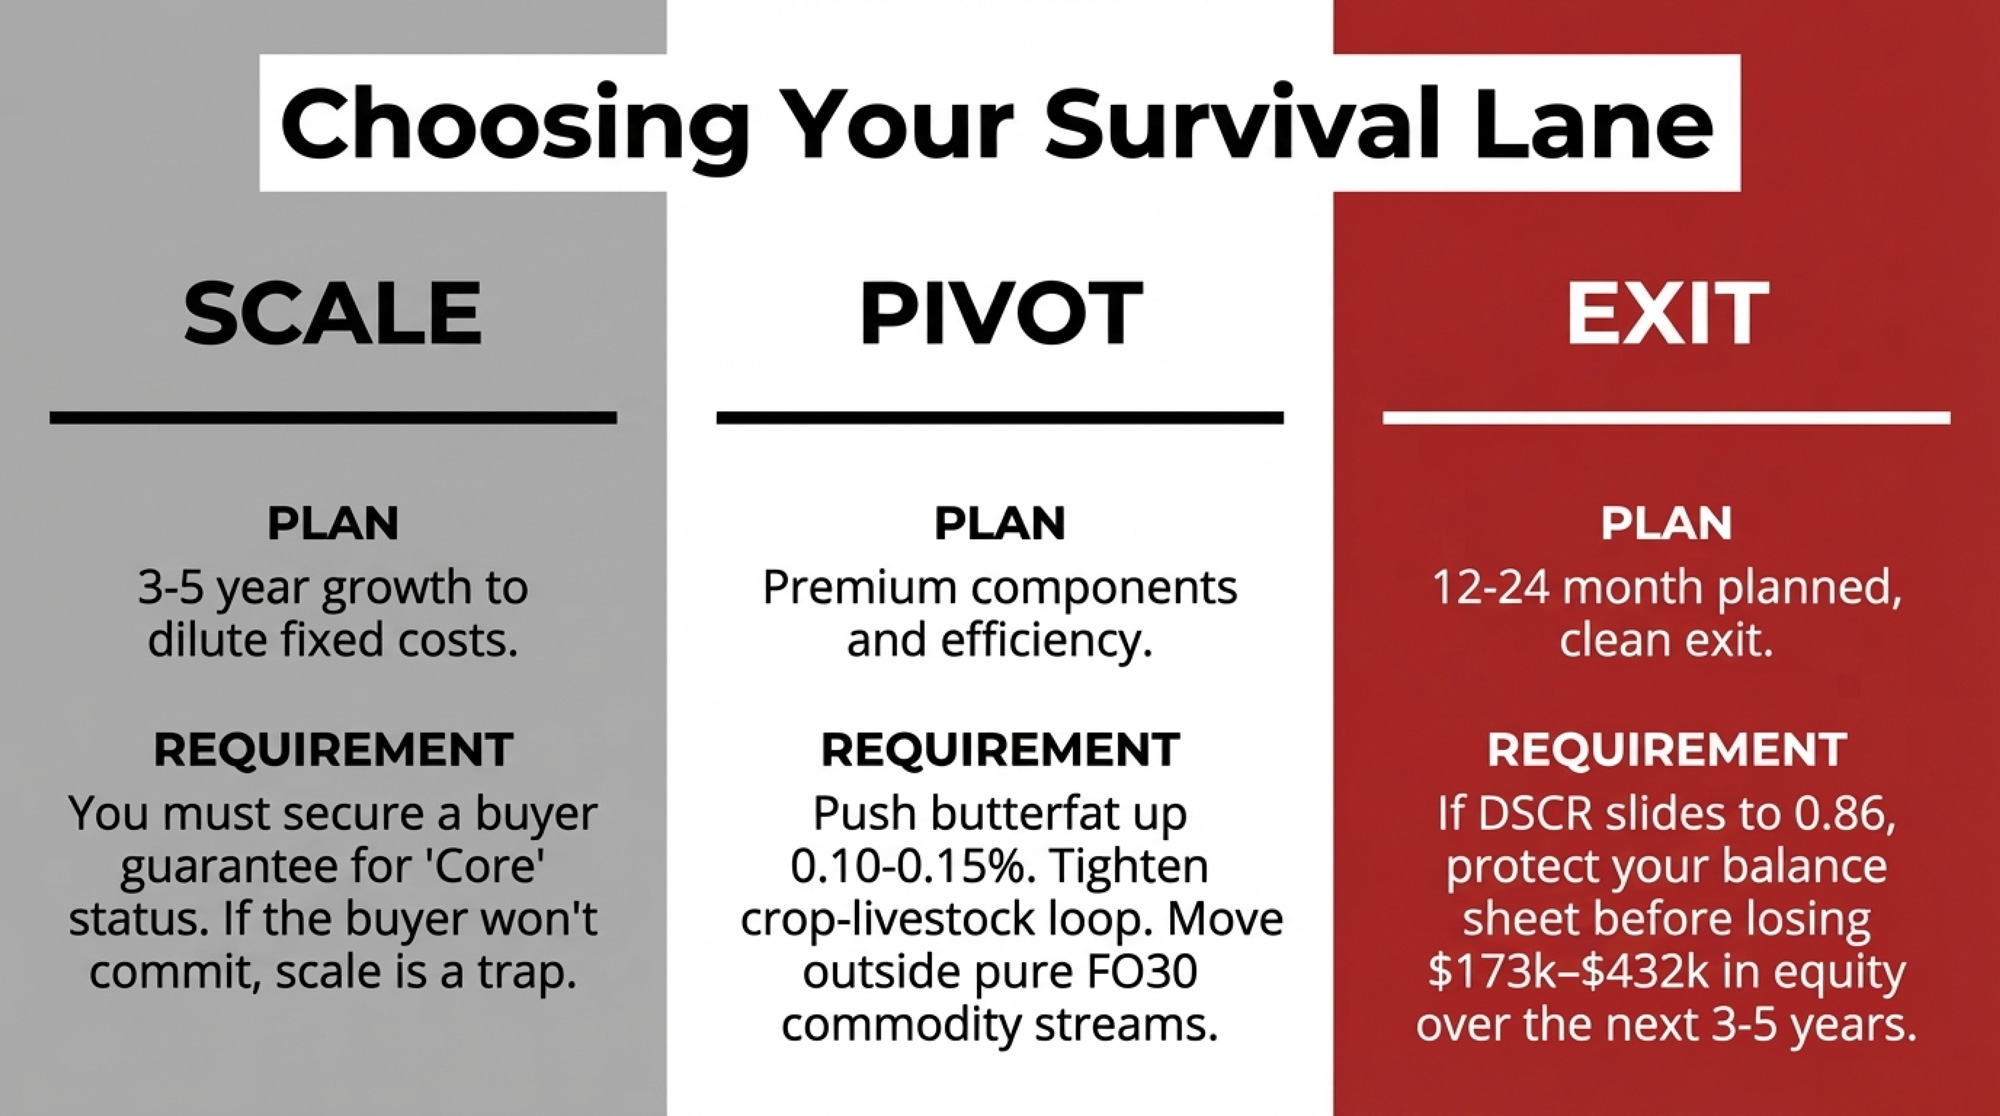
Lane 1 — Scale:
You work with your lender on a 3–5-year plan to add cows, showing how you can reduce the fixed cost per cwt enough to offset a $0.40–$0.60 regional hit. Then you ask your buyer straight:
- “If we grow to X cows by [year], does that move us into your core base or just make us a bigger flex farm?”
If the lender is nervous and the buyer can’t give you a clear path to core, scale probably isn’t your answer.
Lane 2 — Pivot to Premium/Efficiency:
You’re not going to out‑Riverview Riverview. But you can reduce how much any mega‑permit dictates your fate by:
- Locking in premiums that depend on quality/components, not just volume.
- Tightening your crop‑livestock loop to drop purchased feed cost per cwt.
- Exploring specialty channels that sit outside FO30’s pure commodity stream.
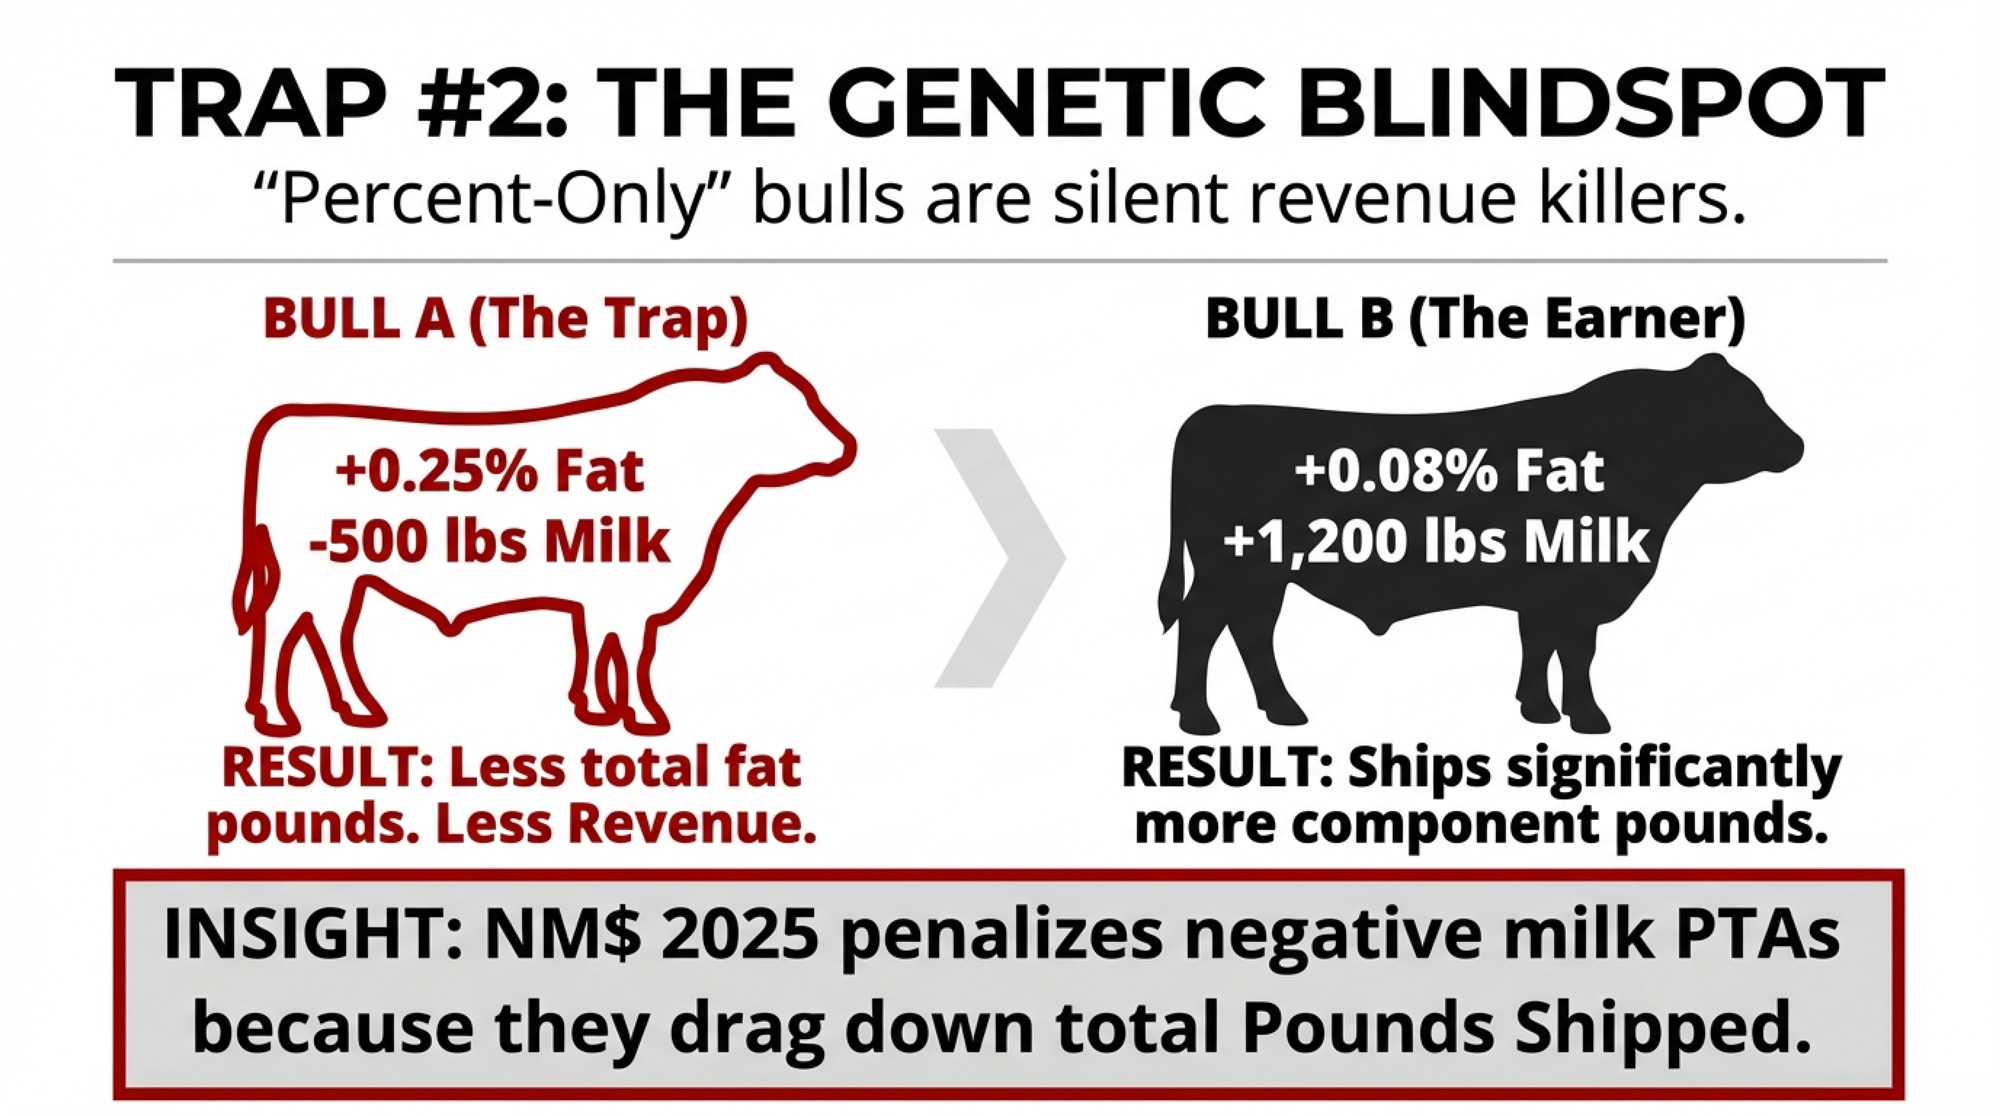
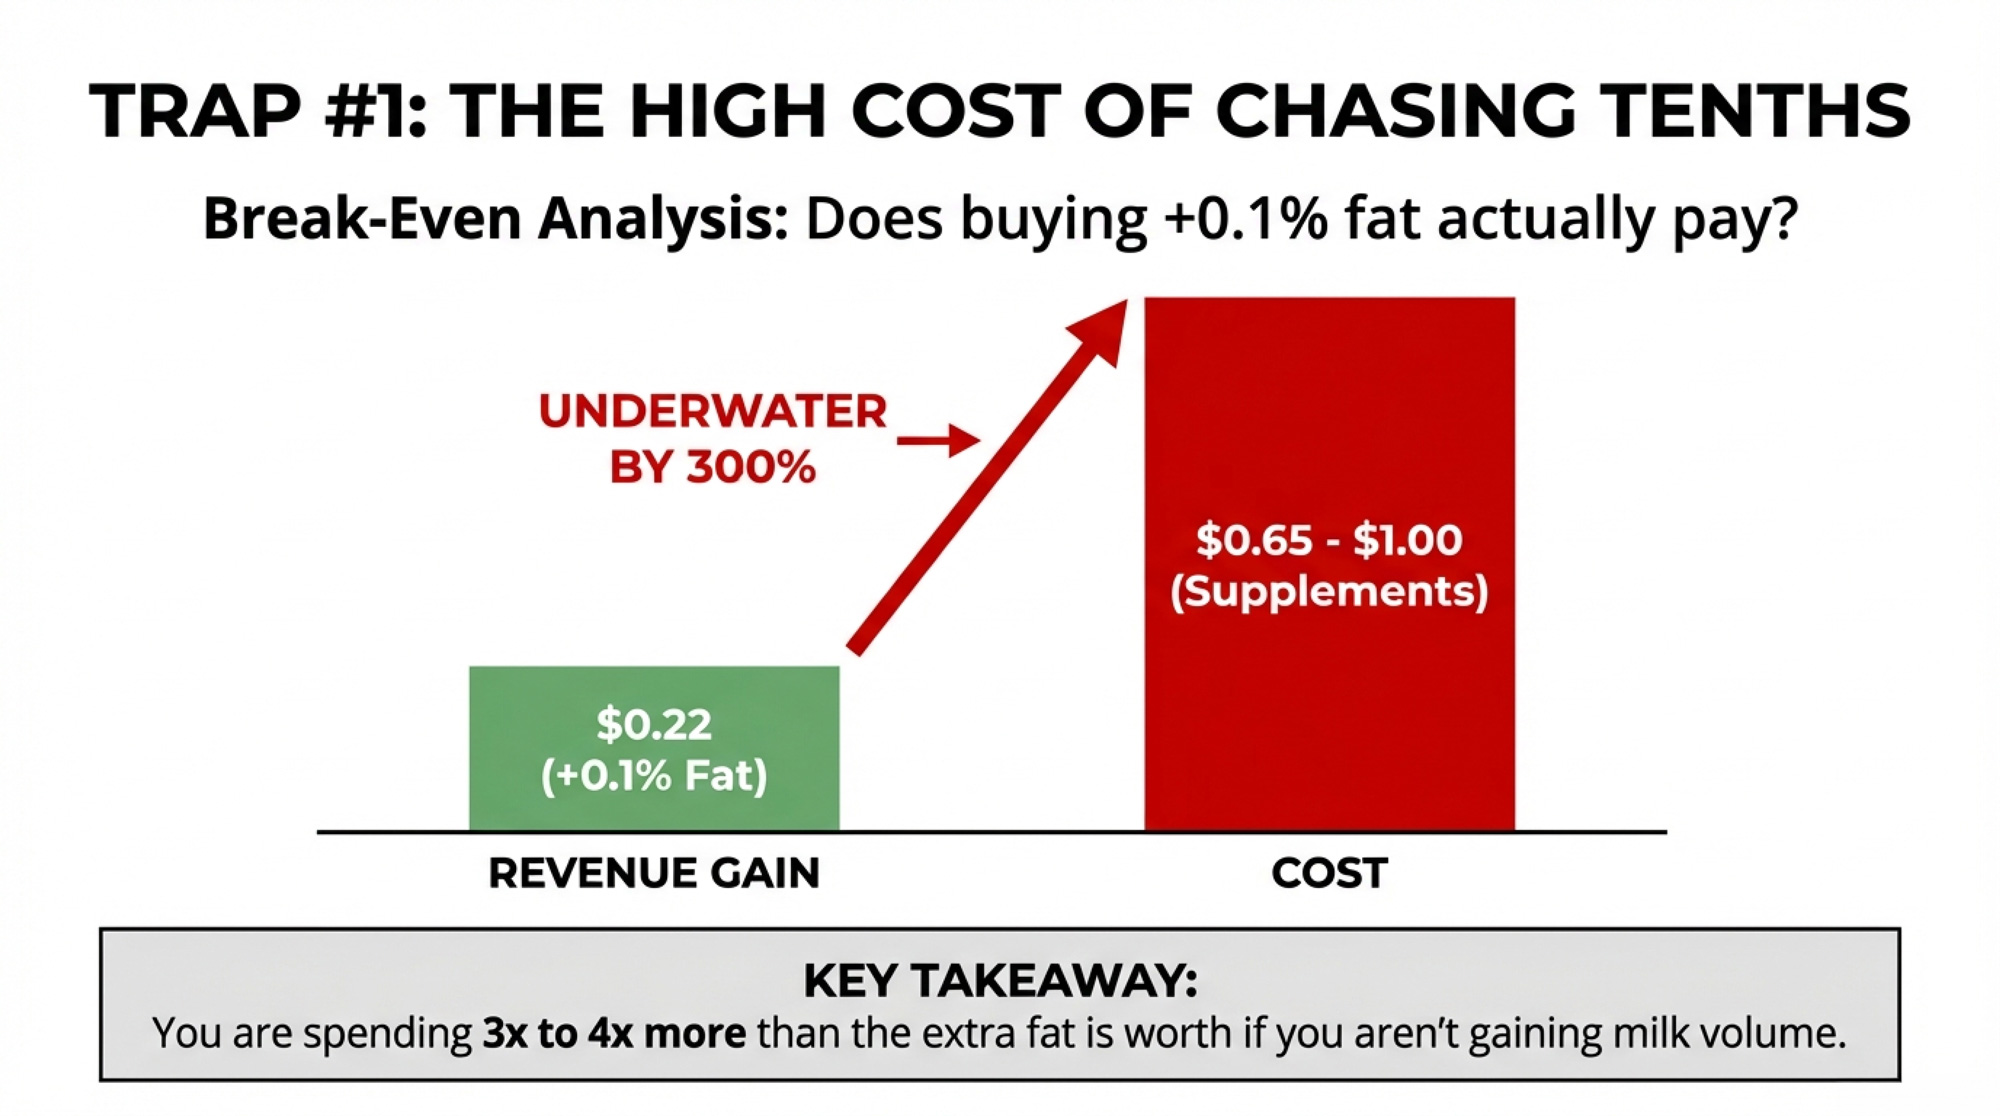
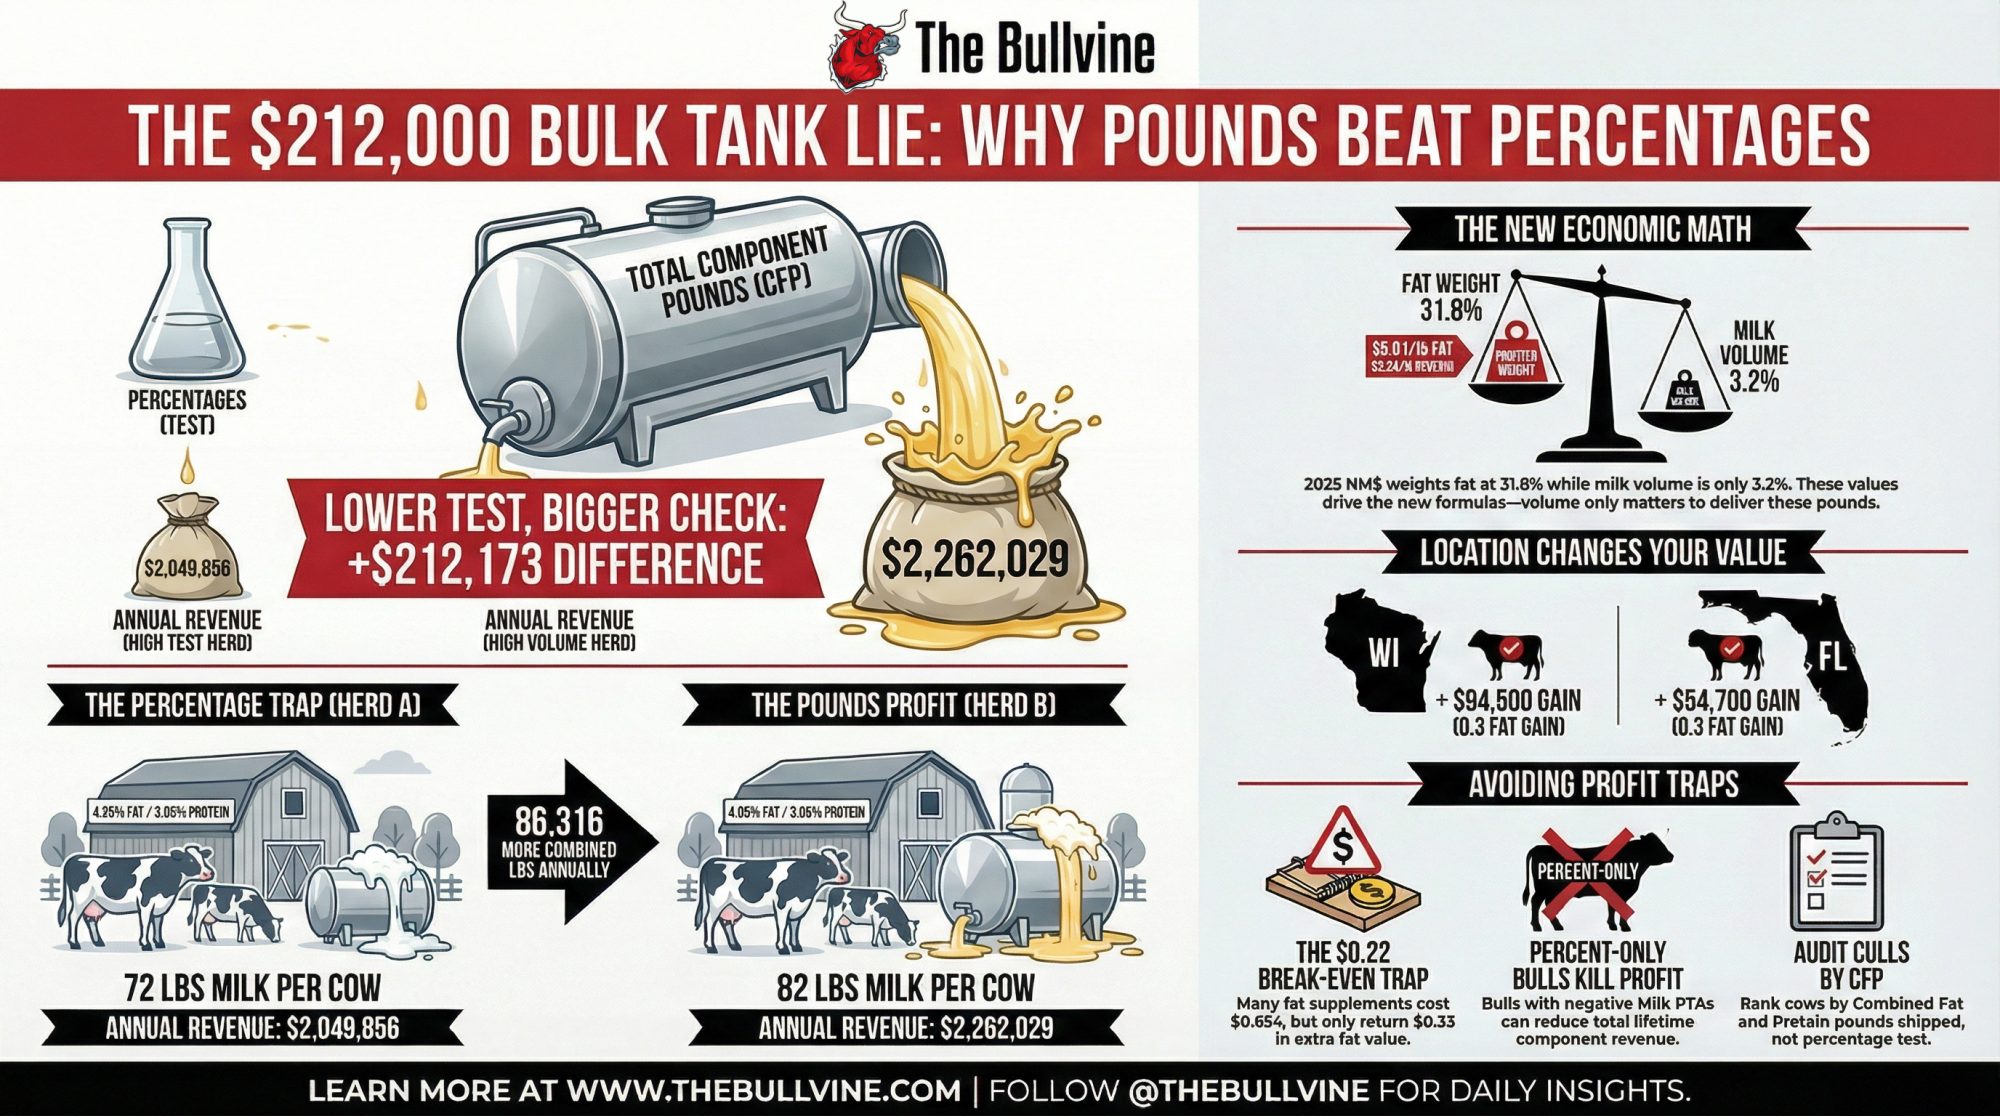
If you can realistically push butterfat up 0.10–0.15% and protein up 0.05–0.10% at the same or lower feed cost, and your co‑op or plant pays decent component premiums, you can claw back a meaningful chunk of that $0.40–$0.60/cwt loss through your own cows instead of someone else’s permit.
Lane 3 — Planned Exit:
If your honest margin stress test shows your DSCR sliding back toward 2023’s 0.86 with no believable fix in sight, a 12–24 month exit while your balance sheet is still strong might be the smartest move on the table.
On a 500‑cow herd:
- A $0.40/cwt hit costs about $57,600/year.
- A $0.60/cwt hit costs about $86,400/year.
Stay in that position for three to five years, and you’re looking at $173,000–$432,000 in cumulative lost equity. That’s the difference between walking away with fuel for the next chapter — or walking away with just enough to pay off the last one.
What This Means for Your Operation
- Don’t wait for the base letter. Treat any new 10,000‑plus permit in your shed as your starting gun for the 30/90/365‑day plan, not as something to file mentally under “policy news.”
- Use $0.40–$0.60/cwt as your personal stress‑test band. If dropping your net price into that range for 12–18 months pushes your DSCR below 1.0 — or even under 1.2 — that’s a sign you need a structural answer, not small cost cuts.
- Remember, your region starts behind. The FO30 Upper Midwest mailbox price is already $0.58/cwt below the all‑order average. You’ve got less margin to play with than your peers in richer orders.
- Watch behavior, not memos. Field reps talking about “holding production,” routes being “optimized” around new big barns, and extra loads being refused are your real‑time indicators that your shed is tipping long.
- Don’t move processors without proof. Don’t uproot a 500‑cow herd on a recruiter’s pitch alone. Ask for real mailbox data versus FO30’s weighted average and base terms in writing.
- In the next 30 days, pick up the phone twice. Once to your field rep with that one‑pager and three blunt questions. Once to your lender, with your −$0.40/−$0.60 margins pencilled in, asking how many months your DSCR can live there.
Key Takeaways
- If a mega‑dairy helps knock $0.40–$0.60/cwt off your net price, you’ve got roughly 12–24 months to either offset it or plan an exit before your balance sheet starts making decisions for you.
- The real hit isn’t one big line on your milk check; it’s the combination of higher hauling, thinner premiums, and new “market adjustments” that add up to $60,000–$80,000 a year on a 500‑cow herd.
- Your shed already sits $0.58/cwt below the national mailbox average, so the same shock that a Texas or Idaho herd can absorb might push a Minnesota herd back into 2023‑style DSCR territory.
- “Core vs fringe” is political as well as technical. Volume, history, and relationships matter as much as your SCC when plants decide who they hold onto in a long‑milk year.
The Bottom Line
Riverview isn’t the villain here. They’re playing the game as it’s written — vertically integrated from cow to powder plant, scaling across six states, lining up processing for their expansion. The real question is whether you’re still playing the game you signed up for — or just waiting quietly for the clock to run out.
Complete references and supporting documentation are available upon request by contacting the editorial team at editor@thebullvine.com.
Learn More
- $18.95 Milk, $19.14 Costs: USDA’s 2026 Milk Price ‘Upgrade’ Still Leaves Your Dairy in the Red – Arms you with the brutal math needed to survive the next 12 months. This breakdown exposes the gap between headline forecasts and real-world breakevens, delivering immediate action items for your next lender meeting.
- More Milk, Fewer Farms, $250K at Risk: The 2026 Numbers Every Dairy Needs to Run – Reveals the structural “more milk, fewer farms” trap reshaping the Upper Midwest. It provides a 500-cow stress test that identifies exactly where your equity is leaking before regional processing shifts close your exit windows.
- Your Cheese Plant’s New Bacteria Can Run 56% Faster – Why This Technology Decides Which Processors (and Farms) Survive 2030 – Exposes the hidden technological race inside your local plant. Discover how “programmable” fermentation and throughput gains are picking the industry’s winners, fundamentally changing which farms will secure the few remaining “core” supply contracts.
 The Sunday Read Dairy Professionals Don’t Skip.
 The Sunday Read Dairy Professionals Don’t Skip.
Every week, thousands of producers, breeders, and industry insiders open Bullvine Weekly for genetics insights, market shifts, and profit strategies they won’t find anywhere else. One email. Five minutes. Smarter decisions all week.