Archive for U.S. milk production

THE GREAT DAIRY MIGRATION: April’s Production Surge Reveals Who’s Winning and Losing in America’s New Milk Map

Texas herds surge 10.6% as US milk production hits 3-year high. Component-adjusted output up 3% – what it means for dairy margins.

EXECUTIVE SUMMARY: April 2025 saw U.S. milk production jump 1.5% year-over-year – the largest gain since 2022 – driven by a 89,000-cow herd expansion and rising yields. Texas dominated growth with a 10.6% output surge, while Idaho’s 4.2% rise faced emerging H5N1 risks. Component-adjusted production soared 3%, amplifying manufacturing potential despite California’s lingering avian flu challenges. Markets reacted bearishly as Class III futures dropped 20¢, signaling concerns about sustained oversupply. The data reveals a geographic shift, with Southern Plains states outpacing traditional dairy regions.

KEY TAKEAWAYS:

  • Historic expansion: 102K cows added in 10 months, pushing herds to 9.4M head – highest since mid-2021.
  • Texas powerhouse: 50K new cows + 55 lb/cow yield gain = 10.6% production spike.
  • Component revolution: 4.31% fat (+1.7%) and 3.34% protein (+1.2%) created 3% manufacturing value surge.
  • Regional realignment: Kansas (+11.4%) and South Dakota (+9.2%) boom as Washington (-4.5%) and Florida (-3.7%) contract.
  • Market warning: Bearish price reactions signal oversupply risks if demand doesn’t match 2%+ component-adjusted growth.
U.S. milk production, dairy herd expansion, milk components, Texas dairy, April 2025 dairy report

April 2025’s milk production statistics aren’t just another monthly data point—they’re the smoking gun confirming a fundamental restructuring of America’s dairy landscape. The 1.5% production surge (3.0% on a component basis) reveals how rapidly production power is shifting south and west, creating winners and losers in an industry transformation many producers aren’t prepared to acknowledge, much less address. USDA’s latest data confirms that the production center is shifting dramatically away from traditional dairy states toward regions that many “experts” dismissed as unsustainable just a decade ago.

The Numbers That Shatter Conventional Wisdom

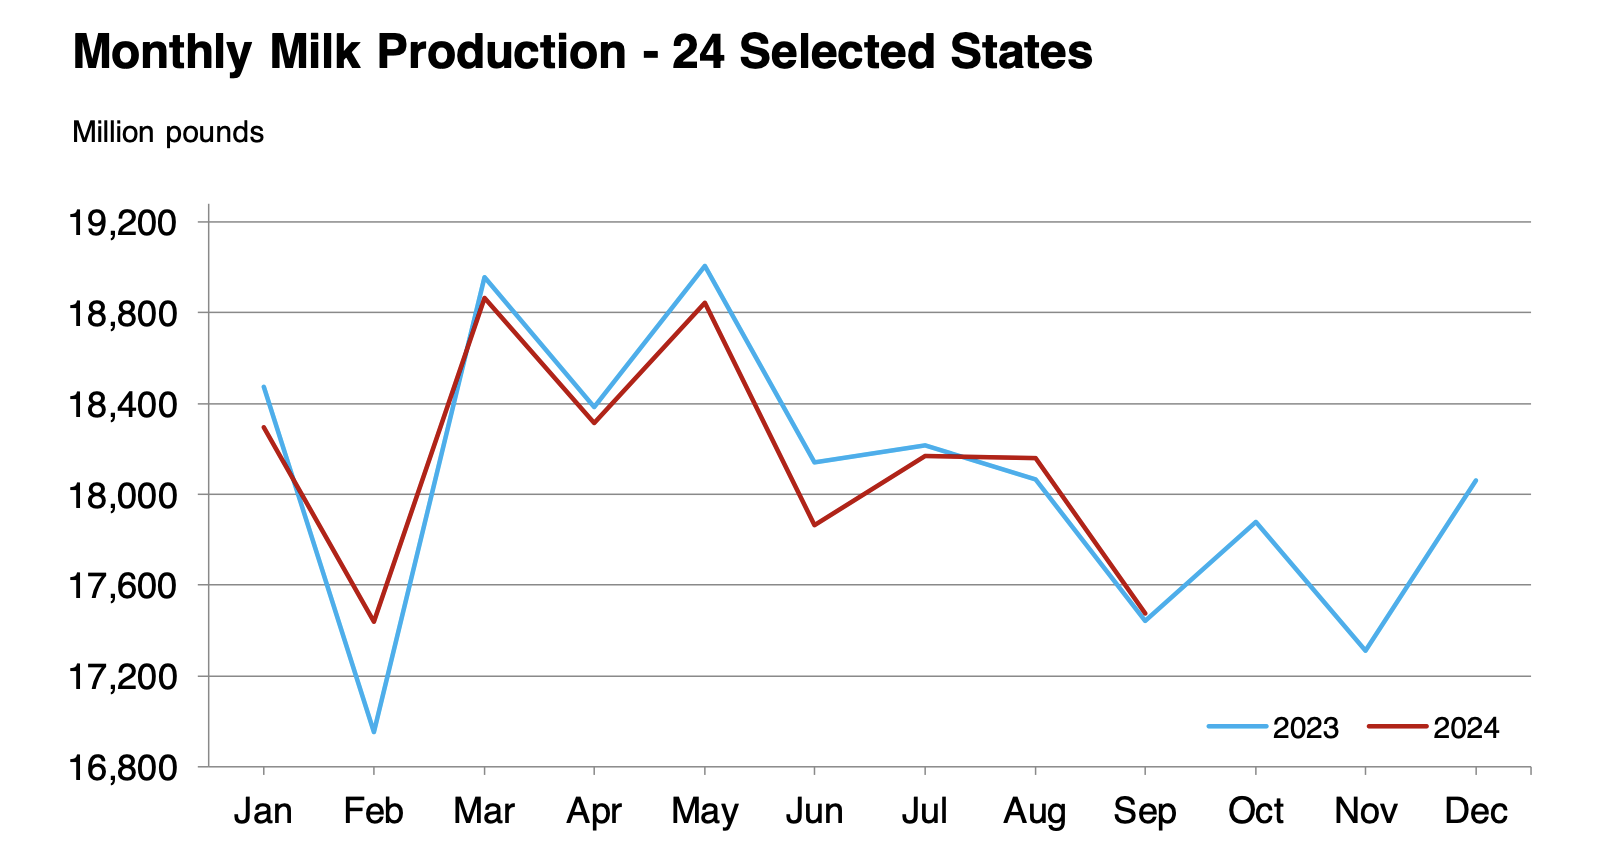
Let’s be brutally honest about what April’s milk production report tells us. The nationwide 1.5% production increase compared to April 2024 doesn’t just mark the fourth consecutive month of rising output—it represents the most substantial year-over-year percentage gain since August 2022, according to USDA data released May 21, 2025.

What should make you sit up straight is the component-adjusted production increase of 3.0% that vastly outpaced the raw volume growth. This isn’t just more milk—it’s dramatically more valuable milk, with fat content reaching 4.31% (up 1.7% from last year) and protein climbing to 3.34% (up 1.2%).

When was the last time anyone in your cooperative meeting mentioned that component-adjusted production was growing at double the volume rate? It’s like celebrating a 200-bushel corn crop while ignoring that the test weight jumped from 56 to 58 pounds per bushel. The manufacturing value of America’s milk supply is expanding at a rate that’s reshaping processing economics in ways many industry observers seem determined to ignore.

This wasn’t supposed to happen. Market analysts had predicted a modest 1.2% growth. Instead, producers delivered an expansion that sent Class III futures and cheese prices tumbling approximately 20 cents in nearby months. When the market pundits and economists consistently underestimate production growth for four consecutive months, it’s not just a miscalculation—it’s a failure to recognize fundamental structural changes in the industry.

The Triple-Threat Expansion That Nobody Saw Coming

The April data exposes an industry expanding through three simultaneous vectors, creating a multiplier effect that catches even experienced market watchers flat-footed.

Heifers Stay Home: The Return of National Herd Expansion

For years, conventional wisdom claimed that the national dairy herd would remain flat, or contract as consolidated operations focused on efficiency rather than cow numbers. That narrative just collided head-on with reality. According to USDA’s National Agricultural Statistics Service, the April milking herd reached 9.425 million head, up 89,000 compared to April 2024 and adding 5,000 just since March.

This isn’t a statistical anomaly. U.S. dairy farmers have added 102,000 cows to the national herd in just 10 months—a 1.1% increase that has brought the milking population to its highest level since mid-2021, with the exception of that single month in March 2023.

What makes this expansion truly remarkable is its timing. Producers are actively growing herds despite cull cow prices that would typically have them backing up the trailer to the freestall barn every time a cow shows the slightest sign of trouble. When dairy producers choose milk production over $1,500+ cull checks, it signals they’ve run the numbers and see substantially more long-term value in keeping those animals in the parlor than in the beef supply chain.

We should ask whether this herd growth is driven by confidence in dairy fundamentals or by producers chasing more substantial cash flow in regions where cowside margins remain artificially inflated by unsustainable subsidies or environmental regulatory forbearance? The geographic distribution of this growth suggests the latter may be more significant than industry cheerleaders care to admit.

From Good to Great: Yield Climbs Despite Dilutive Factors

As the national herd grows, individual cow productivity isn’t reduced by first-lactation heifers and held-over cull candidates. It’s improving. USDA reports milk per cow averaged 2,055 pounds in April, 11 pounds more than April 2024, representing a 0.6% increase.

This yield improvement is particularly telling because it’s happening simultaneously with herd expansion. The industry’s conventional wisdom holds that you can grow aggressively or improve per-cow production, not simultaneously. The USDA data directly contradicts this assumption.

Typically, rapid herd growth involves bringing in younger, first-lactation animals and retaining older cows longer, which drag down average productivity. Yet national yields are still climbing, suggesting that the genetic advancement curve is steepening rather than flattening, despite widespread complaints about genetic diversity constraints. The annual rate of genetic improvement appears to be outpacing the dilutive effects of herd expansion—a phenomenon that undermines decades of dairy management assumptions.

The Component Revolution Nobody’s Talking About

Perhaps the most significant trend in the April data—and the one getting the least industry attention—is the continued improvement in milk components. Analysis shows fat content reached 4.31% (up 1.7% from last year) while protein rose to 3.34% (up 1.2%).

This component boost is why the true expansion of U.S. milk production is double what the fluid numbers suggest. While raw volume increased 1.5%, component-adjusted production surged 3.0%. This means processors receive substantially more manufacturing material from each tanker, dramatically expanding the dairy solids available for cheese, butter, and powder production.

For farmers in Federal Orders with component pricing, this represents a significant revenue multiplier beyond simple volume growth. For processors, it means substantially improved manufacturing efficiency. Yet how many producer meetings have you attended where the focus was entirely on hundredweight volume rather than component yield? The industry’s fixation on fluid metrics is increasingly disconnected from the economic reality of modern milk production.

MYTH BUSTER: The Expansion/Efficiency Trade-Off Is Dead

Dairy advisors and economists have repeated the same mantra for decades: “Rapid herd expansion inevitably dilutes per-cow productivity.” The April data completely demolishes this long-held belief. Despite adding 89,000 cows nationally and expanding the dairy herd at the fastest rate in years, milk per cow still increased 0.6% year-over-year, according to the USDA’s official report.

This wasn’t supposed to happen. The traditional wisdom suggests that when operations add significant numbers of younger animals and retain marginal older cows longer, average production should decline or at best remain flat. But the evidence is clear—we’re simultaneously experiencing both quantity (more cows) AND quality (more milk per cow) expansion.

What changed? And why aren’t industry advisors acknowledging this new reality? The data suggests genetic advancement is accelerating faster than previously recognized. Modern genetic selection tools, genomic testing, and AI-driven breeding decisions deliver productivity gains that outpace the natural dilutive effects of herd turnover.

This has profound implications for dairy business planning. Suppose you’re still operating on the old assumption that you must choose between expansion and efficiency. In that case, you’re using an outdated playbook that places your operation at a significant competitive disadvantage against producers who recognize and leverage this new reality.

America’s Dairy Geography Revolution: The New Powerhouses Emerge

The national production increase masks the most important story in the April data: a fundamental geographic restructuring of America’s dairy industry happening faster than most industry veterans believed possible.

Texas: The Undeniably New Dairy Capital

If you’re still thinking of Wisconsin as America’s Dairyland, it’s time to update your mental map. According to USDA figures, Texas’s milk production surged an astonishing 10.6% year-over-year in April, reaching 1.511 billion pounds. This extraordinary expansion wasn’t just incremental growth but a seismic shift in production capacity.

Texas added 50,000 cows to its dairy herd in just 12 months, growing from 640,000 to 690,000 head. That single-state expansion accounts for 56% of the entire national herd growth, as verified by the USDA’s state-level data. Even more impressively, milk per cow jumped from 2,135 to 2,190 pounds, demonstrating that Texas isn’t just adding cows—it’s continuously improving productivity.

Let’s put this in perspective: Texas alone accounted for more than half of America’s net dairy herd expansion. The state is no longer merely an emerging dairy power; it has established itself as the epicenter of U.S. dairy growth with a production model that combines aggressive expansion with improving efficiency.

This rapid growth raises uncomfortable questions about resource allocation. When a single state adds more cows in one year than many traditional dairy states’ milks, how sustainable is the resulting concentration of animals, manure nutrients, and water demand? Texas’s growth model depends on groundwater from the rapidly depleting Ogallala Aquifer and cheap feed grain production subsidized by federal crop programs. Is this the sustainable future of American dairying, or are we witnessing a resource bubble that will eventually burst with devastating consequences?

Idaho: Growth Despite Disease Shadows

According to the USDA’s April report, Idaho posted a robust 4.2% milk production increase in April, reaching 1.471 billion pounds. Unlike Texas, however, Idaho’s growth came entirely from herd expansion. The state added 28,000 cows year-over-year while milk per cow remained flat at 2,110 pounds.

This reliance on herd growth rather than productivity improvement creates potential vulnerability, particularly as The Bullvine reports new cases of H5N1 avian influenza have begun to emerge in Idaho. While the impact was described as “limited” in April, this development warrants close attention. Have we learned nothing from California’s experience with H5N1? When an industry builds growth projections entirely on herd expansion without concurrent productivity improvements, it’s creating a house of cards that can collapse with the first strong biological headwind.

Idaho’s production model—focusing on cow numbers rather than cow efficiency—resembles a crop farmer expanding acreage without improving yield. When margins tighten or disease challenges emerge, operations without productivity improvements to buffer against herd reductions become disproportionately vulnerable. Is Idaho making the same strategic error that cost California its production dominance?

California: Beyond Bird Flu

California, America’s largest milk-producing state, continued to feel the effects of H5N1 with April production falling 1.4% year-over-year to 3.480 billion pounds, according to USDA data. However, analysts note this represents improvement from March’s 2.7% decline and outperformed their forecast of a 1.7% reduction.

Interestingly, California’s struggles stem primarily from reduced productivity rather than herd contraction. The state’s cow numbers increased slightly by 1,000 head year-over-year, but milk per cow fell by 30 pounds. This suggests H5N1’s primary impact has been on cow health and productivity rather than triggering widespread culling—an object lesson in the differential effect of disease on production parameters versus herd demographics.

The recovery trend in California and the stronger-than-expected performance elsewhere create a dichotomy of negative milk production in California and strong recovery in the rest of the country. This divergence has significant implications for regional milk pricing and product flows that FMMO reform advocates have yet to address adequately.

The Reshuffling of America’s Dairy Map

Beyond these major players, USDA’s state-level data revealed several other states posted dramatic production shifts that further illustrate the geographic redistribution of U.S. dairy capacity:

  • Kansas: +11.4% (emerging as another major growth center)
  • South Dakota: +9.2% (continuing its multi-year expansion trend)
  • Georgia: +7.2% (showing surprising strength in a traditionally shrinking region)
  • Washington: -4.5% (accelerating contraction in the Pacific Northwest)
  • Florida: -3.7% (continuing its long-term decline)
  • Wisconsin: +0.1% (essentially flat production from America’s traditional dairy heartland)

This pattern reveals a fundamental restructuring of U.S. dairy geography that’s happening regardless of whether industry leaders choose to acknowledge it. The traditional Upper Midwest and Pacific Northwest regions show minimal growth or outright contraction, while the Southern Plains and certain parts of the Southeast are experiencing explosive expansion.

Regional Production Shifts Reshaping the U.S. Dairy Landscape

StateApril 2025 Production (million lbs)YoY ChangeKey DriversFuture Implications
Texas1,511+10.6%+50,000 cows, +55 lbs/cowEmerging dominant production center requiring massive processing expansion
Idaho1,471+4.2%+28,000 cows, flat yieldGrowth is vulnerable to the emerging H5N1 situation
California3,480-1.4%+1,000 cows, -30 lbs/cowGradual recovery from H5N1 impact, primarily yield-driven
Wisconsin2,713+0.1%+7,000 cows, +15 lbs/cowThe traditional dairy heartland is showing minimal growth
Kansas382+11.4%+16,000 cows, +40 lbs/cowEmerging as a significant growth center in the Central Plains
South Dakota440+9.2%+16,000 cows, +30 lbs/cowSustained multi-year expansion continuing

This geographic shift has profound implications for processing capacity, transportation logistics, and regional price relationships that industry planners seem determined to ignore. The industry’s infrastructure was built around historical production centers, but milk is increasingly produced in regions lacking adequate processing capacity.

Who’s asking the tough questions about this mismatch? When milk production growth is concentrated in regions without proportional processing expansion, the result is inefficient transportation, pressure on class prices, and increased vulnerability to market disruptions. Is anyone planning for a dairy industry where Texas and Kansas collectively produce more milk than Wisconsin? Because that’s the trajectory we’re on, according to the multi-year trend in USDA production data.

H5N1: Managing Through Rather Than Solving

The emergence of H5N1 avian influenza in dairy herds created significant uncertainty for the industry over the past year. While still a concern, the April data suggests producers are developing effective management strategies to limit its impact on production, managing through rather than solving the underlying problem.

California, which was hit hardest by H5N1, is showing signs of recovery with the production decline rate moderating from -2.7% in March to -1.4% in April. This improvement, coupled with the slight increase in California’s cow numbers, indicates farmers are adapting to manage through the challenge rather than reducing herd size.

Analysts note that “most H5N1 cases in dairy cattle are being reported as subclinical, and many affected producers have not reported a decline in milk production on the farm.” But let’s be clear: ‘subclinical’ doesn’t mean ‘inconsequential.’ Subclinical infections can still compromise long-term health, reproduction, and lifetime productivity. The industry’s apparent satisfaction with “managing through” rather than solving the H5N1 challenge reflects a troubling pattern of addressing symptoms rather than root causes.

Are we witnessing another example of the dairy industry adapting to a new normal rather than solving a fundamental problem? Just as we’ve collectively accepted declining reproductive performance, shortened productive life, and escalating transition cow challenges as “normal,” the industry appears to be normalizing endemic H5N1 as just another management variable rather than a solvable problem.

Market Implications: Reality Check Coming

The April production report triggered immediate bearish reactions in dairy markets. Class III milk and cheese prices dropped approximately 20 cents soon after release. Market volatility was evident, as “at one point Class III was limit up (+75 cents) after the spot session” before settling lower.

What makes this production boom particularly significant is that it’s being driven by multiple simultaneous factors: expanding herd size, improving yields, and rising component levels. This multi-pronged expansion creates sustained upward pressure on supply that could continue through mid-2025, potentially crushing producer margins if demand doesn’t keep pace.

Analysts project that “component-adjusted growth could remain above 2% through June” if current trends persist. This suggests the supply pressure in the market could intensify in the coming months.

The embedded momentum in the system—102,000 additional cows added in just 10 months, according to USDA—creates production inertia that will continue even if expansion decisions slow. These newly added cows will continue contributing to the milk supply for multiple lactation cycles, maintaining elevated production levels even if farmers pause further expansion.

Is the industry headed for another self-inflicted oversupply crisis? When milk production substantially outpaces domestic consumption growth and exports fail to absorb the difference, the result is predictable: inventory buildups, price pressure, and eventual margin compression that forces painful contractions. Have we learned nothing from the cyclical boom-bust patterns of the past two decades?

Your Strategic Response: Five Critical Adjustments

How should dairy farmers respond to this rapidly changing production landscape? Here are key considerations for producers looking to maintain profitability in this environment:

1. Make Components Your Production North Star

With component-adjusted production growing at double the rate of fluid volume (3.0% vs 1.5%), the economic return on component improvement has never been clearer. Stop fixating on tank volume and start obsessing over component yield. Evaluate your feeding program, genetic selection, and management practices focusing on fat and protein optimization.

DHIA records can be invaluable for identifying your highest component producers for breeding decisions. Consider strategic culling based not just on volume but on component production efficiency. A 65-pound cow producing 4.5% butterfat and 3.6% protein might be more profitable than an 85-pound cow with 3.5% fat and 3.0% protein, especially in component-based payment systems.

When did you last sort your herd list by fat and protein pounds rather than milk volume? If you’re still selecting primarily for milk volume in your breeding program, you’re fighting yesterday’s economic battle while your competitors focus on today’s profit drivers.

2. Understand Your Regional Vulnerabilities

The dramatic regional disparities in the April data highlight how local conditions increasingly determine dairy success. Texas producers face very different challenges and opportunities from those in Wisconsin or California.

Have you honestly assessed whether your region is a long-term winner or loser in this geographic redistribution? If you’re in a contracting region, what competitive advantages can you leverage to overcome the structural headwinds? If you’re in an expansion area, are you prepared for the inevitable infrastructure constraints and environmental scrutiny that follow rapid growth?

Areas to critically evaluate include:

  • Local processing capacity trends and expansion plans
  • Regional feed cost and availability projections
  • Water access guarantees and regulatory trajectory
  • Labor market stability and cost escalation
  • Land base constraints and nutrient management limits

These factors are increasingly divergent across regions and will determine which areas can sustainably support continued growth. Many producers are making long-term capital investments based on outdated assumptions about regional competitiveness that the April USDA data directly contradicts.

3. Prepare for Price Pressure Now, Not Later

The sustained production expansion, particularly on a component-adjusted basis, creates the potential for inventory buildups and price pressure if demand doesn’t keep pace. Strategic risk management isn’t optional in this environment—it’s essential for survival.

Consider:

  • Forward contracting opportunities through your co-op or private buyers
  • Options strategies to protect downside risk
  • Building financial reserves while margins remain positive
  • Stress-testing your operation against potential Class III and component value scenarios

Are you budgeting based on the current milk price or the cost when your newest heifer group enters the milking string? The Federal Order system’s classified pricing means different producers will experience this market pressure differently. Understanding how your milk is utilized and priced becomes increasingly critical in this environment of growing supply.

4. Rethink Your Culling Strategy

The trend of slowed culling rates suggests that many producers retain older cows longer than usual due to favorable margins. While this maximizes short-term production, it could create vulnerability if margins tighten.

Are you keeping unprofitable cows in your herd because they’re still producing milk? Evaluate your culling decisions based on:

  • Individual cow profitability accounting for component production
  • Reproductive status and projected productive life
  • Current beef market opportunities (cull cow prices remain historically strong)
  • Replacement availability and costs

A clear culling strategy—rather than simply retaining all cows—will provide flexibility if market conditions change rapidly. This is the dairy equivalent of a crop farmer’s harvest strategy—knowing when to take profits rather than hoping for ever-higher yields.

5. Plan for H5N1 as Endemic, Not Temporary

While H5N1’s impact appears moderate, its continued presence creates ongoing risk. The experience in California shows how quickly production can be affected when disease challenges emerge.

Hoping H5N1 will simply disappear is not a strategy. Instead, develop comprehensive management protocols:

  • Robust biosecurity measures beyond basic visitor logs
  • Early detection systems and regular surveillance testing
  • Staff training on disease identification and management
  • Contingency plans for potential outbreaks, including segregation strategies

Have you calculated the economic impact of a 2% drop in herd productivity from subclinical H5N1 infection? For most operations, this “invisible” loss would significantly erode profitability. Yet, few have quantified this risk or developed specific mitigation strategies, despite the numerous cases documented by the USDA and reported in agricultural publications like The Bullvine.

The Bottom Line: Adapt or Be Left Behind

April’s milk production data from the USDA reveals an industry fundamentally transforming itself through geographic redistribution, component enhancement, and overall expansion. The 1.5% increase in raw volume—amplified to a 3.0% boost in component-adjusted terms—signals strengthening supply pressure that will challenge milk prices in the coming months.

The regional divergence in production performance—from Texas’s 10.6% surge to California’s ongoing struggles—highlights how local conditions increasingly determine dairy success. Producers must recognize that geography, processing capacity, and biological resilience now play outsized roles in determining competitive position.

The U.S. dairy landscape is evolving rapidly, with the dramatic growth in Texas and other Plains states shifting the center of gravity for American milk production. Traditional dairy regions like Wisconsin and the Pacific Northwest see their relative influence diminish as the Southern Plains emerges as the new growth engine.

For dairy farmers, now is the time to honestly reassess your strategic position in this changing environment:

  • Are you optimizing for components or still chasing volume?
  • Does your region have the infrastructure to support profitable dairy production in the long term?
  • Are you prepared for the price pressure inevitably following this supply expansion?
  • Have you developed a reproductive program to maintain herd size without retaining unprofitable cows?
  • Is your operation structured to withstand the biological challenges that appear increasingly endemic?

The winners in this new environment won’t necessarily be the largest producers, but rather those who best align their operations with the emerging realities of America’s restructured dairy map. The geographic revolution beneath the surface of these production numbers will reshape competitive dynamics for years to come.

Take a hard look at where your operation fits in this changing landscape. Are you positioned in a growth region with the right cows producing the right components for your market? Or are you holding onto outdated production models in regions facing structural decline?

The April production report isn’t just another data point—it’s a roadmap to the industry’s future. Those who read it correctly and adjust accordingly will thrive. Those who dismiss it as just another monthly fluctuation may wonder why their business model no longer works in an industry that’s moved on without them.

What specific change will you implement this month to align your operation with these emerging realities? Your answer to this question may determine whether you’re leading this transformation or being left behind by it.

Learn more:

Join the Revolution!

Join over 30,000 successful dairy professionals who rely on Bullvine Weekly for their competitive edge. Delivered directly to your inbox each week, our exclusive industry insights help you make smarter decisions while saving precious hours every week. Never miss critical updates on milk production trends, breakthrough technologies, and profit-boosting strategies that top producers are already implementing. Subscribe now to transform your dairy operation’s efficiency and profitability—your future success is just one click away.

NewsSubscribe
First
Last
Consent

The Butterfat Boom: Riding The Cream Tsunami That’s Reshaping Dairy Manufacturing

U.S. dairy’s butterfat boom creates a cream tsunami-butter thrives, ice cream falters. Can farmers ride the wave or drown in surplus?

EXECUTIVE SUMMARY: American dairy cows now produce record-breaking butterfat levels, flooding processors with cream. While butter production soars 5% (absorbing 25M+ lbs of fat), ice cream and cream cheese struggle with declining demand. Natural American cheese emerges as a bright spot, using 15M+ extra lbs of fat. Export markets become critical to avoid oversupply, but reliance on global demand raises volatility risks. Farmers must prioritize component-driven genetics and risk management to capitalize on this new reality.

KEY TAKEAWAYS:

  • Butterfat surge: 3.4% increase in Q1 2025 creates 82M lbs of extra fat-reshaping dairy economics.
  • Market divergence: Butter (+5%) and American cheese (+15M lbs fat) thrive; ice cream (-7.9%) and cream cheese (-6.3M lbs) falter.
  • Export dependency: 60% of butterfat relies on global markets-price stability hinges on overseas sales.
  • Farm strategy: Focus on component genetics, precision feeding, and futures/options to hedge volatility.
butterfat surge, dairy component pricing, U.S. milk production, cream market trends, dairy export strategy

America’s dairy farms are pumping more butterfat than ever, creating a cream tsunami forcing processors to adapt or drown. While butter churns work overtime, traditional products like ice cream are missing the boat entirely. Smart dairy operators aren’t just watching this transformation – they’re positioning themselves to capitalize on the new component-driven reality while their neighbors wonder what hit them.

The American dairy industry is experiencing a revolution that is fundamentally altering milk production’s economics. U.S. dairy producers increased total butterfat content by a staggering 82 million pounds in Q1 2025 alone – that’s 3.4% more than last year, with barely any increase in fluid volume. This component surge isn’t just a fascinating trend – it creates winners and losers across the dairy manufacturing landscape.

THE CREAM EFFECT: WHEN ABUNDANCE CREATES OPPORTUNITY

The first ripple of this butterfat tsunami hits the cream market. When your milk truck leaves the farm at 4.3% butterfat instead of 3.7%, that extra component must go somewhere – and right now, it’s flooding the cream market like spring runoff hitting a dam.

“Cream multiples have been historically weak through early 2025,” explains Betty Berning, analyst with the Daily Dairy Report. “Until recently, we saw multiples dipping below 1.00 in some regions – a clear sign that processors are swimming in cream”.

These weak cream multiples represent a threat and an opportunity, depending on which side of the farm gate you’re standing on. For farmers, continually depressed component values could eventually filter back to the milk check. For processors with the flexibility to pivot toward butterfat-heavy products, it’s like finding $100 bills scattered across the plant floor – if you’re quick enough to pick them up.

While multiples have recently started to firm with the onset of ice cream season, the situation remains one of abundance rather than scarcity. According to Hoard’s Dairyman, cream multiples are “near the record lows of March 2020, even as domestic butter consumption is growing”. The relative weakness in U.S. butterfat markets is starkly contrasted to the rest of the world, where Oceania and European butter markets sit comfortably north of $3.50 per pound.

The fundamental question every dairy operation should be asking: Are you positioned to thrive in an era of component abundance, or are you still chasing volume like it’s 1995?

PRODUCT DIVERGENCE: FOLLOW THE FAT

The fascinating aspect of this butterfat surge is how unevenly it’s being absorbed across dairy categories. Some products are soaking up cream like thirsty calves, while others are entirely turning away from the trough.

Butter: The Relief Valve

Butter manufacturers have emerged as the primary beneficiaries and absorbers of America’s butterfat dividend. Year-to-date through March 2025, butter production reached nearly 650 million pounds – a 5% jump compared to 2024 (adjusted for leap year).

Translate that into fat utilization and you’ll see why this matters: churns processed approximately 25 million pounds more milkfat in Q1 2025 than they did in Q1 2024. March production alone hit 229 million pounds, an 8.6% surge year-over-year.

“Butter plants are essentially functioning as the relief valve for the dairy system right now,” industry consultant Jake Morrison explains. “When there’s excess cream in the system, it finds its way to the churn as predictably as water flows downhill.”

This hasn’t been entirely without risk. Reports indicate that cream prices are relatively low, and butter manufacturers carry heavier inventories than normal. This strategic inventory building makes perfect sense in the short term – like filling the hay mow in June – but creates potential price risk if domestic consumption or exports don’t keep pace with increased output.

The good news? U.S. butter exports are soaring in response to price advantages. According to recent trade data, U.S. butter exports more than doubled in February 2025, and anhydrous milkfat (AMF) sales grew tenfold, with more than 3,000 metric tons volume increases compared to last year. For the first time in more than two years, the U.S. exported more butter than it imported.

Ice Cream’s Unexpected Chill

In a surprising twist, ice cream makers have reduced their butterfat utilization despite abundant cream supplies, like refusing free feed when your TMR mixer is half empty. Regular ice cream production plummeted 7.9% year-over-year in March, with low-fat production falling 8.9%.

This counterintuitive trend – declining fat use when cream is plentiful and affordable – points to more profound shifts in consumer preferences that raw material availability alone cannot overcome.

Over 60% of consumers now actively seek “healthier” dessert options, driving growth in plant-based alternatives and premium, portion-controlled products. The traditional dairy-based ice cream category isn’t disappearing, but it’s evolving toward artisanal offerings rather than mass-market products.

When an industry refuses available, affordable inputs, it’s telling you something profound about market direction. Are we witnessing the beginning of a permanent shift away from traditional dairy ice cream, or just a temporary consumer infatuation with alternatives that will eventually fade?

Cream Cheese Contraction

The cream cheese sector shows a similar pattern of declining fat utilization, like a cow refusing grain during peak lactation. First-quarter production of cream cheese and Neufchatel was down by 6.3 million pounds compared to Q1 2024, making an additional 2.2 million pounds of butterfat available on the market.

More recent market intelligence indicates demand from cream cheese producers had “seasonally picked up” by mid-April, suggesting the Q1 decline might be temporary rather than a long-term structural trend.

American Cheese: The Comeback Kid

Among these shifting currents, Natural American cheese varieties have emerged as a bright spot in butterfat utilization, like a high-component cow in a low-component herd.

“Cheese is the largest user of U.S. milkfat, and Natural American varieties, which have a higher-fat content than Mozzarella, appear to be making a comeback,” notes Berning. This resurgence has a real impact: stronger demand increased fat intake in Natural American cheese vats by 15 million pounds in Q1 2025.

Production data confirms this trend, with American-type cheese output totaling 500 million pounds in March 2025, a 4.6% increase from March 2024. This comeback is particularly notable against a backdrop where cheese inventory levels remain tight – American-style cheese stocks were reportedly down 8% at the start of 2025.

This cheese resurgence is welcome news for dairy producers, like discovering that your corn silage tested two percentage points higher in starch than expected. Cheese plants typically operate on stable throughput volumes, providing consistent demand for farm milk throughout the year.

MARKET TIGHTROPE: BALANCING THE BUTTERFAT BOOKS

With domestic production outpacing consumption growth for fat-heavy products, exports have become critically important, just as crucial as a reliable milk hauler during spring flush. “Cheese and butter prices will need to remain low enough to keep exports moving, or U.S. dairy stocks could start to pile up,” warns Berning.

This export dependence creates both opportunity and vulnerability. International demand for butter, cheese, and whey products heavily supports the current strength of dairy prices. However, this also makes the sector more susceptible to global economic shifts, trade disruptions, or currency fluctuations, like a dairy dependent on export hay during a shipping crisis.

The U.S. currently exports roughly 16-17% of its milk production as dairy products and ingredients, but there’s a striking imbalance in the component mix. According to Corey Geiger, lead dairy economist with CoBank, “On a full-fat basis, the U.S. exported just 5.2% of its milk production last year, while it exported 21.6% of its milk production on a skim solids basis”. This indicates the U.S. traditionally skims off its butterfat for the domestic market, keeping it a relatively small player in global butterfat trade.

However, this dynamic is changing rapidly. U.S. dairy exports hit two-year highs in early 2025, with butter and milkfat exports reaching a 26-month high of 15.74 million pounds in January, doubling year-over-year shipments. A significant price advantage drives this export surge – U.S. butter is trading at a substantial discount to global competitors.

The Class III/IV Divergence Worth Watching

A curious divergence exists between milk class futures that directly impacts butterfat utilization. While Class III milk (used primarily for cheese) and Class IV milk (used for butter and powder) have historically maintained relatively predictable price relationships, current market dynamics are creating unusual patterns.

Mike North, Principal of Risk Management, speaking at the 2025 Dairy Strong Conference, highlighted how cheese and butter markets respond differently to the current component surge. With substantial new cheese processing capacity coming online in 2025, there’s increased demand for milk volume in cheese plants. However, all that extra butterfat often generates surplus cream that flows to butter manufacturers.

“We don’t have enough animals to make all the milk to supply all the plants in the U.S. This is a good problem,” North explained. “So, we will likely see some inefficient plants close and some not run at 100% capacity. But with all this cheese potentially coming online, we have a real need for exports because we will create many additional products”.

This divergence suggests that future traders may be pricing in current market tightness or that specific demand factors are not fully captured in the smoothed annual averages from the USDA. Are market participants seeing something that government forecasters are missing? Or are they setting themselves up for disappointment when production increases seasonally later this year?

THE NEW DAIRY MATH: COMPONENT ECONOMICS IN ACTION

The component revolution offers dairy producers a significant opportunity through milk payment systems that reward butterfat and protein. To illustrate the financial impact, let’s compare two hypothetical 100-cow operations:

Farm A: Traditional Volume Focus

  • Production: 85 lbs/cow/day
  • Butterfat: 3.7%
  • Protein: 3.0%
  • Total component production: 3.145 lbs/cow/day
  • Component value: $23.59/cwt
  • Daily revenue: $2,005/day

Farm B: Component Focus

  • Production: 80 lbs/cow/day
  • Butterfat: 4.3%
  • Protein: 3.3%
  • Total component production: 3.44 lbs/cow/day
  • Component value: $26.95/cwt
  • Daily revenue: $2,156/day

Despite producing 5 pounds less milk per cow, Farm B generates $151 more daily revenue– over $55,000 annually – through superior component production. This component premium is like having seven extra cows in your herd without additional labor, housing, or manure management costs.

Have you calculated what a 0.3% increase in butterfat would mean for your operation’s bottom line? For most farms, it’s a six-figure opportunity hiding in plain sight.

STRATEGIC MOVES: POSITIONING YOUR DAIRY FOR THE COMPONENT ERA

The message from the market is clear: farms focusing on butterfat and protein components will capture premium returns. This reality reshapes breeding decisions, feeding strategies, and overall farm management nationwide.

1. Genetic Selection with Purpose

Target components aggressively with your breeding program

  • Select sires with high PTA Fat and PTA Protein values (>100 lbs)
  • Balance with health traits (particularly SCS) to maximize component harvest
  • Prioritize productive life and fertility to optimize lifetime component production

Remember that according to industry research, butterfat and protein rank among the most heritable traits for dairy cows (0.58 for fat percentage and 0.51 for protein percentage). Every replacement heifer represents an opportunity to elevate your herd’s component production potential.

The genetic shift is happening faster than many realize. According to data presented at the 101st USDA Agricultural Outlook Forum, first and second lactation cows on progressive dairies are now completing lactations averaging 5% butterfat, while older cows (fifth lactation and beyond) range from 3.5% to 4.4%. This generational leap demonstrates how rapidly genetics can transform your herd.

2. Feed for Components, Not Just Volume

Optimize your nutrition program for maximum component yield

  • Implement strategic use of rumen-protected fats
  • Maintain optimal rumen pH (>5.8) through proper forage-to-concentrate ratios
  • Ensure adequate physically effective fiber (peNDF) for proper cud chewing
  • Balance rations for optimal amino acid profiles, particularly lysine: methionine ratios

“The feed bunk is where genetic potential either becomes reality or gets squandered,” nutritionist Dr. Sarah Williams notes. “A properly balanced TMR can boost butterfat by 0.3-0.4 percentage points in many herds – that’s like finding an extra $75 per cow in annual revenue without adding a single animal.”

3. Harvest What You Grow

Maximize component recovery through optimal milking procedures

  • Implement consistent prep-lag times for complete milk letdown
  • Maintain proper vacuum levels and pulsation rates
  • Prevent over-milking that damages sphincter tissue
  • Develop comprehensive mastitis prevention protocols

Cutting corners on prep time is like running your combine too fast – what you leave behind costs more than the time you save.

4. Risk Management for the Component Market

Protect your component value with strategic approaches

  • Evaluate Dairy Revenue Protection (DRP) policies with component endorsements
  • Consider Class III and Class IV futures to hedge against price volatility
  • Adopt partial pricing strategies rather than all-or-nothing approaches
  • Monitor global markets closely, as exports increasingly drive domestic prices

Smart risk management is like crop insurance for your dairy – you hope you don’t need it but can’t afford to operate without it.

THE BOTTOM LINE: CAPTURING YOUR SHARE OF THE BUTTERFAT DIVIDEND

The component revolution in U.S. milk production represents both a challenge and an opportunity. Farms that optimize for butterfat and protein will capture premium returns, but the industry must develop sustainable markets for these additional solids.

Success in this environment requires forward-thinking strategies:

  1. Make component-driven genetics your foundation. Every breeding decision is a 5-year commitment to your herd’s production profile.
  2. Balance your nutrition program for component yield, not just milk volume. Work with your nutritionist to target specific component levels based on your milk market.
  3. Understand your milk market’s true component values. Different processors and cooperatives offer varying premiums and incentives.
  4. Implement risk management tailored to component markets. Traditional volume-based hedging may not adequately protect your revenue.
  5. Engage with your processor about product innovation. The component surge creates opportunities for new products that could benefit producers and processors.

The U.S. dairy industry’s historic component surge shows no signs of slowing. According to Federal Milk Marketing Order data, butterfat percentages climbed from 3.8% to 3.94% from March 2015 to March 2020, but that shift accelerated dramatically between March 2021 and March 2025 as butterfat moved from 4.01% to 4.33%. This is not a temporary blip – it’s the new reality of American milk production.

The thriving farms will recognize this fundamental shift and position themselves, accordingly, maximizing component production while actively developing sustainable markets for America’s butterfat dividend.

Are you still managing your dairy for volume while your neighbor’s cash in on components? Look hard at your breeding program, nutrition strategy, and milk market. The butterfat dividend is there for the taking – but only for those who adapt to this new reality.

Learn more:

Join the Revolution!

Join over 30,000 successful dairy professionals who rely on Bullvine Weekly for their competitive edge. Delivered directly to your inbox each week, our exclusive industry insights help you make smarter decisions while saving precious hours every week. Never miss critical updates on milk production trends, breakthrough technologies, and profit-boosting strategies that top producers are already implementing. Subscribe now to transform your dairy operation’s efficiency and profitability—your future success is just one click away.

NewsSubscribe
First
Last
Consent

Global Milk Shortage Could Reach 30 million Tons by 2030

30M ton milk shortage by 2030 threatens US dairy profits. Climate stress, global shifts demand urgent action. Can farmers adapt?

EXECUTIVE SUMMARY: The International Dairy Federation warns of a potential 30-million-ton global milk shortage by 2030, driven by population growth, climate-driven yield declines, and shifting production patterns. While traditional dairy powerhouses like the U.S. and EU face stagnation, emerging regions like India struggle to fill the gap. U.S. producers must adapt through protein-focused breeding, feed cost management, and specialty product diversification as milk prices rise. Climate stress compounds challenges, with heat reducing yields by 7% per 1°C. The crisis presents both risks and opportunities for U.S. dairy, leveraging innovation to counter global competition.

KEY TAKEAWAYS:

  • IDF vs. IFCN divide: 30M vs. 6M ton shortage forecasts highlight uncertainty in balancing global supply/demand.
  • Climate costs: Heat stress threatens 7% yield drops per 1°C, disproportionately impacting small farms.
  • US stagnation: 0.9% production growth lags India’s 5%, risking lost export market share.
  • Price surge: USDA forecasts $22.60/cwt milk prices in 2025, with further hikes likely.
  • Adapt now: Focus on component pricing, feed contracts, and A2/organic diversification to survive.

The global dairy industry faces a looming crisis as the International Dairy Federation (IDF) projects a potential milk shortage of 30 million tons by 2030. This alarming forecast, announced by Laurence Rycken, Director General of IDF (Belgium), during her presentation at the 2025 Dairy Olympics in Al Ain, UAE, signals a fundamental shift in the global dairy landscape that demands immediate attention from producers, processors, and policymakers alike.

Why Your Dairy Farm’s Future Hangs in the Balance: Population Boom vs. Shrinking Herds

The projected milk deficit stems from a perfect storm of converging factors. Global population growth, expected to reach 10 billion by 2050, combined with rising prosperity in developing nations, dramatically increases demand for dairy products. Meanwhile, production in traditional dairy powerhouses is stagnating or declining under mounting pressures. “We are facing not only a volume challenge but also the need to preserve nutritional value and ensure the sustainability of production,” Rycken emphasized during her presentation. “The solutions must be global in design, but local in execution.” This 30-million-ton shortage projection starkly contrasts the International Farm Comparison Network’s (IFCN) more modest forecast of a 6-million-ton deficit by 2030. This discrepancy highlights the uncertainty in long-term dairy forecasting and underscores the complexity of the challenges ahead.

Competing Shortage Projections (2030)

OrganizationProjected Global Milk Shortage (2030)Key Drivers Cited
International Dairy Federation (IDF)30 million tonsPopulation growth, declining production in developed regions
International Farm Comparison Network (IFCN)6 million tonsDeveloping regions’ deficit (14M tons) is partially offset by developed regions’ surplus (8M tons)

7% Less Milk Per Cow: Climate’s Crushing Impact on Your Dairy Profits

Climate change is emerging as a critical threat to dairy production worldwide. Research shows that for every 1°C rise in temperature, dairy cows experience a 7% drop in milk yield due to heat stress. This translates to billions of dollars in lost production annually. A University of Illinois study found that high temperatures and humidity already lead to a 1% annual decline in milk yield in the U.S. Midwest alone. Smaller farms disproportionately lack resources for cooling systems and other mitigation strategies. As global temperatures continue to rise, these losses could increase by 30% in the coming decades, further exacerbating the projected shortage.

The Winners and Losers: Which Dairy Regions Will Survive the Coming Shortage?

While the European Union and the United States experience production stagnation, countries including India, Pakistan, and nations across Africa and Latin America are showing growth potential. Traditional dairy exporters—the EU, New Zealand, and Australia—face mounting resource constraints and environmental pressures that limit their ability to increase output. “While the EU debates nitrogen caps, New Zealand farmers are culling herds. Your takeaway? Sustainability policies without profitability are a recipe for collapse.” The changing landscape is already reshaping global dairy trade flows. New Zealand’s share in global exports is shrinking while China and other Asian countries are bolstering local production. For every 1kg of milk powder China produces domestically, it imports 2kg from struggling EU farms—a rapidly changing ratio as Asian production capacity grows.

Regional Production Outlook (2025)

Region2025 Production ForecastChange from Previous YearKey Factors
United States227.2 billion pounds+1.7 billion poundsNew cheese processing capacity, herd expansion despite HPAI challenges
European Union149.4 million metric tons-0.2 million metric tonsDeclining cow numbers, environmental regulations
ArgentinaIncrease of 1.1 billion pounds+1.5%Improved producer economics, better weather conditions
New ZealandModest increaseNot specifiedHerd expansion, improved feed management
IndiaContinued growth+5% (2023 figure)Recovery after disease impact

$22.60 Per CWT: The Economic Reality of Dairy’s New Scarcity

Current USDA forecasts put the all-milk price at $22.60 per cwt for 2025, reflecting the tightening supply situation. However, if the IDF’s shortage projections materialize, prices could climb significantly higher, creating profitability challenges for processors and affordability issues for consumers. India’s 5% production growth vs. the U.S.’s 0.9% stagnation isn’t just a gap—it’s a chasm. This divergence highlights the shifting center of gravity in global dairy production and suggests emerging markets may be key to addressing the looming shortage.

Survive and Thrive: 3 Critical Strategies Every U.S. Dairy Producer Needs Now

Adaptation is not optional for dairy farmers facing this changing landscape—it’s essential. Three critical strategies emerge for producers looking to thrive in this new environment:

  1. Breed for protein, not just volume – With component pricing becoming increasingly important, genetics focused on protein and fat content rather than fluid volume will maximize returns.
  2. Lock in feed contracts now – With 2025 prices projected to spike 12% amid global grain market volatility, securing long-term feed supplies at current prices provides crucial cost stability.
  3. Diversify into specialty products – A2 milk, grass-fed, and organic dairy products command premium prices and offer some insulation from commodity market volatility.

Can India’s Dairy Surge Save the World? (Spoiler: Not Without These 3 Fixes)

India shows significant potential to bridge the growing supply-demand gap in the global dairy sector. IDF President Piercristiano Brazzale states that India’s dairy industry is positioned to play an increasingly important role in meeting global demand. However, realizing this potential requires addressing three critical challenges:

  1. Infrastructure investment – Cold chain development and processing capacity must expand dramatically
  2. Quality standards harmonization – Export growth depends on meeting international standards
  3. Climate adaptation strategies – India’s producers face some of the most severe heat stress challenges globally. “The global dairy trade is reshuffling faster than a Vegas blackjack table. Bet on Asia’s production—or fold.”

Global Milk Production Growth by Region (2017-2030)

RegionProjected Growth (2017-2030)
South Asia (India & Pakistan)+64%
Africa+33%
Near & Middle East+37%
East & Southeast Asia+22%
Latin America+24%
North America+14%
Western Europe+6%
Eastern Europe & CIS+32%
Oceania+22%
Global Average+35%

Adapt or Perish: Why Dairy’s Golden Era Is Over

The IDF’s warning isn’t a forecast—it’s a wake-up call. Forget “milk does a body good.” By 2030, it might just harm the bank account. With global shortages looming, dairy’s golden era is over. The question isn’t if you’ll adapt—it’s how bloody the transition will be. As dairy producers worldwide navigate these challenges, the industry faces a critical adaptation period. Success will require balancing increased production with sustainability concerns while ensuring nutritional quality remains paramount—a complex but essential task for securing the future of global dairy. For U.S. producers specifically, this global shortage presents both challenges and opportunities. While competition for export markets will intensify, domestic production advantages—including technological innovation, established infrastructure, and the U.S. Dairy Net Zero Initiative—position forward-thinking American dairy farmers to capitalize on higher prices while addressing sustainability demands.

Learn more:

Join the Revolution!

Join over 30,000 successful dairy professionals who rely on Bullvine Daily for their competitive edge. Delivered directly to your inbox each week, our exclusive industry insights help you make smarter decisions while saving precious hours every week. Never miss critical updates on milk production trends, breakthrough technologies, and profit-boosting strategies that top producers are already implementing. Subscribe now to transform your dairy operation’s efficiency and profitability—your future success is just one click away.

NewsSubscribe
First
Last
Consent

U.S. Milk Production Report—January 2025: Navigating Avian Flu Impacts and Market Dynamics

U.S. milk production increased by 0.1% in January 2025, with component-adjusted output jumping 2.2% amid higher fat/protein yields. California’s 5.7% decline underscores persistent avian flu pressures, while USDA herd revisions reveal unexpected dairy cow expansion and evolving market risks.

Summary:

U.S. milk production in January 2025 saw a marginal 0.1% year-over-year increase, with component-adjusted output rising 2.2% due to higher fat and protein yields, signaling improved herd efficiency. The USDA revised the upward October–November 2024 production and reported an unexpected 10,000-head dairy herd expansion, countering earlier contraction forecasts. California’s output fell 5.7% as H5N1 avian flu outbreaks disrupted supply chains, contrasting with a 1.4% growth in other states like Wisconsin and Texas. Federal pricing mechanisms stabilized farmgate milk prices at $21.75/cwt, though Class I utilization hit record lows (20%) amid plant-based competition. Retail dairy inflation surged 7.7%, driven by biosecurity costs and labor shortages, while H5N1’s spread to raw milk consumers underscored public health risks. Medium-term projections suggest cautious optimism, balancing feed cost relief against ongoing avian flu threats and climate-driven feed instability.

Key Takeaways:

  • U.S. milk production inched up 0.1% year-over-year in January 2025
  • Component-adjusted production jumped 2.2% due to higher fat and protein content
  • The USDA unexpectedly reported a 10,000-head increase in the national dairy herd
  • California’s output plummeted 5.7%, mainly due to ongoing avian flu (H5N1) impacts
  • The rest of the country saw steady growth at 1.4%, led by states like Wisconsin and Texas
  • Farmgate milk prices stabilized at $21.75/cwt under Federal Milk Marketing Orders
  • Class I (fluid milk) utilization hit a record low of 20%, pressured by plant-based alternatives
  • Retail dairy prices rose 7.7% year-over-year, outpacing overall food inflation
  • H5N1 outbreaks in dairy operations raised concerns about cross-species transmission
  • Raw milk consumption led to some human H5N1 cases, prompting FDA warnings
  • The medium-term outlook suggests cautious expansion, pending avian flu containment
  • Labor shortages and climate-driven feed instability remain key challenges for the sector
U.S. milk production, avian flu impact, dairy herd expansion, retail dairy inflation, federal pricing mechanisms

The U.S. milk production landscape in January 2025 reflects a delicate balance between modest growth and persistent challenges from avian influenza (H5N1). Nationwide milk production increased 0.1% year-over-year, with component-adjusted output rising 2.2% due to higher fat and protein content. However, regional disparities persist: California’s output fell 5.7% amid ongoing bird flu outbreaks, while the rest of the U.S. grew 1.4%. The USDA revised October–November 2024 production upward and reported a 10,000-head dairy herd expansion between December 2024 and January 2025, signaling cautious optimism for medium-term recovery. This report analyzes the interplay of avian flu disruptions, federal pricing mechanisms, and consumer market trends shaping the dairy sector.

National Milk Production Trends

Modest Growth Amid Component Adjustments

U.S. milk production in January 2025 increased by 0.1% compared to the previous year, aligning with pre-report forecasts. The growth was driven by higher fat (+1.8%) and protein (+2.4%) content, which boosted component-adjusted production by 2.2%. This aligns with long-term trends of genetic improvements in dairy herds and optimized feed efficiency. The USDA’s upward revisions to October–November 2024 milk output—by 0.3% and 0.5%, respectively—highlight improved data granularity and reduced volatility in herd health reporting.

Herd Dynamics and Expansion Pressures

Quarterly Herd Dynamics (2024-2025)

Table 1. National Dairy Herd Composition 

QuarterAvg. Milk Cows (1,000)Milk/Cow (lbs)Production (B lbs)
Q1 20249,3386,09856.94
Q4 20249,3605,93055.51
Q1 20259,3426,01256.16 (est.)

Contrary to earlier projections of herd contraction, the USDA estimated a 10,000-head increase in the national dairy herd between December 2024 and January 2025. This expansion reflects improved feed costs and more substantial cheese prices, which are incentivizing farmers to retain heifers. However, feed quality concerns persist: Drought-reduced alfalfa yields in the Midwest have forced reliance on less nutritious silage, potentially dampening future productivity gains.

Regional Disparities: California’s Avian Flu Challenge

State-Level Milk Output (January 2025 vs. 2024)

Table 2. Milk Production in Key States 

State2024 Cows (1,000)2025 Cows (1,000)2024 Milk/Cow (lbs)2025 Milk/Cow (lbs)% Change
California1,7251,6262,3102,178-5.7%
Wisconsin1,2681,2792,1052,121+1.4%
Texas6476622,0802,095+2.3%
New Mexico3423352,2502,210-1.8%

Production Declines and Recovery Delays

California’s milk production fell 5.7% year-over-year in January 2025, extending an 8% decline in December 2024. The state’s dairy sector remains disproportionately affected by H5N1 avian influenza, which has infected over 14 million birds in commercial poultry operations since December 2024. While the virus’s mortality rate in cattle remains low (2–5%), mandatory quarantines and milk dumping protocols have disrupted supply chains. For example, a San Francisco dairy farm reported a 30% drop in output after culling 1,200 cows exposed to infected poultry.

Biosecurity and Cross-Species Transmission Risks

The H5N1 strain’s jump to mammals—including 67 confirmed human cases in the U.S. as of January 2025—has intensified scrutiny of dairy farm practices. Genetic sequencing revealed mutations in the PB2 protein (E627K) that enhance viral replication in mammalian cells, raising concerns about potential human-to-human transmission. California’s dense dairy-poultry interface (e.g., shared water sources and feed trucks) has facilitated cross-species spread, with 38% of the state’s H5N1 cases linked to dairy operations.

Avian Flu’s Economic Impact on Dairy

Compensation Programs and Supply Chain Costs

The USDA’s indemnity program paid $1.46 billion to poultry and dairy producers in January 2025 for culling infected animals, up from $890 million in 2024. For dairy farmers, compensation covers 70% of a cow’s market value but excludes long-term losses from herd rebuilding. A typical 1,000-cow farm faces $2.1 million in lost revenue during a 6-month quarantine, compounded by rising insurance premiums (up 22% year-over-year).

Retail Price Inflation and Consumer Behavior

Egg prices surged to $5 per dozen in January 2025, a 150% increase from 2021, while whole milk reached $4.15 per gallon. Consumer demand remains inelastic (-0.2 price elasticity), with 80% of households prioritizing dairy purchases despite cost hikes. However, discount retailers like Aldi and Lidl have gained market share by offering private-label dairy at 15–20% below national brands, squeezing mid-tier producers.

Federal Milk Marketing Orders and Price Controls

Class I Fluid Milk Pricing Mechanisms

The Federal Milk Marketing Order (FMMO) system stabilized farmgate milk prices at $21.75/cwt in January 2025, a 4% increase from 2024. Class I (fluid milk) premiums reached $7/cwt in Florida but averaged $1.60/cwt in the Upper Midwest, reflecting regional disparities in bottling capacity and consumer demand. However, Class I utilization fell to 20% of total production—down from 65% in 1950—as plant-based alternatives captured 18% of the beverage market.

Cheese and Butter Stockpiles

Government cheese inventories hit 600 million kg in January 2025, a 12% year-over-year increase, as weak export demand and tariff wars with China (25% retaliatory duties) stifled trade[15]. The USDA’s Dairy Management Inc. has redirected 8% of surplus butter to fast-food partnerships, notably McDonald’s “ButterBurgers,” but stockpile storage costs now exceed $120 million annually.

Consumer Price Trends and Forecasts

Short-Term Volatility and Long-Term Pressures

Retail dairy prices rose 7.7% year-over-year in January 2025, outpacing overall food inflation (5.2%). Analysts project a 20.3% increase in egg prices and 8–10% milk price hikes through mid-2025, assuming H5N1 outbreaks persist at current rates. However, futures markets indicate moderation: CME Class III milk contracts for July 2025 trade at $18.25/cwt, suggesting traders anticipate production rebounds in H2 2025.

Labor Costs and Automation Adoption

Dairy farms face a 14% wage inflation rate for skilled labor (e.g., milking technicians), driven by H-2A visa shortages and competition from the construction sector. In response, 32% of large-scale operations have deployed robotic milking systems, which reduce labor costs by 40% but require upfront investments of $250,000–$500,000.

Public Health and Food Safety Concerns

Raw Milk and Viral Transmission Risks

The CDC confirmed 38 human H5N1 cases in California as of January 2025, including a San Francisco resident who consumed raw milk from an infected herd. Viral loads in raw milk reached 1.2×10⁶ RNA copies/mL, prompting the FDA to issue nationwide advisories against unpasteurized dairy. Despite this, raw milk sales rose 18% in Q4 2024, fueled by anti-vaccine rhetoric and RFK Jr.’s advocacy for “natural immunity.”

Pasteurization Efficacy and Regulatory Gaps

Studies confirm that standard HTST pasteurization (161°F for 15 seconds) reduces H5N1 infectivity by 99.99%, but 9% of small processors fail to meet thermal profiling standards. The FDA’s January 2025 recall of 240,000 gallons of milk from 12 underprocessed batches underscores persistent gaps in oversight.

The Bottom Line

The January 2025 milk production report underscores the U.S. dairy sector’s resilience amid unprecedented challenges. While component-adjusted output growth and herd expansion signal medium-term stability, avian flu remains a wildcard. Proactive measures—such as mRNA poultry vaccines (95% efficacy in trials) and dairy farm compartmentalization protocols—could mitigate future outbreaks. However, rising input costs, labor shortages, and climate-driven feed instability demand policy innovation, including FMMO reforms to address Class I utilization declines and carbon credit programs for methane-reducing feed additives. As H5N1 continues evolving, bridging the gap between agricultural viability and public health safeguards will define the industry’s trajectory through 2025 and beyond.

Learn more:

Join the Revolution!

Bullvine Daily is your essential e-zine for staying ahead in the dairy industry. With over 30,000 subscribers, we bring you the week’s top news, helping you manage tasks efficiently. Stay informed about milk production, tech adoption, and more, so you can concentrate on your dairy operations. 

NewsSubscribe
First
Last
Consent

December 2024 Dairy Product Production Report: Cheese Slump Meets Butter Boom

U.S. Milk Output Drops 0.5% as CA Herds Crash – TX/ID Surge. Butter Defies Odds (+1.1%), Cheese Slumps. NFDM Stocks Soar 27.7% – Can WPI Save 2025 Margins?

Summary:

The December 2024 Dairy Report outlines a mixed picture for the U.S. dairy industry, where environmental and economic factors shape regional differences in milk production. Due to drought, California’s output dropped heavily by 6.8%, but Texas and Idaho saw growth thanks to more cows and new technology. Butter production increased by 1.1% even with limited cream, while cheese saw a 6.1% drop, especially in cheddar. Nonfat dry milk stocks rose 27.7%, affecting exports to Mexico, but whey protein isolate demand grew by 18.1% for fitness markets. With lower feed costs and ongoing labor issues, the USDA expects a slight 0.8% milk production rebound in 2025. Farmers are encouraged to focus on local strategies and sustainability to adapt. Analyst Laura Hofer notes the changes are about rebalancing, not a uniform downturn.

Key Takeaways:

  • U.S. milk production declined by 0.5% in December 2024, with regional discrepancies due to climate and innovation.
  • California experienced a significant 6.8% decrease in milk output due to drought and rising feed costs.
  • Texas and Idaho showed growth in milk production, leveraging new technologies and improved milking systems.
  • Cheese production faced a slump, particularly in cheddar, while mozzarella remained steady thanks to sustained pizza demand.
  • Butter production bucked trends, increasing by 1.1%, reflecting consumers’ continued preference for staple products.
  • Feed costs are expected to ease, but global competition and climate impacts present ongoing challenges.
  • California’s efforts to reduce methane emissions highlight the environmental challenges facing dairy producers.
  • Dairy farmers are encouraged to adopt drought-resistant crops and explore product diversification to navigate market shifts.
U.S. milk production, dairy industry trends, California drought impact, butter production increase, whey protein demand

In December 2024, overall U.S. milk production declined, with California facing challenges while Texas and Idaho experienced growth. Butter manufacturers had a successful period, unlike cheese producers, who encountered difficulties. 

Quick Snapshot 

U.S. milk production decreased by 0.5% in December compared to 2023, totaling 18.7 billion pounds, a slight decrease. California’s output crashed 6.8% due to drought and expensive feed, but Texas (+7.5%) and Idaho (+48 million pounds) grew. Butter production surprised experts by rising 1.1% in December, even as cheese output dropped 6.1%. 

Regional Wins and Losses 

StateMilk ChangeKey Factors
California-6.8%Drought, high feed costs
Texas+7.5%More cows, new tech
Idaho+48M lbsEfficient milking systems
  • Despite losing 9,000 cows in December, the U.S. has 17,000 more cows than in 2023.
  • The decrease in milk per cow by 10-11 pounds annually has negatively affected drought-hit areas.

“Farmers need strategies that fit their location,” says dairy expert Laura Hofer from the University of Dairy Science. “Growth states have opportunities; others need help.”

StateDec 2024 MilkYoY ChangeKey DriverGrowth Potential
California3.2B lbs-6.8%Drought PenaltiesLow
Texas1.4B lbs+7.55%Robotic AdoptionHigh
Idaho1.5B lbs+3.2%Feed Efficiency ProgramsModerate

Cheese vs. Butter Production Trends 

Cheese vs. Butter 

  • Cheese production experienced a 6.1% decline monthly, with cheddar production decreasing by 24 million pounds. Mozzarella production remained stable, increasing by 2.3% annually due to high demand in the pizza industry.
  • Butter Boom: Output rose to 171 million pounds (+1.1%) as prices hit $2.58/lb. 

Product Performance Table 

ProductDec 2024 ProductionYoY ChangePrice TrendKey Market Factor
Butter171m lbs+1.1%↗️ $2.58/lbRetail demand surge
Cheddar320m lbs-8.1%↘️ $1.72/lbRestaurant sales slump
Whey Protein48m lbs+18.1%↗️ $4.20/lbFitness sector growth

Source: USDA Dairy Products Report 

Challenges in Milk Powder and Protein Production

  • Milk Powder: Nonfat dry milk (NFDM) stocks jumped 27.7% despite lower production, hurting exports to Mexico.
  • Whey Split: Dry whey dropped 4.9%, but protein-rich whey isolate (WPI) surged 18.1% for fitness products.

“Butter’s comeback shows shoppers want basics,” says USDA economist Sarah Novak.

2025 Forecast

InputDec 2024 Price2025 ForecastChangeImpact on 1,000-cow herd
Corn$3.99/bu$3.75/bu-6%$18,500 savings
Soymeal$330/ton$310/ton-6.1%$9,200 savings
Diesel$3.45/gal$3.70/gal+7.2%$6,800 added cost

Source: USDA ERS Feed Outlook 

  1. Feed Costs Drop: Corn prices at $3.99/bushel may ease pressure on farmers.
  2. Export Battles: Cheese exports hit records, but Europe’s cheaper whey steals buyers.
  3. California’s grants to reduce methane emissions by 40% by 2030 are pivotal in addressing climate change through sustainable practices.

USDA Predicts: Milk production will grow 0.8% in 2025, but feed and weather risks remain. 

What Farmers Can Do 

  • Growth States (TX, ID): Invest in tech-like robots and better cow genetics.
  • Drought Zones (CA): Switch to drought-resistant crops and seek state aid.
  • Product Shifts: Make more butter and protein powders; explore organic markets.

“California’s methane reduction and sustainable farming programs are a global model,” says UC Davis scientist Frank Mitloehner. “Losing them could hurt farms and the planet.”

Bottom Line 

The year 2025 will be a pivotal test of how effectively the dairy sector can adapt to imminent climate risks and dynamic market shifts. Can farmers balance sustainability with profits? 

Learn more:

Join the Revolution!

Bullvine Daily is your essential e-zine for staying ahead in the dairy industry. With over 30,000 subscribers, we bring you the week’s top news, helping you manage tasks efficiently. Stay informed about milk production, tech adoption, and more, so you can concentrate on your dairy operations. 

NewsSubscribe
First
Last
Consent

Dairy Industry Faces Record Setbacks: Stable Margins Amid California’s Milk Production Plunge

Discover how bird flu in California affects dairy margins. Can stable prices balance out production drops? Explore challenges and strategies for farmers.

dairy margins, milk prices, feed costs, California bird flu outbreak, milk production drop, U.S. milk production, December dairy market, dairy industry trends, factors affecting dairy, dynamic dairy market

Ah, December—it always feels like a time of surprises. Even in the dairy world, just when you think you’ve got everything figured out, bam! Here comes the plot twist. For those deeply entrenched in the dairy industry, this December was one such month with its unique challenges and revelations. Yet, the resilience and adaptability of our industry professionals continue to amaze us, enabling them to navigate these twists with confidence and capability. 

Let’s examine the numbers over the past six months more closely. Understanding these trends is essential, as they provide insight into market conditions. 

MonthDairy MarginYear Over Year Change
July$11.50+2.5%
August$11.75+3.0%
September$11.60-1.5%
October$11.80+0.8%
November$11.90+1.2%
December$12.00+2.0%

These numbers underscore the challenges of navigating through an ever-changing market landscape.

Grasping the Dairy See-Saw: Supply, Demand, and Dairy Margins 

Understanding the delicate dance of supply and demand is crucial in the dairy industry. The industry involves more than cows producing milk or farmers waking up at dawn. It is an ever-evolving market ecosystem influenced by many factors, from weather patterns to consumer preferences and, importantly, the intricate balance of supply and demand. 

Let’s start with the basics of supply and demand. Milk prices? They’ve nudged up, which initially might sound like good news, right? But hold your horses because feed costs climbed in tandem, nullifying the potential gains from those higher milk prices. It’s a classic case of one step forward, two steps back in dairy margins. Talk about a balancing act! For many, this prompts the question: how do you strategically plan when the see-saw of costs and prices keeps swinging? Despite these challenges, there’s always room for strategic planning and optimism in the face of market volatility. For instance, dairy farmers in the Midwest implemented innovative cost-saving measures to counteract the impact of fluctuating milk prices. 

The Unexpected Heavyweight: California Facing a Dairy Dilemma 

StateMilk Production (November 2024, billion pounds)Year-Over-Year Change (%)
California3.0-9.2
Wisconsin2.51.5
Idaho1.32.0
New York1.2-0.5
Pennsylvania0.9-1.0

Now,  talk about that unexpected (and unfortunate) heavyweight—California. This pivotal state in the dairy sector has been grappling with an unexpected adversary—a severe bird flu outbreak. This isn’t just a minor glitch; this outbreak has slashed milk production by a staggering 9.2% year-over-year. Let’s pause here and think—this is the most significant annual decrease ever noted in the state’s milk production history. It’s like watching an Olympic record being broken but on a much grimmer note. 

Why does this matter so much to Californians and all involved in the dairy ecosystem? California is a powerhouse in milk production, and this considerable drop has rippling effects far beyond its borders, influencing dairy prices nationwide and even affecting international trade dynamics. Nationally, for instance, U.S. milk production chalked up to 17.875 billion pounds in November, reflecting a 1% decline compared to the previous year. Yes, that number is correct, and it’s a figure that encapsulates the complex dynamics at play. While some regions were basking in growth, the weight of California’s losses tipped the scales in the opposite direction. Think about it—had circumstances been different, there was chatter of a 0.2% increase on the horizon. Who would have predicted this downturn instead? This significant decrease in milk production in California affects the national supply. It has implications for the global dairy market, potentially leading to increased prices and changes in trade dynamics. 

The Intricate Dance of Data and Context in Dairy Management 

Still, numbers can paint only part of the picture without the context that makes them meaningful. For instance, the USDA was a little surprised by October’s figures. They revised their initial estimates, adding 35 million pounds to the national tally. But how did that happen?  There was an unexpected surge in cow numbers, with dairy farmers adding to their herds and squeezing out higher production per cow. By November, the milking cows numbered 9.365 million—5,000 less than in October but still a decent step up from last year by 20,000. It’s a game of strategic expansions and contractions, where dairy farmers carefully adjust herd sizes based on market conditions, highlighting the dynamic nature of cattle management. Isn’t it fascinating how these small shifts can make a massive difference overall? 

Exploring Dairy Treasures Beyond Milk: California’s Impact on Butter 

Let’s take a closer look at California’s impact on butter and powder production. California isn’t just any player in the dairy game; it’s the nation’s heavyweight champion, the undisputed leader in milk production. When a state of such magnitude faces a production hiccup — like the 9.2% year-over-year slump we’re seeing — it’s only natural that the effects will ripple far and wide. But how exactly does this slowdown shadow butter and powder supplies? 

It’s worth noting that in California, a substantial volume of the milk produced is directed towards creating Class 4 products — our butter and dry milk powder. So, when less milk flows through the pipelines, there’s automatically a squeeze on how much of these products can be churned out (pun intended). Butter stocks might seem stable, with a mere 0.4% increase over last year, but remember, this subtle rise is termed the smallest in the entire yearly tally for 2024. That’s no minor detail. 

It all boils down to supply and demand. While demand remains relatively steady — because, let’s face it, who doesn’t love a good pat of butter on their toast? — a drop in production can lead to tighter supply conditions. This could increase prices, making it more expensive for consumers and businesses relying on these dairy staples. Moreover, as one of the staunch suppliers, California’s reduced output means a potential shift in the supply chain dynamics, forcing other states or even countries to step up and fill the gap. These adjustments can lead to heightened volatility within the market, affecting overall margins and how the industry strategizes for future fluctuations. 

So, next time you butter your bread or indulge in a creamy latte, consider the broader narrative behind these seemingly small changes. They remind us of the interconnectedness and delicate balance that define the dairy industry.

For All the Cheese Enthusiasts: A Closer Look at the Numbers 

Now, for all the cheese enthusiasts, here’s a nugget for you. Total cheese inventories at the end of November stood at 1.335 billion pounds. That’s a decline of 1% month-over-month from October and a more pronounced 7.2% dip year-over-year. Quite the shift, wouldn’t you say? It suggests that cheese production, too, is feeling the pinch in this tightening market. 

The Whirlwind in Commodities: Brace for Unexpected Twists 

And what about the commodities market? It indeed wasn’t sitting idle. Corn and soybean meal markets showcased some exhilarating rallies, akin to a thrilling rollercoaster ride driven by fund shorts scrambling to cover positions alongside pivotal technical breakouts. Soybean meal notably spiked 11.6% from its recent low—a surge that caught many off-guard. Like skilled sailors navigating turbulent seas, dairy professionals must demonstrate nimbleness and adaptability to weather the storm. Navigating the dairy market is akin to conducting a symphony, where each strategic decision plays a crucial note in the harmony of profit margins, showcasing the intricacies of daily business operations. Dairy professionals can consider strategies such as forward contracting, risk management tools, and diversifying feed sources to navigate these market fluctuations. 

The Bottom Line

So where does that leave us? Maybe you’re wondering how these shifts will shape your operations’ future. Are there strategies you’re contemplating to shield your business from the unpredictable ebbs and flows? Or perhaps you’re thinking of innovative ways to harness the shifting tides to your benefit? As always, there’s much to consider in the ever-evolving landscape of dairy farming. The dairy industry faces challenges ranging from navigating supply and demand dynamics to addressing unexpected outbreaks and managing market volatility. However, with strategic planning, adaptability, and a keen understanding of the market, dairy professionals can overcome these hurdles and even find growth opportunities.

Key Takeaways:

  • Dairy margins remained relatively stable throughout December, with milk prices rising alongside feed costs.
  • California’s bird flu outbreaks led to a historic decrease in milk production, with a 9.2% decline from the previous year.
  • Overall U.S. milk production in November came in at 17.875 billion pounds, representing a 1% decrease compared to the previous year.
  • The declining milk production in California significantly impacted national production statistics despite gains elsewhere.
  • USDA slightly revised October milk production, adjusting for increased cow numbers and productivity.
  • Butter stocks saw considerable tightening in November, reflecting California’s production challenges, although stocks increased marginally year-over-year.
  • Cheese inventories decreased by 1% from October and 7.2% compared to the previous year, highlighting a more significant reduction.
  • Commodity markets witnessed sharp rallies, driven by fund activities, impacting corn and soybean meal prices.
  • Producers continue to navigate the markets with strategic, flexible approaches to safeguard margins in light of consistent market fluctuations.

Summary:

In December, dairy margins stayed stable because higher milk prices were balanced with rising feed costs. However, California’s bird flu outbreak led to a massive 9.2% drop in milk production, the largest recorded. This event influenced November’s overall U.S. milk production, which was 17.875 billion pounds, down 1% from last year. These numbers demonstrate how important it is to stay informed about all the factors in play, from diseases to changes in production, in the dynamic dairy market.

Learn more:

Join the Revolution!

Bullvine Daily is your essential e-zine for staying ahead in the dairy industry. With over 30,000 subscribers, we bring you the week’s top news, helping you manage tasks efficiently. Stay informed about milk production, tech adoption, and more, so you can concentrate on your dairy operations. 

NewsSubscribe
First
Last
Consent

USDA Predicts US Leads Global Milk Production Growth Despite European Challenges in 2025

USDA’s 2025 milk forecast: Can the US drive global growth despite Europe’s hurdles? Uncover key insights for dairy farmers.

Summary:

As 2024 wraps up, the dairy industry’s gaze shifts to the year ahead, anticipating modest global milk production growth. The USDA’s latest report projects a 0.4% increase among the top-five milk exporting countries, led by a 0.7% rise in the United States. This trend reflects economic and environmental changes affecting milk markets worldwide—from North America to Oceania, with Europe struggling due to regulatory and cost challenges, while Argentina shows optimism. Advanced robotic milking systems and selective breeding drive the predicted growth, influencing global dairy supply chains, farm profits, and international trade. Yet, high expenses and stringent environmental regulations in Europe could impede progress. Oceania’s milk production is set to rise by 1.1%, with long-term hurdles like climate change, whereas New Zealand’s sees a 0.9% increase. Argentina’s sector shows resilience with a forecasted 4.7% growth amid Europe’s struggles with costs and investment. This collective output is vital, aligning with rising worldwide demand from population growth and improved economic conditions.

Key Takeaways:

  • The global milk production is set to grow by 0.4% in 2025, with the U.S. leading the way.
  • Environmental regulations and high costs hinder growth in the European dairy industry.
  • Oceania shows promising growth, although structural challenges may impact long-term potential.
  • Argentina’s improved macroeconomic conditions boost its dairy sector’s recovery.
  • Growing world population and better economic conditions will drive global dairy demand.
  • Global trade dynamics and pricing might shift due to regional production disparities.
  • Stakeholders need to plan strategically for the evolving dairy market landscape 2025.
global milk production, robotic milking systems, dairy supply chains, U.S. milk production, environmental regulations, Oceania milk production, sustainable farming practices, dairy industry challenges, Argentina dairy sector growth, technological advancements in dairy

As the end of 2024 approaches, dairy farmers and industry leaders cautiously look forward to 2025. The United States Department of Agriculture (USDA) expects global milk production to grow by 0.4% among the top five milk-exporting countries. The United States is expected to lead this growth due to the implementation of advanced robotic milking systems, such as automated milking robots, and selective breeding practices focusing on genetic enhancements for higher milk yield. Implementing advanced robotic milking systems, such as automated milking robots and selective breeding practices, focusing on genetic enhancements for higher milk yield, is projected to increase milk production by 0.7%, further securing the United States’ position in the dairy market. In Europe, high costs and strict environmental regulations could hinder production progress. 

These forecasts indicate significant growth opportunities and challenges for dairy farmers beyond numbers. The expected rise in production could change global dairy supply chains, affecting everything from farm profits to international trade. The USDA’s forecast provides valuable insights by highlighting emerging market trends, identifying potential growth areas, and suggesting strategic development opportunities for dairy farmers in the coming year. As the global dairy market prepares for these changes, it’s vital for everyone involved to stay updated and ready for what’s ahead. The increase in U.S. milk production is expected to ripple effect on the global dairy market, potentially influencing prices and trade dynamics.

Region2024 Milk Production (Billion Pounds)2025 Projected Increase (%)2025 Projected Milk Production (Billion Pounds)
United States226.410.7%228
Australia20.61.1%20.82
New Zealand21.10.9%21.29
Europe150.5-0.2%150.2
Argentina11.74.7%12.25

Driving Factors of the 0.7% Rise in U.S. Milk Production for 2025: Opportunities and Concerns

The predicted 0.7% rise in U.S. milk production for 2025 is a testament to the potential for growth in the dairy industry. Improved profit margins from increased milk prices motivate farmers to boost their production. As a result, many farms are increasing the size of their herds, selecting high-yield breeds, and improving herd quality, significantly boosting production levels. 

Technological advancements and improved feeding methods are significantly improving milk quality. These improvements, such as enhanced nutritional value from fortified feed and decreased bacterial contamination due to strict hygiene practices, significantly improve dairy production processes. This improved quality allows farmers to produce a broader range of dairy products from the same quantity of milk, ultimately increasing overall output. 

While the dairy industry has made positive developments, it’s essential to acknowledge growth challenges. As big farms grow and invest in technology, smaller farms might find it hard to compete, possibly increasing inequality in the industry. Larger dairy farms have a more significant environmental impact, creating challenges like better managing waste and reducing greenhouse gas emissions. Relying on advanced technologies can also lead to higher energy use and more resources. These are essential issues to remember as the dairy sector grows and changes.

Oceania’s Positive Outlook 

In 2025, Australia’s milk production is predicted to rise by 1.1%, while New Zealand’s is expected to increase by 0.9%. This growth is mainly due to high milk prices and good weather, creating a hopeful future for farmers. 

But why are these numbers significant? High milk prices give dairy businesses the money they need to continue operating. This money allows them to invest in their farms, improve work practices, and use new technology. Good weather helps keep animals healthy and improves pasture quality, allowing cows to produce more milk. 

However, before moving forward, it is crucial to consider the long-term challenges ahead. One big issue is climate change. While 2025 might bring good weather, unpredictable changes could affect production in the future. The dairy industry in Oceania needs to be prepared for potential disruptions and consider strategies for adapting to a changing climate, such as investing in drought-resistant crops or implementing water conservation measures. 

Oceania also needs to balance growth with caring for the environment. Farmers feel pressure to adopt eco-friendly practices as the world becomes more focused on reducing environmental impact. This often requires a lot of money, which can be challenging for smaller farms. 

This constraint makes it difficult for dairy farmers in Oceania to expand their operations and meet increasing demands. Since dairy farming requires a lot of land, insufficient land can limit farmers’ growth. 

To overcome these challenges, Oceania must focus on implementing sustainable farming practices, investing in innovative technologies, and collaborating with environmental agencies to ensure long-term viability. The dairy industry must use new technologies and creative farming methods to ensure continued growth. One such technology is precision agriculture, which uses data-driven solutions like automated monitoring tools and precision irrigation systems to optimize resource utilization and reduce risks from unpredictable weather. These technologies could significantly boost productivity and cut environmental impact in the dairy industry. At the same time, following global market trends, such as the rising demand for plant-based alternatives, could create new revenue streams and broaden options. Embracing sustainability is crucial; methods like cutting greenhouse gas emissions and conserving water can protect the future of the Oceania dairy industry. By combining tradition with innovation, the sector can face challenges and thrive in a fast-changing global market.

European Dairy Industry at a Crossroads: Navigating Multifaceted Challenges

The European dairy industry is at a critical juncture. It is grappling with challenges such as high input costs, stringent environmental regulations, and inadequate investment, which pose significant threats to its prominent global milk production position. The USDA’s prediction of a 0.2% decrease in 2025 highlights these problems mainly due to high input costs, strict environmental rules, and a noticeable lack of investment. 

High input costs, such as rising feed, energy, labor, and fuel expenses, continue to burden dairy farmers in Europe, reducing profitability and operational constraints. For example, the feed cost has increased dramatically in Germany, squeezing profits and forcing many farmers to reconsider their production plans. Feed, energy, labor, and fuel have also become more expensive. This financial pressure has led some farmers to cut their herd sizes, directly affecting milk output

Strict environmental regulations are another major hurdle. The Netherlands is a clear example, where limits on nitrogen emissions have forced dairy farmers to make expensive changes. Adhering to these rules often requires substantial financial investments, whether through adopting costly new technologies or purchasing emission rights, which poses financial challenges for dairy farmers. This leaves the industry struggling to balance environmental responsibilities with financial stability

A general lack of investment in the industry exacerbates this situation. Italy, for instance, has received little financial support to update its dairy farms, partly due to economic uncertainties and changing milk prices. This stagnation acts as a roadblock to innovation, preventing potential improvements in productivity and competitiveness on the global stage

While northern European countries like Denmark have strict environmental policies, southern countries like Spain face more serious financial issues worsened by limited subsidies and support.  Tackling high input costs, following regulations, and encouraging investment will be crucial for Europe to hold its position in the global dairy market.

Argentina’s Dairy Sector: A Beacon of Resilience in Uncertain Times 

Amid global uncertainty, Argentina shines as a source of potential and resilience in the dairy industry, with forecasts showing a 4.7% growth in milk production for 2025. After a rough 2024, marked by economic troubles and harsh farming conditions, things are starting to look up for Argentine dairy farmers. 

The improved economic outlook in Argentina significantly contributes to restoring confidence and encouraging investment in the dairy sector. As inflation stabilizes and exchange rates balance, obtaining capital has become easier. This economic change reassures current investors and draws new ones who want to explore the growing potential of Argentina’s dairy farms. 

Take the example of Diego Alvarez, a third-generation dairy farmer with his family farm in Santa Fe. Diego and his family struggled with rising costs and unpredictable profits for years. However, with recent economic stability, Diego has noticed a positive shift. His farm has started investing in modern milking technologies, boosting efficiency and output. The optimism is apparent as workers, once worried about their jobs, now engage in lively talks about future expansions and innovations. 

This comeback isn’t just a win for Diego. It shows the significant change happening in rural Argentina, where dairy farms are getting back on their feet. Diego’s journey epitomizes a broader narrative within the Argentine dairy sector, serving as a testament to resilience and progress. In a time when news often focuses on economic stats and production numbers, the grit and flexibility of farmers like Diego push the story forward. His success, despite challenging times, using better investment options and a revived dairy market, connects deeply with the shared experience of many who make up this key industry. The grit and determination of these individuals are key to achieving success in the dairy industry. Dairy farmers worldwide face unpredictable weather, evolving market demands, and stringent environmental regulations. However, their firm resolve and innovative thinking often turn challenges into opportunities. Resilient farmers adjust by using new technology, adopting sustainable methods, and diversifying their operations to fit changing consumer tastes. Their perseverance not only sustains their livelihoods but also fosters the growth and resilience of the industry. These stories demonstrate the vital connection between human dedication and industry achievements, highlighting the human element alongside the economic aspects.

Global Dairy Demand: Navigating Through Population Growth and Economic Shifts 

Several changing factors influence the global demand for dairy products. First, the growing population plays a significant role. As the world’s population approaches 8 billion, the need for healthy foods like dairy increases. Also, better economic conditions in many places give people more money to spend and lead them to eat more animal-based products, including dairy. 

You may wonder about these trends: How will the international dairy trade evolve? The different growth rates in milk production worldwide could change trade patterns. For example, with their expected production increases, the U.S. and Oceania could fill gaps caused by reduced European production. But will these supply and demand changes balance out, or will significant disruptions exist? 

Pricing will also be essential to watch. Rising demand with various production levels might push dairy prices up. However, how might political issues, changing input costs, and climate change affect these prices? Finding the right balance between gaining market advantage and not pushing prices too high for some consumers can be tricky. 

How prepared is the industry to manage future fluctuations? Which strategies, like investing in sustainable practices or diversifying product offerings, could optimize these changes for growth and development in the global dairy industry? Thinking about these questions could help businesses navigate the uncertain future and drive innovative solutions that meet changing market needs. 

The industry must closely track these trends and adjust its practices to meet changing demands. 

The Bottom Line

The global dairy industry faces a pivotal year in 2025, with milk production expected to rise by 0.4% among the top five dairy exporters, potentially reshaping supply chains and influencing international trade dynamics. The United States leads with a 0.7% increase, driven by better profit margins and an expanded herd in the herd. Oceania is also on a growth path but must address long-term challenges. Nevertheless, Europe’s high costs and stringent environmental regulations decrease production, highlighting the imperative for strategic adjustments. Meanwhile, Argentina shows promise with a projected 4.7% increase, aided by a stronger economy. 

Dairy farmers must adjust to regional differences as they operate in a changing global market influenced by growing demand due to population growth and strong economies. Each region has distinct conditions affecting dairy operations, including favorable economic conditions in the U.S., environmental challenges in Oceania, and European financial constraints. These conditions directly impact profitability and sustainability. 

Regional milk production varies due to economic conditions, environmental considerations, and policy influences. The U.S. sees more demand for dairy and favorable economic conditions, promoting herd expansion despite rising costs. Oceania enjoys good weather and high prices but faces sustainability issues, requiring a balance between economic gain and environmental impact. Meanwhile, Europe’s dairy sector struggles with high costs, strict regulations, and limited investment, pushing for innovative, cost-effective solutions. With a more stable macroeconomic environment, Argentina shows resilience by achieving a significant 4.7% increase in production, showcasing the positive effect of economic conditions on the dairy sector’s growth. 

Dairy farmers should comprehend global dynamics, adopt innovation, and prioritize strategic planning to enhance their operations. Consider how these regional changes will impact your dairy operations as you progress. 

Learn more:

Join the Revolution!

Bullvine Daily is your essential e-zine for staying ahead in the dairy industry. With over 30,000 subscribers, we bring you the week’s top news, helping you manage tasks efficiently. Stay informed about milk production, tech adoption, and more, so you can concentrate on your dairy operations. 

NewsSubscribe
First
Last
Consent

U.S. Milk Production Rebounds: Surprising Growth Amid Challenges and Opportunities

What’s behind the surprising uptick in U.S. milk production? Let’s dive into the implications for dairy farmers and the industry’s future challenges and opportunities.

Summary:

U.S. milk production has shown an unexpected uptick after over a year of decline. The latest USDA report highlights this slight growth, with September production up by 0.1% compared to last year and August’s projections revised to a 0.4% increase. While these trends might lead to lower milk and dairy product prices, challenges remain with avian influenza affecting California and poor forage in Wisconsin. Yet, states like Idaho, Texas, and New York display strong growth. Navigating these changes, the dairy sector must adapt and strategize for stability. Are we seeing a temporary surge or a long-term trend? Your insights on this shift are invaluable.

Key Takeaways:

  • The U.S. milk production experienced an unexpected increase in August and September 2024, likely influencing lower milk and dairy product prices.
  • Despite challenges such as avian influenza affecting California, milk output remained consistent with year-ago levels in the state.
  • Idaho, Texas, and New York reported notable year-over-year increases in milk production, contrasting with Wisconsin’s slight decline.
  • The U.S. dairy herd saw slight fluctuations but remained significantly smaller than the previous year’s figures.
  • Production metrics for the 24 significant states showcased a modest rise in both milk production and output per cow in September 2024 compared to the prior year.
  • The July-September quarter demonstrated a slight overall growth in U.S. milk production, continuing a cautious upward trend.

Predictability is a rare commodity in a world where the recent, unexpected surge in U.S. milk output stands out. After a period of declining yields, this sudden upturn prompts us to question whether it’s a fleeting trend or a new era for the dairy industry. What does this unforeseen increase mean for dairy producers and the broader agricultural landscape? Is it a temporary blip, or does it signal a sustained shift towards higher production levels? As we delve into the details, consider how this revitalization in milk production could impact your company’s plans and financial performance.

A New Chapter in Dairy Dynamics: Is the Milk Production Surge a Game Changer or a Temporary Spike?

The recent surge in milk output, observed between August and September, marks a significant shift in the U.S. dairy sector. After a period of stagnation, this increase could potentially reshape market dynamics and long-term industrial strategy, signaling a move towards higher productivity.

This rise may initially put downward pressure on milk and dairy product prices. When supply meets or exceeds demand, prices often fall. This may benefit consumers, but dairy farmers may need to help maintain profit margins. The critical issue remains for stakeholders: Is this rise a blip or the start of a new trend?

Several variables might determine whether this alteration is transient or permanent. Technological innovations, such as improvements in cow genetics and farm management approaches, help increase production. External elements, such as climatic and regulatory settings, will also significantly impact.

Only months of diligent observation and analysis will allow stakeholders to determine whether this milk production surge is a one-time or long-term trend. Dairy farmers and industry experts must remain vigilant, adapt their methods, and make necessary adjustments to capitalize on these changes.

Regional Resurgence: How States Adapt and Thrive Amidst Dairy Challenges

California’s dairy industry, famed for its regular production, experienced unexpected hurdles when avian influenza spread. Despite this, the state’s output levels remained consistent, demonstrating the durability and strength of California’s dairy infrastructure in the face of environmental challenges. This resistance begs the question of how epidemic management strategies may protect other places from similar risks.

Wisconsin, known as America’s Dairyland, had a 0.5% decrease in milk output. Who is the culprit? Inadequate pasture quality is a harsh reminder of how dairy yields naturally depend on feed quality. This situation emphasizes the importance of pasture management in sustaining output levels, indicating an increasing need for precision agricultural technology to detect and alleviate such concerns.

Idaho’s milk production has risen by a surprising 1.8%. This upsurge might be attributed to favorable meteorological circumstances and advances in agricultural equipment and methods, suggesting that Idaho’s approach could serve as a model for other states seeking development.

Despite the tragic setback of a big fire, Texas saw a remarkable 4.9% increase. This increase demonstrates the state’s capacity to recover and expand. It underscores the importance of resilience planning and recovery frameworks in assuring continuity in the face of unexpected interruptions and reassuring the industry.

In New York, output increased by 1.2%, most likely owing to advances in cow genetics and farm management practices. These components highlight the advantages of investing in technology and research, implying the possibility of continued productivity improvements in the state.

Subtle Shifts in the Dairy Herd: Navigating Between Optimism and Economic Constraints

As recent events show, the dairy herd in the United States increased by 9,000 head in August, slightly approaching the production frontier. In contrast to a constant herd size in September, this increase illustrates producers’ cautious optimism. They await long-term favorable circumstances or policy reforms before making significant investments.

Despite these short-term gains, the picture over a slightly longer time frame shows a falling trend, with the herd size 38,000 heads lower than in September 2023. This decrease highlights the effect of current economic restraints, which force dairy businesses to downsize as part of cost-cutting measures. This continual herd shrinkage may limit future output capacity if cow productivity improves.

These dynamic fluctuations in herd size are anticipated to have an essential influence in setting market patterns. A smaller herd limits prospective yield growth, which may reduce supply unless matched by greater productivity per cow. A consistent herd size, without overextension, protects against a saturated market, which might drive down prices. The future trajectory heavily depends on external variables like regulatory changes, feed prices, and the ebb and flow of global dairy demand.

Market analysts and industry players must decide whether this stable herd size represents a new standard in the U.S. dairy business or a forerunner to future growth. As environmental, economic, and regulatory factors change, attentive attention to herd dynamics will be critical for anticipating and negotiating future adjustments in dairy production outputs.

Efficiency Over Expansion: The Blueprint for Sustainable Dairy Growth

Dissecting the fundamental variables determining milk production reveals a story of incremental progress paired with stability, notably in the September statistics. The average yield per cow was an impressive 1,966 pounds, reflecting a numeric rise and suggesting qualitative improvements in agricultural operations and cow management. What does this reveal about the sector’s progress toward sustainability and efficiency?

Although the overall number of milk cows decreased slightly from August to September 2024, remaining at 8.89 million, the effects are far-reaching. Focusing on improving production per animal rather than increasing herd numbers provides a possible blueprint for long-term success. It promotes a less-is-more strategy, prudently using natural resources and reducing surpluses that might disrupt market dynamics.

This operation indicates a transition to a more sustainable dairy farming framework. Focusing on animal health, breeding strategies, and feed optimization may improve efficiency. However, how equipped are stakeholders to implement these sustainable practices for long-term success?

These measurements serve as both a reminder of previous resilience and a road map for future possibilities. The dairy industry is on the verge of a transformational phase in which efficiency is more than just a slogan but a viable road ahead. Are we prepared to welcome it?

Strategic Equilibrium: Is the Dairy Industry Treading a New Path with Production and Herd Balance?

The minor increase in milk output to 56.0 billion pounds during the July-September quarter represents a subtle but substantial change in the United States dairy sector. Although not spectacular, this rise represents a significant shift in the relationship between herd size and total output. The average number of milk cows, 9.33 million, offers insight into the industry’s efforts to preserve balance. It’s a planned balance, showing that producers may be more concerned with utilizing current resources than randomly raising herd numbers.

This stability in herd numbers and incremental productivity increases per cow implies a cautious but positive outlook for maintaining output levels. The fact that herd numbers have not swollen out of proportion provides a buffer against future price decreases caused by oversupply. Furthermore, this balanced strategy may build the basis for resilience to the economic and environmental stresses the dairy business has traditionally faced.

As the sector navigates these minor alterations, the fundamental issue remains: Are these developments signs of a more stable future, or are they only temporary adjustments? The emphasis on balancing herd size with production efficiency might indicate a viable route ahead, implying a possible shift in the industry’s operational procedures and future development strategy.

Charting the Future: Is Your Dairy Business Ready for Technological and Environmental Paradigms?

The dairy sector constantly changes, and foresight is required to stay ahead. Technological developments are one crucial trend transforming the sector. Continuous innovation in genetics and herd management technology has the potential to improve production efficiency and cost management significantly. Consider the capacity to use data-driven insights to fine-tune every element of your operations—do you have the tools to profit from them?

Meanwhile, the impending climate change must be addressed. Its effects are unpredictable, influencing everything from feed quality to water availability. Consider techniques to strengthen your agriculture. Integrating heat-resistant feed alternatives, minimizing water consumption, and reducing carbon impact are all positive measures. Have you started implementing such strategies?

Furthermore, the need to adopt sustainable practices is higher than ever. Pursuing sustainability is more than simply an ideal; it is a must for future-proofing your company against environmental and regulatory challenges. As external variables continue to impact the market, how can you guarantee your company’s viability and competitiveness?

The Bottom Line

The dairy sector constantly changes, and foresight is required to stay ahead. Technological developments are one crucial trend transforming the sector. Continuous innovation in genetics and herd management technology has the potential to improve production efficiency and cost management significantly. Consider the capacity to use data-driven insights to fine-tune every element of your operations—do you have the tools to profit from them?

Meanwhile, the impending climate change must be addressed. Its effects are unpredictable, influencing everything from feed quality to water availability. Consider techniques to strengthen your agriculture. Integrating heat-resistant feed alternatives, minimizing water consumption, and reducing carbon impact are all positive measures. Have you started implementing such strategies?

Furthermore, the need to adopt sustainable practices is higher than ever. Pursuing sustainability is more than simply an ideal; it is a must for future-proofing your company against environmental and regulatory challenges. As external variables continue to impact the market, how can you guarantee your company’s viability and competitiveness?

Adapting to these more significant trends is more than simply survival; it is also about placing your business to prosper in a changing economy. You can negotiate these changes and embrace chances that arise if you remain knowledgeable and adaptable. How can you adapt and develop as the industry evolves under these diverse influences?

Learn more:

Join the Revolution!

Bullvine Daily is your essential e-zine for staying ahead in the dairy industry. With over 30,000 subscribers, we bring you the week’s top news, helping you manage tasks efficiently. Stay informed about milk production, tech adoption, and more, so you can concentrate on your dairy operations. 

NewsSubscribe
First
Last
Consent

Dairy Market Dynamics: Key Insights on Global Milk Production, Export Trends, and Price Movements

Get critical insights on milk production, exports, and prices. How will these affect your dairy business? Read our expert analysis now.

Summary:

The dairy industry is amid significant shifts and uncertainties. In August, New Zealand’s milk solids production increased by 10%, while U.S. headline milk production dipped slightly by 0.1% but saw a component-adjusted rise of 1.8%. On the downside, New Zealand’s exports and Chinese imports fell short of expectations, declining by 13% and 2.8%, respectively. The market’s behavior has been erratic: Whole Milk Powder (WMP) prices rose more than anticipated, yet prices for most other products have remained steady or dropped. U.S. butter stocks exceeded forecasts again, even as illnesses like bird flu and Bluetongue pose risks to production in various regions. Are we witnessing a market pause before a final bullish push, or have we passed the peak? The answer may vary by product and region.

Key Takeaways:

  • New Zealand’s milk solids production showed a robust increase of 10% in August.
  • U.S. milk production slightly decreased by 0.1%, although component adjustments indicated a 1.8% rise.
  • New Zealand’s exports fell by 13% in August, signifying lower-than-expected performance.
  • Chinese imports weakened, dropping by 2.8% in the same period.
  • GDT Pulse saw a notable increase in whole milk powder prices, contrary to the steady to lower trends for other products.
  • Concerns about unsold butter stocks continue, with U.S. butter stocks in August larger than anticipated.
  • The U.S. cheese market experienced turbulence, with buyers stepping back, leading to falling prices for blocks and barrels.
  • NFDM/SMP prices softened in both the U.S. and EU, signaling a bearish shift in market sentiment.
  • Seasonal and global factors such as bird flu in California and Bluetongue in Europe affect production and market stability.

Imagine sailing a ship through choppy waves; that’s how the dairy market feels. Milk output is increasing in specific locations while decreasing in others. Export patterns are altering, with unanticipated changes in essential markets such as China and New Zealand. Prices? They are fluctuating more than ever. Understanding these processes is not simply necessary; it is critical. This article will examine the most current worldwide milk production figures, export patterns, and price variations. Let us get you ahead of the curve.

CategoryRegionChangeRemarks
Milk Solids ProductionNew Zealand+10%Better than expected
Headline Milk ProductionU.S.-0.1%Component adjusted +1.8%
ExportsNew Zealand-13%Weaker than forecast
ImportsChina-2.8%Weaker than expected
Butter StocksU.S.N/ALarger than forecast

Milk Production Trends: Navigating the Shifts in New Zealand and the U.S. 

As we look at worldwide milk production patterns, two key areas stand out: New Zealand and the United States. Recently, New Zealand recorded a remarkable 10% rise in milk solids output in August. This increase in production is more than just a figure; it is a vital sign of the country’s thriving dairy industry, which continues to set the pace for global milk supply.

In contrast, headline milk output fell 0.1% in the United States in August. However, when controlling for components, the image changes, suggesting a 1.8% gain. This complex change shows that U.S. milk’s quality and richness have increased, although total volume may seem stable.

What do these developments mean for the worldwide market? With New Zealand boosting production, milk prices might fall as supply matches or surpass demand. However, the situation in the United States adds another degree of difficulty. The rise in component-adjusted production suggests that the United States may compensate for volume by producing higher-value goods, such as premium cheeses and specialized dairy components.

These processes have various geographical implications. For example, rising New Zealand exports may pressure European markets, increase competition, and change price tactics. Meanwhile, the U.S. market’s emphasis on quality over quantity may position dairy goods as a specialty, premium offers, shielding them from worldwide price volatility. This means that even if the overall volume of U.S. dairy exports remains stable, focusing on high-quality products could potentially drive up prices in specific markets.

Overall, the interaction between volume and value in these crucial areas emphasizes the significance of strategic manufacturing and marketing. Dairy farmers and industry experts should pay particular attention to these patterns, as they will likely affect market movements and opportunities in the coming months. By staying focused and adapting your strategies, you can confidently navigate the changing dairy market.

Global Trade Dynamics: New Zealand’s Export Decline and China’s Import Drop

New Zealand’s latest export statistics indicate a dramatic 13% fall, surprising many, considering the market’s usually positive outlook. What does this signify for the world supply? Dairy goods from one of the world’s top suppliers are becoming more scarce.

Meanwhile, China’s imports have dropped by 2.8%. While this may seem minor initially, it has far-reaching repercussions when considering China’s status as a significant dairy consumer. A drop in Chinese demand might indicate shifting consumer habits or economic forces.

What does the combined dynamic of decreased exports from New Zealand and lower imports into China mean for global supply and demand? For starters, if supply exceeds demand, the market may soften. This change may temporarily lower prices for dairy customers. On the other hand, manufacturers may face narrower margins and financial constraints.

Unexpected Surges Amidst a Shifting Dairy Market: Analyzing Whole Milk Powder’s Leap 

The latest pricing fluctuations in the dairy sector have caused quite a commotion. Whole Milk Powder (WMP) has seen an unexpected price increase on the world stage, contradicting industry expectations. This increase in the GDT Pulse index has left many questioning if we’ve entered a new market trend or whether this was an outlier. Other dairy goods, like cheese, butter, and powders, have consistently reduced costs, indicating a change in the market.

Why did WMP grow when others stagnated or even declined? Let’s look at some critical elements. First, New Zealand’s milk solids output increased by an astonishing 10% in August. While additional supply might cause downward pressure, worldwide demand for WMP from developing markets may have absorbed this extra volume, sending prices upward. In contrast, component-adjusted milk output in the United States increased by 1.8%, showing adequate supply levels.

However, the broader market may be cooling down. Cheese, for example, saw U.S. stocks fall 6.4% from the previous year, and lower-than-expected August statistics did nothing to boost sentiment. Buyers backed off, lowering prices for blocks and barrels as offers dried up.

Butter prices also fell, finishing at $2.79 ($6,150/M.T.) on the CME, the lowest level since March. Market observers may ascribe this to a variety of things. One explanation is that domestic demand was front-loaded early this year, resulting in less hunger today. Furthermore, larger-than-expected U.S. butter supplies in August boosted the perception of a well-supplied market, reducing pricing pressure.

Powders, notably NFDM and SMP, have softened in the U.S. and E.U. markets, with CME futures taking a significant knock. Since the beginning of September, attitude seems to have moved to a pessimistic stance. This shift may be attributed to lower global trade dynamics, as seen by New Zealand’s 13% export reduction and a smaller-than-expected 2.8% drop in Chinese imports.

These dairy market fluctuations indicate that, although specific sectors, such as WMP, are experiencing unexpected growth, others are dealing with supply and demand adjustments. Is the market merely pausing another boom, or have we reached the peak? Only time will tell—along with rigorous monitoring of output, stockpiles, and global commerce.

Market Sentiment: Breather or Peak? 

Let’s discuss the market mood. Are we merely taking a break before another push higher, or have we reached the peak? Currently, it’s a mixed bag. U.S. butter supplies were higher than predicted in August, possibly due to a spike in domestic demand. That is hardly the bullish signal that many were expecting.

However, there is more at play. Bird flu is quickly spreading across California, which is a significant concern. The same is true for Bluetongue in Europe. These variables will undoubtedly impact output and, as a result, pricing in the future. While specific markets may be slowing down, others may experience more activity.

The critical issue is whether we’ll see another spike or settle down. It’s a difficult decision. On the one hand, the continuous year-end Christmas demand usually results in higher pricing, as consumers tend to buy more dairy products during this festive season. On the other hand, rising stock levels, notably in butter, signal that the market may have peaked and is now poised to rebalance.

So, we are at a crossroads. Is this the quiet before the storm or the start of a plateau? Only time will tell, but remaining watchful about these vital aspects is essential for making educated judgments in the coming months.

U.S. Cheese Market in Flux: Buyer’s Strike Creates Uncertainty 

The current state of the cheese market in the United States has several opportunities for analysis. Recently, U.S. cheese purchasers took a considerable step back, effectively going on strike. This move reflects strategic prudence due to dropping pricing for cheese blocks and barrels. Rising offers and a noticeable lack of bids mainly caused this week’s fall. The attitude indicates resistant purchase behavior as buyers wait for better market circumstances.

New figures show that U.S. cheese supplies were 7 million pounds fewer than expected in August. They fell by 6.4% from the previous year, which was accentuated by the downward adjustment in July. This decline points to a more precarious supply position than previously thought. Lower supply typically raises prices, but the present buyer strike has disturbed this natural market reaction.

So, what does this imply for the U.S. cheese market? Lower stock levels often indicate increased market pressures, which might contribute to future price recoveries. However, the current price situation may worsen if buyers stay on the sidelines. The power dynamic has altered somewhat; sellers are dealing with demand uncertainty.

The market is tug-of-war between current supply limits and buyer reluctance. As we proceed, the price volatility risk remains substantial, determined by how soon and to what degree buyers re-engage. The cheese market in the United States may continue to be volatile due to changing purchasing habits and underlying supply dynamics.

Butter Market Puzzles: Is the Seasonal Trend Buckling? 

Turning our focus to the butter market, recent developments have left many industry observers perplexed. CME spot butter ended Thursday at $2.79 ($6,150/M.T.), its lowest price since early March—a notable development given seasonal tendencies. Typically, we anticipate butter prices to climb as we approach the end-of-year holidays due to increasing demand.

But what’s behind this surprising decline? One potential reason is that domestic demand was higher than usual this year. Perhaps customers stockpiled up significantly earlier this year, expecting price increases and supply chain problems that still need to materialize. Consequently, a slowdown in buying may be placing downward pressure on pricing.

The future of the butter market remains to be determined. Seasonal tendencies indicate that costs should rise as Christmas baking and cooking increase. Still, current market dynamics raise doubt about this tendency. Factors such as current avian flu outbreaks in California and bluetongue in Europe may affect supplies further, possibly hiking prices.

However, we must also examine whether the market is resting before another upward surge or if we are nearing the conclusion of a bullish cycle. Late-year demand will be critical to monitor. Will customers empty their stashes, forcing fresh purchases, or have we reached a corner?

Powder Market: Shifting Sands and Emerging Challenges 

Powders have also seen notable changes. The costs of nonfat dry milk (NFDM) and skim milk powder (SMP) have fallen in both the United States and the European Union. This isn’t just a slight adjustment; CME futures have dropped significantly over the last two days, signaling a substantial shift in market opinion. Since September, the prognosis has shifted to the pessimistic side, particularly in the U.S. This move raises various issues.

Are purchasers speculating on future oversupply? Perhaps recent production increases in New Zealand and the United States have addressed some of the supply limitations that had previously driven prices higher. How does this affect dairy producers and suppliers?

Price cuts may have a double-edged effect. On the one hand, reduced prices may stimulate demand, clearing stockpiles. However, as input prices rise, manufacturers may face narrower margins. If prices continue to fall, stakeholders must plan for probable financial difficulties or seek cost-cutting strategies to retain profitability.

The hostile move indicates deeper market concerns about maintaining higher prices in the face of variable output and unpredictable demand patterns worldwide. If these price declines shake market confidence further, we may witness a market correction or a longer-term trend. Only time—and the forthcoming Christmas demand—will tell if this negative mindset persists or shifts back to positive.

Seizing Opportunities in a Complex Market: Your Game Plan 

The present market dynamics are complex, but if you look at your business, you will find several chances. Begin by adequately controlling expenses, such as bulk purchasing feed and conserving energy. Diversify your goods beyond milk, explore using technology to increase production, and keep up with market developments. Create financial resilience via contingency savings and avoid high indebtedness. Finally, prioritize quality; better items often result in higher pricing and more devoted consumers. In 2024, flexibility and proactive initiatives are more than just buzzwords; they are required to be competitive in the ever-changing dairy industry. Stay aware and agile, and always seek operational efficiencies.

The Bottom Line

The present dairy sector environment shows a combination of stronger-than-expected milk output in New Zealand and the United States, comparatively weak Chinese imports, and volatile commodity prices. The strike in the U.S. cheese market and the sudden fluctuations in butter and powder pricing show the unpredictability of dairy markets. Consider how these trends may affect your daily operations and bottom line as the year advances. Are you ready to negotiate these changes, or must you adapt your methods to remain ahead? The future of the dairy industry depends on our capacity to adapt and make sound choices. What actions would you take to guarantee that your firm flourishes in the face of global market fluctuations?

Learn more:

Join the Revolution!

Bullvine Daily is your essential e-zine for staying ahead in the dairy industry. With over 30,000 subscribers, we bring you the week’s top news, helping you manage tasks efficiently. Stay informed about milk production, tech adoption, and more, so you can concentrate on your dairy operations. 

NewsSubscribe
First
Last
Consent

The Future Looks Bright for U.S. Dairy Farmers – But Are You Ready for the Hidden Hurdles?

Can U.S. dairy farmers thrive despite growth challenges and high costs? Discover their strategies and the role of export markets in our latest article.

Summary: Have you ever wondered what the future holds for the U.S.? While many dairy farmers are turning profits, high costs and short supplies of heifer replacements could pose roadblocks. As the demand for milk in the U.S. grows, it becomes increasingly vital. The central is buzzing with opportunities, thanks to projects like the Lupino factory in Lubbock, Texas, and the Hilmar facility in Dodge City, Kansas. One potential solution is using breeding technology to increase heifer calves, though the costs and development time remain concerns.

  • Most dairy farmers turned profits over the past 5 years, and many plan to expand operations within the next five years.
  • Heifer replacements are in short supply, posing challenges to increased milk production.
  • Export markets have become critical due to the anticipated surge in milk processing capabilities.
  • Dairy farmers are optimistic and adaptable, willing to meet the market demands head-on.
  • Increased competition from the European Union and New Zealand globally.
U.S. dairy industry, rapid growth, expansion, producers, profits, challenges, high cost, scarcity, heifer replacements, threat, southern area, shortfall, milk production, new facilities, central United States, opportunities, Lupino factory, Lubbock, Texas, Hilmar facility, Dodge City, Kansas, breeding technology, sexed semen, heifer calves, investment, time, concern, Michael Dykes, President and CEO, International Dairy Foods Association (IDFA), adaptation, resilience, market pressures, fulfilling expanding need, optimizing feeding procedures, working with rations.

Did you know that, despite the volatility, many dairy producers in the United States have generated a profit in the last five years? This resiliency demonstrates the industry’s strength and reassures us about its future. But what comes next for the U.S. dairy industry? Many dairy producers plan to expand in the following years, using billions of dollars set aside for development. However, the route has hurdles. The high cost and scarcity of heifer replacements threaten to impede this promising trend.

Furthermore, rising production capacity highlights the dairy industry’s potential for significant expansion in the United States. This optimism is bolstered by the significance of expanding beyond home boundaries and entering foreign markets. The southern area, in particular, will experience a shortfall. Millions of pounds of milk must be produced every day to serve new facilities opening in that area. Are you prepared to negotiate future growth, impending hurdles, and the importance of export markets? The future of U.S. dairy is packed with opportunities, but it also presents challenges that need strategic preparation and resilience.

U.S. Dairy’s Golden Era: Growth, Challenges, and Global Opportunities

The dairy business in the United States is undergoing rapid development and expansion. In recent years, profitability has been a notable trend among dairy producers, with over 70% reporting profits in the last five years. This favorable economic climate is paving the way for big growth ambitions. Over half of the dairy farmers polled want to expand their operations during the next five years, citing the industry’s strong market demand and bright future.

Substantial financial investments support the commitment to growth. Billions of dollars are invested in the business and allocated for future development projects and advancements. These investments are projected to boost production capacities, increase efficiency, and help create new processing units. Significant increases are on the horizon in crucial places such as Texas and Kansas, where large-scale industries use millions of pounds of milk every day. This implies a planned effort to expand operations and fulfill market needs, which might improve the overall competitiveness of the U.S. dairy business on both local and international levels.

The central United States is bustling with possibilities, thanks to huge developments such as the Lupino factory in Lubbock, Texas, and the Hilmar facility in Dodge City, Kansas. These initiatives are more than expansions; they reflect a daily demand for millions of pounds of milk. Consider the logistical challenges, the quantity of cows required, and the revolutionary effect this may have on local economies. For dairy producers, this means opportunity. Can you imagine the size of operations necessary to provide an extra 8 million pounds of milk every day? These places have a strong feeling of momentum, ready to reshape the dairy landscape.

Facing the Heifer Hurdle: The Challenge of Expanding U.S. Dairy Herds

One of the most critical issues confronting the U.S. dairy business is the high cost and scarcity of heifer replacements. These young female cows, known as heifers, are vital to sustaining and increasing herds. However, their supply is now restricted, posing a barrier to increasing milk output.

Imagine planning a significant expansion only to discover that the crucial components—heifers—are rare and costly. This puts an extra financial burden on farmers and hinders the expansion process. Even the best-equipped farms cannot scale up productivity as intended unless they get a consistent supply of heifers.

One possible answer to the heifer replacement challenge is modern breeding technology, such as sexed semen. This technology allows for the selection of the sex of the calf, increasing the likelihood of heifer calves being born. While this may alleviate the problem somewhat, there are more effective remedies. Given the investment in such technology and the time it takes for heifers to develop, this dilemma will likely remain a significant worry in the immediate future.

Unyielding Optimism: How U.S. Dairy Farmers Rise to Market Demands

Michael Dykes, President and CEO of the International Dairy Foods Association (IDFA), is optimistic about dairy farmers’ adaptation and resilience in the face of market pressures. “I know dairy farmers; if the market is there, they will grow,” he firmly claims, emphasizing the industry’s proactive approach. Large dairy producers, mainly, are keen to grow as demand rises.

Dykes discusses numerous options that farmers might use to fulfill this expanding need. “If there’s a market demand for the milk, they’ll find a way to start producing more heifers with sexed semen,” he suggests. This new reproductive technique enables more female calves, critical for improving milk production. Furthermore, farmers will change their feeding procedures to optimize diets and increase cow milk production.

The combination of these tactics exemplifies the inventive spirit of American dairy producers. “They’ll find a way to make the terms they will work with rations; they’ll increase the milk production per cow,” Dykes elaborates. His steadfast faith in the dairy industry’s inventiveness shines through: “I’m a firm believer that dairy farmers respond to market signals, and I believe the milk will be there.”

Export Markets: The Lifeline for U.S. Dairy’s Future Growth

The significance of export markets cannot be emphasized, particularly given the expected rise in milk output. Stephen Cain, Senior Director of Economic Research and Analysis at the National Milk Producers Federation (NMPF), echoes this opinion, stating that the growing ability to process milk locally may soon outpace local demand. Therefore, The industry needs to look towards the export market to move some of this additional capacity.

Finding new overseas markets is not simply a strategy for dairy producers in the United States; it is a need. Cain underlines that in the absence of these markets, domestic processing facilities may need to improve operational efficiency. Plants may be required to shorten runtimes or even close if they cannot perform properly. This is especially problematic considering the quantity of additional processing capabilities predicted to become available shortly.

Furthermore, Cain cautions that failure to establish a significant presence in the global market may result in prematurely closing less efficient operations. He clarifies: “The export market will be key for moving some of this product overseas.” The dairy sector in the United States may maintain its expansion while mitigating overproduction concerns by expanding into overseas markets. This strategy shift will be critical as America confronts stiffer competition from dairy farmers in the European Union and New Zealand.

Turning the Tide: How U.S. Dairy Can Win on the Global Stage

The worldwide stage is unquestionably competitive, with the European Union and New Zealand dominating the dairy business. Both locations have long-established marketplaces and are recognized for their efficient manufacturing processes. This creates a double challenge for U.S. dairy: not only must they achieve rigorous international standards, but they must also outperform well-established rivals.

However, this competition is not impossible. The U.S. dairy business has distinct advantages that may be used to carve out and grow market share abroad. For example, technology developments and production process innovations give dairy farmers in the United States a considerable advantage in terms of efficiency and productivity. Integrated supply chains, aided by cutting-edge agricultural technology, simplify operations, save prices, and improve quality control.

To summarize, although competition from the E.U. and New Zealand is fierce, the U.S. dairy business has plenty of opportunities to overcome these obstacles. Embracing innovation, pushing for favorable regulations, and emphasizing their dedication to quality and sustainability will help U.S. dairy farmers compete and grow worldwide.

Consumer Trends: How Dairy Farmers Are Adapting to the Rise of Plant-Based and Organic Products

Consumer patterns rapidly change, and the U.S. dairy business feels the effects. Have you seen the increasing availability of plant-based milk substitutes and organic dairy products? This isn’t a passing trend. According to a Plant-Based Foods Association estimate, the plant-based milk industry increased by 6% in 2020, reaching a remarkable $2.5 billion in sales [PBFA Report]. Furthermore, the organic dairy business is developing significantly, with sales expected to increase by 5.5% in 2020 to $6.8 billion[OTA Report].

So, how does this affect conventional dairy farmers? So, adaptability is the name of the game. Assume you’ve been a dairy farmer for decades and must broaden your offerings. The good news is that many farmers are rising to the occasion. To meet increasing customer demand, several businesses are transitioning to organic systems. Others are even turning to plant-based alternatives, such as oat or almond milk, to remain competitive in this changing market.

But it’s more than simply diversifying offerings; it’s also about recognizing customer preferences. Consumers nowadays are increasingly aware of environmental issues and animal welfare. According to a Nielsen poll, 73% of worldwide consumers would definitely or probably modify their purchase patterns to decrease their ecological effects [Nielsen Survey]. This change encourages dairy producers to use more sustainable techniques and technologies to increase efficiency and reduce carbon emissions.

The Human Factor: Why Workforce Development is Crucial for the Dairy Industry

One of the most significant concerns facing the dairy sector in the United States as it prepares to expand is a workforce shortage. Have you ever wondered who would manage the growing herd of cows or run the sophisticated gear on these expanding farms? According to recent research, more than 60% of dairy farms have a significant scarcity of experienced staff. This scarcity is more than a minor glitch; it may drastically delay development and reduce productivity.

So, what is being done to remedy this? Various efforts are targeted at training and keeping talented workers. The Dairy Workforce Training Initiative, a University of Wisconsin-Madison initiative, is making waves. “Our goal is to equip future dairy workers with the skills needed to excel in a modern dairy farm setting,” says Dr. Emily Walker, program coordinator [UW Madison].

Furthermore, teamwork is necessary. Industry leaders collaborate with educational institutions to provide hands-on training modules that include old methodologies, modern technology, and sustainable practices. Jim Collins, CEO of Collins Dairy Farms, highlights the importance of technology in maintaining competitiveness. According to Collins Dairy, technology is only as effective as its operators. Programs like this are helpful now and are laying a solid basis for the future of U.S. dairy by investing in human capital and assuring long-term success.

The Bottom Line

The U.S. dairy sector is poised for significant development, propelled by new investments and the building of large-scale processing units. However, this hopeful future is challenging. Dairy producers face considerable hurdles due to the high cost of heifer replacements and the need to boost milk output. However, the tenacity and flexibility of U.S. dairy farmers come through since they are recognized for efficiently responding to market needs. Furthermore, as local production capacity increases, finding overseas markets for excess milk and dairy products becomes critical. To compete with global players such as the European Union and New Zealand, dairy producers in the United States must be strategic, inventive, and collaborative. Are you prepared to grab these possibilities while navigating the challenges? The future of dairy is in your hands.

Learn more:

US Milk Production Declines for 11th Month While Butterfat and Protein Rise

Learn why US milk production is decreasing while butterfat and protein levels are increasing. How does this change affect dairy products and consumer choices? Find out more.

A persistent 11-month decline in U.S. milk production marks a pivotal shift in the dairy sector’s landscape. This latest drop of 0.9% in May stands in stark contrast to rising butterfat and protein levels, reaching unprecedented highs, underscoring a transformation within the industry. It’s evident that the emphasis must now transition from sheer milk volume to its quality and composition. Driven by consumer demand, this evolution highlights the substantial value of nutrient-rich dairy products. Between 2011 and 2023, butterfat pounds shipped from farms surged by 27.9% to 9.3 billion pounds, while milk production saw a comparatively modest rise of 15.4% to 226.4 billion pounds. These figures reflect a fundamental change in productivity benchmarks, illustrating that higher-content milk offers distinct financial and nutritional benefits.

Redefining Dairy Productivity: From Volume to Value 

YearMilk Production (Billion Pounds)Butterfat Production (Billion Pounds)
2011196.47.3
2012200.37.5
2013201.27.7
2014206.08.0
2015209.98.3
2016212.48.5
2017215.58.7
2018217.58.8
2019218.48.9
2020223.19.0
2021225.79.1
2022226.09.2
2023226.49.3

Since 1931, U.S. dairy productivity measures have revolved chiefly around milk output, determined by the USDA. Historically, this metric has offered a simple approach for evaluating performance over time and estimating production. Rising milk yields have shown developments in agricultural methods, herd management, and animal genetics, strengthening the dairy sector. However, since 2011, the makeup of milk has changed, which calls for a change in production guidelines. Butterfat and protein in milk have notably increased as customer tastes for nutrient-dense goods change. These are more significant than volume when gauging dairy quality and market worth. From 2011 to 2023, milk output rose by 15.4%; butterfat and protein production skyrocketed by 27.9%. This change emphasizes adjusting production values to fit consumer nutritional knowledge and market demand.

Recent Milk Production Trends: A Shift Towards Quality 

MonthMilk Production (billion pounds)% Change from Previous Year
June 202218.0-0.5%
July 202218.2-0.4%
August 202218.1-0.6%
September 202217.8-0.7%
October 202218.0-0.3%
November 202217.9-0.4%
December 202217.7-0.5%
January 202318.1-0.6%
February 202317.5-0.8%
March 202318.3-0.9%
April 202317.9-0.7%
May 202318.0-0.9%

Current milk production patterns highlight a dynamic change in the American dairy sector. This May’s 0.9% dip in milk output represents the eleventh straight month of losses. However, butterfat and protein output has risen for ten of the last eleven months. U.S. milk production statistics and butterfat and protein percentages from Federal Milk Marketing Orders (FMMO) help one determine this number. Although depooling and Idaho’s exclusion cause the metric to be imperfect, it emphasizes the trend toward higher-content milk. This change results in more nutrient-dense dairy products, indicating a fundamental shift from volume to quality in the dairy business.

Nutrient-Dense Evolution: Elevating Butterfat and Protein in Dairy Products 

Higher butterfat and protein contents have significant market ramifications as the dairy sector adjusts to the changing milk composition. The move toward more nutrient-dense dairy products directly answers customer tastes for better, indulgent choices. Producers emphasizing quality over volume may demand more money for premium cheeses, yogurt, and other dairy products. Focusing on butterfat and protein may satisfy niche markets like high-protein diets and stimulate creativity by meeting the need for highly flavorful, nutrient-packed choices.

Nutrient-dense dairy products have emerged in line with more general market trends toward convenience and functional diets. Health-conscious customers look for products that effectively provide necessary nutrients in line with changing milk guidelines. Furthermore, the explosion in U.S. cheese exports shows the rising worldwide demand for premium dairy products. Driven by customer demand and economic incentives for producers to give milk composition priority, these market dynamics ultimately highlight a notable change in the dairy sector by stressing milk’s value and composition instead of pure output volume.

A Rollercoaster Start to 2023: Domestic and International Cheese Consumption Trends

MonthDomestic Consumption (Million Pounds)International Exports (Million Pounds)
January30090
February29092
March315110.3
April320102
May325106

Domestic cheese consumption dropped early in 2023, dropping over 3.5% in January and February. By March and April, Americans turned around and started eating more cheese than in past years. Low cheese prices on the CME spot market helped to drive this recovery and significantly increase worldwide sales. Reaching a milestone, U.S. cheese exports for March for the first time topped 100 million pounds, up 20.5% yearly to the 110.3 million pound mark. With 102 million and 106 million pounds in exports, respectively, April and May followed this pattern; 40 million pounds were headed for Mexico.

Shifts in Dairy Cow Culling: Rethinking Herd Management and Market Strategy 

YearCattle Culling (Head)
20193,500,000
20203,275,000
20213,000,000
20222,850,000
2023 (Through June)2,631,500

The U.S. dairy sector depends significantly on the noted dairy cow culling drop. Usually, dairy cow culling revitalizes herds by balancing productive and non-productive animals. Still, as of June 22, culling is down by 218,500 head from the previous year. This dramatic change deviates from the four-year trend. The growing beef-on-dairy market—which has produced between 3 million and 3.25 million animals from beef sires and dairy dams—is primarily responsible for this. Due to this tendency, dairy heifer replacements are scarce, which has driven their valuations beyond $3,000 at many auctions—a record high over two decades.

Aiming to improve meat production efficiency, the great demand for beef-on-dairy calves combines the robust features of beef cattle with dairy breeds. However, it influences herd dynamics by aggravating the replacement shortage and lowering the number of dairy heifers accessible to replace culled cows. With the almost three-year cycle from conception to the first calving, this shortage will take time. The future depends on how the sector responds to these developments and how they affect herd management and economic viability.

The Unrelenting Threat of HPAI: Navigating a Path Forward Amidst a National Challenge

Affecting at least a dozen states and compromising milk supply and herd health, Highly Pathogenic Avian Influenza (HPAI) still shadows the dairy sector. The two biggest dairy states, California and Wisconsin, have recorded no instances. However, dairy producers deal with lower milk output and difficulties controlling sick cows. Several businesses are working hard to address these challenges and provide vaccinations against HPAI in cattle. Emphasizing these initiatives, USDA Secretary Tom Vilsack has given optimism for future assistance. The dairy industry has to control the immediate effects of H5N1 using careful disease management techniques until vaccination is ready.

The Bottom Line

The business is moving from volume to rewarding highly nutritious milk components as we examine the evolving scene of dairy production. This reflects shifting customer tastes and market realities, requiring fresh production targets. Rising butterfat and protein levels indicate the possibility for additional value-added dairy products even though milk output dropped 11 months ago. Driven by competitive prices, trends also reveal growing worldwide demand for U.S. cheese. Apart from the continuous danger of Highly Pathogenic Avian Influenza and strategic herd management among limited culling, the dairy industry also suffers issues. Monitoring combined protein and butterfat output now offers a better standard for dairy output. Dairy producers and customers depend on a solid and sustainable future; hence, adopting these new productivity criteria and innovation is vital.

Key Takeaways:

  • U.S. milk production has decreased for the 11th consecutive month as of May, showing a 0.9% drop.
  • Despite declining milk volume, butterfat and protein production increased for 10 out of the past 11 months, indicating a shift in focus towards milk quality over quantity.
  • Cow culling rates have decreased significantly, influenced by the beef-on-dairy market; dairy heifer replacements are at a 20-year low, pushing replacement values over $3,000.
  • Highly Pathogenic Avian Influenza (HPAI) continues to impact dairy cows in multiple states, with ongoing efforts to develop a vaccine against this threat.
  • U.S. cheese exports hit a record high, surpassing 100 million pounds in a single month for the first time in history.

Summary:

The decline in U.S. milk production has led to a shift in the dairy sector, with butterfat and protein levels reaching unprecedented highs. This highlights the importance of nutrient-rich dairy products and the need to transition from sheer milk volume to quality and composition. Between 2011 and 2023, butterfat pounds shipped from farms surged by 27.9% to 9.3 billion pounds, while milk production saw a modest rise of 15.4% to 226.4 billion pounds. The USDA’s milk output metric has been used since 1931 to evaluate performance over time and estimate production. From 2011 to 2023, milk output rose by 15.4%, while butterfat and protein production skyrocketed by 27.9%. Recent milk production trends show a dynamic change in the American dairy sector, with the 0.9% dip in May representing the eleventh straight month of losses. The growth of U.S. cheese exports highlights the rising worldwide demand for premium dairy products, driven by customer demand and economic incentives for producers to prioritize milk composition.

Learn more:

Send this to a friend