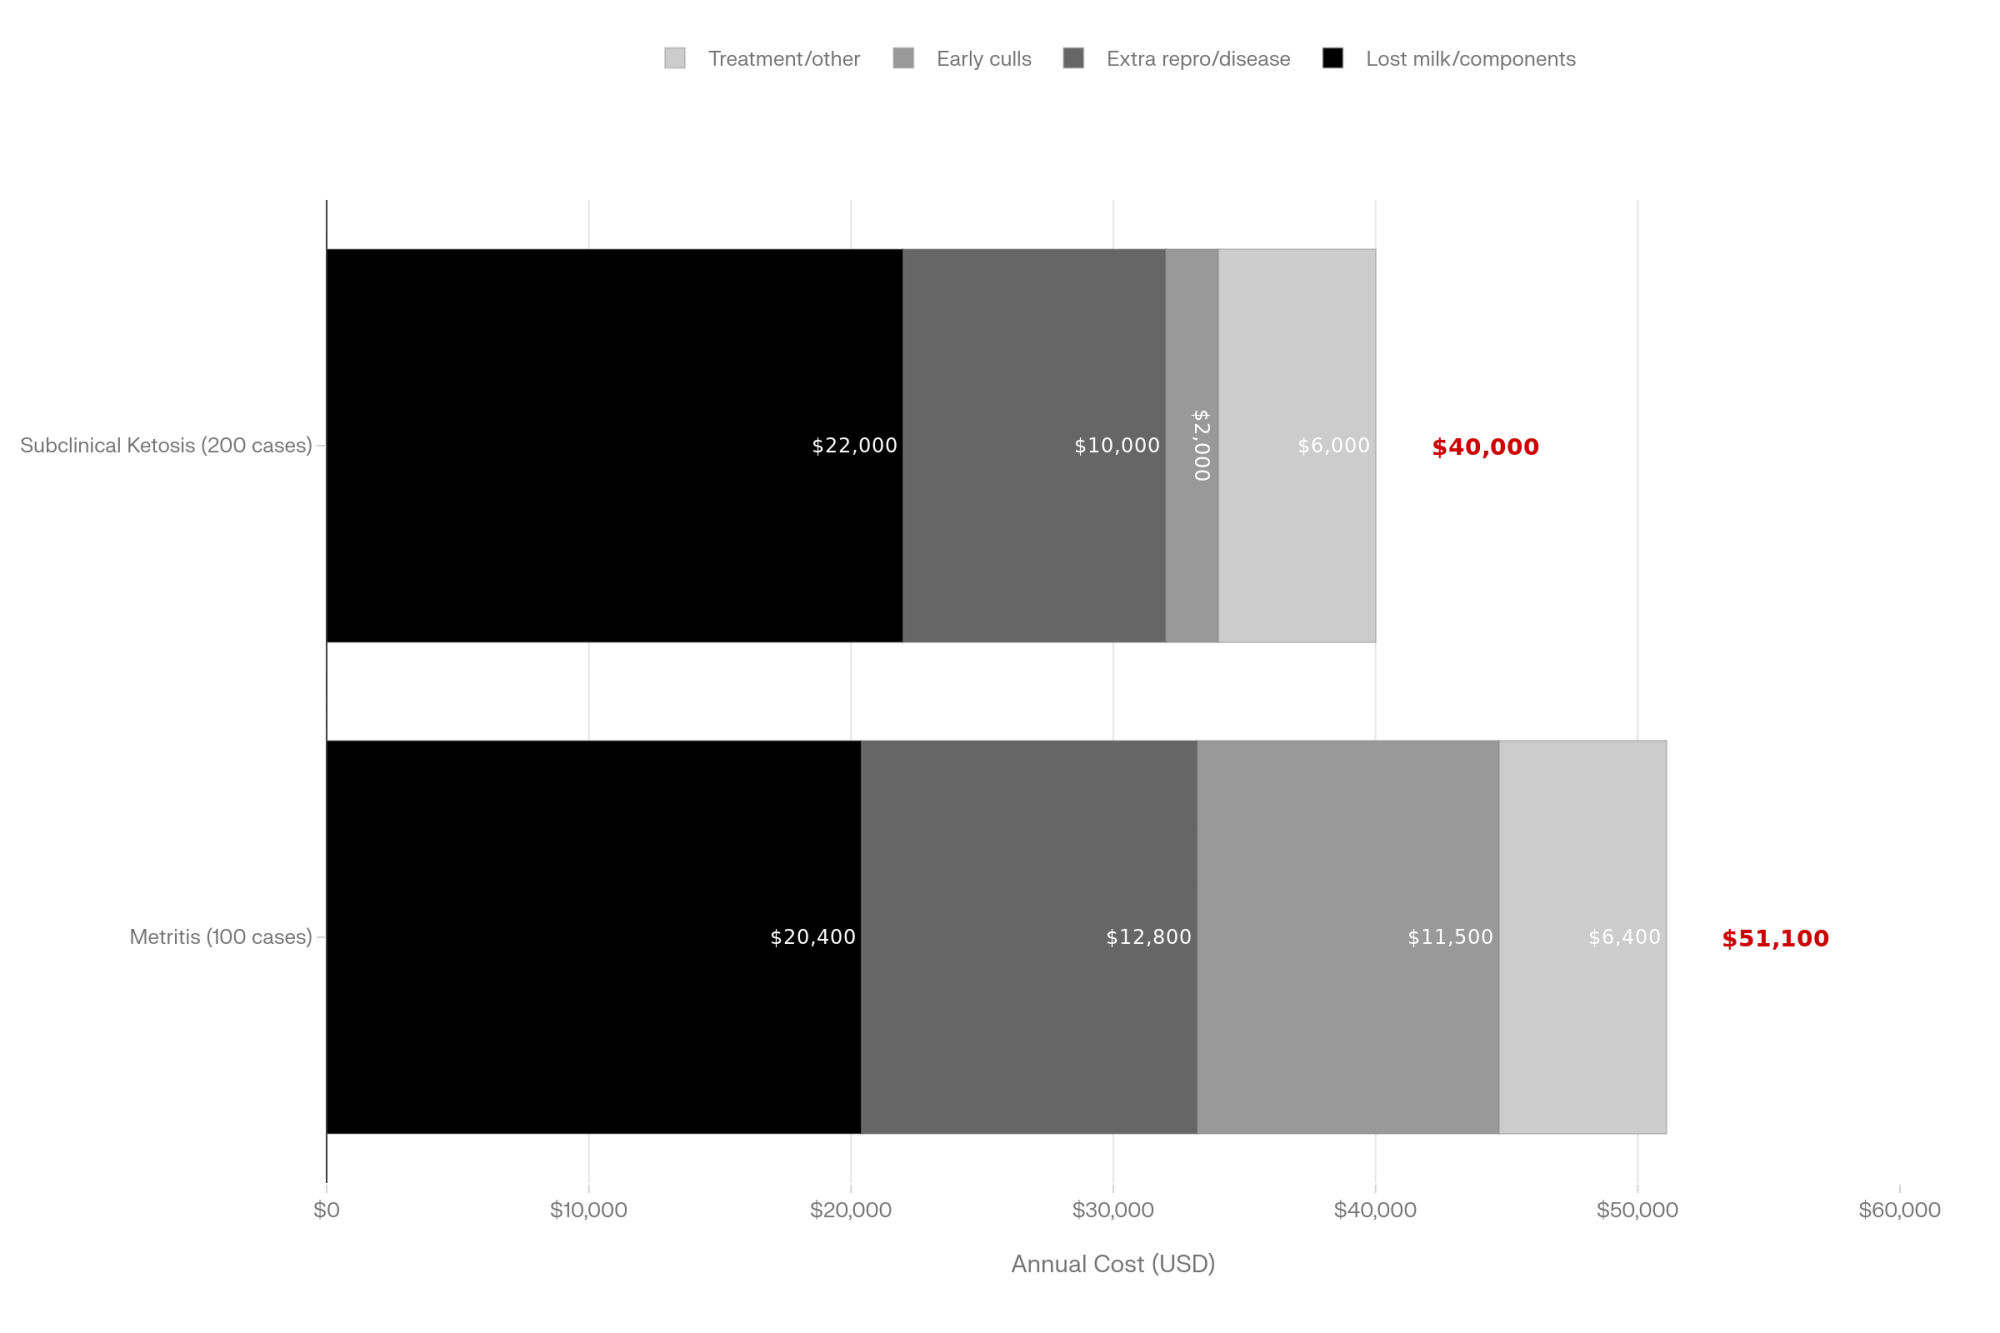
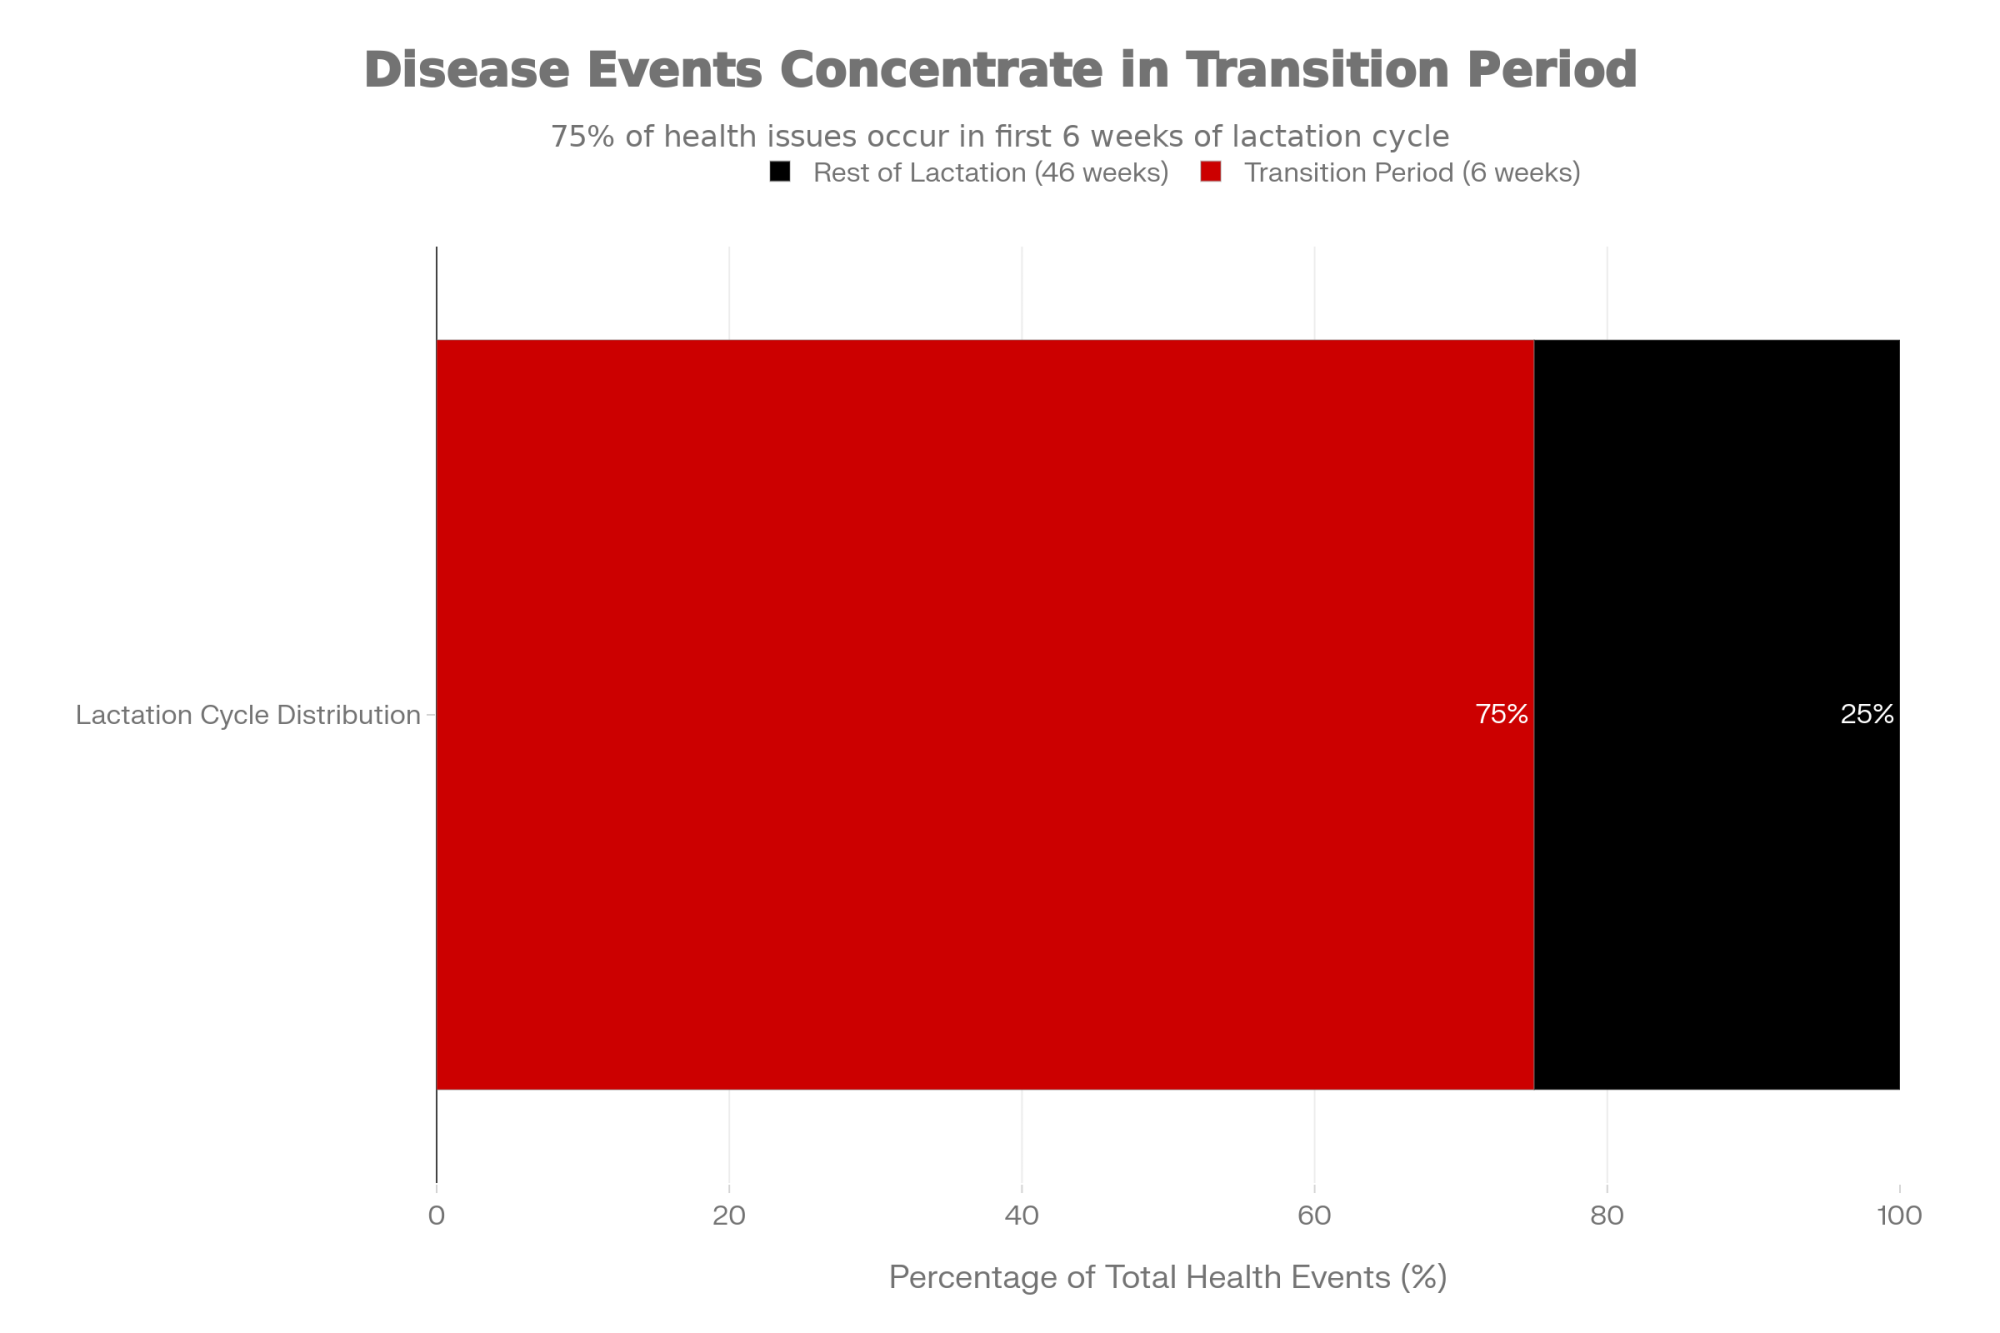
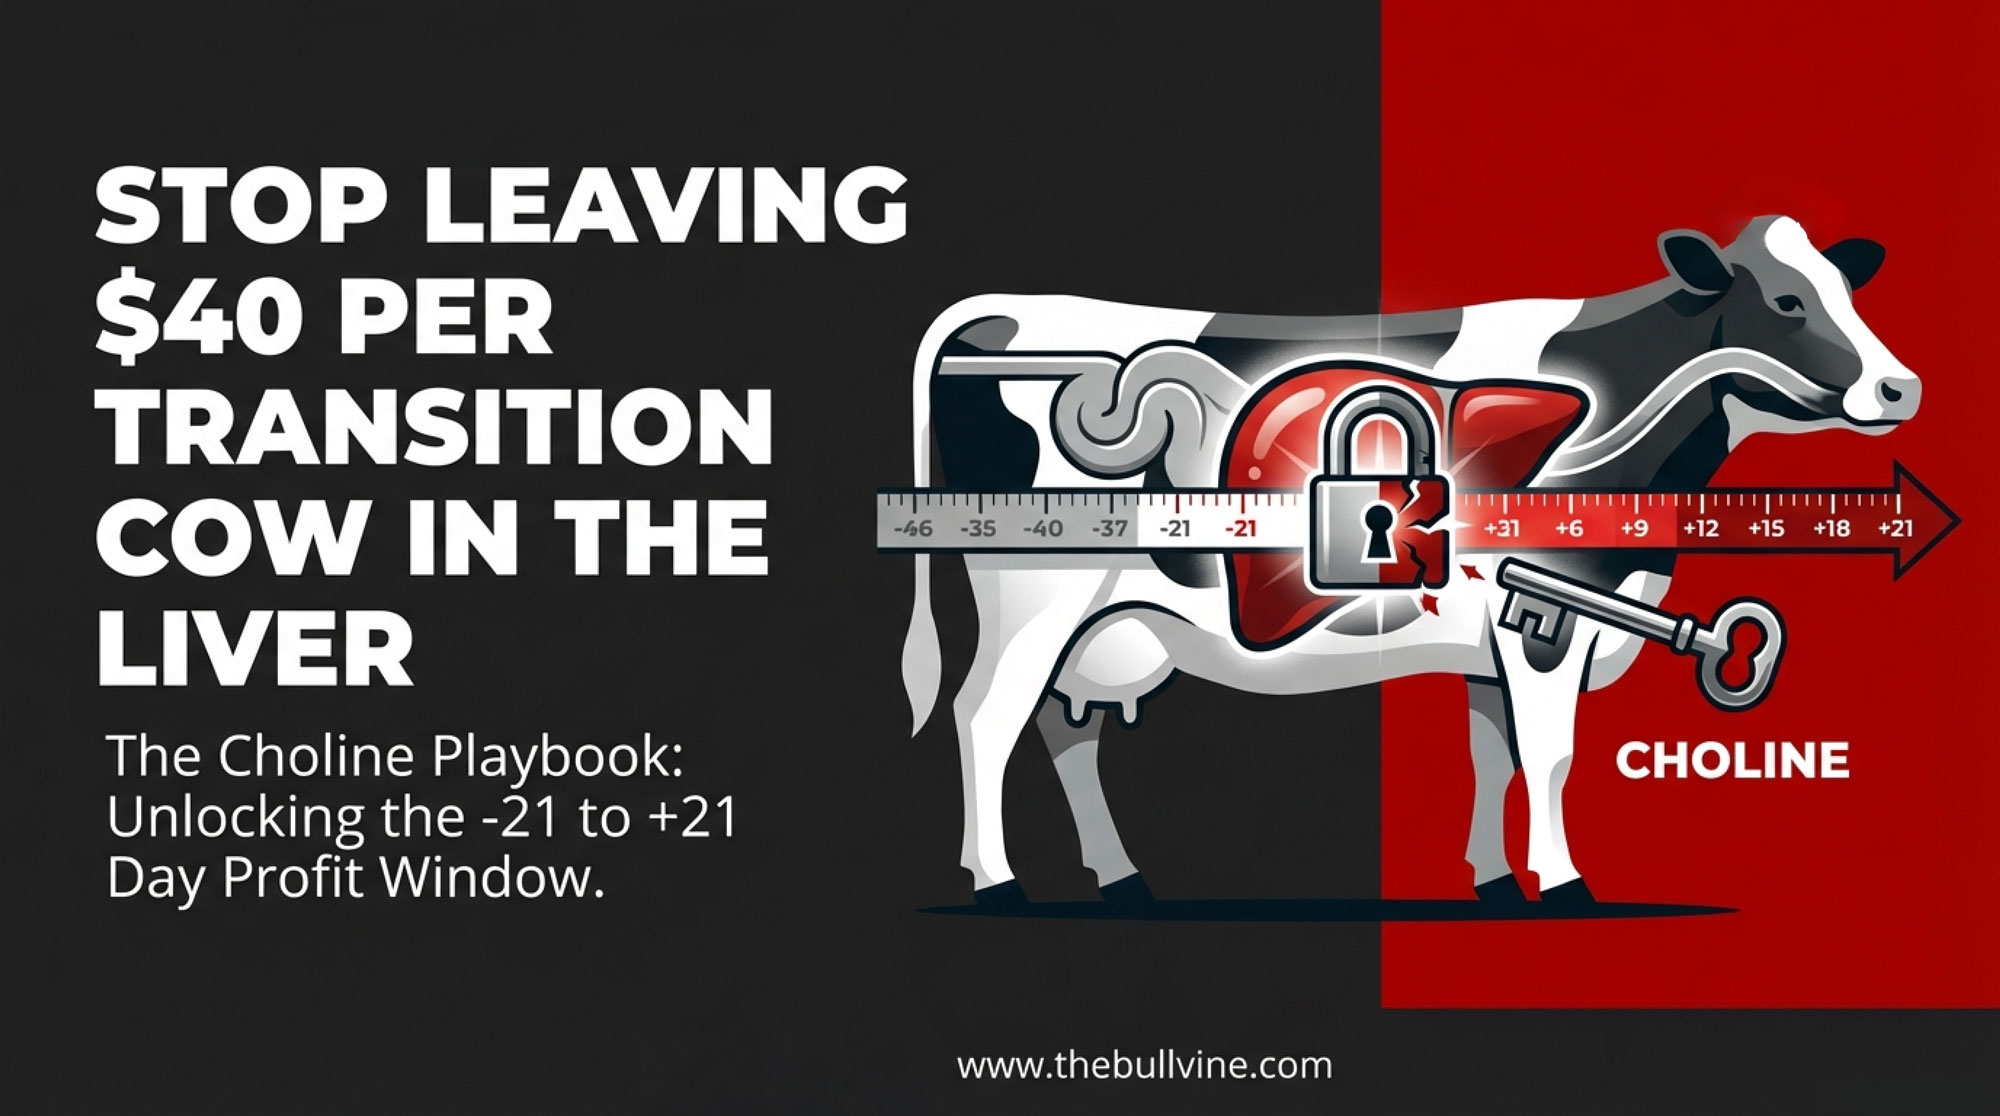
21 trials. 1,313 cows. +1.7 kg ECM/day at ~13 g choline. The catch: only works from −21 to +21 days. Miss that window, miss the money.
Executive Summary: If your fresh cows look “okay” on paper but still feel like they’re leaving money on the table, this article argues that a lot of that profit is stuck in their livers. It pulls together 21 trials with 1,313 cows, plus newer PLOS ONE and Animals work, showing that feeding about 13 g/day of rumen‑protected choline from roughly 21 days before calving through the first few weeks in milk consistently adds around 1.6–1.7 kg/day of energy‑corrected milk and helps livers export fat rather than store it. Under typical component‑based pricing, that kind of response often works out to roughly US$40–45 per cow in early‑lactation milk value before you even price in fewer DAs or ketosis cases. At the same time, the meta‑analyses are clear that health effects are more hit‑and‑miss, so the piece leans into a “fundamentals first” message: get energy, DCAD, and fresh cow management right, then decide whether choline is really your next bottleneck. From there, it walks you through a plain‑language, three‑step playbook—BHB testing, a quick audit of transition basics, and a structured −21 to +21 choline trial—so your own numbers tell you if it pays on your farm. You finish with clear decision rules that help you rank choline against methionine, cow comfort, and other big‑ticket tools in your transition budget instead of guessing.
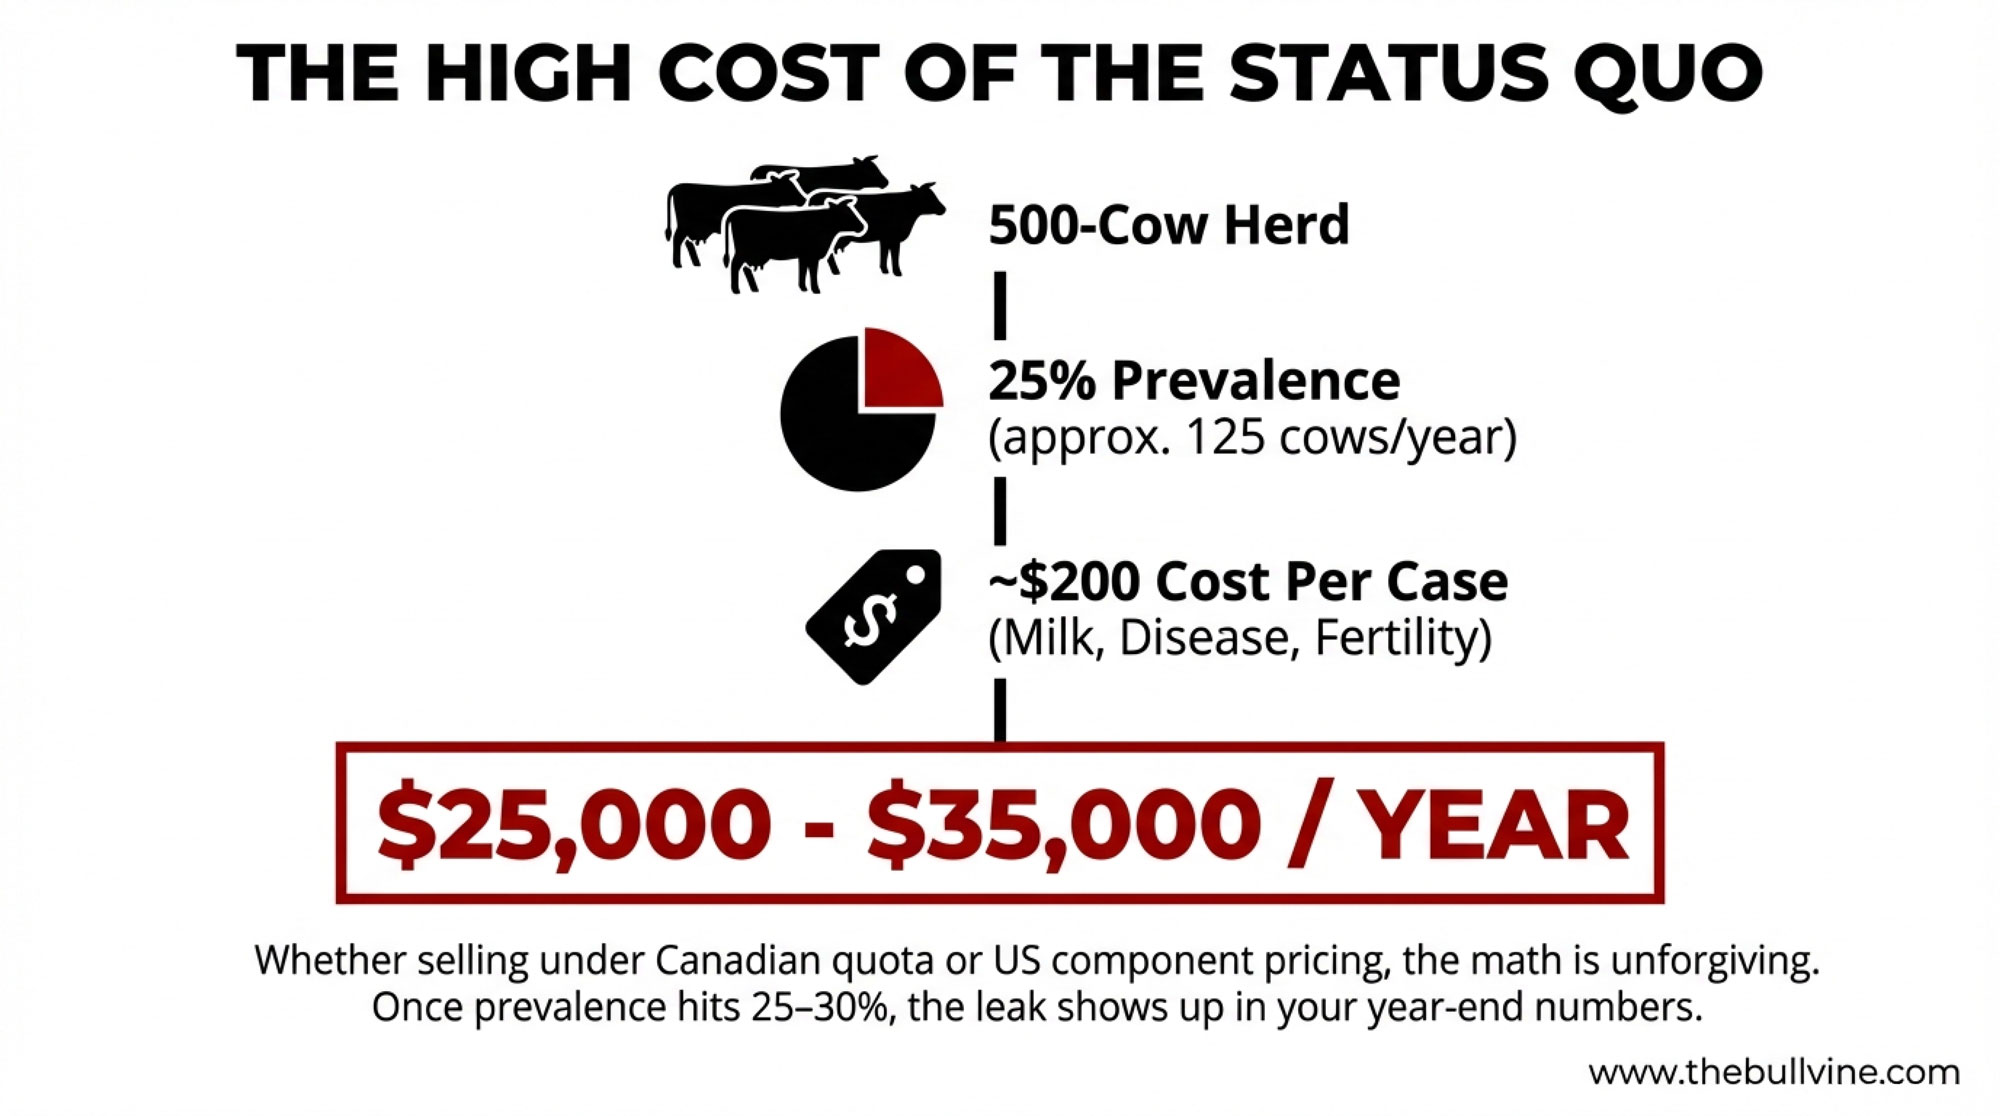
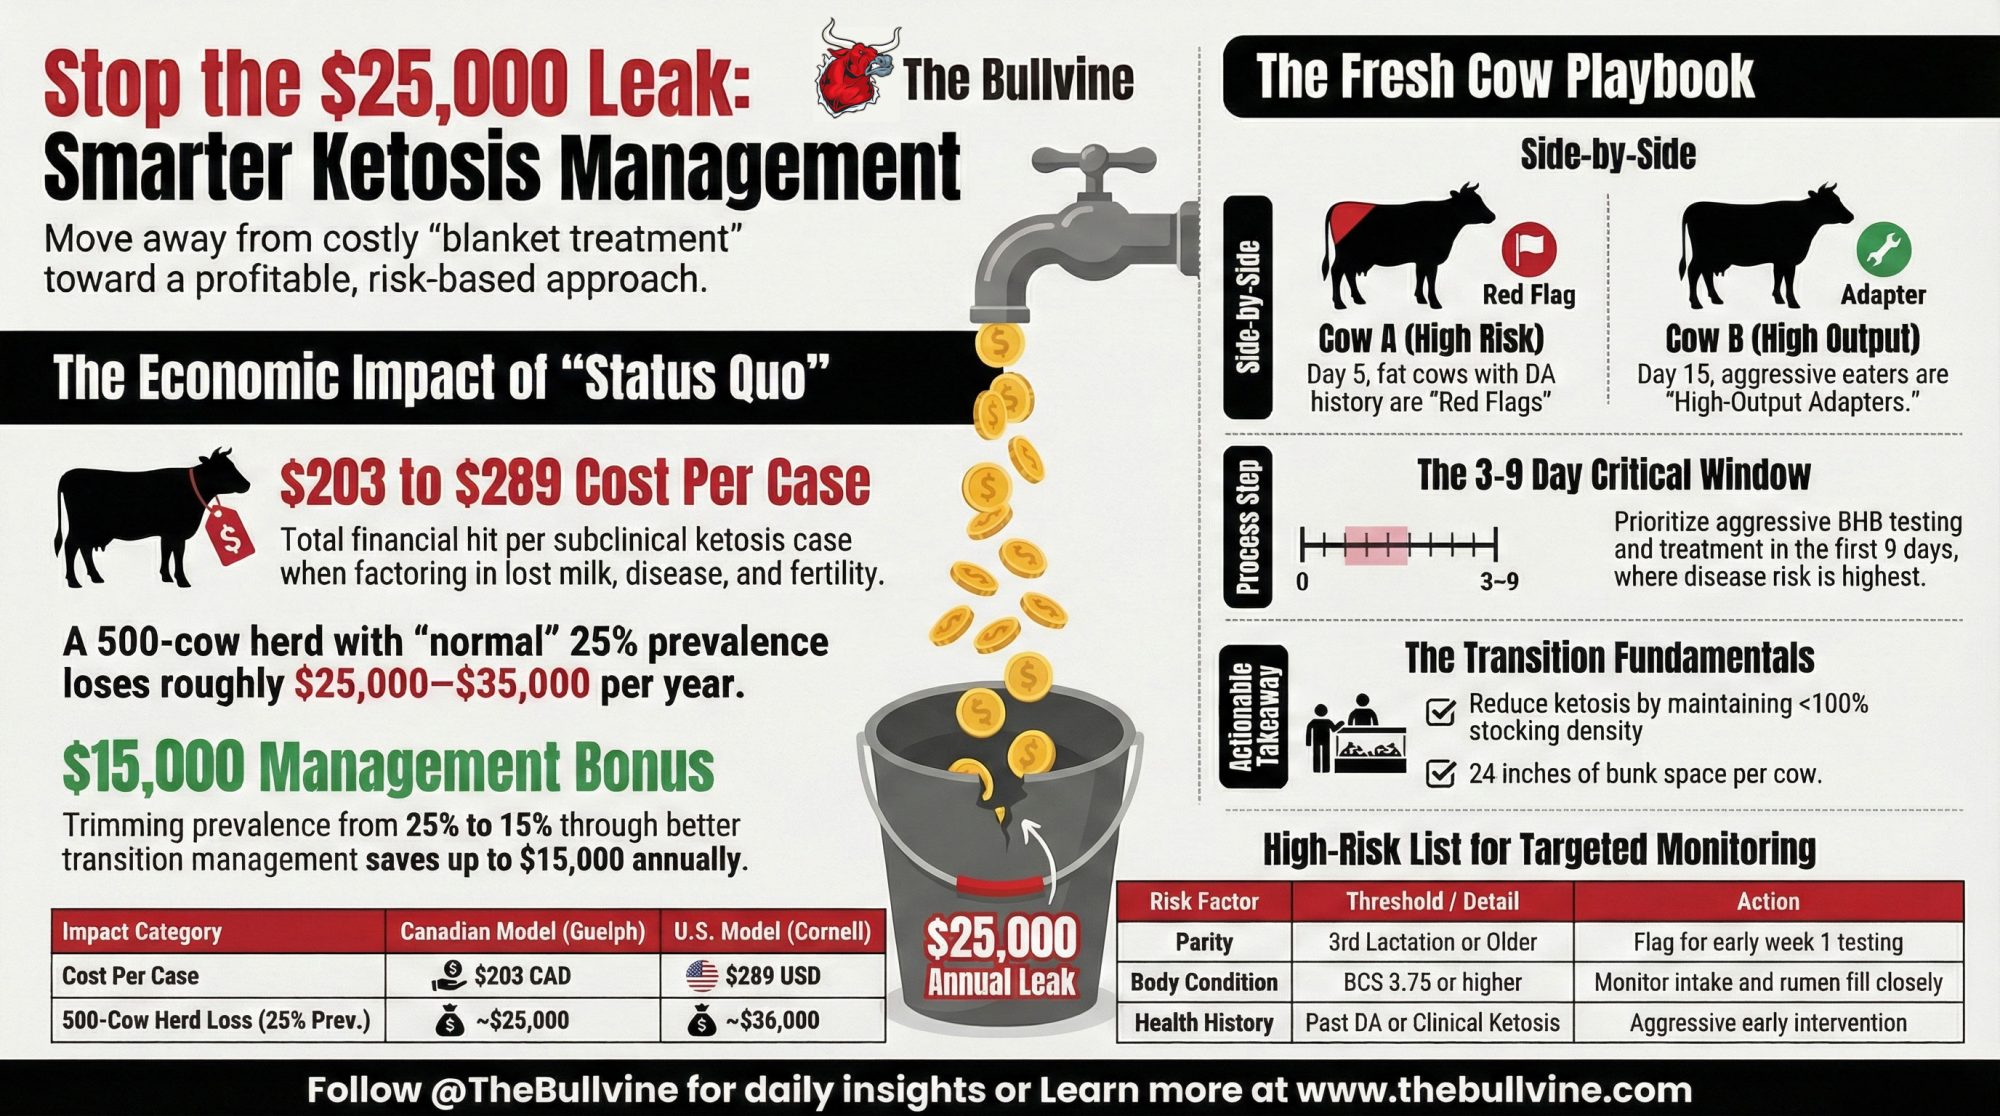
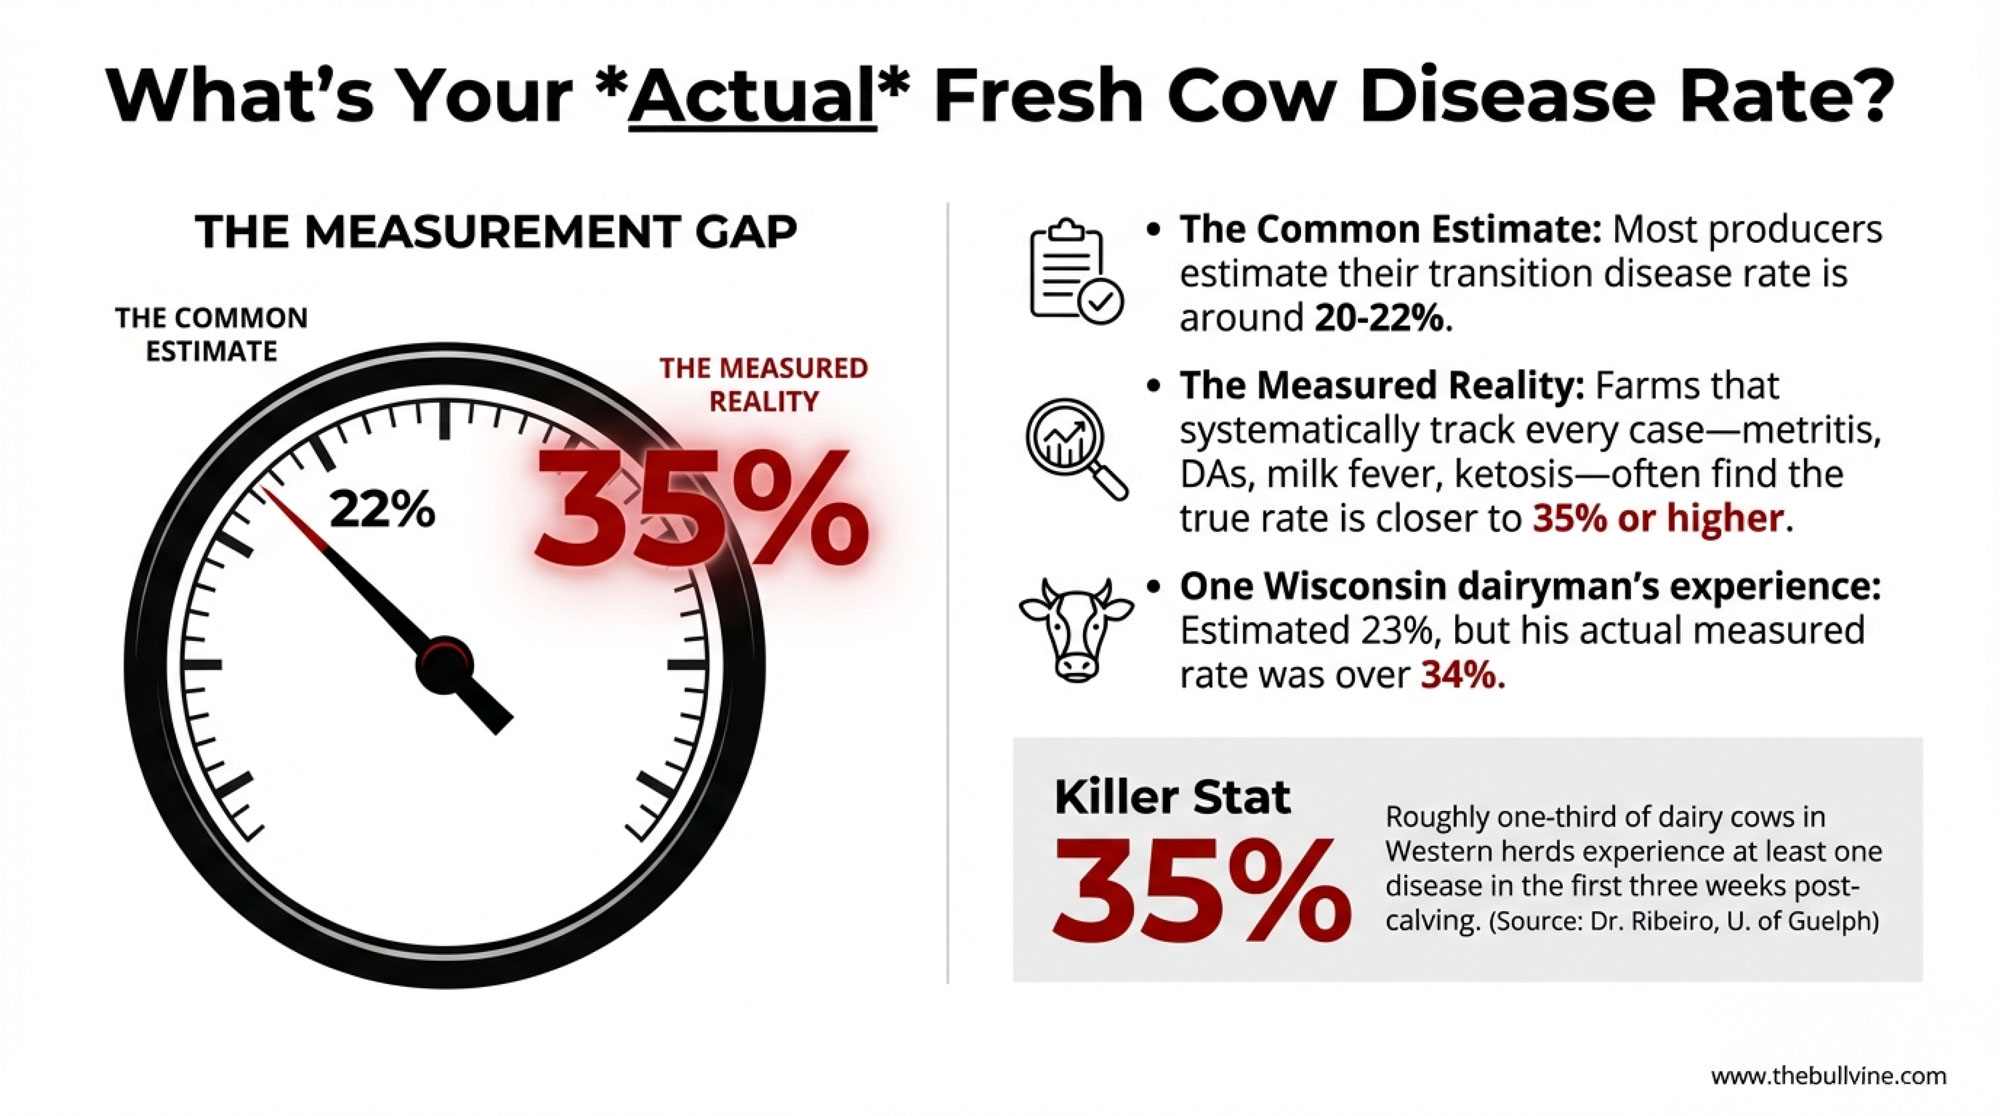
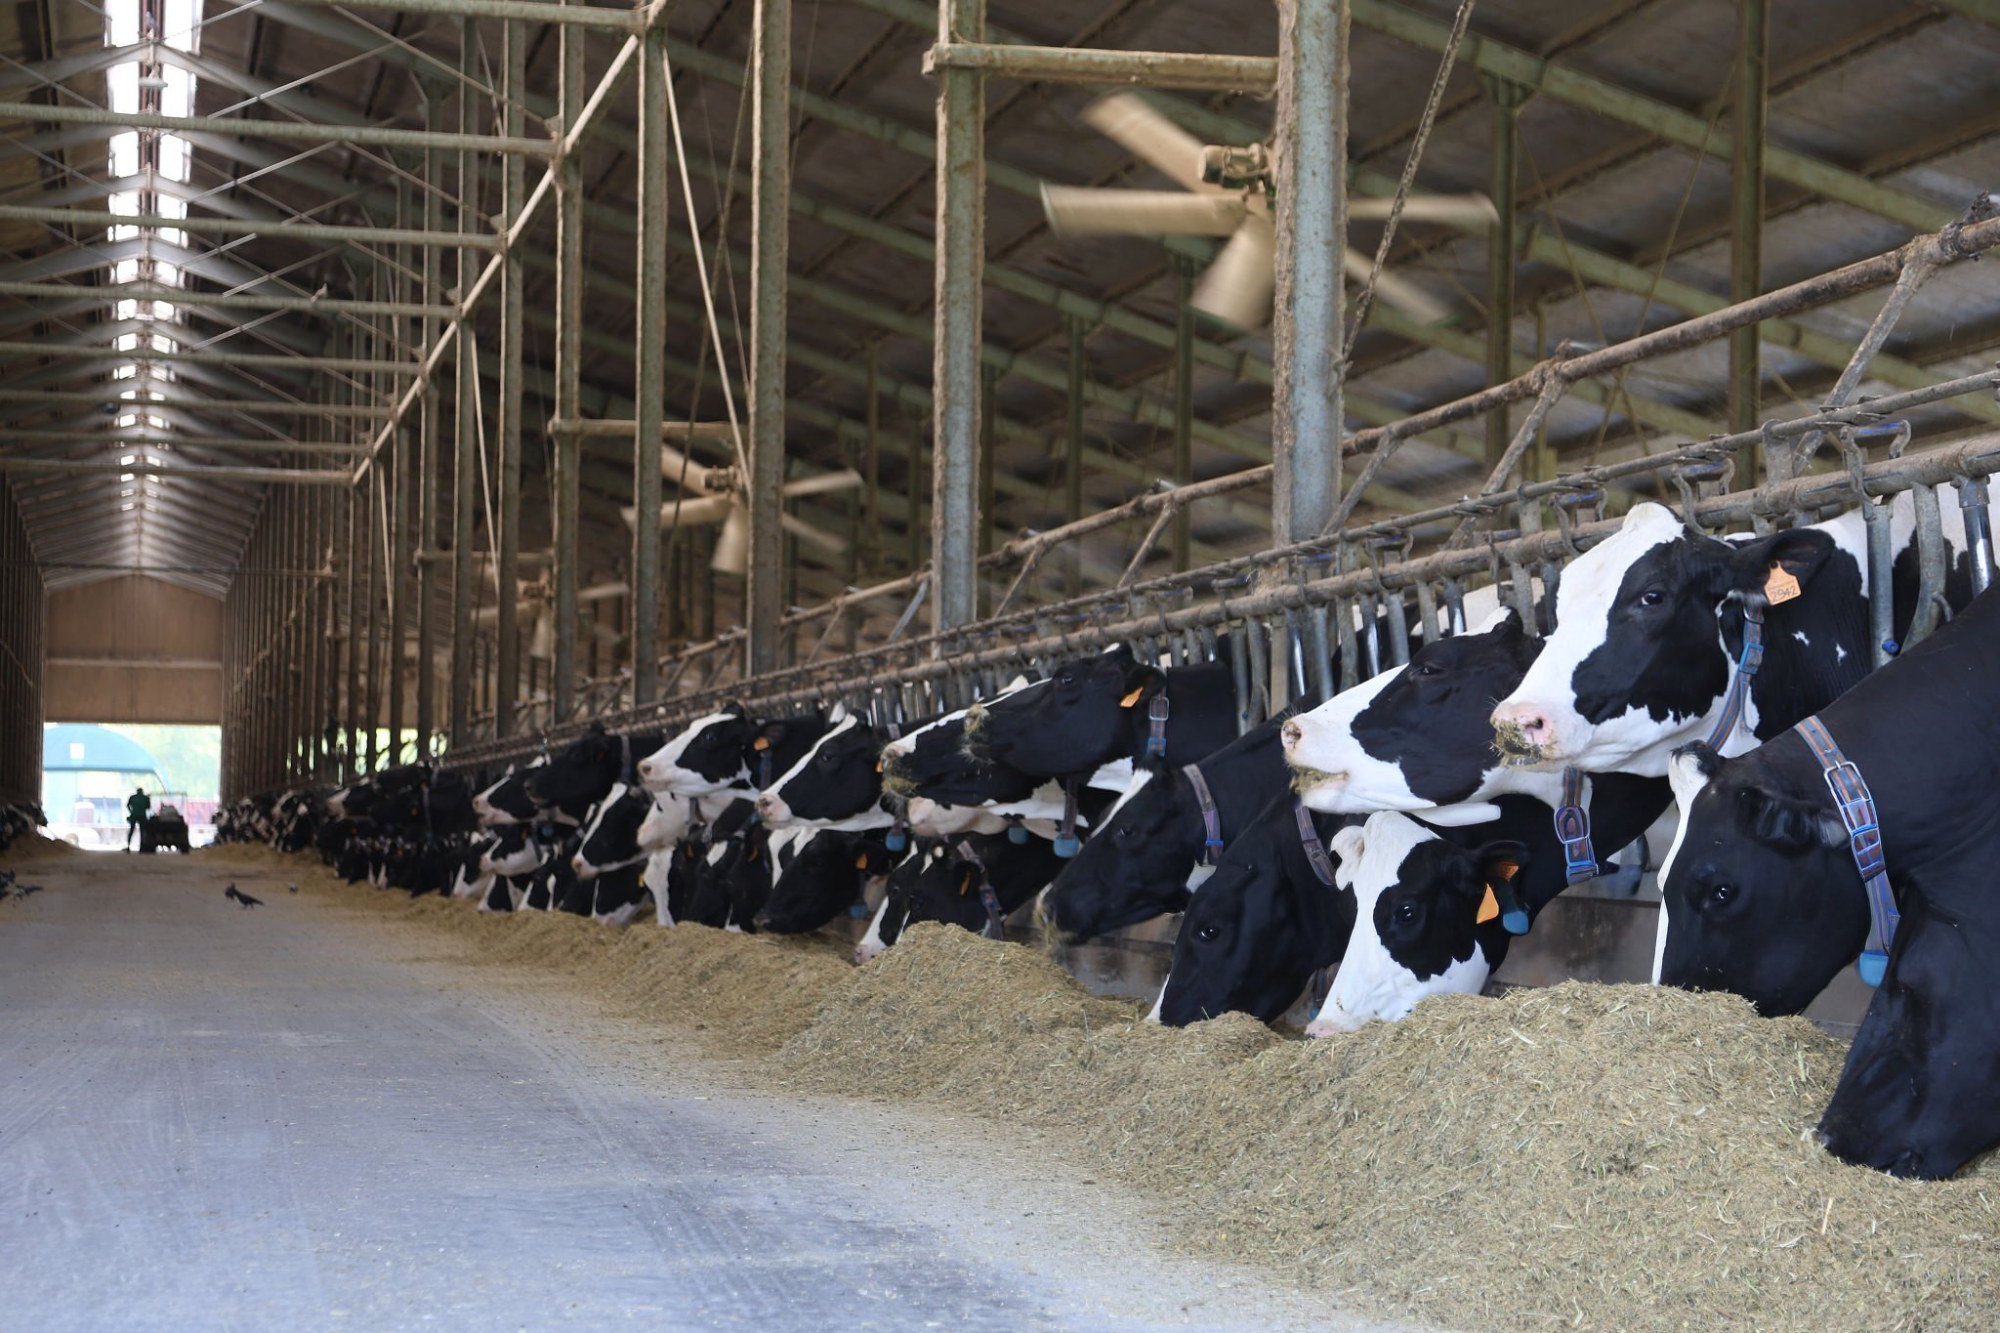
Right now, a lot of transition cows are putting more fat into their livers than those livers were ever designed to handle. In a typical high‑output Holstein herd, that can easily mean tens of dollars per cow per fresh period in lost milk and quiet metabolic costs. Rumen‑protected choline isn’t a silver bullet, but the newer data say it may be one of the more underused tools we’ve got for that −21 to +21 window.
If you sit in on many nutrition meetings these days, you’ll notice something about rumen‑protected choline. For some folks, it’s still parked in that “fatty liver insurance” category—something you try when cows are too fat, or the fresh pen’s been a headache. For others, especially in higher‑producing Holstein herds, choline is quietly shifting into the “core transition tool” column, because early‑lactation cows are presumed not to synthesize enough phosphatidylcholine to match the fat they’re mobilizing, as a 2016 transition‑cow review in PLOS ONE and a 2024 trial in Animals both point out when they look at post‑ruminal choline supply.
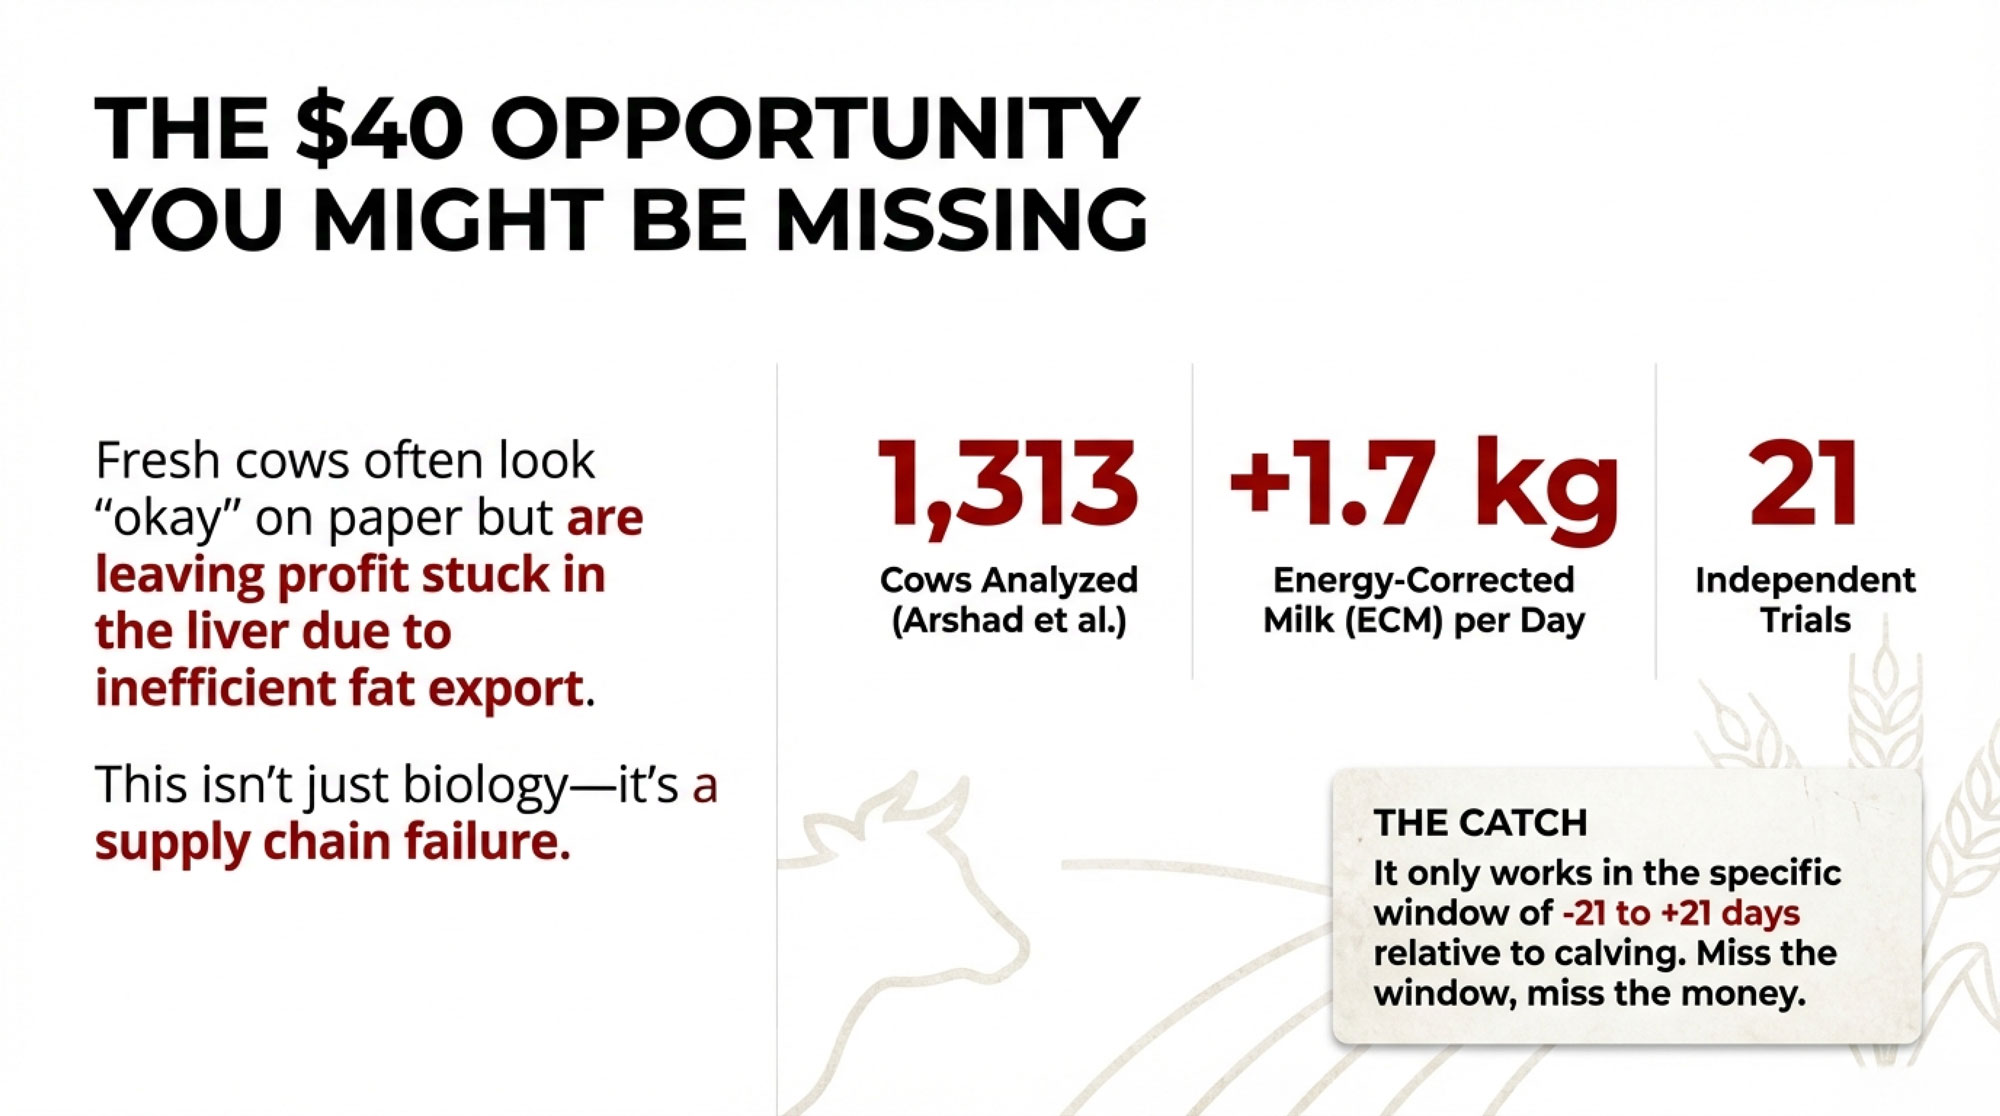
What’s interesting here is that glossy marketing pieces aren’t driving this shift. It’s coming from liver biopsies, blood samples, and some very solid meta‑analyses. A 2020 meta‑analysis in the Journal of Dairy Science, led by Arshad and colleagues, pulled together 21 experiments with 1,313 prepartum cows and found consistent effects of rumen‑protected choline on milk and energy‑corrected milk, especially around a specific dose range. A 2019 MDPI meta‑analysis reached similar conclusions about milk response while noting that health outcomes were more variable, which aligns with what many of us see in the field. A 2023 PLOS ONE paper on dose‑dependent choline effects in Holsteins showed clear changes in liver fat and glycogen when cows were put under feed restriction. And a 2024 Animals paper by Humer and co‑authors reported that a well‑protected choline program improved both metabolism and lactation performance in commercial‑type settings.
When you take those milk responses and health shifts and plug them into typical component‑based pay programs—using the same economic logic extension folks apply when they model ECM value and disease costs—it’s easy to end up with returns in the “tens of dollars per cow” range per transition. That’s before you start putting dollar values on displaced abomasums you didn’t have to fix or fresh cows you didn’t have to cull early.
So let’s walk through what the data actually say and how that lines up with what many of us are seeing in barns—from freestall herds in the Midwest and Ontario to dry lot systems in the U.S. West and high‑output Holstein herds across western Europe and seasonal systems in New Zealand and Ireland.
Looking at This Trend: A Liver Built for a Different Cow
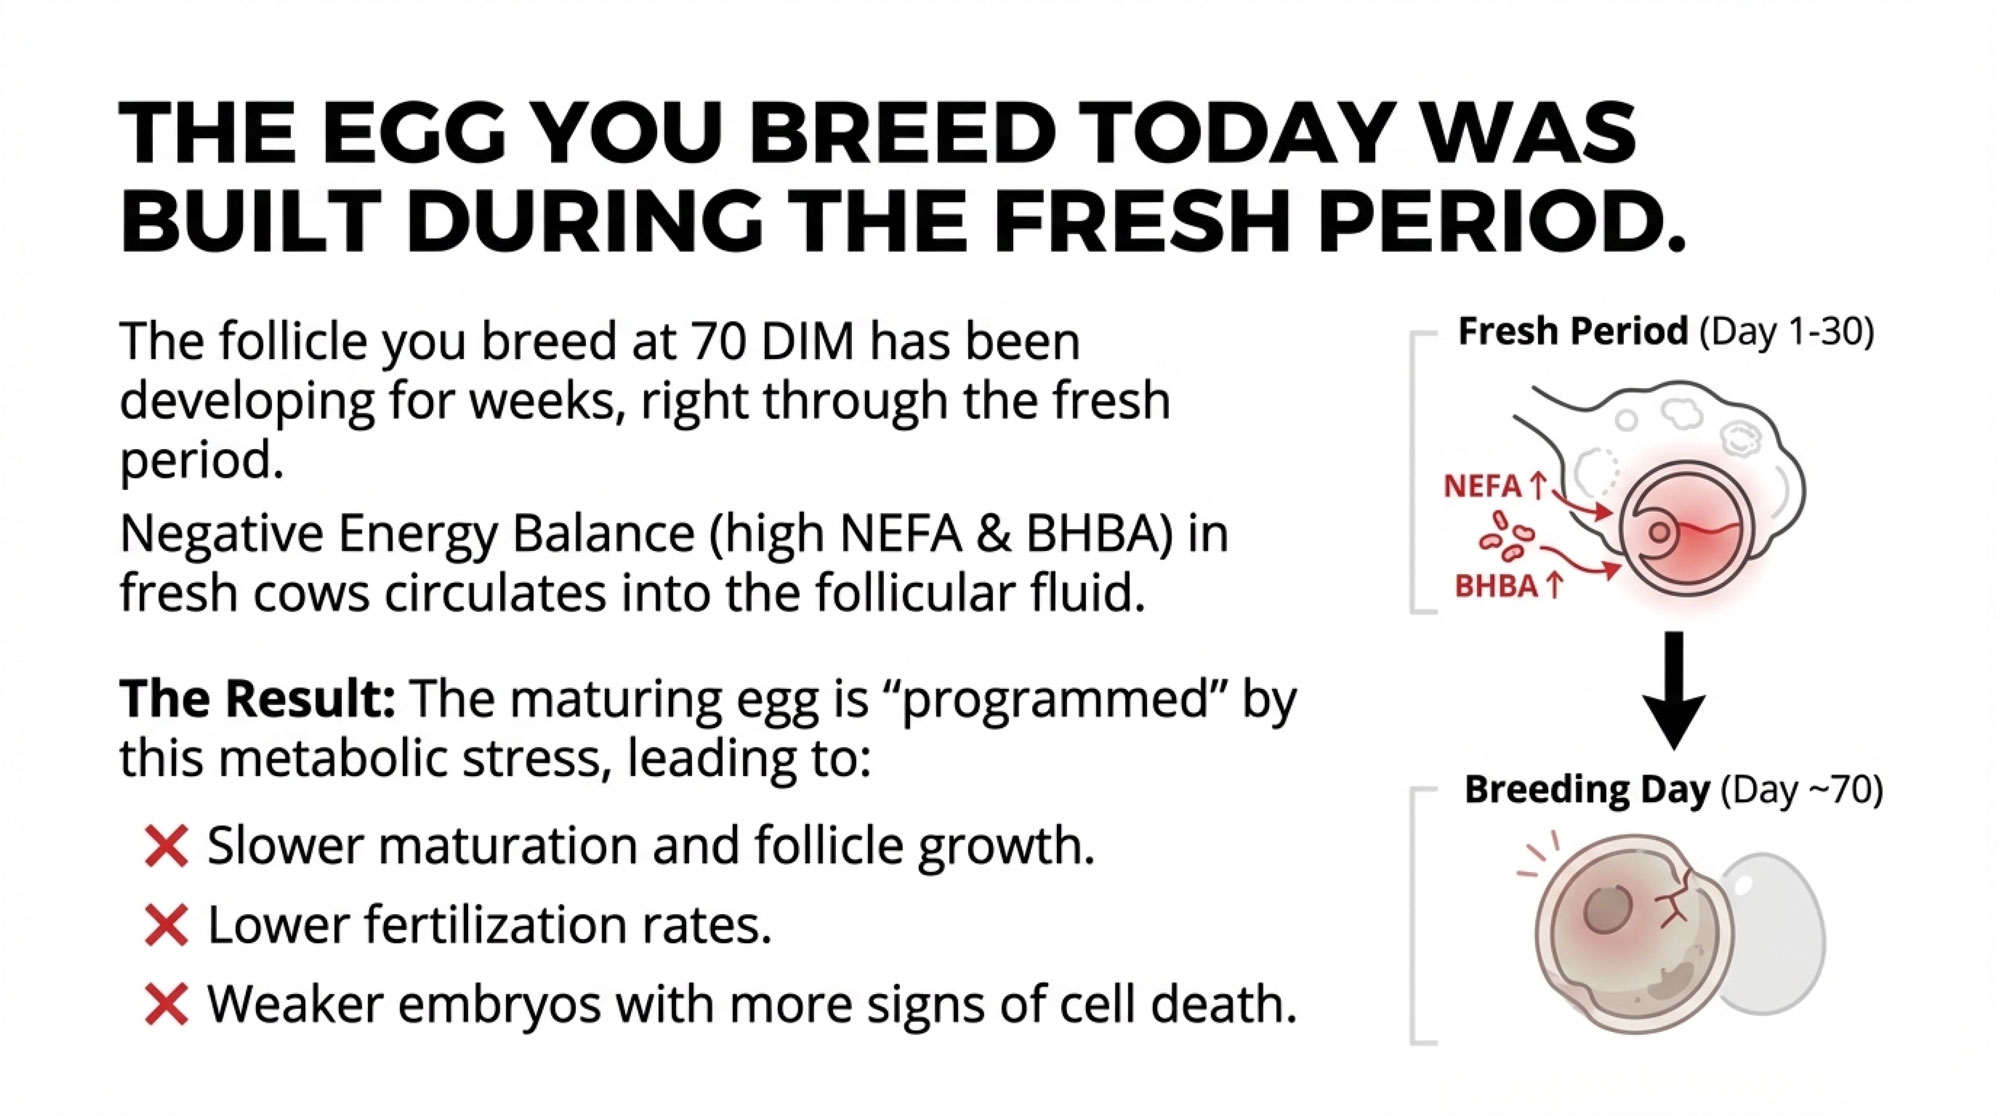
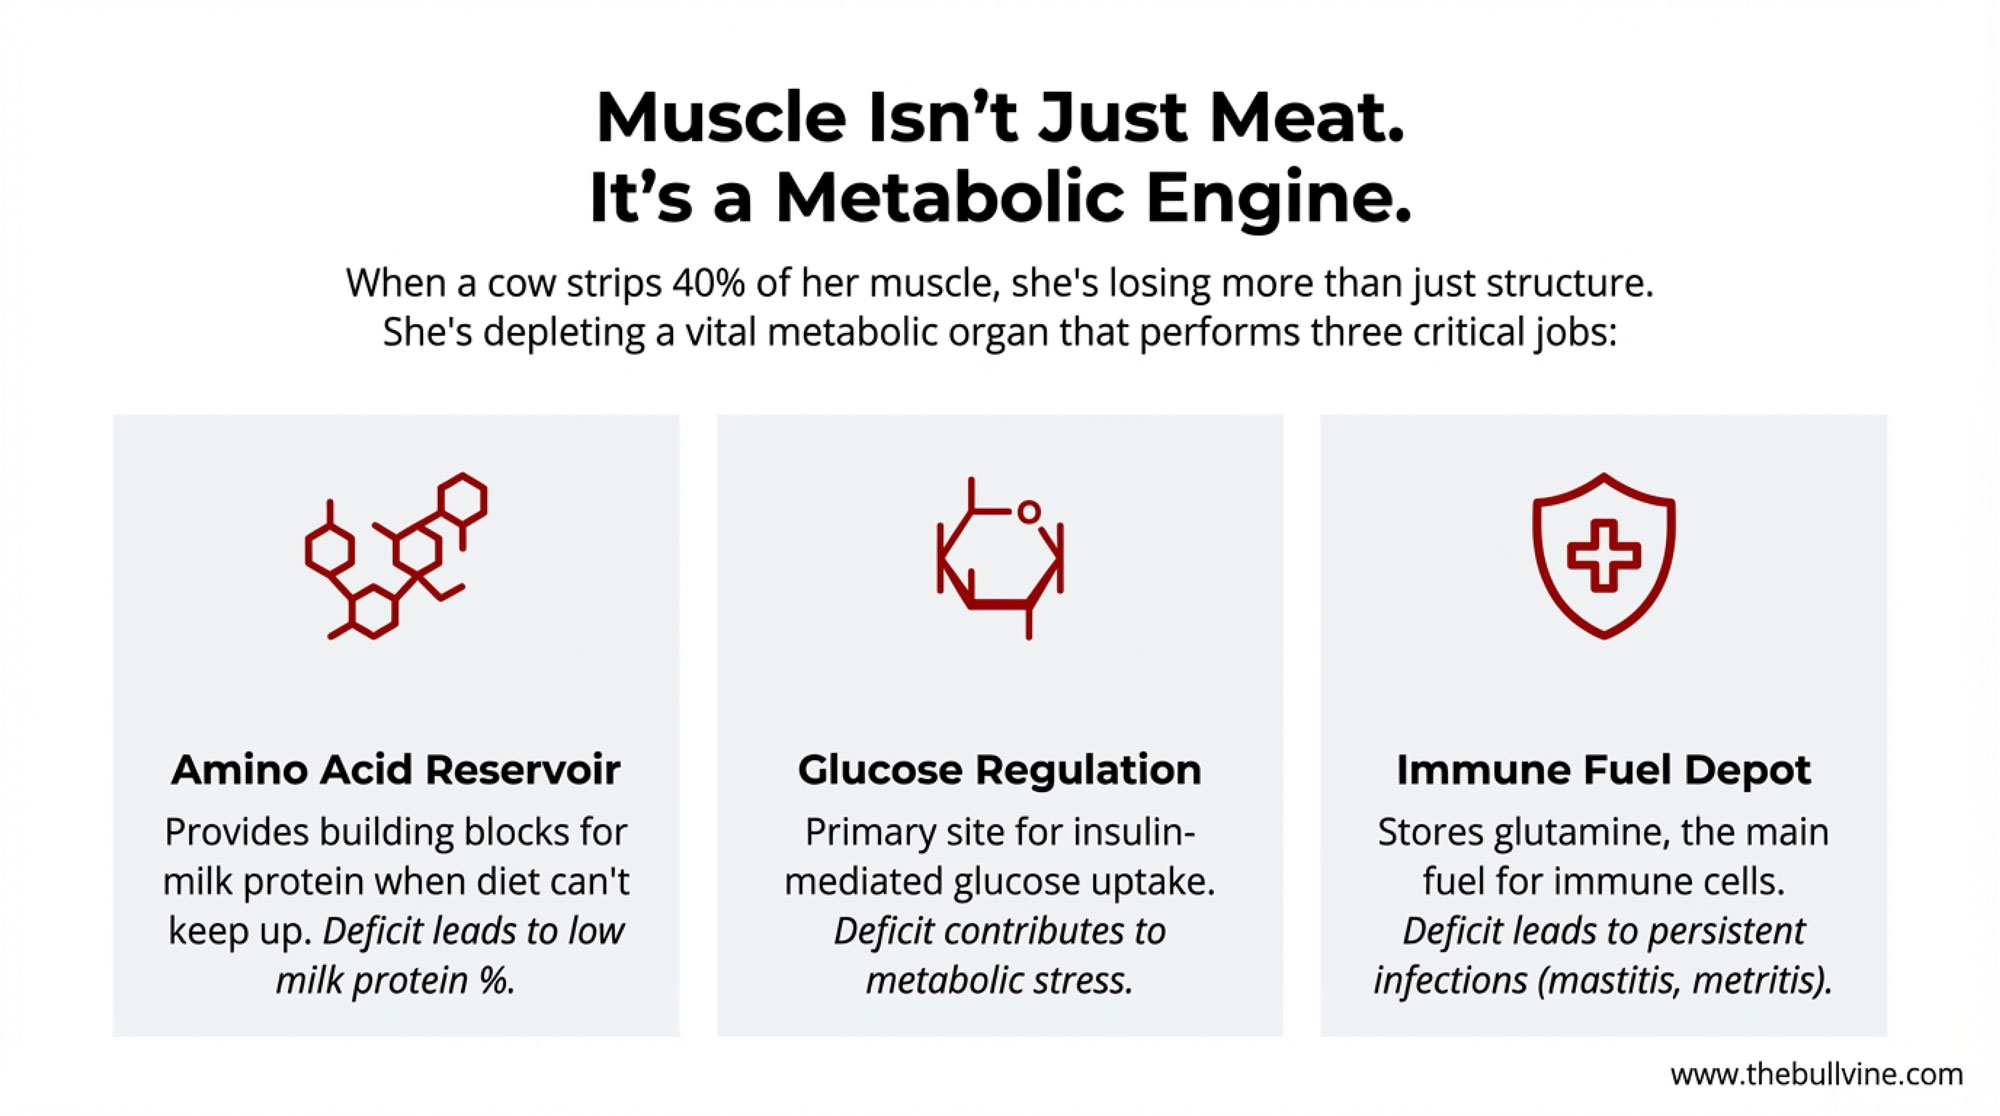
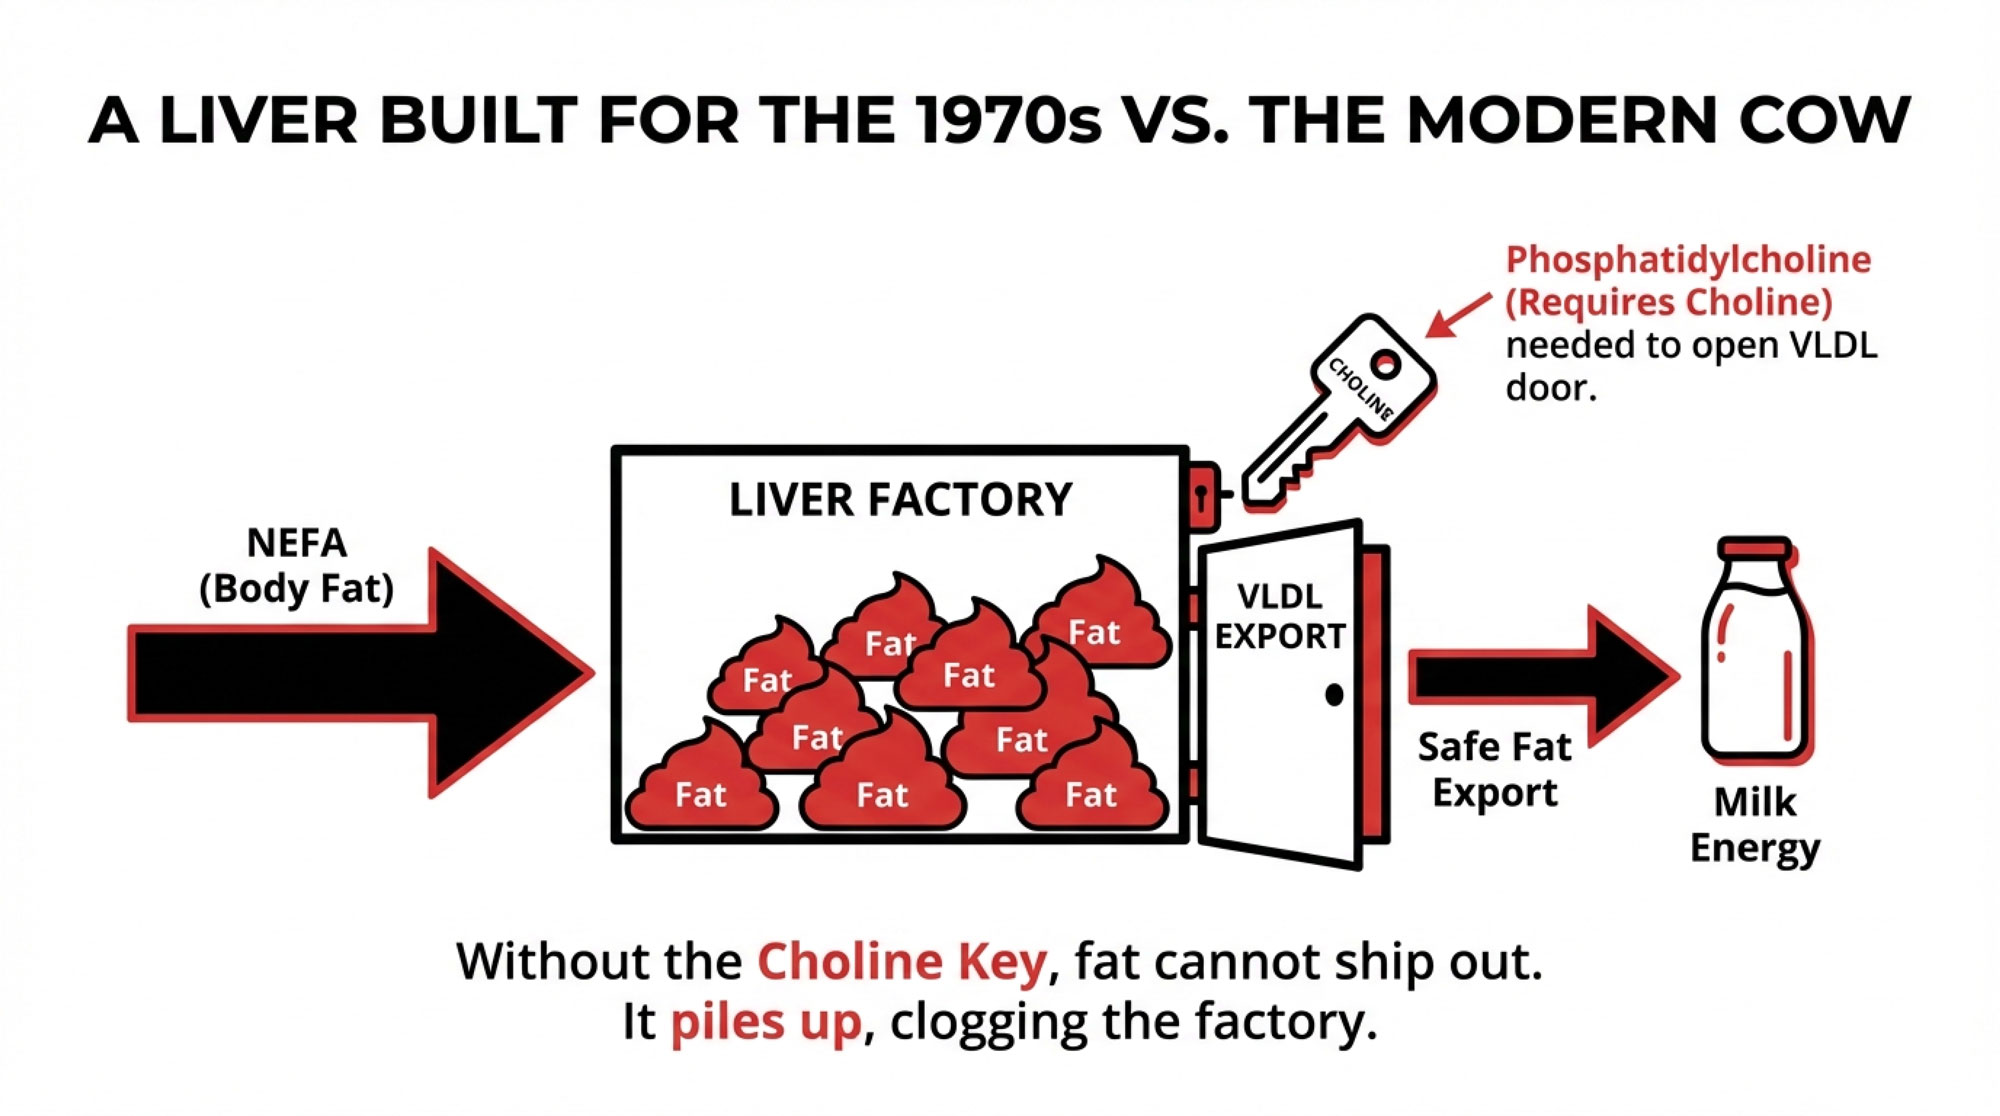
You probably know this already, but it’s worth putting right on the table. When a cow freshens, she mobilizes body fat to fuel milk production. Those non‑esterified fatty acids—NEFA—head straight to the liver. From there, the liver has three main options: burn those fats for energy, convert some into ketone bodies, or package them into very‑low‑density lipoproteins (VLDL) and ship that fat back out into circulation.
That last route—exporting fat as VLDL—is the safest one for the liver if you want to avoid fat build‑up. To build VLDL, the liver needs phosphatidylcholine, and phosphatidylcholine depends heavily on choline, either from the diet or from methylation pathways in the liver. If choline is tight, the liver can still assemble triglyceride, but it struggles to export it. Fat starts piling up in liver cells. That’s the fatty liver problem many of us talk about on fresh‑cow rounds.
Now, here’s where the biology bites us a bit. Work summarized in that 2016 transition‑cow review and in a 2016 article on rumen‑protected choline makes it clear that dairy cow livers export VLDL more slowly than many non‑ruminants and are strongly geared toward gluconeogenesis from volatile fatty acids rather than moving large amounts of fat out of the liver. That design made perfect sense when cows were giving far less milk and mobilizing less fat around calving.
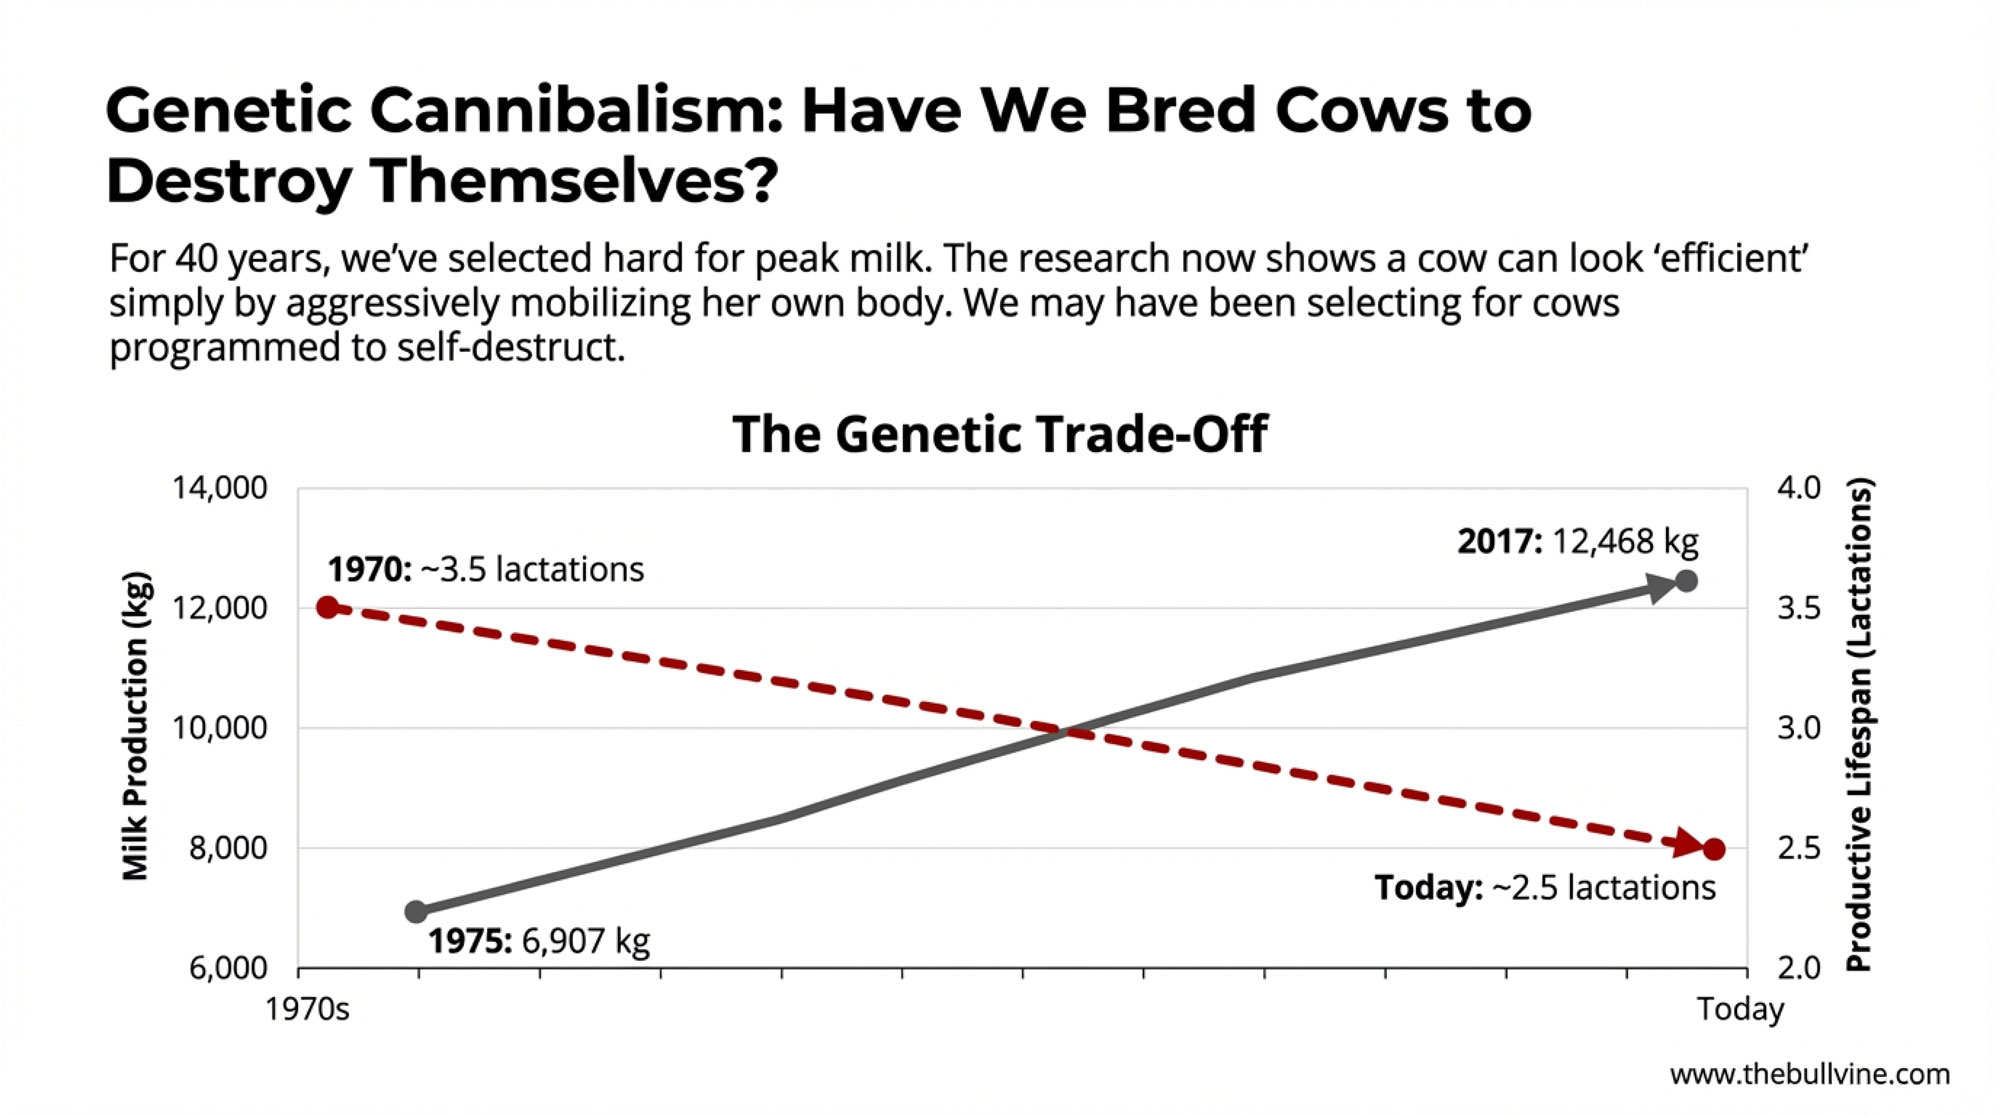
Fast‑forward a few decades. Across North America and western Europe, average Holstein production per cow has roughly doubled since the 1970s, according to USDA and Eurostat data. Many well‑managed Holstein herds now comfortably exceed 10,000 kilograms per cow per year, with some elite herds pushing 11,000–12,000 kilograms. As production has climbed, fat mobilization in early lactation has climbed with it. Reviews on transition‑cow metabolism consistently tie higher NEFA loads and deeper negative energy balance around calving to modern high‑yield cows.
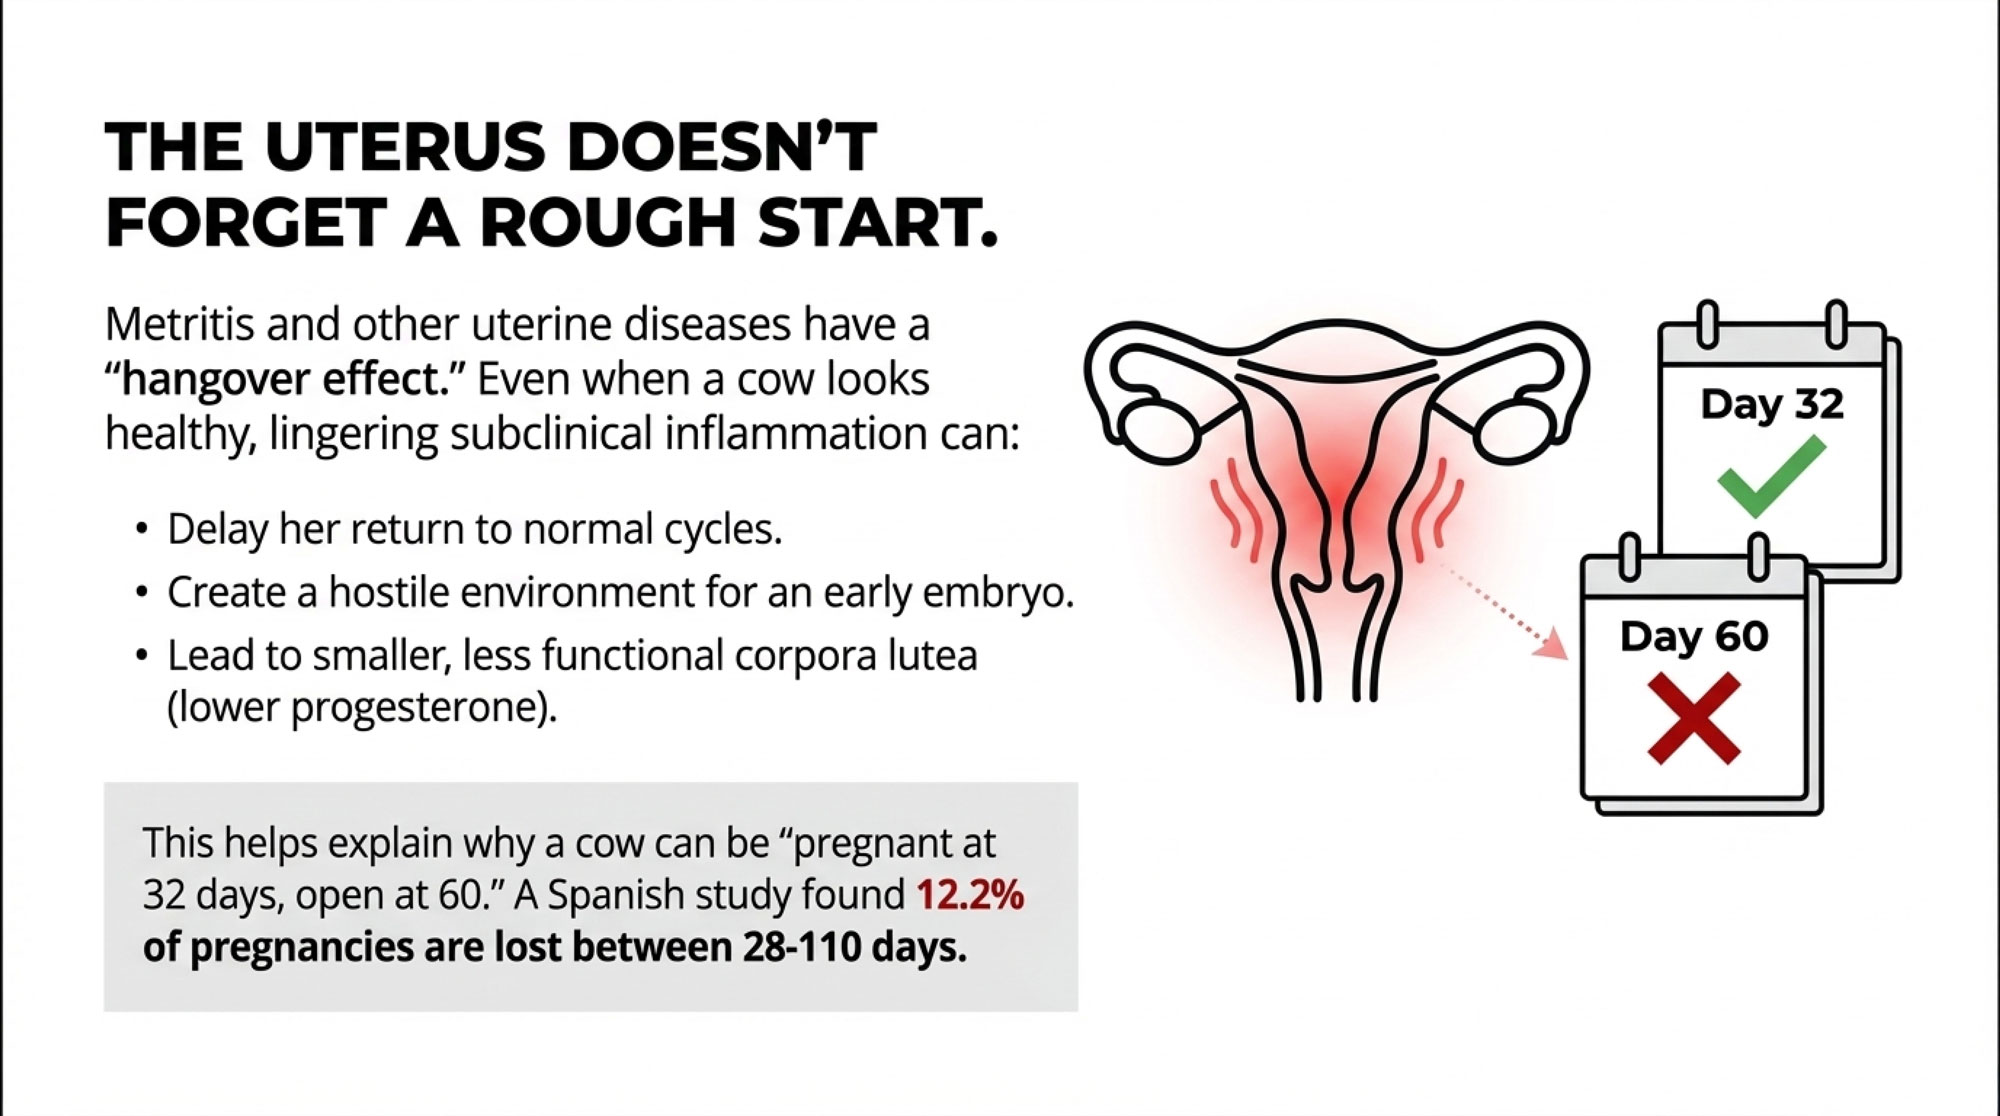
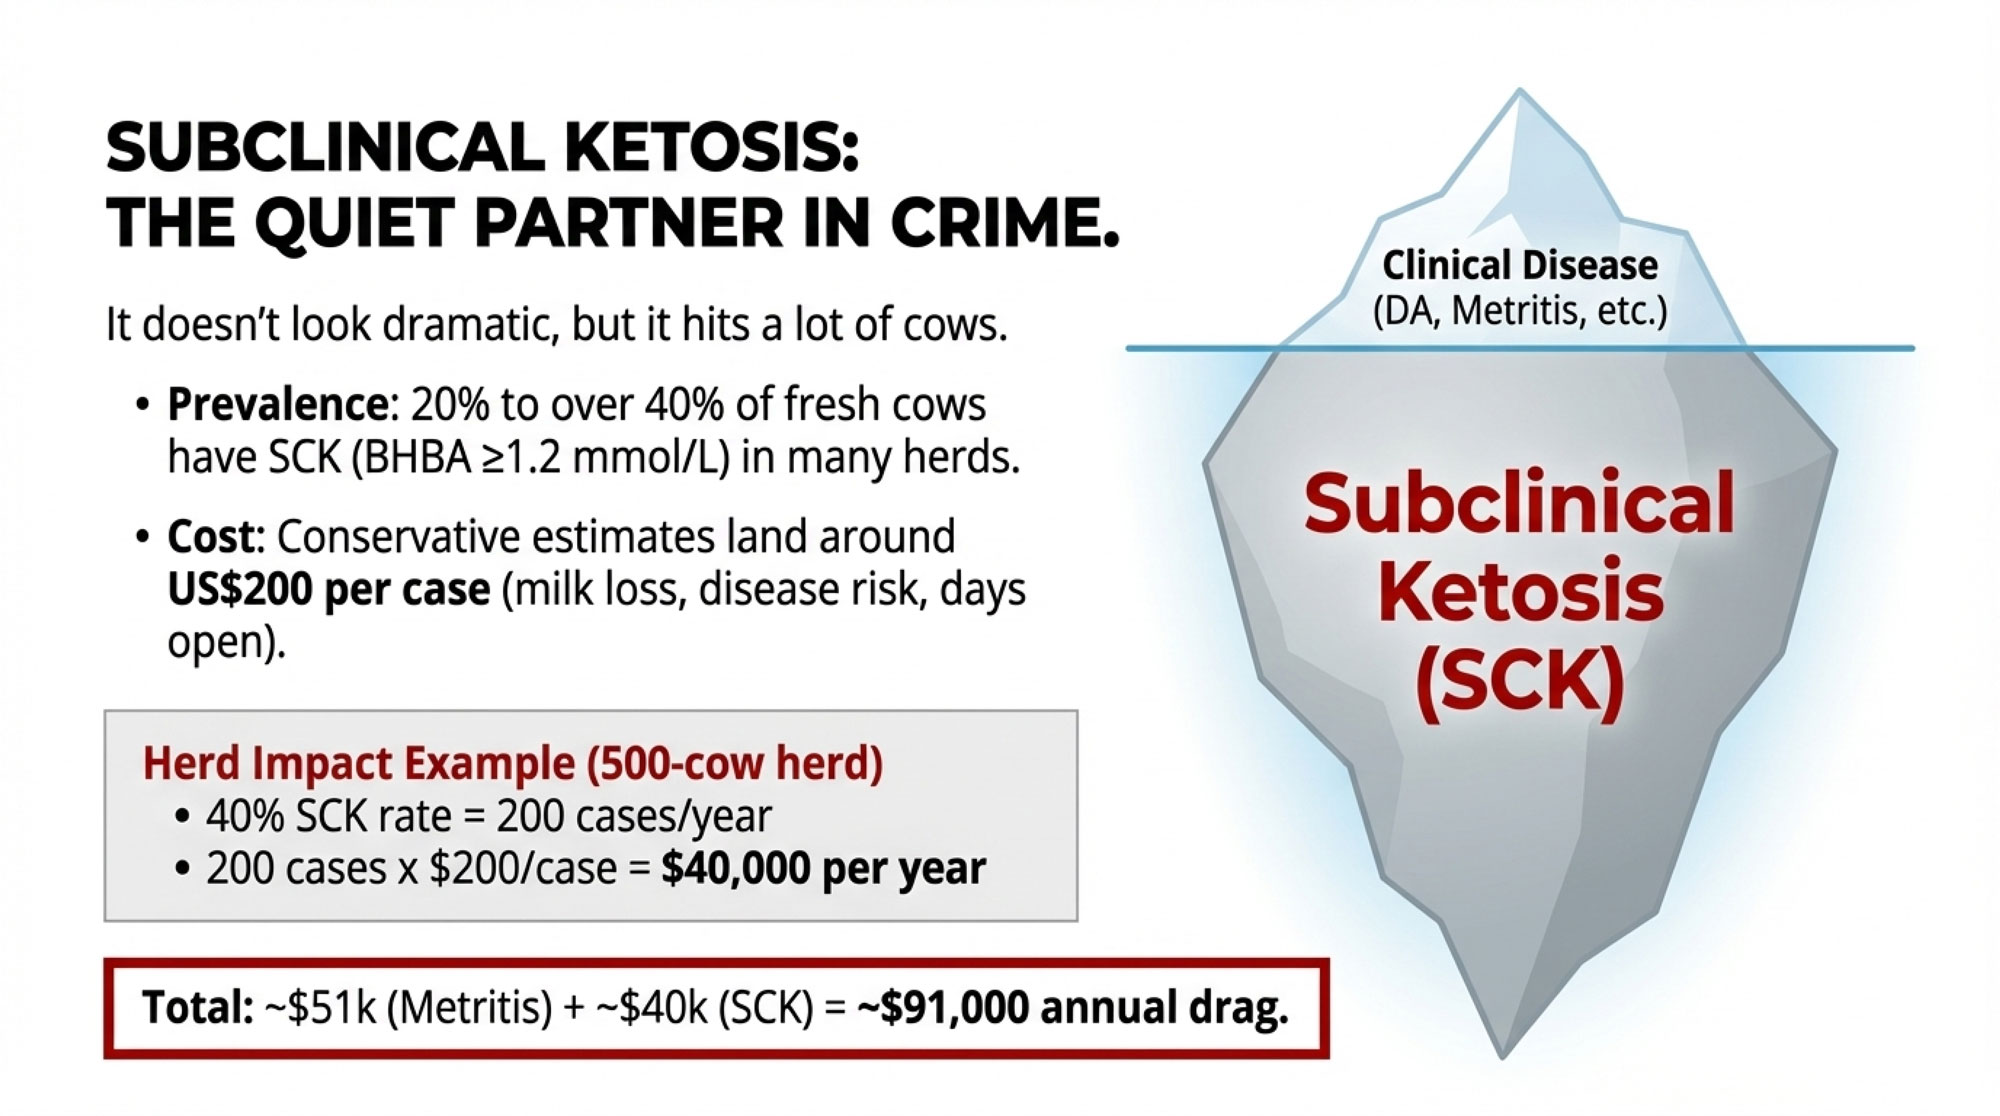
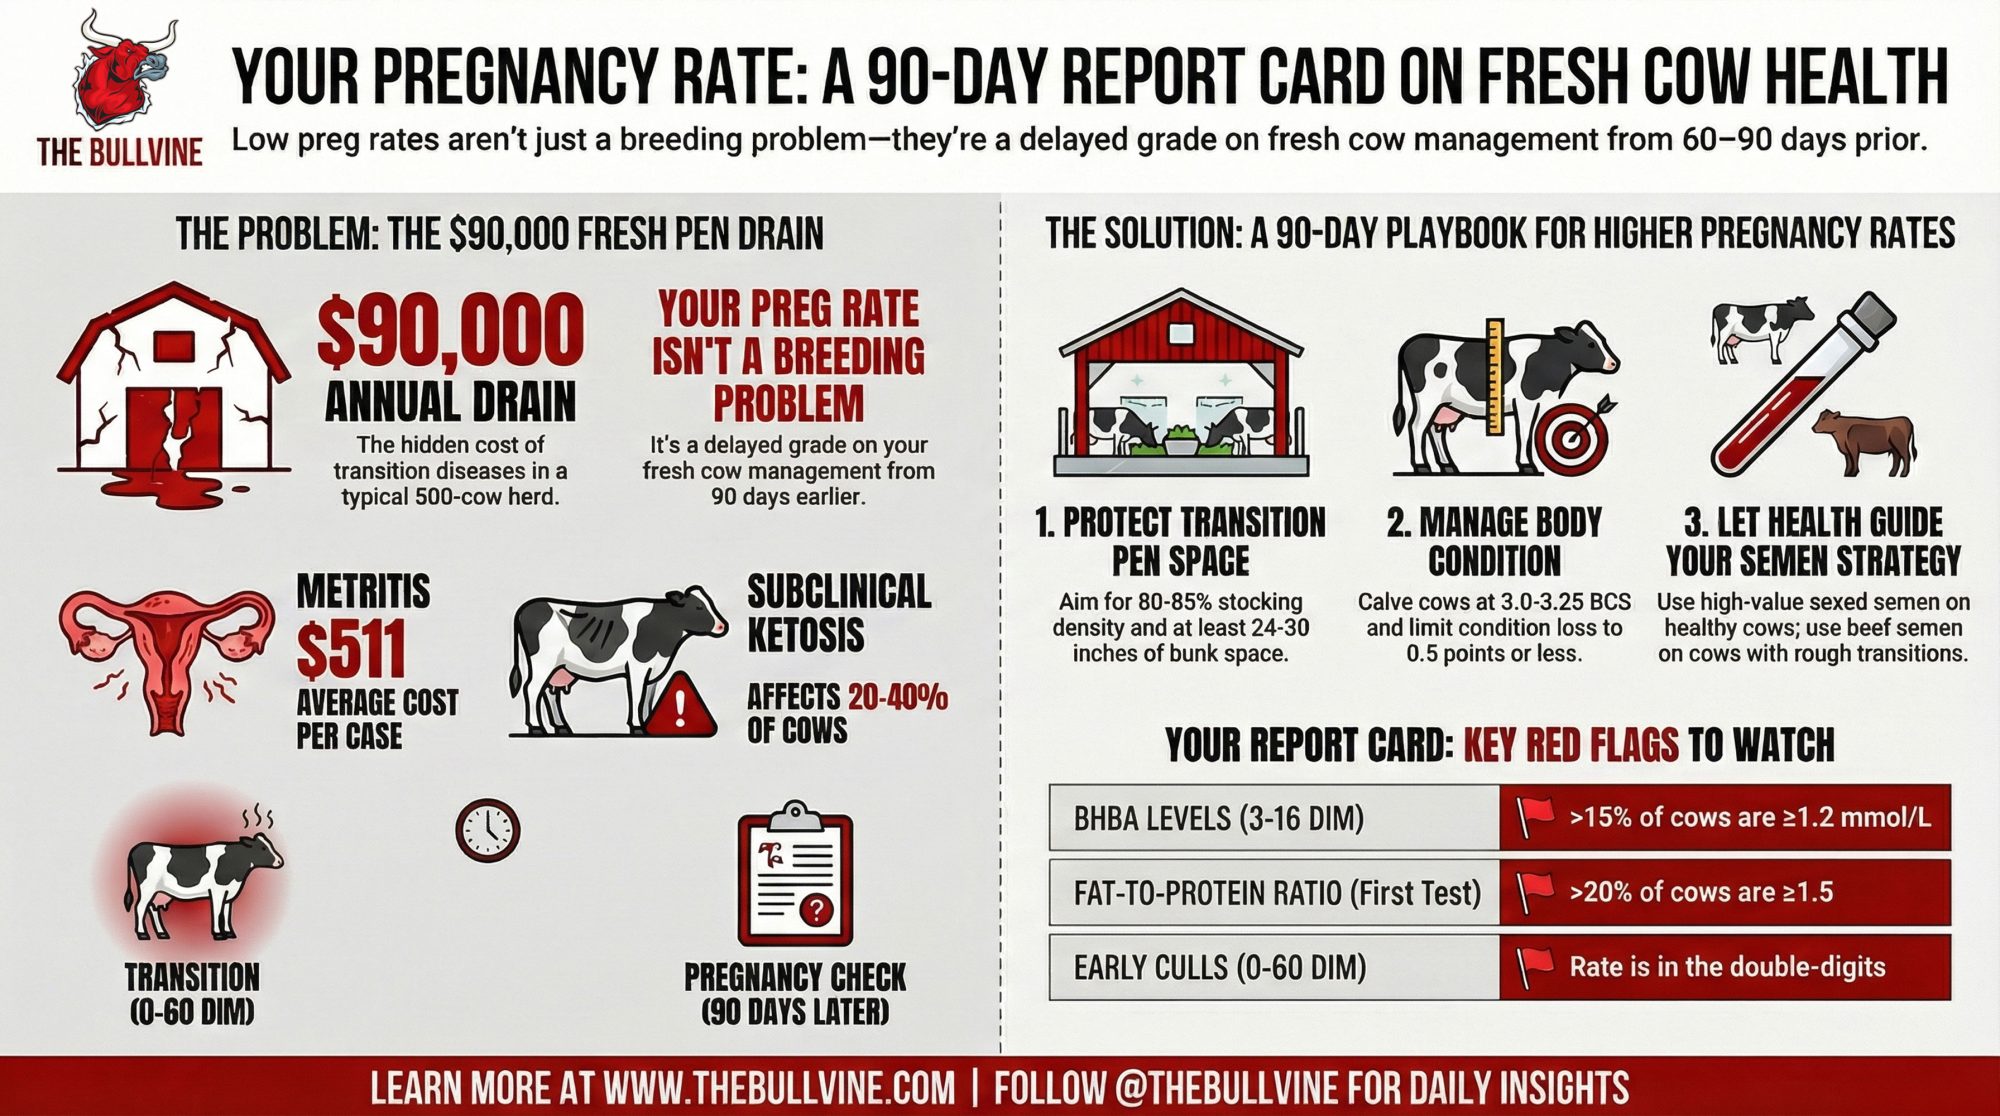
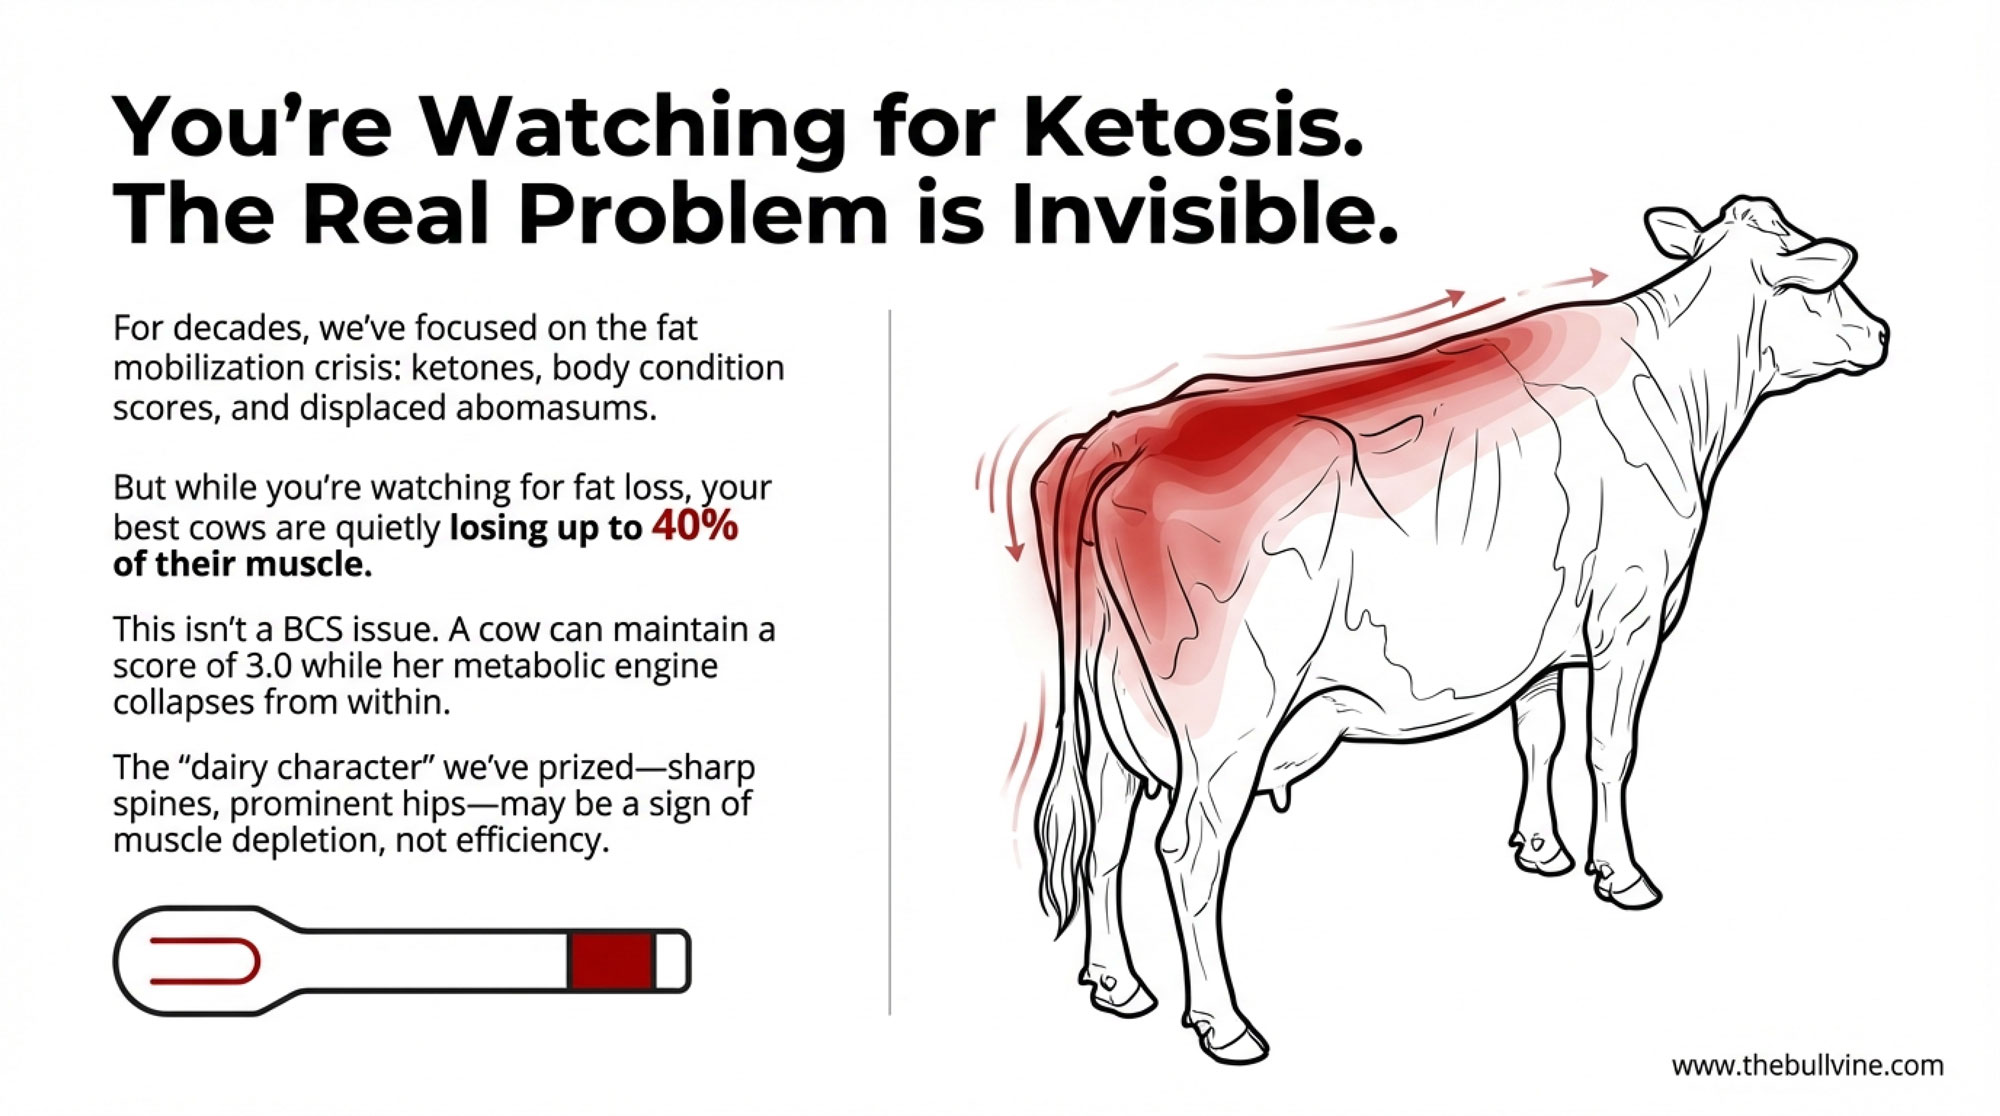
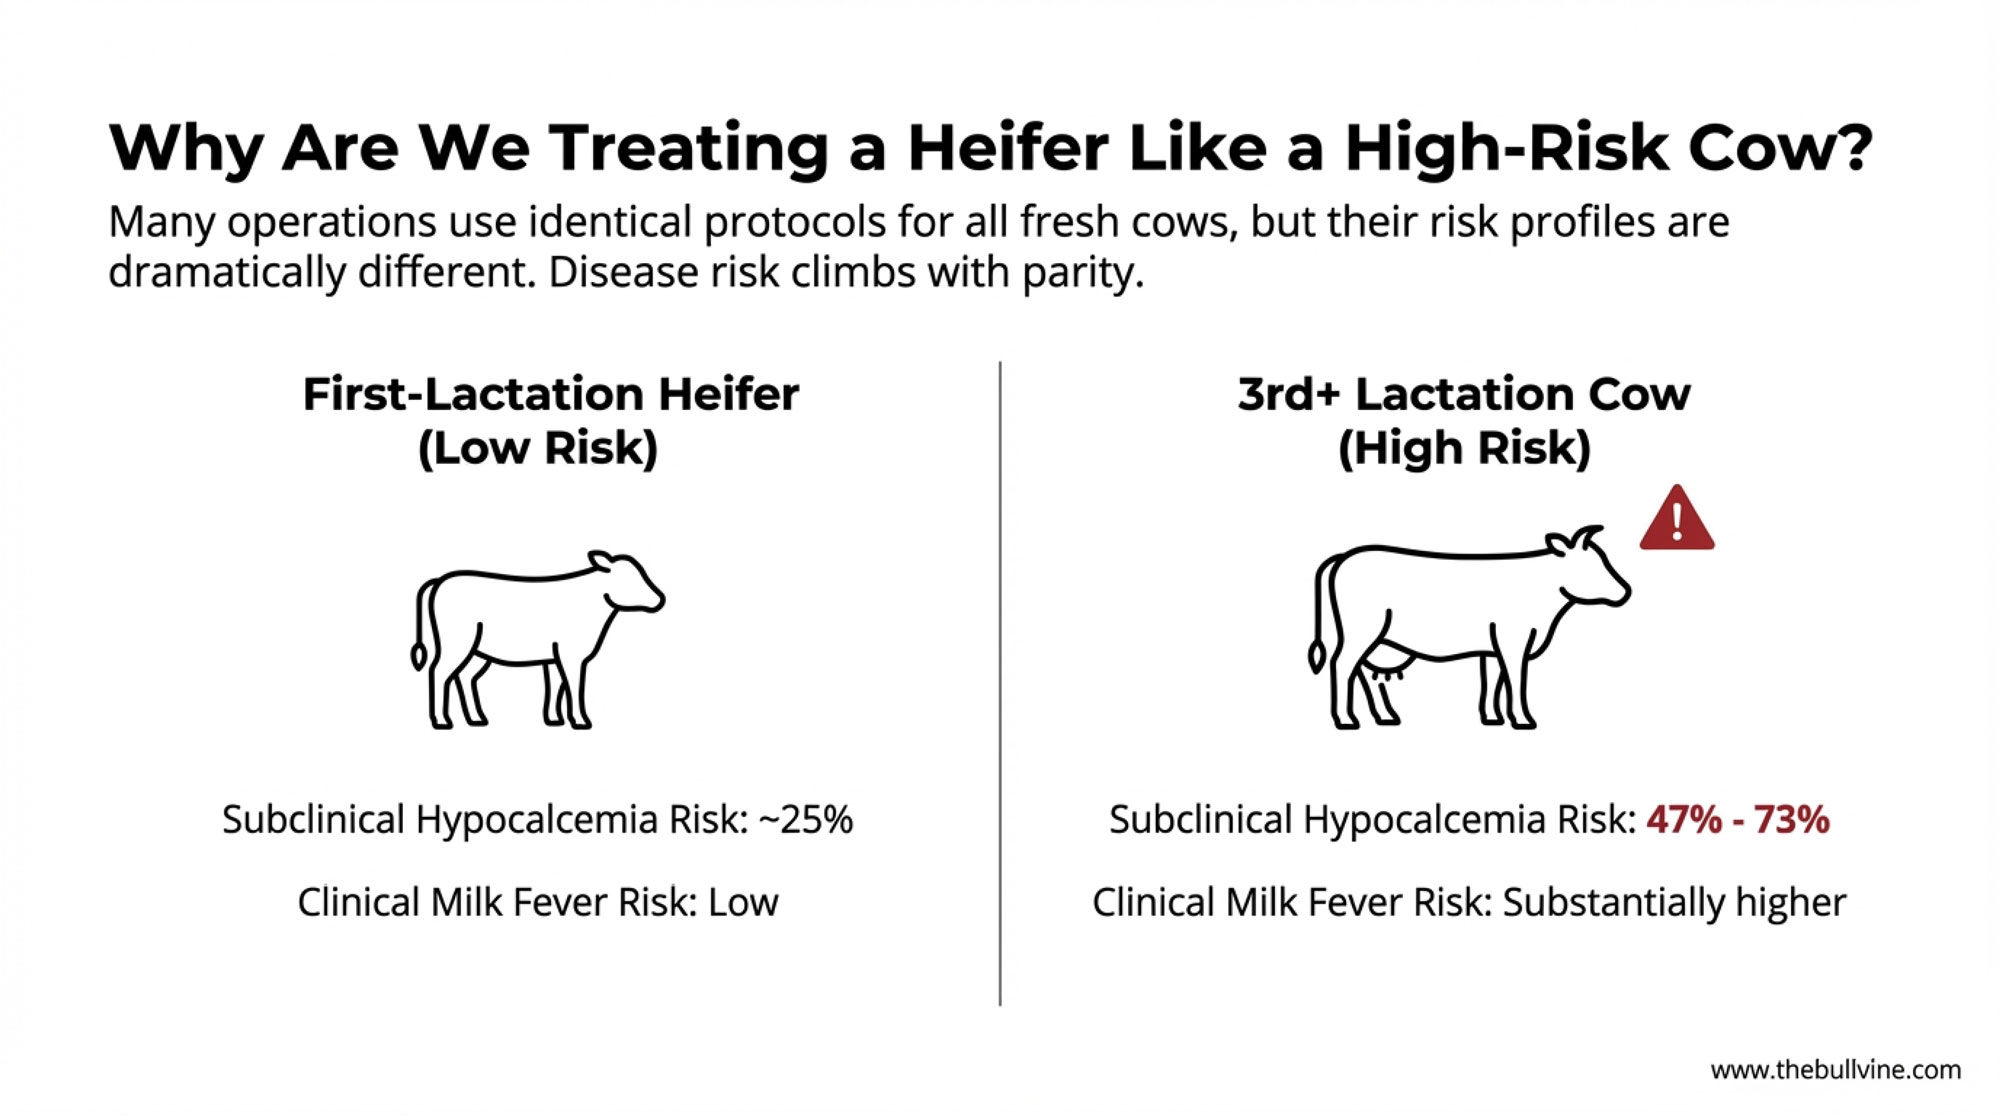
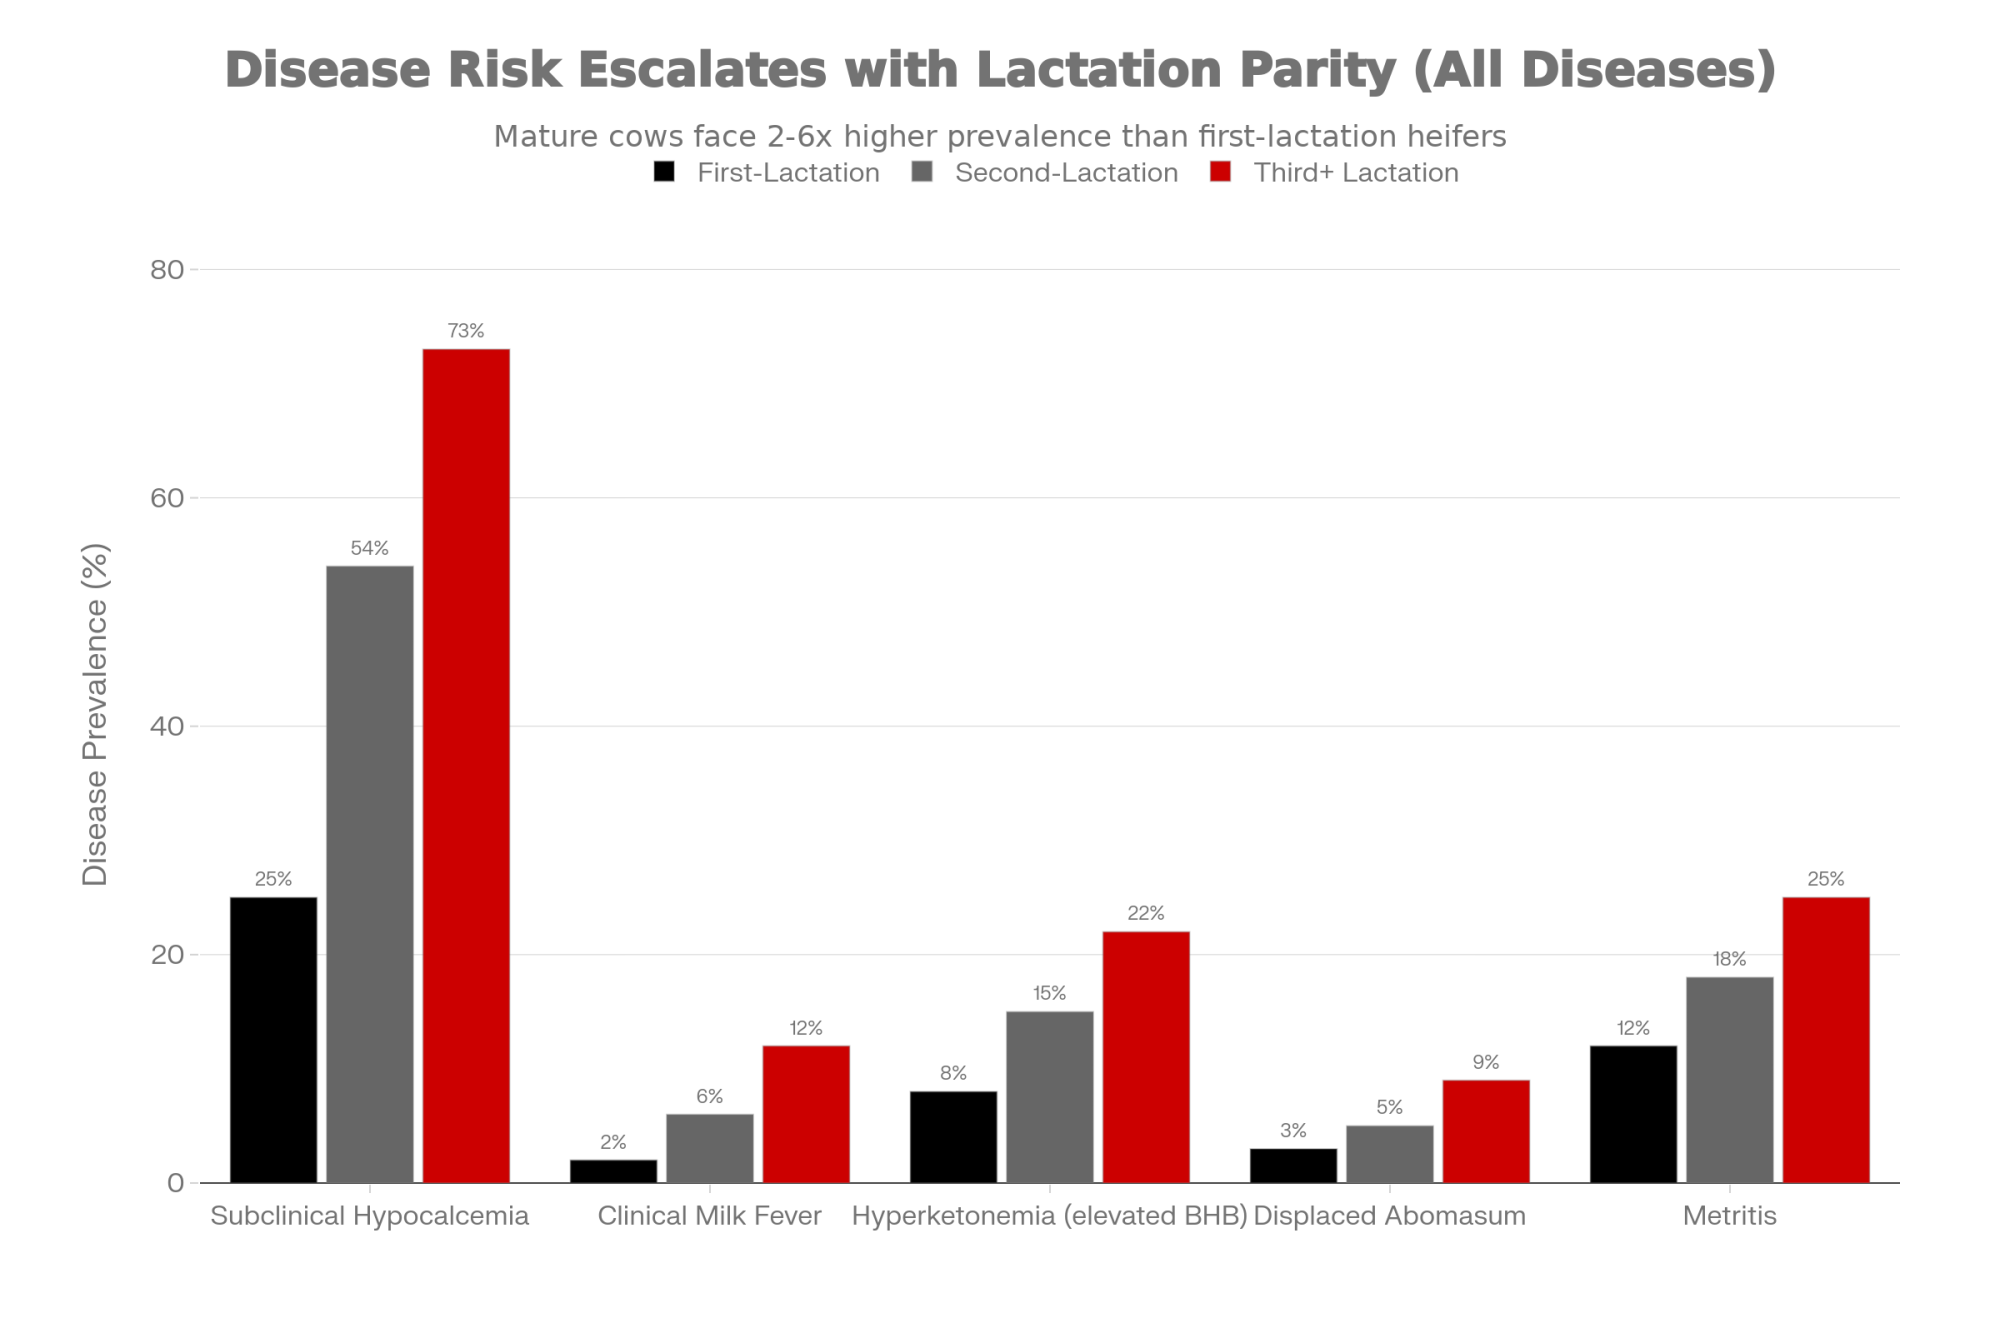
It’s worth noting that necropsy and field work in high‑output herds show that a significant number of early‑lactation cows develop moderate to marked fatty liver, especially when they calve over‑conditioned. Large observational studies summarized by researchers such as Dr. Stephen LeBlanc at the University of Guelph and Dr. Tom Overton at Cornell have linked fatty liver and subclinical ketosis to increased odds of displaced abomasum, metritis, reduced milk yield, and impaired fertility. Many of you have watched that cascade play out: the cow that’s “just a bit slow” after calving, then turns into a DA surgery or a re‑breed project a few weeks later.
When you line those pieces up, the attention on choline starts to make more sense. If the liver’s ability to export fat depends on phosphatidylcholine, and phosphatidylcholine depends on choline, then choline supply can become one of the limiting pieces in today’s transition cows.
What Farmers Are Finding in the New Choline Research
What farmers and advisors are finding is that the rumen‑protected choline story is much clearer now than it was 10 or 15 years ago. Products are better protected, doses are defined, and timing is controlled. That makes it a lot easier to line up the journal data with what you’re seeing on your own DHI printouts and fresh‑cow boards.
Milk and Components: The 12.9‑Gram “Sweet Spot.”
A good place to start is Florida. In work done with high‑producing Holsteins, Zenobi and colleagues at the University of Florida pooled two randomized block experiments with 215 cows. Cows either got no choline or a rumen‑protected choline product (ReaShure®, Balchem) that supplied 12.9 grams per day of choline ion, fed from 21 days before calving to 21 days after calving.


Cows on choline produced, on average, about 1.8 kilograms more milk per day and roughly 1.9 kilograms more energy‑corrected milk per day than controls. They also shipped more milk fat, more protein, and more lactose. That’s not a tiny bump you have to squint at on a herd summary. In many herds, that’s a clear uptick in early‑lactation performance.
What’s interesting here is that pre‑calving body condition score didn’t seem to change the benefit. In those Florida data, prepartum BCS ranged from about 2.7 up over 4.2, and choline‑fed cows out‑produced their controls across that range. That directly challenges the old idea that “choline is only for fat cows.”
A 2024 paper in Animals, led by Humer and colleagues in Europe, followed two large groups—one of multiparous Holsteins and one of heifers—and fed them 12.9 grams per day of choline ion in a rumen‑protected form, starting in the close‑up period and continuing into early lactation. Those choline‑supplemented cows generally produced more fat‑corrected and energy‑corrected milk, and in some groups more milk, than their unsupplemented herdmates. Their metabolic profiles looked better, too, with lower hyperketonemia in certain categories. Cows with higher plasma choline levels soon after calving tended to have lower liver triacylglycerol levels a short time later, suggesting that the ration aligns with what’s actually happening in the liver.
If you zoom out even further, the 2020 Journal of Dairy Science meta‑analysis by Arshad et al. pulled together those Florida experiments and 19 others, covering 1,313 prepartum cows. Doses of rumen‑protected choline ranged from 5.6 to 25.2 grams of choline ion per day, with a median of 12.9 grams. The authors reported average increases of about 1.6 kilograms of milk and 1.7 kilograms of energy‑corrected milk per day at that median dose, with diminishing extra gains at higher levels—particularly when methionine status in the post‑calving diet was already good. A 2025 systematic review and dose‑response meta‑analysis in Journal of Dairy Science Communications has since reinforced that the most efficient dose range for milk response sits in that same low‑teens choline‑ion neighborhood.
So when you hear people talk about “around 13 grams per day of choline ion” as the sweet spot, they aren’t guessing. They’re following where the bulk of the controlled studies and meta‑analyses say the most consistent milk and ECM responses live.
Inside the Liver: Dose‑Dependent Effects Under Stress
On the liver side, a 2023 paper in PLOS ONE by Arshad and co‑authors has turned into a touchstone. They took dry pregnant Holstein cows, put them into a controlled fatty‑liver model, and fed rumen‑protected choline at 0, 6.45, 12.90, 19.35, or 25.80 grams per day of choline ion. Cows were fed ad libitum for 5 days, then restricted to 30% of their energy requirement for lactation from day 6 to 14 to create a metabolic pinch.
During that restriction period, cows receiving rumen‑protected choline had about 28.5% less hepatic triacylglycerol and about 26.1% more hepatic glycogen than cows that received no choline. Liver triglyceride concentrations declined linearly as the choline dose increased. Expression of genes involved in choline and phosphatidylcholine synthesis and apolipoprotein production went up, while genes tied to fat synthesis and inflammation went down.
In plain terms: when those cows were pushed toward fatty liver, more choline in a protected form meant less fat stuck in the liver and better support for glucose production and fat export when the cows were under pressure.
Other trials—such as the “Regulation of Nutritional Metabolism in Transition Dairy Cows” work and more recent nutrigenomic studies—have shown that supplementing rumen‑protected choline, sometimes along with rumen‑protected methionine, can reduce blood NEFA and β‑hydroxybutyrate levels and improve antioxidant status and immune indicators during the transition period. This development suggests that choline doesn’t just nudge milk. It helps the liver handle the metabolic load that comes with modern fresh cows.
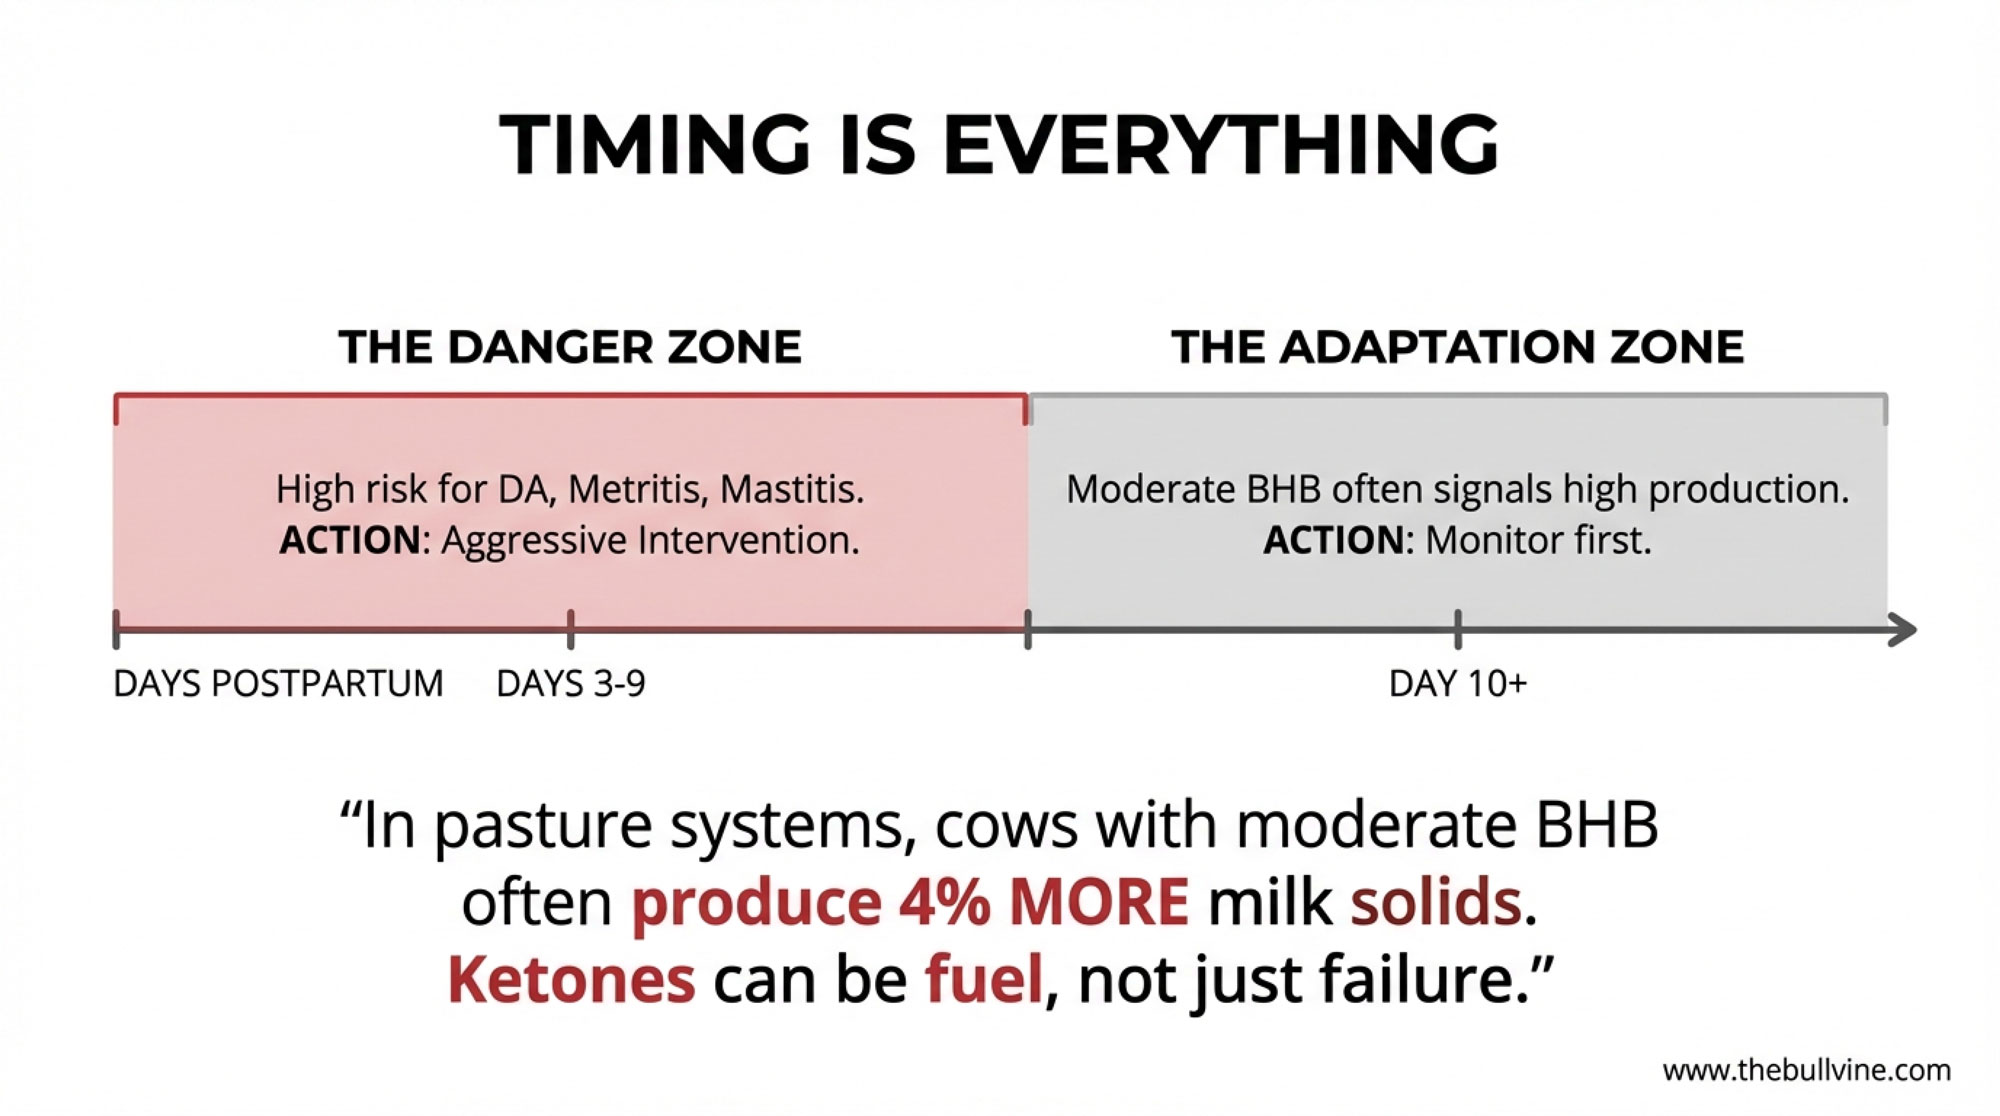
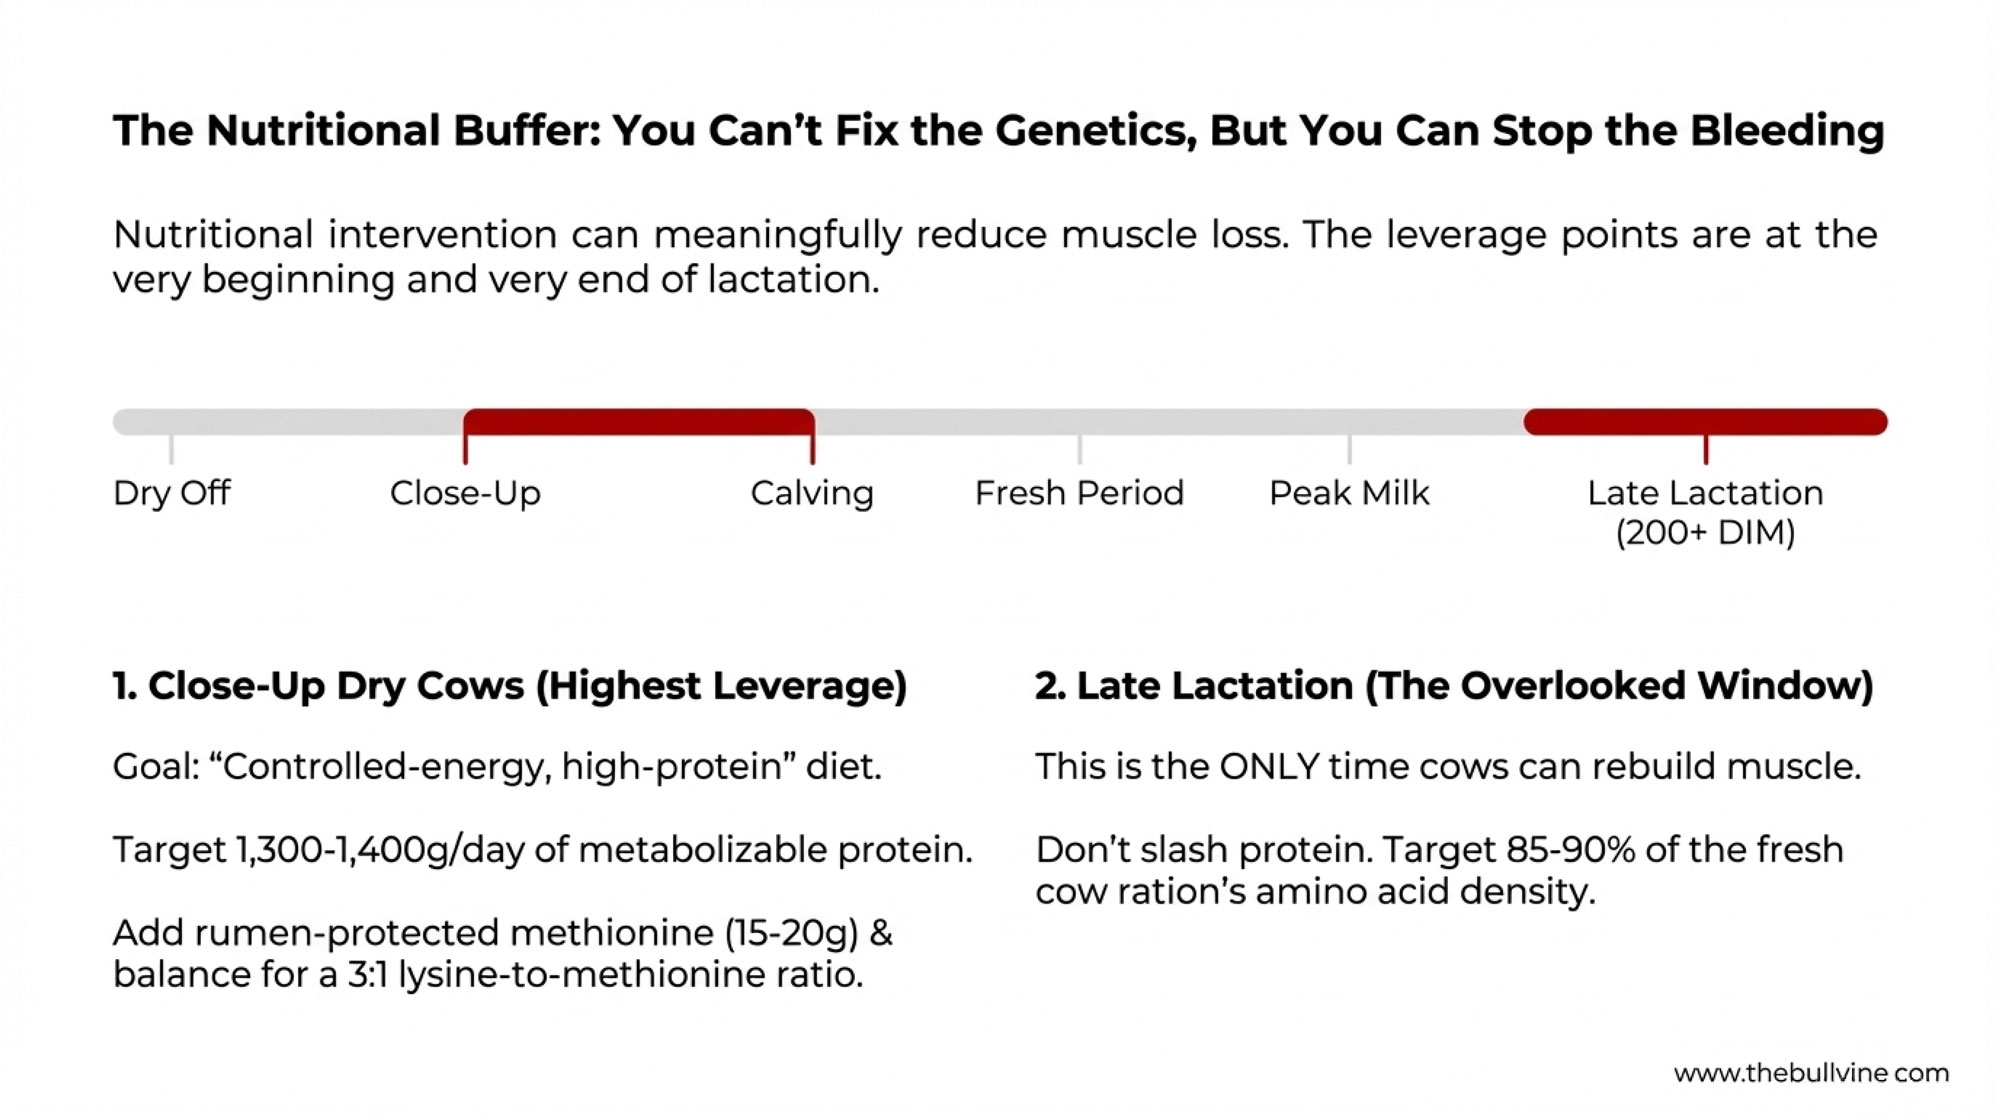
Why the −21 to +21 Day Window Keeps Coming Up
Looking at this trend across different universities and herds, one theme keeps popping up: timing really matters.
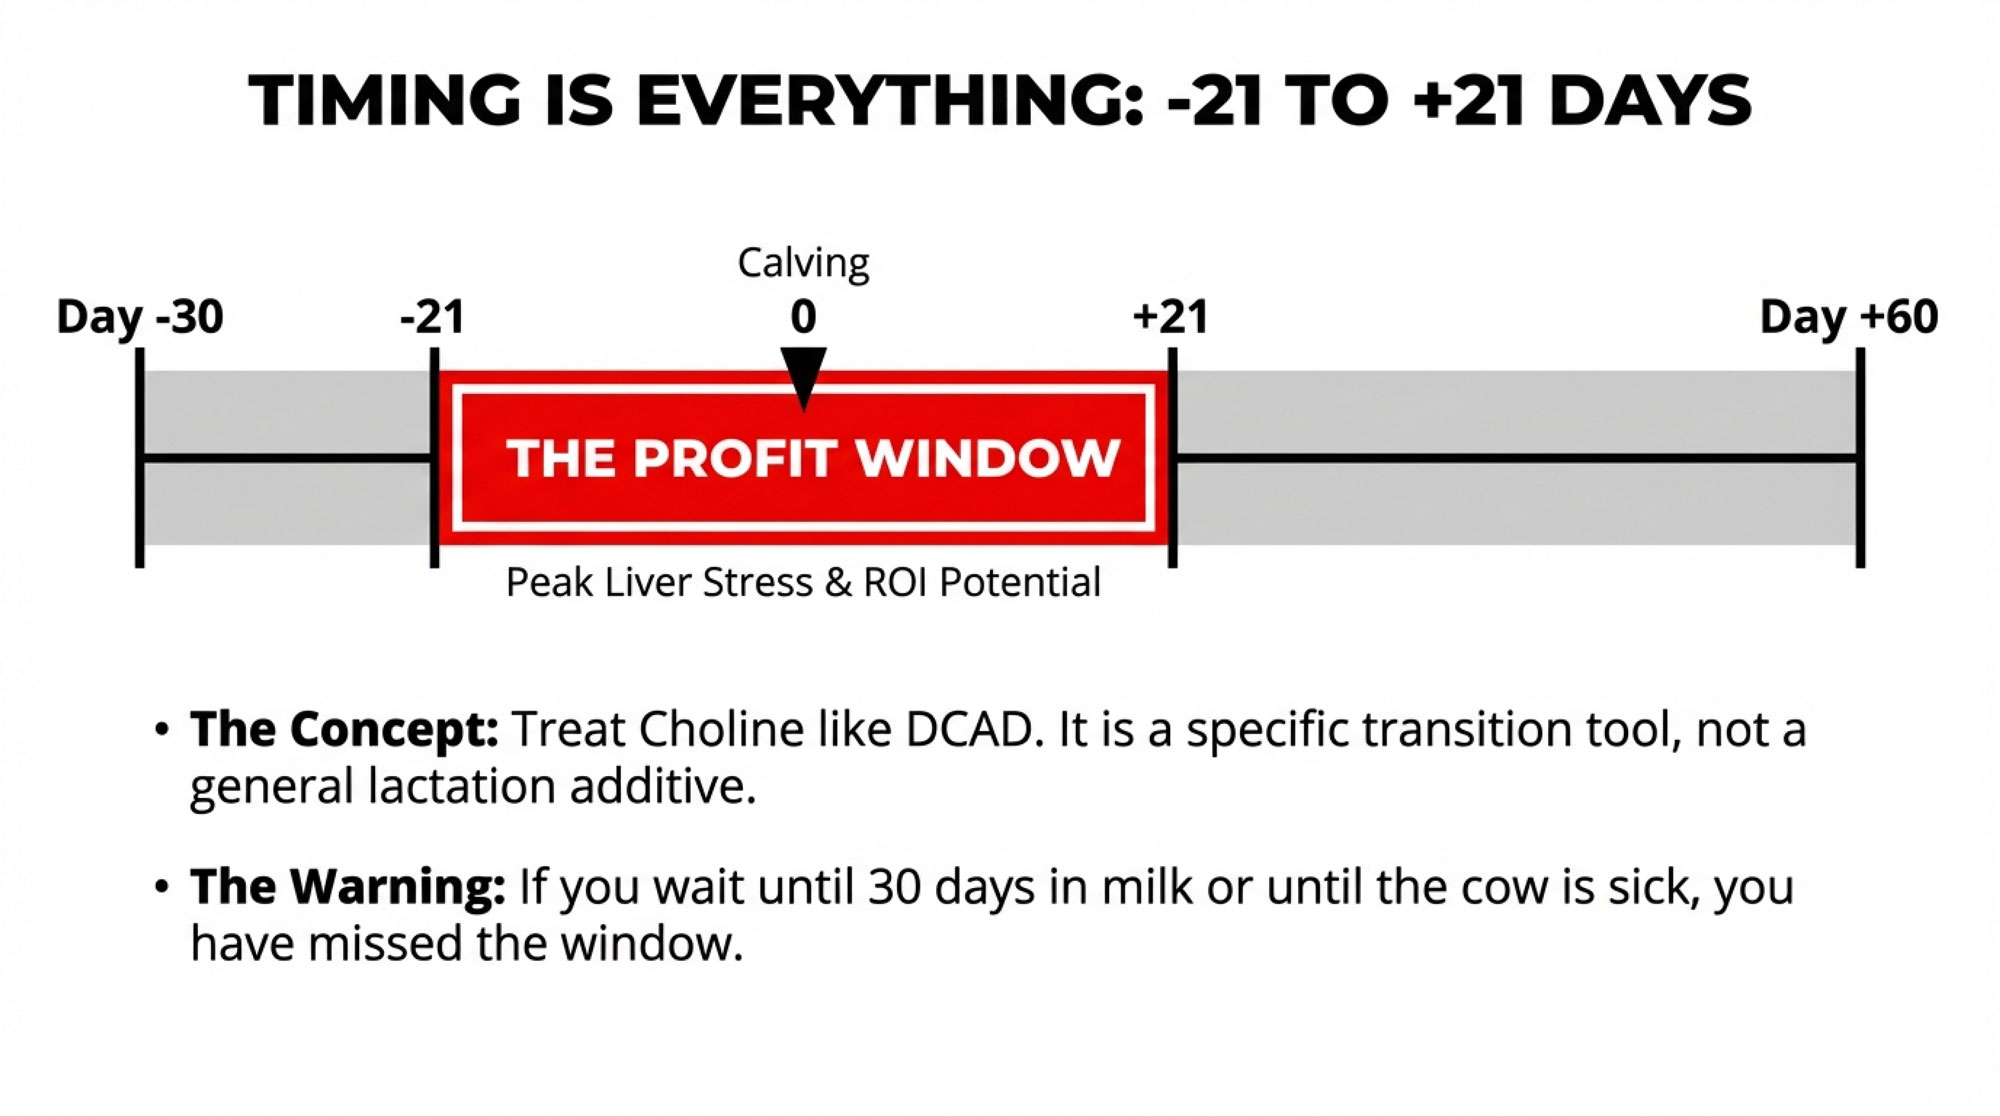
You know how we think about calcium and DCAD as “transition‑period tools,” not something you bolt on randomly later in lactation? Choline is starting to look similar.
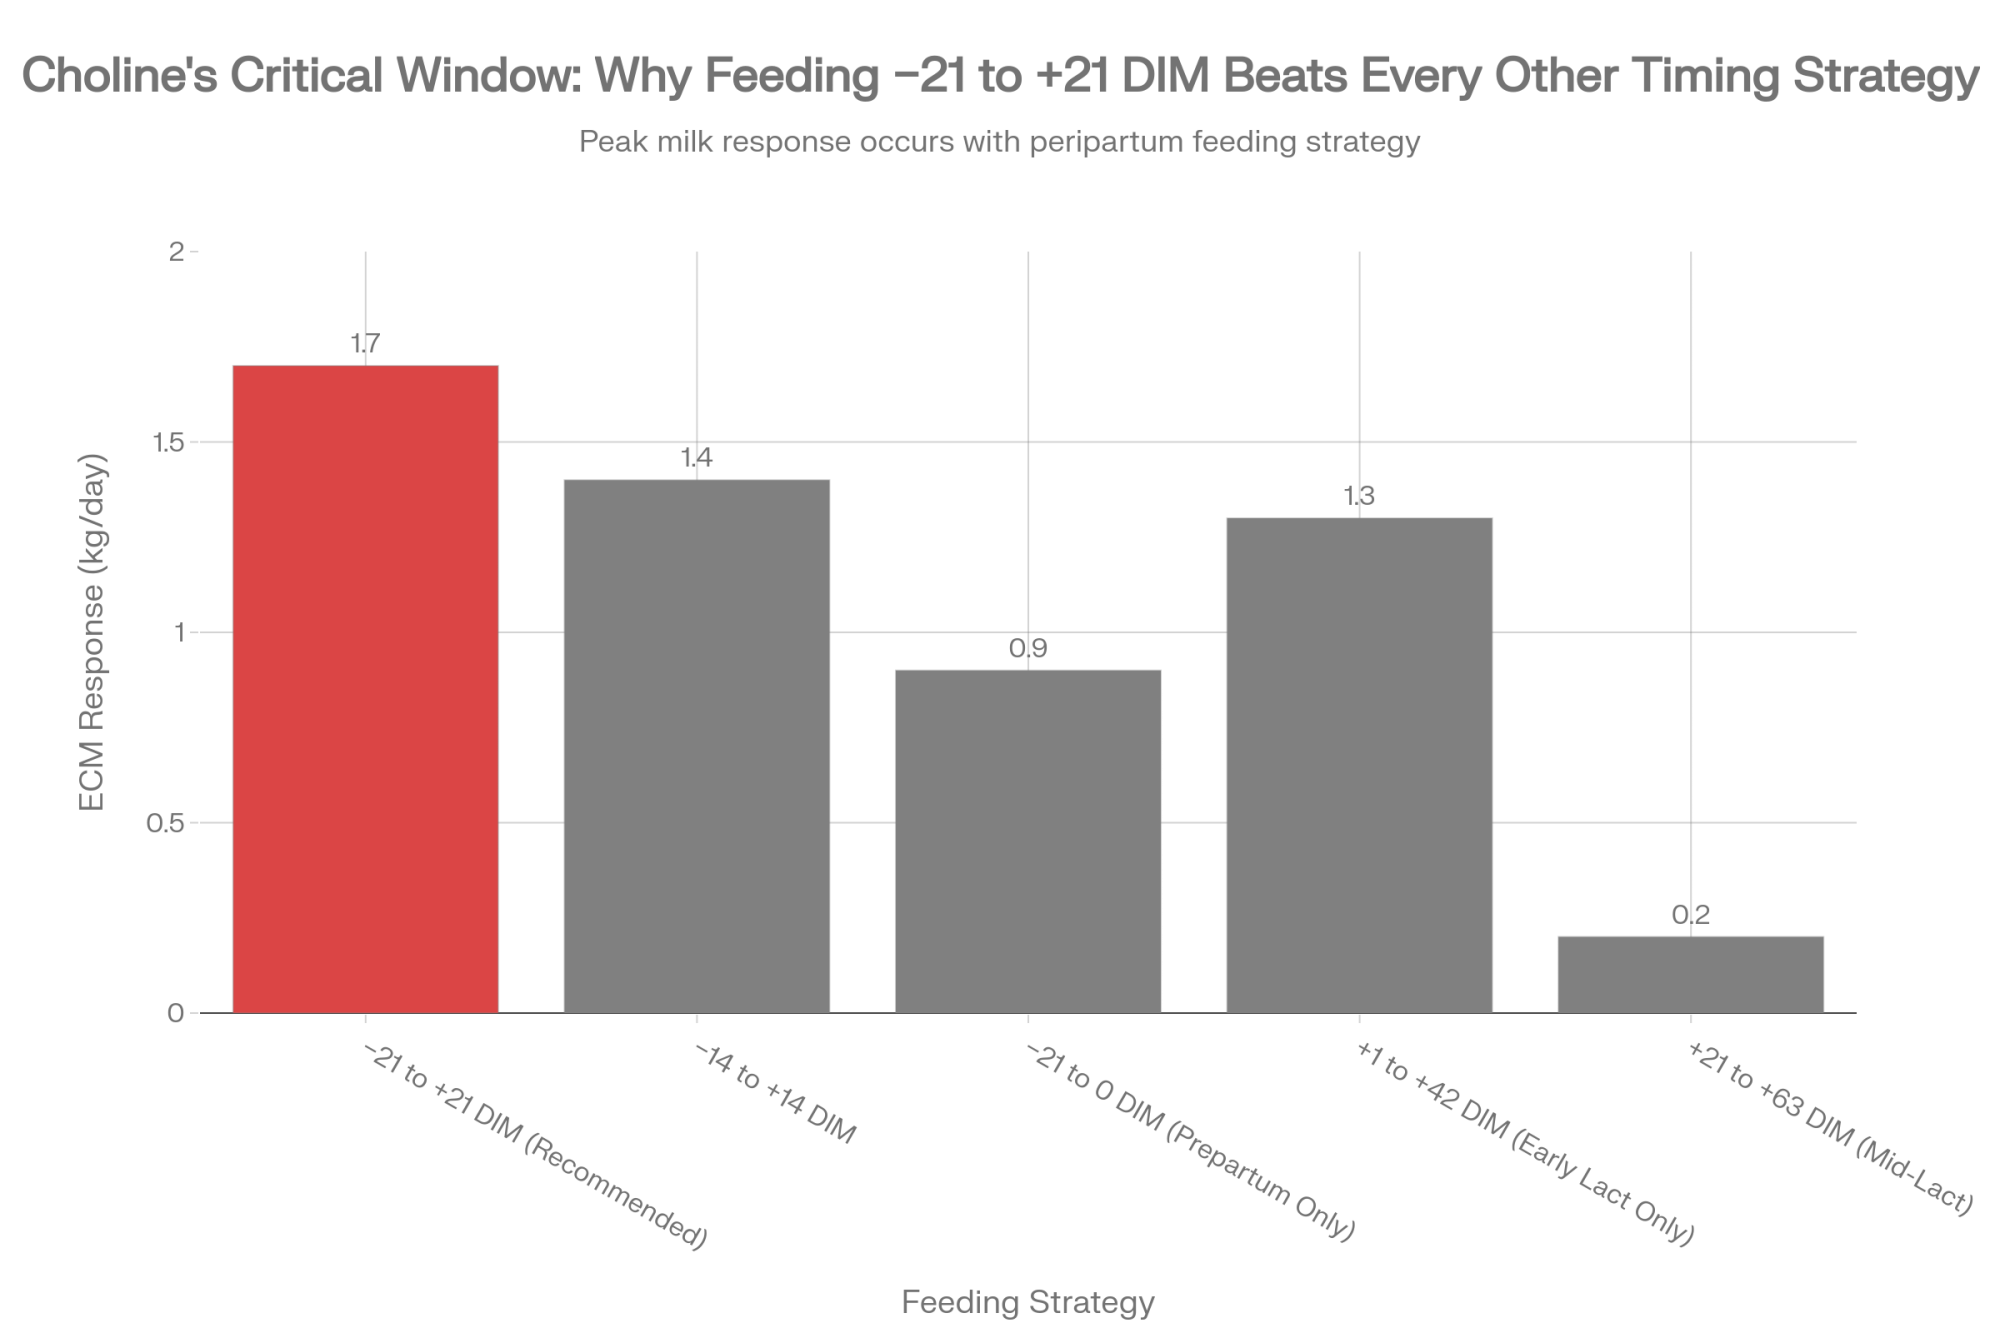
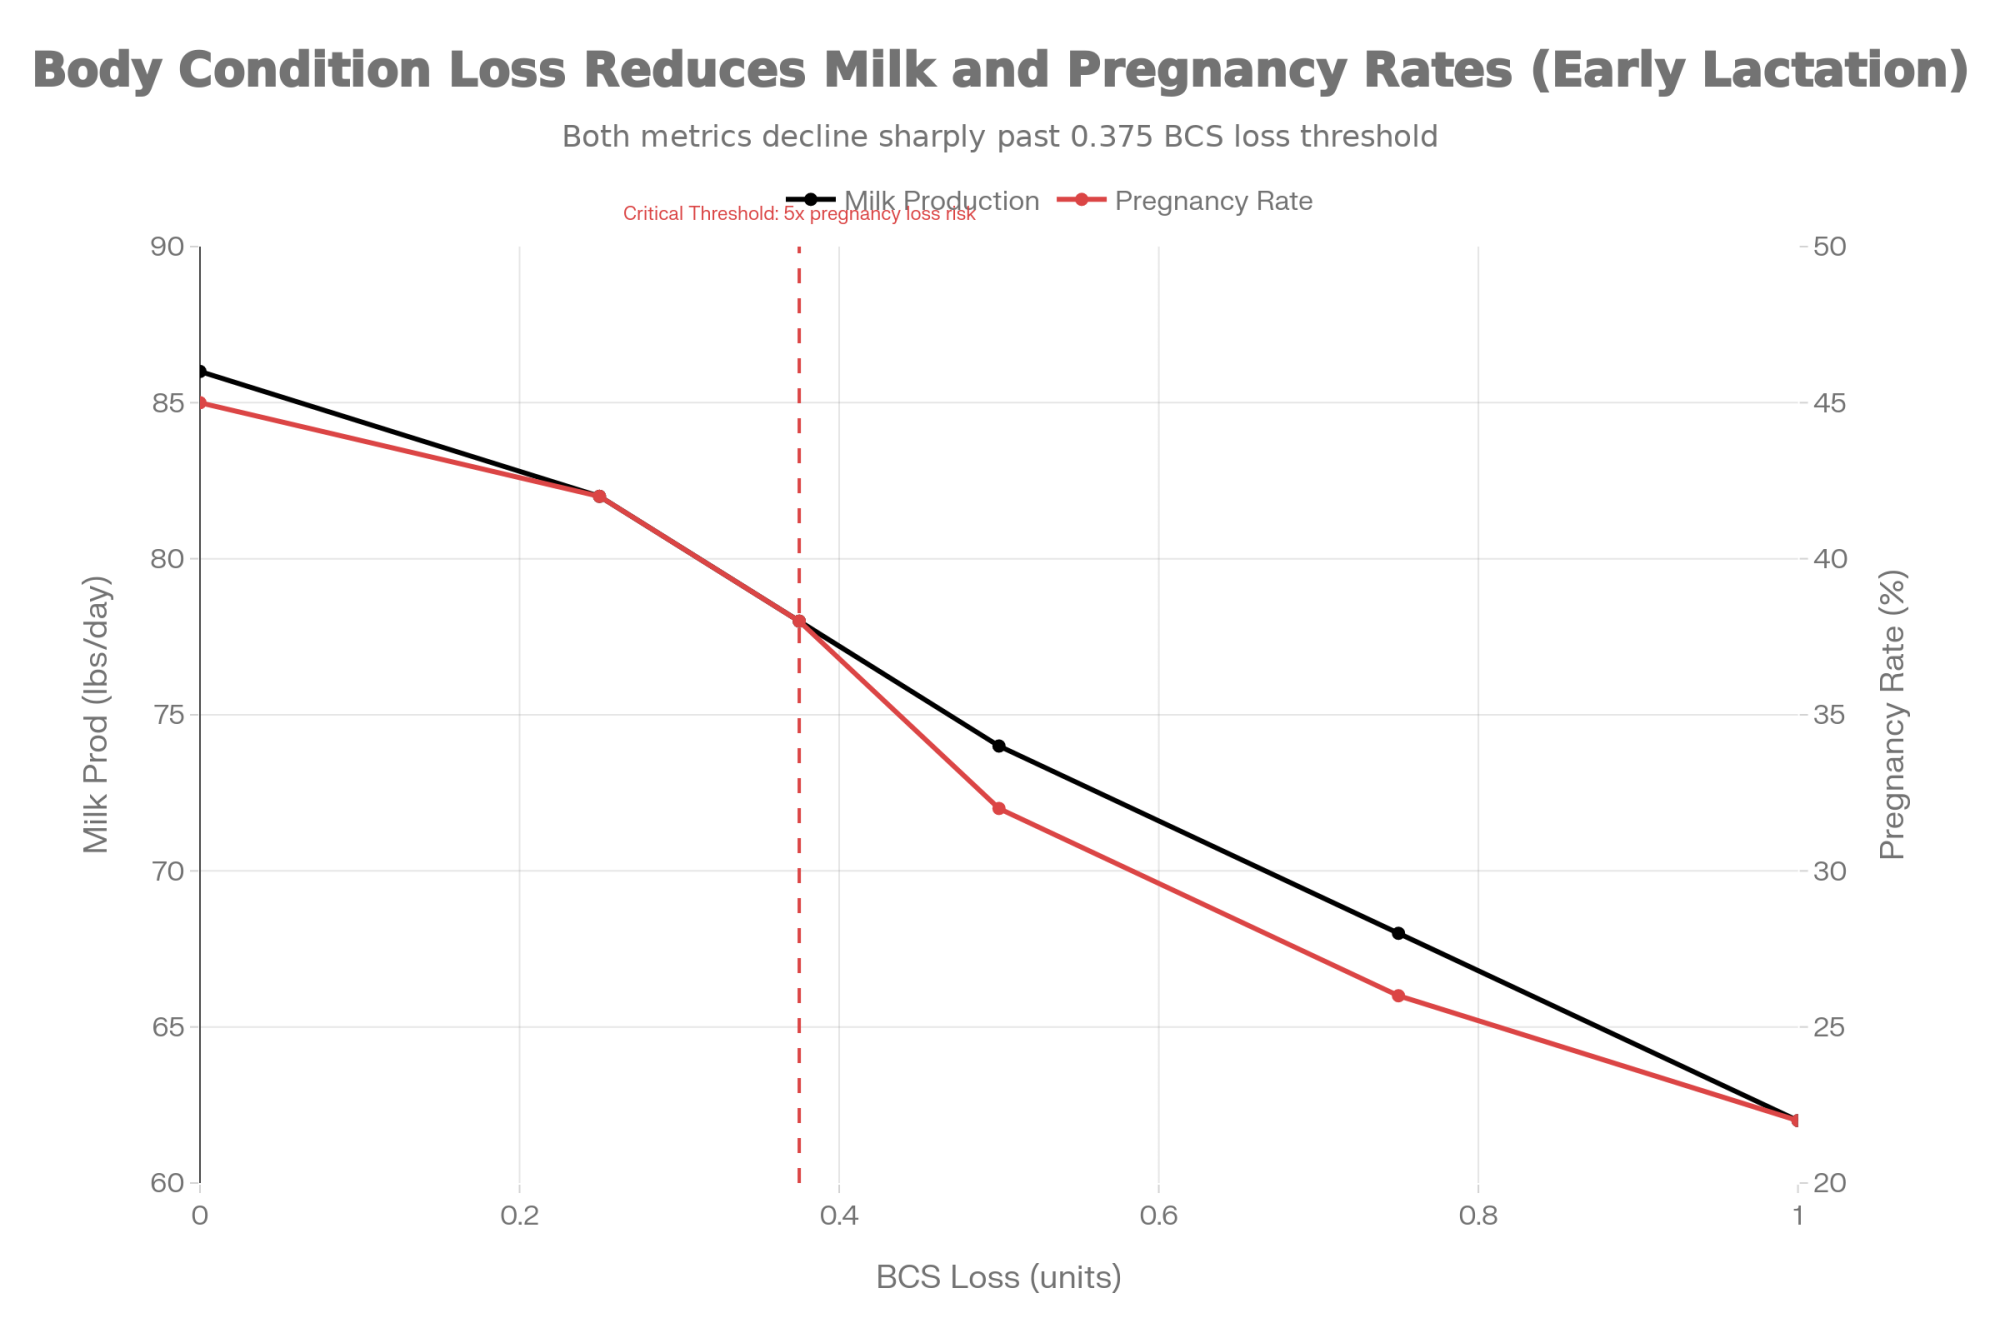
| Feeding Window | Control Comparison | Milk Response (kg ECM/day) |
|---|---|---|
| −21 to +21 DIM (recommended) | No choline | +1.7 ★ PEAK |
| −14 to +14 DIM (shortened window) | No choline | +1.4 |
| −21 to 0 DIM (prepartum only) | No choline | +0.9 |
| +1 to +42 DIM (early lactation only) | No choline | +1.3 |
| +21 to +63 DIM (mid-lactation) | No choline | +0.2 |
Several university trials—including work in U.S. research herds and commercial farms—have used around 60 grams per day of encapsulated choline products that supply roughly 13 grams of choline ion. When cows received rumen‑protected choline starting in the close‑up period (about three weeks before calving) and continuing through the first three to six weeks of lactation, they produced more milk, more fat, and more energy‑corrected milk, and often showed better feed efficiency. When supplementation began later in lactation—after the worst of the negative energy balance had passed—the same benefits generally didn’t appear.
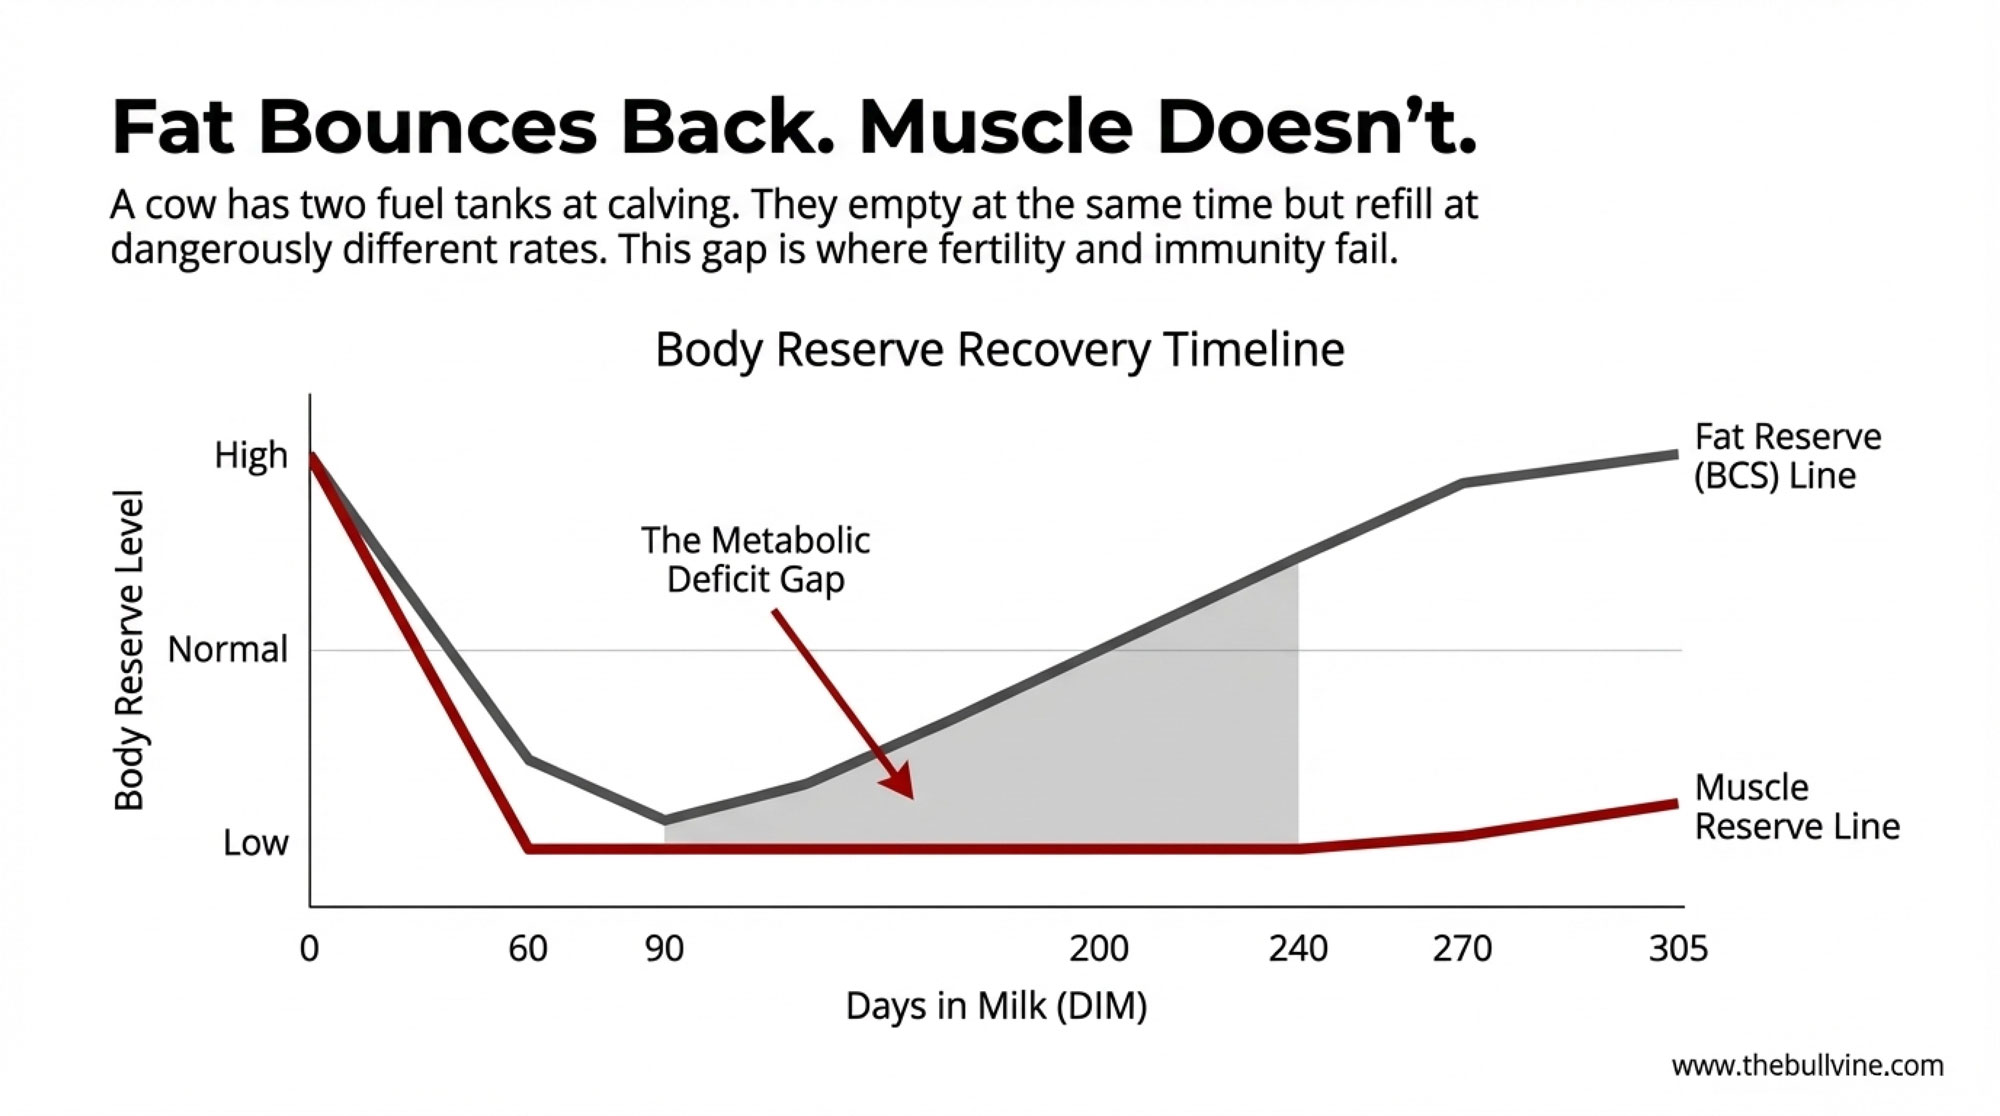
That lines up closely with what we already know about transition biology. The liver is under peak pressure in the three weeks before and three weeks after calving. That’s when NEFA are highest, negative energy balance is deepest, and liver fat and ketone levels are most likely to peak. If choline isn’t in the ration then, then you’re missing the main opportunity to help.
Some nutritionists, especially when budgets are tight, focus on roughly three weeks before calving and two weeks after, because that’s when liver triglycerides and blood BHB typically peak. But the research is pretty clear: if you wait until cows are three or four weeks into milk to introduce choline, you’ve already blown past most of the window where it can help the liver the most.
Putting Real Numbers to It: Does Choline Pay?
Sooner or later, this all comes back to money. And honestly, it should.
On the cost side, adding a rumen‑protected choline program that delivers around 13–14 grams of choline ion per cow per day will add a modest per‑cow daily cost to your transition ration. Industry reports from suppliers such as Balchem, as well as independent nutrition firms like Dellait, indicate that RPC programs typically represent a small fraction of total ration cost per cow, but still enough that you’ll notice them on a per‑transition‑cow basis over a six‑week feeding window. The exact number will depend on your supplier, contracts, and freight, so it’s something to pencil out with your nutritionist and feed rep based on current quotes.
On the income side, we’ve already talked about the responses. The 2020 Journal of Dairy Science meta‑analysis reported that cows getting around 12.9 grams per day of choline ion produced about 1.6 kilograms more milk and 1.7 kilograms more energy‑corrected milk per day across those 21 experiments. The Florida pooled trials found similar numbers: 1.8 kilograms more milk and 1.9 kilograms more ECM per day during the feeding period.
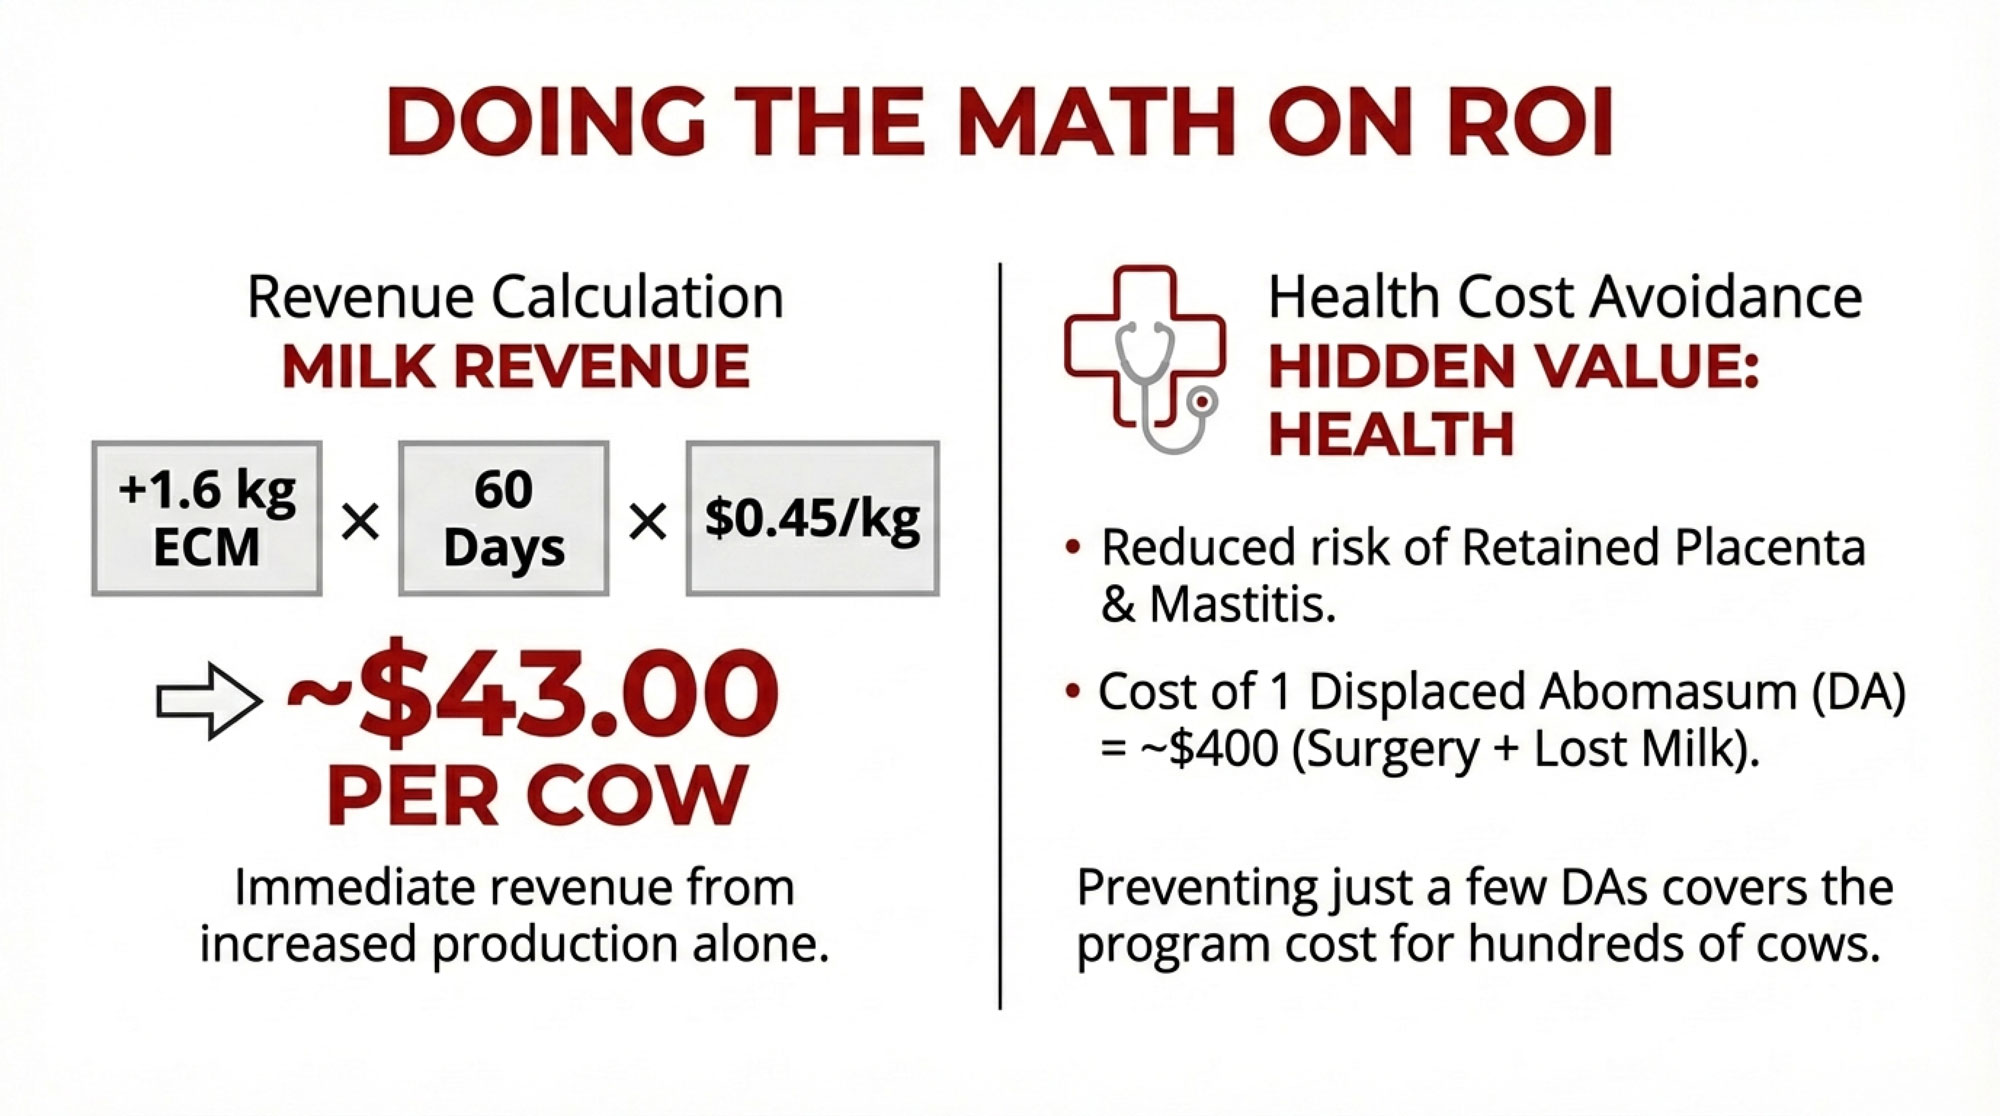
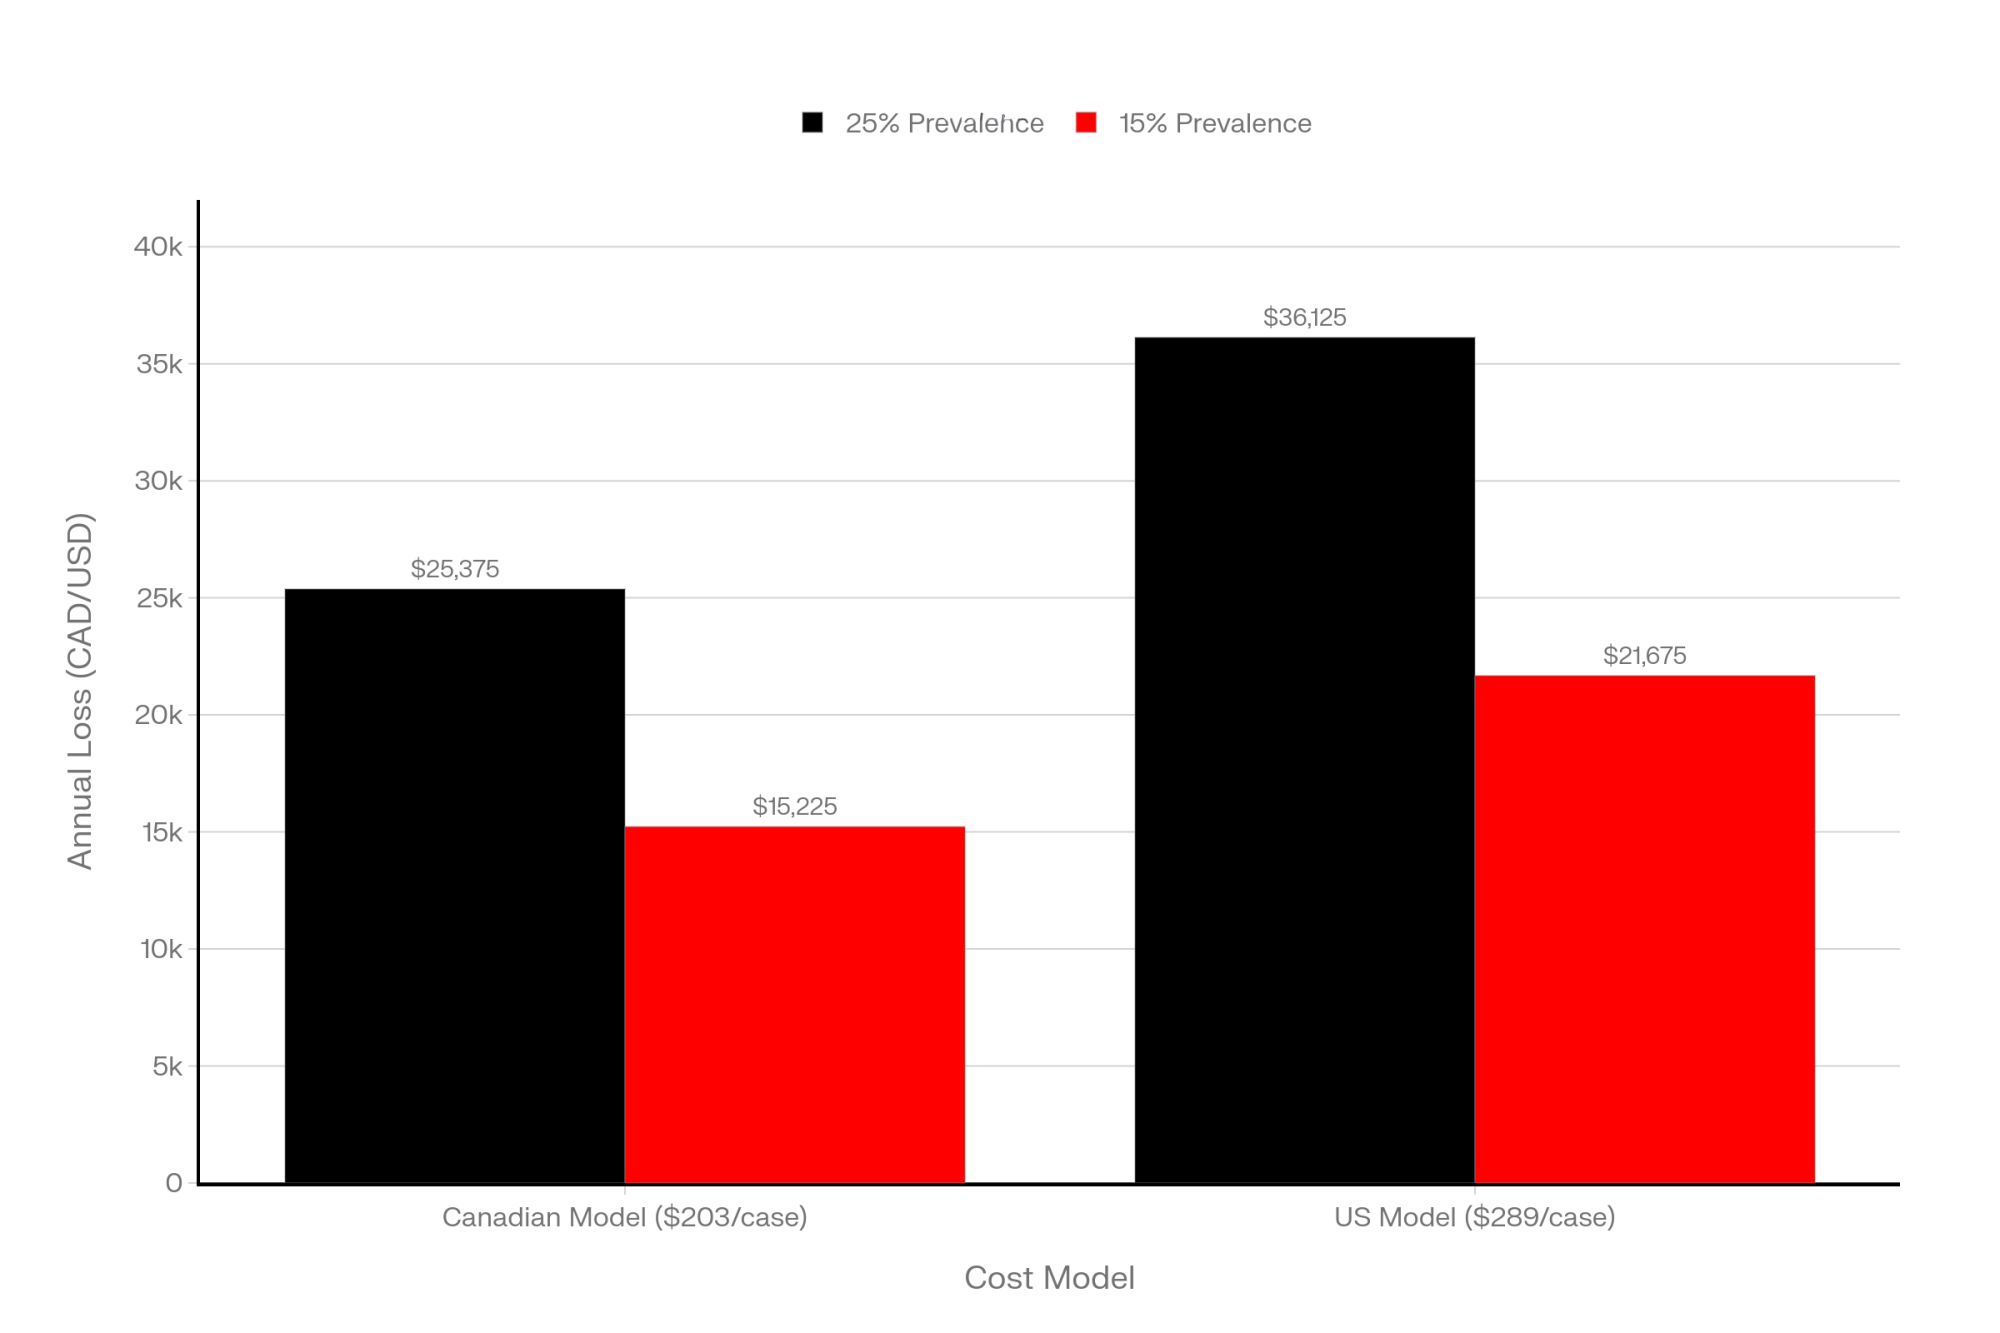
So let’s walk through a simple example and see where the math lands. Say your herd actually gets a 1.6‑kilogram‑per‑day increase in energy‑corrected milk for the first 60 days in milk—roughly in line with those pooled research results. If your ECM is worth about US$0.45 per kilogram (a reasonable ballpark when you translate a typical component‑priced hundredweight into kilograms), that extra early‑lactation milk would be worth about US$43 per cow.
Under those same assumptions, in a 200‑cow herd you’d be looking at something like US$8,600 in added early‑lactation milk value. Around US$17,000 for 400 cows. North of US$43,000 for 1,000 cows. The exact numbers will fluctuate with your pay program, component bonuses, and the size of the response your cows actually give. But it’s enough to show why a lot of folks are taking a serious second look at choline.
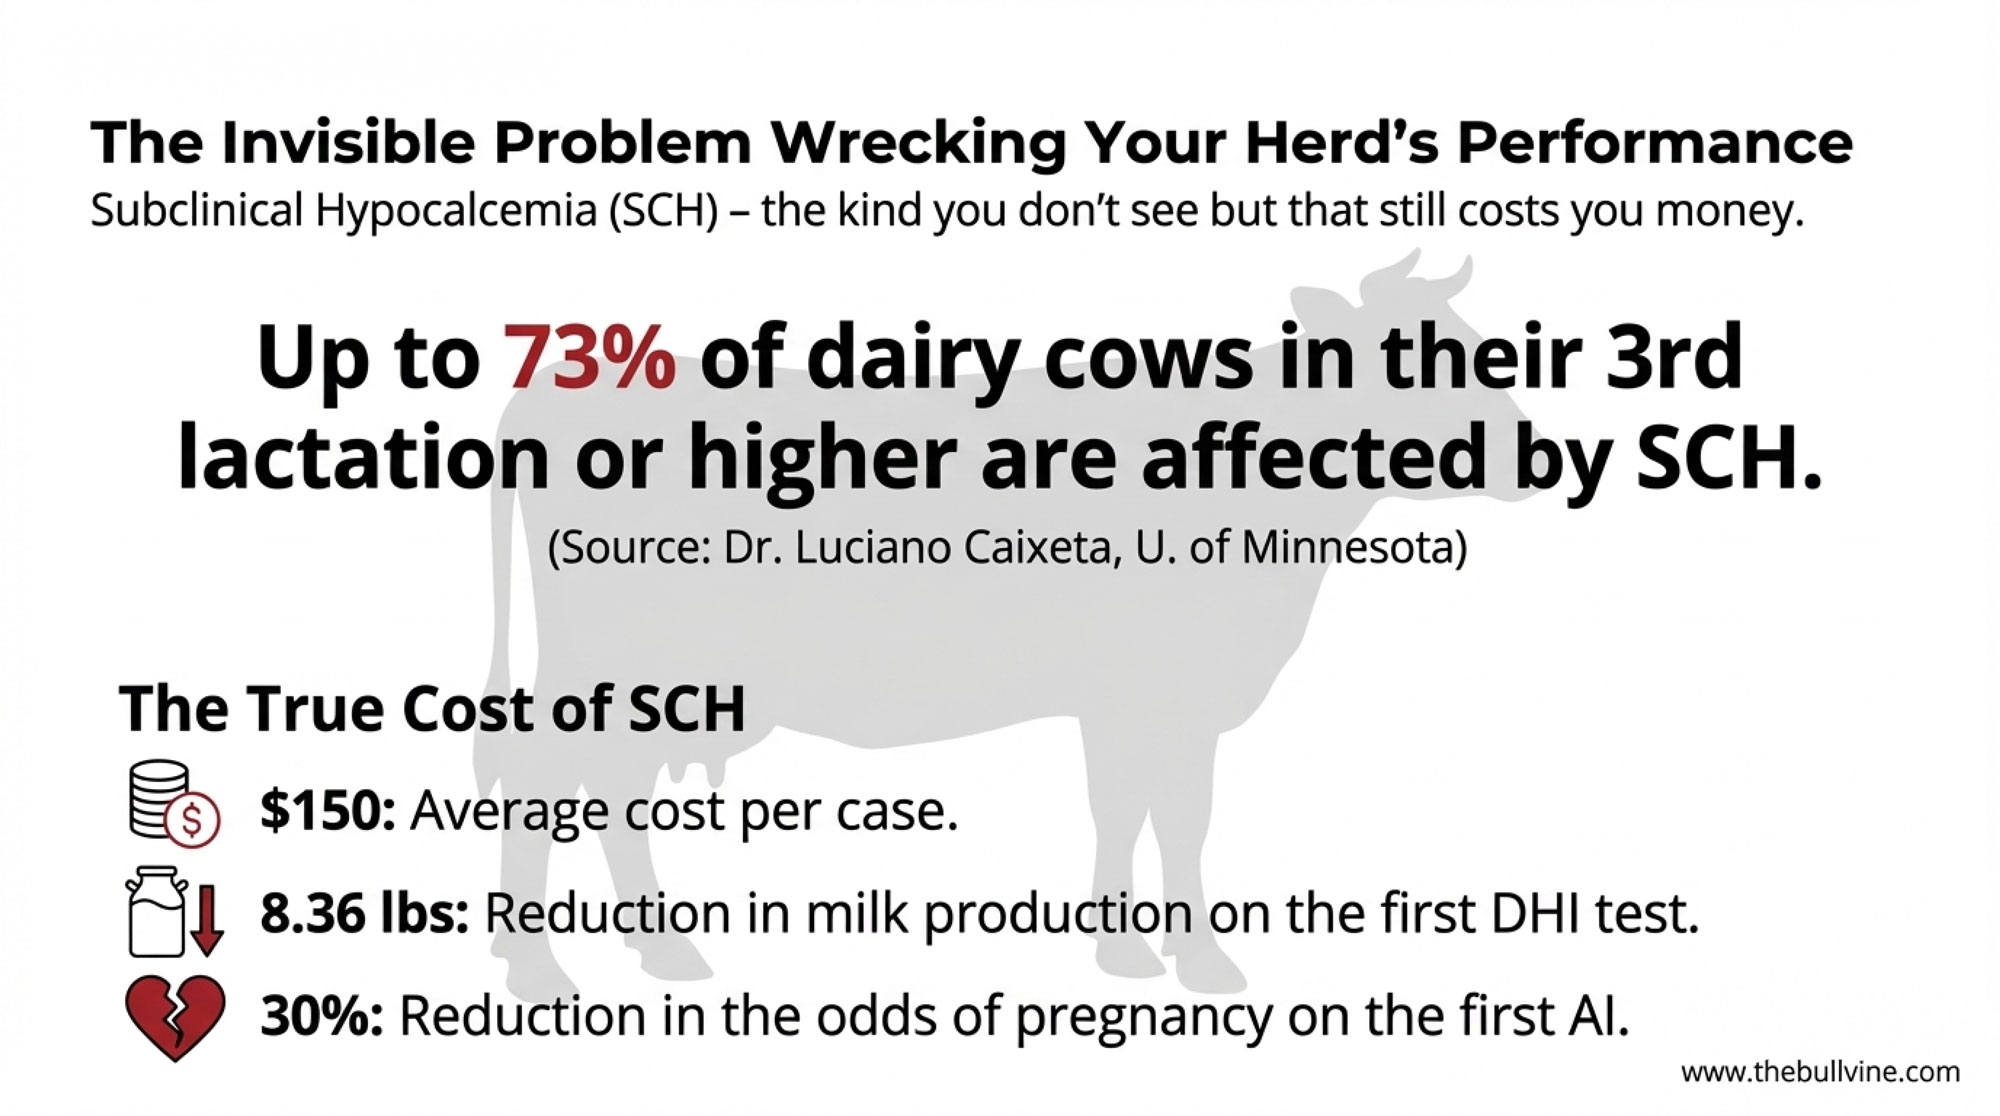
On the health side, that same meta‑analysis found that rumen‑protected choline reduced the risk of retained placenta and mastitis in parous cows, while effects on metritis, milk fever, displaced abomasum, ketosis, and liver fat were smaller and more variable across studies. More recent field‑style work, including a 2024 study on metabolic, reproductive, and productive performance by Ali et al., has documented lower hyperketonemia and improved fertility parameters in some choline‑supplemented herds, especially in those with already high baseline transition risk.
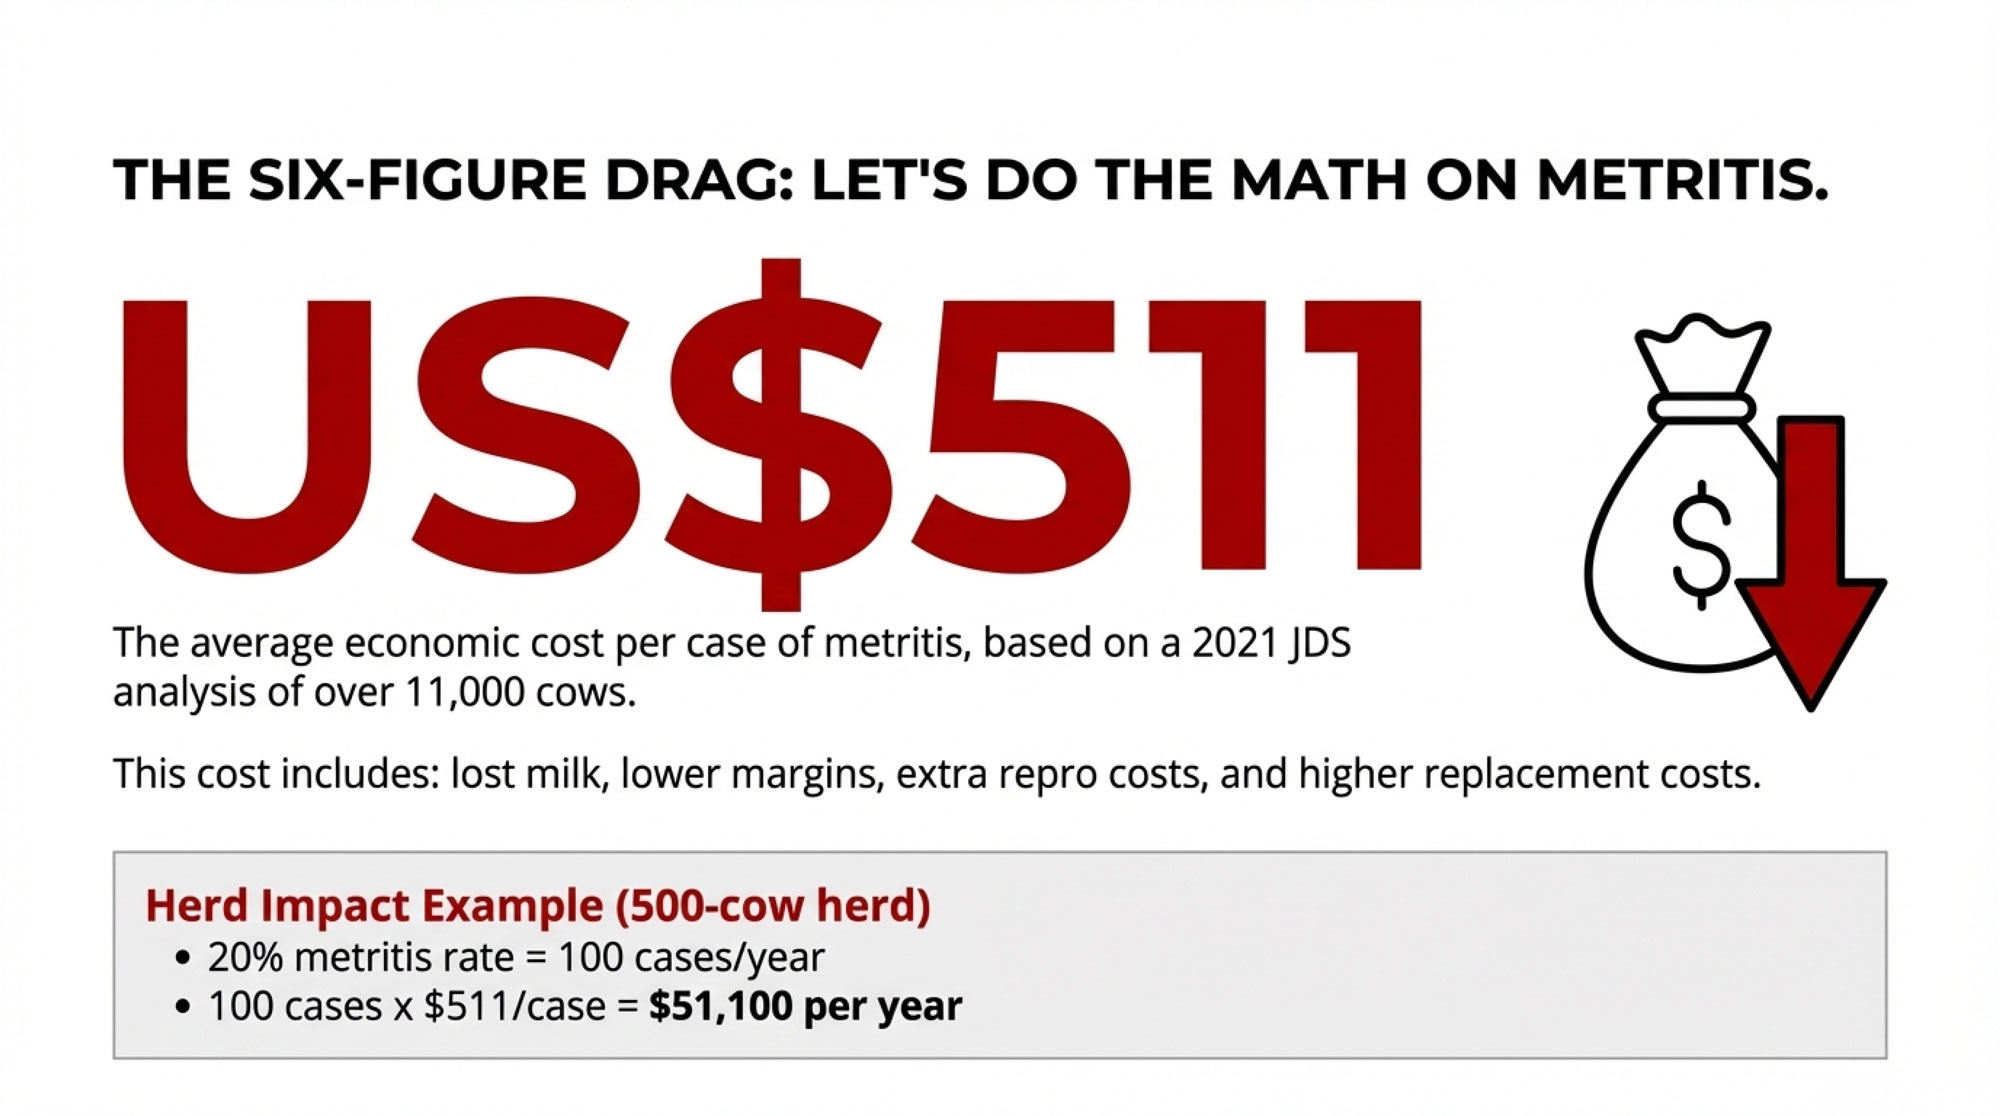
Here’s where the dollars can move quietly. Economic analyses from extension‑style resources in Wisconsin, New York, and other dairy regions often put the total cost of a displaced abomasum case in the neighborhood of US$400 when you include surgery, lost milk, and added culling risk. If you’re running at three DAs per 100 fresh cows, that’s roughly US$1,200 per 100 cows in DA costs alone, before you count the lost reproductive momentum. If a choline program—layered on top of better fresh‑cow management—helps you avoid even a modest number of DAs per hundred cows, you’re looking at a meaningful avoided cost per cow just on that one condition.
Stack those avoided losses on top of the extra ECM we just walked through. The return on a decent choline program can look pretty attractive in herds that are under real transition stress.
| Metric | WITHOUT Choline | WITH Choline | Delta |
|---|---|---|---|
| Early-Lactation ECM Milk Value | $0 | $43 | +$43 |
| Avoided DA Risk (est. 1 case per 30 cows) | $0 | $13.33 | +$13.33 |
| Avoided Clinical Ketosis Costs (est. $25/case, 15% reduction) | $0 | $3.75 | +$3.75 |
| Avoided Mastitis/Metritis (minor health gains) | $0 | $2.00 | +$2.00 |
| Total Benefit per Cow | $0 | ~$62 | +$62 |
What’s encouraging is that the economics don’t hinge on one “magic” effect. They come from a combination of more milk and fewer expensive metabolic problems. At the same time, the research is very clear that the exact return is herd‑specific. It depends on your milk price, disease patterns, how dialed‑in your fresh‑cow management is, and what you actually pay for choline. The most honest way to think about it is that the data suggest strong potential for a positive return in the right herds—not that every herd, everywhere, will see the same payoff.
For Canadian readers working under quota, the math looks a bit different. You may not be chasing more shipped volume in the same way, but better transition performance still pays through component premiums, fewer forced culls, lower replacement pressure, and more flexibility in how you fill quota with your best cows.
Why Choline Still Isn’t in Every Transition Ration
Given all this, it’s fair to ask why rumen‑protected choline isn’t in the “automatic” category alongside DCAD programs or monensin in close‑up and fresh rations.
From what I’ve seen, three themes keep coming up in conversations with producers and advisors.
Early Product Variability Left Some Scars
You know this story. A lot of folks still remember the early “protected choline” products that, once people dug into them, weren’t very well protected.
We’ve known for a long time that rumen microbes degrade unprotected choline rapidly. How much choline actually reaches the small intestine depends heavily on the encapsulation and matrix. Comparative work on encapsulated choline sources shows real differences in choline chloride concentration, rumen stability, and even biological effects on liver fat when cows are pushed toward fatty liver.
So what I’ve noticed is that some of those mixed or disappointing older trial results probably came from products that, chemically speaking, weren’t delivering much choline past the rumen. That’s a big part of why many nutritionists today want independent rumen‑protection and TMR‑stability data on a specific product—not just a “protected” label—before they’ll build it into a transition ration.
A Lot of the Wins Are Quiet
Another challenge is that many of the benefits appear as problems that never occur.
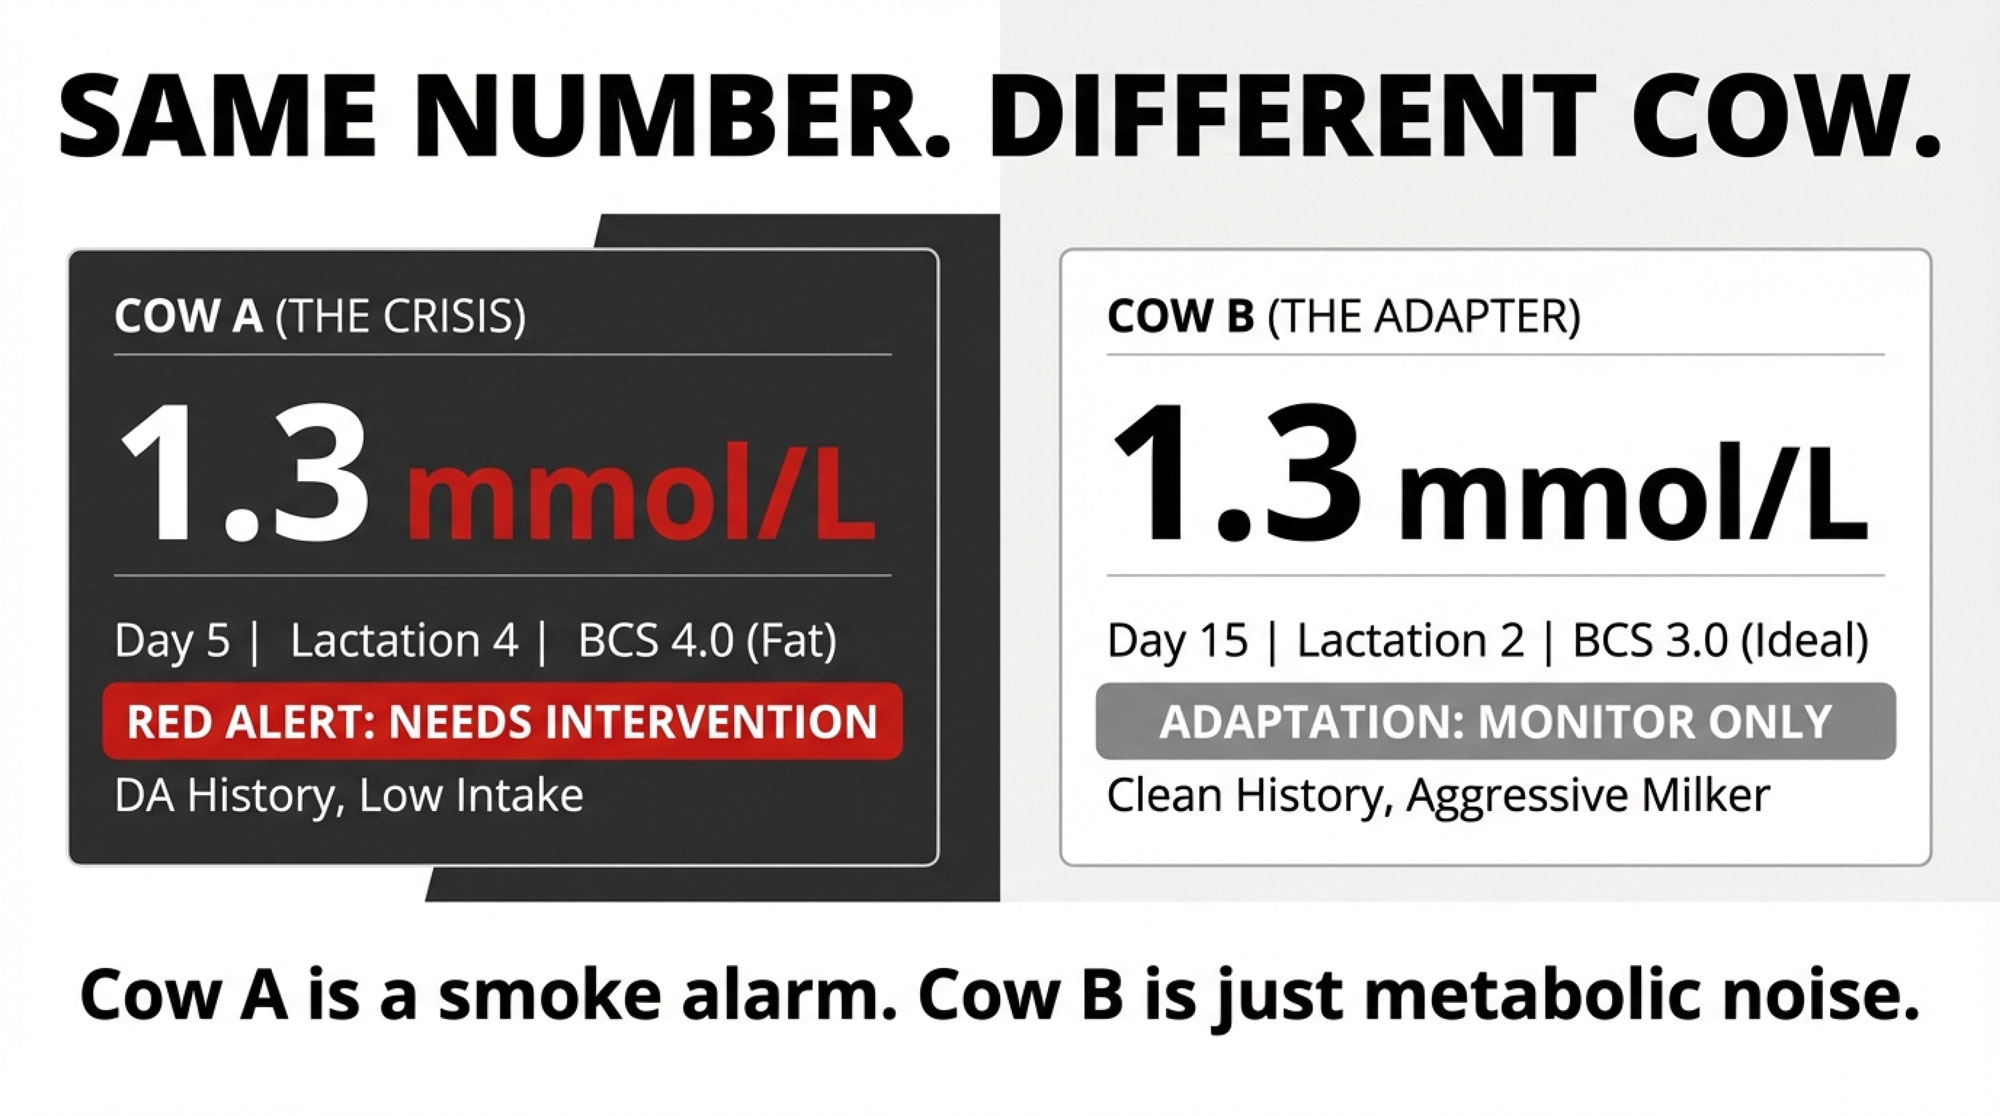
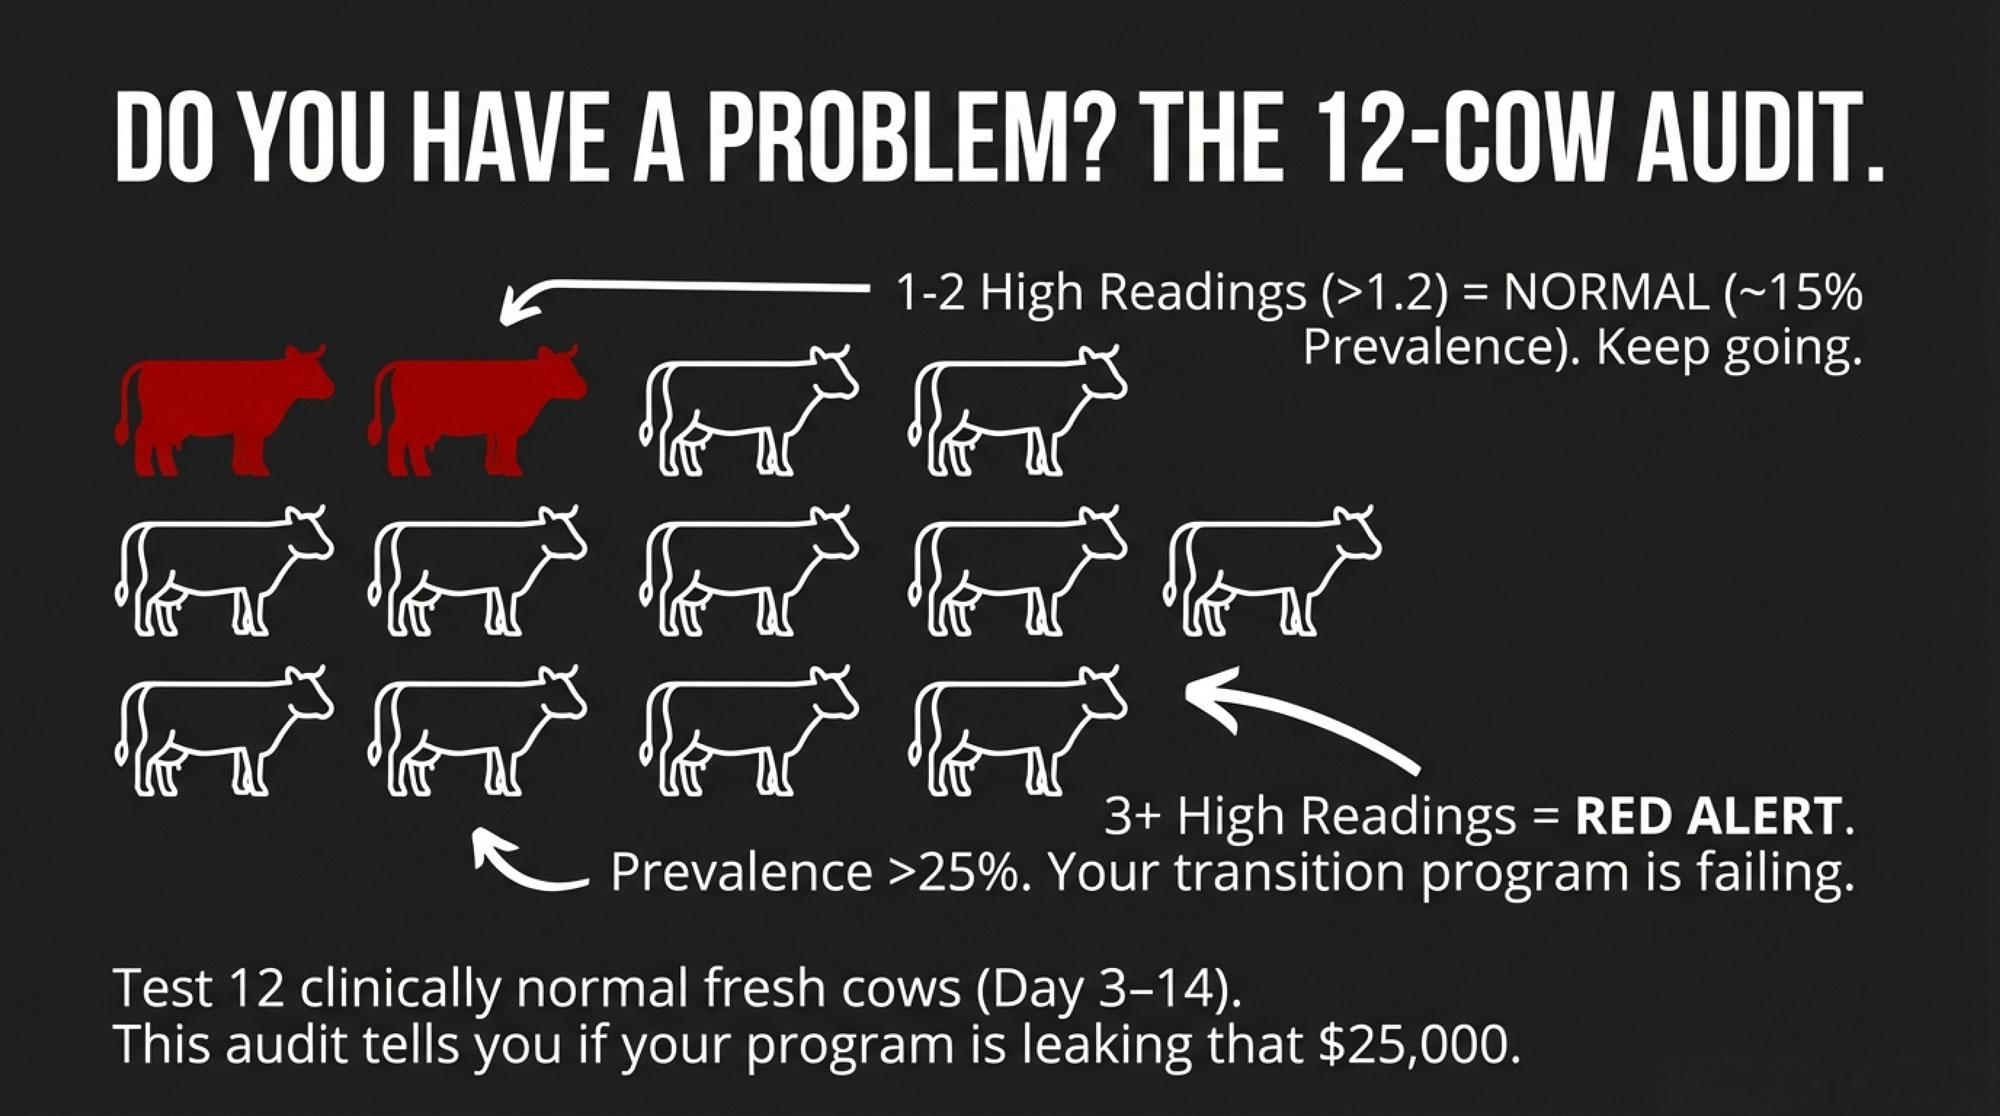
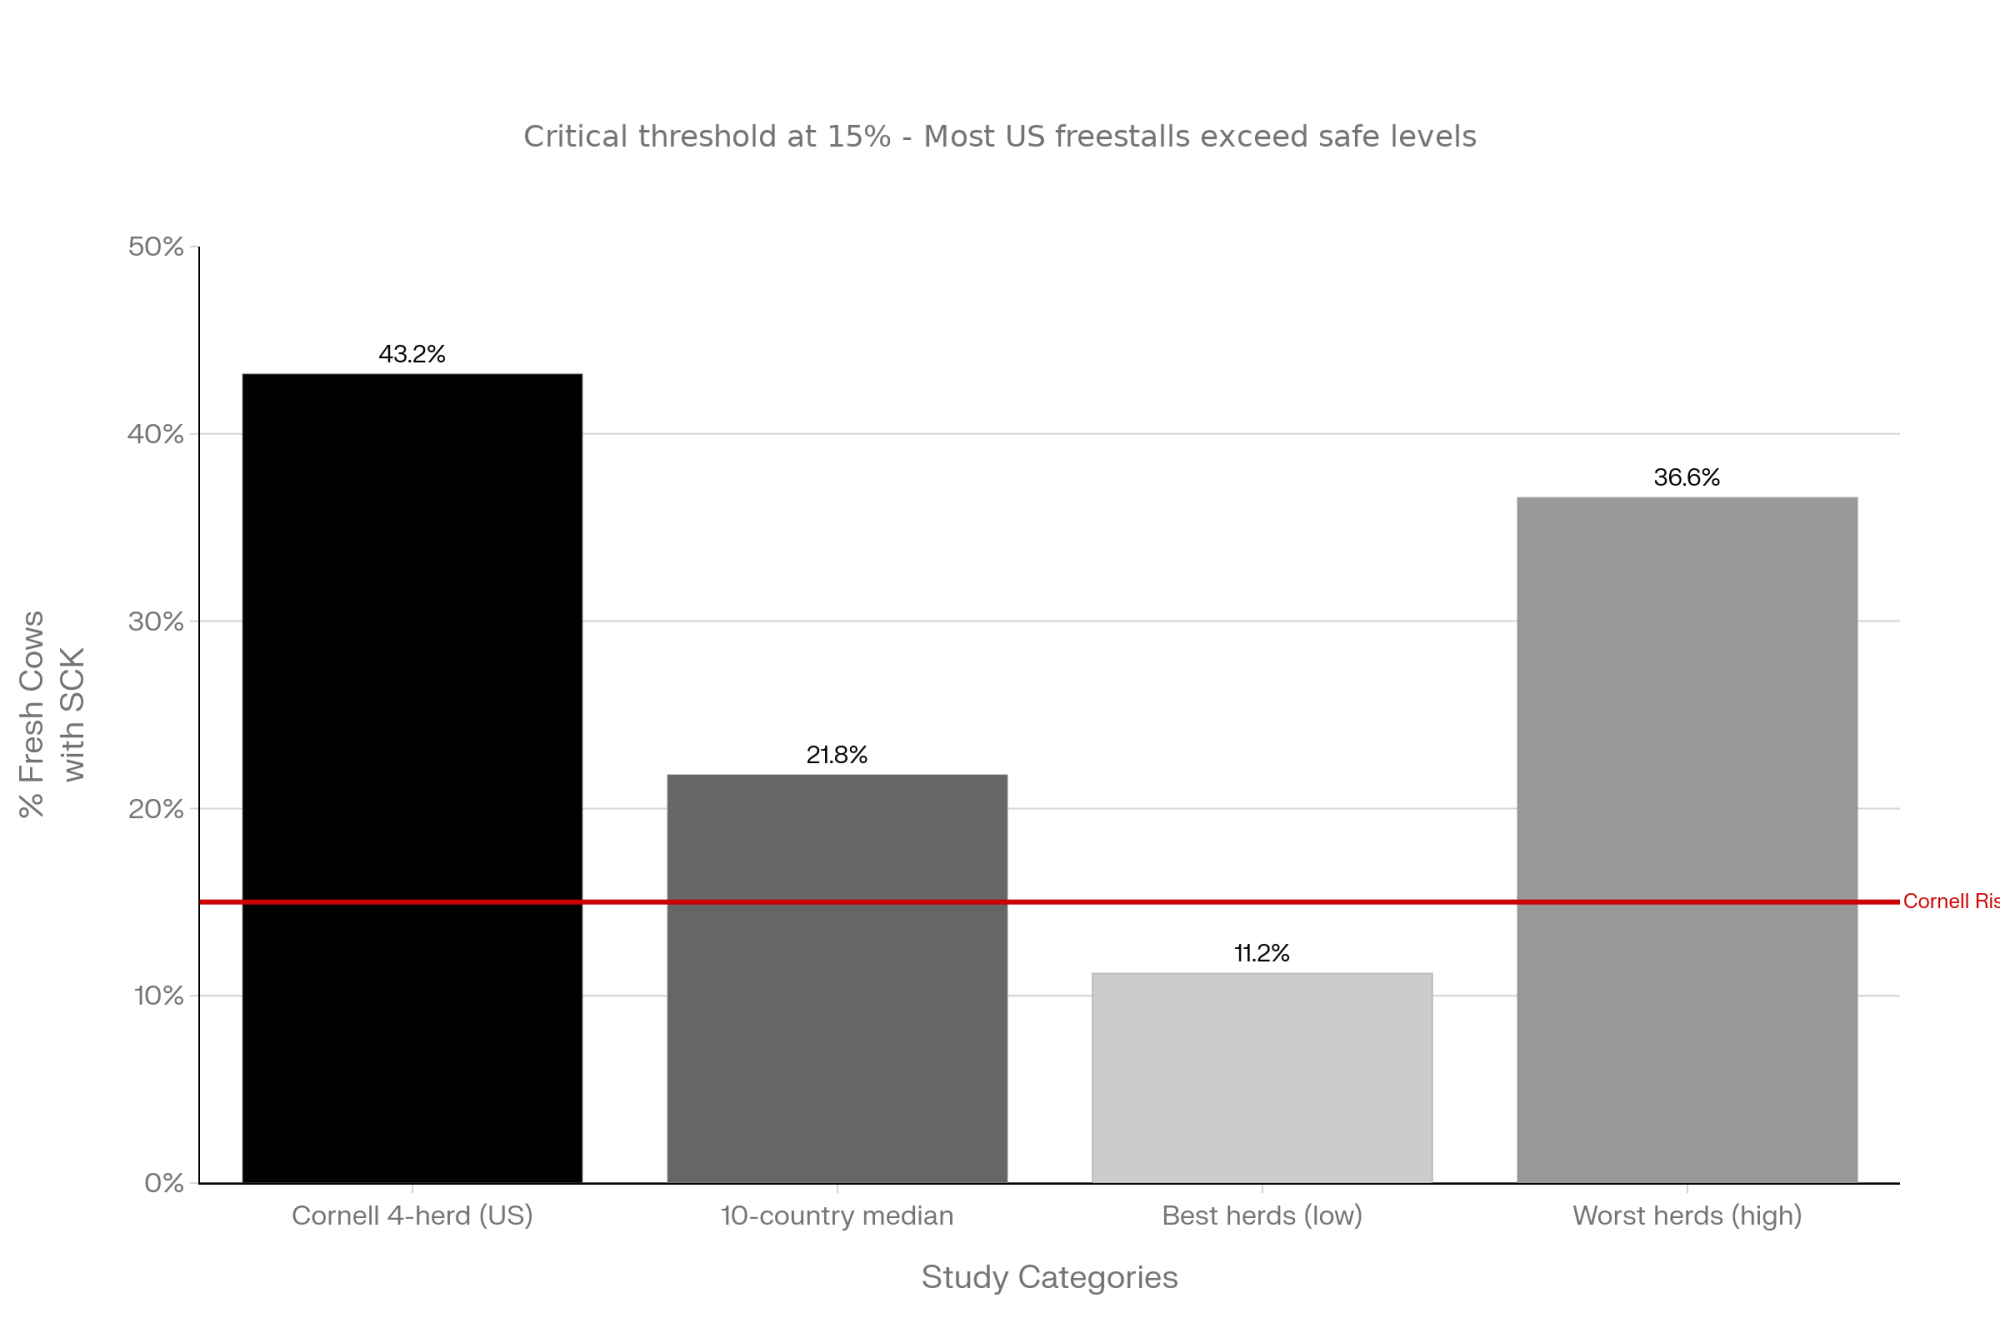
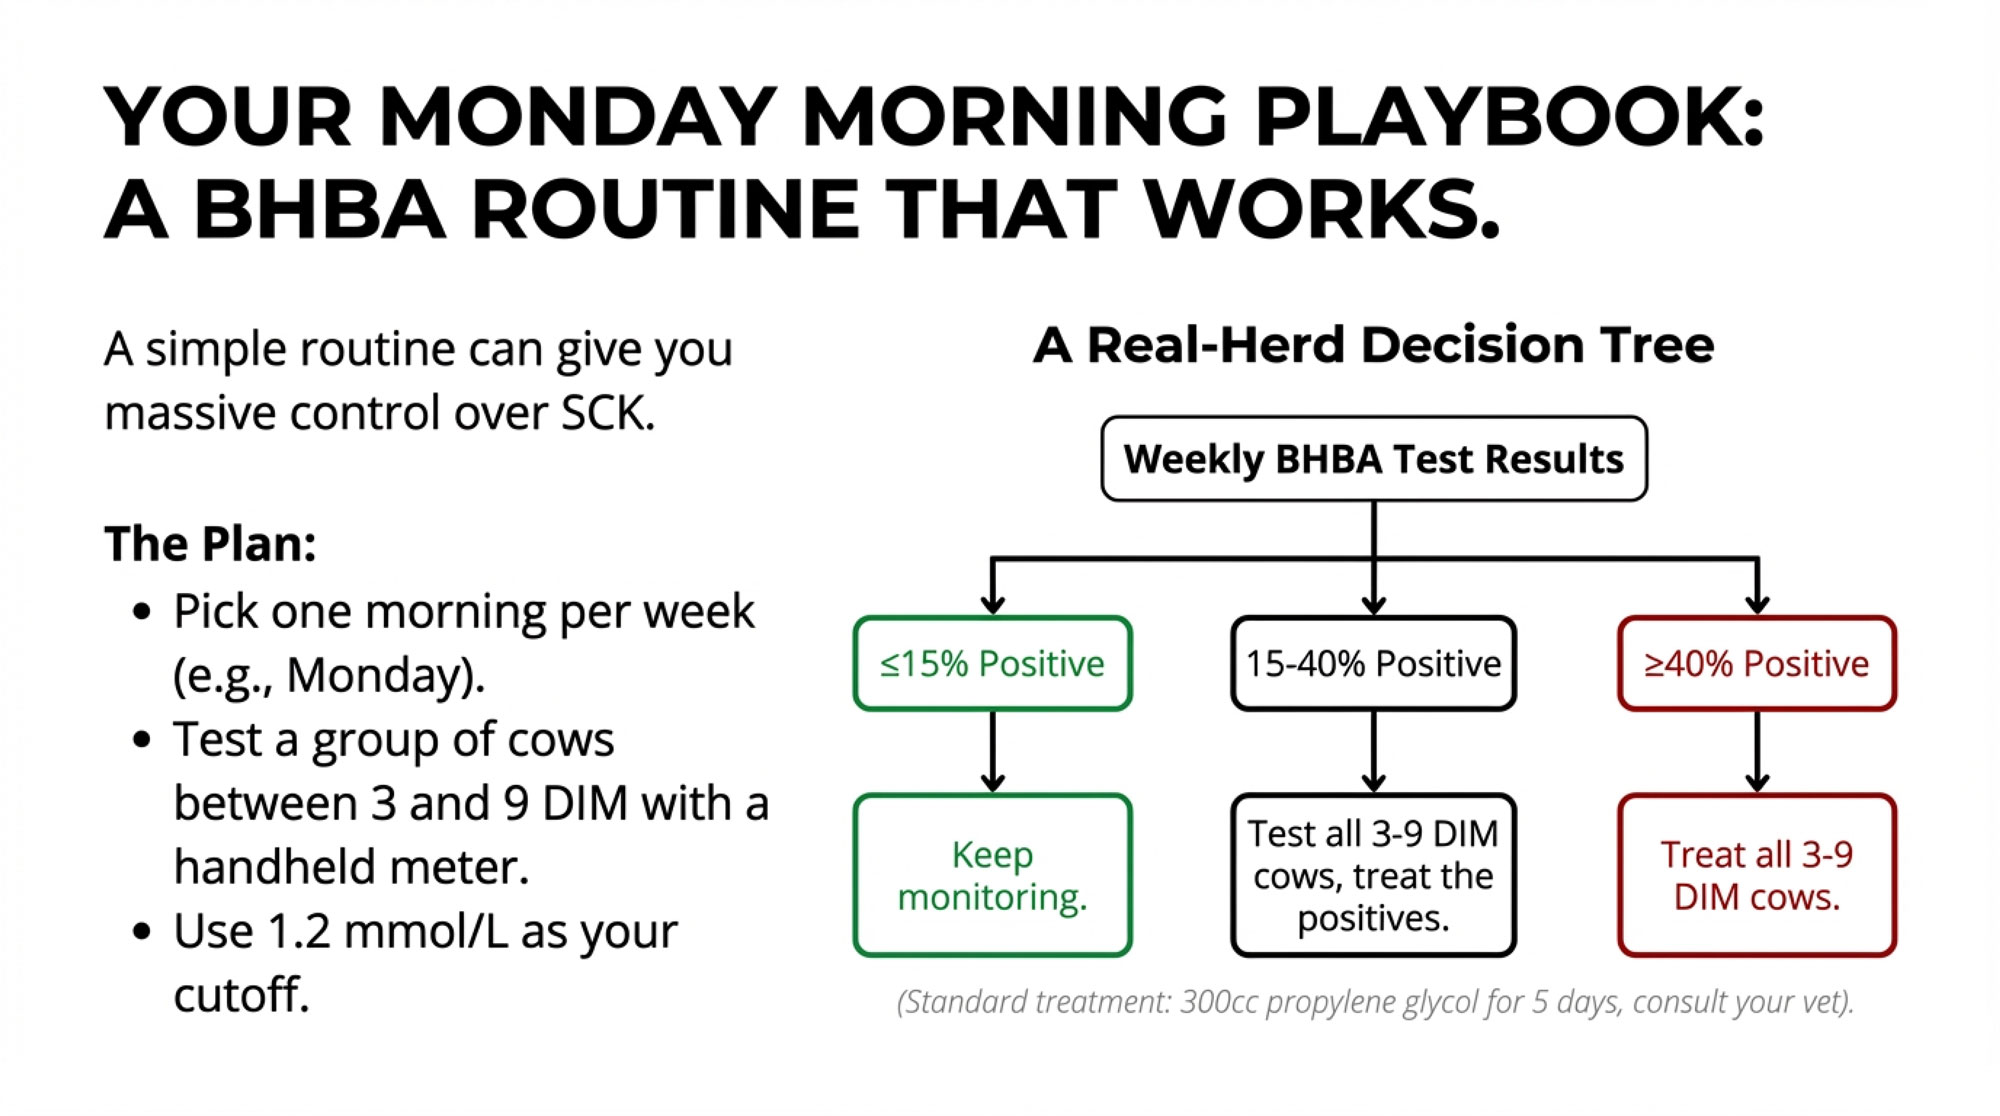
Take subclinical ketosis. Large field studies in North America and Europe—including work compiled by McArt and colleagues and more recent reviews—report that roughly 15–30% of early‑lactation cows exceed β‑hydroxybutyrate thresholds of 1.2–1.4 mmol/L, which is the common definition of subclinical ketosis. In strongly seasonal or grazing systems, like those in New Zealand and parts of Ireland, cumulative SCK rates across the first month postpartum can be higher again due to concentrated calving and rapid diet shifts, as pasture‑based research reviews point out.
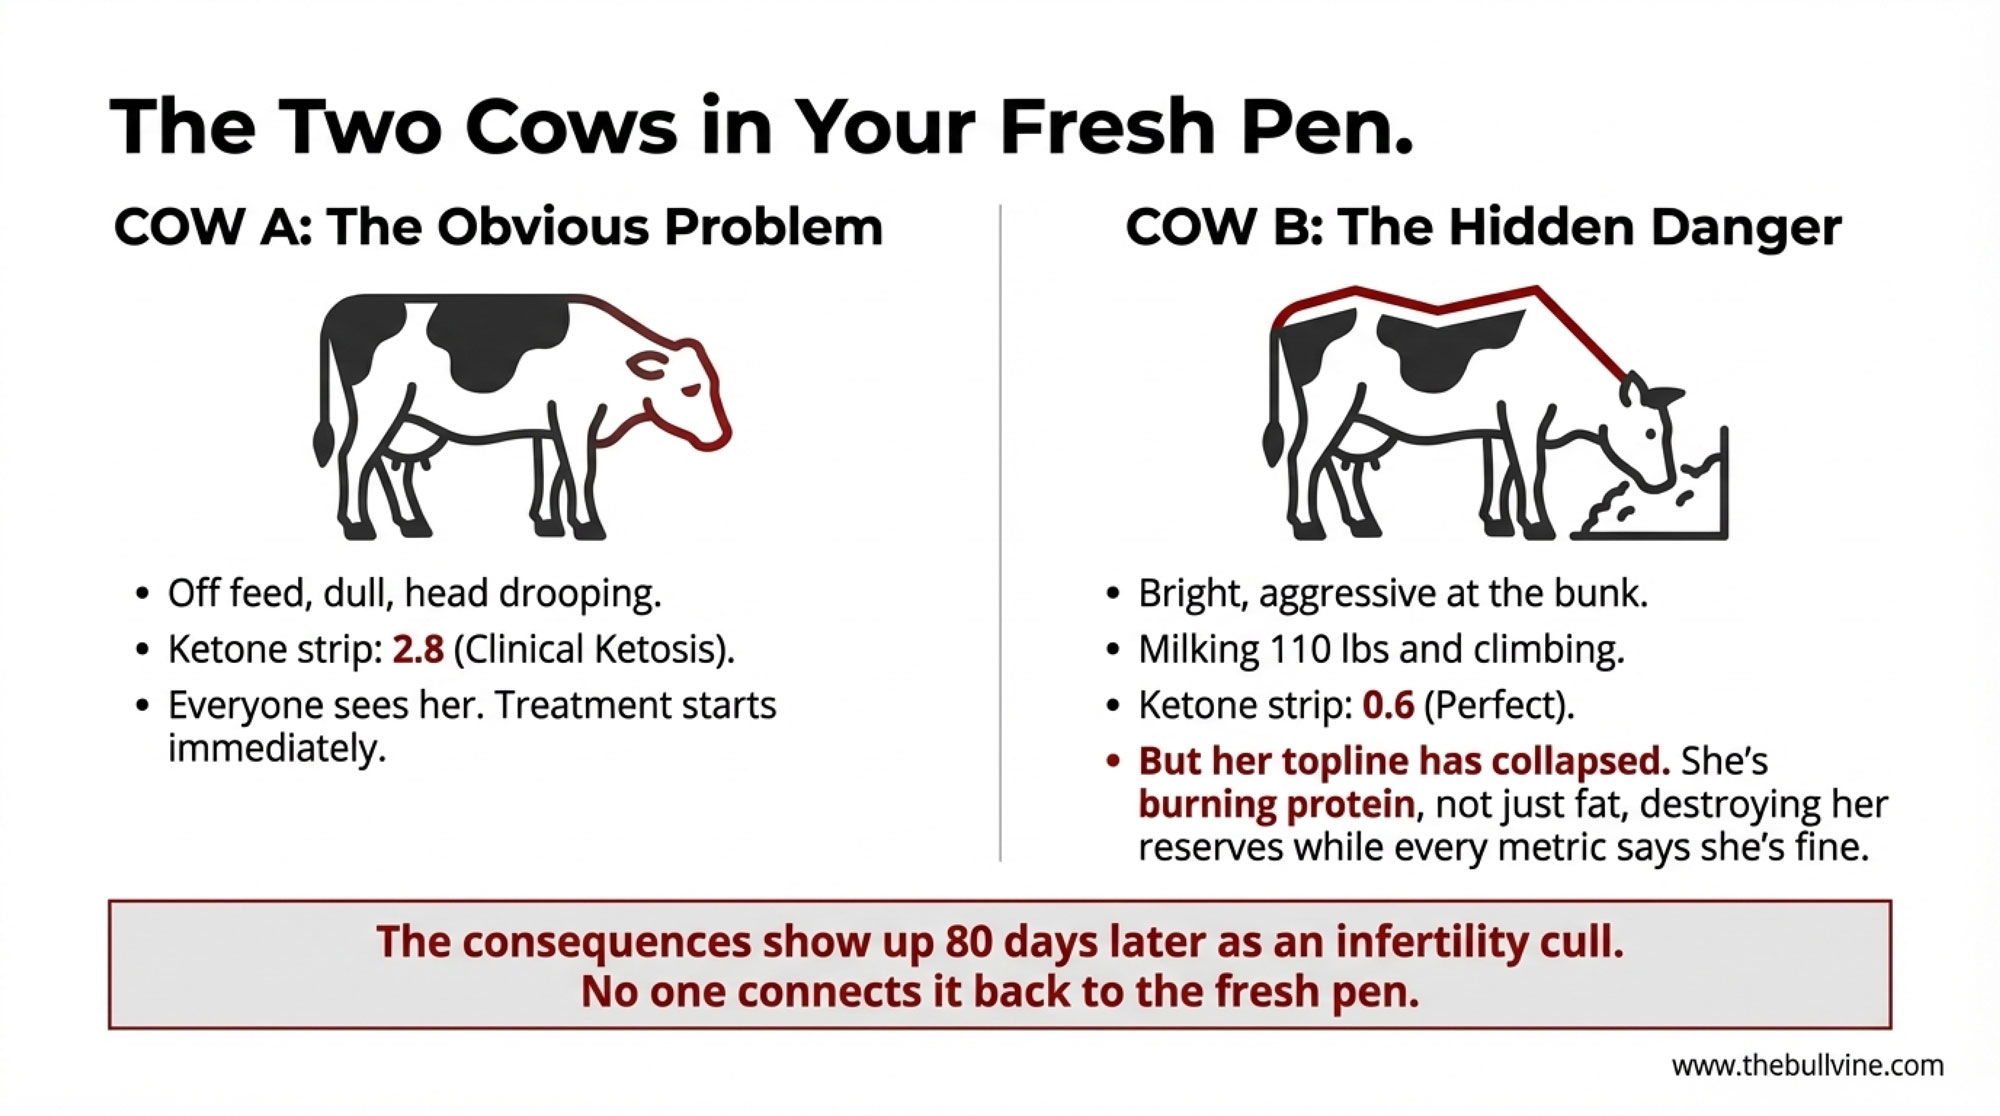
These cows don’t always look sick in the feed alley. But they’re more likely to go on to displaced abomasum, metritis, lower yields, and earlier culling.
| Production Tier | Typical SCK Prevalence (%) | Typical DA Rate per 100 Cows | Typical Cull Rate (%) | Risk Category |
|---|---|---|---|---|
| Lower production (<8,000 kg/cow/yr) | 10–15% | 2–4 | 15–20% | Low Risk |
| Mid-range (8,000–9,500 kg/cow/yr) | 15–22% | 4–6 | 20–25% | Moderate Risk |
| High production (9,500–11,000 kg/cow/yr) | 22–30% | 6–10 | 25–35% | HIGH RISK ← RED TEXT |
| Elite herds (>11,000 kg/cow/yr) | 28–40% | 8–15 | 30–40% | CRITICAL RISK ← RED TEXT, BOLD |
| Seasonal/grazing systems (NZ, Ireland) | 30–45% (concentrated calving) | Highly variable | Variable | SPECIALIZED |
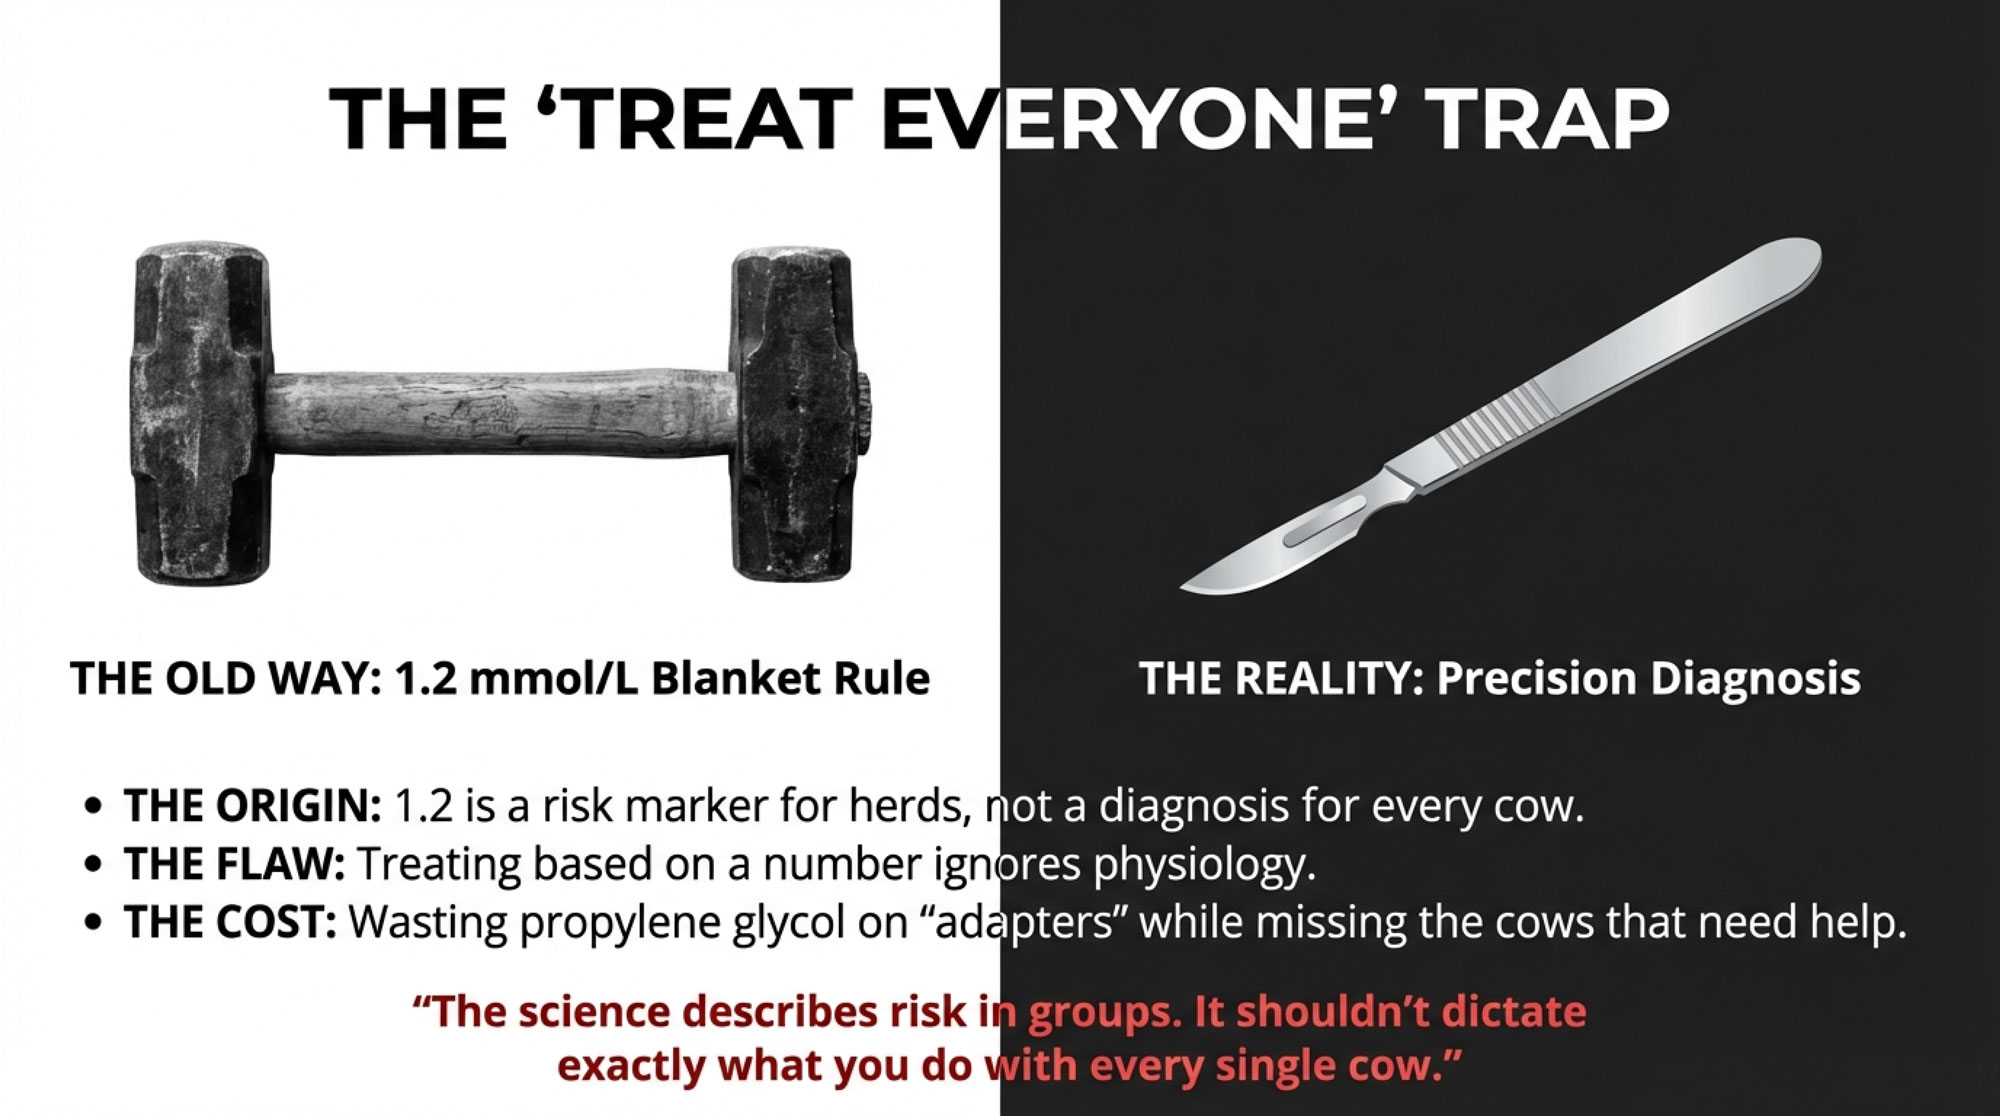
Unless you’re measuring BHB, most of that cost stays hidden. So when you tighten up transition management and add a well‑designed choline program—and it works—the wins often look like fewer DAs, fewer obvious clinical ketosis cases, fewer “mystery” fresh cows that never really get going, and smoother fresh‑cow management overall. There isn’t always a dramatic before‑and‑after photo you can put in a newsletter. Without numbers, it’s easy to underestimate how much you’ve gained.
Subclinical‑ketosis reviews and extension bulletins keep coming back to the same message: if you want to manage SCK well, you need early diagnosis and targeted nutritional strategies. That usually means controlled‑energy dry cow diets, solid DCAD management, and in some herds, correctly timed rumen‑protected choline layered into that fresh‑cow program.
Advisors Have to Decide Which Bottleneck to Fix First
And then there’s the reality of the feed budget. You’re already juggling a long list of transition tools: controlled‑energy dry cow diets, DCAD, rumen‑protected methionine, monensin, yeast and buffers, and organic trace minerals. Not to mention cow comfort, stocking density, and fresh‑cow handling. You just can’t do everything at once.
Recent work on one‑carbon metabolism and methyl donors has added some nuance here. A 2023 Journal of Dairy Science paper by Vailati‑Riboni and colleagues fed rumen‑protected choline and rumen‑protected methionine—separately and together—to Holstein cows from about three weeks before calving through roughly five weeks after calving. They showed that both nutrients changed plasma choline metabolites, amino acids, and liver gene expression tied to one‑carbon and lipid metabolism, and that some of those responses depended on whether the other nutrient was present.
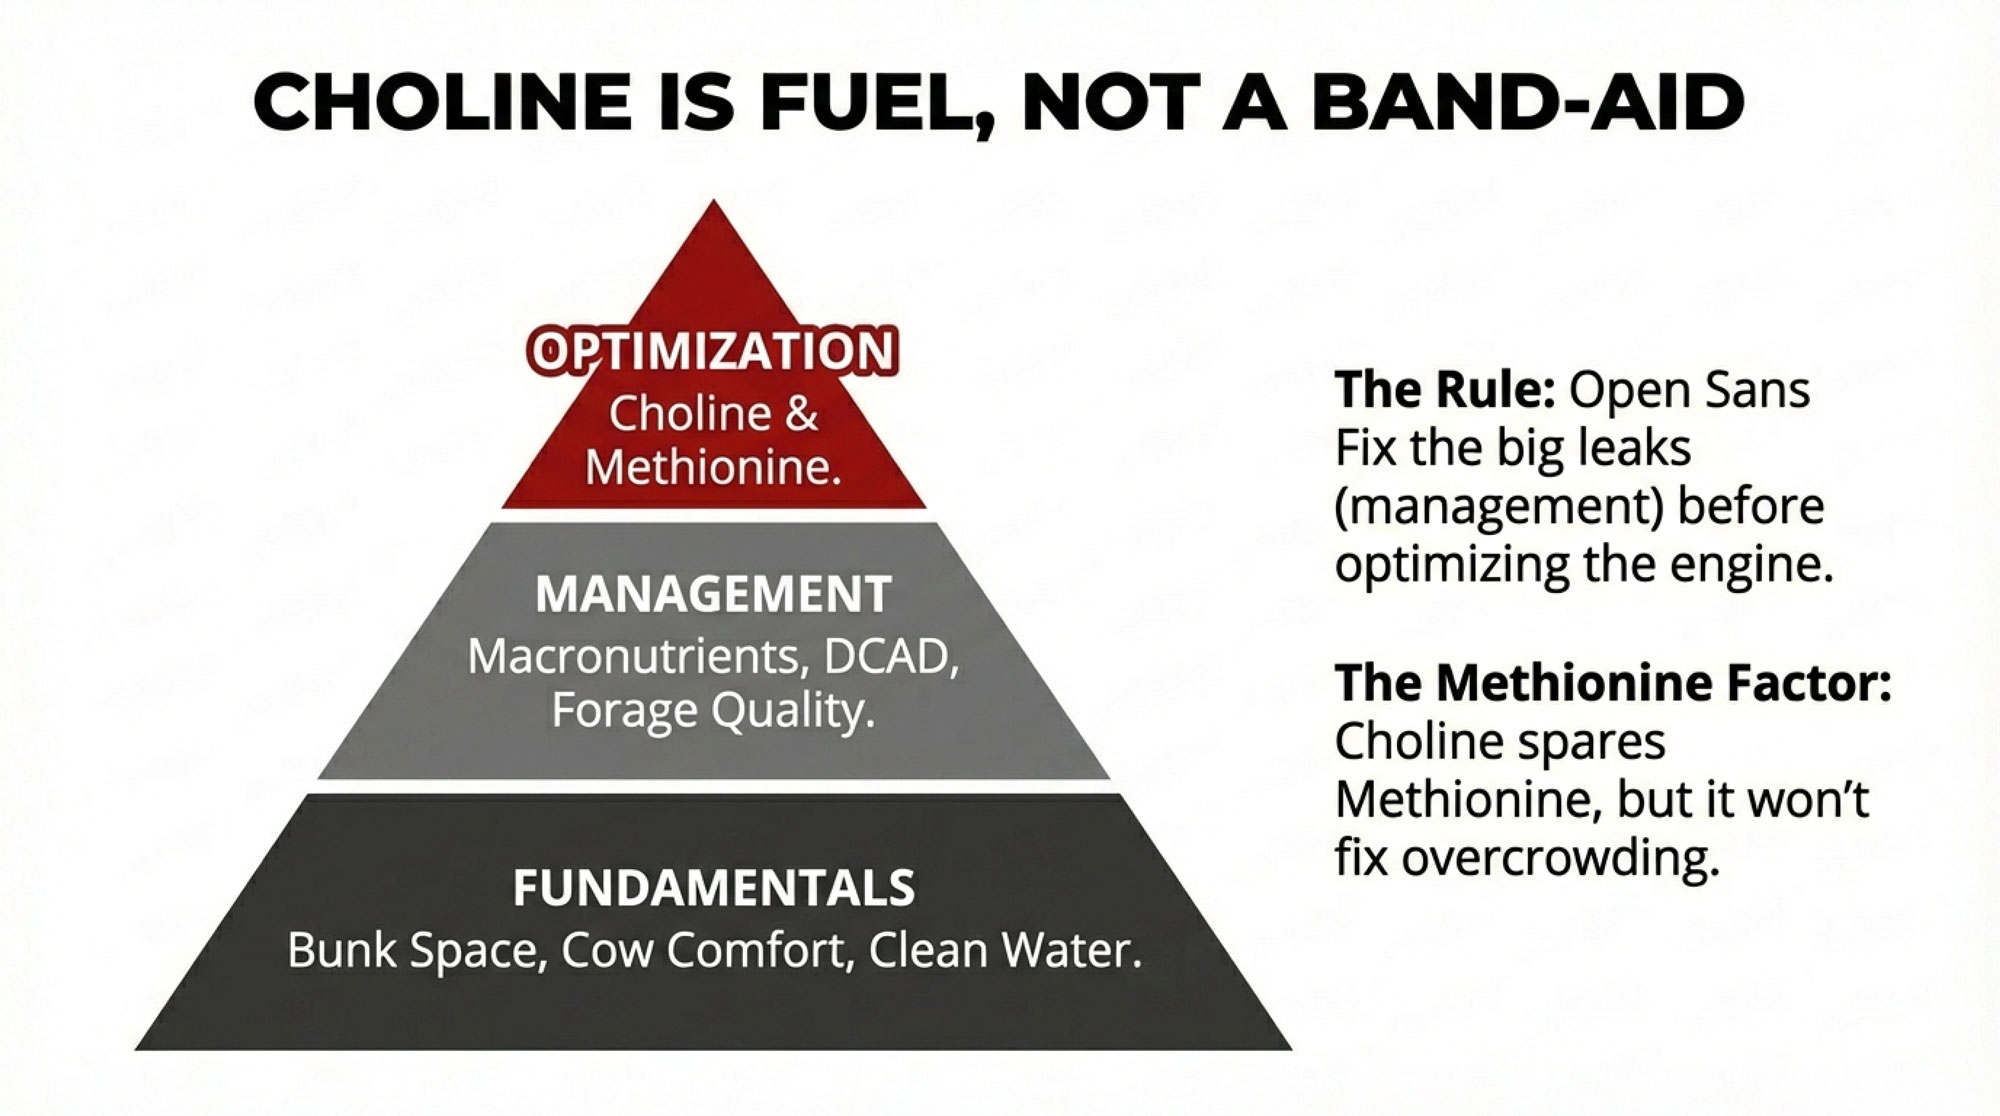
That work, together with earlier trials, shows that methionine and choline are part of a larger system. If methionine is clearly limiting in your base diet, fixing that first often gives you a bigger initial response in dry matter intake, milk yield, and milk protein. Once methionine is where it ought to be, choline’s specific role in supporting phosphatidylcholine synthesis and VLDL export becomes more obvious—especially in higher‑risk, high‑output cows.
Here’s what often gets missed in quick conversations: choline doesn’t just sit beside methionine; it can actually help spare it in one‑carbon metabolism. Choline is oxidized to betaine, and betaine donates methyl groups to regenerate methionine from homocysteine.
In practice, that means choline and methionine are drawing from the same methyl pool, so when you add choline, you can free up methionine for other jobs in the liver and for milk protein. Experimental work has shown that supplying choline can reduce methionine use in some transmethylation pathways, and milk responses to rumen‑protected choline tend to be smaller when methionine in the post‑calving diet is already high. That’s why you’ll hear choline described as functionally “methionine‑sparing” in certain high‑demand situations.
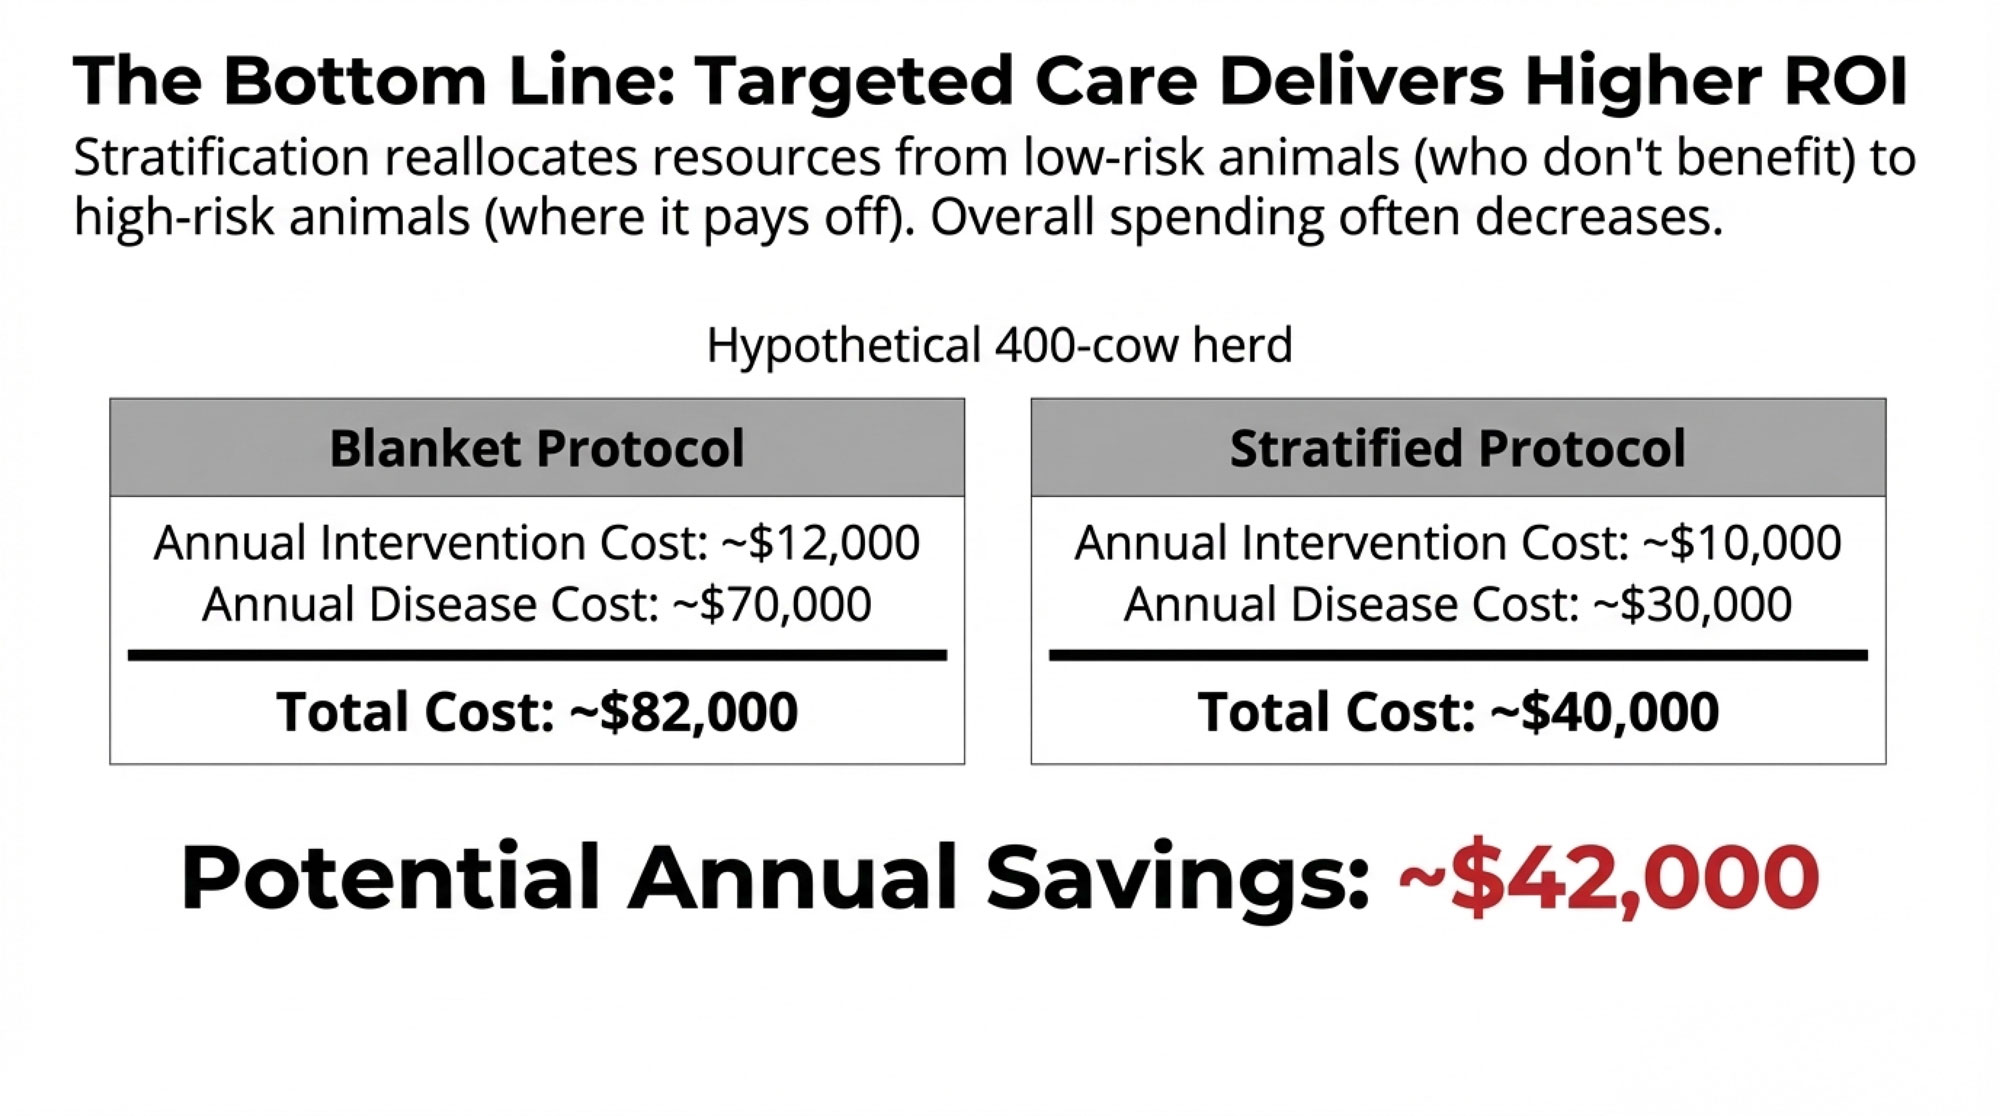
So the real question isn’t “methionine or choline?” It’s “Where’s the main bottleneck in this herd right now?” On some farms—especially those already feeding rumen‑protected methionine, with good DCAD and solid fresh‑cow management in place but still wrestling with too much ketosis and too many DAs—choline moves up the priority list. On others, you may decide to tackle management and amino acid balance first and come back to choline once those bigger leaks are plugged.
| Transition Tool / Management | If You Have Poor Fundamentals (DA >8%, SCK >30%) | If You Have Solid Fundamentals (DA 3–5%, SCK 15–20%) | If You Have Excellent Transition Health (DA <2%, SCK <10%) | Est. Cost/Cow/60 Days |
|---|---|---|---|---|
| Controlled-Energy Dry Cow Diet + DCAD Management | PRIORITY 1 | Already in place | Already in place | $8–12 |
| Rumen-Protected Methionine | Priority 2 | PRIORITY 1 | Consider | $4–6 |
| Rumen-Protected Choline (−21 to +21) | Priority 3 | PRIORITY 2 | Lower priority | $6–9 |
| Monensin + Fresh Cow Management | Parallel (ongoing) | Parallel (ongoing) | Parallel (ongoing) | $1–2 |
How Producers Are Actually Testing Choline on Their Farms
Given all that, the practical question becomes: how do you decide whether rumen‑protected choline deserves a spot in your transition program this year?
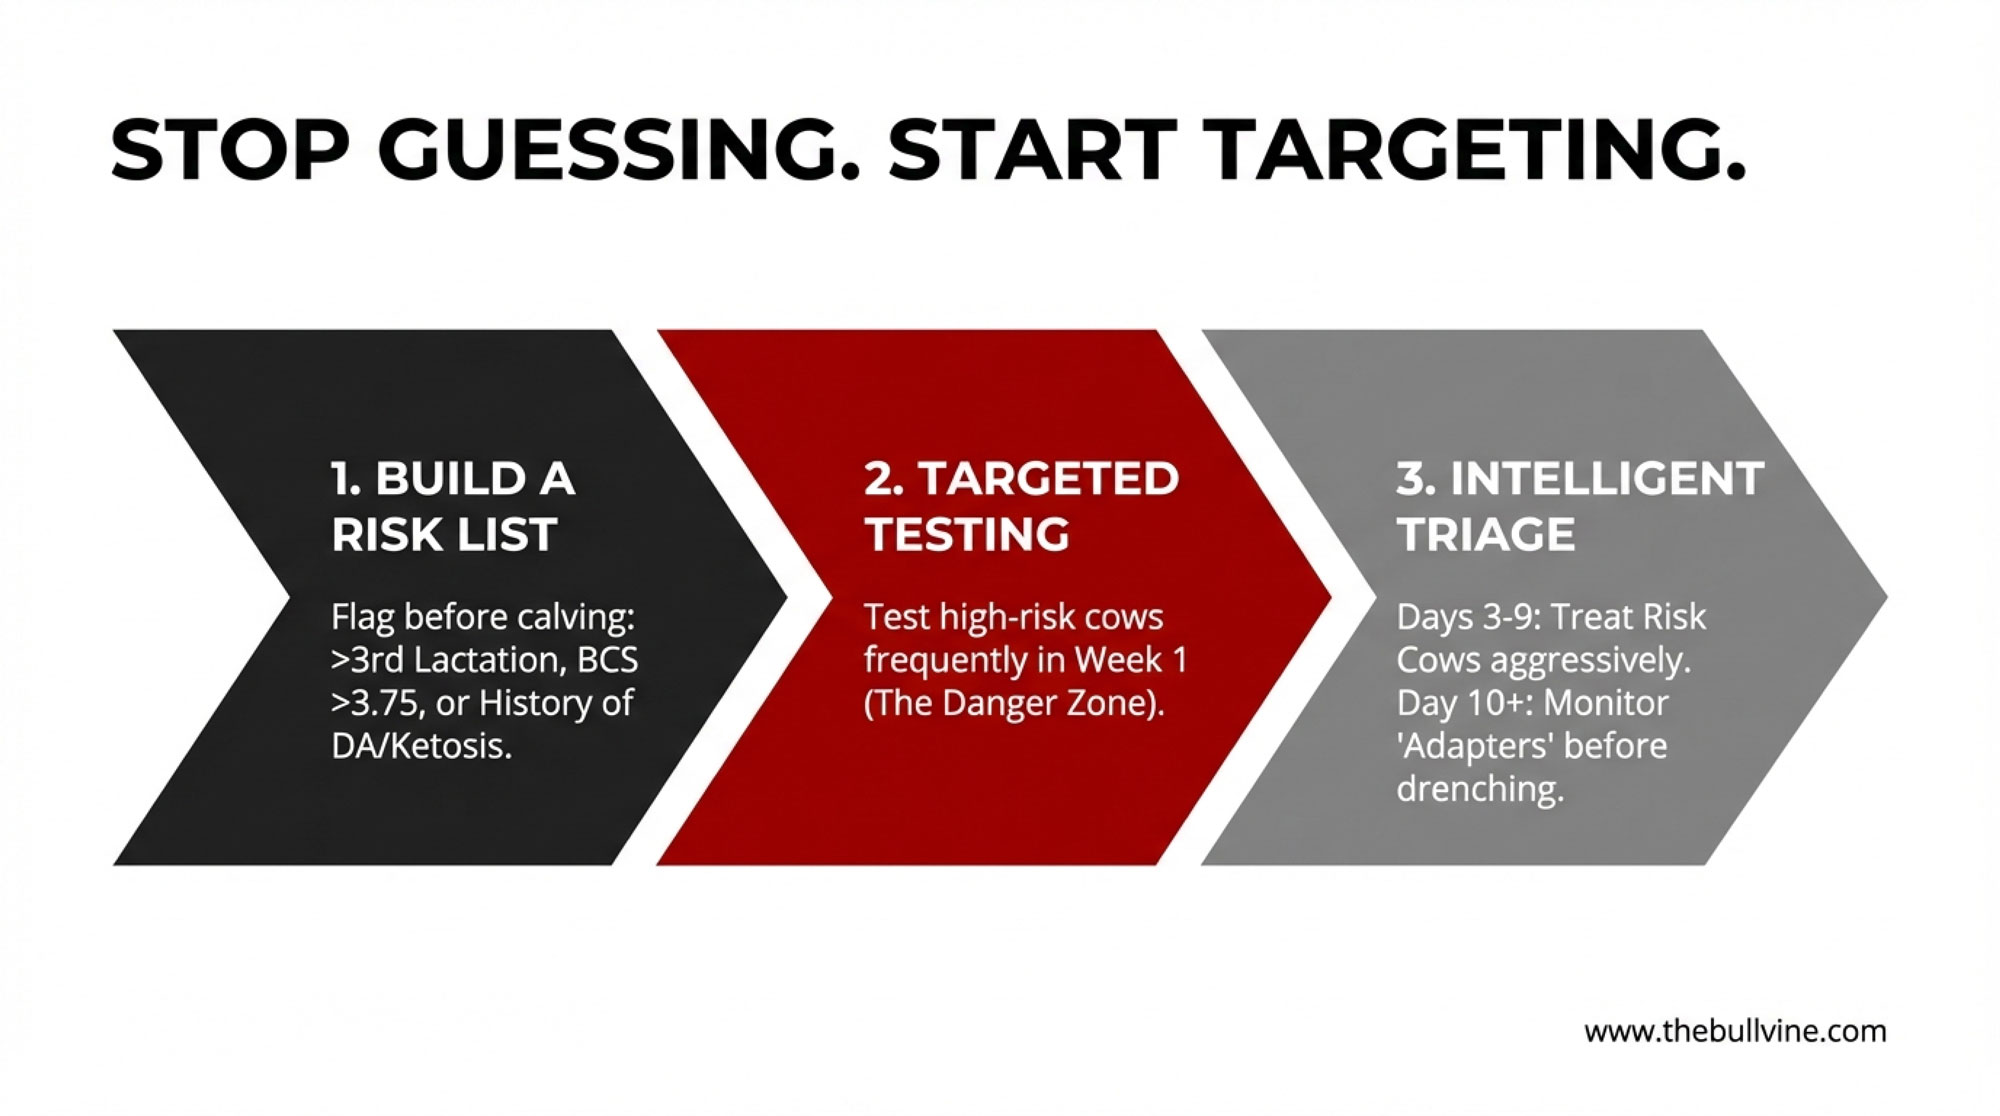
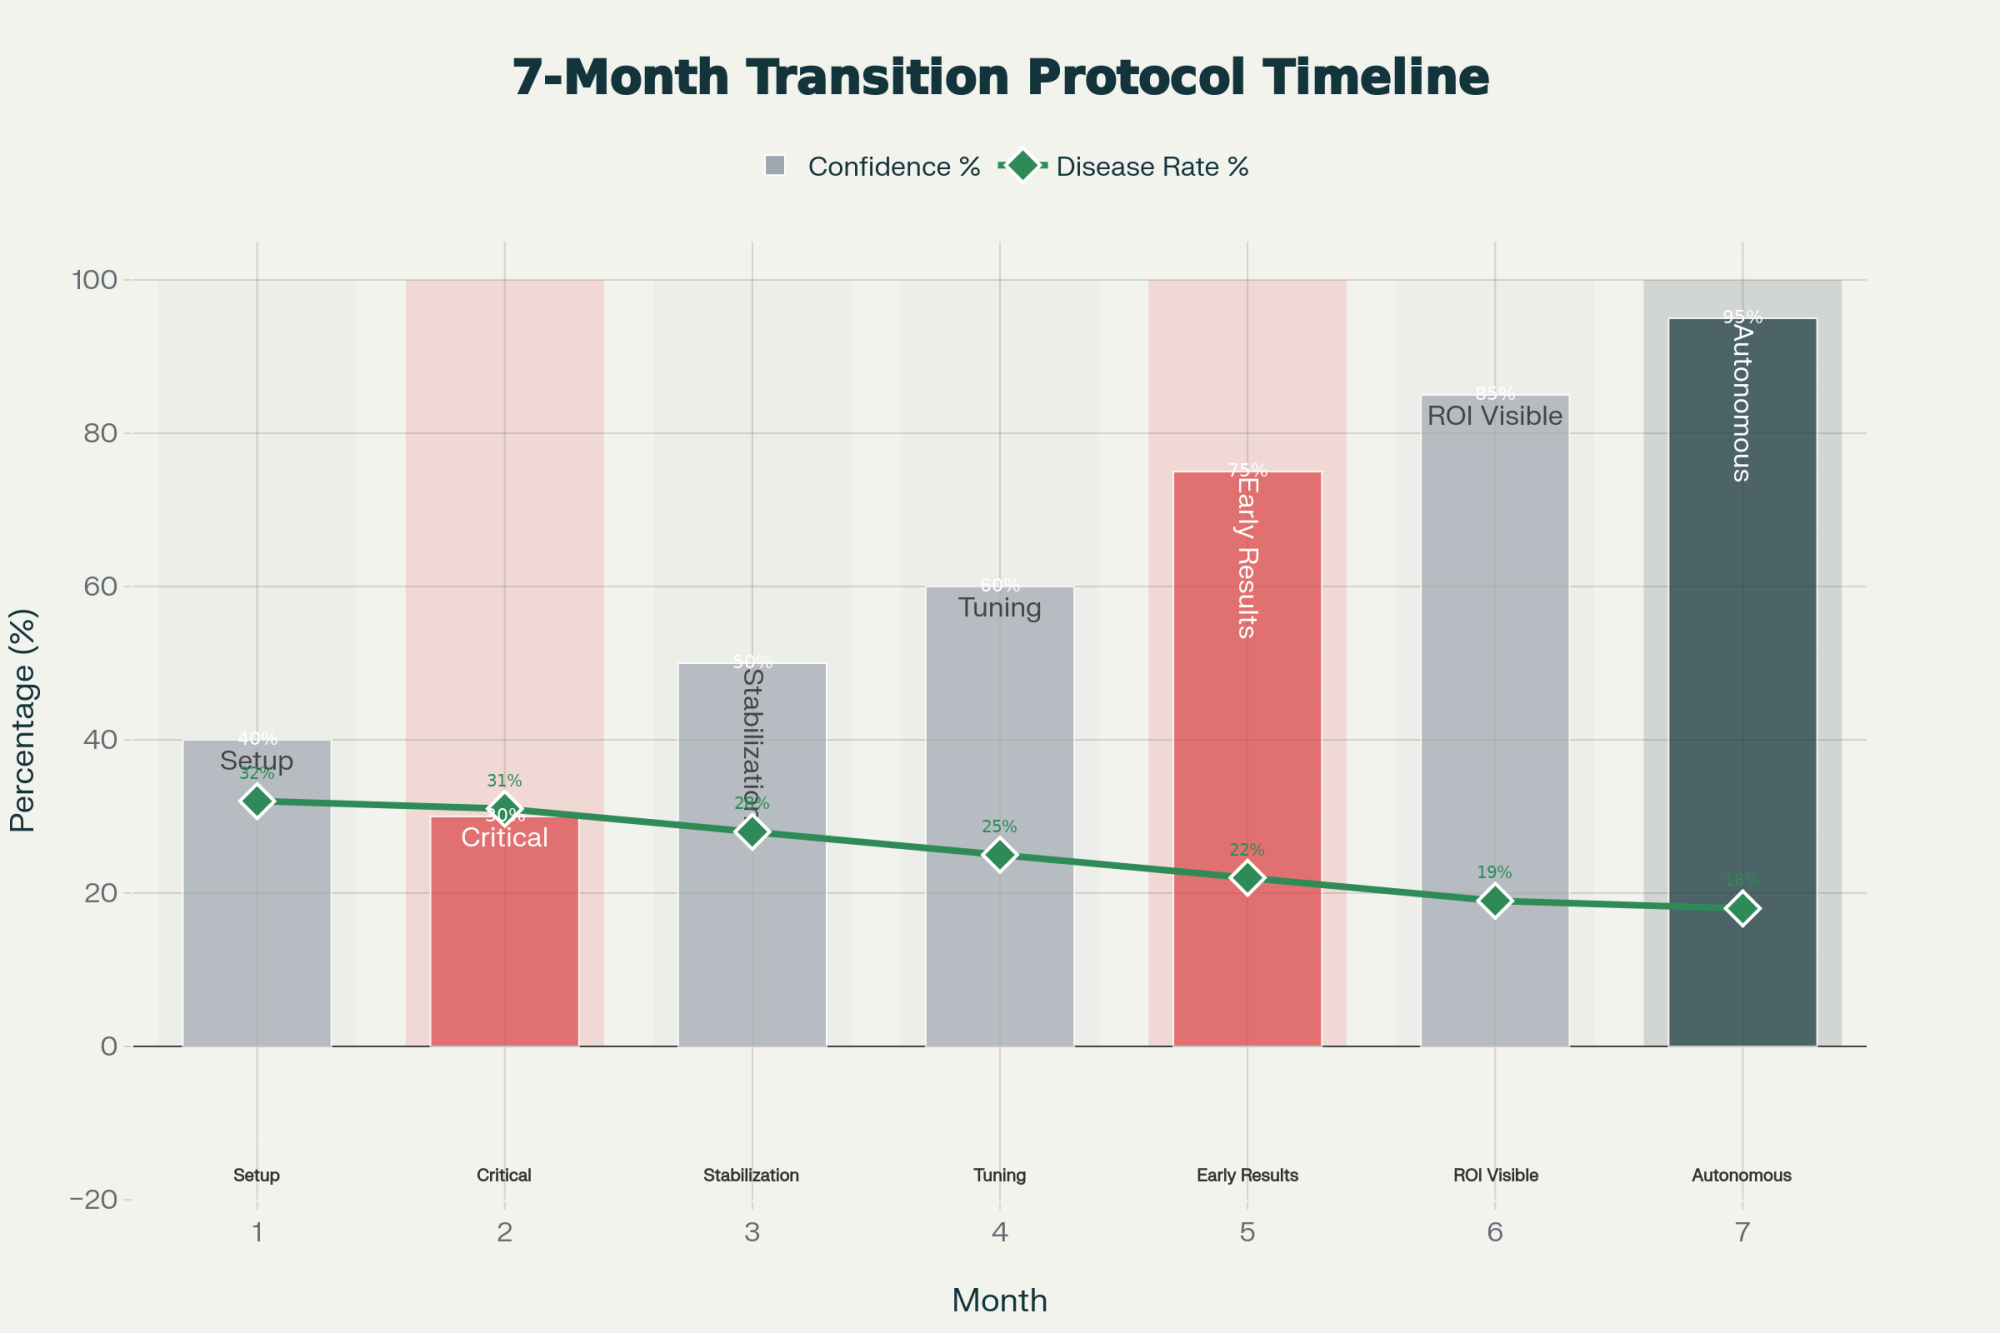
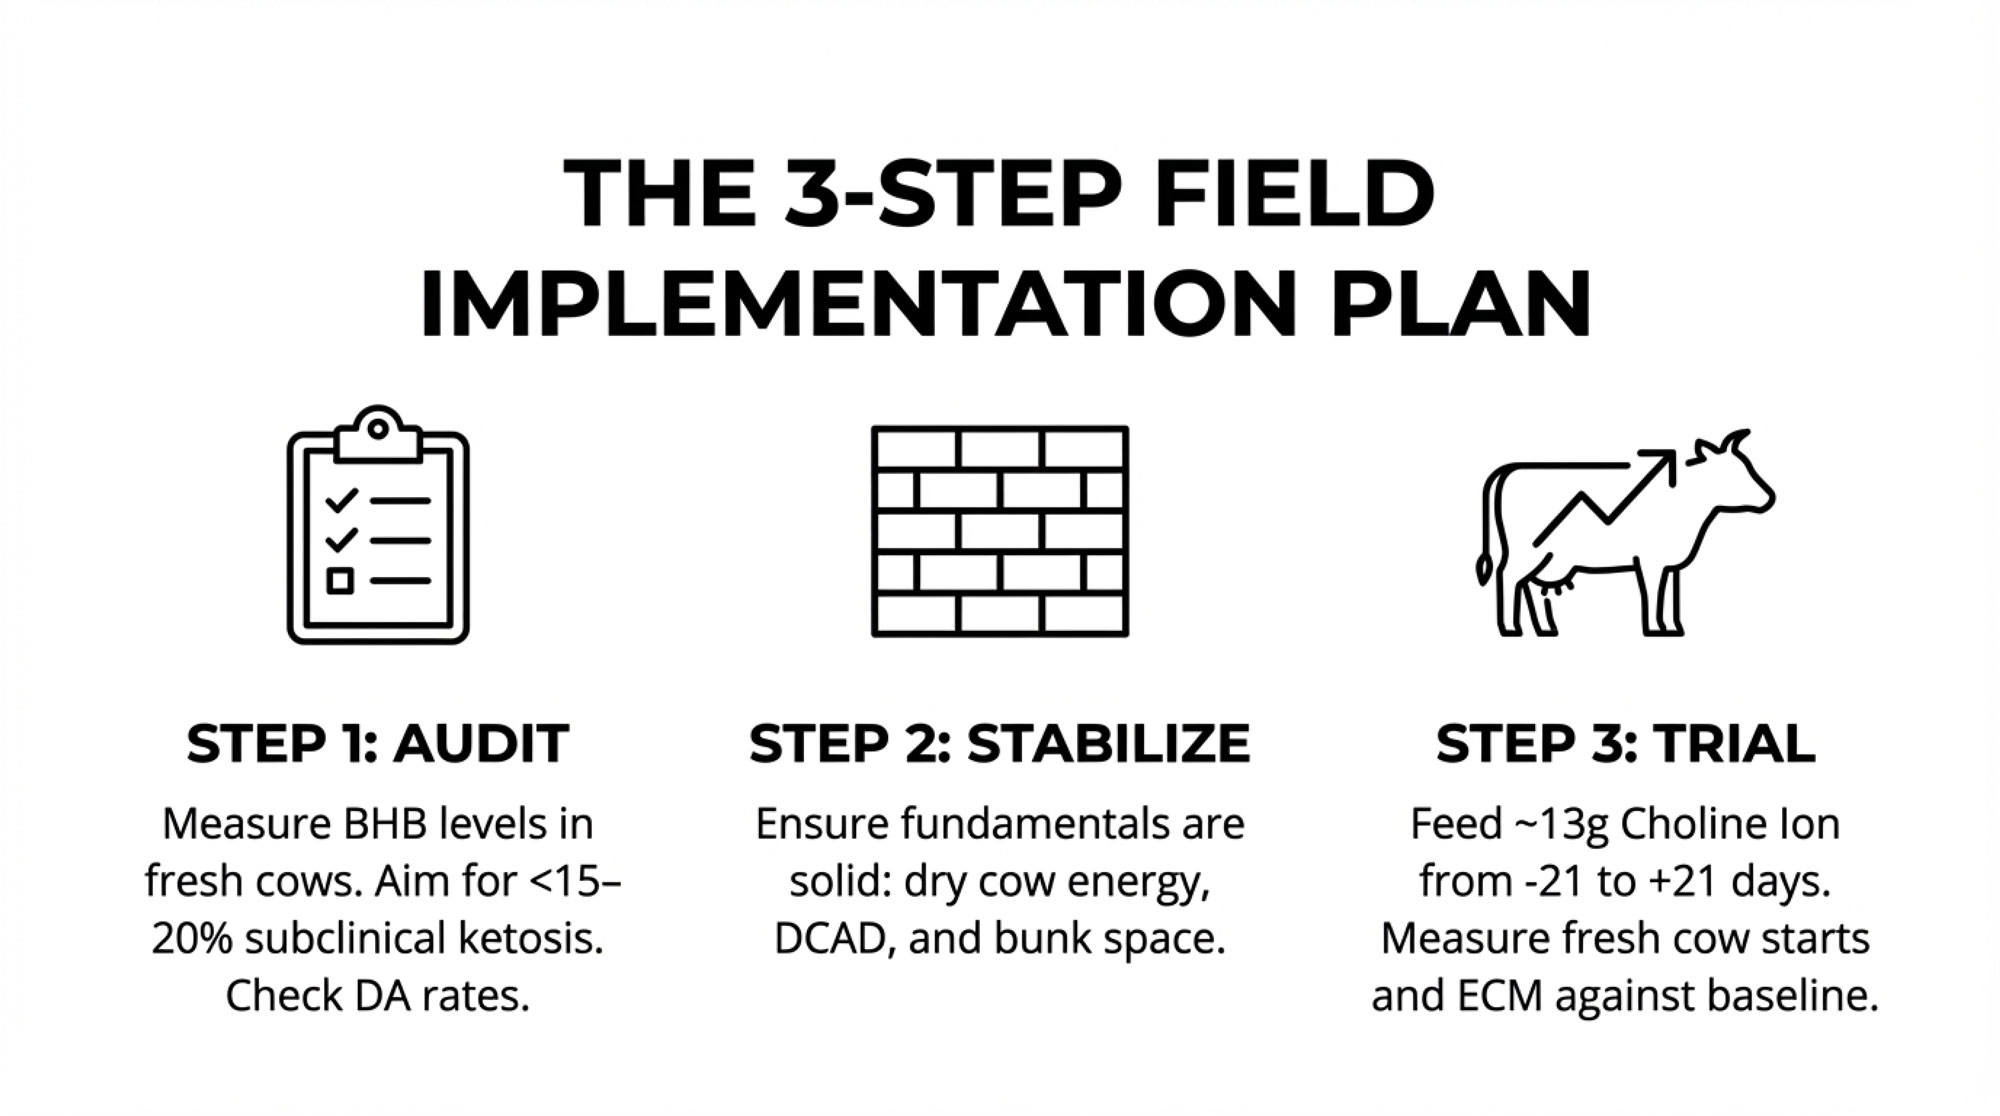
What I’ve found, talking with producers who feel confident in their choline decisions, is that they all went through some version of the same three‑step process. They measured where they were. They made sure the basics were in order. Then they ran a structured trial with real numbers.
Step 1: Get a Clear Baseline on Transition Risk
Looking at this trend on progressive operations, the first move is often a simple metabolic snapshot.
| BHB Test Result (7–14 DIM) | Interpretation | Typical Herds Affected | Recommended Action |
|---|---|---|---|
| <1.0 mmol/L average | Excellent metabolic status | ~5–10% of herds | Maintain current transition program; choline optional |
| 1.0–1.2 mmol/L average | Borderline; mild subclinical ketosis present | ~20–30% of herds | Audit DCAD and energy; consider choline if other factors solid |
| 1.2–1.5 mmol/L average | Moderate SCK; metabolic stress evident | ~40–50% of herds | Fix fundamentals first; add choline after DCAD/energy confirmed |
| >1.5 mmol/L average | Severe SCK; crisis-level metabolic drag | ~10–20% of herds (mostly very high-output) | Full transition overhaul: DCAD, energy, management, then choline (may come 2nd or 3rd priority) |
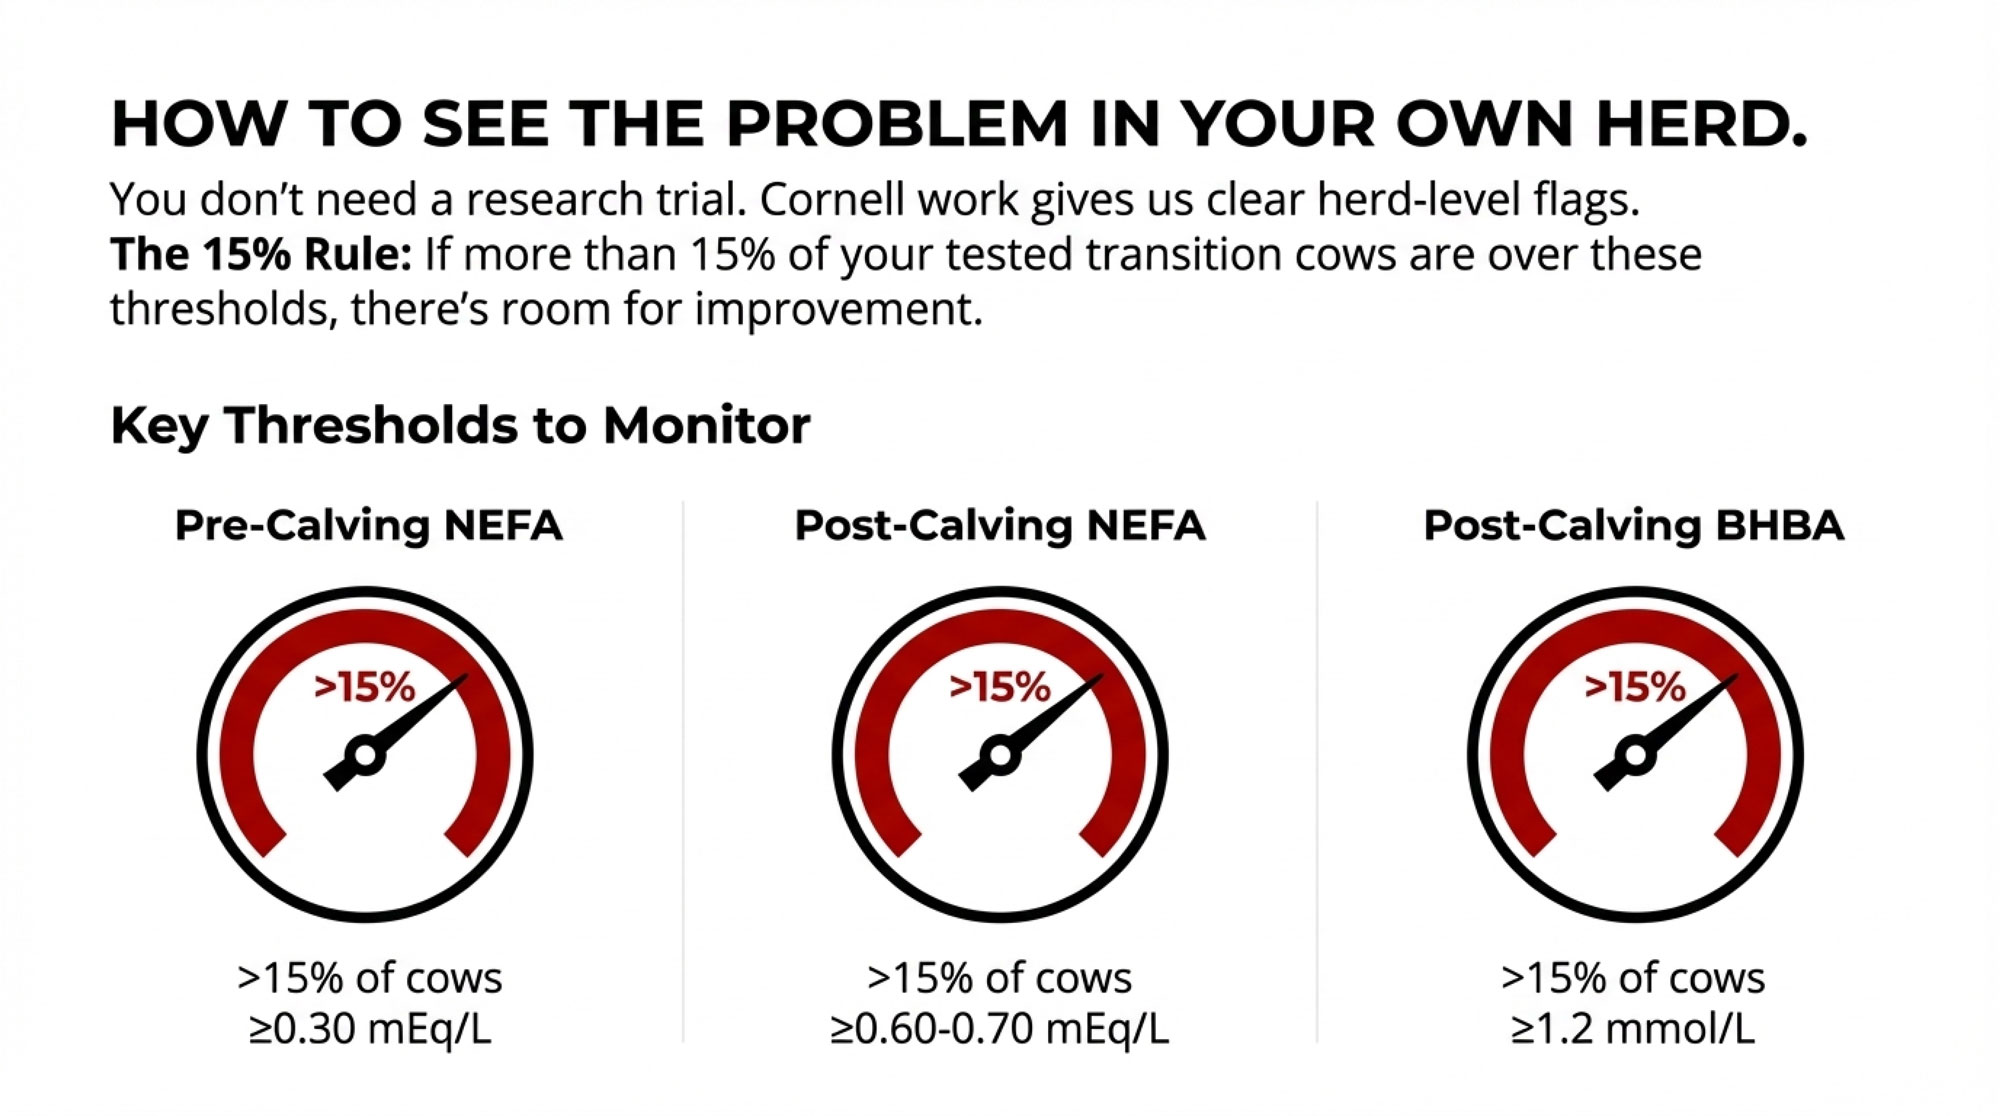
That usually starts with testing a group of fresh cows—say 10 to 20 animals—at about 7 to 14 days in milk for blood β‑hydroxybutyrate using a handheld meter or lab analysis. Large subclinical‑ketosis studies summarized by McArt and others suggest that if a significant portion of those cows are above a threshold around 1.2–1.4 mmol/L, then SCK is part of your reality, whether the cows look “sick” or not.
The next step is to pull 12 months of fresh‑cow records and look hard at displaced abomasum, clinical ketosis, retained placenta, metritis in the first 30 days, and early culls or deaths.
In one 500‑cow Wisconsin freestall herd I worked with, the owner felt transition was “pretty good.” When we actually tested BHB on 20 fresh cows and pulled the disease records, we found subclinical‑ketosis prevalence north of 25% and more DAs than anyone had realized—numbers very much in line with what those field studies describe. That’s the kind of gap that makes choline—and a broader transition rethink—worth a serious look.
Extension‑style teams and herd‑health groups in North America and Europe are increasingly recommending exactly this kind of early‑lactation “metabolic check‑up” as a core part of transition planning. It replaces “I think we’re okay” with “here’s what our numbers actually say,” which makes conversations about choline and other tools a lot more grounded.
Step 2: Make Sure the Fundamentals Are Solid
Choline works best when it’s layered onto good fresh‑cow management. It doesn’t replace it.
Most advisors will want to see that:
- Dry and close‑up diets are balanced correctly for energy and fiber, and DCAD is being managed, where that’s part of the program, to reduce clinical and subclinical milk fever risk.
- Cows spend something close to three weeks in a true close‑up group instead of bouncing in and out for a couple of days.
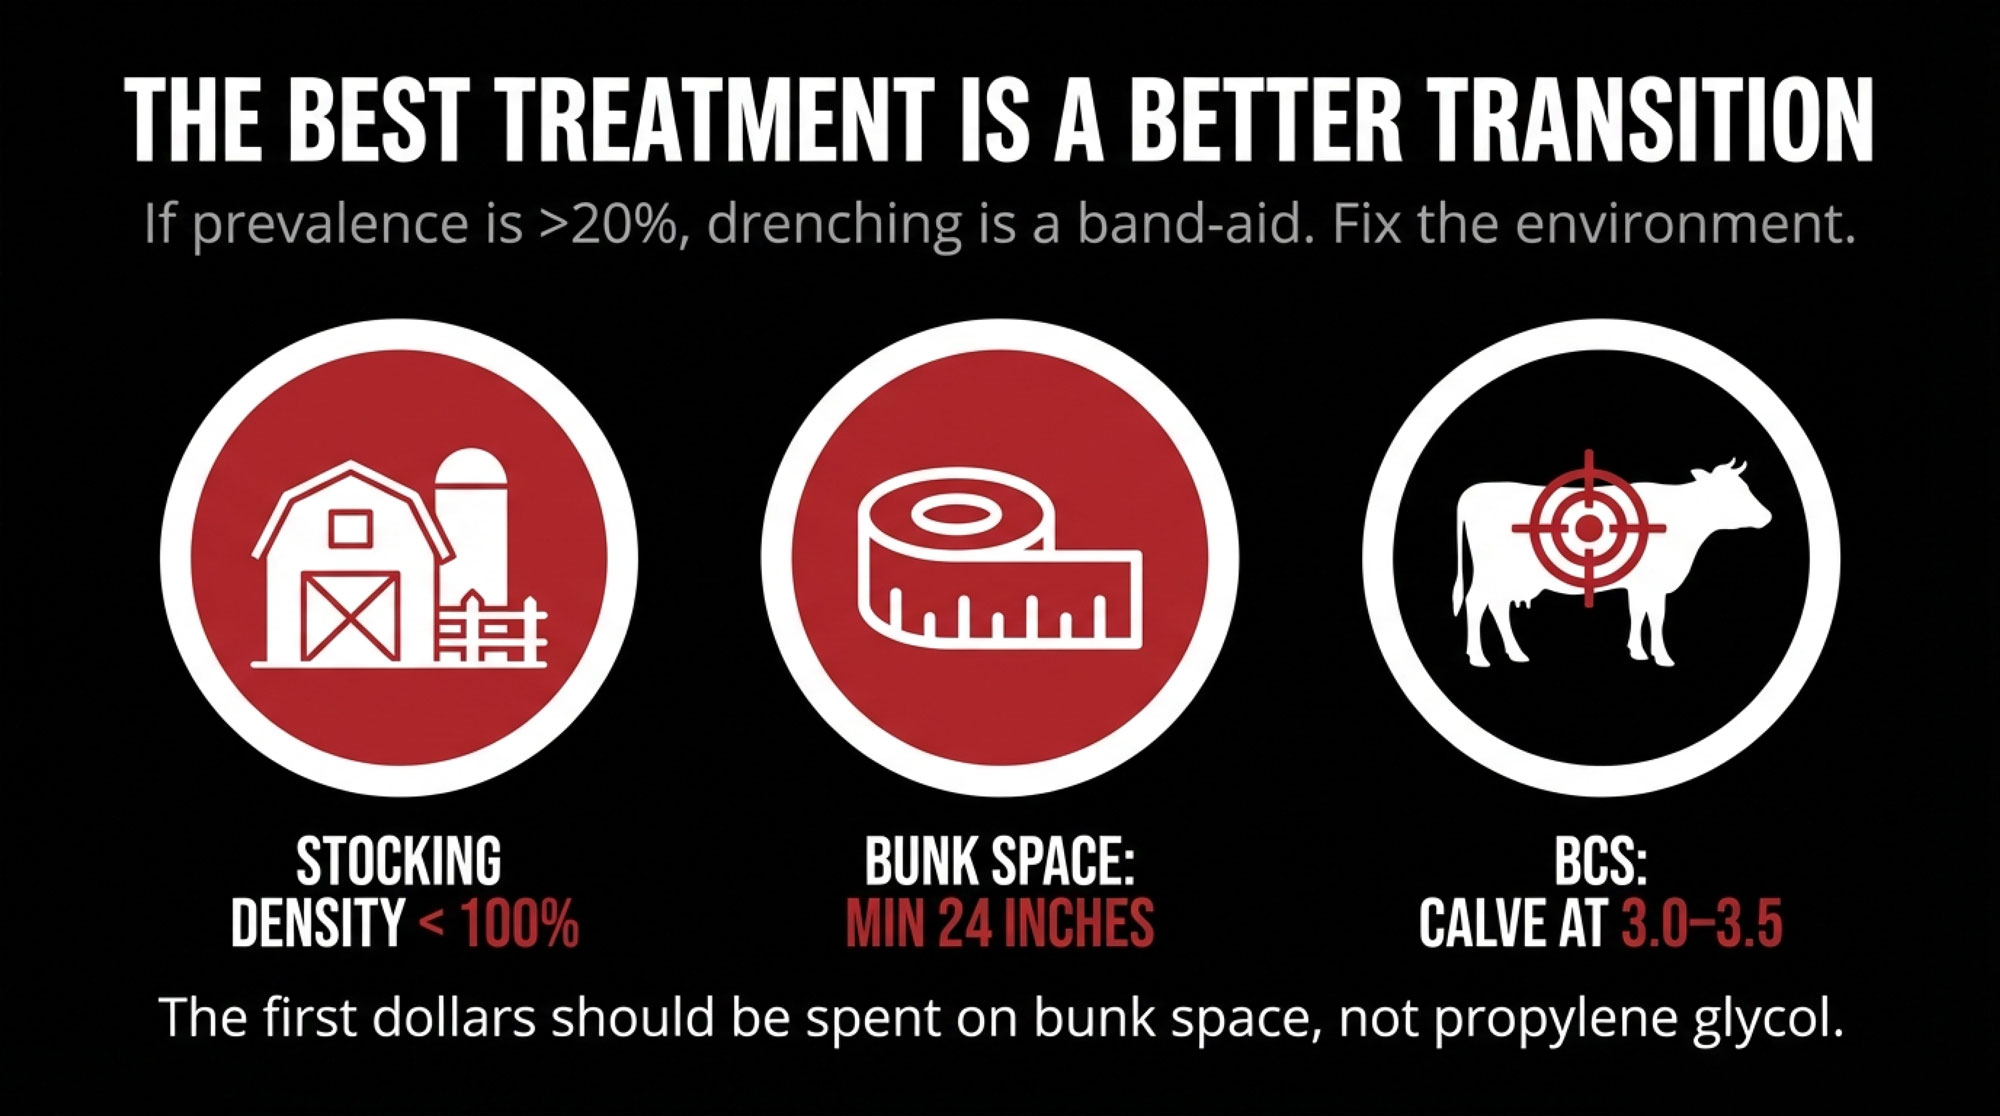
- Fresh‑cow management—whether you’re in freestalls in Ontario, tiestall barns in Quebec, or dry lot systems in California—gives cows clean feed, adequate bunk space, comfortable lying areas, and consistent feed push‑ups.
In many herds, butterfat performance, rumination data, and manure consistency are still some of the quickest checks on how the rumen is coping with the transition ration.
If those pieces are seriously off, rumen‑protected choline on its own usually won’t deliver the kind of response the research makes possible. Don’t ask choline to fix overcrowding or bad bedding—fix those first, then see what your livers can really do.
Step 3: Choose a Product on Evidence, Then Run a Trial
Once you’re comfortable with your basics and your data indicate that transition risk is high enough to warrant concern, then it’s time to talk products and trials.
Producers and nutritionists who are comfortable with their choline programs tend to ask suppliers some very practical questions:
- Do you have independent data on rumen protection—lab or research work showing how much of the choline survives rumen conditions?
- Do you have TMR‑stability data at six and 24 hours after mixing, especially under feeding schedules like ours?
- How is the choline encapsulated, and has that technology been independently evaluated in peer‑reviewed work?
- Can you point to published research that used this specific product or encapsulation system at similar doses and feeding windows?
Once a product clears that bar, a simple on‑farm trial might look like this:
- Randomly assign upcoming calvings to two groups over a defined period (for example, three to four months).
- Feed your current close‑up and fresh ration to both groups.
- Add rumen‑protected choline to one group at a rate that supplies around 13–14 grams of choline ion per day from about 21 days before calving to 21 days after calving, matching the research dose and timing.
- For both groups, measure BHB in a subset of cows at 7–14 days in milk and track transition events, including displaced abomasum, clinical ketosis, retained placenta, metritis, and early culls and deaths.
- Follow early‑lactation milk and butterfat performance closely on both groups, using DHI data or parlour software.
It won’t be perfect—no farm trial ever is. But it’ll answer the question that really matters: in your cows, on your forages, in your system, does this choline program pay its way?
What This Means for Your Herd This Year
With all of that on the table, what does the choline story really mean for 2025–2026—especially in a year when margins can swing on you pretty quickly?
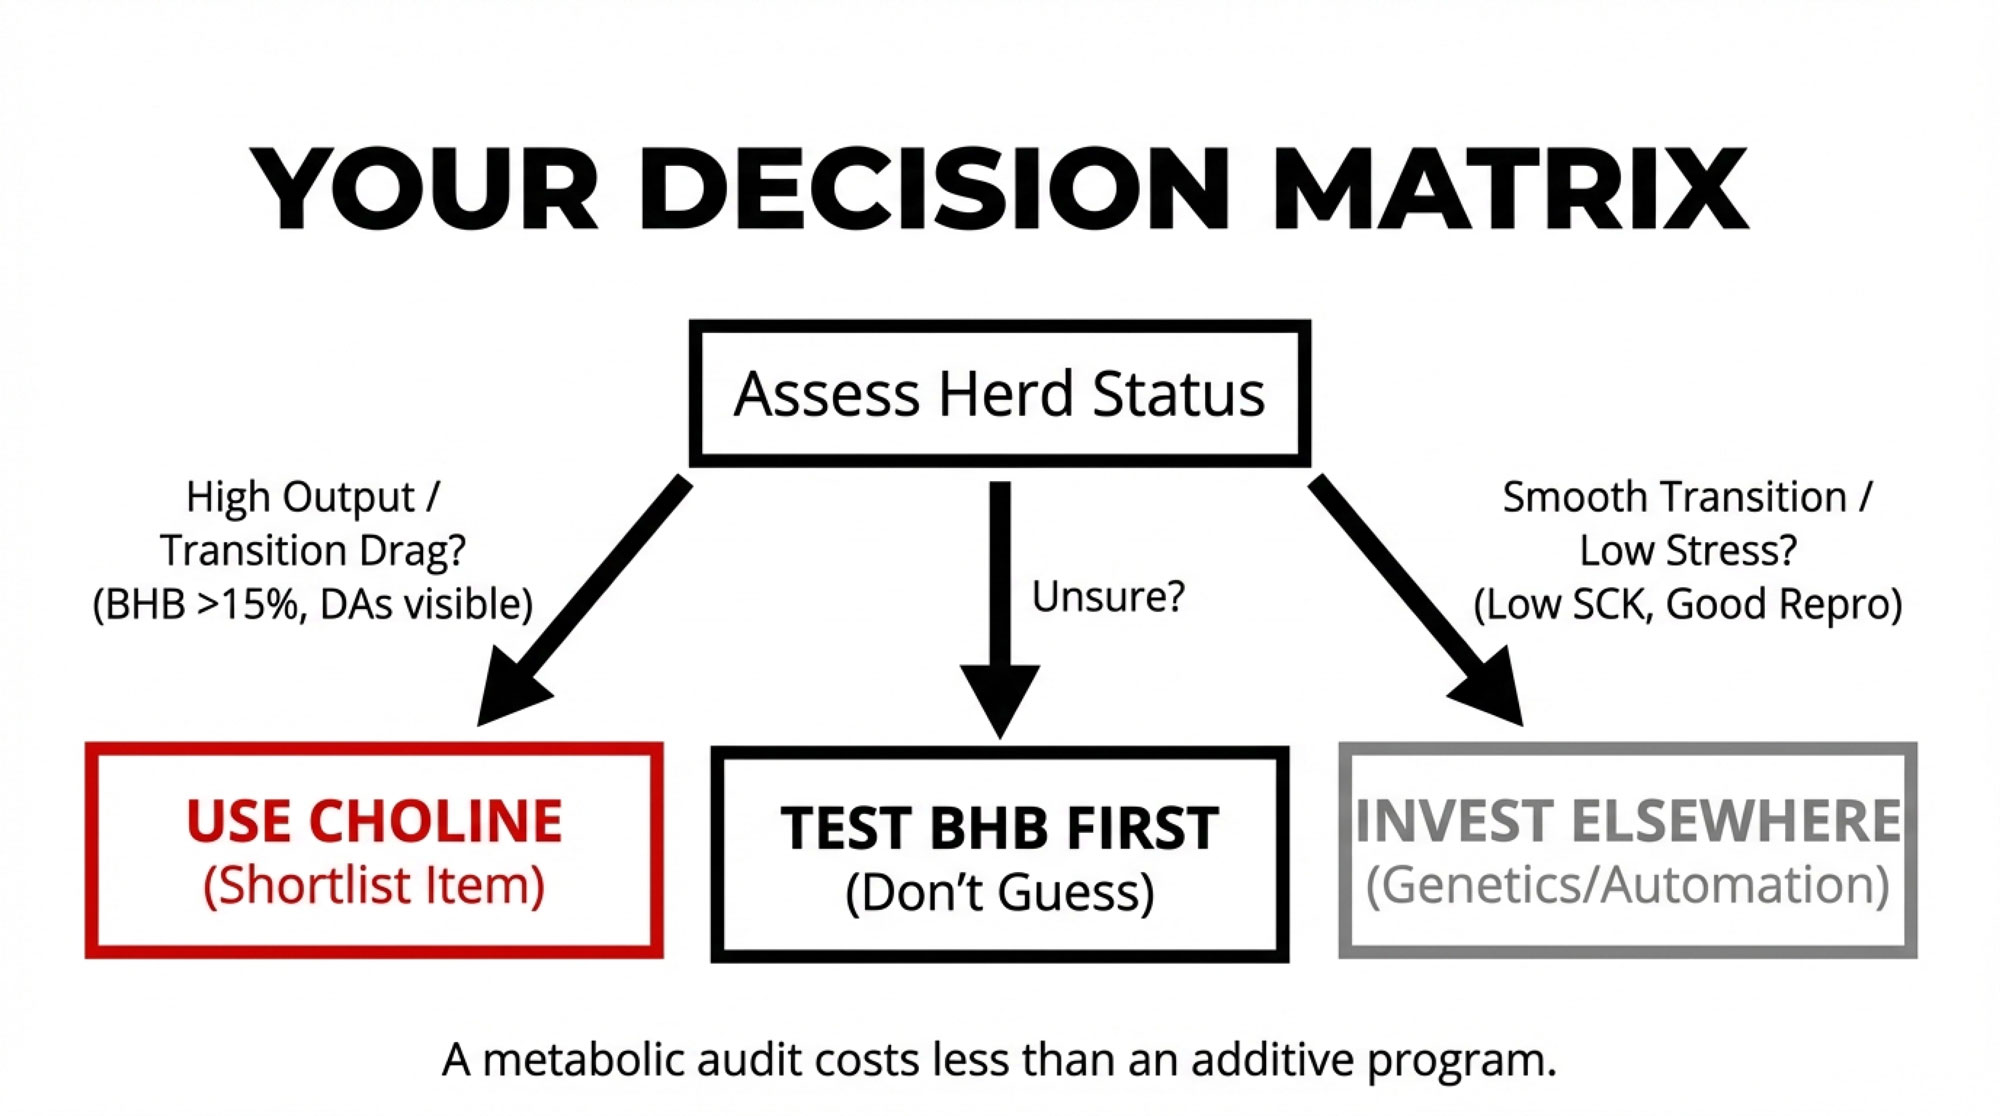
Three Simple Decision Rules
If your herd is high‑output and your transition numbers are only “okay,” choline belongs on your shortlist. If you’re in that roughly 9,000–12,000-kilogram-per-cow range and your BHB tests or DA and ketosis records show more metabolic drag than you’re comfortable with, the odds are pretty good that your cows’ livers are under exactly the kind of pressure the choline research is talking about.
If subclinical ketosis is low and transition health is excellent, choline may still help—but it’s probably not your first dollar. If your SCK prevalence is low, displaced abomasums are rare, butterfat levels and fresh‑cow health look strong, and reproduction is where you want it, choline might still give some biological benefit, especially for very high‑producing cows. But it’ll be competing with other investments—genetics, forage quality, automation—for your next upgrade.
If you’re not sure how bad your transition issues are, measure before you spend. A focused BHB and fresh‑cow disease audit over a few months costs far less than a full additive program. The numbers you get back will tell you whether choline deserves serious attention this year or whether other bottlenecks are more urgent.
The Next Three Moves
If you’re thinking seriously about choline over the next 12 months, here’s a simple path that’s working well for a lot of herds:
- Run a 2–3 month BHB and fresh‑cow health audit so you actually know your transition risk and where you stand relative to the subclinical‑ketosis and DA levels reported in the large field studies and extension summaries.
- Sit down with your nutritionist and rank your biggest bottlenecks—energy, amino acids, choline, or management. That’s where the one‑carbon and methionine–choline work really helps frame what to fix first.
- If choline makes the shortlist, test a −21 to +21 DIM, roughly 13 g/day choline‑ion program in a structured on‑farm trial and let your own milk, health, and cull numbers tell you whether it earns a permanent spot in the ration.
If your herd is already hitting low SCK, low DAs, and strong early‑lactation milk and butterfat performance, choline may still have a role. But it’ll be fighting for your next dollar alongside some pretty good alternatives. If your numbers tell a rougher story, not stress‑testing a focused choline program in this kind of margin environment might actually be the more expensive choice.
In many larger Holstein herds in places like Wisconsin, the Northeast, California, and parts of western Europe—especially those wrestling with transition health and wanting more consistent fresh‑cow performance—the evidence says rumen‑protected choline deserves a serious look. For smaller or lower‑producing herds with excellent transition metrics, it may sit a little further down the priority list.
- Either way, the science and field experience now give you a clear framework to evaluate rumen‑protected choline as one more tool to help transition cows come through those 42 days around calving in better shape—ready to do the job they were bred for, and to do it profitably.
Key Takeaways
- The sweet spot: ~13 g/day choline ion, fed from −21 to +21 days around calving. That’s where 21 trials and 1,313 cows say the milk gains are most consistent.
- The milk math: Expect around +1.6–1.7 kg ECM/day—roughly US$40–45/cow in early-lactation value under typical component pricing, before you count avoided DAs or ketosis cases.
- The fine print: Health benefits are real but variable. Choline helps the liver, but it won’t fix overcrowding, bad DCAD, or sloppy fresh-cow management.
- The decision rule: If your SCK is above 15–20% and DAs keep showing up, choline belongs on your shortlist. If transitions are already smooth, your next dollar probably goes elsewhere.
- The first move: Test BHB on 10–20 fresh cows before you spend. Let your own numbers—not a sales pitch—tell you if choline pays on your farm.
Complete references and supporting documentation are available upon request by contacting the editorial team at editor@thebullvine.com.
Learn More
- The 15:1 ROI Protocol: How Anti-Inflammatory Treatment is Cutting Transition Disease in Half – Arms you with a low-cost, high-impact intervention that slashes fresh cow disease by 50%. This protocol delivers a massive 15:1 return by tackling hidden inflammation before it hijacks your transition milk and glucose.
- Dairy Profit Squeeze 2025: Why Your Margins Are About to Collapse (And What to Do About It) – Navigate the brutal economic forces of 2025 with this aggressive roadmap to protect your equity. It breaks down collapsing milk prices and reveals the risk management tools needed to survive the structural squeeze.
- The 2026 Breeding Playbook: Using Calf‑Health Genomics and Beef‑on‑Dairy to Unlock $50,000 in Your Herd– Exposes the hidden profits in your maternity pen by linking new calf-health genomics to beef-on-dairy math. You’ll gain a competitive advantage using 2026’s groundbreaking health traits to secure a $50,000 bottom-line boost.
 Join the Revolution!
 Join the Revolution!
Join over 30,000 successful dairy professionals who rely on Bullvine Weekly for their competitive edge. Delivered directly to your inbox each week, our exclusive industry insights help you make smarter decisions while saving precious hours every week. Never miss critical updates on milk production trends, breakthrough technologies, and profit-boosting strategies that top producers are already implementing. Subscribe now to transform your dairy operation’s efficiency and profitability—your future success is just one click away.