Glenn Kline ran the numbers at $3,110 heifers. The cows he kept were not the ones he expected.
Executive Summary: Record‑high replacement heifer prices — topping $3,110 per head in October 2025 — have pushed a lot of dairies to keep cows longer, but the math says that instinct is upside down. A five‑year study of 3,003 cows on 29 Swiss farms found that hanging onto unprofitable cows costs about three times more than culling them a bit early, and Penn State’s NAHMS work shows 73.2% of U.S. culls are still driven by health and fertility failures, not strategy. When you add Lunak’s finding that it takes more than three lactations to pay off a heifer that only averages 2.7 lactations before she leaves, “one more lactation” stops being a brag point and starts looking like the costliest habit in your barn. This feature walks through barn‑floor math for a 400‑cow herd using current USDA milk prices, cull cow values, and feed costs, showing how just ten marginal cows can quietly erase $3,750–$6,000 in 150 days. You then get a simple three‑filter screen (DIM, production versus group, SCC, and pregnancy status) plus practical use of Dr. Victor Cabrera’s Retention Pay‑Off calculator and Albert De Vries’ “profitability per cow per year” lens to make real keep‑or‑replace calls. A 30/90/365‑day action plan spells out what to change first if you’re leaning hard on beef‑on‑dairy, running high first‑lactation percentages, or managing under Canadian quota.
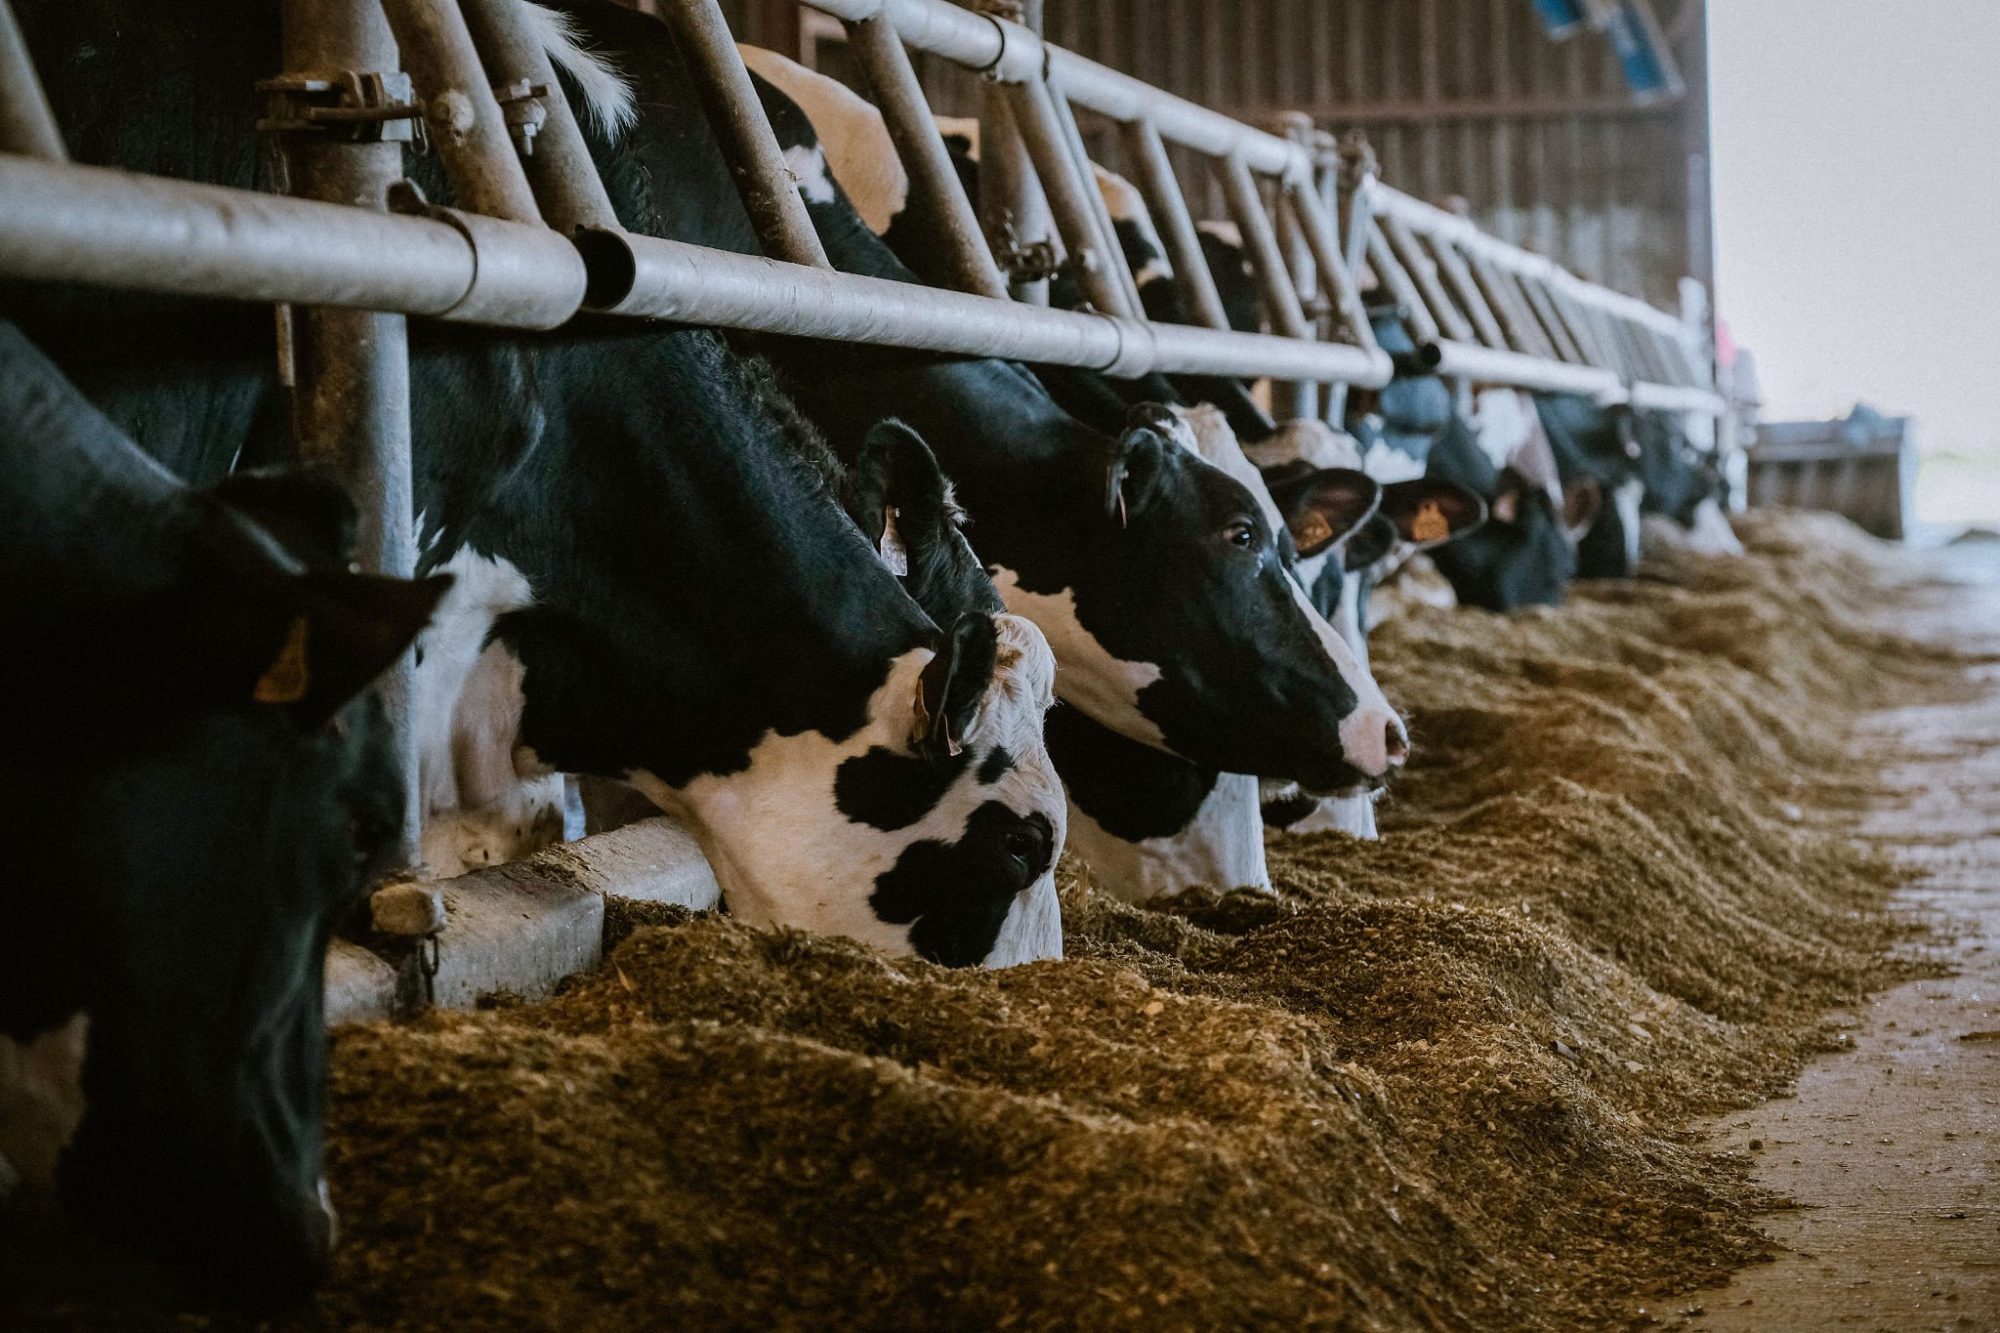
Glenn Kline doesn’t agonize over which cows stay and which ones go. At Y Run Farms in Pennsylvania, he genomically tests everything, breeds his lower performers to beef, and uses IVF to concentrate replacements from his top females. “Back in 2011, we started on genomic testing, and boy, that’s made a huge difference on our herd,” Kline told the audience at CDCB’s 2025 industry meeting at World Dairy Expo. His approach is ruthlessly cow-by-cow. And at current heifer prices, that precision is worth more than ever.
| Date | Heifer Price (USD/head) |
|---|---|
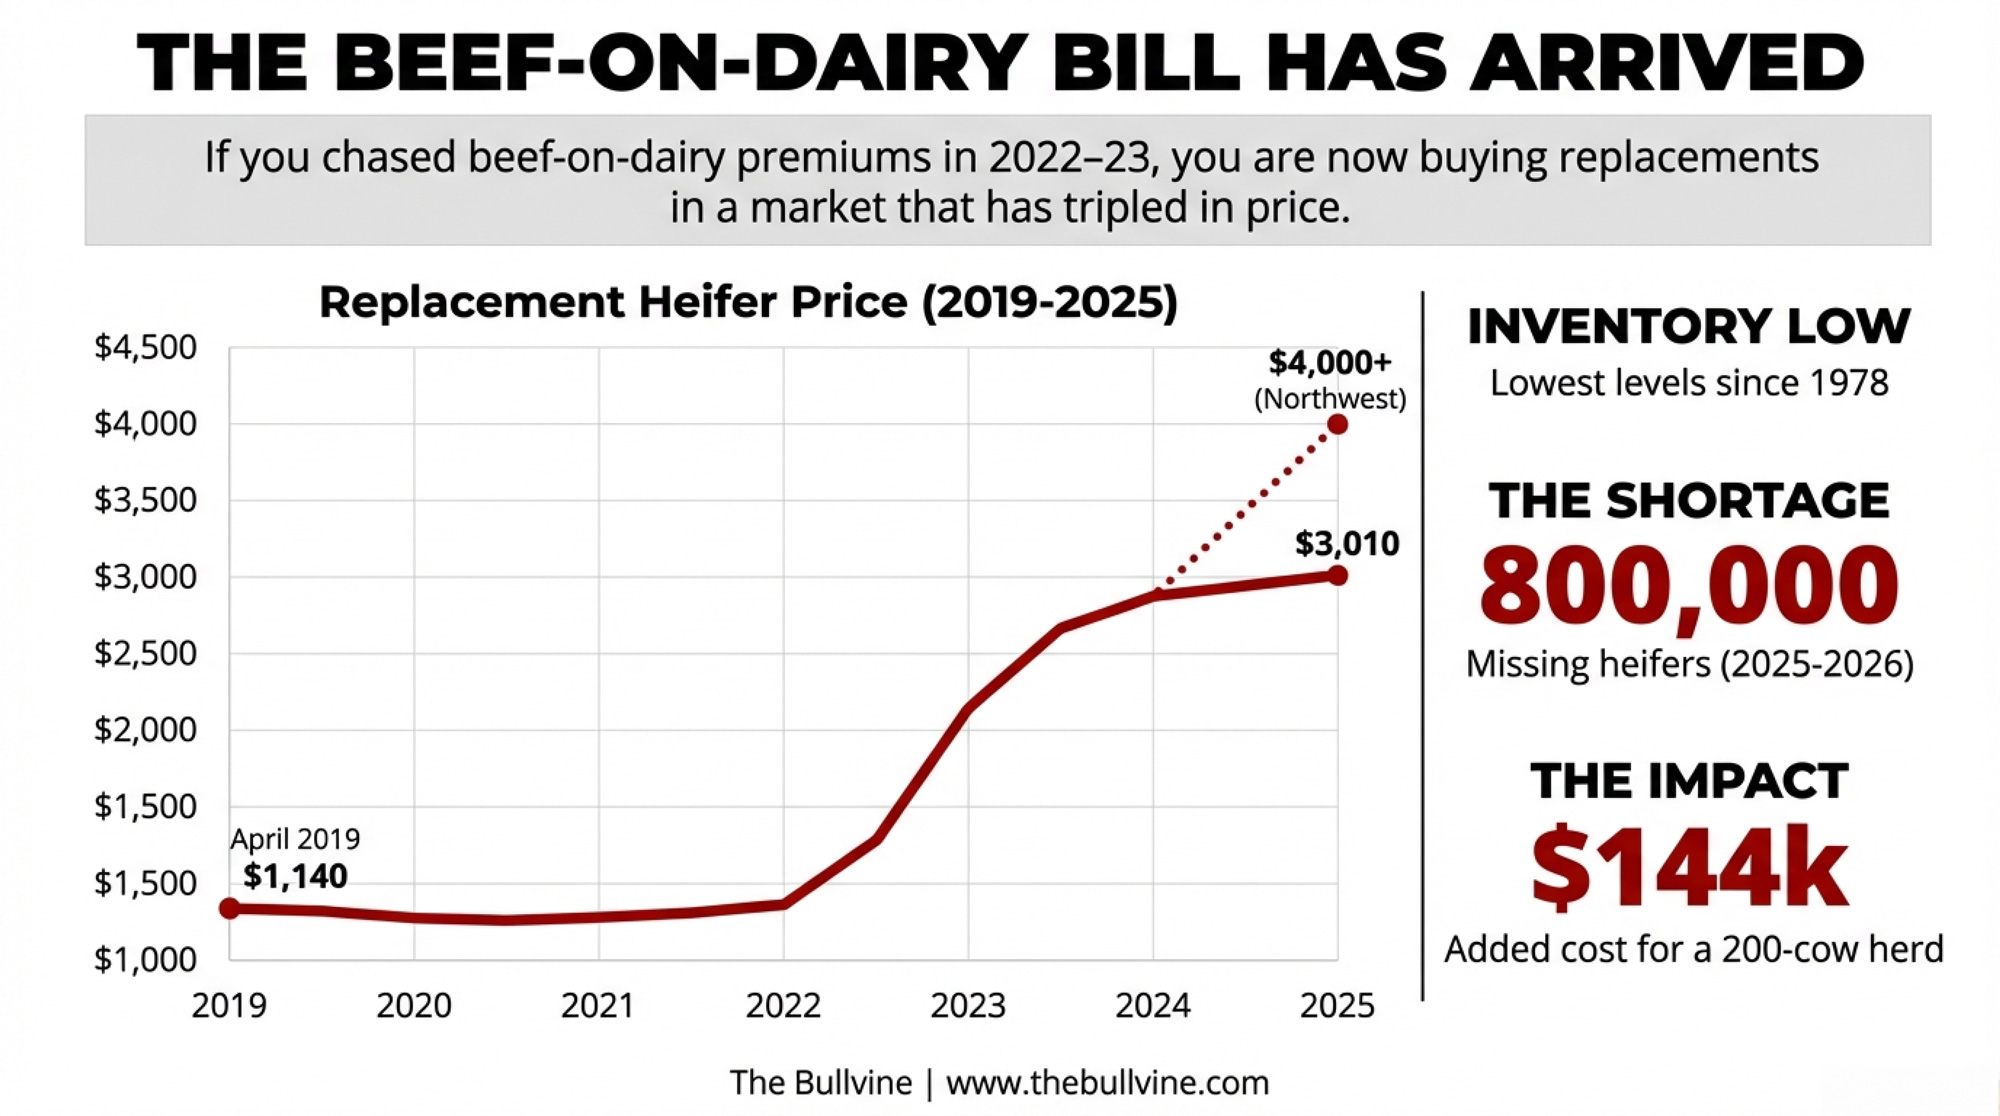
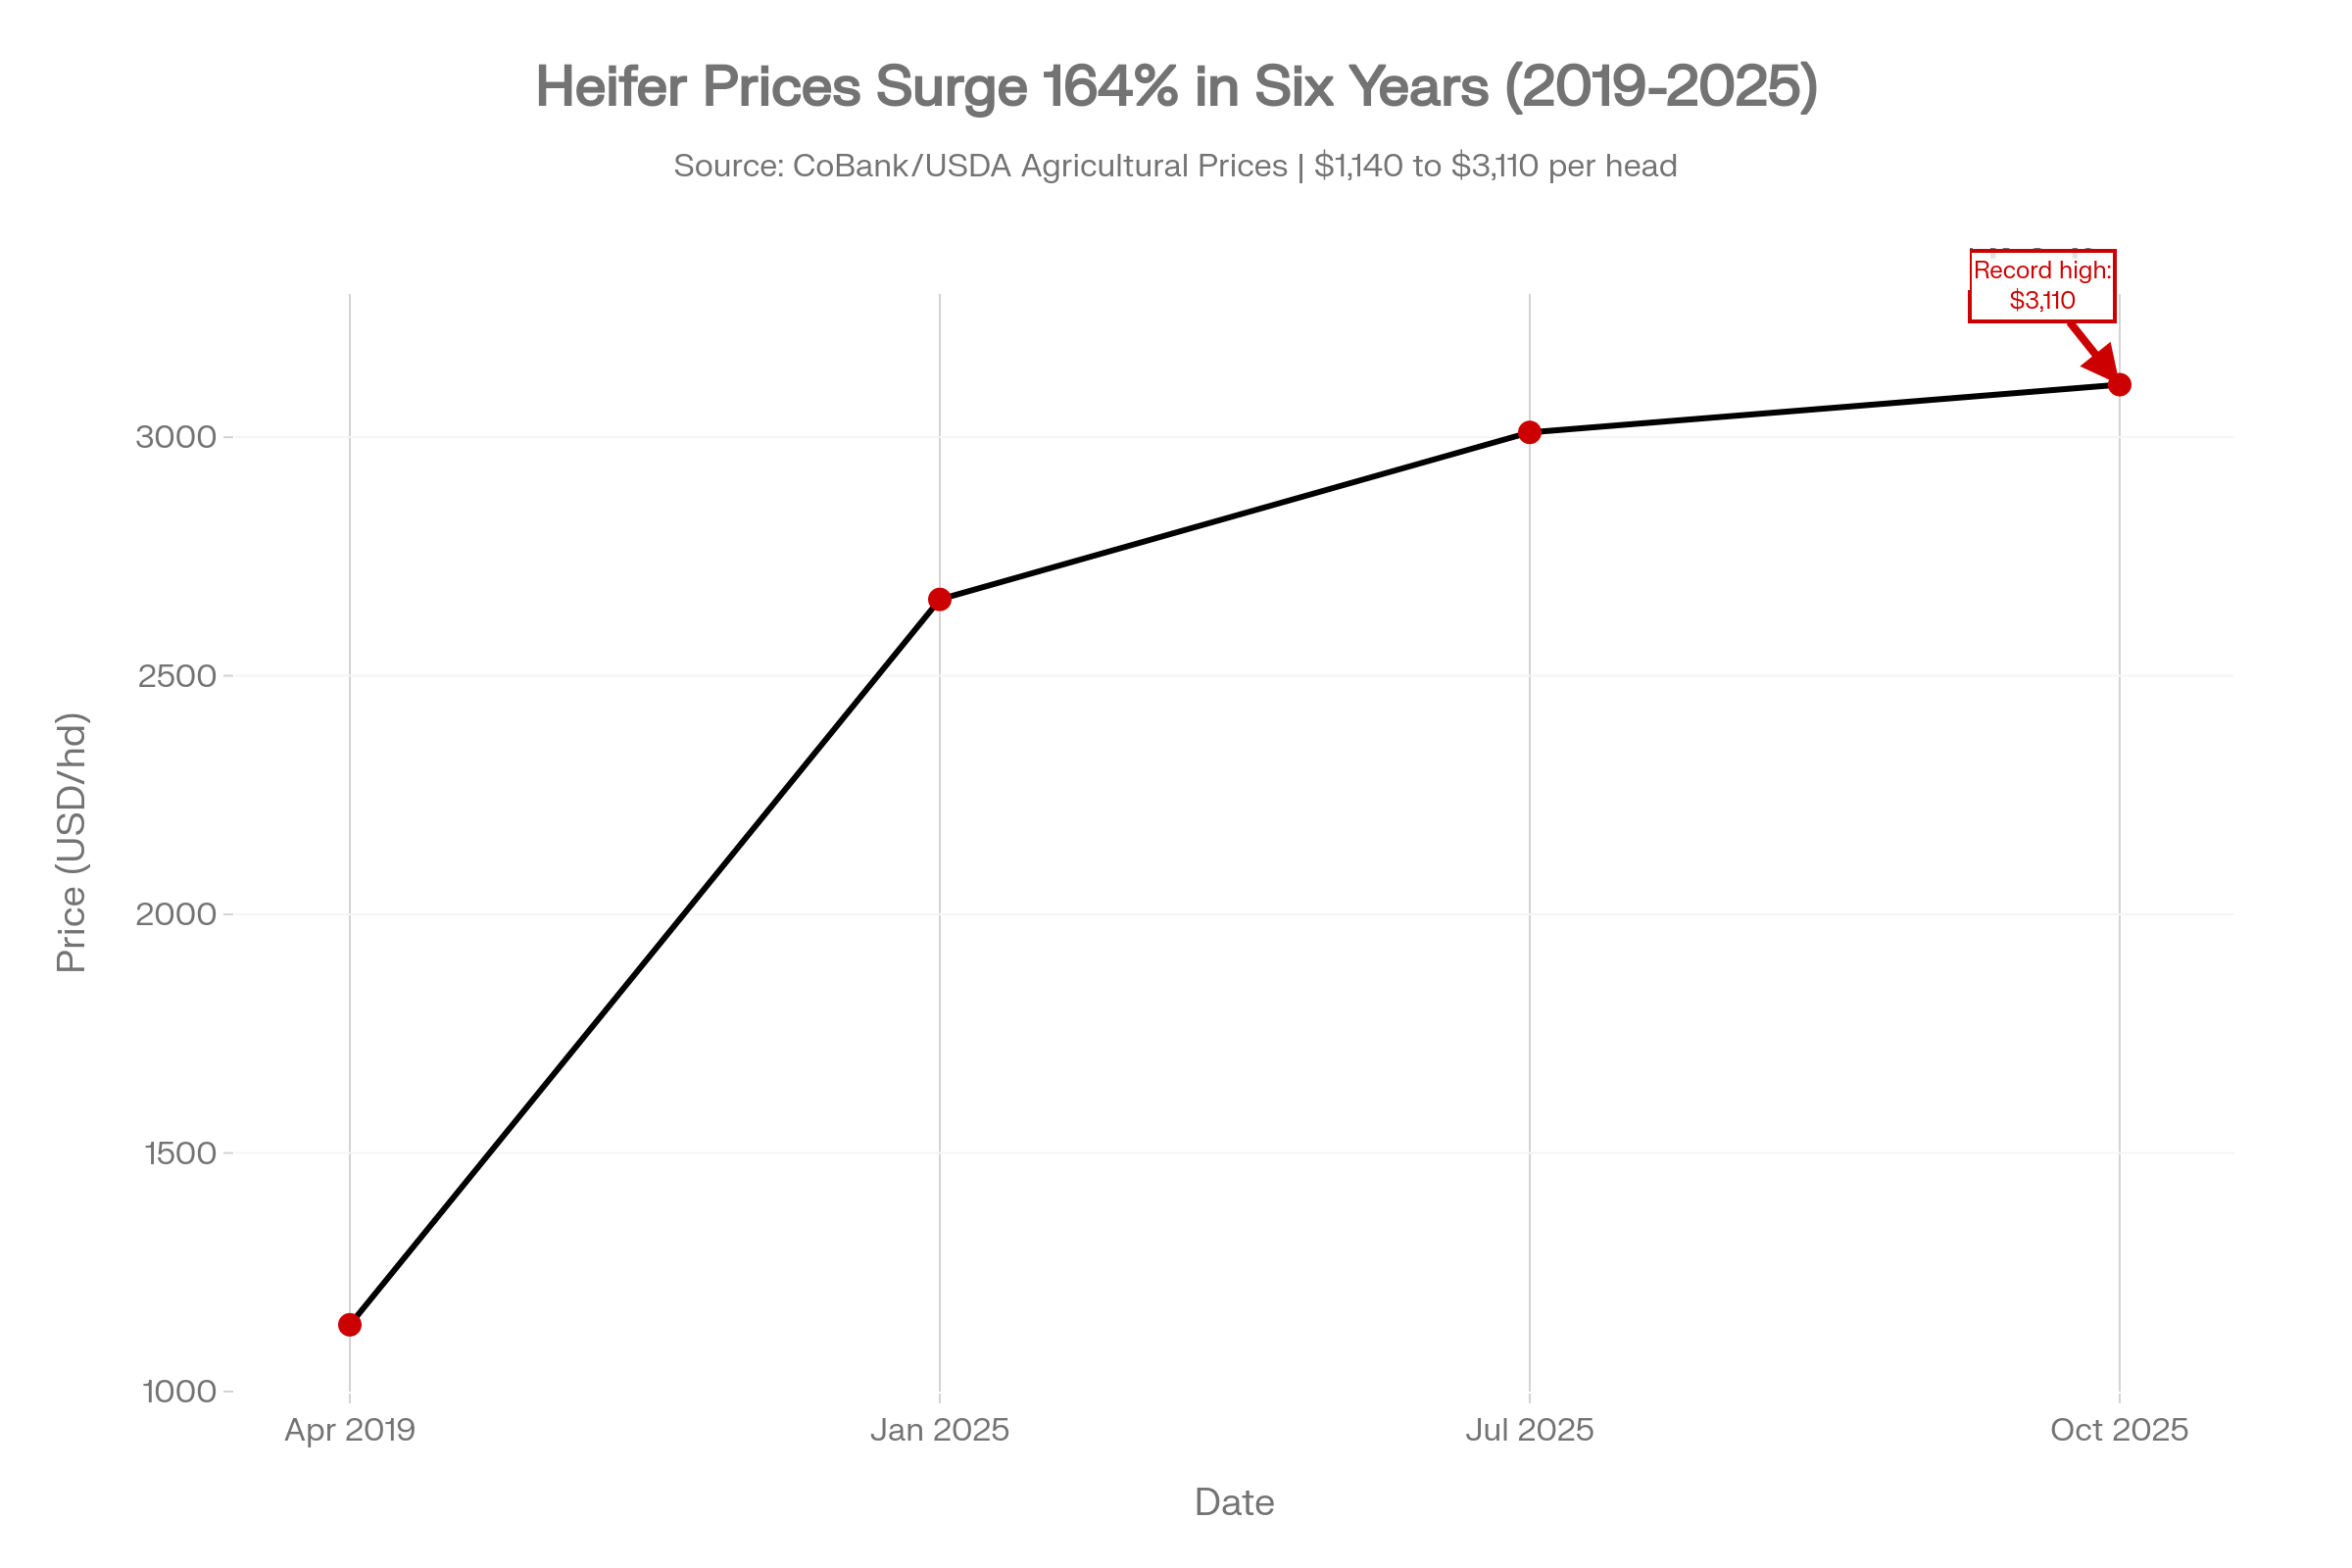
| April 2019 | $1,140 |
| January 2025 | $2,660 |
| July 2025 | $3,010 |
| October 2025 | $3,110 |
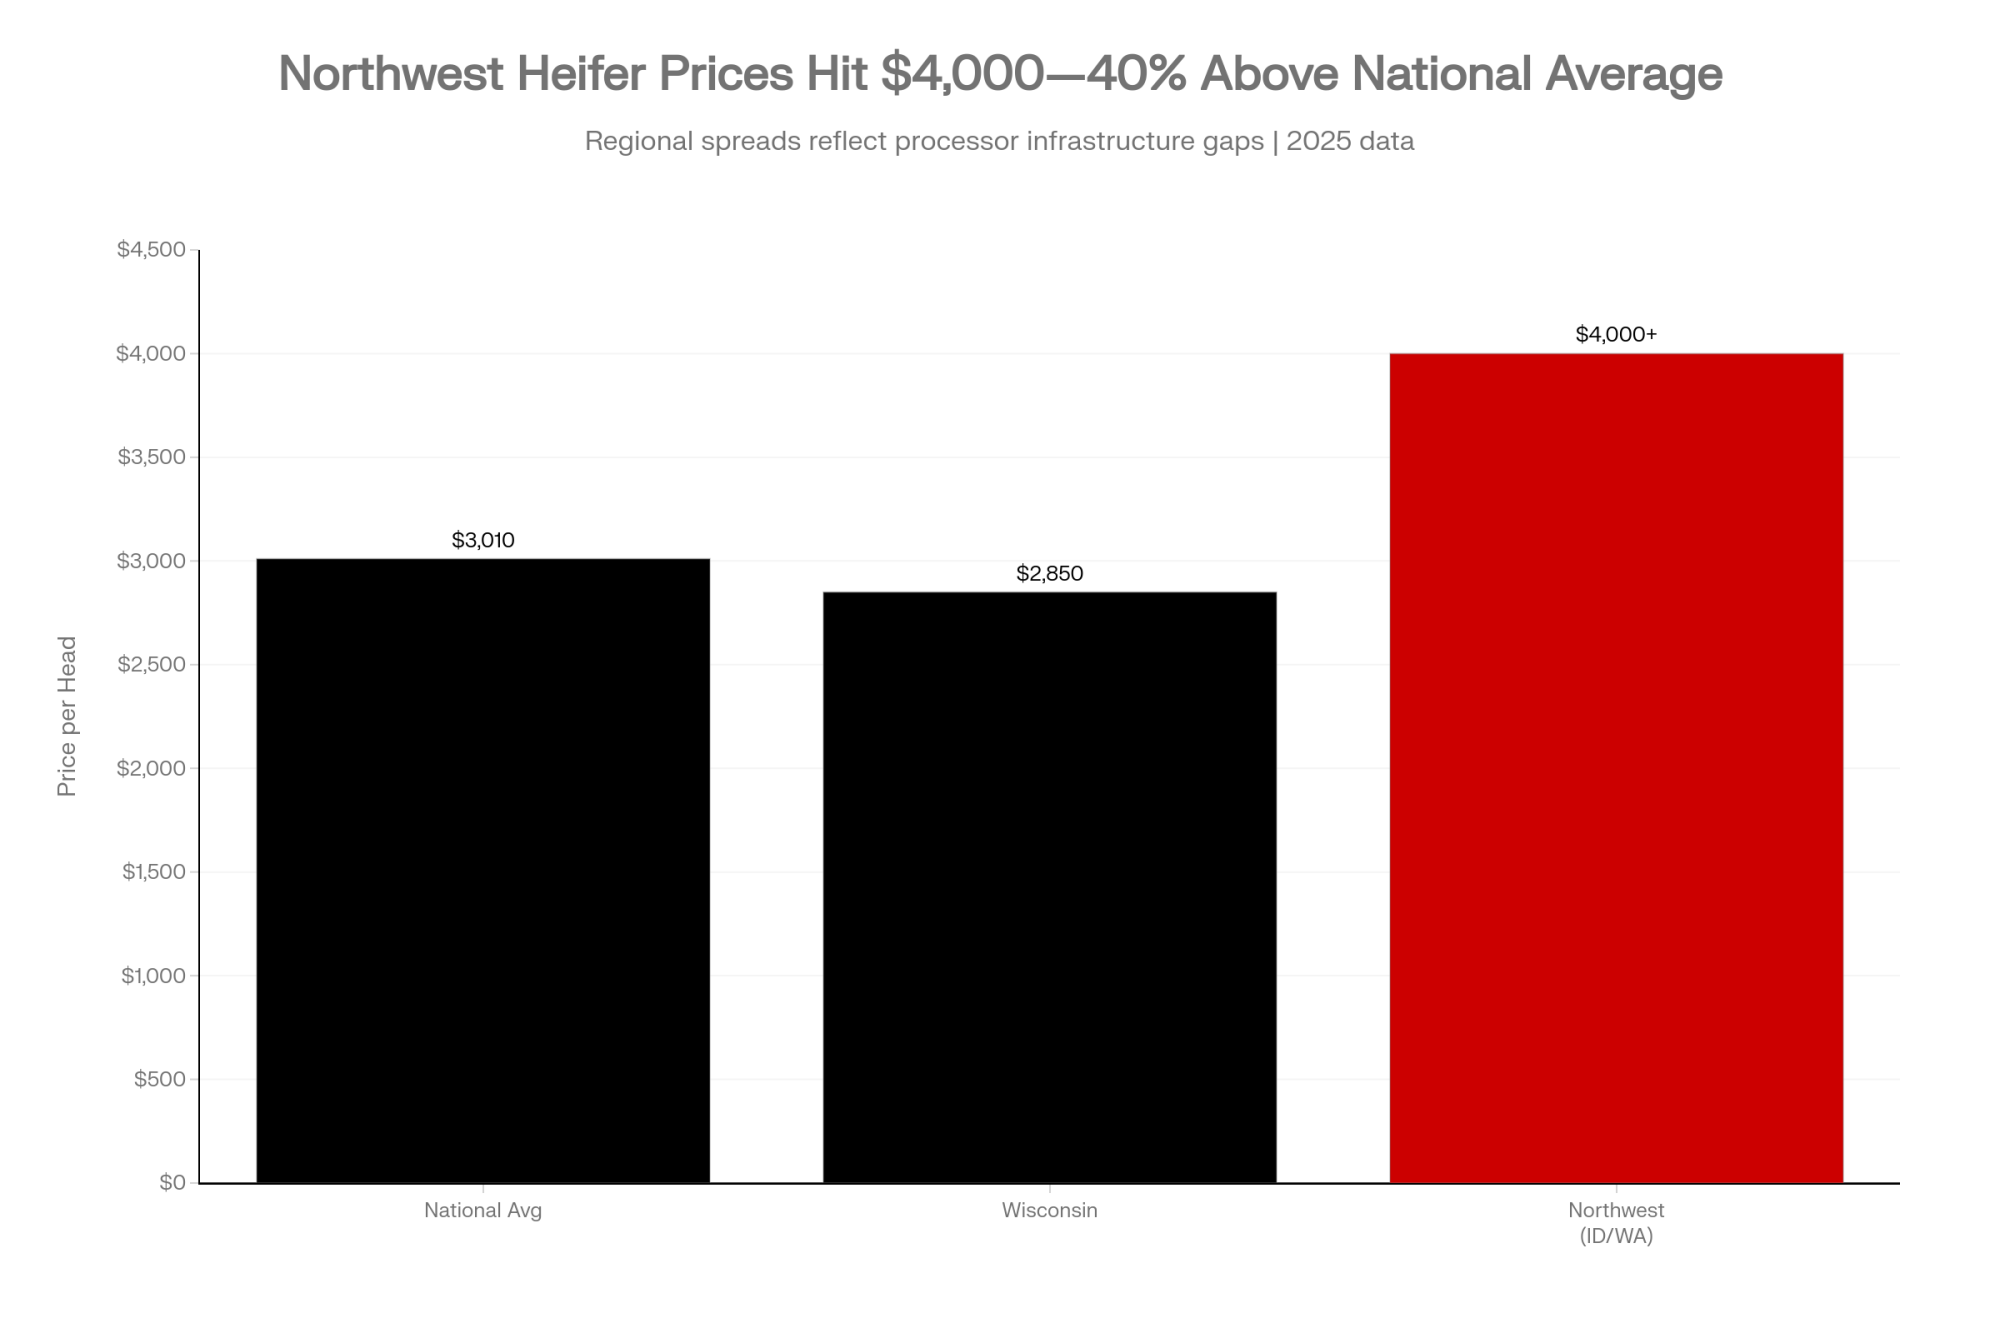
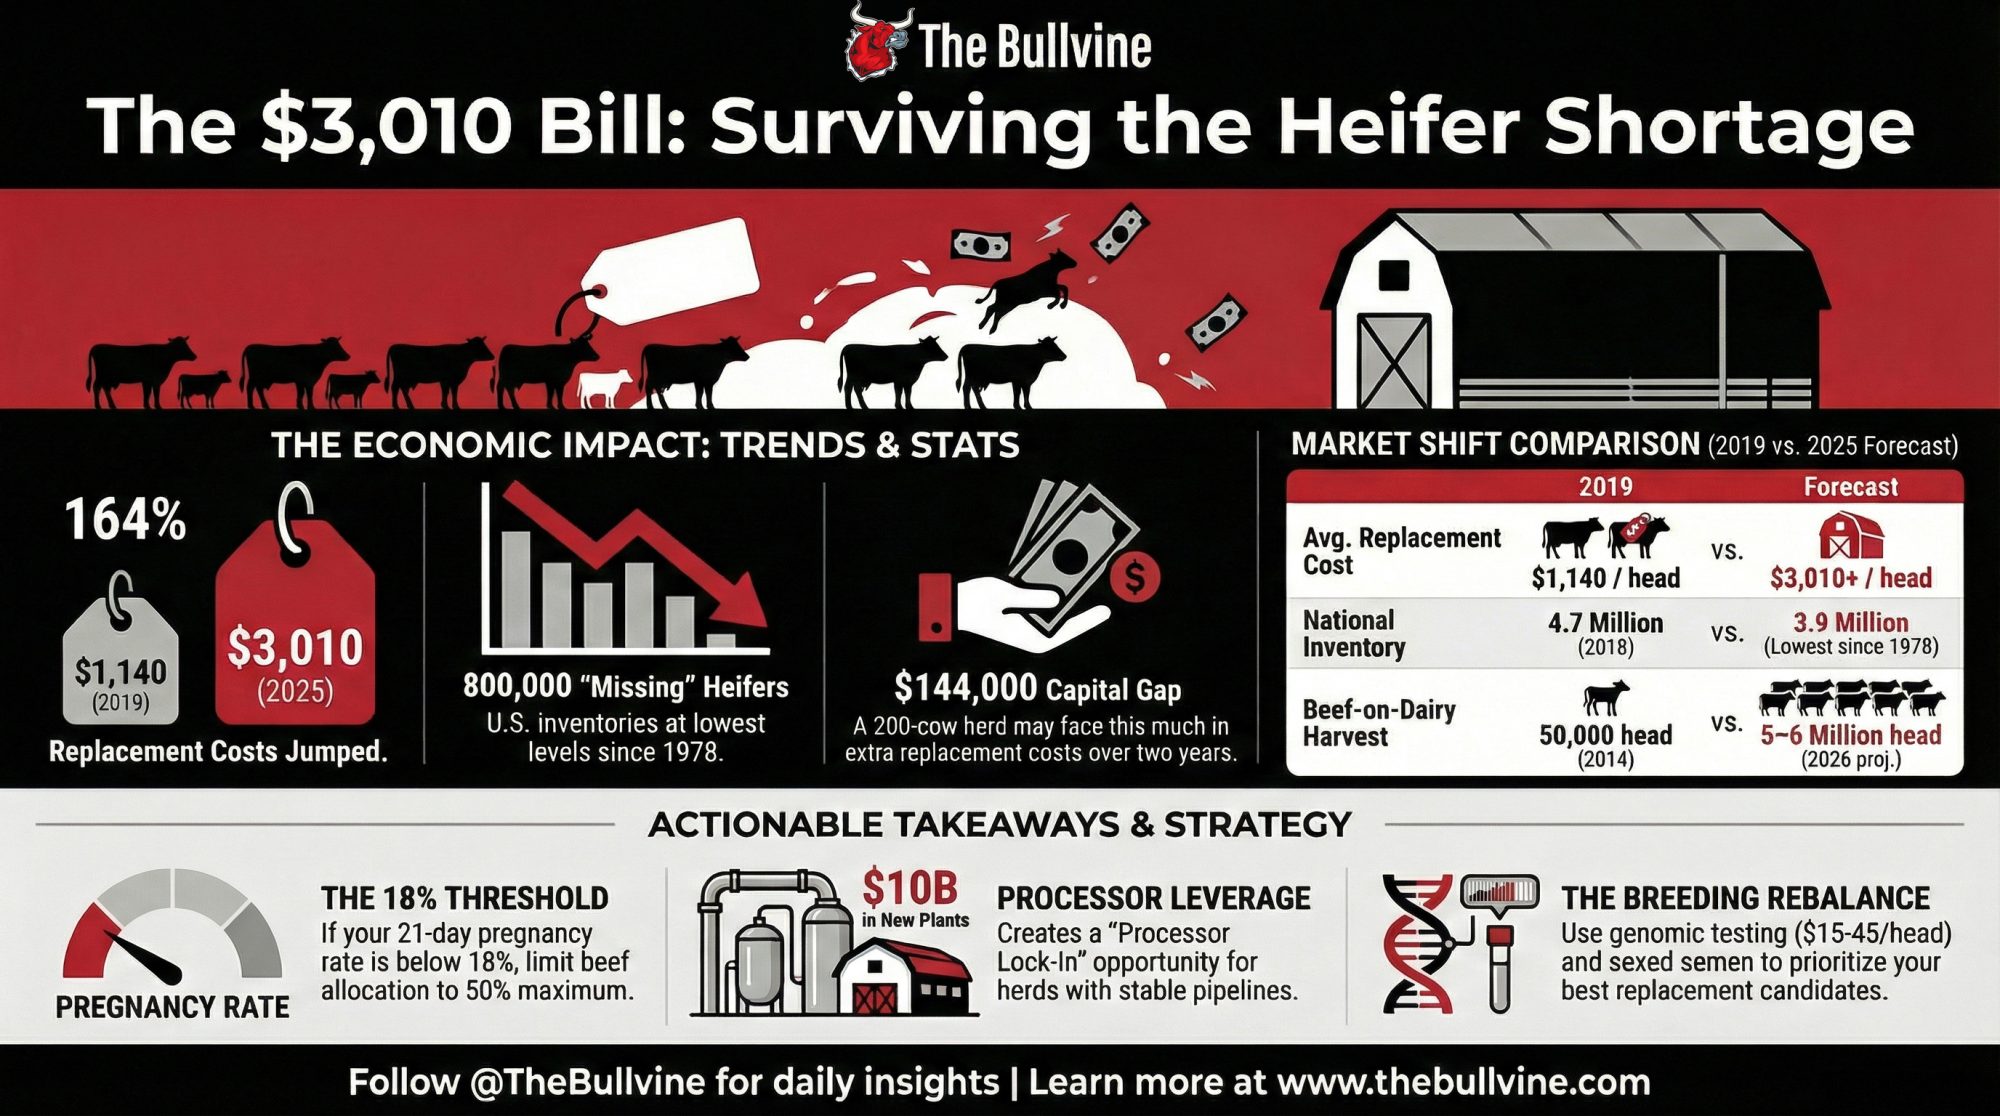
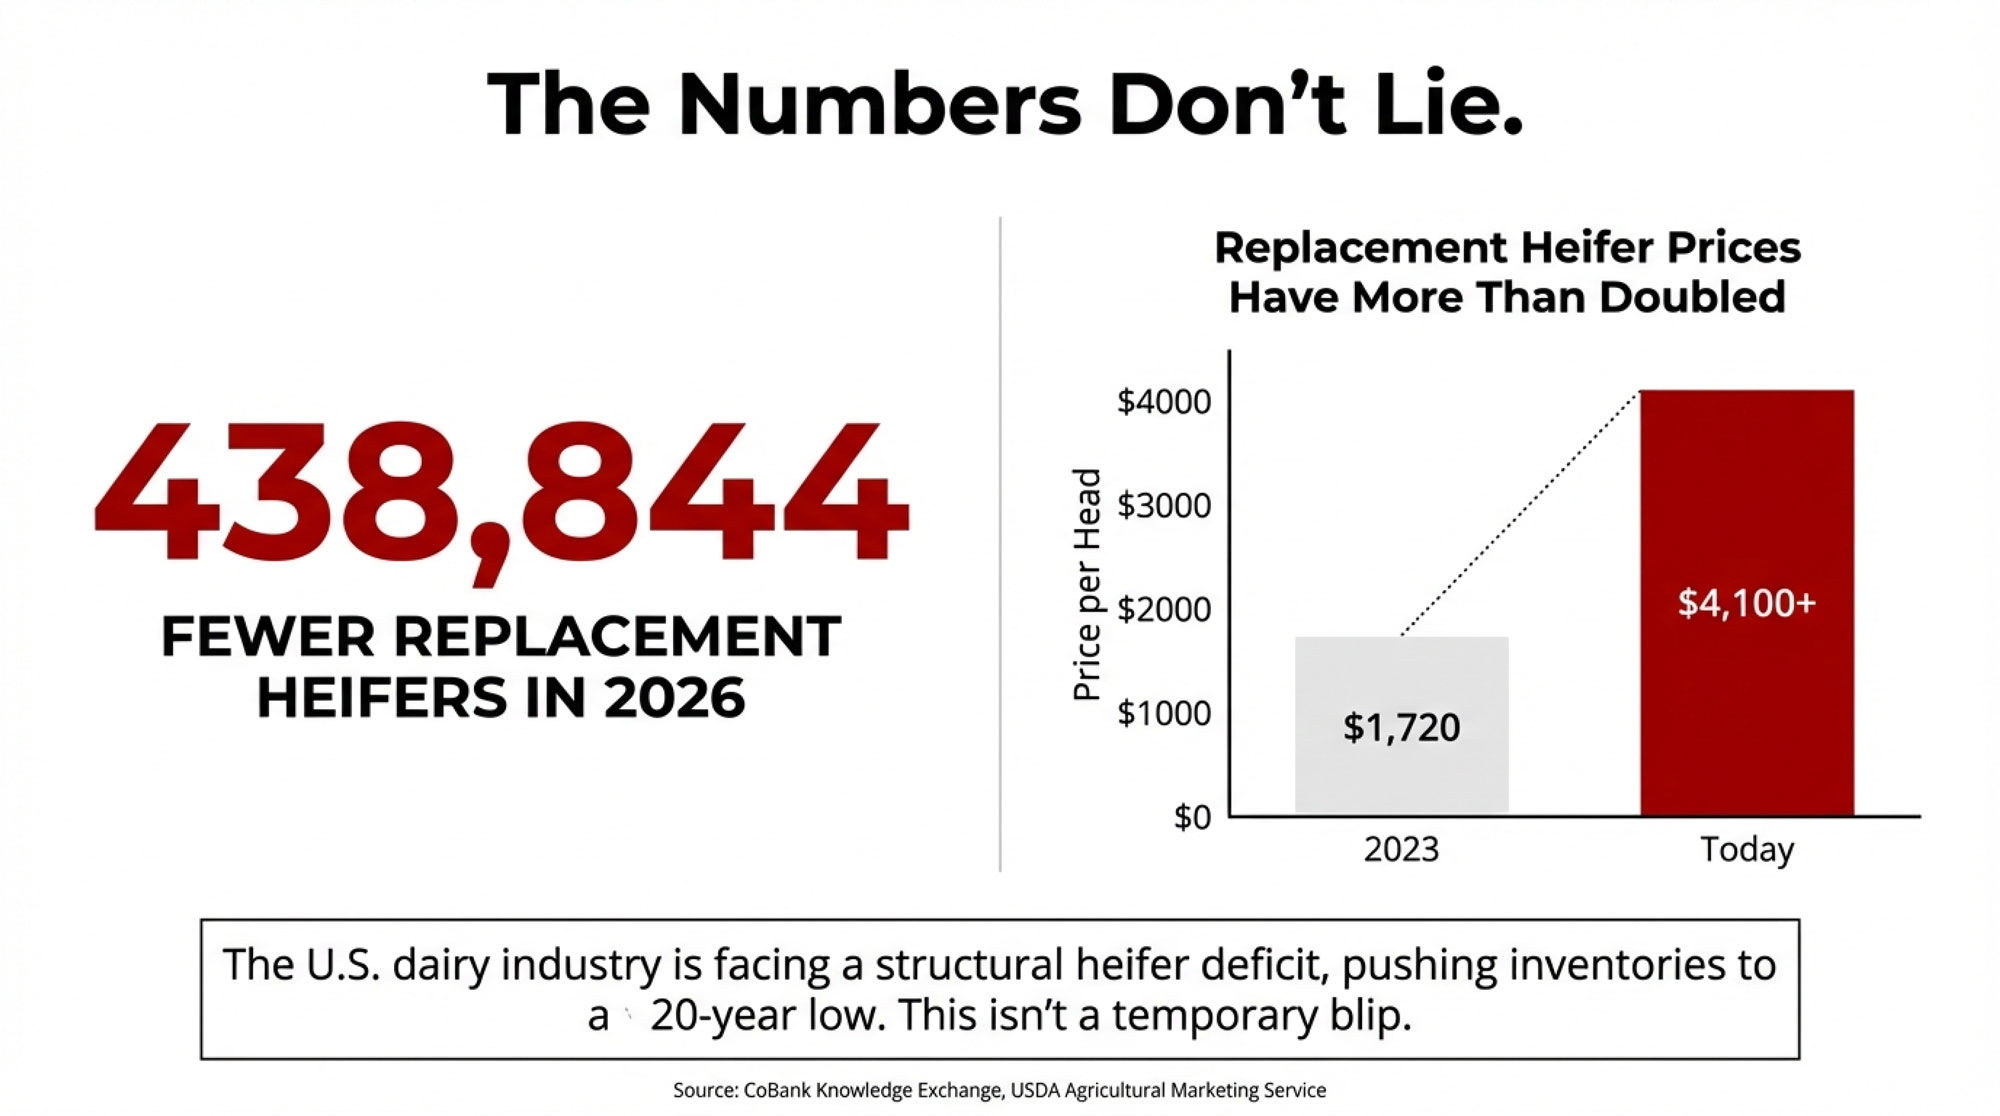
In October 2025, USDA’s Agricultural Prices report pegged the average U.S. replacement dairy heifer at $3,110 per head — the highest figure ever recorded. By January 2026, that number eased to $2,860, but top heifers in California and Minnesota auction barns were still clearing north of $4,000. Those prices have convinced a lot of producers that holding cows longer is the smart play. Fewer replacements purchased, lower turnover, better welfare optics. Sounds logical.
That logic is costing you more than the heifers ever would.
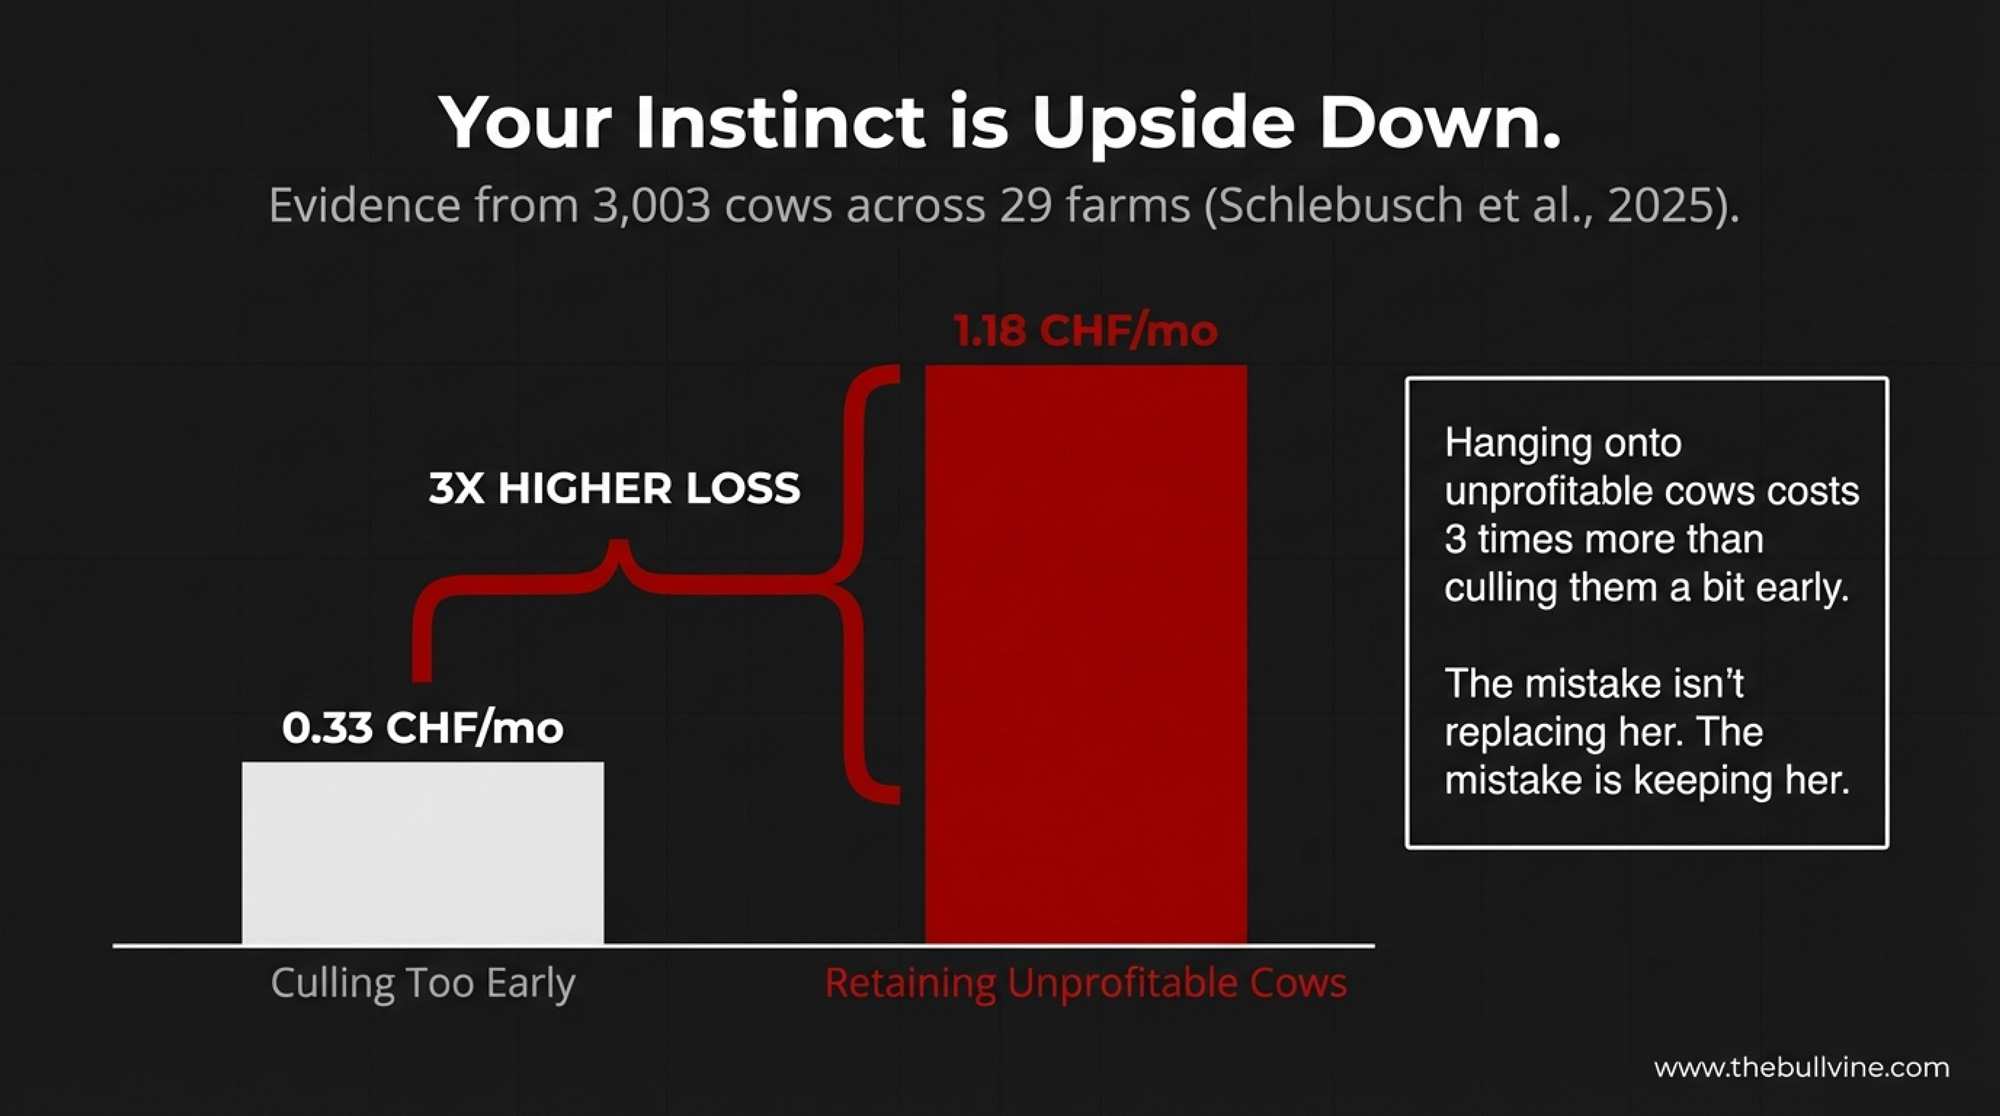
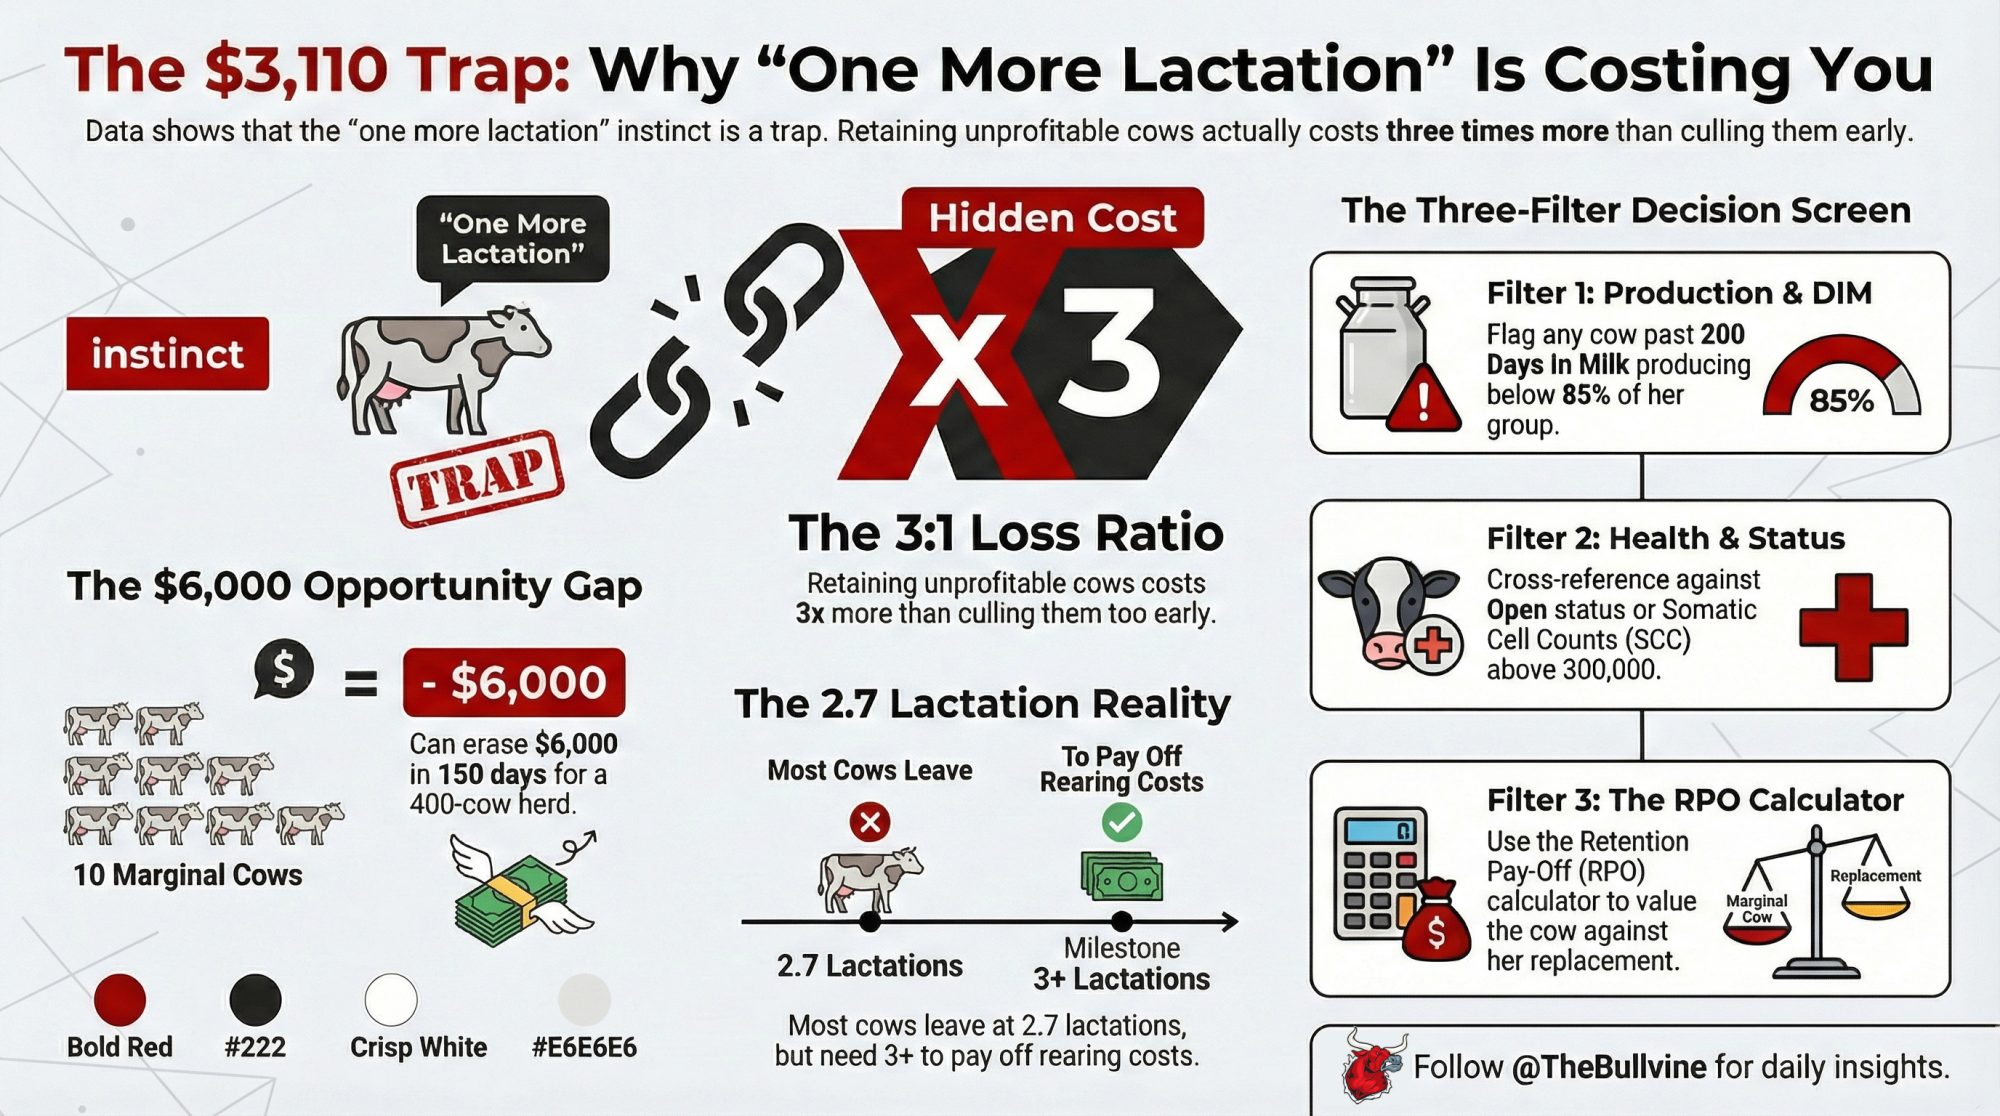
A 2025 study published in Animals by Schlebusch et al. tracked replacement decisions across 29 Swiss dairy farms and 3,003 individual cows over 5 years (2018–2023), comparing actual culling decisions with a dynamic bio-economic model. The economic loss from retaining unprofitable cows (1.18 CHF per cow per month) was approximately three times greater than the loss from culling cows too early (0.33 CHF per cow per month).
Not marginally worse. Three times worse. The instinct to squeeze one more lactation out of a cow past her economic peak was the more expensive mistake by a wide margin.
The Longevity Myth That’s Costing You
There’s a persistent belief — reinforced by some breeding indexes, welfare programs, and conference presentations — that longer-lived cows are inherently better. Lower cull rate equals better management. More lactations per cow equals more profit. In some individual cases, that’s absolutely true. But as a herd-level management principle, it falls apart under scrutiny.
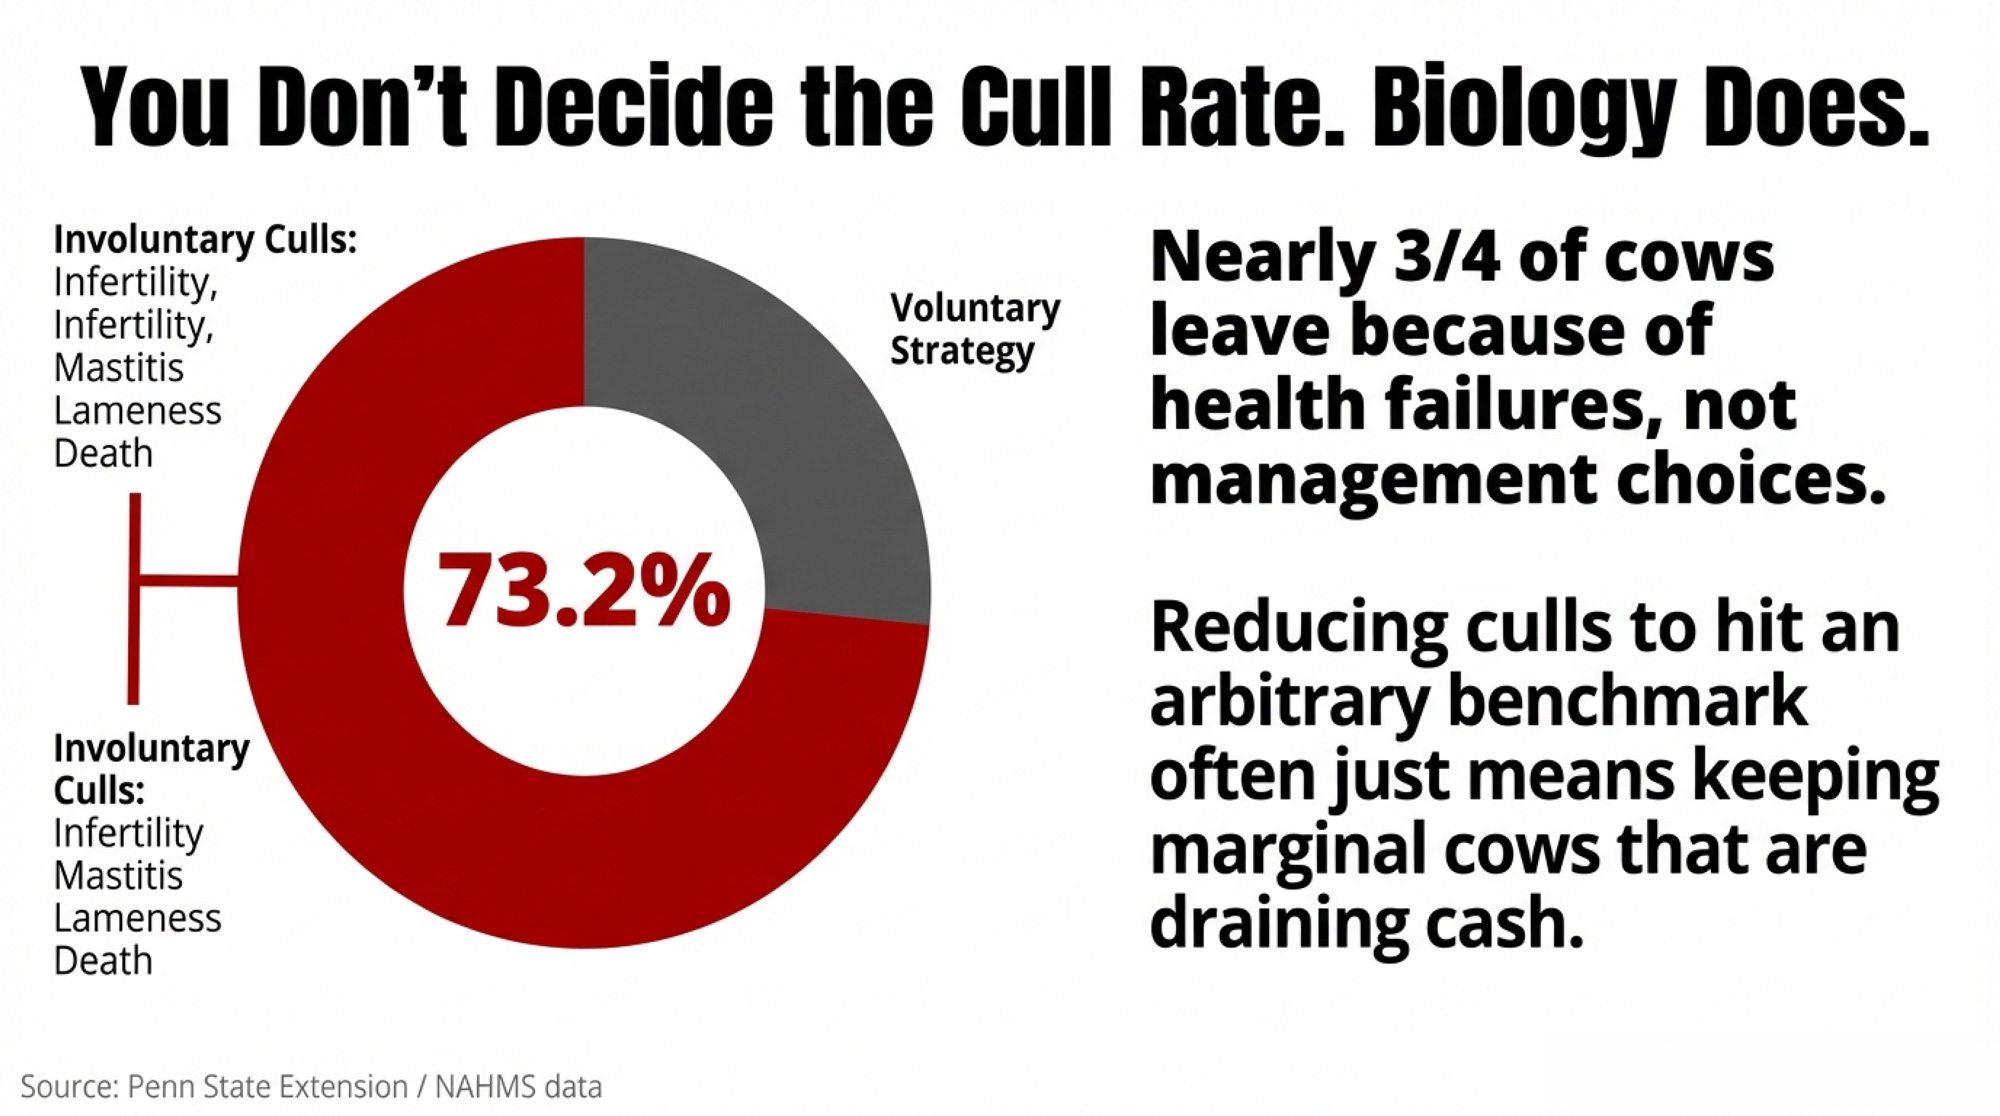
According to Penn State Extension specialist Robert Lunak, drawing on 2018 USDA/NAHMS data for the Northeastern U.S., the average cull rate was 37.6% — including a 6.2% on-farm death rate. Of total culls, 73.2% were involuntary: infertility (23.3%), mastitis (18.6%), lameness (9.1%), injuries (3.5%), respiratory disease (2.4%), metritis (2.2%), displaced abomasum (2.0%), and other causes (12.1%).
Voluntary culling — the part you actually control — was just 26.8% of the total.
Nearly three-quarters of the cows leaving your herd aren’t leaving because you decided they should. Biology decided for you. Mastitis. Infertility. Lameness. So when someone tells you that driving your cull rate from 38% to 30% will improve profitability, the right question is: which part of the 38% are you cutting?
| Cull Reason | % of Total Culls | Classification |
|---|---|---|
| Infertility | 23.3% | Involuntary |
| Mastitis | 18.6% | Involuntary |
| Lameness | 9.1% | Involuntary |
| Injury | 3.5% | Involuntary |
| Respiratory disease | 2.4% | Involuntary |
| Metritis | 2.2% | Involuntary |
| Displaced abomasum | 2.0% | Involuntary |
| Other involuntary | 12.1% | Involuntary |
| Voluntary culling | 26.8% | Voluntary |
| TOTAL | 100% | — |
If you’re reducing involuntary culls through better transition management, better foot care, better reproduction protocols — that’s real progress. But if you’re just keeping marginal cows around longer to hit an arbitrary benchmark, you’re stacking losses.
Why Is 73% of Your Culling Involuntary?
The NAHMS data doesn’t just describe what’s happening — it reveals what isn’t happening. Lunak points out that mastitis, lameness, metritis, DA, respiratory problems, and injuries together represent almost 40% of biological culls. These aren’t mysterious losses. They’re preventable ones.
The Schlebusch study’s farm-level data supports this. Across all 553 culling events recorded over five years, the three leading causes of replacement were fertility issues (26.4%), udder health problems (22.6%), and inadequate performance (9.8%). First- and second-parity cows together accounted for 36% of all removals — cows that hadn’t yet recovered the investment in their rearing.
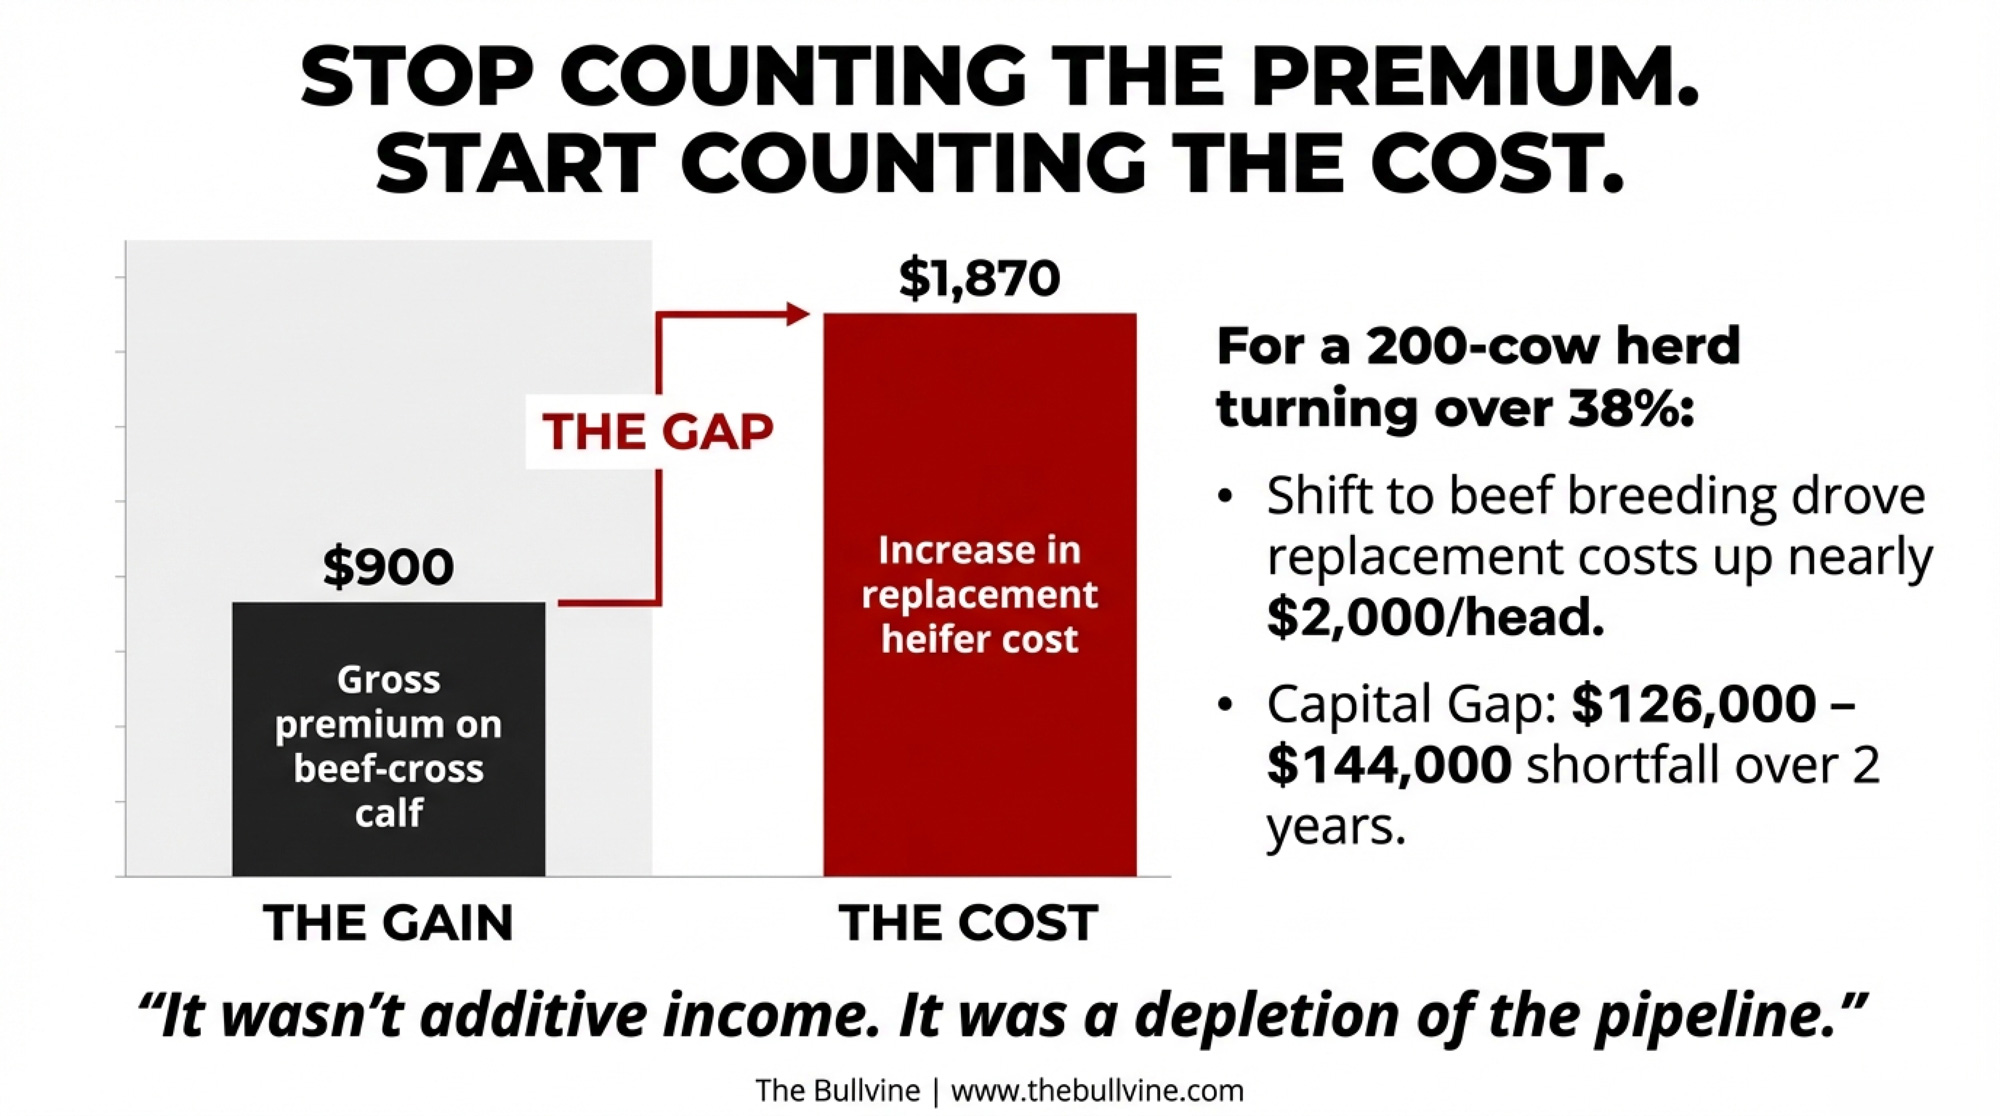
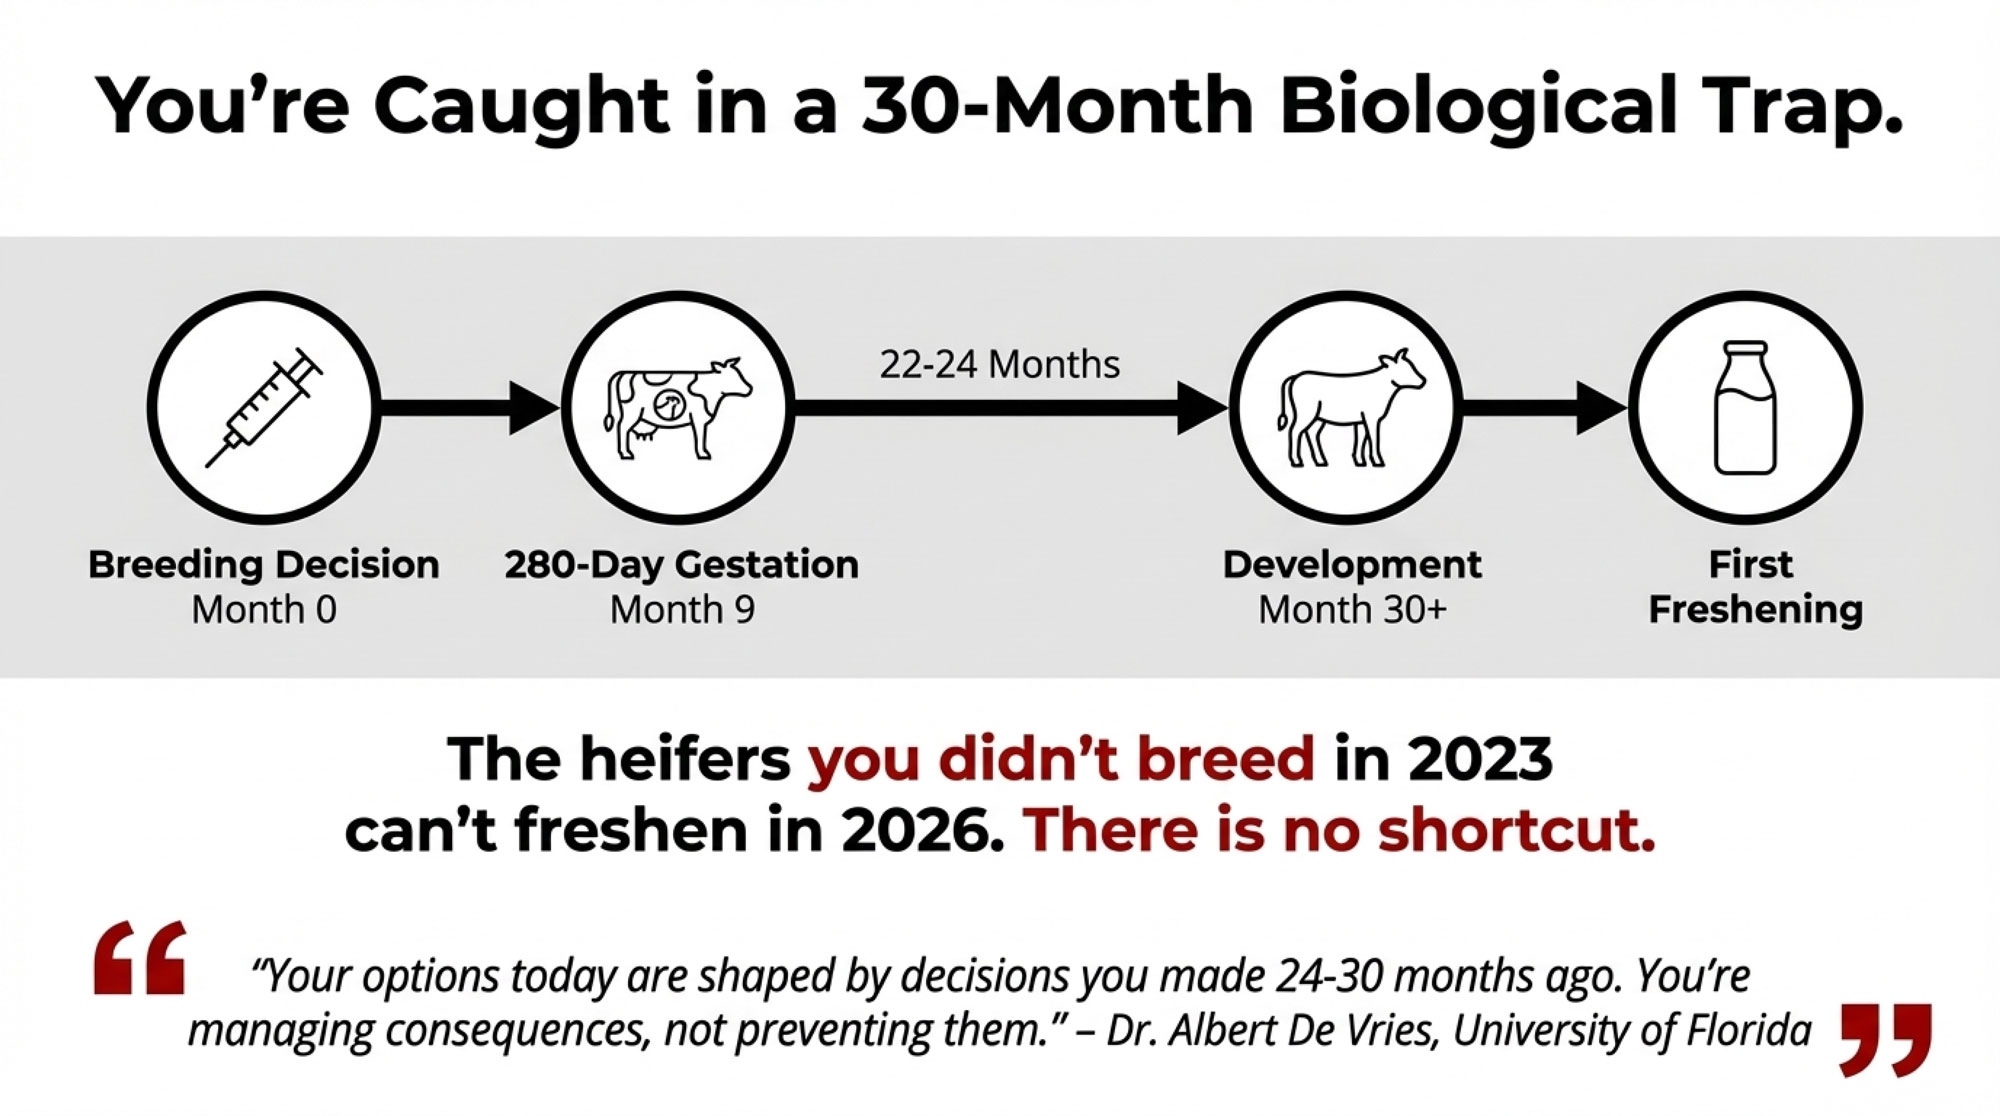
Lunak’s own analysis underscores the scale of this problem: it takes more than three lactations to recoup the roughly $2,000 cost of raising a replacement heifer, but the average productive life of a U.S. dairy cow is currently just 2.7 lactations. USDA data indicates that 70% of cows are culled within their first three lactations. Break-even, at best.
And here’s where survivorship bias creeps in. The cows you see in their fourth, fifth, sixth lactation — the ones putting up big numbers — they survived. They’re the genetic and management winners. The cows that didn’t make it can’t show up in your herd average. You don’t have their third-lactation production data because they never got there.
Looking at your oldest cows and concluding they produce the most milk? Of course, they do — the ones that couldn’t produce got culled or died. That’s not evidence that aging improves productivity. It’s evidence that your culling process works. The mistake is building your replacement policy around that survival data.
Is Your Culling Rate Too Low — or Too High?
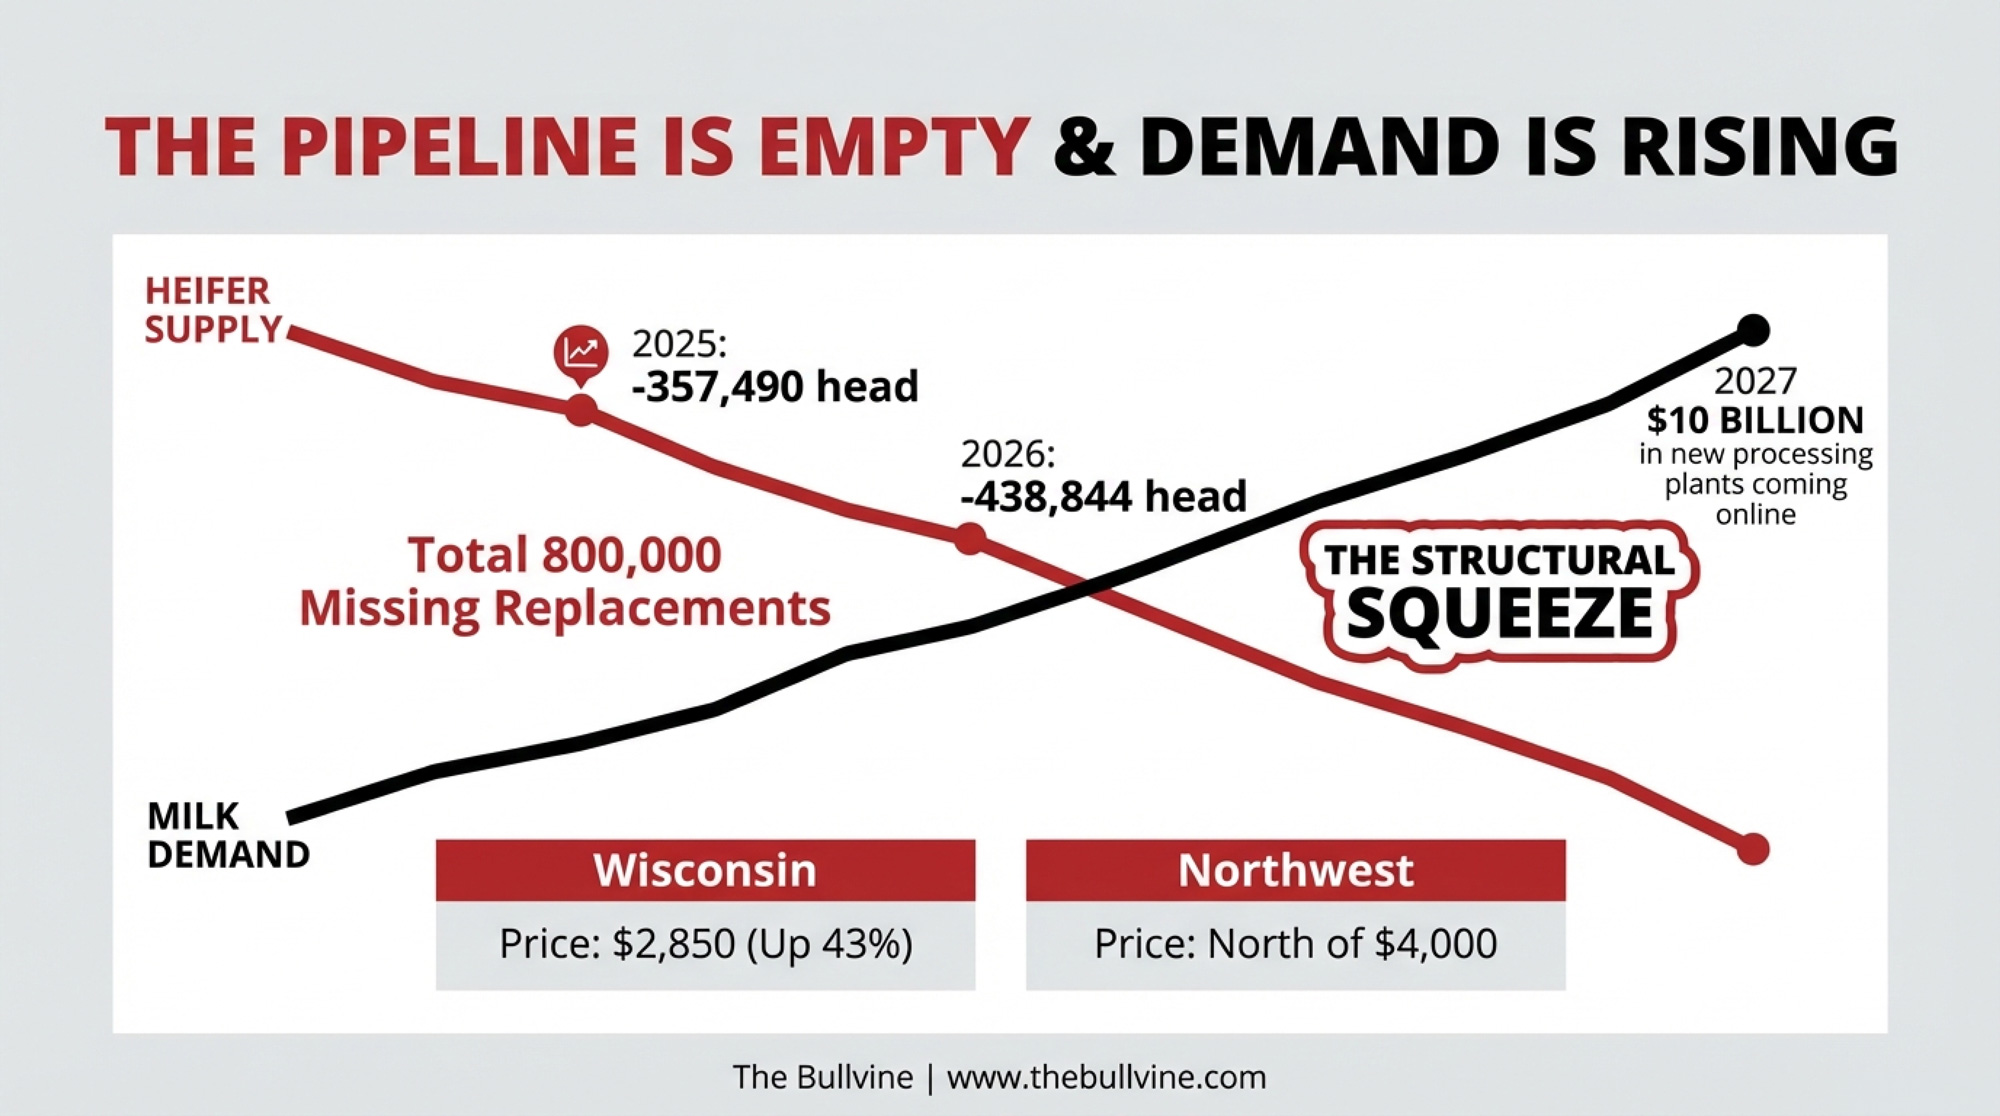
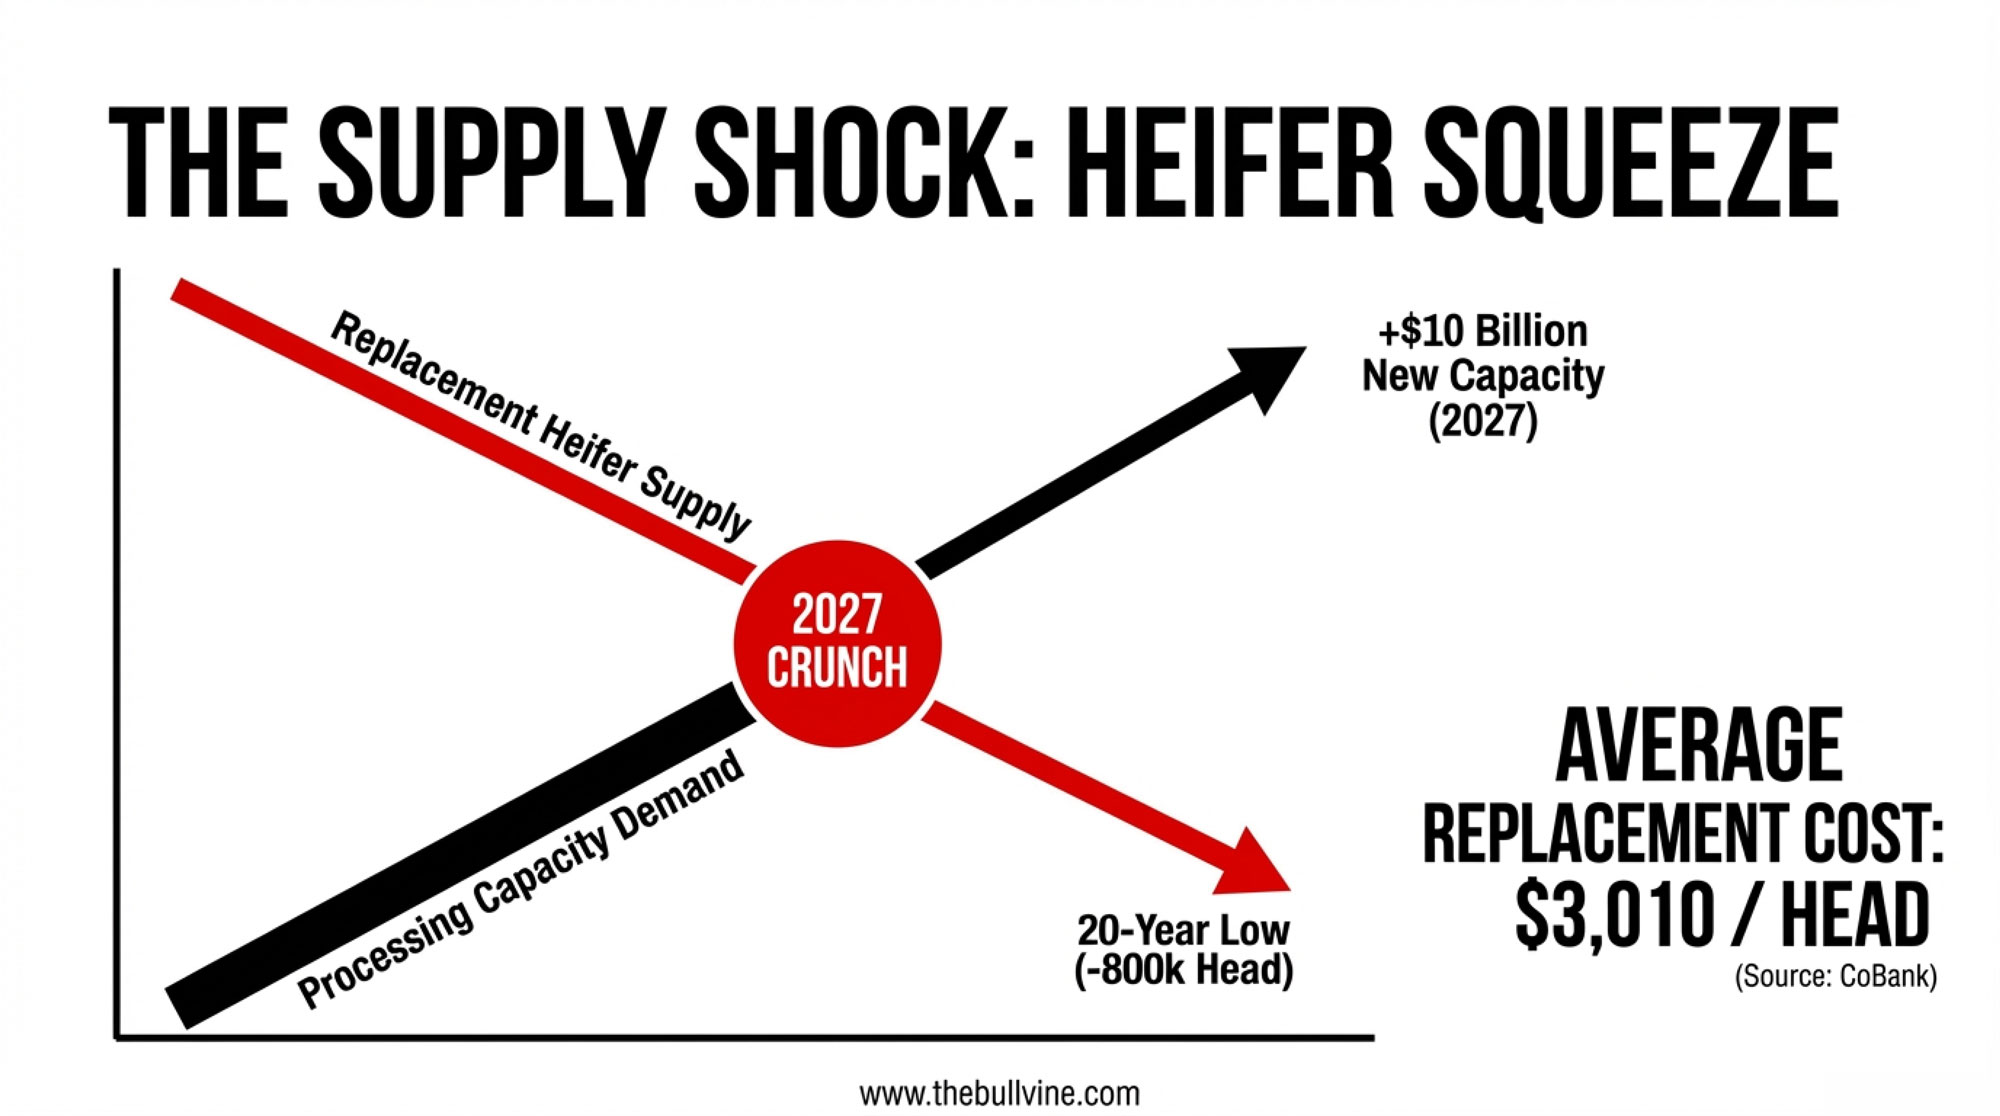
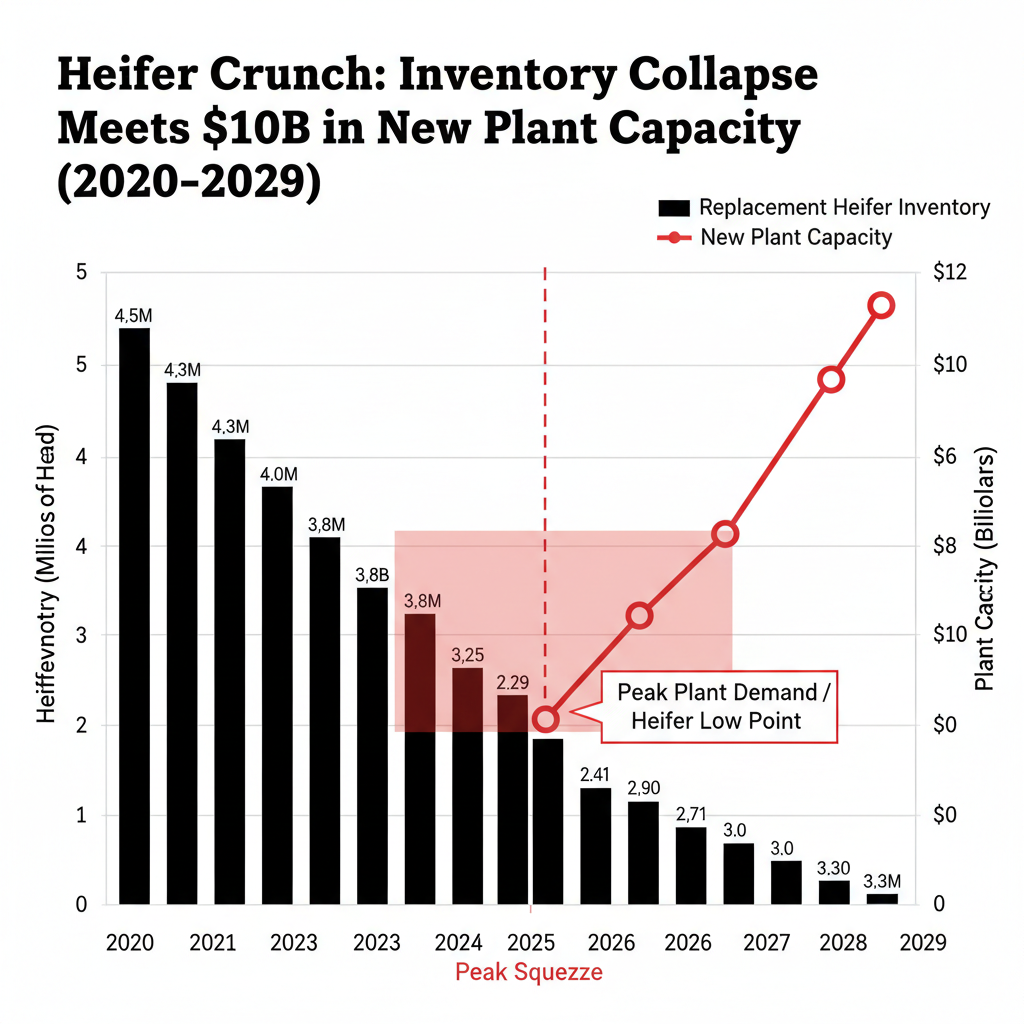
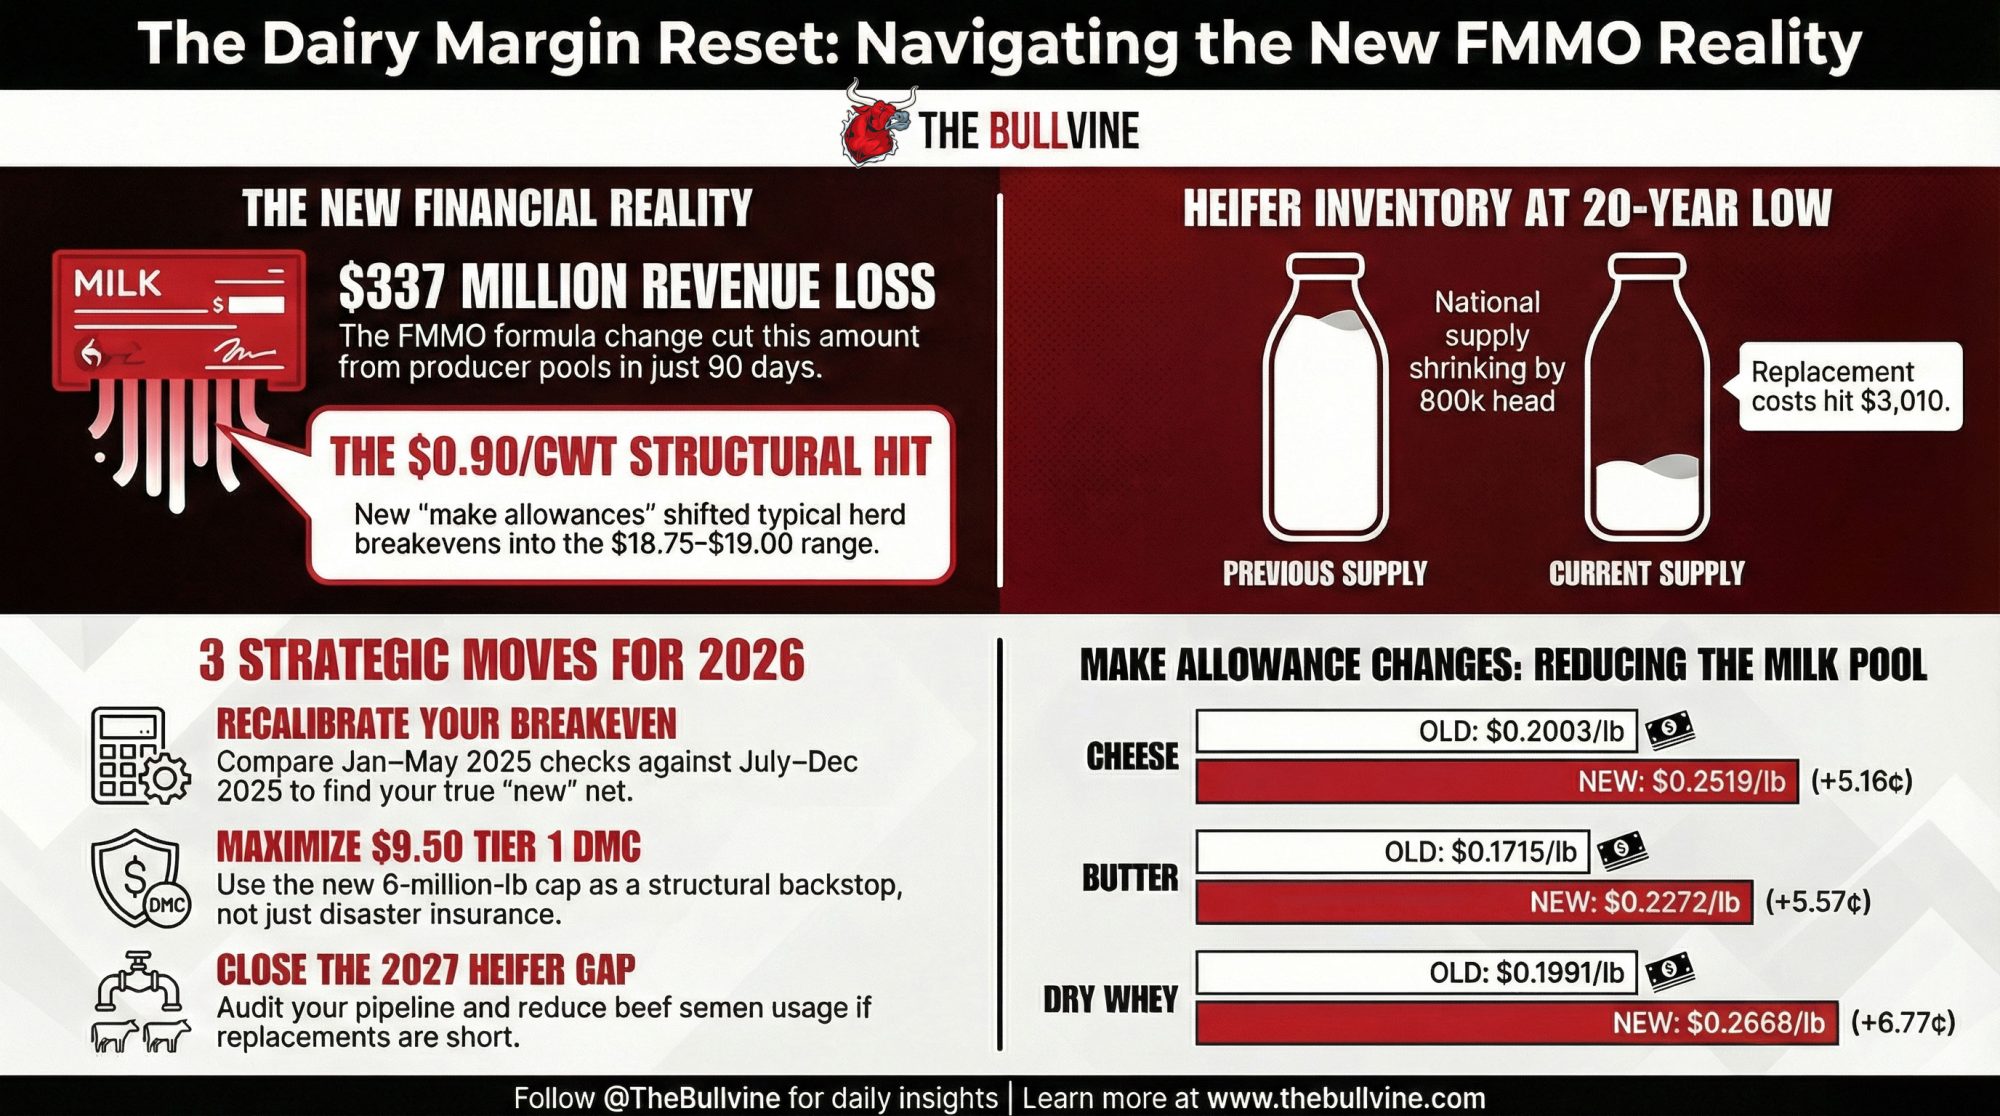
Very few people want to engage with this question honestly. CoBank has closely tracked the heifer supply situation, and the picture isn’t pretty. USDA’s February 2026 Agricultural Outlook Forum confirmed that dairy replacement heifer inventory remains near its lowest level since the early 1990s — the ratio of dairy heifers per 100 milk cows hit its lowest since 1991.
Geiger’s analysis for CoBank traces the trajectory: heifer values climbed from $1,140 per head in April 2019 to $2,660by January 2025, then surged to a record $3,010 in July 2025 — a 164% jump. By October 2025, USDA’s quarterly estimate hit $3,110. Replacement heifer inventory fell to a 47-year low in early 2025, and the structural shift toward beef-cross breeding shows no sign of reversing.
Heifers are scarce and expensive. That’s a fact. But scarce and expensive doesn’t mean your fourth-lactation cow with a 350,000 SCC and an open status at 180 DIM is suddenly a good investment. It means you’re stuck between two bad options — and you need math, not sentiment, to pick the less bad one.
The Barn Math: What a $3,110 Heifer Actually Costs Your Herd
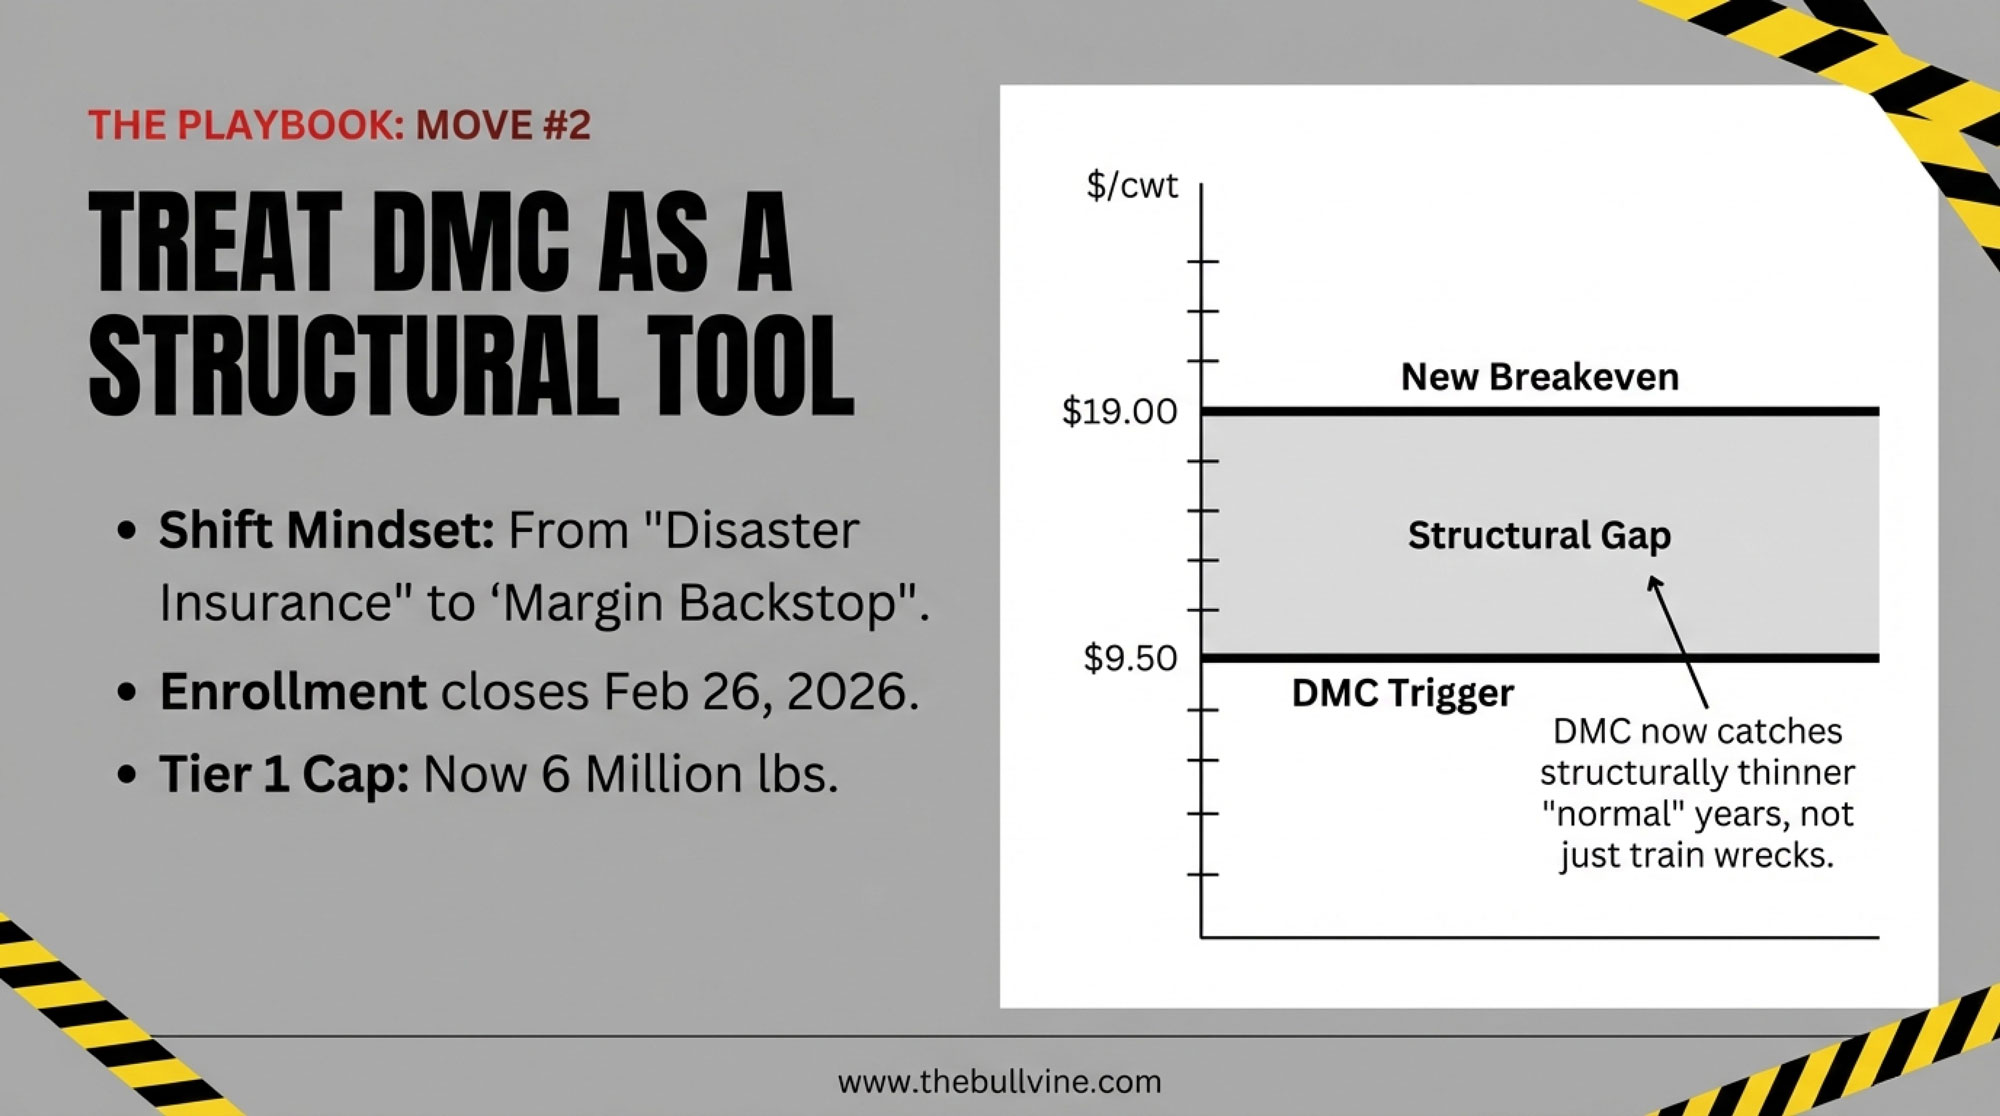
Run the numbers on a 400-cow freestall. January 2026 Class III milk came in at $14.59/cwt. The all-milk price for 2026 is forecast at $18.95/cwt per the February 2026 WASDE — but early-year actuals are running well below that annual average.
| Scenario | Replacement Heifer Cost (USD) | Cull Cow Value (USD) | Net Replacement Cost (USD) |
|---|---|---|---|
| Low | $2,860 | $1,600 | $1,260 |
| Mid | $3,110 | $1,500 | $1,610 |
| High | $3,110 | $1,400 | $1,710 |
- Replacement heifer cost: $2,860–$3,110 per head (USDA Agricultural Prices, January–October 2025)
- Cull cow value: January 2026 National Dairy Comprehensive Report shows cutter cows at roughly $285–$292/cwt dressed weight; on a live-weight basis for a 1,400-lb dairy cow, approximately $1,400–$1,600 per head depending on condition.
- Net replacement cost: approximately $1,260–$1,710 per head after cull cow credit
- Daily feed cost for a below-average cow producing 55–60 lbs/day: Penn State Extension’s feed cost framework shows at $0.12–$0.14/lb dry matter and 50 lbs DMI, total daily feed runs $6.00–$7.00/day.
At $18.95/cwt all-milk, a cow producing 55 lbs/day generates $10.42 in gross milk revenue. That leaves a daily margin of $3.42–$4.42 — before labor, breeding, health costs, and overhead.
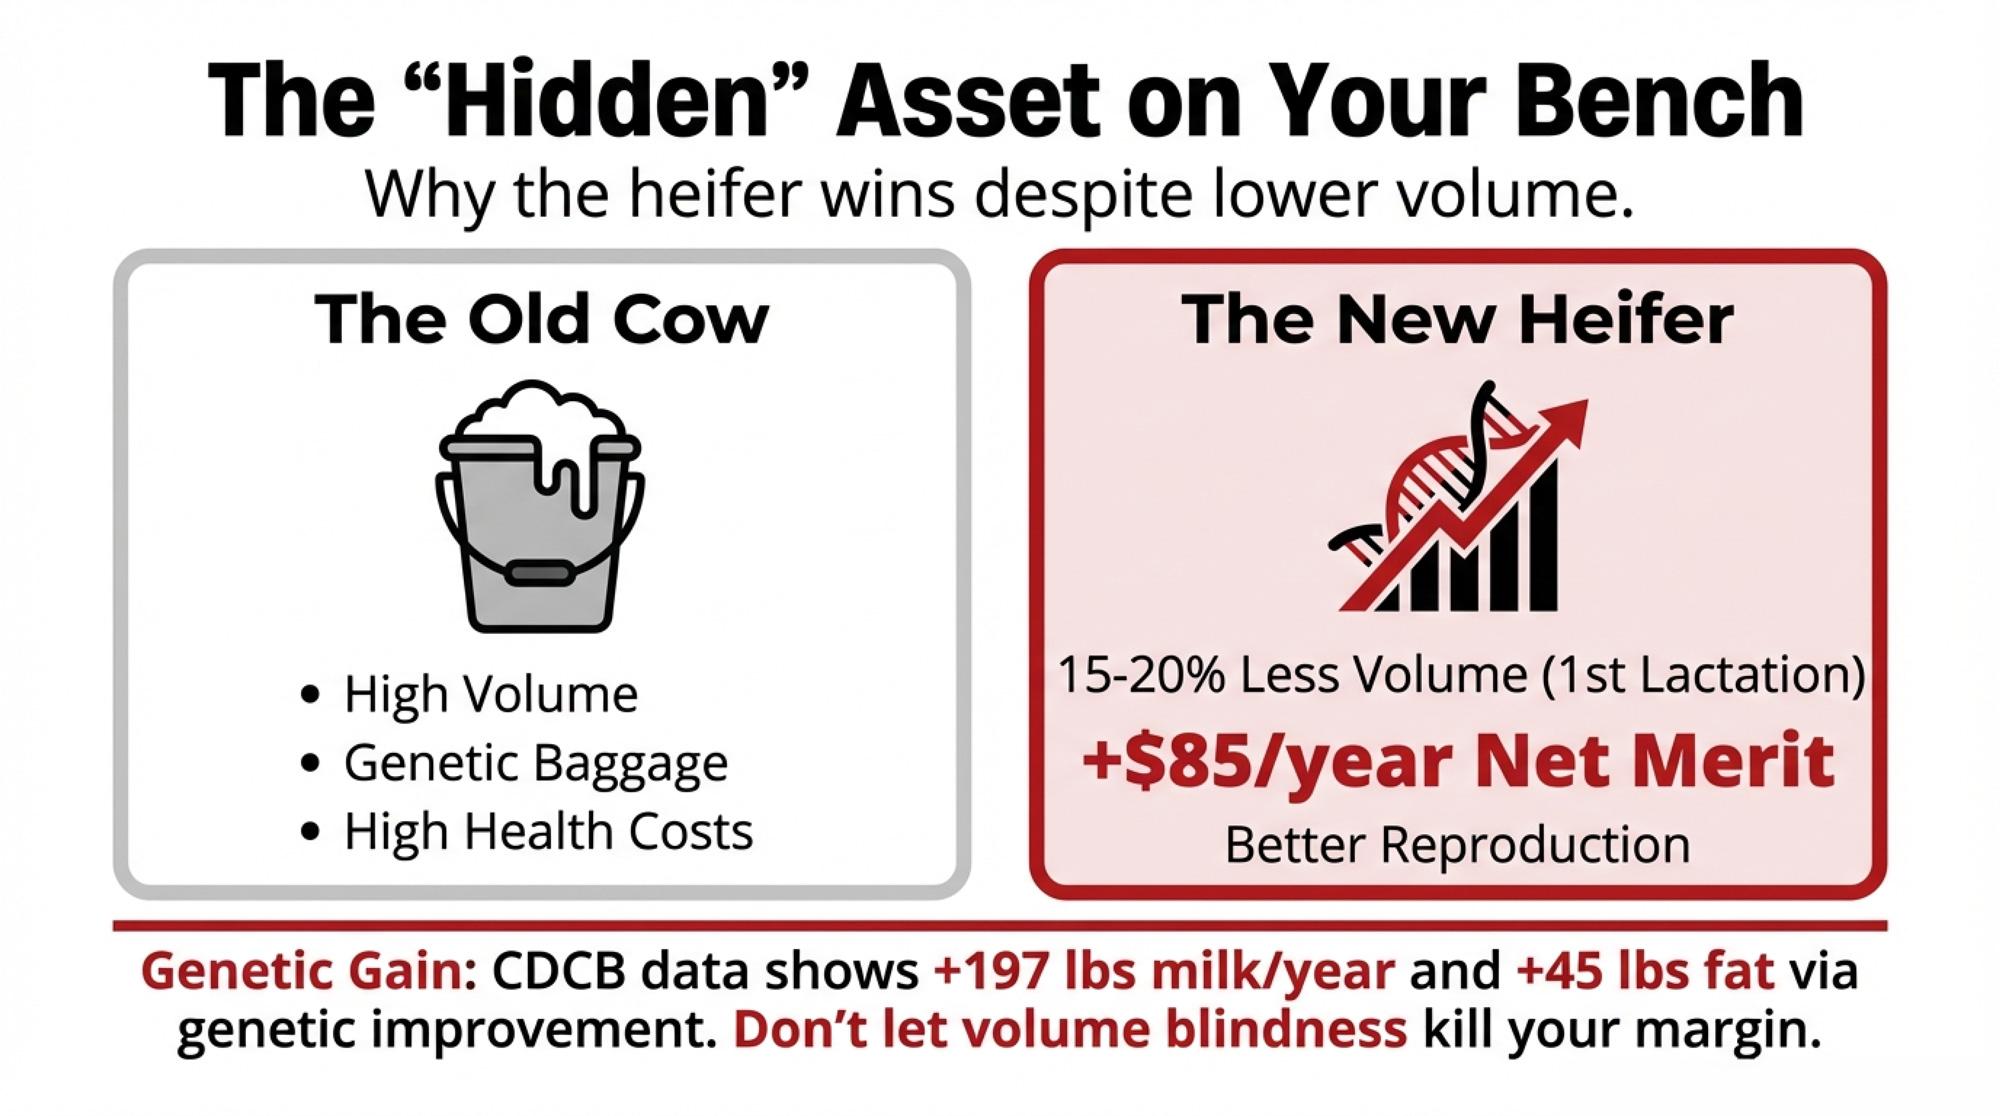
Now compare her to the heifer on your bench. CDCB’s 2020 genetic base change showed Holsteins gained 984 pounds of milk through genetic improvement alone over the five-year base period (2010–2015 births) — roughly 197 lbs/year. The 2025 base change, reflecting 2015–2020 births, shows even larger component gains: +45 lbs of butterfat and +30 lbs of protein over that period. Since genomic selection took hold, the average annual increase in Net Merit has been $85/year, compared to $40 during the previous five years. That genetic progress is sitting on your heifer bench right now — and it compounds across her lifetime.
If the older cow is past 200 DIM, producing 15% below her group’s rolling herd average, open or questionable on pregnancy status, and carrying elevated SCC, her real daily margin after all variable costs may be negative.
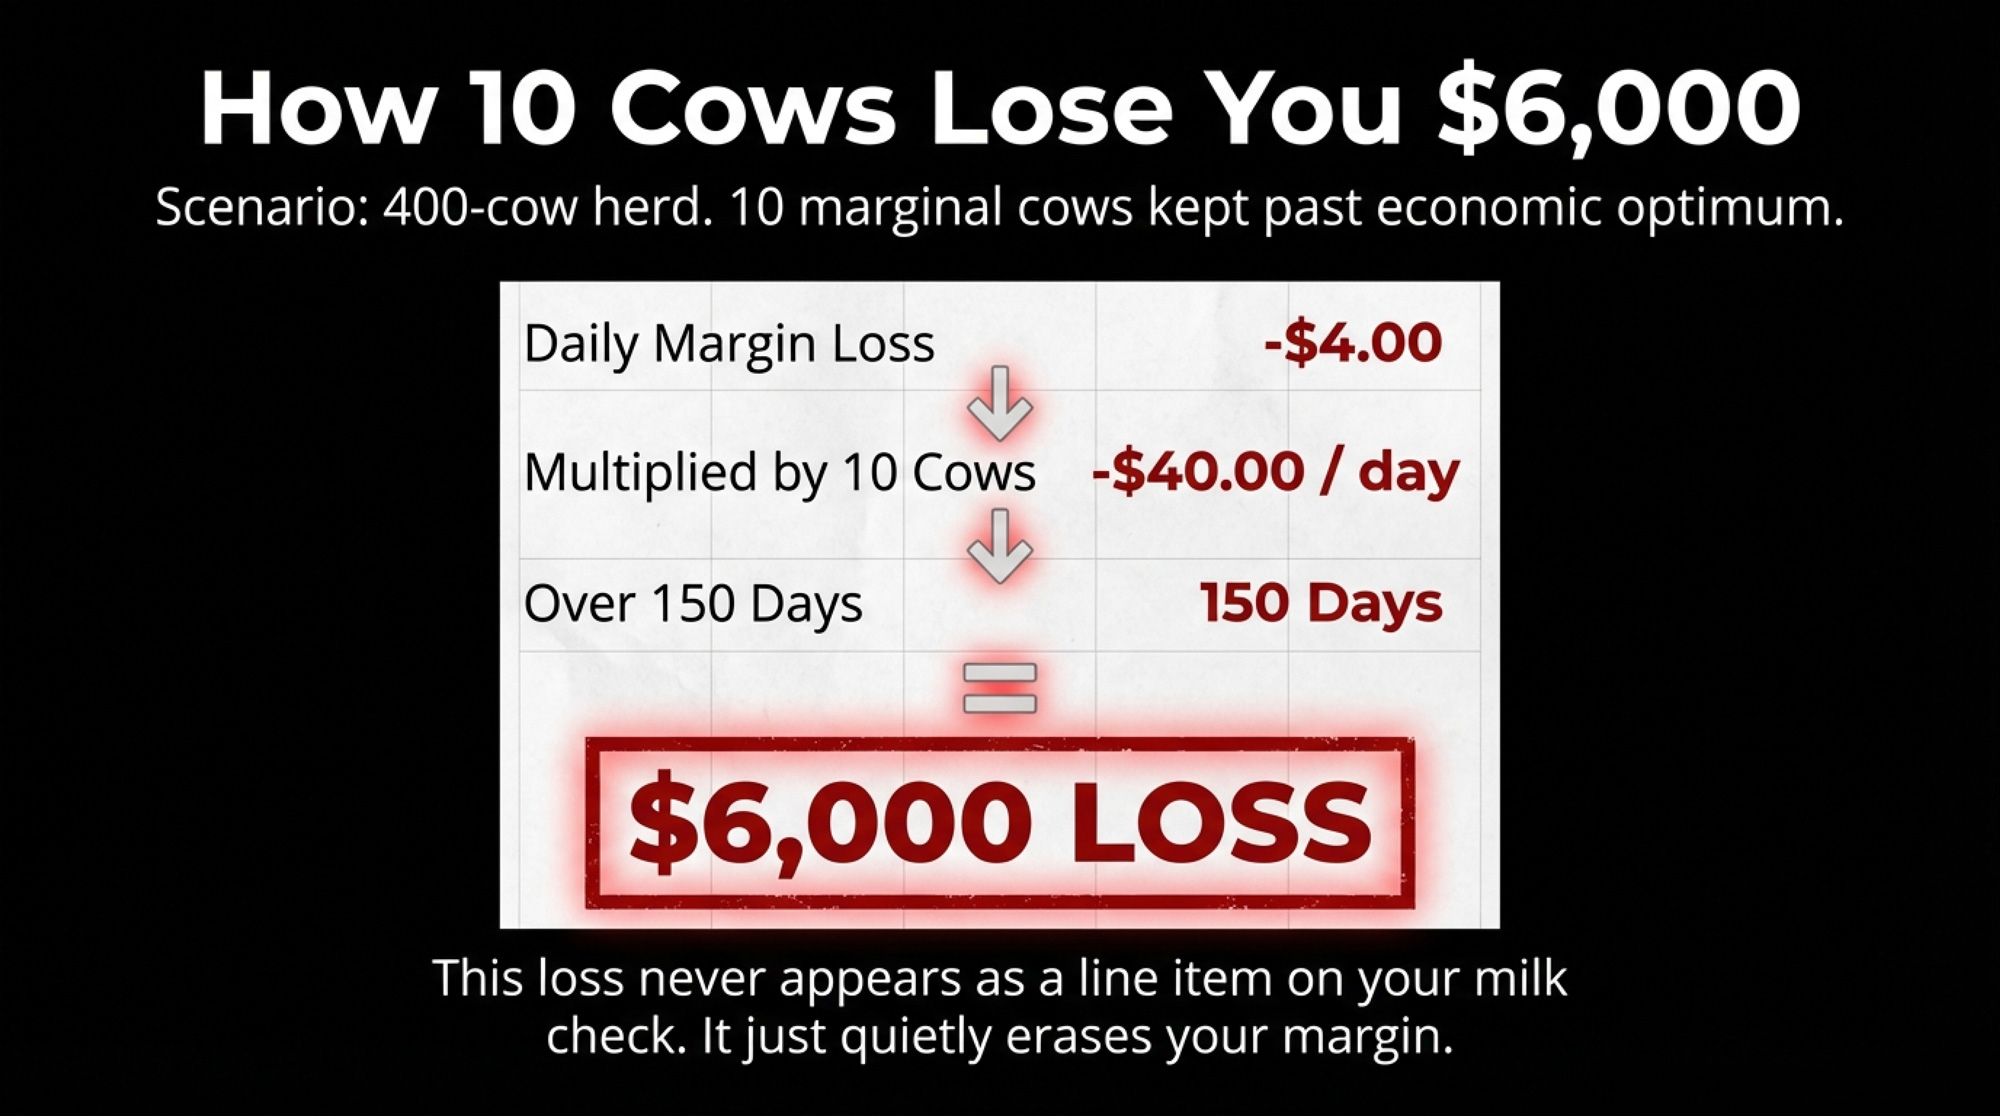
On a 400-cow herd, keeping just 10 cows past their economic optimum adds up fast. If each marginal cow generates $2.50–$4.00/day less margin than her replacement would, that’s $25–$40/day across the group. Over 150 days, that’s $3,750–$6,000 in lost opportunity, just for those 10 cows. Scale it to 15 or 20, and you’re looking at $5,625–$12,000 in a single cycle that never shows up as a line item on your milk check.
| Scenario | Daily Margin Loss Per Cow | Number of Marginal Cows | Total Loss Over 150 Days |
|---|---|---|---|
| Conservative | $2.50 | 10 | $3,750 |
| Moderate | $3.25 | 10 | $4,875 |
| High-loss | $4.00 | 10 | $6,000 |
The Heifer Shortage Doesn’t Change the Math
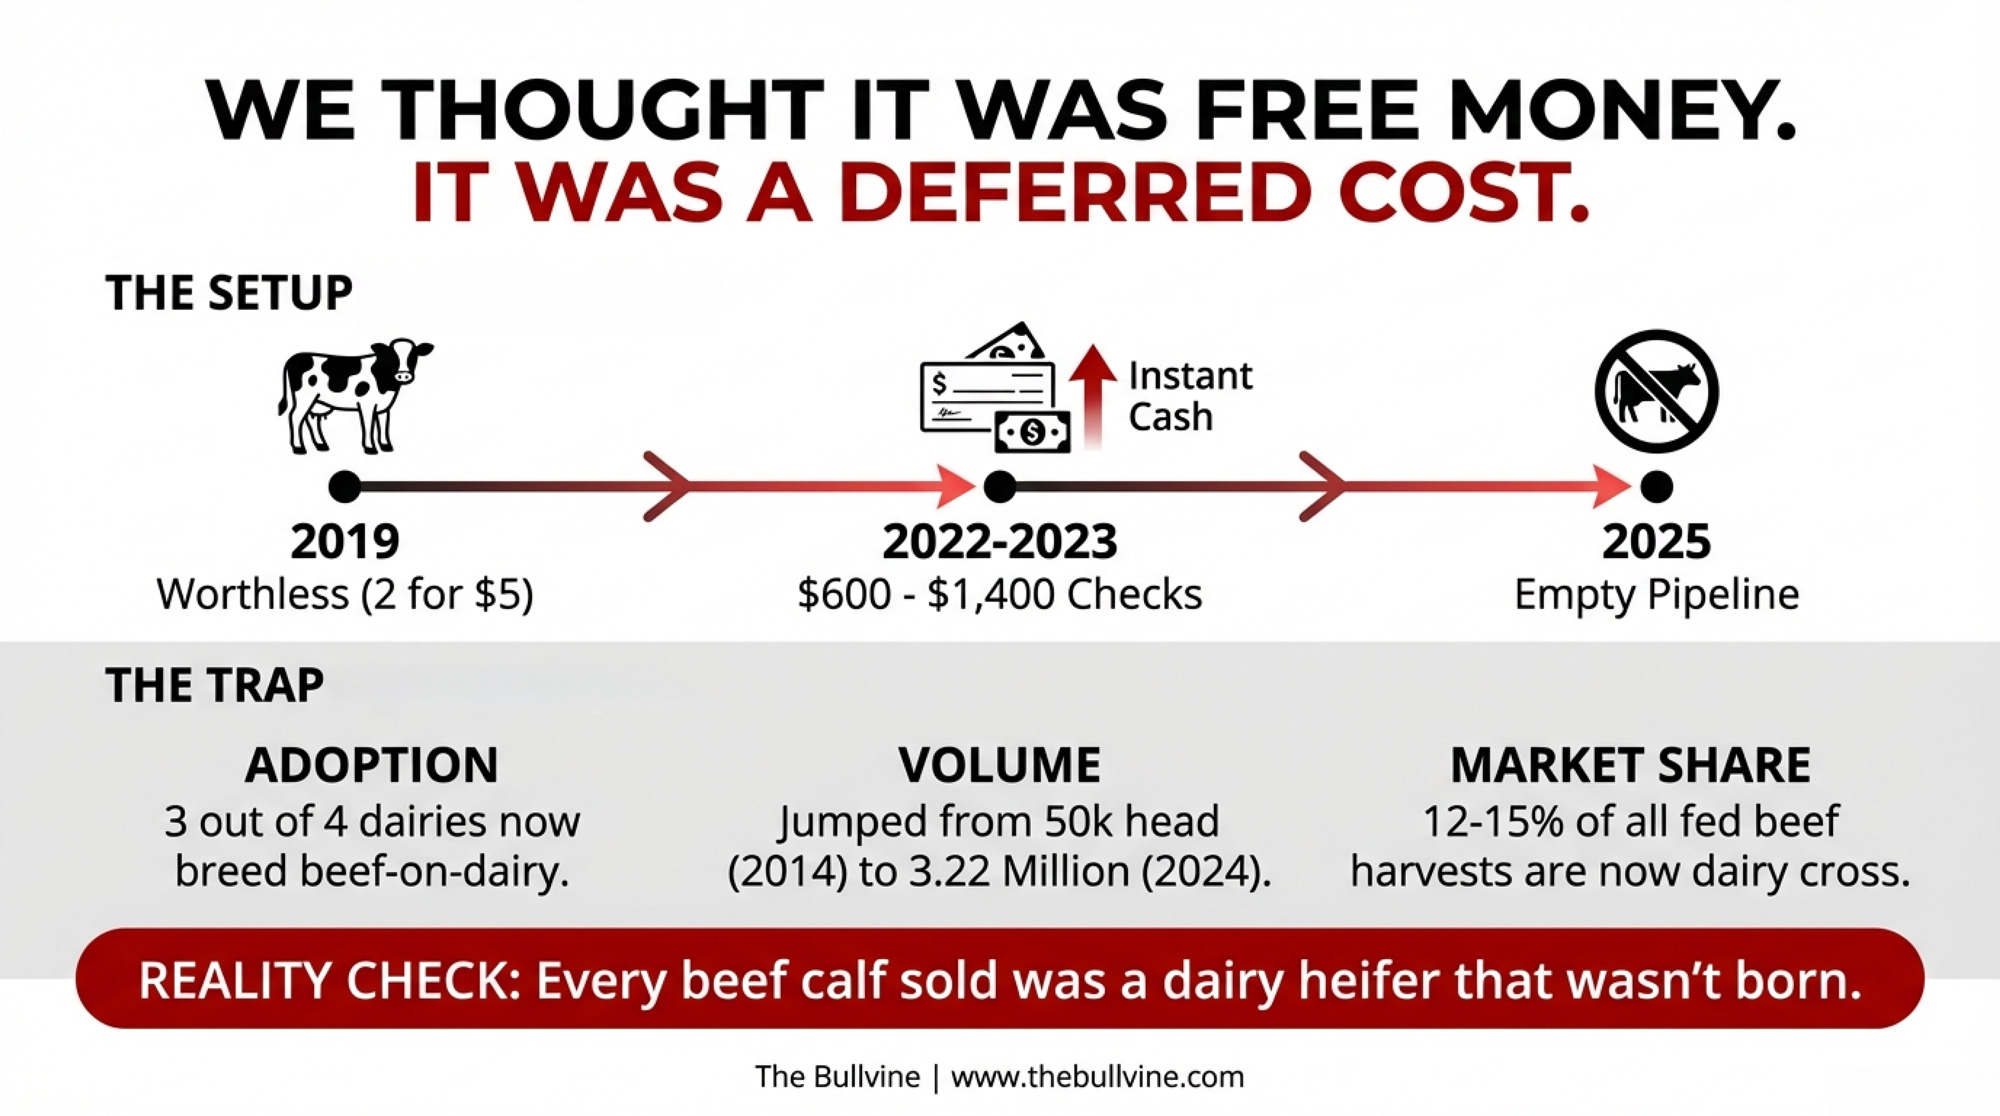
USDA’s February 2026 Outlook Forum makes clear that the dairy heifer pipeline isn’t recovering anytime soon — the number of heifers expected to calve declined again, and beef-on-dairy continues to pull potential replacements out of the system.
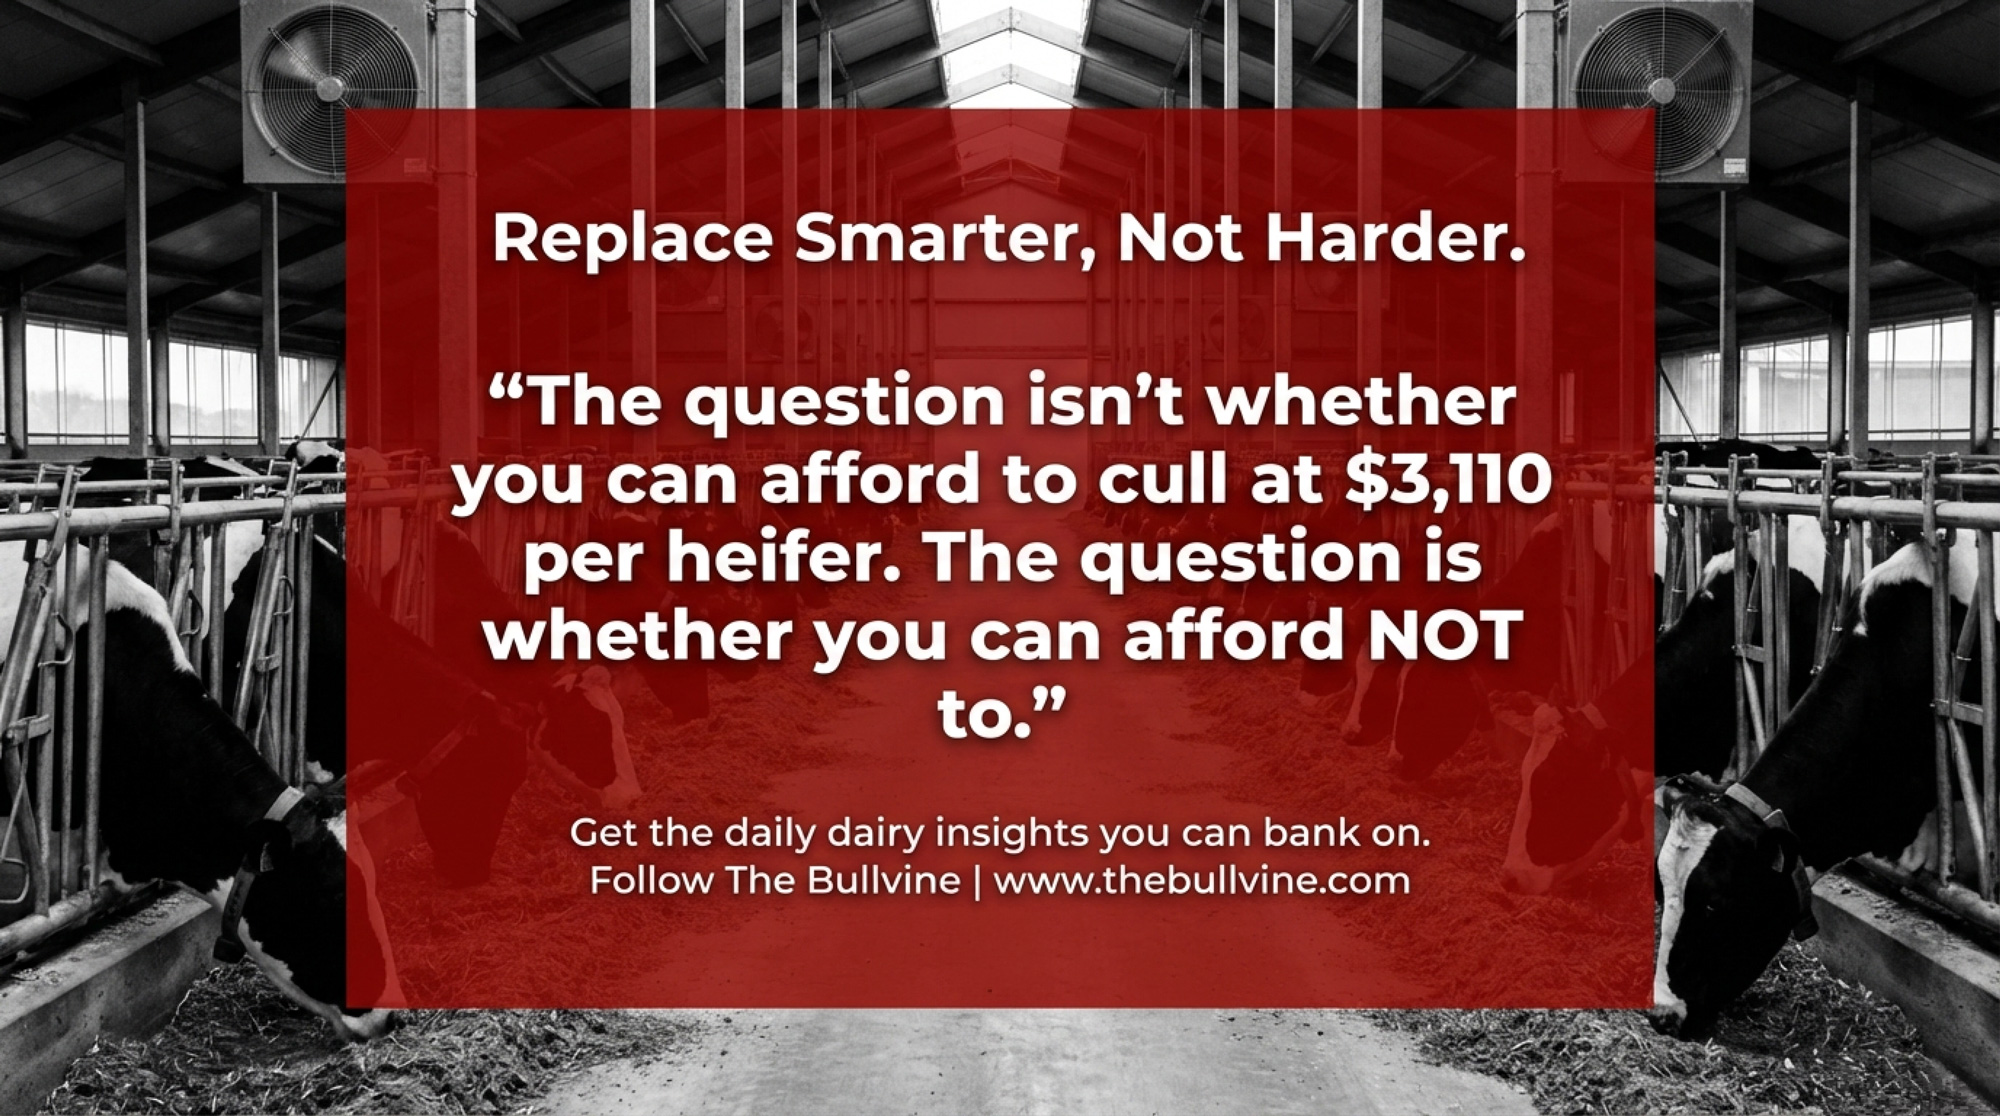
But expensive doesn’t mean “don’t replace.” It means replace smarter.
The Schlebusch study nails it: farmers consistently underestimate the cost of keeping cows too long and overestimate the cost of culling too early. Across all 29 farms, cows retained despite having negative economic value accounted for 3,557 CHF in cumulative losses, versus just 1,101 CHF in losses from premature culling — a 3.2:1 ratio. And that’s in a system where the average replacement heifer cost was 3,123 CHF (roughly $3,435 USD at 2023 exchange rates) — not far off from what North American producers face right now.
| Decision Type | Cumulative Loss (CHF) |
|---|---|
| Kept Too Long | 3,557 |
| Culled Too Early | 1,101 |
That’s the sunk cost trap working on you. You’ve invested $2,860 to get that heifer into the herd. She had a rough first lactation — mastitis, slow to breed back. The instinct is to keep her longer to “pay off” that investment. But that $2,860 is gone whether she milks for one more day or one more year. The only question that matters: starting today, will she generate more margin than the next heifer in line?
If the answer is no, keeping her isn’t protecting your investment. It’s compounding the loss.
When Does “One More Lactation” Stop Making Money?
Think of it like professional sports. As long as a player is performing — earning her spot through production, health, and reproductive success — she stays on the roster. The day she’s not outperforming the next player on the bench, she gets replaced. Nobody keeps a veteran around just because his signing bonus was expensive.
Eric Grotegut at Grotegut Dairy in Wisconsin has pushed his replacement rate down to 25% — but he didn’t do it by holding on to marginal cows. Better calf management, upgraded facilities, and consistent hoof work drove the involuntary culls out. “Instead of culling problem cows or culling lower performers, genetically they’re definitely able to stay longer,” Grotegut told the CDCB panel at World Dairy Expo in 2025. That’s a low cull rate that was earned, not manufactured.
Some cows deserve exactly that kind of long career. Great genetics, sound feet, clean udders, breed back on schedule, throw high-index daughters — the breeders who proved genetic progress compounds built their programs around those animals. The Schlebusch data confirms it: the biological and economic optimum sits at five to six parities — but only for cows whose health, fertility, and production justify it.
“Some cows deserve long careers” is not the same as “all cows should have long careers.” And “our cull rate should be 28%” isn’t a management strategy. It’s a bumper sticker.
What $3,110 Heifers Mean for Your Culling Strategy
Albert De Vries at the University of Florida has spent years modeling this exact question. His framing cuts through the noise: “You want to maximize profitability per unit of the most limiting factor, and a reasonable metric for that is profitability per cow per year.” Not lifetime production. Not lifetime longevity. Profit per cow per year.
Pull your DHIA 202 Herd Summary tonight and run these three filters:
| Filter | Threshold / Rule | Why It Matters |
|---|---|---|
| Days in Milk (DIM) | >200 DIM | Cow is past peak; if she’s underperforming now, she won’t recover margin before dry-off |
| Production vs. Group | <85% of group rolling herd average | She’s a bottom-tier performer relative to her peers — genetic progress is sitting on your heifer bench |
| SCC & Pregnancy Status | SCC >300,000 or open past 200 DIM | High SCC signals chronic mastitis; open status means no future lactation income to recover her feed cost |
- Flag every cow past 200 DIM producing below 85% of her group’s rolling herd average.
- Cross-reference against pregnancy status and SCC. Any cow that’s open past 200 DIM with SCC above 300,000 — she’s your first candidate.
- Calculate her daily margin using your actual milk price and feed cost, not herd averages. Dr. Victor Cabrera’s Dairy Management group at UW-Madison offers a free Retention Pay-Off (RPO) calculator at dairymgt.wiscweb.wisc.edu that values each cow relative to her potential replacement, accounting for production, butterfat, pregnancy status, feed cost, replacement cost, and cull cow price. De Vries’s group at the University of Florida offers comparable tools. Both let you plug in your own numbers.
If your operation carries 40%+ first-lactation heifers, you will sacrifice bulk tank volume. First-lactation animals produce 80%–85% of the milk that a cow in her third or greater lactation can produce — that’s a 15%–20% gap per cow. A first-lactation animal makes roughly 15% less than a second-lactation cow and 25% less than one in her third or fourth. First-lactation cows already account for 38%–40% of the milking herd on many operations, so pushing that number higher will absolutely show up in your tank average.
But those younger cows also carry better reproductive performance, lower health costs, and the genetic progress you’ve been paying for through your semen purchases. The trade-off is real — lower volume now in exchange for better margins and a genetically stronger herd going forward. Whether that trade makes sense depends on your milk contract structure, component premiums, and how quickly your replacements ramp up.
For Canadian producers operating under quota, the economics shift because the quota value per cow substantially changes the replacement cost calculation. A cow’s implied quota value can exceed her biological value. Run the same filters, but adjust the threshold — a marginal cow holding quota may warrant a longer runway than the same cow in a non-quota system.
For operations where heifers clear $3,500+ (California, Minnesota, parts of Wisconsin): the “keep” window for marginal cows extends modestly. But document the monthly cost of every cow you’re holding past the filter screen. If you haven’t replaced her in 90 days, she’s not a bridge — she’s your new standard.
The 30/90/365 Playbook
In the next 30 days: Pull your DHIA 202 and identify every cow that fails the three-filter screen. Run at least five through Cabrera’s RPO calculator at UW-Madison or the University of Florida equivalent using your actual January–February milk price and feed cost. If the calculator says replace, start the process.
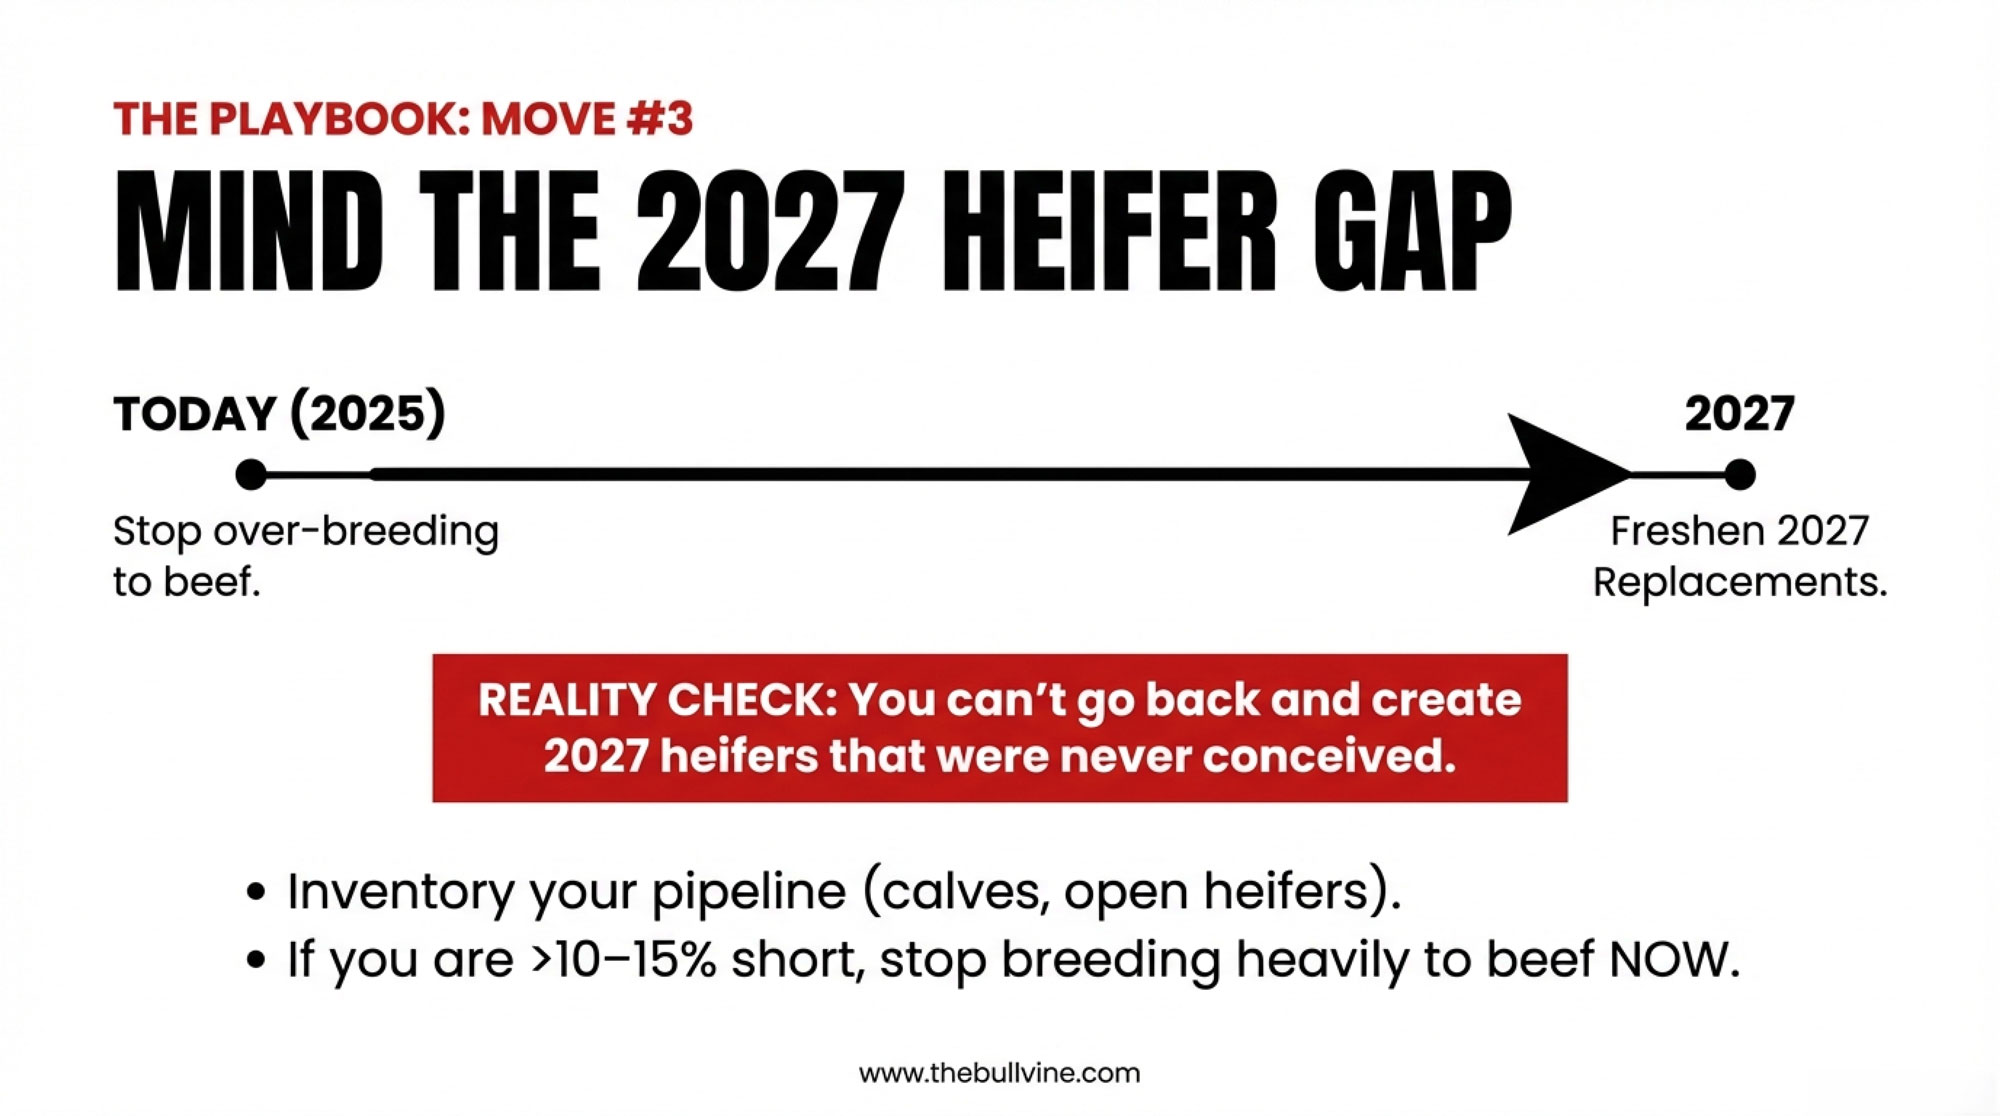
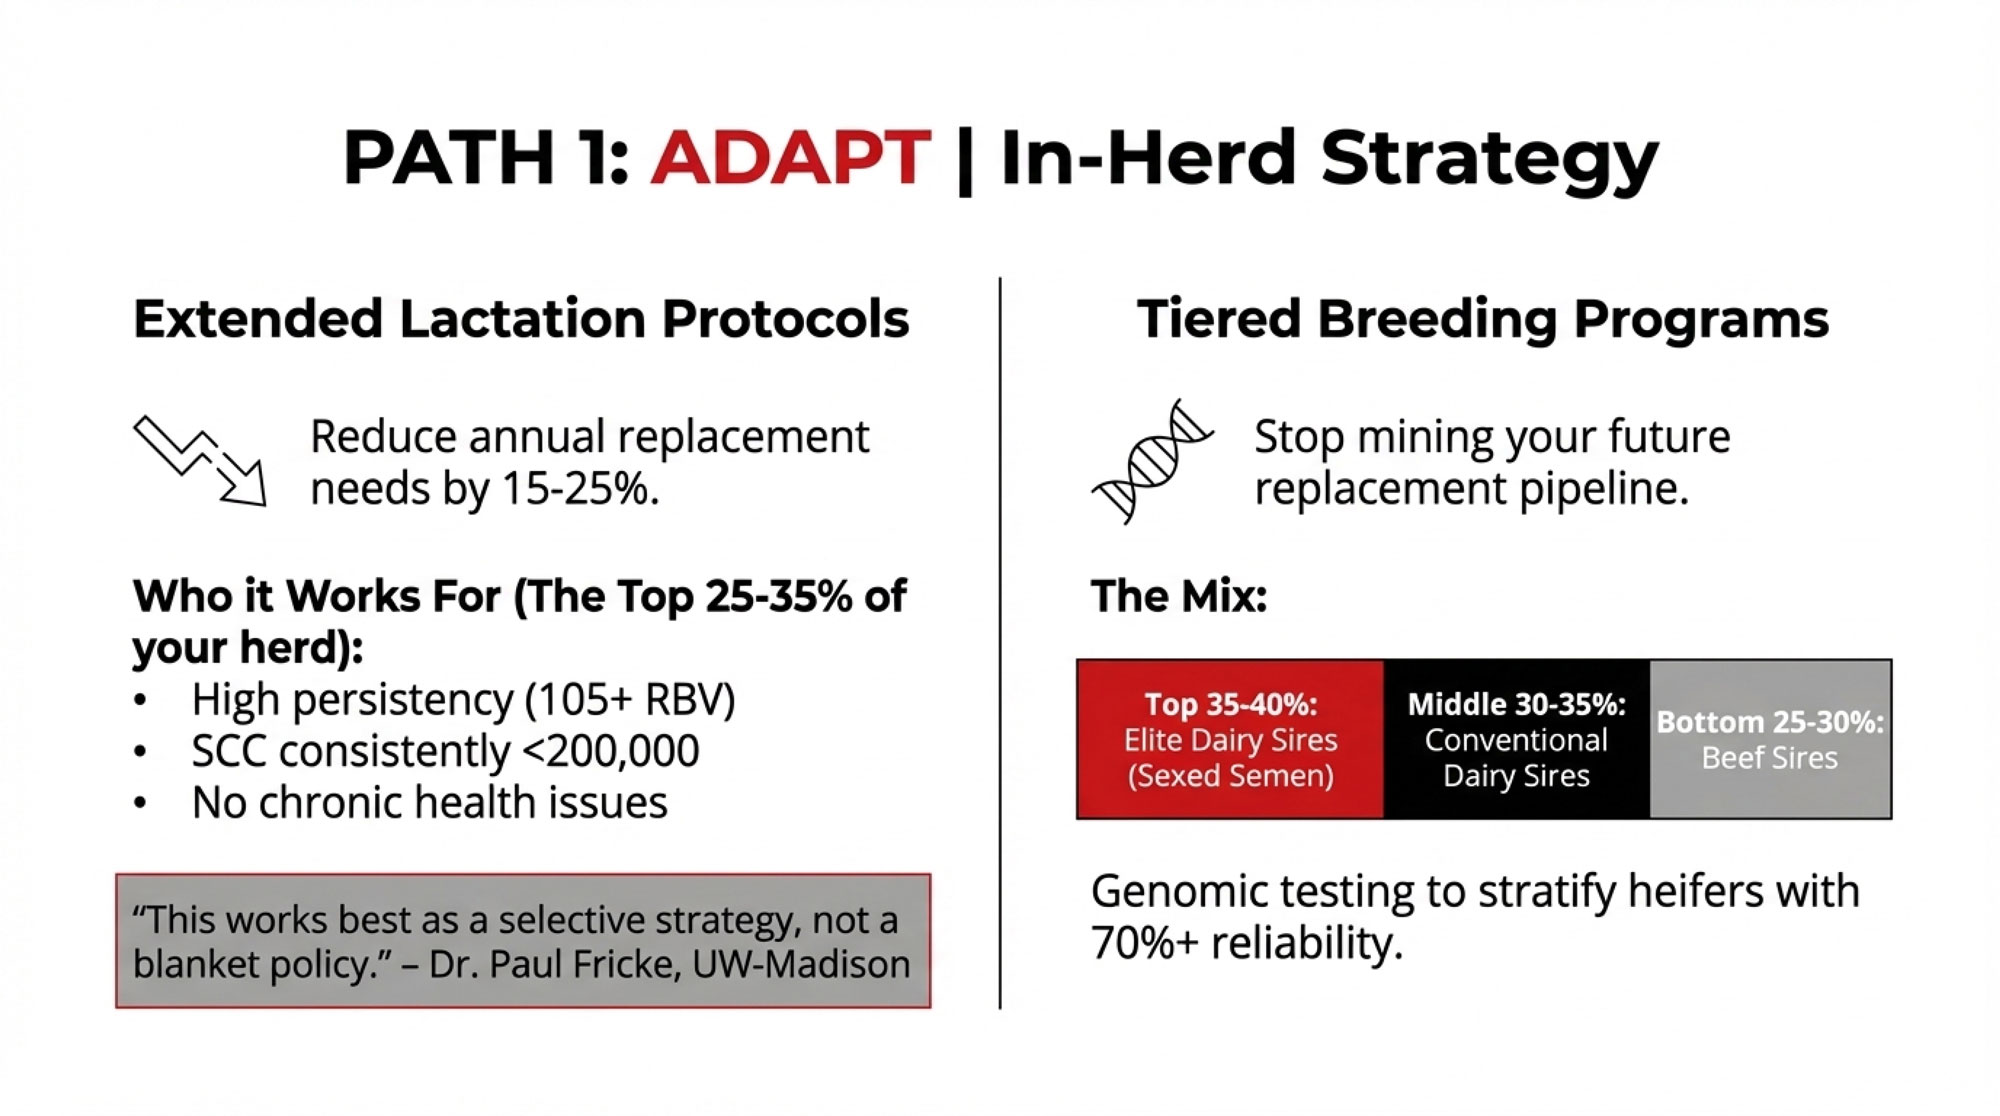
In the next 90 days: Review your breeding protocol. Glenn Kline’s approach at Y Run Farms is a good model: beef semen on lower performers, IVF on your best females, and genomic testing to know the difference. How many straws of beef semen are you using on cows, and how many might you need as replacements? Every beef-cross pregnancy is terminal for your replacement pipeline. Align your breeding decisions with your actual heifer needs—not just your calf-check revenue.
In the next 365 days: Build a quarterly cull review into your management calendar. Heifer prices will move. Milk prices will move. The cows that were borderline keeps at $3,110/heifer may be clear culls at $2,500 or clear keeps at $3,800. The point isn’t to set a policy and forget it — it’s to make this decision with data, every quarter, cow by cow.
Key Takeaways
- Across 29 farms and 3,003 cows, hanging onto unprofitable cows cost about 3× more than culling a bit too early — keeping is the more expensive instinct.
- Penn State data shows 73.2% of culls are involuntary, and it takes more than 3 lactations to pay off a heifer that only averages 2.7, so “one more lactation” often destroys margin instead of proving good management.
- On a 400‑cow herd with today’s USDA prices, ten marginal cows can quietly erase $3,750–$6,000 in 150 days without ever appearing as a separate line on your milk check.
- A three‑filter screen (DIM >200, production <85% of group, high SCC/open) plus Cabrera’s RPO calculator and De Vries’ “profitability per cow per year” metric give you a repeatable way to rank cows as investments, not pets or statistics.
- High first‑lactation percentages, beef‑on‑dairy, and Canadian quota change how aggressive you can be, but not the core rule: if a cow can’t beat her replacement on profit per cow per year, she’s on borrowed time.
The Bottom Line
Count the cows past 200 DIM below 85% of their group average tonight. Run five through a retention payoff calculator. At $18.95/cwt all-milk forecast but $14.59 January Class III actual, your margin for error on marginal cows is thinner than it’s been in two years. That’s the math Kline runs at Y Run Farms every time he reaches for a beef straw instead of a dairy one. The question isn’t whether you can afford to cull them at $3,110 per replacement. The question is whether you can afford not to.
Complete references and supporting documentation are available upon request by contacting the editorial team at editor@thebullvine.com.
Learn More
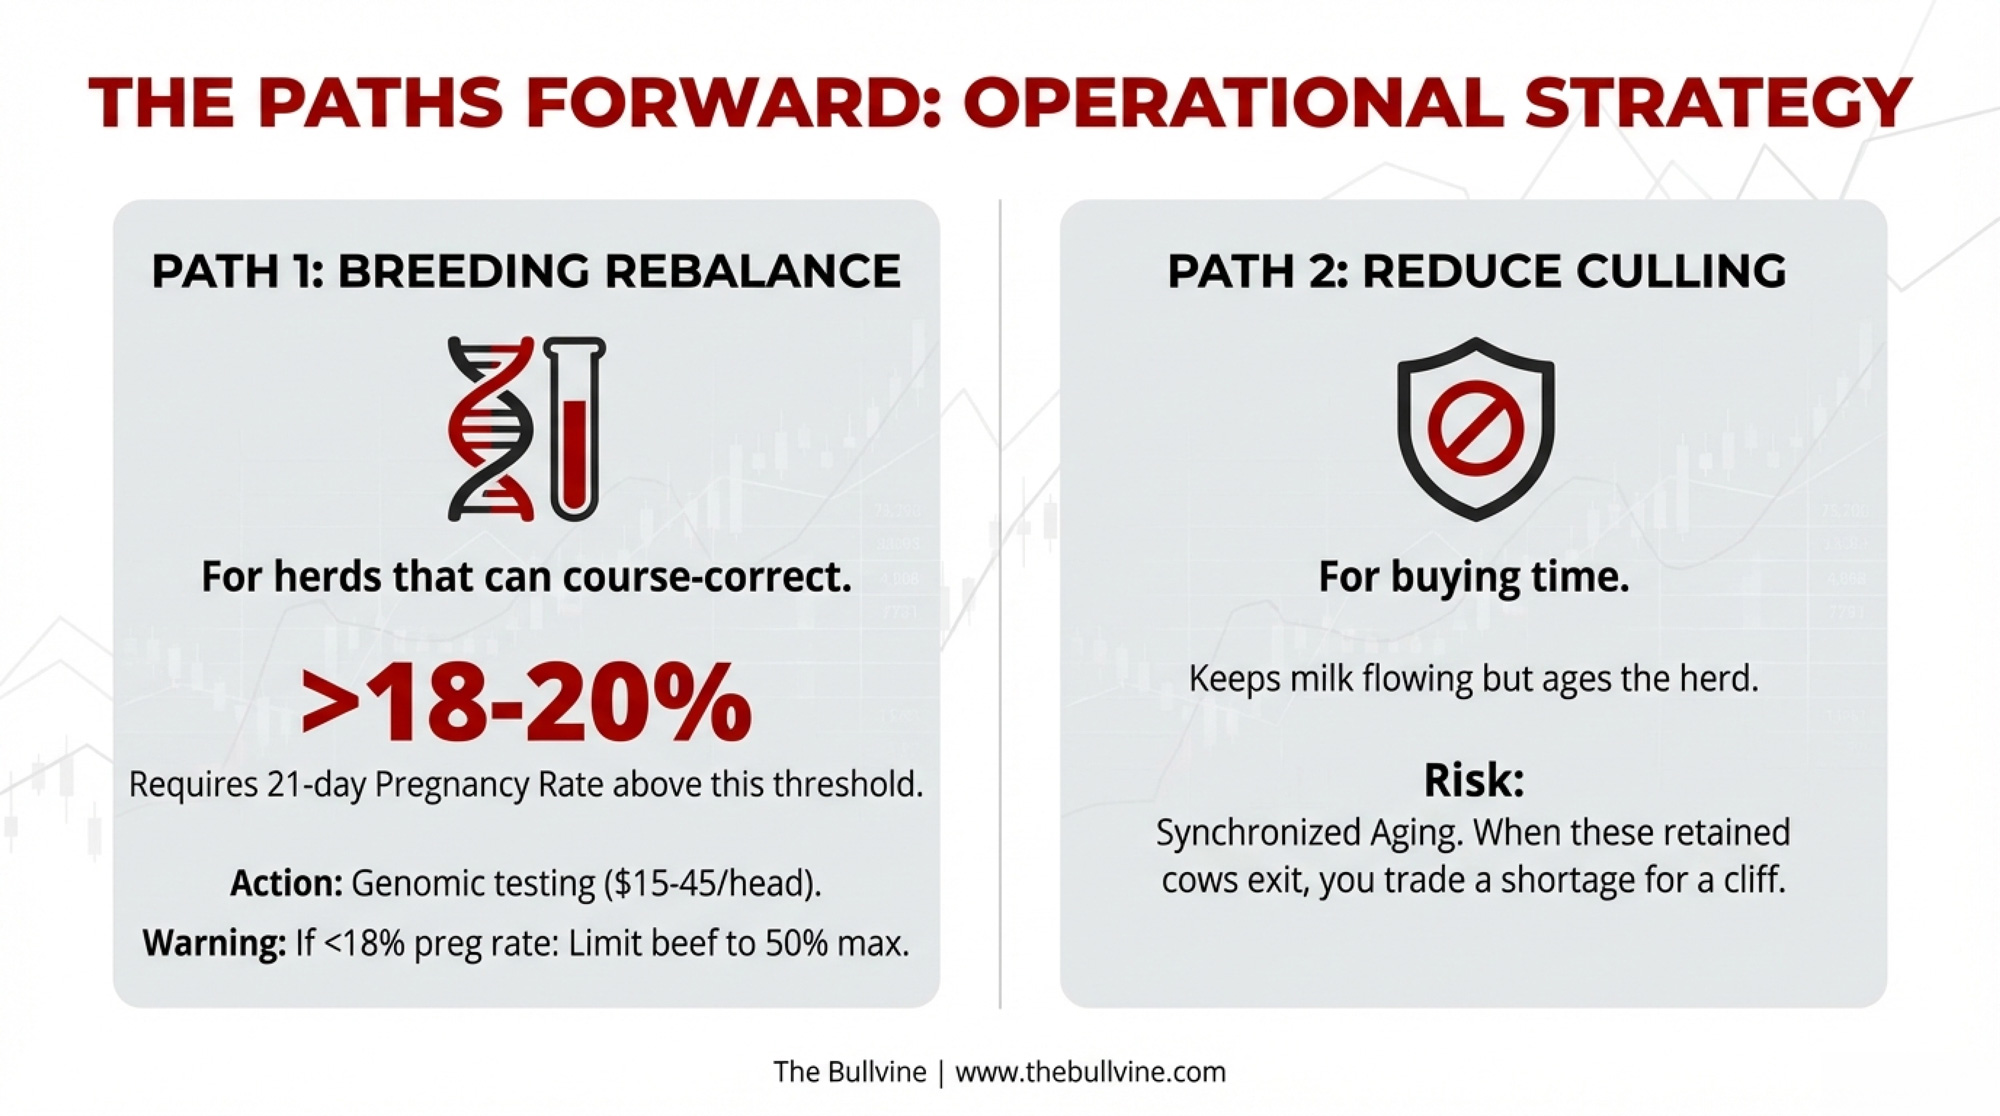
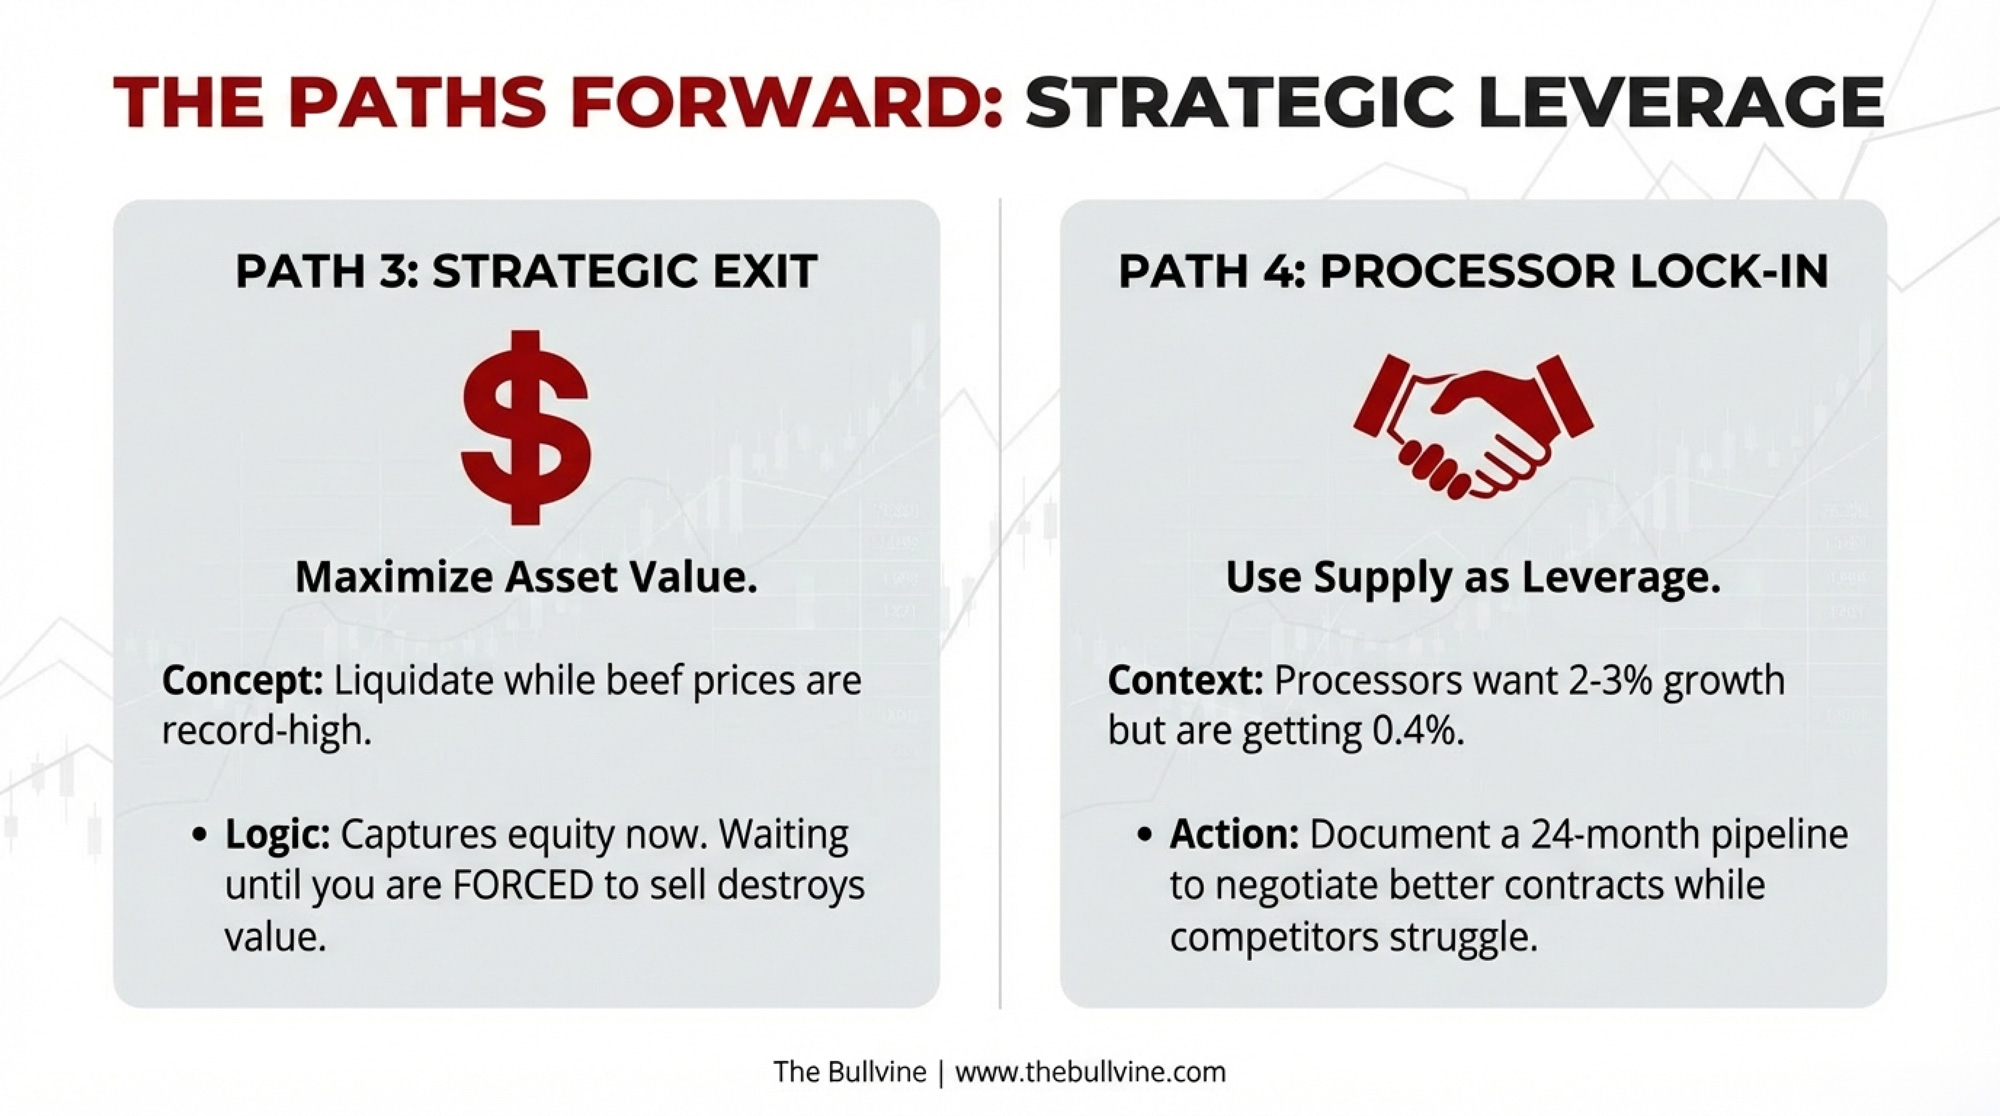
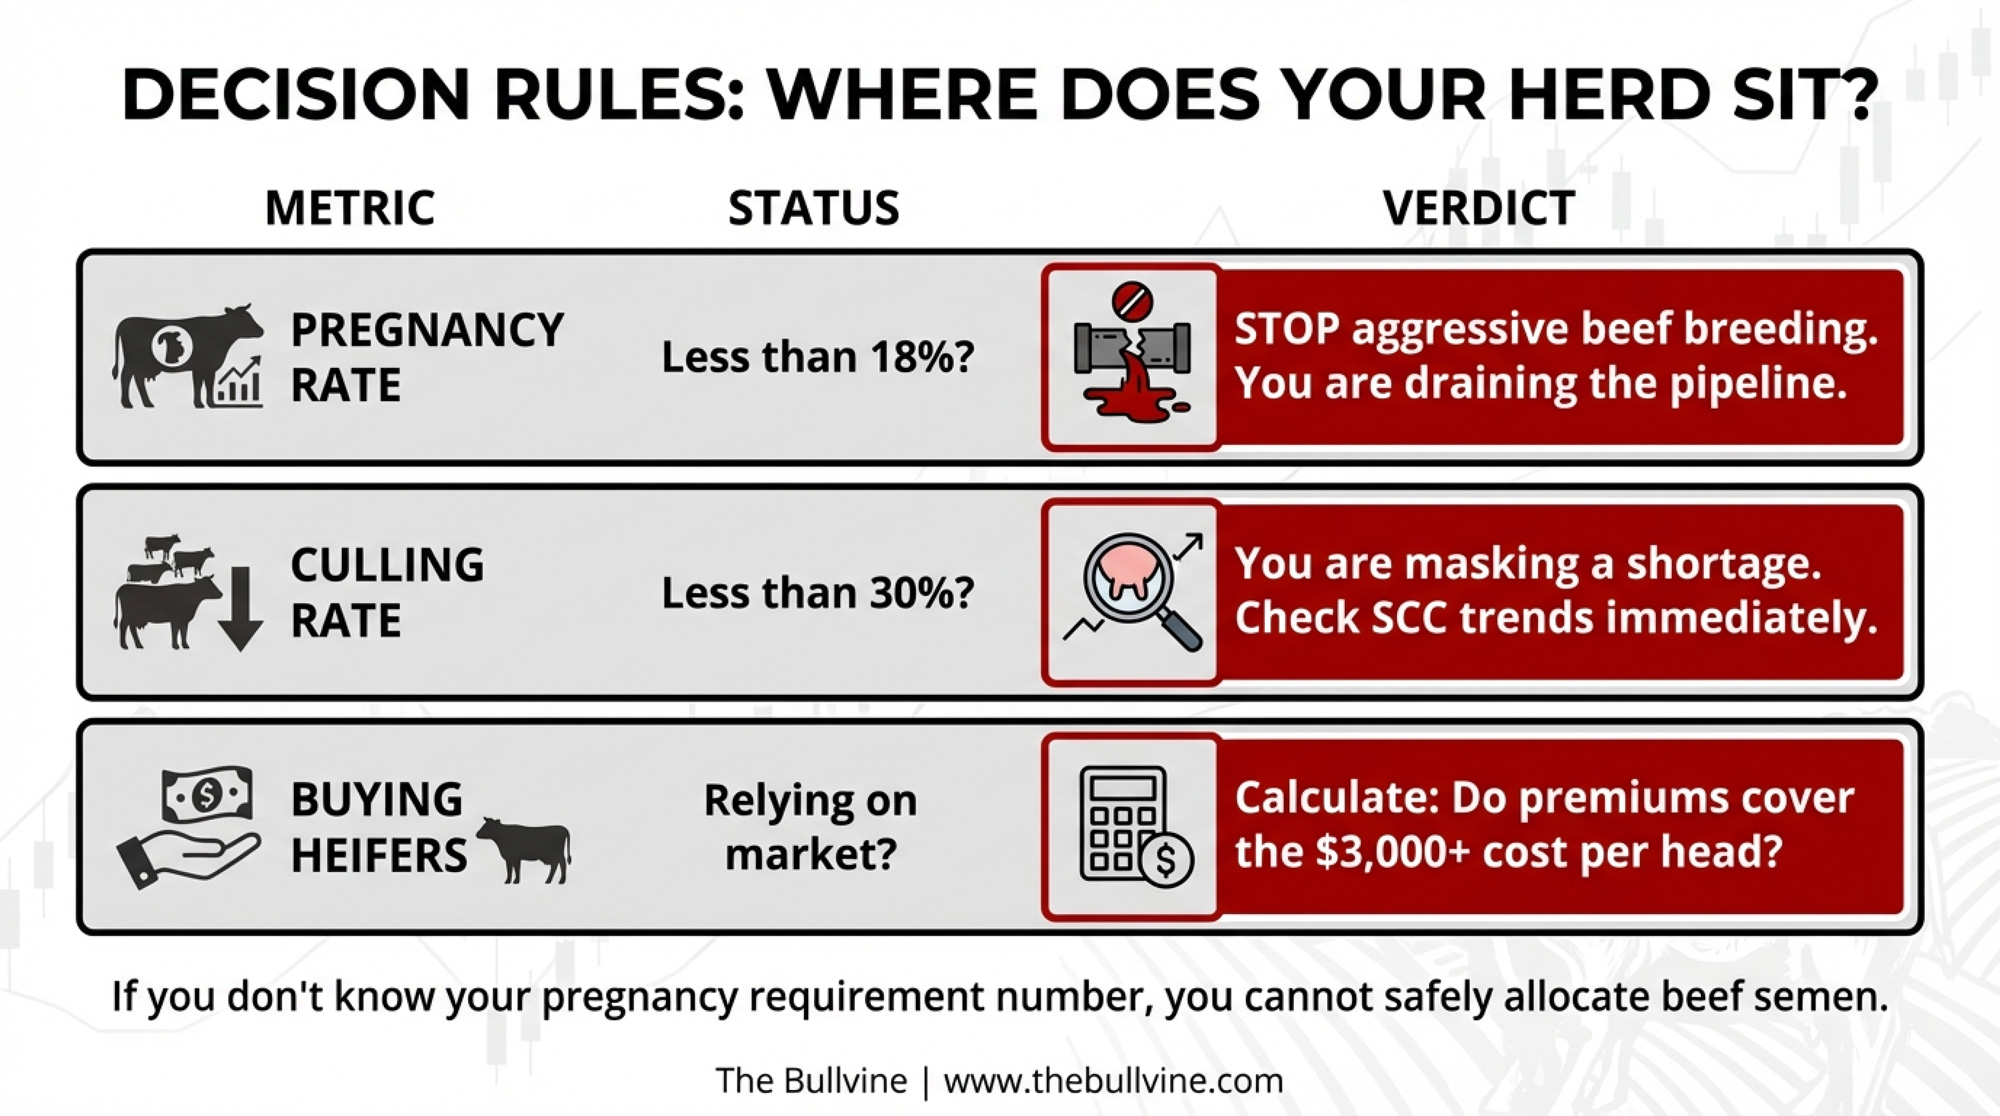
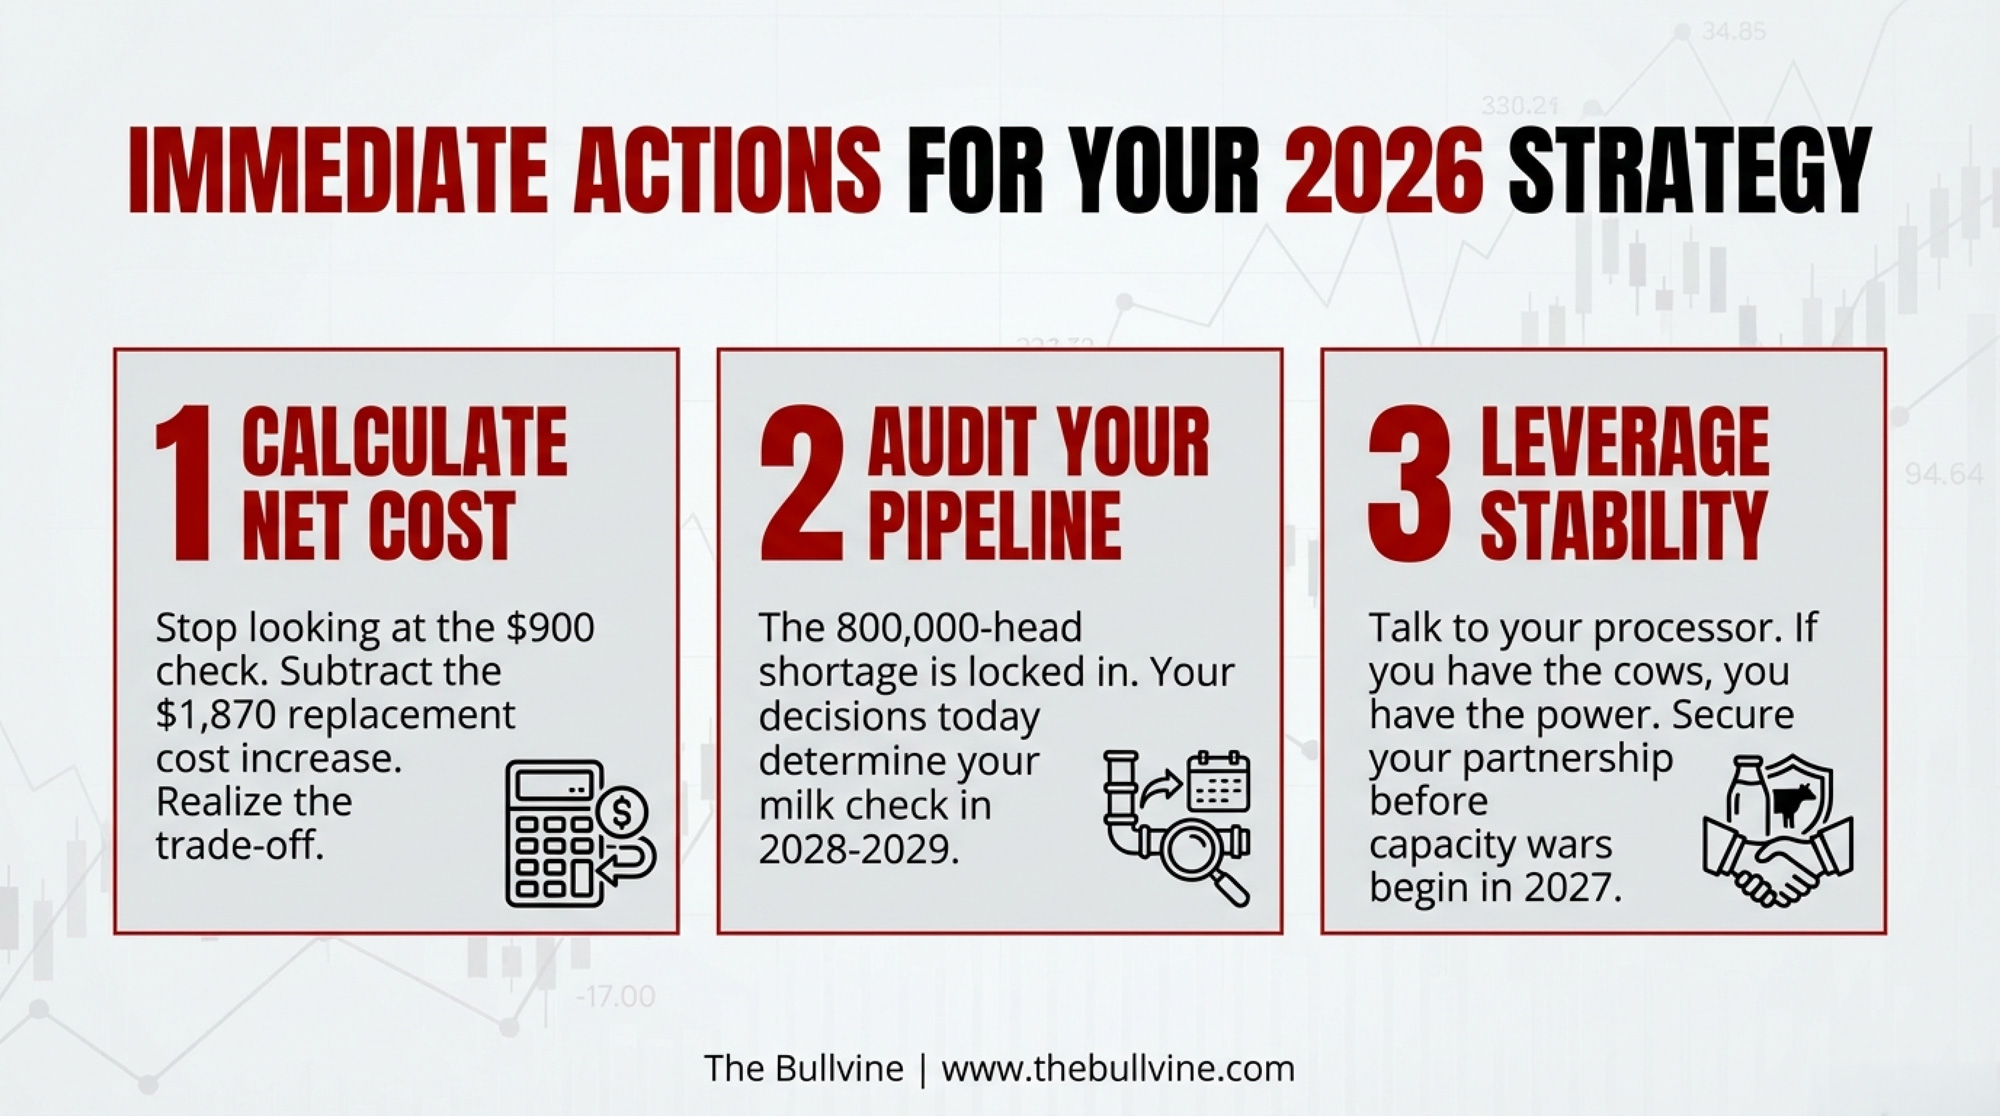
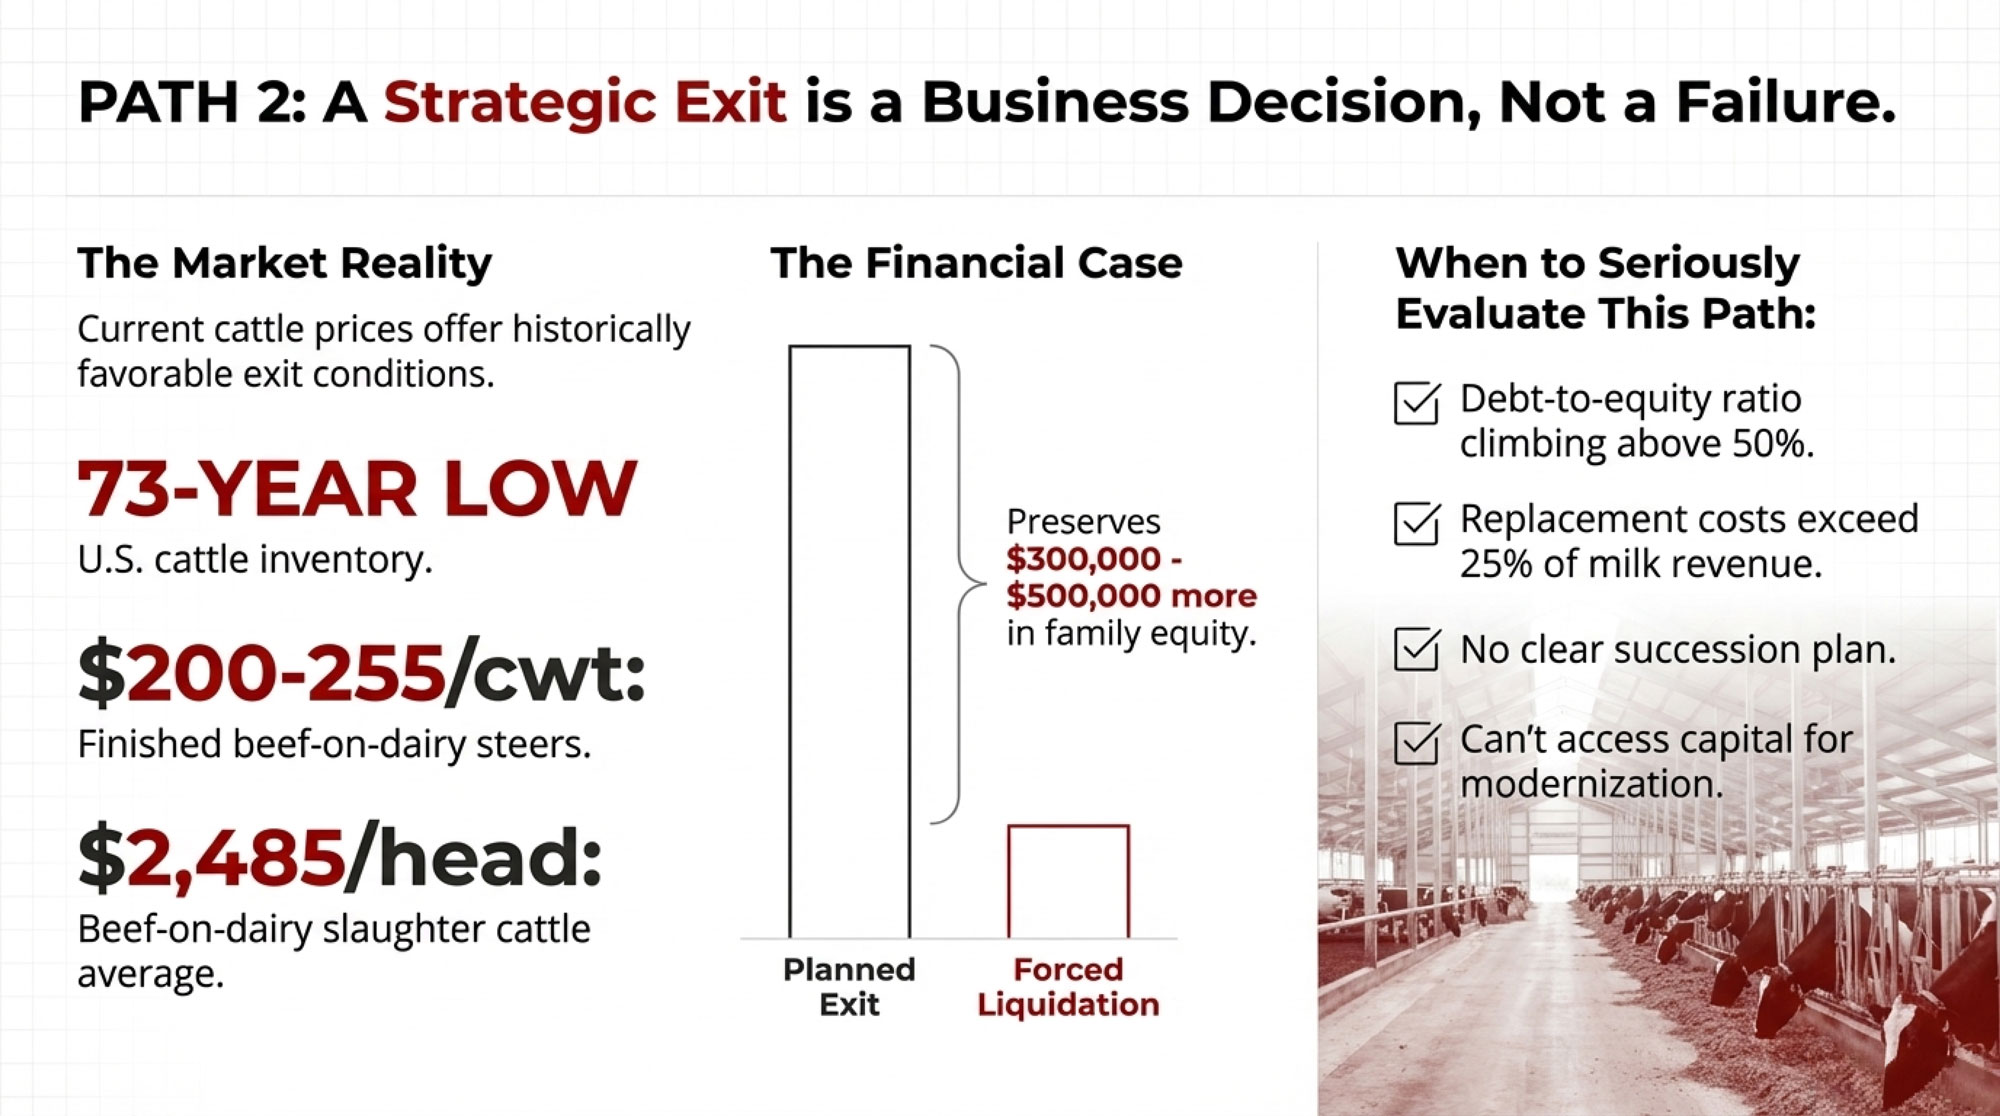
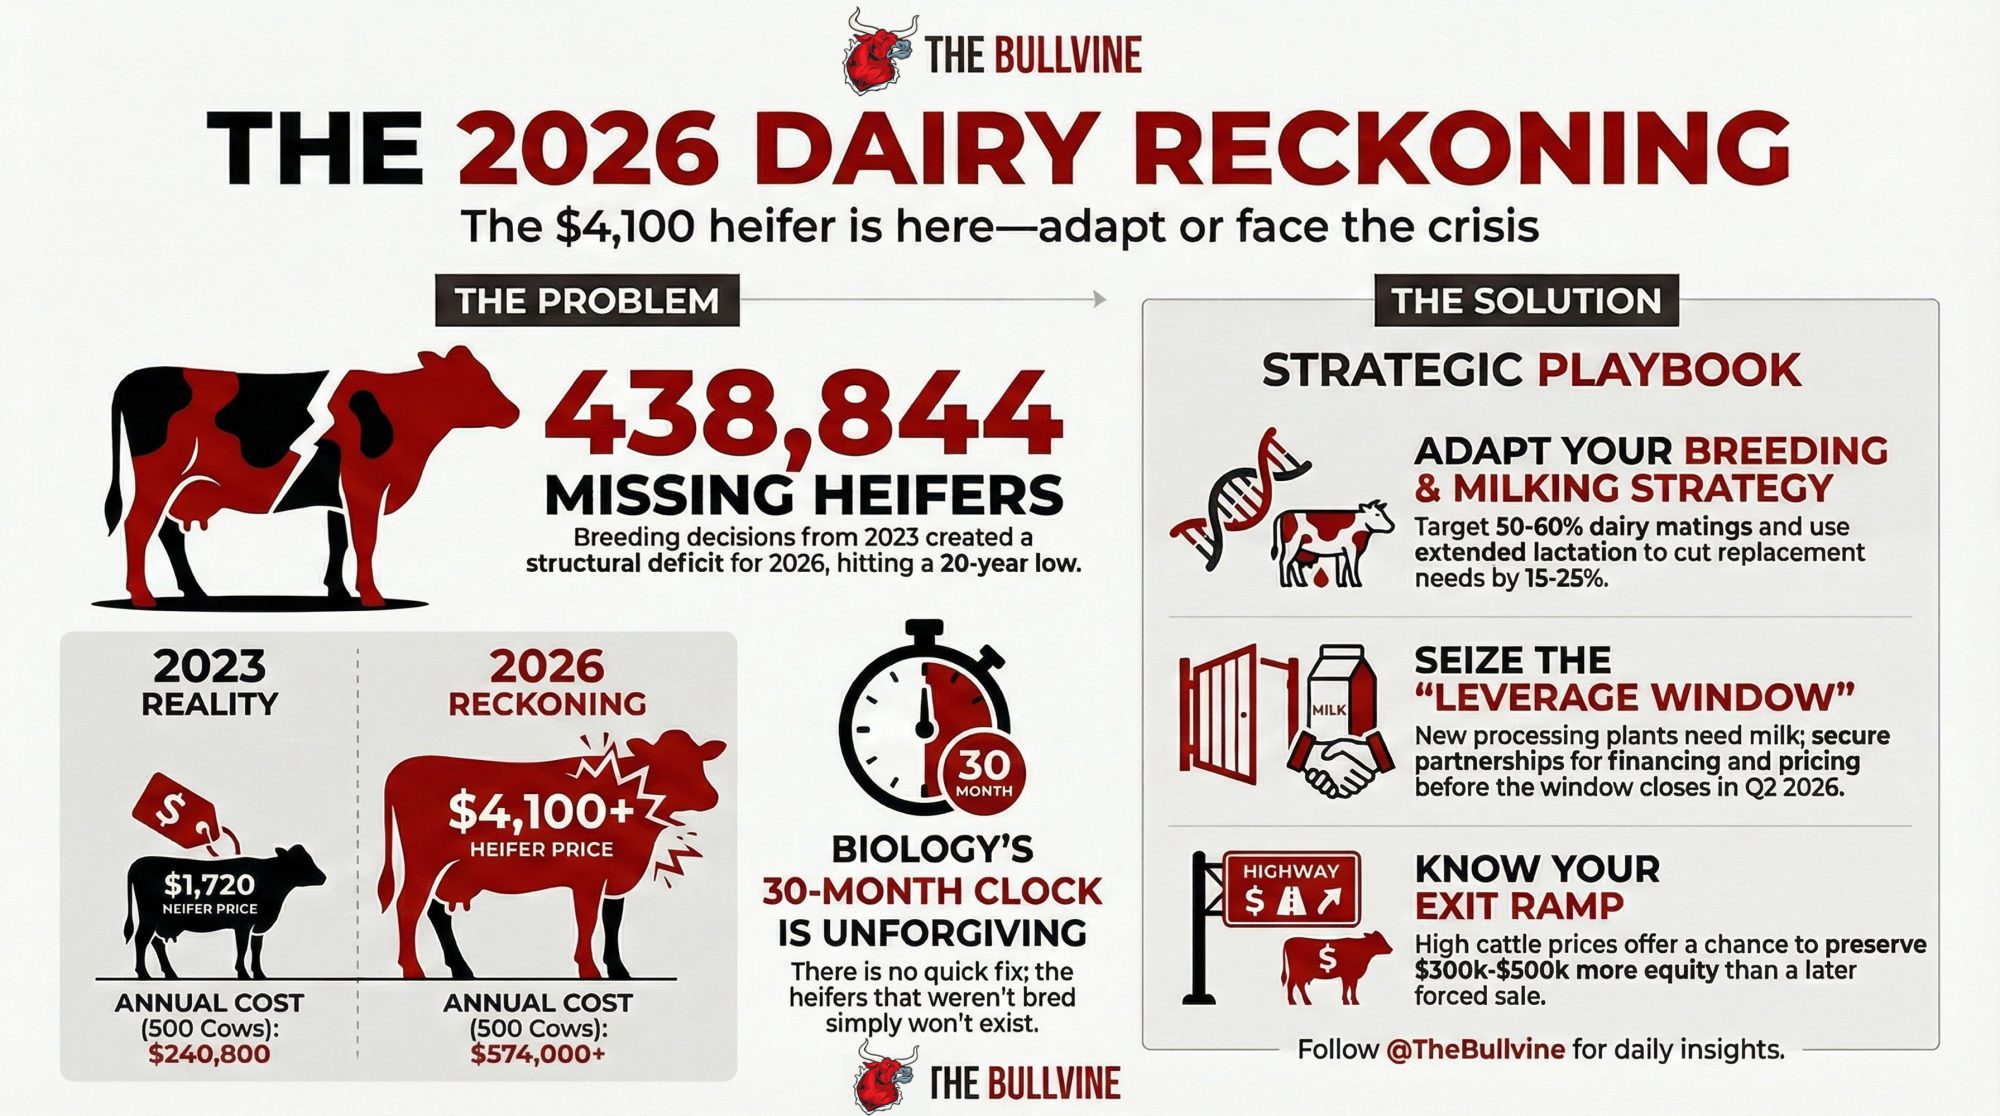
- $3,010 Per Heifer. 800,000 Short. Your Beef-on-Dairy Bill Is Due. – This breakdown arms you with four concrete survival paths, exposing the critical pregnancy rate thresholds and breeding rebalances required to navigate the 2026 heifer shortage without eroding your operation’s equity.
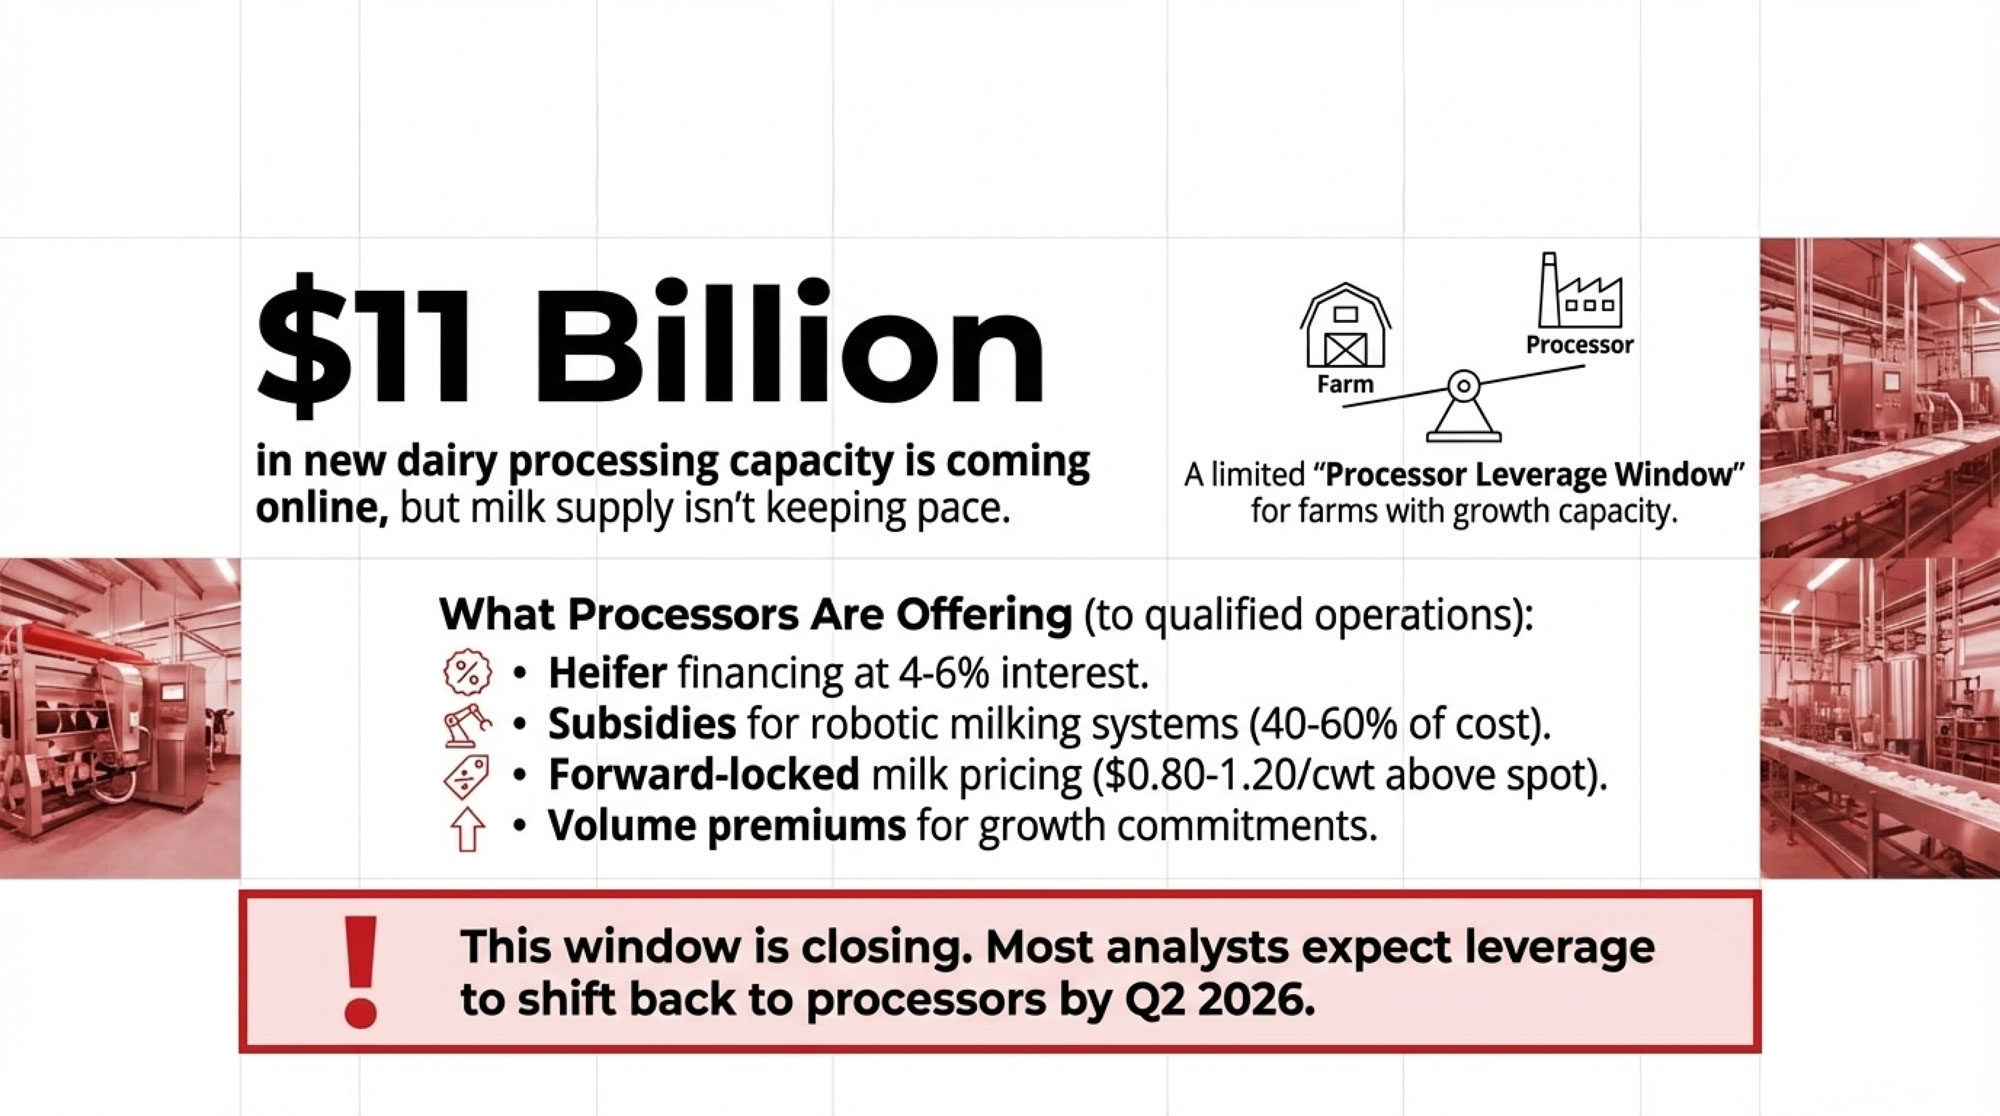
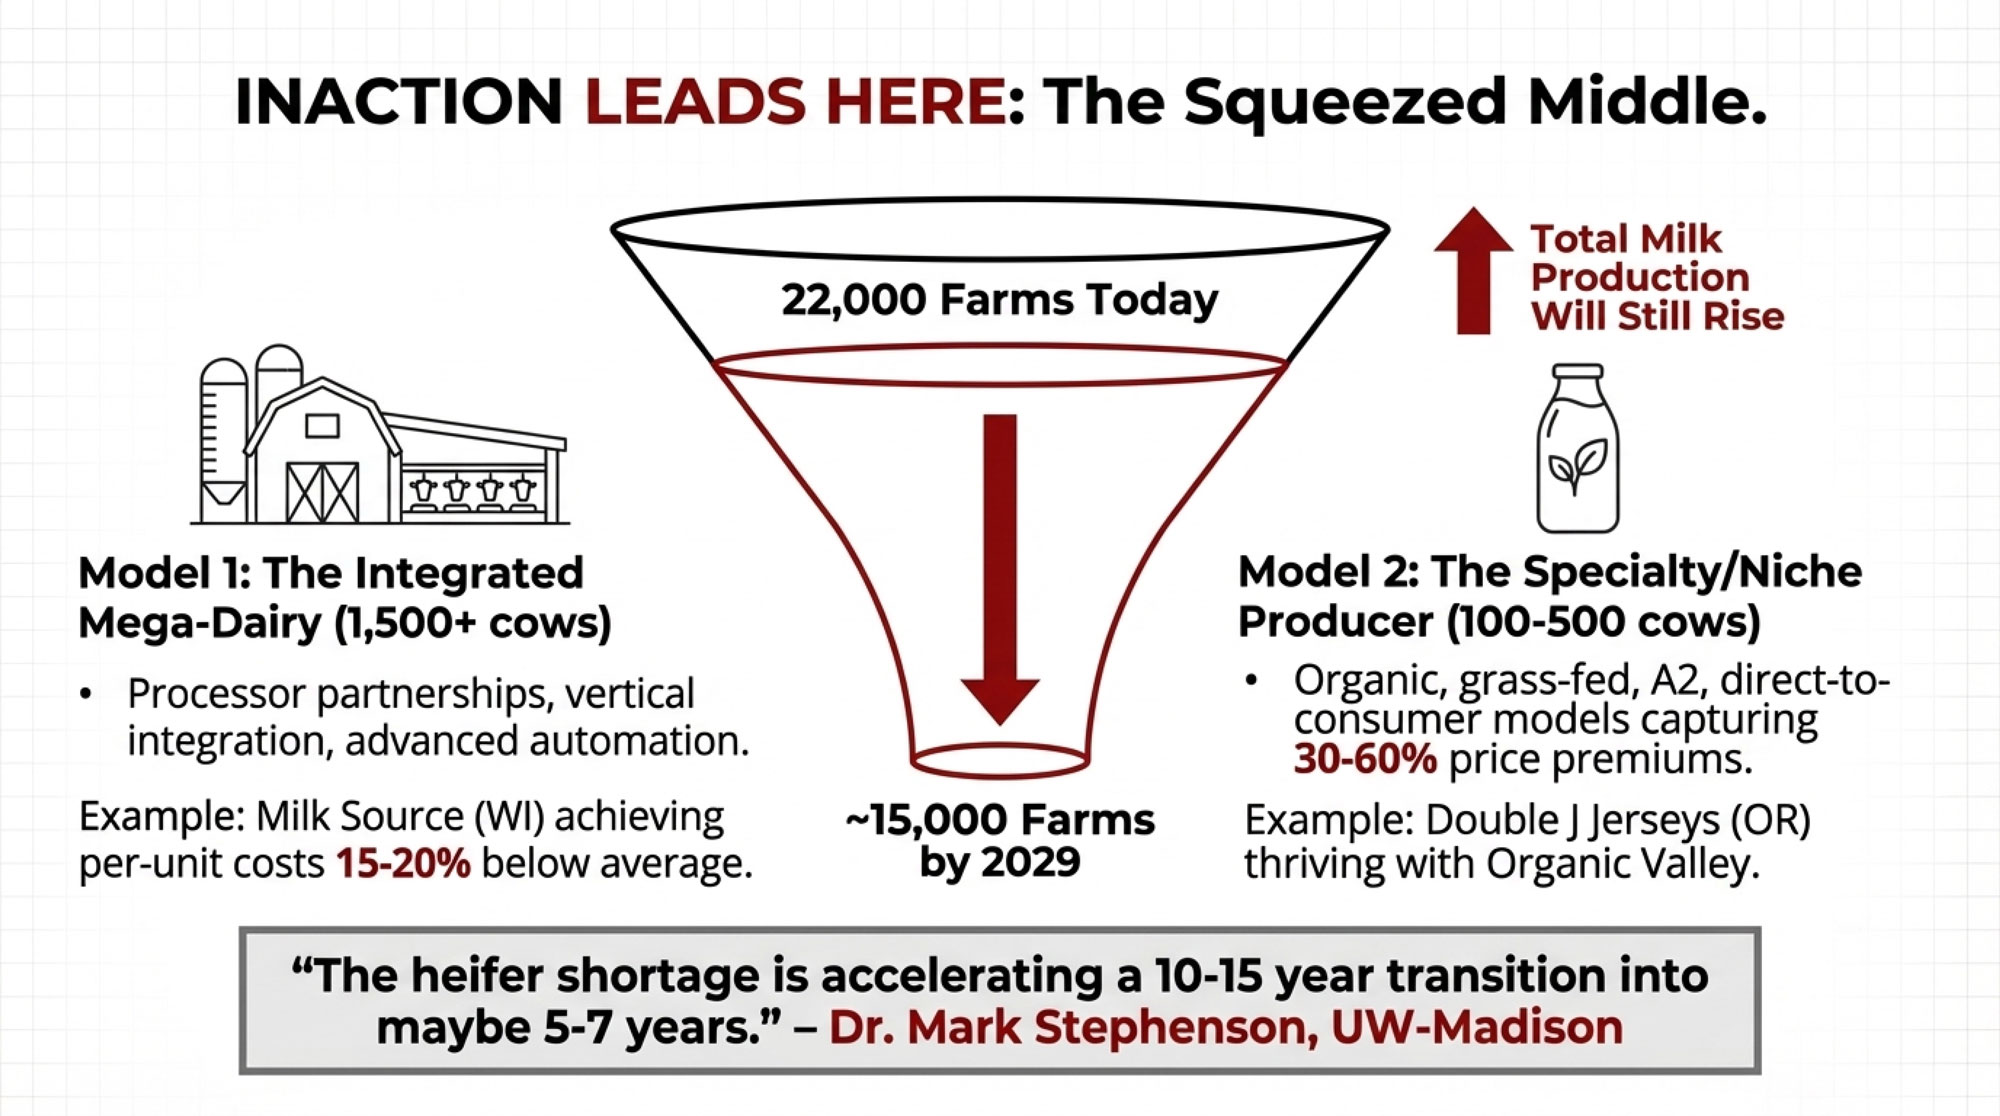
- The $11 Billion Reality Check: Why Dairy Processors Are Banking on Fewer, Bigger Farms – Position your dairy for the 2030 landscape by understanding how massive processor investments and exclusive supply contracts are fundamentally reshaping the industry’s hierarchy and leaving unaligned producers behind.
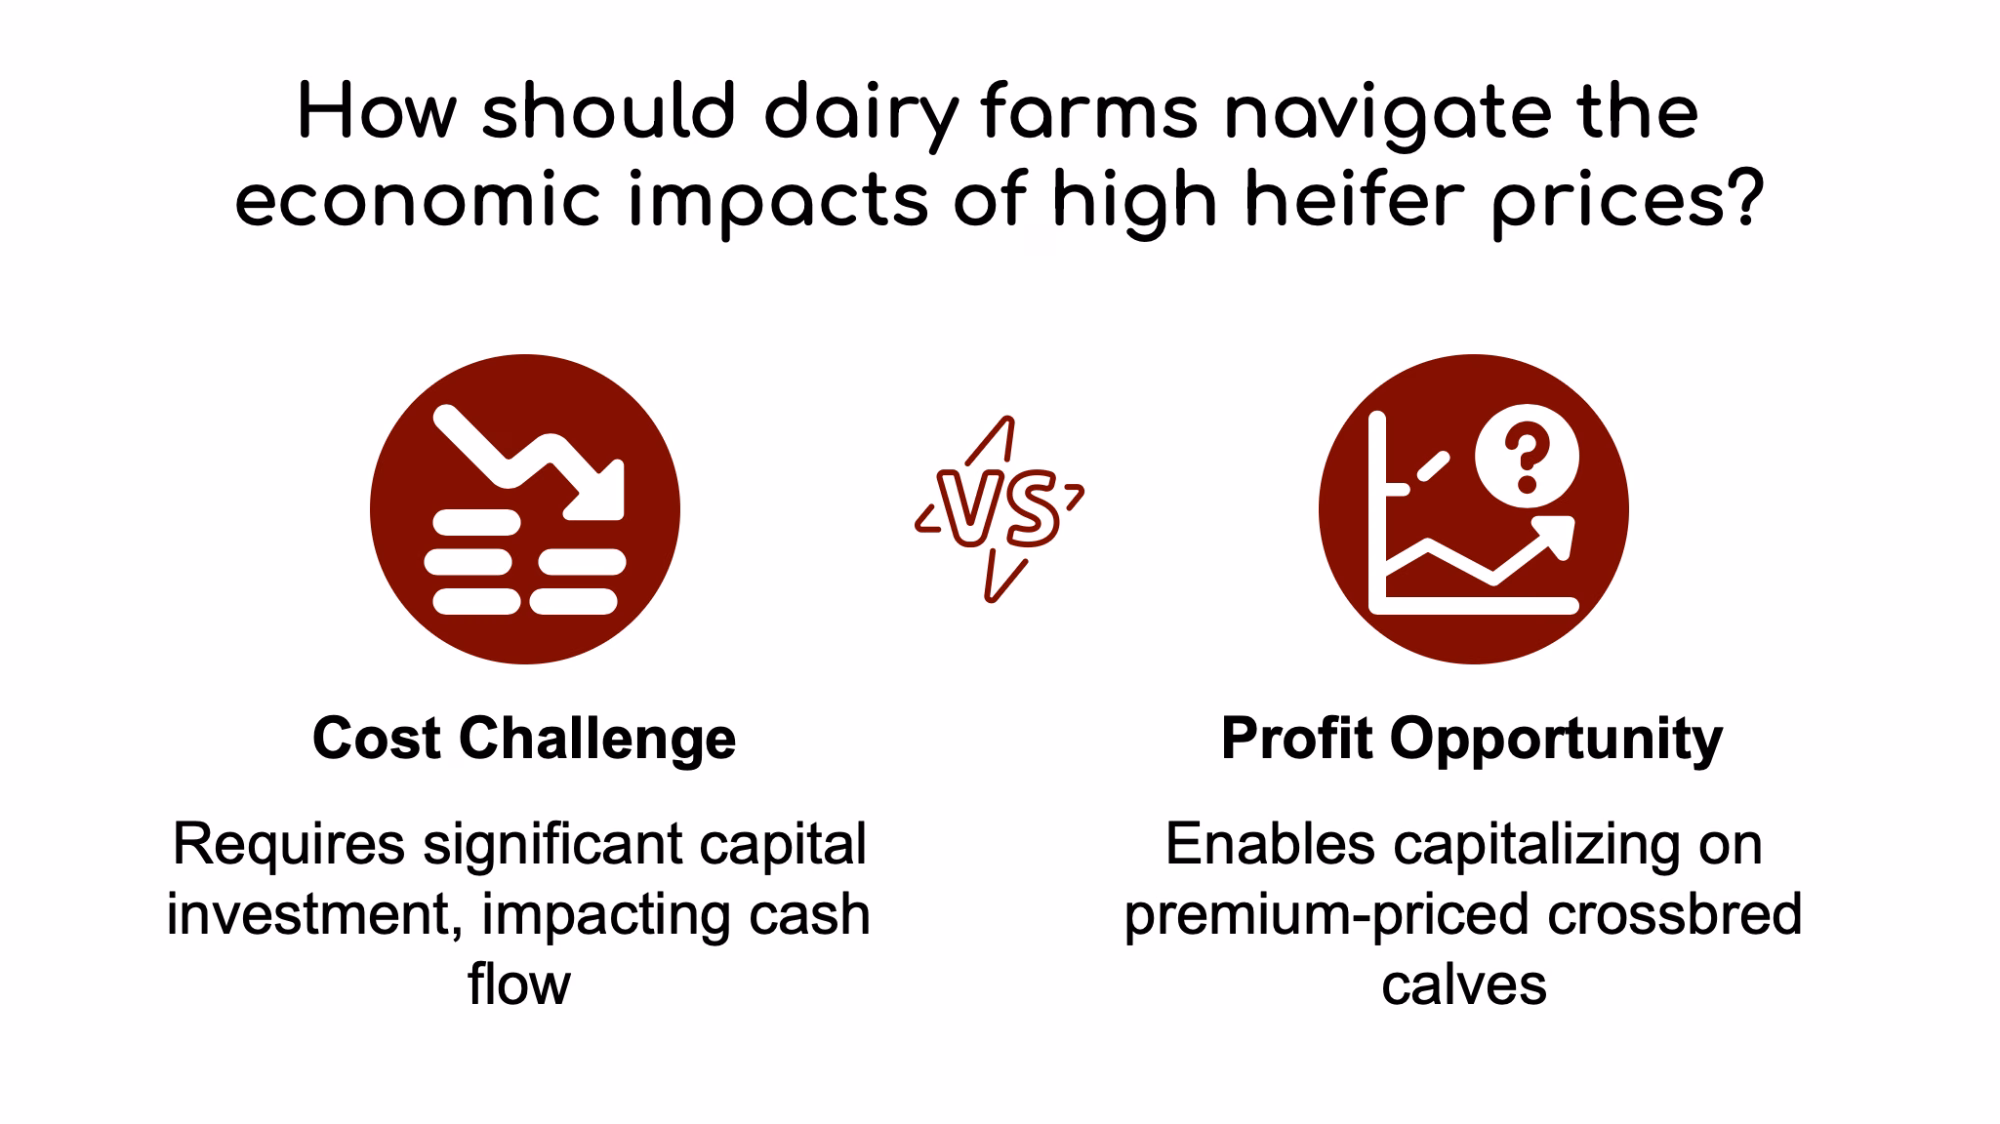
- Beef-on-Dairy’s $500,000 Swing: What 72% of Farms Know That’s Costing You $1,000/Cow Every Year – This strategy reveals how to deploy a “segmented herd” model, leveraging genomic multipliers and new LRP hedging tools to capture a $500,000 annual revenue swing that your traditional competitors are leaving on the table.
 The Sunday Read Dairy Professionals Don’t Skip.
 The Sunday Read Dairy Professionals Don’t Skip.
Every week, thousands of producers, breeders, and industry insiders open Bullvine Weekly for genetics insights, market shifts, and profit strategies they won’t find anywhere else. One email. Five minutes. Smarter decisions all week.