


4.2% butterfat herds lost money while 3.3% protein dairies gained $47K—here’s why the math changed
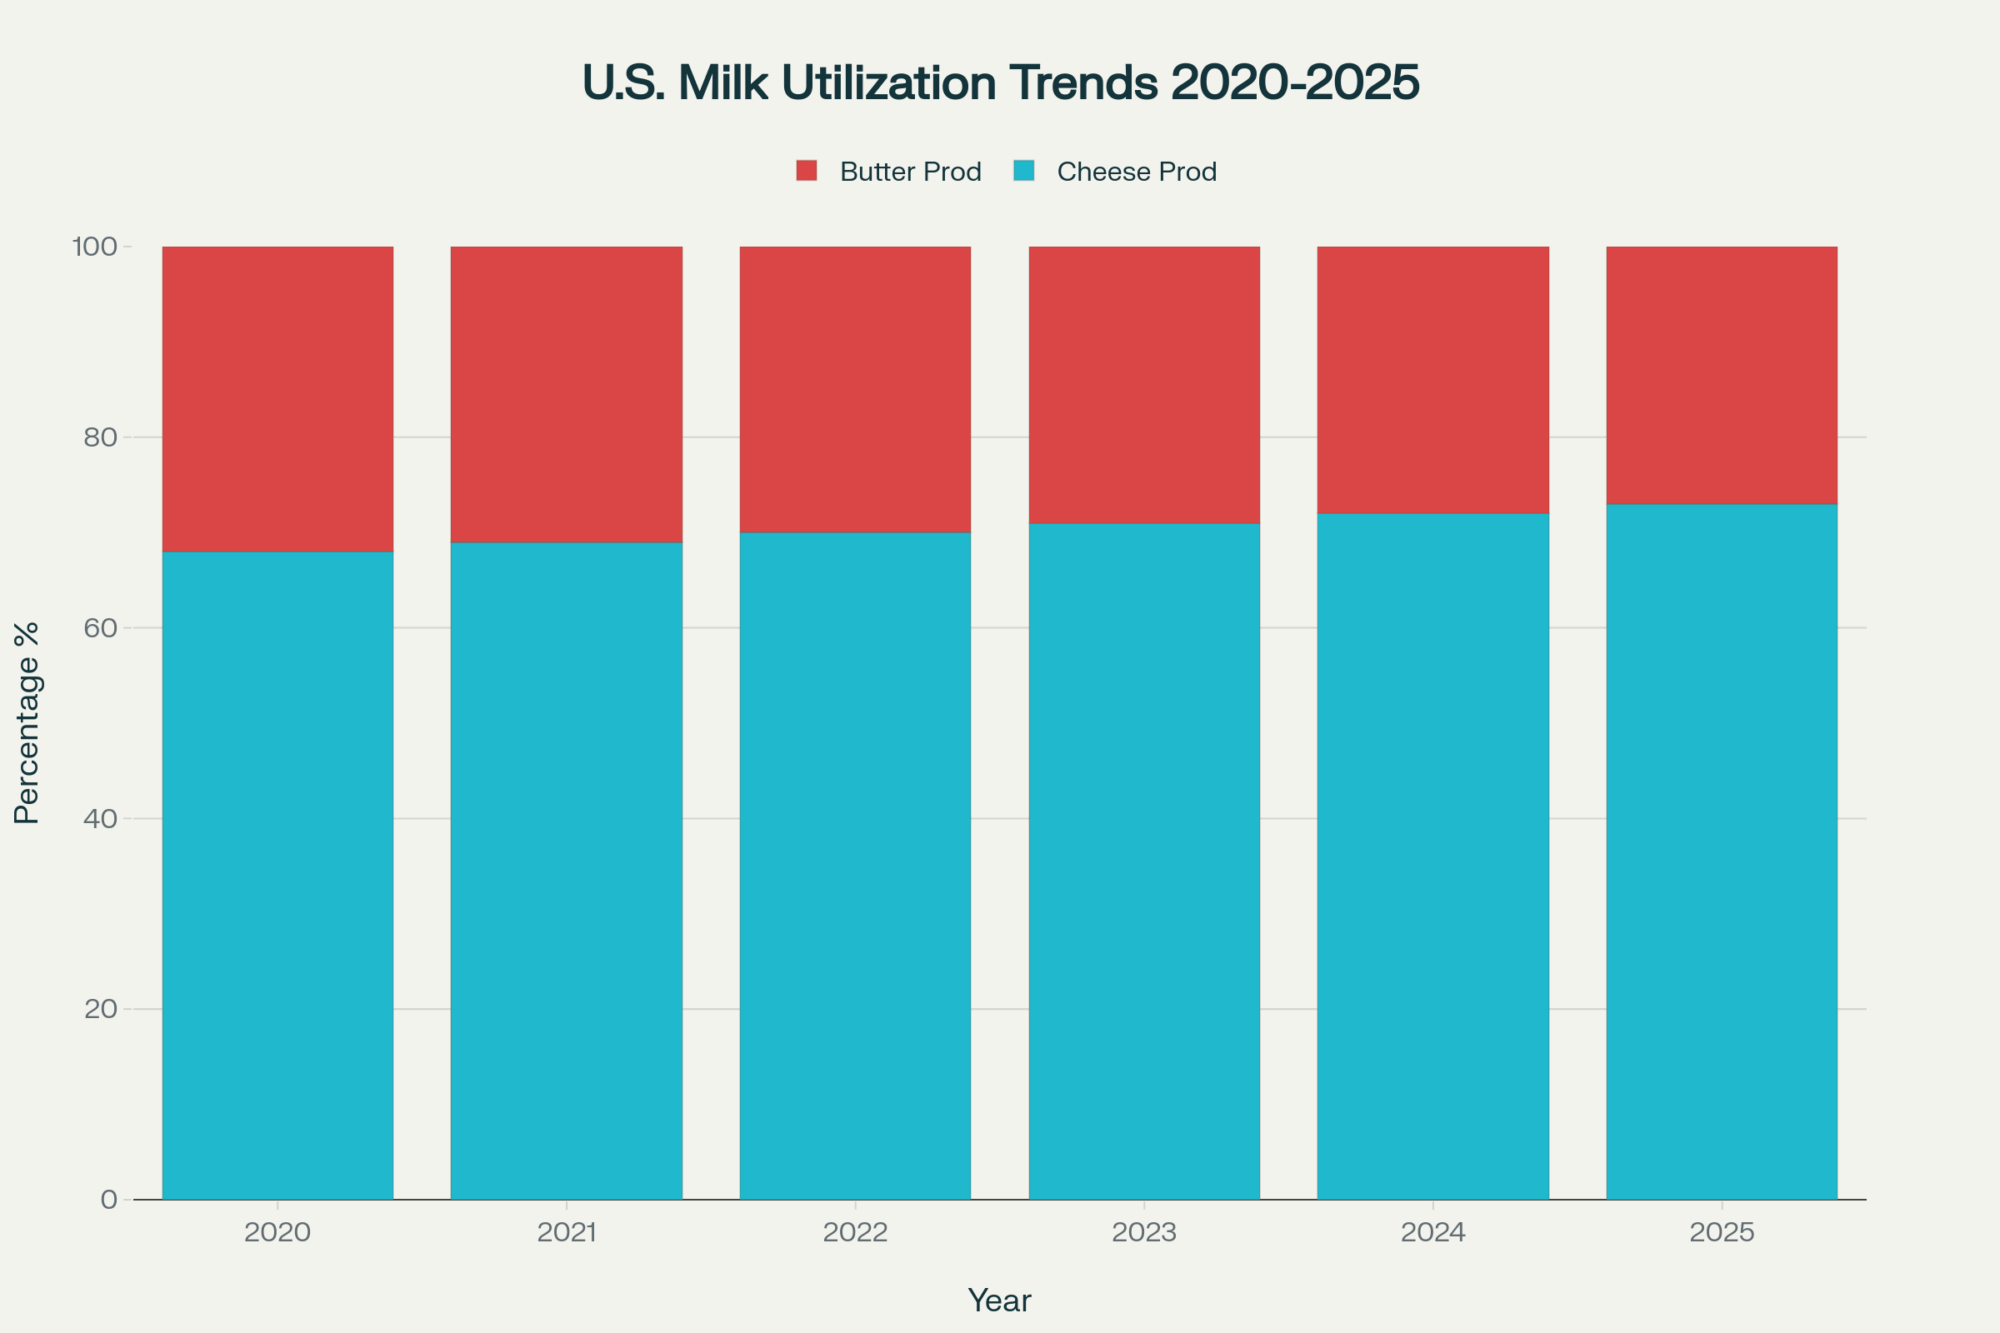
EXECUTIVE SUMMARY: This fall’s butter market correction revealed a fundamental shift that’s catching producers off-guard: despite genetic advances pushing national butterfat averages above 4.2%, cheese-focused processors are prioritizing protein premiums over traditional fat bonuses. Operations tracking component optimization report capturing $40,000-$75,000 in additional annual revenue by balancing breeding programs toward protein production, with technology investments typically paying back within 2-3 years for herds above 400 cows. While 73% of U.S. milk now flows into cheese manufacturing—up from 68% just five years ago—many producers remain focused on butterfat genetics that no longer align with processor economics. Regional variations matter significantly: Southeast operations face higher bypass protein feed costs that can reduce net benefits, while Upper Midwest farms benefit from established cheese processing infrastructure offering competitive protein premiums. What farmers are discovering is that successful component strategies require understanding processor priorities, not just herd genetics. The most resilient operations develop flexible approaches that can adapt to changing market spreads between Class III and Class IV pricing.
You know those weeks when the markets do something that makes absolutely no sense until you dig deeper? Well, we had one of those this fall when butter futures took a hit that had everyone talking. And not just a little dip—we’re talking about the kind of drop that gets people’s attention real quick.
But here’s what really caught my eye, and maybe you’ve noticed something similar… Despite our herds producing some of the highest butterfat levels in decades—and the genetic advancement reports from places like Hoard’s Dairyman confirm we’re seeing unprecedented gains in component production—butter manufacturing in many regions actually declined while cheese production kept expanding.
That disconnect tells us something important about how the industry’s evolved. And honestly, it’s creating opportunities for those willing to think differently about component production.
Understanding What’s Really Happening in Processing Plants
I recently spoke with a producer in central Wisconsin who put it this way: “The plant manager told us flat out that they’re making decisions based on contract stability, not what’s coming through the separator that week.” This builds on what I’ve been hearing across the Midwest, and what’s particularly noteworthy is how consistent this pattern seems to be.
You can see this playing out in the trade patterns. Industry reports suggest cheese exports to Mexico have been growing consistently, while butter exports haven’t kept pace despite our production advantages. From what I’m observing—and I’d be curious to hear if you’re seeing something different—processors seem to be responding to these market signals by prioritizing protein over butterfat, even when there’s plenty of cream to work with.
What’s interesting here is how this creates opportunities for those willing to adapt. What I’ve been noticing—and I wonder if this matches your experience—is that protein premiums appear to be widening while butterfat bonuses often stay relatively flat across several cooperative systems I’ve been tracking.
Making the Numbers Work: When Component Strategy Actually Makes Sense
Let me share a situation that really drives this point home. I had a conversation with a producer who asked to remain anonymous—a 650-cow operation in Wisconsin—and their experience represents what many farms are discovering. A couple of years ago, their genetic selection focused heavily on butterfat production. You know the approach: targeting sires with those high fat EBVs (Expected Breeding Values—basically the genetic prediction for how much extra fat or protein a bull’s daughters will produce), getting the herd up above 4% butterfat. Should’ve been a winner, right?
But here’s what they found… Their cooperative was offering significantly higher premiums for protein than for butterfat. Most of their milk was flowing into cheese contracts with guaranteed protein bonuses that substantially exceeded what they could earn from fat.
This aligns with broader industry data suggesting that most of our milk production is now going into cheese manufacturing—a notable increase from just a few years back. While the data is still developing on exact percentages, the trend reflects export opportunities and margin stability that butter manufacturing simply can’t match (especially with European competition limiting our butter export potential).
Now, it wasn’t all smooth sailing for them—they had their share of feed mixing mistakes and breeding errors in the first year. The learning curve was steeper than they expected. But the financial impact was significant once they got the systems working properly. By adjusting their breeding program toward more balanced component production and modifying feeding programs to support protein synthesis, they captured substantial additional premiums. We’re talking about enough money to cover genetic improvement costs and generate meaningful additional revenue.
What’s particularly encouraging is how this approach builds on traditional dairy management principles. Instead of chasing single-component extremes, it’s about optimizing the whole milk profile for current market realities.
The Investment Reality Check: Making Technology Pay
Here’s where things get practical, and this is where I think we need to be really honest about the economics. Making these adjustments isn’t just about changing breeding decisions—though that’s certainly part of it. This Wisconsin operation invested in:
- RFID collar systems for dynamic herd grouping
- Automated feeding equipment that can deliver different rations to different groups
- Herd management software that tracks component yields by group
The investment typically runs into six figures for comprehensive systems, but their payback fell into that 2-3 year range that most lenders can live with. And that’s key: you need enough scale to spread those fixed costs across sufficient volume to make it pencil out.
Early indications suggest—and this matches what I’m hearing from extension folks—that component optimization investments typically make economic sense for larger herds, generally starting around 400-500 cows. Although this varies significantly based on existing infrastructure and local market conditions, which highlights an important point about regional differences.

For operations below that threshold, the recommendation I keep hearing is to focus on cooperative programs and selective nutrition adjustments rather than major technology investments. As one specialist explained to me, you can often capture most of the component benefits through precision feeding without the big capital outlay.
It’s worth noting that some of the most successful implementations I’ve seen started small—maybe just separating first-lactation heifers from mature cows, then gradually adding complexity as management systems improved.
Regional Realities: Why Geography Still Matters More Than Ever
This is where I think we need to be careful about painting with too broad a brush. What works in Wisconsin doesn’t necessarily translate elsewhere, and recent conversations with producers across different regions have really driven this home.
Take the Southeast, where summers routinely hit the mid-90s with high humidity. Heat stress naturally depresses butterfat production, making protein premiums more attractive—but feed costs for bypass protein sources run notably higher than in the Upper Midwest. I recently spoke with a Georgia producer who found the economics to be completely different from what he had read about Wisconsin operations.

Here’s what I’ve observed across different regions:
In Wisconsin, Minnesota, and Iowa, you’ve got established cheese processing infrastructure that creates competitive protein premiums. Cooperative payment structures often favor milk testing above certain protein thresholds—and those bonuses can be quite attractive when you hit them consistently.
Down in Georgia, Florida, and the Carolinas, heat stress challenges butterfat production, but local processors serving regional cheese markets still offer protein incentives. However, higher feed costs for bypass protein sources can reduce the net benefits. One North Carolina producer told me, “The math works, but barely.”
In the western United States, specifically in California, Arizona, and New Mexico, large-scale operations benefit from economies of scale in component tracking technology; however, water costs and heat management present distinct challenges for optimization. I haven’t spent as much time talking with Western producers, but the conversations I’ve had suggest they’re dealing with challenges the rest of us don’t fully appreciate.
Up in Vermont, New York, and Pennsylvania, seasonal variation is more pronounced. Winter component production often exceeds summer levels by several tenths of a percent for both fat and protein—partly because of cooler temperatures, but also because fresh cow management tends to be easier when you’re not dealing with heat stress. Something you need to factor into any optimization strategy.
Pacific Northwest operations face their own unique challenges with seasonal pasture systems and proximity to export facilities, which could alter the entire optimization equation. The proximity to Asian export markets may create different premium structures than those seen in other regions.
What’s becoming clear to me is that successful component strategies need to match regional processing infrastructure, not just herd genetics.
Financial Risk Management: Beyond Basic Marketing
What’s emerged alongside component optimization is a different approach to financial risk management—and this is where things get interesting. Dairy Revenue Protection has seen growing adoption across the country, with industry estimates suggesting increasing participation rates, but successful operations aren’t just buying coverage.
They’re integrating it with component-specific strategies. When cheese-focused markets strengthen relative to butter markets, these operations adjust their approach accordingly. They might maintain different strategies for different production focuses, increasing cheese-related protection when protein premiums widen, or adjusting toward butter-related positions when those premiums improve.
This requires more management sophistication than traditional marketing, and I’m still trying to figure out if it’s truly necessary for everyone or just certain types of operations. What’s your experience been with financial risk management complexity?
I’ve noticed that the farms handling this complexity best are treating it like any other management system—they’ve got protocols, regular review schedules, and clear decision criteria rather than making it up as they go along.
When Technology Strategies Fall Short
Not every attempt at component optimization succeeds, and I think it’s important to talk honestly about what can go wrong. Here’s a representative example that really opened my eyes—an Illinois operation with around 480 cows that invested heavily in similar technology upgrades.
Within several months, they’d shut down the component tracking systems and returned to single-group management. The complexity overwhelmed their labor situation. Feed mixing errors, breeding mistakes, and constant system troubleshooting. The theoretical benefits never materialized because they couldn’t execute consistently on a day-to-day basis.
That said, they did learn some valuable lessons about their operation’s limitations, and they’ve actually improved their basic component tracking through simpler nutrition adjustments. Sometimes knowing what doesn’t work for your situation is just as valuable.
This highlights something I see repeatedly: operational excellence still trumps sophisticated strategies that are poorly executed. That operation now focuses on cost control and traditional efficiency measures, which have proven more reliable given their management situation.
I should mention that there are plenty of successful producers who think this whole component optimization trend is overcomplicating things. One farmer I know in Iowa puts it this way: “I’d rather be really good at the basics than mediocre at advanced strategies.” And honestly, he’s got a point—his cost per hundredweight is consistently lower than many high-tech operations.
The common failure points in component optimization usually come down to execution issues that most of us can relate to:
- Feed mixing precision becomes critical when different groups require different rations, which necessitates attention to detail that some operations simply can’t maintain consistently during busy seasons like planting or harvest.
- Managing multiple genetic lines increases the chance of breeding errors that can take years to correct—and we all know how expensive those mistakes can be.
- Technology dependence means system failures during critical periods can disrupt months of planning. And we’ve all had those equipment failures at the worst possible times.
- Staff turnover necessitates ongoing retraining on more complex protocols, which can become expensive and frustrating.
What I’ve learned is that the most successful implementations have built-in simplicity and backup systems from day one.
Alternative Pathways That Work Just Fine
Component optimization isn’t the only way to respond to changing market dynamics, and maybe that’s the most important point of this whole discussion. Several successful operations pursue different strategies that might be more suitable for farms facing management or capital constraints.
Value-added production offers one interesting path. Organic certification and quality standards that exceed commodity requirements can generate premiums that reward operational excellence rather than component manipulation. This approach is particularly attractive for farms that prefer focusing on traditional management skills—and there’s nothing wrong with that approach.
Specialty markets present another option worth considering. I know operations supplying artisan cheese makers or local processors that capture premiums based on quality and consistency rather than specific component levels. These relationships require different skills—such as reliability, flexibility, and direct communication with manufacturers—but can generate comparable returns without significant technology investments.
Many cooperatives now offer pooled services that allow smaller farms to access sophisticated strategies without individual infrastructure investments. Professional support for component tracking and risk management can be more cost-effective than going it alone, especially if you’re not at that 400-500 cow threshold.
Direct marketing continues to work well for farms in the right locations. Farm stores, on-farm processing, agritourism—these approaches can generate premiums that dwarf any component optimization program, though they require completely different skill sets.
The Technology Risks Nobody Discusses
One aspect that often receives insufficient attention is what happens when systems fail. I heard about cybersecurity issues this past spring that affected feed management software, leaving farms unable to access their protocols for days. Most recovered quickly, but operations running complex component programs faced more significant disruptions.
The lesson learned—and this came up in several conversations—was maintaining backup systems for everything. Technology enables precision, but you need redundancy when precision matters. Paper copies of feeding recipes, breeding schedules, and group assignments. It adds administrative overhead but provides essential backup when systems go down.
Cybersecurity concerns are growing as farms connect more systems to internet-based platforms. Agriculture has seen an increase in security incidents, and dairy operations with financial programs can present attractive targets for malicious actors. This is something we all need to consider as we integrate connected systems.
There’s also the question of what happens when technology companies go out of business or discontinue support. I’ve seen farms stuck with orphaned software systems that cost thousands to replace.
The Global Economic Picture
Looking beyond individual farm decisions—and this is where I find the whole situation fascinating—this component focus reflects broader changes in global dairy trade. European milk production has seen some decline, while New Zealand production has remained relatively flat despite generally favorable conditions.
That’s created export opportunities for U.S. cheese that don’t exist for butter, where European producers maintain competitive advantages in premium markets. Industry reports suggest U.S. cheese exports have grown significantly compared to butter exports, and these global patterns are what’s really driving domestic processing decisions.
Growing middle-class populations in Southeast Asia are driving cheese consumption in markets that previously relied primarily on traditional dairy products. This creates long-term export demand that supports protein-focused processing strategies, thereby enhancing the sustainability of these strategies. However, I’m genuinely curious about whether this component focus will remain long-term or if we’ll see the pendulum swing back toward simpler approaches as the market evolves.
The development that really has me thinking is how currency fluctuations affect these export patterns. When the dollar strengthens, our export competitiveness changes, which could shift processor priorities again.
Seasonal Patterns Most Producers Miss
Here’s something I’ve noticed from years of watching component production, and maybe you’ve observed the same thing… Seasonal variation in optimization returns is more significant than most producers realize.
Many producers observe that winter months often favor butterfat premiums as holiday demand increases, while spring and summer frequently see stronger protein premiums as cheese manufacturing ramps up for fall and winter consumption. Current conditions suggest this pattern is holding, though regional variations seem more pronounced this year.
Some operations adjust feeding programs seasonally to capture these patterns—shifting toward higher-fat rations in fall, then transitioning to protein-focused feeding by late winter. This seasonal flexibility requires more management attention but can add meaningful revenue to component premiums—though it also adds another layer of complexity that not every operation can handle.
The seasonal aspect becomes particularly important for farms using financial strategies. Price spreads show patterns that experienced farms can often anticipate and position for, though recent market volatility has made traditional patterns less reliable.
What’s interesting is how the seasonal patterns seem to be getting more pronounced as export markets become more important to domestic pricing.
Key Questions Every Producer Should Ask
Before diving into component optimization, here are the questions I’d recommend asking yourself:
- Can your current management team handle increased complexity? Be honest about attention to detail during busy seasons like planting or harvest, when dairy tasks might get less focus.
- What’s your cooperative’s actual payment structure? Don’t assume—get the specific thresholds and premiums in writing and calculate the real potential benefits for your current production levels.
- Do you have backup systems in place for your technology dependence? Paper records, alternative feeding protocols, and manual sorting systems for when (not if) technology fails.
- What’s your real payback timeline tolerance? Six-figure investments with 2-3 year paybacks sound reasonable until cash flow gets tight during a downturn.
- How does this fit your long-term farm goals? Component optimization might not align with succession planning, debt reduction, or quality-of-life objectives.
Practical Steps for Different Farm Situations
For producers considering component optimization—and this might not apply to your situation, but here’s what I’ve learned from both successful and unsuccessful attempts:
- If you’re running 500 or more cows, start with data analysis. Review a couple of years of component tests and cooperative payments to identify what opportunities you might be missing. Many farms discover significant premiums they didn’t even realize were available. Technology infrastructure investments typically make sense at this scale, though the learning curve can be steeper than expected.
- For mid-size operations, focus on cooperative programs and precision nutrition rather than major technology investments. Most cooperatives offer component assistance that provides much of the benefits without the capital requirements. Consider sharing costs with neighboring farms if that’s feasible—I’ve seen some interesting collaborative arrangements that spread technology costs across multiple operations.
- Smaller operations should first evaluate value-added opportunities and specialty markets. Fixed technology costs often make traditional approaches more profitable at a smaller scale. However, selective breeding changes that favor balanced component production rarely harm and usually provide modest improvements over time.
- Regardless of size, honestly assess your management capacity. The most sophisticated strategy fails without consistent execution—and I’ve learned this the hard way. Component optimization requires attention to detail that not all operations can maintain, and that’s perfectly fine. Focusing on operational excellence often provides better returns than poorly executed advanced strategies.
The Bottom Line
The market disruptions we saw this fall exposed how much the industry has changed beneath the surface. Genetic advances—documented in publications like Hoard’s Dairyman’s coverage of unprecedented gains in milk components—have created component abundance that many farms haven’t learned to capture yet.
Processing strategies now prioritize export stability over domestic price volatility. Financial tools exist that weren’t available to previous generations. But you know what? The fundamental principles haven’t changed.
Animal care, feed quality, labor management, and cost control—these remain essential. Component optimization and financial sophistication are additional tools, not replacements for solid farming practices. This builds on what we’ve always known: good farming fundamentals matter more than any technology or market strategy.
The operations that are thriving understand this balance. They’re not trying to become trading companies that happen to milk cows. They’re dairy farms that have added market intelligence and appropriate technology to their skill sets—and they’re doing it in ways that fit their particular situations.
Looking ahead, I expect we’ll see continued evolution in how farms approach component production and risk management. The producers who master this integration—combining solid farming with market awareness and appropriate technology—are positioning themselves well regardless of where cycles head next.
The choice isn’t between traditional farming and technological sophistication. It’s about finding the right combination for your operation, your markets, and your management style. What happened in the butter markets taught us that change will continue. The question is whether individual farms will adapt in ways that make sense for their particular circumstances.
And honestly? That’s what makes this business interesting. There’s no single right answer—just different approaches that work for different situations, different management styles, different markets. The key is understanding what’s changing and figuring out how to respond in ways that fit your operation and keep you sustainable for the long haul.
I’d love to hear if your experience has been different, or if you’re seeing patterns in your region that don’t match what I’ve described here. That’s how we all keep learning in this business.
KEY TAKEAWAYS
- Component optimization investments typically generate $120-$180 additional revenue per cow annually for operations above 500 cows, with comprehensive RFID and automated feeding systems paying back in 2-3 years through enhanced protein premium capture
- Herds targeting balanced component profiles (3.25%+ protein alongside 4.0%+ fat) consistently outperform single-component strategies by 15-25% in cooperative premium payments, particularly in regions with established cheese processing infrastructure
- The 400-500 cow threshold represents the economic break-even point for component tracking technology, while smaller operations can capture 60-70% of optimization benefits through precision nutrition and cooperative pooled services without major capital investment
- Regional processing economics vary dramatically—Upper Midwest protein premiums often exceed butterfat bonuses by 7-10 cents per pound, while Southeast operations face higher feed costs that can reduce net component optimization benefits by 30-40%
- Seasonal component management strategies can add $15,000-$20,000 annually through tactical feeding program adjustments that capture winter butterfat premiums and spring-summer protein bonuses, requiring enhanced management attention but minimal additional infrastructure investment
Complete references and supporting documentation are available upon request by contacting the editorial team at editor@thebullvine.com.
Learn More:
- The Protein War Just Got Real: How Lactalis’s $2.1 Billion Power Play Will Reshape Your Milk Check – This article reveals the global market forces driving processor demand for protein, explaining why high-protein yogurt and cheese are changing the economics for your dairy and providing context for the shift in processor priorities.
- Precision Feeding Strategies Every Dairy Farmer Needs to Know – This guide provides actionable steps for implementing precision nutrition on your farm, with specific strategies for benchmarking, herd grouping, and using feed additives to capture component premiums without major technology investments.
- The Tech Reality Check: Why Smart Dairy Operations Are Winning While Others Struggle – This article delivers a frank look at the actual return on investment for major technology upgrades, exposing hidden costs and providing a checklist to determine if your operation has the management capacity to make technology pay.
 The Sunday Read Dairy Professionals Don’t Skip.
 The Sunday Read Dairy Professionals Don’t Skip.
Every week, thousands of producers, breeders, and industry insiders open Bullvine Weekly for genetics insights, market shifts, and profit strategies they won’t find anywhere else. One email. Five minutes. Smarter decisions all week.


