Archive for milk protein premiums

The $97,500 Protein Shift: How Weight-Loss Drug Users Are Rewriting Your Breeding Strategy

$97,500. That’s what weight-loss drugs are worth to a 500-cow dairy. Here’s how to capture it.

milk protein premiums

Executive Summary: $97,500 annually. That’s what a 500-cow dairy can capture by responding to the protein shift—a market realignment most producers haven’t traced to its source. GLP-1 weight-loss drugs have reached 41 million Americans who now consume high-protein dairy at triple the normal rate, reshaping what your milk is worth. Protein premiums have hit $5/cwt at cheese facilities, and December’s Federal Order update raised baseline protein to 3.3%—meaning below-average herds now subsidize neighbors who ship higher components. The opportunity stacks three ways: nutrition optimization ($8,750-$15,000), protein-focused genetics ($17,500-$22,500), and processor premiums ($24,000-$60,000). The catch: breeding decisions this spring won’t reach your bulk tank until 2029, rewarding producers who move early. The math is clear, the window is open, and this analysis shows exactly how to capture it.

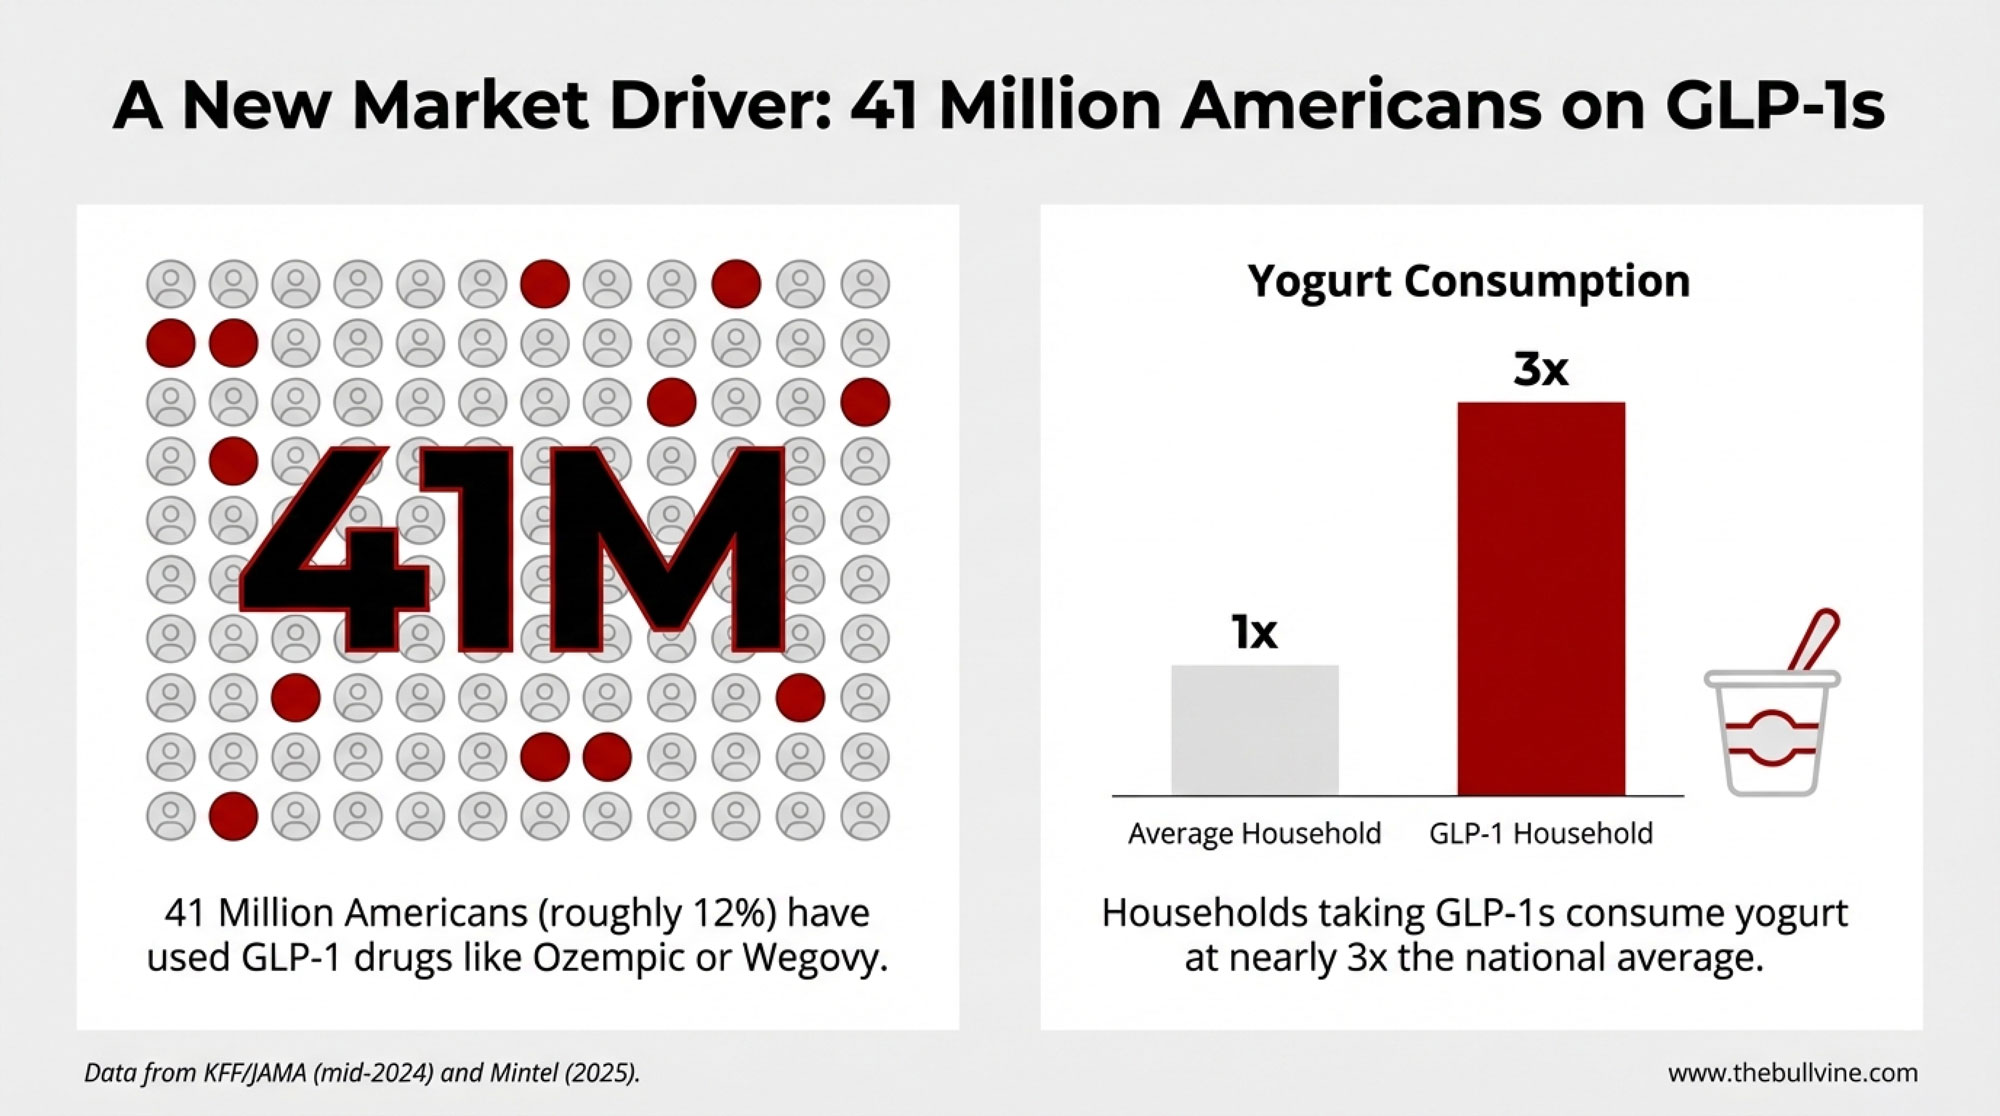
A number worth sitting with: households taking GLP-1 weight-loss medications are consuming yogurt at nearly three times the national average. Not 20% more. Not double. Three times.

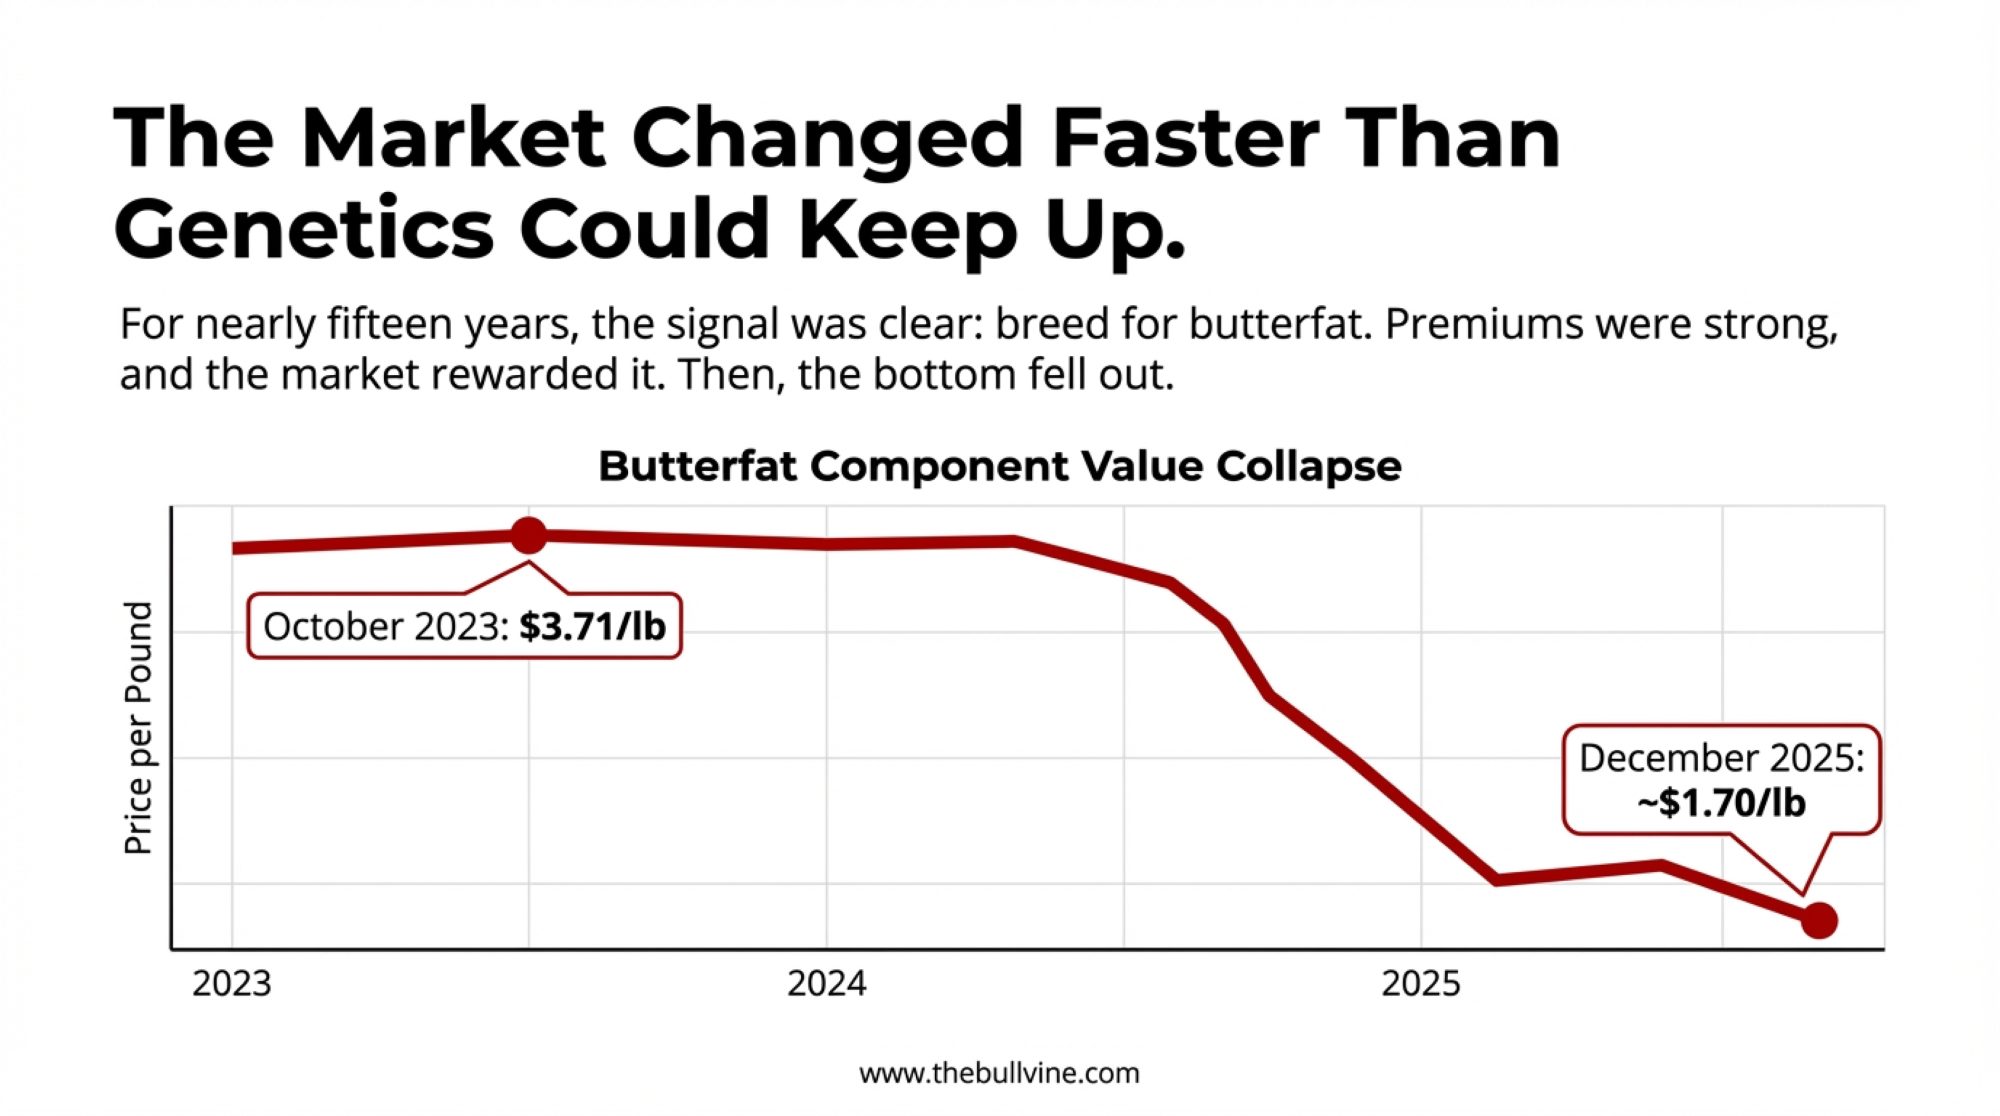
That data point comes from Mintel’s 2025 consumer tracking. It tells you something important about where dairy demand is heading—and raises questions worth considering if your breeding program has been focused primarily on butterfat.

Something meaningful is shifting in how the market values what comes out of your bulk tank. This isn’t a temporary blip or a pricing anomaly. What we’re seeing appears to be a structural change driven by forces that weren’t on most of our radars even five years ago—pharmaceutical trends, aging demographics, and global nutrition demands all converging at once.

This creates opportunities for producers positioned to respond. It also creates challenges for those caught off guard. The difference often comes down to understanding what’s actually driving these changes.

THE QUICK MATH: What’s This Worth?

For a 500-cow herd positioned to capture the protein shift:

OpportunityAnnual Value
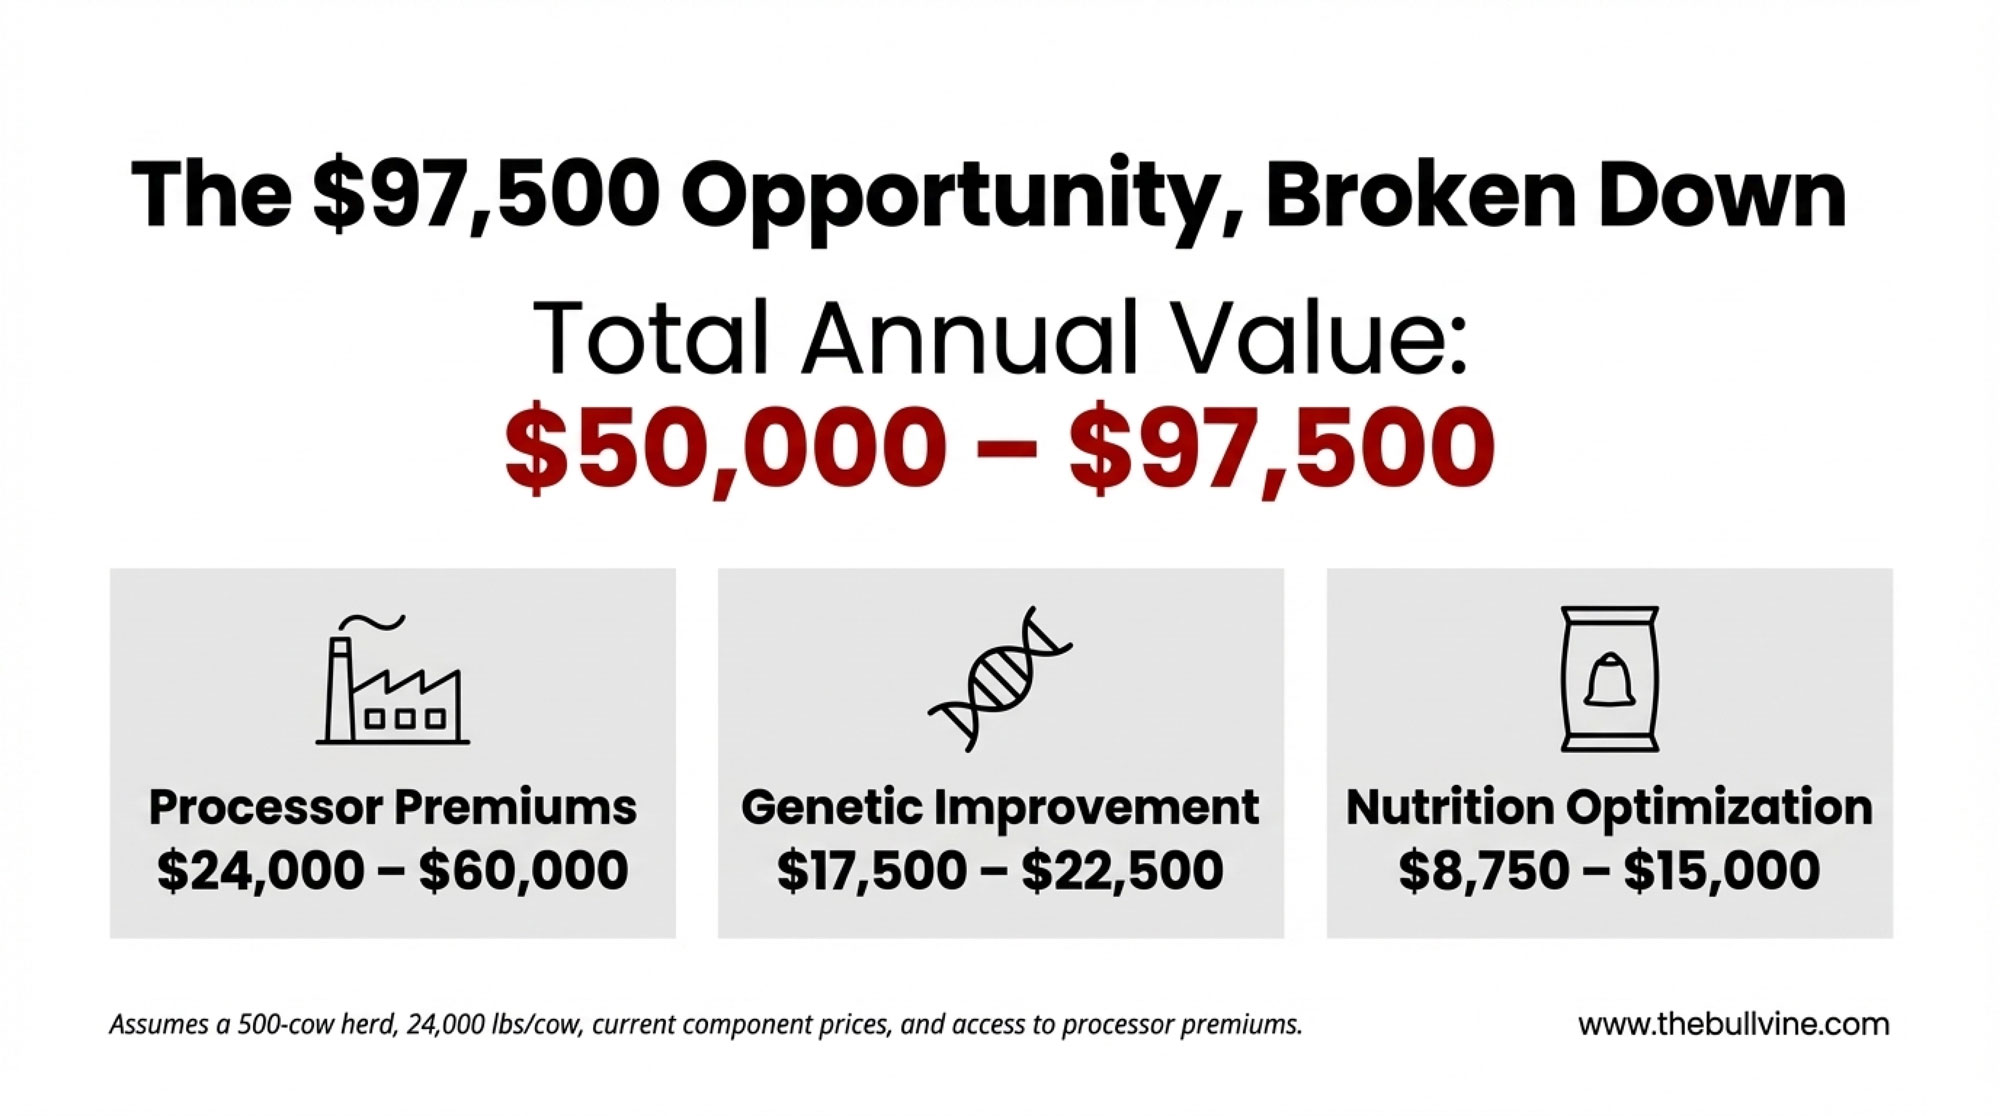
Nutrition optimization (amino acid balancing)$8,750 – $15,000
Genetic improvement (protein-focused selection)$17,500 – $22,500
Processor premiums (above-baseline protein)$24,000 – $60,000
Combined Annual Opportunity$50,000 – $97,500

These figures assume: 500 cows, 24,000 lbs/cow annually, current component price relationships, and access to a processor paying protein premiums. Individual results vary based on current herd genetics, ration, and market access.

The Pharmaceutical Connection

When GLP-1 drugs first hit the market, I didn’t give much thought to dairy implications. Weight-loss medications seemed pretty far removed from breeding decisions and component pricing.

That thinking needed updating.

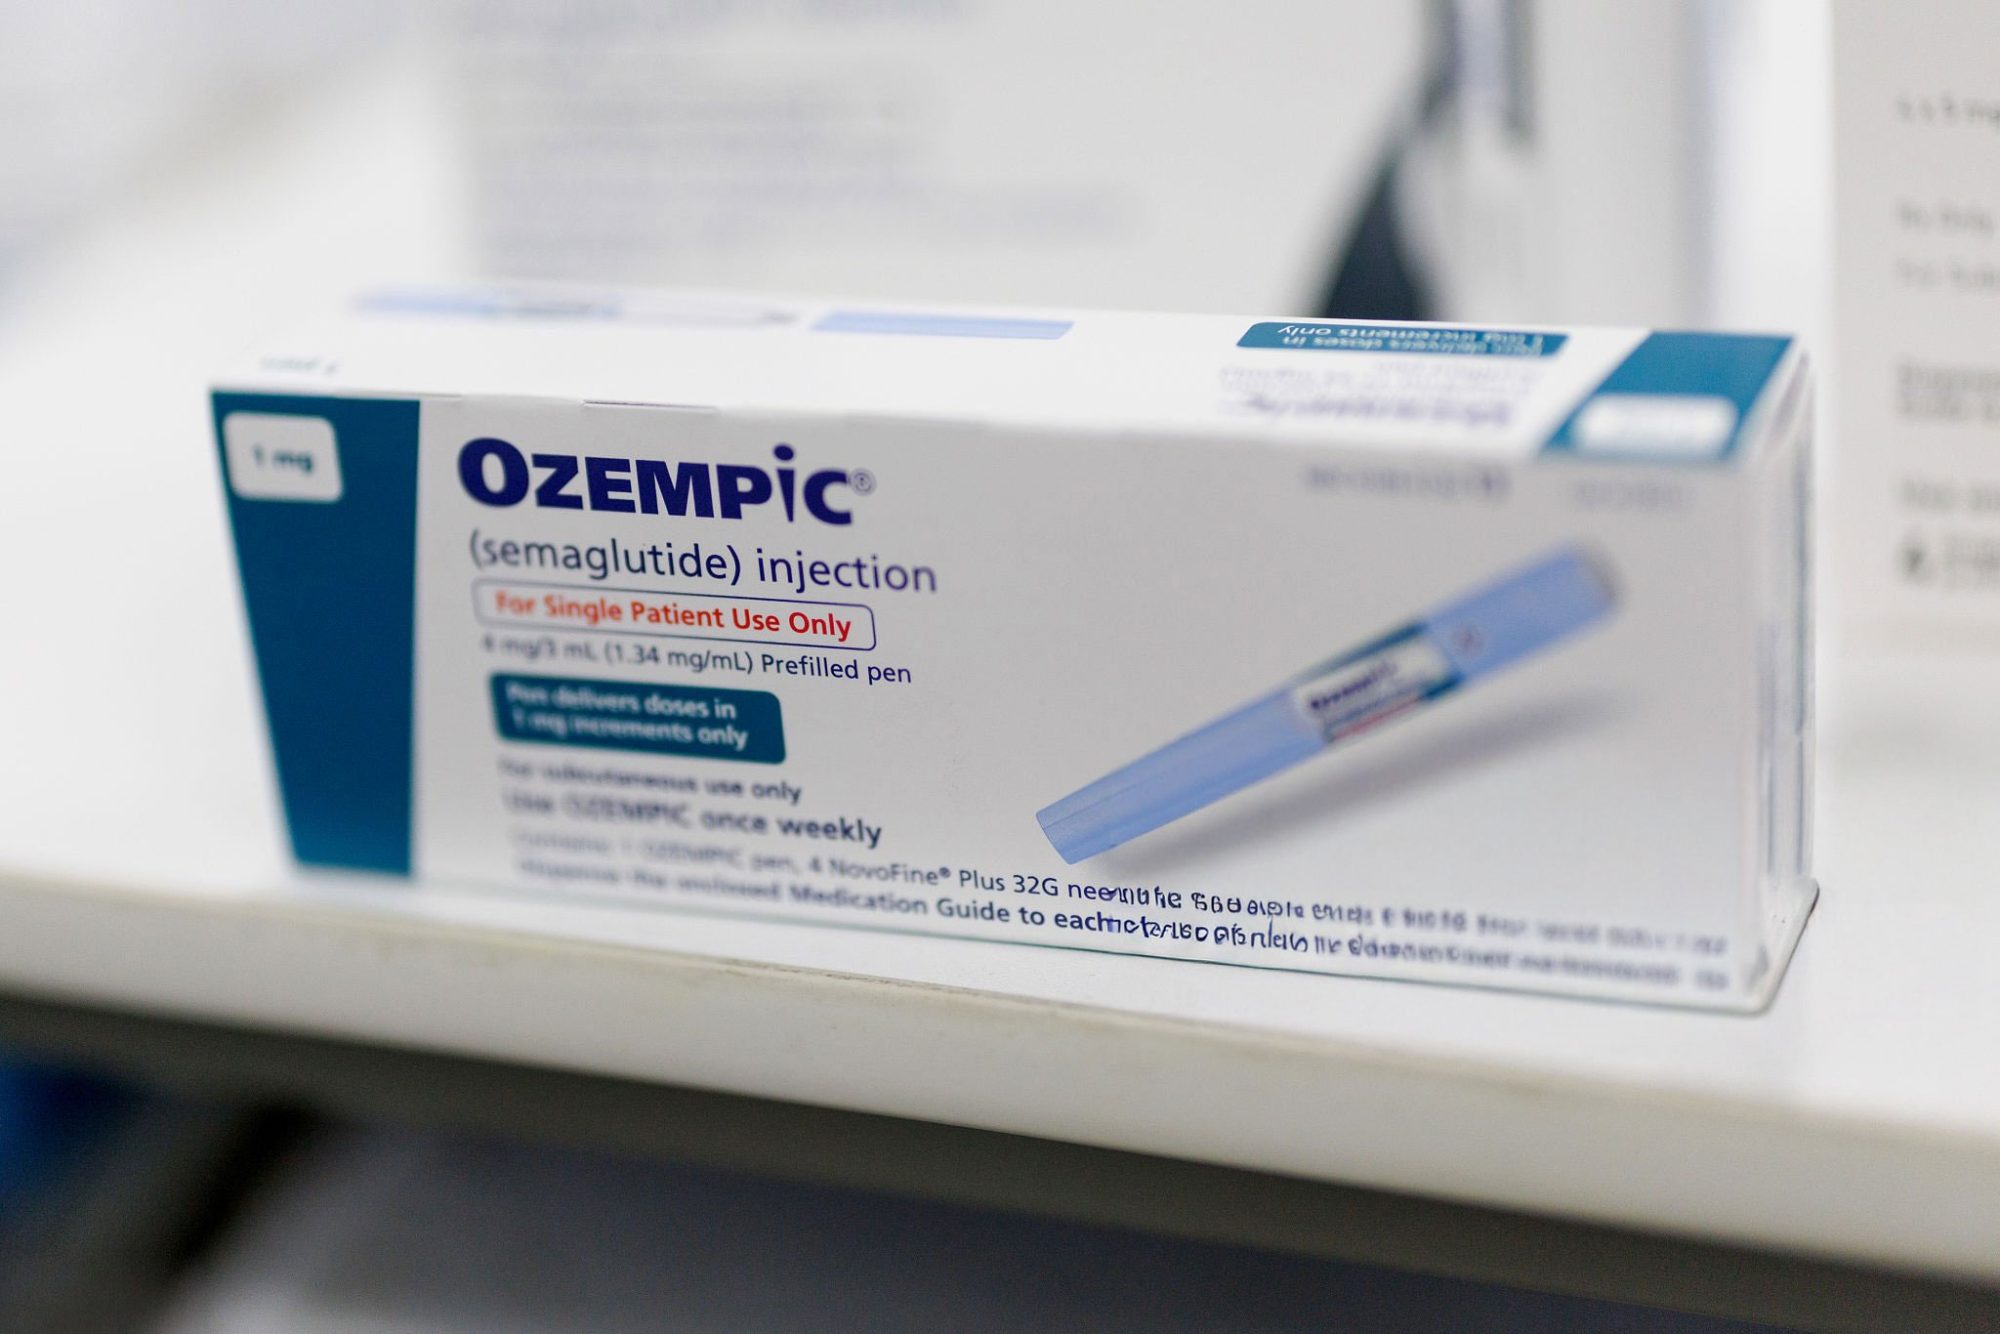
As of late 2025, roughly 12% of Americans—about 41 million people—have used GLP-1 medications like Ozempic, Wegovy, or Mounjaro. That figure comes from a KFF poll reported in JAMA in mid-2024, with subsequent tracking by RAND and others confirming the trend has held. Market projections for these drugs range from $157 billion to $324 billion by 2035, depending on which analyst you ask. This isn’t a niche trend anymore. It’s a mainstream pharmaceutical category reshaping eating behavior at a population level.

What makes this relevant to your operation is how these medications change consumption patterns. GLP-1 drugs work by slowing gastric emptying—patients feel full faster and eat much less. But their protein requirements don’t drop. If anything, clinical guidance suggests they increase.

Obesity medicine specialists now recommend GLP-1 users consume 1.2 to 1.6 grams of protein per kilogram of body weight daily—backed by research in the Journal of the International Society of Sports Nutrition and clinical practice guidelines from multiple medical organizations. That’s substantially higher than typical recommendations. The reasoning? Rapid weight loss without adequate protein intake leads to significant muscle wasting.

And this is where it gets clinically important: studies published in peer-reviewed journals indicate that between 25% and 40% of weight lost on these medications can come from lean body mass rather than fat. A 2025 analysis in BMJ Nutrition, Prevention & Health quantified this at “about 25%–40%” as a proportion of total weight loss. That’s a real concern for patients and their physicians—and it’s driving specific dietary recommendations.

So you have millions of people who can only eat small portions but genuinely need concentrated protein sources. What foods fit that profile?

High-protein dairy fits it remarkably well.

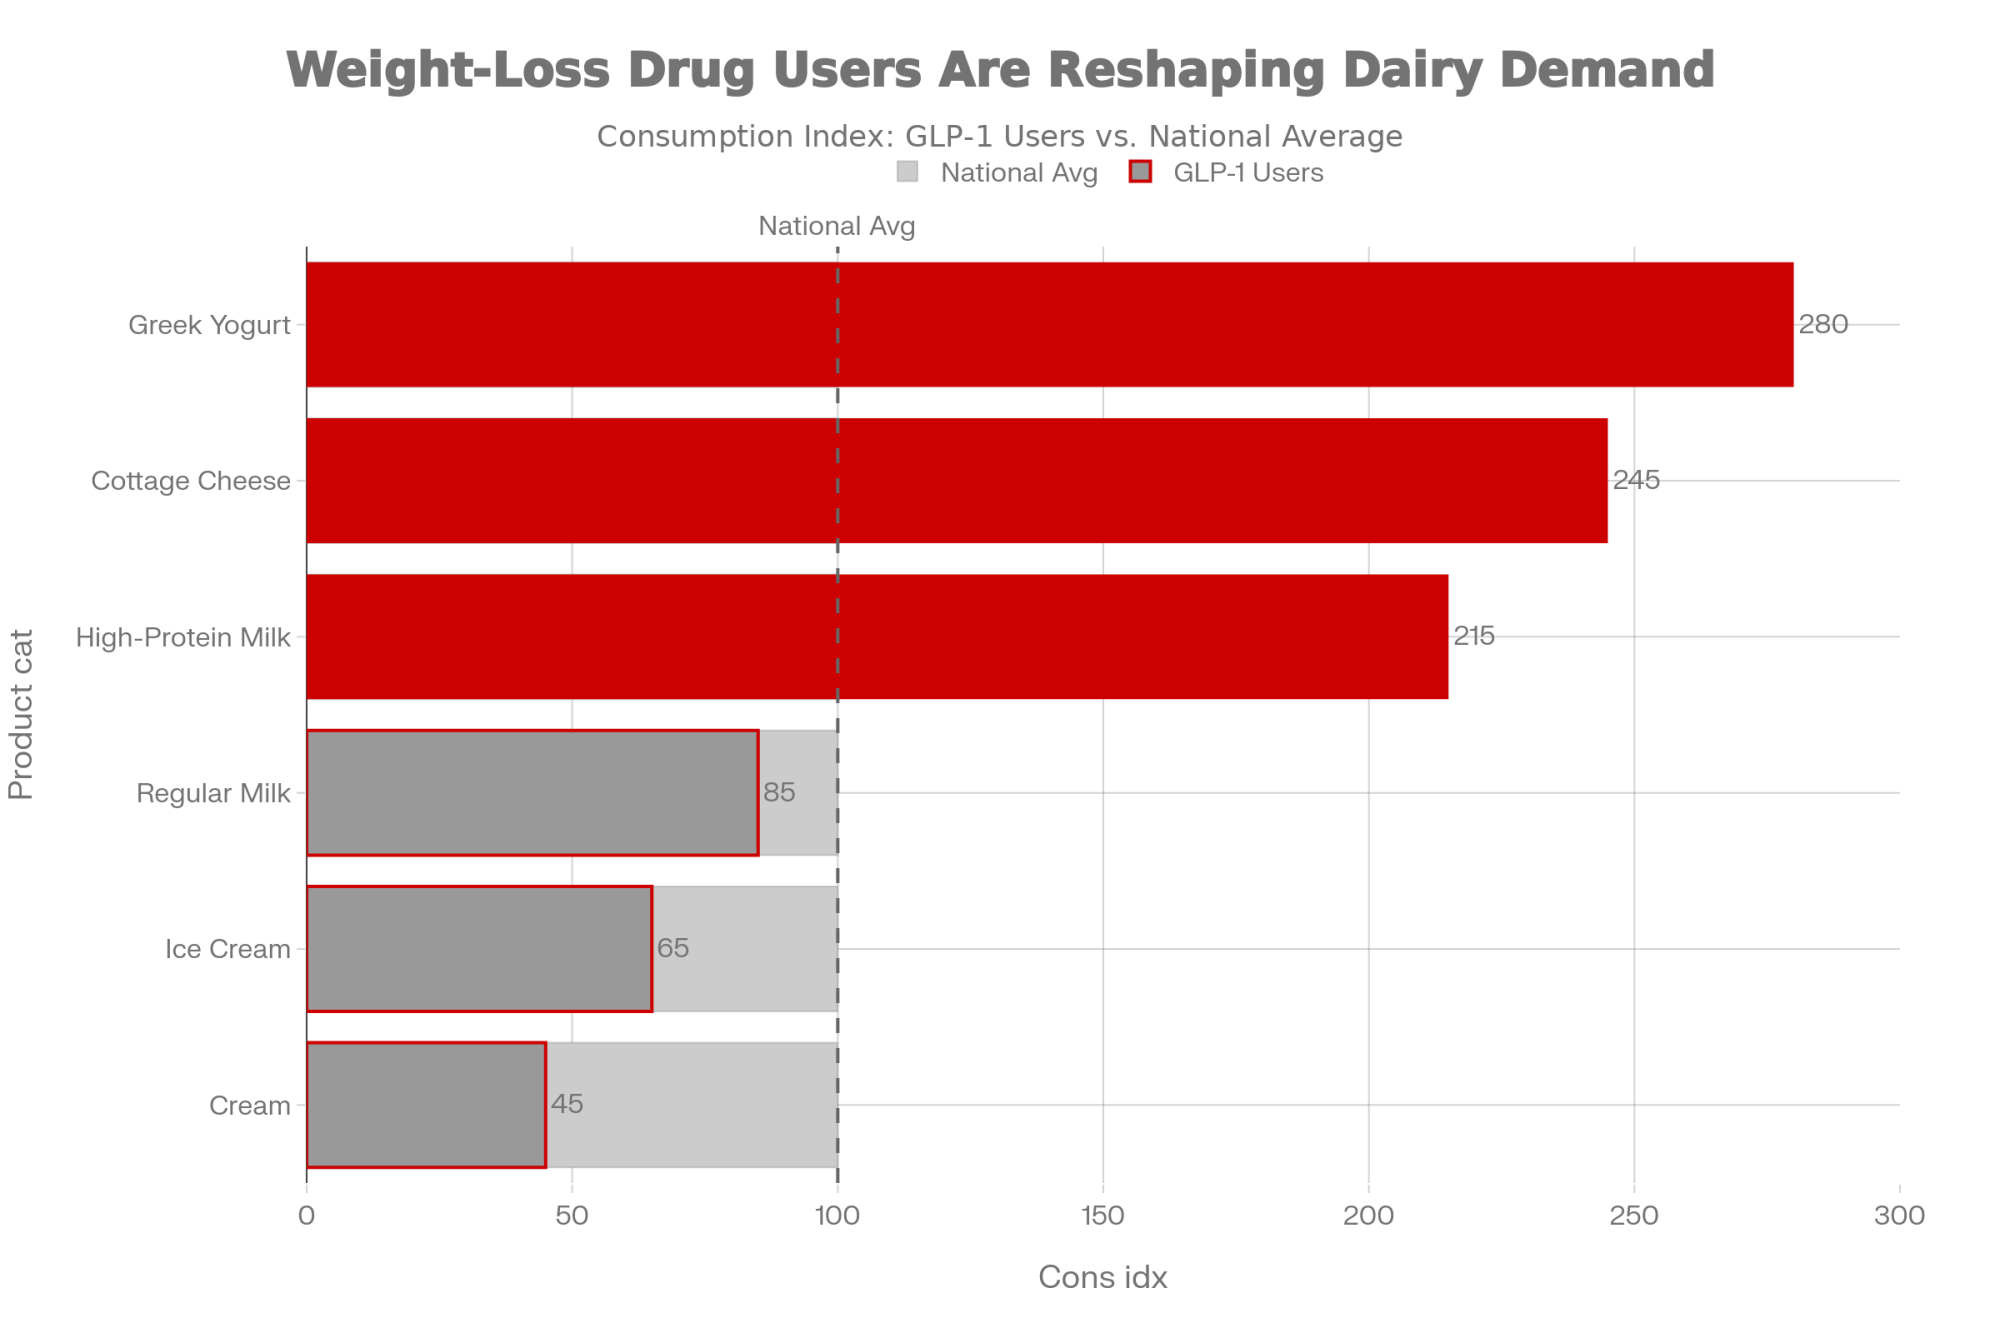
The consumption data supports this. According to Mintel’s tracking, Greek yogurt and cottage cheese consumption has increased significantly among GLP-1 users, while higher-fat dairy categories have moved in the opposite direction. Reports in June 2025 showed that “plain dairy and protein powders hold steady” while “processed goods are taking the biggest hit.” The exact percentages vary by study, but the directional trend is consistent.

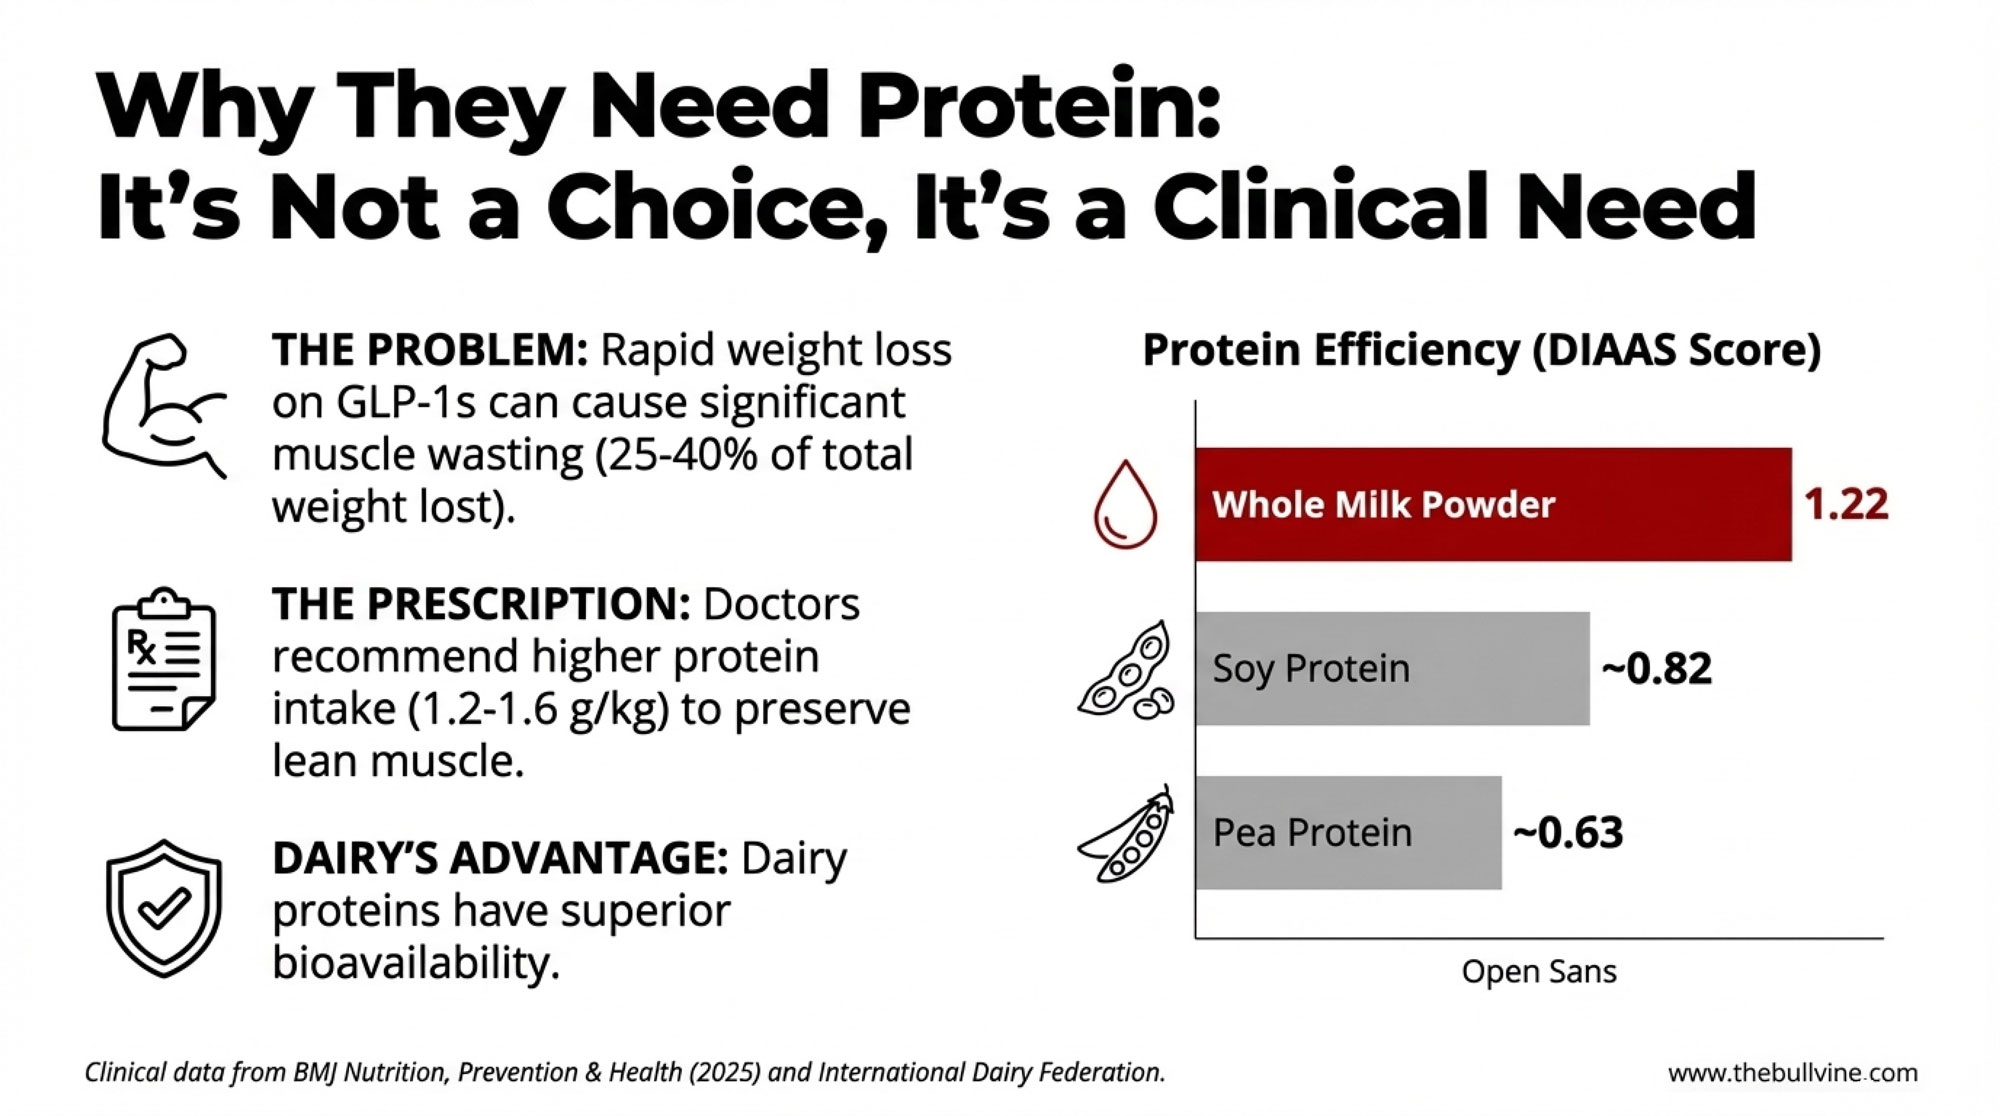
There’s also a bioavailability dimension worth understanding. The DIAAS score—Digestible Indispensable Amino Acid Score, the FAO-recommended measurement method—indicates how efficiently the body uses different protein sources. According to research by the International Dairy Federation and the Global Dairy Platform, whole milk powder scores around 1.22 on DIAAS, while other dairy proteins consistently score 1.0 or higher. Compare that to soy at roughly 0.75-0.90, depending on processing, and pea protein at 0.62-0.64. For someone eating limited quantities, that efficiency difference matters considerably.

What does this means practically? This isn’t just a preference shift—there’s a physiological basis driving these patients toward nutrient-dense protein sources. Dairy happens to fit that need particularly well.

Reading Your Milk Check Differently

So consumer preferences are shifting. What does that actually mean for component pricing?

The answer depends partly on your market, but broad trends are worth understanding.

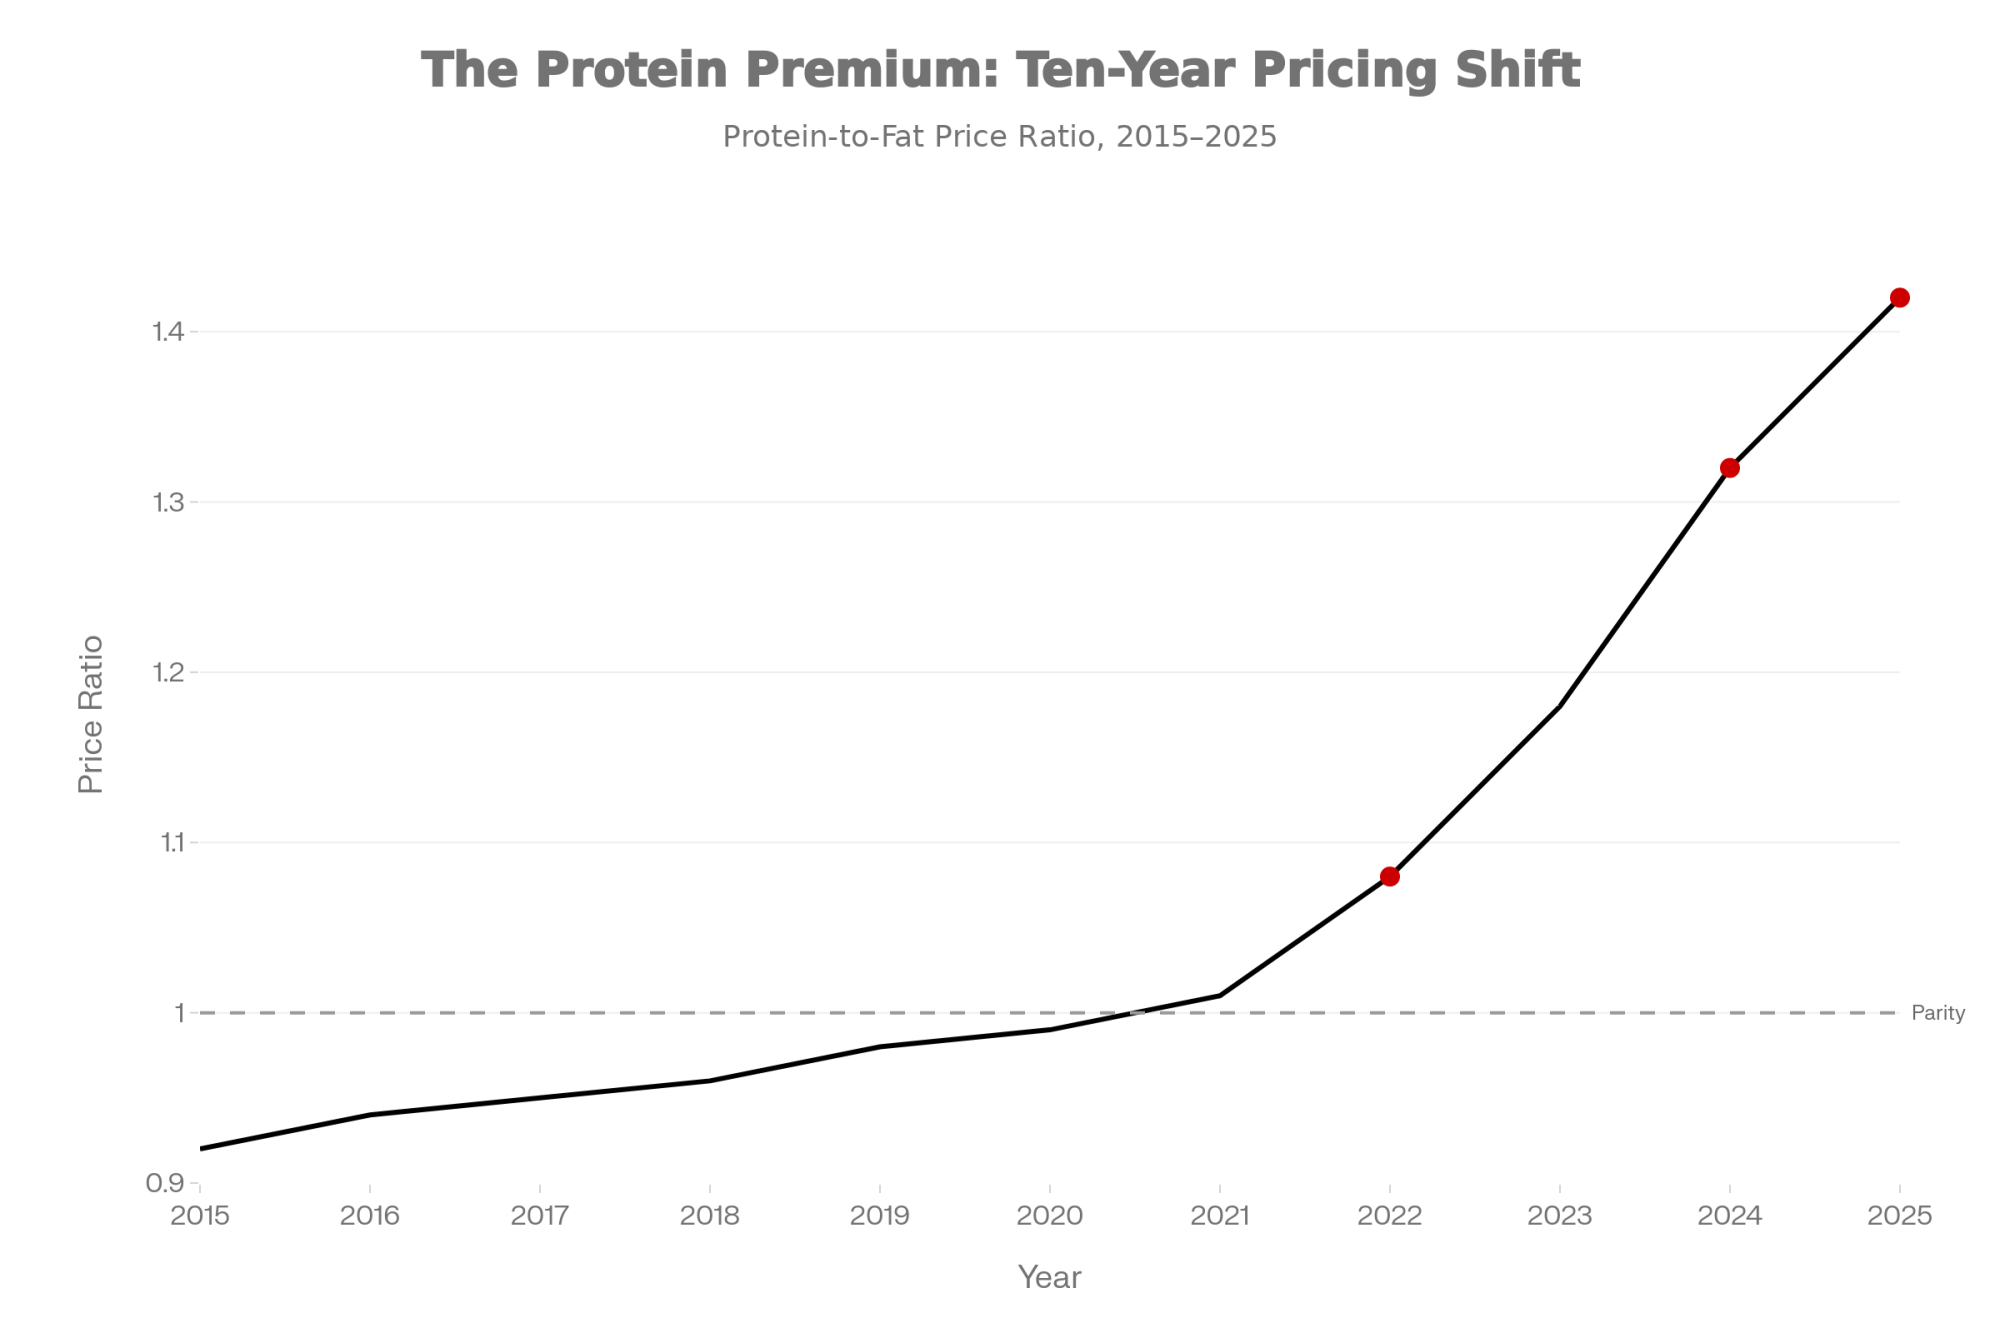
Looking at USDA component price announcements over recent months, protein has traded at a meaningful premium over butterfat. Through late 2025, the protein-to-fat price ratio has been running in the range of 1.3 to 1.4—a notable departure from historical norms. For much of the past two decades, these components traded closer to parity, with fat often commanding a slight premium.

I recently spoke with a Wisconsin producer who’d been closely tracking this shift. “I started paying attention about two years ago,” he told me. “Once I saw the ratio consistently above 1.25, I went back and looked at my sire selection. Realized I’d been leaving money on the table.”

That experience isn’t unusual. Many producers look at their check, review the component breakdowns, and maybe note whether fat or protein prices have changed from last month. But they’re not calculating what the spread actually means for breeding strategy over time.

Let me put some illustrative numbers on it, using late 2025 component price relationships as a guide.

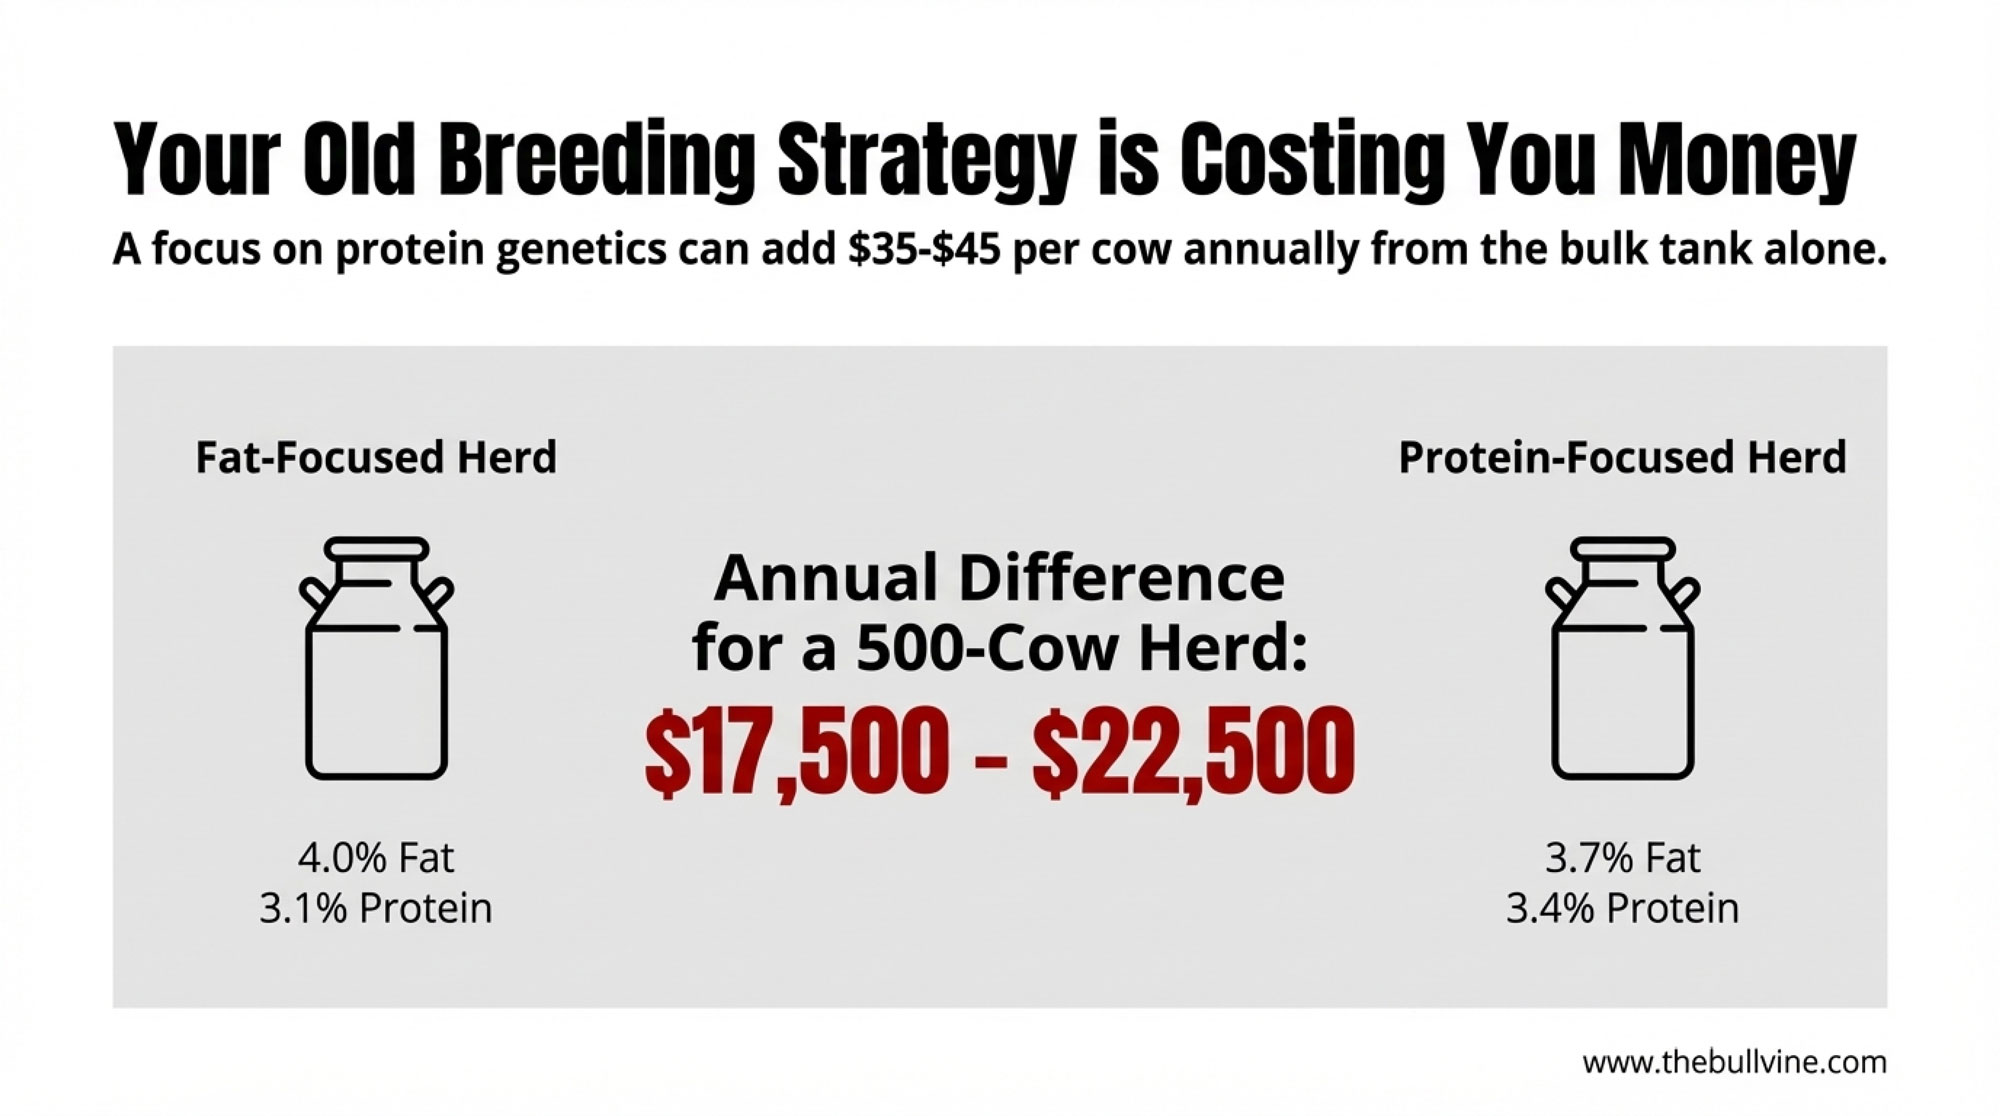
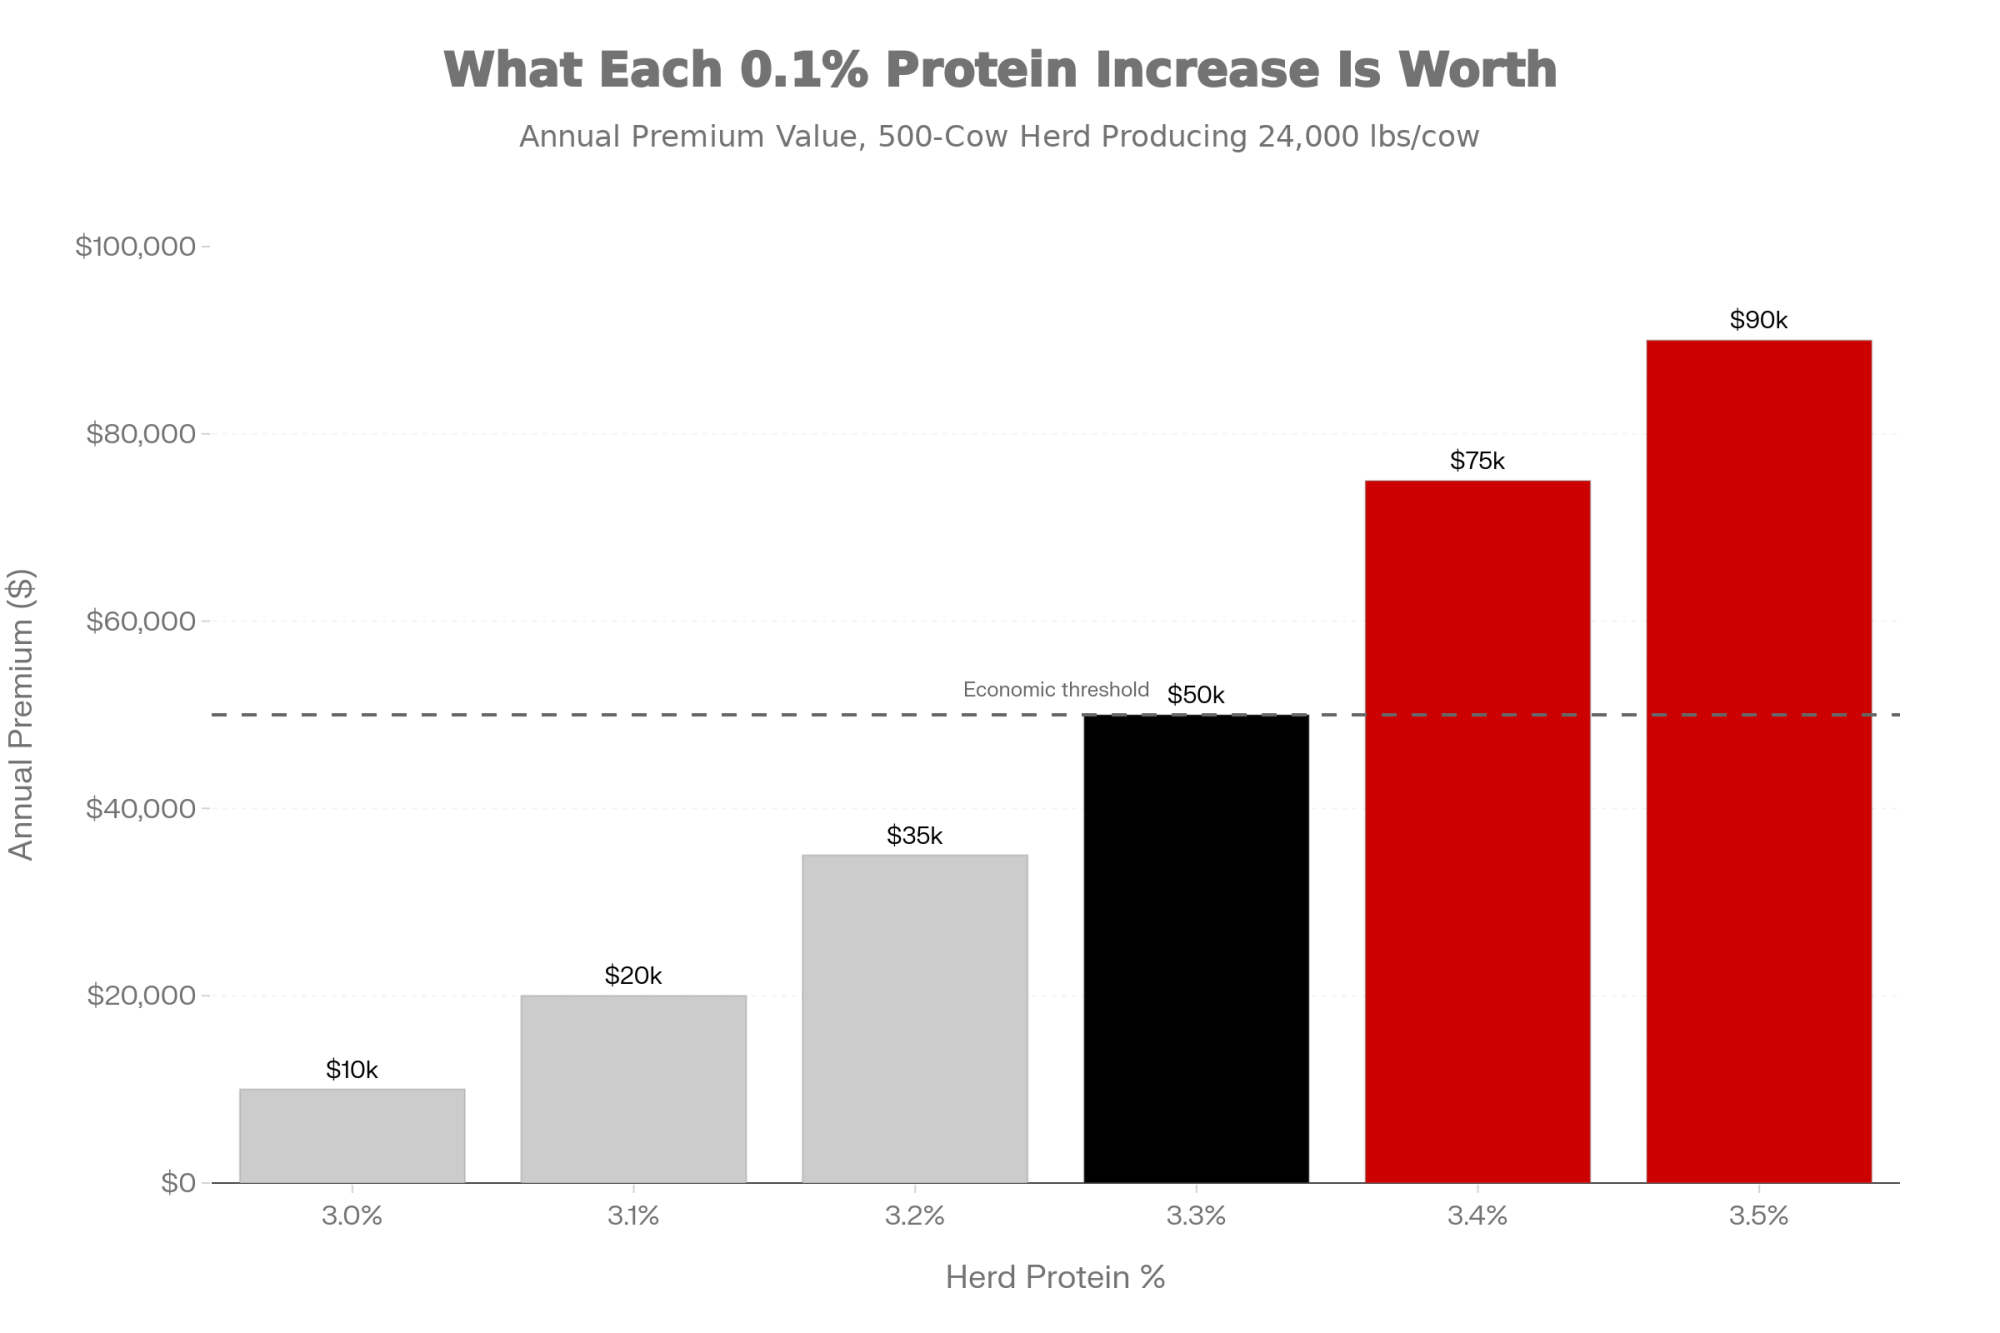
Consider a 500-cow operation producing 24,000 pounds per cow annually. If you compare a fat-focused breeding approach averaging 4.0% fat and 3.1% protein against a protein-focused approach averaging 3.7% fat and 3.4% protein, the difference in total component value can run $35 to $45 per cow annually from the bulk tank alone (these figures shift as component prices move, but the general principle holds when protein maintains its current premium over fat). For that 500-cow herd, you’re looking at roughly $17,500 to $22,500 in annual difference from genetics alone.

That’s before considering processor premiums that cheese and ingredient plants often pay for high-protein milk. Factor those in, and the opportunity can be larger still.

I want to be measured here. I’m not suggesting everyone immediately overhaul their breeding strategy. What I am suggesting is that this ratio deserves more attention than most producers have been giving it.

The Federal Order Update

Another dimension affects how money flows through the pricing system.

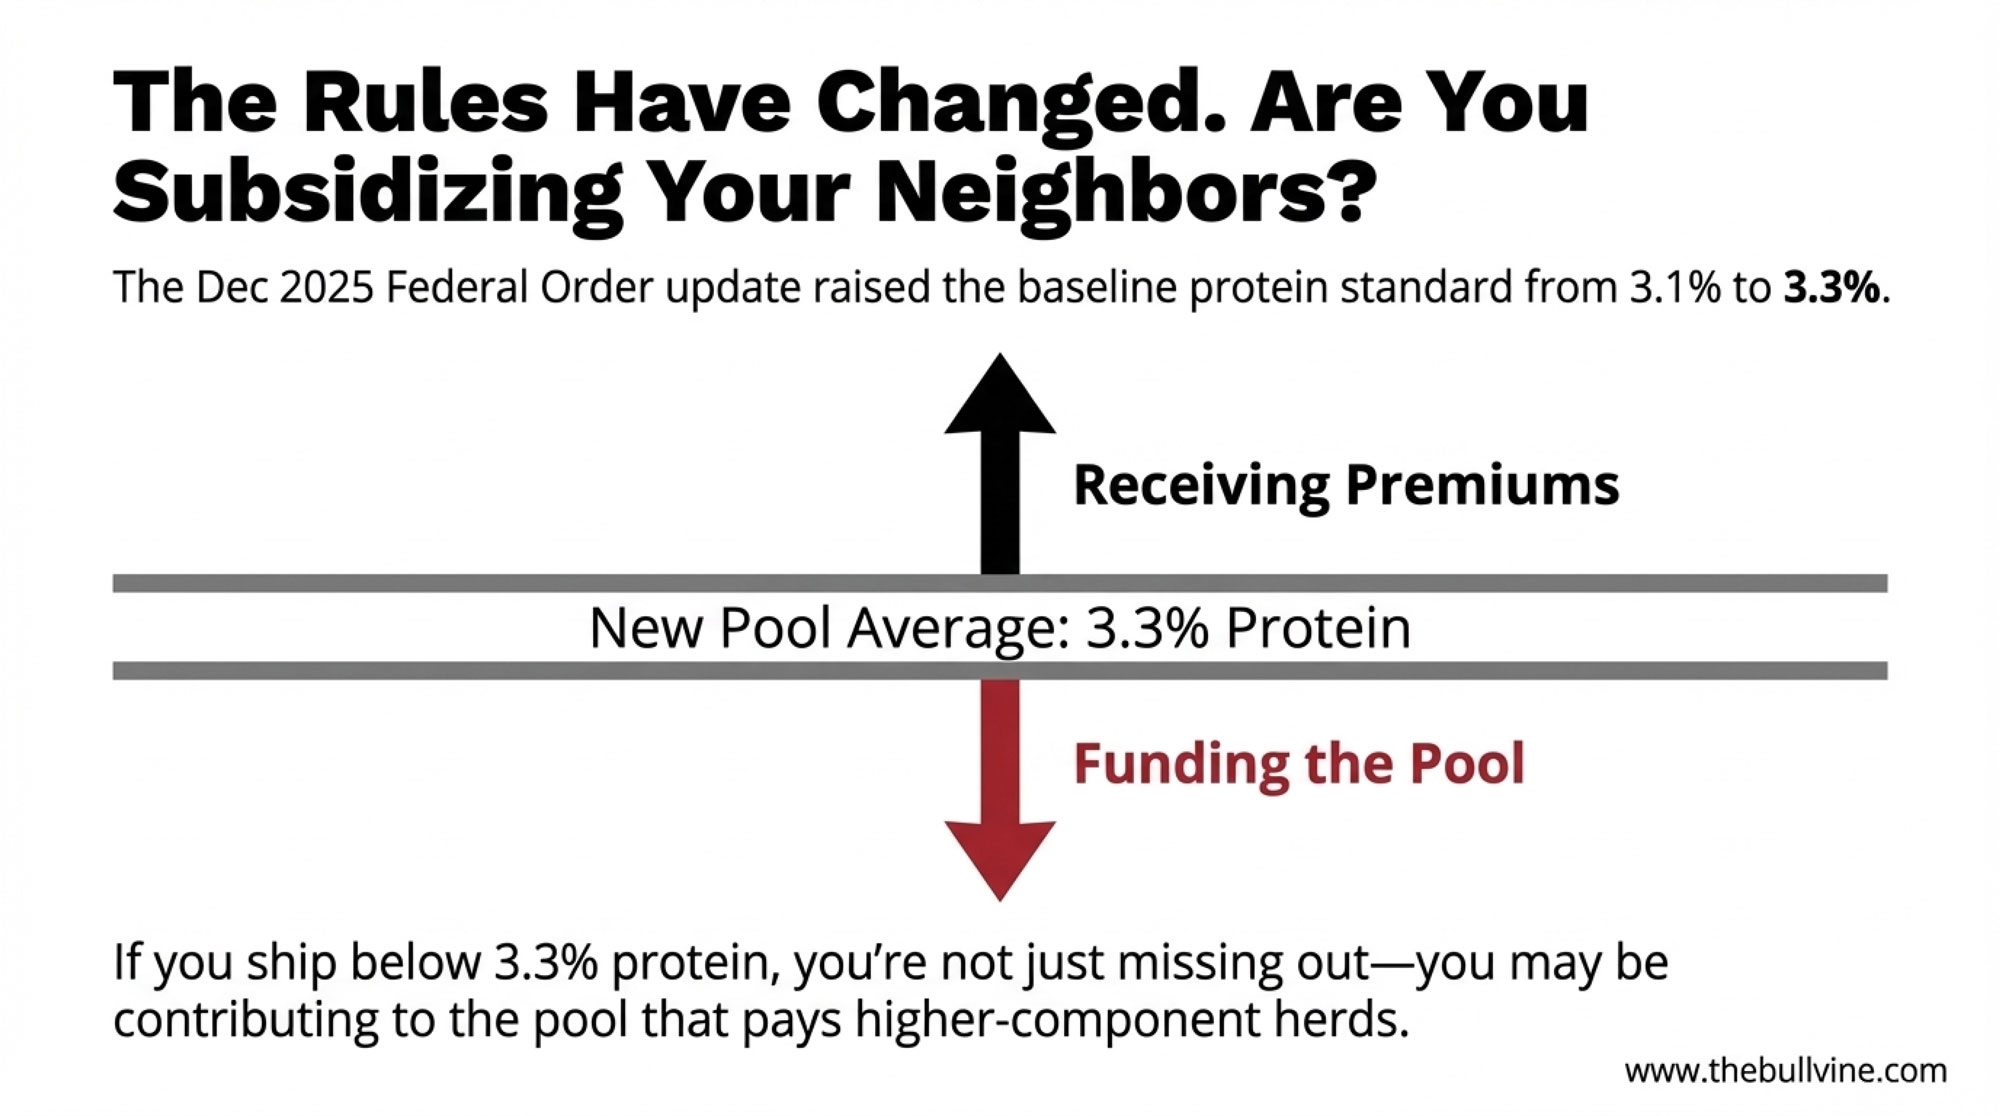
The June 2025 updates to Federal Milk Marketing Order formulas—finalized by USDA in January 2025 after the producer referendum—adjusted baseline composition factors to reflect current herd averages. According to the USDA Agricultural Marketing Service final rule, protein moved from 3.1% to 3.3%, other solids from 5.9% to 6.0%, and nonfat solids from 9.0% to 9.3%. The composition factor updates became effective December 1, 2025.

Why does this matter practically? Processors now assume your milk contains 3.3% protein as the baseline. If you’re consistently shipping 3.0% or 3.1%, you’re not just missing premiums—you may be contributing to the pool that pays premiums to higher-component herds.

I’ve spoken with producers who didn’t fully grasp this dynamic at first. They knew their components were “a little below average” but figured it wasn’t significant. When we worked through their position relative to the pool, they were surprised to see how much value was being transferred out of their operation each month.

The system isn’t unfair—it’s designed to reward quality. But you need to understand where you stand within it.

Genetic Strategies Worth Considering

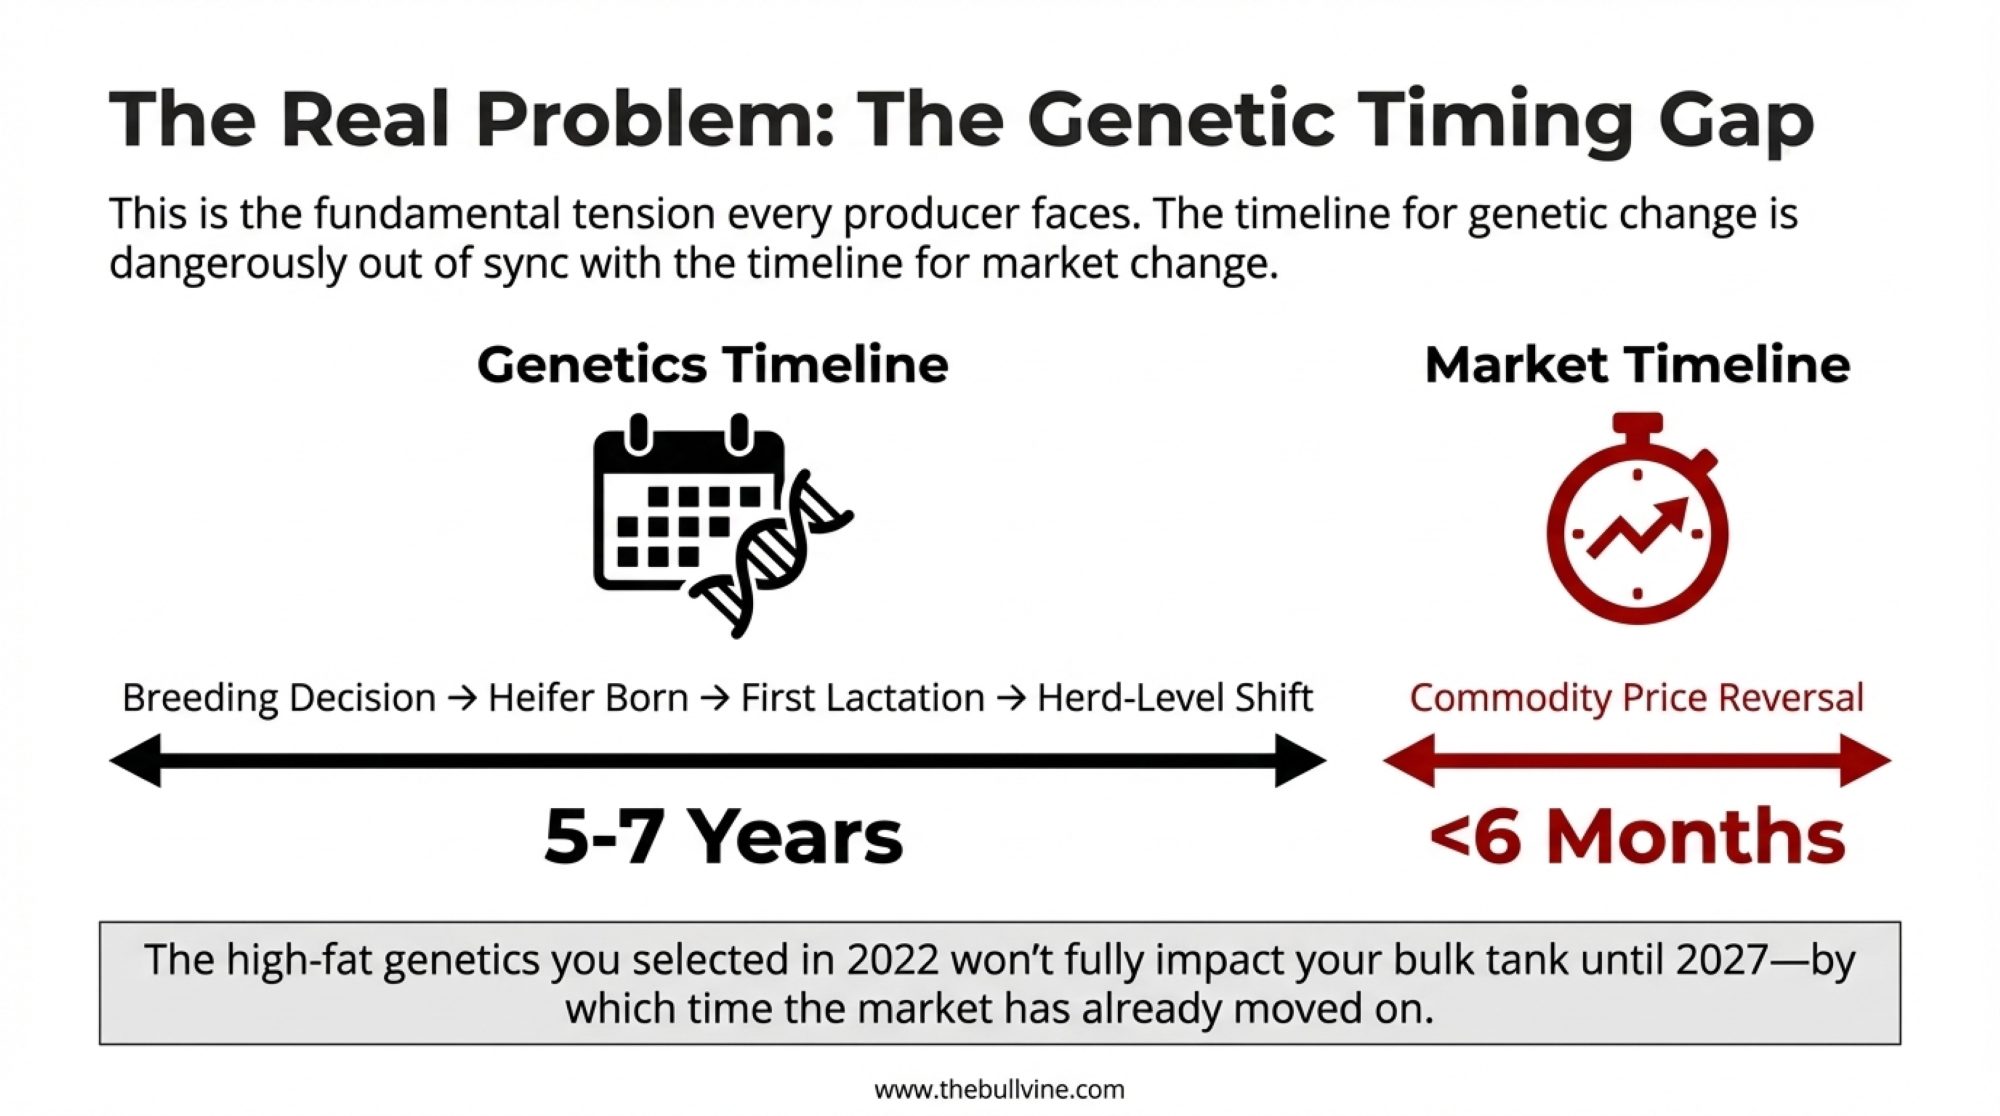
For operations looking to improve protein production, genetic selection offers the most durable path forward. The challenge, as we all know, is that results take time to show up in the bulk tank.

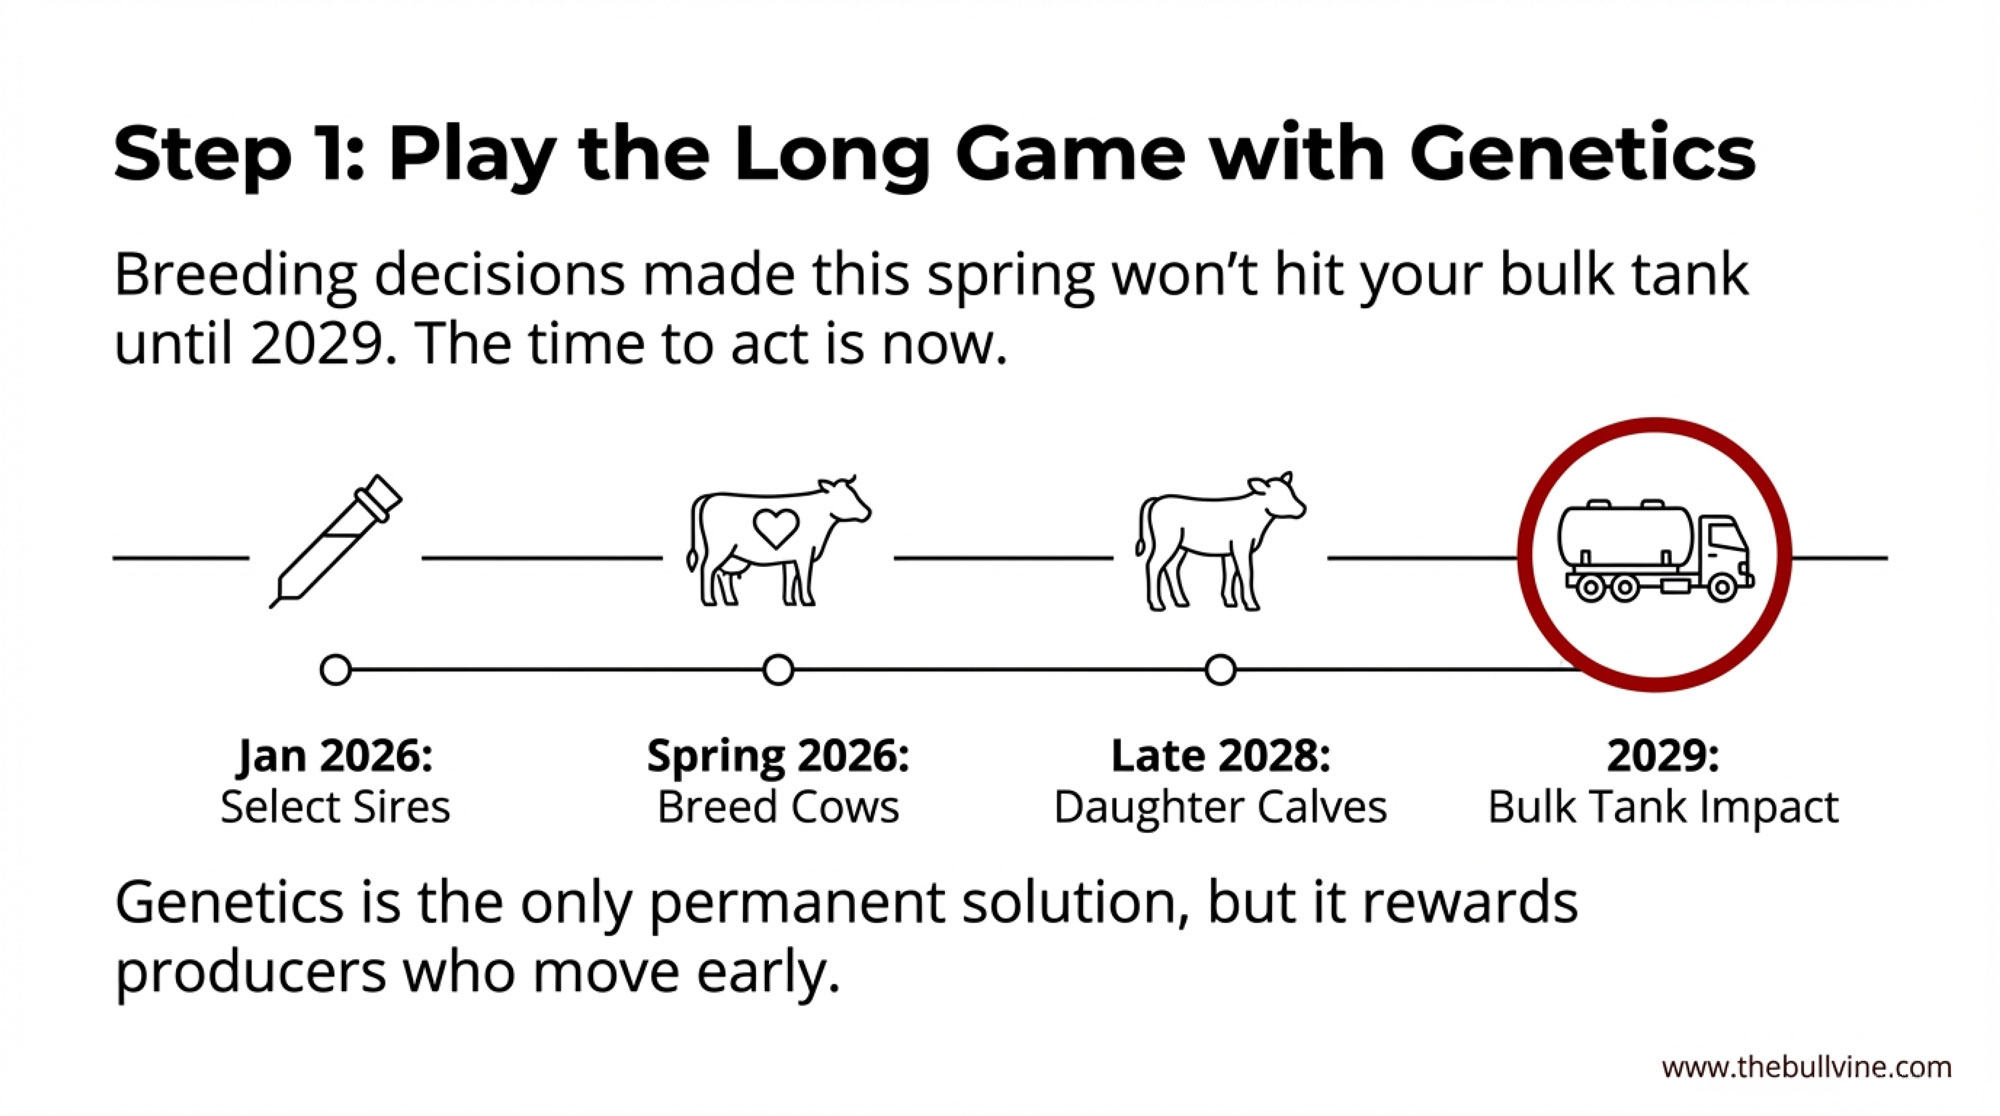
The timeline reality looks something like this:

From Breeding Decision to Bulk Tank Impact

  • Select high-protein sires (January 2026) → Semen in tank
  • Breed cows (Spring 2026) → Conception
  • Gestation (Spring 2026 – Winter 2027) → Calf born
  • Heifer development (2027 – 2028) → Growing replacement
  • First calving (Late 2028) → Enters milking string
  • First full lactation data (2029) → Bulk tank impact measurable
PhaseTimingMonths from Decision
Sire SelectionJanuary 20260
Breeding/ConceptionSpring 20263–6
GestationSpring 2026 – Winter 202712–15
Heifer Development2027 – 202824–30
First CalvingLate 202833–36
Measurable Bulk Tank Impact202936–48

If you breed a cow this spring, her daughter won’t enter the milking string until late 2028 at the earliest. That’s just the biology. So breeding decisions you make in the next few months will shape your herd’s component profile three to five years from now.

MetricFat-Focused StrategyProtein-Focused Strategy
Avg Fat %4.0%3.7%
Avg Protein %3.1%3.4%
Component Value/Cow/Year$1,245$1,290
Processor Premium/Cow/Year$0$120
Total Annual Herd Revenue (500 cows)$622,500$705,000
Revenue Advantage+$82,500

This is why genetics is a long game—but it’s also the only permanent solution. Nutrition can help capture more of your genetic potential today, but it can’t exceed what the genetics allow.

One development that’s accelerating this timeline for some operations: genomic testing. If you’re testing heifers at a few months of age, you can identify your high-protein genetics earlier and make culling decisions before investing in two years of development costs. It doesn’t change the biological timeline, but it does let you be more selective about which animals you’re developing in the first place.

Selection Index Considerations

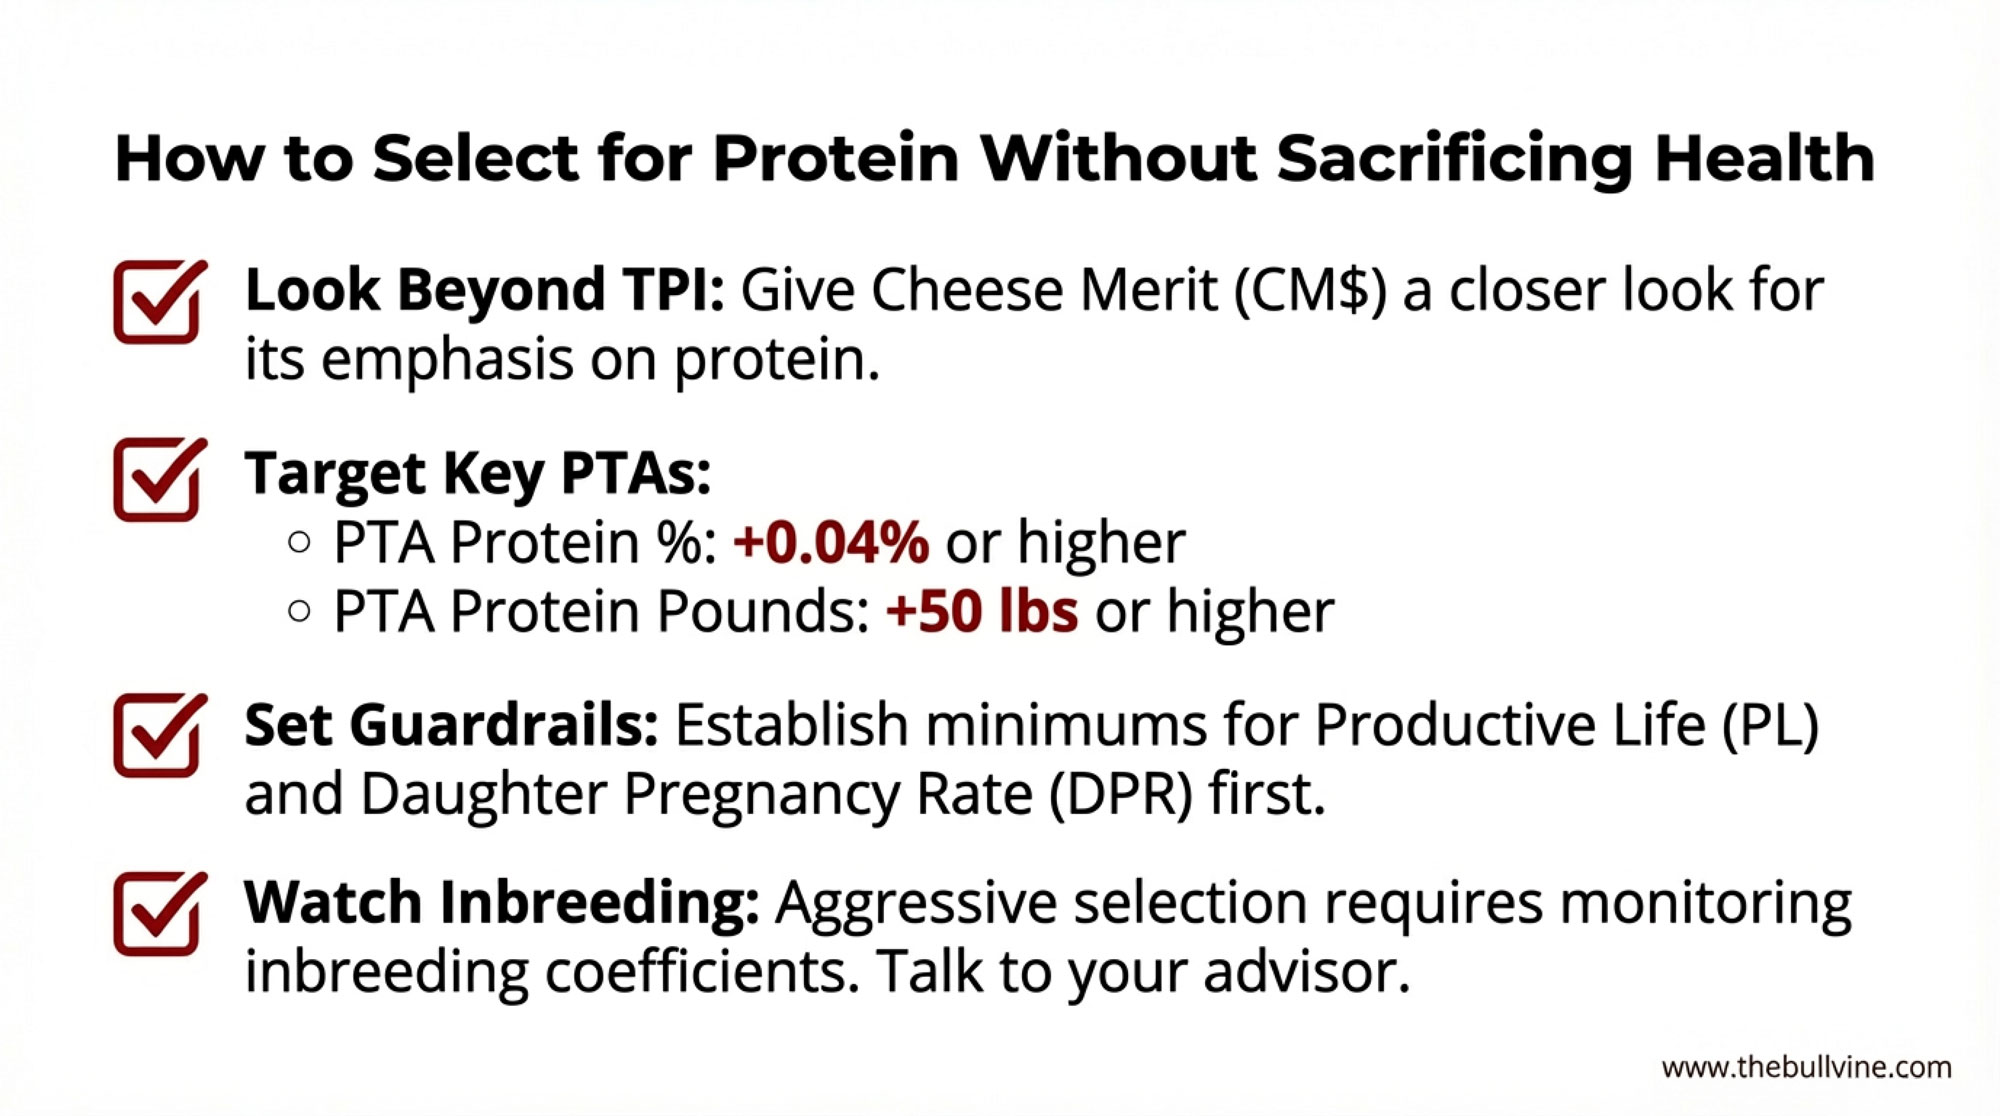
Most producers default to Total Performance Index (TPI) when evaluating Holstein sires, and it remains useful for balanced selection. But if protein improvement is a specific priority, Cheese Merit (CM$) rankings warrant closer scrutiny.

Trait CategoryMinimum ThresholdProtein-Focused TargetWhy It Matters
PTA Protein %+0.03%+0.04% to +0.06%Improves concentration—the key to premiums
PTA Protein Pounds+40 lbs+50 lbs or higherEnsures volume doesn’t drop as % increases
PTA Fat %No minimum+0.01% to +0.03%Hedges against protein premium narrowing
Productive Life (PL)+2.0+3.0 or higherCows must last long enough to justify investment
Daughter Pregnancy Rate (DPR)+0.5+1.0 or higherPoor fertility destroys genetic progress
Somatic Cell Score (SCS)2.90 or lower2.85 or lowerHigh SCC kills premiums faster than low protein
Inbreeding CoefficientMonitor: keep below 6.25%Aggressive protein selection can concentrate genes
Selection IndexUse CM$ or updated NM$Better protein weighting than traditional TPI

CM$ places greater emphasis on protein per pound and protein percentage than TPI does. It was designed for operations shipping to cheese plants, where protein drives vat yield. The updated Net Merit (NM$) formula has also adjusted component weightings in recent years to reflect market realities.

General Thresholds to Consider

When evaluating individual sires for protein improvement, what many nutritionists and AI representatives suggest—keeping in mind these are general guidelines, not hard rules:

  • PTA Protein %: Bulls at +0.04% or higher are generally considered strong for protein concentration. Bulls above +0.06% are moving the needle meaningfully.
  • PTA Protein Pounds: Targeting +50 lbs or higher helps maintain total protein production while improving percentage.
  • Combined approach: The ideal sires show positive values in both categories. Bulls that improve percentage by diluting volume aren’t actually helping you.

One important caution: don’t chase protein so aggressively that you sacrifice health and fertility traits. A cow that burns out after 1.8 lactations isn’t profitable regardless of her component profile. Setting minimum thresholds for Productive Life and Daughter Pregnancy Rate before optimizing for components makes sense. Talk with your AI rep about what fits your specific situation.

Intervention StrategyLow EstimateHigh EstimateTimeline to Impact
Nutrition Optimization (amino acid balancing)$8,750$15,0002–4 weeks
Genetic Improvement (protein-focused sires)$17,500$22,5003–5 years
Processor Premiums (high-protein milk)$24,000$60,000Immediate (if available)
TOTAL ANNUAL OPPORTUNITY$50,250$97,500Varies by strategy

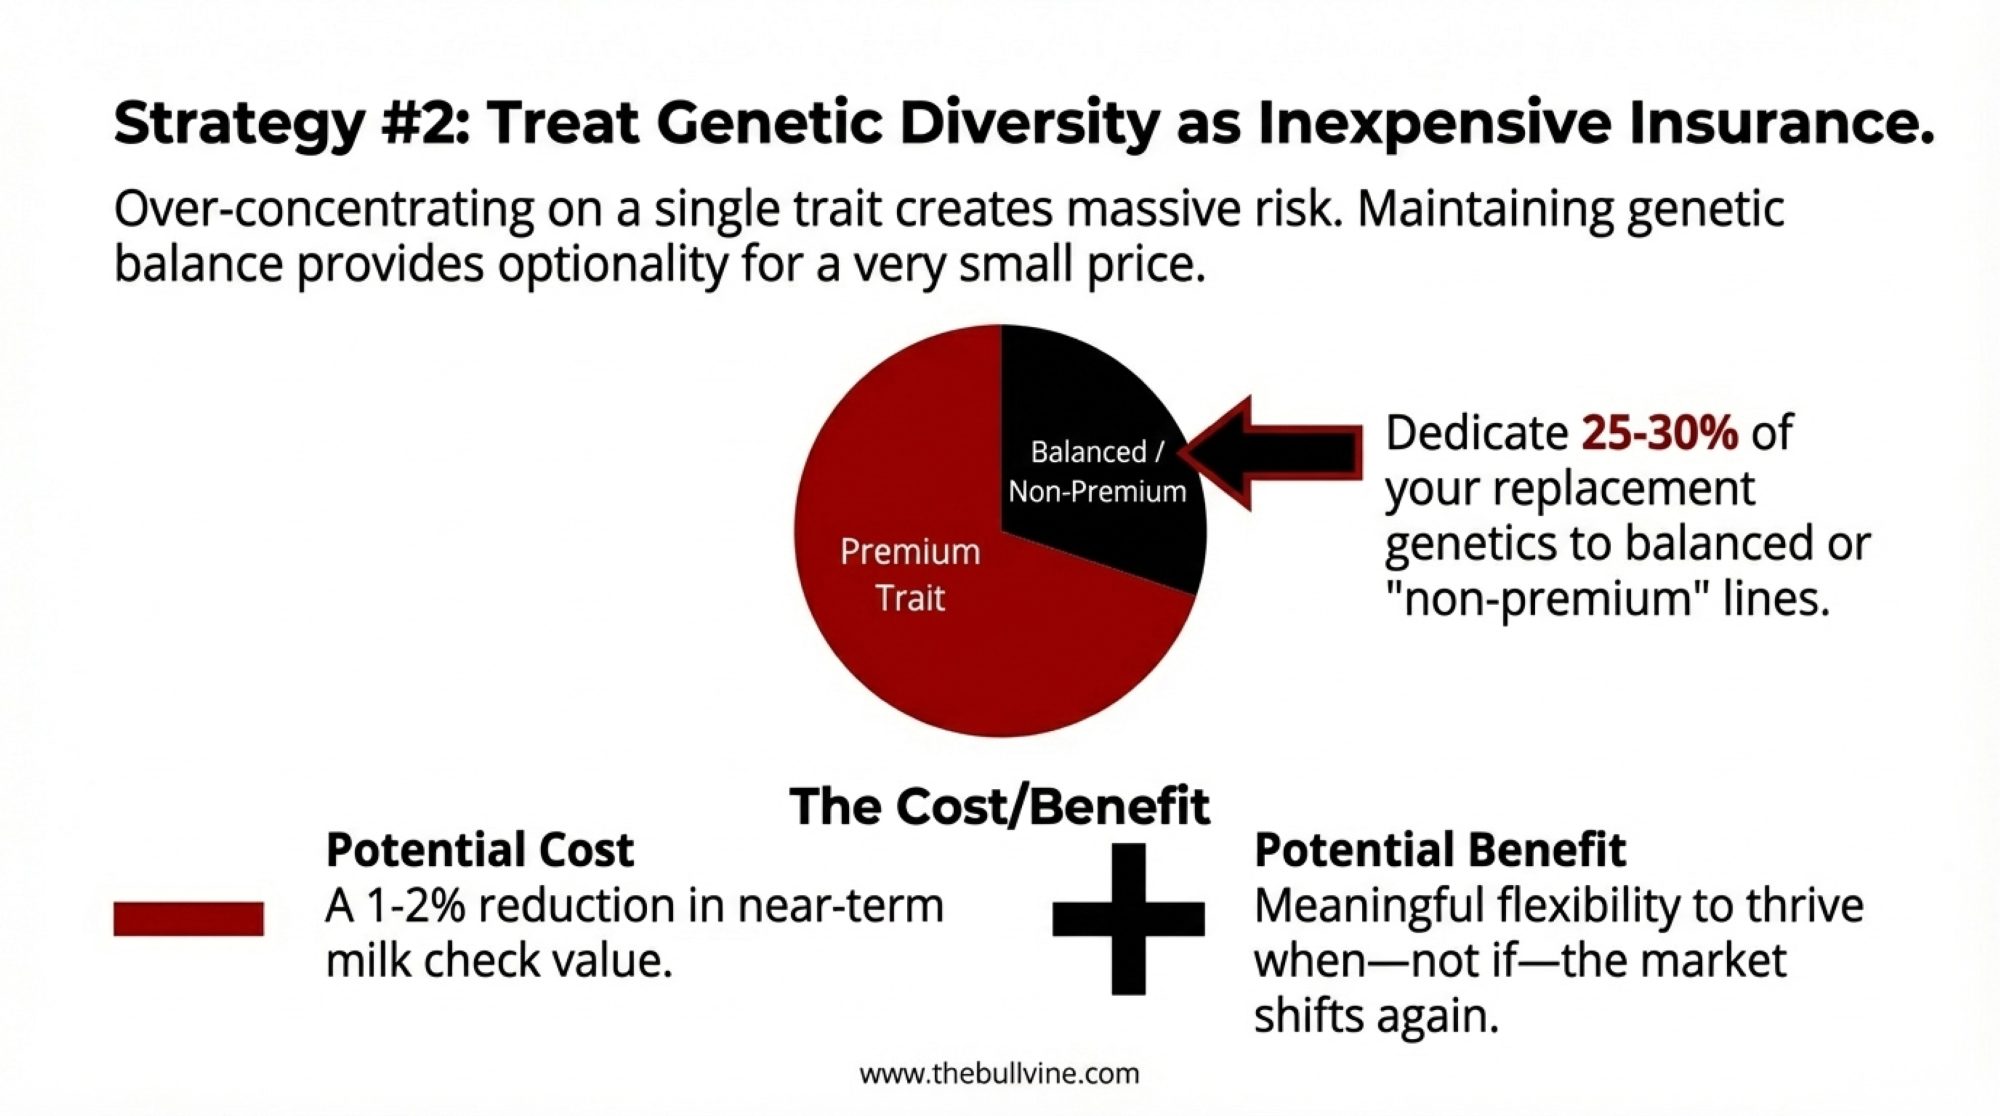
A Note on Inbreeding

Another consideration doesn’t get discussed enough: selecting heavily for narrow trait clusters can accelerate inbreeding. Pennsylvania State University’s Dr. Chad Dechow, who has extensively studied genetic diversity in Holsteins, notes that intense selection for specific traits can accelerate genetic concentration faster than many producers realize—as he’s put it, “if it works, it’s line breeding; if it doesn’t, it’s inbreeding.” Research published in Frontiers in Animal Science found that selection for homozygosity at specific loci (like A2 protein) significantly increased inbreeding both across the genome and regionally. The takeaway: if you’re selecting aggressively for protein traits, monitor inbreeding coefficients and work with your genetic advisor to maintain adequate diversity in your sire lineup.

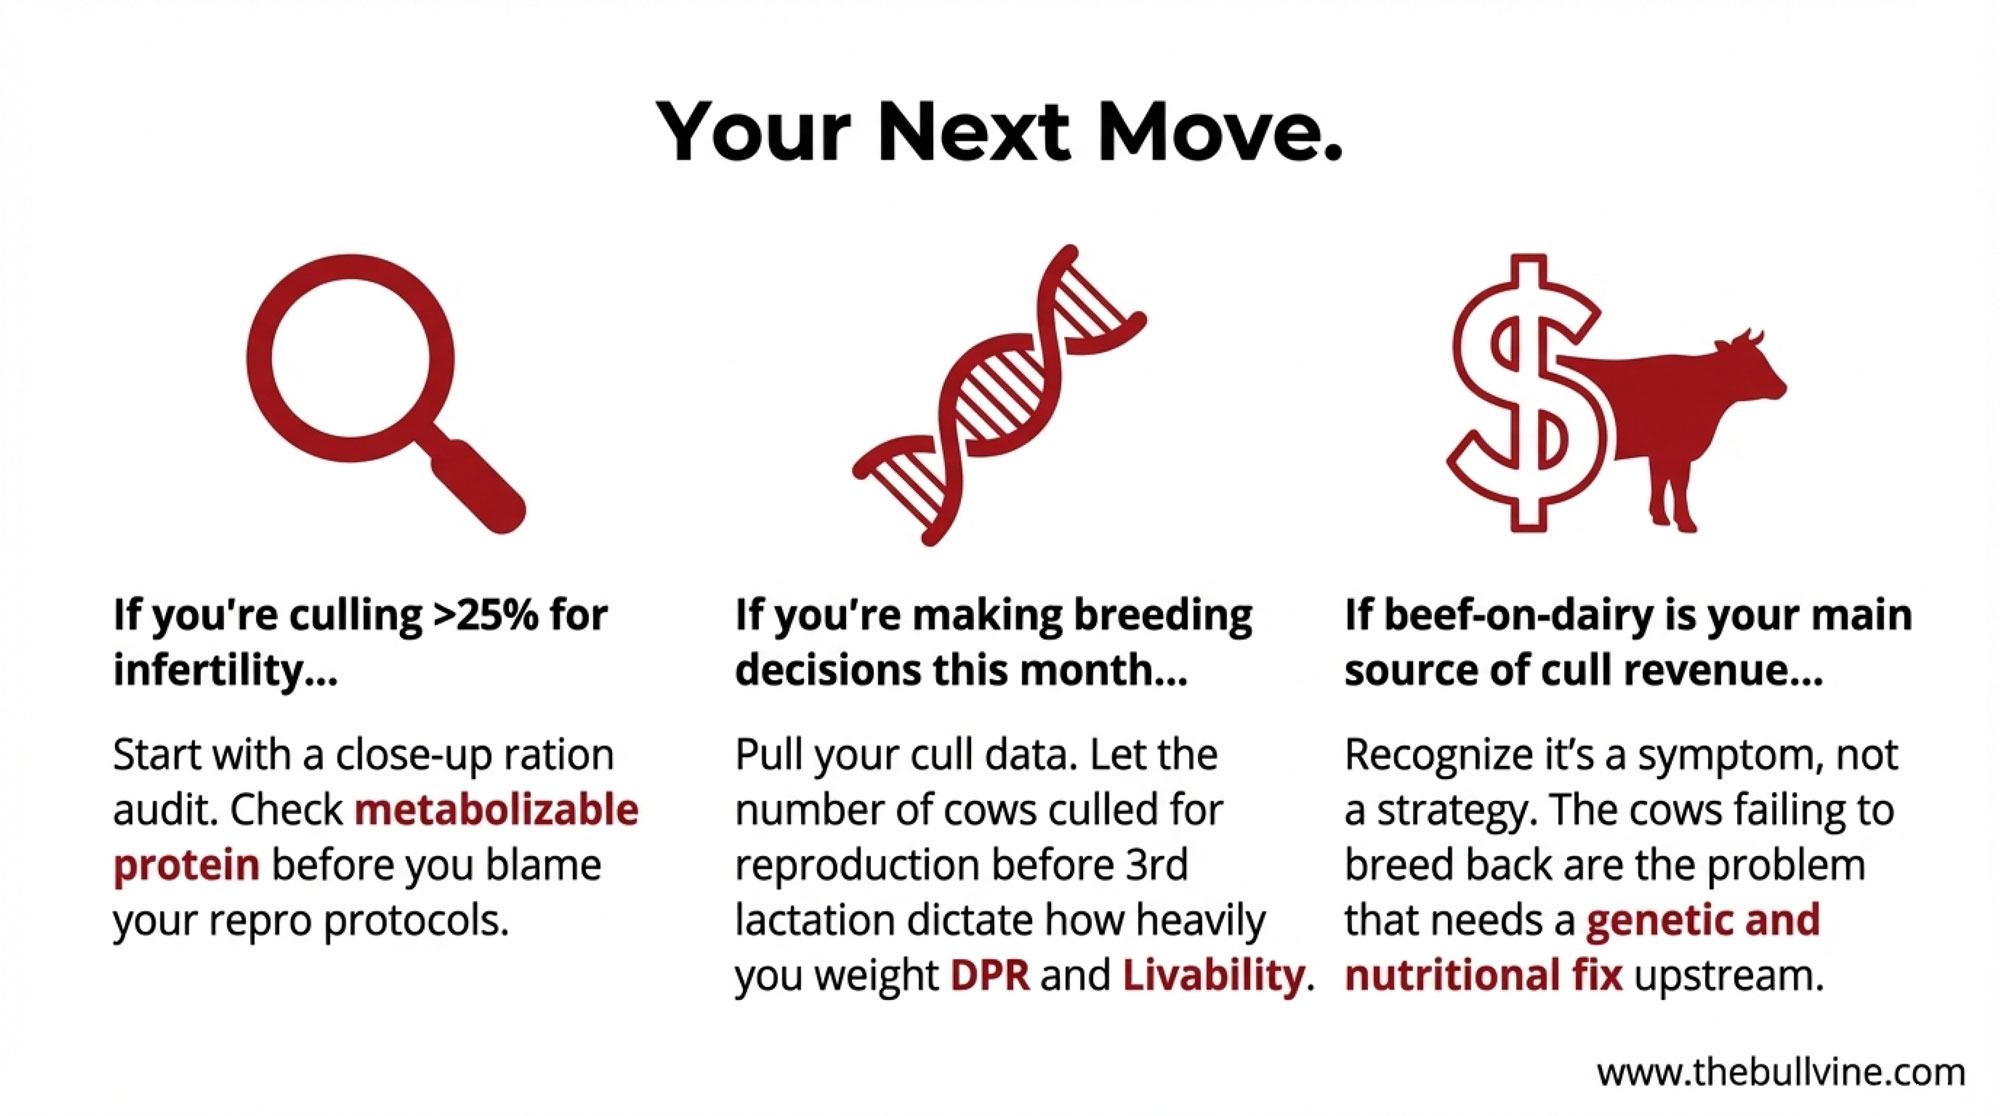
The Beef-on-Dairy Angle

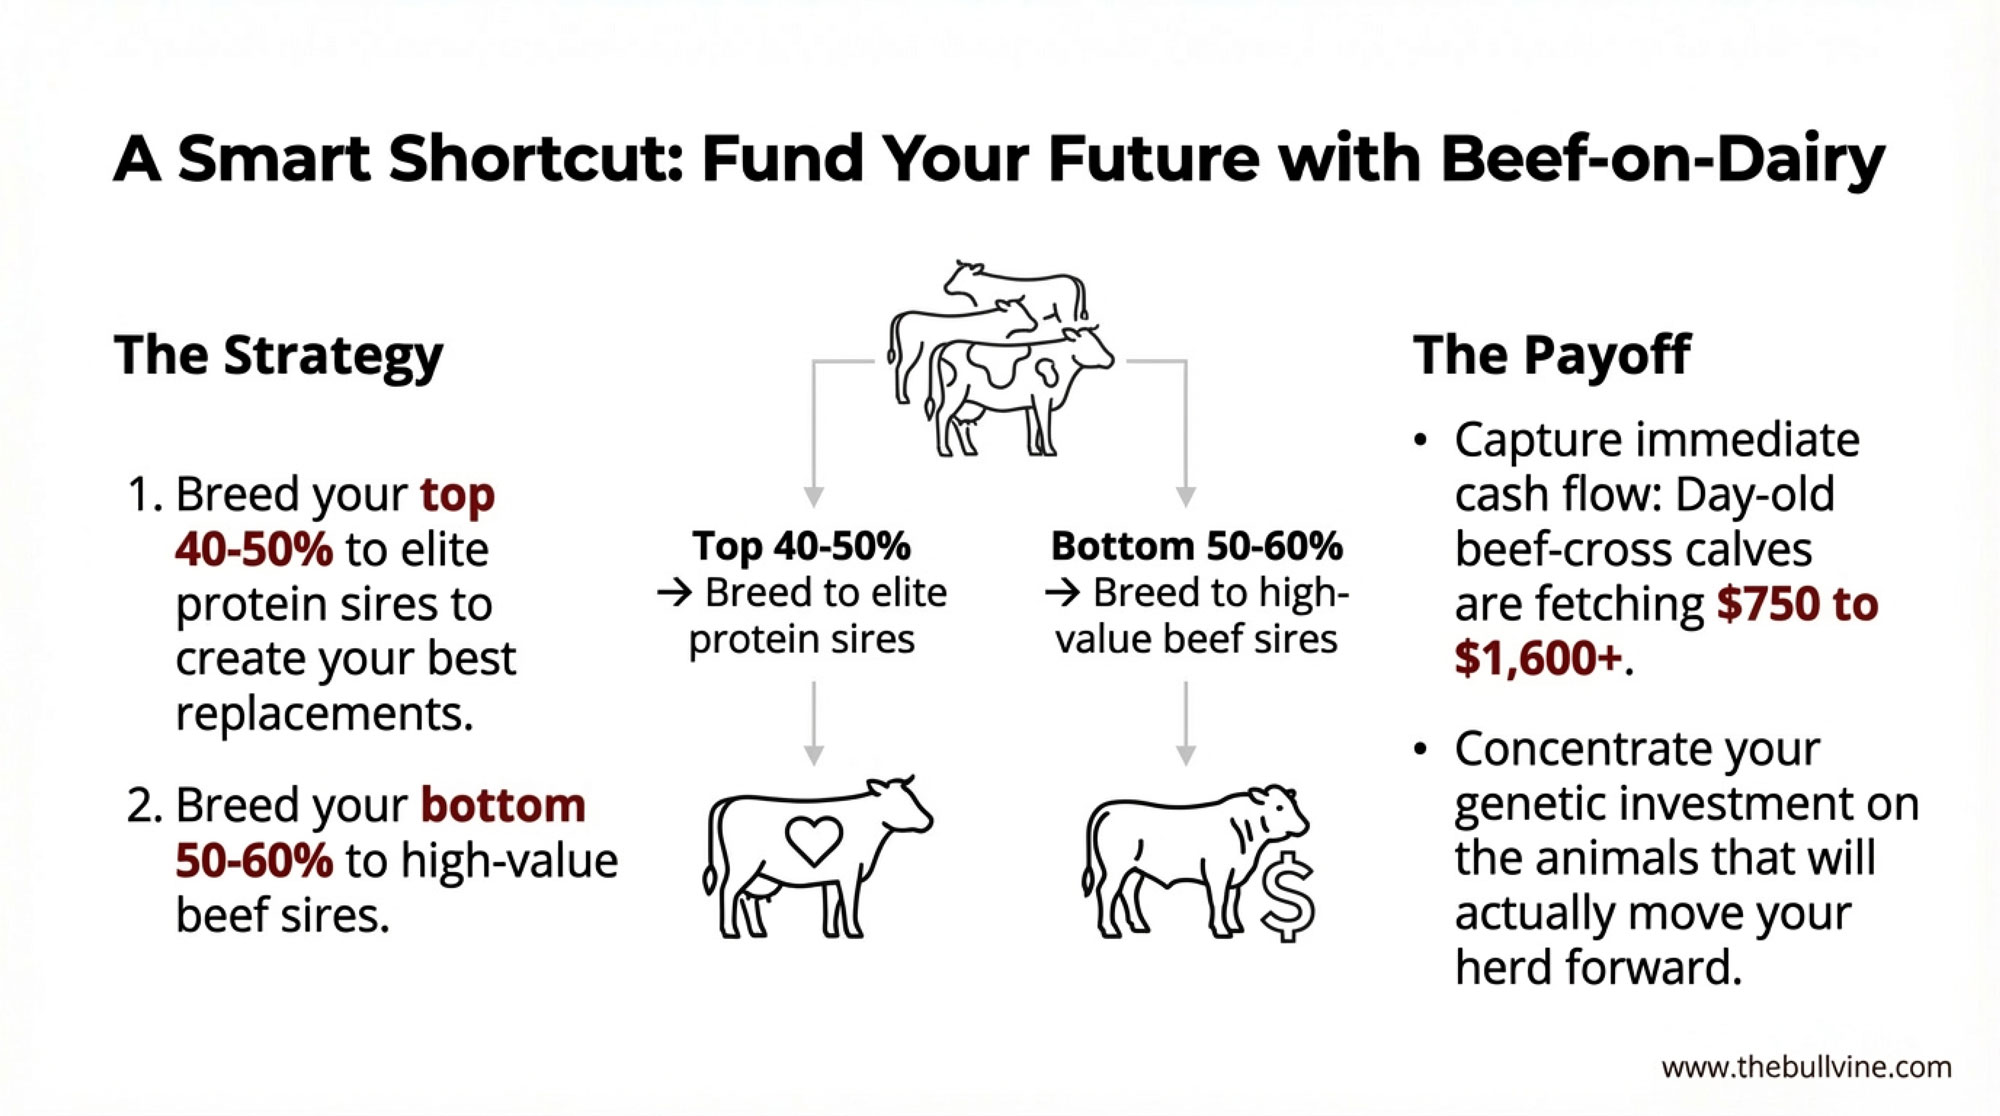
There’s strategic flexibility that comes with the current beef market. Beef-on-dairy calves have been commanding strong prices—industry reports from late 2025 show day-old beef-cross calves going for $750 to over $1,000 in many markets, with well-bred calves sometimes topping $1,600 depending on genetics and condition. Dairy Herd Management reported in August 2025 that Jersey beef-on-dairy calves were fetching $750 to $900 at day of birth, with the market remaining robust through the fall.

Some producers are using this strategically: breed your top 40-50% of the herd to high-protein dairy sires for replacements, and use beef semen on the bottom half. You capture immediate cash flow from beef calves while concentrating genetic improvement on animals that will actually move the herd forward.

A California producer I spoke with recently has been doing exactly this for three years. “It changed my whole approach to replacement decisions,” she said. “I’m more selective about which genetics I’m actually keeping in the herd, and the beef calves are paying their own way.”

It’s not the right approach for every operation, but it’s worth thinking through.

The Nutrition Bridge

Genetics determine the ceiling for what your cows can produce. Nutrition determines how close you get to that ceiling. And unlike genetics, nutrition interventions can show results within weeks.

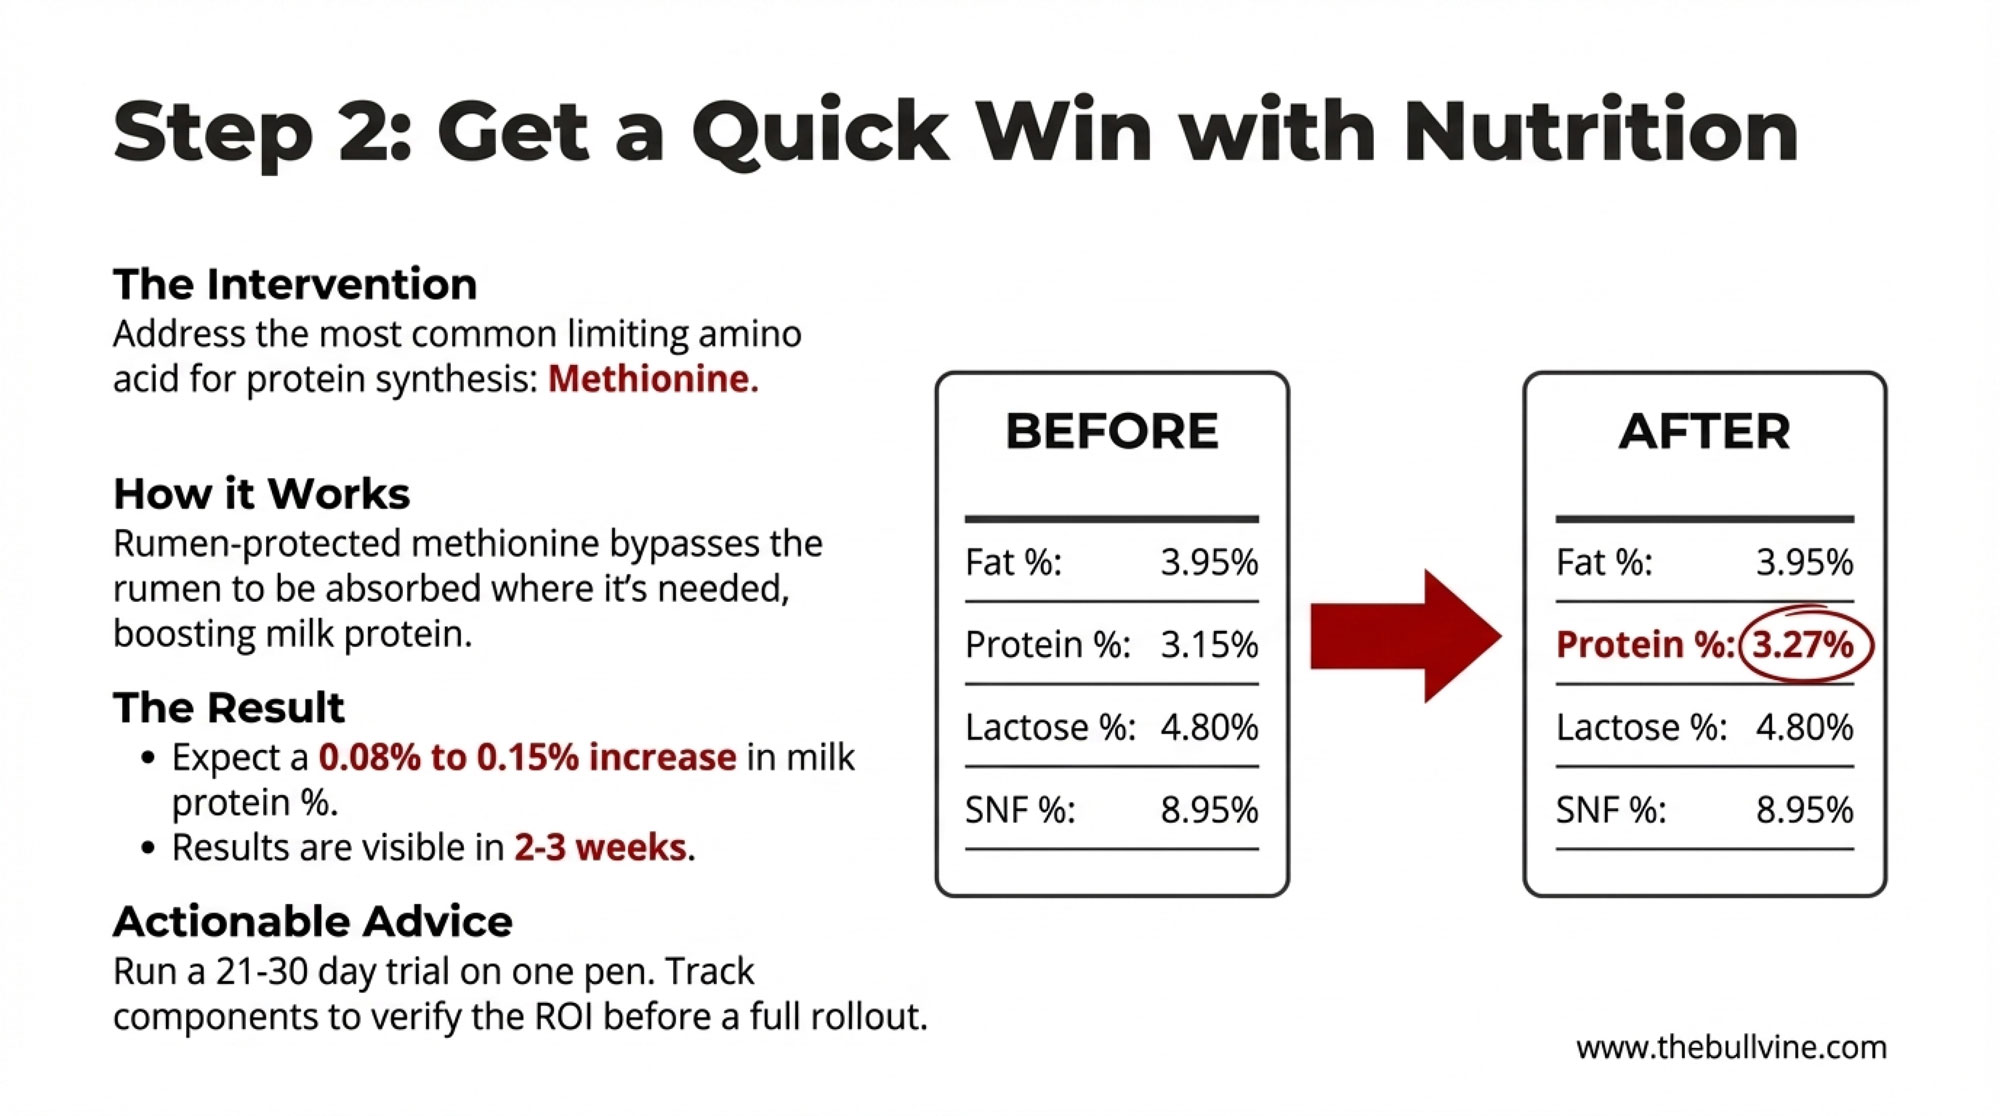
The most targeted intervention for protein production involves amino acid supplementation—specifically rumen-protected methionine.

The background: in typical U.S. dairy diets built around corn silage and soybean meal, methionine often becomes the limiting amino acid for milk protein synthesis. You can feed all the crude protein you want, but if the cow runs short on methionine, she can’t efficiently convert it to milk protein. The excess nitrogen gets excreted.

Rumen-protected forms of methionine—coated to survive rumen degradation—allow the amino acid to reach the small intestine, where absorption actually happens.

What the Research Shows

University trials—including work from Cornell, Penn State, and Wisconsin dairy extension programs—have demonstrated that rumen-protected methionine can boost milk protein percentage, often by 0.08% to 0.15% within 2 to 3 weeks of implementation. Results vary by herd and baseline diet, so verifying response on your own operation before committing fully makes sense.

Run a trial with one pen of mid-lactation cows for 21-30 days. Compare their component tests to a control group or their own pre-trial baseline. Work with your nutritionist on the economics—supplement costs, expected response, and whether it pencils at current protein prices. If you’re seeing the expected response, roll it out more broadly. If not, you haven’t invested much to find out.

One thing I’ve noticed, talking with nutritionists across the Midwest and Northeast, is that the response tends to be most consistent in herds that haven’t previously optimized their amino acid balance. If you’ve already been balancing for methionine and lysine, the incremental gain may be smaller. Fresh cows and early-lactation groups often show the most dramatic response, since that’s when protein synthesis is competing most with other metabolic demands during the critical transition period.

For a 500-cow herd seeing a 0.10-0.12% protein increase, that can translate to $8,750 to $15,000 annually in additional component value at current prices—often exceeding the supplement cost by a meaningful margin.

An additional benefit: because you’ve addressed the limiting amino acid, you may be able to reduce total ration crude protein slightly without sacrificing production. That can offset some or all of the supplement cost.

Processor Relationships

This dimension deserves more attention than it typically gets.

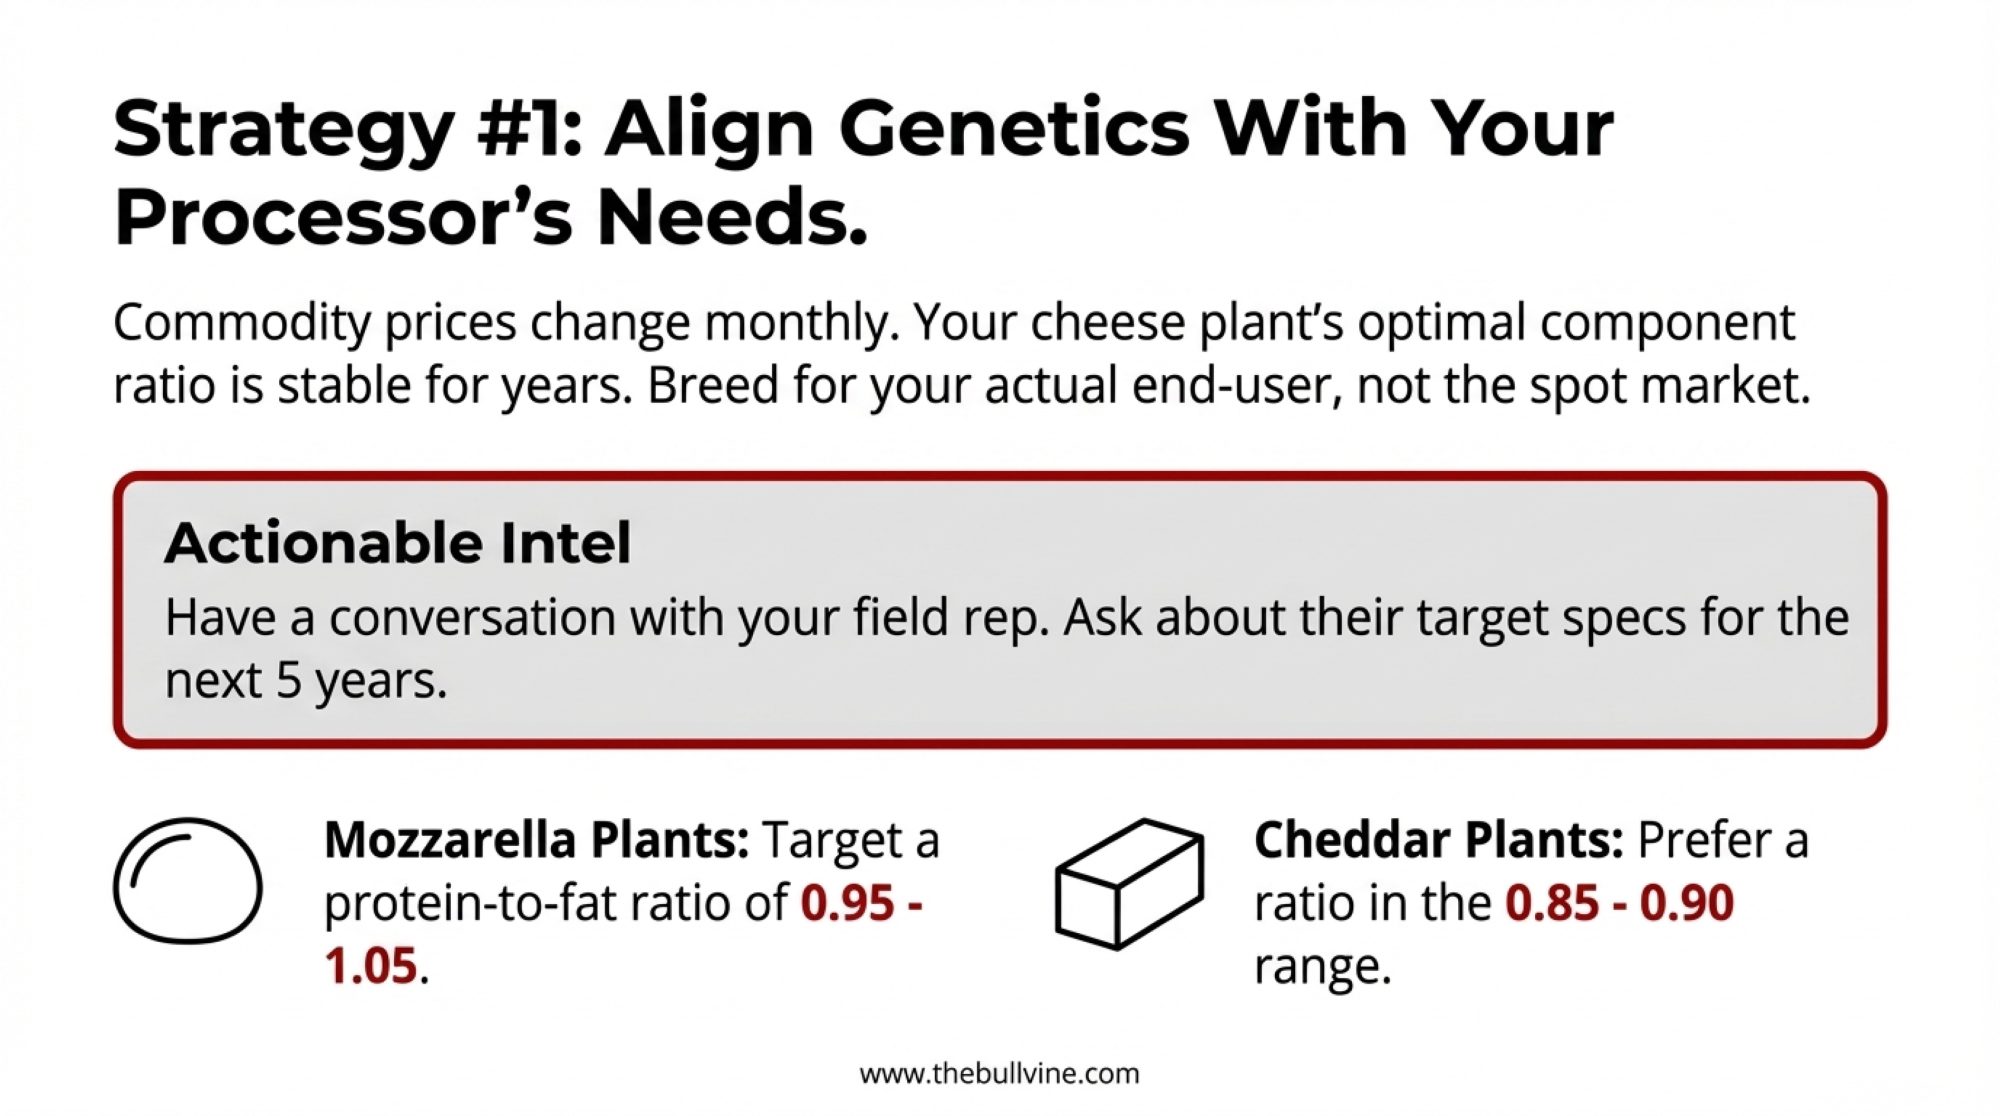
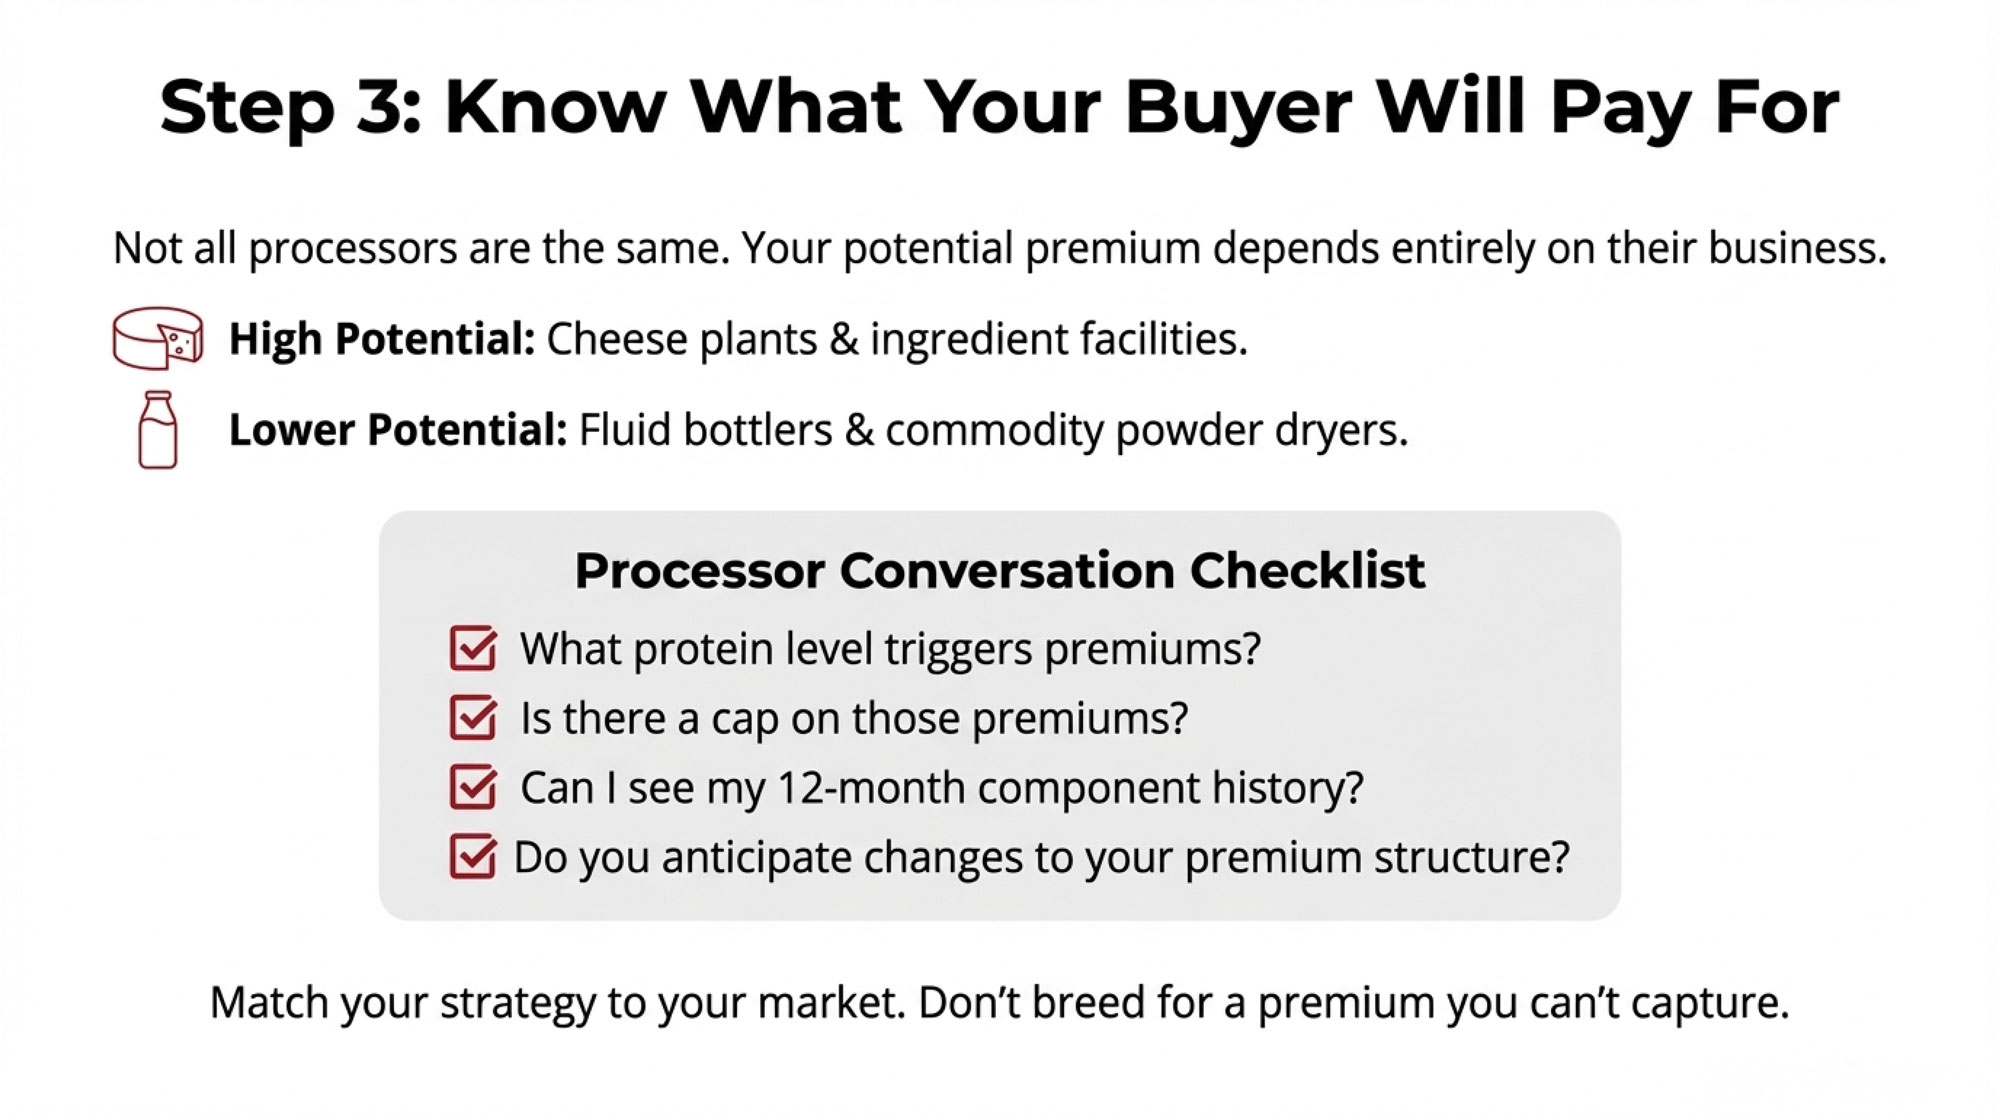
Not all processing facilities are equally equipped to capture the value of high-protein milk. Before making significant changes to your breeding program, it’s essential to understand what your buyer can actually afford.

Cheese plants—particularly the large cooperative facilities across Wisconsin’s cheese belt and specialty operations in California’s Central Valley—are generally the most straightforward. Higher protein concentration means more cheese per gallon processed. A plant can increase output without expanding capacity simply by sourcing higher-protein milk. Clear economic incentive exists to pay for it.

Processor TypeProtein ThresholdPremium per CWTAnnual Value (500 cows)
Commodity Powder PlantNo premium$0.00$0
Regional Cheese Co-op3.3%$0.50–$0.75$60,000–$90,000
Large Cheese Facility (WI)3.3%$1.00–$1.50$120,000–$180,000
Specialty Protein Plant3.35%$2.00–$3.00$240,000–$360,000
Direct Contract (High-volume)3.4%$3.00–$5.00$360,000–$600,000

Cheese plant managers I’ve spoken with confirm they’re actively seeking higher-protein milk supplies. One plant manager in central Wisconsin told me their facility has increased protein premiums twice in the past eighteen months, specifically to attract higher-component milk. “We’re competing for that milk now,” he said. “Five years ago, we weren’t having that conversation.”

What Premiums Actually Look Like

Processor premiums vary considerably by region and facility, but here’s what the market data shows: USDA Dairy Market News reports the average protein premium is around $1.25 per hundredweight above baseline. Some producers shipping to cheese-focused cooperatives report premiums in the $0.50 to $0.75/cwt range for modest improvements, while direct contracts with protein-hungry facilities can reach $3.00 to $5.00/cwt for milk consistently testing above 3.35% protein—though these premium contracts typically require volume commitments and consistent quality.

For a 500-cow herd producing 120,000 cwt annually, even a $0.50/cwt premium adds $60,000 to the annual milk check. At $1.00/cwt, that’s $120,000. The math quickly draws producers’ attention.

Ingredient and filtration plants making whey protein concentrates, milk protein isolates, and similar products also value protein highly. Operations in Idaho and across the West are specifically tooled to extract and monetize protein fractions. These facilities serve the growing functional nutrition market, including products for GLP-1 users.

Fluid milk bottlers and commodity powder dryers may have less ability to monetize elevated protein. If a bottler standardizing for the Southeast fluid market is already adjusting milk to regulatory specifications, excess protein beyond those specs doesn’t necessarily yield premium returns.

PROCESSOR CONVERSATION CHECKLIST

Download and bring to your next meeting with your milk buyer:

☐ Premium Structure

  • “What protein threshold triggers premium payments?”
  • “Is there a cap on protein premiums, or do they scale continuously?”
  • “How is the premium calculated—per point above threshold, or tiered brackets?”

☐ Testing & Verification

  • “How frequently is my milk tested for components?”
  • “Can I access my component test history for the past 12 months?”

☐ Plant Capabilities

  • “Does your plant have protein standardization capability?”
  • “What’s your target protein level for incoming milk?”

☐ Market Trends

  • “Are you seeing increased demand for high-protein products from your customers?”
  • “Do you anticipate changes to your premium structure in the next 12-24 months?”

☐ Contract Options

  • “Are direct premium contracts available for consistent high-protein suppliers?”
  • “What volume and consistency requirements would apply?”

Keep notes from this conversation—the answers should inform your breeding and nutrition decisions.

The answers might influence how aggressively you pursue protein genetics. If your buyer caps premiums at 3.3%, there is less incentive to push for 3.5%. If they’re paying meaningful premiums with no cap because they’re expanding ingredient production, that’s entirely different information.

A Decision Framework

Given this complexity, a framework for thinking through whether an aggressive protein pivot makes sense:

Consider aggressive protein focus if:

  • You ship to a cheese plant or ingredient facility
  • Your current herd averages below 3.25% protein
  • Your buyer explicitly pays protein premiums without caps
  • You have flexibility in your replacement strategy
  • Your herd health metrics are already solid

Consider a balanced approach if:

  • You ship to a fluid bottler or a diversified cooperative
  • Your herd already averages 3.3%+ protein
  • Your buyer caps protein premiums at a specific threshold
  • You’re still working on fertility or longevity genetics
  • You operate in a region with limited processor options

Consider maintaining the current strategy if:

  • Your processor has no protein premium structure
  • Switching buyers isn’t practical for your location
  • Your herd has significant health or fertility challenges to address first
  • You’re already at or above pool averages for both components

There’s no single right answer here. The key is matching your genetic strategy to your actual market circumstances.

Your Current SituationAggressive Protein FocusBalanced ApproachMaintain Current Strategy
Processor pays protein premiums?Yes, uncapped or high capYes, but capped at 3.3–3.4%No premium structure
Current herd protein averageBelow 3.25%3.25–3.35%Above 3.35%
Milk buyer typeCheese/protein plantDiversified co-opFluid bottler/powder plant
Herd health & fertility statusAlready solid (DPR >20%)Some challengesSignificant problems to fix first
Ability to switch processorsYes, within 50 milesLimited optionsLocked into current contract
Replacement strategy flexibilityCan use beef-on-dairyRaising most replacementsMust raise 100% replacements
Risk toleranceWilling to commit 3+ yearsModerateConservative
RECOMMENDATIONGo aggressive: aim for 3.4–3.5% proteinIncremental improvement: target 3.3–3.4%Focus on other profit drivers first

Regional Considerations

This analysis doesn’t apply uniformly across all operations and regions—something worth acknowledging.

Upper Midwest herds shipping to Wisconsin cheese plants are positioned differently than Southeast operations serving fluid markets. A 3,000-cow operation in the San Joaquin Valley faces different economics than a 100-cow farm in Vermont or a grazing dairy in Missouri.

Those shipping to cheese-focused cooperatives in Wisconsin and Minnesota have generally been tracking protein-to-fat ratios more closely—some for several years—and have adjusted breeding programs accordingly. In conversations with producers in these areas, I’ve repeatedly heard that neighbors who were initially skeptical are now asking about sire selections.

But producers in fluid-heavy markets often take a more measured approach. If your buyer can’t pay for high protein, breeding for a premium you can’t capture doesn’t make economic sense. Watching trends while maintaining flexibility is entirely reasonable.

Both perspectives make sense given their circumstances.

The fundamental trends—GLP-1 adoption, component pricing shifts, global protein demand—are real regardless of location. But how you respond depends on your specific situation: current herd genetics, processor relationship, cash flow position, and risk tolerance.

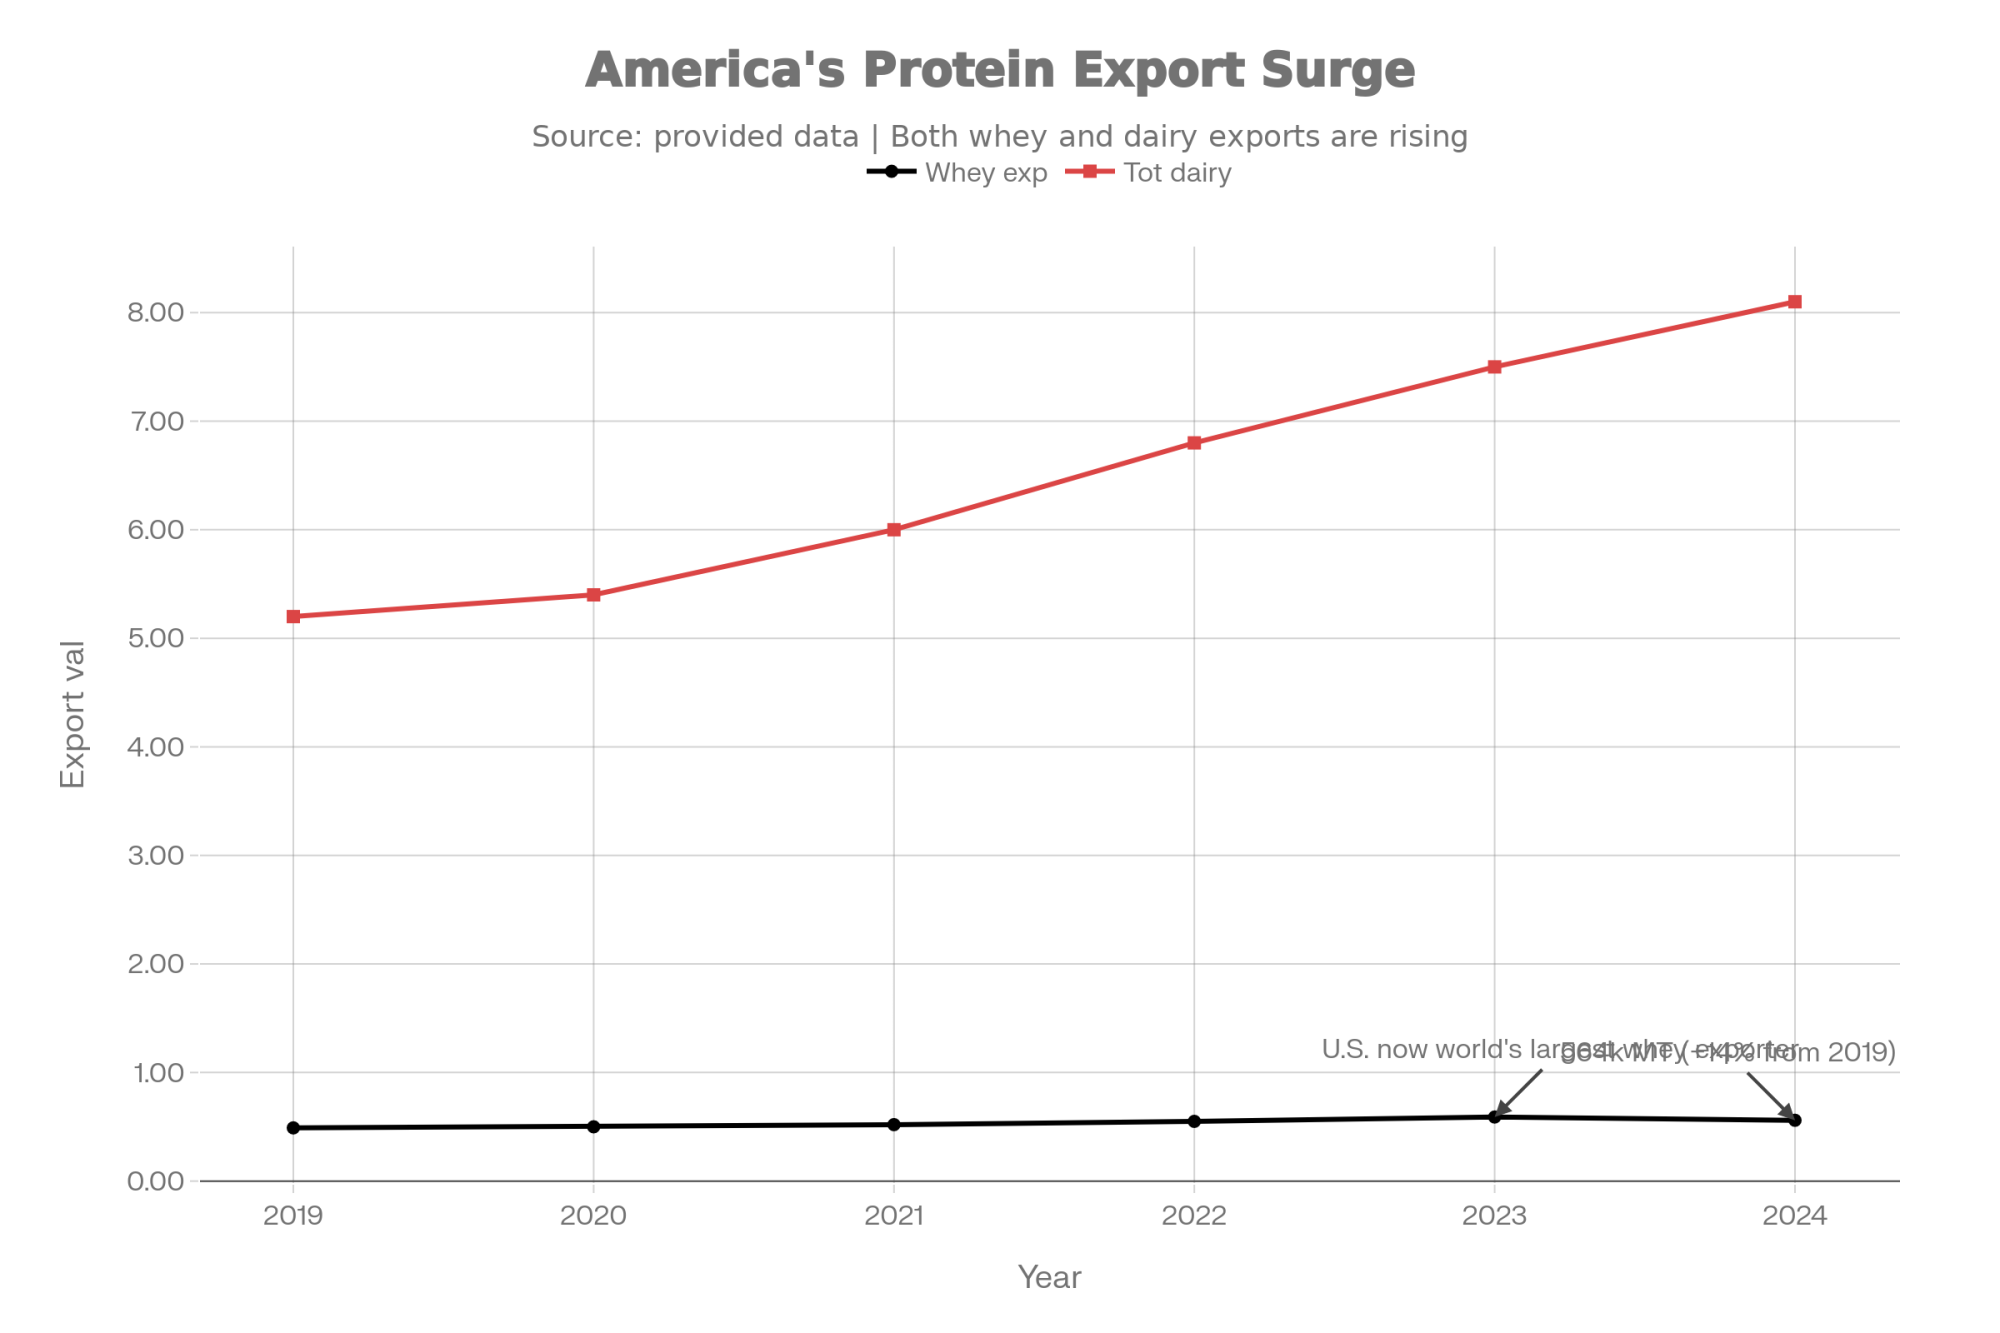
The Global Context: America’s Protein Export Opportunity

What’s happening domestically aligns with broader international patterns—and positions the U.S. dairy industry for a significant strategic shift.

New Zealand’s dairy industry—historically the world’s dominant dairy exporter—has hit production constraints. Environmental regulations capping nitrogen runoff have effectively frozen their national herd. Rather than competing for market share in commodity whole milk powder, they’ve pivoted toward high-value protein products.

According to a 2023 report from DCANZ and Sense Partners, protein products rose from 8.6% to 13.2% of New Zealand’s export mix between 2019 and 2023. DairyNZ reported that protein product exports increased 120% over that period, reaching $3.4 billion. That’s a deliberate strategic shift, not an accident.

Here’s what’s interesting for U.S. producers: we’re no longer just a dairy exporter—we’re increasingly becoming a protein exporter. According to the International Dairy Foods Association, U.S. dairy exports reached $8.2 billion in 2024, the second-highest level ever recorded. That’s a remarkable transformation. As IDFA noted in their February 2025 analysis, “After being a net importer of dairy products a decade ago, the United States now exports $8 billion worth of dairy products to 145 countries.”

The composition of those exports is shifting in telling ways. Brownfield Ag News reported in November 2025 that high-protein whey exports rose nine percent, led by sales to Japan. Farm Progress confirmed in July 2025 that “high-end whey exports continue to grow both in volume and value,” specifically noting that whey protein concentrates and isolates with 80% or more protein are driving the growth. According to the U.S. Dairy Export Council’s reference materials, the United States is now the largest single-country producer and exporter of whey ingredients in the world, with total whey exports reaching 564,000 metric tons in 2023—up 14% from 2019.

The industry is investing, and strong growth prospects have led to $8 billion in new processing plant investments set to increase production over the next two years. By mid-2025, nearly 20 million additional pounds of milk were flowing through new facilities, with much of that capacity focused on cheese—and the whey protein streams that come with it.

This matters for producers because U.S. dairy protein must increasingly meet global specifications. The U.S. Dairy Export Council has been working with the American Dairy Products Institute to develop industry standards for U.S. products and with the International Dairy Federation to develop worldwide technical standards. The National Milk Producers Federation prompted an investigation in 2025—through the U.S. International Trade Commission—into global competitiveness for nonfat milk solids, including milk protein concentrates and isolates.

Why does this matter at the farm level? Asian markets have evolved. China’s domestic milk production has grown, reducing the need for basic powder imports. What they’re purchasing now are specialized high-protein ingredients: lactoferrin for infant formula, protein isolates for clinical nutrition, functional ingredients for the growing urban fitness market.

With New Zealand capacity-constrained and the U.S. investing heavily in protein-processing infrastructure, there’s a genuine opportunity—but only if we’re producing what global buyers want. They’re not paying premium freight costs to import commodity milk. They want protein density that meets international quality standards. The farms supplying that milk are part of an increasingly export-oriented value chain, whether they realize it or not.

Balancing Opportunity and Risk

Any time someone presents a market opportunity, you should ask: “What if the assumptions don’t hold?”

Fair question.

What if the protein premium narrows?

It could happen. Processor capacity might expand. Consumer trends might shift. The protein-to-fat ratio could drift toward historical norms.

My thinking: even if protein premiums moderate, protein is unlikely to become less valuable than fat on a sustained basis. The fundamentals—bioavailability advantages, consumer demand for functional nutrition, processing economics—support continued protein value.

More importantly, breeding for combined solids rather than protein alone provides insurance. Bulls that improve both fat and protein percentages protect against shifts in the ratio. The market has never penalized producers for shipping high total solids. The risk is in low-component production, not in being wrong about which component the market favors most.

What if GLP-1 adoption plateaus?

Possible, but current trajectory suggests otherwise. These medications are being prescribed not just for weight loss but for diabetes management and cardiovascular protection. Insurance coverage is expanding. Pill formulations are entering the market. The user base appears to be institutionalizing rather than peaking.

But even setting GLP-1 aside, other demand drivers—aging populations seeking muscle preservation, fitness culture emphasizing protein intake, Asian markets wanting protein imports—remain intact.

Practical risk management approaches:

  • Use Net Merit (NM$) rather than extreme protein indexes for a balanced hedge
  • Maintain health and longevity trait minimums regardless of component goals
  • Keep some flexibility through beef-on-dairy rather than raising 100% of replacement heifers
  • Consider nutrition interventions (reversible) before genetic changes (permanent)
  • Monitor inbreeding coefficients when selecting heavily for protein traits

Practical Takeaways

Bringing this together into actionable items:

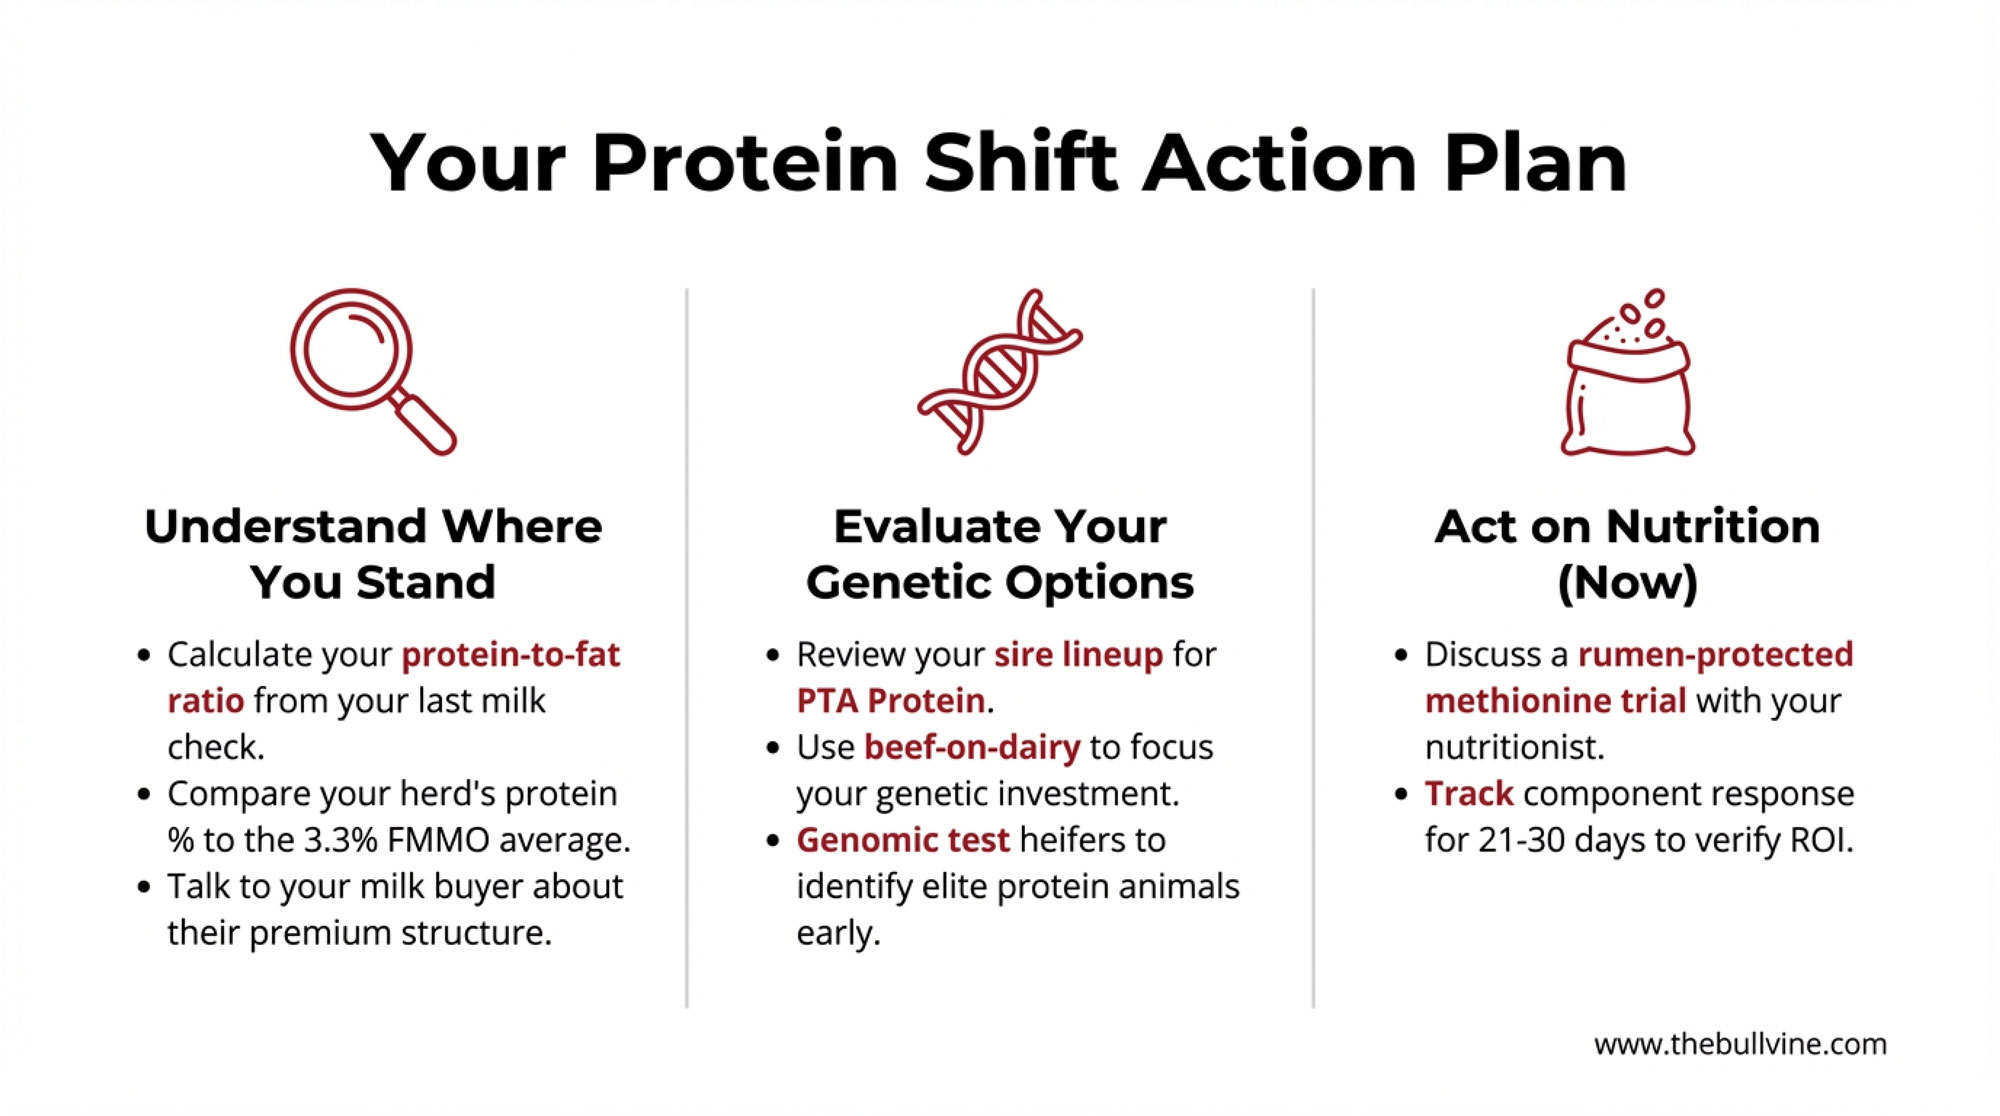
Understanding Where You Stand

  • Calculate the protein-to-fat price ratio from your last few milk checks
  • Compare your herd’s protein percentage to the Federal Order pool average (now 3.3%)
  • Have an explicit conversation with your milk buyer about protein premiums and thresholds

Evaluating Genetic Options

  • Review your current sire lineup for protein trait emphasis
  • Consider CM$ or updated NM$ rankings alongside traditional TPI
  • Set minimum thresholds for health and fertility traits before optimizing for components
  • Look for bulls positive in both protein percentage and protein pounds
  • Work with your AI rep on what makes sense for your herd
  • If you’re genomic testing heifers, use protein traits in your retention decisions
  • Monitor inbreeding levels when concentrating selection on protein traits

Near-Term Nutrition Interventions

  • Discuss rumen-protected methionine with your nutritionist
  • Consider a 21-30 day pen trial before full implementation
  • Track component response carefully to verify ROI on your operation
  • Pay particular attention to fresh cow and early lactation response

Timeline Expectations

  • Nutrition changes: visible results in 2-4 weeks
  • Genetic changes: first daughters milking in 3+ years
  • Spring 2026 breeding decisions will shape your 2029 bulk tank

Questions to Keep Asking

  • Does my processor have the infrastructure to pay for high-protein milk?
  • Am I positioned above or below the pool average for components?
  • What’s my risk tolerance for genetic strategy changes?
  • Am I tracking the protein-to-fat ratio, or just looking at absolute prices?

The Bottom Line

The dairy industry has navigated plenty of transitions over the decades. What makes this moment noteworthy is the convergence of forces—pharmaceutical, demographic, and economic—pointing in a consistent direction.

I’m not predicting that butterfat will become worthless or that every operation needs to overhaul its breeding program immediately. What I am suggesting is that assumptions many of us have operated under for the past decade deserve fresh examination.

The market is sending signals. Processors are paying premiums for protein that would have seemed unusual five years ago. Consumer demand is shifting in ways that favor nutrient density over volume. Global buyers are seeking protein ingredients, not commodity powder. And American dairy is increasingly positioned as a global protein exporter, not just a domestic commodity producer.

The combined opportunity is real. For a 500-cow herd that optimizes nutrition, adjusts genetic selection, and captures processor premiums—we’re talking $50,000 to $97,500 annually in additional value. That’s not theoretical. It’s math based on current market conditions and achievable improvements.

Producers who take time to understand these dynamics—and thoughtfully evaluate what they mean for their specific operations—are well positioned. Those who assume the old rules still apply may find themselves wondering why neighbors’ milk checks look different.

This isn’t about chasing trends. It’s about recognizing when fundamental market structures are shifting and responding accordingly. For some operations, that response might be modest adjustments. For others, more significant changes might make sense. Either way, understanding what’s actually happening is the essential first step.

That protein-to-fat ratio on your milk check? It’s telling you something. 

Complete references and supporting documentation are available upon request by contacting the editorial team at editor@thebullvine.com.

Learn More

Join the Revolution!

Join over 30,000 successful dairy professionals who rely on Bullvine Weekly for their competitive edge. Delivered directly to your inbox each week, our exclusive industry insights help you make smarter decisions while saving precious hours every week. Never miss critical updates on milk production trends, breakthrough technologies, and profit-boosting strategies that top producers are already implementing. Subscribe now to transform your dairy operation’s efficiency and profitability—your future success is just one click away.

NewsSubscribe
First
Last
Consent

40% Muscle Loss in 60 Days: The Genetic Time Bomb Hiding in Your Fresh Pen

She’s milking 110 lbs. Ketones perfect. Appetite strong. She’s also lost 40% of her muscle and won’t breed back. You just can’t see it yet.

EXECUTIVE SUMMARY: While you’re watching ketones and body condition, your best cows are quietly losing up to 40% of their muscle—and you can’t see it happening. Fat bounces back by 90 days in milk. Muscle doesn’t recover until 240-270 days, if at all. That gap explains a lot: the silent ovaries, the infections that won’t clear, the early culls you blamed on bad luck. Worse, Purdue research shows your highest-genetic cows mobilize the hardest—we may have spent 40 years breeding cows programmed to destroy themselves for peak milk. Rumen-protected amino acids and late-lactation nutrition buffer the damage—but don’t fix the genetics. The real question: are we willing to weight DPR, Livability, and persistency heavily enough to breed cows that last 4-5 lactations instead of 2.5?

Dairy Cow Muscle Mobilization

New research reveals that high-producing cows can lose up to 40% of their muscle depth in early lactation. The uncomfortable question: have decades of selection created cows genetically programmed to cannibalize themselves?

If you’ve spent any time around transition cows, you know the routine. Monitor ketones. Watch body condition. Keep an eye on feed intake. Over the past couple of decades, we’ve gotten pretty good at spotting the fat mobilization crisis—you know, the ketotic cow with acetone breath and a twisted stomach brewing.

But here’s what’s been hiding in plain sight: while we’ve been laser-focused on fat, our cows have been quietly drawing down something else entirely. Their muscle.

Recent work coming out of Purdue University, led by Dr. Jackie Boerman and her team, has documented something that should give us all pause. According to their research database, high-yielding cows routinely mobilize 30% to 35% of their longissimus dorsi muscle depth—that’s your ribeye area—within the first 60 days of lactation. And in some cases, cows can lose up to 40% of that muscle depth during this window.

Here’s the part that should make every breeder uncomfortable: unlike fat, which starts coming back around 60-90 days in milk, muscle mass often doesn’t rebuild until 240-270 days in milk. Sometimes not at all.

And the cows doing this most aggressively? Your highest genetic merit animals.

Let that sink in for a minute.

The Breeding Question Nobody Wants to Ask

Let’s cut to the chase here. We’ve been selecting hard for peak milk yield and feed efficiency for decades—really since the early 1980s when the Holstein boom took off. Both traits have value. Nobody’s disputing that.

But here’s the uncomfortable reality the research is now exposing: a cow can score high on “efficiency” simply by aggressively mobilizing her own body tissue. She looks efficient on paper because her own reserves aren’t counted as an input.

Think about what that means. We may have spent 40 years selecting for cows willing to destroy themselves to make milk.

The data from Lactanet tells the story pretty clearly. The average Canadian Holstein cow born in 1975 produced 6,907 kg of milk. By 2017, that number had climbed to 12,468 kg. That’s remarkable genetic progress by any measure. But here’s the flip side—productive lifespan has moved in the opposite direction, declining from about 3.5 lactations in 1970 to somewhere between 2.5 and 3.0 today, according to research compiled by Lohmann Breeders.

Now, to be fair, some exceptional operations have achieved 4+ lactation averages even with high-production genetics—but they’re the exception rather than the rule, and they’ve typically invested heavily in the nutritional and management strategies we’ll discuss later. For most herds, the inverse relationship between genetic milk potential and productive lifespan remains stubbornly real.

Studies published in Animals comparing “high muscle” cows (greater than 5cm longissimus dorsi depth at calving) with “low muscle” cows found something that should stop breeders in their tracks. High-muscle cows—your genetically superior animals with the capacity for massive production—actually begin mobilizing before calving even happens. They lose more total muscle in absolute terms. They produce significantly more milk in early lactation. And then they crash harder reproductively.

The cows with lighter frames? More metabolically conservative. Lower peaks, but they hold together longer.

Dr. Kent Weigel, who chairs the Department of Animal & Dairy Sciences at the University of Wisconsin-Madison and has worked extensively on dairy cattle selection indexes, has noted that traits such as Daughter Pregnancy Rate and Livability serve as indirect proxies for metabolic robustness. A cow with high DPR maintained her reproductive function while producing milk. A cow with high Livability survived multiple lactations, which require maintaining body reserves over time.

It’s worth noting that Scandinavian breeding programs recognized this connection earlier than most. Countries like Sweden and Denmark have emphasized health, fertility, and longevity traits in their selection indexes for decades—and their herds show it in productive lifespan numbers that consistently exceed North American averages.

Here’s the call to action for those of us making breeding decisions: If you’re still selecting primarily on milk and type while treating DPR and Livability as afterthoughts, you may be actively breeding for metabolic fragility. Every 500 pounds of additional milk potential means nothing if that cow burns out after 2.5 lactations—which is exactly where the U.S. average sits.

The cow of 2030 needs to look different than the cow we’ve been chasing. A bit more substance. A bit less extreme “dairy character.” Flatter lactation curves. And 4-5 profitable lactations instead of a spectacular peak followed by an infertility cull.

It’s achievable. Some of the herds are already there. The question is whether the rest of us are willing to shift our thinking.

Why Muscle Matters More Than Most Realize

For a long time—and I was guilty of this too—we’ve thought about skeletal muscle as structural tissue. Important for getting the cow from the freestall to the feed bunk, sure, but not really central to the metabolic challenges of early lactation. That thinking is outdated.

What’s becoming clear from recent research is that muscle tissue pulls triple duty during lactation. It serves as the cow’s amino acid reservoir, providing the building blocks for milk protein synthesis when dietary intake can’t keep pace with demand. It’s also the primary site for insulin-mediated glucose uptake, which matters enormously during that naturally insulin-resistant state after calving. And here’s something that often surprises people: muscle stores glutamine—the primary fuel source for immune cells fighting infection.

Dr. Boerman put it well in a recent presentation at the American Dairy Science Association annual meeting—she essentially said we need to stop thinking about muscle as “meat” and start thinking about it as a metabolic organ. It’s not just structural. It’s actively regulating the cow’s entire metabolic response to lactation.

When a cow strips 40% of that organ in 60 days, you can imagine what follows.

What Body Condition Scoring Actually Misses

Here’s something worth considering, and you may have noticed this yourself if you’ve been paying close attention: our standard monitoring tools weren’t designed to catch muscle loss.

Body Condition Scoring primarily measures subcutaneous fat cover. That’s what it was built to do, and it does that job reasonably well. But a cow can maintain an acceptable BCS of 3.0 while losing significant muscle mass underneath. The visual “dairy character” many of us associate with high production—those sharp spines, prominent hip bones, angular frames—may sometimes reflect muscle depletion rather than optimal metabolic efficiency.

I’ve been thinking about this a lot lately. We may have been confusing a coping mechanism with a desirable trait for decades.

Tools that actually measure muscle status:

Research teams are using ultrasound imaging of the longissimus dorsi at the 12th/13th ribs to track changes in muscle depth over time. Blood biomarkers like 3-methylhistidine indicate active muscle breakdown, while creatinine levels reflect total muscle mass. Even milk protein percentage—when it drops below 2.9-3.0% in early lactation—can signal amino acid deficiency and excessive tissue mobilization.

These tools remain primarily in research settings for now, though some veterinary practices are beginning to explore on-farm ultrasound protocols. That’s worth watching.

Two Cows, Two Outcomes: A Fresh Pen Scenario

Let me paint a picture that might feel familiar.

You walk into your fresh pen, 6 AM. Two cows calved about 20 days ago and are now penned side by side.

Cow A is obvious. She’s off feed, dull, and head drooping. Her ketone strip reads 2.8. Clinical ketosis, maybe a DA brewing. Everyone notices her. Treatment starts immediately. This cow is asking for help.

Cow B looks like your star. She’s bright, aggressive at the bunk, already milking 110 pounds, and climbing. Ketone strip reads 0.6, perfect. She appears to be crushing it.

But look closer at her topline. Three weeks ago, there was a firm shelf of muscle along her spine. Today, your fingers slide right down the side. The shelf has collapsed. Her ribs are more visible, her frame more angular.

She’s not showing ketosis because she’s burning protein, not just fat. Muscle catabolism produces glucose precursors that actually prevent ketone formation. She’s destroying her metabolic reserves while every standard metric says she’s fine.

Monitoring MetricCow A – Clinical Ketosis (Everyone Notices)Cow B – Hidden Muscle Crisis (Looks Perfect)
Ketones (mmol/L)2.8 (HIGH)0.6 (normal)
Body Condition Score2.53.0
Milk Yield (lbs/day)75110
Milk Protein %3.22.8 (red text)
Muscle Depth (cm)4.83.2 (40% loss) (red text)
Reproductive Status at 100 DIMNormal cycle expectedNo cycle – infertility cull (red text)

The consequences show up 80-100 days later when she fails to cycle and gets flagged as an infertility cull. And nobody connects it back to the fresh pen—or to the genetics that programmed her to spend herself this way.

Signs Worth Watching For in Fresh Cows

  • Milk protein percentage dropping below 2.9% in the first 30 DIM
  • Topline softening along the spine despite adequate body condition scores
  • High-producing cows failing to show heat by 80-100 DIM
  • Persistent low-grade infections (mastitis, metritis) that won’t fully clear
  • Angular appearance developing more rapidly than expected post-calving
  • Strong peak production followed by a steep, early decline

The Fertility and Immune Connection

This is where the research gets really practical, and honestly, it’s the part that convinced me this topic deserves more attention than it’s been getting.

Work published in the journal Animals back in 2022—a study by Schäff and colleagues that tracked 500 lactations across three commercial UK herds—found that cows experiencing excessive muscle tissue mobilization took significantly longer to resume ovarian cyclicity and had extended intervals to first service. Moderate muscle loss—around 1.5 to 5mm reduction in muscle diameter—was actually associated with optimal reproductive outcomes. It’s the excessive losses, more than 8mm reduction, that correlated with delayed return to fertility.

From a physiological standpoint, reproduction is what biologists call a “luxury” function. When a cow’s body is under severe metabolic stress, the signal is clear: conditions aren’t ideal for supporting a pregnancy.

The immune connection matters too. Immune cells are voracious consumers of glutamine—they use it as fuel to replicate and mount an immune response. Skeletal muscle is the body’s primary site for glutamine storage. When a fresh cow mobilizes muscle too aggressively, she may run short of glutamine for her immune system while the mammary gland simultaneously demands it for milk protein synthesis. Research published in the Journal of Dairy Science found that glutamine supplementation during the transition period improved immune cell function and reduced infection severity.

The practical takeaway: Cows leaving the herd for “infertility” may not have inherent reproductive problems at all. Their bodies have simply entered protein-conservation mode. And stubborn SCC problems or persistent metritis? The ration’s amino acid balance—and the cow’s genetic programming for tissue mobilization—may be part of the picture.

Every cow that fails to breed back at 100 DIM is a decision point—fix her nutrition, change her genetics, or make beef-on-dairy work for you. With week-old beef crosses commanding premium prices and replacement heifers running $2,600-3,000+, that infertility cull calculation has shifted. But here’s the thing: relying on beef-on-dairy to bail out your reproduction program isn’t a long-term strategy. It’s a symptom that something upstream needs fixing.

Financial Metric (500-Cow Dairy)Current Reality: 2.5 Avg LactationsAchievable: 4.0 Avg LactationsYour Farm’s Opportunity
Annual Replacement Rate40%25%-15 percentage points
Cows Replaced per Year200125-75 cows
Annual Replacement Cost$560,000$350,000-$210,000/year
5-Year Replacement Cost$2,800,000$1,750,000-$1,050,000
Reproduction Culls (5 years)250 cows100 cows-150 fewer culls
Lost/Gained Milk Revenue-$600,000 (lost)+$990,000 (gained)$1,590,000 swing
TOTAL 5-YEAR IMPACT$3,400,000 (total cost)$760,000 (net cost)$2,640,000 SAVED

The Recovery Timeline: Fat vs. Muscle

This is what keeps nutritionists up at night. At calving, your cow has both a fat reserve and a muscle reserve. Both start depleting immediately—but their recovery paths couldn’t be more different.

TimelineFat ReserveMuscle Reserve
Days 0-60Heavy mobilizationHeavy mobilization (30-40% loss)
Days 60-90Hits nadir, starts recoveringStill depleted, no recovery
Days 90-200Continues rebuilding; BCS improvesRemains at nadir; cow looks healthy, but chassis is stripped
Days 240-270Fully recoveredFinally begins meaningful recovery
Day 305NormalMany cows still haven’t returned to pre-calving depth

If a cow enters each successive dry period with less metabolic reserve than before, you’re looking at a cumulative deficit that compounds across lactations. That’s not just a nutrition problem. That may be a genetic trajectory toward early culling.

Nutritional Strategies That Buy Time

The encouraging news in all of this: nutritional intervention can meaningfully reduce muscle mobilization. It won’t change the underlying genetics, but it can buffer against the damage.

Close-Up Dry Cow Nutrition (21 Days Pre-Calving)

This is your highest-leverage intervention point. What happens in these three weeks before calving sets the trajectory for everything that follows.

The goal is a “controlled-energy, high-protein” approach. You want a high-fiber, high-bulk diet that keeps the rumen full and prevents over-conditioning. But—and this is critical—you also want a high metabolizable protein supply, not just crude protein.

Rumen-protected amino acids, particularly methionine and lysine at a 3:1 lysine-to-methionine ratio (a target well-established in the research literature, including foundational work by Dr. Chuck Schwab at the University of New Hampshire), give the cow a “labile protein reserve” she can draw on immediately post-calving. Think of it as preloading her checking account so she doesn’t have to raid her savings account.

ComponentTypical Close-UpMuscle-Supportive Close-Up
Crude Protein14%14%
Metabolizable Protein1,000-1,100g/day1,300-1,400g/day
Rumen-Protected Methionine0g15-20g
Rumen-Protected LysineVariableBalanced to a 3:1 ratio
Energy DensityOften too highControlled (0.65-0.68 Mcal/lb NEL)

Fresh Cow Adjustments

If you’re seeing signs of excessive muscle mobilization in your fresh pen, here are some starting points:

Add rumen-protected methionine. Target 15-20 grams per cow daily. This is typically the first-limiting amino acid and has a meaningful impact on reducing tissue mobilization.

Increase rumen-undegradable protein (RUP) sources. Blood meal, heat-treated soybean meal, or commercial bypass protein blends provide amino acids that reach the small intestine directly.

Include glucogenic precursors. Propylene glycol, calcium propionate, or well-processed corn provide glucose precursors that reduce the need for the cow to convert her own amino acids into glucose.

Late Lactation: The Overlooked Rebuilding Window

Here’s where many herds have an opportunity, and I’ll admit I’ve been guilty of overlooking this myself in the past.

The 200 DIM to dry-off window is really the only opportunity your cows have to rebuild muscle before the next lactation. If you’re putting late-lactation cows on minimal rations to reduce costs, you may be setting them up to fail next time around.

Target at least 85-90% of your fresh cow ration’s amino acid density in late lactation, even as energy drops. The cow doesn’t need as many calories at 250 DIM, but she still needs the building blocks to rebuild tissue.

Questions Worth Asking Your Nutritionist

  • “What’s our close-up ration’s metabolizable protein supply—not just crude protein percentage?”
  • “Are we meeting the 3:1 lysine-to-methionine ratio in our fresh cow diet?”
  • “What’s our fresh pen average milk protein percentage at 30 DIM?”
  • “What bypass protein sources are we using, and what’s our RUP percentage?”
  • “How does our late-lactation ration compare to our fresh cow ration on amino acid density?”

The Economics

Yes, this adds cost. Here’s the math.

The Investment (Fresh Period, 0-30 DIM):

  • Rumen-protected methionine: $0.30-0.36 per cow/day
  • Propylene glycol or glucose support: $0.40 per cow/day
  • Bypass protein premium: $0.15 per cow/day
  • Total: roughly $0.85 per cow/day ($25 per cow for 30 days)

The Potential Returns:

Fertility: University of Kentucky research indicates each day open beyond 100 DIM costs somewhere in the $2-5 range, though this varies significantly by herd. One fewer cycle open—21 days—often pays back the investment multiple times over.

Reduced culling: Replacement heifers are running $2,600-3,000+ according to USDA 2025 data, with premium animals fetching $4,000+ at auction. Preventing even a few infertility culls on a 500-cow dairy can dramatically change the economics.

Milk protein: Here’s where the market is shifting in ways that make this conversation even more relevant. With GLP-1 weight-loss drugs like Ozempic and Wegovy driving consumer demand toward high-protein dairy products, protein premiums are strengthening. Whey protein isolate hit record prices above $8.50 per pound in late 2024, and that demand is trickling back to the farm gate. In component-pricing markets, Wisconsin producers shipping 3.4% protein are capturing roughly $0.40-0.50 more per hundredweight than their 3.0% neighbors—and that gap adds up fast across a year’s production. Cows that can maintain milk protein above 3.0% while preserving body reserves become doubly valuable—they’re capturing today’s premiums while staying in the herd long enough to keep doing it.

With FMMO modernization now finalized—USDA’s January 2025 rule updates skim milk composition factors to 3.3% protein effective December 2025, up from the 3.1% standard that’s been in place since 2000—the cows that can maintain 3.2%+ protein while staying fertile become strategic assets. The new formula better reflects current milk composition and amplifies the protein’s relative value at the farm gate.

The Big Math: What 2.5 vs. 4.0 Lactations Actually Costs

Let’s run the numbers for a 500-cow dairy over five years. This is the calculation that changes how you think about breeding decisions.

Scenario A: 2.5 Average Lactations (Current U.S. Average)

  • Annual replacement rate: 40% (200 cows/year)
  • Replacement heifer cost: $2,800 average
  • Annual replacement cost: $560,000
  • 5-year replacement cost: $2,800,000
  • Cows culled for reproduction failure (est. 25% of culls): 250 cows over 5 years
  • Lost production from early exits: ~12,000 lbs/cow potential × 250 cows = 3 million lbs
  • At $20/cwt: $600,000 in lost milk revenue

Scenario B: 4.0 Average Lactations (Achievable with intervention)

  • Annual replacement rate: 25% (125 cows/year)
  • Replacement heifer cost: $2,800 average
  • Annual replacement cost: $350,000
  • 5-year replacement cost: $1,750,000
  • Reproduction culls reduced by 60%: 100 cows over 5 years
  • Additional lactations captured: 150 cows × 1.5 extra lactations × 22,000 lbs = 4.95 million lbs
  • At $20/cwt: $990,000 in additional milk revenue

The 5-Year Difference:

  • Replacement cost savings: $1,050,000
  • Additional milk revenue: $990,000 (conservative)
  • Total advantage: Over $2 million per 500 cows over 5 years

That’s $400,000 per year—or $800 per cow annually—that separates the 2.5-lactation herd from the 4.0-lactation herd. And this doesn’t include reduced veterinary costs, fewer fertility treatments, better genetic progress from keeping your best cows longer, or the component premiums from cows that maintain protein percentage.

The Breeder’s Dilemma

Here’s where we need to be honest with ourselves about what we’re doing with our mating decisions.

Nutrition can buffer against aggressive tissue mobilization. Good management can catch problems earlier. But neither changes the fundamental genetic programming that’s telling your highest-merit cows to destroy themselves for peak production.

Research from Dairy Global has documented this connection pretty clearly: “Long-term genetic selection for high-yielding cows with increased productivity and calving intervals showed to increase susceptibility to metabolic diseases, including mastitis and lameness.” And work from the University of Melbourne found a negative association between thermotolerance and production traits—another dimension of the same problem.

A hard look at current index construction:

The April 2025 Net Merit revision tells an interesting story about industry priorities. According to CDCB, the updated NM$ assigns 31.8% to fat and 13.0% to protein—roughly 45% to production components. Productive Life, meanwhile, dropped from 11.0% to just 8.0%. Feed Saved increased to 17.8%, which sounds good until you remember that “efficiency” can be achieved by aggressive tissue mobilization.

That ratio may need recalibration if research on muscle mobilization and genetic predisposition holds true. We’re weighting production nearly six times heavier than the cow’s ability to stay in the herd—and wondering why average herd life sits at 2.5 lactations. The math doesn’t lie.

Selection considerations that matter now:

  • Weight DPR and Livability heavily, even if it means accepting modestly lower predicted milk
  • Look at lactation persistency, not just peak yield—a cow that peaks at 110 and holds 95 beats one that peaks at 140 and crashes
  • Consider “strength” traits in type evaluation—chest width and loin strength reflect metabolic capacity, not just appearance
  • Question whether 2.5 lactations is acceptable when genetics exist for 4-5

The question isn’t whether we can keep propping up metabolically fragile cows with expensive interventions. The question is whether we should be breeding them in the first place.

The Bottom Line

None of this changes the fundamentals of transition cow management. Fat mobilization and ketosis prevention remain critically important. But addressing only half of the metabolic equation has contributed to the fertility challenges, cull rates, and shortened productive lives that frustrate operations everywhere.

The research is telling us something uncomfortable: we may have optimized for the wrong things. Peak milk and extreme dairy character came at a cost we’re only now measuring—in muscle depth, immune function, fertility, and herd life.

What’s encouraging is that the tools are available. Nutritional interventions exist. Better genetic selection criteria are documented. Some herds are already proving that 4+ lactation averages are achievable. The knowledge is in the literature and is increasingly being applied in the field.

The cows are telling us something with their disappearing toplines and their silent ovaries. The data is confirming what they’ve been communicating for years.

The genetics we choose next will determine whether we keep selecting for metabolic time bombs—or start breeding cows built to last.

That choice is ours.

Where to Start Based on Your Situation

  • If you’re culling 25%+ for infertility, Start with a close-up ration protein audit. Check the metabolizable protein supply and amino acid balance before blaming reproduction protocols.
  • If you’re a 1,000+ cow operation: Consider piloting an ultrasound monitoring protocol with your vet on a subset of fresh cows. Track muscle depth at calving and 60 DIM to quantify what’s actually happening in your herd.
  • If you’re making breeding decisions this month: Pull your last 12 months of cull data. Calculate what percentage is left for reproduction failure before the third lactation. That number should inform how heavily you weight DPR and Livability going forward.
  • If beef-on-dairy is bailing out your cull revenue: That’s fine for now—but recognize it’s a symptom, not a solution. The cows generating those beef-cross premiums are the same ones failing to breed back. Fix the upstream problem.

For more information on transition cow protein metabolism, see Dr. Jackie Boerman’s research publications through Purdue University’s Department of Animal Sciences, or contact your regional dairy extension specialist.

KEY TAKEAWAYS

  • 40% muscle loss in 60 days—invisible to standard monitoring. Your fresh cows are cannibalizing muscle, while ketones and BCS read normal
  • Fat bounces back. Muscle doesn’t. Fat recovers by 90 DIM; muscle takes 240-270 days. That’s 8 months of hidden metabolic deficit
  • Your highest-genetic cows mobilize hardest. The same genetics driving 110-lb peaks are programming aggressive self-destruction
  • Nutrition buffers the damage but doesn’t fix it. Rumen-protected methionine (15-20g/day) and late-lactation amino acids buy time; genetics determines the trajectory
  • The real lever is breeding. Weight DPR, Livability, and persistency now—or keep replacing cows every 2.5 lactations

Complete references and supporting documentation are available upon request by contacting the editorial team at editor@thebullvine.com.

Learn More

Join the Revolution!

Join over 30,000 successful dairy professionals who rely on Bullvine Weekly for their competitive edge. Delivered directly to your inbox each week, our exclusive industry insights help you make smarter decisions while saving precious hours every week. Never miss critical updates on milk production trends, breakthrough technologies, and profit-boosting strategies that top producers are already implementing. Subscribe now to transform your dairy operation’s efficiency and profitability—your future success is just one click away.

NewsSubscribe
First
Last
Consent

Breeding Into a Moving Market: What Butterfat’s Crash Reveals About Dairy’s Genetic Timing Problem

The same genomic tools that delivered record milk components are now prompting producers to rethink how they approach breeding decisions—and the lessons extend well beyond butterfat.

Executive Summary: Butterfat prices dropped from $3.71 to $1.50 per pound in two years—but the genetics selected during the boom won’t fully express until 2027. That timing gap is the real story here. Producers who invested in high-fat genetics weren’t making bad bets; they were responding rationally to a decade of strong market signals. The problem is structural: genomic selection moves in 5-year cycles while commodity markets can reverse in 5 months. Now, with protein commanding higher premiums in many Federal Orders and replacement heifers at their lowest since 1978, breeding decisions made this season will shape herd economics through 2030. The operations that thrive won’t be those who predicted the protein shift earliest—they’ll be producers who built enough genetic flexibility to perform whether butterfat, protein, or neither pays the premium.

Dairy breeding strategy

For about fifteen years, the playbook seemed pretty clear. Butterfat was the component everyone wanted more of. Global shortages, strong butter demand, and Federal Order component prices that reached $3.71 per pound in October 2023 made aggressive selection for high-fat genetics look like a solid strategy. Producers who pushed their herds from 3.7% to 4.2% butterfat watched their milk checks respond accordingly.

Then things shifted faster than most of us anticipated.

By late 2024, average butter prices had dropped to $2.65–$2.70 per pound—still workable for most operations, but a significant change from those earlier highs. And the adjustment continued from there. By December 2025, USDA Agricultural Marketing Service reports showed CME butter around $1.50 per pound, with butterfat component values near $1.70—a correction that surprised even some seasoned market watchers.

What changed more fundamentally was the relationship between butterfat production and butterfat value. Processors who struggled to source cream in previous years were now describing 2025 as “a buyer’s market” for butterfat-based products.

What makes this situation worth examining—beyond the price movement itself—is what it reveals about how genomic selection interacts with commodity markets. For producers making breeding decisions right now, there are some genuinely practical lessons here.

How We Got Here

To understand the current landscape, it helps to recall why butterfat became so valuable in the first place.

In the early 2010s, global butterfat supplies were genuinely constrained. The European Union was working to phase out milk quotas, causing production disruptions across the continent. New Zealand faced drought conditions. Meanwhile, consumer preferences were shifting—full-fat dairy products were regaining favor after decades of low-fat messaging.

The U.S. responded by importing increasing quantities of butter and anhydrous milkfat. USDA Foreign Agricultural Service data shows imports climbed from about 10 million pounds in 2011 to over 100 million pounds by 2021—then jumped to 172 million pounds by 2023. The signal to American dairy producers was clear: butterfat demand was outpacing domestic supply.

Genomic selection, which arrived around 2008–2009, gave producers the tools to respond effectively. With the ability to evaluate animals at birth and make breeding decisions based on predicted genetic merit, the industry could achieve in five years what once required fifteen or more.

The production response tells the story. Between 2011 and 2023, U.S. milk production increased about 15%—while butterfat production climbed roughly 28%, according to USDA data analyzed by CoBank economist Corey Geiger. The industry essentially doubled the rate of butterfat improvement relative to overall milk output. By 2024, national milkfat levels had reached 4.23%.

One Wisconsin producer put it to me this way: “We did exactly what the market told us to do. The premiums were there, the genetics were available, and it penciled out.” And he’s right—producers responded rationally to clear economic signals. Those were logical business decisions given the information available at the time.

Geiger has emphasized that U.S. producers responded exceptionally to butterfat demand—and that supply growth has shifted the market from tightness toward relative balance. By April 2025, Holstein genetics had improved so significantly that the Council on Dairy Cattle Breeding rolled back the butterfat genetic base by 45 pounds—almost double any previous adjustment in the breed’s history.

The Timing Challenge Every Producer Faces

Here’s where things get particularly instructive for anyone evaluating their breeding program.

There’s a fundamental tension in dairy genetics that this butterfat cycle illustrated clearly: the timeline for genetic change doesn’t align with the timeline for market change. Not even close.

Timeline StageGenetic Expression TimelineMarket Cycle Timeline
Initial DecisionEvaluate genomic young sires, select matingsRespond to current component prices
Early PhaseBreeding + gestation (0-24 months)Prices can shift 20-40% in 6-12 months
First ExpressionHeifers enter lactation (24-36 months)Market conditions completely different
Herd-Level ImpactGenetic shift reaches 50%+ of herd (48-84 months)8-16 complete market cycles have occurred
Full ExpressionTotal timeline: 5-7 yearsTotal reversal possible: 6 months

Extension data from Penn State, University of Wisconsin-Madison, and industry genomic selection studies. Market cycle data from USDA Agricultural Marketing Service CME component pricing.

When you’re evaluating a genomic young sire and making a breeding decision today, the consequences of that decision won’t fully appear in your bulk tank for at least 3 to 4 years. Meaningful herd-level shifts? Those generally take five to seven years to materialize—that’s standard extension guidance from places like Penn State and Wisconsin. Meanwhile, component prices can move 30% or more in six months. We just watched butterfat drop from $3.71 to $1.70 in about two years.

Dr. Chad Dechow, associate professor of dairy cattle genetics at Penn State, has written extensively about this dynamic in the Journal of Dairy Science. His research has documented how genomic selection has accelerated genetic change to the point where market conditions sometimes shift before the genetics fully express in production.

What this means in practical terms: A producer who selected aggressively for butterfat in 2021 and 2022, responding to then-strong prices, won’t see those genetics fully express until 2025–2027. By then, market conditions will have already evolved—and the genetic direction will be largely set.

You know, this creates a challenging planning environment. Producers are essentially making long-term commitments based on market conditions they can’t fully predict. When those decisions align with where markets ultimately go, results are excellent. When they don’t, adjustments take time.

“U.S. producers did an exceptional job responding to butterfat demand. For 10 years, the market couldn’t supply enough of it, and now there’s a relative balance—it’s almost too much of a good thing.” — Corey Geiger, Lead Dairy Economist, CoBank

What This Looks Like Across Different Operations

For farms that followed market signals and invested in high-butterfat genetics, current conditions present real considerations. But the impact varies meaningfully depending on operation size, financial structure, and regional market.

Consider a typical Upper Midwest cheese milk producer with 800 to 1,200 cows who increased herd butterfat from 3.8% to 4.2% over the past decade. At peak butterfat prices, component calculations suggest that improvements could have added six figures to the milk check annually. The exact amount varies by market and pricing formula, but the direction was consistently positive during the premium period.

Many of those operations reasonably invested in facility improvements, purchased replacement heifers, and structured financing around component premiums that appeared sustainable. Those were logical business decisions given the information available.

Mark Stephenson, director of dairy policy analysis at the University of Wisconsin-Madison, has tracked these dynamics in his monthly Dairy Situation and Outlook reports. He’s observed that Upper Midwest cheese plants face different economics than fluid milk processors in the Southeast or butter-powder operations in the West—so the regional experience varies considerably.

What’s also important to recognize: some operations that emphasized butterfat genetics timed things well. Farms that built equity during 2018–2023 and maintained manageable debt loads are navigating this transition reasonably. The greater pressure tends to fall on operations that expanded more recently with higher leverage.

As one California producer explained to me: “Every cycle looks obvious in hindsight. The question is always whether you’re positioned to handle the turn when it comes.”

The Export Development

One factor that’s helped absorb domestic butterfat supply is significant growth in U.S. dairy exports.

According to the U.S. Dairy Export Council, through the first three quarters of 2025, U.S. butterfat export value reached almost $400 million—surpassing the previous full-year record of $351 million set in 2013. The U.S. has essentially shifted from a consistent butter importer to a competitive exporter.

This export growth has provided meaningful market support. But some context is helpful.

Much of the growth reflects price competitiveness rather than permanent structural demand. In late 2024, U.S. spot butter was around $2.65 per pound, versus $3.17 in New Zealand and $3.60 in the EU—roughly 30% below European suppliers’ prices. That price differential attracts buyers, though it may not represent a permanent market position.

Trade policy considerations also matter. The American Farm Bureau Federation noted in mid-2025 that “dairy’s trade balancing act” remains sensitive to geopolitical developments affecting markets like Canada, Mexico, and Asia.

The practical implication: exports help balance supply, but building a long-term strategy for export markets requires careful attention to factors beyond domestic control.

The Protein Discussion

As butterfat values have moderated over the past 18 months, protein has emerged as the more valuable component in several Federal Milk Marketing Orders—a shift from the pattern of recent years.

YearButterfat Value ($/lb)Protein Value ($/lb)Premium WinnerAdvantage ($/lb)
2021$2.85$2.12Butterfat+$0.73
2022$3.45$2.38Butterfat+$1.07
2023$3.20$2.55Butterfat+$0.65
2024$2.25$2.40Protein+$0.15
2025$1.70$2.65Protein+$0.95

Federal Order component pricing basis. Actual values vary by region and specific co-op formulas. For a typical Holstein producing 24,000 lb milk annually at 4.0% fat (960 lb) and 3.2% protein (768 lb), this swing represents significant per-cow value shifts.

So what’s driving this? Several factors are worth watching.

Growth in GLP-1 weight loss medications like Ozempic and Wegovy appears to be influencing dairy consumption patterns. Circana research found that consumers using these medications often increase protein intake to preserve muscle mass—with Danone reporting roughly 40% growth in yogurt sales among GLP-1 users based on that data. Greek yogurt and other high-protein dairy products are showing measurable gains among this demographic.

The broader high-protein trend also continues. The International Food Information Council’s national consumer surveys show that the percentage of Americans actively trying to increase protein intake rose from 59% in 2022 to 71% in 2024, then settled at 70% in their 2025 survey.

And with well over half of U.S. milk flowing into cheese production according to USDA utilization data, processors continue to value milk with favorable protein-to-fat ratios for optimal yields.

This naturally raises a question: Could the butterfat experience repeat with protein?

The dynamics differ somewhat. Protein has biological constraints that limit how quickly it can increase. Extension specialists like Dr. Kent Weigel at the University of Wisconsin-Madison have noted that protein percentage is more physiologically constrained than butterfat and tends to improve more gradually, even under strong selection pressure.

That said, the basic market structures—selection indices that primarily reflect current prices, commercial incentives that favor trending traits—haven’t fundamentally changed.

What this suggests: responding to protein market signals makes sense, while the butterfat experience offers a useful perspective on building flexibility into longer-term genetic planning.

Thinking Differently About Breeding Decisions

For producers making breeding decisions this season for heifers that won’t enter the milking string until 2028 or 2029, what approaches are worth considering?

Conversations with producers who’ve thought carefully about this reveal some common themes.

Consider scenarios rather than single predictions. Rather than optimizing entirely for current market conditions, there’s value in selecting genetics that perform reasonably well across multiple possible futures. This isn’t about being overly cautious—it’s about acknowledging genuine uncertainty about what component values will look like in 2029.

In practice, this might mean maintaining some genetic diversity even when current prices favor a particular trait. Keeping 25–30% of replacement genetics in “non-premium” lines might cost 1–2% in near-term milk check value while providing meaningful flexibility if conditions shift. Think of it as a relatively inexpensive form of insurance.

Align genetics with processor requirements. This consideration sometimes gets overlooked. Commodity prices fluctuate considerably quarter to quarter. But your cheese plant’s preferred protein-to-fat ratio? That tends to be fairly stable over multi-year periods.

Different cheese types have different optimal compositions. Mozzarella plants typically target protein-to-fat ratios around 0.95 to 1.05 for optimal stretch and yield. Cheddar operations often prefer ratios in the 0.85-0.90 range. If your milk goes to a specific plant, selecting toward that specification may make more sense than following monthly component price movements.

Cheese TypeOptimal Protein:Fat RatioTarget Protein %Target Fat %Why It Matters
Mozzarella0.95 – 1.053.3 – 3.5%3.4 – 3.6%Too much fat = poor stretch & oil-off; too little = rubbery texture
Cheddar0.85 – 0.903.1 – 3.3%3.6 – 3.8%Lower ratio optimal for aging; high protein reduces yield
Swiss0.90 – 0.953.2 – 3.4%3.5 – 3.7%Balance critical for eye formation; ratio affects gas production
Cream Cheese0.40 – 0.502.8 – 3.0%6.0 – 7.0%High fat essential for texture; protein secondary consideration
Parmesan/Asiago0.95 – 1.003.4 – 3.6%3.5 – 3.7%Long aging demands protein; low fat reduces rancidity risk

Optimal ranges vary by specific plant equipment, cultures, and product specifications. Contact your field representative for your plant’s specific targets. Component ratios shown are protein:fat on a percentage basis.

Having a conversation with your fieldman or co-op representative about end-user requirements over the next five years is time well invested. Useful questions include: What’s your target protein-to-fat ratio? Are anticipated product mix changes expected to shift component preferences? What component levels create operational challenges for your plant?

Use financial tools alongside genetic planning. Programs like Dairy Margin Coverage and Dairy Revenue Protection, along with component futures, can help manage margin volatility regardless of herd genetic composition.

DMC enrollment for 2026 coverage is approaching—evaluating whether current coverage levels match your risk profile makes sense given margin trends. USDA’s Farm Service Agency offers enrollment details and decision tools through local offices and at farmers.gov.

Monitor genetic diversity metrics. Holstein inbreeding has accelerated under genomic selection. Average inbreeding for Holstein females reached 8% by 2020, with young genomic bulls averaging 13.7%. The trend has continued upward, with average female inbreeding rising each year since 1981.

Beyond fertility and health considerations, genetic similarity increases collective exposure when market conditions or disease pressures change unexpectedly.

Evaluating a sire’s expected inbreeding contribution alongside his PTAs reflects recognition that diversity has practical value in uncertain environments. Inbreeding data is available on CDCB’s website at uscdcb.com, and most AI companies include this information in sire catalogs and mating programs.

Regional and Operational Considerations

A few additional factors for producers working through these decisions:

Regional context matters. Upper Midwest cheese milk producers face different dynamics than Southeast fluid milk shippers or California producers selling into butter-powder markets. The component value discussion plays out differently depending on your market channel. Understanding your specific situation helps calibrate how national trends apply to your operation.

Scale affects flexibility. Larger operations generally have more capacity to maintain diverse genetic lines within their herd. Smaller operations may need different approaches—perhaps breeding group strategies or working with AI representatives to build diversity into mating programs with fewer animals.

Financial structure shapes options. Operations with lower leverage and stronger equity positions can more readily weather margin compression while genetic adjustments work through the herd. Operations with recent expansion debt face different calculations. Honest assessment of your situation helps identify which strategies fit best.

The replacement market is constrained. USDA’s January 2025 inventory report showed dairy replacement heifers at 3.914 million head—the lowest since 1978. CoBank’s August 2025 analysis reported average heifer prices around $3,010 per head, with top heifers at California and Minnesota auctions reaching $4,000 or more.

If your approach involves significant culling and replacement, current heifer market conditions meaningfully affect the economics. This makes breeding decisions on your existing herd inventory more consequential when outside replacements are both expensive and limited.

The Bottom Line

The butterfat boom is over, but the lesson is permanent: Chasing the hot market of the moment is a slow-motion gamble.

Genomic selection delivered exactly what it promised—unprecedented genetic progress toward the traits producers selected for. The problem wasn’t the tool. The problem was selecting into a market environment that proved more temporary than the genetic changes themselves.

The winners in 2030 won’t be the ones who chased today’s milk check. They’ll be the ones who bred for the cow that works in any market.

That means building herds with enough flexibility to perform when butterfat pays, when protein pays, and when neither pays particularly well. It means matching genetics to processor needs rather than spot prices. It means treating diversity not as a compromise but as a genuine competitive advantage.

The operations that thrive through the next cycle—and there will always be a next cycle—will be those that learned this lesson now, while the butterfat correction is still fresh.

The question for every producer making breeding decisions today is simple: Are you building a herd for this year’s premium, or for the decade ahead?

Key Takeaways:

  • The timing gap is structural and permanent. Breeding decisions take 5-7 years to express; markets can reverse in months. Build for multiple scenarios, not today’s price sheet.
  • Chasing butterfat wasn’t a mistake—the signals were real. The lesson isn’t to ignore markets; it’s to avoid over-concentration in any single trait when you can’t predict what pays in 2030.
  • Protein now commands higher premiums, but the same mismatch applies. Don’t repeat the butterfat pattern by going all-in on the next hot component.
  • Your processor’s requirements beat spot prices for planning. Cheese plants have stable protein-to-fat targets (mozzarella: 0.95-1.05; cheddar: 0.85-0.90). Align genetics to your actual market channel.
  • Diversity is insurance with a cheap premium. Maintaining 25-30% of replacements in balanced genetics costs 1-2% short-term but provides real optionality when—not if—markets shift again.

Complete references and supporting documentation are available upon request by contacting the editorial team at editor@thebullvine.com.

Learn More:

Join the Revolution!

Join over 30,000 successful dairy professionals who rely on Bullvine Weekly for their competitive edge. Delivered directly to your inbox each week, our exclusive industry insights help you make smarter decisions while saving precious hours every week. Never miss critical updates on milk production trends, breakthrough technologies, and profit-boosting strategies that top producers are already implementing. Subscribe now to transform your dairy operation’s efficiency and profitability—your future success is just one click away.

NewsSubscribe
First
Last
Consent

Why Every Smart Dairy Decision Is Driving 14,000 Farms Out – And Your Q1 2026 Action Plan

Every smart dairy decision right now is collectively destroying the industry. 14,000 farms gone by 2027. Your escape plan

EXECUTIVE SUMMARY: Your $1,600 beef-on-dairy calves are funding today’s survival while creating the heifer shortage that will eliminate 14,000 farms by 2027. This isn’t market volatility—it’s structural collapse driven by individual rational decisions creating collective disaster: processors betting $11 billion on milk from cows that don’t exist, heifer inventories at 20-year lows while replacements hit $4,000, and production racing west (Kansas +21%, Wisconsin +2%) where scale economics rule. The timeline is brutal—farms that don’t act before Q1 2026 lose all strategic options. Winners will be mega-dairies leveraging scale, small farms capturing specialty premiums, and operations that exit NOW while equity remains. Mid-size commodity producers face extinction unless they immediately choose: scale up through consolidation, pivot to high-value niche markets, or execute a strategic exit that preserves $200,000-400,000 in family wealth, which disappears after Q1 2026.

Dairy Industry Outlook 2026

You know what’s been keeping me awake lately? It’s not just checking on fresh cows at 2 AM. It’s this strange situation where every producer I talk to—and I mean everyone, from my neighbors here in Wisconsin to folks I met at that Texas conference last month—they’re all making absolutely sensible decisions for their operations. Smart moves, really. Yet somehow, when you add it all up, we’re collectively driving ourselves toward the biggest industry shakeup since the ’80s farm crisis. And here’s what’s wild: this isn’t another milk price cycle we can just ride out. We’re looking at a fundamental transformation that could cut farm numbers from 26,000 to potentially 12,000 within the next 24 months.

The brutal 36-month timeline: 14,000 farms will disappear between now and 2028 – miss the Q1 2026 decision window and you lose all strategic options, joining the forced-exit wave

The Beef-on-Dairy Boom: When Opportunity Becomes a Trap

So here’s what triggered this whole conversation for me. A buddy from Pennsylvania—third-generation dairy farmer, solid operator—texted me last week. He just got $1,600 for a day-old Holstein-Angus cross calf.

I had him repeat that. Sixteen hundred dollars. For one calf.

You probably remember when those same calves were worth maybe $200 on a good day, right? Well, Penn State Extension’s been tracking this closely since earlier this year, and they’re confirming what we’re all seeing—these beef-on-dairy calves are moving for $1,000 to $1,400 pretty consistently across the Northeast. The Wisconsin team’s noting similar numbers out here.

The economic trap that’s destroying dairy: beef-cross calves now fetch $1,600 while replacement heifers hit $4,000 – farmers are cashing checks today that eliminate their industry tomorrow

I was talking with Dr. Michael Hutjens—you might know him from Illinois, he’s been doing some consulting work since retiring—and he put it perfectly. He said that with today’s beef premiums, the income-over-semen-cost calculation has basically rewritten everyone’s budgets. “When crossbred calves fetch double what dairy calves do, you can’t ignore it,” he told me. “But at three, four times? It changes what’s possible on a balance sheet.”

And the math is real. I’ve run these numbers with several neighbors using Cornell’s PRO-DAIRY modeling. Take your typical 500-cow herd, breed about 35% to beef semen—pretty standard approach these days—and you’re looking at $350,000 to $400,000 a year in extra calf revenue. That’s not marketing hype. That’s actual money hitting bank accounts.

But—and here’s where it gets complicated—have you seen what’s happening with heifer inventories? October’s USDA report shows we’re at a 20-year low. Think about that. Only 2.5 million heifers are coming into the US milking herds for 2025. That’s the lowest since they started properly tracking this back in 2003.

The Wisconsin auction yards tell the story. Replacement heifer prices jumped from $1,990 to $2,850 in just one year. And I’m hearing from producers out in the Pacific Northwest—granted, these are the extreme cases—but some folks are paying over $4,000 for the right animal. Even in California, where you’d think the scale would keep things stable, UC Davis Extension is reporting $3,500 for good replacements.

Dr. Victor Cabrera over at Madison said something that really stuck with me: “This makes perfect sense for each individual farm. But system-wide? We’re baking in a heifer shortage that’ll last years.” And you know what? The cull cow numbers tell the same story.

The heifer shortage nobody’s talking about: replacement inventories plummeting from 4.77M head in 2018 to a projected 3.2M by 2027 – a 33% collapse that makes industry expansion impossible

Shifting West: Kansas, Idaho, and the Geography of Expansion

Here’s what’s really fascinating—and honestly, it’s a bit unnerving if you’re farming in traditional dairy states like most of us. The October USDA milk production numbers are eye-opening. Kansas production is up 21% year-over-year. Twenty-one percent! Idaho’s up 9%, Texas jumped 7.4%. Meanwhile, we managed 2.1% here in Wisconsin, and Pennsylvania actually went backwards a bit. Even California, with all those new facilities near Tulare, only grew about 2.4%.

The death of traditional dairy states: Kansas explodes 21% while Wisconsin crawls at 2.1% and Pennsylvania contracts – geography now determines survival more than management skill

This isn’t just random variation, folks. This is a structural change happening right in front of us.

I had the chance to visit a 15,000-cow operation outside Garden City, Kansas, this summer. And what struck me—beyond the sheer scale, which is something else entirely—was the complete integration of every system. They’ve got water reclaim that essentially recycles every drop, hydroponic barley sprouting for year-round fresh feed, and they’re adjusting rations twice daily based on real-time component testing.

The ops manager (he asked me not to use his name because of co-op agreements) shared something interesting. They’re running about $2.50 per hundredweight below the Midwest average on total costs. “It’s not that we’re smarter,” he said. “We just built for this scale from day one. No retrofitting old tie stalls. No working around century-old barn foundations.”

Kansas State’s ag economics folks have been studying this, and they’re confirming these mega-dairies achieve 10% to 15% cost advantages through scale and integration. And yeah, let’s be honest—lower regulatory burden plays a role too.

What’s happening down in Florida and Georgia is different but equally telling. Producers there are dealing with heat stress that would knock our cows flat, but they’re making it work with cross-ventilated barns and genetics explicitly selected for heat tolerance. One Georgia dairyman told me he’s getting 75 pounds per day in August—not Wisconsin numbers, but impressive given the conditions.

Out in New Mexico and Arizona, it’s a different story again. Water scarcity is forcing innovation—one operation near Phoenix installed a reverse-osmosis system that recovers 85% of its water. They’re spending $50,000 annually on water technology, but it’s cheaper than not having water at all. These Southwest operations are proving that you can adapt to almost anything if you’re willing to invest in the right systems.

But here’s what really drives this geographic shift—it’s the processing infrastructure. That new Hilmar plant in Dodge City? It needs 8 million pounds of milk daily. That’s roughly 16 average Wisconsin farms, or about 1.5 of those Kansas mega-dairies. Valley Queen, up in South Dakota, is expanding by 50% to increase capacity, too. The processors go where the milk is, the milk goes where the processors are. It’s self-reinforcing.

The $11 Billion Bet: Processors Defy the Herd Falloff

Here’s a number that should make everyone pause: $11 billion. That’s what the International Dairy Foods Association says processors are investing in new capacity through 2028.

From their perspective, it makes sense. USDA’s November forecasts show milk output reaching 232 billion pounds by 2026, up from 226 billion in 2024. Even with cow numbers staying flat or declining slightly.

Michigan’s posting 2,260 pounds per cow monthly—that’s more than 250 pounds above the national average. Dr. Kent Weigel over at Madison calls this the “component yield era.” We’re seeing 3% to 5% yearly increases in protein and butterfat just from genetics and better feeding. With advances in nutrition, processors are betting on continued supply growth. It’s a reasonable bet based on what we’ve seen historically.

Yet—and this is where things get interesting—CoBank’s August report says we’ll lose another 800,000 heifers before the curve turns around in late 2027. I asked a cheese company exec about this disconnect at last month’s conference. His take? “We’re not betting on more cows. We’re betting on more milk per cow. Frankly, we’d rather work with fewer farms producing consistent volume than coordinate with hundreds of smaller operations.”

What’s interesting is that processors in the Southeast are taking a different approach—smaller, more flexible plants for regional supply. A new facility in North Carolina is designed to handle just 500,000 pounds daily, specifically targeting local specialty markets. But the big money? That’s all, heading to the Plains states.

GLP-1: The Protein Surge Nobody Planned

The obesity drug windfall: GLP-1 users exploding from 41M to 315M creates insatiable whey protein demand – pushing >3.2% protein herds to $1.50/cwt premiums worth $75,000-$100,000 per 500-cow operation

You know what’s wild? The biggest market mover right now isn’t even on the farm—it’s in the pharmacy. Morgan Stanley’s research shows 41 million Americans have tried those weight-loss GLP-1 drugs like Ozempic and Wegovy. The market for these medications is expected to hit $324 billion by 2035.

Why should we care? Well, turns out folks on these drugs need massive amounts of protein to avoid losing muscle along with the weight. The bariatric surgery folks updated their guidelines this year—they’re recommending 1.2 to 2.0 grams of protein per kilogram of body weight for these patients. That’s way above normal recommendations.

Dr. Donald Layman—Professor Emeritus at Illinois, who has been studying protein metabolism forever—told me whey protein’s become the gold standard. “The amino profile and absorption rate match exactly what GLP-1 patients need,” he explained. “You can’t get that efficiency from plant proteins.”

And the market’s responding in real time. CME spot dry whey prices jumped 19.8% in just a month, while Class III and IV are struggling. Lactalis rolled out GLP-1-specific yogurt lines that are flying off shelves. Danone’s high-protein Oikos line posted 40% growth last quarter. Even Nestlé’s getting in on it, developing what they call “next-gen functional proteins” specifically for the weight-loss market.

Here’s what this means for us: a 500-cow herd pushing protein above 3.2% can pocket an extra $50,000 to $100,000annually, just from protein premiums. That’s based on current Federal Milk Marketing Order pay schedules. Real money that could make the difference between red and black ink.

The 24-Month Crunch: Who Exits? Who Thrives?

I’ve been having a lot of conversations lately about survival math. Here’s how I think the next two years play out:

Right now through early 2026: We’re in the “kitchen table decision” phase. A Farm Credit rep in Wisconsin told me they’re seeing two to three times the usual requests for transition planning. “These aren’t distressed operations yet,” he said. “They’re farmers who can read the writing on the wall.”

Spring and summer 2026: That’s when the new processing capacity comes online hard. Valley Queen’s expansion, multiple Texas and Kansas cheese plants. The mega-dairies will lock in those contracts first, leaving mid-size operations scrambling. CoBank expects 3% to 5% of operations to exit during this window. Not all bankruptcies—but hard transitions.

Late 2026 into 2027: Cornell’s Dyson School economists are flagging rapid compression—25% to 40% of milk could come from operations over 5,000 cows. Dr. Andrew Novakovic at Cornell compared it to the ’80s consolidation, but compressed. “What took ten years then is happening in two or three now,” he told me.

2027-2028: We’ll likely stabilize at 12,000 to 18,000 farms total, down from today’s 26,000. The rest get absorbed or shut down.

What This Means for Different Operations

So what’s a producer to do? Well, it depends on your situation.

If you’re running a mega-dairy (5,000+ cows): Your advantages are clear—scale, technology, processor relationships. Just don’t overleverage. Keep debt under 40% of assets—that’s what saved the survivors in 2009 and 2020. And plan for those beef-on-dairy premiums to drop back to $400-500 when the beef herd rebuilds. It always does.

If you’re mid-size (500-2,000 cows): This is where it gets tough. If you’re losing money on milk alone, that beef-on-dairy revenue is buying time, not solving problems. Gary Sipiorski at Vita Plus puts it bluntly: “Q1 2026 is your decision window.” Exit while you have equity, find a niche, or partner up for scale.

I’ve seen success stories from Northeast operations doing direct sales, some Georgia and Texas folks making it work with heat-tolerant crossbreeds and targeted butterfat contracts. Down in Arizona, several mid-size operations formed a marketing co-op specifically for premium contracts. There are paths forward, but they require decisive action.

If you’re smaller (under 500 cows): Don’t write yourself off. Direct sales, on-farm processing, high-premium markets like A2 or grassfed with strong local brands—these can work if you’re committed. Bob Cropp at Madison always says, “Niche isn’t enough—you need real differentiation and usually some off-farm income during transition.”

The Stuff That’s Not in the Spreadsheets

Mental health matters here. Every banker I talk to mentions family stress. The Wisconsin Farm Center offers free, confidential counseling. Minnesota has their Farm & Rural Helpline (833-600-2670). Iowa State Extension runs Iowa Concern (800-447-1985). Most states have similar programs—find yours and use it. I’ve seen too many good operators make bad decisions because stress clouded their judgment.

Policy risk is real. Don’t build a five-year plan assuming today’s Dairy Margin Coverage program or immigration rules stick around. They won’t. Build flexibility into your planning.

Water—if you’re in the Southwest, plan for 30% cuts in availability by 2030. That’s what the Bureau of Reclamation models suggest. I talked to a Central Texas dairyman who’s already hauling water weekly, and another in New Mexico who’s paying $200 per acre-foot—triple what he paid five years ago. Changes everything about your cost structure.

And technology disruption? Precision fermentation isn’t science fiction anymore. Fonterra just put $50 million behind it. Perfect Day is already selling ice cream made with lab-produced dairy proteins. We can’t ignore this stuff.

Looking Forward: Building Smart AND Resilient

What I keep asking myself is—are we optimizing for the wrong things? Dr. James Dunn at Penn State warns that stable conditions reward efficiency, but what happens when things get less stable?

I think adaptability wins. The operations that’ll thrive in 2028 won’t necessarily be the biggest or most efficient. They’ll be the ones with options—not all-in with one processor, not overleveraged, not betting everything on one market.

Watch what’s happening in Europe with their farm protests. See New Zealand fighting environmental regulations. Australia’s dealing with drought cycles that make our weather look predictable. No export market is guaranteed. No playbook survives every storm.

The Bottom Line

If there’s one thing I’d leave you with, it’s this: the window for proactive decisions—whether that’s expansion, exit, or complete restructuring—is closing faster than most of us realize. By Q1 2026, most of the good options will be taken.

Push for higher components, not just volume. Be realistic about calf prices. Know your regional advantages—whether that’s proximity to processors in Kansas or grassfed premiums near Boston. And don’t try to go it alone. Get good advice. Run real numbers. Have honest conversations with your family.

The industry isn’t dying, but it is shedding its skin. Make sure you aren’t the one shed with it.

Your state’s Farm Center or Extension can help—Wisconsin’s is free and confidential (800-942-2474). Farm Aid runs a national hotline at 1-800-FARM-AID. The National Suicide Prevention Lifeline (988) has agricultural specialists available. Sometimes the hardest conversation is the one that saves your farm—or helps you exit with dignity and equity intact.

KEY TAKEAWAYS

  • Decision Deadline: Q1 2026 – After this, you lose all strategic options. Exit now = $200-400K preserved equity. Exit later = bankruptcy.
  • Immediate Revenue: Chase Protein Premiums – Getting above 3.2% protein captures $50-100K annually (500 cows) from GLP-1 demand while you plan next moves.
  • Reality Check Your Business – If you need $1,600 beef calves to survive, you’re already dead. Plan for $500 calves, $15 milk, and 30% less water (Southwest).
  • Only 3 Models Survive – Mega-scale (5,000+ cows), radical differentiation (A2, grassfed, on-farm processing), or strategic exit. “Local” and “family farm” aren’t differentiators.
  • Geographic Destiny – Kansas/Idaho/Texas have won. Traditional dairy states face a permanent 15% cost disadvantage. Location now determines survival more than management.

Complete references and supporting documentation are available upon request by contacting the editorial team at editor@thebullvine.com.

Learn More:

Join the Revolution!

Join over 30,000 successful dairy professionals who rely on Bullvine Weekly for their competitive edge. Delivered directly to your inbox each week, our exclusive industry insights help you make smarter decisions while saving precious hours every week. Never miss critical updates on milk production trends, breakthrough technologies, and profit-boosting strategies that top producers are already implementing. Subscribe now to transform your dairy operation’s efficiency and profitability—your future success is just one click away.

NewsSubscribe
First
Last
Consent
Send this to a friend