New research puts hard numbers on the hidden price tag of genetic progress—and what a 10-year crossbreeding study reveals might change how you think about your next breeding decisions.
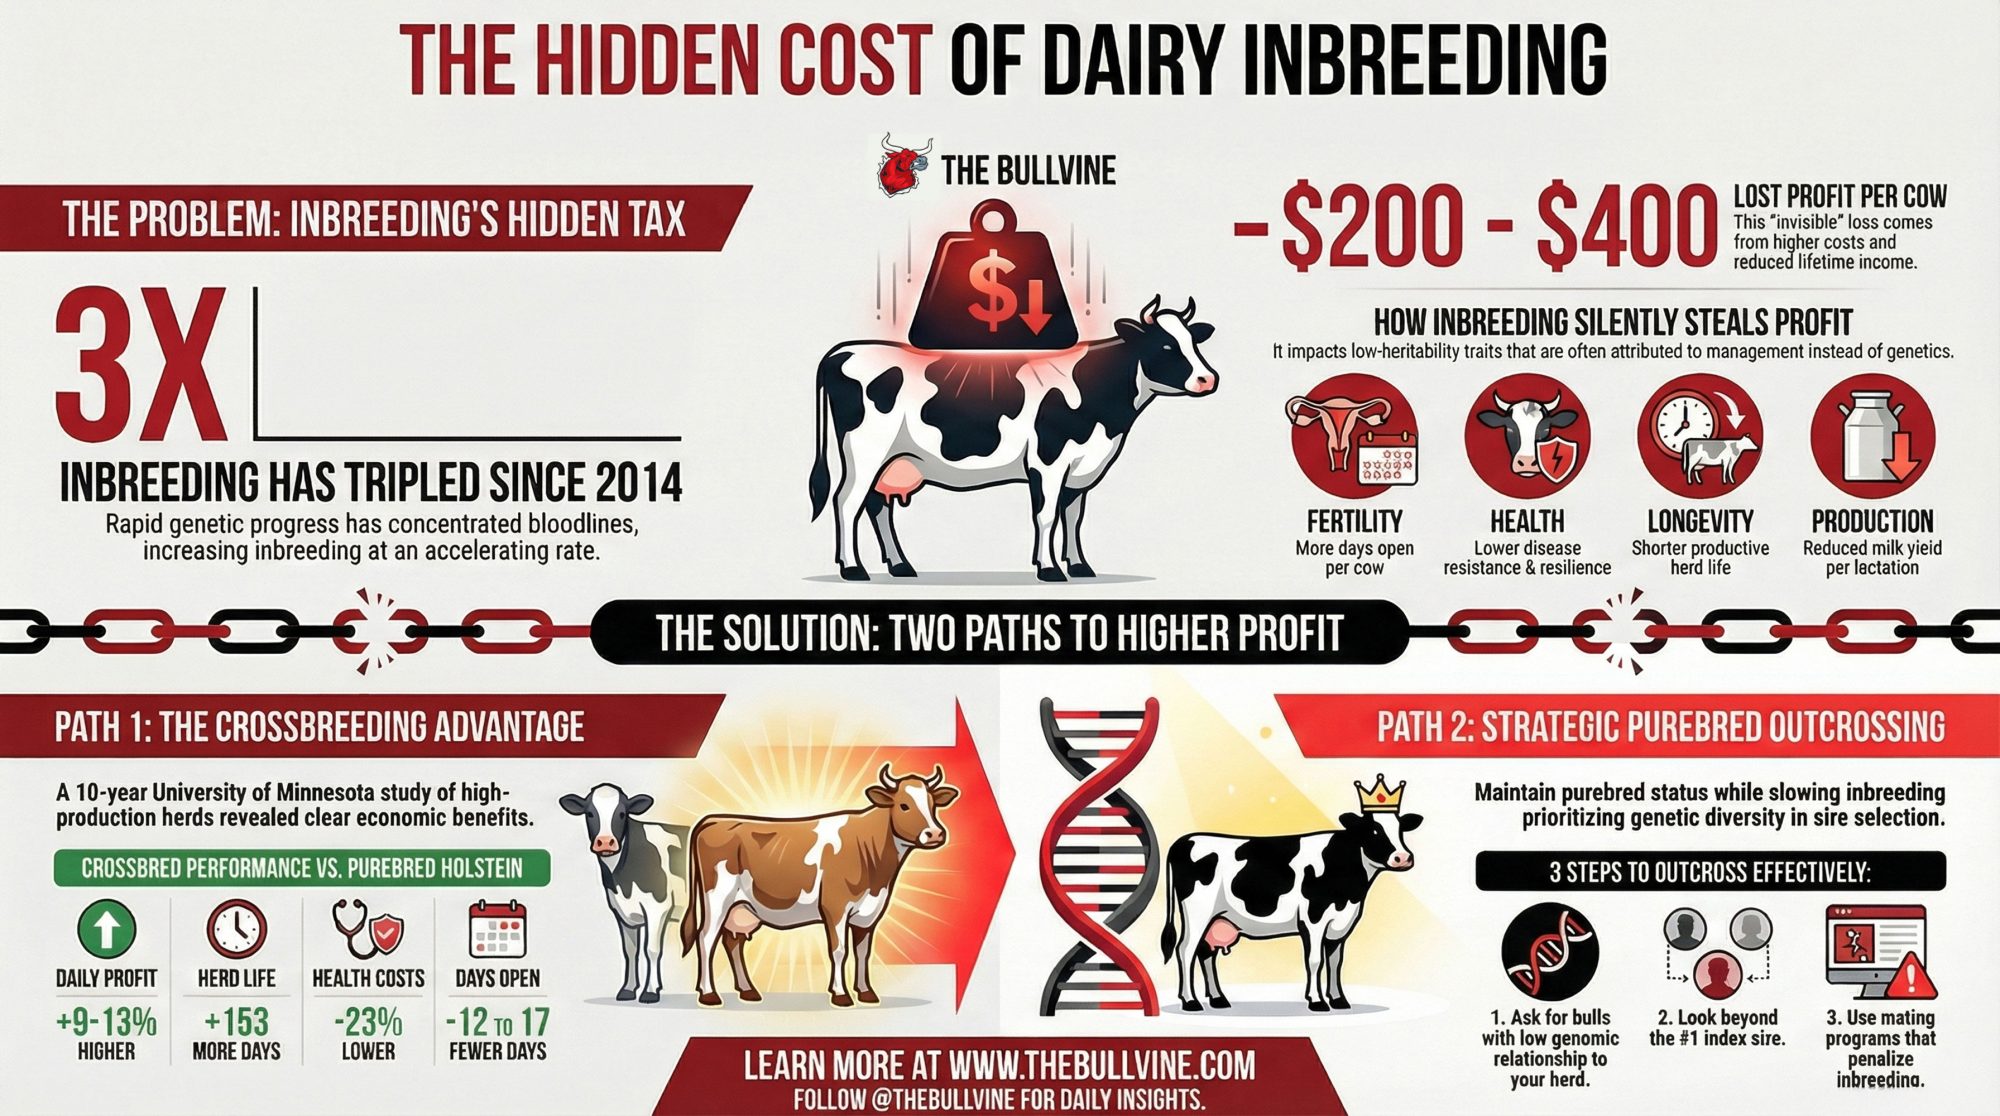
Executive Summary: Inbreeding in Holsteins has tripled since 2014—silently adding an estimated $200-400 per cow in lifetime losses. These costs are not reflected in any report but appear as extra breedings, transition problems, and productive cows culled too soon. A 10-year University of Minnesota study tracked seven high-production herds averaging nearly 30,000 lbs. The finding: crossbred cows made 9-13% more profit per day. Every herd. No exceptions. That doesn’t make crossbreeding right for every operation—but it does change the math. For purebred programs, strategic outcrossing can slow the trend. For those open to alternatives, a decade of data demands attention. Both paths start with understanding what your genetics are actually costing you.
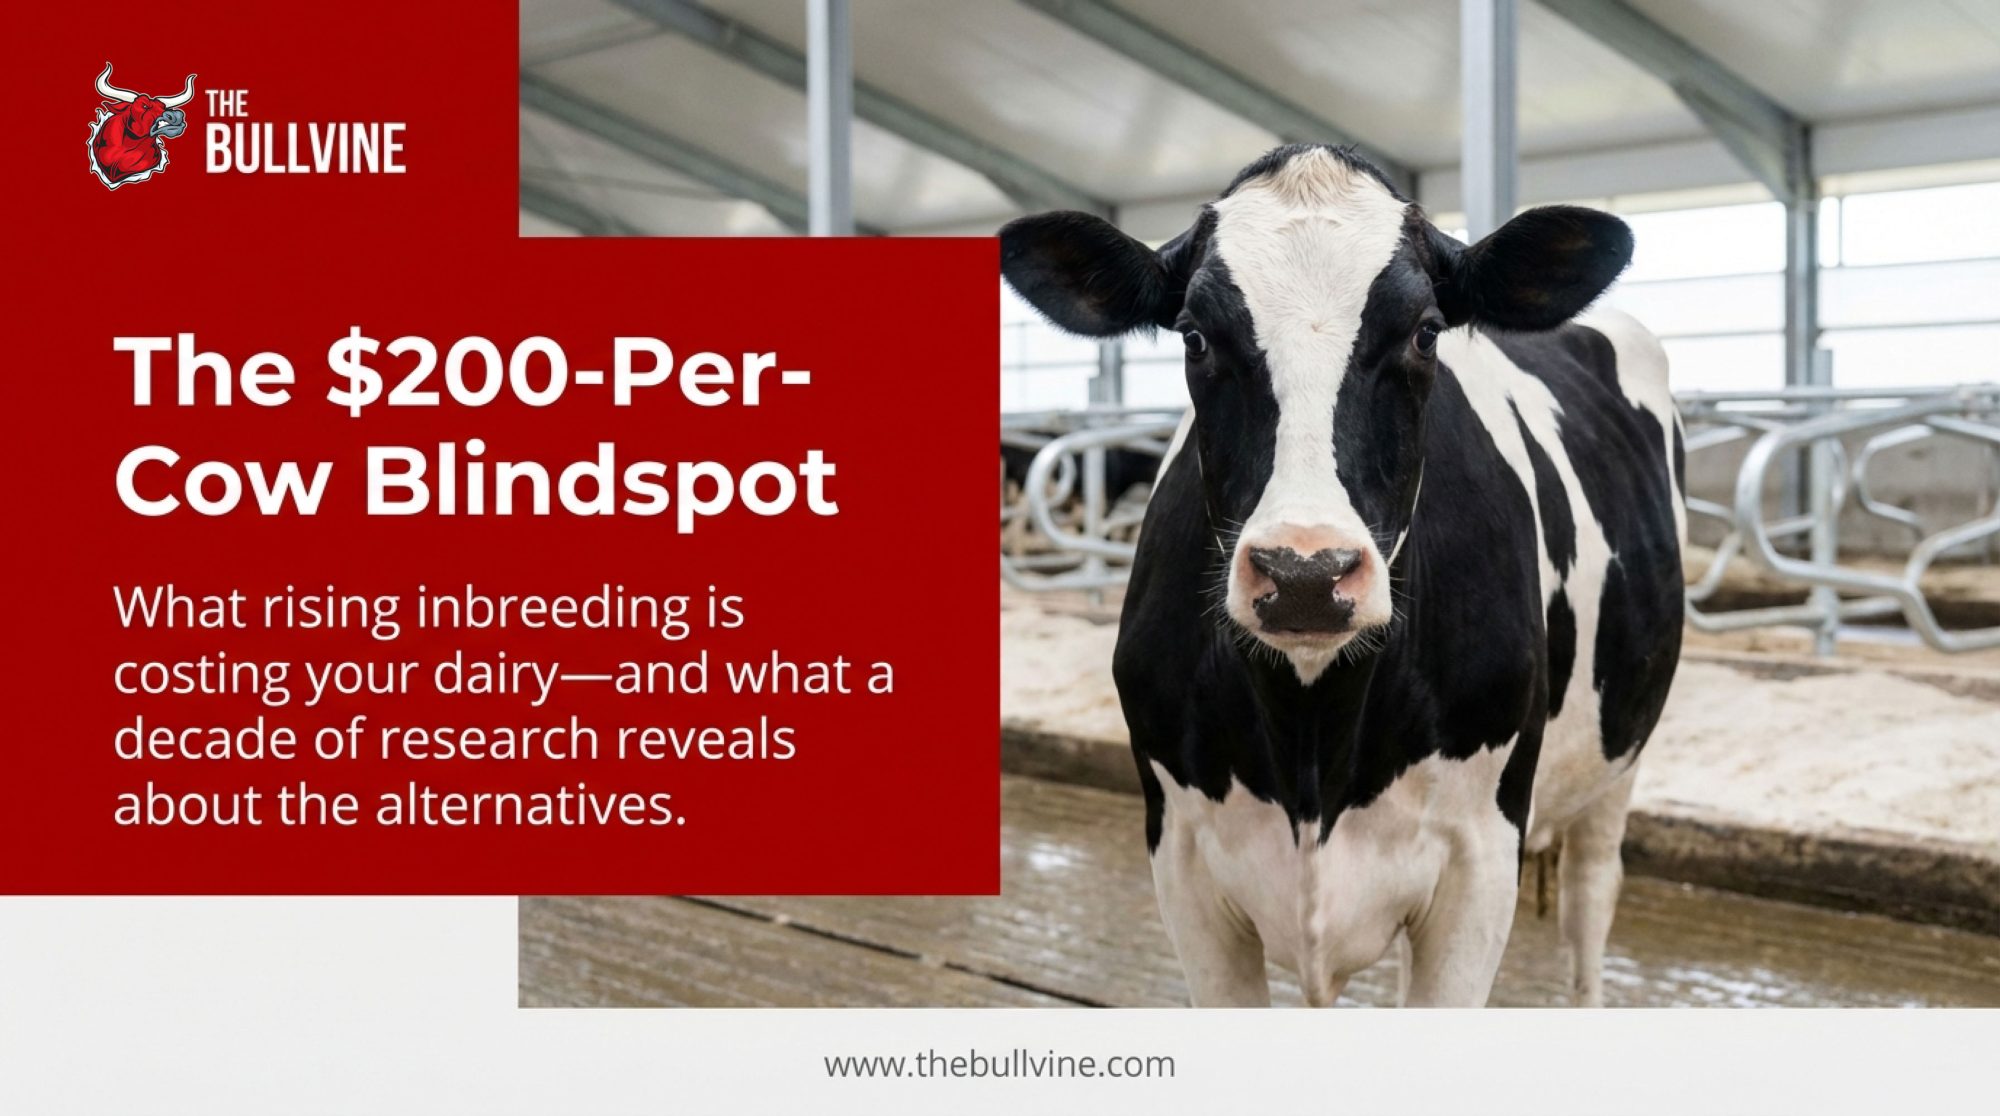
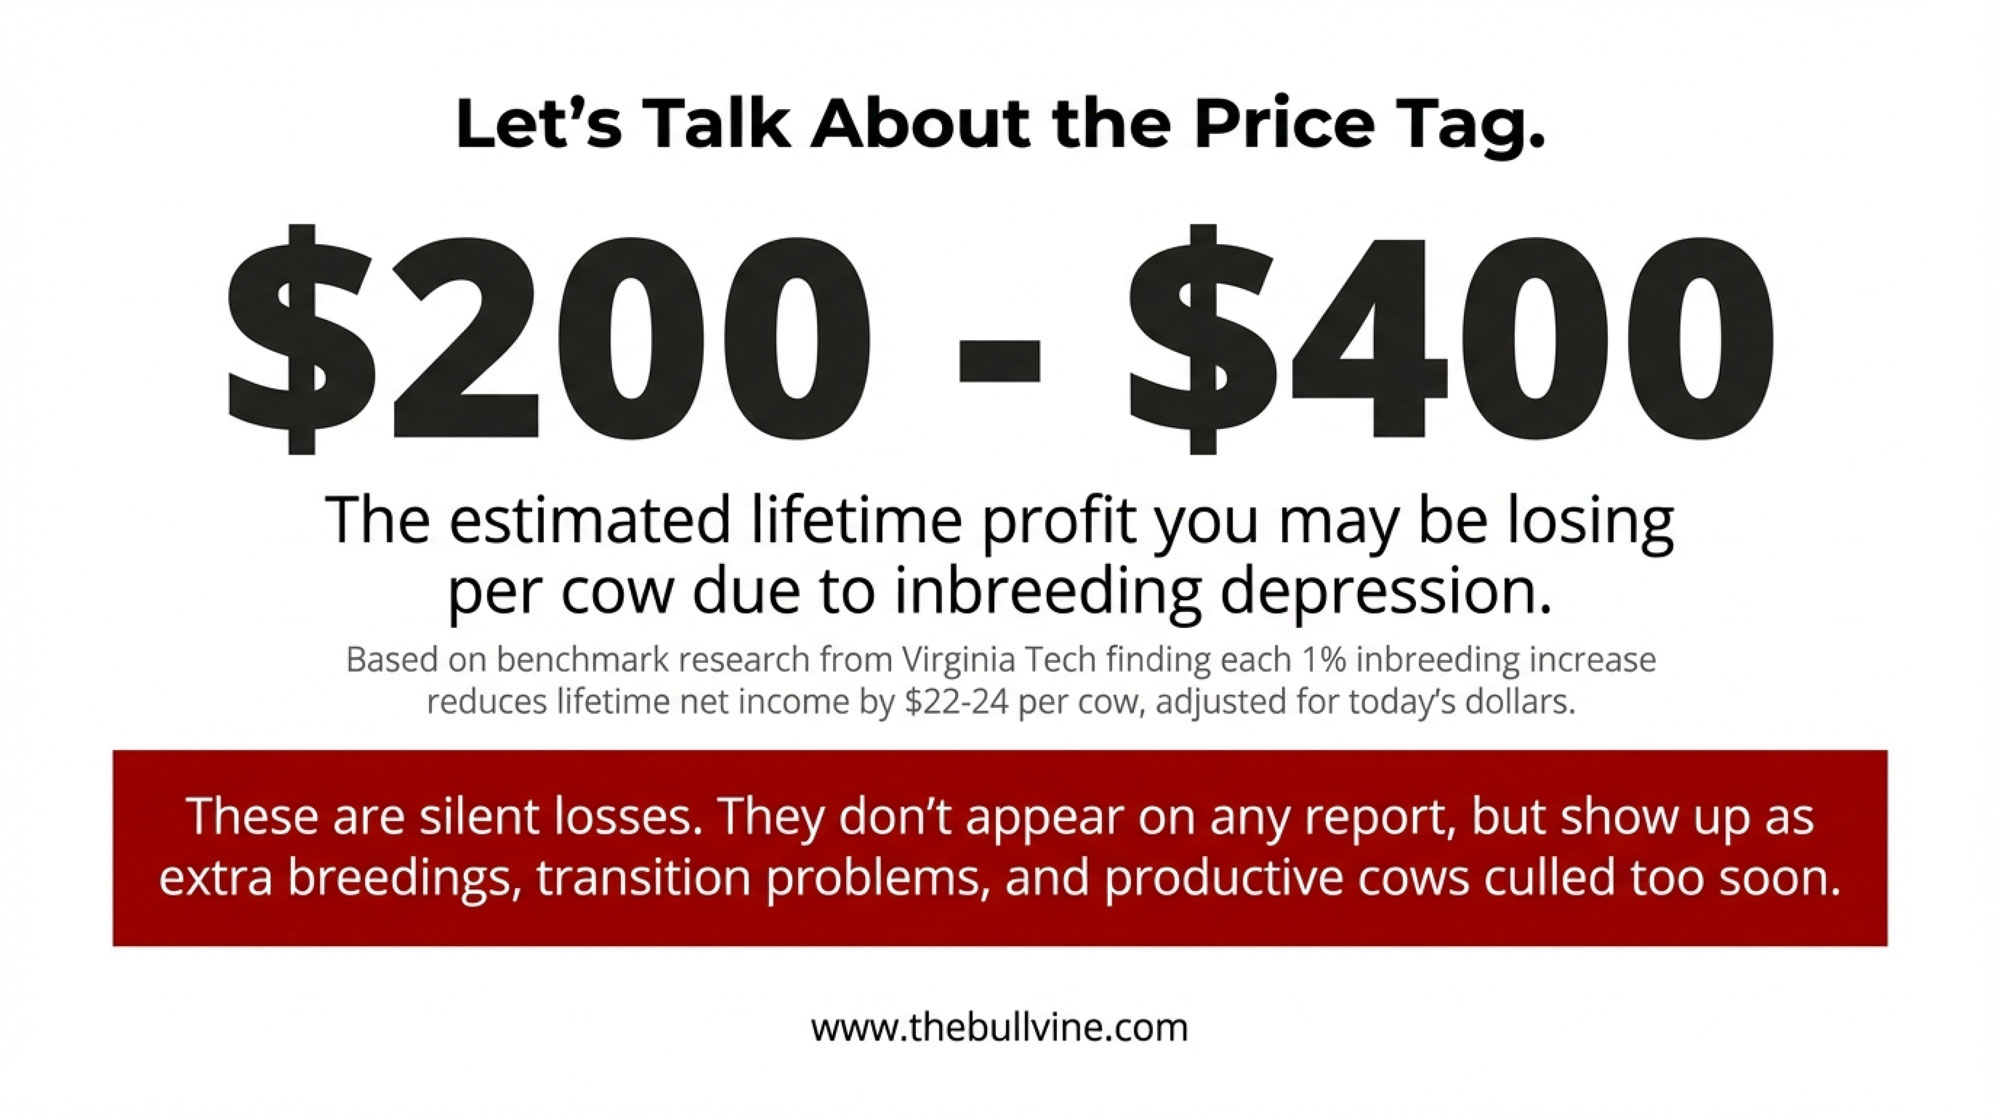
Here’s a number that probably isn’t on your radar: $200 to $400 per cow.
That’s the estimated lifetime profit you may be losing to inbreeding depression—losses that never show up on a breeding report, never get their own line item, and rarely get blamed on genetics. They show up as the cow that took an extra breeding. The calf that didn’t quite thrive. The cow you culled in the third lactation instead of the fifth. Most of us have seen these patterns in our herds without necessarily connecting them to genetics.
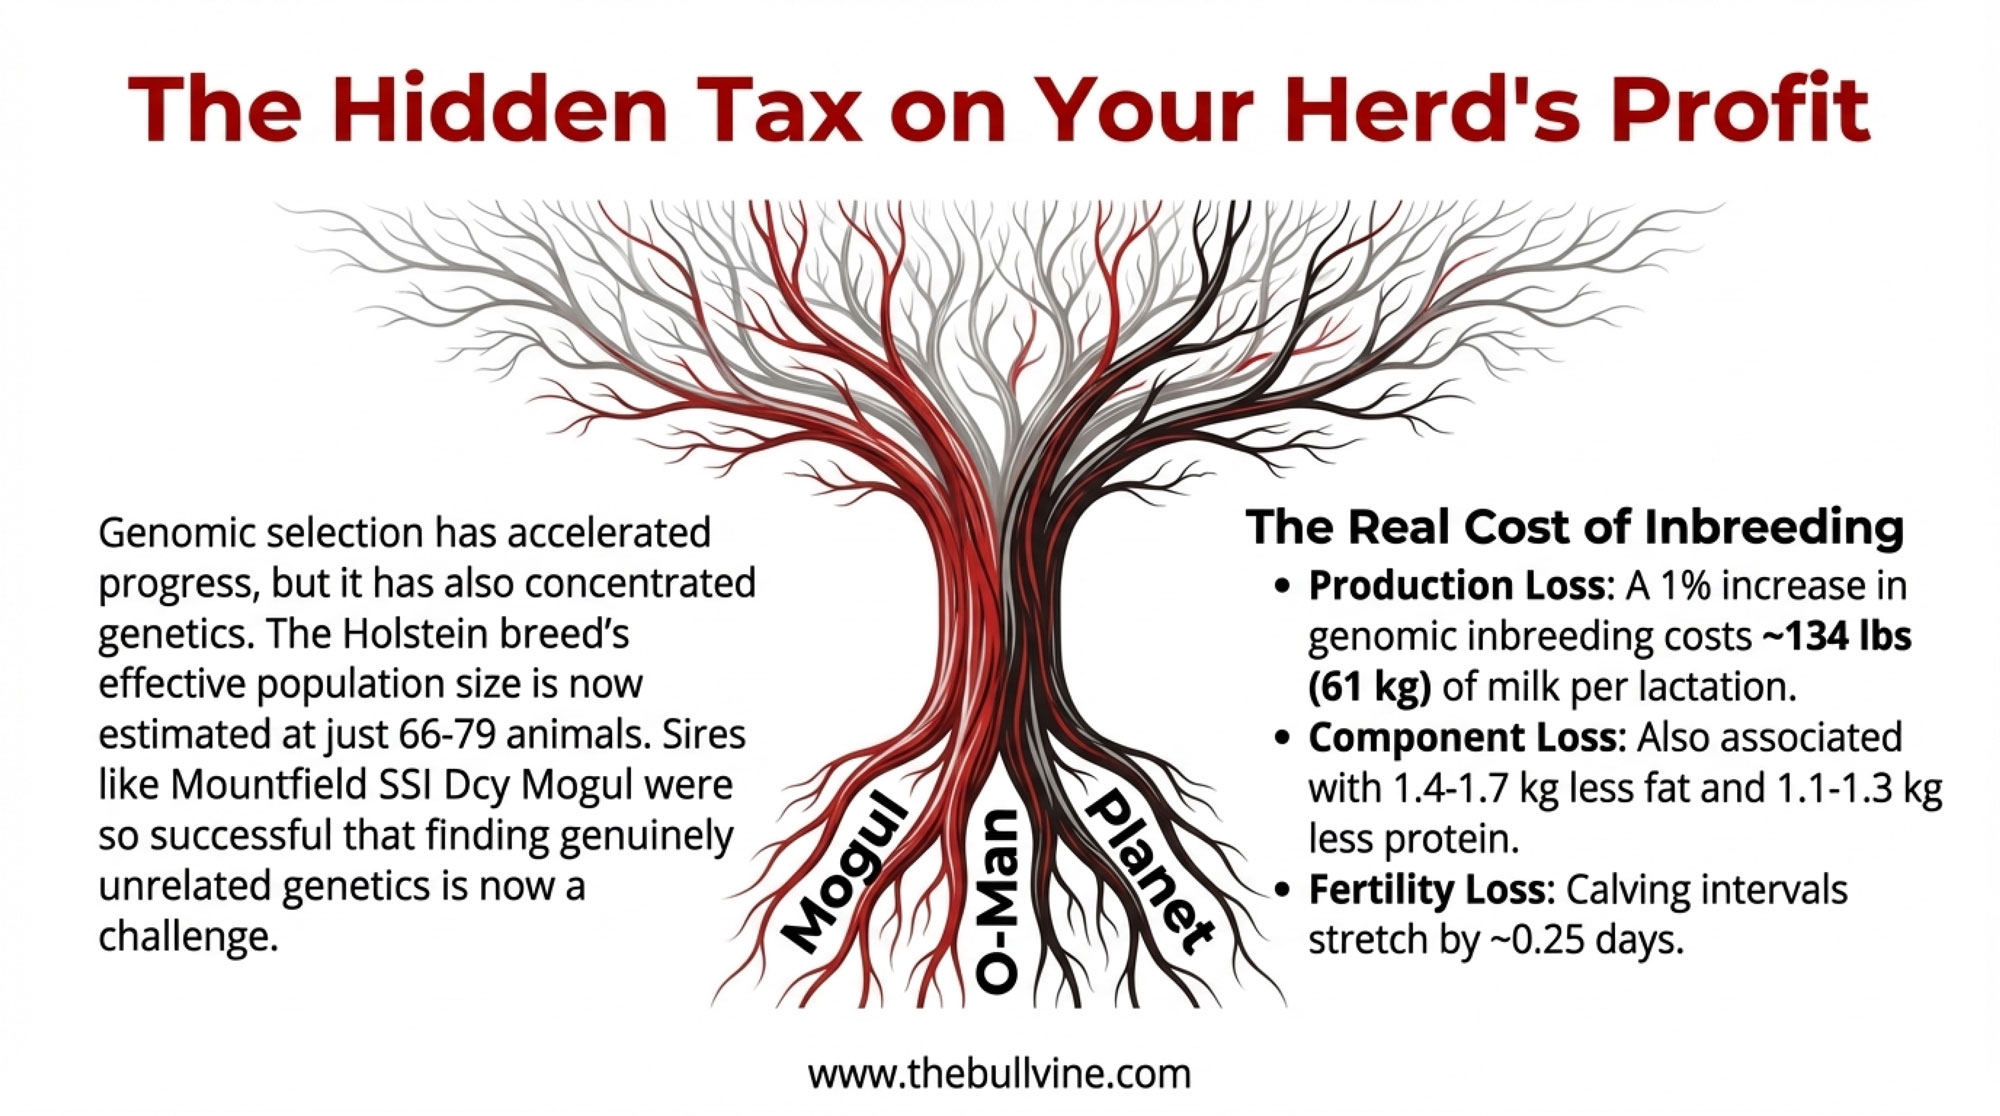
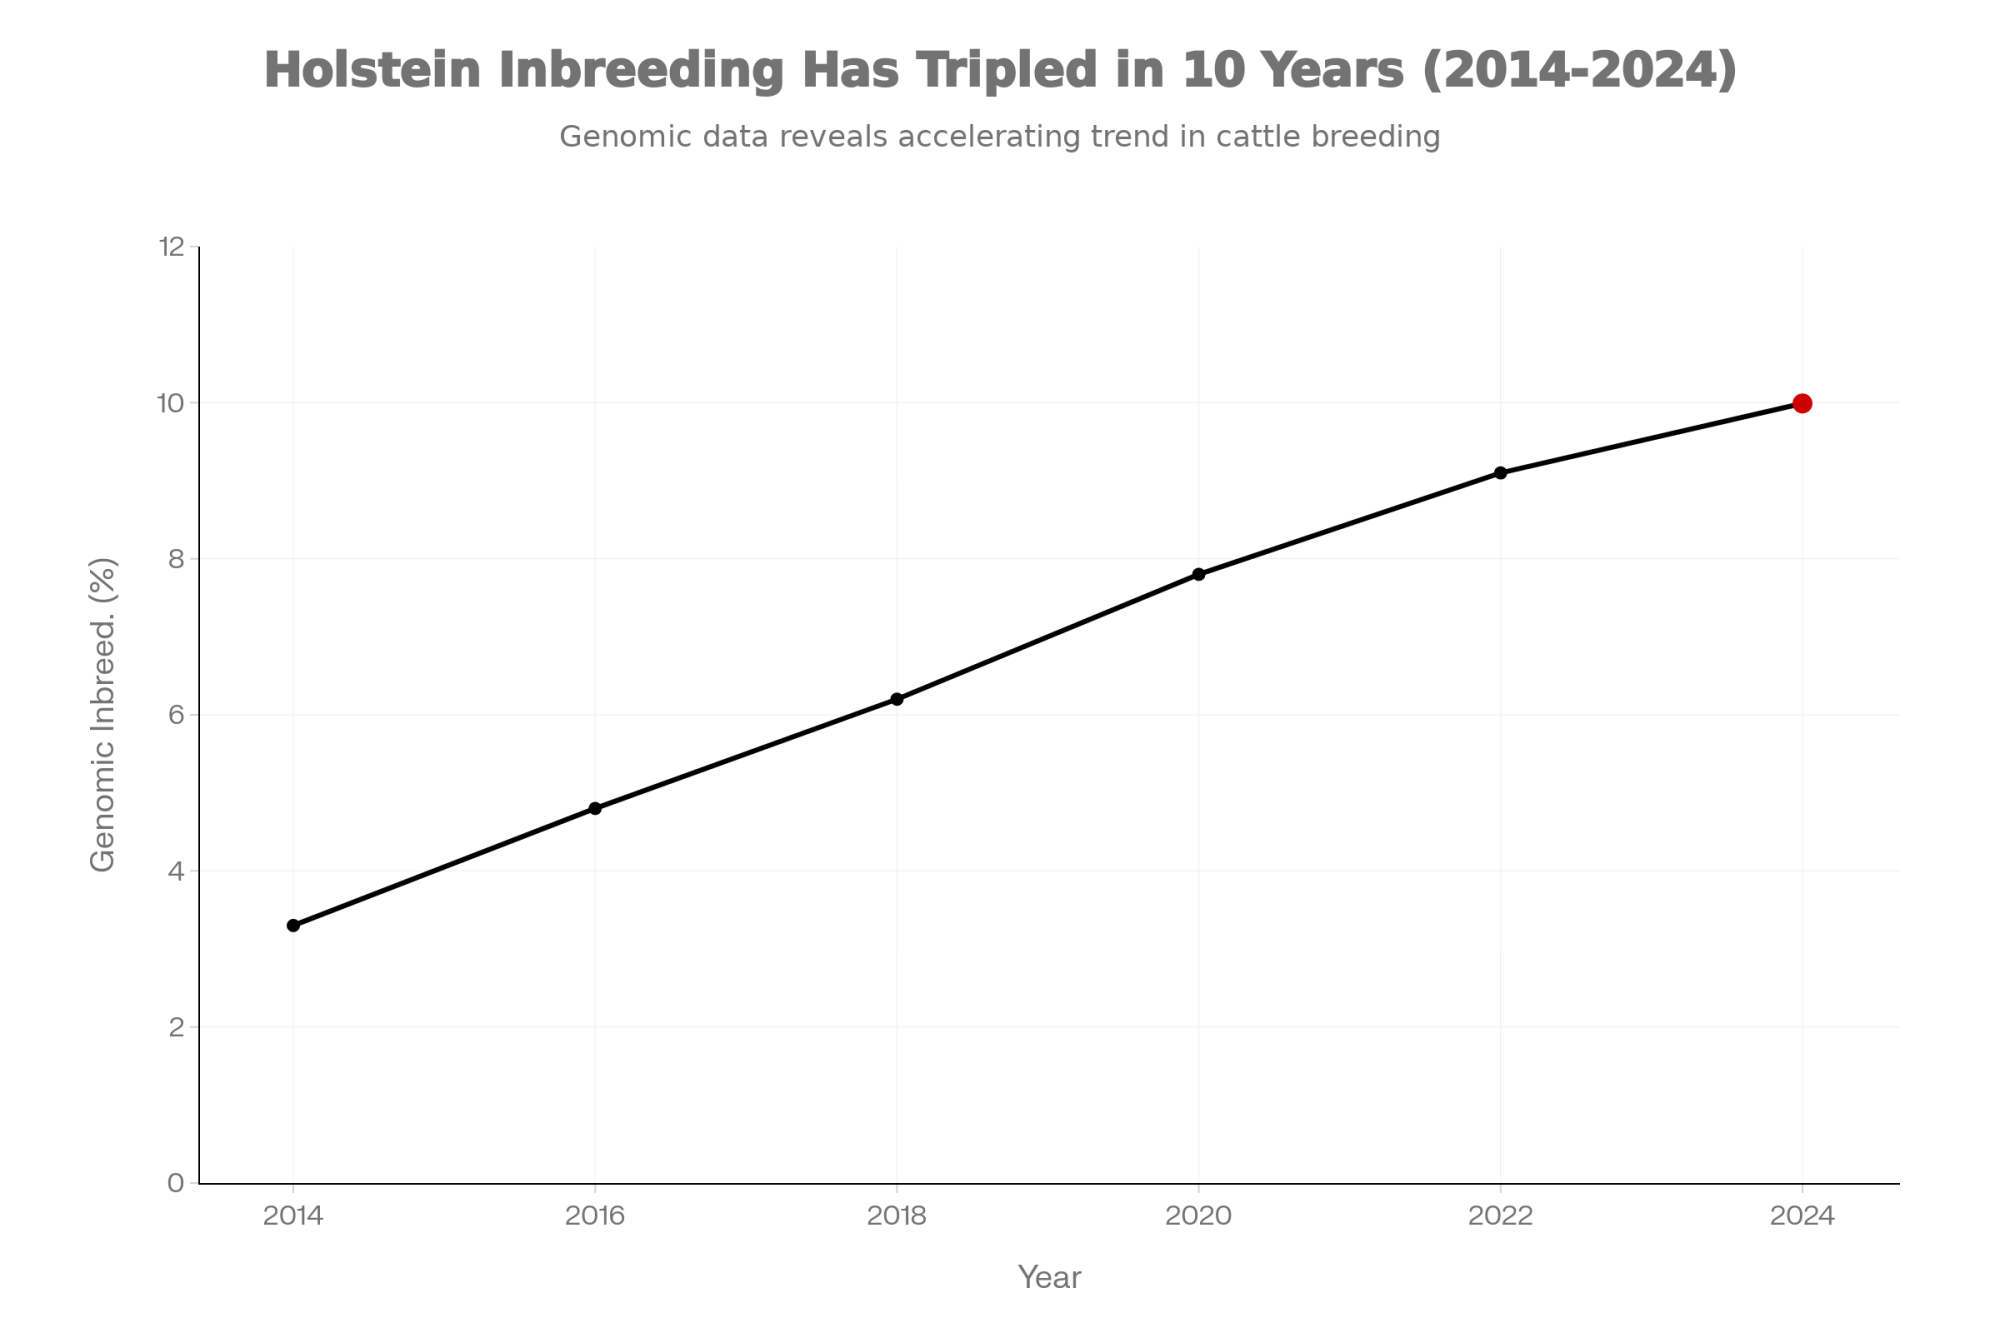
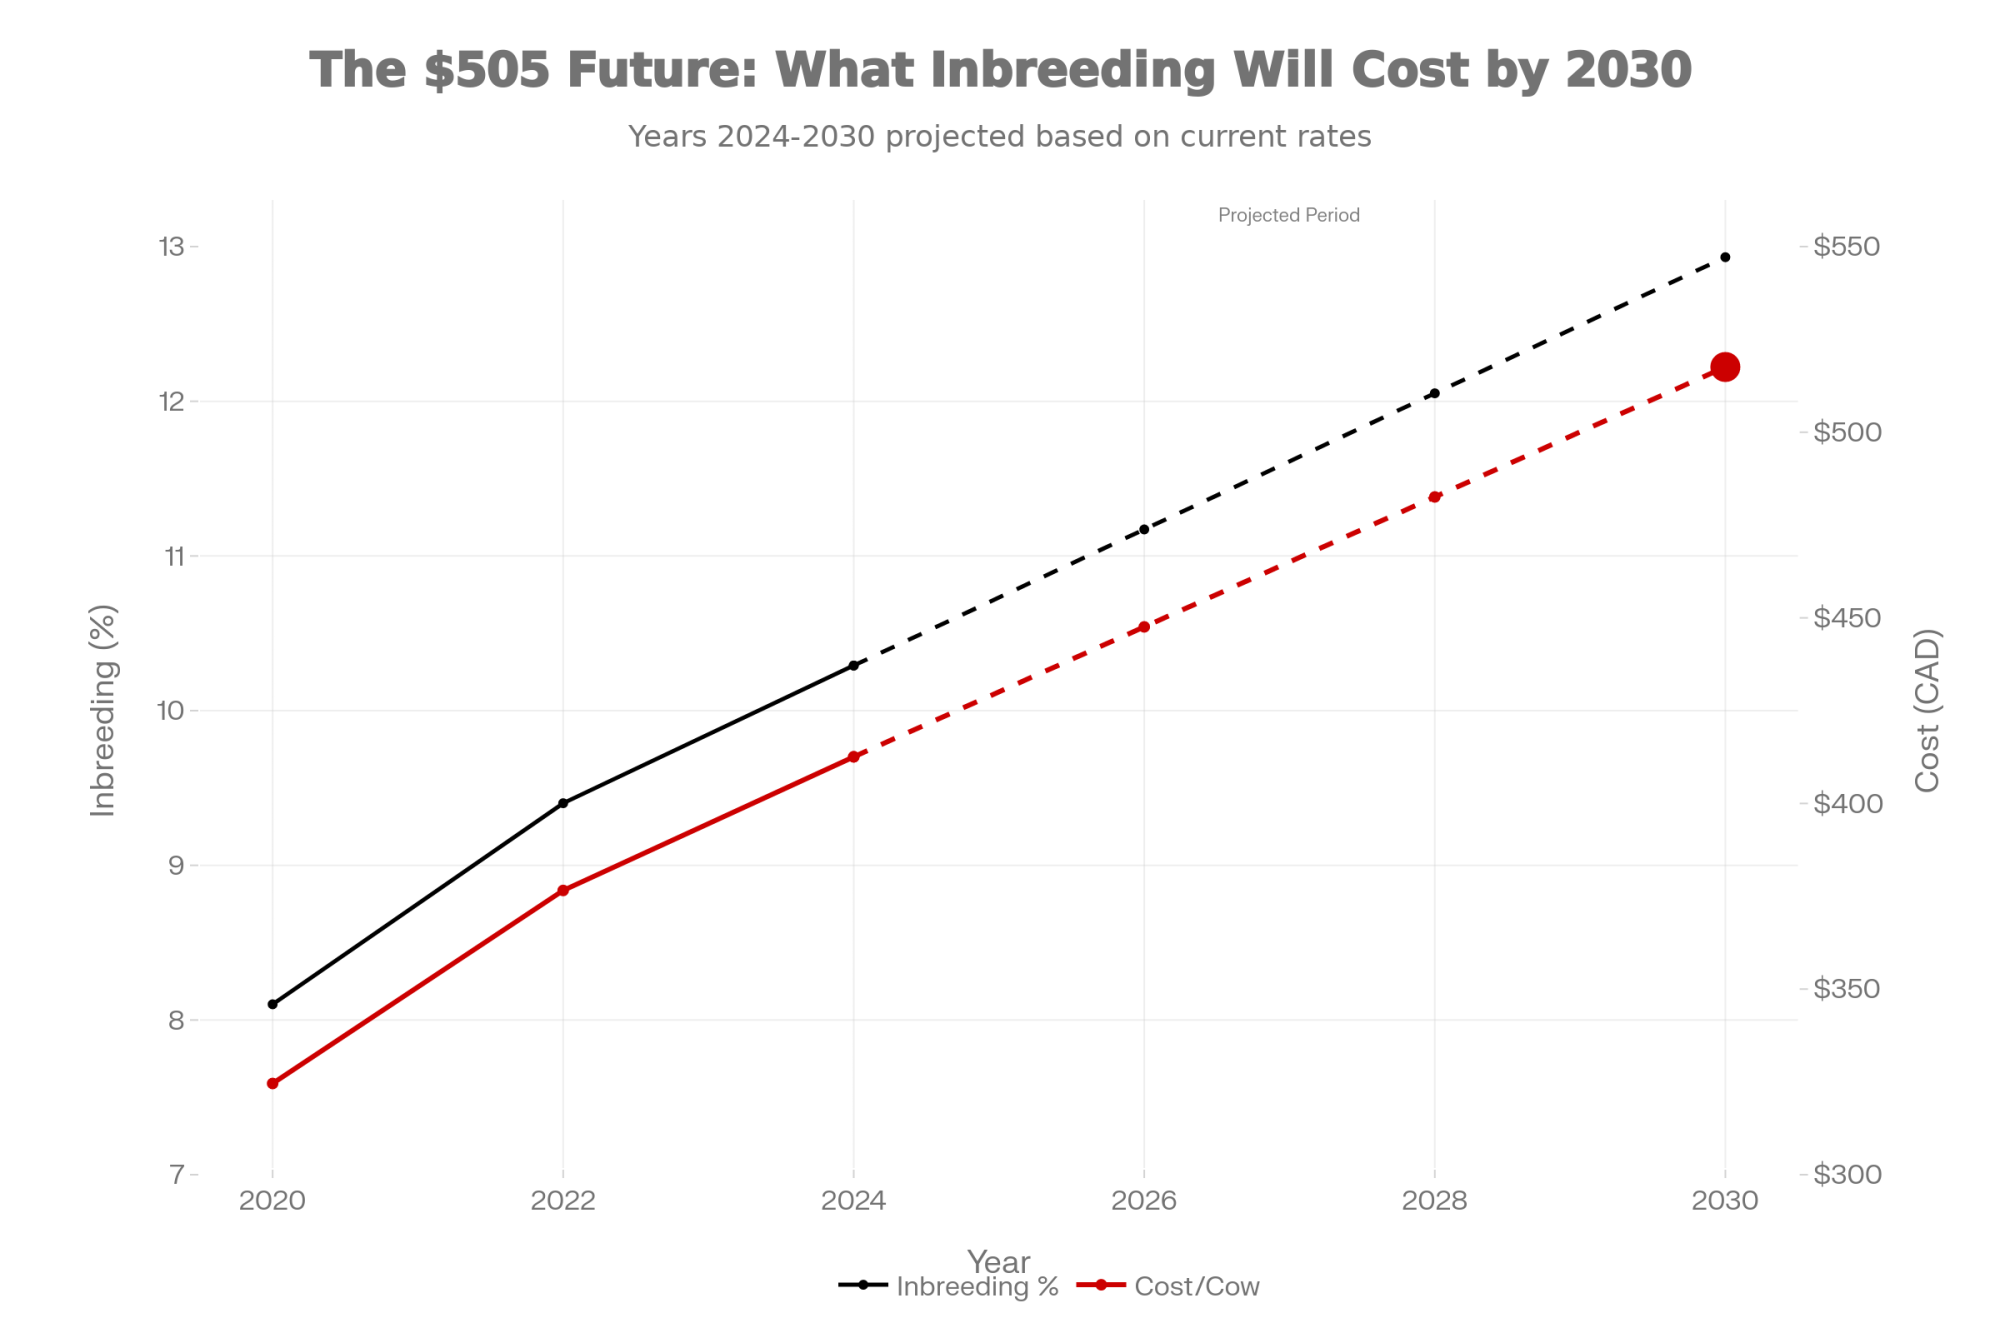
And here’s what makes this worth a closer look: Holstein genomic inbreeding has climbed dramatically over the past decade. The Council on Dairy Cattle Breeding’s trend data shows genomic inbreeding in young Holstein bulls has roughly tripled since 2014, with current averages pushing into the mid-teens percentage-wise. Lactanet Canada’s August 2025 update puts the average for Holstein heifers born in 2024 at 9.99%—nearly double what it was fifteen years ago. John Cole walked through this acceleration in detail at the 2024 Beef Improvement Federation symposium—and honestly, the rate of change caught even some industry veterans off guard.
Now, I want to be clear from the start: genomic selection has been one of the most valuable tools our industry has ever had. The genetic progress over the past decade has been remarkable. But there’s a growing body of research suggesting we need to look at the full picture—both the gains and the costs. And increasingly, producers I talk to are asking a fair question: What’s the net benefit when you account for everything?
Let me walk through what the research actually shows, what’s driving these trends, and what options might make sense for different operations.
What Inbreeding Is Actually Costing You
Let’s start with the economics, because that’s ultimately what matters when you’re making decisions for your operation.
Back in 1999, researchers at Virginia Tech—Cassell, Adamec, and Pearson—published a study in the Journal of Dairy Science that’s still the benchmark for understanding inbreeding costs. They found that each 1% increase in inbreeding reduces lifetime net income by $22-24 per cow, depending on whether you’re selling into fluid or cheese markets.
That study is over two decades old now, and I’ll be upfront about that. The underlying biology hasn’t changed, but dollar values certainly have. A rough inflation adjustment would put that figure somewhere around $40-45 per cow per percentage point in today’s terms—though I should note that’s a back-of-envelope calculation, not a formal research finding. We could really use an updated economic study on this, and I know several universities have been discussing it.
So, when genomic inbreeding rises substantially over a decade You’re potentially looking at $200-450 in lost lifetime profit per cow. For a 200-cow dairy in Wisconsin or a 500-cow operation in California’s Central Valley, that adds up to real money—$40,000 to $90,000 or more in economic impact that’s essentially invisible on your monthly reports.
Inbreeding depression silently steals profit from dairy producers because it is expressed mostly for traits that are not readily noticeable, such as embryo loss, less disease resistance, and shortened survival. That word “silently” is important. These aren’t losses you see on a vet bill or a milk check. They’re distributed across your operation in ways that are genuinely hard to track.
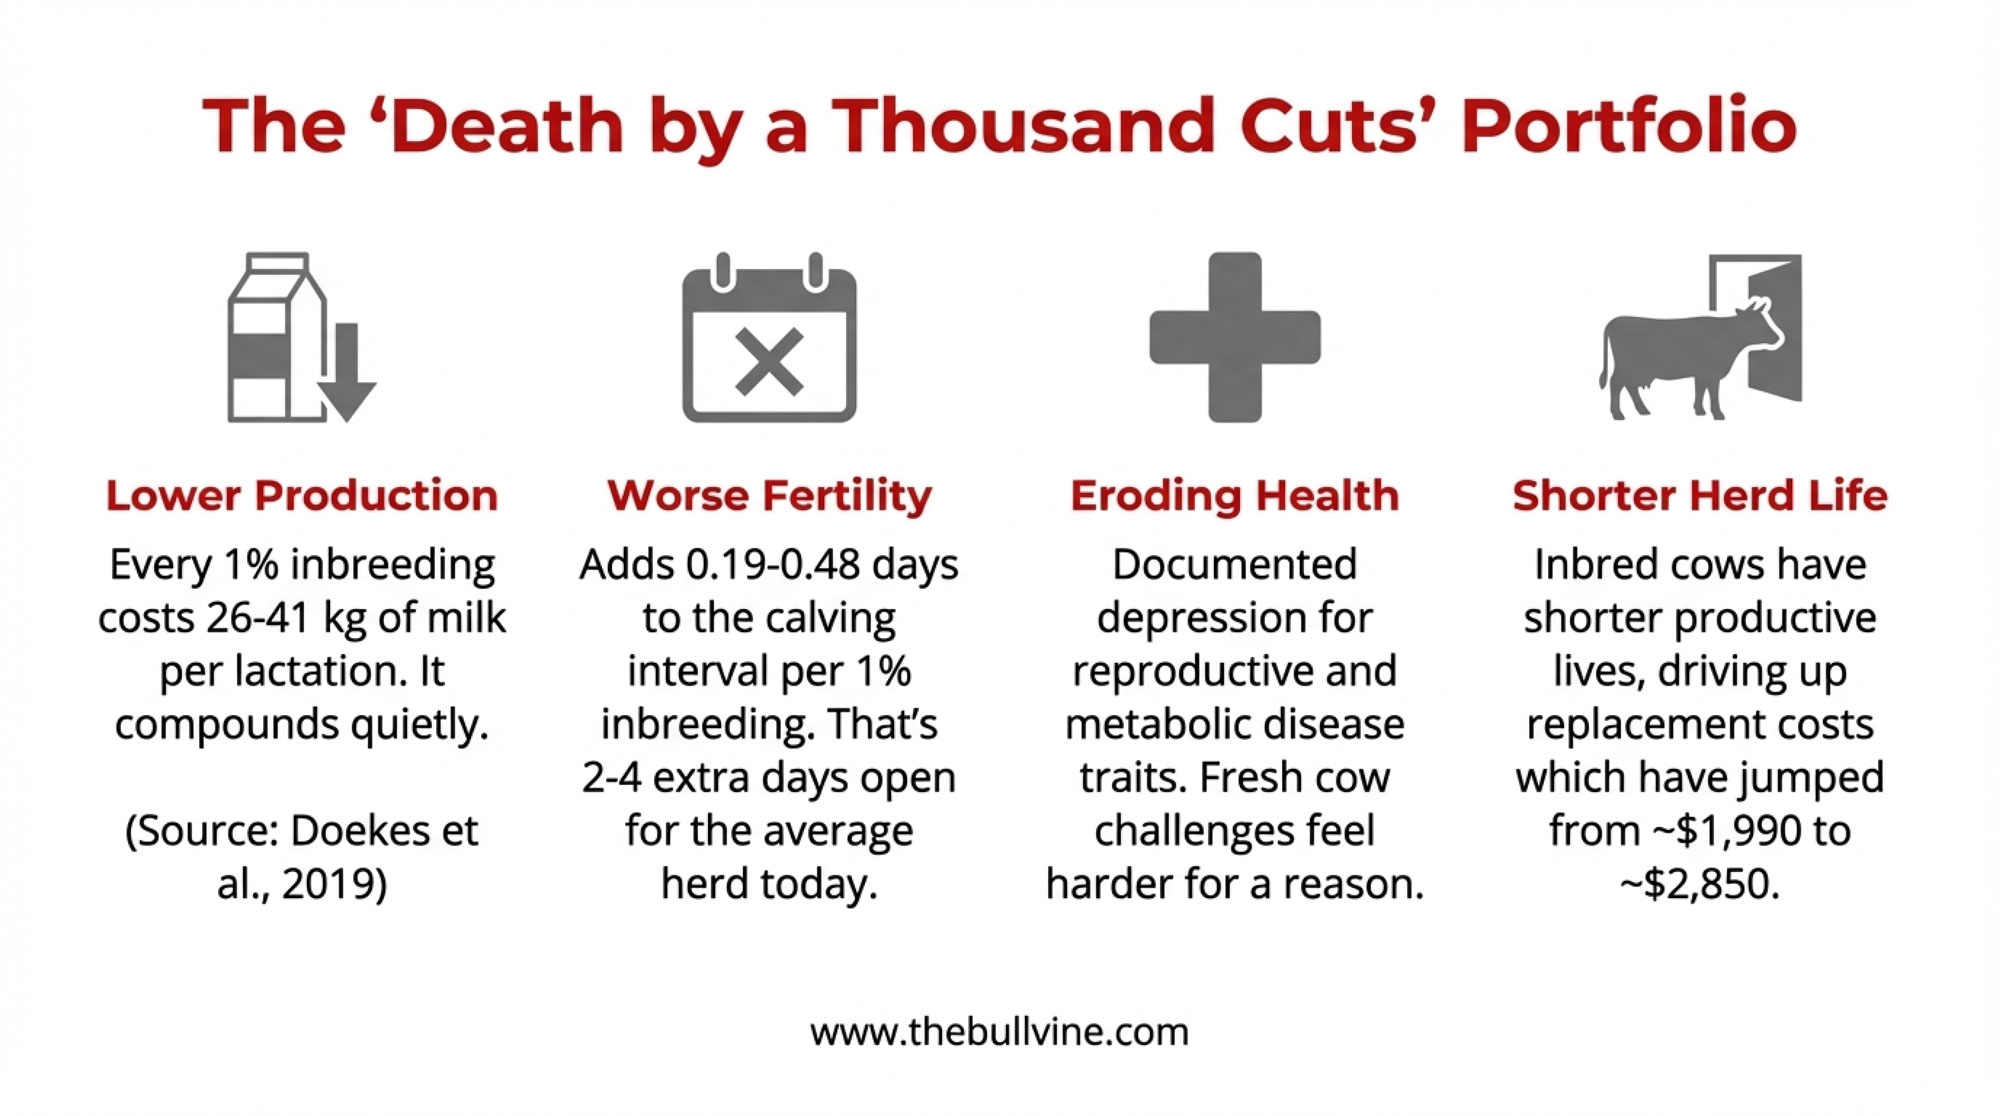
- Production losses add up quietly. Research published in Genetics Selection Evolution—including detailed work by Doekes and colleagues in the Netherlands—found that every 1% increase in genomic inbreeding costs roughly 26-41 kg of milk per lactation. Doekes specifically documented a 36.3 kg decrease in 305-day milk yield per 1% increase in runs of homozygosity. Not dramatic for any single cow. But across a herd and over multiple lactations? It compounds.
- Fertility takes a hit, too. That same body of research shows 0.19-0.48 additional days in the calving interval per 1% inbreeding increase. I know—sounds small. But if your herd is averaging 8-10% more inbreeding than a decade ago, that’s potentially 2-4 extra days open per cow. Talk to any reproductive specialist, and they’ll tell you what that costs over time.
- Health resilience erodes. U.S. research involving hundreds of thousands of Holstein cows has documented significant inbreeding depression for reproductive and metabolic disease traits. The cows aren’t necessarily falling over sick, but they’re not quite as resilient as they could be. Fresh cow challenges. Transition period issues. Mastitis susceptibility. All of these have genetic components that inbreeding can compromise. I’ve had several producers tell me their fresh cow management seems harder than it used to be, and while there are many factors involved, this may be part of the picture.
- Longevity shortens. Inbred cows tend to have shorter productive lives. And you know what replacement heifers cost these day, prices jumped from around $1,990 to $2,850. Getting four lactations instead of five from each cow changes your economics significantly.
Here’s what I find particularly telling: these are exactly the kinds of traits that don’t show up well on genomic evaluations. They’re low in heritability, hard to measure consistently, and easy to attribute to management rather than genetics.
The Numbers at a Glance
| Metric | Data |
| Holstein genomic inbreeding trend | Roughly tripled since 2014 |
| Current Holstein heifer average (Canada) | 9.99% for 2024-born animals |
| Cost per 1% inbreeding | $22-24/cow lifetime (1999 dollars) |
| Potential herd impact (200 cows) | $40,000-90,000 |
| Annual rate of increase | Approximately 0.35-0.44% per year |
Data from Council on Dairy Cattle Breeding trend reports; Lactanet Canada August 2025; Cassell et al. 1999, Journal of Dairy Science; Doekes et al. 2019, Genetics Selection Evolution
What’s Behind the Trend
So why has inbreeding accelerated so dramatically? Several factors are working together, and here’s what’s worth understanding—each one made sense as an individual decision.
- Genomic selection changed the timeline. Before genomics, progeny testing meant waiting 5-7 years to know if a bull was actually delivering what his numbers promised. Now we can identify elite genetics essentially at birth. That’s genuinely powerful, and it’s driven tremendous progress. But it also means popular sire lines spread through the population much faster than they used to. Bulls that would have taken a decade to significantly influence breed genetics now achieve similar penetration in 3-4 years. The genetics are better—but they’re also more concentrated.
- Sexed semen reshaped breeding patterns. The technology has been transformative for heifer inventory management. Data from the UK’s Agriculture and Horticulture Development Board shows sexed semen now accounts for 84% of all dairy semen sales in Great Britain—with Holsteins specifically hitting 88-89% by April 2024. North American adoption continues climbing, too. The economics make sense for individual operations. But here’s the tradeoff: before sexed semen, breeding elite cows with conventional dairy semen produced roughly 50% bull calves, giving AI organizations a large pool of potential sires to evaluate. Today, that pipeline has narrowed considerably.
- Beef-on-dairy became standard practice. And for good reason—those calves are worth real money, and the quality has improved dramatically. The National Association of Animal Breeders reported that beef semen represented about 31% of total semen sales to dairy operations in 2023, and Farm Bureau data from early 2025 indicates 72% of dairy farms now use beef genetics on at least part of their herd. That’s a rational economic decision for most operations. But combined with sexed semen on your top-end genetics, it means fewer Holstein matings overall. Canadian data from Lactanet shows Holstein-on-Holstein breedings have dropped from the mid-90s percent range to around three-quarters of matings in recent years
- Industry structure evolved. This one’s worth understanding because it affects sire availability. Lactanet Canada’s analysis shows that between 2014 and 2019, bulls from AI-owned dams increased from 34% to 52% of marketed young bulls. I want to be clear about something: this isn’t a criticism of AI companies. They’re doing what makes business sense—investing in elite genetics and accelerating progress. And they’ve developed real tools to help manage inbreeding. But the concentration does have implications for genetic diversity that are worth being aware of when you’re making breeding decisions.
The Industry Perspective
It’s worth acknowledging that AI organizations aren’t ignoring this issue—far from it. Most major companies now offer mating programs that calculate genomic relationships and help avoid closely related matings. Tools like ABS’s Genetic Management System, Semex’s OptiMate, and similar platforms from other organizations are designed specifically for inbreeding management. These tools work, and they’re more sophisticated than what was available even five years ago.
And the industry has delivered real value. Various analyses suggest genomic selection has generated substantial economic benefit—potentially billions of dollars—through accelerated genetic progress over the past decade. That represents genuine improvement in production, health traits, and efficiency, as shown by milk checks and herd performance.
Here’s where it gets complicated, though. USDA geneticist Paul VanRaden and others have noted the fundamental tension: accepting slower genetic progress to manage inbreeding means potentially watching competitors move faster. For individual operations, using the highest-ranking bulls often makes economic sense regardless of relatedness. But when everyone does that, breed-wide inbreeding accelerates. It’s a classic collective action problem—individual optimization can lead to collective challenges.
Some countries have approached this differently. Nordic breeding programs in Denmark, Sweden, and Finland have historically weighted health, fertility, and longevity more heavily in their selection indexes—and their inbreeding trajectories look different as a result. Now, it’s not a perfect comparison. Different population sizes, different market conditions, different payment systems. But it does suggest that how we design selection indexes has real consequences for genetic diversity over time.
The question isn’t whether genomic selection has been valuable—it clearly has. The question is whether we’re fully accounting for all the costs alongside the benefits, and whether there are adjustments worth considering.
What a Decade of Crossbreeding Data Actually Shows
Here’s where the conversation gets really interesting: while most of the industry focused on maximizing genetic indexes in purebred Holsteins, researchers at the University of Minnesota spent 10 years collecting data on an alternative approach.
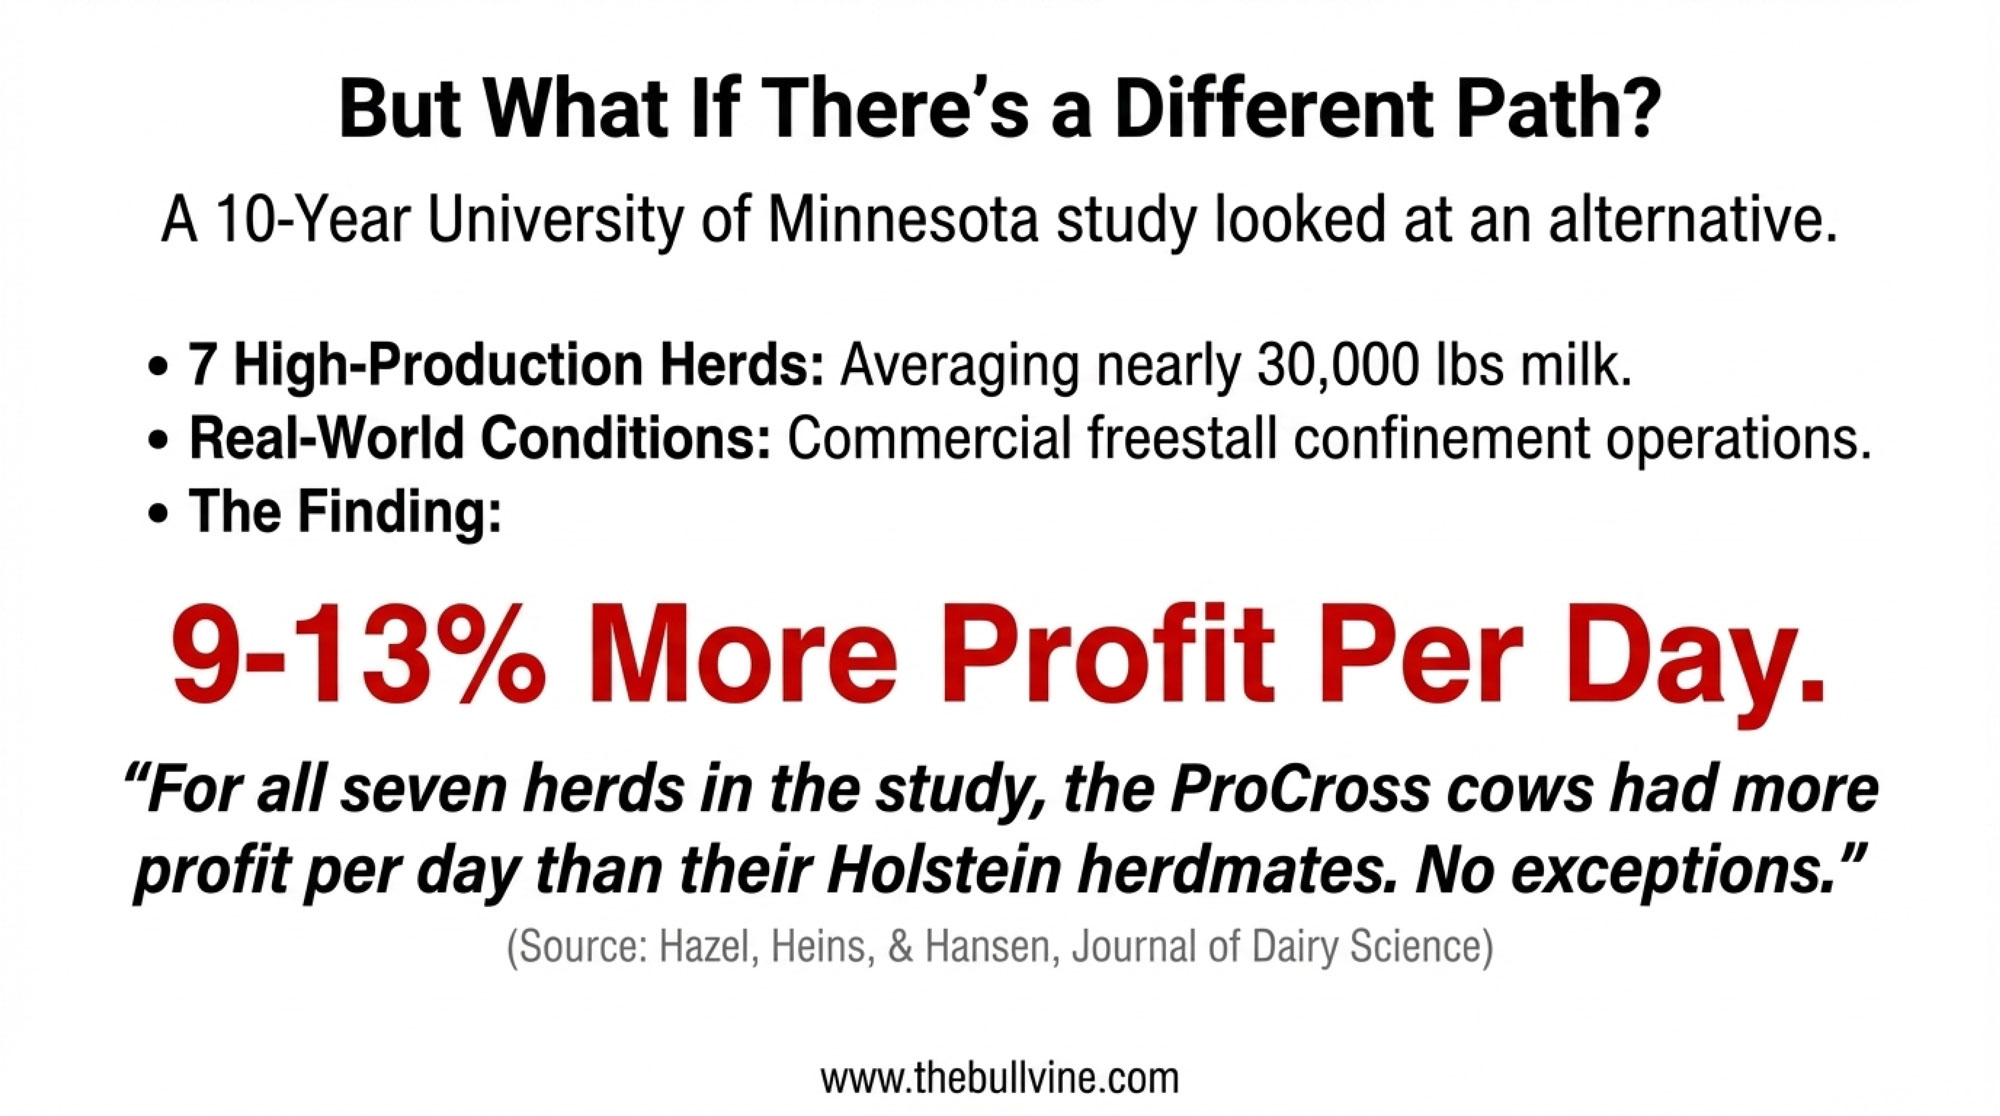
This wasn’t some small-scale grazing experiment or low-input system. These were seven high-producing herds averaging just under 30,000 lbs milk per cow—freestall confinement operations that would look familiar to commercial dairies across the Upper Midwest and beyond. The kind of herds where management is tight, and expectations are high.
The findings, published by Amy Hazel, Brad Heins, and Les Hansen in the Journal of Dairy Science, got my attention:
“For all seven herds in the study, the ProCross cows had more profit per day than their Holstein herdmates,” the researchers concluded. Not some of the herds. All seven.
| Performance Metric | Holstein (Baseline) | Crossbred Advantage |
|---|---|---|
| Daily Profit | Baseline | +9-13% higher |
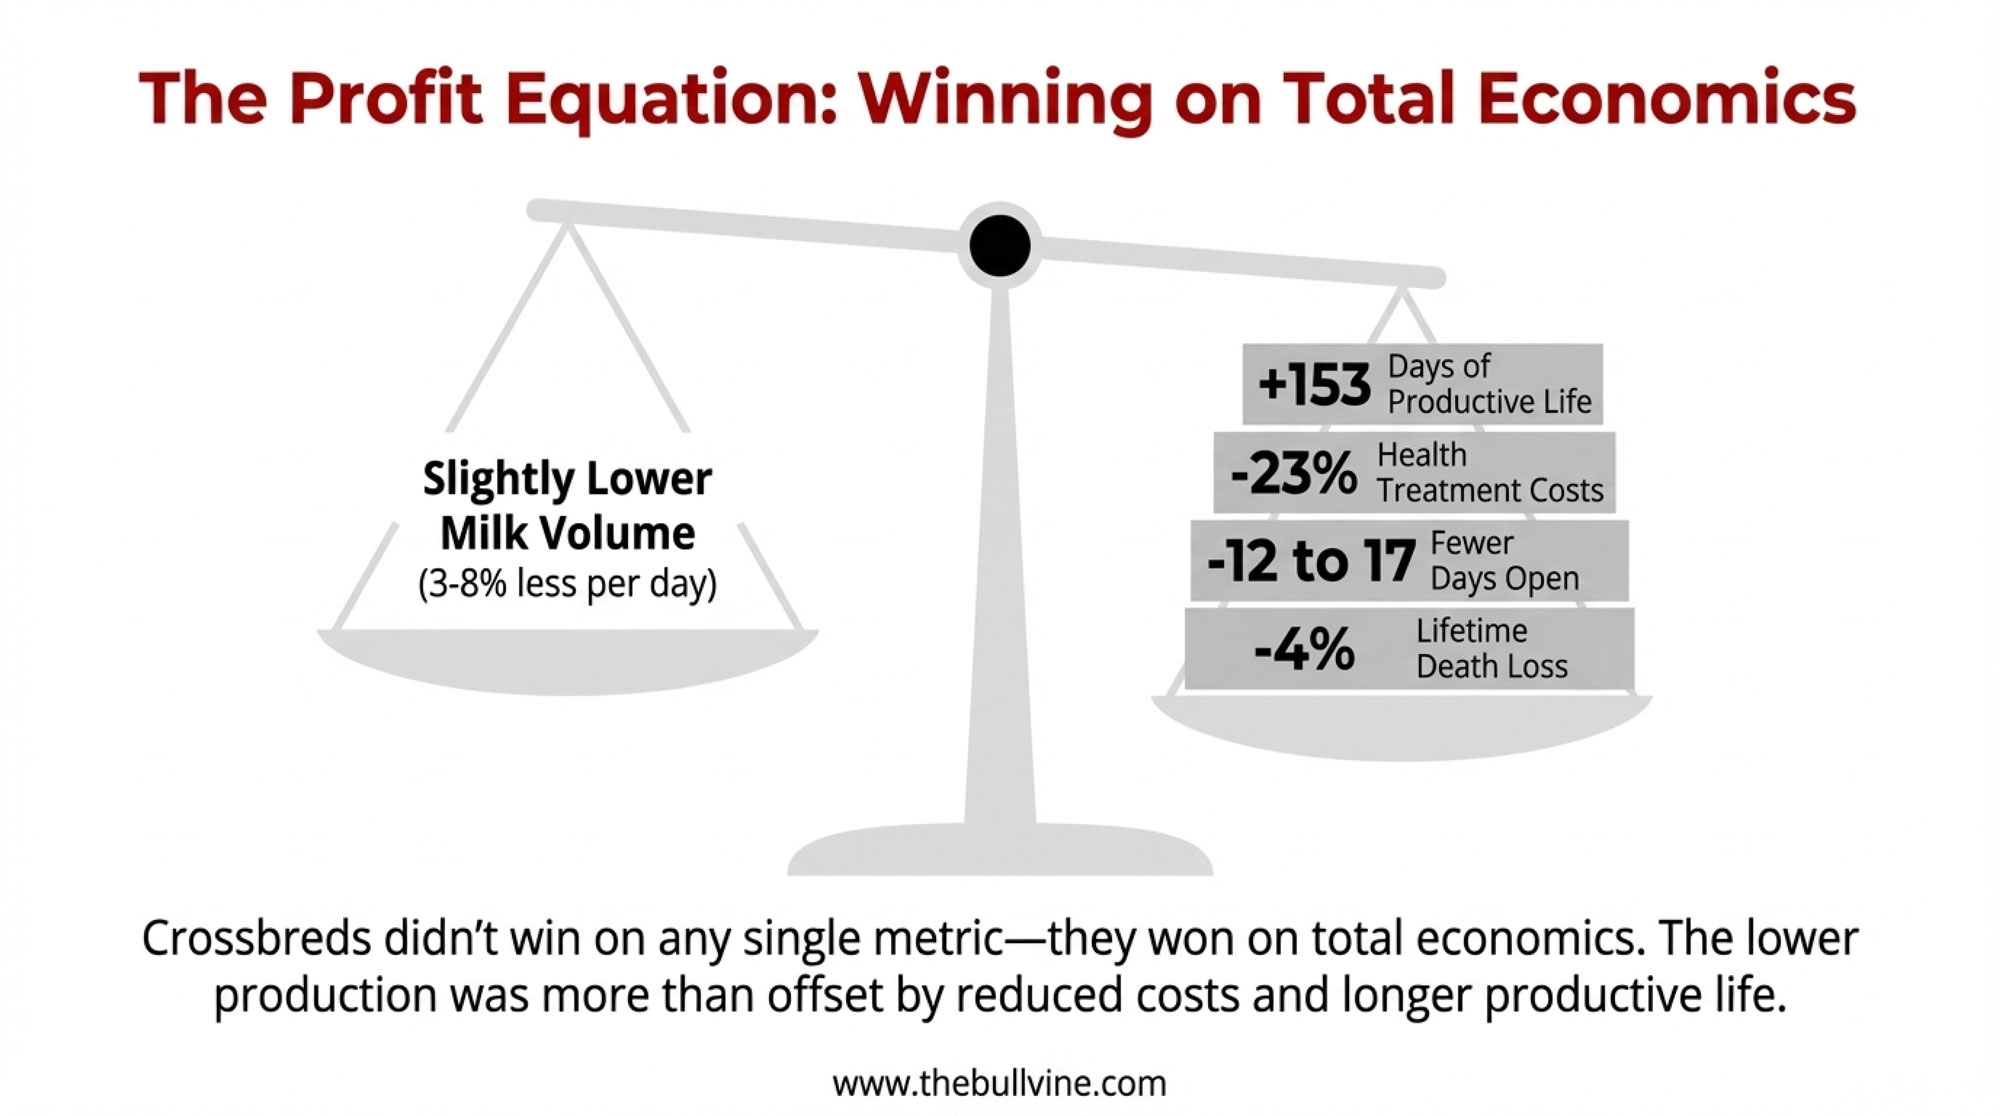
| Herd Life | Baseline | +153 days |
| Health Treatment Costs | Baseline | 23% lower |
| Days Open | Baseline | 12-17 fewer days |
| Stillbirth Rate | Baseline | Lower |
| Lifetime Death Loss | Baseline | 4% lower |
Now, I can hear the question you’re probably asking: “What about production?” Fair point. Crossbred cows in these studies did produce somewhat less milk per day than their purebred Holstein herdmates—typically 3-8% less in early generations, depending on the specific cross and lactation.
But here’s what the data showed: the lower production was more than offset by reduced costs and longer productive life. The crossbreds weren’t winning on any single metric—they were winning on total economics. Lower vet bills, fewer reproductive interventions, and more lactations per cow.
Producer Case Study: Cunningham Dairy, Iowa
Kelly and Christy Cunningham lost their fluid milk market in 2017 and began looking for a cow that would produce high components with a moderate size. Their search led them to the ProCross program. After purchasing cattle from three established ProCross herds through Creative Genetics and beginning their own breeding program, they now keep detailed comparative records on their crossbred and Holstein groups.
Their results:
- Days open: ProCross cattle are open 22 days less than Holsteins
- Pregnancy rates: 4-5 percentage points higher than Holsteins
- Fresh cow health events (ketosis, metritis, DA, milk fever, retained placenta): Half of what they experience with Holsteins
- Mastitis and pneumonia: More than 50% less than Holsteins
- Health costs: $0.28/cow/day, lower than Holsteins
- Dry matter intake: 4-10% less for ProCross cows
- Components: +0.3% fat and +0.2% protein compared to Holsteins
“We are very pleased with the ProCross cattle,” Kelly says. “We have realized better components, better health, better reproduction, and lower herd turnover rate. As our ProCross herd matures, milk volume and ECM are improving compared to Holsteins.”(Source: Creative Genetics of California / ProCross testimonials)
| Performance Metric | Holstein | ProCross | Winner |
|---|---|---|---|
| Days Open | Higher by 22 days | Baseline | ProCross |
| Pregnancy Rate | Lower by 4-5% | Baseline | ProCross |
| Fresh Cow Health Events | 2× higher | Baseline | ProCross |
| Mastitis & Pneumonia | 2× higher | Baseline | ProCross |
| Health Cost/Cow/Day | Higher by $0.28 | Baseline | ProCross |
| Dry Matter Intake | Higher by 4-10% | Baseline | ProCross |
European research published in the Journal of Dairy Science found similar patterns, noting that crossbreds achieved what researchers called a “win-win trade-off” on milk yield and fertility, while purebred Holsteins tended to show opposing trade-offs between the two. You could optimize heavily for one or the other, but getting both simultaneously was harder.
The mechanism behind this is well established in animal breeding: crossbreeding captures heterosis—hybrid vigor—which delivers approximately 5% improvement in production traits and 10-15% improvement in fertility, health, and survival. Those happen to be exactly the traits most affected by inbreeding depression. In a sense, crossbreeding reverses the inbreeding penalty while adding hybrid vigor on top.
Why More Farms Aren’t Crossbreeding
Given those results, you might wonder why rotational dairy crossbreeding remains relatively uncommon. I’ve had this conversation with producers across the country, and the reasons are worth understanding:
- Index comparisons get complicated. Crossbred animals can’t be directly compared to purebreds on TPI or NM$, making it harder to evaluate genetic merit with the tools most of us rely on. For operations that use indexes as their primary selection framework, this creates genuine uncertainty. How do you track progress generation over generation when you can’t use the same yardstick?
- Registration doesn’t fit. Breed associations require high purity thresholds—typically 87.5% or higher—for registration. If you’re selling breeding stock or involved in shows, crossbreds don’t work within that system.
- Semen availability takes more effort. The breeds used in successful crossbreeding programs—Viking Red, Montbéliarde—aren’t as widely distributed through major North American AI organizations. You have to seek them out, work with specialized suppliers, and sometimes pay more for shipping.
- Cultural factors are real. The dairy industry has deep roots in purebred genetics, and there’s social pressure—whether spoken or not—around breeding decisions.
For commercial operations focused primarily on milk production economics rather than registered genetics or show competition, these barriers may matter less than the profitability data suggests. But they’re real considerations, and I don’t think it’s helpful to dismiss them.
Practical Options for Your Operation
So what does this mean for your breeding decisions? It depends on your goals, your market, and honestly, your appetite for doing something different from your neighbors. Here’s how I’d think through the options:
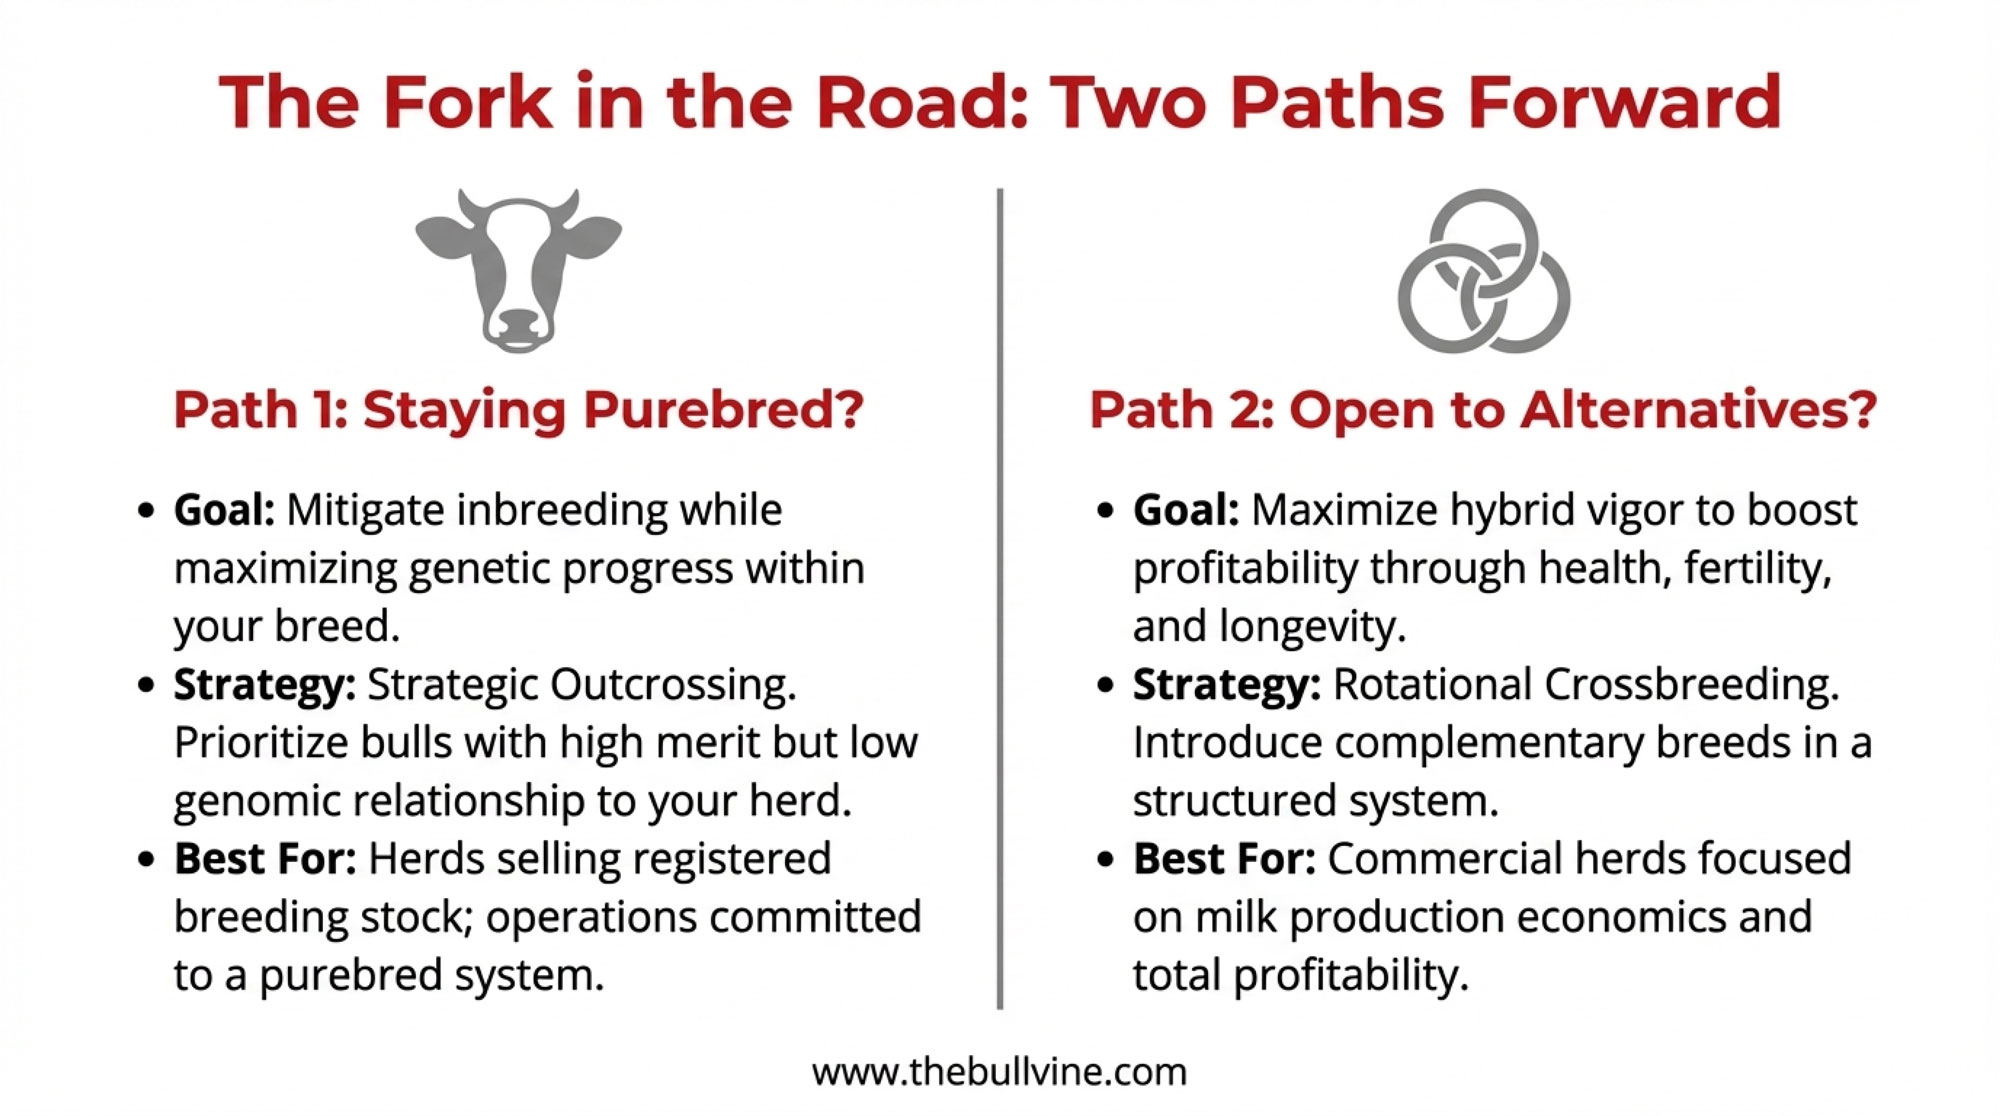
If You’re Staying Purebred
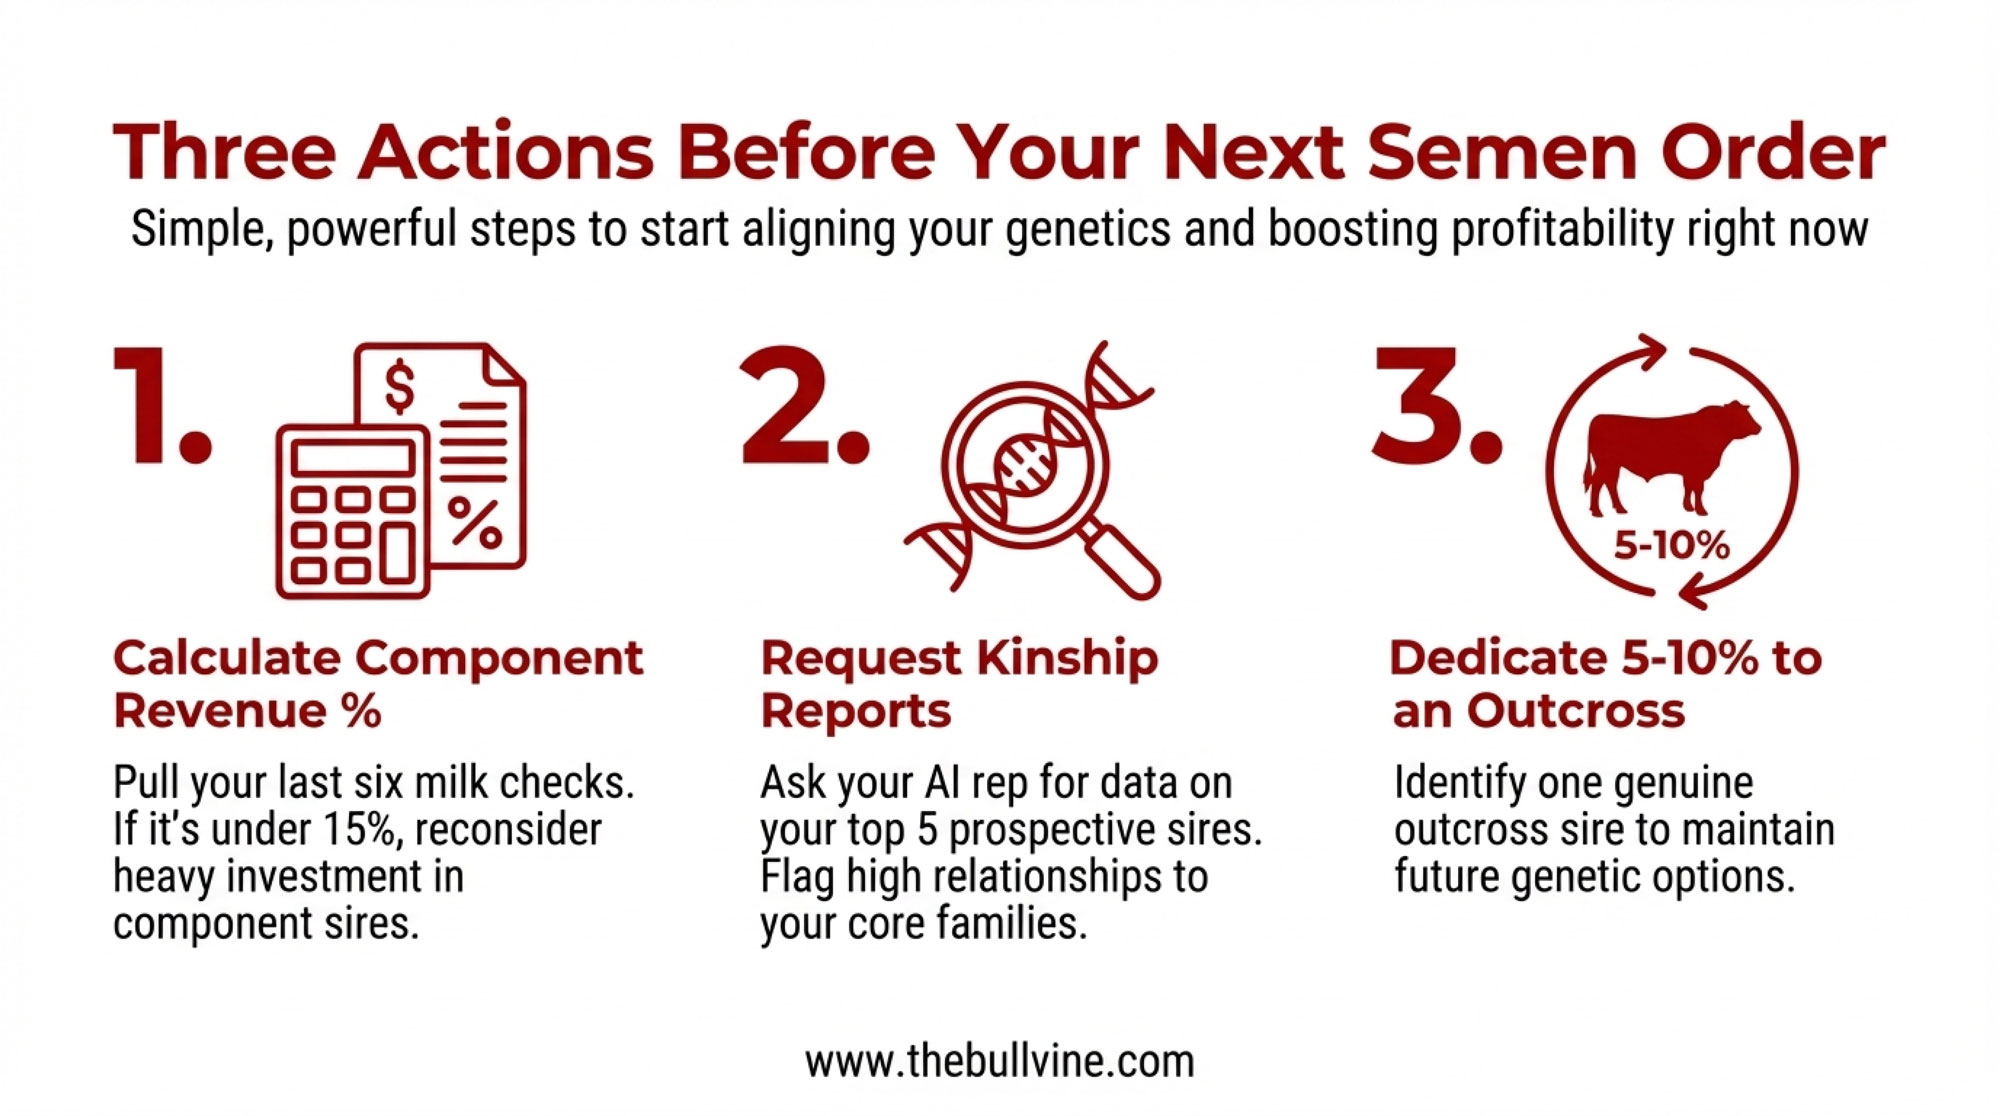
Strategic outcrossing offers a middle path that many operations are exploring. The concept is straightforward: identify bulls with high genetic merit but low genomic relationship to your herd. You’re prioritizing diversity alongside performance rather than just chasing the highest index numbers.
What that looks like in practice:
- Ask your AI representative for genomic relationship data, not just rankings. Most mating programs can generate this information—you just need to request it specifically.
- Look at bulls’ pedigrees for underutilized sire lines. Sometimes the second or third-ranked bull is a better fit for your herd’s genetic profile than the top option.
- Consider international genetics—Nordic, European, and New Zealand—that may be less related to dominant North American bloodlines.
- Use mating programs that penalize inbreeding, not just maximize index. Most major AI organizations offer this setting, but it’s not always the default.
What about cost? Here’s something worth knowing: outcross bulls aren’t necessarily more expensive than top-ranked conventional options. Pricing depends more on proof of reliability and demand than on relatedness. In many cases, you can find bulls with strong genetic merit and lower relationship to your herd at comparable prices—you just have to ask specifically for that combination. Your AI rep can run the numbers for your situation.
Another option worth considering: use conventional semen on some of your top genetics. Sexed semen makes sense for maximizing heifer production, but using conventional semen on elite cows preserves the option for producing bull calves—potentially valuable if you’re interested in contributing to genetic diversity or selling to AI organizations looking for outcross genetics.
And here’s something important: for herds with high genetic merit that actively sell breeding stock into competitive registered markets, intensive purebred selection may remain the right strategy despite higher inbreeding levels. The premium prices for elite genetics can offset the inbreeding costs, and your market position depends on staying at the leading edge. Know your situation and your numbers.
If You’re Considering Crossbreeding
A measured approach lets you learn without betting the whole operation:
- Start with 20-30% of your herd. This gives you enough animals to genuinely evaluate performance under your specific conditions—your feed program, your facilities, your management style—without a wholesale transformation. You’ll learn a lot in three years.
- Choose breeds with research backing. Three-breed rotations using Holstein × Viking Red × Montbéliarde have the strongest long-term data behind them. The UMinn research specifically validated this combination in high-production environments.
- Plan for the timeline. First crossbred daughters will calve approximately 3 years after initial breeding decisions. This isn’t a quick fix—it’s a strategic shift that requires patience.
- Focus on commercial females. Crossbreeding strategies work best for cows whose daughters will enter your milking herd rather than the breeding stock market.
Organizations like Creative Genetics and Viking Genetics offer crossbreeding-focused programs and technical support if you want to explore this direction seriously.
Regardless of Which Direction You Go
Track your herd’s genomic inbreeding over time. Request runs of homozygosity (FROH) data from your genomic testing provider—Zoetis, Neogen, whoever you’re working with. Compare your herd average to breed benchmarks, and watch how it trends over generations.
And have a direct conversation with your AI rep. Ask specifically: “What are my outcross options? Which bulls in your lineup would reduce my herd’s average relatedness?” You might be surprised at what’s available when you ask the right questions.
A Few Things I’m Watching
A few developments worth keeping an eye on over the next several years…
- Effective population size is a metric geneticists use to gauge long-term genetic health. Research published in the Journal of Heredity and elsewhere suggests that when effective population size drops below 50, populations face accelerated genetic drift and loss of rare alleles—genetic variation that can’t be recovered once it’s gone. Various studies estimate Holstein effective population size somewhere between 50 and 100, depending on methodology, which is why researchers are paying closer attention than they were a decade ago.
- Evaluation systems may evolve. Some European breeding programs have begun incorporating inbreeding penalties into their selection indexes, rewarding bulls that combine high genetic merit with genetic diversity. If North American programs move in this direction—and there’s been discussion about it—that could shift which bulls rise to the top of rankings.
- The math that keeps me up at night: At current accumulation rates of 0.35-0.44% per year, breed-average inbreeding will add another 2-3.5 percentage points by 2030. That’s $44-158 per cow in additional silent losses—already baked in unless breeding decisions change. The cows being bred this year will be milking through that reality.
Here’s how I think about it: You don’t buy fire insurance because you expect your barn to burn down. But you’re glad you have it if something unexpected happens.
Reader Challenge: What’s Your Herd’s Inbreeding Level?
Here’s something I’d genuinely like to know: What does your herd’s average genomic inbreeding look like?
Pull up your latest genomic herd report—whether it’s from Zoetis, Neogen, or another provider—and find your herd’s average FROH (runs of homozygosity) or genomic inbreeding percentage.
Drop your number in the comments below. No judgment here—we’re all dealing with the same industry trends. But seeing where different operations land could start an interesting conversation about what’s realistic to manage and what strategies are actually working.
If you’ve been actively using outcross sires or implementing crossbreeding, I’d especially like to hear how your numbers compare to where you started.
Not sure where to find this data? Your genomic testing provider can generate a herd inbreeding summary—you just need to ask for it.
Key Takeaways
- The economics are real, even if they’re hard to see. Research from Virginia Tech found that each 1% increase in inbreeding costs approximately $22-24 per cow in lifetime profit. With breed-average inbreeding up substantially over the past decade—Lactanet Canada now reports 9.99% for 2024-born Holstein heifers—that represents meaningful money. Potentially $200-400 per cow that doesn’t appear on any line item but affects your bottom line.
- Crossbreeding data is more compelling than many realize. The University of Minnesota’s 10-year study found crossbred cows delivered 9-13% higher daily profit across seven high-producing commercial herds. The advantages came from longer productive life, lower health costs, and better fertility. This was a decade of real data from real operations.
- You have options within purebred programs. Strategic outcrossing—prioritizing bulls with high merit and low relationship to your herd—can slow inbreeding accumulation while maintaining genetic progress. The tools exist, outcross genetics are often competitively priced, and good AI reps can help you use them.
- Track what matters to your operation. Request genomic inbreeding data on your herd and watch trends over time. Ask your AI representative specifically about outcross options, not just top rankings.
- Match your strategy to your goals. Crossbreeding makes most sense for commercial operations focused on milk production economics. If you’re selling registered breeding stock into competitive genetic markets, intensive purebred selection may still be your best path. Neither approach is wrong. They’re optimizing for different outcomes.
The goal isn’t to abandon genomic selection—it’s delivered tremendous value to our industry. But making breeding decisions with full awareness of the trade-offs helps ensure short-term genetic gains don’t come at the expense of long-term herd profitability and resilience.
As with most decisions in dairy farming, the right answer depends on your situation. What’s changed is that we now have more data than ever to inform those decisions. The question is whether we’re willing to look at all of it, not just the parts that confirm what we’re already doing.
Key research referenced: Cassell, Adamec, and Pearson (1999), Journal of Dairy Science; Hazel, Heins, and Hansen, Journal of Dairy Science (ProCross study); Doekes et al. (2019), Genetics Selection Evolution; Council on Dairy Cattle Breeding trend data; Lactanet Canada August 2025 Inbreeding Update; AHDB sexed semen market reports; American Farm Bureau Market Intel.
Complete references and supporting documentation are available upon request by contacting the editorial team at editor@thebullvine.com.
Learn More
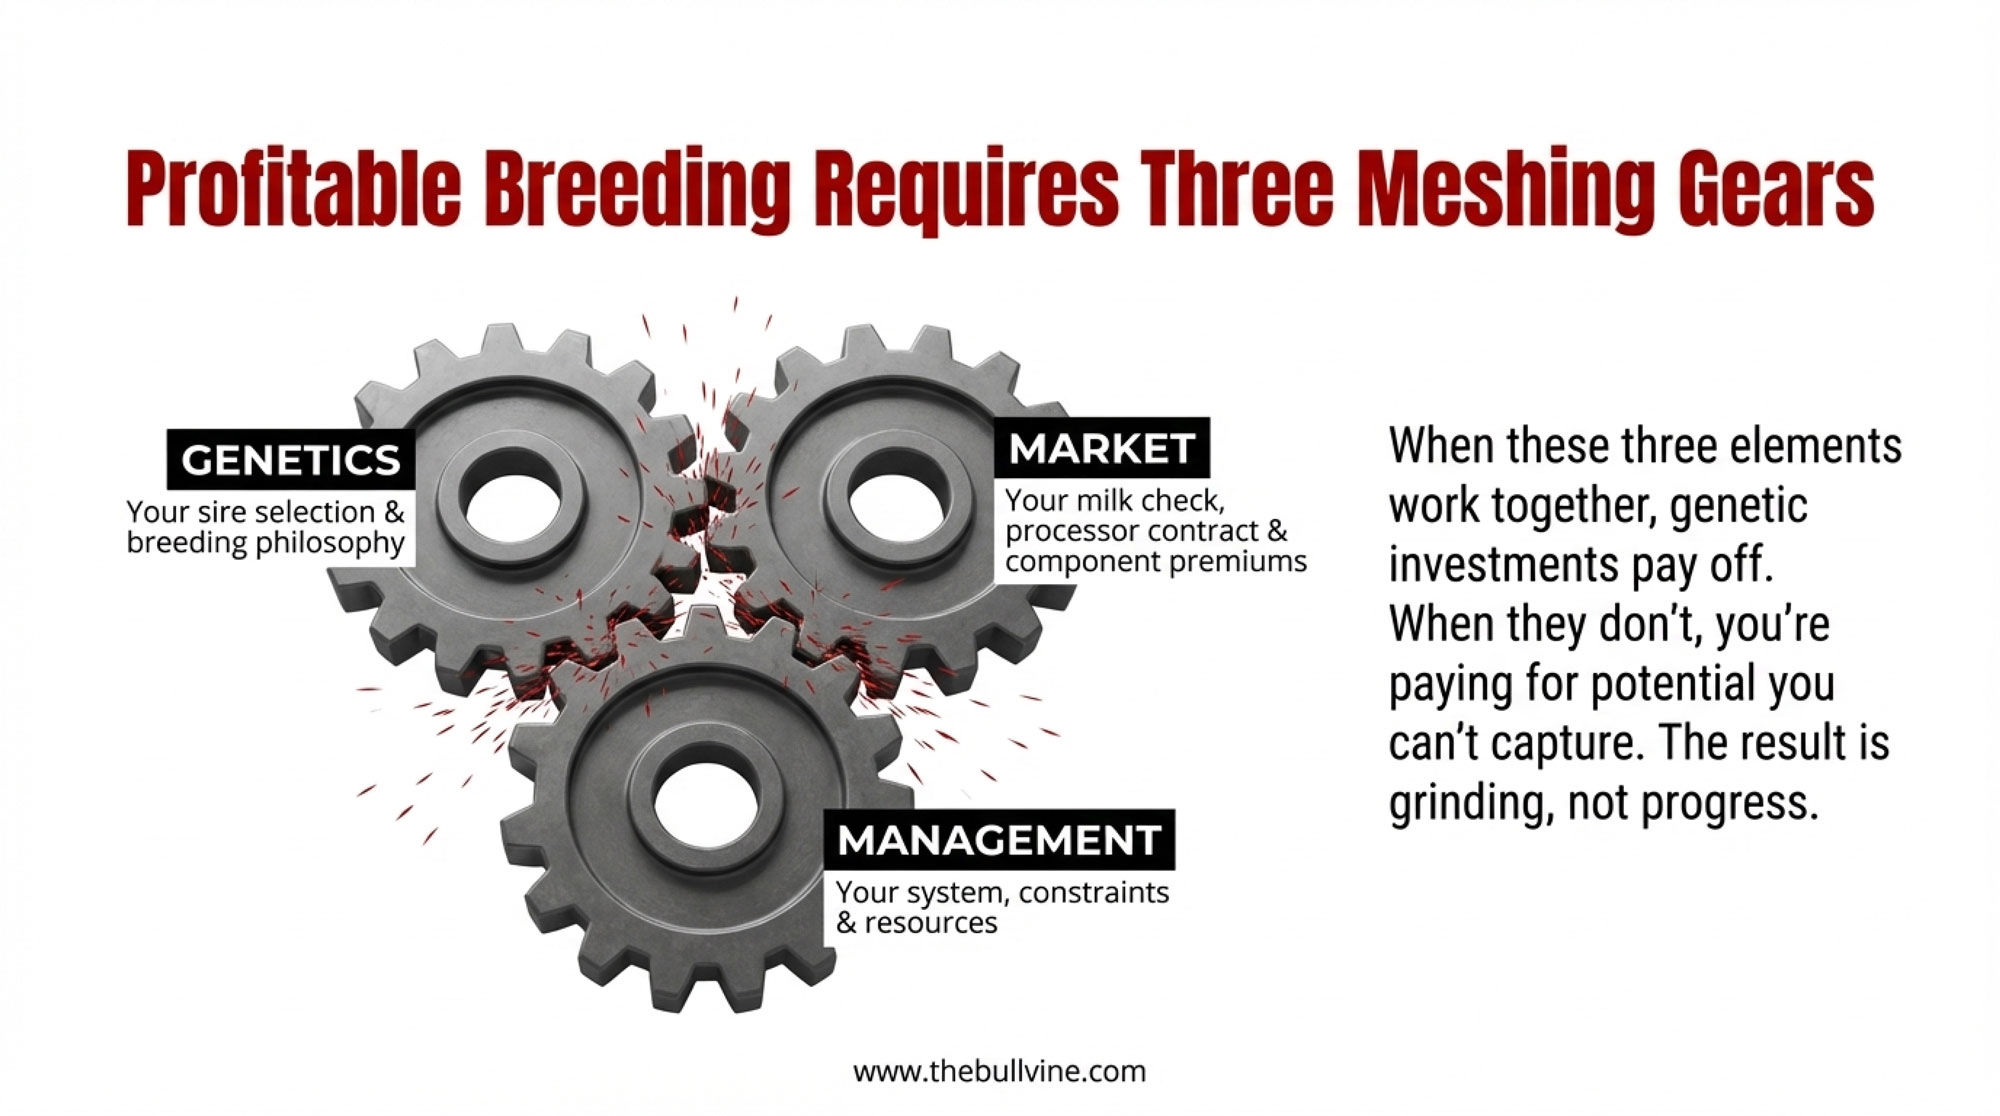
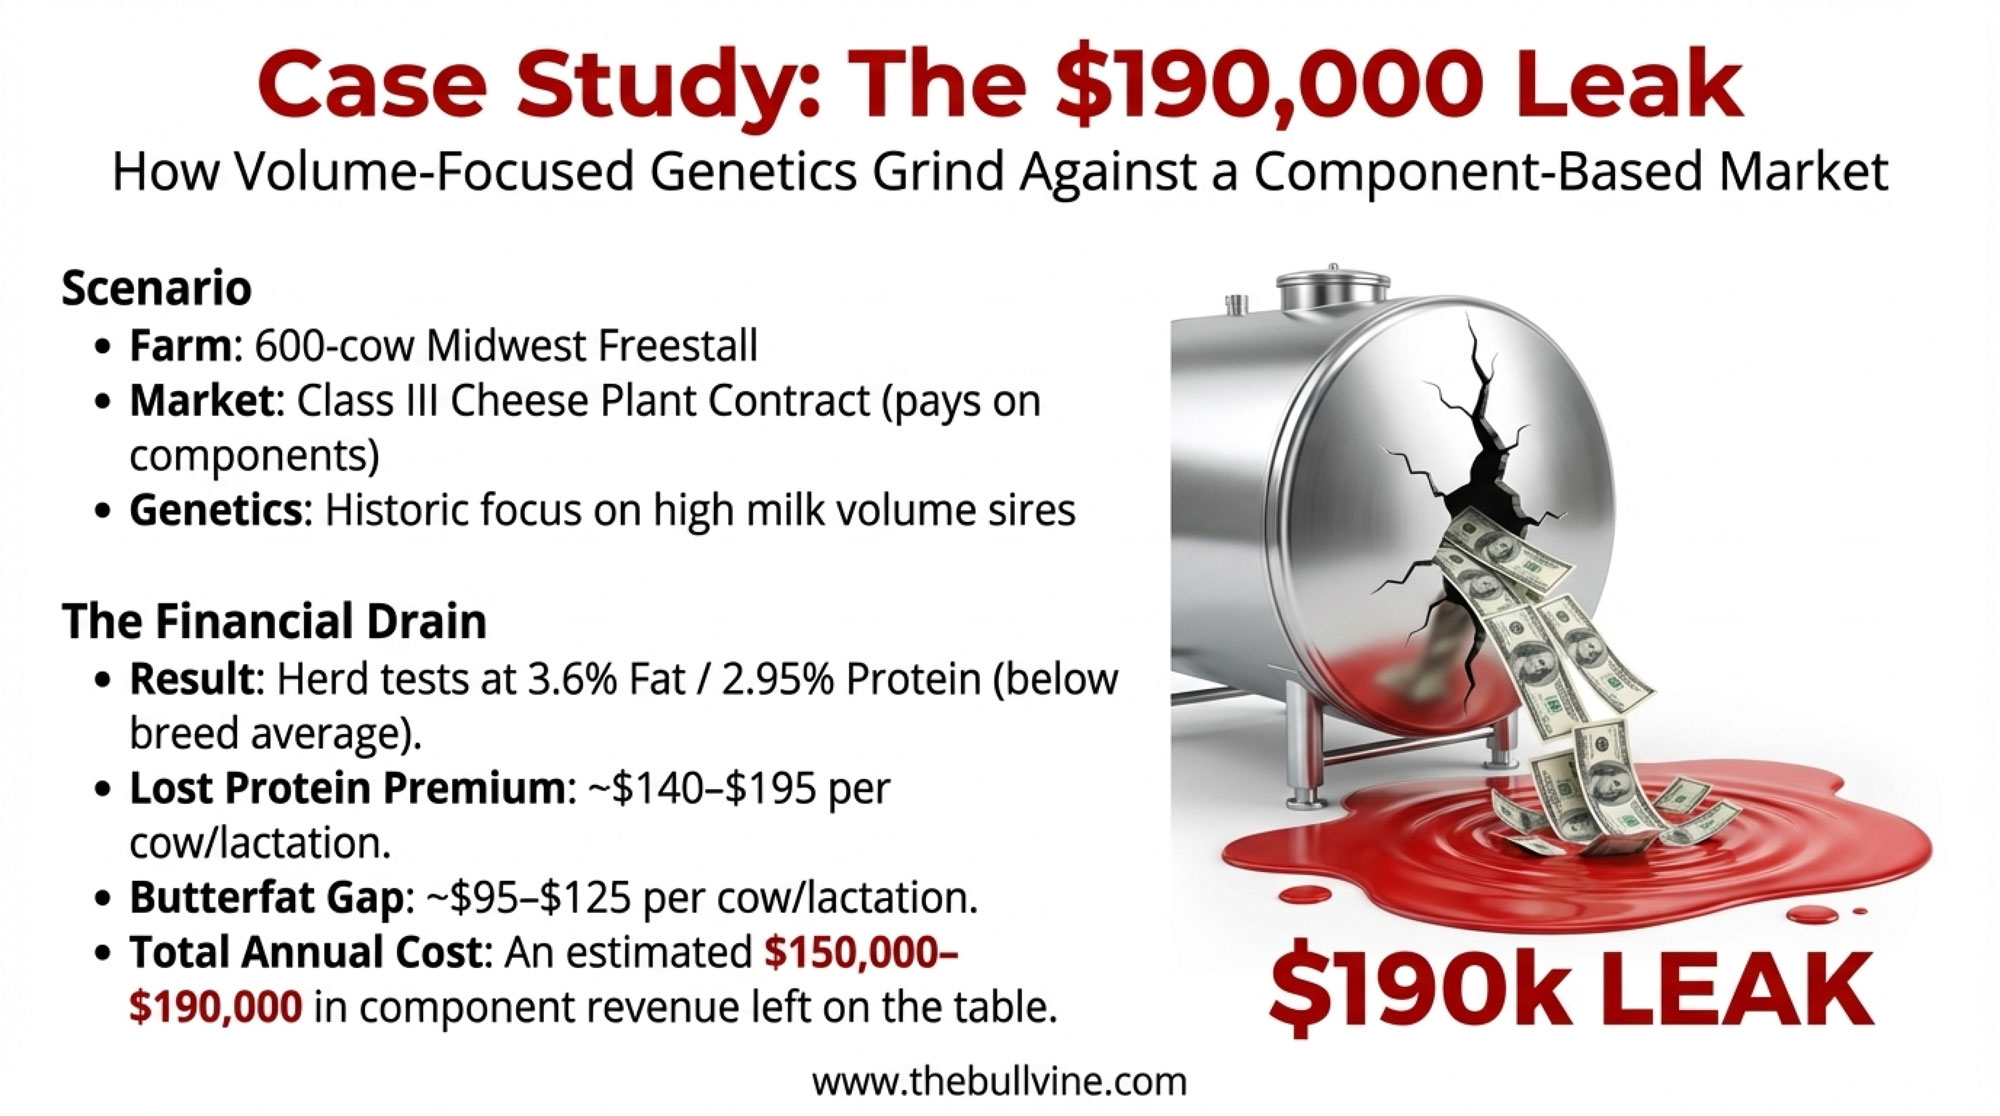
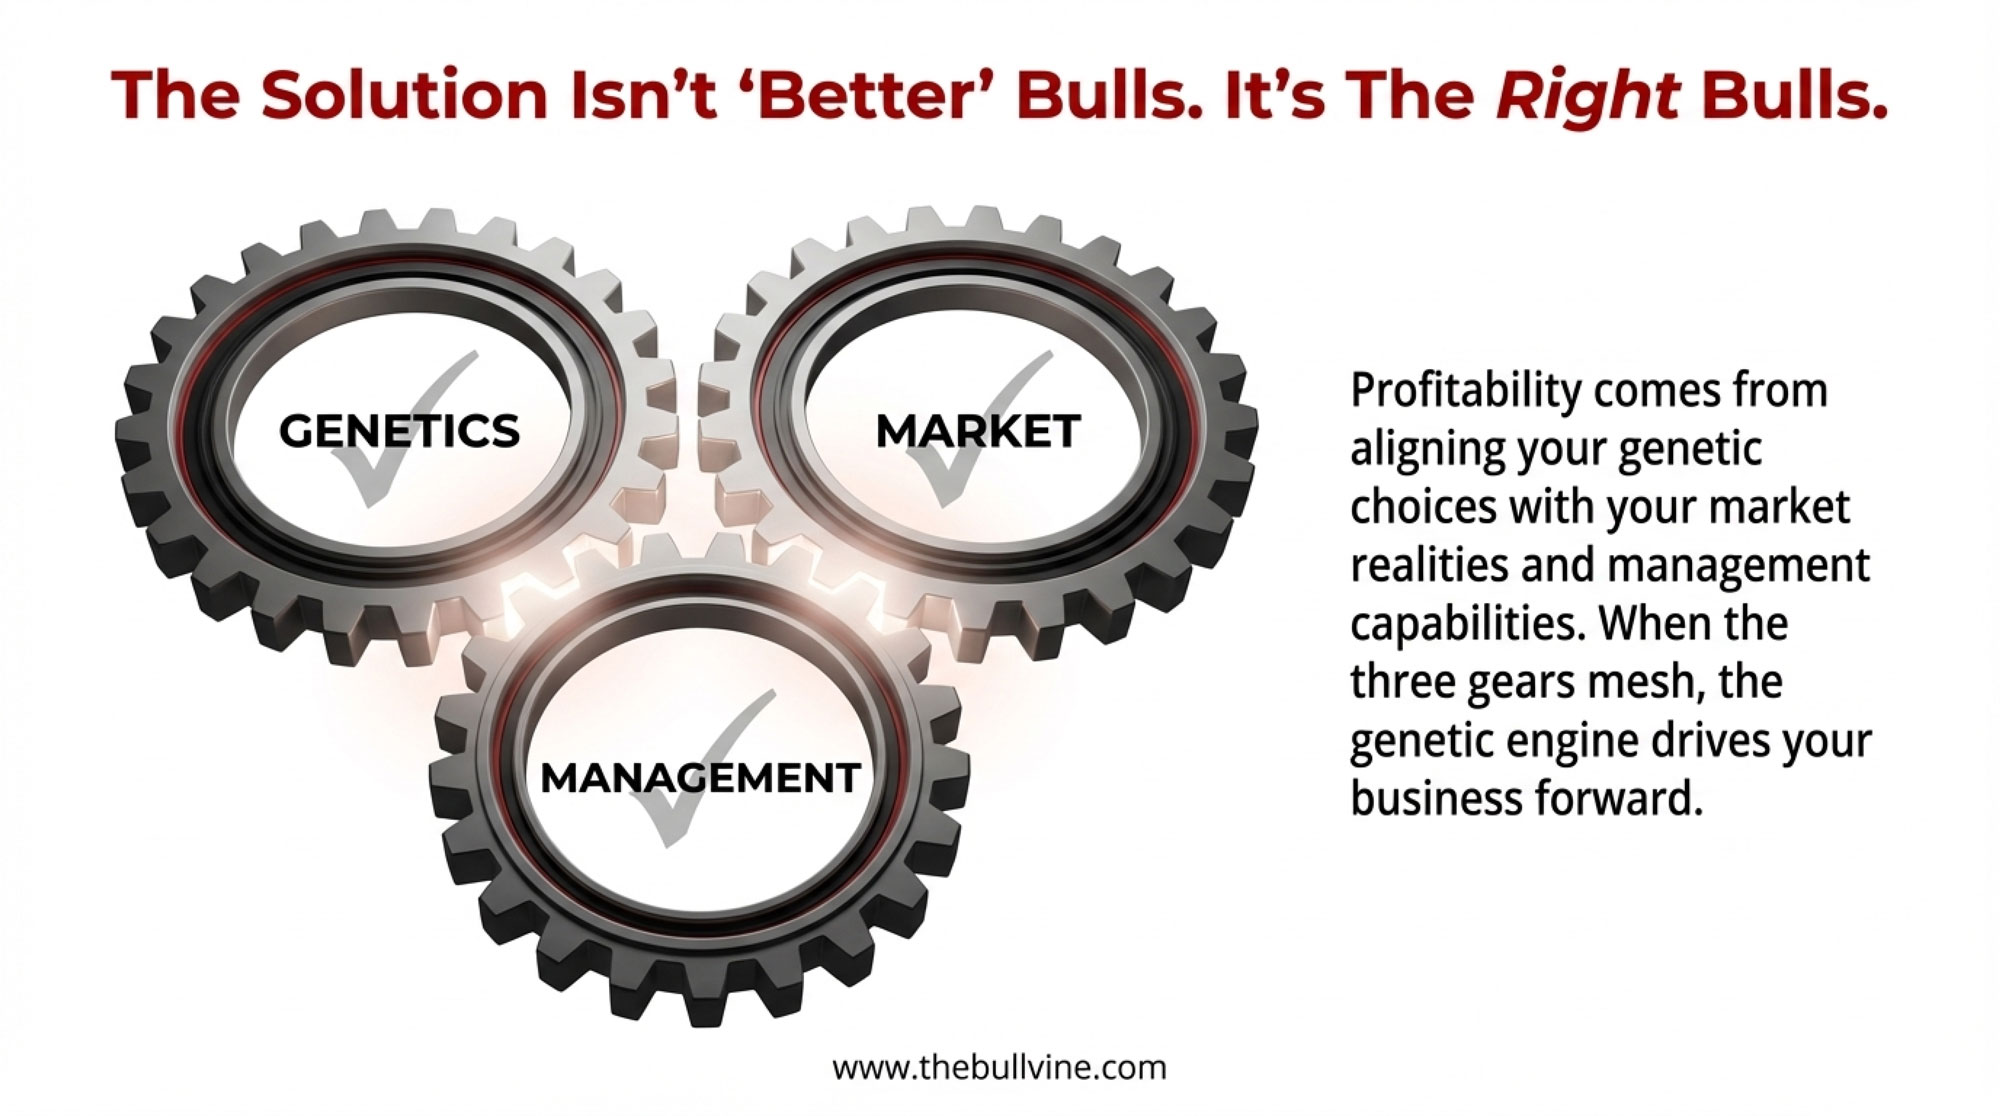
- Does Your Breeding Program Fit Your Milk Market? – Stop overpaying for genetic potential your market won’t reward. This guide delivers a tactical five-step audit to align your sire selection with processor payouts, exposing the hidden inbreeding drags that quietly siphon $190,000 from your annual revenue.
- 2025 Dairy Year in Review: Ten Forces That Redefined Who’s Positioned to Thrive Through 2028 – Future-proof your operation against the 27-month supply constraint. This briefing exposes the structural forces reshaping the industry through 2028, arming you with the long-term capital allocation strategies needed to thrive while heifer scarcity drives replacement costs upward.
- Genetic Revolution: How Record-Breaking Milk Components Are Reshaping Dairy’s Future – Gain a first-mover advantage as the genetic goalposts shift. This analysis breaks down how AI and microbiome PTAs are transforming selection, revealing the emerging tools that will define high-efficiency, climate-resilient herds by the turn of the decade.
 The Sunday Read Dairy Professionals Don’t Skip.
 The Sunday Read Dairy Professionals Don’t Skip.
Every week, thousands of producers, breeders, and industry insiders open Bullvine Weekly for genetics insights, market shifts, and profit strategies they won’t find anywhere else. One email. Five minutes. Smarter decisions all week.