Archive for farm financial strategy

The Real Reason Dairy Farms Are Disappearing (Hint: It’s Not About Better Farming)

Dairy success isn’t about better farming anymore—here’s the real force changing who survives and who sells out.

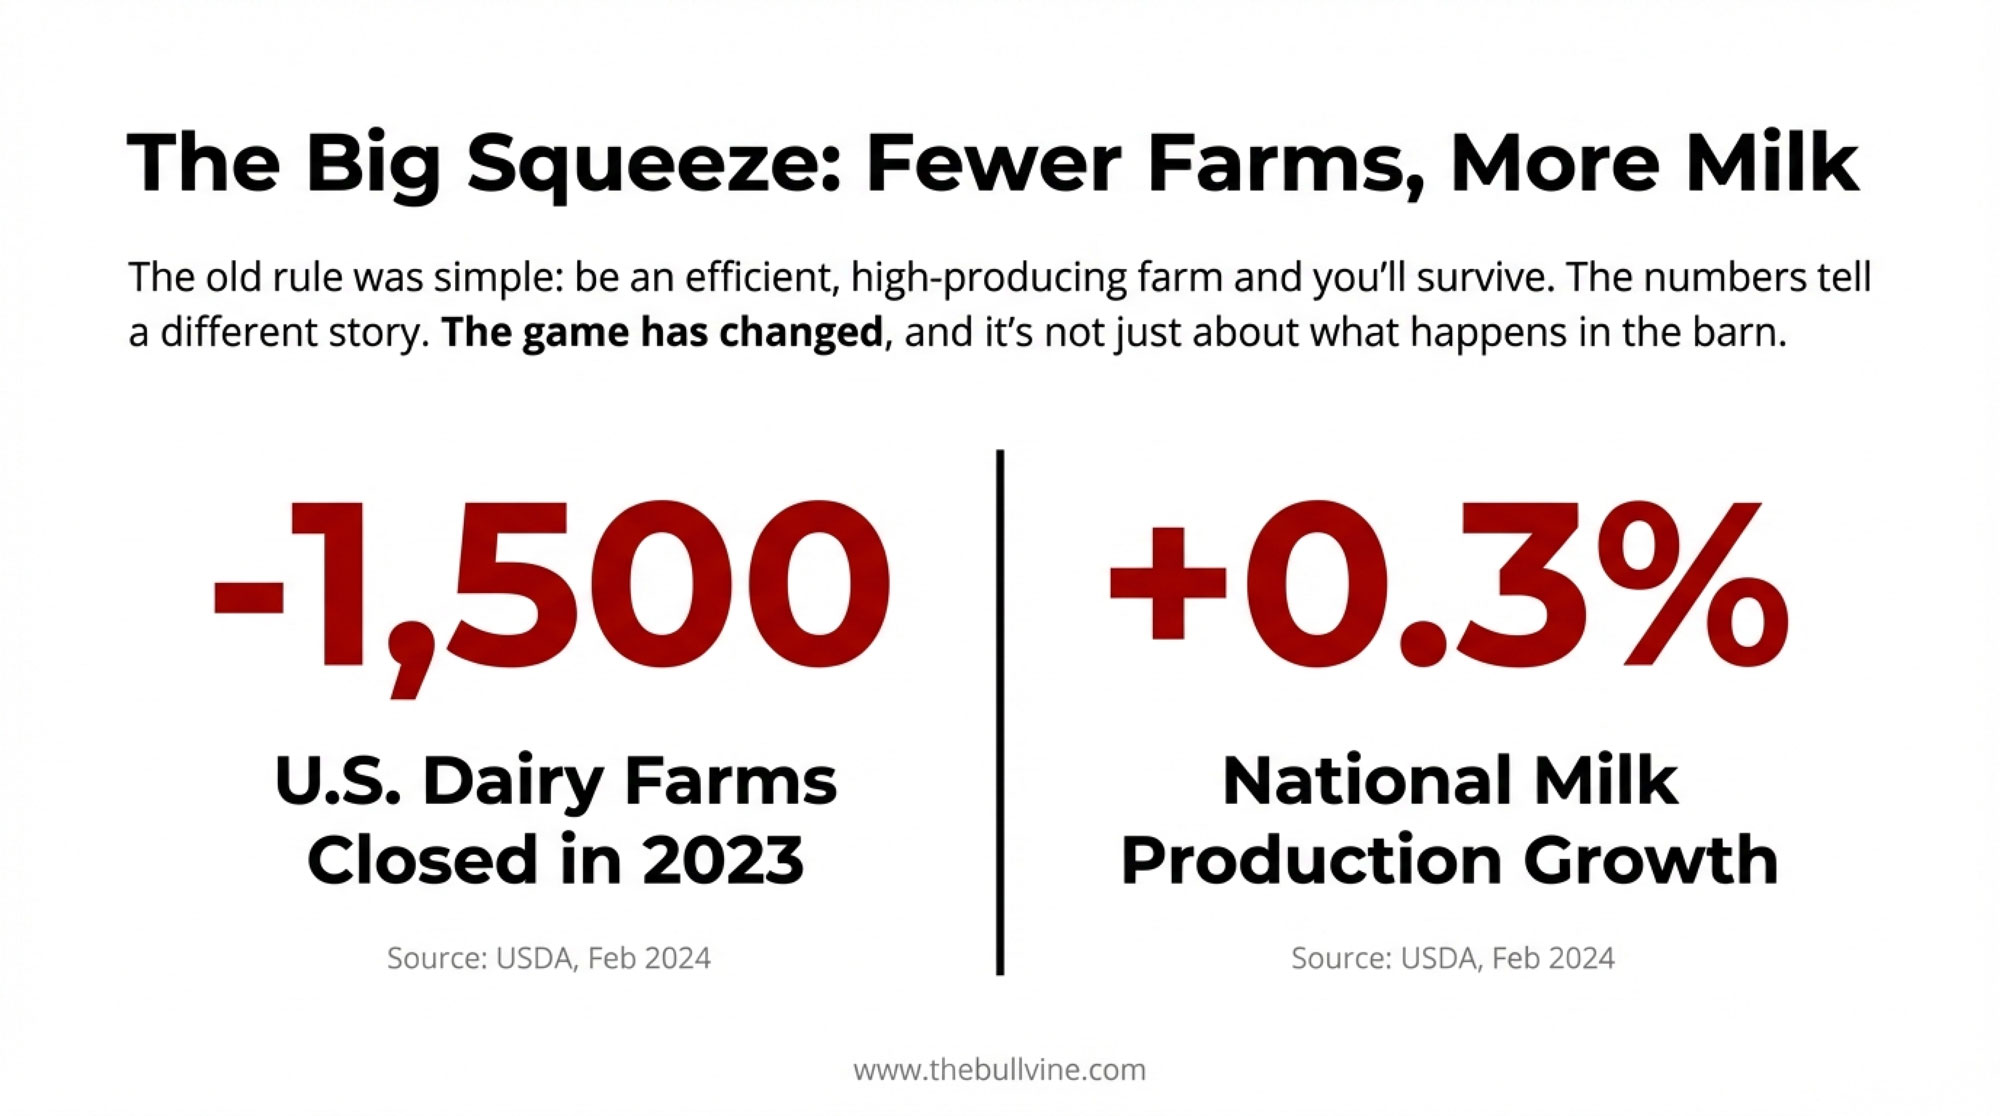
The February 2024 USDA report had a number that’s stuck with me: about 1,500 U.S. dairy farms closed in 2023, yet national milk production ticked higher. That’s not just abstract data—it’s what drives our conversations at kitchen tables and farm meetings across the country. Let’s talk through what’s really happening and what it means for the future.

U.S. dairy farming faces an existential consolidation crisis, with farm numbers plummeting from 39,300 operations in 2017 to a projected 10,500 by 2040—a 73% reduction driven by systematic structural advantages favoring mega-operations over traditional family farms, with 1,420 farms disappearing annually as of 2024.

Looking at How the Structure Has Shifted

Start with the numbers, because they’re telling: The 2022 Census of Agriculture shows about 65% of American milk now comes from just 8% of herds—those with over 1,000 cows. Meanwhile, nearly 9 out of 10 farms (the 100–500 cow group) account for only 22% of the supply. In the Northeast and Midwest, that’s still the “standard” size, but the playing field keeps tilting.

As one third-generation Wisconsin farmer shared, “I remember 13 dairies on our road, but now it’s just us. Plenty of the folks who exited were younger managers, not retirees. They just couldn’t get the numbers to work.”

Cost of production varies dramatically by herd size, with the smallest operations facing a devastating $9/cwt disadvantage that translates to $250,000 in annual losses for a typical 600-cow farm—a gap driven by scale advantages in feed purchasing, financing, and regulatory compliance rather than management quality.

Cornell’s Dairy Farm Business Summary for 2022 has it in black and white: the biggest herds report $22–$24/cwt cost of production. For 100–199 cow operations, the range is $31–$33/cwt. In a market where the base price is set by regional blend or federal order, that gap eats margin and equity fast.

Beyond Raw Efficiency: What’s Really Behind Cost Gaps

What’s interesting here is how much of the “efficiency” story isn’t really about cow management or even genetics anymore. I talked to a Central Valley manager running 5,000 cows who summed it up: “We buy grain by the unit train—110 railcars. Our delivered price is CBOT minus basis, sometimes 15 cents lower. My neighbor with 300 cows pays elevator price, plus haul; that’s 40, 50 cents more per bushel.”

It’s not just West Coast operations seeing this. In the Upper Midwest, neighbors share similar experiences. Volume buyers get priority and save dollars, not because they feed cows better, but because they can buy enough at once to command a discount.

Bring in finance, and the gap widens. Published rates show 2,000-cow herds receiving prime plus 0.5%. A 200-cow farm might see prime plus two. On a $1 million note, that’s more than $15,000 a year in extra interest just for being smaller.

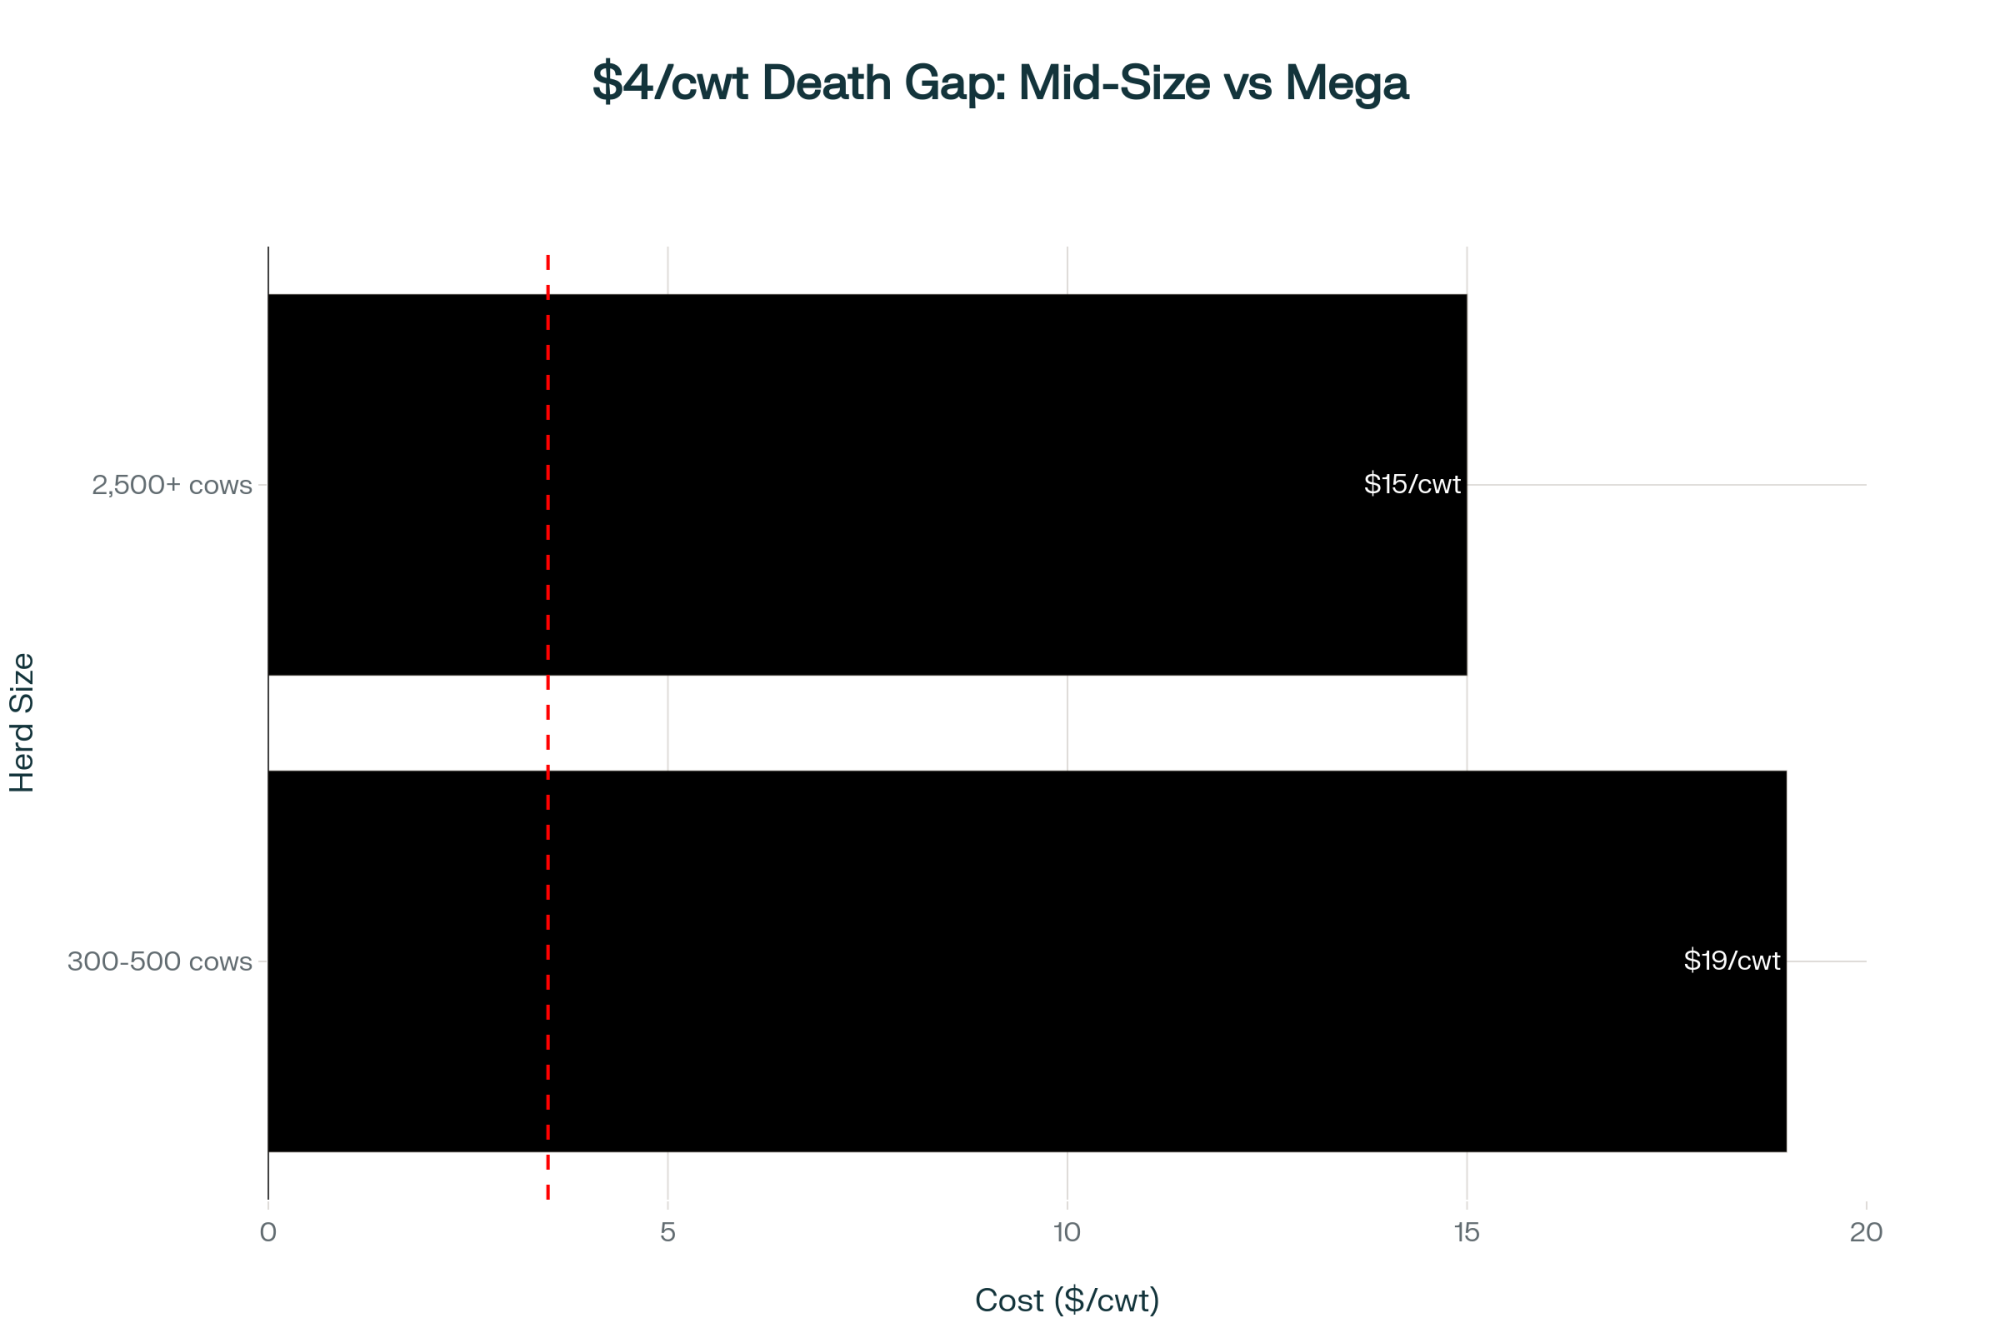
Then consider environmental compliance. The latest Wisconsin Department of Ag reports—which many of us turned to during the farm planning season—show the cost of nutrient management, methane compliance, and water permits comes out to 50 cents/cwt for the largest herds, but easily $15/cwt or more for the smallest. It’s the same paperwork, same inspector fee—just spread over far fewer cows and pounds.

The scale advantage isn’t about better farming—it’s about systematic structural advantages that give large operations a $4/cwt cost edge through volume discounts on feed, preferential financing rates, amortized regulatory compliance costs, and labor efficiency, creating a $100,000 annual penalty for a 500-cow farm that has nothing to do with management quality.

The Co-op/Processor Crossover: Facing Up to the Math

Now, here’s where a lot of dinner-table talk turns pointed. Vertical integration with co-ops, especially after big moves like DFA’s $425 million purchase of Dean Foods’ 44 plants, changes the dynamic. Industry estimates now indicate that more than half of DFA members’ milk flows through DFA plants.

There’s no way around it: when your co-op is both your “agent” and your buyer, it faces a built-in conflict. The original co-op job—fight for a fair farm price—collides with the processor’s goal: keep input costs as low and steady as possible.

A Cornell ag econ professor put it bluntly at last year’s co-op leadership workshop: “Co-ops owning plants face incentives that are tough to align. You can’t maximize both farmer pay price and processing margin.” And I’ve seen the evidence myself; the research shows co-ops often have lower stated deductions, but within the co-op group, “other deductions” can vary wildly. As one board member told us, “Transparency on this stuff is hard for everyone, even when we want it.”

Think about it: if your co-op owns the plant, is the negotiation about pay price truly across the table or just across the hallway?

Canadian Lessons: Costs and the Future

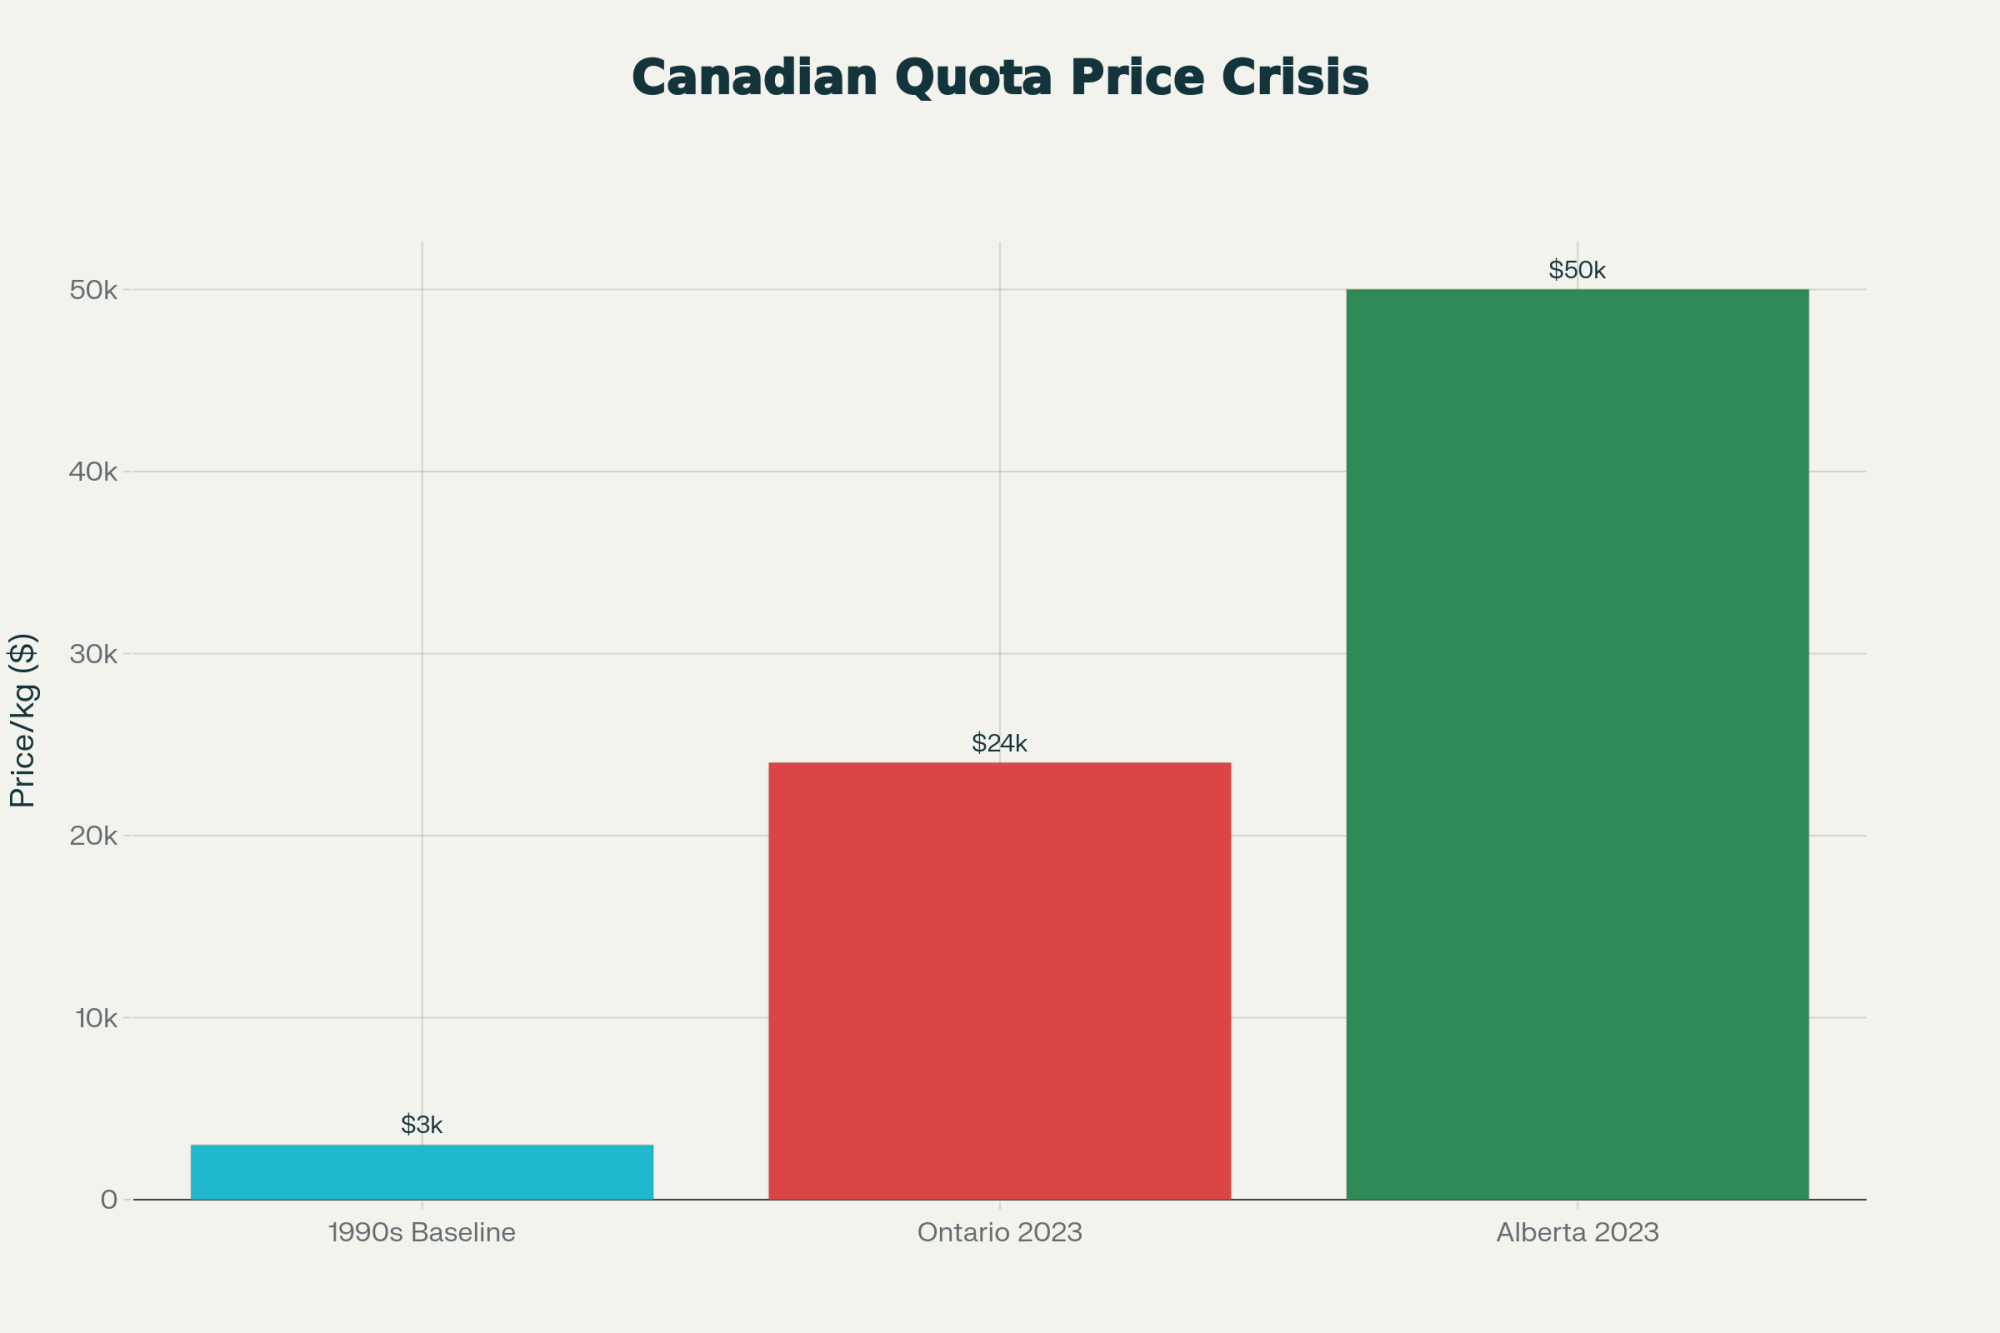
Now, Canadian friends watching these trends aren’t immune either. The Canadian Dairy Information Centre’s latest data puts the last decade’s dairy farm reduction at over 2,700, even under supply management. And quota levels are a choke point: In Ontario, with a strict cap, quota changes hands around $24,000 per kilo of butterfat; Alberta’s uncapped market runs up past $50,000.

A young producer near Guelph explained it best: “We want to keep the farm in the family, but the math now is about buying quota at market rate from Dad—he paid $3,000/kilo in the ’90s. I pay $24,000/kilo or more, and start so far behind on cash flow it feels impossible.”

Canadian dairy quota prices have exploded from $3,000 per kilogram in the 1990s to $24,000 in Ontario and $50,000 in Alberta by 2023—a 1,567% increase that creates an impossible generational wealth transfer barrier, forcing young farmers to begin their careers hundreds of thousands of dollars in debt simply to acquire the right to produce milk their parents obtained for a fraction of the cost.

Producers Team Up—and Win

We should all pay attention to how producers abroad have responded. In Ireland, Dairygold tried to drop prices, but farmers quickly networked on WhatsApp. Once they started comparing pay stubs, they discovered inconsistencies—same pickup, same composition, different pay. They organized: “If 200 show up with real data, will you join?” The answer was yes. Six weeks, 600 farmers, and the transparency improved, the price cut was rescinded.

That lesson isn’t just for Ireland. That’s modern farm business—facts and solidarity over rumors and grumbling.

U.S. Adaptation Tactics: What’s Working

Across the U.S., I’ve watched farmers embrace savvy but straightforward approaches. Central Valley producers doubled back to their milk checks and truck bills and found that some paid 20 cents/cwt more for identical hauls. As a group, they pressed for change—and got it.

Midwesterners have started bottling their own milk—Wisconsin’s extension reports show farmgate price benefits of $2 to $4 a gallon, though yeah, getting there takes $75,000 to $100,000 and some serious compliance stamina.

Debt is a fresh challenge in its own right in cow management. Now’s the time to renegotiate any credit above prime plus one. Dropping even one percent on a $2 million note brings $20,000–$25,000 savings straight to the P&L.

Environmental Law: A Sea Change

California’s methane digester rules, fully phased in over the past two years, are a classic case of “scale wins again.” For big operations, $4 million-plus digesters can become a profit center—especially if you trade renewable natural gas credits north of $1 million a year. Small farms? They can’t justify the capital, so the compliance cost splits unevenly—UC Davis economists show $2/cwt for small farms, under 50 cents for the largest.

It’s not about better manure management; it’s about who can amortize the cost.

The Path Ahead: What’s Next in Dairy Consolidation

The USDA’s Economic Research Service expects U.S. dairy farm numbers to dip below 10,000 by the mid-2030s, with Canadian farm numbers also dropping to around 4,000–5,000. That’s the math if nobody changes the model or the market.

But honestly, what gives me hope are examples of when perseverance, innovation, and strategic shifts pay off. In Wisconsin, several smaller herds now sell directly into grass-fed cheese contracts, pulling in a $4/cwt premium (more than make-allotment size, less fight for line space). “We stopped competing with 5,000-cow barns by beating them at their game,” one farmer told me. “We get paid for our story and our butterfat.”

Where To Focus Now

  • Calculate Your Position Honestly. Know your true cost—family living included—against hard local benchmarks. If the numbers don’t lie, accept what you see and plan accordingly.
  • Don’t Go It Alone. From paycheck audits to volume negotiations, the farms that win increasingly do so together.
  • Strategic Awareness Beats Production Alone. The future belongs to those who know how pricing, processing, and consumer trends intersect—and find their “crack” in the system instead of just producing more.

As Tom Vilsack put it at a dairy business roundtable: “We love to say we’re saving family farms, but policy and business choices keep rewarding bigness and consistency.” No matter your model—organic, conventional, something in between—the goal is to find your margin, your allies, and your leverage.

The numbers will keep changing, but one reality holds—those who adapt, share, and innovate stand the best chance. Old rules are being rewritten, and it’s worth being part of that conversation. For deep dives on industry economics, co-op strategy, and farm resilience, visit www.thebullvine.com.

KEY TAKEAWAYS

  • Butterfat numbers and raw efficiency don’t guarantee survival—market scale, price leverage, and transparency do.
  • Question every deduction and demand clarity from your co-op or processor—internal conflicts don’t have to shortchange you.
  • Benchmark your costs with neighboring farms and negotiate together—solo producers rarely win against consolidated buyers.
  • The farms thriving today are adapting: going direct-to-consumer, value-adding, or finding specialized markets to earn more per cwt.
  • Success in modern dairy comes from forward planning, embracing new models, and building your own leverage—not waiting for the system to “fix itself.”

EXECUTIVE SUMMARY:

Dairy’s old rules—“be efficient and you survive”—no longer hold. Drawing on real farm stories and national data, this investigation exposes why scale, access, and co-op consolidation matter more than top cow performance. You’ll see how market power and processor influence—not just farm management—decide who survives and who sells out. With insights from producers challenging these trends, along with practical strategies and benchmarks, this article is a must-read for anyone rewriting their playbook. Get the facts, the framework, and a clear-eyed look at what real success in dairy now demands.

Complete references and supporting documentation are available upon request by contacting the editorial team at editor@thebullvine.com.

Learn More:

Join the Revolution!

Join over 30,000 successful dairy professionals who rely on Bullvine Weekly for their competitive edge. Delivered directly to your inbox each week, our exclusive industry insights help you make smarter decisions while saving precious hours every week. Never miss critical updates on milk production trends, breakthrough technologies, and profit-boosting strategies that top producers are already implementing. Subscribe now to transform your dairy operation’s efficiency and profitability—your future success is just one click away.

NewsSubscribe
First
Last
Consent

Farm Income Soars to $180B in 2025 – But Not for Dairy

Crop farmers: $35B bailout. Beef: $1,100 calves. You: $17.50 milk that costs $19 to make. The numbers that should anger every dairyman.

Executive Summary: Record farm income of $179.8 billion sounds great until you realize dairy’s been left behind—your neighbors got disaster checks while you’ve faced 18 months of negative margins with minimal help. The numbers are stark: mega-dairies produce $3-4/cwt cheaper, driving consolidation that’s eliminated 39% of farms since 2017. Behind every closure is a family burning through retirement savings, with 60-70% of dairy farmers now reporting serious mental health impacts. Yes, some operations thrive through creative adaptations—premium marketing in New York, specialty partnerships in Texas—but these require advantages most farms don’t have. For mid-size dairies, three paths remain: invest heavily to scale up, find niche markets, or exit strategically while equity remains. This article offers an honest assessment and practical tools to make that choice consciously rather than desperately.

dairy profitability strategies

You know what’s interesting? The September farm income forecast from USDA shows net farm income up 40.7% to $179.8 billion—second-highest on record. It’s all anyone’s talking about at the coffee shop. But here’s the thing: for most of us checking milk prices against feed bills this fall, that headline number feels like it’s from a different planet.

I was talking with a producer near Eau Claire last week—he’s milking about 380 Holsteins, and he’s been at it for years. While his grain-farming neighbor just deposited a disaster check for weather losses from two years back, this guy’s been navigating 18 months of tough margins with nothing but the DMC coverage he pays premiums for.

Makes you think about how these support structures really work across different commodities, doesn’t it?

Let me share what I’ve been learning from conversations around the industry—producers, economists, folks who’ve been watching these trends for decades. Maybe together we can make sense of this disconnect between ag’s overall prosperity and what’s happening in our barns.

Understanding Where That $180 Billion Really Goes

So here’s what’s fascinating when you dig into this $179.8 billion figure. About $41 billion of it? That’s government payments, not market returns.

The breakdown tells you everything:

  • $35.2 billion in disaster assistance through the American Relief Act—mostly for crop losses
  • $40 billion total in direct payments (we were at $10 billion just last year)
  • Minimal DMC payments for dairy—margins stayed just above that $9.50 trigger

You probably know this already, but it’s worth repeating: dairy’s support structure works completely differently. We pay into programs that rarely trigger at levels that actually help. Meanwhile, crop disasters get an immediate congressional response.

Now look, I’m not saying processors have it easy either. Labor’s up about 15%, energy costs have jumped over 20%, and don’t even get me started on packaging materials—nearly 20% higher than 2020. Everyone’s feeling it somehow. But the way support flows through the system…well, that’s another story.

The Scale Reality We Can’t Ignore in 2025

What I’ve found really compelling is the recent data from our land-grant universities on operational scale. And honestly, as much as we might not want to hear it, the numbers are clear: operations with 2,500-plus cows are producing milk for roughly $3 to $4 less per hundredweight than those of us running 300 to 500 head.

Let me break this down the way it was explained to me.

The Math Nobody Wants to Talk About

Take your typical 300-cow operation averaging 23,000 pounds:

  • Fixed costs: Running about $0.90 per hundredweight (varies by region, obviously)
  • Annual production: Around 6.9 million pounds
  • The challenge: Can’t justify specialized equipment, stuck with truckload purchasing

Compare that to 3,000 cows:

  • Fixed costs: Drop to maybe $0.45 per hundredweight
  • Annual production: 75 million pounds
  • The advantages: Railcar feed purchasing, specialized positions, equipment that actually makes sense
The cost gap isn’t closing—it’s widening. Mid-size operations at $19/cwt can’t compete with mega-dairies at $15/cwt. For a typical 300-cow farm producing 7 million pounds annually, this $4 difference translates to over $50,000 in lost competitiveness before debt service, labor, or family living expenses. 

An Idaho dairyman I know—he’s running about 2,800 head—put it to me straight:

“We’re buying feed in railcar quantities for substantially less per hundredweight. The guys buying truckloads? They’re paying $1.50 to $2 more, easy. That advantage is really tough to overcome.”

But here’s what’s worth considering. Not every big operation is printing money. I spoke with a California producer managing over 5,000 cows, and his perspective was sobering:

“Everyone thinks we have it made. Truth is, we’re all walking a tightrope, just at different heights. Our debt service alone runs over a million annually. One disease outbreak, one major equipment failure—those thin margins disappear real fast.”

The Census of Agriculture data from 2022 really drives this home: we lost 39% of dairy farms between 2017 and 2022. That’s the steepest five-year decline they’ve ever recorded. And operations over 1,000 cows? They’re now producing 66% of our milk, up from 57% in 2017.

834 Operations Control Half the Milk—16,334 Fight for Scraps

How This Plays Out Across the Country

What I find really interesting is how differently this consolidation hits different regions:

Pacific Northwest folks:

  • You’re dealing with that brutal Class I utilization problem—18% versus 29% nationally
  • Federal Order prices running over a dollar below the national average
  • And those transportation costs to get milk to cities? Forget about it

Wisconsin and Minnesota producers:

  • Over 500 farms gone in 2024 alone—mostly those 150-400 cow operations we all grew up around
  • When the co-op closes, the vet leaves, the equipment dealer stops stocking parts…
  • That infrastructure needs critical mass, and once it’s gone, it’s gone

Out in Idaho and Texas:

  • Production’s actually growing—7% or more—even as farm numbers drop
  • They’re attracting these mega-operations with the climate, the space
  • New processing plants are going up to match

Northeast—and this is tough:

  • Land at $4,500 an acre (if you can find it)
  • Environmental compliance costs that’d make your head spin
  • Infrastructure that’s 40 years older than what they’re building out West

California’s its own beast:

  • Central Valley operations are expanding like crazy
  • But near the cities? They’re selling to developers
  • Most complex market in the country, honestly

Florida dairy—different world:

  • Heat stress management costs running $100+ per cow annually
  • Unique fluid milk market dynamics
  • Some of the highest production costs nationally

Each region’s facing its own version of this challenge, but the underlying pressure’s the same everywhere.

The Human Side Nobody Wants to Talk About

Here’s what keeps me up at night. Recent agricultural health research suggests 60-70% of us are dealing with mental health impacts from farm stress. That’s way higher than the general population, and we need to acknowledge it.

I know a Wisconsin couple—good people, who milked registered Holsteins for nearly 30 years. Sold out this summer. They knew five years ago the math wasn’t working, but how do you walk away from something your grandfather built?

“The hardest part was watching our neighbors in grain and beef doing well while we struggled. Felt like nobody in policy circles even knew we existed.”

What makes dairy different—and we all know this:

  • No breaks: Cows need milking twice a day, every day
  • No sleep: Research shows we’re averaging four hours during calving season
  • No let-up: Financial pressure plus operational intensity equals chronic stress
  • Identity crisis: When the farm’s been in your family for generations…

By the time many folks finally make the decision, they’ve burned through the equity they’ll need for retirement. It’s heartbreaking.

But There Are Success Stories

Now, it’s not all doom and gloom. I’ve seen some really creative adaptations working.

That New York Operation Near Cooperstown

These folks transformed their 280-cow dairy:

  • What they did: Switched to A2A2 genetics, found a local processor, and added agritourism
  • Investment: About $450,000 over three years (yeah, it’s substantial)
  • Results: They’re seeing 18% net margins, getting $32/cwt equivalent
  • Key factor: They’re 45 minutes from Albany—location matters

Texas Partnership That Works

A 400-cow operation found their niche:

“It’s not revolutionary, but that $3 premium for high-butterfat milk makes the difference between losing money and modest profitability.”

  • Strategy: Partnered with a local ice cream manufacturer
  • Benefit: Guaranteed volume, premium for butterfat
  • Lesson: Sometimes the answer’s right in your backyard

Connecticut’s Organic Journey

This one’s honest about the challenges:

“The three-year transition nearly bankrupted us. But now? It’s sustainable rather than highly profitable, and sustainable beats losing money.”

  • Reality check: Needed off-farm income during transition
  • Current status: Making it work, but it’s not easy money
  • Truth: Location near affluent markets was crucial

Export Markets and Processing—It’s Complicated

USDA data shows we exported $8.2 billion in dairy products last year—second-highest ever. Sounds great, right? But here’s what worries me:

The vulnerabilities:

  • Over 40% of our cheese goes to Mexico
  • China’s substantially increased tariffs on most dairy products
  • Domestic consumption’s only growing 1-2% annually
  • We’re building processing capacity faster than finding markets

Recent expansions:

  • Wisconsin’s new plant: 8 million pounds daily
  • Valley Queen in South Dakota: Another 3 million pounds of capacity
  • And there’s more coming online

The Federal Order reforms this summer increased make allowances by about $0.54 per hundredweight. Processors show the data—costs really are up. But we’re all wondering how they’re expanding if margins are so tight. Both things can be true, I guess.

Alternative Models—Let’s Be Realistic

You know, everyone asks about organic, grass-fed, on-farm processing. Here’s my honest take after watching this for years: these can work brilliantly for maybe 20-25% of producers. But you need:

The right location:

  • Within 50 miles of a big city (500,000+ people)
  • Household incomes above average
  • Customers who value what you’re doing

The right scale:

  • 80-200 cows typically
  • Small enough for relationships
  • Big enough for efficiency

The right mindset:

  • Ready for 80+ hour weeks
  • Willing to do marketing, not just milking
  • Often need off-farm income initially

Burlington, Vermont? Perfect. Middle of Nebraska? Much tougher.

Technology Might Actually Help in 2025

What’s encouraging is how technology costs have come down. Genomic testing costs have dropped substantially in recent years. Activity monitoring that used to need 5,000 cows still need to be justified. Now it works at 500.

A Pennsylvania producer with 450 cows told me:

“Our conception rates improved 8%, we’re catching health issues two days earlier, and I’m actually sleeping through the night during calving. The investment was about $120,000, and we figured an 18-month payback.”

And here’s something interesting—robotic milking is finally penciling out for mid-size operations. We’re seeing 200-300 cow dairies making it work, especially where labor’s tight. About 5% of operations are exploring this now, up from almost none five years ago. It won’t overcome all the scale disadvantages, but it’s helping mid-size operations stay competitive in specific areas. That’s something, at least.

The Policy Reality in 2025

Here’s what’s uncomfortable but true: dairy doesn’t fit the disaster model Congress understands.

Recent support comparison says it all:

  • Crops: $35.2 billion in disaster aid
  • Commodity payments: Tripled from last year
  • Conservation: Up over 10%
  • Dairy: DMC that we pay for rarely helps when we need it

When crops fail due to weather, it’s visible and immediate. When will our margins compress over two years? That looks like a business problem, not a disaster. And as fewer dairy farms open each year, our political voice keeps getting quieter.

Crops: $35 Billion. Dairy: $1.2 Billion. The Support Gap Killing Farms.

What’s Actually Working Right Now

Looking at successful operations, here’s what they’re doing:

Getting real about costs:

  • Calculating true production costs, including economic depreciation
  • Need about $2/cwt margin above true costs
  • Most of us are below that right now

Using every tool available:

  • DMC five-year commitment saves 25% on premiums
  • Dairy Revenue Protection for catastrophic protection
  • Strategic culling with cull prices at $140-148/cwt

One Minnesota producer shared this:

“We culled 20% strategically—generated enough cash to restructure debt and buy some breathing room.”

Having an exit strategy (even if you never use it): Financial advisors tell me farmers with exit plans actually make better daily decisions. Takes the desperation out of it.

Looking Down the Road

Based on what economists and industry folks are saying, here’s what’s likely:

Industry projections for 2025-2030 suggest:

  • We’ll lose 2,000-2,800 farms annually through 2027
  • Operations over 1,000 cows will hit 75% of production by 2030
  • Mid-size farms are mostly gone except near cities

Policy changes?

  • Farm Bill might tweak things
  • But fundamental change? Unlikely
  • Maybe higher DMC coverage, but same structure

Market disruptions could change everything—disease, processing problems. But you can’t plan on disasters.

So What Does This Mean for Your Farm?

Let’s get practical here.

First, know where you really stand:

  • Calculate actual costs versus realistic revenue
  • Penn State’s got great worksheets online for this
  • If the math doesn’t work, that’s not failure—it’s information

Second, pick a lane:

  • Staying in? Either differentiate clearly or scale up
  • Getting out? Timing is everything for preserving equity
  • Standing still? Usually means falling behind

Third, get support:

  • Farm Aid: 1-800-FARM-AID for financial counseling
  • Crisis line: 988 if you’re struggling
  • Talk to other producers—we’re all dealing with this

Every month you operate at a loss, eats equity you’ll need later. That’s just math.

The Bottom Line

Look, this disconnect between headlines and our reality reflects changes that aren’t reversing. Consolidation, technology, global markets—these forces are bigger than any of us.

But here’s what I want to emphasize: you still have choices.

If you’re well-positioned—good location, right scale, unique advantages—this transition might create opportunities. If not, you need clear-eyed assessment and strategic planning.

Success isn’t about being the best farmer or working the hardest anymore. It’s about recognizing reality early and adapting. Sometimes that’s expanding. Sometimes it’s finding a niche. And sometimes—more often than we’d like—it’s transitioning out with dignity and security intact.

Make decisions consciously, not by default. Understand where you really stand instead of hoping for rescue. That might be the most valuable thing any of us can do right now.

We’re all trying to navigate these changes while holding onto why we got into dairy in the first place. The conversations I’ve had across the country show we’re facing similar challenges, just in different ways.

And whatever path makes sense for your operation, you’re not walking it alone. We’re all figuring this out together.

Key Takeaways:

  • The economics are permanent: Mega-dairies produce $3-4/cwt cheaper—this gap will widen, not shrink, making commodity milk unviable for farms under 1,000 cows
  • Your three options are clear: Scale to 1,200+ cows (requires $3-5M capital), capture premium markets (needs metro proximity), or exit strategically while equity remains
  • Time is your enemy: Every month at negative margins burns $25-50K in equity—the difference between comfortable retirement and bankruptcy is acting 12-18 months sooner
  • Location determines everything: Success stories share one trait—proximity to wealthy consumers or unique partnerships; without this, scaling or exiting are your only choices
  • Support exists, use it: Calculate true costs with Penn State worksheets, get financial counseling at 1-800-FARM-AID, mental health support at 988—deciding consciously beats drowning slowly

Mental Health Resources: National Suicide Prevention Lifeline (988, available 24/7), Farm Aid Hotline (1-800-FARM-AID), American Farm Bureau’s Farm State of Mind resources

Financial Resources: Farm Service Agency offices, Farm Credit Services, state Farm Business Management programs, National Farm Transition Network

Complete references and supporting documentation are available upon request by contacting the editorial team at editor@thebullvine.com.

Learn More:

Join the Revolution!

Join over 30,000 successful dairy professionals who rely on Bullvine Weekly for their competitive edge. Delivered directly to your inbox each week, our exclusive industry insights help you make smarter decisions while saving precious hours every week. Never miss critical updates on milk production trends, breakthrough technologies, and profit-boosting strategies that top producers are already implementing. Subscribe now to transform your dairy operation’s efficiency and profitability—your future success is just one click away.

NewsSubscribe
First
Last
Consent

Beyond Class III: Three Global Signals Predicting Your Next 18 Months      

Milk at $18. Butter at $1.50. But heifers at $3,200 tell the real story. The recovery’s already starting—if you know where to look.

EXECUTIVE SUMMARY: A Wisconsin dairy producer’s confession reveals the new reality: “I watch New Zealand milk production closer than my own bulk tank.” While traditional metrics show disaster—butter at $1.50, milk under $18, three forward signals are flashing a recovery 3-4 months out. Weekly dairy slaughter remains at historic lows (230k vs. 260k trigger) because $900-$1,600 crossbred calves are keeping farms afloat, breaking the normal correction cycle. Smart operators monitoring Global Dairy Trade auctions and $230/cwt cattle futures have already locked in $4.38 corn, gaining $1.20/cwt margin advantage over those waiting for Class III improvements. With heifer inventories at 40-year lows (3.914 million head), operations that went heavy on beef-on-dairy face a cruel irony: they survived the crash but can’t expand in recovery. The next 18 months won’t reward efficient production—they’ll reward those watching the right signals.

Dairy Market Signals

Last week, a Wisconsin producer told me something that stopped me in my tracks: “I’m watching New Zealand milk production closer than my own bulk tank readings.”

That conversation captures perfectly how dairy economics have shifted. And looking at Monday’s CME spot prices—butter hitting $1.50 a pound, lowest we’ve seen since early 2021—alongside December cattle futures losing nearly twenty bucks per hundredweight over the past couple weeks, you can see why traditional metrics aren’t telling the whole story anymore.

Here’s what’s interesting, folks… while everyone’s fixated on Class III and IV prices that essentially report yesterday’s news, there are actually three specific signals providing genuine forward-looking intelligence. I’ve been tracking these with producers across the country for the past year, and what I’ve found is that the patterns could determine which operations thrive during this transition period.

AT A GLANCE: Your Three Critical Market Signals

Three Forward Signals Dashboard provides dairy producers with actionable intelligence 90-120 days before traditional Class III prices signal recovery—those monitoring these indicators have already locked in $4.38 corn and gained $1.20/cwt margins over competitors waiting for conventional signals. This is Andrew’s edge: forward-looking data that beats reactive strategies.

📊 Signal #1: Weekly dairy cow slaughter exceeding prior year by 8-10% for three consecutive weeks
📈 Signal #2: GDT auctions showing 6-8% cumulative gains over four consecutive sales
📉 Signal #3: December cattle futures 30-day moving average crossing above 200-day at $230+/cwt

The Perfect Storm We’re Navigating Together

You’ve probably noticed this already, but what we’re experiencing isn’t your typical dairy cycle. It’s more like… well, imagine several weather systems colliding simultaneously, each amplifying the others in ways most of us haven’t seen before.

The Production Surge

So here’s what the USDA data shows—milk production increased 3.5% through July, and those butterfat tests? Katie Burgess over at Ever.Ag called them “somewhat unbelievable” in her recent market analysis, and honestly, she’s spot on. I’m seeing consistent test results of 4.2% butterfat, even 4.3%, across multiple regions—Wisconsin operations, Pennsylvania farms, and even out in California—when just two years ago, 3.9% was considered excellent.

You know what’s happening here, right? We’re all getting better at managing transition periods, feeding programs are more precise, genetics keep improving… but when everyone’s achieving similar improvements simultaneously, well, the market gets saturated. And that’s exactly what we’re seeing.

Global Supply Pressure

The Global Dairy Trade auction has declined for three straight months now, and that’s coinciding with European production recovering—you can see it in the Commission’s September data—and Fonterra announcing that massive 6.3% surge in September collections. When major exporters increase production simultaneously like this… friends, you know what happens to prices.

Domestic Demand Challenges

Meanwhile, domestic demand faces unprecedented pressure. Those SNAP benefit adjustments affecting 42 million Americans? They’re creating ripple effects throughout the retail sector. Food banks across Iowa are reporting demand increases of ten to twelve times normal—I mean, the Oskaloosa facility went from distributing 300-400 pounds typically to nearly 5,000 pounds in the same timeframe. That’s not sustainable.

A Lancaster County producer managing 750 Holsteins shared an interesting perspective with me recently:

“Component payments help, sure, but when everyone’s achieving similar improvements, the market gets saturated. And those fluid premiums we used to count on? They’re basically evaporating as processors shift toward manufacturing.”

The Broken Feedback Loop

Here’s what really caught me off guard, though—that traditional feedback loop where low prices trigger culling, which reduces supply and brings markets back? It’s broken.

With crossbred calves commanding anywhere from $900 to $1,600 at regional auctions—and I’m seeing this from Pennsylvania clear through to Minnesota based on the USDA-AMS reports—compared to maybe $350-$400 back in 2018-2019, that additional beef revenue is keeping operations afloat despite negative milk margins.

The Beef-on-Dairy Survival Paradox illustrates the cruel irony facing dairy producers: crossbred beef calves now generate 20-25% of farm revenue (at $900-$1,600 each vs. $350-$400 for dairy heifers), which kept operations afloat during low milk prices—but eliminated the heifer inventory needed for expansion when markets recover. Survival strategy becomes growth killer.

Three Dairy Market Signals Worth Your Morning Coffee

📊 SIGNAL #1: Weekly Dairy Cow Slaughter Patterns

When: Every Thursday at 3:00 PM Eastern
Where: USDA Livestock Slaughter report at usda.gov
Time Required: 5 minutes

What’s fascinating is the consistency here—dairy cow culling has run below prior-year levels for 94 out of 101 weeks through July, according to USDA’s cumulative statistics. Year-to-date culling? It’s the lowest seven-month figure since 2008, and we’ve got a much bigger national herd now.

🎯 THE KEY THRESHOLD:
Three consecutive weeks where slaughter exceeds prior-year levels by 8-10% or more

When weekly figures rise from the current 225,000-230,000 head range toward 260,000-270,000 head, that signals crossbred calf values have finally declined below that critical $900-$1,000 level where they no longer offset weak milk margins.

💡 WHY IT MATTERS:
A 600-cow operation near Eau Claire started monitoring these signals back in March, locked in feed when they saw the pattern developing, and improved margins by $1.20/cwt compared to neighbors who waited. That’s real money, folks.

📈 SIGNAL #2: Global Dairy Trade Auction Trends

When: Every two weeks, Tuesday evenings, our time
Where: globaldairytrade.info (free access)
Time Required: 15 minutes

I’ll be honest with you—for years, I ignored these New Zealand-based auctions, thinking they were too far removed from Midwest realities. That was an expensive mistake.

🎯 THE KEY THRESHOLD:
Four consecutive auctions showing cumulative gains of 6-8% or higher, with whole milk powder exceeding $3,400/MT

Katie Burgess explains it well: “GDT auction results in New Zealand influence U.S. milk powder pricing dynamics.” And the correlation is remarkably consistent—GDT movements typically show up in CME spot markets within two to four weeks.

💡 INSIDER PERSPECTIVE:
A Midwest cooperative CEO recently shared this with me—can’t name the co-op for competitive reasons—but he said: “We’ve integrated GDT trends into our pooling strategies. Sustained upward movement there typically translates to improved export opportunities within 30-45 days.”

📉 SIGNAL #3: Cattle Futures Technical Analysis

When: Daily monitoring
Where: Any free futures charting platform
Time Required: 5 minutes daily

With the National Association of Animal Breeders data showing 40-45% of dairy pregnancies now utilizing beef sires, and those calves generating 20-25% of total farm revenue, cattle market volatility directly impacts our cash flow.

🎯 THE KEY THRESHOLD:
30-day moving average crossing above 200-day moving average while December futures maintain above $230/cwt

Recent movements illustrate the impact perfectly—when cattle prices dropped in October, crossbred calf values fell by $200-$250 per head. For a 1,500-cow operation with 40% beef breeding, that’s substantial revenue reduction… we’re talking six figures of annual impact.

💡 PRO TIP:
If you’re just starting to track these signals, give yourself a full month to establish baseline patterns before making major decisions based on them. As many of us have learned, knee-jerk reactions rarely pay off.

Quick Reference: Your Market Monitoring Dashboard

MONDAY MORNING (10 minutes over coffee)

✓ Check Friday’s CME spot dairy prices
✓ Review cattle futures five-day trends
✓ Update 90-day cash flow projections

THURSDAY AFTERNOON (5 minutes)

✓ Access USDA slaughter report (3 PM ET)
✓ Calculate 4-week moving average vs. prior year
✓ Note trend acceleration or deceleration

BIWEEKLY GDT DAYS (15 minutes)

✓ Monitor GDT Price Index and whole milk powder
✓ Calculate 3-auction cumulative change
✓ Compare with NZ production reports

MONTHLY DEEP DIVE (worth the hour)

✓ USDA Cold Storage report analysis
✓ Regional milk production review
✓ Update beef-on-dairy calf values
✓ Calculate actual production cost/cwt
✓ Evaluate 2:1 current ratio benchmark

Understanding the Structural Shifts Reshaping Our Industry

The Heifer Shortage: By the Numbers

The 40-Year Heifer Crisis shows U.S. dairy heifer inventory at 3.914 million head—the lowest level since 1978—creating an expansion trap where even when milk prices recover to $22/cwt, operations can’t grow due to $3,200 heifer costs and limited availability. This isn’t a cyclical problem; it’s a structural crisis that will define the industry for years.

You know, CoBank’s August dairy report really opened some eyes—they’re projecting an 800,000 head decline in heifer inventories through 2026. And the January USDA Cattle inventory confirmed we’re at just 3.914 million dairy heifersover 500 pounds. That’s the lowest since 1978, folks.

Current Reality:

  • $3,200 current bred heifer cost (compared to $1,400 three years ago)
  • Wisconsin actually added 10,000 head
  • Kansas dropped 35,000 head
  • Idaho lost 30,000 head
  • Texas shed 10,000 head

A Tulare County producer summed it up perfectly when he told me: “The irony is crushing—beef-on-dairy revenue helped us survive the downturn, but now expansion is virtually impossible without heifers.”

SNAP Impact: The Ripple Effect

When those 42 million Americans saw their SNAP benefits cut from $750 to $375 for a family of four… the impact on dairy demand was immediate and, honestly, worse than I expected.

The Numbers:

  • 50% benefit reduction starting November 1st
  • 10-15% reduction in retail dairy orders within the first week
  • 1.4-1.6 billion pounds milk equivalent annual impact

Andrew Novakovic from Cornell’s Dyson School—he’s been studying dairy economics for decades—offers crucial context: “Dairy products often see early reductions when household budgets tighten. Unfortunately, many consumers categorize dairy as discretionary when financial pressures mount.”

Global Dynamics: The New Reality

Twenty years ago, friends, U.S. dairy prices were mostly about what happened between California and Wisconsin. Today? With 16-18% of our production going to export markets, what happens in Wellington, Brussels, and Beijing matters just as much.

Key Production Increases:

  • Ireland’s up 7.6% year-to-date through May
  • Poland’s share grew from 1.9% to 3.9% of EU production over five years
  • New Zealand hit four consecutive monthly records through September
  • China’s now 85% self-sufficient, up from 70%

Ben Laine over at Rabobank explained it well: “When major exporters increase production simultaneously while China requires fewer imports, prices have to adjust globally. These signals reach U.S. farms within weeks, not months.”

Action Plans by Operation Type

📗 For Growth-Oriented Operations

Genomic Testing ROI:

I’ll admit, spending $45 per calf for genomic testing when milk prices are in the tank seems counterintuitive. But here’s the math that convinced me:

  • Test 300 heifer calves at $45 each: $13,500
  • Apply sexed semen to top 120 at $27 extra per breeding: $3,240
  • Generate 80-100 surplus heifers worth $3,200-$3,500 each: $280,000+
  • Your ROI? About 16 to 1

University dairy economics programs have validated these projections, and frankly, those numbers work in any market.

Risk Management Stack:

You can’t rely on DMC alone—it hasn’t triggered meaningful payments in over a year according to FSA records. Smart operators are layering:

  • DMC at $9.50: ~$0.15/cwt for first 5 million pounds
  • DRP at 75-85%: Premiums run 2-3% of protected value
  • Forward contracts: 30-40% when you see $19+/cwt

📘 For Transition Candidates

Three Proven Paths:

  1. Collaborative LLC: Three farms near Fond du Lac reduced per-cow investment from $8,000 to $3,200 by sharing infrastructure
  2. Premium Markets: A2 can bring a $4/cwt premium; organic runs $20/cwt over conventional if you can secure a buyer first
  3. Strategic Exit: You preserve 80-85% of equity in a planned transition versus maybe 50% in distressed liquidation

📙 For Next Generation

If you’re under 30 and considering this industry, you need to know it’s fundamentally different from what your parents knew. University programs like Wisconsin’s Center for Dairy Profitability and Cornell’s PRO-DAIRY are developing specific resources for younger producers navigating this new environment. Use them.

Regional Snapshot: Your Competition and Opportunities

Southwest: Water costs are doubling in some areas. One Albuquerque producer told me they’re making daily tradeoffs between feed production and maintaining adequate water for the herd.

Northeast: Those fluid premiums we used to count on? They’ve compressed from $2-3/cwt down to $0.50-1.00 in many months.

Pacific Northwest: Urban pressure near Seattle and Portland—plus down in Salem—has reduced available land by 30% in five years for some operations. A Yakima producer told me they’re now focusing entirely on efficiency rather than expansion.

Upper Midwest: Generally best positioned with those heifer additions and relatively stable production costs. Wisconsin operations, particularly, are seeing benefits from their heifer inventory decisions.

The Path Forward: Your 18-Month Strategy

You know, a Turlock-area veteran told me something last week that really stuck: “We’ve shifted from watching weather and milk prices to monitoring New Zealand production and Argentine beef policy. This isn’t the dairy farming of previous generations, but it’s our evolving reality.”

The coming 18 months will challenge all of us, yet patterns remain identifiable for those watching. Markets will recover—they always do—but the question is whether your operation will be positioned to benefit from that recovery.

Looking at this trend, farmers are finding that appropriate signal monitoring, combined with decisive action, makes the difference. Your operation deserves strategic planning beyond hoping for better prices. And with the right approach, achieving better outcomes remains entirely possible.

Because at the end of the day, friends, as many of us have learned, success in modern dairy isn’t just about producing quality milk anymore. It’s about understanding global dynamics, managing risk intelligently, and making informed decisions based on forward-looking indicators rather than yesterday’s prices.

The tools are there. The signals are clear. What we do with them over the next 18 months will determine who’s still farming when this cycle turns—and it will turn. It always does.

KEY TAKEAWAYS: 

  • Monitor three signals, not milk prices: Weekly slaughter approaching 260k (currently 230k), GDT auctions gaining 6-8% over four sales, and cattle futures holding above $230/cwt predict recovery 3-4 months before Class III moves
  • The correction isn’t coming—it’s different this time: Crossbred calves at $900-$1,600 create a revenue floor keeping marginal operations alive, breaking the traditional supply response to low milk prices
  • First movers are winning now: Operations tracking these signals have locked in $4.38/bushel corn and gained $1.20/cwt margins while others wait for “normal” price recovery that follows different rules
  • The heifer shortage trap: At 3.914 million head (lowest since 1978), expansion is mathematically impossible for most—even when milk hits $22, you can’t grow without $3,200 heifers
  • Your 18-month edge: Implement Monday morning CME checks, Thursday slaughter monitoring, and biweekly GDT tracking—15 minutes weekly that separates thrivers from survivors

Complete references and supporting documentation are available upon request by contacting the editorial team at editor@thebullvine.com.

Learn More:

Join the Revolution!

Join over 30,000 successful dairy professionals who rely on Bullvine Weekly for their competitive edge. Delivered directly to your inbox each week, our exclusive industry insights help you make smarter decisions while saving precious hours every week. Never miss critical updates on milk production trends, breakthrough technologies, and profit-boosting strategies that top producers are already implementing. Subscribe now to transform your dairy operation’s efficiency and profitability—your future success is just one click away.

NewsSubscribe
First
Last
Consent

New Zealand Hit Record Production and Started Paying Down Debt – Here’s the $1.7 Billion Signal You’re Missing

When the lowest-cost producer starts hoarding cash, what should you be doing?

EXECUTIVE SUMMARY: What farmers are discovering about New Zealand’s record September production—228,839kg of milk solids, up 3.4%—reveals something crucial about the next commodity cycle. Despite Fonterra paying out $16 billion in returns (30% above last year), Reserve Bank data shows their farmers just paid down $1.7 billion in debt over six months rather than expanding. This disconnect between production strength and conservative positioning mirrors patterns from 2014, right before the last major downturn that saw prices crash to NZ$3.90/kgMS for 18 months. China’s Three-Year Action Plan for cheese production, combined with their historical pattern of cutting WMP imports by 240,000 metric tons once domestic capacity matured, suggests the 2027-2030 period could see similar disruption in cheese markets. Smart operators are already adjusting—Federal Reserve data shows U.S. dairy borrowing remains flat despite strong cash flows, while processors with 70% of milk under long-term contracts are reporting better stability than spot-market dependent operations. Here’s what this means for your operation: the window for strengthening balance sheets and securing stable contracts is open now, but it won’t stay that way past 2026.

You know that feeling when something’s just… off? Milk production’s strong, the neighbor’s adding another barn, equipment dealers can’t keep anything in stock. But there’s this nagging sense that these “good times” are different. I think what’s happening in New Zealand right now might help explain why so many of us are feeling cautious.

So here’s what caught my attention: DairyNZ’s latest production statistics show New Zealand just hit their highest September milk collection on record—228,839 kilograms of milk solids. That’s up 3.4% from last year. And Fonterra announced in their FY25 results that total cash returns to shareholders are approaching sixteen billion dollars, which is roughly 30% more than the previous year.

But—and this is the part that makes you think—Global Dairy Trade auction prices have been sliding for three straight months. The October 7th auction settled at $3,921 per tonne. When production’s surging but prices are softening? That tells you something.

Record production colliding with softening prices—the market signal smart operators aren’t ignoring

Why New Zealand Can’t Actually Choose What They Produce

Here’s what I’ve found most producers outside Oceania don’t really grasp about New Zealand’s system. According to DairyNZ’s seasonal production data, about 84% of their entire national herd calves within a three-month window—August through October. Think about that for a second. Nearly every cow in the country freshening at the same time.

During their spring flush—that’s October through December down there—they’re pushing roughly 60-65% of their entire annual milk volume through processing plants in just three months. Fonterra’s milk collection data shows their plants hit 95% utilization during peak. That’s not efficiency, folks. That’s desperation.

When 84% of your national herd calves in 3 months, you don’t choose what to produce—you spray dry whatever doesn’t fit in the tank

You know what happens then? Industry processing reports show they’re running spray dryers flat out just to keep milk from backing up on farms. According to the Dairy Processing Handbook from Tetra Pak, modern spray dryers typically process 10-15 metric tons per hour, and during New Zealand’s flush, these things run continuously. Day and night.

This is why—and here’s what’s really telling—whole milk powder still represents about 40% of New Zealand’s dairy exports according to USDA’s Foreign Agricultural Service analysis. It’s not because they want to make powder. It’s because when that wall of milk hits, you either spray dry it or dump it. There’s no third option.

For those of us running year-round calving systems, this might seem crazy. But it’s actually both their biggest advantage and their Achilles heel, depending on how you look at it.

New Zealand’s grass-based system delivers the world’s lowest production costs—but that advantage is eroding as climate forces adaptation

China’s Playing the Long Game (Again)

What’s happening with China’s import patterns is fascinating—and honestly, a bit concerning. USDA’s Beijing office analyzed China Customs data and found cheese imports are up over 22% while skim milk powder imports jumped 26%. But whole milk powder? Still declining.

You probably remember what happened with WMP between 2010 and 2018, right? UN Comtrade data shows China kept importing massive volumes while quietly building their own production capacity. Then suddenly—boom—imports dropped from around 670,000 metric tons to 430,000 metric tons. Changed the whole global market.

Now they’re following the same playbook with cheese. China’s Ministry of Agriculture published this Three-Year Action Plan for cheese production development. Their western provinces are already incorporating cheese plants into those massive dairy clusters they’re building. Industry reports indicate China Modern Dairy is producing something like 3,300 tons of raw milk daily now. And get this—their cows are averaging over 13,000 kilograms of production. That’s right up there with good U.S. herds.

Looking at current construction activity tracked by the China Dairy Industry Association, most analysts expect modest import growth through maybe 2026, then watch for new “quality standards” that somehow favor domestic production. By 2027-2030? Well, cheese imports could follow the same path as powder—down 30-40% from peak. Though who knows, right? Economic conditions could speed this up or slow it down. And let’s not forget, precision fermentation and alternative proteins are starting to look more viable every year, though current costs suggest traditional dairy keeps its advantages for commodity uses through at least 2030.

China’s building massive cheese capacity right now—expect ‘quality standards’ that favor domestic production to hit by 2028, just like they did with WMP

Those “Profitable” Margins Tell a Different Story

DairyNZ’s Economic Survey shows New Zealand producers are looking at breakeven costs around NZ$8.66 per kilogram of milk solids. Fonterra’s announced farmgate price is NZ$10.16. So that’s about a NZ$1.34 spread—in our terms, they’re breaking even around $16.50 per hundredweight compared to the $24.55 it costs to produce milk in California according to CDFA’s May cost study.

Sounds pretty good, doesn’t it? But here’s what I find interesting: Reserve Bank of New Zealand data shows farmers just paid down NZ$1.7 billion in debt in six months through March 2025. That’s not expansion behavior. That’s battening down the hatches.

They remember 2015-16. Fonterra’s historical pricing data shows milk prices crashed to NZ$3.90 per kilogram and stayed there for 18 months. A lot of good operators went under during that stretch.

Iowa State research proves it: debt reduction gives you twice the resilience of expansion at cycle peaks—NZ farmers clearly remember 2015

And now you’ve got climate issues on top of everything else. Federated Farmers officials have been calling recent droughts in Waikato and Taranaki some of the worst in decades. When you’re forced to dry cows off early, or you’re taking 20-30% discounts on spot milk because plants can’t handle your flush volumes… suddenly that cost advantage doesn’t look so solid.

University of Melbourne’s Dairy Futures research projects profitability could drop 10-30% by 2040 without successful climate adaptation. But here’s the catch—every adaptation measure costs money and changes your cost structure. Several Canterbury producers I’ve heard speak at field days who invested in irrigation say the same thing: “It saved our production during the drought, but we’re not a low-cost operation anymore.”

Why Farmers Vote for Cash, Not Strategy

This is where cooperative governance gets really interesting. Industry analysis from Rabobank and others suggests Fonterra needs hundreds of millions in capital investment for specialty protein infrastructure if they want to stay competitive as markets evolve.

But when Fonterra put their Flexible Shareholding structure to a vote in December 2021, you know what happened? Official voting results showed 85.16% approval with over 82% turnout—for a proposal that REDUCED capital requirements from one share per kilogram of milk solids to one share per three kilograms. Farmers overwhelmingly voted for more financial flexibility, not strategic investment.

And honestly? I can’t blame them. If you’re running 500 cows and a 50-cent payout increase means $85,000 in your pocket this year, that’s real money. You can pay down debt, fix that mixer wagon that’s been limping along, help your kid with college. Voting to fund some protein plant that might help in eight years—assuming China doesn’t build their own first—that’s a much tougher sell.

What farmers are finding is that democratic governance, while it protects individual interests, can really limit strategic flexibility. And it’s not just Fonterra—I’ve seen the same tensions in cooperatives here in the States.

Climate’s Changing Everything

You know, the relationship between climate and production systems is getting more complicated every year. New Zealand’s whole model depends on predictable pasture growth synchronized with their seasonal calving. Research published in Agricultural Systems shows those patterns are becoming way less reliable.

Every adaptation has trade-offs. Install irrigation? There goes your low-cost advantage. Switch to split calving? Now you need more stored feed. Build bunker silos for drought reserves? Suddenly you’re looking at cost structures closer to what we have here.

I was talking with a Missouri producer at a grazing conference who’s using New Zealand-style rotational grazing on 650 cows. He made a great point: “Their system works perfectly in their climate. But when spring shows up three weeks late—or sometimes not at all—you understand why we do things differently here.”

Another producer from the Northeast who’s running managed intensive grazing on 400 cows added something interesting: “We took the best parts from New Zealand—the paddock system, focusing on grass quality—but adapted it for our reality. Sometimes that means feeding stored forage for five months instead of two. Our butterfat stays strong at 4.0-4.2%, but we’re definitely not low-cost anymore.”

This suggests to me that climate adaptation is forcing everyone’s costs to converge, which could erode New Zealand’s traditional advantage faster than people realize.

What Smart Operators Are Actually Doing

It’s interesting watching what experienced producers are doing versus what they’re saying. Federal Reserve ag lending data shows dairy borrowing is flat or declining across most mature markets despite strong cash flows. Farm Credit System quarterly reports suggest folks who survived 2015-16 are using this windfall to strengthen balance sheets, not build new facilities.

I know several producers who’ve shifted focus from volume to components. They don’t care if they ship 10% less milk if their butterfat hits 4.2% instead of 3.8%. The math just works better, especially when plants are at capacity.

According to the International Association of Milk Control Agencies, processors with 70% or more of their milk under long-term contracts report much better stability than those chasing spot markets. And something else I’m seeing—producer groups working together to secure whey protein extraction agreements. They’re thinking five years out, not five months.

What’s really telling is how the conversation has shifted. Five years ago, everyone was talking expansion and efficiency. Now? It’s all about flexibility and resilience.

Different Regions, Different Opportunities

Where you’re located really shapes your options. Upper Midwest producers, those new cheese plants—Hilmar’s operations in Texas and Kansas, plus others coming online—are creating massive whey streams according to Dairy Foods reporting. Smart producers are already talking to specialty protein processors about capturing that value.

Irish dairy operations have those same grass advantages as New Zealand but they’re closer to premium markets. Ornua’s annual report shows they hit €3.6 billion in revenues in 2024, proving grass-fed products can command serious premiums, especially here in the U.S. where consumers are willing to pay for that story.

Australian producers have their own advantage—they’re closer to Southeast Asian markets that are growing like crazy. Dairy Australia’s export data shows this proximity really matters for fresh products where New Zealand’s extra shipping time creates opportunities.

Here in the Northeast, as many of you know, being close to major cities provides fresh milk premiums that Western operations can’t touch. I heard a Pennsylvania producer at a recent conference say they’re getting $2.50 premiums for local, grass-fed milk going directly to retailers. That completely changes the economics.

And California? Several large operations are dedicating part of their herds to organic or specialty production for Bay Area markets. As one producer put it, “The premium’s worth it when you’re 150 miles from your customer instead of 7,000.”

Timing Is Everything

Looking at construction permits tracked by the China Dairy Industry Association and their published policy documents, domestic cheese production will probably hit serious scale around 2027-2028. Past cycles show market impacts usually show up 18-24 months after capacity comes online, so we’re looking at 2029-2030 as the potential turning point.

Though honestly? Global economic conditions could speed this up or slow it down. And precision fermentation or alternative proteins could throw a wrench in everything, though current costs suggest traditional dairy keeps its advantages for commodity uses through at least 2030.

If this follows previous patterns, we’ll probably see some softness in 2026 that everyone calls “temporary.” By 2027, it’ll be “challenging conditions.” By 2029-2030? That’s when everyone finally admits there’s structural oversupply.

Producers expanding aggressively right now might find themselves in trouble by decade’s end. But those building cash reserves? They could be in position to buy assets at pretty good discounts. As a Wisconsin ag lender specializing in dairy told me recently, “The farms that survived 2015 and bought their neighbor’s operation in 2017—those are the ones we want to work with today.”

What This Actually Means for Your Farm


Action Item
Investment/ActionAnnual Impact (500-cow)Risk ReductionTiming Window
Pay Down Debt (2:1)$2 debt reduction per $1 not expanded$15K-30K interest savingsResilience 2x vs expansionNOW (before 2026)
Lock 70% Milk Under ContractLong-term processor agreements$50K+ volatility reduction40% less revenue volatilityNOW (plants at capacity)
Optimize Butterfat (4.2% vs 3.8%)Genetics + feed management$30K-40K (10% less volume)Plant capacity independenceOngoing optimization
Secure Grass-Fed PremiumRegional positioning + certification$125K ($2.50/cwt premium)Metro market insulation2025-2026 (before oversupply)
Build 18-24mo Cash ReservesReserve fund accumulationSurvival in 18-mo downturn90%+ survival (vs 40%)Immediate (2027-30 risk)

When the world’s lowest-cost producer is pumping flat out despite softening prices, they’re not celebrating—they’re extracting value while they can. That massive payout Fonterra’s making? To me, that looks more like getting cash to farmers while it’s available, not permanent prosperity.

The practical stuff isn’t complicated, but man, it’s hard to execute when milk checks are good. Agricultural economists at Iowa State have shown that paying down debt gives you about twice the resilience compared to expansion investment when you’re at the top of the cycle. Lock in what you can—supply agreements, input contracts, customer relationships. Stability beats optimization when things get volatile.

Most importantly, focus on what you control. You can’t control Chinese policy or weather patterns. But you can control your debt level, your costs, your flexibility.

The Bottom Line

I recently toured a newer 2,000-cow facility in Wisconsin—beautiful operation with all the bells and whistles. Robotic milkers, genetics that would make anyone jealous, feed efficiency that pushes every boundary. The owner mentioned they’re breaking even around $18-19 per hundredweight, expecting to drive that down with volume.

What struck me was the contrast. New Zealand’s breaking even at $16.50 with minimal infrastructure and grass. Chinese cheese plants coming online will probably achieve competitive costs without shipping milk across oceans. Even Fonterra, with every advantage you could want, can’t pivot fast enough because of how their governance works.

The real question isn’t whether any of us can match New Zealand on cost—probably not, given the fundamental differences. The question is whether we’re positioned to survive when cost advantages matter less because everyone’s dealing with oversupply.

What I’ve learned over the years is that the best time to prepare for a downturn isn’t when prices crash. It’s when production records and big milk checks make everyone think the party will never end.

That disconnect between New Zealand’s record production and falling auction prices? That’s not a contradiction. That’s a signal, if you’re willing to see it.

A California dairyman who’s been through four cycles in 35 years said it best at a recent meeting: “The pattern never changes—just the products and countries involved. Right now feels like 2014, right before things got tough. We’re paying down every dollar of debt we can.”

The industry’s at an interesting crossroads. How we navigate the next few years depends on decisions we’re making right now, while things still feel good. So what makes sense for your operation, given what’s coming?

The clock’s ticking, as it always does in this business. But this time, if we’re paying attention to the right signals, we can see it coming.

KEY TAKEAWAYS:

  • Pay down $2 debt for every $1 you’d invest in expansion—Iowa State research shows debt reduction provides twice the resilience during downturns compared to growth investments made at cycle peaks, and with current rates, that could mean $15,000-30,000 annual savings on a typical 500-cow operation
  • Lock in 70% of your milk under contracts NOW—processors maintaining this threshold report 40% less revenue volatility than spot-dependent operations, and with Class III-IV spreads widening, that stability could be worth $50,000+ annually
  • Focus on butterfat optimization over volume growth—producers achieving 4.2% butterfat versus 3.8% are capturing an extra $0.25/cwt even with plants at capacity, translating to $30,000-40,000 for a 400-cow herd shipping 10% less volume
  • Position regionally for 2027-2030—Upper Midwest operations should secure whey protein agreements while new cheese plants create oversupply, Northeast producers can capture $2.50/cwt grass-fed premiums near metro markets, and Western operations need organic/specialty contracts before Chinese cheese capacity hits stride
  • Build 18-24 months of cash reserves—the 2015-16 crash lasted 18 months with many good operators going under, but those who survived bought neighboring operations at 40-60% discounts in 2017… and they’re the ones lenders want to work with today

Complete references and supporting documentation are available upon request by contacting the editorial team at editor@thebullvine.com.

Learn More:

Join the Revolution!

Join over 30,000 successful dairy professionals who rely on Bullvine Weekly for their competitive edge. Delivered directly to your inbox each week, our exclusive industry insights help you make smarter decisions while saving precious hours every week. Never miss critical updates on milk production trends, breakthrough technologies, and profit-boosting strategies that top producers are already implementing. Subscribe now to transform your dairy operation’s efficiency and profitability—your future success is just one click away.

NewsSubscribe
First
Last
Consent
Send this to a friend