What the End of Government Relief Really Meant—and How Smart Farms Are Turning Uncertainty Into Opportunity
EXECUTIVE SUMMARY: From Shutdown to Showdown: How Dairy’s 2026 Wake-Up Call Is Redefining Survival” details how the end of the government shutdown set the stage for a year of unprecedented challenge—and opportunity—in the dairy sector. Instead of relief marking the finish line, the reopening exposed new processor contract demands, profit headwinds from make allowance adjustments, and a high-stakes shift to protein-centric pricing, all verified through university extension findings and current market data. The article demonstrates how farms that capitalize on narrow timing windows, lean into peer networks, and embrace collaborative learning are gaining margin and flexibility amidst change. Practical checklists, region-specific examples, and expert-backed insights make it useful at the barn and the boardroom table alike. By weaving in both the pressures and pathways open to all sizes of operation, the story embodies The Bullvine’s commitment to presenting real decisions, not just headlines. In the end, it shows that survival—and success—are less about official relief and more about being prepared to adapt, connect, and strategize for what 2026 brings next.
You know, as much as we all soaked in the relief of those USDA payments and the delayed Milk Production reports this past fall, the lesson of the moment is clearer than ever: what matters most heading into 2026 is how quickly and thoughtfully we respond to the challenges—not just what help the government sends. What I’ve noticed—confirmed by producers in Wisconsin, Florida, and even out west—is that “relief” doesn’t make the difference for your bottom line. It’s how you move with the changing facts, the shifting contracts, and the farm realities in front of you.
Pull up a stool. Here’s how that’s actually playing out in barns, co-op meetings, and balance sheets, with credible trail markers for farms of all sizes.
Speed Kills (Complacency): Margins in the Data Gaps
What farmers are finding is that, in this climate, the winners are the ones ready to act. When the USDA’s October Milk Production report was missing for weeks, extension specialists and loan officers across the Midwest were fielding anxious calls. Herds that moved quickly—hedged milk at $17.35/cwt right after the report, or locked in feed at $4.10—wound up with $2,000-$2,500 more on every 500 cows compared to those who waited. CME and Wisconsin extension data both show how waiting for “certainty” can shrink margins before you even see the warning.
It’s not luck. It’s keeping your strategy loose, your phone handy, and your local data bookmarked. Fresh cow management, feed contracts, and market windows—they all demand being both alert and decisive, especially as 2026 approaches.
Make Allowance Leaks: When Efficiency Quietly Costs You
The Allowance Shift: June 2025 Make Allowance Increase Transfers ~$0.50/cwt from Producer Milk Checks to Processor Margins
Let’s lay out the dollars and cents. Thanks to FMMO make allowance changes last summer, about $82 million annually has shifted from producer checks into processor cost recovery, according to the American Farm Bureau and university research. That hits particularly hard for 400-600 cow herds in the Midwest, where $8,000-$15,000 in value quietly vaporized from family budgets in 2025 alone. While vertically integrated co-ops sometimes recoup some through patronage, for most, these quieter cost shifts are exactly what force new choices—do we hold, reinvest, cut inputs, or consider transitioning out?
The lesson? It’s time to double down on IOFC, watch every transition group closely, and look at every feed and labor line as a matter of survival, not just habit.
Premium Contracts: New Growth, New Hurdles
The Processor Divide: Expanded Capacity and Premium Contracts Favor Large Operations—Small Farms Face Component Quality Barriers Worth $4.40/cwt
Let’s get real about processor expansion. Yes, IDFA and DFO confirm $11 billion in new milk-processing capacity, but the “growth” headlines come with some fine print. Today’s direct contracts expect you to consistently deliver volume (often 1,000+ cows), protein over 3.2%, and sub-Grade A somatic cell counts.
Why the clampdown? Processors need stable, high-quality components to secure export and retail channels, invest in automation, and deliver on food safety for globally diverse buyers. UW reports and field officers say this shift is now woven into most new plant supplier specs.
It’s not all doom. Farms who began investing in butterfat genetics, precision feed systems, and herd data management years ago are fielding more calls, not fewer. Those focusing just on short-term barn expansion are finding that you can’t rush a protein curve or a culture of quality management. Extension and Minnesota case studies show that slow, steady moves—targeting milk components and recordkeeping upgrades first—put herds in the fast track for premium deals.
December’s 3.3% Rule: Protein as the Baseline
Speed Kills Complacency: How Quick Response to Market Data Translates to $1,400+ More Per 500 Cows
Here’s what’s interesting: this year’s biggest structural shift might be USDA’s new baseline for protein—up from 3.1% to 3.3% (USDA Final Rule). It’s been a long time coming, and peer-reviewed research had foreshadowed the change for several years. Genetics, feeding, and savvy fresh cow management have all nudged national averages upward. But it’s the local impacts—from blend checks to contract premiums—that hit home.
What does that mean practically? A 0.2% difference in protein, per 100 cows, adds up to $400-800 in annual check value, per the latest Midwest and Ontario extension data. Above 3.3%? You’re in the bonus column. Below? Now’s the time to pull out the ration notes and see where you can tweak, swap, or invest before the next round of pricing hits.
More importantly, more farms are opening up the books—digitizing records, crowdsourcing advice in peer groups, and trading input strategy tips without fear of “giving away secrets.” As more transition into 2026, collaborative learning is proving, in the field and in extension trials, to be a margin driver as real as any piece of steel.
Transition Planning: The Strongest Exit Isn’t Running—It’s Timing
One of the biggest takeaways this year is that transition can be a strength, not a sign of retreat. USDA NASS land reports peg the Midwest ground firmly above $25K/acre; extension planners increasingly help herds time “retirement” or partner transitions before the next storm hits. The real win? Leaving with financial options and the pride of calling the shot on your terms.
Herds still thinking big? UW and DFO studies show that the best results come when expansion is built on several years of component improvement and a fresh-cow strategy—not as a panic reaction to price. Dry lot and fresh group upgrades, pooled input efforts, and peer feedback show up again and again in success stories.
And for those holding steady, including herds in the 200-700 cow bracket, “optimization” is earning a new respect. Peer networks and beef-on-dairy strategies (with calves bringing $400-600, latest UMN data) are now front-line tools, and regular peer benchmarking is ensuring that the smartest changes don’t just sit on paper—they get put into practice.
Are You Fast Enough for 2026?
Pulling together farmer panels and co-op roundtables, it’s clear: being nimble, not just knowledgeable, is the new shield against margin loss. Extension economic analysis calls it “window management”—profits are made in these small, rapid openings, not in broad trends or after-the-fact decision meetings.
Facing Protein Gaps? Your Action Checklist
Bring three years of production and component records to a dairy-literate advisor.
Model the value and cost of boosting protein (and the status quo if you don’t).
Sit down with a local extension or farm business group—where are your best, region-specific levers hiding?
Use your peer network: tested approaches and hard-learned lessons are worth more than a new gadget.
So if there’s one sure thing heading into our “2026 wake-up call,” it’s that resources, relationships, and rapid response matter. Let’s keep those mugs full and the learning real—together, we’ll keep setting the pace for the next curve in dairy.
KEY TAKEAWAYS:
Farms that respond swiftly to new information—securing prices or input deals as data shifts—routinely outperform those waiting for a “clear signal.”
The new normal: Processor contracts and milk pricing now demand higher protein, stricter quality, and more documentation, making management upgrades and peer collaboration must-haves.
Smart transition planning—whether exiting, scaling, or realigning—can be a competitive edge, helping farm families lock in value rather than react to crises.
Operational resilience is increasingly about connecting with peer networks, bulk-buying alliances, and benchmarking tools—not just individual innovation.
For 2026, the most resilient farms will be those that adapt fastest to changing rules, seize learning opportunities, and stay proactive in their markets.
Complete references and supporting documentation are available upon request by contacting the editorial team at editor@thebullvine.com.
Every week, thousands of producers, breeders, and industry insiders open Bullvine Weekly for genetics insights, market shifts, and profit strategies they won’t find anywhere else. One email. Five minutes. Smarter decisions all week.
Your best cow makes 4.5% butterfat. Your processor pays for 4%. Your neighbor with robots is profitable at $16 milk. You need $19.50. Welcome to dairy’s new reality.
Executive Summary: Fresh cows across America are now routinely exceeding 4.2% butterfat—a genetic miracle achieved in five years that should’ve taken thirty. But here’s the crisis: processors built for 3.7% milk can’t handle today’s components, capping payments at 4% while farmers produce 4.5%. With heifer inventory at its lowest since 1978 (3.914 million head) and milk prices stuck at $16.70, mid-sized farms bleeding cash at $19-20/cwt production costs watch 5,000-cow operations profit at the same prices. Four proven paths exist: scale to competitive size with locked-in processing contracts, exit strategically while preserving 70-85% equity, differentiate into $42-48/cwt niche markets, or adopt robotics for megadairy-level efficiency at family scale. The genetic revolution is permanent and irreversible. The only question is whether you’ll adapt by choice or by force.
You know, I recently spent time with a third-generation Wisconsin dairyman reviewing his latest DHIA test results, and what we saw tells the whole story. Every fresh cow in his transition pen—every single one—was testing above 4.2% butterfat, right out of calving. He looked at those numbers, shook his head, and said something that’s been rattling around in my mind ever since: “We’ve bred exactly what we wanted, and now we’re not entirely sure what to do with it.”
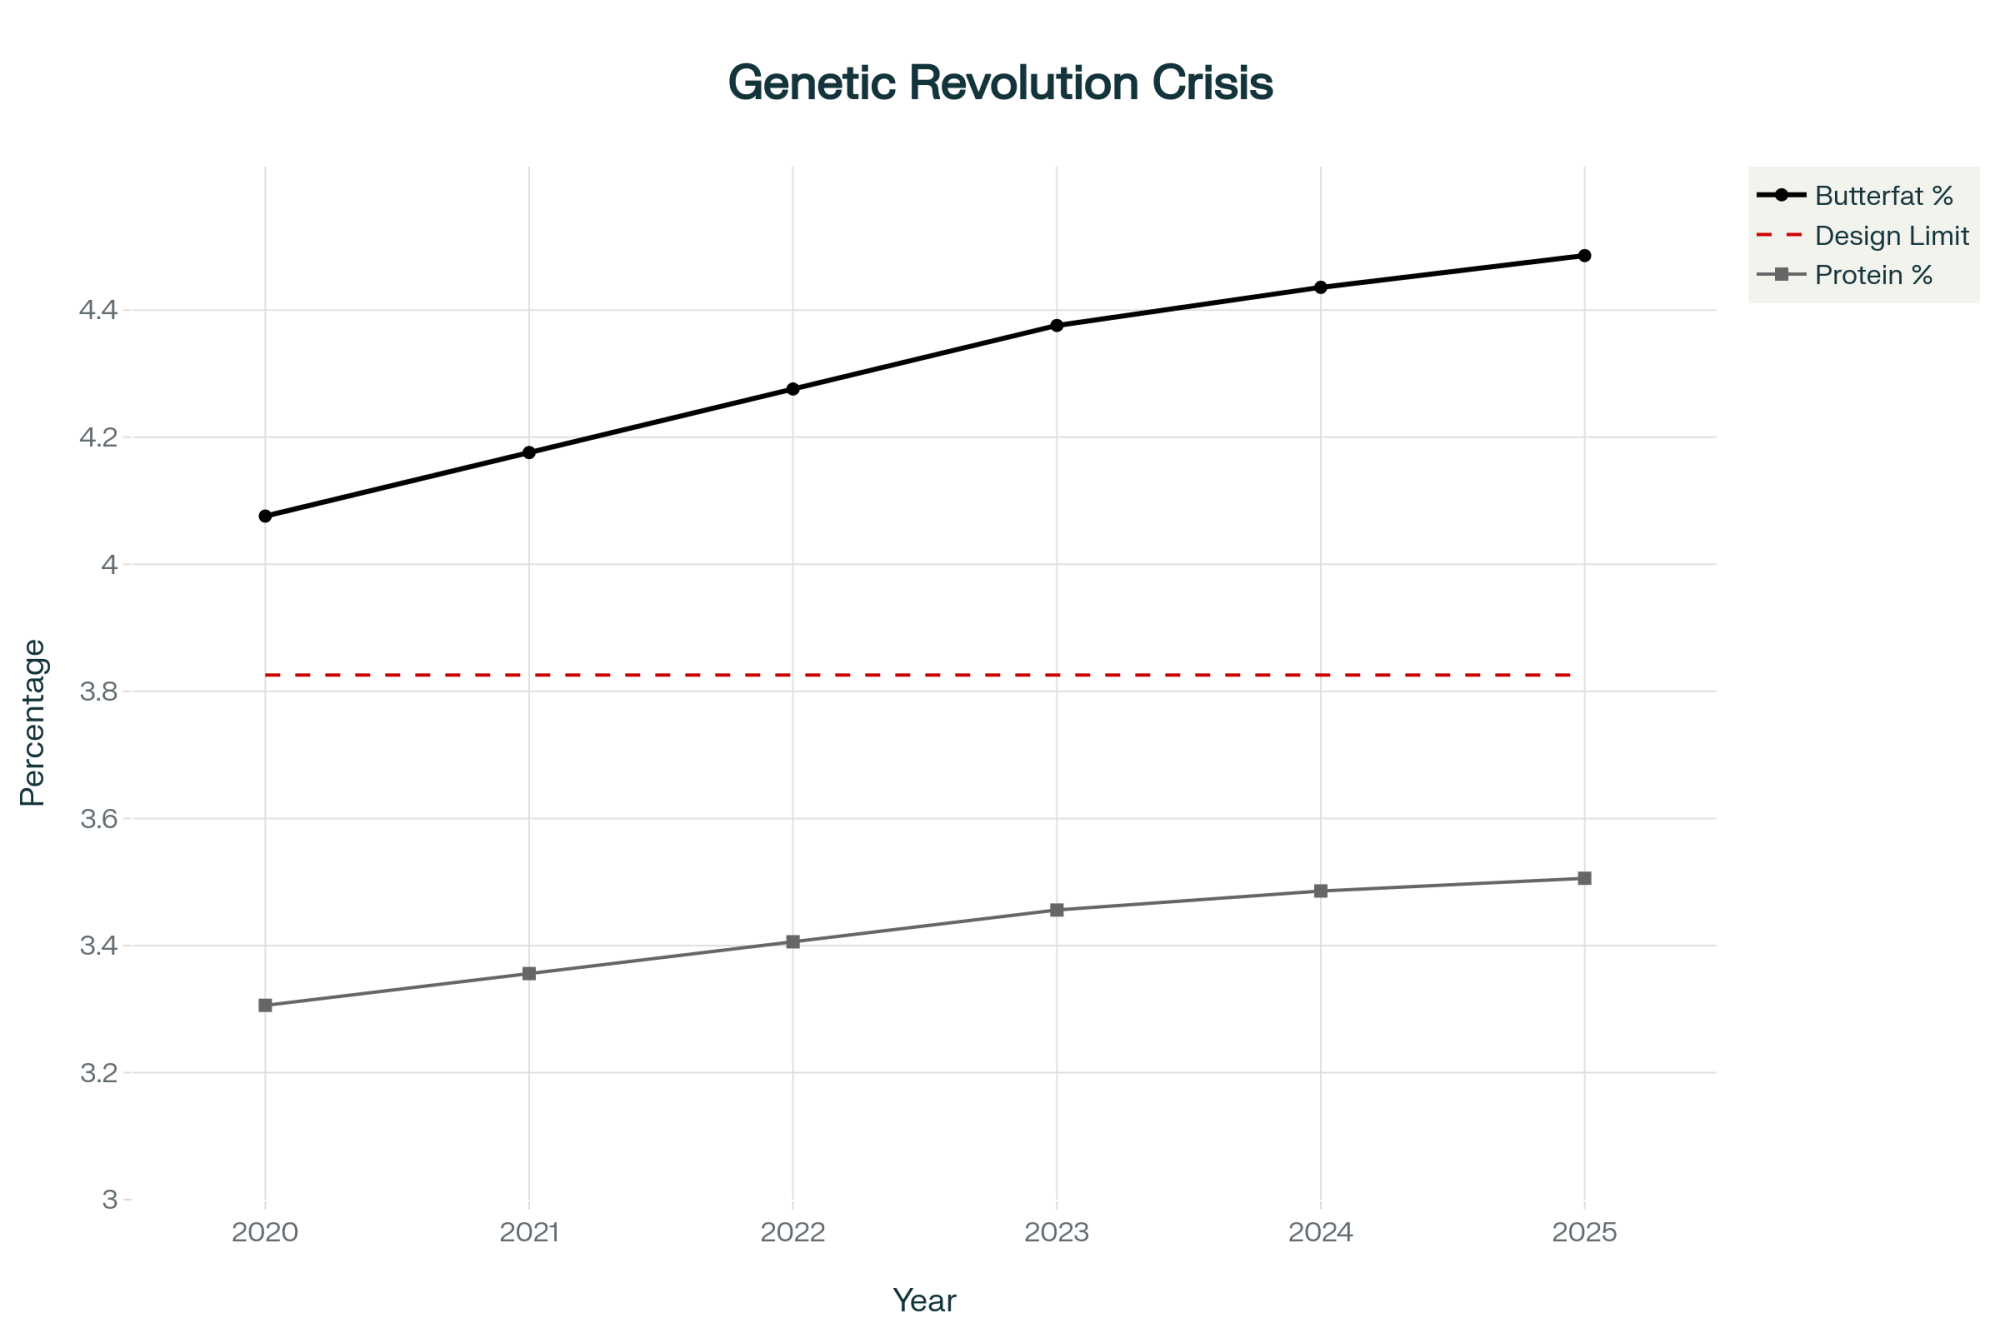
That conversation really captures what’s happening across our industry right now. According to the USDA’s September 2025 Milk Production report, we’ve pushed average butterfat from 3.95% in 2020 to 4.36% today. Think about that for a minute—what took our grandfathers thirty years, we’ve done in five. August milk production hit 19.5 billion pounds, up 3.2% from last year, with the average cow producing 2,068 pounds monthly. It’s incredible progress by any measure.
And yet… here we are, looking at Class III futures stuck around $16.70 through spring 2026 on the CME, and many of us are wondering how success became so complicated.
The genetic miracle becomes a processing nightmare: butterfat jumps from 3.95% to 4.36% while plants designed for 3.7% struggle to handle excess cream, triggering payment caps at 4%
Understanding the New Production Reality
What’s really fascinating is how fundamentally genomic selection has changed the game since it took off around 2009. The Council on Dairy Cattle Breeding’s August 2025 data shows we’ve essentially doubled our rate of genetic gain—from about $40 in Net Merit annually to $85.
Now, Net Merit—for those who haven’t dug into the genetics reports lately—basically captures lifetime profit potential. It rolls milk production, components, fertility, and longevity into one dollar value. When that’s jumping $85 every single year, well… you’re looking at cows that are fundamentally different from what we milked even a decade ago.
Here’s what this means in practical terms on your farm. The genetic potential for butterfat percentage is increasing by about 0.04-0.06% annually, according to CDCB’s latest evaluations. When combined with nutritional advances, this results in the total observed improvement of 0.1% or more that we see in the tank—and the genetic portion is baked in permanently. Protein content has risen from around 3.18% in 2020 to 3.38% today based on the USDA’s component testing data. Generation intervals have compressed from 5 years to just over 3, as Holstein Association USA’s genomics report documents. We’re seeing component-adjusted milk solids up 1.65% year-to-date, even though actual volume declined slightly, according to Progressive Dairy’s June 2025 analysis.
What’s particularly noteworthy—and honestly, kind of sobering—is that these improvements are permanent. Unlike feed rations, you can adjust, genetic potential can’t be dialed back when market conditions shift. Dr. Chris Wolf and his team at Cornell’s Dyson School have been documenting this reality extensively in their market outlook papers. Once those genetics enter your herd, that production capacity is there to stay.
I recently spoke with nutritionists working with Idaho operations averaging 95 pounds daily at 4.4% butterfat, and here’s what’s interesting: they’re now reformulating rations, trying to moderate component production. Can you imagine? Five years ago, we were doing everything possible to push components higher. Now, some folks are actually trying to pump the brakes. It’s a complete reversal of production philosophy.
And it’s not just us dealing with this. New Zealand’s LIC reports similar acceleration in genetic gains in their latest breeding worth statistics, though not quite at our pace. European data from Eurostat’s dairy production reports show that average butterfat has gone from 4.05% to about 4.18% over the same period. Australia’s seeing comparable trends according to DataGene’s genetic progress reports. But nobody’s matched what American genetics have achieved, and… well, that’s becoming part of the problem, isn’t it?
“We’ve bred exactly what we wanted, and now we’re not entirely sure what to do with it.” — Wisconsin dairy producer, reviewing 4.2%+ butterfat across his entire fresh pen
Understanding Component Changes
Metric
2020 Baseline
2025 Current
Annual Change
Butterfat
3.95%
4.36%
+0.1-0.15%
Protein
3.18%
3.38%
+0.04%
Manufacturing Impact
Baseline
+20-25% cheese yield
Permanent gain
The Processing Bottleneck Nobody Saw Coming
Here’s where things get really interesting—and frankly, a bit concerning for many of us. While we’ve been celebrating these genetic achievements, we’ve created this mismatch between what our cows produce and what our plants can actually handle.
Several Midwest cheese plants are reporting that their systems were engineered for milk with an average butterfat content of 3.7%. Today’s routine deliveries at 4.5% or higher? That creates real operational challenges. During spring flush, some facilities literally can’t process all the cream they’re separating. Nobody really saw that coming.
California’s experience really illustrates this challenge. Their Department of Food and Agriculture’s October 2025 utilization report shows that over 55% of milk now flows to Class IV processing—that’s butter and powder—because cheese manufacturers struggle to utilize all that excess butterfat efficiently. When your infrastructure expects one thing and your milk delivers something entirely different, you get these localized surpluses that hammer prices even when demand is actually pretty decent.
You know what’s making this worse? We used to count on seasonal variation. University extension research from Wisconsin and Minnesota has long documented that summer heat stress typically reduces component levels by 0.2-0.3%, giving plants a natural breather. But with better cooling systems, enhanced summer rations… that dip isn’t happening like it used to. Plants that historically scheduled maintenance for July and August are running at full capacity year-round.
What many producers are encountering now—and you’ve probably experienced this yourself:
Some processors have implemented butterfat payment caps at 4.0%—anything above that, you’re not getting paid for it
Seasonal penalties ranging from $0.50 to $1.00 per hundredweight when components get too high, according to various Michigan and Wisconsin co-op reports
Regional price differences of $2-3 per hundredweight based on what local plants can handle
Several Wisconsin cooperatives are introducing component ratio requirements for the first time in decades
The industry’s responded with substantial investment—CoBank’s August 2025 Knowledge Exchange report and Rabobank’s dairy quarterly show about $8 billion in new processing capacity over three years. Major projects include Leprino’s Texas expansion opening in March 2026, Hilmar’s Kansas facility operational since July 2025, and California Dairies’ new beverage plant with 116,000 gallons daily capacity. But here’s the catch: these facilities were designed using milk projections for 2020-2021. They might be underestimating where genetics are actually taking us.
Jim, a VP of Operations at a major Midwest processor, told me at a recent industry meeting: “We’re essentially trying to retrofit 20th-century infrastructure for 21st-century milk. It’s like trying to run premium gasoline through an engine designed for regular—it works, but not optimally.”
The Demand Side Reality Check
Now, it’s worth acknowledging that demand hasn’t been standing still either. USDA Foreign Agricultural Service data shows U.S. dairy exports totaled around $7.8 billion in 2024, with cheese and whey products leading growth. Mexico remains our largest market, accounting for nearly 30% of exports, while Southeast Asian demand for milk powders continues to expand at 5-7% annually, according to USDA FAS regional analyses.
Domestically, we’re seeing interesting innovation too. Ultra-filtered milk sales grew 23% year-over-year according to IRI market data, and high-protein dairy products are capturing premium shelf space. The yogurt category alone has shifted toward Greek and Icelandic varieties that utilize more milk solids per unit—Chobani and Siggi’s now represent nearly 40% of the yogurt market by value, according to Nielsen data.
But here’s the reality—and this is what the economists at CoBank and Rabobank keep emphasizing in their reports—these demand-side factors, while positive, simply can’t keep pace with genetically-driven supply growth. When you’re adding 0.1-0.15% butterfat annually across 9.3 million cows, that’s creating manufacturing capacity equivalent to adding 200,000 cows every year without actually adding any cows. Export growth of 3-4% annually and domestic innovation can’t absorb that kind of structural increase.
A Wisconsin cheese maker I talked with last month put it pretty clearly: “We can sell everything we make, but we can’t make everything that’s being produced. The components are just overwhelming our systems.”
Why the Heifer Shortage Changes Everything
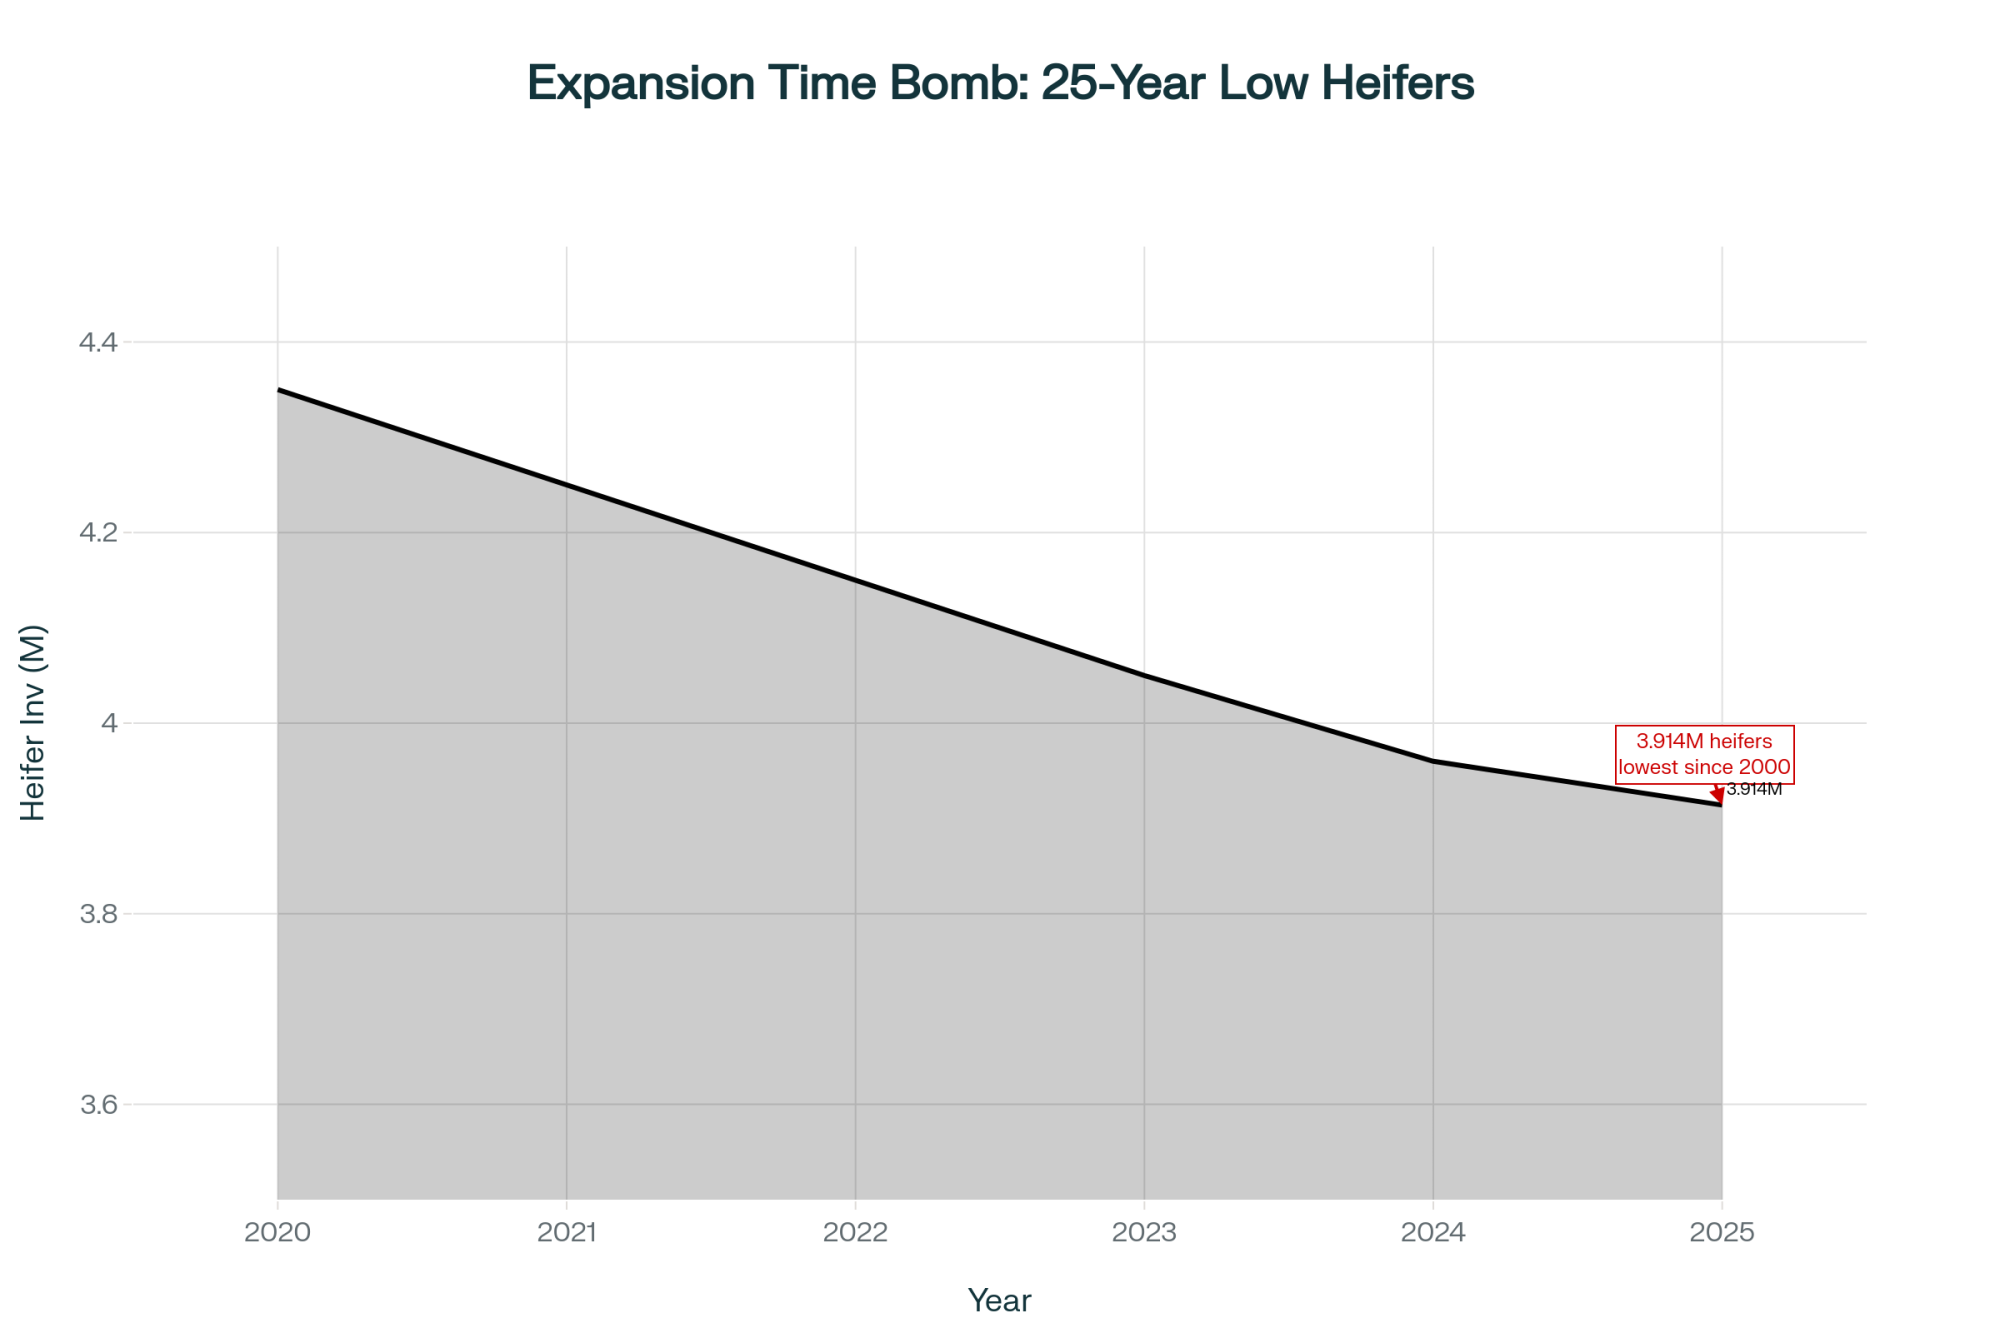
The replacement crisis creating tomorrow’s volatility: heifer inventory crashes to 3.914 million as 30% beef semen usage guarantees delayed expansion followed by genetically-supercharged production surges in 2028-2029
Now let’s talk about something that’s really reshaping market dynamics—the heifer situation. USDA’s October 2025 Cattle report shows we’re at 3.914 million replacement heifers. That’s a 25-year low, a level we haven’t seen since the turn of the century.
Regional heifer markets reflect this scarcity in a big way. At a sale in Lancaster County, Pennsylvania, last month, quality-bred animals brought $3,200 to $3,800. Five years ago? Those same heifers would’ve been $1,800 to $2,200. Mark Johnson, a buyer from Maryland, whom I talked with there, summed it up: “At these prices, every heifer has to offer exceptional potential.”
What’s driving this shortage is fascinating—and kind of predictable in hindsight. National Association of Animal Breeders’ 2025 annual report shows beef semen sales to dairy farms reached 7.9 million units last year, representing about 30% of total breedings. When feed costs spiked during 2023-2024, many operations reduced replacement programs by 30-40%. Tom Harrison, who runs 2,200 cows near Syracuse, New York, told me last week, “We cut our heifer program dramatically back then. We’re definitely paying for those decisions now.”
Here’s what this means for how markets will behave going forward:
Traditional expansion when prices improve? That’s now delayed 24-30 months minimum
When expansion eventually occurs, accumulated demand will likely trigger rapid growth
Those delayed heifers will carry enhanced genetics, amplifying future production increases
We’re basically setting up conditions for extended corrections followed by more dramatic rebounds
CoBank dairy economist Ben Laine’s latest analysis—published in their September 2025 outlook—offers really intriguing projections. He suggests milk prices might strengthen in 2026-2027 because no one can expand quickly. But then watch out for 2028-2029 when all those genetically superior heifers enter production. It’s like we’re loading a spring that’ll release all at once.
The Consolidation Reality Reshaping Farm Economics
The brutal mathematics of survival: mega-dairies banking $2.70 per hundredweight while mid-sized farms bleed $2.80—same milk price, catastrophically different outcomes determined purely by scale
At World Dairy Expo this October, every conversation seemed to circle back to consolidation. Dr. Andrew Novakovic’s team at Penn State released dairy markets research showing we’re approaching 85% processor concentration among the top five companies. Meanwhile, USDA’s preliminary 2024 Census of Agriculture data documents the decline from 648,000 dairy operations in 1970 to about 25,000 today.
But this isn’t just about getting bigger. I’ve been looking at cost-of-production data, and the disparities are striking. Wisconsin’s Center for Dairy Profitability September 2025 benchmarks show large operations exceeding 2,500 cows report production costs around $13-15 per hundredweight. Mid-sized farms—that 500-999 cow range many of us operate in—are looking at $19-20.
At current Class III prices near $17, that differential literally determines who’s profitable and who’s burning equity. A dairy farmer fromt the Texas Panhandle running 5,000 cows, showed me his books—still making money at $16 milk. His neighbor with 800 cows? He needs $19.50 just to break even. That’s not management quality—that’s structural economics.
Dairy’s ruthless transformation: 55 years collapse 648,000 farms to a projected 15,000 by 2030 while five processors tighten control to 90%—power consolidating on both sides of the check
But you know, smaller operations aren’t completely out of the game. A growing number of sub-200-cow farms are exiting the commodity markets entirely.
Strategic Pathways for Mid-Sized Operations
Pathway
Key Requirements
Success Factors
Typical ROI Timeline
Scale Up(1,500+ cows)
$5-8M capital; Processing partnerships secured first
Economies of scale; Strategic processor relationships
7-10 years
Strategic Exit
Act before distress; Professional valuation
Timing (retain 70-85% equity); Current market: $5,500-$7,000/cow
Immediate
Niche Markets
Location near population centers; Marketing capability
Direct sales at $42-48/cwt vs. $17 commodity; Strong brand development
3-5 years
Robotic Technology
$225-300K total installed cost per robot; 60-70 cows/robot
Labor efficiency rivals megadairies; Maintains family management
5-7 years
Four Strategic Pathways for Mid-Sized Operations
For those of us running 500 to 1,500 cow operations—and that’s still most of us, right?—the current environment demands some really honest assessment. Based on extensive discussions with lenders, consultants, and farms that have recently navigated these choices, I’m seeing four main pathways emerge.
Scaling to Competitive Size
This means expanding to 1,500-plus cows to capture those economies of scale. Dairy outlook reports show you’ll need $5-8 million in capital, and—this is crucial—processing partnerships secured before you break ground. Based on what lenders and consultants are telling me, successful transitions remain relatively uncommon, mostly limited by capital access and those processor relationships.
Strategic Exit Timing
This is about selling while you can still retain 70-85% of your equity rather than waiting for forced liquidation. Legacy Dairy Brokers, who handle many Northeast sales, tell me that success improves significantly with early action rather than distressed sales.
Differentiation Beyond Commodities
This involves transitioning to specialized markets—organic, A2, and local brands. While success varies considerably by location and marketing ability, farms near population centers with strong direct marketing skills are finding viable niches.
Technology-Driven Efficiency Through Robotics
Here’s an interesting fourth pathway that’s gaining traction, especially for that squeezed middle segment. DeLaval’s 2025 North American sales report shows robotic milking installations increased 35% this year, primarily on farms with 300-800 cows. Lely and GEA report similar growth trends. These operations are achieving something remarkable—labor efficiency approaching megadairies while maintaining family management structures.
I visited a family near Eau Claire, Wisconsin, who installed six robots last year for their 400-cow herd. They’re down to three full-time people, including family members, and their cost per hundredweight dropped significantly—by nearly $3. The initial investment was substantial—around $1.8 million total—but with current labor challenges and costs, the five- to seven-year payback looks increasingly attractive, according to equipment manufacturers’ ROI analyses.
What’s particularly interesting is that these robotic operations can often secure better financing terms. Lenders see them as technology-forward with lower labor risk. It’s not the right fit for everyone, but for operations with good management and a willingness to embrace technology, it’s proving to be a viable middle path.
Risk Management Tools Every Farmer Should Understand
What surprises me is how many folks still aren’t using available federal programs effectively. Let me share what’s actually working based on USDA Farm Service Agency data and producer experiences.
Dairy Margin Coverage at the $9.50 level has provided exceptional value. FSA’s October 2025 program report documents average net benefits of $0.74 per hundredweight above premiums during challenging margin periods from 2021-2023. For Tier 1 coverage—your first 5 million pounds—the premium’s just $0.15 per hundredweight. That’s essentially subsidized protection. Enrollment deadlines are on March 31 each year, and you can enroll online at farmers.gov/dmc or call your local FSA office at 1-833-382-2363.
And here’s something interesting—with USDA’s Agricultural Marketing Service reporting October cull cow prices at $150-157 per hundredweight, strategic culling has become a real opportunity. Dave Carlson, a Michigan producer I spoke with last week, managing 650 cows near Grand Rapids, summarized it pretty well: “At $2,000 per cull cow while we’re losing money on milk, the math becomes pretty straightforward. We’ve reduced our milking herd by 15% and improved cash flow immediately.”
Regional Perspectives Reveal Different Realities
What fascinates me is how differently this transformation affects various regions. In Vermont and the Northeast, smaller operations with strong local markets are often outperforming mid-sized commodity producers. NOFA-VT’s 2025 pricing survey documents local, grass-fed, or organic premiums reaching $10-15 above conventional prices.
Down in the Southern Plains—Texas, Kansas, Oklahoma—it’s a completely different story. The massive investments in processing are driving aggressive expansion. A farmer I talked with in Texas, with 3,500 cows outside Amarillo, described the situation: “It’s basically a land grab for processing contracts. If you don’t have one locked in by 2027, you’re done.”
Pennsylvania’s situation particularly illustrates the challenges faced by mid-sized farms. Built on family operations, Penn State Extension’s latest report shows they lost 370 dairy farms in 2024 alone—predominantly in that 200-700 cow range. A farmer, managing 650 cows near Lancaster, explained his predicament when we talked last month: “We’re too large for direct marketing, too small for processor attention. We’re caught between models.”
Even within states, the variations are remarkable. Northern New York benefits from proximity to Canada and strong cooperatives, generally maintaining better margins than western New York operations shipping to distant processors. It’s all about local dynamics now.
Looking Ahead: What 2030 Actually Looks Like
Based on current trends and industry analysts’ projections—Rabobank’s September 2025 five-year outlook and CoBank’s consolidation analysis are particularly telling—the dairy landscape in the 2030s will be dramatically different. We’re likely looking at:
14,000 to 16,000 total operations, down from today’s 25,000
Five major processors potentially controlling 90-92% of capacity
Average herd size around 600-650 cows, though that masks huge variation
Butterfat potentially averaging 4.52% if current genetic trends continue
The vast majority of production—maybe 75-80%—from operations exceeding 1,500 cows
Dr. Marin Bozic, the University of Minnesota dairy economist, made an observation at a conference I attended last month that really stuck with me: “Dairy is industrializing in 20 years what took poultry 40 years and swine 30 years to accomplish.”
The traditional 500- to 1,500-cow family dairy—the backbone of Wisconsin, Minnesota, and Pennsylvania—will need to either scale up, specialize, embrace technology, or transition out. Those aren’t easy choices, but ignoring them doesn’t make them disappear.
Practical Takeaways for Dairy Farmers
So what should you actually do with all this information? Here’s what I think makes sense:
Within the next month:
Calculate your true production costs, including family labor at market rates (University Extension has excellent worksheets—Wisconsin’s are particularly thorough)
Get written quotes from multiple processors or cooperatives for comparison
Make sure you’re enrolled in DMC before the March 31 deadline—it’s basically free protection
Have an honest conversation with your lender: Can we survive 18 months at $16.50 milk?
Over the next quarter:
Honestly evaluate which of the four strategic pathways aligns with your capabilities and family objectives
If you’re considering selling, start conversations now while maintaining your negotiating position
Reassess genetic selection strategies—maybe maximum production isn’t the goal anymore
Explore local differentiation opportunities or technology investments that might provide a competitive advantage
Long-term positioning:
Accept that genetic gains create permanent structural changes requiring adaptation
Understand that processing relationships increasingly determine profitability beyond farm efficiency
Recognize that scale economies, differentiation, or technology adoption are becoming essential
Build cash reserves—volatility’s the new normal
The Bottom Line
After months of researching this and talking with farmers nationwide, here’s my conclusion: The genetic revolution we’ve achieved—doubling productivity gains in 15 years—is absolutely remarkable. It represents American agriculture at its finest.
But it’s also fundamentally altered what economically viable dairy farming looks like. The efficiencies we’ve pursued individually have, collectively, created structural oversupply that traditional market mechanisms struggle to address. When everyone improves components 0.1% annually through permanent genetics… well, we’ve changed the entire game.
An Iowa breeder I’ve known for years, recently showed me comparative bull proofs from his files—1985’s top butterfat bull was plus 45 pounds, today’s leaders exceed plus 150. His observation was telling: “We achieved exactly what we selected for. Maybe we should’ve considered whether we truly wanted it.”
What’s becoming clear is tomorrow’s dairy success won’t just be about efficient milk production. It’ll be about strategic positioning, processing partnerships, risk management sophistication, technology adoption, and having the courage to make difficult decisions before they’re forced on you.
For those willing to adapt—whether through scaling, specializing, embracing technology, or strategic exit—viable pathways remain. The question becomes whether we’ll acknowledge these changes and adapt, or keep hoping for an industry structure that’s already gone.
The genetic revolution hasn’t merely changed how we produce milk. It’s reshaped what sustainable dairy farming means. Understanding and adapting to that reality, rather than resisting it, offers the clearest path forward.
As a Wisconsin farmer told me just last week: “We keep searching for someone to blame—genetics companies, processors, imports. Maybe we just got too good at what we do. Now we need to figure out what comes next.”
That’s the conversation we need to be having. And it needs to happen now, while options remain, not after another thousand farms close their doors.
For more information on the risk management programs mentioned in this article:
Dairy Margin Coverage (DMC): farmers.gov/dmc or call 1-833-382-2363
Livestock Gross Margin for Dairy (LGM-Dairy): Contact your approved crop insurance agent
Find your local FSA office: farmers.gov/service-locator
Complete references and supporting documentation are available upon request by contacting the editorial team at editor@thebullvine.com.
Learn More:
Rethinking Dairy Cattle Breeding: A Guide to Strategic Sire Selection – This guide provides tactical methods for adjusting your breeding program in a component-saturated market. It demonstrates how to select sires that balance production with crucial health and efficiency traits, directly impacting your herd’s future profitability and market relevance.
The Dairy Farmer’s Guide to Navigating Market Volatility – Explore advanced financial strategies for building resilience against the price volatility described in the main article. This analysis reveals how to leverage marketing tools, manage input costs, and build a flexible business model to protect your equity through unpredictable cycles.
The Robotic Revolution: Is Automated Milking the Future for Your Dairy? – For those considering the technology pathway, this deep dive details the operational ROI and management shifts required for robotic milking. It provides a crucial framework for evaluating if automation can deliver the labor efficiency and production gains needed to compete.
The Sunday Read Dairy Professionals Don’t Skip.
Every week, thousands of producers, breeders, and industry insiders open Bullvine Weekly for genetics insights, market shifts, and profit strategies they won’t find anywhere else. One email. Five minutes. Smarter decisions all week.
To provide the best experiences, we use technologies like cookies to store and/or access device information. Consenting to these technologies will allow us to process data such as browsing behavior or unique IDs on this site. Not consenting or withdrawing consent, may adversely affect certain features and functions.
Functional
Always active
The technical storage or access is strictly necessary for the legitimate purpose of enabling the use of a specific service explicitly requested by the subscriber or user, or for the sole purpose of carrying out the transmission of a communication over an electronic communications network.
Preferences
The technical storage or access is necessary for the legitimate purpose of storing preferences that are not requested by the subscriber or user.
Statistics
The technical storage or access that is used exclusively for statistical purposes.The technical storage or access that is used exclusively for anonymous statistical purposes. Without a subpoena, voluntary compliance on the part of your Internet Service Provider, or additional records from a third party, information stored or retrieved for this purpose alone cannot usually be used to identify you.
Marketing
The technical storage or access is required to create user profiles to send advertising, or to track the user on a website or across several websites for similar marketing purposes.
To provide the best experiences, we and our partners use technologies like cookies to store and/or access device information. Consenting to these technologies will allow us and our partners to process personal data such as browsing behavior or unique IDs on this site and show (non-) personalized ads. Not consenting or withdrawing consent, may adversely affect certain features and functions.
Click below to consent to the above or make granular choices. Your choices will be applied to this site only. You can change your settings at any time, including withdrawing your consent, by using the toggles on the Cookie Policy, or by clicking on the manage consent button at the bottom of the screen.
Functional
Always active
The technical storage or access is strictly necessary for the legitimate purpose of enabling the use of a specific service explicitly requested by the subscriber or user, or for the sole purpose of carrying out the transmission of a communication over an electronic communications network.
Preferences
The technical storage or access is necessary for the legitimate purpose of storing preferences that are not requested by the subscriber or user.
Statistics
The technical storage or access that is used exclusively for statistical purposes.The technical storage or access that is used exclusively for anonymous statistical purposes. Without a subpoena, voluntary compliance on the part of your Internet Service Provider, or additional records from a third party, information stored or retrieved for this purpose alone cannot usually be used to identify you.
Marketing
The technical storage or access is required to create user profiles to send advertising, or to track the user on a website or across several websites for similar marketing purposes.


 The Sunday Read Dairy Professionals Don’t Skip.
 The Sunday Read Dairy Professionals Don’t Skip.