Archive for dairy processing

Your Cheese Plant’s New Bacteria Can Run 56% Faster – Why This Technology Decides Which Processors (and Farms) Survive 2030

Processors cut cheese time 56% with gene-edited cultures—your milk price depends on if yours adopts by 2026

EXECUTIVE SUMMARY: What farmers are discovering is that gene-edited bacterial cultures aren’t just making cheese 56% faster—they’re fundamentally reshaping which processors survive the next five years. University of Wisconsin-Madison trials documented 80% fewer phage-related shutdowns in facilities using these enhanced cultures, while processors report getting an extra vat through daily with the same equipment. The technology works by optimizing bacteria’s natural traits through CRISPR—no foreign DNA involved—creating what industry suppliers call “programmable” fermentation that adjusts to milk composition and market demands. Regional patterns are already emerging: California processors are partnering aggressively with UC Davis, while Wisconsin’s split between innovation leaders and traditional holdouts is evident. Meanwhile, mid-scale operations everywhere face a harsh reality—adapt, consolidate, or exit. For dairy farmers, this means fewer but potentially more stable processor relationships, with those starting implementation now having 75% better odds of success than those waiting until 2027. The window for positioning your farm advantageously is open today, but processors are making decisions right now that will determine market access for the next decade.

dairy processing innovation

You know what’s got processors buzzing at every industry meeting these days? They’re getting an extra vat through daily with the same equipment, same crew—just different bacterial cultures. And when you dig into the research behind this, the implications for all of us are bigger than most folks realize.

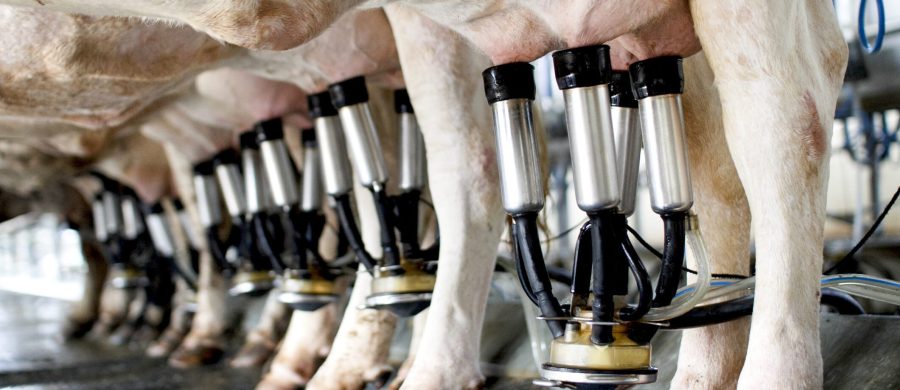
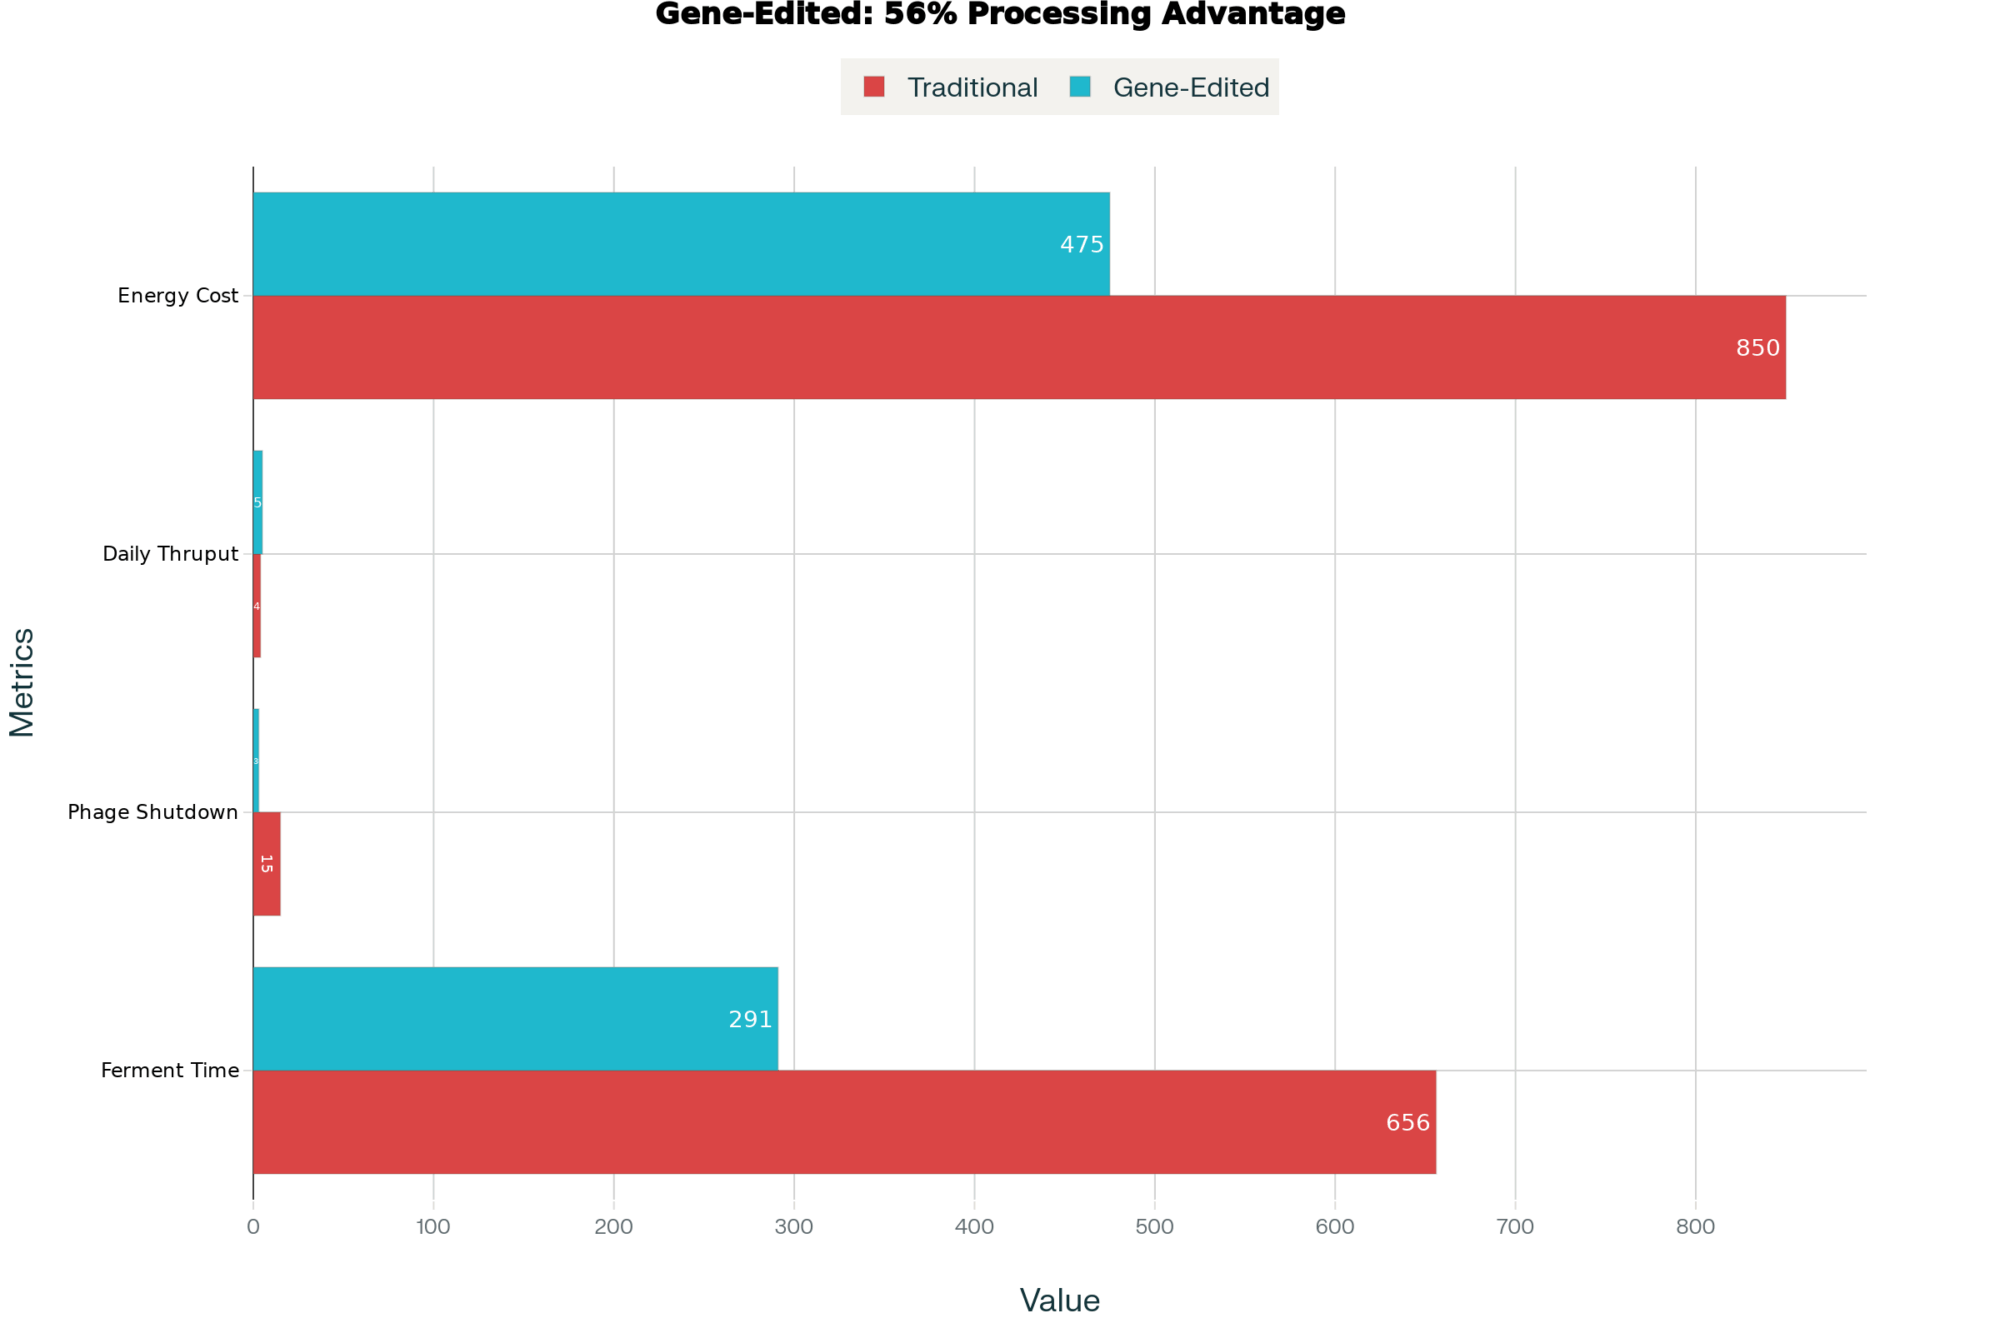
The University of Wisconsin-Madison’s dairy extension documented a remarkable finding in their 2024 trials: facilities using gene-edited bacterial cultures experienced 80% fewer phage-related shutdowns. Meanwhile, Applied and Environmental Microbiology published data this August showing 56% faster fermentation times in controlled settings. This isn’t theoretical anymore—it’s happening in cheese plants right now, and it’s starting to reshape how processors think about capacity, efficiency, and even which farms they want to work with.

I’ve been following this development closely, speaking with everyone from small artisan cheesemakers to large co-ops that process thousands of tons daily. What’s becoming clear is we’re not just looking at another processing upgrade. This technology is fundamentally changing competitive dynamics in ways that’ll affect every farm shipping milk, regardless of size or location.

Making Sense of the Science

So what exactly makes these gene-edited cultures different from what processors have been using for decades?

Firstly, this isn’t like the old GMO controversies, where foreign DNA is introduced—and that distinction really matters. CRISPR technology, which FEMS Microbiology Letters explained well in their February 2024 issue, allows scientists to optimize traits that bacteria already possess. Think of it like… well, you know how we select for higher components in our herds? They’re doing something similar with bacteria, just at the genetic level. Same organism, better performance.

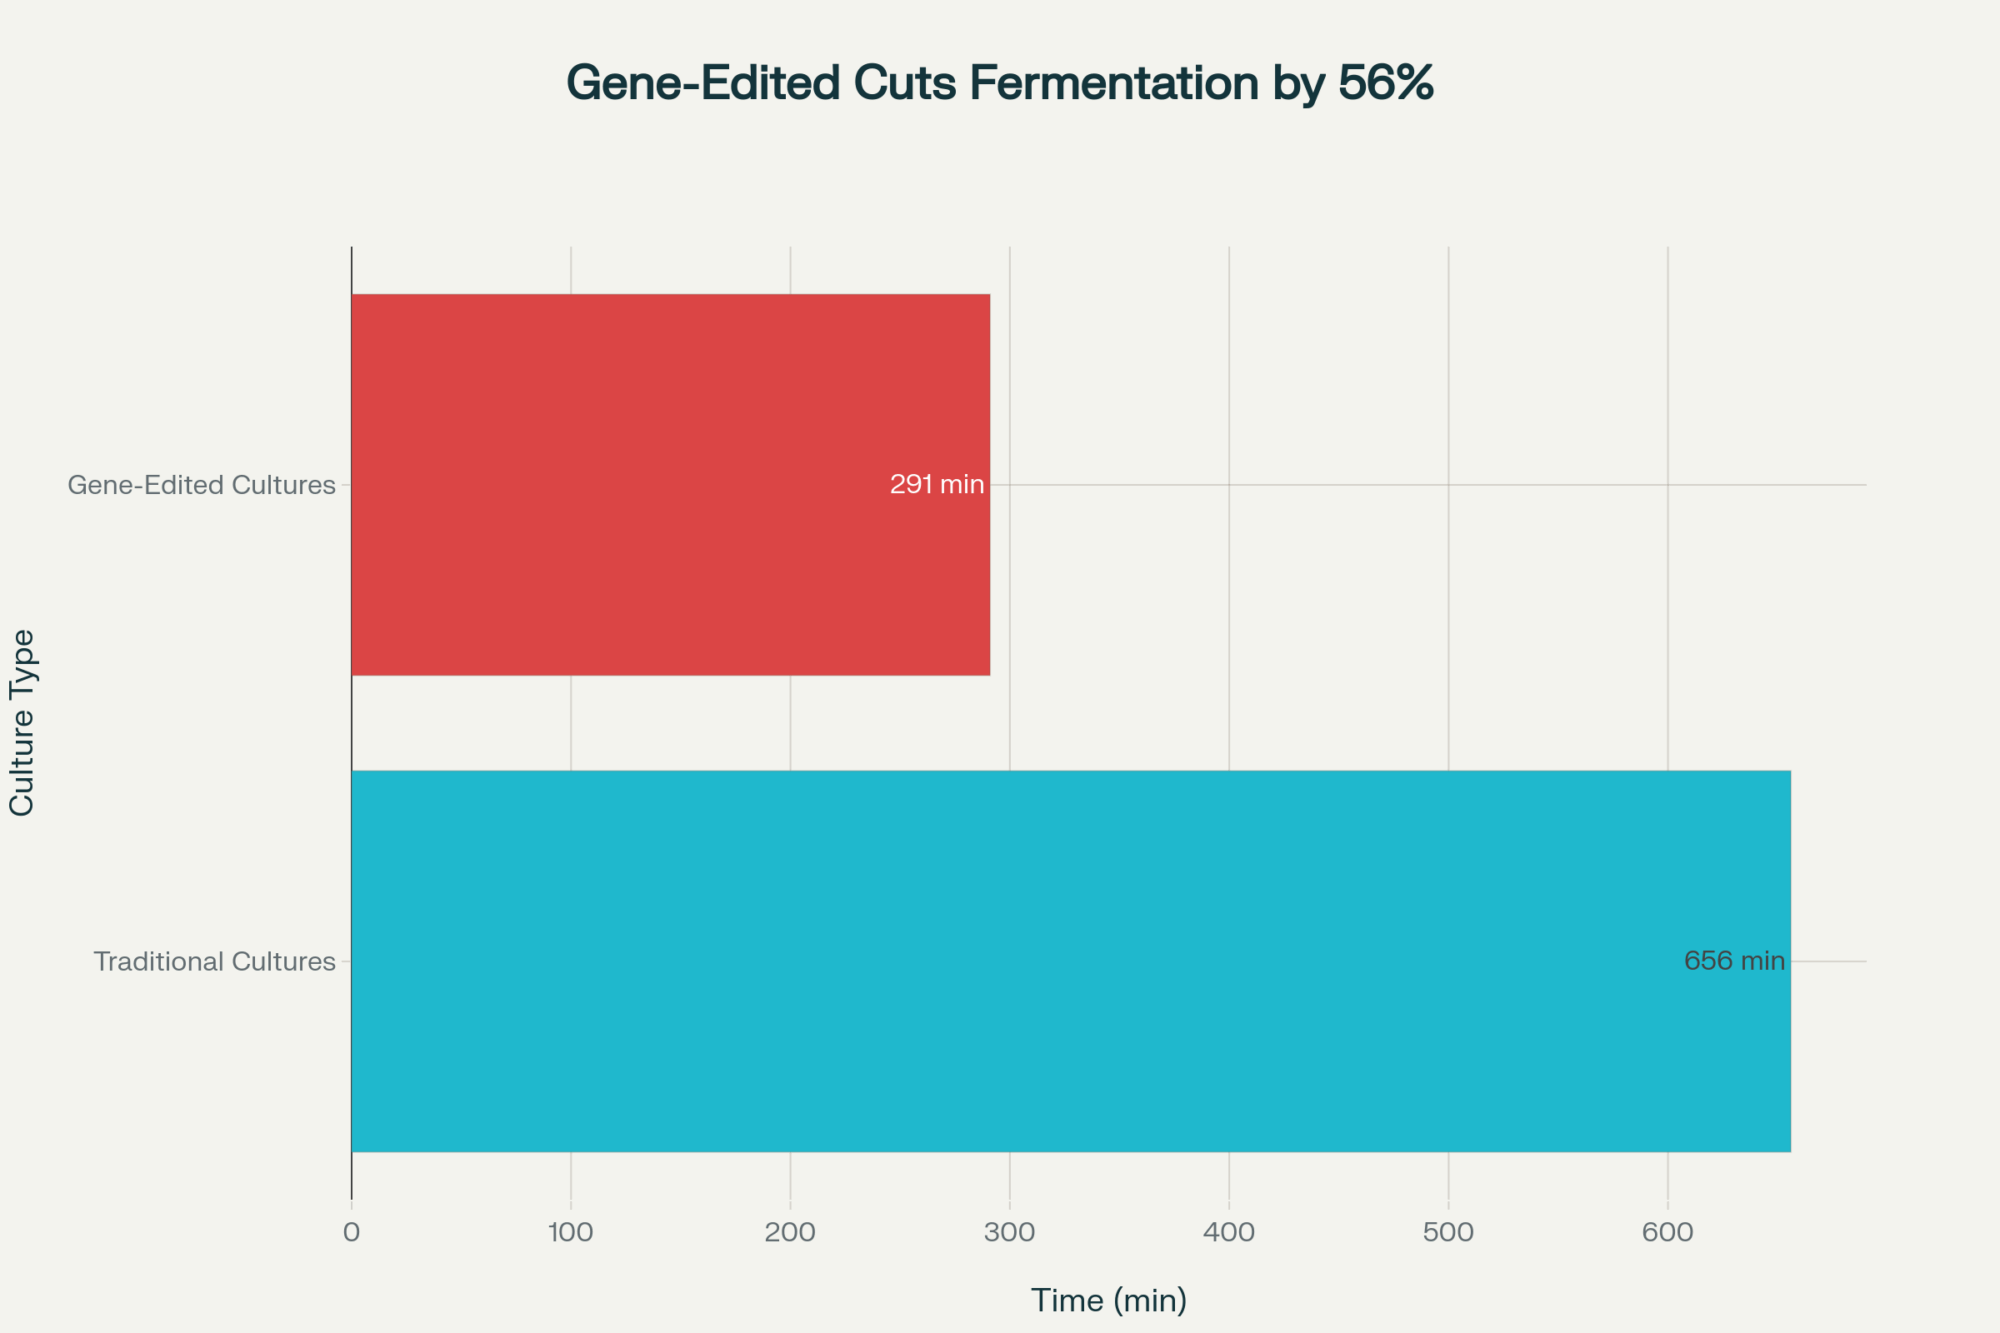
The University of Copenhagen published fascinating data on modified Streptococcus thermophilus strains that reach the target pH in 291 minutes, compared to the usual 656 minutes. Why should we care? Faster acidification enables processors to process more milk through existing equipment without the need to build new vats. That’s a game-changer for their economics—and eventually, for milk pricing.

The 56% fermentation time reduction isn’t just about faster cheese—it’s about processors achieving 30% more throughput with existing equipment, fundamentally changing the economics of dairy processing and determining which facilities survive consolidation.”

The science behind it actually makes sense once you understand what they’re doing. By enhancing protease genes—basically the bacteria’s ability to break down casein—they’re making more nutrients available for bacterial growth. The bacteria perform better because they’re essentially getting a more balanced diet. Kind of reminds me of the difference we see in milk production when we nail the transition cow ration versus when we don’t quite get it right.

Zero New Equipment, 25% More Output: The Math Processors Love

Processors across different scales are reporting consistent improvements:

  • Throughput gains in the 20-30% range (imagine getting that from your existing parlor without adding a single stall)
  • Dramatic drops in phage contamination losses
  • Lower energy costs from shorter fermentation cycles
  • Much more predictable results during the spring flush when components are bouncing around

Industry culture suppliers like Chr. Hansen and IFF (formerly DuPont) describe these as “programmable” cultures—meaning processors can adjust fermentation characteristics based on milk composition, product specs, even when electricity rates are lower. It’s giving them a level of control they’ve never had before.

56% Faster, 80% Fewer Failures: The Numbers Processors Can’t Ignore

Three-Speed Industry Emerging

8% Setting the Pace While 92% Risk Obsolescence

What’s fascinating is watching how different processors are responding to this opportunity—or threat, depending on your perspective.

The Early Movers (Less Than 10%)

A small group of processors is not waiting for the FDA’s formal guidance, expected in 2026. They’re utilizing self-affirmed GRAS (Generally Recognized as Safe) status—a regulatory pathway that has been in existence since 1997, but is not widely recognized.

Examining the FDA GRAS Notice Database reveals an interesting story. Perfect Day’s precision fermentation whey protein was approved in March 2020. Remilk followed with beta-lactoglobulin in 2022. New Culture secured approval for animal-free casein this February. These precedents are creating pathways that traditional dairy processors could follow if they choose to.

The Squeezed Middle

Regional processors handling 200-800 tons daily are in a tough spot. They can’t match the massive investments of the big players—Fonterra just committed $500 million to biotechnology through their Ki Tua Innovation Fund this June. However, they’re also too large to pivot quickly, unlike specialty operations.

These mid-scale facilities are facing what you might call strategic compression. They lack both the capital for major innovation and the agility for rapid adaptation. Several processors I know are already exploring mergers, partnerships, or finding specialized niches. It’s not panic—it’s recognition that the competitive landscape is shifting fast.

Small Operations Finding Opportunities

Here’s what surprised me: artisan and small-scale processors are discovering real advantages through university partnerships. Wisconsin’s Center for Dairy Research, UC Davis, Cornell—they’re all running programs where small operations can access this technology without massive capital commitments.

Vermont cheesemakers working with their state university are combining traditional methods with modern science, and their customers—the ones paying $35 per pound for aged cheddar—seem to appreciate both the heritage and the innovation. This mirrors what we’ve seen with farmstead operations that embrace technology while maintaining their craft identity.

Five Critical Questions Every Farmer Should Ask Their Processor Today

QuestionWhy It MattersWhat to Listen For
“What’s your position on gene-edited starter cultures?”Reveals strategic thinking and competitive awarenessActive exploration = stronger positioning; Wait-and-see = potential vulnerability
“How might this affect my component premiums?”Could change payment structures significantlyPlans for adjusting premiums based on consistency vs. variation
“Are you considering consolidation or partnerships?”Your market access depends on their survivalTransparency about strategic options vs. evasive responses
“What about organic certification?”Critical for organic producersClear segregation plans and a committed organic strategy
“What’s your implementation timeline?”Earlier adoption = better competitive positionStarting now = good odds; Planning for 2027+ = risky

The Reality of Implementation

Based on what processors are actually experiencing, here’s how implementation typically unfolds—and it’s tougher than the sales pitches suggest.

Getting Everyone on Board (Months 1-3)

The biggest challenge isn’t technical—it’s organizational. Board members often confuse gene editing with GMO technology, even though gene editing does not involve the introduction of foreign DNA. It takes time to educate everyone on the differences and implications.

Processors typically spend three months on planning and education before making any commitments. University extension specialists often provide a crucial outside perspective during these discussions. What really matters is getting your quality team, operations staff, and salespeople all to understand what’s changing and why.

Running Pilots (Months 4-9)

This phase always takes longer than expected. You can’t just swap cultures like changing a barn cleaner belt. The entire fermentation profile changes, requiring new quality control protocols. Staff training takes months, not the weeks most processors budget for.

Customer communication during pilots requires real finesse. Some processors handle this brilliantly by being transparent without creating alarm. Others, however, create unnecessary market concerns that can take months to resolve.

Scaling to Full Production (Months 10-18+)

Converting an entire facility while maintaining production is like rebuilding your milking system while still milking twice a day. Technically possible, but it requires exceptional coordination and timing.

Common challenges include:

  • Working capital needs that often exceed initial budgets substantially
  • Customer education is becoming critical as implementation scales
  • Competitors sometimes spreading concerns about the technology
  • Supply chain coordination is becoming surprisingly complex

Regional Patterns Taking Shape

Geographic adoption patterns reveal how university partnerships and regional innovation cultures create lasting competitive advantages—California’s UC Davis collaboration versus Wisconsin’s cooperative resistance will determine regional milk pricing power for the next decade.

Different parts of the country are approaching this transformation in ways that reflect their unique situations.

California: Larger processors appear to be moving aggressively, often leveraging partnerships with UC Davis. Smaller operations are doubling down on organic and artisanal positioning—smart differentiation given their market dynamics.

Wisconsin: Shows interesting contrasts. Some cheese processors are pushing hard on innovation, while others maintain traditional approaches. The cooperative structure sometimes slows down decision-making, but it can provide resources once consensus is built.

Northeast: Fluid milk processors appear less engaged (which may prove shortsighted, given margin pressures), while specialty cheese operations are actively partnering with Cornell and the University of Vermont.

Southeast: Taking a measured approach overall, though some Greek yogurt processors are exploring applications where fermentation time directly impacts capacity utilization.

Upper Midwest: Watching Wisconsin closely while dealing with their own consolidation pressures. Several mid-sized processors in Minnesota and Iowa are forming informal groups to share information and potentially pool resources.

Idaho and Pacific Northwest: Larger operations are quietly evaluating options, particularly those supplying West Coast specialty cheese markets. The distance from major research universities is creating unique partnership challenges.

Understanding the Regulatory Landscape

The regulatory situation is more straightforward than many realize, although geography plays a significant role in determining it.

In the U.S., that self-affirmed GRAS pathway exists today. Companies can establish safety through independent expert panels without waiting for FDA pre-approval. The FDA’s formal guidance, expected in 2026, will provide an additional framework, but it isn’t required to move forward.

Europe operates completely differently. Their Novel Food regulations require 18-36 month approval processes, giving U.S. processors a significant head start in technology adoption and market positioning.

Canada and Mexico are monitoring U.S. developments and will likely follow with some delay, creating potential export opportunities for early-adopting U.S. processors.

The Economics That Matter

While specific numbers vary by facility, the patterns are clear. Processors report substantial reductions in phage-related losses—which have been an expensive hidden cost for decades. Combined with throughput improvements and energy savings, the economics can be compelling for successful implementers.

However, here’s what the technology suppliers often overlook: successful implementation requires much more than just purchasing new software. It demands supplier partnerships, comprehensive training, and careful market positioning. Miss any of these elements and those promising economics evaporate quickly.

Implementation consistently exceeds budgets by 40% and timelines by 50%, but successful processors still achieve compelling returns—the key is realistic planning and commitment to seeing transformation through completion.

One Midwest processor shared (off the record) that their implementation costs exceeded budget by 40%, largely due to extended timelines and unexpected customer education needs. They remain positive about the investment, but it took 18 months longer than planned to generate returns.

$2.5M Annual Benefit Transforms Mid-Size Processor Economics

Looking Ahead: The 2030 Dairy Processing Landscape

Based on current adoption patterns, recent consolidation announcements, FrieslandCampina’s acquisition of MilcobelndCampina-Milcobel in January, and capital flowing into biotechnology, we’re heading toward a fundamentally different industry structure.

The processor consolidation timeline shows why 2025-2026 decisions determine decade-long outcomes—early adopters gain insurmountable advantages while late movers face elimination or acquisition by 2030.

We’ll likely see three distinct operational tiers:

  • Technology-enabled mega-processors are achieving efficiency levels we haven’t seen before
  • Regional specialists using selective technology adoption for specific market positioning
  • Artisan operations combining tradition with innovation for premium markets

The conventional middle market—characterized by moderate scale and traditional technology—faces the most pressure. Without technology advantages or premium positioning, these operations will struggle to compete.

For dairy farmers, this means:

  • Fewer but potentially more stable processor relationships
  • Greater importance of understanding your processor’s strategic position
  • Need for contingency planning if your processor isn’t well-positioned
  • Possible opportunities with processors who value a consistent, quality supply for their enhanced efficiency

What This Means for Different Farm Sizes

Large Operations (1,000+ cows): You’ve got negotiating power. Use it to understand your processor’s technology strategy and secure favorable contracts before consolidation reduces options.

Mid-Size Farms (200-1,000 cows): You’re in the sweet spot for processors who value consistent volume and quality. Build relationships with multiple processors now, before consolidation limits choices.

Small Farms (Under 200 cows): Consider forming partnerships with artisan processors that leverage university connections. Your flexibility and quality focus align well with premium market positioning.

Organic Producers: This technology does not directly apply to you, but consolidation affects everyone. Ensure your processor has clear segregation plans and a committed organic market strategy in place.

The Bottom Line for Your Farm

This isn’t some distant possibility—processors are making decisions right now that will determine their competitive position for the next decade. And their position directly affects your milk check and market access.

The technology demonstrably works. The economics can be strong for those who implement successfully. The regulatory pathways exist. What separates winners from losers increasingly comes down to execution capability and timing.

Have frank conversations with your processor about their plans and expectations. Their transparency—or lack of it—tells you something important about your own positioning needs. As the industry transforms, whether individual processors participate or not is a key consideration.

Looking back, 2025 will likely be remembered as a pivotal year, marking a significant turning point in history. The question is whether you recognized the signals and adapted accordingly, or got caught reacting to changes already underway.

This goes beyond bacteria making cheese faster. We’re watching competitive dynamics reshape our entire industry. And that reshaping is happening right now—today—regardless of whether we’re ready.

I’ve witnessed numerous changes during my years in the dairy industry. This one feels different—faster, more fundamental to processing economics. But here’s what I know for sure: dairy farmers who stay informed, ask tough questions, and keep their options open usually find their way through.

The key is understanding what’s happening, evaluating how it affects your specific operation, and making decisions based on your circumstances—not someone else’s. While technology may be reshaping dairy processing, good business judgment and strong relationships remain the most important factors.

And at the end of the day, processors still need quality milk from reliable farms. That hasn’t changed. What’s changing is which processors will be around to buy it, what they’ll pay, and what they’ll value most. Understanding those shifts—that’s what’ll separate the farms that thrive from those that just survive.

Keep asking questions. Keep building relationships. And, perhaps most importantly, continue to discuss with other farmers what they’re seeing and hearing. Because in times of change, our best resource has always been each other.

So here’s the real question: Will your operation be positioned to benefit from these changes, or will you find yourself scrambling to adapt when your processor announces their strategy? The window for proactive positioning is open now—but it won’t stay that way for long.

KEY TAKEAWAYS

  • Processors using gene-edited cultures achieve 20-30% throughput gains without new equipment, fundamentally changing their economics—ask your processor about their technology timeline before consolidation limits your options
  • Implementation takes 12-18 months and often exceeds budgets by 40%, but early adopters capture market advantages that become impossible to match—processors starting now have vastly better supplier access than those waiting for 2026 FDA guidance
  • Regional dynamics vary significantly: California large processors lead adoption, Wisconsin shows cooperative resistance, the Northeast fluid processors lag dangerously—understand your region’s pattern to anticipate market changes
  • Five critical questions determine your processor’s survival odds: their position on gene-edited cultures, impact on your premiums, consolidation plans, organic segregation strategy, and implementation timeline—transparent answers suggest stronger positioning
  • Small farms under 200 cows can thrive through artisan processor partnerships leveraging university programs, while mid-size operations (200-1,000 cows) should build multiple processor relationships now before consolidation reduces choices

Complete references and supporting documentation are available upon request by contacting the editorial team at editor@thebullvine.com.

Learn More:

Join the Revolution!

Join over 30,000 successful dairy professionals who rely on Bullvine Weekly for their competitive edge. Delivered directly to your inbox each week, our exclusive industry insights help you make smarter decisions while saving precious hours every week. Never miss critical updates on milk production trends, breakthrough technologies, and profit-boosting strategies that top producers are already implementing. Subscribe now to transform your dairy operation’s efficiency and profitability—your future success is just one click away.

NewsSubscribe
First
Last
Consent

Nebraska’s New $186M Plant: Will Local Milk Prices Finally Shift?

Nebraska farmers: 70% of your milk gets hauled out-of-state — how’s that working for your bottom line?

EXECUTIVE SUMMARY: Here’s what’s happening. Most Nebraska milk — about 70% — gets shipped out of state, and every mile those trucks roll is money out of your pocket. However, a fix is in the works: a $186 million dairy plant that’ll process 30% of that milk right here at home. We’re talking about  1.8 million pounds daily and 70 new jobs that actually matter to local communities.This isn’t just Nebraska news — it’s part of a $8+ billion wave of processing investments reshaping the dairy industry nationwide. What caught my attention? Farms maintaining somatic cell counts below 150,000 are landing premium contracts that make a real difference. The bottom line: if you’re still stuck in the “ship it far away” mindset, you’re leaving serious money on the table. Time to rethink your strategy.

KEY TAKEAWAYS:

  • Cut transport costs by 15-30% by processing milk closer to home — Map your distance to emerging processing hubs and explore partnerships that reduce hauling miles. With fuel volatility hitting hard in 2025, every saved mile counts.
  • Boost milk premiums through disciplined SCC management below 150,000 — Tighten your herd health protocols and milking hygiene now. Premium processors are paying real money for consistent quality, not just volume.
  • Capture 18-25% margin improvements through strategic vertical integration — Consider partnerships or cooperative arrangements with processors. The $ 8 billion+ industry consolidation wave means independent operators need allies.
  • Leverage shelf-stable technology advantages during supply disruptions — UHT processing proved its worth during COVID when conventional milk got dumped. Position yourself near facilities offering resilient processing options.
  • Focus on geographic positioning over pure production efficiency — A recent University of Wisconsin Extension analysis shows that processing proximity increasingly outweighs per-cow productivity for sustainable profitability in volatile markets.
dairy processing, dairy profitability, UHT milk processing, milk transportation costs, somatic cell count

For decades, Nebraska dairy producers have faced a stark reality: a near-total lack of local processing options, forcing most milk to be shipped far from home. But that’s changing—fast. This summer, DARI Processing, led by the experienced Tuls family, broke ground on what could genuinely be a game-changer for regional dairy economics.

We’re talking about a $186 million investment here—the first new dairy plant Nebraska has seen in over 60 years. That 60-year gap reveals just how underserved the region has been.

Here’s What Actually Happened

The new facility spans 236,000 square feet and is designed to process about 1.8 million pounds of milk daily. However, what makes this interesting is that they’re using Ultra-High Temperature (UHT) processing, combined with aseptic packaging technology. The strategic brilliance of this choice lies in its impact on market access: these products can remain on shelves for up to 14 months without refrigeration. That’s market access conventional fluid milk can’t touch.

The products roll out under the MooV brand: ultra-filtered, lactose-free, high-protein milk that’s already stocked in over 180 HyVee stores across the Midwest.

Governor Jim Pillen captured it perfectly at the June 18, 2025, groundbreaking ceremony: “This plant allows us to add value right here, supporting family farms and keeping economic benefits in our state.”

Key Investment Metrics:

  • $103 per pound of daily processing capacity (competitive with coastal mega-facilities)
  • 70 full-time jobs expected by early 2027
  • 18-25% projected returns with 4-6 year payback (per UW Extension analysis)
  • Public-private partnerships contributing $11.6+ million in infrastructure support

Why Your Bottom Line Should Care

Here’s the kicker that every producer needs to understand: Nebraska currently ships about 70% of its milk out of state for processing. While exact transportation costs vary by route and season, every mile milk travels represents a direct hit to producer margins.

This plant aims to flip that dynamic entirely, retaining approximately 30% of Nebraska’s milk processing in-state. If you’re within that sweet spot of about 100 miles from Seward? You’re looking at immediate margin improvements through reduced hauling costs.

But here’s where quality becomes everything. They’re prioritizing milk with somatic cell counts below 150,000—this isn’t just about meeting standards; it’s about capturing premium pricing that rewards disciplined herd health management.

What’s fascinating is how this technology proved itself during the COVID-19 pandemic. While conventional processors were dumping millions of gallons because cold supply chains collapsed, UHT technology kept shelf-stable products flowing to consumers. That resilience isn’t just marketing talk—it’s a competitive edge when the next crisis hits.

The Supply Chain Reality Check

Here’s what gets really interesting when you dig into the numbers: Nebraska’s dairy herd has dropped from 55,000 cows in 2013 to about 49,000 today. This plant needs milk from roughly 20,000 cows to run at capacity—nearly half the state’s entire herd.

So where’s that milk coming from? The Tuls family operates about 22,000 cows across multiple operations, including Double Dutch Dairy, Butler County Dairy, and Pinnacle Dairy. They understand vertical integration—controlling both production and processing to capture margins at every level.

But scaling isn’t simple. Finding technicians skilled in aseptic processing? That’s specialized labor commanding premium wages… and they’re not exactly growing on trees around here. Additionally, expanding milk collection beyond efficient hauling distances begins to eat into the transportation savings they’re promising.

The Broader Industry Context

This investment joins a massive national wave—over $8 billion flowing into processing capacity from coast to coast. Consider Darigold’s $ 1 billion+ Pasco facility and Chobani’s $1.2 billion New York expansion. But Nebraska’s edge? Interstate 80 positioning with rail access creates distribution cost advantages that coastal mega-facilities simply can’t match for heartland markets.

Here’s the thing, though… this is more than just another processing plant. It’s part of a fundamental reshaping of how dairy value gets captured. Recent industry consolidation trends suggest that processing proximity is increasingly more important than pure production efficiency when it comes to achieving sustainable profitability.

What Smart Producers Need to Know Right Now

Critical Success Factors:

Proximity pays dividends. Supply chain volatility makes access to processing more valuable than incremental production efficiency gains. Are you positioned strategically or just efficiently?

Quality delivers real premiums. Maintaining SCC standards below 150,000 isn’t just good practice—it’s your ticket to value-added pricing structures.

Integration becomes essential. Whether through partnerships, cooperatives, or vertical arrangements, controlling more of your value chain is no longer optional.

And let’s be realistic about the challenges ahead. Tariff uncertainties, shifting consumer demand patterns, and rising input costs create a knife-edge environment where strategic positioning could make or break operations.

The Bottom Line

This facility represents more than infrastructure—it’s proof that the commodity mindset is evolving in real time. The operators who thrive won’t necessarily be those producing the most milk per cow. They’ll be those positioned strategically near value-added processing that captures premiums rather than shipping commodity products to distant processors who don’t care about your individual operation.

The question every dairy producer should be asking: What’s your strategic positioning for the next decade? Because producers who don’t start thinking beyond the commodity model might find themselves squeezed out by those who do.

Complete references and supporting documentation are available upon request by contacting the editorial team at editor@thebullvine.com.

Learn More:

Join the Revolution!

Join over 30,000 successful dairy professionals who rely on Bullvine Weekly for their competitive edge. Delivered directly to your inbox each week, our exclusive industry insights help you make smarter decisions while saving precious hours every week. Never miss critical updates on milk production trends, breakthrough technologies, and profit-boosting strategies that top producers are already implementing. Subscribe now to transform your dairy operation’s efficiency and profitability—your future success is just one click away.

NewsSubscribe
First
Last
Consent

Strategic Milk Allocation Failures Cost Dairy Producers 40% Potential Butter Premiums

Processors’ allocation blindness costs dairy farmers 40% butter premiums while missing exploding APAC demand—110-year inventory records prove it

EXECUTIVE SUMMARY: Dairy processors have systematically failed at basic milk allocation decisions, costing producers 40% potential butter premiums while chasing low-margin cheese volumes. New USDA data exposes butter inventories at their lowest April level since 1915—just 337,352 thousand pounds—while cheese stocks remain relatively comfortable at 1.4 billion pounds, down only 2% year-over-year. This isn’t market volatility; it’s strategic incompetence that’s left money on the table while global butter demand explodes across Asian markets. With U.S. milk production declining 1.1% and the dairy herd contracting 0.8%, every allocation decision now carries amplified consequences that processors continue to botch. European competitors are already capturing premium Far East markets with specialized butter formats while American processors remain stuck in 1990s thinking. The math is brutal: butter’s record scarcity has created premium pricing opportunities that could reshape dairy profitability overnight, but only for producers smart enough to exploit processor failures. Stop following the herd toward mediocrity—these allocation disasters represent the biggest profit opportunity in modern dairy history.

KEY TAKEAWAYS

  • Capture 40% butter premiums immediately: With inventories at 110-year lows and processors still prioritizing cheese volume over butter value, producers can renegotiate milk pricing contracts to exploit this artificial scarcity and secure premium differentials that could boost annual revenue by $15,000-25,000 per 100-cow operation.
  • Exploit global market misalignment: While U.S. processors fumble domestic allocation, exploding Asian demand for premium butter formats (sheets, dishes, sticks) offers direct-market opportunities worth 25-30% price premiums over traditional commodity pricing—European exporters are already capitalizing on Singapore, Malaysia, and China markets.
  • Leverage production flexibility advantage: With milk production declining 1.1% year-over-year, producers with the ability to adjust component profiles toward butter-optimized milk (higher butterfat percentages through strategic breeding and nutrition) can command premium pricing from desperate processors seeking to rebuild depleted inventories.
  • Position for inevitable market correction: Historic butter shortages alongside stable cheese supplies prove systematic processor misallocation—smart producers building butter-focused relationships now will benefit when the industry inevitably corrects these strategic failures, potentially capturing 15-20% sustained margin improvements.
  • Implement risk management strategies: Record-low buffer stocks mean any production hiccup triggers disproportionate price movements—producers should secure import sourcing relationships and develop contingency pricing mechanisms to protect against volatile input costs while maximizing upside capture during supply disruptions.
milk allocation strategy, dairy profitability, butter premiums, dairy processing, milk pricing

April 2025 inventory data reveals butter stocks at a 110-year low while cheese remains stable, exposing fundamental processing misallocation that smart producers can exploit for maximum profitability

Every dairy producer must face the uncomfortable truth: U.S. butter inventories just crashed to their lowest April level since 1915, while cheese stocks remain relatively comfortable. This isn’t market volatility—it’s a systematic failure by dairy processors who’ve played the wrong game for years.

The numbers paint a devastating picture. Butter stocks plummeted to just 337,352 thousand pounds as of April 30, 2025—a crushing 7% drop from last year’s 362,089 thousand pounds. Meanwhile, cheese inventories managed only a modest 2% decline to 1.4 billion pounds.

This divergence exposes what should terrify every producer: processors have been systematically undervaluing butter production while chasing volume over value in cheese.

The Reality Check: An Industry in Denial

Let’s cut through the processing sector’s collective delusion. When butter hits record lows while cheese stays stable, it reveals a strategic blind spot that’s costing producers millions in lost premiums.

The data from the USDA’s Cold Storage Report doesn’t lie. Butter stocks increased just 4% from March, but that pathetic monthly gain couldn’t touch the massive year-over-year deficit. Compare that to cheese, which managed relative stability despite export pressures.

This isn’t a coincidence—it’s the consequence of flawed allocation strategies that prioritize familiar markets over emerging opportunities. The industry context makes this even more damning: national milk production fell 1.1% compared to last year, with the dairy herd contracting 0.8% year-over-year. Yet processors kept feeding the cheese machine while starving butter production.

What Global Markets Are Screaming

While U.S. processors fumble basic allocation decisions, global markets send clear signals about where the money lies.

Rising global demand for premium butter is exploding across APAC markets—Singapore, Malaysia, Thailand, Indonesia, Hong Kong, and China all represent massive opportunities. High-end bakery trends driving butter sheet demand globally create premium pricing opportunities that dwarf traditional cheese margins.

Here’s the kicker: European producers are already capitalizing on these trends while U.S. processors remain stuck in 1990s thinking. British dairy exporters report that butter formats—butter sheets, butter dishes, butter sticks—represent the fastest-growing segment in Far East and Middle East markets.

Meanwhile, our domestic processors are doubling down on cheese exports to Mexico, completely missing the higher-margin butter opportunities that global competitors are seizing.

The Strategic Blindness Exposed

Since comprehensive records began in December 1915, we’ve never seen April butter inventories this scarce. The previous record low was 1,082 thousand pounds back in 1916. Current levels represent roughly half the 1992 peak of 678,673 thousand pounds.

This isn’t a temporary market blip—it’s the inevitable result of decades of strategic myopia. While processors chase the illusion of cheese profitability, they’ve created artificial scarcity in the higher-value butter segment.

Regional cheese data exposes the dysfunction deeper. Mountain region American cheese stocks surged 35% year-over-year, while West South Central plummeted 34%. This geographic chaos proves that distribution networks are as broken as production priorities.

What Smart Producers Must Do Now

Stop waiting for processors to figure this out. Here’s your immediate action plan:

Next 30 Days:

  • Renegotiate milk pricing contracts to capture butter premium differentials
  • Evaluate direct-market butter opportunities, bypassing traditional processors
  • Establish import relationships before global supply tightens further

Next 90 Days:

  • Assess milk component profiles that optimize butter production potential
  • Investigate co-op partnerships, prioritizing butter manufacturing over volume cheese
  • Develop risk management strategies for volatile input costs driven by artificial scarcity

Next 12 Months:

  • Consider vertical integration opportunities in specialty butter processing
  • Build relationships with premium butter markets commanding 40% higher margins
  • Position for the inevitable correction when processors wake up to their allocation mistakes

The Uncomfortable Truth About Processor Psychology

This crisis didn’t happen overnight. The industry ignored early warning signals because they conflicted with established infrastructure investments and comfortable marketing relationships. Cheese plants are expensive to retool. Export contracts take effort to renegotiate. Change requires admitting mistakes.

But comfort is the enemy of profit in agriculture. While competitors cling to outdated models, forward-thinking producers can exploit this systematic blindness.

Public warehouse stocks account for 319,916 thousand pounds of total butter inventory—the vast majority of commercially available supplies. This concentration amplifies both market vulnerability and opportunity for those positioned correctly.

The broader context makes this even more critical: with milk production declining 1.1% year-over-year and the dairy herd contracting, every allocation decision carries amplified consequences.

The Global Competition Reality

Here’s what should wake up every U.S. dairy producer: while we’re creating artificial butter shortages through poor allocation, international competitors are capturing premium global markets.

European dairy exporters report a growing middle-class appetite for premium dairy products across Asia and the Middle East. They’re developing high-fat, low-moisture butter and cultured butters in formats specifically designed for emerging market opportunities.

The U.S. is competing with Europe in Far East markets, but we’re handicapping ourselves with domestic allocation failures that create supply constraints exactly when global demand explodes.

The Bottom Line

U.S. butter inventories have reached their lowest April level in 110 years, exposing systematic allocation failures that smart producers must exploit before processors correct their mistakes. While cheese stocks show relative stability, the butter shortage represents modern dairy history’s most significant profit opportunity.

This isn’t about inventory management but recognizing when entire industries make systematic strategic errors. The processors who created this mess through poor allocation will eventually wake up, but not before early movers capture disproportionate value from their incompetence.

The math is brutal and beautiful: butter’s record scarcity has created premium pricing opportunities that could reshape dairy profitability models overnight. With global demand exploding and domestic supplies at 110-year lows, the question isn’t whether butter premiums will expand—it’s whether you’ll position yourself to capture them.

Stop following the herd toward mediocrity. In distorted markets, leadership comes from recognizing opportunities where others see only problems.

The data is clear. The opportunity is unprecedented. The choice is yours.

Learn More:

Join the Revolution!

Join over 30,000 successful dairy professionals who rely on Bullvine Weekly for their competitive edge. Delivered directly to your inbox each week, our exclusive industry insights help you make smarter decisions while saving precious hours every week. Never miss critical updates on milk production trends, breakthrough technologies, and profit-boosting strategies that top producers are already implementing. Subscribe now to transform your dairy operation’s efficiency and profitability—your future success is just one click away.

NewsSubscribe
First
Last
Consent

Alarming Disconnect: January 2025 Dairy Production Report Reveals Strategic Misalignments as Trade Tensions Loom

Powder inventories surged 41%, while processors accelerated production despite looming trade wars. The January dairy products report exposes alarming disconnects between market signals and manufacturing decisions, threatening processor and farm profitability as spring production increases.

EXECUTIVE SUMMARY: The January 2025 Dairy Products report reveals troubling production misalignments that demand immediate attention. NFDM production jumped 11% despite inventories already 41% above last year, while cheese and butter showed minimal growth despite increased milk supply. Italian cheese varieties (+2.2%) outperformed American types (+0.2%), suggesting shifting market preferences. Meanwhile, processors appear to redirect components toward consumer packaged goods like ice cream (+20.1%) and cream cottage cheese (+18.0%) while neglecting export-oriented products just as trade tensions escalate with Mexico. These patterns create significant price risks as spring flush approaches and raise questions about long-term strategic planning throughout the supply chain.

KEY TAKEAWAYS:

  • NFDM production surged 11% to 154 million pounds while inventories climbed to 299.3 million pounds, up 41% year-over-year, creating a dangerous market imbalance
  • Italian cheese varieties outperformed American types, with mozzarella production up 3.6% while cheddar continued its 15-month decline.
  • Butter production increased merely 0.5% despite high component availability, as processors shifted cream to ice cream (+20.1%) and cultured products.
  • Whey protein concentrate production fell 10.4% while whey protein isolate jumped 19.9%, indicating a strategic shift toward higher-value proteins.
  • Regional production patterns show Western processors focused heavily on NFDM (+15.2%) while Central region facilities led in cheese (+1.8%)
dairy production, NFDM inventory, cheese production, dairy exports, trade tensions, milk powder, dairy market analysis, dairy processing, mozzarella production, butterfat allocation, Mexico tariffs, spring flush

Steam billows from dryers running at full capacity across America’s heartland, transforming rivers of milk into mountains of powder that increasingly threaten to overwhelm warehouse capacity. The USDA’s January 2025 Dairy Products report, released yesterday, exposes troubling misalignments between processor decisions and market realities. Manufacturers appear to be doubling down on precisely the wrong products while ignoring clear warning signals from domestic and international markets.

Cheese Production Reveals Contradictory Strategies

January cheese production data unveils a strategic repositioning that demands closer scrutiny from processors and farmers. Total cheese output reached 1.21 billion pounds, inching up a modest 0.8% from January 2024 despite component-adjusted milk production increasing 2.2% nationally. This restrained growth suggests processors remain cautious amid looming capacity expansions and uncertain demand signals.

ProductJanuary 2025 (million lbs)Change from January 2024Change from Expected
Cheese (Total)1,210.2+0.8%Below forecast
American-Style473.9+0.2%Below forecast
Cheddar326.1-1.4%Below forecast
Italian Types521.7+2.2%Above forecast
Mozzarella412.7+3.6%Above forecast

The most revealing aspect of January’s cheese data is the stark divergence between cheese categories. While American cheese production barely increased, at 0.2% above January 2024 levels, Italian varieties grew substantially stronger, at 2.2%. Mozzarella’s impressive 3.6% increase led this to 412.7 million pounds. This marks mozzarella’s third-highest January production, reflecting processors’ strategic pivot toward export-friendly and foodservice-oriented varieties.

Particularly concerning for farmers focused on American cheese components is cheddar’s continued decline, dropping 1.4% to 326.1 million pounds—marking the fifteenth consecutive month of year-over-year declines. While this represents a moderating decrease compared to previous months, the persistent weakness in a traditionally anchored U.S. dairy processing category raises fundamental questions about shifting consumer preferences and processor responses.

The Butterfat Allocation Mystery

The January report exposes a perplexing contradiction in butterfat utilization that demands explanation. How can butter production grow only 0.5% to 218.3 million pounds when component-adjusted milk production increased by 2.2% and butterfat yields reached near-record levels? The answer lies in a dramatic reallocation of fat to alternative product streams that offer processors better margins—but may ultimately undermine farm-level butterfat premiums.

Processors appear to redirect cream toward frozen and cultured products rather than churning butter, with ice cream production soaring 20.1% to 59.6 million gallons—the highest January level since 2016. Regular hard ice cream led the surge, but other categories followed: low-fat ice cream jumped 10.2%, frozen yogurt increased 14.1%, and cream cottage cheese production jumped 18%.

This strategic pivot coincides with concerning inventory accumulation. According to the USDA’s Cold Storage Report, butter stocks climbed to 270.2 million pounds by January 31st, representing a troubling 26% increase from December and 9% growth year over year. This inventory build-up during what should be the seasonal low point for butter stocks signals potential market imbalances that could eventually transmit back to farm-level component values.

Powder Markets: A Crisis in Waiting

The most alarming element of January’s report is the dangerous inventory accumulation in dry milk products. Despite already bloated warehouses, nonfat dry milk (NFDM) production accelerated sharply by 11.0% to 153.5 million pounds, creating what industry analysts increasingly call “a powder volcano ready to erupt.”

NFDM Inventory MetricsJanuary 2024December 2024January 2025% Change (YoY)
End-of-Month Stocks (million lbs)212.3256.1299.3+41.0%
Monthly Production (million lbs)138.3130.7153.5+11.0%
Monthly Shipments (million lbs)123.0106.5106.5-13.4%
Production-to-Shipment Ratio1.121.231.44+28.6%

The 41% year-over-year inventory increase to 299.3 million pounds represents approximately 90 days of domestic consumption—far exceeding healthy balance levels. Even more troubling, NFDM shipments collapsed by 13.4% compared to January 2024, creating a perfect storm of overproduction and underconsumption.

“Processors appear to be ignoring flashing warning signs in the powder market,” warns industry economist Maria Rodriguez. “With flat or weakening demand from Mexico and reduced interest from other international buyers, these inventory levels create downward price pressure that will only intensify as we approach spring flush.”

This inventory mismanagement becomes more significant given imminent trade disruptions with Mexico, America’s largest dairy export destination. Adding to market pressures, the sharp decline in skim milk powder production (37.6% to 35.5 million pounds) indicates processors may be abandoning products specifically formulated for international markets just as trade tensions escalate—a concerning strategic pivot that could damage hard-won market relationships.

Whey Complex Shows Mixed Results

The whey sector presented contradictory signals in January that further highlight processor indecision. Total dry whey production decreased slightly by 1.9% to 76.2 million pounds compared to January 2024, despite increasing cheese production that would typically generate more whey. This suggests potential processing constraints or strategic decisions to limit whey production amid uncertain markets.

More notably, whey protein concentrate (WPC) production fell sharply by 10.4% to 38.2 million pounds, with the WPC 25.0-49.9% category plummeting 17.6%—reaching record low production levels for January. Despite this production decline, WPC stocks decreased marginally by 3.6%, suggesting weakening demand across domestic and international channels.

Conversely, whey protein isolate production increased substantially by 19.9% to 17.1 million pounds, suggesting manufacturers focus on higher-value protein products. Meanwhile, WPI stocks decreased 5.7%, indicating that demand for these specialized products remains relatively robust.

ProductRegional Change from January 2024
Atlantic
Cheese-1.6%
NFDM+4.1%
Dry Whey-2.9%

Strategic Implications for Dairy Farmers

The January production data demand strategic responses from dairy producers facing these market dynamics. The disconnect between component-adjusted milk production increases (2.2%) and finished product growth rates suggests processors struggle to balance milk utilization against fragmented market signals efficiently. This challenge ultimately transmits financial risk back to the farm level.

Farmers should consider several proactive measures:

  1. Review component optimization strategies, particularly evaluating the ROI on protein-enhancing feed additives, given the weakness in American cheese production and strength in Italian varieties.
  2. Contact processors directly to understand their production plans during the upcoming spring flush period and align herd management accordingly.
  3. Evaluate milk marketing contracts to determine flexibility for directing milk to processors with more diversified product portfolios that are less dependent on NFDM.
  4. Implement voluntary production moderation during peak spring months to avoid contributing to already excessive powder inventory build-up.

Farmers must recognize that the traditional price signals from CME markets may be increasingly disconnected from actual product movement and inventory positions. The January report demonstrates that even as cheese and butter prices show relative strength on paper, the underlying supply-demand fundamentals suggest potential pricing corrections once inventory realities fully manifest in market prices.

Conclusion: Market Reality Check Needed

As the dairy industry navigates these complex production and trade dynamics, the approaching spring flush threatens to exacerbate already significant challenges. The traditional seasonal increase in milk production could trigger substantial price corrections unless processors realign production plans with market realities rather than continuing to build inventory positions that defy economic logic.

For dairy farmers, these production trends underscore the urgent need for greater transparency and coordination across the supply chain. The divergence between component-adjusted milk production increases and finished product growth rates suggests a processing sector struggling to allocate milk components efficiently against fluctuating demand signals. This challenge ultimately transmits financial risk back to those producing the milk.

LEARN MORE:

Join the Revolution!

Join over 30,000 successful dairy professionals who rely on Bullvine Daily for their competitive edge. Delivered directly to your inbox each week, our exclusive industry insights help you make smarter decisions while saving precious hours every week. Never miss critical updates on milk production trends, breakthrough technologies, and profit-boosting strategies that top producers are already implementing. Subscribe now to transform your dairy operation’s efficiency and profitability—your future success is just one click away.

NewsSubscribe
First
Last
Consent

Is Your Dairy Farm on the Move? Discover the Benefits of South Dakota, Kansas, and Texas for Dairy Farmers

Are you considering relocating your dairy farm? Discover why South Dakota, Kansas, and Texas are top choices for dairy farmers seeking growth and sustainability.

Over the last decade, the U.S. dairy sector has significantly shifted from dairy farms to central and southern states such as South Dakota, Kansas, and Texas. These areas have become hotspots because of their distinct benefits, which include proximity to feed production, rich groundwater, investments in dairy processing, more favorable environmental laws, and cheaper labor costs. If you’re considering moving or improving your dairy farm, you should understand why many farmers migrate to these states. This information is valuable for future success and may give you the competitive advantage to make strategic choices for your dairy farm.

StateDairy Cattle Numbers (2018)Dairy Cattle Numbers (2023)% Change
California1,730,0001,600,000-7.5%
Wisconsin1,270,0001,250,000-1.6%
New York625,000600,000-4.0%
Pennsylvania525,000510,000-2.9%
Texas520,000620,00019.2%
Kansas160,000210,00031.3%
South Dakota125,000195,00056.0%

Strategic Benefits of South Dakota, Kansas, and Texas: A Magnet for Dairy Farm Migrations

The USDA reports that the dairy cow population in South Dakota has increased by 70.5% since 2019. This development is a tribute to the state’s efficient dairy operations, which are critical for dairy farms trying to increase output and cut expenses.

Similar trends are unfolding in Kansas and Texas, where significant investments in dairy processing plants have fueled the rise of the local dairy industry. These facilities offer rapid milk markets, which encourages dairy enterprises to expand. South Dakota’s dairy cow population has increased by 20% during the previous five years. Kansas has seen a 15% increase in milk output over the last decade. These developments, along with more favorable regulatory circumstances and cheaper labor costs, establish Kansas and Texas as top locations for dairy producers.

The migration of dairy cows from coastal areas, particularly California, emphasizes this tendency. California, long the apex of American dairy production, has seen a downturn owing to limited real estate, expensive licensing procedures, and natural resource limits such as water. In contrast, the central and southern states have sufficient groundwater and vast areas of inexpensive land, making dairy businesses more scalable.

The combined effect of these variables has pushed many dairy producers to investigate or begin relocation of their farms. As the dairy environment evolves, the move to these central and southern states looks rational and favorable for those seeking to preserve and develop their dairy companies.

StateAverage Feed Cost ($/ton)Labor Cost ($/hour)Water Availability (acre-feet)Dairy Processing FacilitiesEnvironmental Regulations Severity
South Dakota1501525,00010Moderate
Kansas1401430,00012Low
Texas13513.535,00015Low

The Economic Allure of South Dakota, Kansas, and Texas for Dairy Farmers

The economic temptation of shifting dairy businesses to South Dakota, Kansas, and Texas is undeniable, with significant cost savings. These states provide far cheaper production costs than dairy centers like California and Michigan. The low cost and availability of feed is a crucial influence. For example, South Dakota’s land prices are almost half those in coastal areas. Yet, feed costs in Texas dairy farms are nearly 25% cheaper. The Midwest and Southern areas provide rich territory and temperatures ideal for growing important feed crops like maize and alfalfa at a reduced cost. Consequently, farmers may acquire their feed locally, lowering shipping expenses and maintaining a steady, fresh supply.

Furthermore, labor expenses in South Dakota, Kansas, and Texas are crucial for increasing profit margins. These states have historically low minimum salaries and living costs, significantly reducing operating expenditures for dairy farms. For example, Kansas’ labor expenses are nearly 30% lower than the national average. Furthermore, these places have a larger workforce specialized in agricultural labor, contributing to cheaper salaries and the availability of experienced workers. This excellent combination of low labor costs and a plentiful supply of qualified personnel provides a favorable climate where dairy producers may maintain optimum staffing levels without incurring significant financial obligations in other states. As a result of the decreased operating expenses, South Dakota dairy farmers have a 5% larger profit margin.

Finally, the economic advantages make a strong argument for transferring dairy enterprises to these emerging dairy centers. By leveraging lower production costs, inexpensive feed, and cost-effective labor, dairy producers may achieve larger profit margins and more sustainable business models, putting them in a competitive position.

Geographical Advantages and Water Resources in Dairy Relocation: South Dakota, Kansas, and Texas

The geographical advantages of migrating to states like South Dakota, Kansas, and Texas go well beyond land availability; they also provide an astounding range of water resources. These states are endowed with ample groundwater, critical in the dairy business, where water use is high. Kansas has 10% more groundwater availability than the national average. Effective management of these water resources is critical, and local governments have made significant infrastructure expenditures, including reservoirs and irrigation systems, to ensure long-term use.

Furthermore, these areas have witnessed a significant investment in dairy processing facilities. This implies that proximity to processing factories decreases transportation costs and time, directly impacting the bottom line. This infrastructure improves dairy farming’s economic viability while ensuring environmental compliance by lowering carbon footprints.

Understanding the Regulatory Landscape: The Key to Leveraging Favorable Compliance Frameworks for Dairy RelocationUnderstanding the regulatory environment is critical for any dairy farm contemplating migration. South Dakota, Kansas, and Texas have more favorable regulatory environments than California or Michigan, where rigorous environmental rules may create substantial operating challenges. Policymakers in these middle-income countries realize the economic advantages of attracting dairy enterprises, which has resulted in more attractive compliance regimes for farmers.

South Dakota’s environmental rules are designed to be both rigorous and practical, finding a balance that protects the environment while increasing agricultural output. Farmers benefit from more straightforward permitting procedures and aggressive governmental assistance, which make compliance more attainable. Kansas and Texas have regulatory environments that balance environmental care with economic realities in dairy production. Notably, Texas dairy producers have 40 percent fewer ecological rules. Both states have made significant investments in technology and procedures that will assist farms in meeting environmental regulations at a reasonable cost. South Dakota has spent $100 million on dairy processing plants.

In contrast, states such as California have implemented more stringent regulations governing water consumption, air quality, and waste management. These often result in increased operating expenses and complex regulatory obligations. While these restrictions seek to address environmental problems, they may also drive dairy farmers to states that take a more balanced approach, such as South Dakota, Kansas, and Texas.

Thus, while contemplating relocation, it is critical to grasp the area’s regulatory intricacies. A favorable regulatory environment minimizes compliance requirements while contributing to dairy enterprises’ long-term viability and profitability. Deciphering these distinctions may help dairy farmers position themselves for success, allowing them to reap the advantages of shifting to states that promote agricultural expansion and environmental stewardship.

The Labor Market: A Key Driver in Dairy Farm Relocation Decisions 

Understanding labor market characteristics, particularly labor availability and cost, is critical when contemplating migrating to South Dakota, Kansas, or Texas. These locations have a more advantageous labor market for dairy production, making them more popular among farmers.

Availability of Labor: One significant benefit in these states is the comparatively big pool of available labor suitable for dairy farming operations. South Dakota, Kansas, and Texas are known for their firmly ingrained agricultural traditions, which ensures that the workforce understands the needs of dairy production and has the essential skills and expertise. This experience with agriculture results in a readily marketable work population in rural and semi-rural regions, frequently difficult to find in more urbanized and industrialized states.

Labor Costs: These central states have lower labor costs than coastal states like California or northeastern ones like Maine. This cost-effectiveness is due to a lower cost of living and distinct economic constraints compared to their coastal equivalents. Lower labor costs directly influence operational budgets, enabling dairy producers to manage resources better, boost margins, and reinvest in other aspects of their business to achieve development and sustainability.

The economic environment in these states encourages competitive pay structures that benefit both businesses and workers, resulting in a more stable and pleased workforce. This stability is critical given the labor-intensive nature of dairy farming, where human resource consistency and dependability may majorly impact productivity and overall farm performance.

The labor market circumstances in South Dakota, Kansas, and Texas, characterized by a robust supply of agriculture-savvy people and reduced labor costs, present solid incentives for dairy producers contemplating relocating. These advantages, strategic location benefits, economic incentives, and favorable regulatory environments make it a compelling argument to relocate your dairy farm to the nation’s center.

Infrastructure Investment: Empowering Dairy Farmers with Advanced Processing Facilities

Strategic investment in dairy processing infrastructure is one crucial element driving dairy farm migrations to South Dakota, Kansas, and Texas. These nations have aggressively upgraded their processing facilities to meet the growing needs of their dynamic dairy industries. Significant investments totaling $100 million in South Dakota have resulted in the construction of modern processing facilities with cutting-edge technology. This improves milk processing efficiency and increases value across the supply chain by providing dairy farmers access to high-capacity facilities in their immediate neighborhood.

Strategic public-private collaborations have helped Kansas improve its dairy processing infrastructure. Government incentives and subsidies have encouraged large-scale dairy processors to establish operations in the state. This tendency has resulted in an interconnected ecosystem where dairy producers may minimize transportation costs and achieve faster turnaround times from farm to table. Furthermore, these facilities have fueled local economic development by producing employment and cultivating a supportive community for the dairy industry.

With its enormous terrain and business-friendly atmosphere, Texas has attracted significant investment from local and foreign dairy industry companies. These factories specialize in high-demand industries like specialty cheeses and organic dairy products, with the capacity to handle enormous quantities. Integrating innovative logistics and supply chain management systems emphasizes the benefits of coming to Texas, making it a desirable location for forward-thinking dairy producers.

The combined efforts of these states to improve their dairy processing facilities provide a strong argument for dairy producers wishing to migrate. South Dakota, Kansas, and Texas are ideal areas for dairy farm businesses to prosper and develop in the future due to their modern facilities and supportive regulatory and economic environments.

Climate and Environmental Considerations: A Crucial Factor in Dairy Farm Relocation 

Climate and environmental concerns are increasingly essential for relocation choices in the changing dairy farming landscape. Farmers understand how a region’s geographical and climatic characteristics may substantially influence the health and production of their dairy herds. As severe weather patterns become more common due to climate change, states such as South Dakota, Kansas, and Texas have received attention for their relatively stable weather conditions. While these states are not immune to weather changes, their climatic stability provides a more predictable environment for dairy production.

Furthermore, the environmental advantages linked to these places go beyond climatic stability. South Dakota, Kansas, and Texas soils are ideal for producing vital feed crops like maize and alfalfa. This decreased dependence on imported feed cuts expenses and the carbon footprint associated with transportation. Dairy producers may successfully use local resources to promote a more sustainable and environmentally friendly agricultural strategy by locating their operations in these regions.

The geographical availability of copious groundwater adds to these environmental benefits. Access to dependable and clean water sources is crucial for dairy farm operations, from herd health to adequate irrigation of feed crops. South Dakota’s well-managed aquifers, Kansas’ controlled groundwater consumption, and Texas’ innovative water conservation policies all contribute to a strong foundation for water resource management. These characteristics make these states especially appealing to farmers trying to reduce the risks associated with water scarcity.

These states’ progressive environmental rules contribute to the advantages by balancing agricultural output and ecological protection. For example, Kansas’s extensive nutrient management programs and Texas’ focus on novel waste management methods demonstrate a dedication to decreasing dairy farming’s environmental effects while increasing operating efficiency.

Climatic and environmental factors influence dairy producers’ migration to South Dakota, Kansas, and Texas. The benefits of climatic stability, rich soils, ample groundwater, and balanced environmental restrictions combine to provide a sustainable and productive dairy farming setting.

The Bottom Line

As the dairy business undergoes constant changes, a smart move to states such as South Dakota, Kansas, and Texas appears as an appealing choice for sustainability and development. These locations provide several advantages to dairy producers, including positive economic incentives, abundant geographical resources, sound regulatory systems, and robust labor markets. Improved infrastructural investments and suitable climatic conditions increase their appeal. Dairy producers may capitalize on these multiple benefits by migrating, assuring long-term sustainability and competitiveness in a changing market context.

Summary:

A significant trend is reshaping the landscape of the U.S. dairy industry, and many farmers are relocating their operations to states like South Dakota, Kansas, and Texas. This movement is driven by various factors, including more favorable environmental regulations, access to abundant groundwater, investments in dairy processing facilities, and lower labor costs. Over the past decade, strategic location benefits such as proximity to feed production, rich groundwater, lower production costs, and feed availability have made these states particularly attractive. Additionally, these regions offer ideal conditions for growing important feed crops like maize and alfalfa, reducing shipping expenses. Labor costs in these states are significantly lower, with Kansas’ labor expenses nearly 30% lower than the national average, which enhances profit margins. With historically low minimum wages, living costs, and a skilled agricultural workforce, these states provide a conducive environment for dairy farming, promising to define the next era of American dairy farming.

Key Takeaways:

  • Farmers are increasingly relocating to South Dakota, Kansas, and Texas due to advantageous environmental regulations and resources.
  • Abundant groundwater and strategic investments in dairy processing facilities enhance these states’ appeal for dairy operations.
  • Lower labor costs significantly improve profit margins in these states, with Kansas’ labor expenses nearly 30% below the national average.
  • Proximity to feed production and ideal conditions for growing feed crops like maize and alfalfa reduce shipping expenses and bolster efficiency.
  • Historically low minimum wages and living costs, coupled with a skilled agricultural workforce, provide a supportive environment for dairy farming.
  • These states’ comprehensive advantages position them as pivotal locations for the future of American dairy farming.

Learn more: 

How Once-a-Day Milking Impacts Quality, New Study Reveals: Boosting Milk Proteins

Uncover the effects of once-a-day milking on milk protein quality. Could this approach boost your dairy production? Dive into the breakthrough study’s latest revelations.

Understanding the intricacies of dairy farming can profoundly affect milk quality, with milking frequency emerging as a crucial factor. A recent study by Riddet Institute PhD student Marit van der Heijden, published in the journal Dairy, illustrates how milking frequency can alter the protein composition in milk, potentially transforming dairy practices. 

“Milk from a once-a-day (OAD) milking system contained higher proportions of αs2-casein and κ-casein and lower proportions of α-lactalbumin,” said Van der Zeijden.

This study compares the effects of OAD and twice-a-day (TAD) milking over an entire season, revealing significant changes in protein proportions that could affect milk processing and quality.

This research underscores the impact of milking frequency on milk protein composition. By comparing once-a-day (OAD) and twice-a-day (TAD) milking, the study reveals how these practices affect specific milk proteins. Conducted by the Riddet Institute, the study analyzed protein composition over the entire milking season, providing insights that previous short-term studies should have included. These findings highlight the relationship between milking practices and milk quality, with potential implications for dairy management and processing.

Protein Composition Shifts with Milking Frequency: Implications for Milk Quality and Processing

ParameterOAD MilkingTAD Milking
αs2-caseinHigher ProportionsLower Proportions
κ-caseinHigher ProportionsLower Proportions
α-lactalbuminLower ProportionsHigher Proportions
Average Milk Solids ProductionDecreased by 13%Variable
Milk YieldReducedHigher

The study uncovered noteworthy disparities in protein proportions contingent on the milking regimen employed. Specifically, milk derived from an OAD milking system exhibited elevated levels of α s2 casein and κ-casein, juxtaposed with a decrease in the proportion of α-lactalbumin. These findings underscore the impact that milking frequency can have on milk’s nutritional and functional properties, potentially influencing its processing characteristics and overall quality.

Van der Zeijden’s Findings: A New Paradigm for Dairy Processing and Quality Management

Van der Zeijden’s findings reveal significant effects on milk processing and quality due to changes in protein composition from different milking frequencies. OAD milking increases α s2 casein and κ-casein levels while reducing α-lactalbumin. These proteins are crucial for milk’s gelation and heating properties. 

Higher κ-casein in OAD milk can enhance gel strength and stability, which is beneficial for cheese production. κ-casein is key in forming casein micelle structures, improving cheese texture and firmness. 

Lower α-lactalbumin levels in OAD milk may impact milk’s heat stability. α-lactalbumin affects whey proteins, which are heat-sensitive and play a role in denaturation during pasteurization or UHT processing. Less α-lactalbumin might result in smoother consistency in heat-treated dairy products

The protein composition differences from milking frequency require adjustments in dairy processing techniques to optimize product quality. Dairy processors must tailor their methods to harness these altered protein profiles effectively.

Methodical Precision: Ensuring Robust and Comprehensive Findings in Van der Zeijden’s Research

The methodology of Van der Zeijden’s study was meticulously crafted to ensure reliable and comprehensive findings. Two cohorts of cows at Massey University research farms in Palmerston North followed different milking regimes—OAD and TAD. Both farms used pasture-based feeding, with TAD cows receiving more dry matter supplementation. 

Eighteen cows, evenly split between the two systems, were selected for homogeneity. Each group consisted of three Holstein-Friesians, three Holstein-Friessian x Jersey crosses, and three Jerseys, allowing for a direct comparison of milking frequency effects on protein composition. 

Over nine strategic intervals across the milking season, Van der Zeijden collected milk samples, capturing data at the season’s start, middle, and end. Samples were also categorized by early, mid, and late lactation stages, ensuring a thorough understanding of how milking frequency impacts protein content throughout the lactation period.

Dynamic Interplay: Seasonal Timing, Lactation Stages, and Cow Breeds Shape Protein Composition in Bovine Milk

FactorDescriptionImpact on Protein Composition
Milking FrequencyOnce-a-day (OAD) vs. Twice-a-day (TAD) milkingOAD increases proportions of α s2 casein and κ-casein, decreases α-lactalbumin
Seasonal TimingDifferent periods within the milking seasonVaries protein proportions due to changes in diet, environmental conditions
Lactation StagePeriods of early, mid, and late lactationProtein and fat content increase as milk yields decrease
Cow BreedHolstein-Friesian, Jersey, and crossbreedsJersey cows have higher protein and milk fat content, larger casein-to-whey ratio
Feeding SystemPasture-based vs. supplementary feedingImpacts overall milk yield and protein profiles

Several factors impact protein composition in bovine milk, directly influencing milk quality and processing. Seasonal timing is critical; protein levels can shift throughout the milking season due to changes in pasture quality and cow physiology. The lactation stage also plays a vital role. Early in lactation, milk generally has higher protein and fat levels, decreasing until mid-lactation and possibly rising again as the drying-off period nears. This cyclical variation from calving to preparation for the next cycle affects milk yield and composition. 

By considering seasonal timing, lactation stages, and cow breeds, dairy producers can adapt management practices to enhance protein levels in milk. This alignment with consumer demands boosts product quality. It informs breeding, feeding, and milking strategies to maximize milk’s nutritional and functional benefits.

Breed-Specific Insights: Jersey Cows Stand Out in Protein-Rich Milk Production

Van der Zeijden’s study provides detailed insights into how different breeds vary in milk protein composition, with a focus on Jersey cows. Jersey cows produce milk with higher protein and milk fat content compared to other breeds and a higher casein-to-whey ratio. This makes Jersey milk better for certain dairy products like cheese and yogurt, where more casein is helpful. These findings highlight how choosing the right breed can improve the quality and processing of dairy products.

Embracing Change: The Increasing Popularity of Once-a-Day Milking Among New Zealand Dairy Farmers

The appeal of once-a-day (OAD) milking is growing among New Zealand dairy farmers, driven by its lifestyle benefits. While most farms stick with twice-a-day (TAD) milking, more are shifting to OAD for better work-life balance. OAD milking reduces time in the cowshed, allowing more focus on other farm tasks and personal life. It also improves herd health management by providing more efficient handling routines. However, it comes with challenges like managing higher somatic cell counts and adjusting milk processing to different compositions. The move to OAD reflects a balance between efficiency and personal well-being without compromising milk quality.

The Bottom Line

Milking frequency significantly influences the protein composition of milk, impacting its quality and processing. Marit van der Zeijden’s study highlights vital differences; OAD milking leads to higher levels of certain caseins and lower α-lactalbumin, altering milk’s gelation and heating properties. These findings urge dairy producers to adapt practices based on protein needs. 

The research also reveals that breed and lactation stages interact with milking frequency to affect protein content. Jersey cows show higher protein and fat ratios. As OAD milking is popular in New Zealand, these insights can guide better farm management decisions, optimizing economics and product quality. Strategic adjustments in milking practices could enhance profitability and productivity, advancing dairy processing and quality management.

Key Takeaways:

  • Once-a-day milking (OAD) impacts milk protein composition, increasing α s2-casein and κ-casein while decreasing α-lactalbumin.
  • Variation in protein composition influences milk’s gelation and heating properties, affecting cheese production and heat-treated dairy products.
  • This study is unique as it evaluates protein changes over a complete milking season rather than relying on single samples.
  • Breed-specific differences, particularly in Jersey cows, highlight the importance of genetic factors in milk protein content.
  • OAD milking systems are gaining popularity due to lifestyle benefits, despite lower overall milk production compared to twice-a-day (TAD) systems.
  • Further research is needed to explore the environmental impact, specifically greenhouse gas emissions, associated with OAD milking systems.

Summary: Milk quality in dairy farming is significantly influenced by milking frequency, with a study published in the journal Dairy revealing that once-a-day (OAD) milking systems contain higher proportions of αs2-casein and κ-casein, while lower proportions of α-lactalbumin. This highlights the relationship between milking practices and milk quality, with potential implications for dairy management and processing. OAD milking increases α s2 casein and κ-casein levels while reducing α-lactalbumin, which are crucial for milk’s gelation and heating properties. Higher κ-casein in OAD milk can enhance gel strength and stability, beneficial for cheese production. Lower α-lactalbumin levels may impact milk’s heat stability, affecting whey proteins, which are heat-sensitive and play a role in denaturation during pasteurization or UHT processing. Less α-lactalbumin may result in smoother consistency in heat-treated dairy products.

Send this to a friend