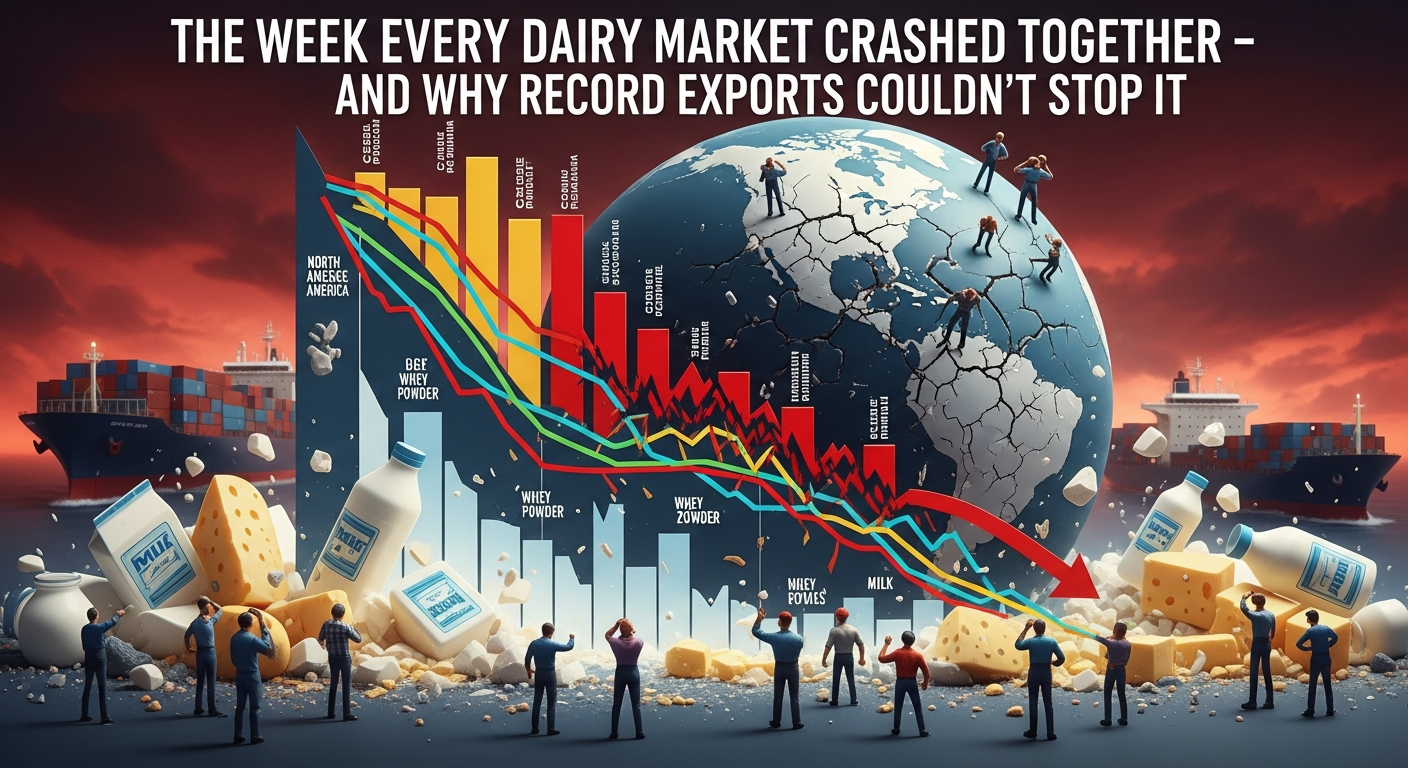
Dec 15: Germany’s butter -9.3%. Chicago cheese at 18-month low. NZ powder is falling. Every dairy market crashed the same week—despite record exports. What broke, and what’s next for your operation
Executive Summary: Record dairy exports should lift prices—instead, every global market crashed simultaneously the week ending December 15, 2025, revealing that fundamental pricing mechanisms have broken. U.S. cheese shipments hit all-time highs while CME prices fell to 18-month lows; European butter dropped 5.8%; powder weakened globally. The paradox persists because cheap feed costs ($4.40 corn) enable production growth despite distressed milk prices—the normal supply response isn’t working. Worse, processors worldwide are simultaneously shifting from butter into cheese, creating concentrated inventory that will mature in Q2 2026 precisely when the spring flush arrives—a collision that could severely pressure spot milk prices. This signals a structural reset, not a cyclical downturn: operations must rebuild for sustained viability at $15-16 milk through cost efficiency, component optimization, balance sheet strength, and strategic feed hedging. The industry emerging from this transition will operate under fundamentally different economics than those of the past decade.
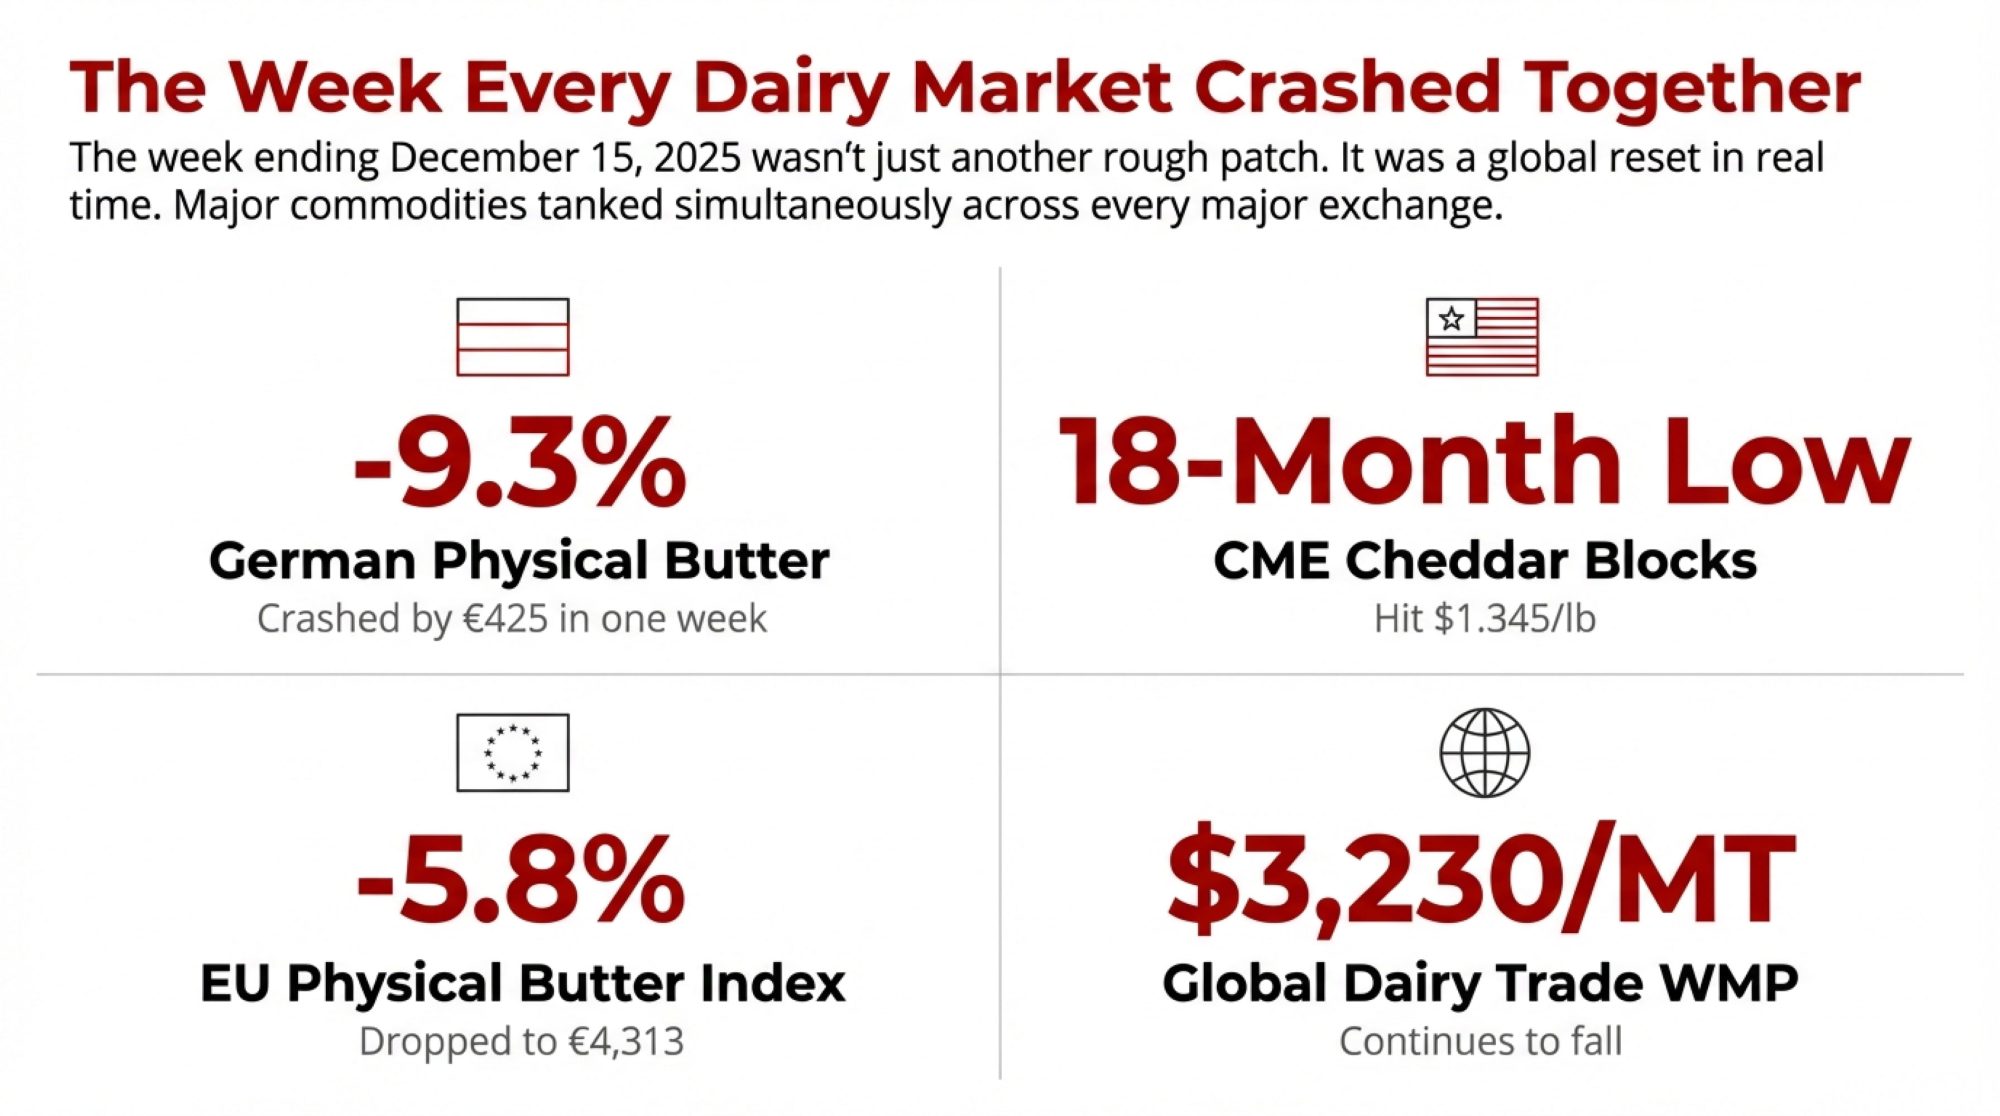
You probably felt it in your milk check before you saw it in the data. But here’s what actually happened the week ending December 15, 2025: butter futures crashed 3.6% in Leipzig to €4,314. EU physical butter dropped 5.8% to €4,313. Whole Milk Powder on the Global Dairy Trade fell to $3,230 per metric tonne. And CME Cheddar blocks hit $1.345 per pound—the lowest since July 2023. When every major commodity tanks simultaneously across every major exchange, we’re not looking at another rough patch. We’re watching the global dairy industry reset itself in real time.
| Market/Product | Price (Week of Dec 15) | Weekly Change | Significance |
|---|---|---|---|
| German Butter | €4,150/tonne | -€425 (-9.3%) | Steepest weekly crash |
| EU Physical Butter (avg) | €4,313/tonne | -€251 (-5.8%) | 18-month low |
| CME Cheddar Blocks | $1.345/lb | -4.1% | Lowest since July 2023 |
| Global Dairy Trade WMP | $3,230/tonne | -3.8% | Sustained weakness |
| Dutch Butter | €4,070/tonne | -€250 (-5.8%) | Export benchmark falls |
| EEX Butter Futures (Leipzig) | €4,314/tonne | -3.6% | Futures signal no recovery |
| EU Young Gouda | €2,961/tonne | -34.3% YoY | Near five-year lows |
| EU Mild Cheddar | €3,248/tonne | Just €4 above 5-yr low | Testing historical floor |
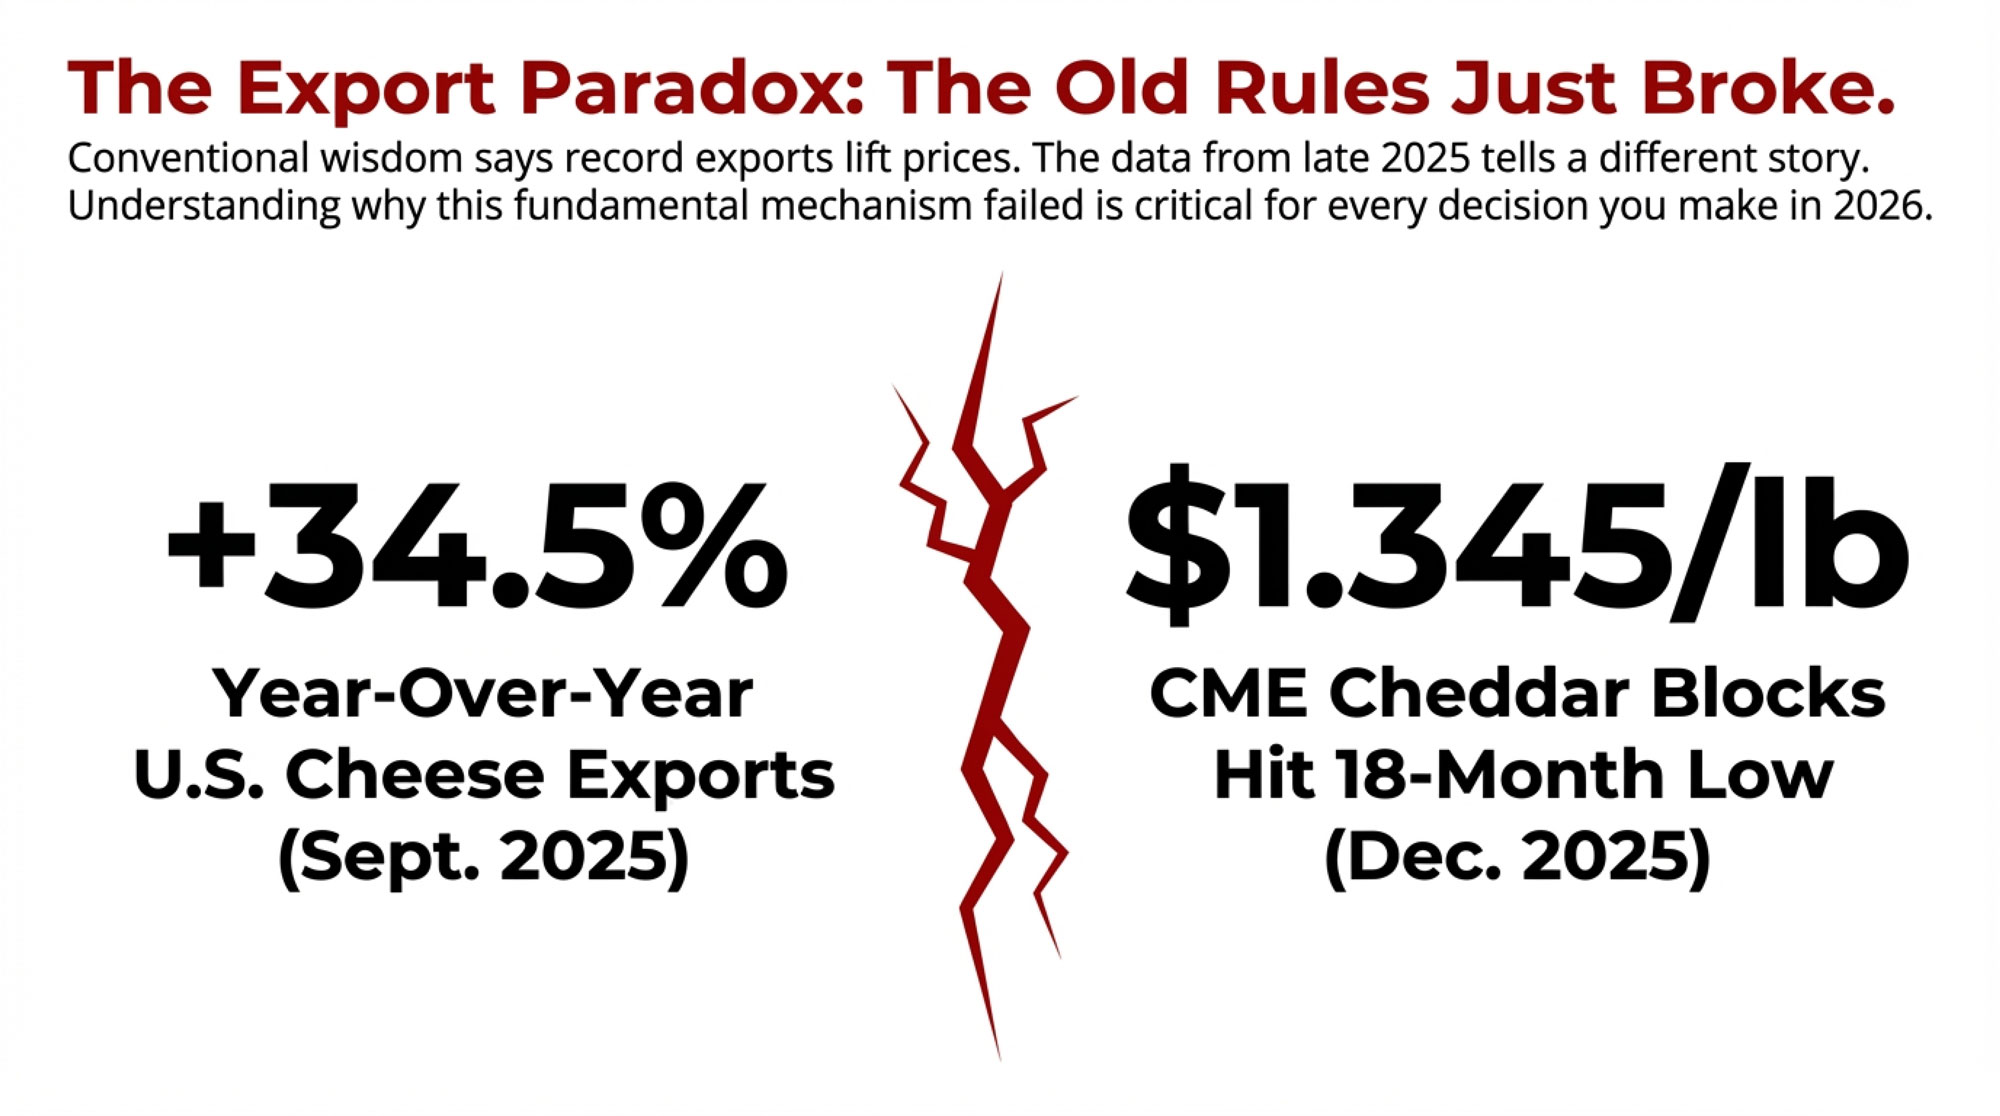
Here’s the part that should really get your attention: U.S. cheese exports hit 116.5 million pounds in September—up 34.5% from the previous year and representing the highest daily average on record, according to the U.S. Dairy Export Council. Record exports should be lifting prices, not coinciding with an 18-month low. That mechanism just broke, and understanding why matters for every decision you’re making about 2026.

| Month | U.S. Cheese Exports (Million lbs) – Left Axis | CME Cheddar Blocks ($/lb) – Right Axis |
|---|---|---|
| Mar 2025 | 95.2 | $1.62 |
| Apr 2025 | 98.7 | $1.58 |
| May 2025 | 102.3 | $1.54 |
| Jun 2025 | 107.8 | $1.49 |
| Jul 2025 | 110.5 | $1.46 |
| Aug 2025 | 113.2 | $1.41 |
| Sep 2025 | 116.5 | $1.38 |
| Dec 2025 | 118.8 (est) | $1.345 |
A Brief Look Back: Context for What We’re Seeing
Before diving into current dynamics, it’s worth understanding that synchronized global dairy price collapses of this magnitude are relatively rare. The last time we saw coordinated weakness across multiple regions and products simultaneously was during the 2014-2016 period, when a combination of Russian import bans, a slowdown in Chinese demand, and the removal of European quotas created a global surplus that took nearly two years to work through. That episode saw U.S. Class III milk drop from over $24/cwt in 2014 to under $14 in 2016.
What eventually resolved that situation was a combination of weather-driven production disruptions (the 2016 New Zealand drought), gradual demand recovery in Asia, and ultimately, many smaller farms exiting the industry entirely. The recovery wasn’t quick, and the industry that emerged on the other side looked structurally different—more consolidated, more efficient, and arguably more vulnerable to the kind of dynamics we’re seeing today.
When the Safety Valves Stop Working
For as long as most of us have been in this industry, global dairy markets have operated with a kind of built-in equilibrium. When prices drop in one region, traders buy there and sell elsewhere, which lifts the cheap market and cools the expensive one. If a U.S. product is discounted, exports surge until domestic prices align with international benchmarks. It’s the arbitrage mechanism that keeps regional markets from getting too far out of whack.
What’s striking about mid-December is how that mechanism appears to have stopped functioning.
Looking at the data from European exchanges, German physical butter crashed by €425 in a single week—that’s a 9.3% drop—settling at €4,150. The weekly EU dairy quotations showed Dutch butter at €4,070, down €250. Yet French butter actually firmed €200 to €4,720. So you’ve got a €650 per tonne spread between French and Dutch butter, which shouldn’t persist in an integrated market.
At the same time, the Singapore Exchange was seeing pressure across its dairy complex despite solid trading volumes of 18,915 tonnes for the week. And back in the States, CME Cheddar blocks are sitting at $1.345 per pound—the lowest we’ve seen since summer 2023.
When these markets all move down together like this, it tells you the buyers are either already full or they’re waiting for even lower prices. That’s a fundamentally different dynamic than we’re used to seeing. What we’re watching is the global dairy complex running out of capacity to absorb current production levels at anything close to recent historical prices.

Why Production Keeps Growing Despite Terrible Prices
In a typical cycle, you’d expect falling prices to trigger pretty predictable responses. Farmers cull marginal cows, dial back feed inputs where it makes sense, and overall production gradually contracts. That supply reduction creates scarcity, and prices eventually recover. It’s the classic pattern the industry has relied on for generations.
That’s not what’s happening, and here’s why it matters.
The USDA’s December World Agricultural Supply and Demand Estimates held 2025 U.S. milk production steady at 115.70 million tonnes—still up 2.4% from 2024. They lowered the 2026 projection slightly, from 117.15 to 117.05 million tonnes, citing reduced dairy cow inventory offsetting per-cow production gains. But even with that downward revision, we’re still looking at 1.2% growth in 2026.
Think about that for a minute. Even with prices at distressed levels across multiple product categories, American milk production is forecast to keep expanding.
And if you want to understand why, take a look at what’s happening in feed markets. The December USDA grain outlook shows March 2026 corn futures trading around $4.405 per bushel, with projected ending stocks of 2.03 billion bushels. That’s the highest level in seven years and 32% greater than last season. The agency actually raised its corn export forecast to 3.2 billion bushels—that’s up 12% from last year’s record—yet domestic supplies remain massive. Soybean meal closed the week at $302 per ton, down $5.40.
What this creates is production that stays high because historically cheap feed costs insulate producers from the full pain of low milk checks. When you run the income-over-feed-cost calculations—and I know most of you do this weekly if not daily—many operations can still pencil out positive margins even with Class III in the mid-$15s. That math keeps marginal cows in the herd even when finished product prices are screaming oversupply.
I was looking at numbers from a 500-cow Wisconsin operation recently that illustrates this perfectly. With corn at $4.40, their feed costs are down 18% from last year. That keeps their IOFC positive at $16.50 milk, even though that’s $3 below what they budgeted for 2025. So the economic signal telling them to cut back gets overwhelmed by the reality that they’re still cash-flow positive on a monthly basis.

| Period | Feed Cost | Other Costs | Milk Price | IOFC Margin |
|---|---|---|---|---|
| Q4 2023 | $10.20 | $7.50 | $19.80 | $9.60 |
| Q1 2024 | $9.80 | $7.60 | $18.50 | $8.70 |
| Q2 2024 | $9.20 | $7.70 | $17.90 | $8.70 |
| Q3 2024 | $8.90 | $7.80 | $17.20 | $8.30 |
| Q4 2024 | $8.40 | $7.90 | $16.80 | $8.40 |
| Q1 2025 | $7.80 | $8.00 | $16.20 | $8.40 |
| Q4 2025 | $7.20 | $8.10 | $15.90 | $8.70 |
Here’s something else worth noting: the USDA report mentions explicitly that winter weather isn’t the constraint it used to be, particularly in the Midwest. Modern housing systems mean operations in Wisconsin, Michigan, and Minnesota can maintain high production levels regardless of what’s happening outside. Better ventilation, more sophisticated environmental controls—which is great for consistency and animal welfare, but it also makes production less responsive to price signals.
The Export Picture Gets Complicated
Here’s where things get really interesting, and why the volume numbers deserve a closer look.
September numbers from the U.S. Dairy Export Council showed cheese exports up 34.5% year-over-year to 116.5 million pounds—the highest daily average shipments on record. Butter exports were 2.7 times larger than the previous year. Whey powder exports hit their highest level since March 2023, up 8.3%.
You’d think those export numbers would support domestic prices. When foreign buyers aggressively purchase U.S. products, that should create competition for available inventory. But that’s not what we’re seeing. Strong export volumes are coinciding with some of the weakest domestic prices in years.
What this tells you is that the industry is exporting what it has to produce to keep processing plants running at capacity. These modern cheese plants have massive fixed costs and debt service obligations. You can’t afford to run at 70% capacity—your cost per unit skyrockets. So you run full-throttle and discount product to move volume into export channels.
And here’s where the story gets more nuanced. While cheese exports are at record levels, nonfat dry milk exports collapsed 18.5% year over year in September, hitting an eight-month low. Even sales to Mexico—and Mexico has been one of our most reliable powder markets—dropped 17.3%. When you can’t move powder to Mexico, that tells you demand is genuinely soft across categories.
The cheese export story breaks down in interesting ways by region. Mexico remains the dominant market, which makes sense given proximity and trade relationships. But what’s notable is that Australia has become the third-largest destination for U.S. cheese. USDEC data shows Australia has already imported more U.S. cheese in 2025 than in any previous year on record, and we’ve still got three months of shipments to count.
This matters because it represents a shift in the Australian dairy sector. Chronic drought conditions and herd contraction have pushed Australia from being a dairy-surplus nation to one that’s increasingly dependent on imports. U.S. cheese is essentially backfilling the gap left by shrinking Australian milk production.
The challenge with this dynamic is sustainability. Mexico is buying finished U.S. cheese because, at current prices, it’s cheaper than importing powder and manufacturing cheese themselves. Australia is buying because they don’t have enough domestic milk. Neither situation represents organic demand growth driven by expanding consumption—they’re opportunistic purchases driven by price dislocations and supply shortfalls elsewhere.
When those conditions change—and at some point they will—it raises legitimate questions about where all that U.S. cheese production capacity is directed.
Europe’s Markets Fragment Under Pressure
The European physical spot markets during the week of December 10 showed how extreme stress can break down normally efficient trading systems, and it’s worth understanding these dynamics because they affect global price relationships.
The weekly EU dairy quotations showed the aggregate butter index down 5.8% to €4,313. But that overall number hides some significant regional variations. German butter crashed €425 per tonne in a single week—that 9.3% decline—settling at €4,150. Dutch butter, which tends to serve as a key pricing benchmark for export markets, fell €250 to €4,070. Yet French butter actually firmed €200 to €4,720.
So you’ve got a €650 per tonne spread between French and Dutch butter. That’s roughly a 16% price difference for essentially the same commodity in neighboring countries with no trade barriers. Under normal circumstances, traders would move product to capture that arbitrage opportunity, and the spread would compress.
The persistence of this spread likely reflects panic selling in the German and Dutch markets—processors liquidating inventory to generate cash flow—while France’s unique regulatory structure (particularly the Loi EGalim laws that protect farmer margins) and strong domestic preference for high-quality branded butter with protected designations create price support that can’t be easily arbitraged away.
Meanwhile, the European cheese complex is testing historical support levels. The EEX European Weekly Cheese Index shows Mild Cheddar trading at €3,248—just €4 above its five-year low. Cheddar Curd sits at €3,221, €27 above its five-year floor. Young Gouda has fallen to €2,961, down 34.3% year-over-year.
When you’ve got multiple cheese varieties simultaneously trading within pennies of multi-year lows during what should be a seasonally firm period—pre-holiday demand, typically lower winter milk production—it signals fundamental oversupply rather than temporary weakness. The market is grinding against production costs, and may already be below them for higher-cost operators.
The Strategic Pivot Creating Future Pressure
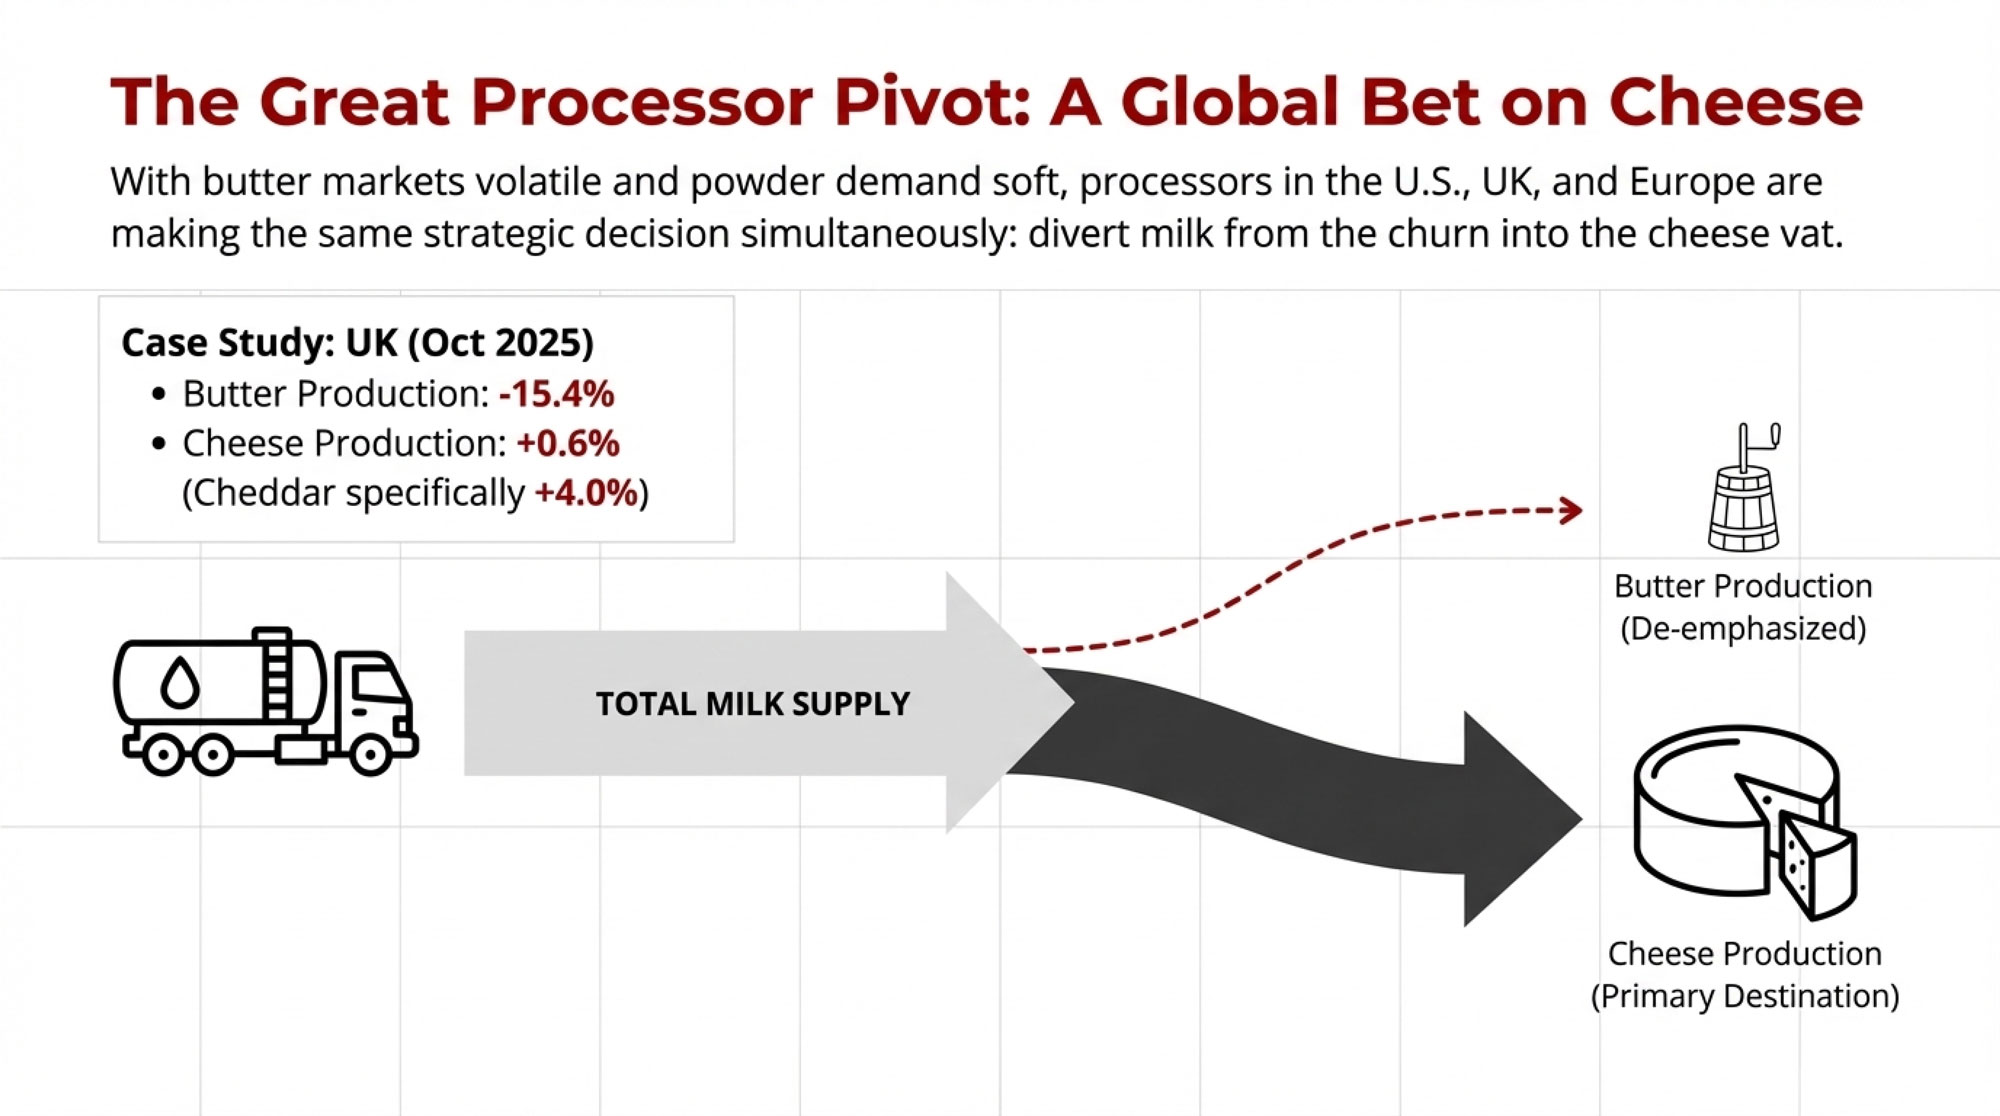
One pattern emerging from the data that has real implications for 2026 is a simultaneous shift by processors across multiple countries away from butter production and toward cheese.
UK production statistics from DEFRA for October 2025 tell the story: butter production down 15.4% year-over-year while cheese production increased 0.6%, with Cheddar specifically up 4.0%. You’re seeing similar dynamics in U.S. processing facilities—milk diverted from volatile butter markets into cheese vats.
The logic makes sense on paper. Butter is highly price-sensitive and difficult to store long-term without incurring significant cold-storage costs. Cheese, particularly aged varieties like Cheddar, can sit in inventory for 6 to 12 months as it matures. From a processor’s perspective, cheese acts as a kind of financial buffer—you can convert today’s surplus milk into a solid commodity and hope that by the time it’s ready for market, prices will have improved.
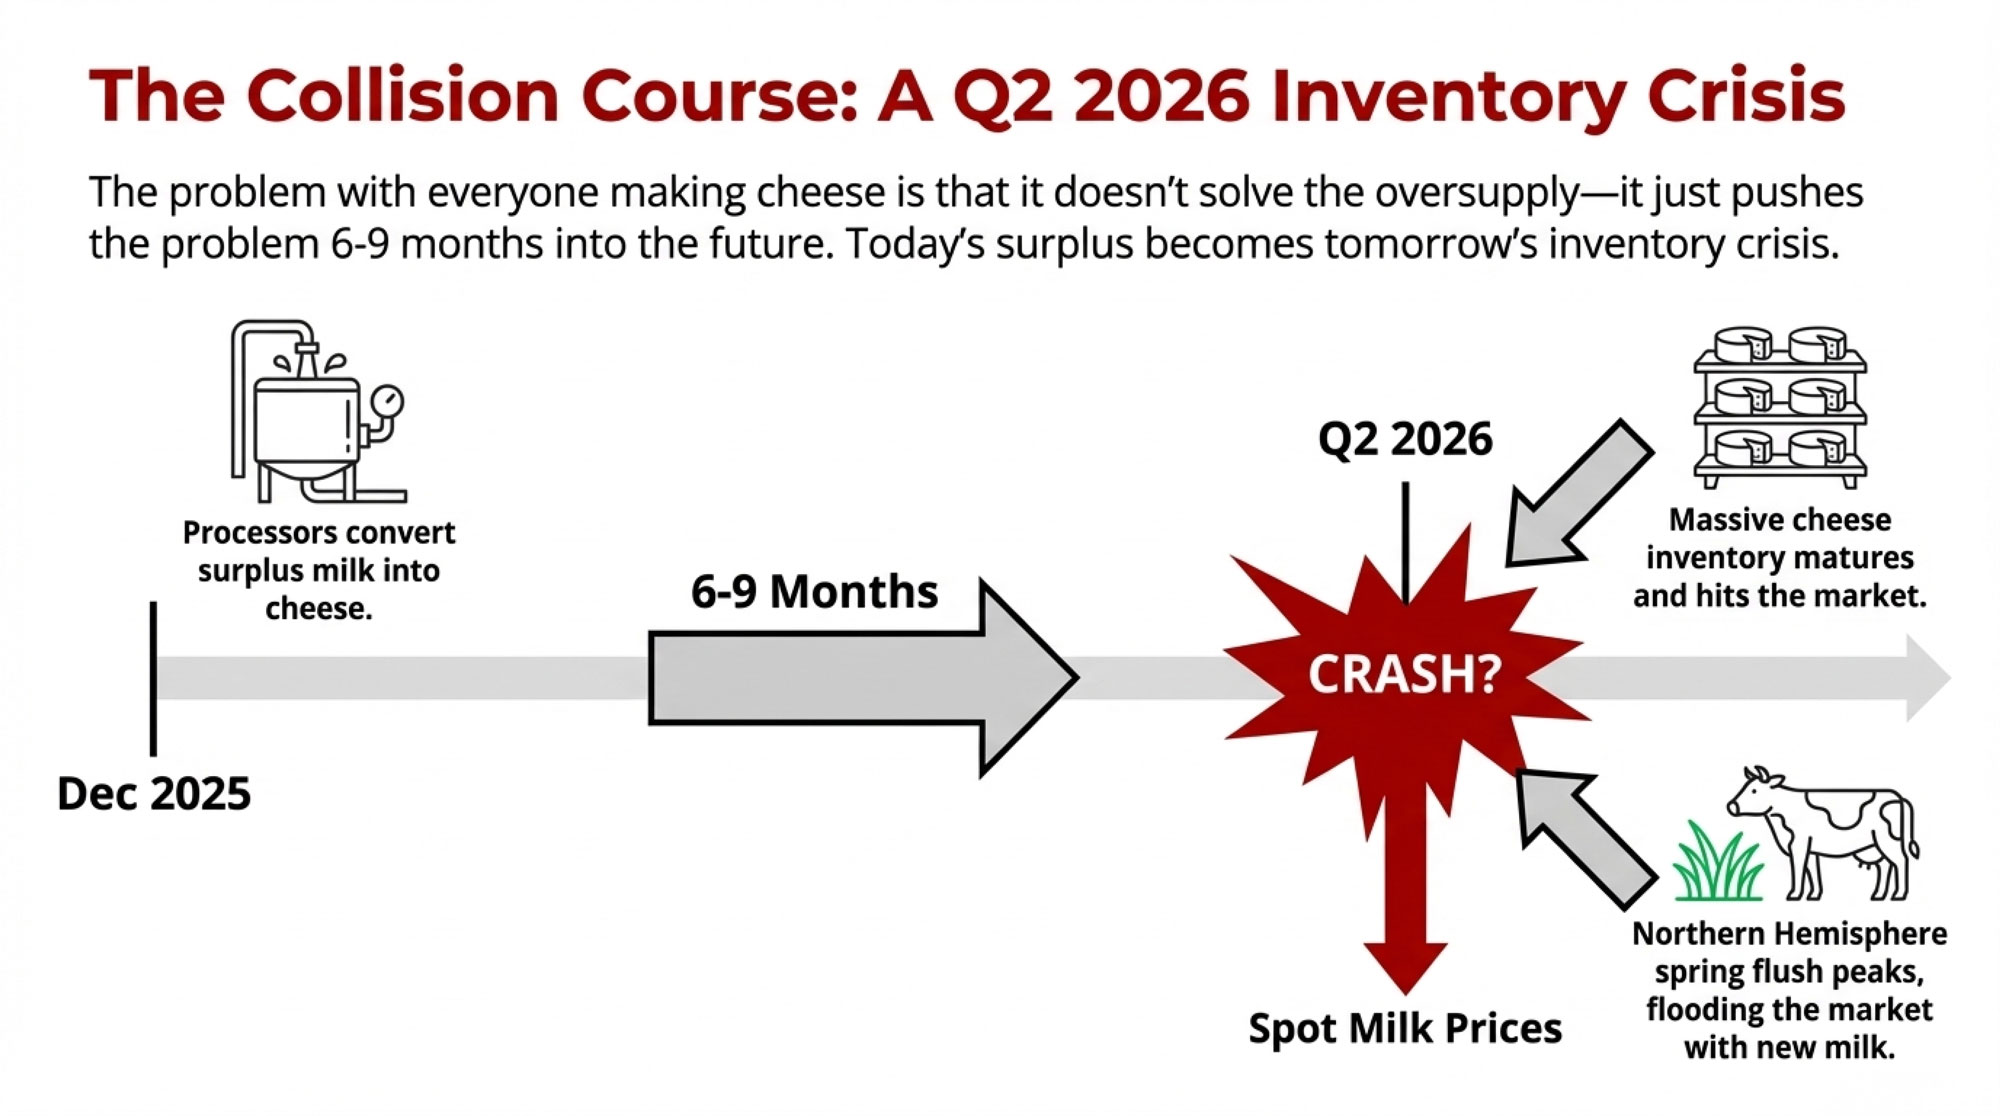
The complication is that when processors in the U.S., UK, and EU all make the same decision simultaneously, they shift oversupply in time and concentrate it into a single product category.
All that cheese being produced right now in December 2025 will mature and need to move to market in mid-2026—right around the time the Northern Hemisphere spring flush begins, bringing another seasonal surge in milk production. If export warehouses in key markets like Mexico and Australia are already well-stocked from late 2025’s record shipments, buyer demand could slow just as supply peaks.
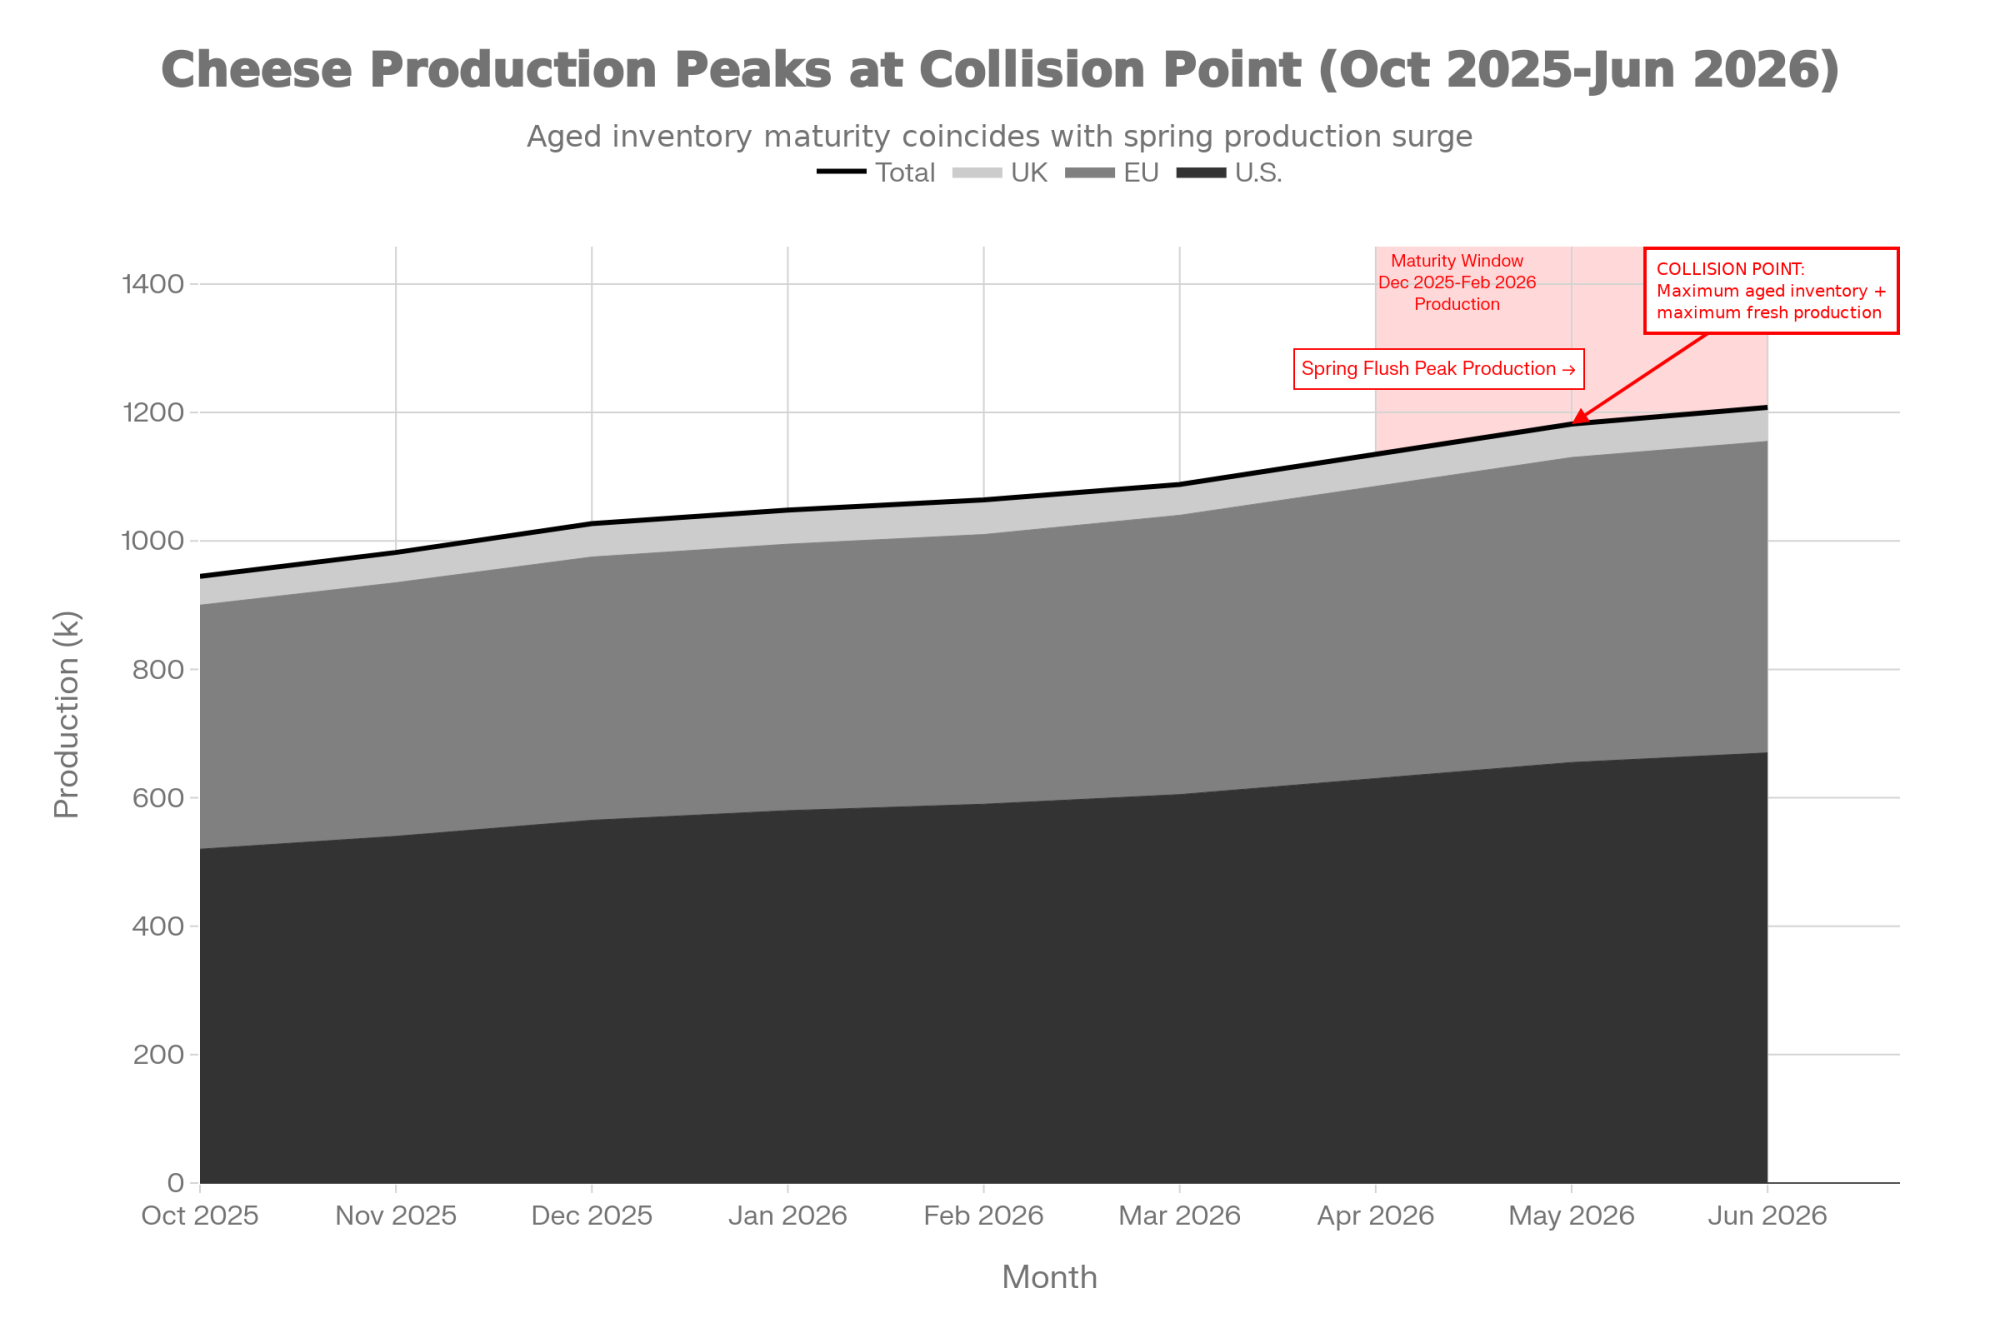
| Month | U.S. Cheese Production | EU Cheese Production | UK Cheese Production | Total Industry Production |
|---|---|---|---|---|
| Oct 2025 | 520 | 380 | 45 | 945 |
| Nov 2025 | 540 | 395 | 47 | 982 |
| Dec 2025 | 565 | 410 | 52 | 1,027 |
| Jan 2026 | 580 | 415 | 53 | 1,048 |
| Feb 2026 | 590 | 420 | 54 | 1,064 |
| Mar 2026 | 605 | 435 | 48 | 1,088 |
| Apr 2026 | 630 | 455 | 50 | 1,135 |
| May 2026 | 655 | 475 | 52 | 1,182 |
| Jun 2026 | 670 | 485 | 53 | 1,208 |
This creates what you might call borrowed demand—the cheese you’re making today to avoid the butter price collapse will need to clear the market in six months. If prices haven’t recovered by then, given the volume being produced across multiple regions, you’ve delayed the problem and possibly intensified it by concentrating everyone’s surplus into the same product at the same maturity window.
What Futures Markets Are Signaling
Despite the physical market’s weakness, there’s a notable divergence in how futures markets are pricing the outlook for different milk classes, and it’s worth understanding what that spread reveals about traders’ expectations.
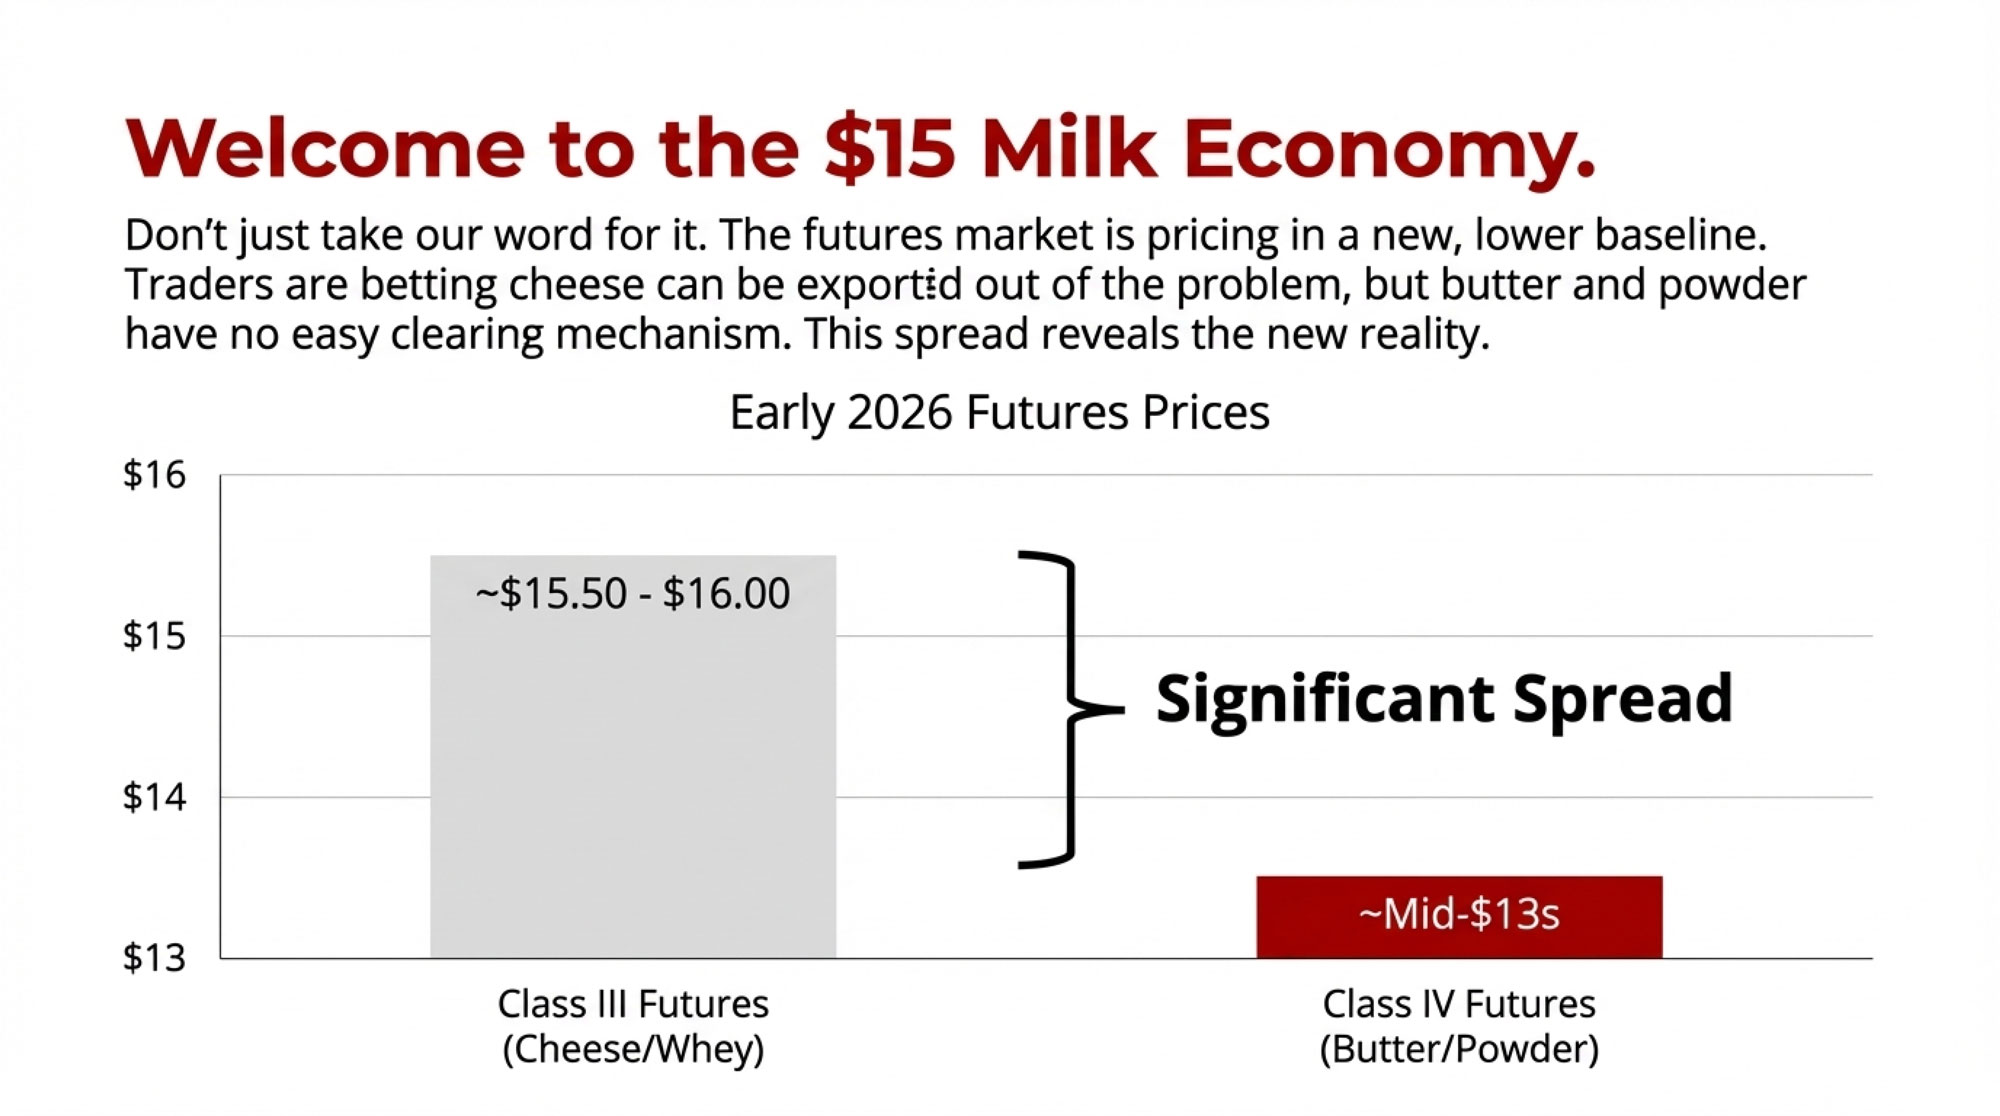
CME Class III futures for December 2025 fell 12 cents during the week to settle at $15.90 per hundredweight. But deferred 2026 contracts showed some resilience. The market seems to be betting that somewhere around the $15.50-16.00 range represents something close to a floor—that at these levels, demand will kick in enough and production will slow enough to stabilize things.
Class IV futures—driven by butter and nonfat dry milk prices—remain stuck in the mid-$13s through early 2026. The futures curve doesn’t show Class IV climbing above $14 until March at the earliest.
This spread reveals how traders are thinking about clearing mechanisms for different product categories. They’re betting that cheese can be cleared through aggressive export pricing, despite concerns about inventory. The record U.S. shipment volumes support that view. But they see no similar clearing mechanism for butter and powder, where domestic consumption is relatively fixed, and export competition from New Zealand and Europe remains intense.
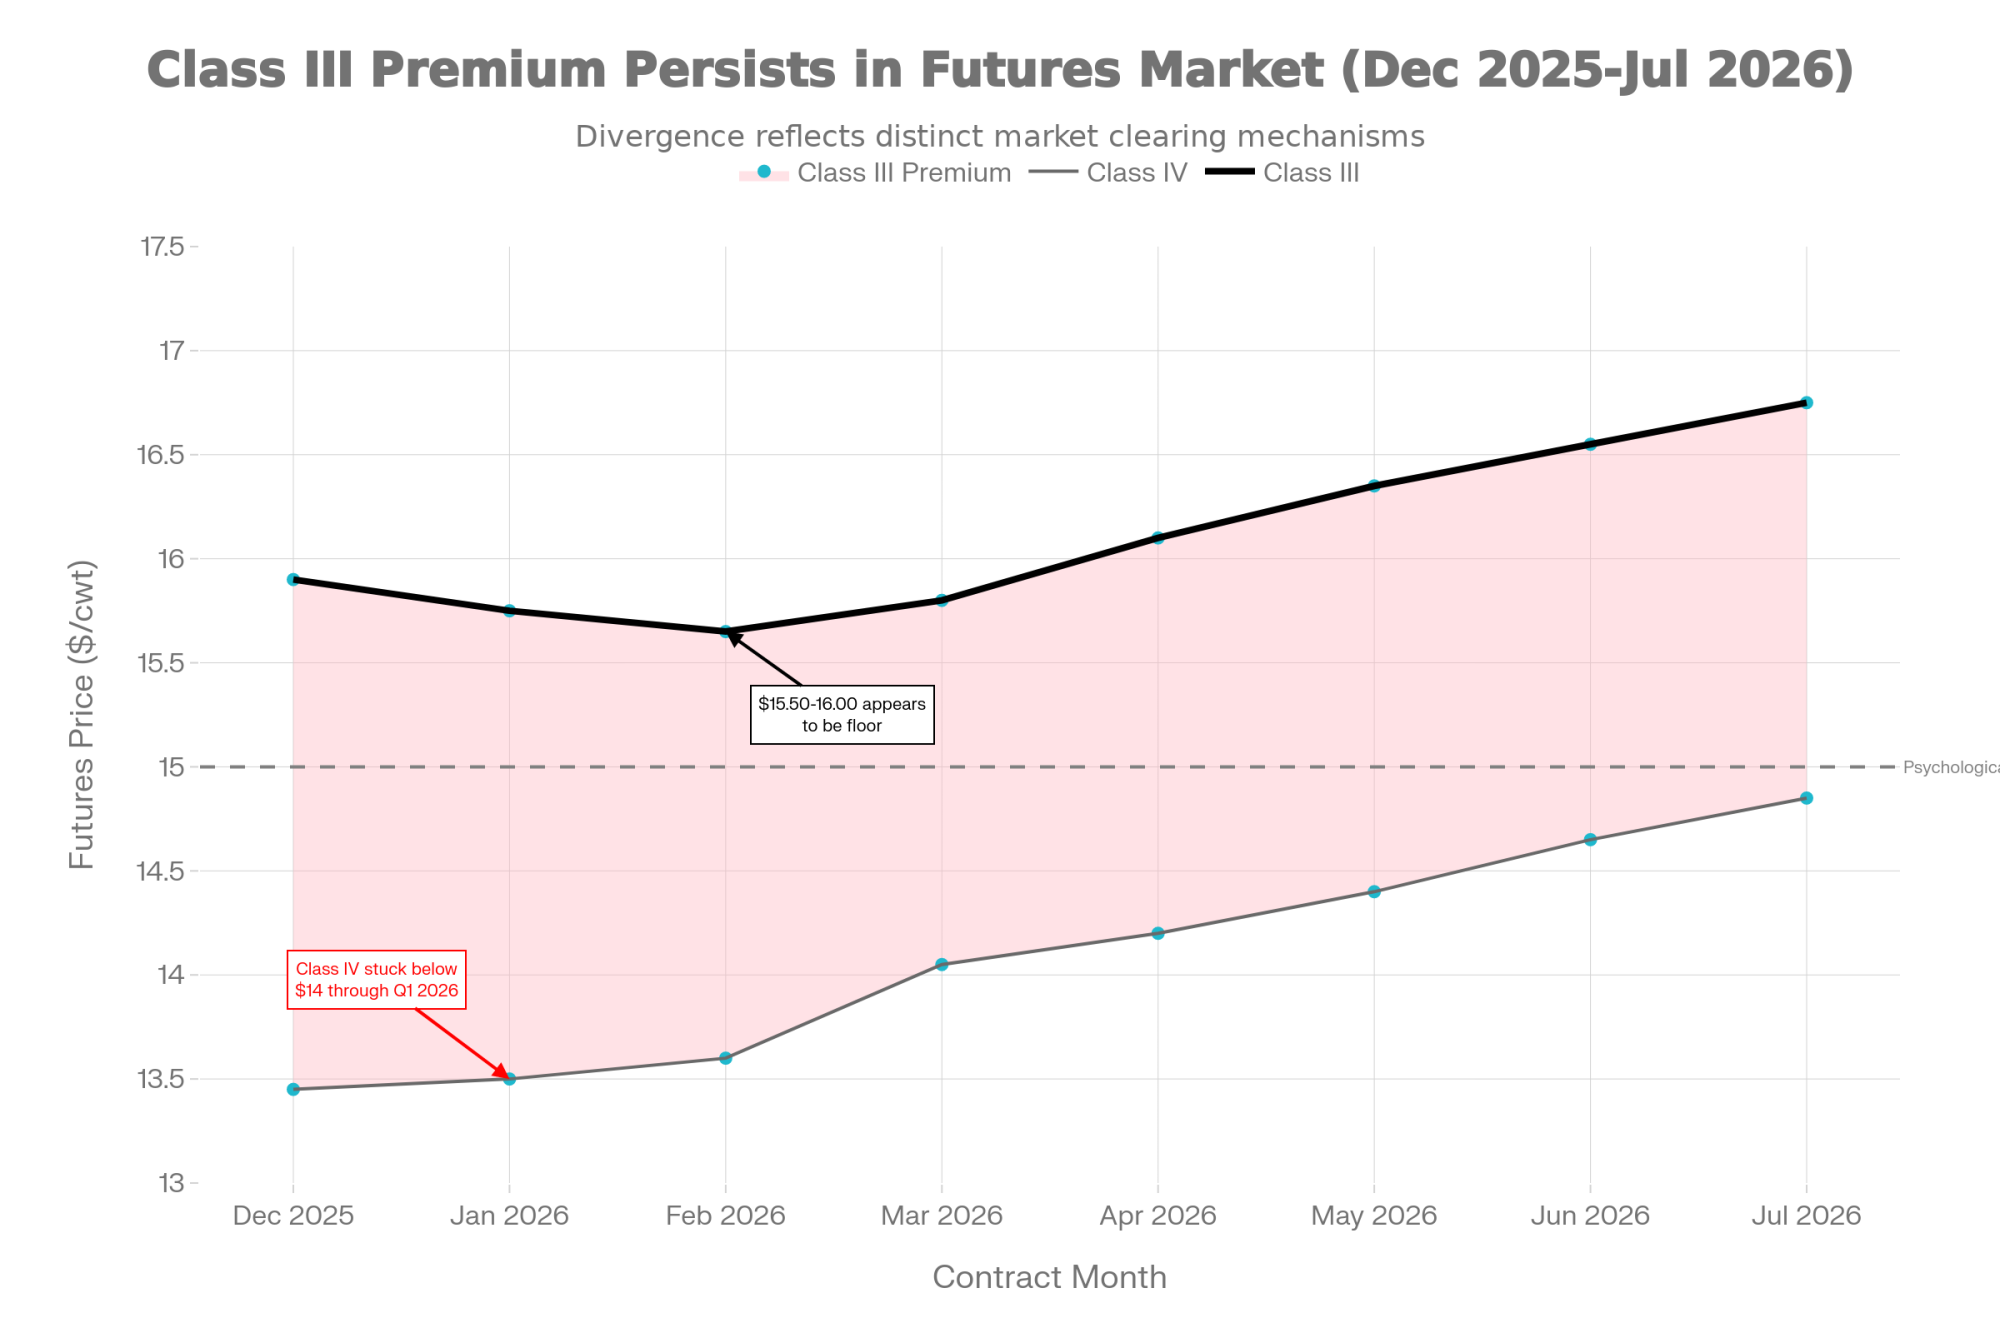
| Month | Class III Futures | Class IV Futures |
|---|---|---|
| Dec 2025 | $15.90 | $13.45 |
| Jan 2026 | $15.75 | $13.50 |
| Feb 2026 | $15.65 | $13.60 |
| Mar 2026 | $15.80 | $14.05 |
| Apr 2026 | $16.10 | $14.20 |
| May 2026 | $16.35 | $14.40 |
| Jun 2026 | $16.55 | $14.65 |
| Jul 2026 | $16.75 | $14.85 |
Another factor supporting Class III that is often overlooked is the relative strength in the dry whey market. While butter and cheese prices are under serious pressure, whey is showing some resilience. The EU weekly quotation showed whey firming €15 to €989 per tonne, now up 12.6% year-over-year—making it the only major dairy commodity showing positive year-over-year performance in European markets. U.S. whey powder exports jumped 8.3% in September, with strong sales to China and Vietnam.
Because the Class III formula includes both cheese and whey components—specifically cheese price times 9.6 plus whey price times 5.9—the strength in whey provides a mathematical floor that Class IV doesn’t have. Even if cheese prices stay depressed, firm whey values help support the overall Class III calculation.
The question is whether futures traders are correctly assessing the inventory risk. If those strong cheese export numbers reflect stockpiling by buyers taking advantage of low prices rather than genuine ongoing consumption demand, then the apparent clearing mechanism could weaken in Q2 2026, just when the spring flush and all that aged cheese hit the market simultaneously.
The Feed Cost Variable Worth Watching
While most market signals point toward continued pressure through early 2026, there’s one variable that could shift the equation, and it’s worth keeping on your radar: what happens in grain markets.

The current dairy situation is enabled by historically low corn and soybean meal prices. As long as those input costs stay depressed, the income-over-feed-cost margins for many operations remain positive enough to justify maintaining production even with low milk prices.
But grain markets can turn quickly. The USDA is forecasting massive corn ending stocks, but those projections assume reasonably normal weather conditions. If drought develops in Brazil or Argentina during their growing season—December through March—grain prices could spike. The soybean complex, in particular, is trading with skepticism about Chinese demand. U.S. commitments to export soybeans through early November were running 40% lower than the prior year.
If China steps back into the market aggressively, or if South American weather turns problematic, soybean meal could rally from current levels near $300 per ton to $350 or higher fairly quickly. That kind of move would change the feed cost equation that’s currently supporting milk production despite low prices.
A grain rally might trigger a supply response driven by economics rather than operational necessity. If feed costs spike while milk prices stay low, you’d see the cull rate accelerate. That would tighten milk supplies before the spring flush, which might prevent some of the more challenging scenarios being discussed for Q2.
The complication, of course, is that this kind of adjustment through higher input costs isn’t exactly a rescue—it would address the oversupply by further pressuring margins. But it might be one of the few mechanisms left that can trigger a meaningful supply response.
Looking Ahead to Spring 2026
As we look toward the next few months, there are several scenarios worth considering, and I think it’s important to think through both the optimistic case and the more challenging possibilities.
The optimistic case would be that export demand continues absorbing U.S. cheese at roughly current volumes, European production contracts modestly as various forecasts suggest, New Zealand’s season ends normally, and the market finds a new equilibrium at these lower price levels without major disruption. Farmers who can operate profitably at Class III in the $15-16 range continue; those who can’t gradually exit through normal business cycles. It’s a slow grind, but it avoids a crisis.
The challenge with that scenario is that it assumes multiple things align favorably simultaneously, and it doesn’t fully account for the inventory dynamics building in the cheese complex.
A more complete assessment acknowledges that we’re heading into Q2 2026 with several risk factors converging. The spring flush will bring seasonal increases in production—that’s biology; you can’t avoid it. Cheese produced in late 2025 and early 2026 will be maturing and needing to move to market. And if export warehouses in key markets are already well-stocked from late 2025’s record shipments, buyer demand could slow as supply peaks.
In that scenario, cold storage space becomes a limiting factor. Processors would face pressure to either move product into lower-value channels—such as converting aged cheese into processed cheese ingredients—or implement supply management measures. Spot milk prices could come under significant pressure in some regions.
Whether these dynamics develop into a more serious situation depends on variables we can’t yet fully predict—export demand patterns, weather affecting production, and policy responses. But the risk is substantial enough that operations should plan for various scenarios rather than assume conditions will improve on their own.
What This Means for Your Operation
So, where does all this leave us? I think there are some practical considerations worth thinking through, and they vary depending on your role in the industry.
For Producers:
The evidence suggests we’ve moved beyond a typical cyclical downturn. Relying on historical price recovery patterns to guide current decision-making carries real risk.
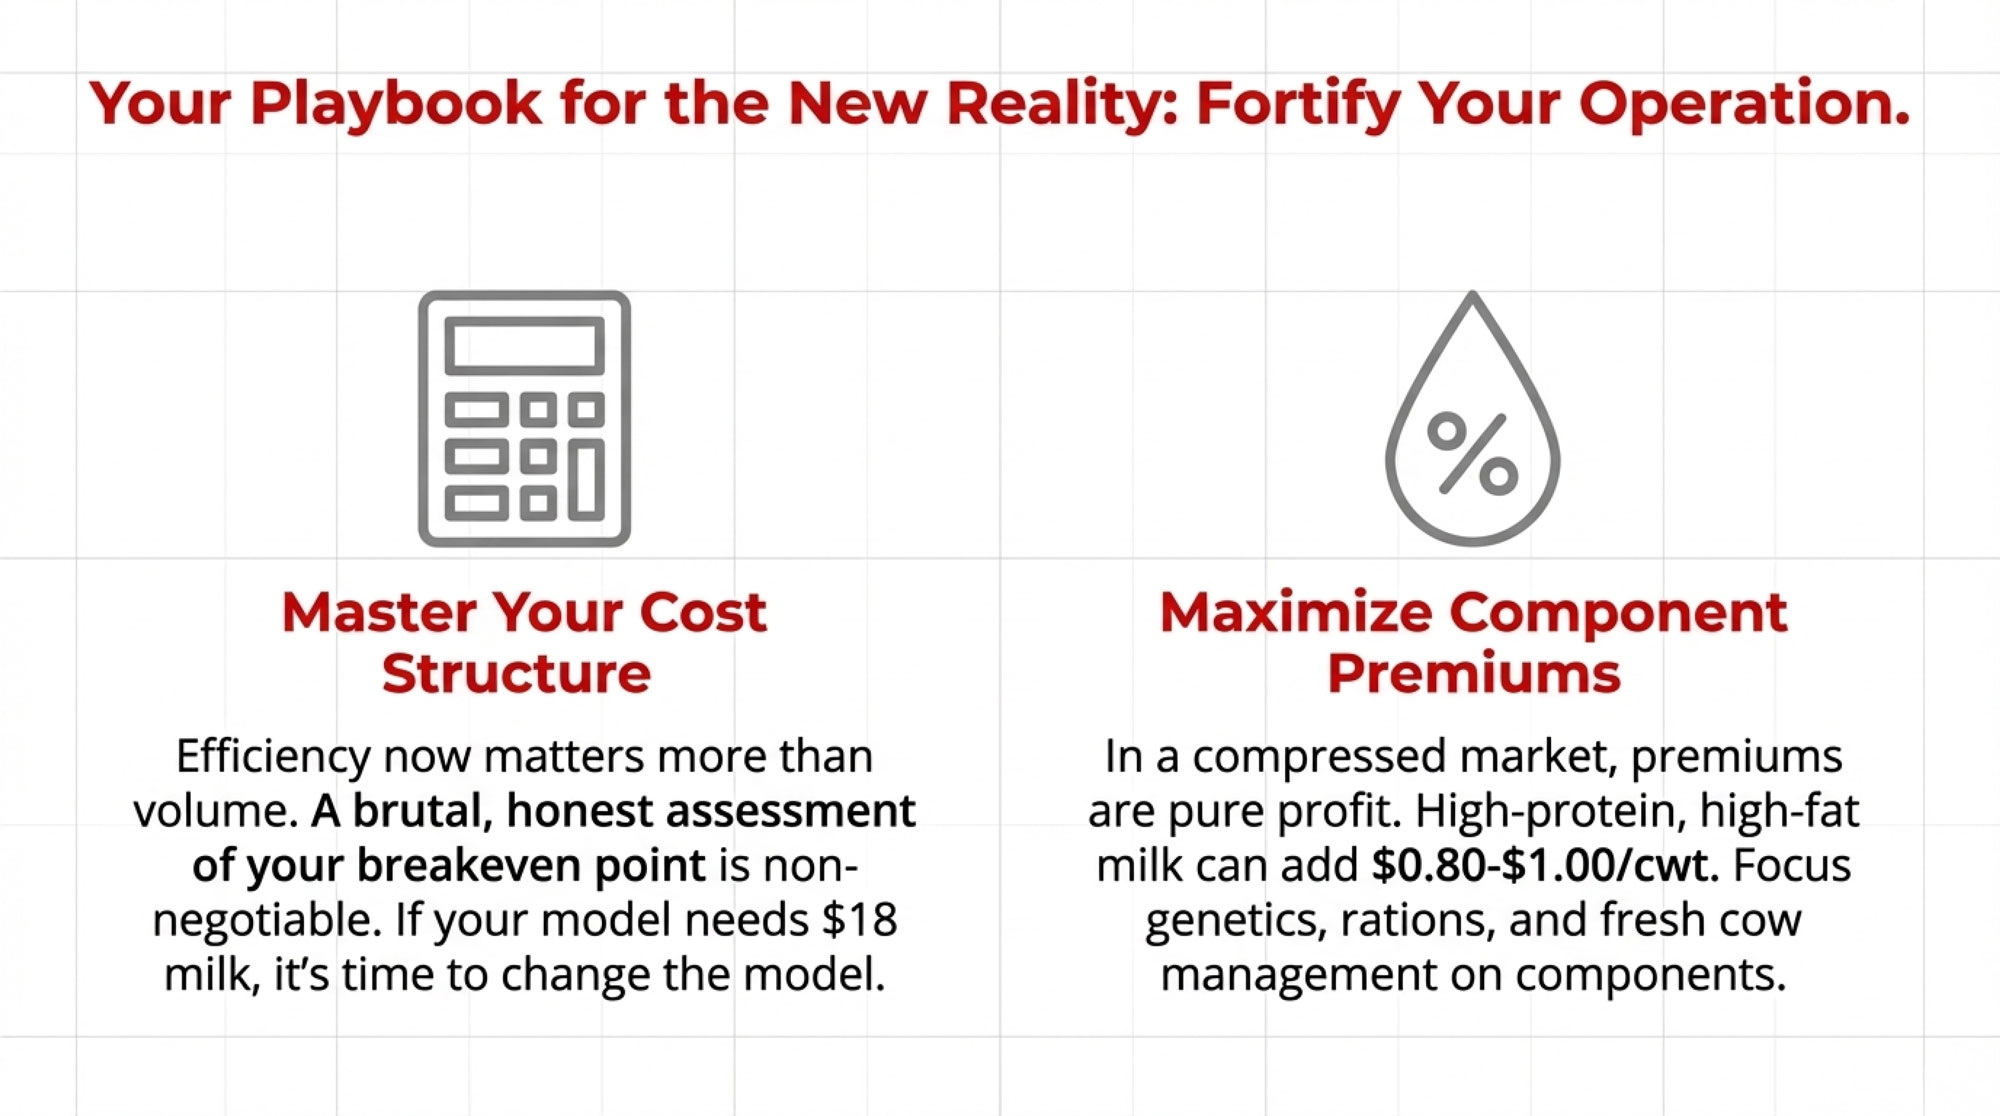
The most important focus right now is cost structure. In a market where establishing a lower baseline price, efficiency matters more than production volume. A realistic assessment of your operation’s true breakeven point is critical. If your business model requires $18-19 milk to be profitable, fundamental changes may be necessary because the market is signaling that $15-16 could be the range for extended periods.
Component quality is becoming increasingly important in compressed markets. When commodity prices are under pressure, the premiums for high-protein, high-fat milk become proportionally more valuable. Fresh cow management, ration formulation, and genetic selection decisions that maximize components—all of this can add meaningful value when the base price is low. I’ve seen operations in the Upper Midwest boost their component checks by 80 cents to a dollar per hundredweight through focused attention to butterfat and protein levels, and that differential matters more than ever in this environment.
| Strategy | Specific Action | Potential Impact | Priority Status |
|---|---|---|---|
| Cost Structure Optimization | Conduct fresh breakeven analysis; identify and eliminate non-essential costs; renegotiate vendor contracts | Lower breakeven $1.50-2.00/cwt | Critical Action |
| Component Premium Maximization | Focus fresh cow management; optimize rations for fat/protein; select genetics for components | Add $0.80-1.20/cwt to milk check | High Priority |
| Balance Sheet Resilience | Build working capital reserves; defer non-critical capital projects; restructure high-interest debt | Survive 6-12 months low prices | Critical Action |
| Feed Cost Management | Forward contract 50-60% of corn/soy needs through summer 2026 at current lows ($4.40 corn) | Lock controllable cost advantage | High Priority |
| Risk Management Tools | Implement Dairy Revenue Protection or LGM; set minimum price floors for Q2-Q3 2026 | Protect against worse-case scenarios | Recommended |
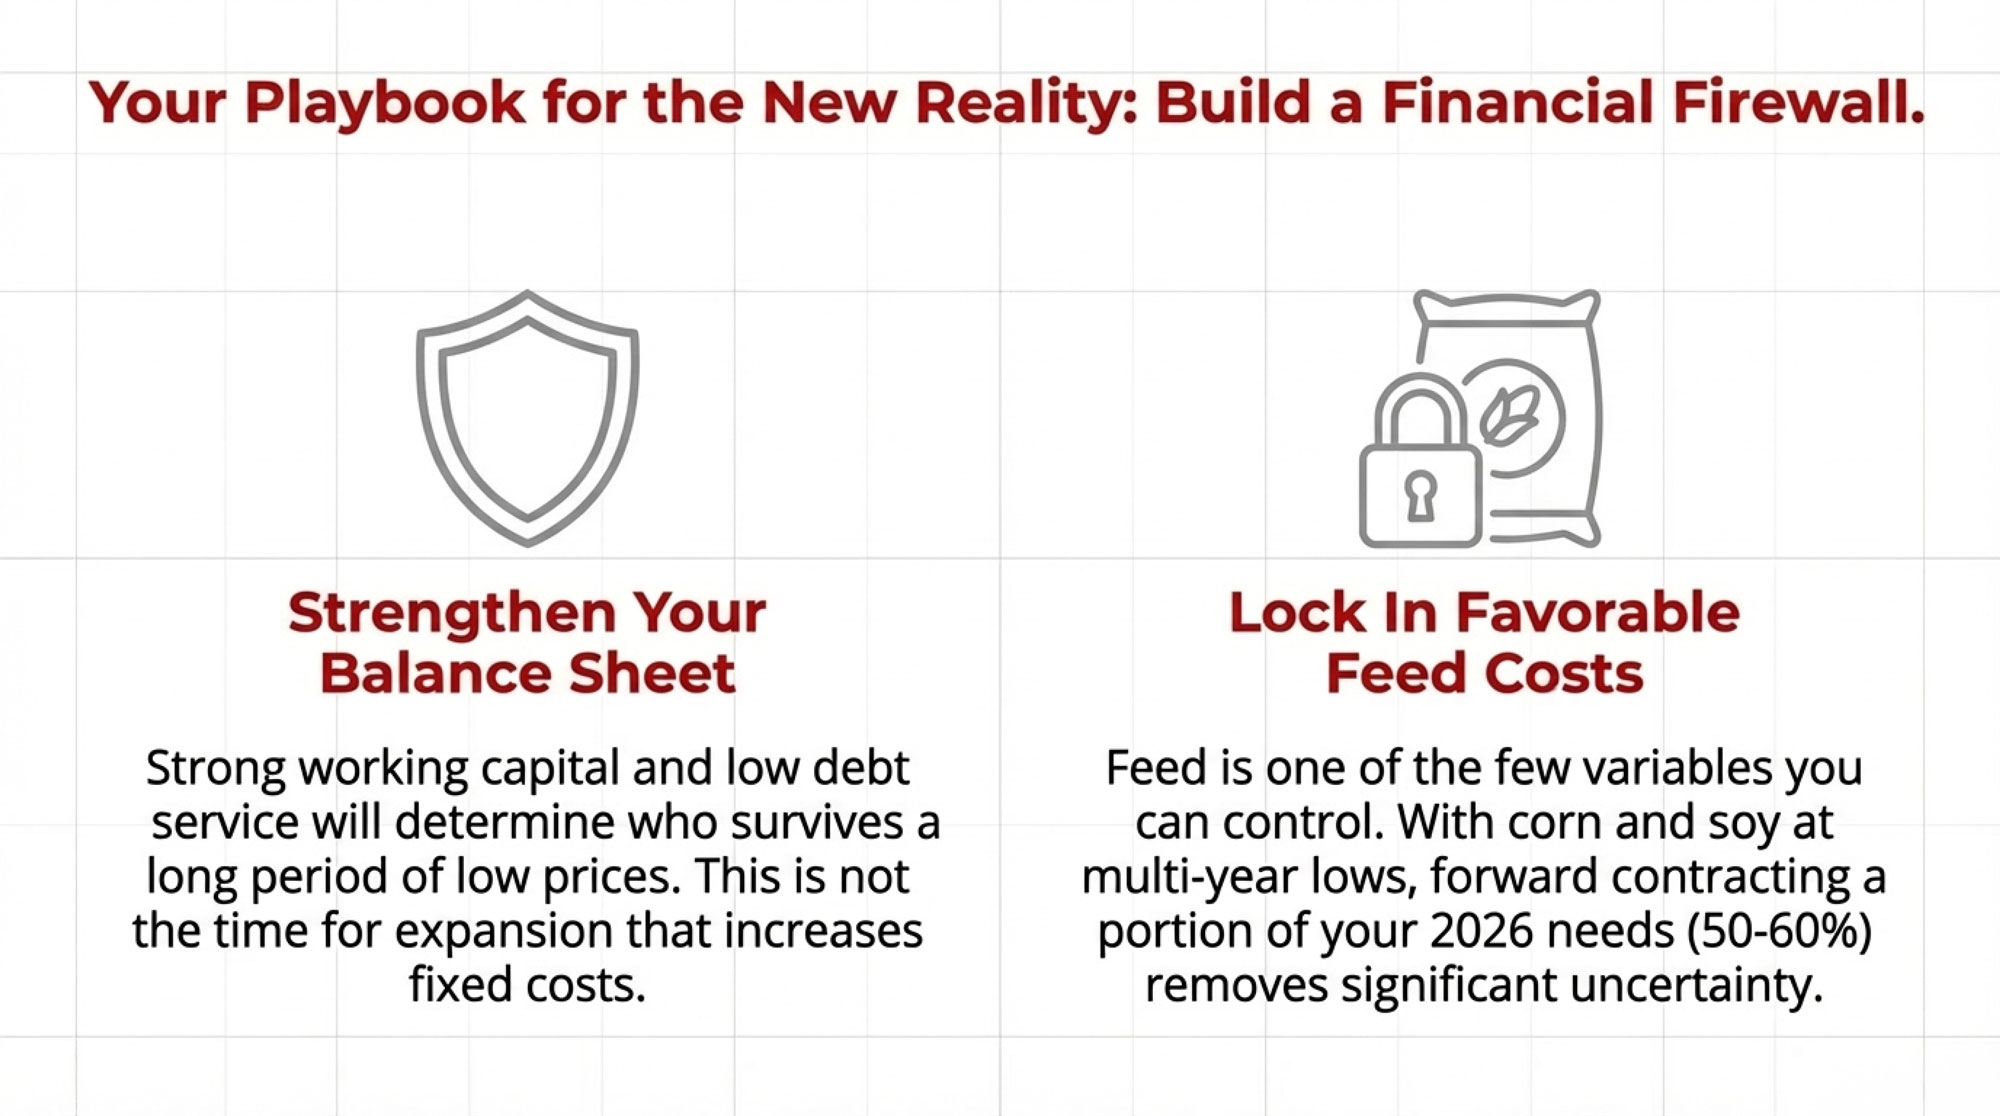
Balance sheet resilience will be critical heading into 2026. Operations with stronger working capital and lower debt service obligations will be better positioned to navigate extended low prices. This may not be the optimal time for major expansion projects or capital spending that increases fixed costs. I know that’s difficult advice when you’ve got planned improvements or a son or daughter wanting to come back to the farm, but timing matters.
Feed cost management deserves attention. With corn and soybean meal at multi-year lows, locking in favorable input costs for at least a portion of needs provides one of the few controllable variables in the current environment. Even partial coverage—50-60% of expected needs—can provide meaningful protection if grain markets rally. Some Northeast operations I’m familiar with are forward contracting corn through summer 2026 to remove at least that uncertainty from their planning.
For Processors:
Inventory management has moved from routine practice to strategic necessity. The industry-wide shift toward cheese production requires realistic planning for when and where that inventory will clear. Frank conversations with customers about forward commitments and careful evaluation of speculative inventory positions are warranted, given uncertainty about the timing of price recovery.
Export channel diversification matters more in volatile markets. Heavy reliance on one or two markets—particularly those that may be engaging in stockpiling rather than steady consumption—creates vulnerability if buying patterns shift.
Processing flexibility offers strategic advantages. Assets that can shift between products as market conditions change provide more options than single-purpose facilities in volatile environments. I recognize that’s easier said than done when you’ve got specialized equipment and a trained workforce, but it’s worth considering in future capital planning.
For the Broader Industry:
The synchronized weakness across global markets raises questions about coordination and supply discipline. Without mechanisms to better align supply with realistic demand expectations, these boom-bust cycles may become more frequent and severe. This doesn’t necessarily mean government intervention, but it might involve processors implementing more structured base-excess programs or cooperatives taking stronger action to manage supply.
Export infrastructure and market development will become increasingly critical if the U.S. continues to position itself as a large-scale global supplier. This means sustained investment in logistics, market access, technical assistance to importing countries, and trade relationships that can reliably absorb substantial volumes.
Better market intelligence and information sharing could help prevent simultaneous strategic pivots that amplify imbalances. If processors in different regions had better visibility into global production decisions, they might make different product-mix choices. Industry associations and market data services have a role in providing that transparency.
The Bottom Line
The week of December 15, 2025, may mark a transition point—when global dairy markets shifted from familiar cyclical volatility into something more structural and challenging to navigate.
The traditional mechanisms that historically dampened these cycles are evolving. Smaller farms that used to exit during downturns and help tighten supply represent a declining share of production. Regional markets that operated somewhat independently are increasingly interconnected and moving together. Feed costs, which tend to move inversely with milk prices and provide a natural hedge, are currently low, removing that counterbalance.
What’s emerging is a more consolidated, more efficient production system that responds to price signals differently than in previous decades. Large operations with modern facilities and low per-unit costs can remain profitable at price levels that would have historically triggered widespread exits. That’s economically efficient in many ways, but it also means markets may need to fall further and stay low longer to trigger the supply response needed to rebalance.
For all of us navigating this transition, the fundamental challenge is to build operations and business models that remain viable at these new baseline prices rather than relying on assumptions of a return to historical averages. The traditional wisdom that low prices eventually cure low prices still holds. The cure is working—you can see it in the data. But the adjustment period may be longer than in previous cycles required.
These are sending clear signals about the current supply-demand balance. The question facing every operation is how to adapt business strategies and risk management approaches to this evolving reality while maintaining the flexibility to capitalize on opportunities as they develop.
Market data referenced in this analysis comes from the European Energy Exchange (EEX), Singapore Exchange (SGX), Global Dairy Trade platform, CME Group, USDA World Agricultural Supply and Demand Estimates (WASDE), U.S. Dairy Export Council (USDEC), UK Department for Environment, Food & Rural Affairs (DEFRA), and European Commission weekly dairy quotations for the period ending December 15, 2025.
Key Takeaways:
- The Export Paradox: Record U.S. cheese exports (+34.5%) met 18-month price lows as every global dairy market crashed simultaneously the week of December 15—revealing fundamental pricing mechanisms have broken.
- Why Supply Won’t Self-Correct: Cheap feed ($4.40 corn, $302 soy meal) keeps income-over-feed-cost positive at $15-16 milk, preventing the production cuts that normally cure oversupply.
- Q2 2026 Inventory Collision: Processors globally are shifting from butter to cheese simultaneously. This inventory matures in spring 2026, precisely when the flush hits—creating a potential crisis for spot milk prices.
- This Is a Reset, Not a Cycle: Class III holding near $16 while Class IV languishes in mid-$13s signals new baseline economics. Operations must be built for sustained viability at these levels, not temporary survival.
- Immediate Producer Priorities: (1) Cost structure over production volume, (2) Maximize component premiums—they matter most in compressed markets, (3) Strengthen balance sheets before spring, (4) Lock feed costs now via forward contracting.
Complete references and supporting documentation are available upon request by contacting the editorial team at editor@thebullvine.com.
Learn More:
- Boost Your Dairy Farm’s Efficiency: Easy Protocol Tweaks for Big Results – Provides immediate, low-cost strategies to tighten operational protocols and reduce waste, essential for protecting margins when milk prices drop to the $15-16 range referenced in the market analysis.
- Slight Dip in Year-End Milk Prices: What Dairy Farmers Need to Know from October 2024 WASDE Report – Delivers foundational context on the USDA forecasts that preceded the current crash, helping producers understand the long-term supply trends and import dynamics reshaping 2025-2026 pricing.
- FEED EFFICIENCY BOMBSHELL: Yeast Additives Expose the Truth About High-Starch Dairy Diets – Reveals how to leverage specific additives to maximize cheap corn inputs and boost income-over-feed costs, a critical tactic for maintaining viability during periods of “profitless production.”
 Join the Revolution!
Join over 30,000 successful dairy professionals who rely on Bullvine Weekly for their competitive edge. Delivered directly to your inbox each week, our exclusive industry insights help you make smarter decisions while saving precious hours every week. Never miss critical updates on milk production trends, breakthrough technologies, and profit-boosting strategies that top producers are already implementing. Subscribe now to transform your dairy operation’s efficiency and profitability—your future success is just one click away.