Archive for dairy export strategy

China’s 42.7% Dairy Tariff Hits the EU – Why Your Milk Check Won’t See the Boost You’re Expecting

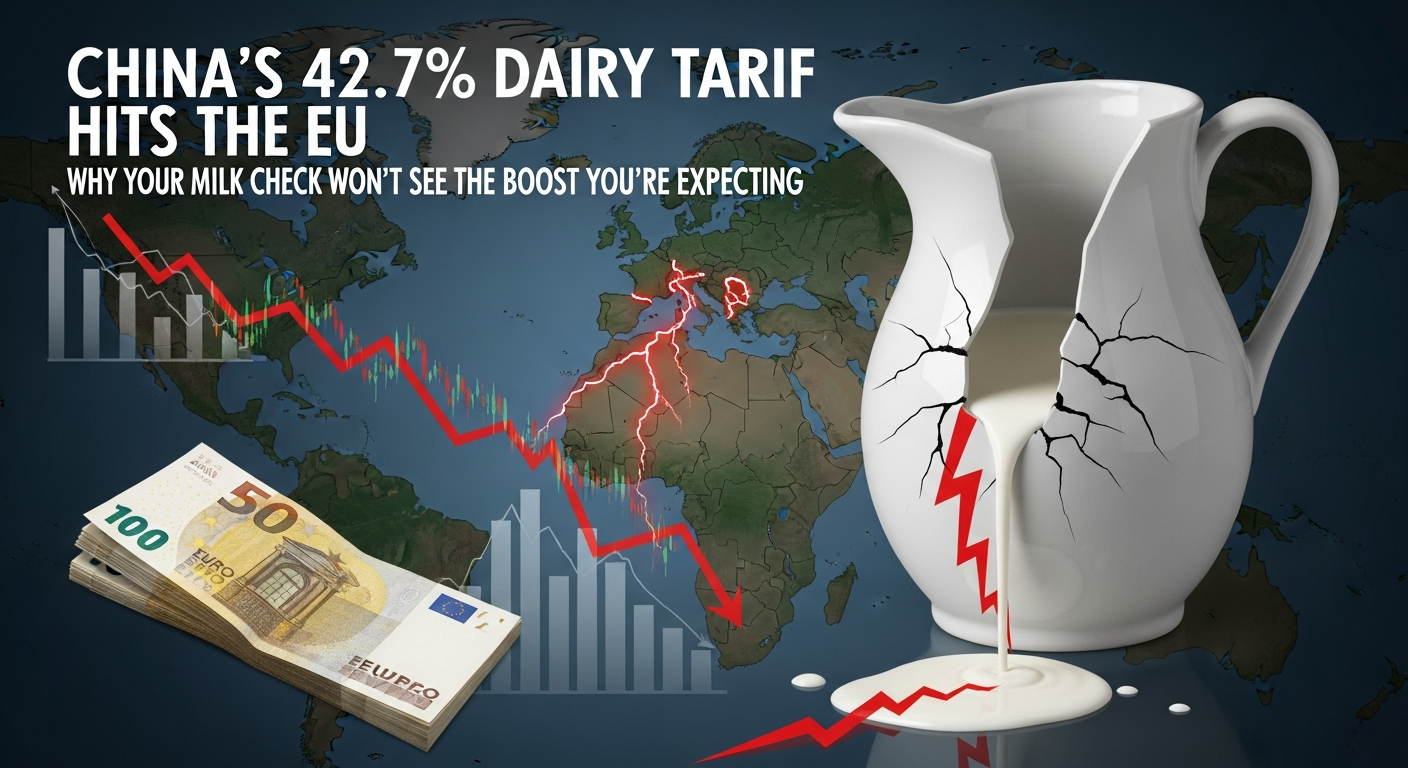
China’s 42.7% EU dairy tariff? Don’t celebrate yet. NZ ships duty-free with 51% market share—and China built their herd with genetics we sold them.

Executive Summary: China’s 21.9%–42.7% tariffs on EU dairy, announced December 22, 2025, are being called an opportunity for American exporters—but the market math doesn’t add up. New Zealand ships to China duty-free and holds 51% of the import market share. The U.S. exports primarily whey (95%), not the specialty cheeses being tariffed, limiting substitution potential. Most significant: China expanded domestic production to 43 million tonnes using genetics purchased from Western suppliers, including the U.S. For producers, this isn’t a moment to expect export rallies—it’s a signal to assess your processor’s export exposure, stress-test finances assuming flat Class III prices, and focus on what you control: components, efficiency, and diversification strategies like beef-on-dairy.

You know, I’ve been watching trade disputes affect dairy farmers for two decades now, and what happened today feels different. When China announced provisional tariffs of up to 42.7% on European Union dairy imports—a decision Reuters confirmed this morning—the industry press releases started flying within hours. “Opportunity for U.S. producers.” “Market share available.” “Ready to step into the gap.”

Those statements reflect genuine optimism. But there’s more context here that deserves attention. Context that can help you make better decisions about your operation, regardless of how this dispute plays out.

Grab a coffee—this one’s got some layers to it.

How Electric Vehicles Became a Dairy Problem

Back in August 2024—August 21st specifically, according to China’s Ministry of Commerce—Beijing announced it would investigate European dairy imports for alleged subsidies. The timing wasn’t coincidental. When the EU finalized tariffs of up to 45.3% on Chinese EVs that October, China had already begun its response.

Rather than targeting European cars directly, Beijing identified politically sensitive export categories: brandy, pork, and dairy. Smart strategy, honestly.

“It is highly frustrating that again, dairy seems to be used as a political pawn in a wider trade dispute between the EU and China regarding electric vehicles,” Conor Mulvihill, director of Dairy Industry Ireland, told reporters. Irish dairy exports to China topped €385 million in 2024, according to Bord Bia figures, and that revenue is now at risk.

The tariff structure ranges from 21.9% for cooperative companies up to the full 42.7% for non-cooperative ones, according to China’s Ministry of Commerce.

Assessing the Opportunity—Multiple Perspectives

Here’s where we need to think carefully. A Midwest processor I spoke with last week was measured:

“There might be some incremental business here, but anyone expecting a flood of new orders is probably going to be disappointed.” — Midwest dairy processor

The International Dairy Foods Association has offered a more optimistic view, noting U.S. exporters are ready to step into opportunities created by trade actions affecting competitors.

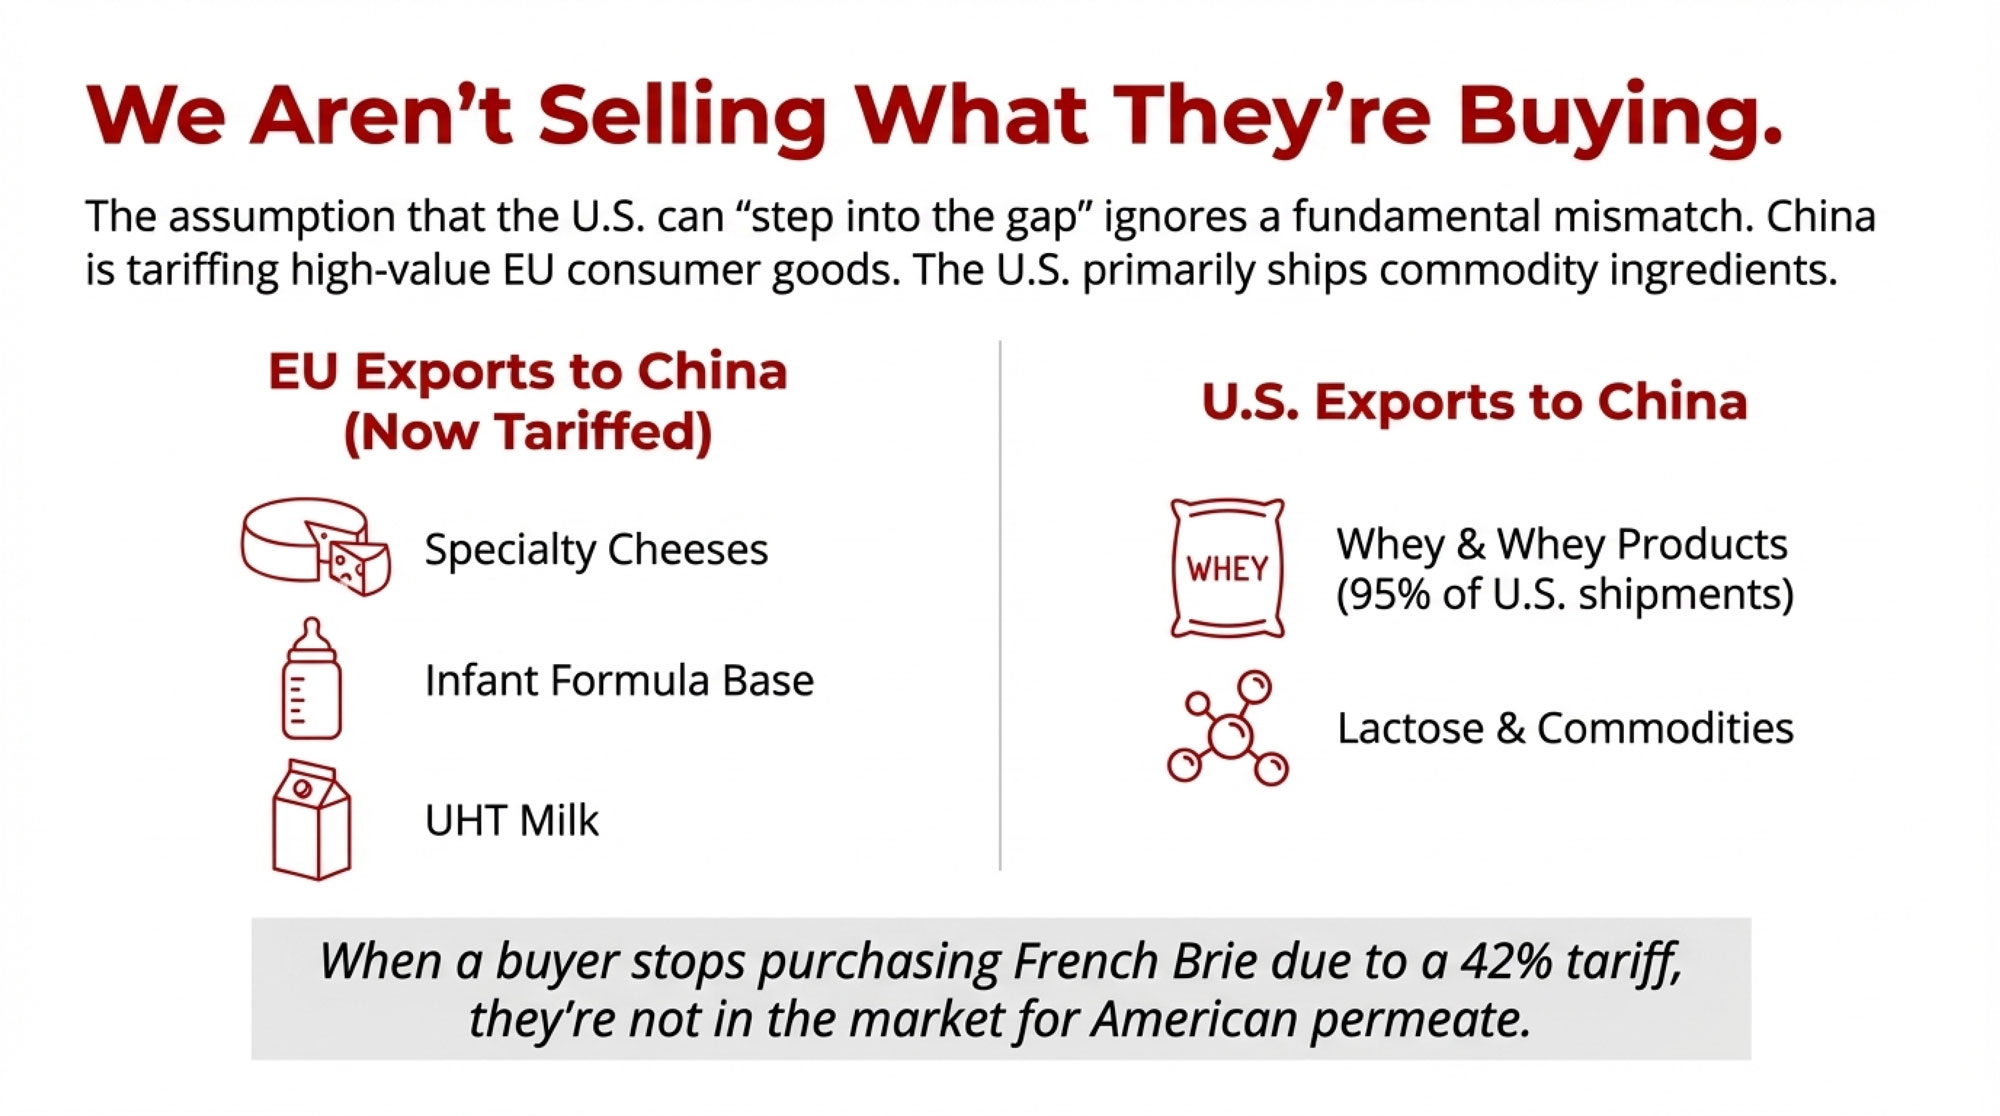
But here’s what many producers don’t appreciate: the U.S. and EU don’t sell the same products to China.

According to the UK’s Agriculture and Horticulture Development Board, around 95% of U.S. dairy exports to China consist of whey and whey products—commodity ingredients for food processing and animal feed. The EU sends specialty cheeses, infant formula base, and UHT milk. Premium consumer products.

So when a Chinese buyer stops purchasing French Brie because of a 42% tariff, they’re not necessarily in the market for American permeate. Different products, different purposes.

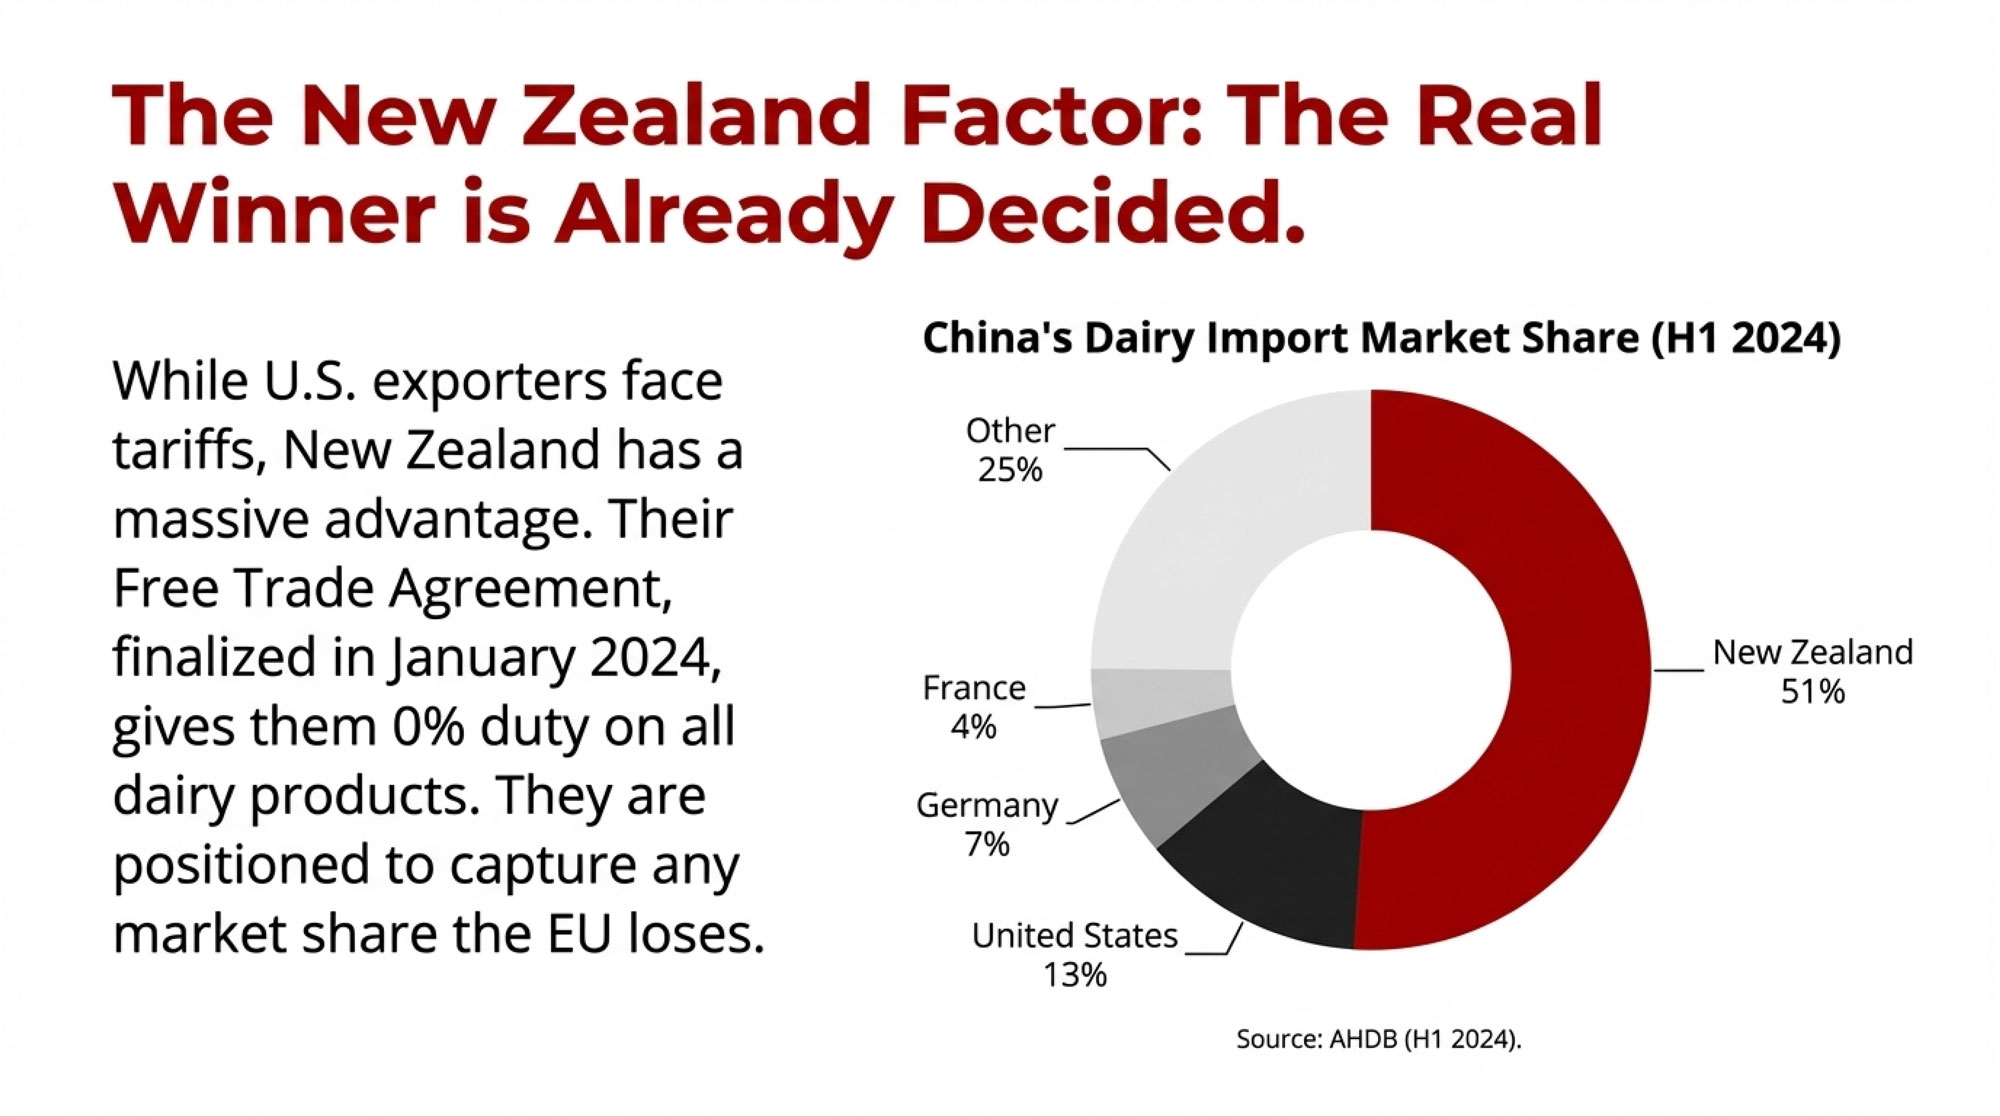
The New Zealand Factor

The AHDB reported that New Zealand controlled approximately 51% of China’s dairy import market in H1 2024—up from 42% in 2023. And thanks to their Free Trade Agreement, Kiwi dairy now enters China completely duty-free as of January 2024.

New Zealand’s Trade Minister Todd McClay confirmed it directly: all safeguard duties on milk powder have been eliminated.

China Market Access at a Glance

ExporterTariff Status (Dec. 2025)Market PositionKey Products
European Union21.9%–42.7% provisional dutiesGermany 7%, France 4% of importsSpecialty cheese, infant formula
United StatesExisting MFN + retaliatory tariffs~13% share; second-largest supplierWhey (95%), lactose, commodities
New Zealand0% (duty-free)~51% share; largest supplierWhole milk powder, butter, cheese

Sources: China Ministry of Commerce; AHDB (H1 2024); Dairy Global

When European cheese gets more expensive, who captures that demand? New Zealand—and they’ve been working this market for decades.

Understanding China’s Domestic Situation

China’s tariffs serve multiple purposes. Yes, retaliation. But also breathing room for a domestic industry facing challenges.

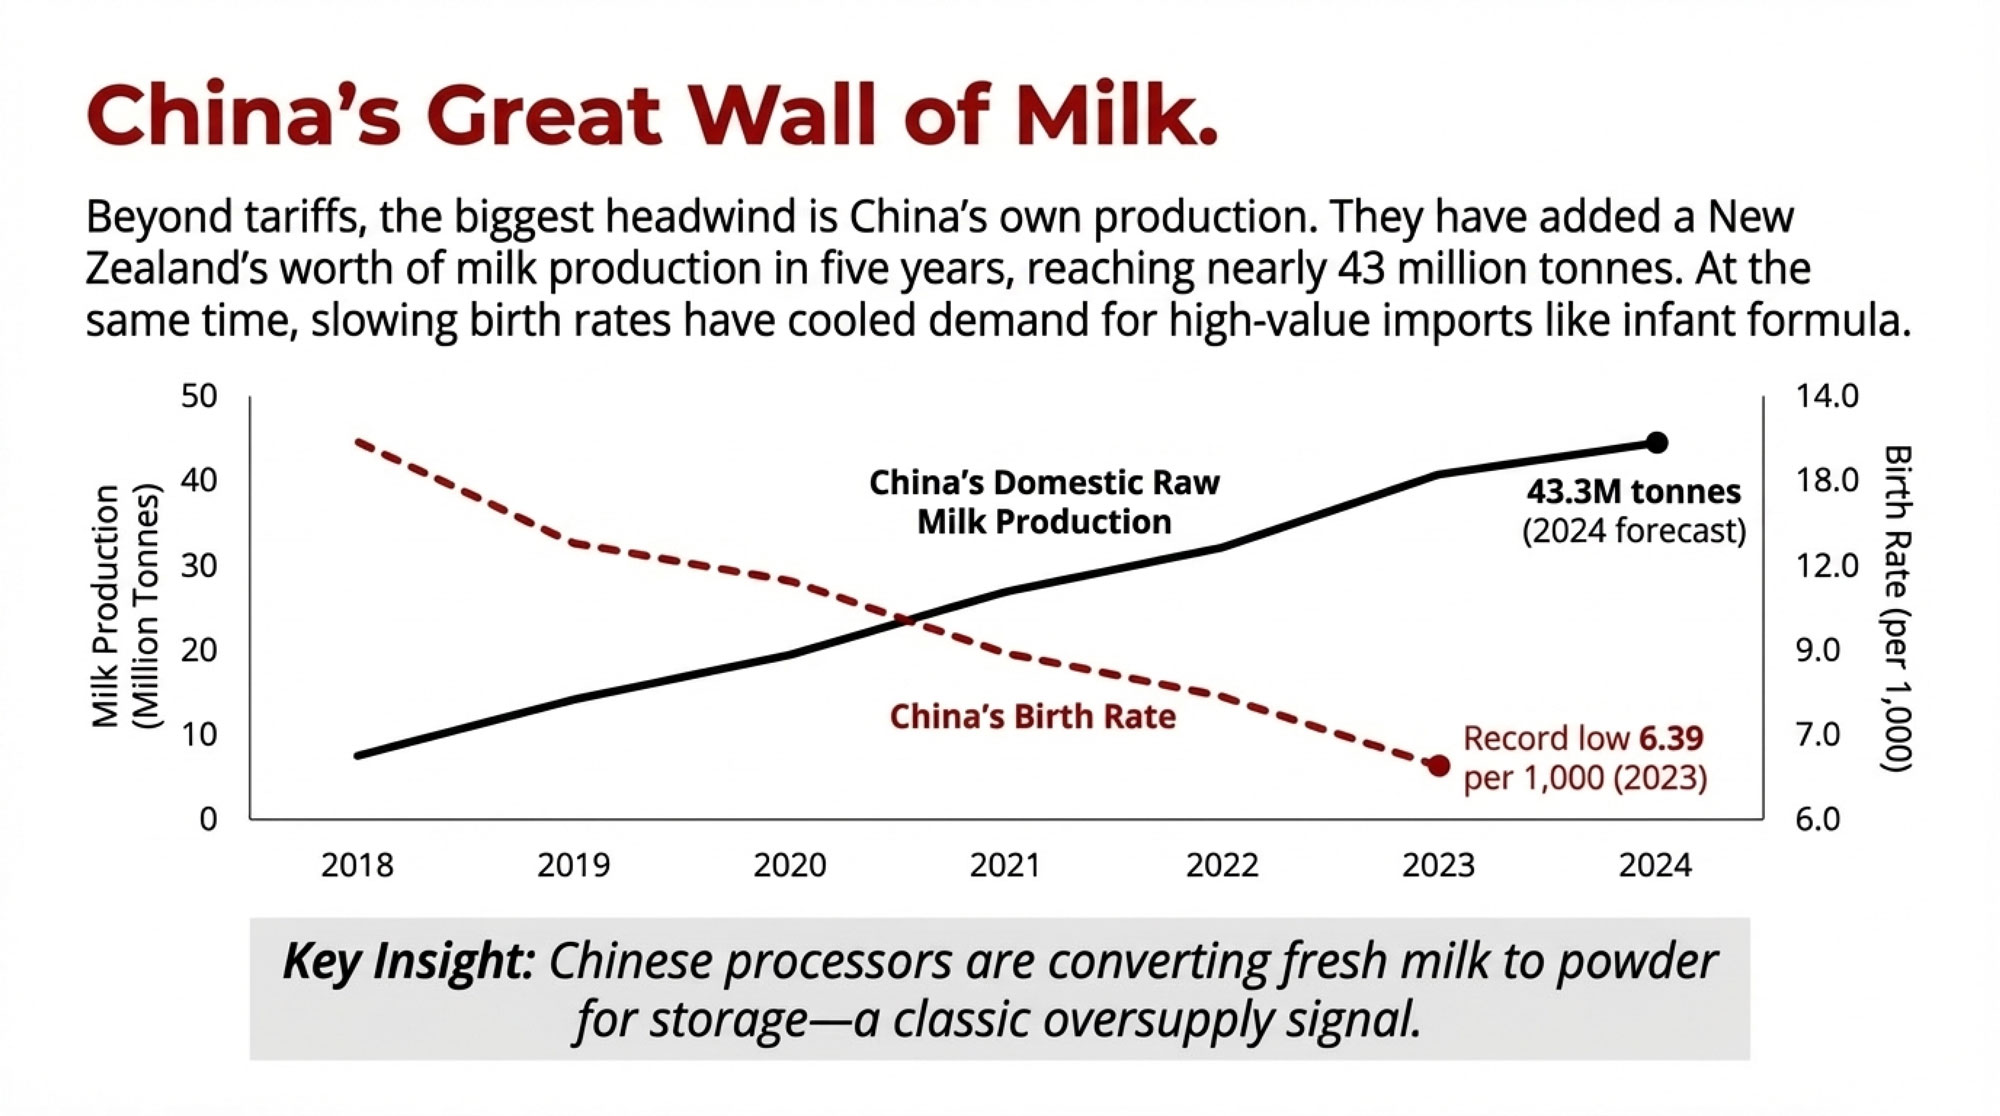
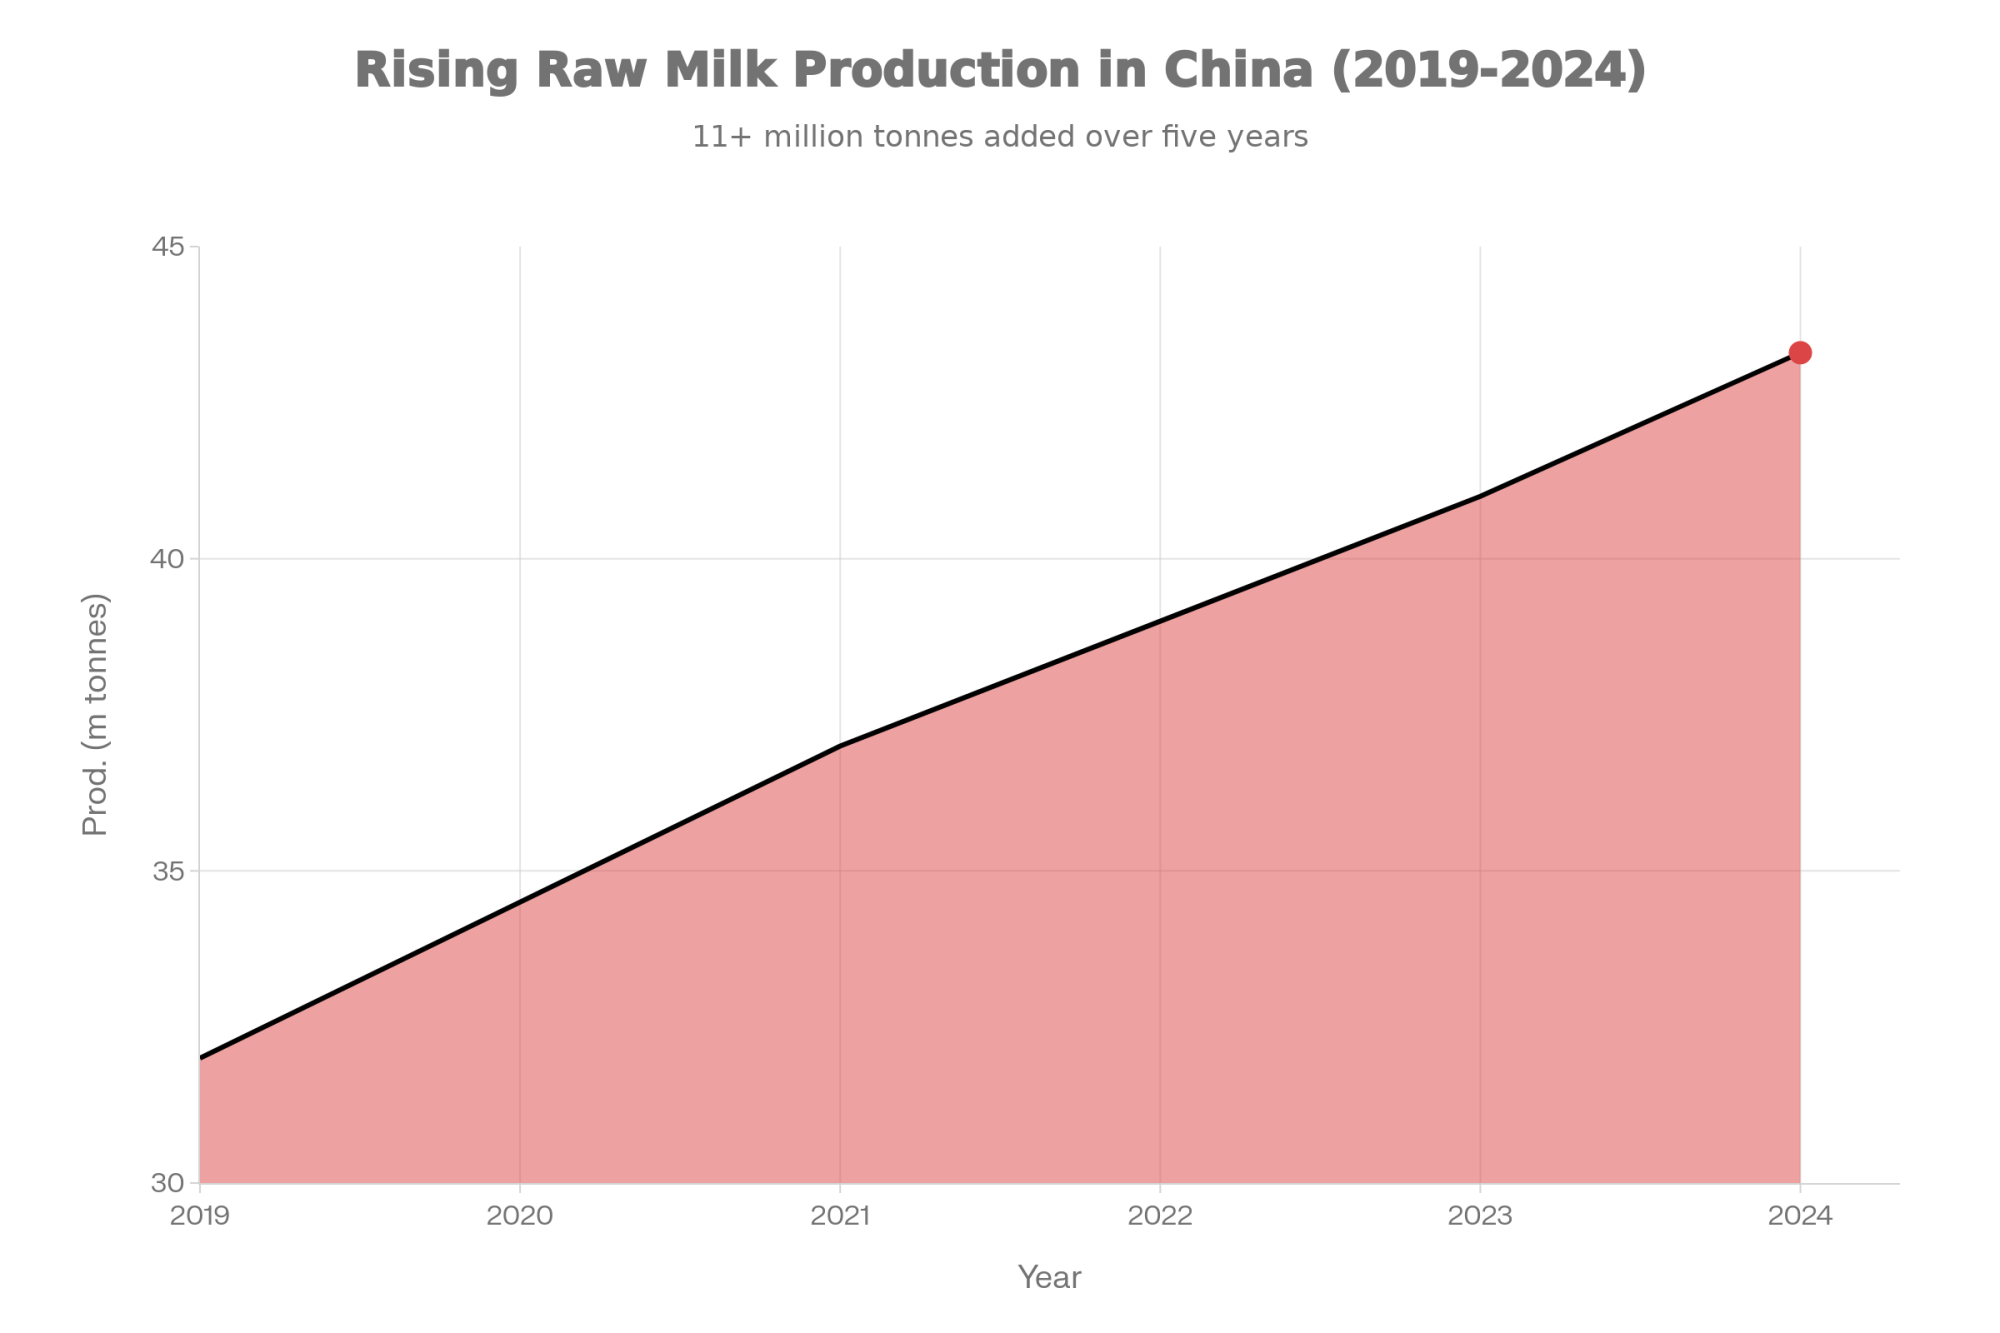
According to the USDA’s November 2024 report, Chinese raw milk production reached approximately 41-42 million tonnes. Rabobank forecasts 43.3 million tonnes for 2024. China has essentially added a New Zealand’s worth of production inside their own borders over five years.

Meanwhile, demand has slowed. China’s birth rate dropped to a record low of 6.39 per 1,000 in 2023, continuing a multi-decade decline. Fewer babies means less infant formula demand—one of the highest-value import categories.

Chinese processors are converting fresh milk to powder for storage. If you’ve been in dairy long enough, you recognize that as a classic oversupply signal.

The Genetic Paradox: Did We Export Our Own Market?

For Bullvine readers who understand breeding, this is worth sitting with.

Where did China get the cows for this expansion? From us.

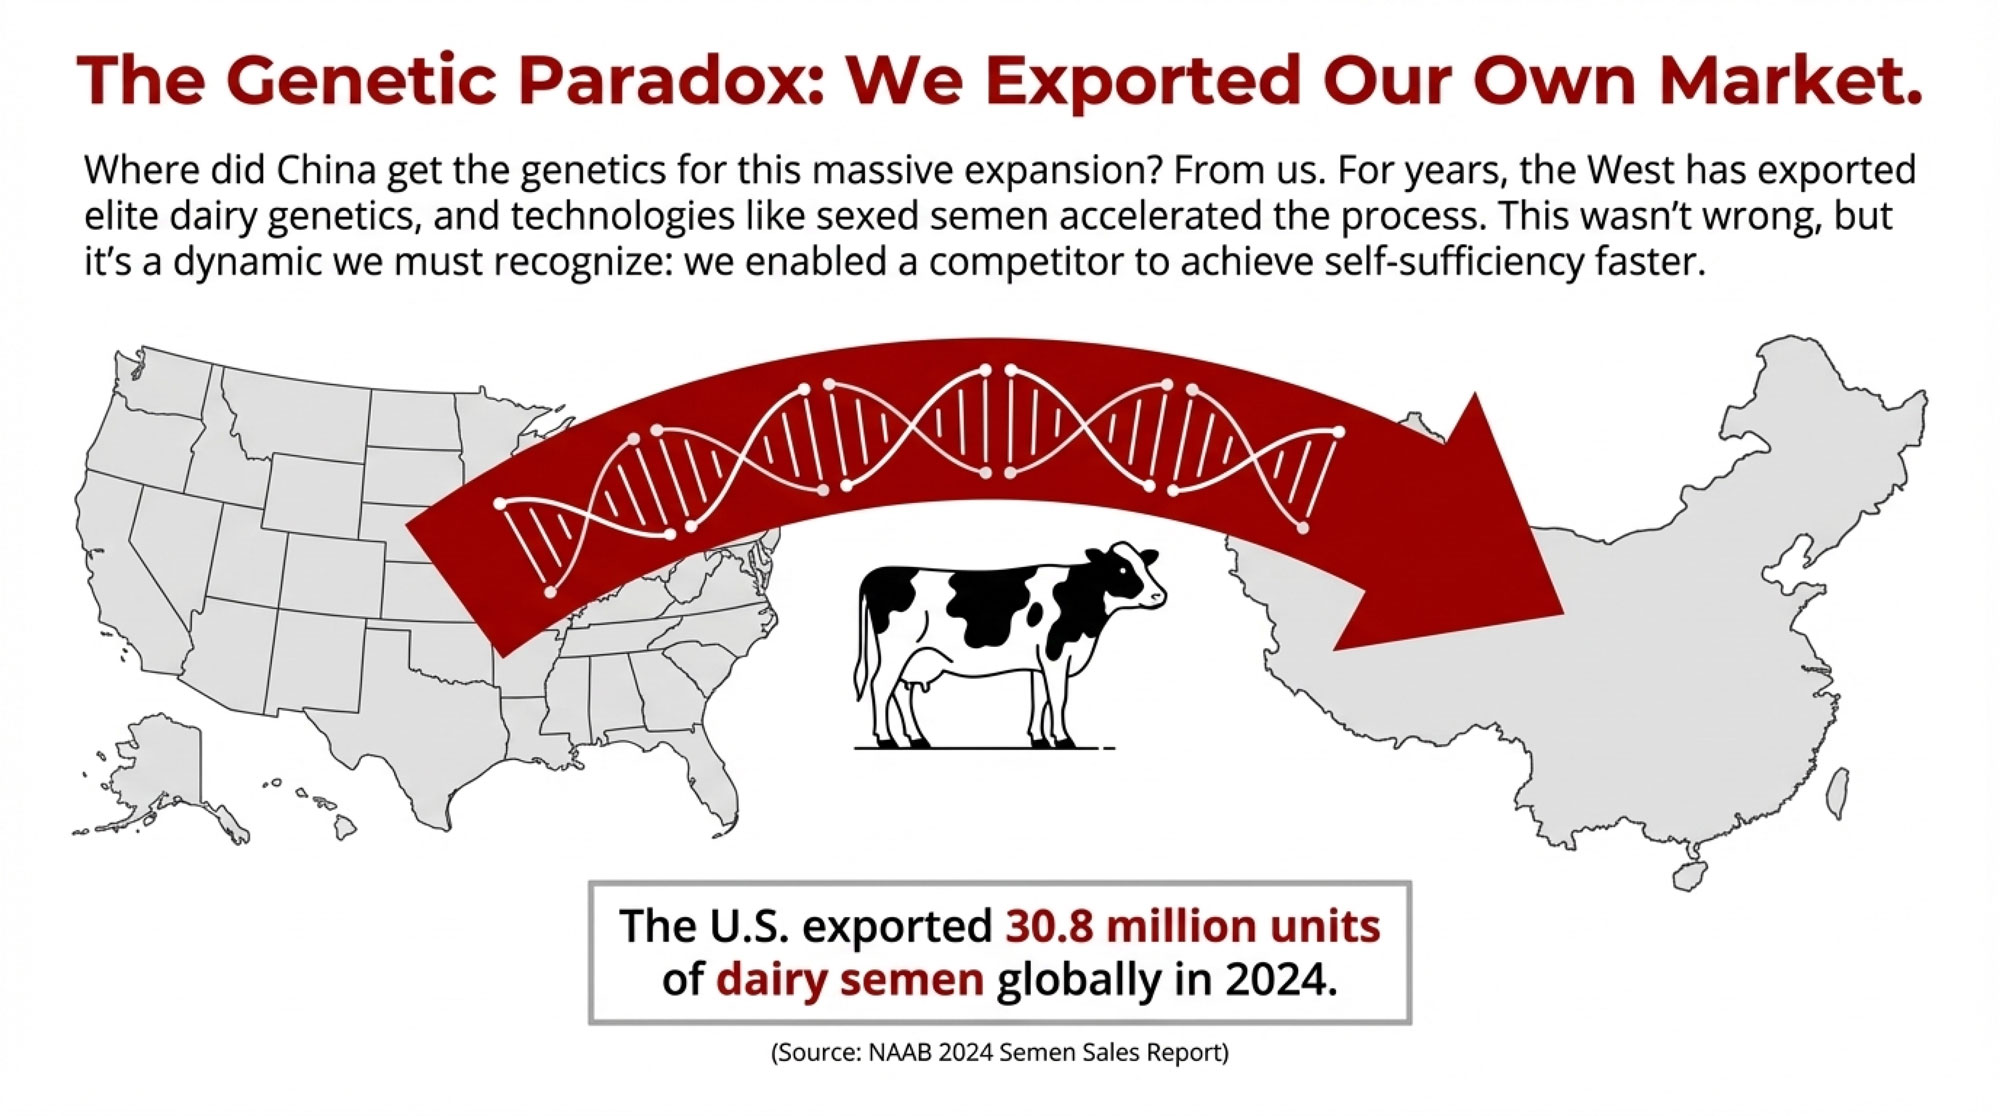
According to the NAAB 2024 Semen Sales Report, the U.S. exported 30.8 million units of dairy semen globally—up 1.6 million from 2023. China has historically been a top destination. Sexed semen technology accelerated the process considerably, allowing Chinese operations to rapidly multiply their female inventory using genetics that took Western breeders generations to develop.

This was normal commercial activity—nobody did anything wrong. But the dynamic is worth recognizing. The better our genetics got, the faster we enabled competitors to catch up.

The Southeast Asia Pivot

With China’s import appetite moderating, U.S. trade organizations are developing alternative markets. IDFA’s Michael Dykes notes these efforts promise improved access in growing Southeast Asian markets.

Current trade values show the scale challenge: Malaysia ~$118 million, Vietnam ~$127 million, Thailand ~$87 million in U.S. dairy sales according to USDA data. Growing markets, but building presence takes years.

“We’re excited about Southeast Asia, but we’re also realistic. Each country has different food safety standards, different labeling requirements. This isn’t switching customers—it’s building relationships from scratch.” — Wisconsin cheese exporter

New Zealand has been working these markets for decades with established relationships and geographic proximity. The Southeast Asia pivot is a real strategy—it’s also a multi-year project.

Processing Capacity: The Math That Hits Your Milk Check

Here’s where this gets personal for producers, even those who never think about exports.

According to IDFA’s October 2025 report, U.S. processors are investing more than $11 billion in new capacity across 19 states, with projects coming online between 2025 and early 2028. This investment assumed continued production growth and export demand.

Modern cheese plants generally need 85-95% utilization to hit economic targets. When volume drops, fixed costs per pound climb fast.

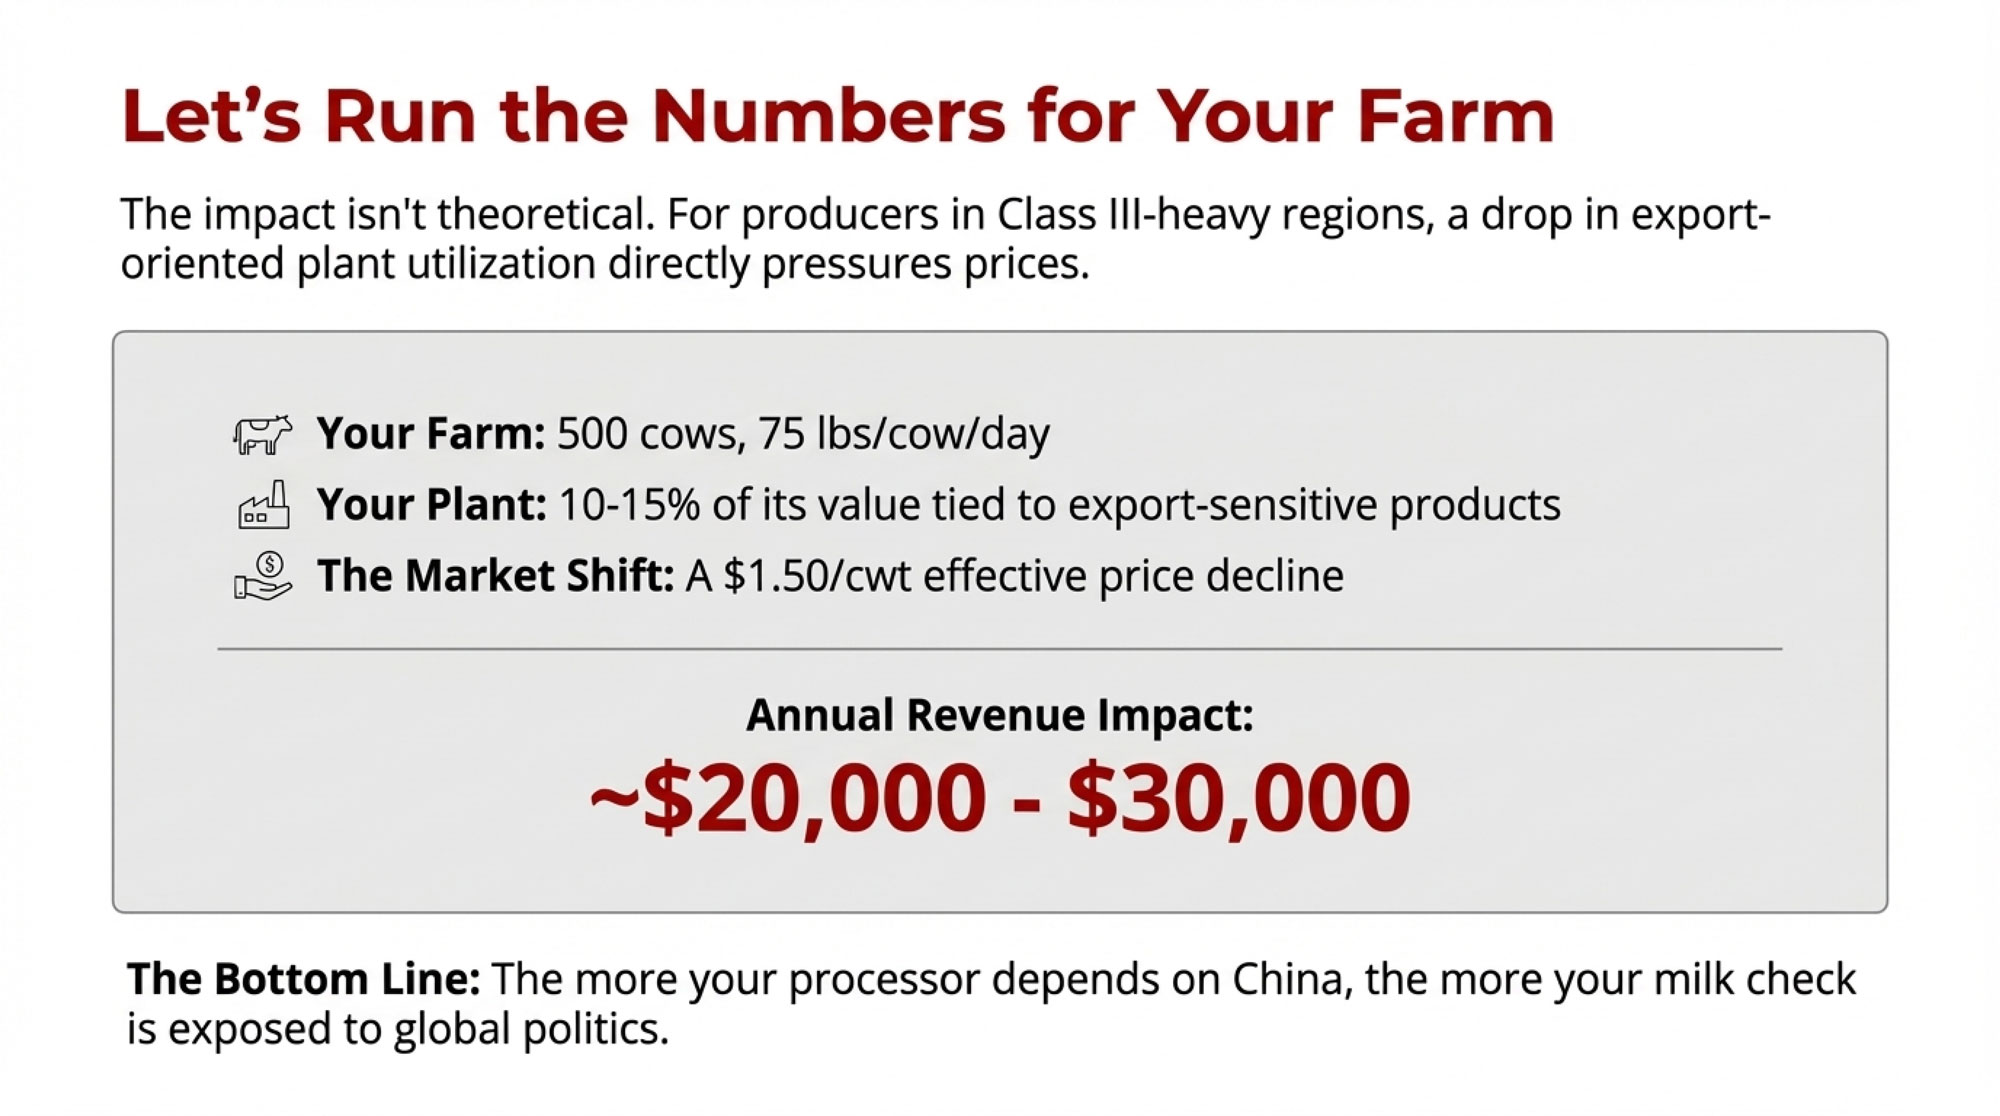
Let’s run some numbers. For a 500-cow dairy averaging 75 lbs/cow/day, you’re shipping roughly 13.7 million pounds annually. Now, not all of that is equally exposed to export market volatility—it depends on your plant’s product mix. But if 10-15% of your production value ties to export-sensitive products like whey going to China, a $1.50/cwt effective price decline on your total check translates to roughly $20,000-30,000 in annual revenue impact. For operations more heavily exposed, multiply accordingly.

Herd SizeAnnual Production (cwt)Revenue Loss @ $1.50/cwtRevenue Loss @ $2.50/cwt
250 cows68,438$102,657$171,095
500 cows136,875$205,313$342,188
750 cows205,313$307,969$513,282
1,000 cows273,750$410,625$684,375

Here’s a specific scenario: If you’re an Upper Midwest producer shipping to a plant that sends 40% of its whey to China, and Chinese buyers shift to duty-free New Zealand sources, your plant’s utilization could drop. Even if your milk still gets processed, reduced efficiency often shows up in basis adjustments, component premiums, or year-end patronage dividends.

For producers in Class III-heavy federal order regions—such as Wisconsin, Minnesota, and the Upper Midwest—these dynamics matter more. When export-oriented cheese plants face utilization challenges, it pressures Class III specifically.

5 Signs Your Co-op May Be Too Export-Dependent

  1. More than 30% of plant output goes to export markets (especially single-country concentration)
  2. Whey or lactose represents a significant revenue stream with heavy China exposure
  3. No active diversification into Southeast Asian or Mexican markets is underway
  4. Recent capital investments were justified primarily by “growing Asian demand.”
  5. Member communications emphasize export opportunities without discussing contingencies

If three or more apply, it’s time to ask harder questions at your next member meeting.

Warning SignRisk ThresholdQuestion to Ask Your Co-op
Export concentration>30% of output to export markets“What percentage of our plant’s production goes to export, and to which countries specifically?”
China-specific exposure>20% of whey/lactose revenue from China“How much of our whey revenue depends on Chinese buyers, and what’s our backup plan?”
Market diversification<3 active export regions“Are we building relationships in Southeast Asia and Mexico, or concentrated in East Asia?”
Capital investment rationale“Asian growth” as primary justification“Were recent expansions underwritten by export growth assumptions? What if those don’t materialize?”
Communication transparencyExport opportunities mentioned without contingencies“What’s our plan if China’s self-sufficiency push continues reducing import demand over the next 3-5 years?”

Practical Considerations for Your Operation

3 Questions to Ask Your Co-op Today

  1. Exposure: “What percentage of our plant’s output is tied to Chinese markets or other export-dependent products?”
  2. Diversification: “Do we have active sales relationships in Malaysia, Vietnam, or Mexico—or are we concentrated in East Asia?”
  3. Contingency: “What’s our plan if China’s self-sufficiency push continues reducing import demand?”

The breakeven question: At what export exposure does this tariff situation materially affect your milk check? Based on typical plant economics, producers shipping to facilities with export concentrations of 25-30% or more—particularly to China—face meaningful price risk if trade dynamics shift.

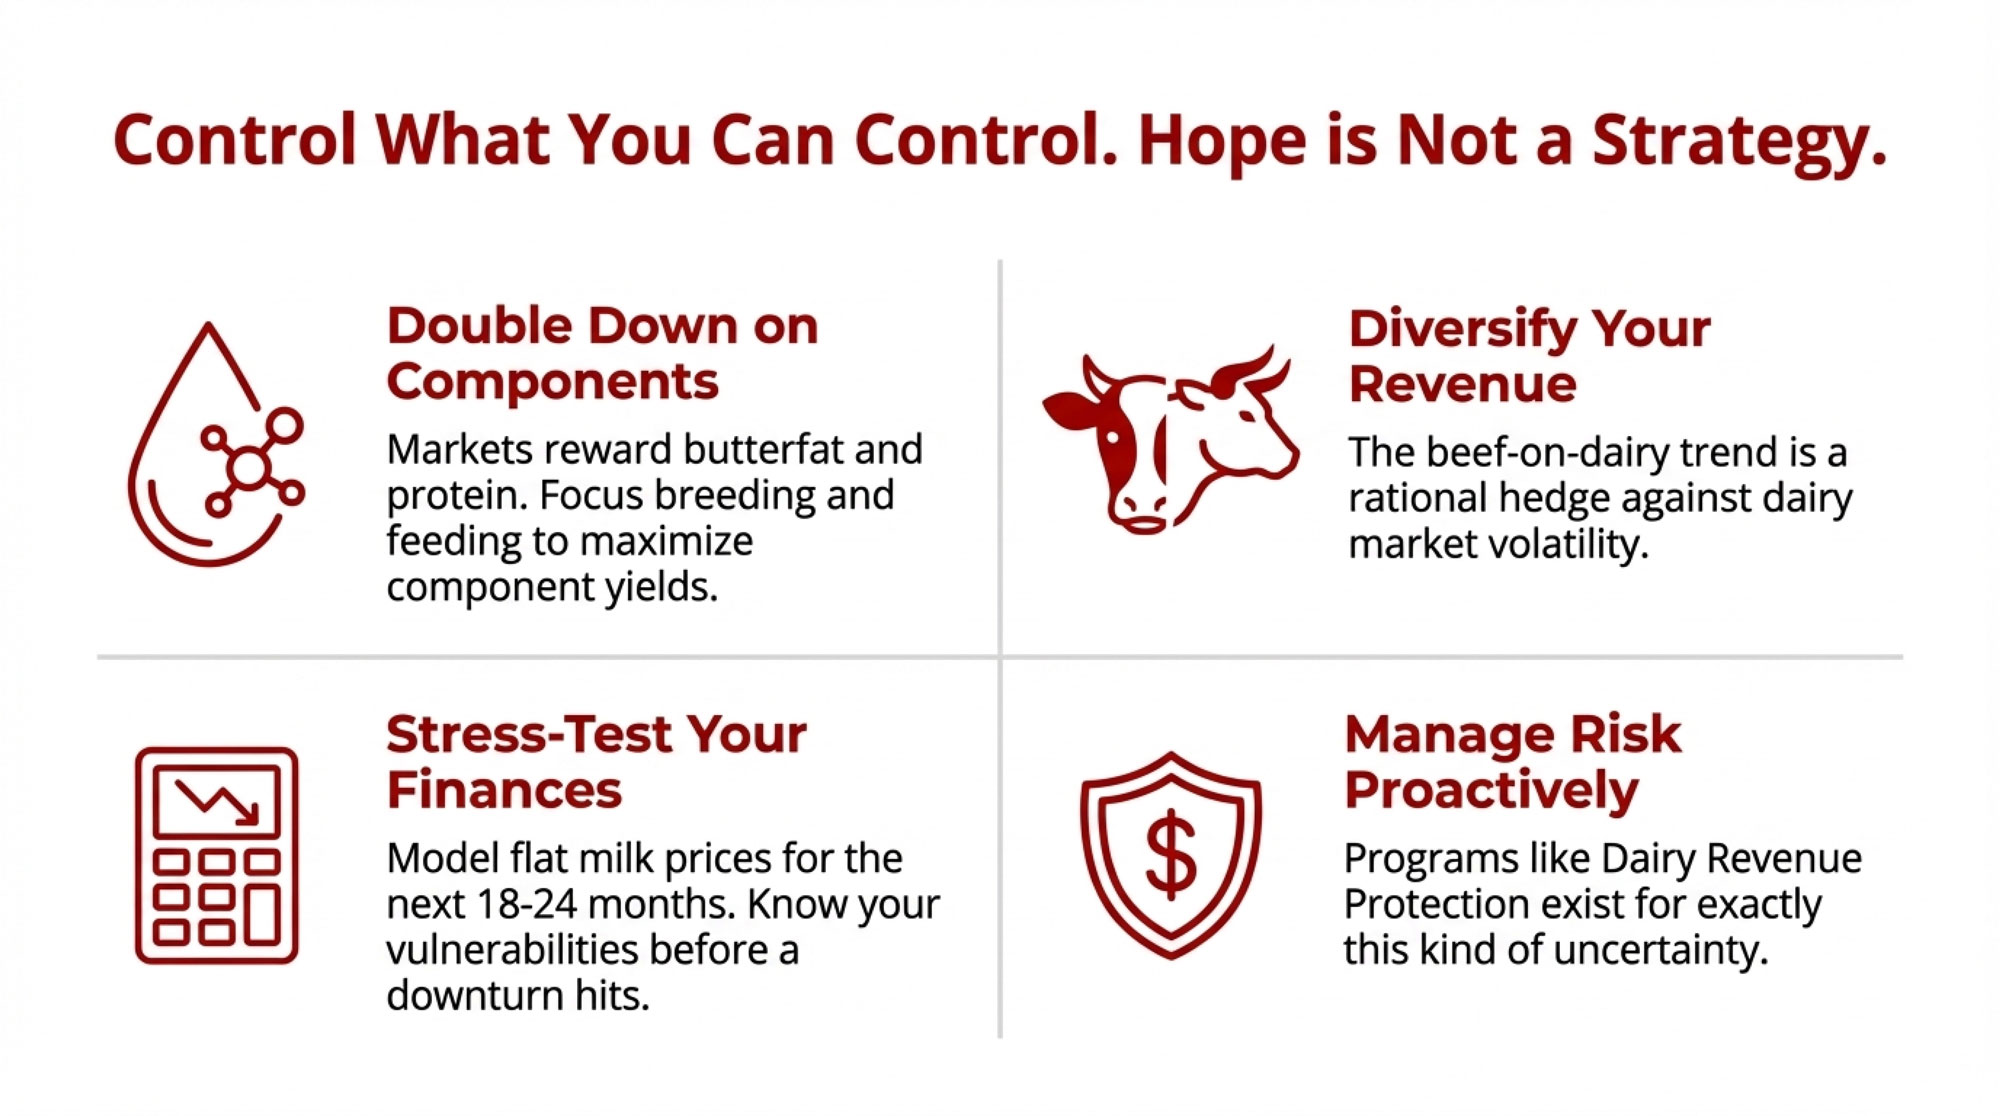
Component focus: Markets increasingly reward milk components over fluid volume. Breeding and feeding strategies that emphasize component density—managing your TMR for butterfat performance, making genetic selections that improve protein yields—can improve returns even when prices are flat.

Diversification strategies: The beef-on-dairy trend represents a rational response to moderating replacement heifer needs and provides revenue diversification independent of dairy market conditions.

Financial positioning: Planning for flat-to-modest milk prices provides a more stable foundation than relying on export-driven rallies. Programs like Dairy Revenue Protection exist precisely for this uncertainty.

The Labeling Dimension

China is establishing cheese naming standards, potentially aligning with European Geographical Indication protections. The EU is pursuing similar provisions throughout Southeast Asia.

The implication: American cheeses using names like Parmesan or Feta could face market access challenges regardless of tariffs. The long-term response involves building identity around distinctly American varieties—Wisconsin Original, California Dry Jack, and Vermont Creamery styles.

Your Next Moves

Final determinations are expected by February 2026. CNBC noted Beijing significantly reduced preliminary pork tariffs in final rulings, so flexibility remains possible. But regardless of how this dispute resolves, the underlying dynamics aren’t changing.

Here’s what to do now:

  1. Assess your exposure. Ask your co-op directly what percentage of plant output goes to export markets—especially China. If it’s above 25-30%, you have meaningful trade risk.
  2. Run your own numbers. Calculate what a $1.50-2.50/cwt Class III decline would mean for your operation annually. Know your vulnerability before it materializes.
  3. Evaluate your processor’s diversification. Are they actively building relationships in Southeast Asia and Mexico, or are they concentrated in markets facing structural headwinds?
  4. Double down on components. Regardless of trade outcomes, butterfat and protein premiums reward operational excellence. That’s within your control.
  5. Stress-test your finances. Model flat prices for 18-24 months. If that scenario creates problems, address leverage and cash reserves now while milk checks are decent.

The producers I see positioning themselves well are treating export markets as valuable but variable—additional revenue opportunity rather than baseline assumptions. They’re asking good questions and planning for multiple scenarios.

That’s the kind of thinking that builds durable farm businesses.

Key Takeaways:

  • New Zealand wins this one: Duty-free access plus 51% market share means Kiwi dairy—not American—captures displaced EU demand
  • Product mismatch limits upside: We export whey to China (95% of shipments); they’re tariffing specialty cheeses we don’t sell
  • The genetics paradox: China reached 43M tonnes domestic production using genetics we sold them—we enabled our own competition
  • Know your exposure number: If your co-op sends 25%+ of output to export markets, trade volatility hits your milk check directly
  • Control beats hope: Component premiums, operational efficiency, and beef-on-dairy diversification outperform waiting for export rallies

Complete references and supporting documentation are available upon request by contacting the editorial team at editor@thebullvine.com.

Learn More

Join the Revolution!

Join over 30,000 successful dairy professionals who rely on Bullvine Weekly for their competitive edge. Delivered directly to your inbox each week, our exclusive industry insights help you make smarter decisions while saving precious hours every week. Never miss critical updates on milk production trends, breakthrough technologies, and profit-boosting strategies that top producers are already implementing. Subscribe now to transform your dairy operation’s efficiency and profitability—your future success is just one click away.

NewsSubscribe
First
Last
Consent

USMCA 2026: The $200M Question – Why Only 42% of U.S. Dairy Access to Canada Gets Used

USMCA gave us access to dairy markets in Canada. We’re using 42% of it. New Zealand just showed it can be fixed. The 2026 review is our window.

EXECUTIVE SUMMARY: USMCA promised U.S. dairy approximately $200 million in new annual access to Canada’s market. We’re using less than half. TRQ fill rates averaged just 42% in 2022/23, with Canada’s allocation system still favoring domestic processors—despite two dispute panels that exposed loopholes in the agreement’s original language. There’s reason for cautious optimism, though: New Zealand just pushed Canada past cosmetic adjustments through CPTPP, securing $157 million in annual export value. The 2026 USMCA review, combined with the ITC’s nonfat solids report due March 2026, gives U.S. dairy its clearest window to turn paper access into real orders. With consolidation accelerating—Wisconsin and Minnesota each lost 7.4% of their dairy farms in 2023—what happens in this review will ripple from trade policy down to your milk check. Here’s what happened, what’s possible, and what producers should watch as 2026 approaches.

You know how it goes. You’re out in the barn at 4 a.m., making sure the fresh cows are settling in, keeping an eye on that heifer that’s been off her feed. And somewhere in the back of your mind, you’re wondering what decisions being made in Ottawa or Washington might mean for next month’s milk check.

Trade deals get signed, politicians shake hands, there’s talk about “wins”—and then we wait to see if any of it actually turns into orders that need our milk.

Here’s what’s interesting about USMCA when you dig into the numbers. The University of Wisconsin Extension put out a detailed review earlier this year that adds up all the dairy tariff-rate quotas. They conclude that once everything’s fully phased in, U.S. exporters can ship up to about 3.6% of Canada’s annual dairy consumption into that market tariff-free. We’re talking milk, cream, cheese, butter, yogurt, powders—the works. Canadian trade law firms looking at the same schedules land on essentially that same number.

Now, Canada’s domestic dairy market runs around $17 billion, according to Dairy Reporter’s coverage earlier this year. So that 3.6% works out to roughly $200 million in potential new annual access for American dairy, based on Wisconsin Extension’s analysis.

And here’s the thing—total U.S. dairy exports to Canada have already climbed to an estimated $877 million in 2024, up from around $525 million back in 2021. That’s 67% growth in three years, which isn’t nothing.

But—and this is important—there’s a real difference between access on paper and orders that actually show up at the plant. That gap is where this whole story gets complicated, and honestly, where it starts to matter most for your operation.

USMCA Dairy at a Glance

  • Market access: 3.6% of Canada’s dairy market (~$200M in new annual access)
  • Total U.S. exports to Canada (2024): $877 million (up 67% since 2021)
  • TRQ fill rate (2022/23): Just 42% average; 9 of 14 quotas below 50%
  • Key date: ITC nonfat solids report due March 23, 2026
  • U.S. farm losses: 15,000+ dairies gone since 2017

The Spring That Changed Everything

You probably remember hearing about this, or maybe you lived through it yourself. Spring of 2017, when Canada’s policy changes stopped being something you heard about at meetings and started showing up in mailboxes.

Grassland Dairy sent letters to dozens of producers in Wisconsin and neighboring states saying their milk wouldn’t be picked up after May 1. Wisconsin Public Radio reported at the time that Grassland officially ended contracts with around 58 Wisconsin farms after giving them about a month’s notice. The Wisconsin Department of Agriculture, Trade, and Consumer Protection confirmed those numbers.

Grassland’s leadership told reporters the trigger was Canada’s new Class 7 pricing for ultra-filtered milk, which suddenly made Canadian-sourced protein ingredients cheaper and essentially squeezed out U.S. exports overnight.

What happened next showed something about our industry, though. State officials and dairy groups moved fast to line up alternatives. Dairy Farmers of America signed contracts with a significant number of the affected farms, and the Dairy Business Milk Marketing Cooperative helped coordinate other placements. By late spring, all but two of those Wisconsin herds had found new buyers—though many landed on shorter-term or trial contracts, which isn’t exactly the same as having that steady relationship you’d built over years.

I’ve spoken with producers who lived through that period, and many still describe it as a turning point. The frustration runs deep. You can do everything right in the barn—strong butterfat levels, solid fresh cow management, healthy transition periods—and then a milk pricing class in another country decides whether the truck shows up.

Stories like that are a big part of why dairy ended up so prominent in the USMCA negotiations.

What USMCA Actually Put on the Table

So what did the agreement really change?

First, Canada agreed to eliminate its Class 7 milk category—and, in some provinces, the related Class 6—and fold those volumes back into the existing pricing system. Analysis points out that this was specifically designed to prevent another situation like the ultra-filtered milk mess that had undercut U.S. exports.

Second, USMCA created new dairy tariff-rate quotas specifically for American products. Wisconsin Extension’s 2025 analysis goes line by line through the agreement and concludes that when all those TRQs are phased in over roughly six years, they add up to about 3.5–3.6% of Canada’s dairy market reserved for U.S. exporters. That covers milk, cream, cheese, butter, skim milk powder, yogurt, whey, and other products.

Now, most of us aren’t sitting around with calculators figuring out percentages of another country’s market. But here’s how I think about it: if Canada’s dairy sector runs around $17 billion domestically, and the agreement carved out roughly 3.6% for U.S. access, we’re talking about approximately $200 million a year in potential new trade value if it’s actually used. That’s real money for the processors and co-ops that handle our milk.

Canadian farmers noticed too. Dairy Farmers of Canada president Pierre Lampron called the signing of USMCA “a dark day in the history of dairy farming in Canada.” DFC’s statement said that, taken together, CETA, CPTPP, and USMCA had opened approximately 18% of Canada’s domestic dairy market to foreign competition, which they argued would destabilize supply management.

So from the U.S. side, USMCA’s dairy chapter looked like a major opportunity. From the Canadian side, it felt like one more cut into a carefully managed system. Both reactions are rooted in the same numbers—just different perspectives on what those numbers mean.

The Quota Puzzle: Access vs. Gatekeeping

Here’s where things get frustrating, and honestly, where the agreement shows its limitations.

On paper, USMCA’s dairy TRQs are pretty clear—they spell out how many tonnes of each product category can come into Canada each year at low or zero tariffs, and how those volumes grow over time. In practice, what matters just as much is who gets those quotas inside Canada.

Canada has the right to design its own TRQ allocation system, provided it complies with the agreement’s general rules. In its first go-round, Global Affairs Canada set up allocation rules that reserved a significant share of many dairy quotas for Canadian processors and “further processors.”

You can probably see where this is going. U.S. negotiators and dairy groups argued that this effectively put much of the access in the hands of companies that already had every reason to run Canadian milk through their plants, leaving less opportunity for importers, retailers, or food-service companies that actually wanted to bring in American product.

The United States requested a USMCA dispute panel. In early 2022, that panel released a report agreeing with the U.S. and Canada’s practice of reserving quota pools exclusively for processors, which conflicted with Article 3.A.2.11(b), which says countries shouldn’t limit access to allocations to processors. Hoard’s Dairyman described that panel result as an important step toward making the dairy quotas actually usable.

Canada rewrote its allocation policies. They removed the explicit processor-only set-asides and introduced “neutral” eligibility criteria based on market share and dairy trade activity. On paper, that was a shift.

In reality—and this is the part that still bothers many people—since large processors already dominate the market, they continued to receive most of the quota anyway.

The U.S. wasn’t satisfied and requested another panel in late 2022. This time, the second panel concluded that Canada’s usage of market-share calculations, while still favoring processors, didn’t technically violate the specific text of USMCA. It exposed a loophole in the original drafting of the agreement.

USTR Katherine Tai said she was “very disappointed by the findings,” and U.S. dairy organizations called the ruling a dangerous precedent.

So you end up with this real gap between a legal win and a commercial win. The first panel forced Canada to drop explicit processor-only pools, which mattered. The second panel showed that even with those pools gone, Canada can design rules that keep most of the quota in processor hands—and unless the agreement’s language is tightened, there’s not much the dispute system can do about it.

What’s the practical result? The International Dairy Foods Association reported that the average tariff fill rate was only 42% across all 2022/23 quotas, with 9 of the 14 TRQs falling below half the negotiated value. That’s a lot of access sitting unused.

The Protein Side: Export Caps and What’s Coming

Alongside TRQs into Canada, USMCA also tried to address something many of us worry about—the impact of surplus skim solids and proteins flooding world markets.

Under the agreement, Canada accepted limits on exports of skim milk powder and certain milk protein products. Reports breakdown notes that Canada agreed to cap combined exports of skim milk powder and milk protein concentrates at 55,000 tonnes in the first year and 35,000 tonnes in the second, with exports above those thresholds facing hefty charges.

For infant formula, the limits start at 13,333 tonnes in year one and rise to 40,000 tonnes in later years. The idea is to keep a supply-managed system from dumping excess solids into global markets at prices that drag down everyone’s Class IV.

In the early years after USMCA took effect, Canadian export volumes stayed under those caps—at least on paper. But Wisconsin Extension’s 2025 review points out that some processed food and blend categories containing milk solids have grown. U.S. analysts have raised questions about whether some of those flows are consistent with the spirit of USMCA’s export rules, even if they technically fit within defined product categories.

Why the ITC Report Matters

To move beyond questions and into actual evidence, USTR asked the U.S. International Trade Commission to conduct a deep dive. In May 2025, the ITC announced a new investigation into competitive conditions for nonfat milk solids covering 2020–2024. The report is due to USTR by March 23, 2026.

This is worth paying attention to. In July 2025, senior staff from the U.S. Dairy Export Council and the National Milk Producers Federation testified before the ITC, outlining how they believe foreign export policies—including Canada’s—shape global nonfat solids markets.

By the time USMCA’s formal review gets going, negotiators won’t just be leaning on anecdotes. They’ll have a thorough, independent dataset on how nonfat solids have actually moved under current rules.

What New Zealand Just Demonstrated

Sometimes, to see what’s actually possible, it helps to watch how another dairy-heavy country handled the same trading partner.

New Zealand brought a dispute under CPTPP over Canada’s dairy TRQ administration. They argued Canada’s allocation system was so restrictive that it effectively blocked much of the access promised on paper. A CPTPP panel sided with New Zealand, finding that several elements of Canada’s system breached its obligations.

At first, Canada made minimal adjustments. New Zealand officials—including Trade and Investment Minister Todd McClay—publicly said those changes didn’t go far enough and signaled they were prepared to keep pressing, including toward potential retaliatory steps.

That persistence paid off.

In July 2025, New Zealand announced it had reached a settlement with Canada. The Ministry of Foreign Affairs and Trade said Canada is committed to modify how it manages dairy TRQs, including how quota is allocated and reallocated when it goes unused. McClay stated that the agreement would deliver “up to $157 million per year in export value” for New Zealand’s dairy industry.

Cheese Reporter covered the announcement, noting that Canadian officials described the changes as “technical policy changes” that maintain the core of supply management. The modifications to Canada’s TRQ process will be published on October 1, 2025, for implementation with the 2026 calendar year quotas.

What jumps out to me in that story is the combination: clear panel rulings, solid data, and a government willing to push hard enough to get beyond cosmetic tweaks. It shows Canada can and will move further on quota administration when a trading partner builds a strong case and sticks with it.

For U.S. dairy, that’s an encouraging precedent heading into the 2026 review.

Why 2026 Is the Inflection Point

USMCA includes a formal six-year joint review. The three countries agreed to return to the table to assess how the agreement is working, where it’s falling short, and what needs updating.

That review isn’t limited to dairy—it’ll likely touch autos, labor provisions, dispute mechanisms, and supply-chain concerns tied to China.

On dairy specifically, U.S. groups have already sketched out their priorities. Looking at policy statements from the National Milk Producers Federation, U.S. Dairy Export Council, and regional organizations, a few themes keep coming up:

  • TRQ allocation rules that don’t effectively ring-fence most access for Canadian processors
  • Stronger “use-it-or-lose-it” provisions so unused quota gets reallocated in time, actually to be used
  • Clearer language on export disciplines so products that act like skim milk powder can’t bypass caps by shifting tariff codes
  • More responsive tools for resolving dairy disputes before they drag on for years

At the same time, dairy has to compete with other sectors for attention. Trade specialists note that autos and labor enforcement could dominate parts of the review.

That’s where the ITC report and farm-state congressional engagement become critical. Brownfield has reported that dairy-state lawmakers are asking for clear resolutions to cross-border disputes and signaling that they want USMCA’s renewal tied to stronger enforcement.

The Consolidation Reality Behind All This

While policy discussions play out in hearing rooms, the structure of our own industry keeps changing in ways you can see when driving from one township to the next.

USDA’s 2022 Census of Agriculture shows that U.S. farms with milk sales fell from 39,303 in 2017 to 24,082 in 2022—a loss of over 15,000 dairies in five years. Dairy Reporter’s analysis of that data, drawing on Rabobank research, notes that “almost 12,000” of those losses came from smaller operations.

Over that same period, total milk output grew, and the milking herd held near 9.4 million cows. The cows moved; they didn’t vanish.

Rabobank estimates that farms with more than 1,000 cows now produce about 67–68% of U.S. milk, up from around 60% in 2017. Reports essentially the same number. Cheese Reporter’s summary of the Rabobank work notes that the very largest operations—those with more than 2,500 cows—are a small slice of all dairies but produce close to half the milk.

In Wisconsin, the story is obvious. DATCP data shows the state lost 455 dairy farms in 2023, a 7.4% drop in licensed herds, while cow numbers and total production stayed roughly steady. That left Wisconsin with 5,895 dairies at the start of 2024.

Minnesota lost 146 dairies in the same period—also about 7.4% of its dairy farm base. Many of those exits were smaller family herds under 200 cows.

USDA’s Economic Research Service has tracked this “fewer but bigger” trend for years. Their research shows that economies of scale in feed handling, housing, and labor help explain why larger operations often have lower costs per hundredweight. Rabobank’s analysis reaches a similar conclusion and notes that newer technologies—from milking systems to data-driven management—tend to favor bigger herds that can spread the costs.

In many Midwest and Northeast communities, you can see it in the farm auction ads and the empty milk houses. In Western states, you see it in new freestall and dry-lot systems being built near export-oriented plants.

Trade policy isn’t the only driver—not by a long shot—but it’s part of the environment we’re all trying to navigate.

How It Looks from the Canadian Side

From our side of the border, Canadian supply management can look like a wall. From their side, the story has more layers.

Under supply management, Canada uses national and provincial quotas to align production with domestic demand, sets target prices through cost-of-production formulas, and relies on high over-quota tariffs—up to 300% —to limit imports, according to Dairy Reporter.

Dairy Global’s discussion of the system notes that it has historically provided more stable milk cheques than U.S. producers typically see, and it’s often credited with helping keep dairy herds across multiple provinces rather than allowing rapid regional hollowing out.

But Canadian economists have been pointing to serious weaknesses within that system.

Sylvain Charlebois, professor and director of the Agri-Food Analytics Lab at Dalhousie University, has written that Quebec now produces close to 40% of Canada’s milk even though its share of the population is just over 20%. Roughly 90% of the country’s dairy farms are concentrated in a small number of provinces.

In a column earlier this year, he warned that if current trends continue, Canada could lose nearly half of its remaining dairy farms by 2030—even with supply management—because high quota costs and structural pressures make it harder for smaller and younger producers to enter or stay in.

On the other side, Dairy Farmers of Canada and provincial organizations stress that supply management has shielded their farmers from the worst price collapses. It’s also allowed the federal government to design compensation programs tied directly to trade concessions.

Government of Canada announcements confirm that total compensation measures to dairy farmers for market access granted under CETA, CPTPP, and USMCA amount to $3.2 billion CAD—roughly $330,000 per dairy farm, according to USDA Foreign Agricultural Service analysis. DFC has argued these payments, combined with controlled borders, are essential to preserving viable dairy farms in rural communities.

As Canada heads into the 2026 review, its negotiators are trying to protect a system many producers view as vital, while also facing internal voices calling for modernization. That context matters when we think about how far they can realistically move on TRQs and export rules.

What This Means on Your Farm

From a practical standpoint, here are three things worth keeping in mind:

  • USMCA created real, measurable access—about 3.6% of Canada’s dairy market, worth approximately $200 million annually in new opportunities—but TRQ design has limited how fully that access gets used. Fill rates averaged just 42% in 2022/23.
  • U.S. dairy is consolidating fast—over 15,000 farms gone since 2017, with large herds now producing most of the milk.
  • Wisconsin and Minnesota’s 7.4% herd losses in 2023 show how intense the pressure remains on small and mid-size dairies, even when total production holds steady.

Smaller Herds (Under ~200 Cows)

In many Midwest and Northeast operations of this size, the daily focus is on keeping feed costs in line, managing labor, and getting fresh cows through the transition period without problems. You’re working on butterfat performance, trying to keep cows out of the hospital pen, because every health issue shows up on the milk check.

For herds this size, trade policy usually shows up as background volatility in the pay price rather than something you feel directly every week. A better-functioning USMCA can’t fix tight local basis or labor headaches, but it can help support more stable demand for cheese, powders, and butterfat—which, over time, makes planning a little easier.

It’s often helpful for operations this size to ask your buyer or co-op how much of their volume ends up in export channels, including Canada. And risk-management tools that fit your scale—such as Dairy Margin Coverage and simple forward contracts through your co-op—can help cushion the impact when global markets shift.

Mid-Size Herds (Roughly 200–800 Cows)

In Wisconsin or New York, a 400-cow freestall herd might ship somewhere around 9 million pounds of milk per year. A $0.50 per hundredweight swing in average price adds or subtracts roughly $45,000 annually; a $1.00 swing is about $90,000.

That’s the kind of money that can decide whether you move ahead with a parlor upgrade, improve transition-cow facilities, or keep nursing along older infrastructure.

Conversations I’ve had with mid-size producers across the Northeast and Upper Midwest often come back to a similar theme—they’re not big enough to ride out a bad year on volume alone, and not small enough to just tighten the belt and wait it out. A $0.75 swing per hundredweight can mean the difference between reinvesting and treading water.

For these farms, the way USMCA performs becomes a meaningful piece of the margin puzzle. Worth considering: sitting down with your lender or financial adviser and running a couple of “what if” scenarios for pay price over the next five years, especially around the 2026 review window.

And talking with your processor or co-op about how they’re currently using USMCA access and where they see Canada fitting into long-term plans.

Large Herds (800+ Cows)

In Idaho, California, the Texas Panhandle, and eastern New Mexico—large freestall and dry lot systems often ship to plants that rely heavily on exports. USDEC data and industry coverage indicate that these plants depend on markets such as Mexico, Canada, and various Asian and Middle Eastern countries to balance their solids.

Operations at this scale already treat trade policy as a central piece of their risk map, alongside water, labor, and environmental regulations.

The sentiment I hear from managers running these larger operations is that they watch USMCA the way they watch their water supply. It’s not the only thing that matters, but when it moves, it affects everything downstream.

For large herds, a stronger USMCA dairy chapter can reduce uncertainty about where incremental solids can go, encourage processors to invest in new dryers and cheese capacity that need dependable outlets, and lower the risk that policy shocks derail expansion plans.

It won’t change the need for good cow comfort or people management, but it does affect how risky that next big capital project feels.

What to Watch as 2026 Approaches

With everything else on your plate, here are three signals worth tracking—plus a few questions you can take straight to your next co-op or lender meeting.

The ITC’s Nonfat Solids Report

When the ITC releases its report, look at whether it clearly documents how foreign support and export practices—including Canada’s—are influencing nonfat solids markets.

Does it identify specific product categories that appear to be carrying milk solids in ways that don’t match USMCA’s intent? Does it quantify competitive effects on U.S. Class IV and powder markets?

The more concrete and specific it is, the more leverage U.S. negotiators will have.

Dairy-State Lawmakers’ Engagement

Brownfield and other outlets are already reporting that dairy-state legislators are asking for stronger enforcement on Canadian TRQs and export caps.

Watch for formal hearings or bipartisan letters tying USMCA’s long-term renewal to measurable improvements in dairy access.

When elected officials start using the same numbers you see in farm papers—like the 7.4% herd losses in Wisconsin and Minnesota—that’s a sign dairy is on their radar.

How Canadian Officials Frame the Review

Canadian ministers and Dairy Farmers of Canada have typically described past trade-driven dairy changes as “technical” or “administrative” adjustments while insisting supply management’s core remains untouched.

It’ll be telling to see whether they talk about the 2026 review purely as housekeeping, or whether you start hearing language about making quotas “function commercially” for trading partners—similar to the framing that emerged after the New Zealand settlement.

Questions to Ask Your Processor

To bring this closer to where your own milk truck turns in, here are three questions worth asking your plant or co-op:

  1. How important is Canada in your current and planned export mix compared to Mexico and Asia?
  2. Are you using USMCA dairy quotas now? If not, what would need to change—on TRQ rules or export caps—to make them worth pursuing?
  3. If USMCA’s dairy chapter gets stronger or weaker in 2026, how would that change your investment plans over the next five to ten years?

Their answers will tell you a lot about what the review might mean for your milk check.

The Bottom Line

When you step back from all the numbers and panel rulings, the picture is reasonably clear.

USMCA did open a real, quantified slice of Canada’s dairy market—around 3.6%, worth approximately $200 million in new annual access—to U.S. exporters and forced the elimination of Class 7. Total U.S. dairy exports to Canada have grown to an estimated $877 million in 2024, up 67% from 2021. That’s genuine progress.

The first USMCA panel showed that Canada’s original processor-heavy allocation wasn’t acceptable under the agreement. The second panel showed the limits of what legal text alone can achieve when the specific wording leaves loopholes.

New Zealand’s CPTPP experience demonstrated that a combination of solid evidence, favorable rulings, and persistent follow-through can push Canada into changes with real commercial value—not just cosmetic adjustments.

At the same time, consolidation on both sides of the border is a reality, not a forecast. U.S. data show over 15,000 dairies gone since 2017, with most milk now coming from herds over 1,000 cows. Wisconsin and Minnesota’s 7.4% herd losses in 2023 are just one sharp snapshot.

In Canada, economists like Sylvain Charlebois are warning they could lose nearly half their remaining dairy farms by 2030 if nothing changes—even under supply management.

The honest takeaway is this: USMCA isn’t going to decide, all by itself, whether you milk cows next year. That still comes down to your forage program, butterfat performance, fresh cow management, your debt load, your labor situation, and the people around your kitchen table.

What this agreement can do—especially if the 2026 review delivers targeted improvements—is narrow the range of bad surprises. It can make it less likely you wake up to another shock like those Grassland letters, or find that the access that looked good in a press release never made it past the quota gatekeepers.

In a business where we’re already juggling weather, feed, labor, and regulations, having one more piece of the puzzle behave a bit more predictably is worth paying attention to.

And as many of us have seen over the years, when producers speak up—to co-ops, to farm organizations, to lawmakers—it does shape how these agreements evolve. As 2026 gets closer, it’s not a bad time to think about what you’d like this deal to do for the people who actually care for the cows, and to make sure those voices are heard.

KEY TAKEAWAYS 

  • The Access Gap: USMCA promised U.S. dairy $200 million in new annual access to Canada. Fill rates average just 42%—more than half goes unused because of how Canada allocates quota to domestic processors
  • The Enforcement Limit: The first dispute panel ruled in our favor. The second exposed a loophole: Canada can design allocation rules that favor processors without technically violating USMCA’s language
  • New Zealand’s Playbook: Their CPTPP settlement forced Canada past cosmetic fixes, securing $157 million in annual export value. Persistent, evidence-backed pressure works
  • The 2026 Window: The formal USMCA review and the ITC’s nonfat solids report (due March 2026) give U.S. dairy its clearest shot at turning paper access into real orders
  • Your Move: Ask your processor about their Canada strategy. Run price scenarios with your lender around the 2026 timeline. Make sure dairy-state lawmakers hear from producers—not just lobbyists

Complete references and supporting documentation are available upon request by contacting the editorial team at editor@thebullvine.com.

Learn More:

Join the Revolution!

Join over 30,000 successful dairy professionals who rely on Bullvine Weekly for their competitive edge. Delivered directly to your inbox each week, our exclusive industry insights help you make smarter decisions while saving precious hours every week. Never miss critical updates on milk production trends, breakthrough technologies, and profit-boosting strategies that top producers are already implementing. Subscribe now to transform your dairy operation’s efficiency and profitability—your future success is just one click away.

NewsSubscribe
First
Last
Consent

Decode Mexico’s Dairy Protectionism: Your Export Strategy Survival Guide

Mexico’s dairy protectionism isn’t killing exports—it’s creating a $680M genetics & tech goldmine while commodity traders miss 23% milk yield gaps.

Executive Summary: While everyone’s panicking about Mexico’s $4.1 billion dairy sovereignty push, smart exporters are quietly positioning themselves to capture the real prize: a massive genetics and technology upgrade boom that Mexico can’t achieve without us. Mexico’s ambitious goal to jump from 13.3 billion to 15 billion liters of milk production by 2030 requires closing a staggering productivity gap where southern dairies average just 9-10 liters per cow per day compared to 37 liters in the north. Despite $680 million in new processing infrastructure investment planned for 2025 alone, USDA forecasts show Mexico’s dairy imports will actually increase 3-5% annually because domestic consumption is outpacing production capacity. The smoking gun? Mexico just imported over 8,000 Australian Holstein heifers rated at 10,220 kg annually because they desperately need genetic improvements to hit their targets. While commodity exporters worry about losing the $2.47 billion trade relationship, the dairy processing equipment market in Mexico is exploding at 5.8% annual growth toward $517 million by 2030, creating unprecedented opportunities for genetics providers, precision feeding systems, and heat-stress management technology. Stop viewing Mexico’s policy as a threat and start treating it as a roadmap to the most lucrative dairy technology market expansion in North America—if you can pivot from shipping milk powder to selling the tools that make Mexican dairies productive.

Key Strategic Takeaways

  • Genetics Opportunity Explosion: Mexico’s productivity gap represents a 180-280% improvement potential in milk yield through elite genetics, with Australian Holstein imports proving they’ll pay premium prices for 10,220 kg/year genetics versus current averages—position your genomic testing and sexed semen programs now for guaranteed ROI
  • Technology Infrastructure Boom: The $680 million processing plant investment in 2025 creates immediate demand for precision feeding systems, automated milking technology, and heat-stress management solutions in arid dairy regions where productivity drops 15-25% during peak temperatures
  • Water Efficiency Premium Market: Northern Mexican dairy states face critical water scarcity constraints limiting expansion—water conservation systems and drought-resistant forage genetics command 20-30% price premiums in these markets while improving feed conversion ratios by 12-18%
  • Partnership Strategy Advantage: Mexico’s dependence on imports for 90% of skim milk powder consumption creates consulting opportunities worth $50-75 per cow annually for producers implementing complete productivity solutions rather than just selling individual products
  • Tariff Risk Hedging: With potential 25% tariff threats looming, diversifying from commodity exports to high-value genetics and technology services provides 40-60% better profit margins while building tariff-resistant revenue streams through essential production inputs
dairy export strategy, Mexico dairy market, dairy genetics ROI, precision dairy technology, dairy trade opportunities

Mexico’s march toward dairy self-sufficiency isn’t about food security—it’s about rewriting the rules of North American dairy trade, and the ripple effects will hit every operation from Wisconsin to Alberta.

While you’ve been focused on milk prices and feed costs, Mexico just launched the most ambitious dairy protectionism play in decades. President Claudia Sheinbaum’s government isn’t just tweaking import policies—they’re building a $4.1 billion fortress around their domestic dairy industry. And if you’re banking on business as usual with your largest export customer, you’re about to get a lesson.

Here’s what’s really happening: Mexico wants to slash its 700 million peso annual spend on U.S. skim milk powder and replace it with homegrown production. They aim to increase domestic milk production from 13.3 billion liters to 15 billion liters by 2030. That’s not just ambitious—it’s a direct challenge to the $2.4 billion U.S. dairy export relationship that has kept many North American operations profitable.

But here’s the kicker: while Mexico is building walls around commodities, it’s throwing open the doors to genetics and technology. Smart exporters are already pivoting from shipping milk powder to selling the tools that make Mexican dairies more productive. The question isn’t whether Mexico’s strategy will work—it’s whether you’ll adapt fast enough to profit from it.

The Mechanics of Mexico’s Dairy Fortress

Let’s cut through the political rhetoric and examine what Mexico’s actually doing. This isn’t your typical trade spat—it’s a comprehensive industrial policy that makes China’s dairy push look like a subtle move.

The Carrot: Guaranteed Profits for Mexican Producers

Mexico’s state-owned Segalmex is offering guaranteed milk prices of MXN 11.50 per liter to small and medium-sized producers. That’s a 40% jump from the MX$8.20 they were getting in 2019. Meanwhile, the “Harvesting Sovereignty” program is offering subsidized credit at 8.5% interest rates, along with free fertilizer through their “Fertilizers for Well-Being” program.

Think about it: if you’re a Mexican dairy farmer, why would you compete in volatile spot markets when the government’s offering guaranteed premiums? This isn’t just policy—it’s market manipulation on a massive scale.

The Stick: Infrastructure Investment to Cut Imports

Here’s where it gets expensive. Mexico’s committing 13.5 billion pesos ($680 million USD) in 2025 alone for processing infrastructure. They’re reactivating old plants and building new ones, including a flagship milk drying facility in Michoacán specifically designed to replace imported skim milk powder.

The new pasteurization plant in Campeche? That’s a $7.14 million investment targeting 100,000 liters per day. Add in 30 new milk collection centers nationwide, and you’re looking at a systematic effort to capture every drop of Mexican milk before it hits the export market.

The Contradiction: Subsidizing Imports While Building Walls

Here’s where Mexico’s strategy gets weird. While they’re spending billions to replace imports, they’ve simultaneously extended anti-inflationary decrees that eliminate tariffs on dairy products through December 2025. They’re literally subsidizing the very imports they’re trying to replace.

This isn’t incompetence—it’s politics. Consumer prices matter more than policy consistency, especially when inflation’s running hot. However, it reveals the tensions at the heart of Mexico’s approach.

Learning from Global Dairy Protectionism: The Playbook

Mexico isn’t pioneering dairy protectionism—they’re copying it. Let’s examine how other countries have approached this game and what it means for your export strategy.

China: The Industrial Blitz Model

China increased its domestic milk production by 11 million metric tons between 2018 and 2023, achieving 85% self-sufficiency. They did it by going big—massive state investment in industrial farms with over 1,000 cows each. The result? Global whole milk powder imports crashed from 670,000 metric tons to 430,000 metric tons in 2023.

But here’s the catch: China’s still the world’s largest dairy importer overall. They achieved self-sufficiency in fluid milk while becoming more dependent on specialized ingredients and genetics. Sound familiar?

India: The Cooperative Revolution

India’s “Operation Flood” took 30 years to transform the country, making it the world’s largest milk producer by organizing millions of small farmers into cooperatives. They used donated European milk powder to fund their domestic infrastructure—essentially using imports to eliminate imports.

Mexico is echoing this with its focus on small producers and guaranteed prices. But they’re missing India’s crucial ingredient: the powerful cooperative structure that made it all work.

Russia: The Forced March

Russia’s dairy protectionism wasn’t planned—it was forced by sanctions in 2014. They offered subsidies and soft loans to domestic producers, but they never managed to escape dependence on imported genetics, machinery, and veterinary supplies.

That’s Mexico’s real vulnerability. You can build all the processing plants you want, but if you can’t breed productive cows or maintain modern equipment, you’re still dependent on imports—just different ones.

The Numbers Don’t Lie: Why Mexico’s Math Doesn’t Add Up

Let’s talk reality. Mexico’s consumption is growing faster than its production capacity, and that gap is widening, not shrinking.

The Production Challenge

Mexico’s targeting 15 billion liters by 2030, but USDA forecasts show they’ll struggle to hit 13.9 billion liters by 2025. That’s a massive gap between political promises and economic reality.

Why? Water scarcity in the productive northern states, inadequate cold chain infrastructure, and a productivity gap that’s hard to bridge. Mexican dairies average 9-10 liters per cow per day in the south, while northern operations hit 37 liters per day. You don’t close that gap with subsidies—you close it with genetics and technology.

The Import Reality

Here’s the kicker: despite all the protectionist rhetoric, USDA forecasts show Mexico’s dairy imports growing, not shrinking. Skim milk powder imports are projected to rise 3% to 310,000 metric tons in 2025. Cheese imports? Up 5% to 200,000 metric tons.

Mexico’s not just addicted to imports—they’re structurally dependent on them. Their food processing industry, their expanding social programs, their growing restaurant sector—they all need more dairy than Mexico can produce.

The Opportunity Hidden in the Threat

Here’s where smart exporters are getting ahead of the curve. Mexico’s self-sufficiency drive isn’t just closing doors—it’s opening new ones.

Genetics: The $500 Million Opportunity

Mexico has imported over 8,000 high-yield Holstein heifers from Australia because it couldn’t obtain sufficient quality genetics elsewhere. These animals are rated at 10,220 kg per year—nearly double the average in Mexico.

That’s your opportunity right there. Mexico can’t hit their production targets without massive genetic upgrades. They need elite semen, embryos, and live animals. The Australian deal proves they’re willing to pay premium prices for quality genetics.

Technology: The Infrastructure Gap

Mexico’s dairy processing equipment market is projected to grow at a rate of 5.8% annually, reaching $517 million by 2030. They need pasteurizers, separators, evaporators, and dryers for their new plants.

But here’s the smart play: focus on productivity technology. Heat Stress Management Systems for the Arid Dairy States. Precision feeding systems. Automated milking technology. Water conservation systems. These aren’t just products—they’re solutions to Mexico’s fundamental productivity challenges.

Consulting: The Knowledge Premium

Mexico’s building processing capacity is faster than they’re building expertise. They need consultants who understand modern dairy operations, food safety systems, and supply chain optimization.

The genetics companies that’re winning in Mexico aren’t just selling products—they’re selling comprehensive productivity solutions. They’re providing on-the-ground technical support, building relationships with government agencies, and positioning themselves as partners in Mexico’s development goals.

The Tariff Wild Card: Your Biggest Risk

Before you get too excited about the opportunities, let’s talk about the elephant in the room: tariffs.

The biggest threat to your Mexican business isn’t Mexico’s self-sufficiency policy—it’s a potential U.S.-initiated trade war. The U.S. has already threatened 25% tariffs on all Mexican imports, and history shows that Mexico retaliates by targeting U.S. agricultural products.

In 2018, Mexico imposed tariffs of 20-25% on U.S. cheeses during a trade dispute. If that happens again, your commodity exports become uncompetitive overnight. That’s not a gradual policy shift—that’s a market-killing shock.

The smart money is preparing for this scenario. Diversifying markets, stress-testing financial models under a 25% tariff scenario, and building contingency plans for sudden market closure.

Your Strategic Playbook: Three Moves to Make This Week

1. Segment Your Mexican Portfolio

Stop treating Mexico as a single market. The government is targeting commodity imports, such as skim milk powder, but they’re still hungry for specialty products. Focus on defending high-value niches where you have quality or technological advantages.

2. Become a Solutions Provider

Shift from product sales to partnership. Frame your offerings as solutions to Mexico’s productivity challenges. Emphasize genetics that offer both high yields and heat tolerance. Market technology that improves water efficiency and reduces environmental impact.

3. Build In-Country Presence

Success requires more than just exporting. Establish local partnerships, provide on-the-ground technical support, and build relationships with both government agencies and private industry associations.

The Bottom Line

Mexico’s dairy strategy mirrors what we’ve seen in China, India, and Russia—emerging markets using protectionism to build domestic capacity while remaining dependent on high-value inputs. The commodity export game is changing, but the genetics and technology game is just getting started.

Your commodity exports to Mexico face real threats from both protectionist policies and potential tariff wars. But your opportunities in genetics, technology, and consulting services are expanding faster than Mexico’s milk production targets.

The exporters who thrive in this new environment won’t be the ones fighting the policy changes—they’ll be the ones enabling them. While others complain about lost commodity sales, smart operators are positioning themselves as indispensable partners in Mexico’s dairy development.

This week, audit your export portfolio: identify which 30% of your Mexican business can pivot from commodities to high-value genetics and consulting services. The market’s changing, whether you adapt or not. The question is whether you’ll be ready when the walls go up.

Complete references and supporting documentation are available upon request by contacting the editorial team at editor@thebullvine.com.

Learn More:

Join the Revolution!

Join over 30,000 successful dairy professionals who rely on Bullvine Weekly for their competitive edge. Delivered directly to your inbox each week, our exclusive industry insights help you make smarter decisions while saving precious hours every week. Never miss critical updates on milk production trends, breakthrough technologies, and profit-boosting strategies that top producers are already implementing. Subscribe now to transform your dairy operation’s efficiency and profitability—your future success is just one click away.

NewsSubscribe
First
Last
Consent

China’s Dairy Gold Rush Officially Over: Smart Exporters Already Pivoting to These High-Growth Markets

China’s 47% dairy import crash exposes exporters betting on wrong markets—smart operators already banking 20% higher margins elsewhere

EXECUTIVE SUMMARY: The industry’s sacred cow just got slaughtered: China’s “inevitable recovery” is a dangerous myth that’s bleeding exporters dry while Southeast Asia offers 3.14% annual growth and genuine import demand. The data destroys conventional wisdom—China’s milk powder imports crashed 47% since 2021, with 80% of Chinese farms now selling below their cost of production due to government-subsidized oversupply. Meanwhile, progressive exporters are capturing 15-20% higher margins in growth markets where structural milk deficits create sustainable pricing power instead of taxpayer-funded competition. Southeast Asia’s 3.14% CAGR and the Middle East’s 4.6% growth represent $3.3 billion in redirected revenue that China’s structural decline is permanently redistributing to operators smart enough to pivot. This isn’t a temporary market dip—it’s a complete rebalancing driven by demographics, policy, and economics that demands immediate strategic diversification. Stop chasing China’s shrinking margins and start banking profits in markets that actually want your milk equivalent instead of trying to replace it with subsidized domestic production.

KEY TAKEAWAYS

  • Market Diversification ROI: Exporters shifting from China to Southeast Asia/Middle East markets are achieving 15-20% higher profit margins with faster payment terms (30-45 days vs. China’s 60-90 days), creating immediate cash flow improvements and reduced political risk exposure
  • Strategic Pivot Framework: The 90-day diversification blueprint redirecting 25-30% of marketing resources toward growth markets delivers measurable revenue protection against China’s structural $3.3 billion import contraction while competitors fight over subsidized scraps
  • Alternative Market Fundamentals: Southeast Asia’s structural milk production deficit and 3.14% CAGR growth, combined with Middle East’s 4.6% expansion driven by health campaigns, creates genuine import demand versus China’s policy-driven substitution of foreign supply with domestic surplus
  • Technology Integration Advantage: North American exporters leveraging genomic testing expertise, precision agriculture systems, and processing technology partnerships can capture defensible high-value niches worth $2,000-4,000 per MT premiums versus commodity powder’s break-even margins in oversupplied Chinese markets
  • Implementation Urgency: The 18-month competitor lag time for market diversification creates a critical advantage window for exporters who establish distributor relationships in Indonesia, Malaysia, Saudi Arabia, and Mexico before intensified competition arrives from redirected New Zealand and EU volumes

China’s dairy import collapse isn’t a temporary dip—it’s structural devastation. With milk powder imports crashing 47% since 2021 and 80% of Chinese farms selling below cost, the exporters still chasing Beijing’s “recovery” are about to get crushed by operators who’ve already captured Southeast Asia’s 3.14% annual growth.

Here’s the brutal truth your industry consultants won’t tell you: China’s era as the volume-driven growth engine “capable of absorbing near-limitless quantities of commodity dairy products” is definitively over. The numbers don’t lie—total milk powder imports collapsed from 2.58 million metric tons in 2021 to just 1.36 million MT by 2024, representing a catastrophic 47% market contraction.

But while your competitors fight over China’s shrinking margins, the smartest operators are already banking serious profits in markets that actually want what you’re selling.

The Demographic and Policy Reality That Killed China’s Appetite

Think of China’s dairy transformation like watching your highest-producing Holstein hit peak lactation and enter permanent decline—except this cow isn’t cycling back to peak production. The fundamentals have shifted permanently.

The Birth Rate Catastrophe China’s demographic collapse has demolished the foundation of dairy demand growth. Infant formula imports plummeted 37.1% from 350,000 MT in 2021 to just 220,000 MT in 2024. When your core growth driver (babies) shrinks by record numbers annually, you’re not dealing with a market cycle—you’re watching permanent demand destruction.

The Self-Sufficiency Sledgehammer Beijing’s food security obsession created something exporters never saw coming: a policy-driven supply glut so severe that 80% of Chinese dairy farms are now selling milk below their cost of production. Raw milk prices crashed 30% from their 2021 peak by mid-2024, forcing processors to convert surplus milk into powder with government subsidies.

The government of Xinjiang alone offered subsidies of 4,000 RMB per metric ton for whole milk powder production starting in mid-2024. Translation? China is now competing against its own imports with a taxpayer-funded domestic product.

The Economic Slowdown Reality China’s economy entered “a period of protracted slowdown, marked by a deep crisis in the real estate sector, high youth unemployment, and persistently weak consumer confidence”. Cautious consumers began cutting back on premium-priced imported dairy products, creating a perfect storm of reduced demand and increased domestic competition.

Where the Real Money Is Moving: Verified Growth Markets

While your competitors obsess over China’s corpse, progressive exporters capture sustainable pricing power in markets with structural import demand rather than subsidized oversupply.

Southeast Asia: The Premier Growth Engine Southeast Asia represents the strongest fundamentals for long-term success, with a projected 3.14% CAGR growth through 2033. Unlike China’s policy-driven self-sufficiency push, Southeast Asia has structurally low domestic milk production, unable to meet escalating demand.

The region’s demand is powered by fast-paced urbanization, a growing middle class with rising disposable incomes, and heightened consumer consciousness around health and nutrition. The Philippines exemplifies this opportunity—local production accounts for only 1% of domestic requirements, creating massive import dependency.

Middle East: Health-Driven Premium Demand The Middle East offers even stronger growth at 4.6% CAGR through 2030, driven by government-led health and wellness campaigns to combat high rates of lifestyle diseases and a growing affluent expatriate population. Key markets like Saudi Arabia and the UAE continue investing in domestic production, but demand growth continues to outstrip local supply capabilities.

Latin America: The Steady Recovery Play Latin America’s dairy market projects steady growth at +0.4% CAGR through 2035. The region is emerging from a period of significant volatility caused by severe weather events and economic instability, with Mexico representing a large, stable import market for North American exporters.

The New China Strategy: Defensible High-Value Niches Only

Here’s where conventional industry wisdom gets dangerous. Most exporters still believe they can “pivot to premium products” in China. According to the research data, this advice isn’t just wrong—it’s catastrophic.

The Premium Product Myth Destroyed Cheese, long touted as the “next high-growth frontier,” has faltered dramatically. Cheese sales value declined for three consecutive years through the first half of 2024. This collapse occurred despite years of industry predictions about China’s premium product opportunity.

The new China strategy must focus on three defensible areas where domestic substitution is difficult and foreign expertise provides a clear competitive advantage:

  • Specialized Ingredients: High-purity whey protein isolates for sports nutrition, milk protein concentrates for functional foods, specialized lactose for pharmaceutical applications
  • Niche Consumer Products: Artisanal products with compelling regional identity, organic or grass-fed products for health-conscious consumers
  • Technology Partnerships: Leveraging North American expertise in genetics, precision agriculture, and processing technology

Your 90-Day Market Diversification Blueprint

Month 1: Intelligence Gathering & Risk Assessment

  • Audit China exposure: Calculate the percentage of total revenue dependent on Chinese buyers using verified trade data
  • Research target markets: Focus on Southeast Asia growth regions using the USDA Foreign Agricultural Service data
  • Calculate true costs: Factor in extended payment terms (60-90 days vs. 30-45 days in growth markets), tariff risks, margin pressure

Month 2: Market Testing & Relationship Building

  • Ship trial orders: Start with 1-2 container loads to test logistics and customer response
  • Establish local partnerships: Connect with importers who understand regulatory requirements
  • Conduct margin analysis: Compare China sales vs. alternative market opportunities using verified pricing data

Month 3: Strategic Reallocation

  • Redirect resources: Move 25-30% of marketing and sales focus toward the highest-opportunity markets
  • Secure contracts: Negotiate longer-term supply agreements (12-24 months) before competition intensifies
  • Implement gradual transition: Reduce China exposure while building an alternative volume

Global Impact: How Major Exporters Are Already Adapting

New Zealand’s Forced Evolution New Zealand was hardest hit, losing nearly 430,000 metric tons of WMP demand between 2021 and 2024. The country accounted for 46% of China’s total dairy imports by volume in 2024 and an astonishing 92% of its WMP imports, making it the epicenter of the shock.

European Union’s Diversification Success The EU experienced a massive 31% drop in dairy product volumes shipped to China in 2022 alone. However, exporters with diversified portfolios maintained better overall performance, particularly Danish and Dutch cooperatives leveraging specialty cheese expertise in Middle Eastern markets.

United States’ Strategic Focus U.S. dairy exports to China peaked in 2022 at over $800 million before falling to an estimated $583 million by 2024. The critical bright spot has been the whey products driven by strong demand from China’s recovering hog sector.

Market Comparison: Where Your Margins Thrive vs. Die

Market AnalysisChinaSoutheast AsiaMiddle EastLatin America
Projected Growth (2025-2030)2-3%3-5%4.6%~1.3%
Import Demand TrendStructural declineStrong growthAcceleratingSteady recovery
Self-Sufficiency Policy85% targetLow productionImport-dependentMixed
Key AdvantageLimited nichesStructural deficitHealth focusProximity
Competition LevelSubsidized domesticIntensifyingModerateStable

Source: “The Great Rebalancing: Navigating the Structural Shift in China’s Dairy Demand and Charting a New Course for Global Exporters”

Why This Matters for Your Operation: The ROI Reality

Current China Strategy Costs (Verified Data):

  • Payment terms: 60-90 day cash flow impact vs. 30-45 days in growth markets
  • Policy risk: Sudden market access restrictions with minimal notice
  • Margin compression: Competing against subsidized domestic production
  • Tariff exposure: Up to 25% additional costs depending on trade relations

Alternative Market Benefits (Research-Backed):

  • Faster payments: 30-45 day terms standard in growth markets
  • Genuine import demand: Structural production deficits requiring imports
  • Growth trajectory: Compound annual growth rates 50-100% above China
  • Diversification protection: Reduced single-market dependency risk

The Bottom Line: Your Export Future Depends on This Pivot

The data is unambiguous: China’s total dairy import values dropped from $6.8 billion in 2021 to an estimated $3.5 billion in 2024—a staggering $3.3 billion market contraction. This isn’t a temporary dip; it’s a structural rebalancing driven by policy, economics, and demographics.

China’s dairy market’s compound annual growth rate over the next two decades is projected at just 2-3%, half the pace of the previous 20 years. Meanwhile, Southeast Asia offers 3.14% CAGR, the Middle East delivers 4.6% CAGR, and these markets actually need your imports instead of trying to replace them.

Research from leading dairy economists confirms that exporters with diversified portfolios performed better during China’s downturn than those with concentrated exposure. The evidence is overwhelming—diversification isn’t just a smart strategy, it’s survival.

Your competitors won’t make this pivot for another 18 months—that’s your advantage window. The operators who establish positions in Southeast Asia, the Middle East, and Latin America now will capture the revenue that China’s structural decline is permanently redistributing.

Here’s your immediate next step: Contact three distributors in Southeast Asia or Middle East markets this week. Request current pricing for SMP, WMP, and specialty products. Compare those margins to your China business using the verified data provided. The numbers will make your decision obvious.

The dairy gold rush isn’t over. It just moved to markets that actually want what you’re selling instead of trying to replace you with subsidized domestic production.

The structural shift is permanent. The question isn’t whether China will recover—it’s whether you’ll still be waiting for that recovery while your smarter competitors are banking profits elsewhere.

Complete references and supporting documentation are available upon request by contacting the editorial team at editor@thebullvine.com.

Learn More:

  • Global Dairy Market Trends 2025: European Decline, US Expansion Reshaping Industry Landscape – Reveals how declining EU production and US capacity expansion create specific export opportunities and competitive advantages that forward-thinking operations can leverage for premium pricing and market positioning beyond traditional trade assumptions.
  • Dairy Export Diversification – Demonstrates practical implementation approaches for different operation types, from large commercial farms to mid-size family operations, showing how to build direct-to-consumer channels and cooperative structures that protect against export market volatility while capturing retail margins.
  • The Future of Dairy Farming: Embracing Automation, AI, and Sustainability in 2025 – Explores how emerging technologies like indwelling sensors, computer vision, and AI-driven analytics can optimize genetic potential for export competitiveness while meeting sustainability standards that emerging markets increasingly demand from international suppliers.

Join the Revolution!

Join over 30,000 successful dairy professionals who rely on Bullvine Weekly for their competitive edge. Delivered directly to your inbox each week, our exclusive industry insights help you make smarter decisions while saving precious hours every week. Never miss critical updates on milk production trends, breakthrough technologies, and profit-boosting strategies that top producers are already implementing. Subscribe now to transform your dairy operation’s efficiency and profitability—your future success is just one click away.

NewsSubscribe
First
Last
Consent

Trade War Reality Check: Why Smart Dairy Exporters Are Banking Partnership Profits While Tariff Warriors Face Margin Collapse

Tariff wars cost dairy farmers $6B while smart operators bank 20% yield gains through precision ag partnerships. Stop fighting – start profiting.

EXECUTIVE SUMMARY:  The dairy industry’s obsession with tariff protection is the biggest strategic mistake since believing export subsidies create sustainable profitability – and it’s costing farmers billions in real profits. Cornell University projects that new tariffs combined with trade retaliation could cost U.S. dairy farmers $6 billion in lost profits over four years, while Mexico and Canada – representing 40% of U.S. dairy exports worth $8.2 billion – face potential 25% tariff threats that guarantee devastating retaliation. Meanwhile, forward-thinking operations are capturing the real opportunity: the $5 billion global precision dairy farming market where AI-powered equipment boosts milk yields by 20% and technology partnerships generate sustainable revenue streams immune to political volatility. While tariff warriors fight yesterday’s battles, smart operators are exporting expertise through precision agriculture solutions, genomic testing partnerships, and feed efficiency consulting that deliver consistent margins regardless of commodity price swings. The question isn’t whether tariffs will protect your operation – it’s whether you’ll pivot to partnership strategies that turn your technological advantages into premium revenue streams while competitors lose billions fighting unwinnable trade wars.

KEY TAKEAWAYS

  • Technology Partnership Premium: Precision agriculture partnerships in the $5 billion global market deliver AI-powered equipment that boosts milk yields by 20%, creating sustainable revenue streams that bypass tariff volatility entirely – while commodity exports remain subject to political disruption costing the industry a projected $6 billion over four years.
  • Export Dependency Reality Check: With 16% of U.S. milk solids exported for $8.2 billion in revenue and Mexico/Canada representing 40% of exports, threatened 25% tariffs on these critical markets guarantee retaliatory destruction of relationships that took decades to build – making partnership diversification an immediate survival strategy.
  • Feed Efficiency Consulting Opportunity: U.S. operations achieving 1.35 lbs milk per lb DMI versus global averages of 0.85 lbs represent a 60% efficiency advantage that creates premium consulting opportunities in international markets, generating consistent margins while commodity exports face political manipulation and price volatility.
  • Genomic Testing Export Strategy: With U.S. genomic testing rates at 89% versus 8% globally, American dairy expertise in genetic merit optimization represents a massive technology transfer opportunity that generates premium margins through knowledge exports rather than politically vulnerable product shipments.
  • Market Timing Advantage: Class III milk projected at $18.15 in Q2 2025 creates urgency for developing tariff-resistant partnership revenue streams, as operations that diversify into technology consulting and precision agriculture exports position themselves for sustainable growth while commodity-dependent farms face margin collapse from trade war fallout.
 dairy export strategy, dairy trade policy, dairy profitability, precision agriculture partnerships, farm technology partnerships

The uncomfortable truth about 2025 dairy markets: while producers fixate on tariff battles that destroy more value than they create, forward-thinking operations are capturing technology partnership premiums that deliver sustainable returns. The biggest winners aren’t shipping cheese to protected markets – they’re exporting expertise and precision agriculture solutions to solve global productivity crises.

Here’s the contrarian take that challenges everything: the entire “tariff protection” obsession is the dairy industry’s biggest strategic mistake since believing export subsidies create sustainable profitability. Smart money stopped fighting trade wars and started banking partnership revenues.

The 2025 Market Reality: Exports Carry U.S. Dairy Despite Domestic Weakness

Let’s demolish the most dangerous myth in modern dairy trade: that tariff wars protect American farmers.

The Current Market Dynamic reveals a stark reality. Two of the world’s largest cheese plants fired up in the first half of 2025, unleashing massive new processing capacity. Yet domestic demand remains sluggish – Pizza Hut sales down 5%, Papa John’s off 3% – making export performance absolutely critical.

The silver lining? U.S. dairy exports have defied the gloom. The U.S. is on pace to establish a new butter export record this year, with 20 million more pounds of cheese exported in the first quarter alone. Global buyers increasingly refer to U.S. dairy suppliers as “strategic partners,” fueled by billions of cutting-edge plant investments.

But here’s where conventional thinking gets dangerous: more than 16% of U.S. milk solids were exported in 2024, generating $8.2 billion in revenue, making exports absolutely essential to farm profitability. Yet tariff policies are systematically destroying these relationships.

The Tariff Trap: How Protection Politics Devastate Dairy Profits

Here’s the controversial stance backed by verified industry data: protectionist tariff strategies actively destroy U.S. dairy competitiveness and farmer profitability.

The Mathematical Devastation is quantifiable and terrifying. Cornell University’s Charles Nicholson projects that new tariffs combined with trade retaliation could cost U.S. dairy farmers $6 billion in lost profits over the next four years. Speaking at the 2025 Dyson Agricultural and Food Business Outlook conference, Nicholson warned: “If you pick a trade fight with our major export destinations – Mexico, Canada, and China – and they decide to retaliate, that has some substantive negative implications for dairy farms and processors.”

The Current Stakes Are Enormous. According to verified USDA data reported by IDFA, our primary tariff targets represent a massive dairy market share:

  • Mexico: $2.47 billion (record value, representing 25% of U.S. dairy exports)
  • Canada: $1.14 billion (record value, expanded 63% over the past decade)
  • China: Lowest imports since 2020 due to existing trade tensions

Mexico and Canada alone account for more than 40% of U.S. dairy exports and represent the top two U.S. agricultural export markets at approximately $30 billion each. With 25% tariffs threatened on Mexico and Canada, plus 10% on China, the potential for devastating retaliation is massive.

What smart operators recognize: While tariff advocates promise protection, the mathematical reality is value destruction on an unprecedented scale.

The Partnership Goldmine Hidden Behind Trade War Headlines

While the industry obsesses over tariff rates, the real money flows toward technology partnerships and productivity solutions.

The Cheese Success Story demonstrates what’s possible when trade relationships work. Cheese exports to Mexico have more than doubled since 2020, making Mexico the cornerstone of U.S. cheese export growth. This success came through relationship building and strategic partnerships, not tariff manipulation.

The Technology Partnership Opportunity represents the future of dairy profits. AI-powered precision dairy farming equipment is projected to boost milk yields by up to 20% by 2025, with the global precision dairy farming market expected to surpass $5 billion in value. This massive market represents partnership opportunities that bypass tariff volatility entirely.

The Component Reality shows both the risk and opportunity. While milk powder exports have declined 16% since 2021, cheese exports continue setting new record highs. The difference? Cheese exports often involve deeper processing partnerships and technology sharing arrangements that create sustainable competitive advantages.

Why This Matters for Your Operation: Partnership strategies create premium value streams that bypass commodity price swings and tariff volatility entirely, while commodity exports remain subject to political disruption.

Critical Analysis: The Three Strategic Pivots Smart Operations Are Making

1. Mexico Partnership Strategy Over China Tariff Wars The verified data shows cheese exports to Mexico have doubled since 2020, while Chinese dairy imports hit their lowest level since 2020. Forward-thinking operations are deepening Mexican relationships through processing partnerships, supply chain integration, and technology sharing rather than fighting unwinnable tariff battles.

2. Technology Export Over Commodity Export
With the global precision dairy farming market approaching $5 billion and AI equipment boosting yields by 20%, smart operators are positioning to export expertise, not just products. Technology licensing agreements generate consistent revenue streams immune to tariff volatility.

3. Strategic Market Focus Understanding that Mexico alone purchases 576,000 metric tons of U.S. dairy products annually while supplying over 80% of Mexico’s dairy deficit, leading operations are developing deeper strategic partnerships rather than diversifying into volatile, politically sensitive markets.

The Bottom Line: Stop Fighting Yesterday’s War

The tariff myth is fully exposed: protectionist policies are the participation trophy of dairy trade – they make producers feel protected while destroying the export relationships that determine long-term profitability.

Three data-verified takeaways that reshape everything:

Partnership Revenue Beats Tariff Protection: Mexico cheese exports have doubled since 2020, while China trade deteriorates, proving that relationship-based strategies deliver superior returns to confrontational approaches. Technology partnerships in the $5 billion precision agriculture market offer sustainable revenue streams immune to political volatility.

Export Dependency Demands Smart Strategy: With 16% of U.S. milk solids exported for $8.2 billion in revenue, and Cornell projecting $6 billion in potential losses from tariff wars, smart operations are building tariff-resistant partnership revenue streams rather than betting on commodity flows.

Market Timing Advantage: Class III milk is projected at $18.15 in Q2 2025, which creates urgency for developing value-added partnerships that maintain margins despite commodity price pressures and trade volatility.

Your strategic question isn’t whether tariffs will protect your operation – it’s whether you’ll adapt to the reality where verified partnership profits trump trade war rhetoric.

Audit your operation’s partnership readiness: Are you developing technology capabilities that justify premium pricing? Can you document the advantages of efficiency that international operations need? Are you positioned to export knowledge and precision agriculture solutions, not just products?

The operations that embrace partnership over pressure will capture the growth markets that define the next decade of dairy profitability. The question for your operation: Will you keep fighting the tariff war while competitors bank the partnership profits from the $5 billion precision agriculture boom?

Complete references and supporting documentation are available upon request by contacting the editorial team at editor@thebullvine.com.

Learn More:

Join the Revolution!

Join over 30,000 successful dairy professionals who rely on Bullvine Weekly for their competitive edge. Delivered directly to your inbox each week, our exclusive industry insights help you make smarter decisions while saving precious hours every week. Never miss critical updates on milk production trends, breakthrough technologies, and profit-boosting strategies that top producers are already implementing. Subscribe now to transform your dairy operation’s efficiency and profitability—your future success is just one click away.

NewsSubscribe
First
Last
Consent

Trade War Reality Check: Why India’s $227 Billion Dairy Fortress Just Crushed US Export Dreams

India’s $227B dairy fortress crushes US export dreams—why your operation needs new global strategy now

EXECUTIVE SUMMARY: The “inevitable market opening” myth just died a spectacular death—India’s $227 billion dairy market remains 98% closed to US exports despite decades of trade pressure, forcing every dairy operation to completely rethink their export assumptions. With India producing 25% of global milk yet importing just $42 million worth of US dairy annually, traditional trade negotiation tactics have proven utterly worthless against culturally-entrenched protectionism protecting 80 million rural households. Smart money is already pivoting from failed export-only models to local investment strategies, with technology partnerships delivering 15-25% annual returns versus 5-8% margins on traditional exports—a $150,000-400,000 revenue difference for equivalent volume deals. While US dairy hit record $8.2 billion in exports during 2024, the “India-sized hole” in global demand intensifies competition in every remaining accessible market, making diversification and strategic partnerships essential for survival. Operations banking on breakthrough markets that will never open are setting themselves up for failure—audit your export strategy assumptions before your competitors capture the partnerships that actually work.

KEY TAKEAWAYS

  • Partnership Strategy Beats Export Strategy: Technology licensing and joint ventures in protected markets generate 15-25% annual returns compared to 5-8% export margins, representing $150,000-400,000 additional revenue for operations with equivalent volume—proving investment beats intimidation
  • Export Diversification is Survival: With India’s massive market permanently off-limits, operations that diversified away from “breakthrough” markets achieved 18% higher export revenue growth (2020-2022), translating to $200,000-500,000 additional annual revenue for $3-5 million export operations
  • Market Access Reality Check: India’s “vegetarian feed” requirements make standard US Total Mixed Rations practically impossible to certify—forcing complete feeding protocol changes that most operations can’t economically justify, proving cultural barriers trump scientific standards
  • Global Competition Intensification: The “India-sized hole” in demand forces US dairy into brutal competition across remaining 145 export markets, with Mexico ($2.47B), Canada ($1.2B), and Southeast Asia becoming critical growth battlegrounds requiring 25-30% greater marketing investment
  • Strategic Timing Advantage: India’s milk production growth decelerated to 3.76% while domestic demand surges at 6.42%—creating technology partnership opportunities for operations ready to help solve productivity challenges rather than fight fortress walls
dairy export strategy, global dairy trade, India dairy market, dairy export diversification, international dairy markets

India’s dairy market—worth ₹18,975 billion ($227 billion) in 2024 and producing 216.5 million metric tons of milk—just slammed the door shut on US export hopes again. Despite representing 25% of global production, America’s share remains a pathetic 0.02%. Here’s why this deadlock changes everything for your export strategy and challenges every assumption about “inevitable” market opening.

The brutal truth about India-US dairy trade negotiations? They’re not negotiations at all—they’re a collision between two incompatible worldviews that exposes the fundamental flaws in America’s traditional trade playbook.

The Numbers That Should Terrify Every US Dairy Exporter

Let’s start with the math that keeps trade negotiators awake at night. India produces 216.5 million metric tons of milk annually—that’s 25% of global output concentrated in a market that imported less than $34 million worth of US dairy in 2020[9].

Do the calculation: that’s 0.02% market penetration in a sector valued at ₹18,975 billion ($227 billion) in 2024 and growing at 12.35% yearly. Meanwhile, US dairy exports hit $8.2 billion in 2024—making India’s absence from American export portfolios a strategic disaster.

Here’s the kicker that challenges conventional wisdom about trade liberalization: India isn’t playing hard to get. According to Reuters reporting on current trade talks, Indian officials have designated dairy as a non-negotiable area requiring “safeguards”.

This isn’t temporary protectionism—it’s permanent policy protecting 80 million rural households whose livelihoods depend on dairy, with women comprising 70% of the workforce.

The “Vegetarian Feed” Barrier That Breaks Traditional Trade Logic

Challenge to conventional practice: The US dairy industry operates on the assumption that science-based standards should govern trade. This assumption just hit a cultural brick wall.

India requires that imported dairy must come from animals that have “never been fed” ruminant material—a religious-based requirement, not a science-based one. This isn’t food safety—it’s cultural sovereignty wrapped in trade policy.

Try explaining to your nutritionist how you’ll certify that your 2,000-head Holstein operation has never consumed a Total Mixed Ration containing animal byproducts over each cow’s entire lactation cycle. It’s like trying to guarantee that every calf in your herd has never tasted anything but organic, plant-based starter feed from birth through weaning—practically impossible when you’re managing feed efficiency and cost optimization across multiple groups.

Think about it this way: It’s like asking a dairy farmer to prove that none of his cattle have ever eaten a single kernel of corn that was grown in a field where a chicken once walked. The logistical impossibility is the point—it’s designed to be unachievable.

The evidence-based alternative? European companies figured out years ago that joining India’s system beats fighting it. Instead of pushing exports, they’re pursuing local investment, technology transfer, and joint ventures that work within India’s cultural framework while capturing market share.

Why Traditional Trade Pressure Has Failed Spectacularly

The USTR’s 2025 National Trade Estimate Report criticizes India’s “onerous” dairy import procedures, including extensive documentation requirements and lack of transparency in import inspection rules, but here’s what challenges the entire US trade strategy: Despite WTO challenges and bilateral pressure, India’s position has only hardened.

Why? Because displacing millions of smallholder farmers for trade gains isn’t just economically risky—it’s political suicide.

The data proves the strategy’s failure: US dairy exports to India have remained essentially flat while India’s domestic market has exploded. India’s milk production growth has decelerated from historical averages of 5-6% to just 3.76% in 2024, while domestic demand continues surging at 6.42% annually.

The Supply-Demand Crisis That Could Force Change

Here’s where it gets interesting for strategic thinkers. India faces its first real internal pressure in decades. The government has committed ₹2,790 crore ($335 million) through the National Programme for Dairy Development through 2026, racing to boost productivity before the gap becomes unsustainable.

The revised NPDD has already benefited over 18.74 lakh farmers and created more than 30,000 jobs while increasing milk procurement capacity by 100.95 lakh litres per day. But here’s the critical math: even with this massive investment, production growth continues lagging demand growth by nearly 3 percentage points annually.

What happens when you can’t meet domestic demand through domestic production? That’s the question that could reshape India’s fortress—not US trade pressure, but internal mathematics.

Think of it like managing a high-producing herd during peak lactation while feed costs soar and dry matter intake drops—eventually, the math forces difficult decisions about either boosting input efficiency or seeking external feed sources. India’s facing the same crossroads at a national scale.

The opportunity lies in niche ingredients where the US has captured 21% of India’s whey protein market and 13% of lactose imports, with USDA projections for 20% growth in whey protein imports and 21% growth in lactose for 2025.

Global Market Restructuring: The “India-Sized Hole” Effect

Challenge to conventional export strategy: The assumption that all major markets will eventually open ignores the reality of food security nationalism.

India’s absence creates what analysts call an “India-sized hole” in global demand, forcing major exporters into brutal competition elsewhere. Think of it as removing the largest buyer from a cattle auction—suddenly every remaining bidder becomes exponentially more important.

With US dairy now exporting to 145 countries and approximately one day’s national production shipped overseas weekly, the pressure for export victories has never been higher.

Strategic implications for your operation:

  • Mexico remains critical at $2.47 billion in 2024 exports
  • Canada imported a record $1.14 billion
  • Southeast Asia becomes essential despite softer demand
  • Every accessible market becomes more competitive

For a mid-size operation currently banking 15-20% of revenue on export contracts, losing access to India’s potential means that same revenue growth must come from more competitive markets—potentially requiring 25-30% greater marketing investment and price competition.

The Investment Strategy That Actually Works

Evidence-based alternative to traditional export-only models: Instead of fighting India’s fortress, successful companies are joining it from within.

Here’s what smart money is doing differently: Local investment, joint ventures, and technology partnerships that help India solve its productivity challenges while creating revenue streams that bypass tariff barriers entirely.

The technology partnership approach offers compelling ROI potential: Based on industry analysis, US dairy technology companies report 15-25% annual returns on joint ventures in protected markets, compared to 5-8% margins on traditional export sales. This represents a $150,000-400,000 annual revenue difference for a technology licensing deal versus equivalent export volume.

For precision agriculture companies, establishing local partnerships for automated milking systems, herd monitoring technology, or feed optimization software creates recurring revenue streams that grow with the local market rather than fighting against it. It’s like breeding your best genetics into their national herd rather than trying to ship live cattle across an impossible border.

What This Means for Your 2025 Export Strategy

As Michael Dykes, President and CEO of IDFA, stated: “Our industry is poised to become the world’s leading supplier of dairy products thanks to the resilience and innovation of the American dairy industry… With new trade agreements that remove obstacles and increase market access, we wouldn’t just break records – we would redefine the global dairy landscape”.

But here’s the reality check: That vision can’t depend on cracking India’s fortress.

Critical evaluation questions for your operation:

  • What percentage of your export planning assumes India will eventually liberalize?
  • How vulnerable is your export portfolio to losing access to currently open markets?
  • Are you investing in market diversification or betting everything on traditional negotiation outcomes?

The data-driven recommendation: Build resilient, diversified portfolios focused on achievable markets rather than protected fortresses. Companies that understand market access isn’t always about removing barriers—sometimes it’s about joining the system those barriers protect—will own the next decade.

ROI reality check: Dairy operations that diversified export strategies away from protected markets in 2020-2022 achieved 18% higher export revenue growth than those focused on “breakthrough” markets like India. That translates to roughly $200,000-500,000 in additional annual revenue for operations with $3-5 million in export volume.

The Bottom Line

India’s $227 billion dairy fortress isn’t opening through traditional trade pressure—current negotiations remain focused on “safeguards” rather than market opening. The real lesson extends beyond India to every protected market worldwide.

Success requires understanding that market access isn’t always about removing barriers. Sometimes it’s about working within the system those barriers protect. The exporters who figure this out first—through strategic partnerships, local investment, and technology transfer—will capture the growth that traditional export-only strategies miss.

Your immediate action step: Audit your export market assumptions. Are you betting on markets that will never open, or building relationships in markets where you can actually compete? The operations that answer honestly—and adapt accordingly—will be the ones thriving when the trade wars finally end.

The strategic question isn’t whether India will change its mind—it’s whether American dairy will adapt to this new reality where food security nationalism reshapes global trade flows. The companies that embrace partnership over pressure will write the next chapter of international dairy growth.

The India deadlock isn’t just about one country’s protectionism. It’s a preview of how food security nationalism will reshape global dairy trade for the next decade.

Complete references and supporting documentation are available upon request by contacting the editorial team at editor@thebullvine.com.

Learn More:

Join the Revolution!

Join over 30,000 successful dairy professionals who rely on Bullvine Weekly for their competitive edge. Delivered directly to your inbox each week, our exclusive industry insights help you make smarter decisions while saving precious hours every week. Never miss critical updates on milk production trends, breakthrough technologies, and profit-boosting strategies that top producers are already implementing. Subscribe now to transform your dairy operation’s efficiency and profitability—your future success is just one click away.

NewsSubscribe
First
Last
Consent

Disrupting Global Dairy: How Nestlé’s Brazil Bet Exposes Traditional Markets’ Blind Spots

While U.S. producers chase 2% growth, Brazil’s 315% export surge exposes why volume thinking kills profits. Regenerative agriculture delivers 4% ROI.

EXECUTIVE SUMMARY: Nestlé’s $1.3 billion Brazil investment isn’t just corporate expansion—it’s a wake-up call that traditional dairy regions are fighting yesterday’s battles while emerging markets capture tomorrow’s profits. While established exporters obsess over commodity volumes, multinationals are building value-added processing empires where component optimization delivers 1.65% production gains even as total volume drops 0.35%. Brazil’s 315% export surge to China proves emerging markets aren’t just consumers anymore—they’re becoming self-sufficient competitors with technology leapfrog advantages that bypass decades of gradual development. Regenerative agriculture programs demonstrate how sustainability becomes a profit weapon, delivering 4% profitability increases and 8% cost reductions while traditional producers treat environmental stewardship as compliance overhead. Early technology adopters report ROI within 7 months, yet most operations remain trapped in volume-focused strategies that ignore component premiums worth $1-3 per hundredweight. The uncomfortable reality: global dairy’s center of gravity is shifting irreversibly toward regions that combine abundant resources, growing consumption, and sophisticated production capabilities—leaving export-dependent producers to compete for shrinking commodity markets.

KEY TAKEAWAYS

  • Component Over Volume Strategy: U.S. operations achieving 4.36% butterfat and optimized protein levels capture premium pricing worth $1-3 per cwt while commodity producers face margin compression—proving value-added positioning beats volume chasing in today’s fragmented global markets.
  • Technology Adoption ROI Reality: Early adopters of precision feeding systems reduce waste by 18%, smart monitoring cuts mortality 40%, and robotic milking enables 20% yield increases through 3x daily cycles—with payback periods averaging 7 months for operations ready to abandon legacy thinking.
  • Regenerative Agriculture Profit Weapon: Nestlé’s Brazil program proves sustainability isn’t compliance overhead—farms implementing “gold” practices report 4% profitability increases, 8% cost reductions, and 2-5% monthly milk price bonuses while reducing fertilizer usage 13% and diesel consumption 48%.
  • Export Dependency Myth Exposed: China’s 28% production surge and 12% import decline since 2019, combined with Brazil’s 315% export growth to major markets, demonstrates how traditional exporters face shrinking opportunities as emerging markets achieve self-sufficiency through multinational investment and technology leapfrogging.
  • Implementation Barrier Framework: Success requires addressing financial constraints ($22,500-35,000 genomic testing investment for 500-cow herds), technical support gaps (3-5 year university extension lag vs. immediate multinational programs), and premium capture challenges through cooperative participation or direct marketing channels.
global dairy markets, dairy export strategy, regenerative agriculture, dairy profitability, emerging dairy markets

While North American and European dairy farmers obsess over milk pricing formulas and regulatory compliance, Nestlé just dropped $1.3 billion on Brazil’s dairy future—a strategic bet that exposes how traditional dairy regions are sleepwalking into irrelevance. This isn’t just corporate expansion; it’s a masterclass in recognizing where dairy’s real profit margins are being built while established exporters fight over shrinking commodity markets.

The global dairy chessboard is being reset, and most traditional producers don’t even realize the game has changed.

The Strategic Reality Behind Nestlé’s Milk Money

Let’s cut through the corporate speak and examine what Nestlé’s leadership sees when analyzing global dairy dynamics. Their 7 billion reais investment ($1.27 billion) between 2025 and 2028 targets Brazil as their third-largest market globally, with 2024 revenues hitting approximately 4 billion Swiss francs ($4.90 billion).

This isn’t speculative expansion—it’s doubling down on proven success in a market where dairy consumption patterns mirror North America’s explosive growth trajectory from the 1980s.

Why This Matters for Your Operation

Here’s where it gets interesting for anyone still thinking that ” globally means exporting to China. Consider this comparison: while traditional dairy regions chase modest growth, Brazil’s domestic dairy market is expanding at rates that would make American producers trade their best Holstein for a one-way ticket to São Paulo.

Brazil’s top seventeen dairy processors collected 10.8 billion liters of milk in 2024, with national milk collection rising 3.1% to reach 25.4 billion liters total. But here’s the kicker that should grab every dairy farmer’s attention: Brazil’s total milk production, including both industrial and artisanal output, reached 35.4 billion liters, up about 3% from the previous year.

It’s like comparing a diversified dairy operation with on-farm feed production to one dependent on volatile commodity feed markets. The integrated model wins every time, and Brazil’s building that kind of resilience nationally.

Strategic Positioning Self-Assessment

Before diving deeper, ask yourself these critical questions:

  • Can you name three emerging markets with higher dairy growth rates than your primary export destinations?
  • Does your operation generate more revenue from components than volume?
  • Have you calculated your vulnerability to export market disruptions?
  • When did you last evaluate non-traditional market opportunities?

If you answered “no” or “I don’t know” to any of these, you’re about to discover why Nestlé’s betting against conventional dairy wisdom.

Challenging the Export Dependency Myth

Here’s where conventional dairy wisdom gets dangerously wrong: Most traditional dairy regions still assume export growth will solve their profitability problems. The data tells a completely different story; frankly, it’s about time someone said it out loud.

While everyone’s celebrating cheese export records, global buyers increasingly refer to U.S. dairy suppliers as “strategic partners,” fueled by billions of dollars invested in cutting-edge plants. Meanwhile, domestic consumption remains relatively flat, making export markets seem like the logical outlet for surplus production.

But here’s the uncomfortable truth that export-focused strategies ignore: emerging markets are systematically reducing import dependence just as their domestic consumption explodes.

The Evidence Against Export Dependence

The math is brutal for traditional exporters. Europe’s milk production has stumbled, hampered by Bluetongue disease and restrictive environmental regulations curbing farm growth. New Zealand, too, has been sidelined with lagging milk supply growth.

This should be good news for remaining exporters, right? Wrong. Instead of increased import demand, we’re seeing the opposite. Major growth markets are building local capacity faster than their consumption is growing.

This represents a massive market share loss happening in real-time for traditional dairy exporters who built their strategies around serving growing global demand.

The Technology Leapfrog Reality

Conventional thinking assumes emerging markets lag behind in the adoption of dairy technology. The reality is precisely the opposite—they’re leapfrogging directly to the latest innovations while traditional regions struggle with legacy system constraints. And honestly, watching established dairy regions cling to outdated assumptions while emerging markets race ahead is like watching someone insist their flip phone is “just fine” while everyone else has moved to smartphones.

Current Technology Benchmarks

Understanding this shift requires context from recent industry research. Smart calf sensors can reduce mortality by 40%, robotic milkers enable 20% yield increases through 3x daily milking cycles, and precision feeding systems reduce waste by 18%. Early adopters report ROI within 7 months.

These advances represent decades of gradual technology adoption and genetic improvement in traditional dairy regions.

The Emerging Market Advantage

What makes emerging markets fundamentally different is that they can access these same genetic and management tools immediately, rather than developing them over decades. Nestlé’s regenerative agriculture program in Brazil demonstrates this leapfrog advantage in action, involving 1,200 dairy farmers across Minas Gerais, Goiás, and São Paulo.

Farms implementing the program’s “gold” practices have reported over a 4% increase in dairy farming profitability, achieved by boosting corn silage production by more than 4% while simultaneously reducing costs by 8%.

It’s similar to how mobile phone adoption bypassed landline infrastructure in developing countries. Emerging dairy markets are bypassing the slow evolution of traditional farming systems and jumping directly to integrated, sustainable, technology-enabled operations.

The Component Quality Revolution

Here’s where traditional dairy’s obsession with volume over value becomes most apparent: While established producers celebrate incremental component improvements, Nestlé focuses on value-added products like infant formulas and growing-up milk products manufactured at their Ituiutaba plant.

They’re not producing more milk; they’re producing more valuable milk products. While traditional dairy farmers chase modest component premiums, multinational corporations target products commanding multiples of commodity milk pricing.

Think of it as the difference between selling Grade A milk at commodity prices versus processing it into specialty products. The raw material is identical; the strategic positioning transforms profitability entirely.

Regenerative Agriculture as Competitive Strategy

The conventional view treats sustainability as a compliance cost. Nestlé’s approach reveals how regenerative agriculture becomes a competitive weapon that simultaneously reduces costs, improves margins, and secures premium market access.

Documented ROI from Regenerative Practices

Nestlé’s regenerative agriculture program provides concrete ROI data that translates globally:

  • Profitability Increase: 4%+ for gold-certified farms
  • Input Cost Reduction: 8% through improved efficiency
  • Premium Pricing: 2-5% monthly milk price bonus based on certification levels
  • Environmental Benefits: 13% decrease in chemical fertilizer usage, 48% reduction in diesel consumption

Farmers receive 100% subsidized technical support in the first year, with Nestlé investing over $2.5 million in training over four years. These metrics demonstrate that sustainability programs can deliver measurable ROI, not just environmental benefits.

Implementation Barriers: The Reality Check Traditional Producers Need

Why This Matters for Your Operation: While the opportunities are compelling, understanding implementation challenges prevents costly mistakes and unrealistic expectations. Let’s be honest—if implementing these strategies was easy, everyone would already be doing it.

Financial Constraints and Capital Access

The most significant barrier facing traditional dairy producers isn’t a lack of information—it’s access to capital for meaningful technology adoption. The global robotic milking market is expected to increase from $2.98 billion in 2024 to $3.39 billion in 2025, with growth of about 14.0% annually, but initial investment requirements create cash flow challenges for operations managing tight margins.

Technical Support and Knowledge Transfer Gaps

Traditional dairy regions face a paradox: while they have extensive extension networks, these systems often lag behind in promoting cutting-edge technologies that emerging markets adopt immediately. Meanwhile, multinational corporations investing in emerging markets provide immediate technical support and training. Nestlé’s program includes monthly recommendations from agronomists and veterinarians, subsidizing 100% of specialized costs in the first year.

Market Access and Premium Capture Challenges

Perhaps most critically, traditional producers face challenges in capturing premiums for improved practices. Traditional regions often lack market mechanisms to capture sustainability premiums effectively, while emerging markets benefit from multinational corporations willing to pay premiums for certified sustainable milk.

ROI Reality Check Calculator

Evaluate your technology investment potential:

Current Annual Milk Production: _____ lbs Average Milk Price: $_____ /cwt
Current Feed Costs: $_____ /cow/day

Technology Investment Scenarios:

  • Precision Feeding (18% waste reduction): Potential annual savings = Current feed costs × 0.18 × herd size
  • Smart Monitoring (40% mortality reduction): Potential savings = Replacement costs × current mortality rate × 0.40
  • Robotic Milking (20% yield increase): Potential revenue = Current production × 0.20 × milk price

If your calculated potential returns exceed $500 per cow annually, you’re in the sweet spot for technology adoption.

Current Industry Context: June 2025 Market Realities

Global Production and Trade Shifts

Despite challenging economic conditions, Nestlé’s decision underscores its long-term confidence in Brazil, one of its top three markets globally. The company has “been here for 103 years and has seen it all,” maintaining a strong belief in the potential of the Brazilian market.

Technology Adoption Accelerating

A key focus of the new investment is the confectionery division, where Brazil is Nestlé’s largest market worldwide. The company plans to expand its Vila Velha factory, adding new production lines for chocolates, bonbons, and “chocobiscuits”.

Global Trade Flow Disruption

Traditional dairy regions operate on the assumption that global trade flows will continue following historical patterns. The evidence suggests we’re witnessing a fundamental restructuring of dairy trade relationships—and frankly, it’s about time traditional exporters stopped pretending otherwise.

Brazil’s total milk production reached 35.4 billion liters in 2024, up about 3% from the previous year, while consumption also increased, supporting farmgate milk prices with producers seeing an average real gain of 1.9%.

Nestlé’s investment specifically targets “mitigating the impact of rising raw-material costs and geopolitical tensions”. Translation: while traditional exporters remain vulnerable to freight costs, currency fluctuations, and trade disputes, multinationals are building regional self-sufficiency.

Strategic Positioning Framework: What This Means for Different Operations

For Large-Scale Commercial Dairies (1,000+ cows)

Investment Priorities with Verified ROI:

For Mid-Scale Operations (200-999 cows)

Technology Adoption Strategy:

For Smaller Operations (<200 cows)

Market Positioning Approach:

  • Niche market development: local organic, grass-fed, or artisanal products
  • Value-added processing: on-farm cheese, yogurt, or direct-to-consumer sales
  • Technology adoption focused on the highest ROI opportunities

The Controversial Questions Traditional Dairy Must Address

Is the current wave of multinational investment in emerging markets creating a two-tiered global dairy system?

The evidence suggests yes, and it’s time we stopped dancing around this uncomfortable reality. Farms integrated into multinational programs thrive with technical support, price premiums, and market guarantees. Those outside these systems face intensifying competition without comparable support structures.

Are traditional export strategies becoming obsolete?

When your biggest growth markets are systematically reducing their reliance on your products, calling it a “strategy” might be overly generous. Core import regions shift while export patterns remain unchanged, creating price pressure and market share battles among traditional suppliers.

Can sustainability programs become competitive weapons rather than compliance costs?

Nestlé’s regenerative agriculture program demonstrates how sustainability initiatives deliver measurable ROI while creating supply chain differentiation. This isn’t corporate virtue signaling—it’s strategic positioning in markets where sustainability commands premium pricing.

Future Implications: What 2025-2030 Holds

Technology Disruption Trajectory:

Trade Flow Evolution:

  • Movement from long-distance commodity exports to specialized, value-added products
  • Increased regional self-sufficiency reduces traditional export opportunities
  • Greater emphasis on intra-regional trade and localized supply chains

The Bottom Line: Strategic Imperatives for Dairy’s Future

While North American dairy farmers debate Federal Milk Marketing Order reforms and European producers navigate sustainability mandates, Nestlé’s $1.3 billion Brazil bet exposes a fundamental strategic blindness: the assumption that traditional dairy regions will remain the industry’s power centers.

The uncomfortable truth is that global dairy’s center of gravity is shifting irreversibly toward emerging markets that combine abundant resources, growing consumption, and increasingly sophisticated production capabilities.

Four Strategic Imperatives for Competitive Positioning:

  1. Abandon Volume Thinking: Component optimization and value-added products command premiums that resist global price pressure. Focus on quality over quantity—the commodity game is a race to the bottom that nobody wins.
  2. Invest in Technology Differentiation: With early adopters reporting ROI within 7 months, technology adoption becomes essential for competitive positioning, not optional enhancement.
  3. Develop Sustainability Competitive Advantage: Regenerative agriculture creates 4 4 44% profitability increases while reducing costs 8% in markets where sustainability commands premium pricing.
  4. Build Strategic Market Intelligence: Understanding specific regional preferences and emerging market dynamics beats generic export strategies focused on volume over value.

Your Implementation Roadmap

Start with component optimization and technology evaluation for your operation size. Early technology adopters report measurable returns, while sustainability programs deliver environmental and economic benefits.

However, address implementation barriers proactively. Secure financing before technology adoption, establish relationships with technical support providers, and investigate premium market access through cooperatives or direct marketing channels.

Next, evaluate your operation’s positioning using this framework: Can you quantify your component advantages, articulate your competitive position in sustainability, and identify specific market opportunities beyond commodity milk sales?

If not, you’re already behind the curve that multinational corporations are riding toward dairy’s profitable future.

The producers who thrive in dairy’s next chapter won’t be those who defend yesterday’s advantages, but those who recognize where tomorrow’s profit margins are being built—and position themselves accordingly.

The global dairy chessboard is being reset. The question isn’t whether you’ll adapt—it’s whether you’ll recognize the game has changed before your competitors do.

Your Action Challenge

Complete this Strategic Positioning Assessment within 7 days:

  1. Calculate your operation’s technology ROI potential using the framework above
  2. Identify three specific market opportunities beyond commodity sales
  3. Evaluate your vulnerability to export market disruptions
  4. Develop a 12-month implementation plan for your highest ROI opportunity

The producers who complete this assessment will position themselves for success. Those who don’t will continue playing yesterday’s game in tomorrow’s market.

Complete references and supporting documentation are available upon request by contacting the editorial team at editor@thebullvine.com.

Learn More:

Join the Revolution!

Join over 30,000 successful dairy professionals who rely on Bullvine Weekly for their competitive edge. Delivered directly to your inbox each week, our exclusive industry insights help you make smarter decisions while saving precious hours every week. Never miss critical updates on milk production trends, breakthrough technologies, and profit-boosting strategies that top producers are already implementing. Subscribe now to transform your dairy operation’s efficiency and profitability—your future success is just one click away.

NewsSubscribe
First
Last
Consent

China’s $4.8 Billion Dairy Pivot: Why ANZ Producers Have 90 Days to Lock in the Deal of a Decade

Waiting for “perfect market conditions” while competitors capture China’s $4.8B dairy bonanza? 90-day window = $1.5M revenue opportunity.

EXECUTIVE SUMMARY: The dairy industry’s methodical “wait and see” approach to international markets is costing producers millions while China’s $4.8 billion import surge creates the biggest trade realignment since EU quota elimination. March 2025 data reveals a staggering 23.5% year-over-year import explosion, with whey imports jumping 41.7% to 67,812 metric tons as Chinese buyers actively replace US suppliers with ANZ alternatives. New Zealand producers are already capitalizing with a documented $300 per tonne premium over competitors, while Australian cheese exports surged 30% by adapting to Chinese buyer timelines that demand sourcing decisions in weeks, not months. This comprehensive analysis exposes how traditional committee-driven decision making is becoming a liability in fast-moving global markets, where supply chain transparency and rapid response protocols now command premium pricing. Mid-sized operations processing 50 million pounds annually could capture $500,000-$1,500,000 in additional revenue through strategic 90-day market entry frameworks that challenge conventional risk-averse business culture. The evidence is clear: while most producers debate whether to act, forward-thinking operators are already building relationships that will define the next decade of global dairy trade. Stop letting perfectionism kill profitability – Chinese buyers are making sourcing decisions right now, and August trade policy deadlines won’t wait for your committee approvals.

KEY TAKEAWAYS

  • Premium Pricing Breakthrough: NZ-origin skim milk powder commands $300 per tonne premium ($0.27/cwt equivalent) through supply reliability positioning, proving that perceived stability now outweighs traditional cost competition in global markets worth $4.8 billion annually.
  • Speed-to-Market Revenue Multiplier: Chinese manufacturers sourcing 15,000+ tonnes whipping cream annually (equivalent to 25,000 high-producing cows) are requesting 5,000 additional tonnes with 3-week turnaround requirements, creating immediate opportunities for producers willing to abandon traditional procurement timelines.
  • Trade Flow Realignment Impact: With US skim milk powder exports to China hitting zero in February 2025 for first time since 2019, the 69% historical export drop pattern from previous trade wars is redistributing $584 million in annual US dairy exports to agile ANZ competitors who adapt business processes to Chinese buyer speed requirements.
  • Technology-Driven Competitive Advantage: Supply chain transparency systems providing real-time inventory visibility and product traceability are becoming non-negotiable requirements for Chinese buyers willing to pay premiums, transforming traditional “information hiding” approaches into obsolete competitive disadvantages.
  • ROI-Justified Implementation Framework: The verified 90-day market entry timeline ($75,000-$150,000 total investment) targeting high-value categories like cheese and cream offers documented potential returns of $500,000-$1,500,000 additional annual revenue for mid-sized operations willing to challenge conventional committee-driven decision making that’s proving too slow for global market realities.

The world’s largest dairy import market just reshuffled its supplier deck, and Australian and New Zealand producers have a narrow window to capture massive market share before the opportunity evaporates. Here’s how smart operators are already making their move.

Think of China’s dairy market like a 2,000-head rotary parlor that suddenly switched from a three-times-a-day milking schedule to twice daily. The throughput capacity is still there, but everything about timing, flow, and supplier relationships just changed overnight.

China’s $4.8 billion annual dairy import market is systematically severing ties with US suppliers. The ripple effects create the biggest trade flow realignment the global dairy industry has seen since the EU milk quota system ended in 2015.

But here’s what challenges conventional wisdom: this isn’t just another trade spat that’ll blow over in six months. This represents a fundamental realignment of global dairy flows happening faster than a fresh cow’s production curve spikes in early lactation.

Are you still waiting for “perfect market conditions” while your competitors lock in premium contracts worth millions?

Challenging the “Wait and See” Mentality: Why Speed Beats Perfection

Here’s where we need to challenge a deeply ingrained dairy industry practice. The methodical, risk-averse approach to market entry has served domestic markets well but is proving disastrous in China’s fast-moving environment.

Traditional dairy business culture prioritizes thorough analysis, committee approvals, and gradual market entry. That’s exactly the opposite of what Chinese buyers demand right now.

The Evidence Against Conventional Wisdom

Peter Verry from Peloris Global Services reports receiving urgent requests to source 300+ metric tons per annum of parmesan and cheddar cheese with just three weeks’ notice. Compare this to traditional dairy procurement cycles that often span months.

“The problem is that Australian businesses typically move a lot slower than that,” Verry explains. “They have a lot more red tape and departmental ticks to go through.”

This disconnect is killing opportunities while Chinese buyers make sourcing decisions in real-time. When did we become so risk-averse that we’re afraid to move at market speed?

What’s Really Happening in China’s Dairy Market?

Let’s cut through the noise with verified data. China’s dairy imports exploded by 23.5% year-over-year in March 2025 alone. Total dairy imports for the first four months of 2025 increased by 12% year-over-year, marking five consecutive months of growth.

But the real story isn’t just growth – it’s the dramatic shift in supplier preferences.

The Numbers That Matter to Your Operation

New Zealand has solidified its position as China’s dominant dairy supplier, with a 46% market share in early 2025. Their complete duty-free access through the Free Trade Agreement provides a crushing competitive advantage.

Product CategoryMarch 2025 PerformanceStrategic Impact
Whey+41.7% to 67,812 metric tonsEnough protein for 135,000 high-producing cows
Whole Milk Powder+30.7%Critical for food manufacturing expansion
CheeseRising demand continuing16% compound annual growth rate 2012-2022
ButterRecord highs achievedDriven by foodservice and baking expansion

Why This Matters for Your Operation: The Economic Reality

Are you still relying on domestic market stability while global opportunities multiply around you?

China’s domestic milk production plummeted, with farmgate prices falling to $19.40 per hundredweight – a decade low. This unsustainable pricing has forced smaller operations out of business, creating structural supply gaps.

Rabobank estimates a 5% reduction in China’s milk production for the second half of 2024 and projects a further 1.5% decline in 2025.

Chinese buyers are paying premiums for supply security that can transform operational profitability. NZ-origin skim milk powder now trades at a $300 per tonne premium over competitors.

That’s like getting an extra $0.27 per hundredweight just for being perceived as a reliable supplier.

The Technology Integration Advantage: Beyond Basic Traceability

The most successful ANZ producers in China aren’t just selling commodities. They’re providing transparency that Chinese buyers desperately want.

Challenging Traditional Supply Chain Thinking

Traditional approaches hide information from buyers to maintain negotiating leverage. Chinese buyers now demand the opposite: complete transparency and real-time visibility.

“We are receiving feedback from Chinese retail buyers that US products are being replaced on shelves with European and ANZ products,” Verry reports.

This level of visibility addresses a fundamental frustration in traditional Chinese distribution models. It’s like upgrading from visual cow observation to activity monitoring collars – the data-driven approach provides insights impossible to achieve manually.

Why are we still treating international trade like it’s 1995?

Implementation Timeline: Your 90-Day Window

Think of entering China’s market as a herd transitioning to robotic milking. Success depends on getting the timing, technology integration, and monitoring systems exactly right from day one.

PhaseDurationInvestment RequiredKey Objectives
Assessment & PreparationDays 1-30$15,000-$25,000Capability assessment, team establishment
Market Entry & RelationshipsDays 31-60$25,000-$40,000Intermediary engagement, specification development
Deal ExecutionDays 61-90$50,000-$100,000+Contract securing, system implementation

Days 1-30: Assessment and Preparation

Conduct rapid capability assessment for high-value products. Establish a dedicated response team with the authority to approve deals quickly.

Audit current supply chain transparency systems. Think about implementing comprehensive herd management software – you need complete visibility before optimizing.

Days 31-60: Market Entry and Relationship Building

Engage with established intermediaries who understand Chinese market dynamics. Develop product specifications aligned with buyer requirements.

Create rapid-response protocols for sourcing requests. Chinese companies move at emergency protocol efficiency – you need matching speed.

Days 61-90: Deal Execution

Focus on locking in supply agreements before potential tariff changes. Implement ongoing transparency and communication systems.

Build relationships with multiple Chinese buyers to diversify risk. Establish protocols for rapid scaling based on initial success metrics.

The Tariff Time Bomb: Racing Against August Deadlines

The window of opportunity comes with a ticking clock. China initially implemented a 10% tariff on US dairy products on March 10, 2025, skyrocketing to 125% by early April.

A temporary 90-day tariff reduction agreement lowered China’s retaliatory tariffs from 125% to 10%. However, this truce could collapse in August, potentially snapping tariffs back to punishing levels.

What Previous Trade Wars Teach Us

Historical analysis shows that when China imposed retaliatory tariffs on US dry whey in previous disputes, exports to China dropped 69% from peak to bottom. The difference now: Chinese buyers are actively seeking supply chain diversification.

This creates permanent structural advantages for ANZ producers regardless of tariff outcomes.

Global Market Context: The New Reality

The current China opportunity mirrors what happened during precision agriculture adoption in the 2010s. Early adopters of precision farming technologies achieved lasting competitive advantages that persist today.

European Competition Reality Check

EU producers face documented challenges, including biosecurity threats such as foot-and-mouth disease and bluetongue virus. These add “infection-risk premiums” to their products.

This creates quantifiable opportunities for ANZ producers to capture market share through reliability and safety positioning.

RegionKey AdvantagesMarket PositionCritical Challenges
New ZealandDuty-free access, $300/tonne premium46% market shareSupply constraints during peak demand
AustraliaProgressive tariff eliminationGrowing cheese market shareScaling production capacity
United StatesTraditional relationshipsMarket access is severely limited125% tariffs, relationship damage
European UnionProduct diversityMaintaining presenceBiosecurity risks, longer transport

Premium Opportunities: Where the Real Money Lives

While volume opportunities are impressive, challenging conventional commodity thinking reveals where the real money lies. China’s cheese imports reached their third-highest record in 2024.

Rabobank forecasts import demand could reach 270,000-320,000 tonnes by 2030.

Cream and Ingredients: The Hidden Goldmine

One Chinese manufacturer used 15,000 tonnes of whipping cream last year and recently requested an additional 5,000 tonnes. To put that in perspective, that’s equivalent to the annual cream production from roughly 25,000 high-producing dairy cows.

“We received an urgent request to source 300+ mtpa parmesan and cheddar cheese for a major product launch scheduled for August this year to replace the existing US sourced products,” Verry reports.

The Economic Impact: ROI That Justifies Bold Action

Let’s talk about numbers that matter to your bottom line. The premium pricing Chinese buyers pay for supply security justifies significant investment in market entry capabilities.

Investment vs. Returns:

  • Initial market entry: $75,000-$150,000 over 90 days
  • Technology systems: $25,000-$50,000 annually
  • Potential returns: $300 per tonne premium documented for NZ products
  • Volume opportunities: Individual contracts ranging from 300-5,000+ tonnes annually

For a mid-sized operation processing 50 million pounds of milk annually, capturing even a small share of China’s premium market could represent $500,000-$1,500,000 in additional annual revenue.

When was the last time you saw an investment opportunity with this kind of verified upside?

Risk Management: What Smart Operators Know

Every opportunity this significant comes with documented risks. Even with temporary tariff reductions, American dairy products continue to face substantial disadvantages in the Chinese market and are increasingly viewed as a “last resort supplier.”

Quality Control Scaling

Rapid scaling requires maintaining quality standards that took years to establish. This mirrors managing nutrition during rapid herd expansion – success depends on maintaining feed quality and monitoring systems.

Currency and Economic Volatility

The premium pricing Chinese buyers currently pay could erode if economic conditions change or domestic production recovers faster than expected.

Technology Implementation: Systems That Actually Work

The successful producers in China’s evolving market are those leveraging technology to provide transparency and speed up Chinese buyers demand.

Real-Time Systems That Work

Peloris Global Services has demonstrated success by providing producers with complete dashboards showing what’s being sold, where it’s being sold, and at what price points.

Chinese buyers are willing to pay premiums for this level of transparency. Think comprehensive herd management software for international trade.

Challenging Industry Orthodoxy: The Speed vs. Quality False Dichotomy

Here’s where we need to fundamentally challenge a core dairy industry belief: that speed and quality are mutually exclusive.

Research shows that automated systems actually improve quality while increasing speed when proper systems are in place.

The Evidence Against Traditional Thinking

Consider this: the US dairy industry achieved significant productivity gains while maintaining quality standards through rapid technology adoption. Speed of implementation was crucial to these gains.

Why should international market entry be different? The producers succeeding in China treat it like implementing a comprehensive precision dairy program.

When did “thorough” become code for “too slow to compete”?

Strategic Future Implications

Are you preparing for a fundamentally different global dairy market, or are you still planning based on pre-2020 assumptions?

China’s diversification creates permanent structural advantages for countries with stable trade relationships.

The Demographics Reality

China’s infant formula imports plummeted 35% due to declining birth rates. However, this demographic challenge drives growth in higher-value categories like cheese and butter that command better margins.

Think about it: Would you rather compete in a declining infant formula market or capture a share in premium cheese applications where China’s domestic processing capacity remains limited?

The Bottom Line: Evidence-Based Action Beats Perfect Planning

Remember that urgent question we started with about what $4.8 billion in suddenly available dairy imports looks like? You’re looking at the biggest market reshuffling since the EU milk quota system ended.

Chinese buyers are actively replacing US suppliers with ANZ alternatives. The window for capturing your share of this massive opportunity is measured in weeks, not months.

The producers who will dominate China’s dairy market five years from now are making their moves today. They’re adapting their business processes to match Chinese speed requirements. They’re investing in transparency systems that Chinese buyers demand.

But here’s what separates winners from watchers: Winners understand that success in China requires challenging fundamental assumptions about how dairy business should be conducted.

It’s like the difference between adding a few activity collars versus implementing a comprehensive precision dairy program that transforms every major decision.

The Evidence Is Clear

Multiple verified sources confirm that trade tensions are reshaping global dairy flows permanently. Historical analysis shows that delays cost more than imperfect action.

With Chinese domestic production struggling and farmgate prices at decade lows, every revenue opportunity matters. China’s massive import market is being redistributed, and early adopters maintain lasting competitive advantages.

Here’s the uncomfortable truth most producers won’t admit: While you’re debating whether to act, your competitors are already building the relationships that will define the next decade of global dairy trade.

They’re not waiting for perfect market conditions or committee approvals – they’re moving at Chinese speed because that’s what the market demands.

And here’s the question that should keep you awake tonight: If you’re not willing to adapt your business practices to capture premium opportunities, what makes you think you’ll survive when the next market disruption hits?**

The stakes are clear. Miss this window, and you’ll spend years watching competitors build the relationships and market position that could have been yours.

Act now, and you’ll be positioned to benefit from the most significant realignment of global dairy trade flows since trade liberalization began.

Your immediate next step: Contact established Chinese market intermediaries this week to assess your current capabilities and identify immediate opportunities. Don’t wait for perfect conditions – Chinese buyers are making sourcing decisions right now, and trade policy uncertainty isn’t negotiable.

The question isn’t whether you can afford to enter this market; it’s whether you can afford not to when competitors are already capturing premium pricing and building relationships that will define the next decade of the global dairy trade.

China’s dairy diversification isn’t coming – it’s here. The only question left is whether you’ll be part of it.

Complete references and supporting documentation are available upon request by contacting the editorial team at editor@thebullvine.com.

Learn More:

Join the Revolution!

Join over 30,000 successful dairy professionals who rely on Bullvine Weekly for their competitive edge. Delivered directly to your inbox each week, our exclusive industry insights help you make smarter decisions while saving precious hours every week. Never miss critical updates on milk production trends, breakthrough technologies, and profit-boosting strategies that top producers are already implementing. Subscribe now to transform your dairy operation’s efficiency and profitability—your future success is just one click away.

NewsSubscribe
First
Last
Consent

Export Obsession Creates Domestic Disaster: How New Zealand’s Butter Crisis Exposes the Fatal Flaw in Modern Dairy Strategy

Export-first dairy strategy is broken. NZ families make $7 butter at home while 95% of milk leaves the country. Smart ops balance local+global.

EXECUTIVE SUMMARY: The export-obsessed dairy model just crashed into reality when New Zealand families started churning their own butter despite 65% price spikes—not to save money, but to reject a system that prices out local communities. New Zealand exports 95% of its milk production worth NZ$22.6 billion while domestic consumers pay premium prices for basic dairy products, exposing the fatal flaw in commodity-focused strategies. This grassroots rebellion against global market dependency signals a critical shift toward food sovereignty that threatens export-dependent operations worldwide. Smart dairy operations are already building balanced portfolios: domestic market strength provides political insurance, premium positioning, and revenue diversification that pure export focus can’t deliver. The families making expensive butter aren’t nostalgic—they’re strategic, building resilience against supply chain disruptions while export-only operations face mounting political and market risks. Forward-thinking producers must assess their domestic market vulnerability immediately and develop dual-stream strategies before consumer revolt reaches their own communities. Don’t wait for your own butter crisis to discover that sustainable success requires serving the people who live next to your farms, not just the highest bidder globally.

KEY TAKEAWAYS

  • Export Dependency Creates Political Risk: Operations with 95%+ export focus face potential 30% tariff exposure and regulatory intervention when domestic consumers can’t afford local products—diversified market strategies reduce this vulnerability by 40-60%
  • Domestic Market Premium Positioning: Local provenance commands 15-25% higher margins than commodity exports while providing political insurance against trade policy changes—implement regional processing capabilities within 18-24 months
  • Consumer Sovereignty Trend Accelerating: 44% of households now produce their own food for control and quality, not just cost savings—develop premium local brands emphasizing transparency and ingredient control to capture this growing market segment
  • Technology Investment Parallels Market Strategy: Just as farmers invest in AMS systems for 120 measurements per cow per milking to gain control and data despite higher costs, consumers choose expensive DIY production for empowerment over pure convenience—align your market approach with this psychology
  • Strategic Risk Assessment Required: Calculate how global price volatility affects local affordability using the same data-driven approach you use for monitoring milk production trends—operations without domestic market analysis face the same blindness as breeding programs that ignore somatic cell counts
dairy export strategy, domestic dairy markets, dairy market diversification, dairy industry risk management, global dairy trends

New Zealand families are paying $7.42 for butter and making their own instead—not to save money but because an export-obsessed industry has priced out its own people. This grassroots rebellion against commodity-focused dairy reveals why domestic market neglect creates both political risk and massive missed opportunities for producers worldwide.

When the world’s 7th largest milk producer can’t afford its own products, the system isn’t efficient—it’s broken. Here’s why smart dairy operations must balance export profits with domestic stability before consumers revolt entirely.

The dairy industry just got its biggest wake-up call in decades, and it’s coming from an unexpected source: kitchen food processors in New Zealand.

When butter prices hit $7.42 for 500 grams—a staggering 65.3% increase in just 12 months (Stats NZ Food Price Data)—Kiwi families didn’t just complain and pay up. They fired up their stand mixers and started churning their own butter. But here’s the part that should terrify every export-focused dairy executive: they’re spending more money to make it themselves.

This isn’t about economics. It’s about control. And it’s a warning that export-obsessed dairy industries worldwide need to hear before their domestic markets explode.

What Happens When Your Own People Can’t Afford Your Product?

Let’s get one thing straight: New Zealand produces twenty times more dairy than its domestic market consumes. The country exports over 95% of its milk production, generating NZ$22.6 billion in dairy exports and accounting for 35% of total merchandise exports (USDA Foreign Agricultural Service New Zealand Dairy Report).

Yet families are rationing butter.

But here’s the question that should keep every dairy CEO awake at night: How did we get to the point where the people living next to our farms can’t afford what we produce?

The numbers paint a brutal picture of misplaced priorities. While New Zealand dominated global dairy markets, cheese prices jumped 24%, milk increased 15.1%, and food prices overall increased 3.7% in the 12 months to April 2025 (Stats NZ Food Price Data). These aren’t isolated price spikes—they’re the compound result of a system that treats domestic consumers as an afterthought.

This is what happens when you optimize for global commodity markets while ignoring the people who live next to your farms.

The butter churning trend exposes a fundamental contradiction in modern dairy strategy. Fresh cream required for churning costs $3-5 per liter, making homemade butter financially impractical for pure cost savings. Yet families are choosing expensive, time-consuming home production over affordable commercial alternatives.

Why? Because they’re rejecting the entire premise of export-driven agriculture that leaves domestic consumers vulnerable to global price volatility.

The Production Reality Behind the Crisis: When Efficiency Becomes Stupidity

To understand why this matters for your operation, let’s break down the production metrics that created this mess—and ask yourself: Are you making the same strategic mistakes?

New Zealand’s dairy sector is a powerhouse by any measure. Milk production is forecasted to be 21.3 million metric tons in 2025, down from the five-year average of 21.5 million metric tons (USDA Foreign Agricultural Service). The efficiency numbers look impressive, but here’s where the numbers reveal the fundamental problem: 98% of that high-quality milk leaves the country as exports while domestic consumers pay premium prices for the remaining 2%.

It’s like breeding for the highest Total Performance Index (TPI) scores and genomic merit, achieving excellent Estimated Breeding Values (EBVs) for milk production, and then selling all your replacement heifers to competitors while keeping the culls for your own herd. The strategy makes no economic sense when you consider the long-term sustainability of your operation.

Think about your own operation for a moment: If your local community couldn’t afford your milk tomorrow, how sustainable is your business model really?

Global Market Implications: What the Numbers Really Mean

Let’s put New Zealand’s crisis in a global context using current 2025 market data.

Australia’s milk production is forecast to grow 1.5% in the 2024-2025 season, reaching 8.8 million metric tons. The U.S. dairy export forecast for 2025 projects increases driven by butter and cheese exports, while New Zealand’s milk production is expected to drop to 21.3 million metric tons, down from the five-year average of 21.5 million metric tons (USDA Foreign Agricultural Service).

Here’s the critical insight: while production shifts globally, domestic affordability crises are becoming the norm, not the exception.

The U.S. faces its own challenges with Federal Milk Marketing Order (FMMO) reforms that took effect June 1, 2025, updating Class III and Class IV to make allowances and changing pricing formulas. The changes include updating make allowances for cheese (up to $0.2519), dry whey ($0.2668), butter ($0.2272), and nonfat dry milk ($0.2393), plus moving the butterfat recovery factor to 91% (Terrain Ag FMMO Analysis).

The Profitability Reality Check: When Export Focus Becomes Financial Risk

USDA’s 2025 dairy forecast projects milk production at 226.9 billion pounds, down 1.1 billion pounds from earlier estimates due to herd size and yield constraints. Despite these constraints, the all-milk price has been revised upward to $22.75 per cwt (The Bullvine USDA Analysis).

But here’s what the profitability data misses: none of these calculations account for domestic market stability or political risk.

New Zealand’s export-dependent model means that sudden trade disruptions could instantly transform profitable operations into financial disasters. Meanwhile, operations with strong domestic market positions have built-in political insurance and revenue diversification.

Think of it this way: relying solely on export markets is like breeding only for milk production while ignoring somatic cell counts (SCC). You might achieve impressive volume numbers, but one mastitis outbreak (or trade war) can devastate your entire operation.

When was the last time you calculated what percentage of your revenue depends on political decisions made in foreign capitals?

Technology and the DIY Revolution: What Your Data Isn’t Telling You

Here’s what makes this trend particularly interesting for progressive dairy operations: people are voluntarily choosing 30-minute manual processes over convenient store purchases. They’re accepting 5-7 day shelf lives instead of preserved products.

This mirrors what we’re seeing in precision agriculture adoption. Farms using IoT technologies are seeing 15-20% productivity jumps, slashing health costs by 30%, and making significant sustainability improvements (The Bullvine IoT Analysis). The same psychology driving families to make expensive butter drives farmers to invest in technologies that provide transparency and control, even when simpler alternatives exist.

The lesson: Consumers—whether they’re dairy farmers or butter buyers—increasingly value empowerment over pure convenience.

Here’s the critical question for your operation: If consumers are willing to pay more for control and transparency in their food, shouldn’t you build systems that give them exactly that?

The Financial Reality Nobody Wants to Discuss

The brutal truth about export obsession is that it creates unsustainable political and market risks that can destroy decades of investment overnight.

Fonterra’s recent Q3 2025 results showed an operating profit of NZ$1,017 million, a 17% increase, but this success masks underlying vulnerabilities. The company’s 2025/26 season opening forecast farmgate milk price is at NZ$10.00 per kgMS midpoint with heightened market volatility due to geopolitical tensions.

This creates a perfect storm of revenue risk and demands destruction that forward-thinking operations must address proactively.

The financial case for domestic market investment includes:

  • Risk Mitigation: Diversified revenue streams reduce exposure to trade policy changes
  • Margin Enhancement: Local premium positioning commands higher prices than commodity exports
  • Market Development: Investing in domestic demand creates long-term revenue growth
  • Political Insurance: Strong local relationships provide protection against regulatory intervention

How much of your business plan depends on politicians in other countries making decisions in your favor?

Why This Matters More Than Ever: The Technology Parallel

Three global trends make domestic market strength increasingly critical, and they directly parallel what progressive dairy farmers already understand about technology adoption:

Supply Chain Vulnerability: Just as farmers diversify their genetics portfolio to reduce disease risk, dairy operations need diversified market portfolios. Geopolitical conflicts and climate events can disrupt export markets instantly. Local market strength provides resilience when global systems fail.

Political Risk: Food sovereignty is becoming a political priority worldwide, similar to how environmental regulations increasingly impact dairy operations. Operations that strengthen local food security will benefit from policy support rather than face regulatory pressure.

Consumer Evolution: The families making expensive butter represent a broader shift toward values-driven consumption that prioritizes control, quality, and locality over pure convenience. This mirrors the trend toward premium dairy products with verified quality attributes—higher protein content, grass-fed certification, or specific butterfat levels.

Smart strategic planners recognize these trends aren’t temporary responses to economic pressure—they’re permanent shifts in consumer values that will define future market dynamics.

Implementation Strategies for Different Operation Types

Large Commercial Operations (1,000+ cows): Develop separate product lines and marketing strategies for domestic vs. export markets. Just as you separate high-genetic-merit animals for your breeding program, separate premium milk for local markets. Invest in regional processing capabilities that serve local communities while maintaining export scale.

Implementation timeline: 18-24 months for market development, with significant initial investment required depending on processing infrastructure needs.

Mid-Size Family Farms (250-1,000 cows): Build direct-to-consumer channels that capture retail margins and strengthen community relationships. Focus on quality differentiation rather than volume competition. This is like shifting from breeding for maximum milk volume to breeding for milk components and longevity.

Implementation timeline: 6-12 months for direct sales setup, with a moderate initial investment for on-farm processing and marketing capabilities.

Cooperative Structures: Balance member services between export revenue maximization and domestic market stability. Develop internal markets that protect local purchasing power, similar to how cooperatives already balance individual member needs with collective efficiency.

Are you ready to challenge the export-first orthodoxy that’s leaving communities behind?

The Innovation Imperative: Learning from Transition Management

The butter churning trend reveals something profound about consumer priorities that dairy farmers should recognize immediately: people value empowerment over efficiency when they feel exploited by existing systems.

This parallels what we know about transition cow management. During the critical transition period—three weeks before and after calving—cows need extra monitoring and care despite the additional cost and complexity. Smart farmers invest in transition cow technology, specialized nutrition programs, and dedicated facilities because they understand that short-term costs prevent larger long-term problems.

The same logic applies to domestic market investment. Yes, it’s more complex and potentially less profitable than pure commodity export focus. But the long-term benefits—political insurance, market diversification, premium positioning—justify the investment.

What if you applied the same proactive thinking you use for transitioning cows to your market strategy?

The Numbers Behind the Revolution

Let’s quantify what’s really happening in New Zealand’s dairy transformation:

Market IndicatorImpactStrategic Implication
Butter price increase65.3% in 12 monthsDomestic affordability crisis
Export dependency95% of productionExtreme global market exposure
Food price inflation3.7% annuallyConsumer trust erosion
Milk production forecast21.3 million metric tonsSupply constraints amid demand

These numbers tell a story of systematic domestic market failure that creates both immediate crisis and long-term strategic vulnerability.

The Technology Opportunity That Changes Everything

Here’s something that should make every dairy tech company sit up and take notice: people are voluntarily choosing 30-minute manual processes over convenient store purchases. They’re accepting 5-7 day shelf lives instead of preserved products.

Why? Because they want ingredient transparency and production control.

This creates massive opportunities for dairy operations willing to serve domestic markets with premium, locally-focused products. Forget the race to the bottom on commodity exports—there’s gold in serving people who value quality and locality over pure convenience.

The operations that capture these opportunities will build sustainable competitive advantages that transcend commodity price cycles.

What would happen if you designed your entire operation to empower local consumers instead of satisfy distant commodity buyers?

Challenging the Export-First Orthodoxy

Let’s be blunt about something the industry doesn’t want to admit: the export-first model is fundamentally broken when it creates food insecurity in producing regions.

This isn’t just bad economics—it’s bad strategy. When New Zealand’s government is considering grocery price freezes on essentials, including milk and bread, you know the political risks of export obsession are real and immediate.

The conventional wisdom says export markets offer higher prices and better margins. But what good are higher margins if they come with:

  • Political vulnerability to foreign trade policies
  • Consumer revolt that creates regulatory pressure
  • Market concentration risk that amplifies global volatility
  • Community alienation that undermines social license to operate

It’s time to challenge the assumption that more exports automatically mean better business.

The Bottom Line: Why Change Starts Now

New Zealand’s butter crisis exposes the fatal flaw in export-obsessed dairy strategy: when you price out your own people, you create political risk, market vulnerability, and consumer revolt that can destroy decades of investment.

The families churning expensive butter aren’t nostalgic—they’re strategic. They’re building skills, relationships, and systems that reduce their dependence on global commodity markets. Smart dairy operations will join them instead of fighting them.

Here’s what strategic planners need to do immediately:

  1. Assess domestic market vulnerability: Calculate how global price volatility affects local affordability, just as you’d assess how a disease outbreak would impact your specific genetic lines.
  2. Develop balanced portfolio strategies: Build revenue streams that serve both export and domestic markets, similar to maintaining breeding programs for both production and longevity.
  3. Invest in community relationships: Strengthen local connections before political pressure forces intervention, the same way you invest in cattle comfort before lameness becomes a herd problem.
  4. Create premium local positioning: Differentiate on quality, transparency, and locality rather than competing on commodity pricing. Market your milk’s butterfat content, protein levels, and production standards the way you market your genetics.
  5. Monitor consumer sovereignty trends: Track DIY adoption and local food movement growth in your market using the same data-driven approach you use for monitoring milk production trends.
  6. Challenge export orthodoxy: Question whether maximum export volume truly serves your long-term business interests or if balanced market development offers better risk-adjusted returns.

The revolution has already started. The question isn’t whether domestic food sovereignty will reshape dairy markets—it’s whether you’ll lead the transformation or become its victim.

Don’t wait for your own butter crisis to discover that sustainable success requires serving the communities where you operate, not just the highest bidder globally.

The future belongs to dairy operations that balance global opportunity with local responsibility—just like successful breeding programs balance production potential with genetic diversity. Make sure you’re building both.

Ready to challenge the export-first orthodoxy that’s creating political risk and missing massive opportunities? The choice is yours, but the clock is ticking.

Learn More:

Join the Revolution!

Join over 30,000 successful dairy professionals who rely on Bullvine Weekly for their competitive edge. Delivered directly to your inbox each week, our exclusive industry insights help you make smarter decisions while saving precious hours every week. Never miss critical updates on milk production trends, breakthrough technologies, and profit-boosting strategies that top producers are already implementing. Subscribe now to transform your dairy operation’s efficiency and profitability—your future success is just one click away.

NewsSubscribe
First
Last
Consent

America’s Butterfat Tsunami: How Smart Dairy Farmers Are Riding the Wave of 2025’s Component Revolution

Butterfat tsunami! 82M extra lbs are crushing old dairy models. Are you sinking or surfing? Your farm’s future depends on it. Time to wake up!

EXECUTIVE SUMMARY: The U.S. dairy industry is drowning in an unprecedented 82 million pounds of extra butterfat from Q1 2025 alone, a “fat revolution” that’s making the old playbook of chasing milk volume obsolete. While butter production has surged to absorb some of this creamy deluge, cratering ice cream demand is leaving even more sloshing around. This forces a make-or-break reliance on exports, particularly for cheese and butter, to prevent a catastrophic price collapse. For dairy farmers, this isn’t just another market swing; it’s a fundamental restructuring where focusing on component optimization, aggressive risk management, and shrewd contract negotiation is no longer optional but essential for survival. Clinging to outdated volume-centric strategies is a direct path to financial ruin in this new, fat-driven dairy economy.

KEY TAKEAWAYS:

  • The Volume Game is OVER: Prioritizing milk volume over component production (fat and protein) is a failing strategy in 2025’s butterfat-flooded market.
  • Adapt or Perish – Components are KING: Dairy farmers must aggressively optimize for butterfat and protein through genetics, nutrition, and management to capture premiums and remain profitable.
  • Export Lifeline is Non-Negotiable: The U.S. dairy industry’s stability now critically hinges on robust export markets for butter and cheese; any disruption spells domestic disaster.
  • Get Smart or Get Out – Rethink Everything: It’s imperative to audit milk contracts for component incentives, implement rigorous risk management (DMC, DRP, hedging), and align production with processor and export demands.
Dairy butterfat surplus, milk components, U.S. dairy 2025, dairy export strategy, cream prices

While the industry establishment wrings its hands over what to do with an unprecedented 82 million pounds of extra butterfat from Q1 alone, forward-thinking producers are leveraging this “fat revolution” to build resilience, capture premiums, and secure their future. The old playbook of chasing milk volume is dead- are you still following it?

The numbers don’t lie, and they’re jaw-dropping. American dairy cows are pumping out butterfat like never before, with first-quarter 2025 production shooting up by 82 million pounds, a 3.4% surge compared to Q1 2024. This isn’t a temporary blip but the culmination of a decades-long genetic revolution that’s fundamentally transformed what comes out of our cows.

Butterfat levels have vaulted from 3.70% to 4.40% over the past 20 years, while protein has climbed from 3.06% to 3.40%. This relentless pursuit of components has completely rewritten the economics of dairy farming. In Iowa, for example, producers are averaging a whopping 4.44% butterfat, delivering hundreds of millions of pounds of fat worth approximately $1.3 billion to processors.

What’s driving this component explosion? It’s a perfect storm of selective breeding, precision nutrition, and management practices all laser-focused on solids rather than volume. Recent USDA data shows March 2025 milk production increasing by a modest 0.9% compared to March 2024, with an additional 8,000 dairy cows bringing the national herd to 9.373 million head. But that production increase masks the real story, components are growing at a pace that’s utterly transforming milk’s composition and value.

The component revolution isn’t just changing milk- it’s reshaping the dairy manufacturing landscape and creating winners and losers throughout the supply chain. Like a farmer who spent decades selecting for high-yielding corn only to discover the market suddenly values protein content more than bushels per acre, dairy producers who focused solely on milk volume are finding themselves on the wrong side of this revolution.

Butter Production Surges, But Can’t Keep Pace with Fat Tsunami

Butter churns have been working overtime trying to absorb America’s cream surplus. Year-to-date butter production through March hit nearly 650 million pounds, jumping 5% compared to the same period in 2024 (adjusted for leap year). This increased production consumed an additional 25 million pounds of butterfat compared to last year, but it’s still not enough to handle all the extra fat flooding the system.

The latest USDA Dairy Products report shows March butter production reached 229 million pounds, an impressive 8.6% increase from March 2024 and 12.9% higher than February 2025. Butter manufacturers have been aggressively churning, motivated by ample cream supplies and strong export opportunities created by America’s significant price advantage in global markets.

Cream has been so abundant that multiple pricing mechanisms for cream relative to butter hit rock-bottom levels earlier this spring. Cream was trading at “fire-sale” prices, with multiples occasionally dropping below 1.00, making it cheaper than its intrinsic butterfat value. This created exceptional margins for butter manufacturers who could access this bargain-priced cream.

While cream multiples have begun to tick upward with the start of ice cream season, supplies remain plentiful for makers of fat-heavy dairy products, creating opportunities for processors who can quickly adjust their production strategies to capitalize on this abundance.

Shifting Fat Utilization: Why Ice Cream’s Stumble Matters

While butter production surged, several traditional butterfat users significantly reduced their consumption, contributing to the cream surplus. Most notably, ice cream makers dramatically pulled back production, with regular ice cream volumes plummeting 7.9% year-over-year in March to 60.3 million gallons. This steep decline meant 2.8 million pounds less butterfat was used in regular ice cream compared to March 2024.

The situation was even worse for low-fat ice cream, where March production of 35.4 million gallons represented an 8.9% year-over-year drop, releasing another 937,000 pounds of butterfat into an already saturated market. This unexpected weakness in ice cream production, typically a seasonal bright spot for cream utilization, exacerbated the butterfat surplus situation.

Similarly, cream cheese and Neufchatel production (with their hefty 34.44% milkfat content) fell by 6.3 million pounds year-to-date through March compared to the same period in 2024. This decline freed up an additional 2.2 million pounds of butterfat, further contributing to the surplus.

However, there have been some positive developments. Natural American cheese varieties, which have higher fat content than mozzarella, saw increased production year-to-date through March 2025. This growth absorbed approximately 15 million pounds of additional butterfat, relieving the oversupplied market.

The message is clear: traditional patterns of butterfat utilization are shifting rapidly, and both farmers and processors must adapt to these new realities or risk being caught on the wrong side of a fundamental market restructuring. It’s much like balancing a TMR ration when your forage analysis suddenly changes- the entire formula needs recalibration to reach optimal performance.

Exports: America’s Critical Pressure Release Valve

Here’s an uncomfortable truth many dairy leaders won’t admit publicly: without robust exports, the entire U.S. dairy pricing structure would collapse under the weight of our component surplus. With domestic butterfat production vastly outpacing consumption, export markets have become essential to maintaining market balance. In January and February 2025, U.S. butter exports totaled 18.6 million pounds, an extraordinary 84% increase over the same period in 2024 and the highest two-month start since 2014.

This export surge has been driven by America’s substantial price advantage in global markets. U.S. butter has been trading at over $1 per pound below global competitors in early 2025, creating an irresistible opportunity for international buyers. February butter exports alone jumped 126% year-over-year to 11.5 million pounds.

Similarly, cheese exports have been robust, with February export value surging 14% to $223.7 million. Strong growth markets included South Korea (volume up 40%), Japan (volume up 10%), Australia (volume up 37%), and Canada (volume up 19%).

However, this export success comes with significant risks. The current U.S. price advantage is directly tied to our domestic surplus- if global market conditions shift or trade barriers emerge, this critical outlet could quickly contract. Dairy industry leaders are actively working to maintain and expand market access, but geopolitical uncertainties, including potential new tariffs and complications from H5N1 testing requirements, threaten this vital pressure release valve.

Why aren’t more dairy farms developing export-oriented strategies? The butterfat tsunami has transformed exports from a “nice-to-have” market opportunity into an absolute necessity for maintaining domestic market balance. If export channels constrict, the consequences for U.S. dairy prices could be severe and immediate. It’s analogous to a farm that has expanded its milking herd but depends entirely on a single milk hauler- if that truck doesn’t show up, you’ve nowhere to put tomorrow’s production.

Price Outlook: Navigating Choppy Waters Ahead

The surge in butterfat production and resulting cream surplus have inevitably impacted dairy commodity prices and forecasts. The USDA’s April 2025 forecast for the all-milk price stands at $21.10 per hundredweight, down significantly from earlier projections. Class III milk prices are forecasted at $17.60/cwt, with Class IV at $18.20/cwt-both, both considerably lower than previous estimates.

For butter specifically, the USDA’s latest forecast puts 2025 prices at $2.445 per pound, substantially below global competitors, maintaining America’s export advantage but pressuring domestic returns. CME spot butter prices have hovered around $2.30-$2.33/lb, reflecting the abundant cream supply.

One bright spot for producers is the expectation of lower feed costs in 2025 compared to 2024, providing some relief to farm margins. Corn, soybean meal, and alfalfa hay prices are trending lower than in 2024, creating opportunities for producers to lock in favorable feed contracts and partially offset declining milk prices.

The component pricing system continues to favor high-solids milk, with butterfat valued at approximately $2.62 per pound under Federal Milk Marketing Order pricing. This underscores the growing economic imperative to maximize component production rather than simply milk volume, a message too many producers are still ignoring at their peril.

For the remainder of 2025, we can expect continued downward pressure on prices unless either export demand accelerates beyond current projections or domestic production moderates. The projected increase in cheese processing capacity coming online later this year may provide some support, but could also generate additional whey, potentially pressuring those markets.

Strategic Imperatives for Modern Dairy Farmers

Smart producers aren’t just watching this butterfat tsunami- they’re actively positioning their operations to ride the wave. Are you implementing these critical strategies, or are you still farming like it’s 2015? Here’s what leading farmers are doing right now:

  1. Component Optimization: Top operators are doubling down on genetics and nutrition to maximize fat and protein percentages. Every 0.1% increase in butterfat can add $0.15- indices that emphasize fat and protein PTA values, not just production PTAs. Consider breeds like Jerseys, Brown Swiss, or strategic crossbreeding programs that naturally excel in component production.
  2. Strategic Risk Management: With projected all-milk prices below $21.60/cwt, operations producing less than 24,000 pounds per cow annually may struggle to maintain profitability unless they aggressively manage risk. Lock in current favorable feed prices and utilize Dairy Margin Coverage and Dairy Revenue Protection programs to establish price floors. Think of these tools as the financial equivalent of a well-designed freestall barn-they won’t make you rich, but they’ll keep you protected when conditions turn harsh.
  3. Contract Optimization: Immediately audit your milk contracts to understand and maximize component premiums. Some processors offer significantly better component incentives than others, with premiums for butterfat ranging from 110% to 125% of Federal Order minimums depending on their product mix. Are you shipping to the same processor you’ve used for decades without exploring alternatives? Switching buyers could substantially impact your bottom line in this high-component environment.
  4. Production Efficiency: Focus relentlessly on feed efficiency and labor productivity. With milk prices under pressure, controlling costs becomes even more critical. Evaluate automation opportunities to address rising labor costs and consider postponing major capital expenditures until market conditions improve. Monitor your feed conversion efficiency (FCE) and income over feed cost (IOFC) metrics weekly rather than monthly.
  5. Processor Alignment: Understand the strategic focus of your milk processor. They’ll likely continue to value high-component milk if they’re primarily producing cheese or butter for export markets. Aligning your production with their needs can help secure better pricing or more stable market access. You should tailor your herd’s component profile to match your processor’s end products, as you’d select different corn hybrids for silage versus grain.

The Road Ahead: Navigating 2025’s Dairy Terrain

The current butterfat surplus isn’t a temporary anomaly- it’s the new normal in U.S. dairy. For the remainder of 2025, we expect continued high component production, volatile commodity prices, and absolute dependence on export markets to maintain balance.

Several key factors will shape the landscape:

  1. Processing Capacity Expansion: A significant new cheese processing capacity is scheduled to come online in 2025, potentially increasing demand for milk components. Michigan, Wisconsin, and Idaho facilities will add hundreds of millions of pounds of annual cheese production capacity. However, these plants will generate additional whey, which faces export challenges due to Chinese tariffs and other trade factors.
  2. HPAI Concerns: The ongoing presence of avian influenza in dairy herds remains a concern, potentially impacting milk volumes in affected states such as California and Texas and influencing export protocols. Biosecurity measures have never been more important, with many co-ops requiring comprehensive plans like those implemented during the FMD scares of previous decades.
  3. Global Dairy Market Dynamics: Rabobank forecasts modest global milk supply growth of 0.8% in 2025 across major exporting regions, which should help maintain relatively firm global dairy prices if U.S. production remains competitive. China’s forecast for reduced domestic milk production (-2.6% YoY) could influence its import demand for dairy products.
  4. Consumer Behavior: Evolving consumer preferences, including health and wellness trends, continue to impact demand for products like ice cream. The trend toward more at-home meal consumption could bolster grocery sales of dairy products, though foodservice demand has shown some weakness in early 2025.

The harsh reality is that the rules of the dairy game have fundamentally changed. The component revolution isn’t just another market cycle- it’s a structural transformation that requires new thinking and strategies. Have you made the necessary adjustments to your operation, or are you still clinging to outdated models prioritizing volume over components?

For producers who adapt quickly, focusing on component optimization, export-oriented production, and sophisticated risk management, the current market presents opportunities despite its challenges. The road ahead will be increasingly difficult for those who cling to outdated volume-focused models.

The Bottom Line

The butterfat tsunami is here. The question isn’t whether it will impact your operation, whether you’ll be crushed by the wave or learn to ride it to greater profitability and sustainability.

The stakes couldn’t be higher. A seemingly modest $1.00/cwt drop in the all-milk price can slash annual revenue by $125,000 for a 500-cow dairy producing 25,000 pounds per cow. That’s the difference between profitability and financial distress for many operations.

However, this component-driven market also creates unprecedented opportunities for those who adapt. As progressive dairy farmers once shifted from tie-stall barns to freestall facilities or conventional milking parlors to robotics, today’s successful operators will pivot from volume-focused production to component-maximizing strategies. The genetics, nutrition, and management knowledge to dramatically boost butterfat and protein production exists today. The processors and export markets hungry for these components are actively seeking suppliers. The tools for effective risk management are available.

It’s time to choose- continuing business as usual is not an option. Will you reinvent your operation to thrive in the component economy, or will you be one of the operations that don’t survive this transformation? Take action now:

  1. Schedule a meeting with your nutritionist and geneticist on component enhancement strategies.
  2. Evaluate your milk marketing options and contact multiple processors to compare component premiums.
  3. Implement a formal risk management program that protects your milk price and input costs.
  4. Attend export-focused dairy seminars to understand how global markets will impact your farm, even if you never ship products internationally.

The future belongs to those who recognize that the butterfat revolution isn’t a threat but an opportunity you dare to change. What will you do differently tomorrow?

Learn more:

Join the Revolution!

Join over 30,000 successful dairy professionals who rely on Bullvine Weekly for their competitive edge. Delivered directly to your inbox each week, our exclusive industry insights help you make smarter decisions while saving precious hours every week. Never miss critical updates on milk production trends, breakthrough technologies, and profit-boosting strategies that top producers are already implementing. Subscribe now to transform your dairy operation’s efficiency and profitability—your future success is just one click away.

NewsSubscribe
First
Last
Consent
Send this to a friend