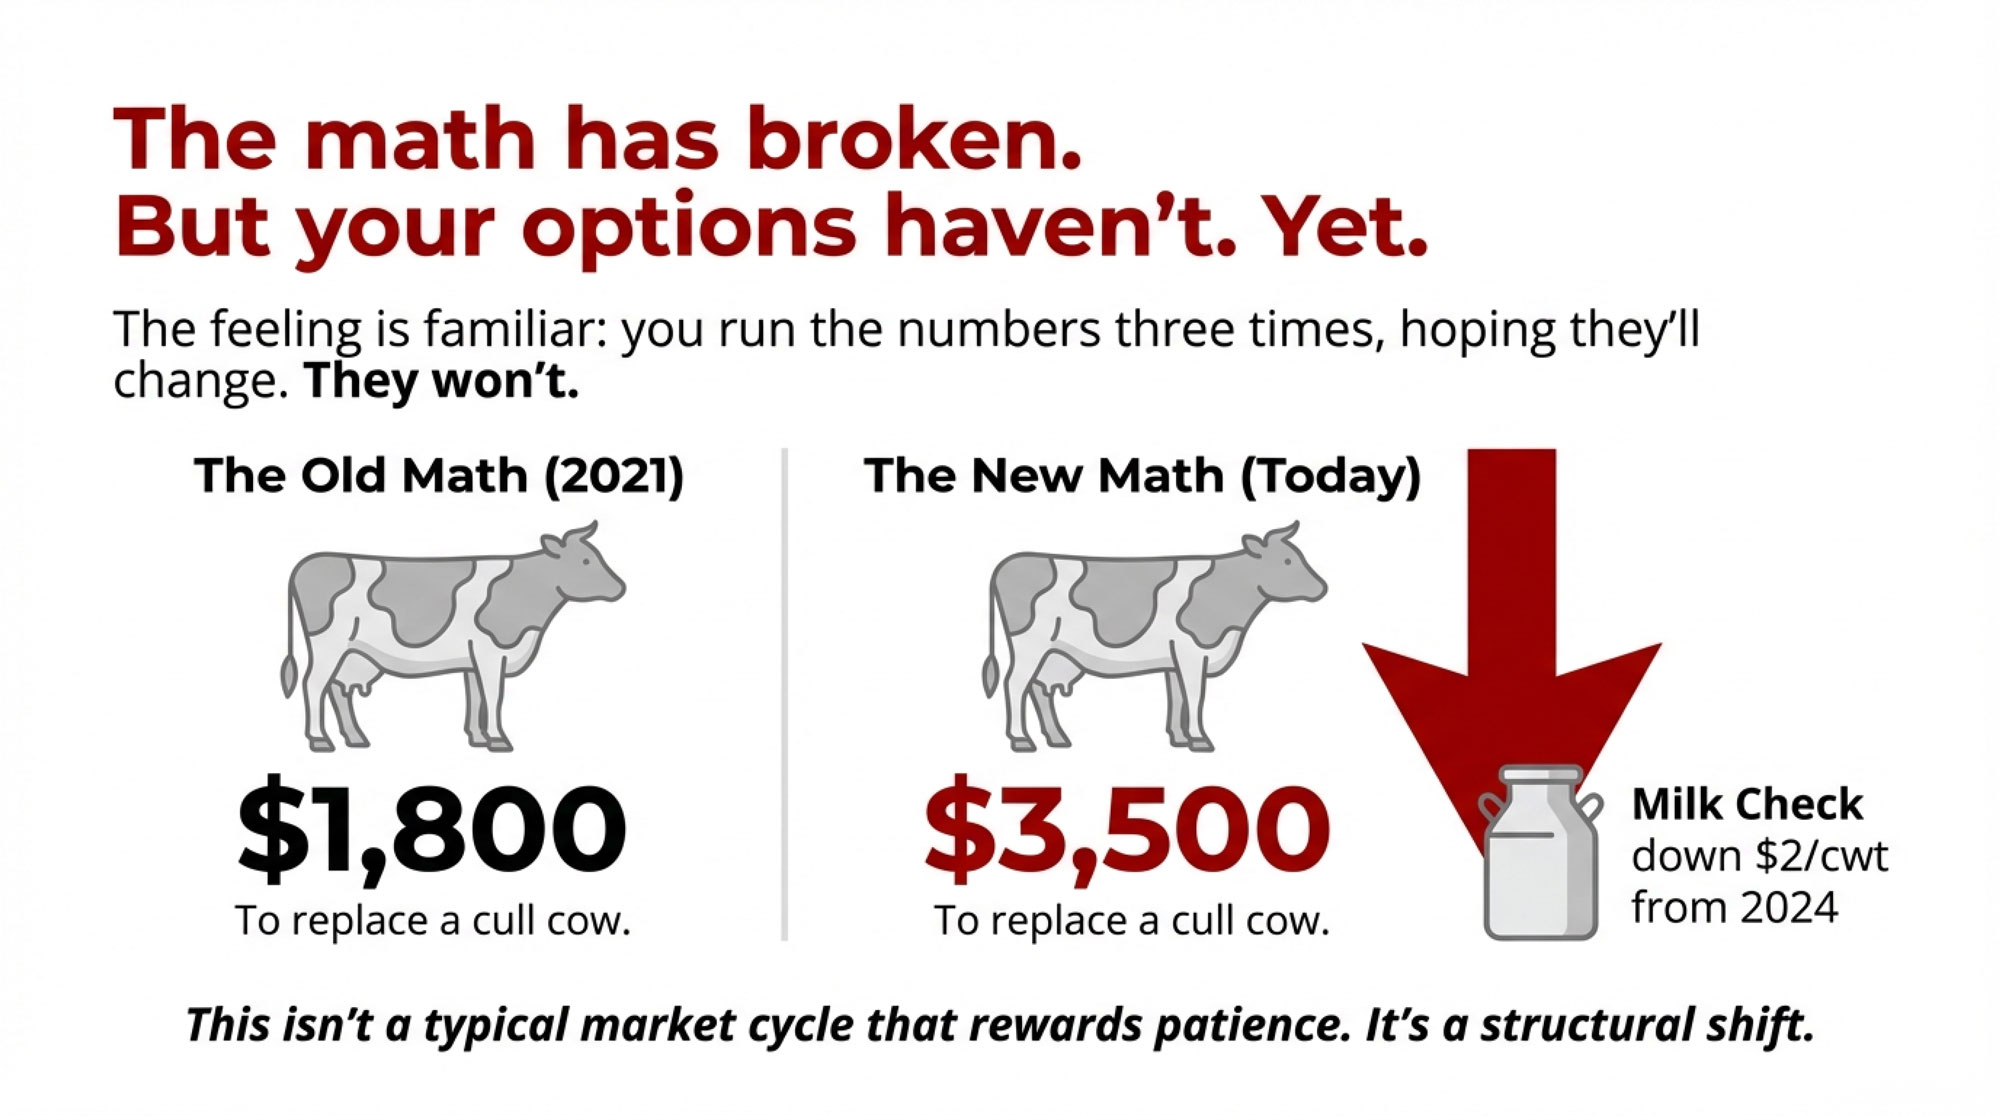
You’ve run the numbers three times, hoping they’d change. They won’t. For 300-1,000 cow dairies, the math has broken—but your options haven’t. Yet.
Executive Summary: The economics that sustained mid-size dairy farming are disappearing faster than most producers realize. Heifer prices have tripled since 2019, milk is down $2/cwt from 2024, and component pricing is shifting from butterfat to protein—meaning genetics selected two years ago are now optimized for a vanishing market. For 300-1,000 cow operations, this creates a structural squeeze: too large for specialty positioning, too small for automation to be economically viable. With USDA reporting the lowest heifer inventory since 1978 and Rabobank projecting 2,800 farm closures this year, the pressure is real and accelerating. The paths forward—organic transition, cooperative processing, strategic scaling, or well-timed exit—all require decisions within 12 months. Here’s the verified data, honest analysis, and practical framework you need to choose your path while options remain open.

You know that feeling when you run the numbers three times, hoping they’ll come out different? I was sitting with a third-generation Wisconsin dairy farmer last month, and he did exactly that—pulled out his calculator, punched in the same figures again, shook his head.
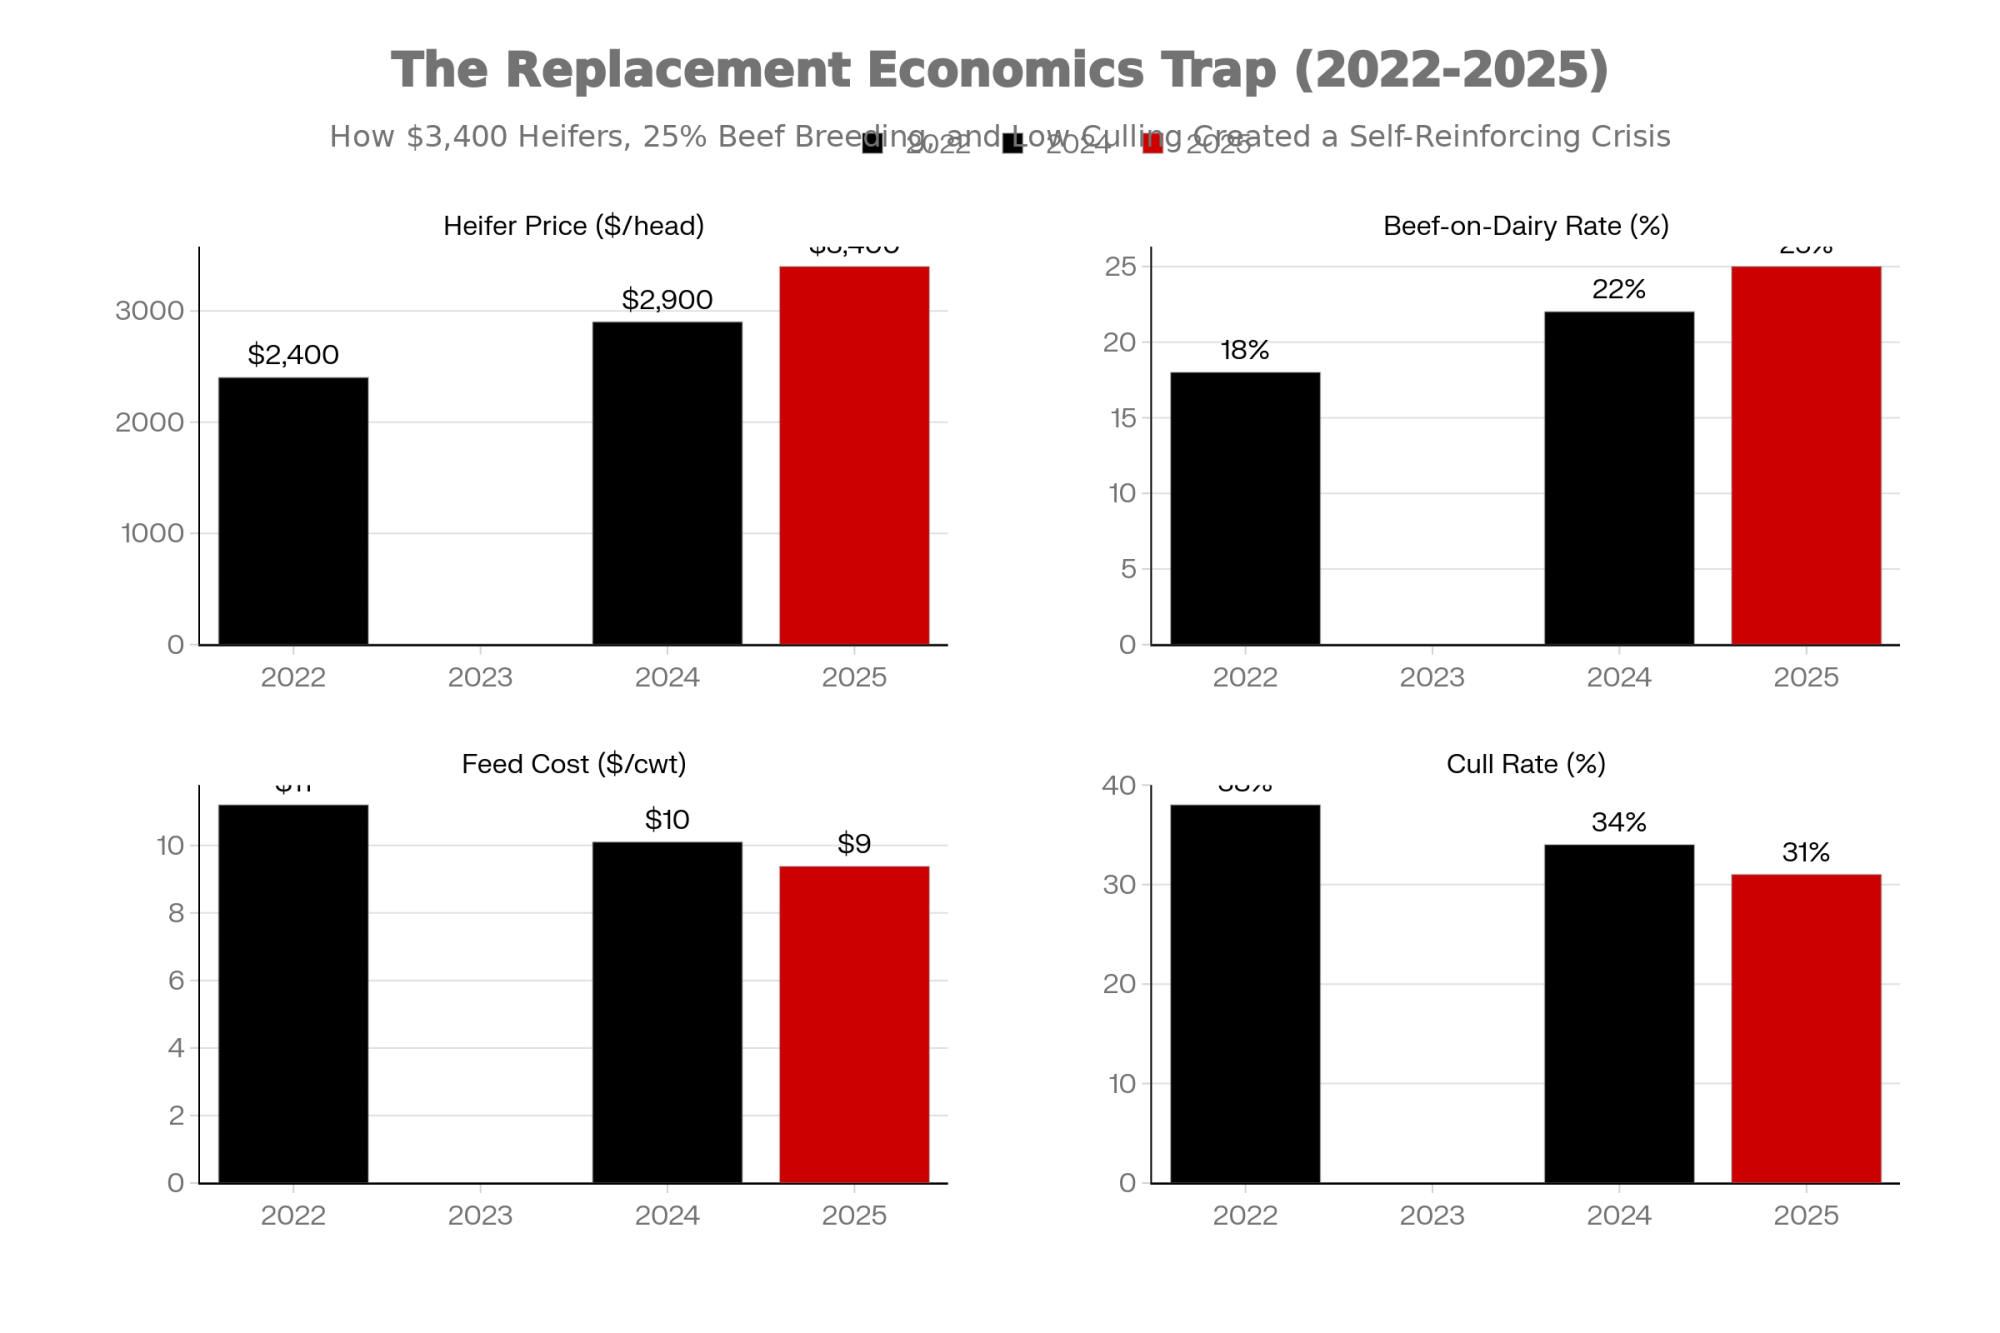
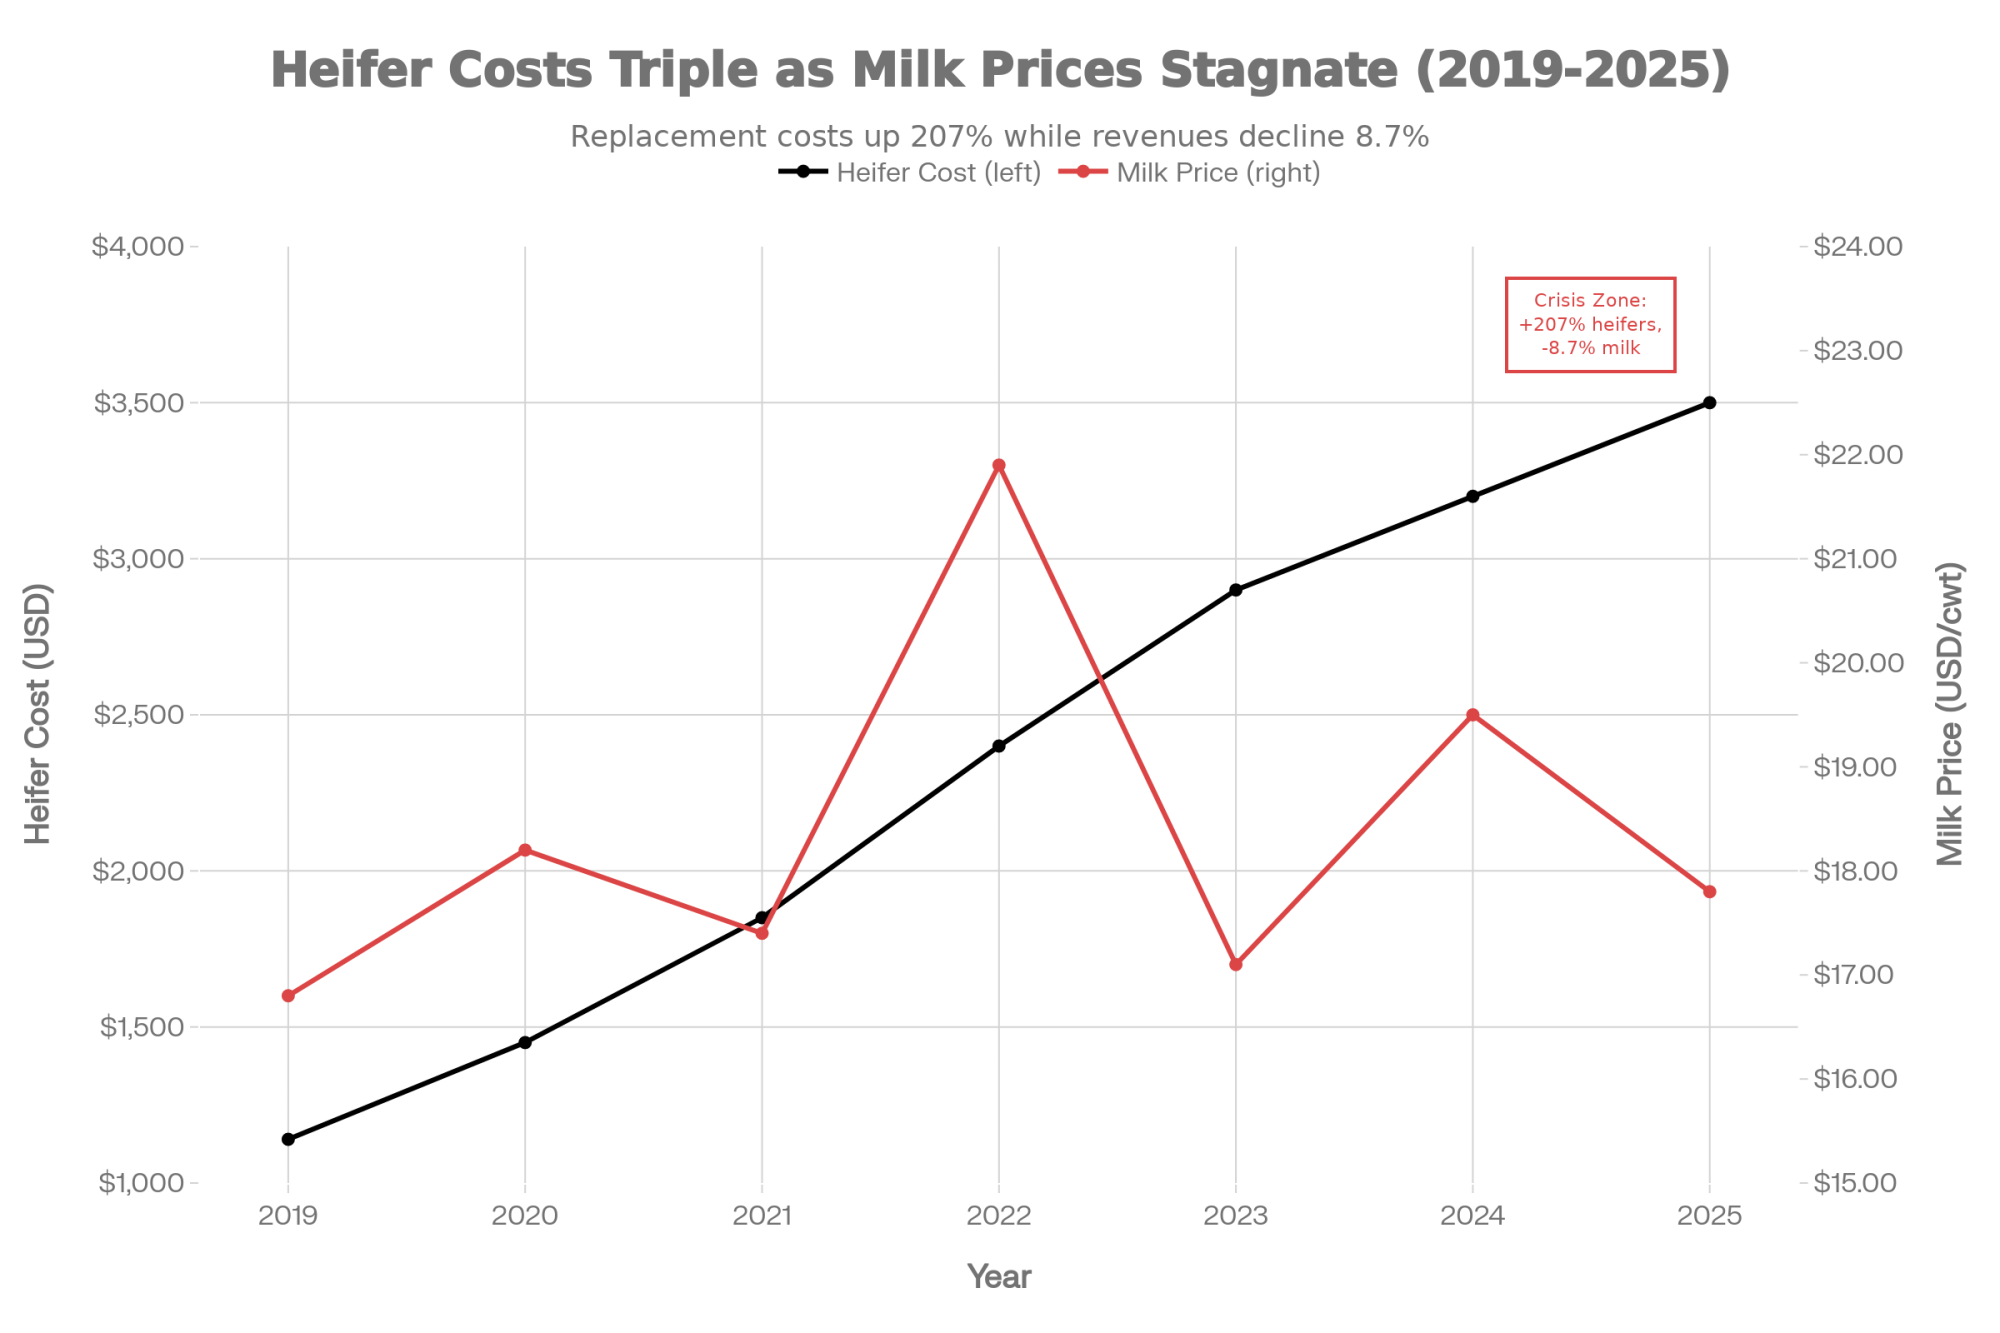
“Three years ago, I could replace a cull cow for eighteen hundred dollars and still make it work,” he told me. “Now I’m looking at thirty-five hundred, and my milk check is down almost two dollars from where it was. Something fundamental has shifted.”
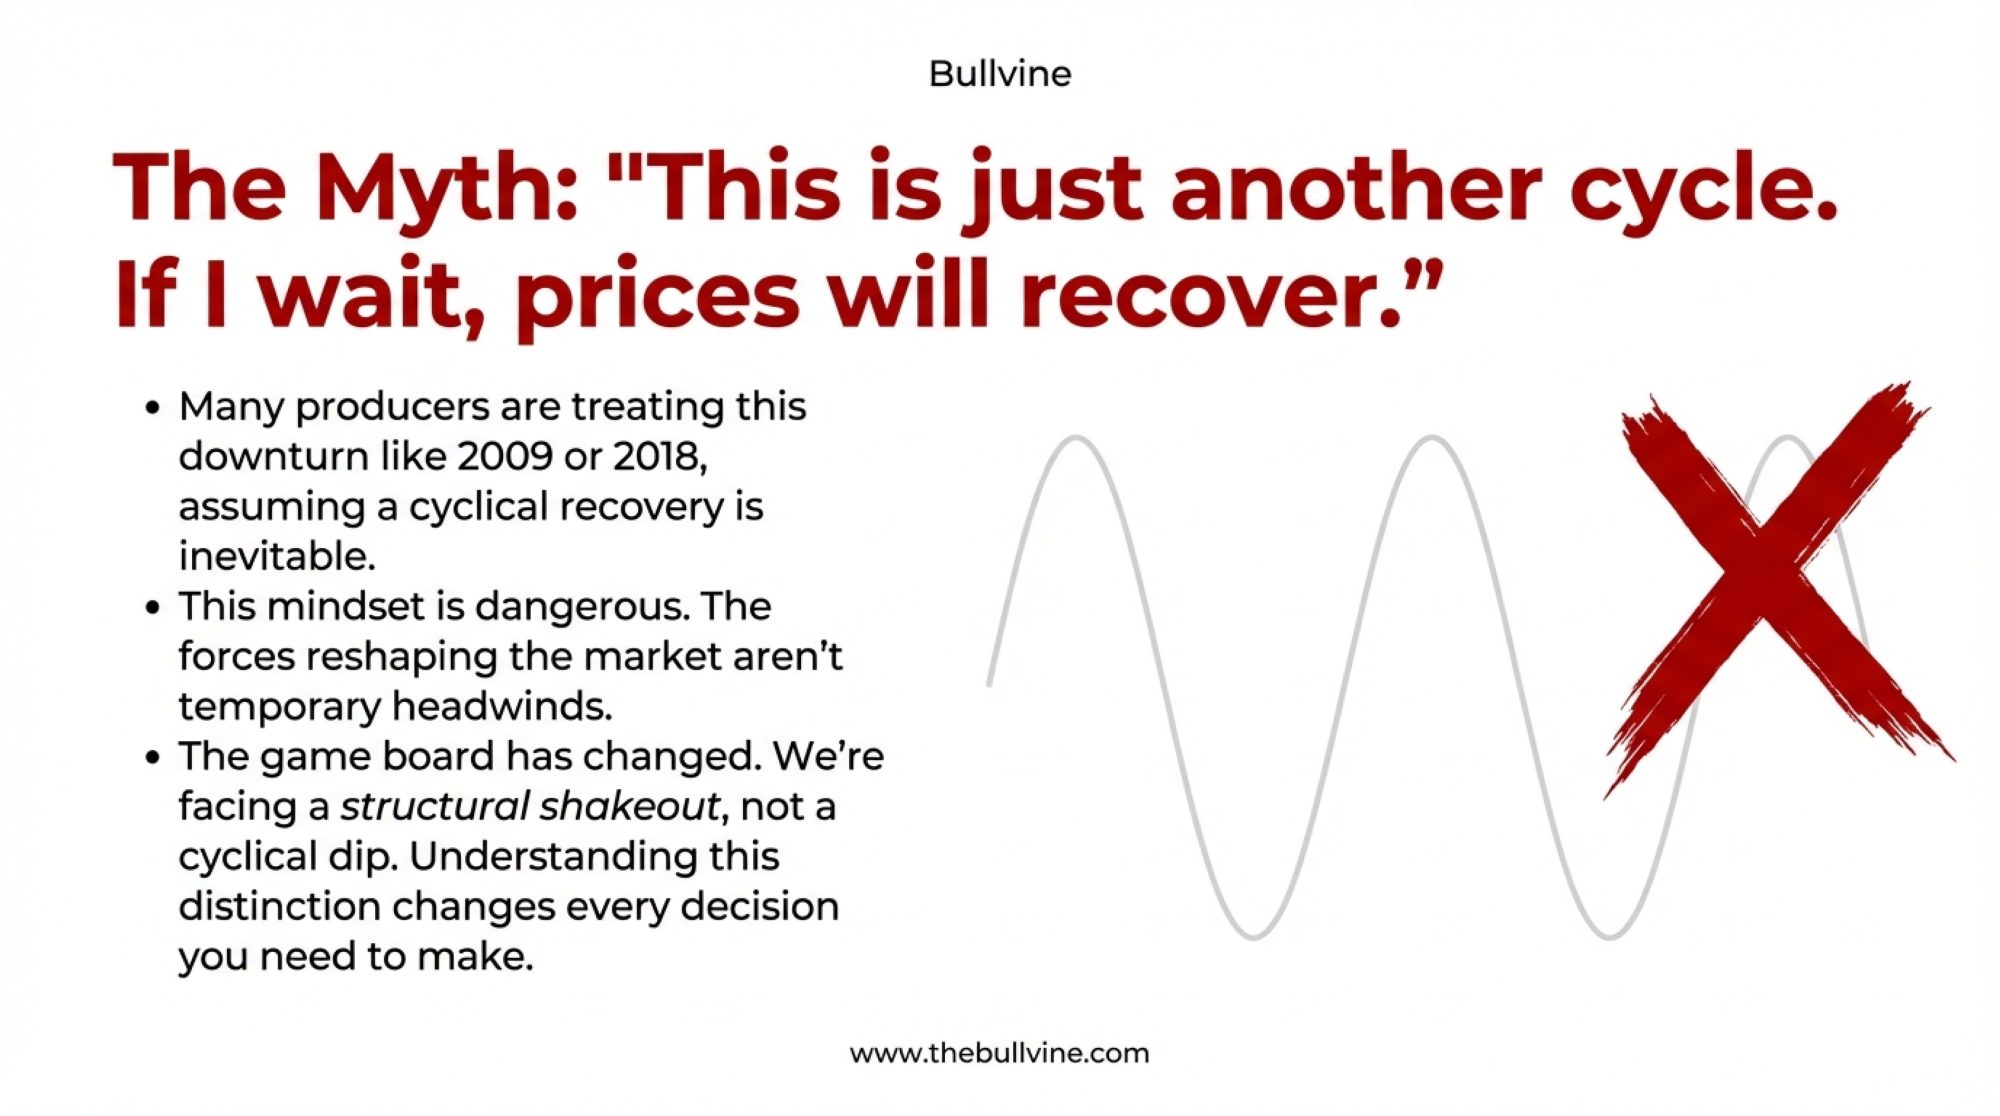
He’s right. And here’s what I’ve been seeing across the industry this year: what’s happening right now isn’t a typical market cycle that rewards patience. Several structural forces are converging at once, creating conditions that favor operations at the extreme ends of the scale spectrum—the very large and the strategically small—while putting real pressure on the traditional middle that’s defined family dairy farming for generations.
I share that not to be pessimistic, but because I think you deserve honest information while meaningful options are still available. And frankly, there are options worth exploring.
What’s Actually Going On
Let me walk through what the data shows, because the way these factors connect matters as much as any single one.
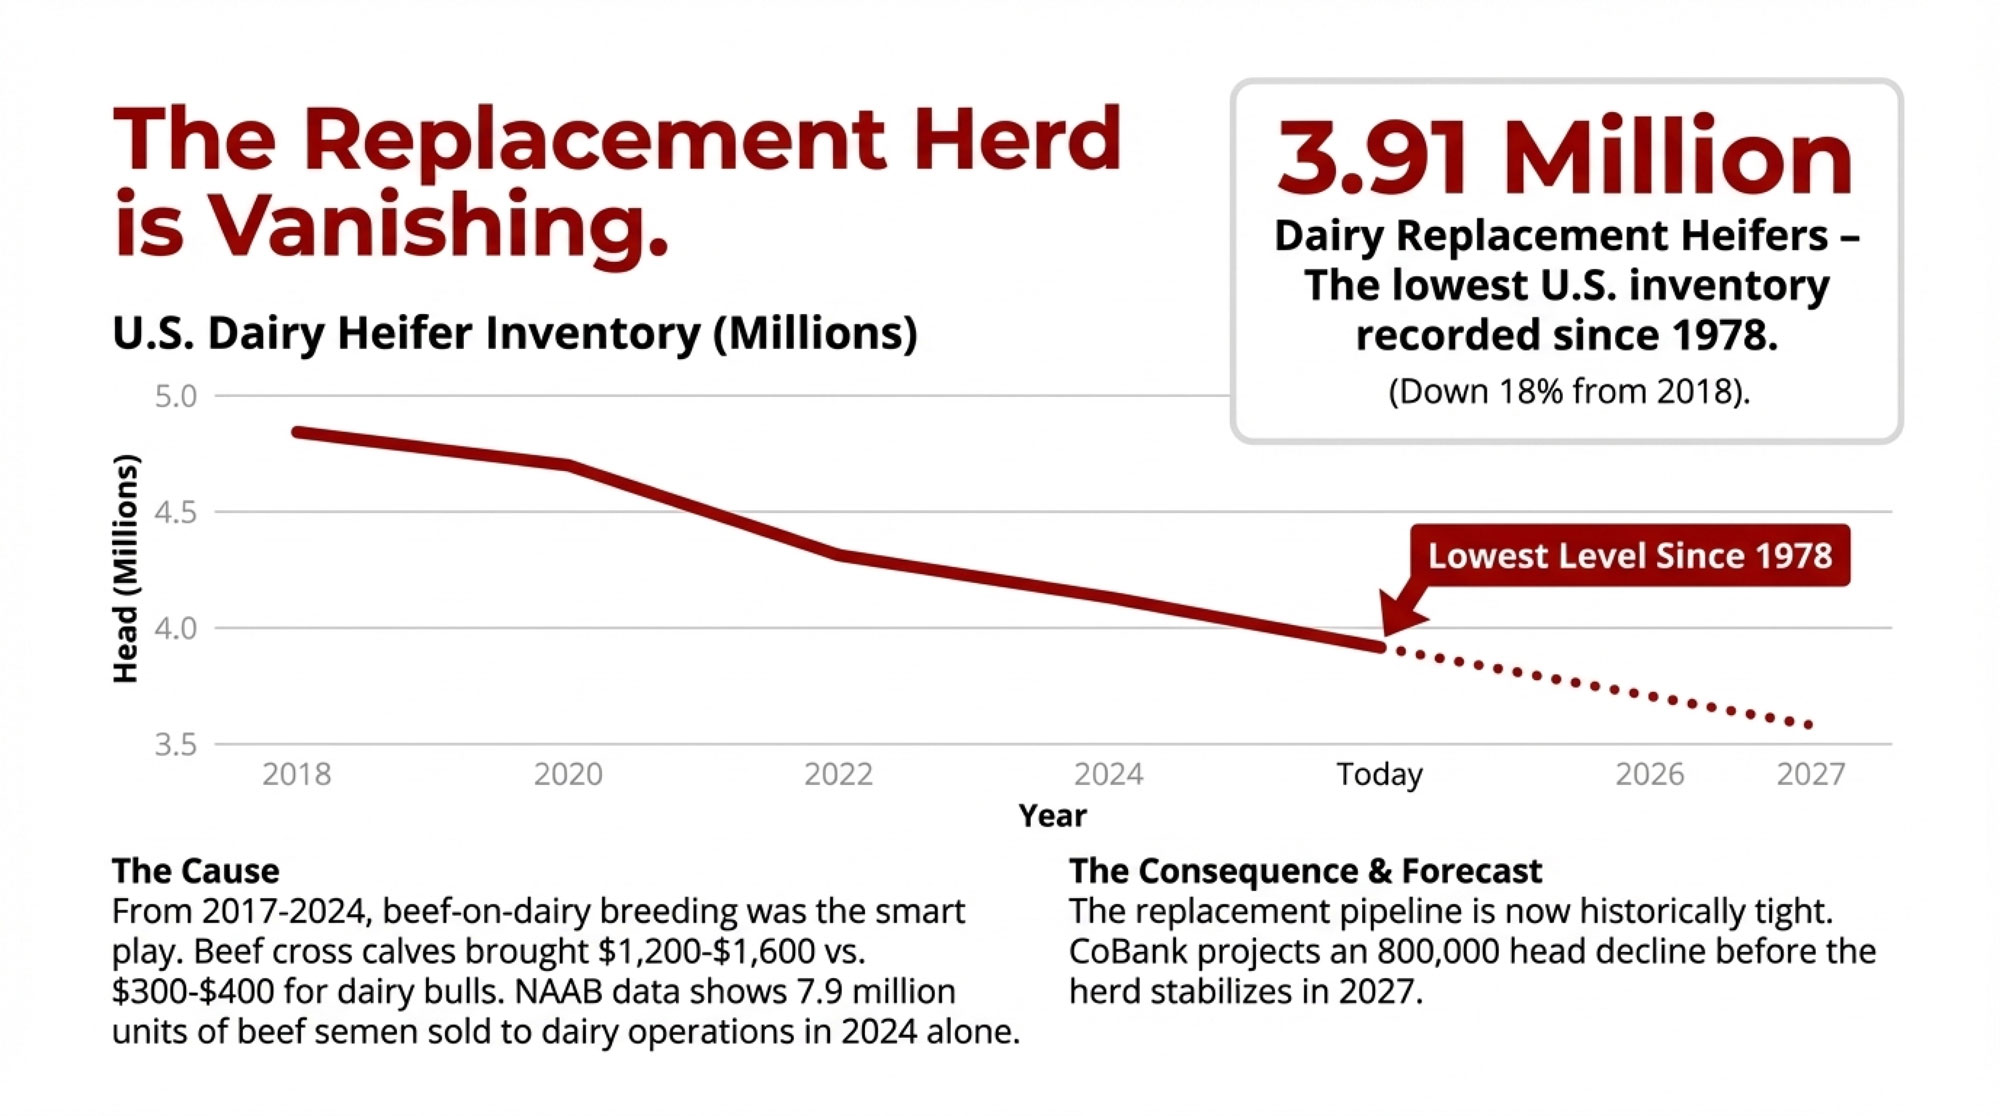
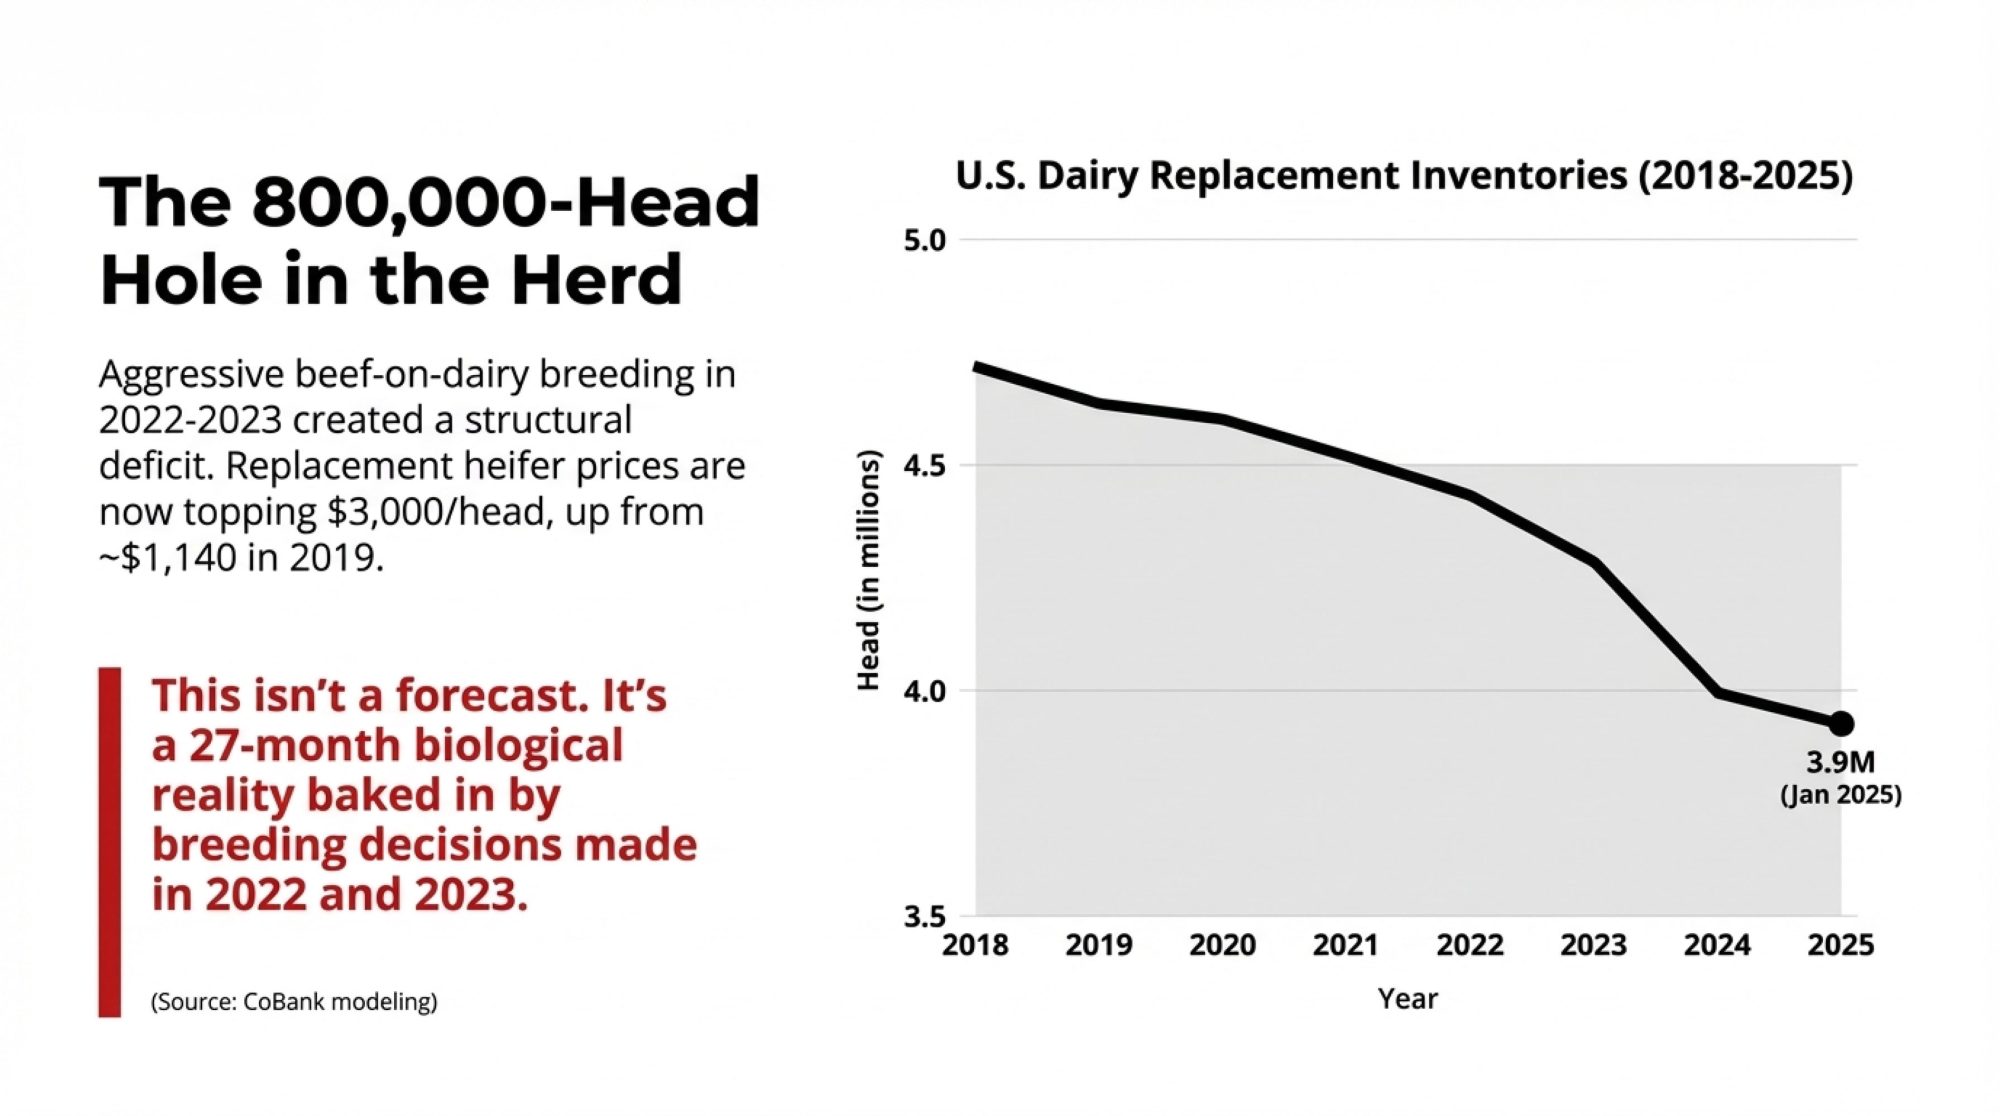
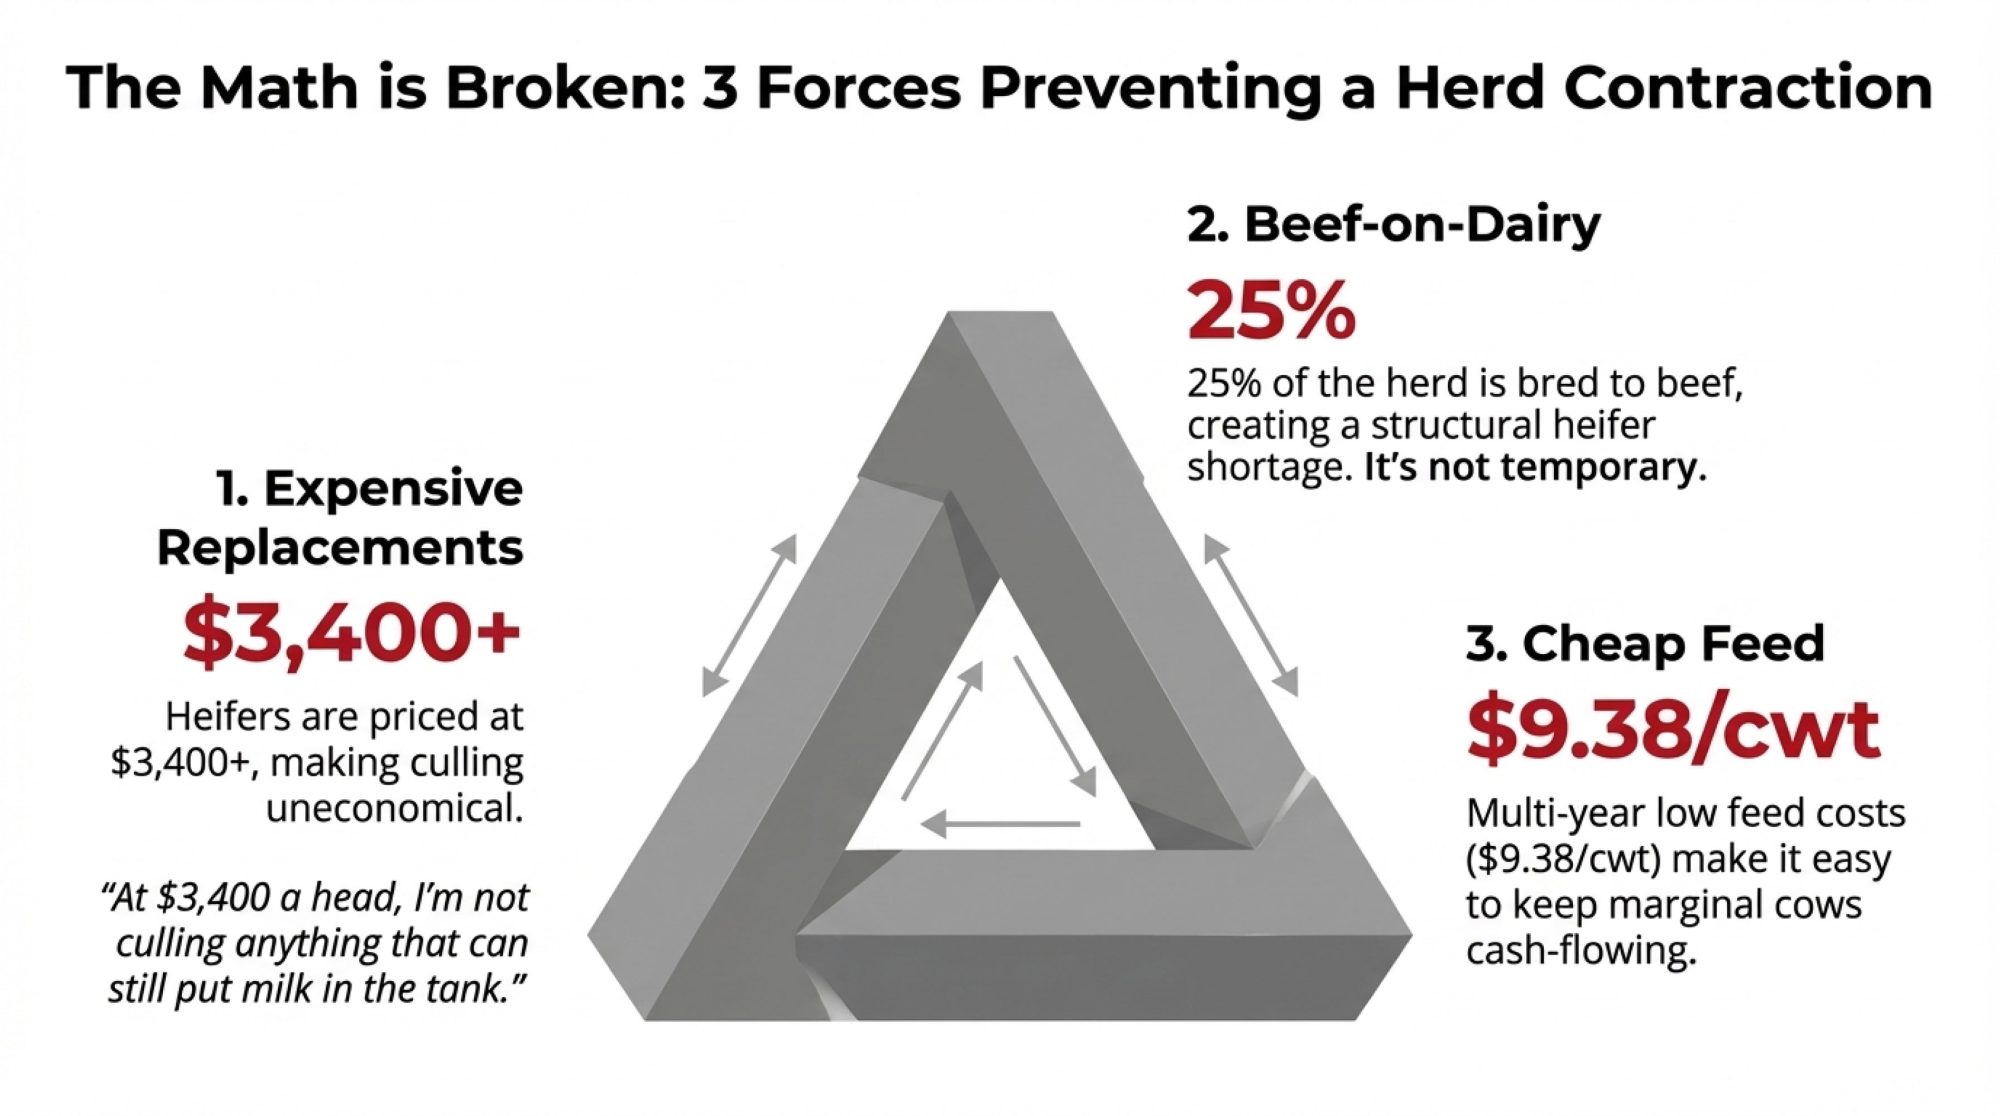
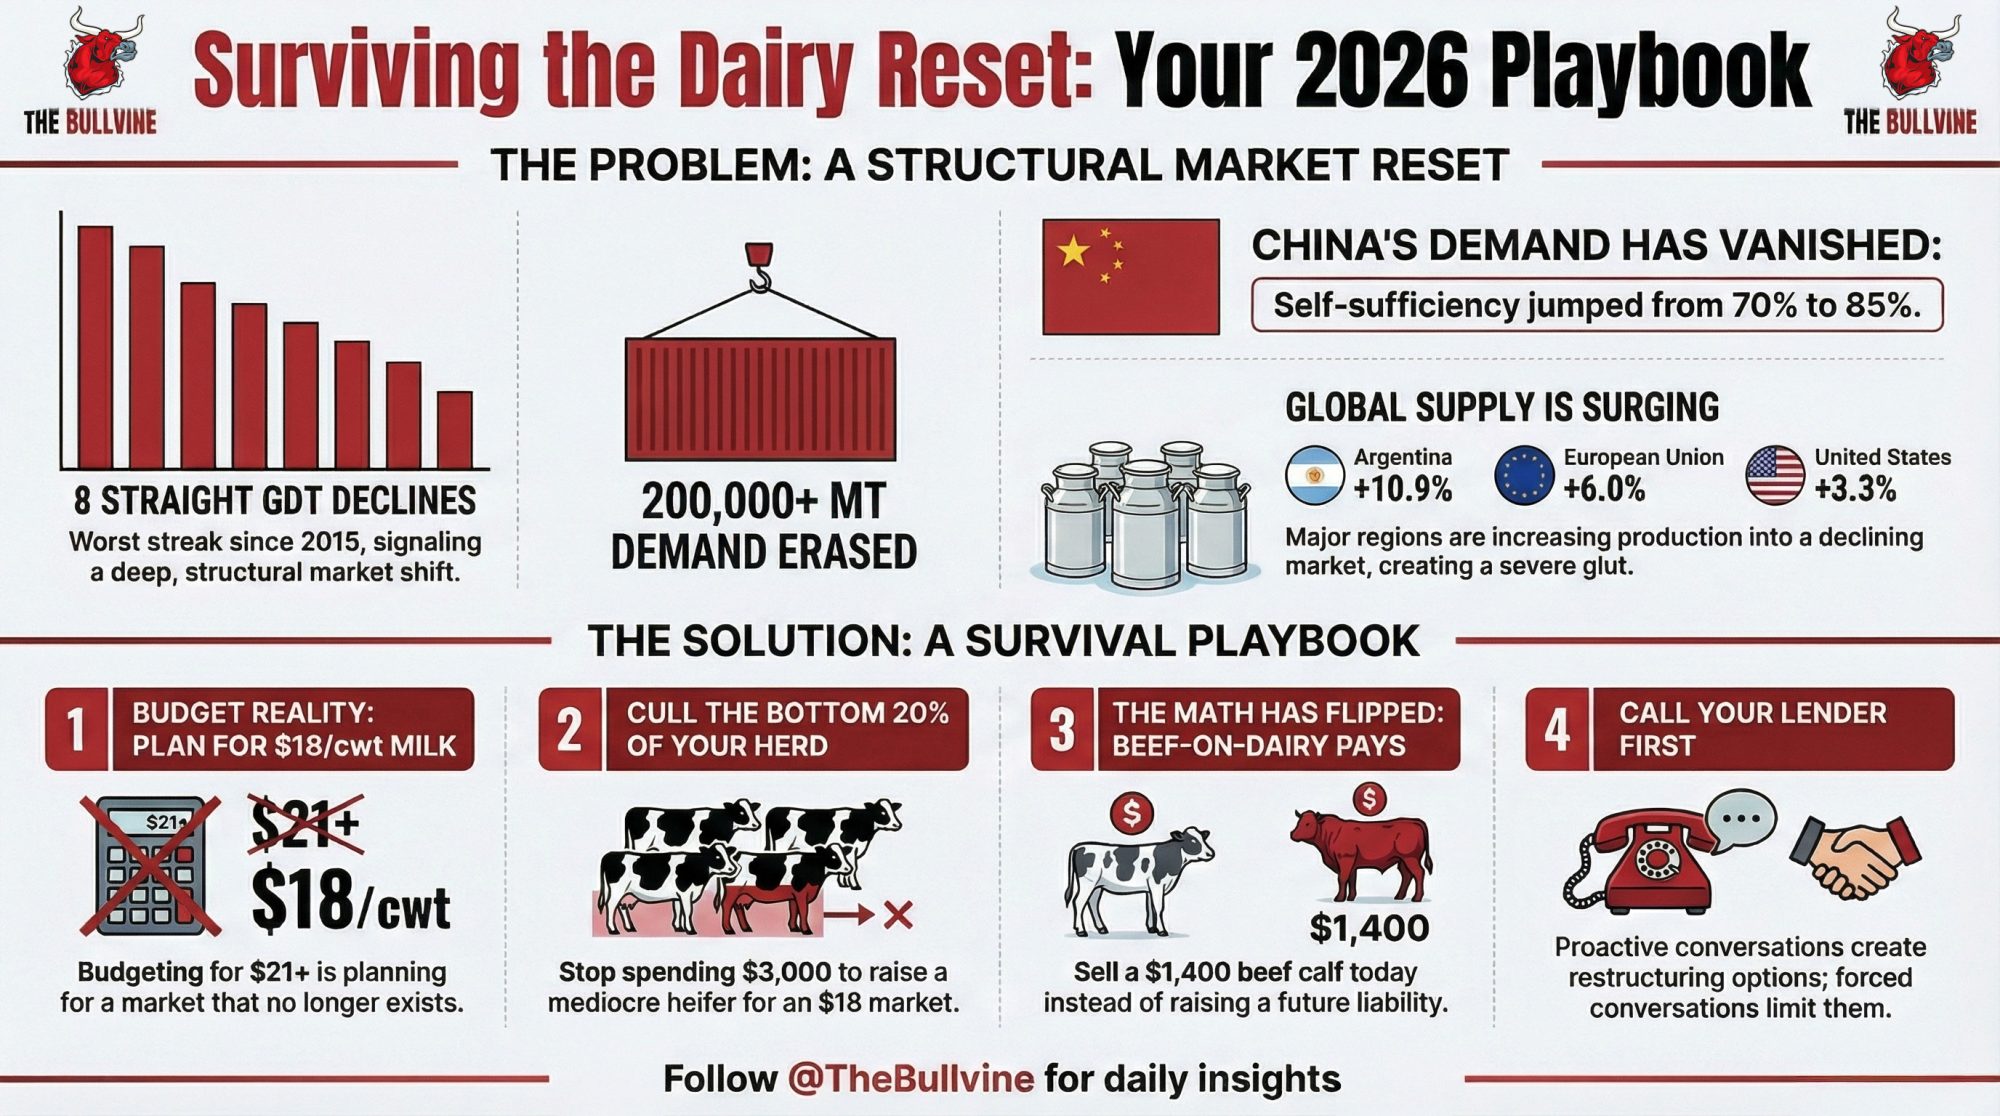
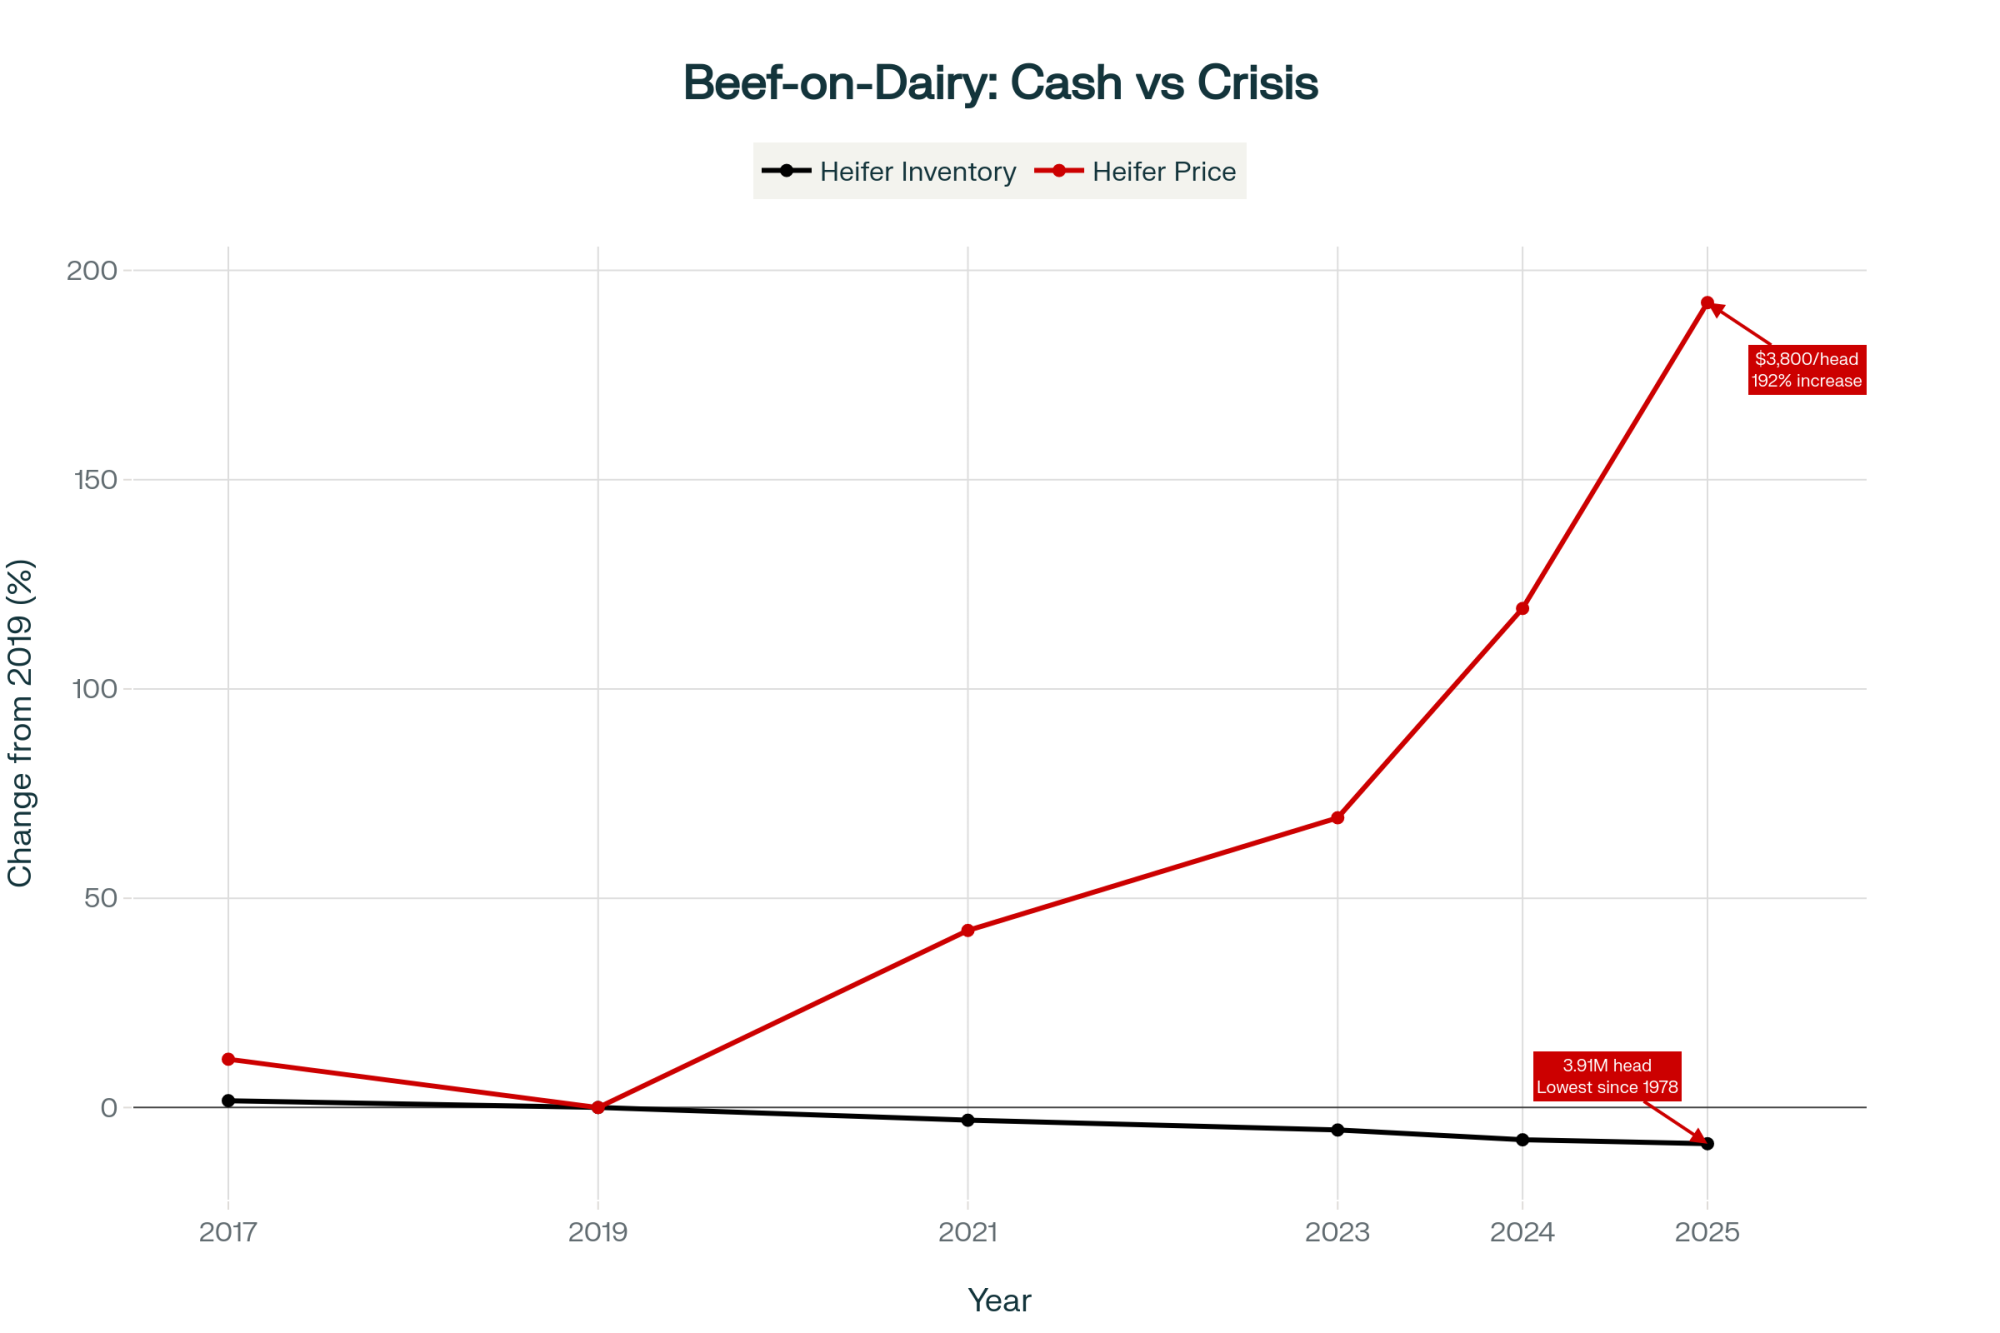
The heifer situation is tighter than most folks realize. USDA’s January 2025 cattle inventory came in at 3.91 million dairy replacement heifers—that’s the lowest level we’ve recorded since 1978. We’re down 18% from 2018 levels. CoBank’s August analysis suggests we’ll see another 800,000 head decline over the next couple of years before things stabilize, probably sometime in 2027.
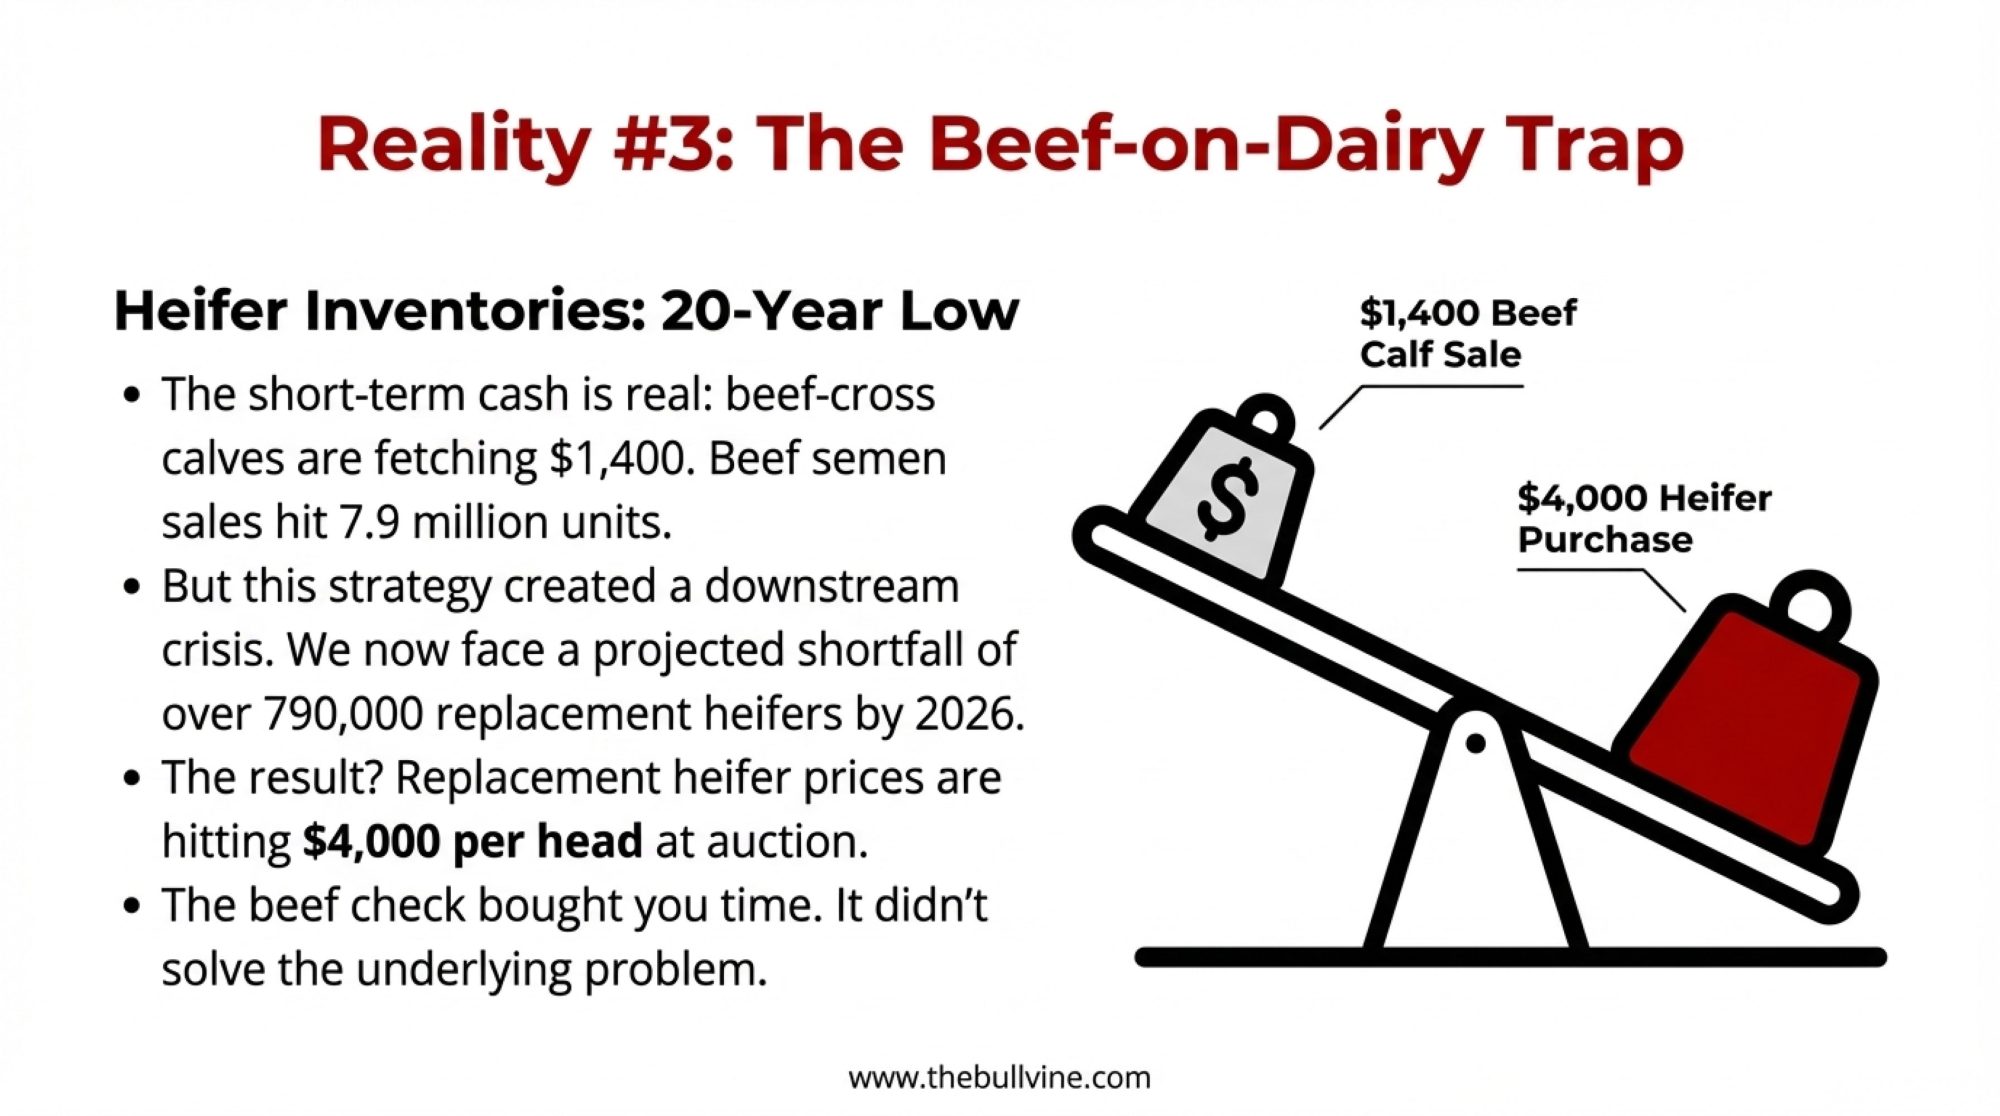
Now, here’s what’s interesting about how we got here. Between 2017 and 2024, beef-on-dairy breeding took off because the math was genuinely compelling—you probably saw this in your own operation or talked with neighbors who did. Dairy bull calves were bringing $300-$400 at auction, while those beef crossbreds commanded $1,200-$1,600. For a 500-cow operation, that difference meant an extra $200,000 or more in annual calf revenue. Hard to argue with those economics at the time. The National Association of Animal Breeders reported 7.9 million units of beef semen sold to dairy operations in 2024 alone.
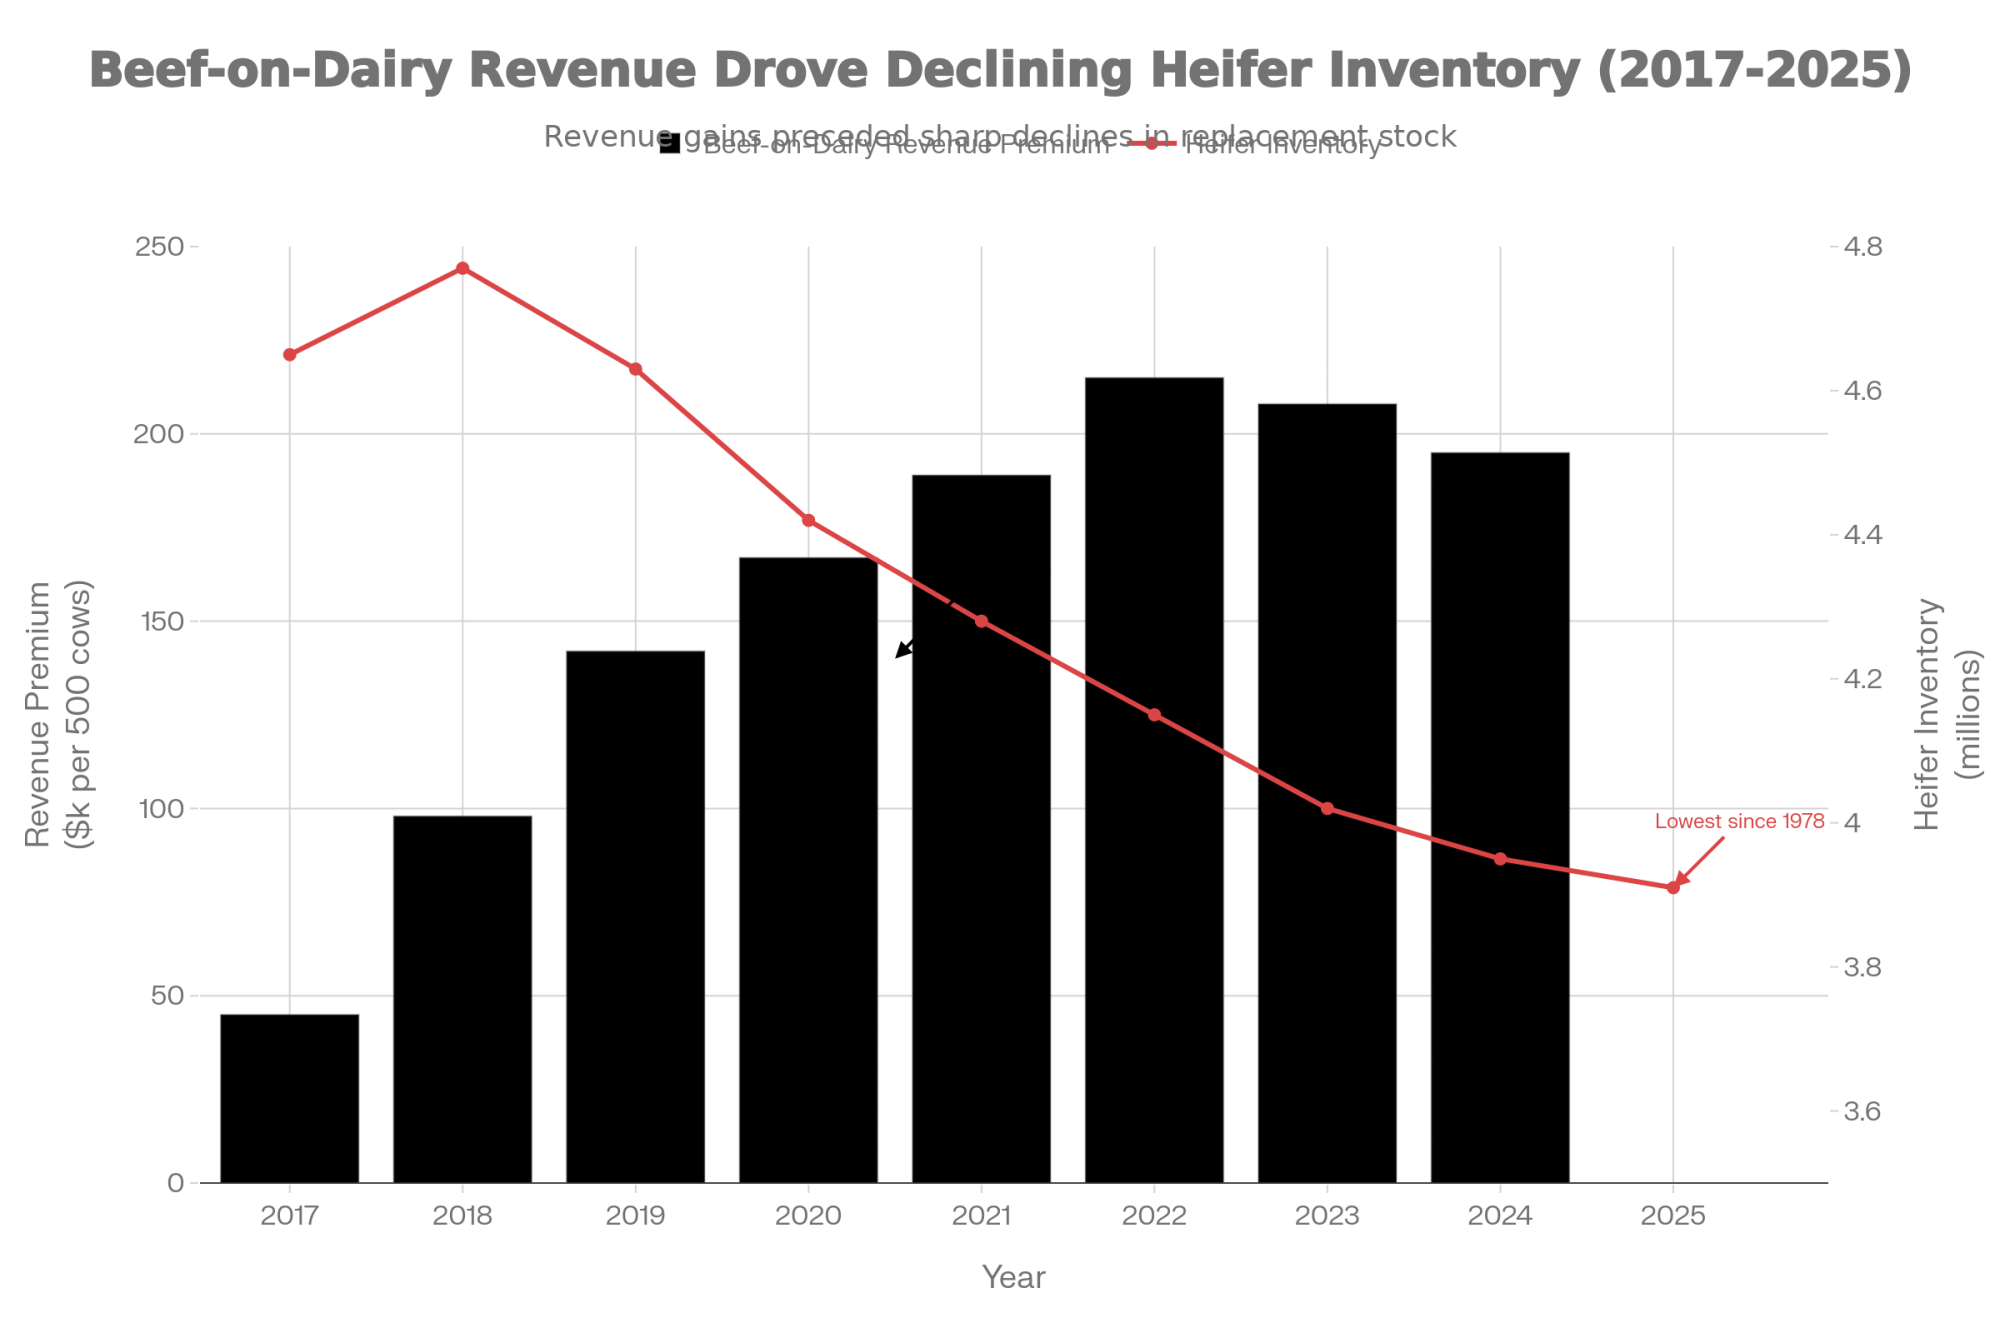
The consequence of those decisions—rational as they were—is now arriving. Heifer prices have climbed from roughly $1,140 back in 2019 to $3,000-$4,000 at current auctions. For operations trying to maintain herd size through normal culling cycles, the replacement math looks very different from what it was even two years ago.
Milk pricing has found a new range. Class III has been trading in that $17-20/cwt corridor through 2025—some months dipping toward the lower end, others pushing higher, but the overall pattern sits $1.50-$2.50 below where we were in 2024. What I find myself thinking about isn’t the decline itself—we’ve all weathered price cycles. It’s the structural factors that suggest this might be more of a new baseline than a temporary dip.
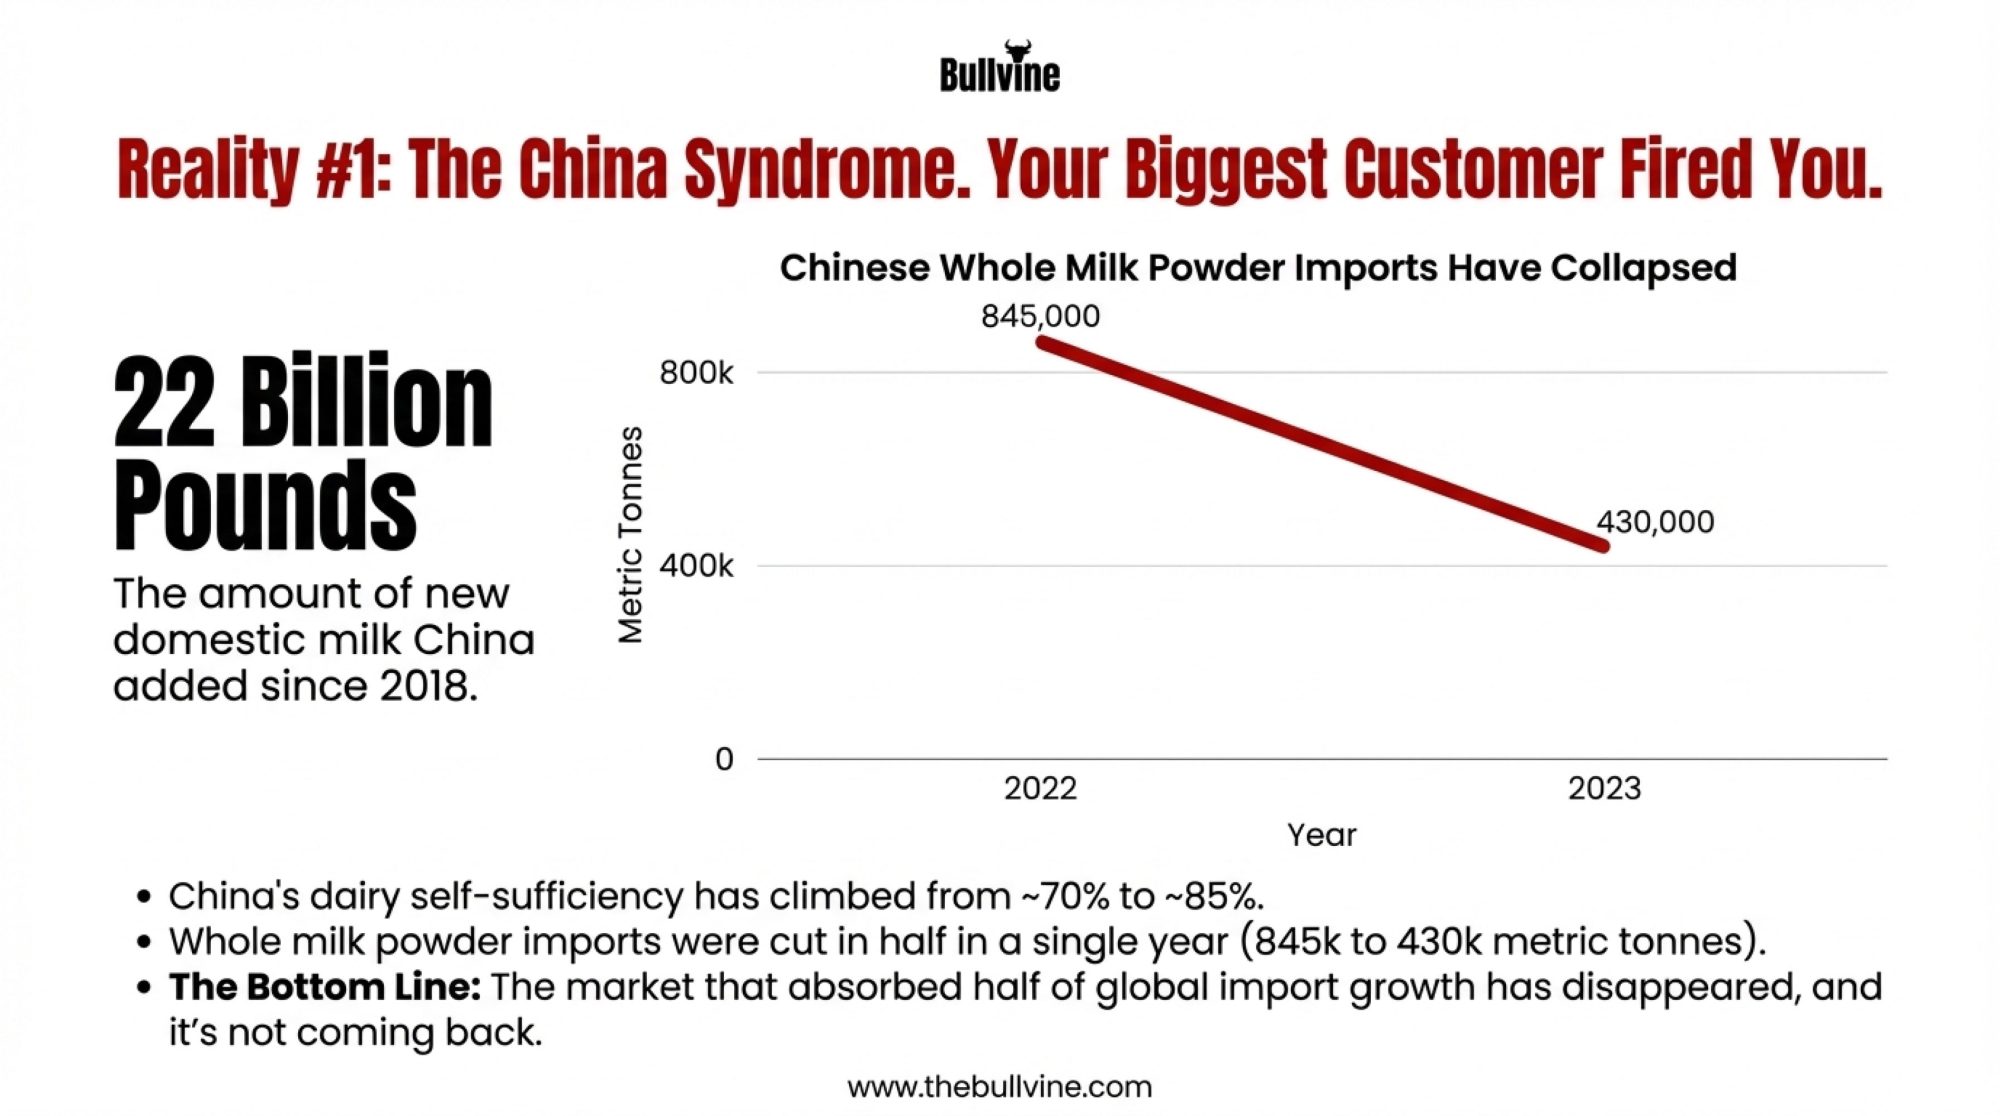
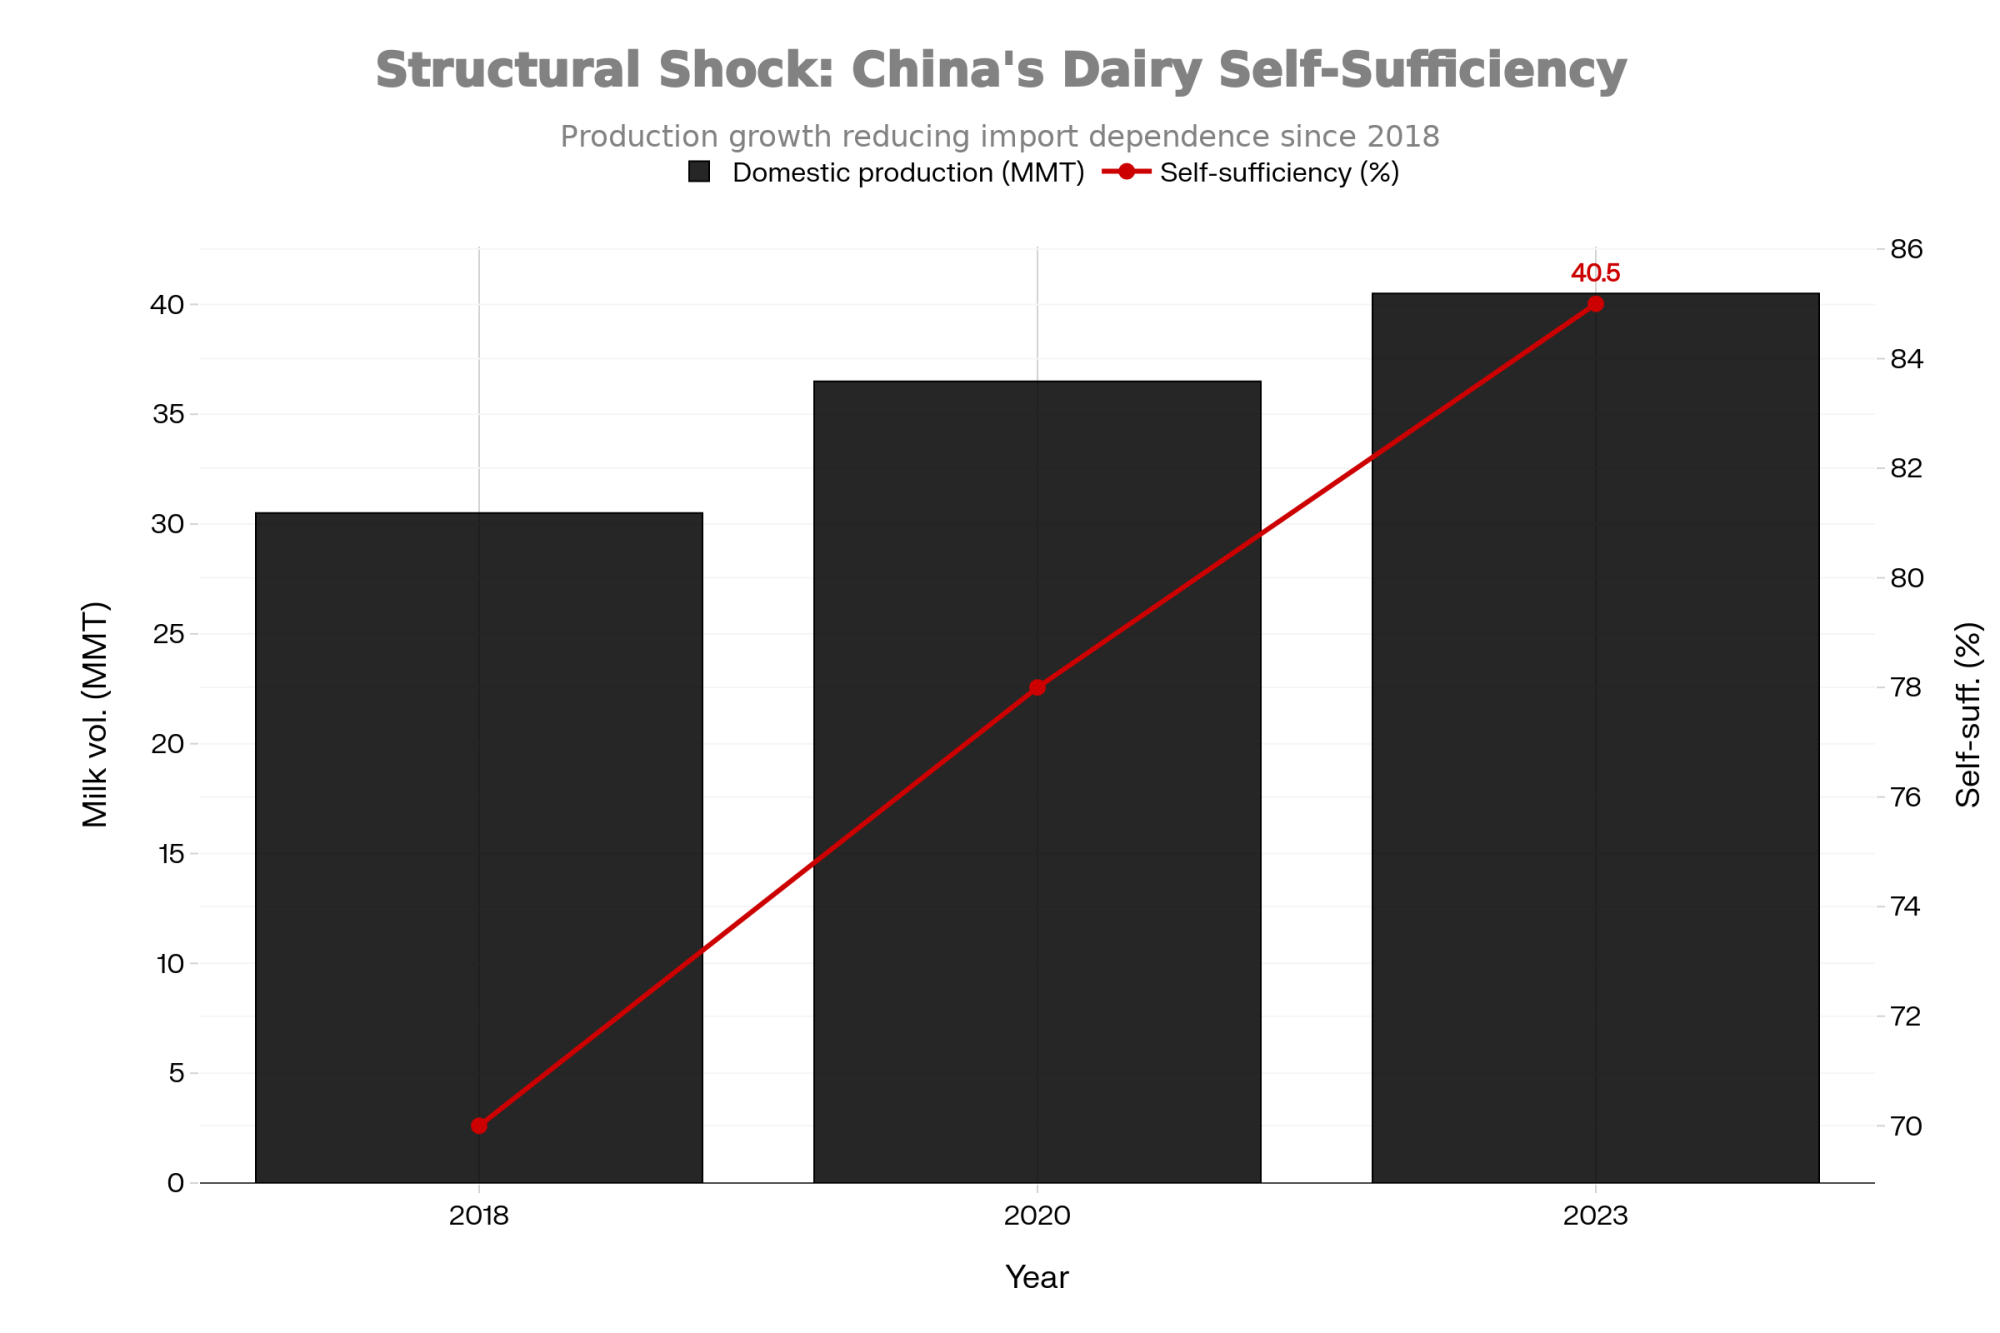
China’s domestic dairy production has expanded significantly, reaching roughly 85% self-sufficiency according to the USDA Foreign Agricultural Service tracking. That compresses what had been a growing export opportunity for U.S. producers. Meanwhile, domestic production continues to expand even as farm numbers decline—larger operations are adding capacity faster than smaller ones are exiting.

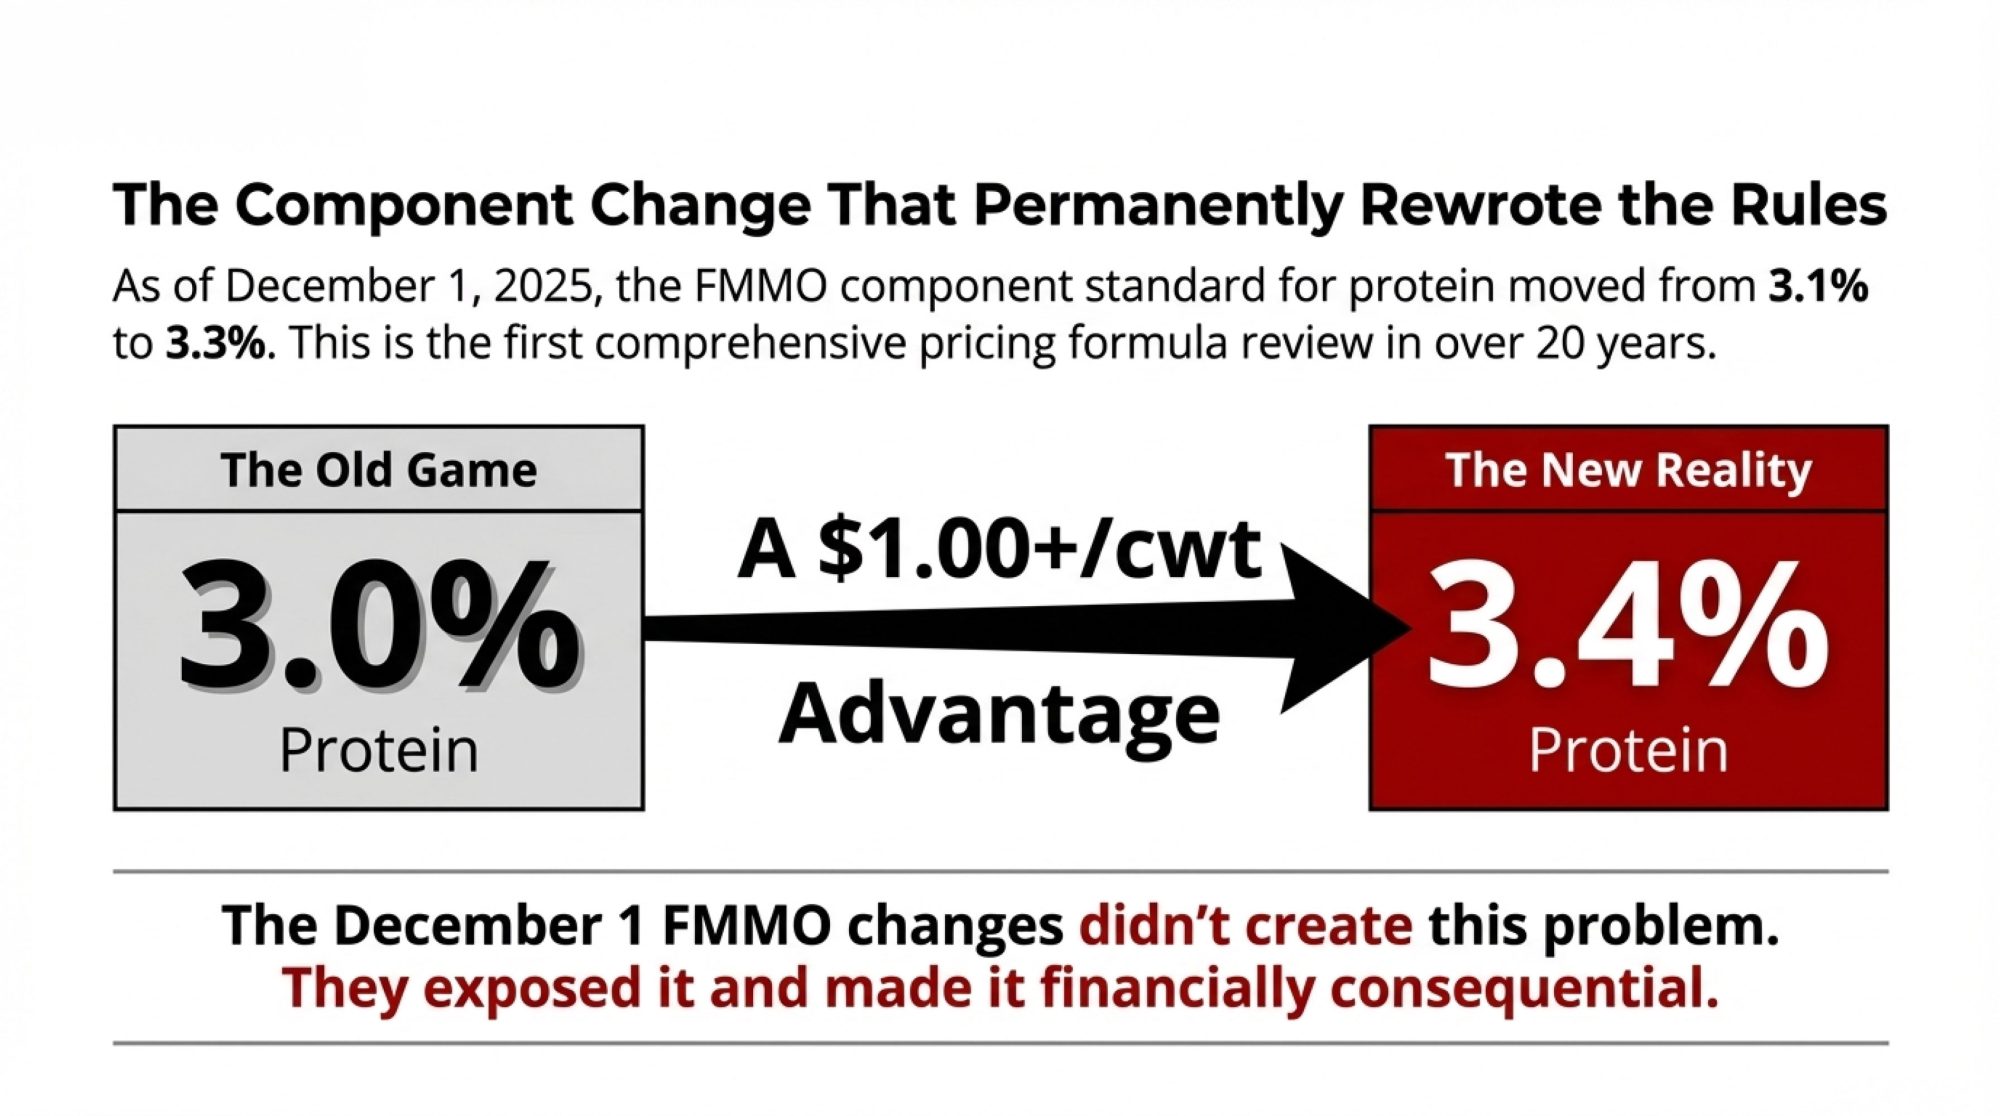
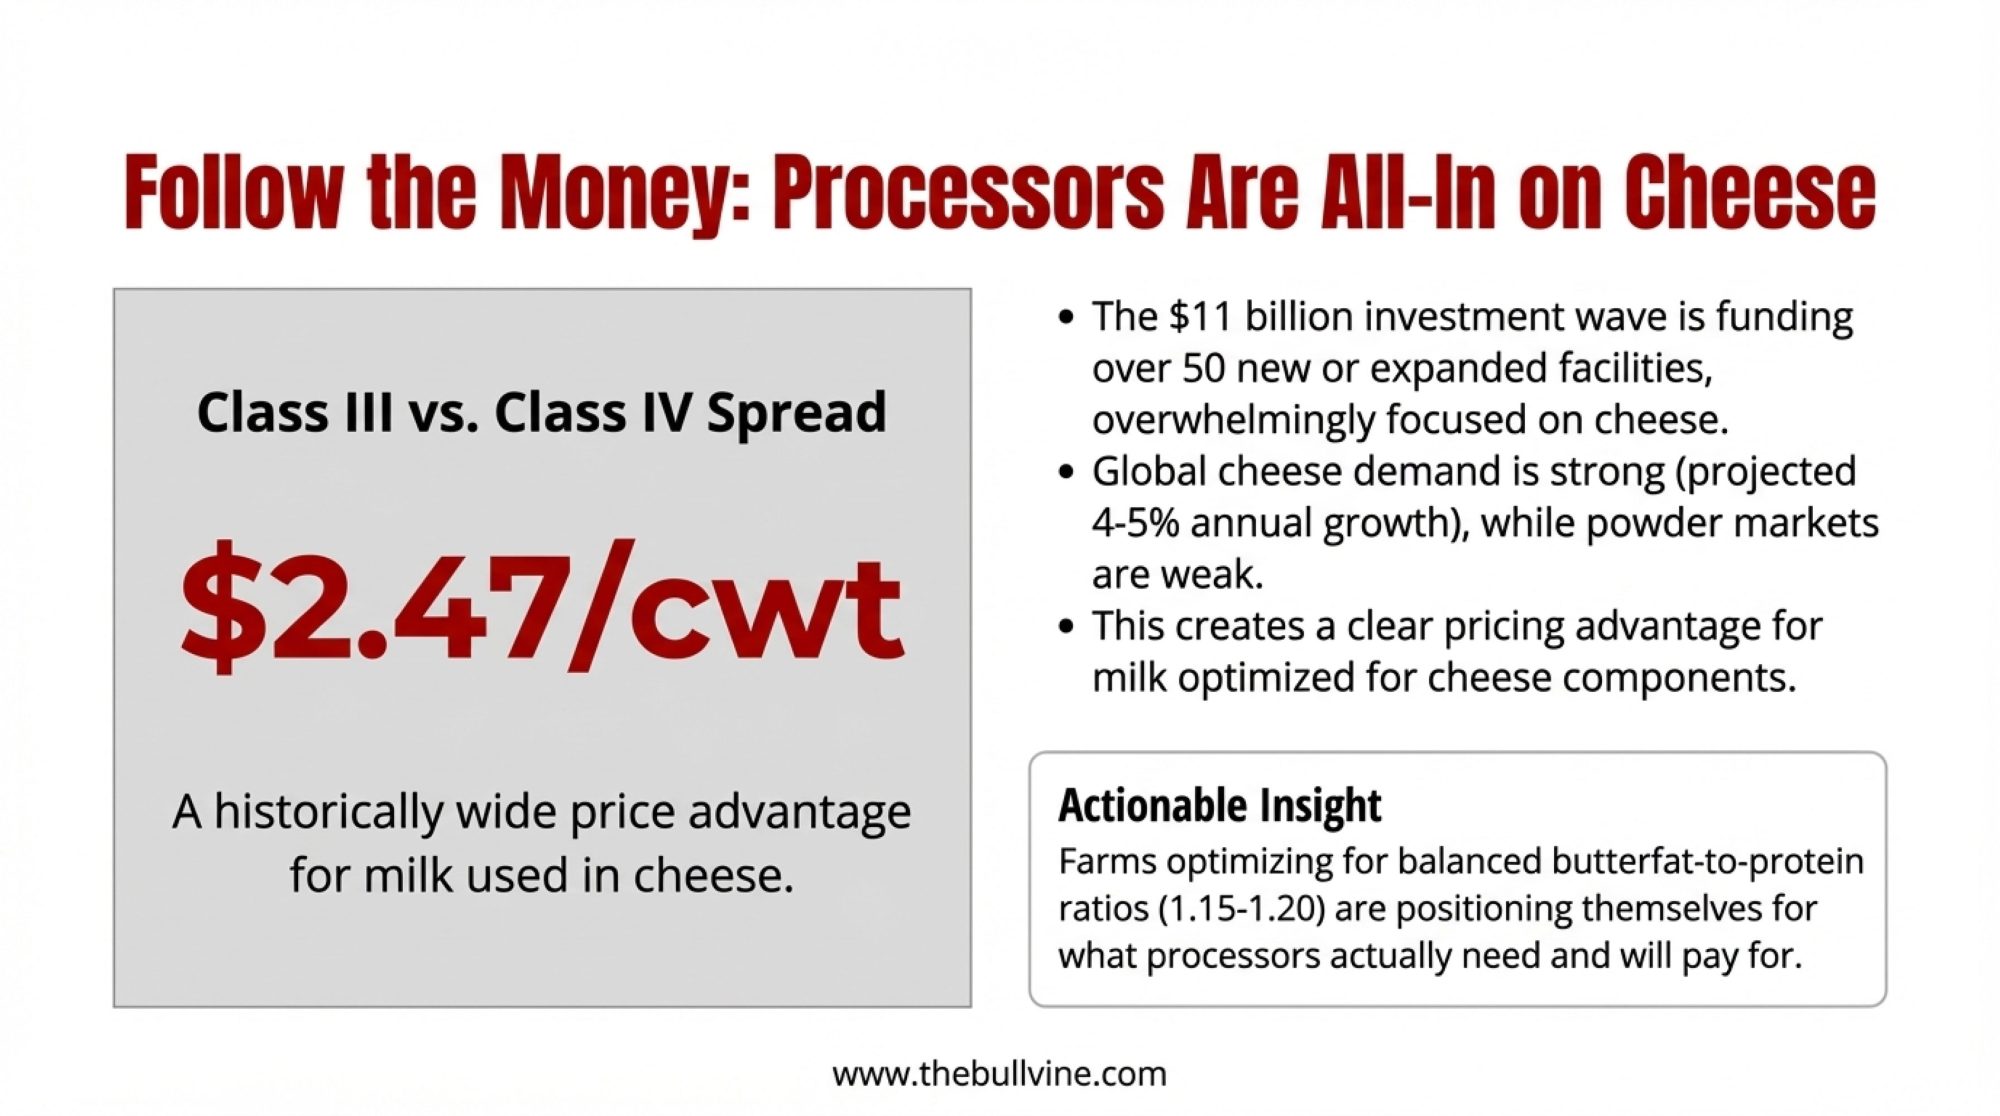
Component economics are shifting in ways that matter. This one’s been on my radar because it affects breeding decisions many of us made years ago. Western Canada’s milk marketing boards announced in October that, effective April 1, 2026, component pricing will move from roughly 85% butterfat emphasis to a 70/25/5 split that weights protein significantly higher than historical norms. You can find the details on the BC Milk Marketing Board’s website.
American processors are beginning to explore similar adjustments. Producers in Wisconsin and Minnesota have mentioned contract offers with $0.30-$0.50/cwt premiums tied to protein content above 3.4%—something that would have seemed unusual three years ago when butterfat commanded all the attention.
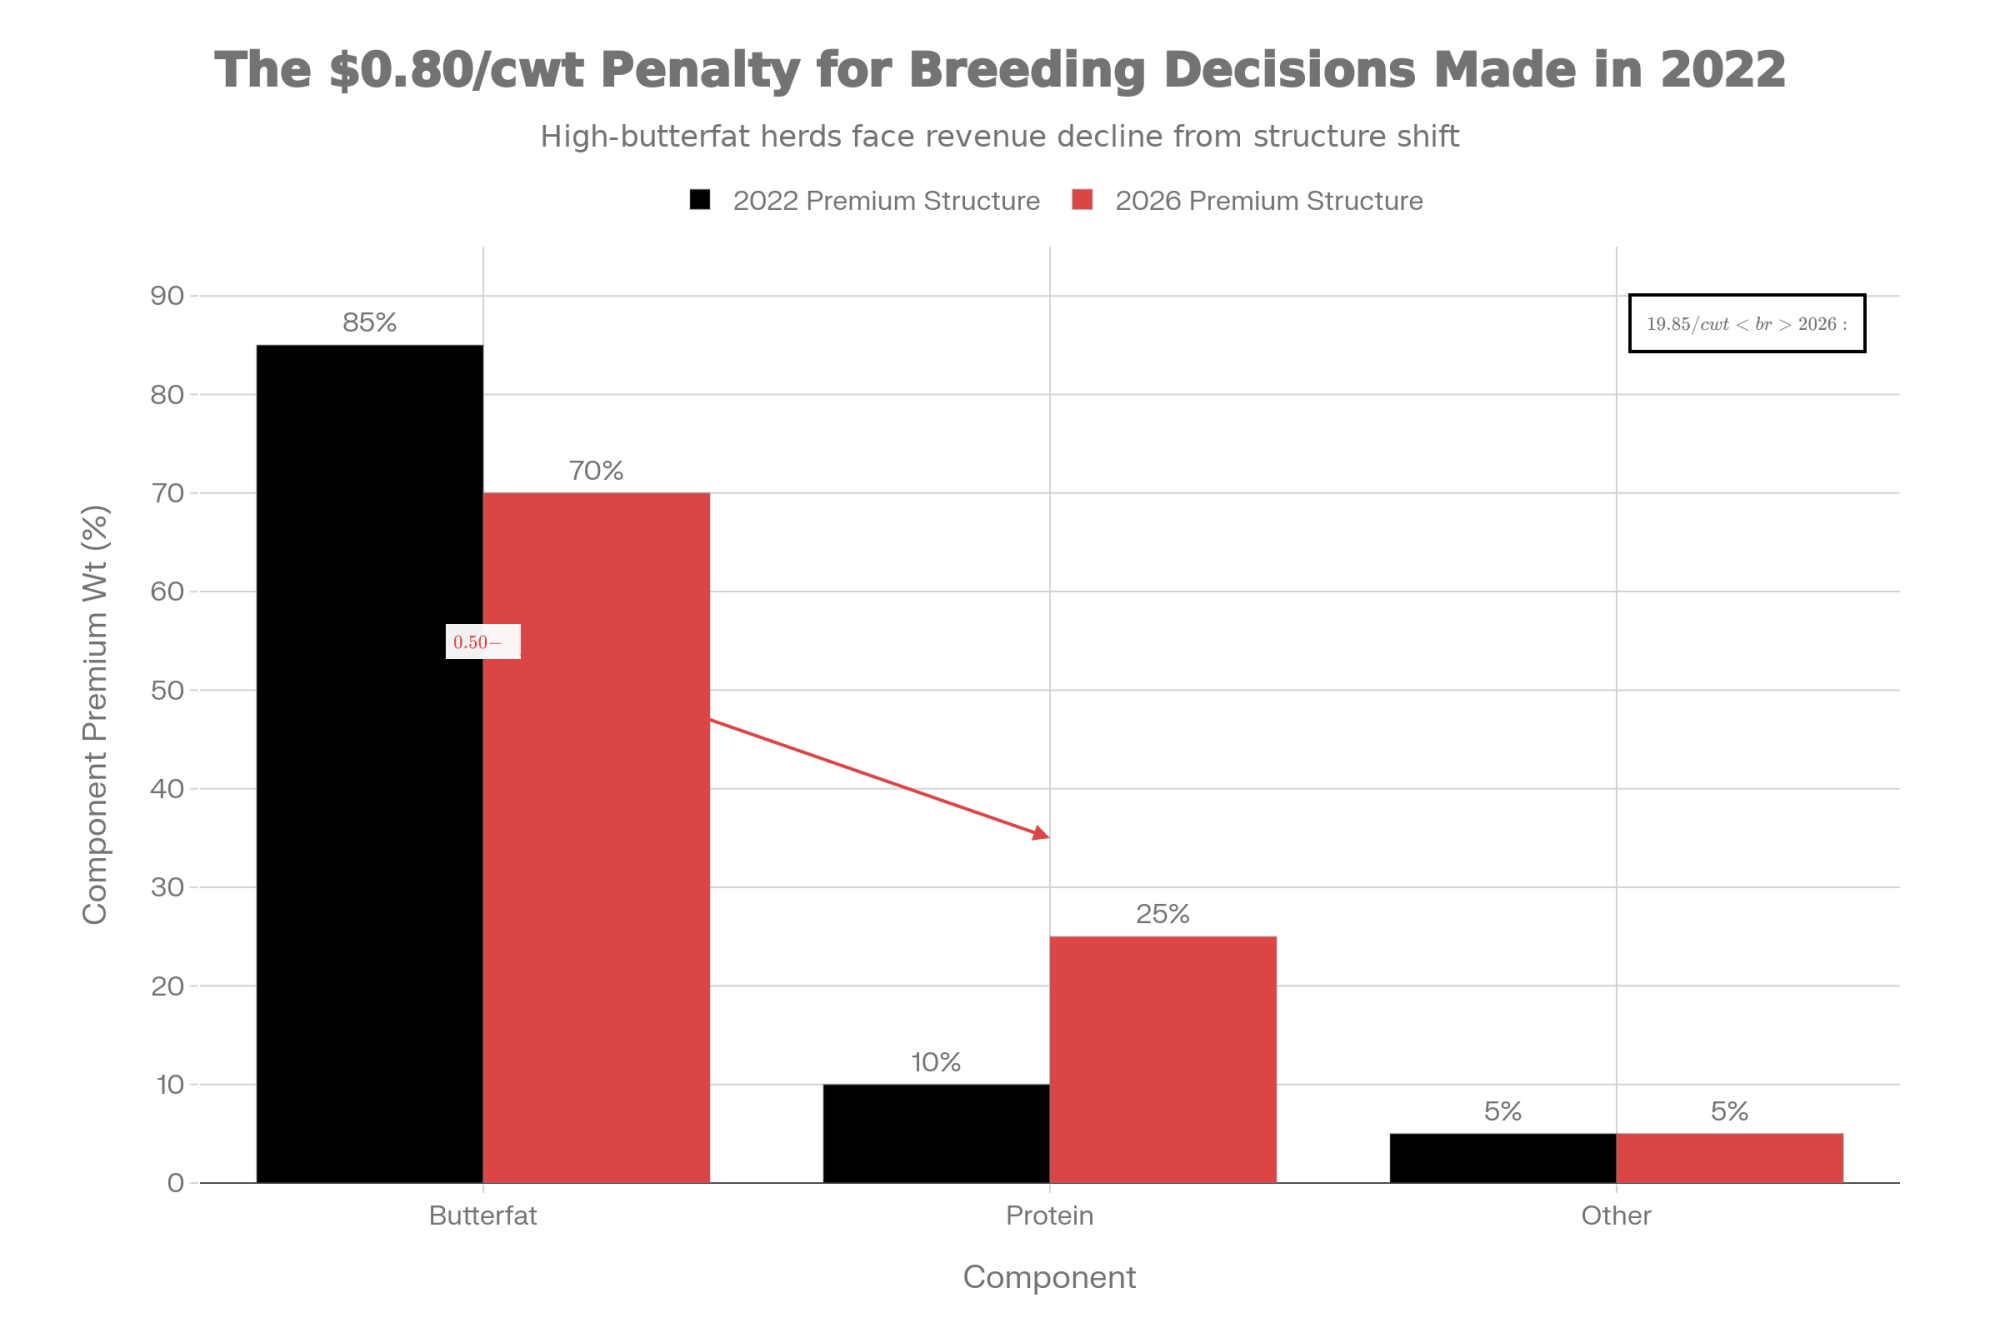
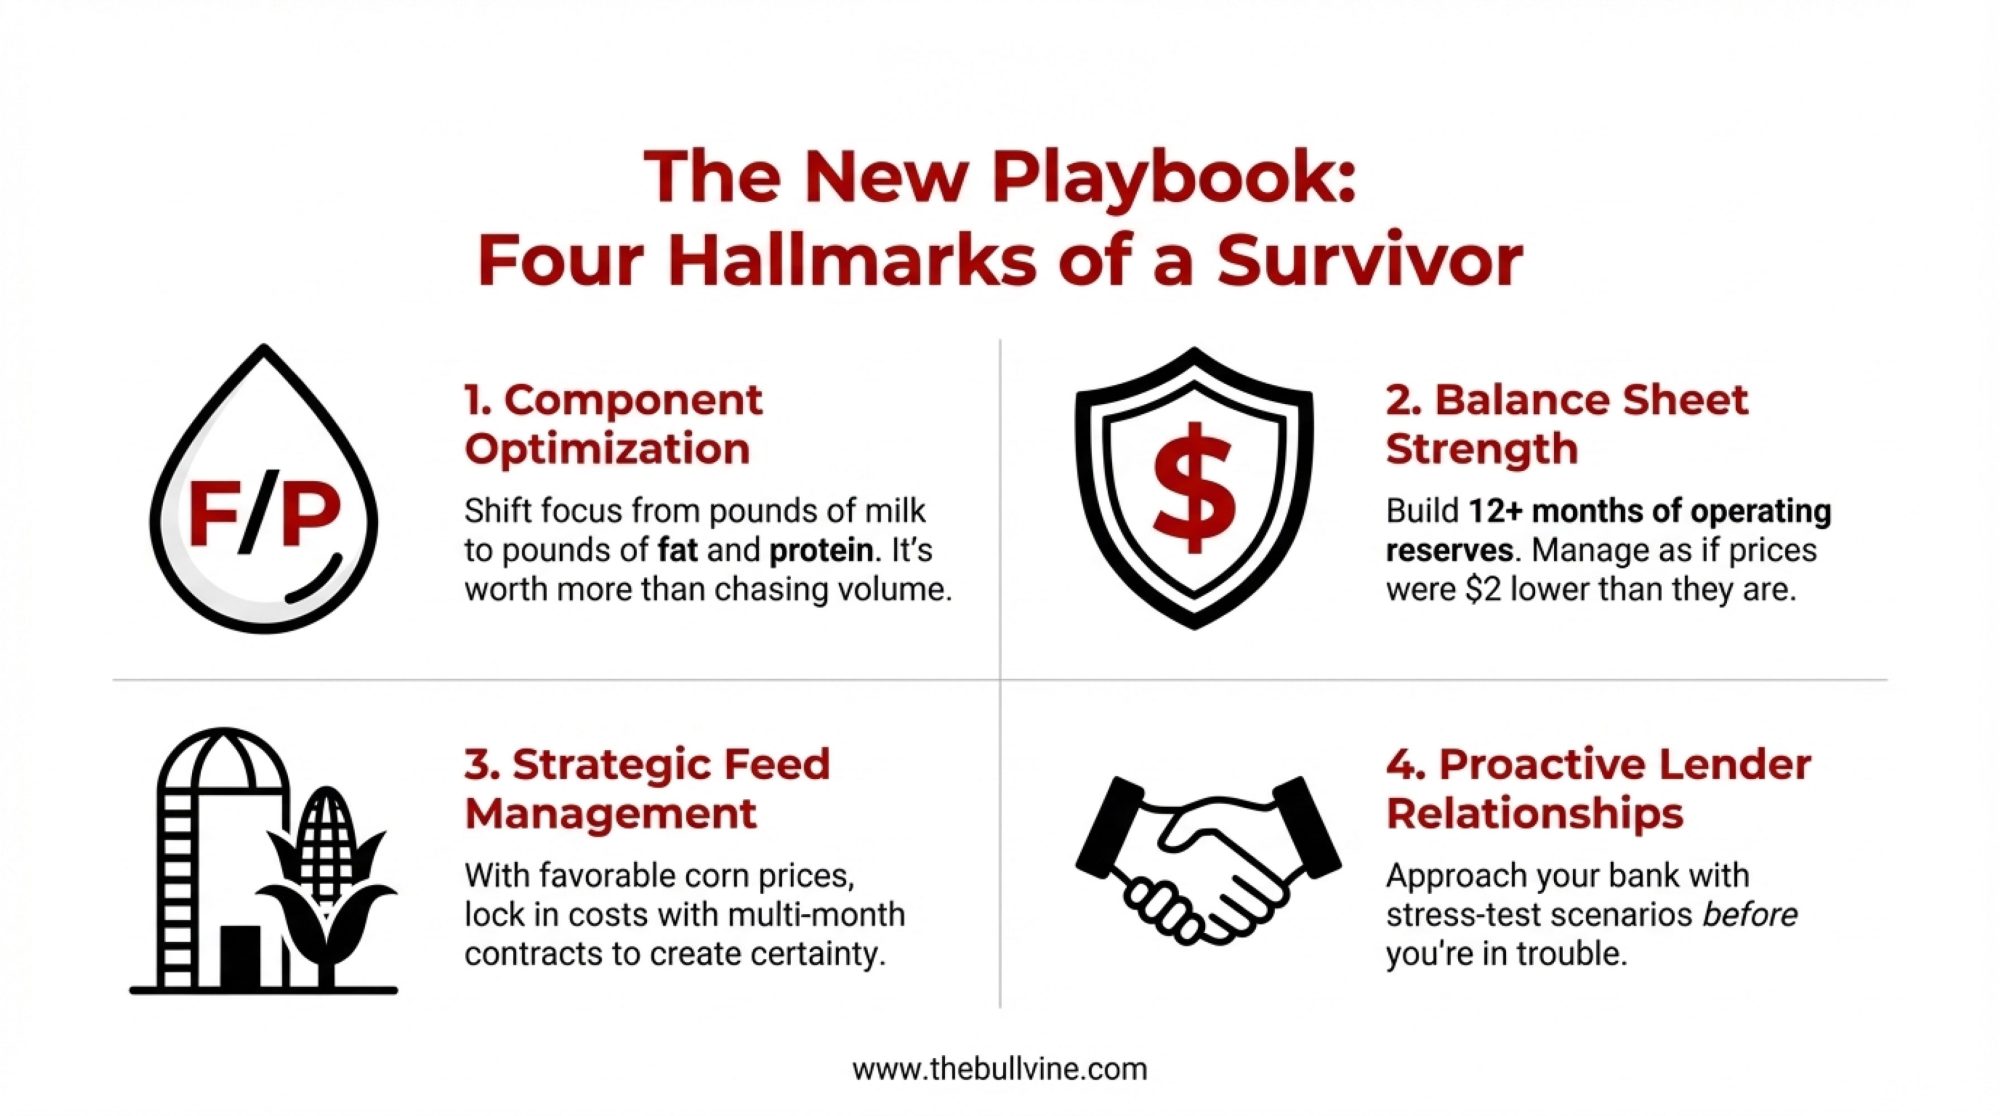
Why does this matter right now? Those genetic decisions we made in 2022-2023 are entering the milking herd. They were overwhelmingly butterfat-focused because that’s what the market rewarded at the time. If your tank average is still chasing butterfat because of the bulls you picked in 2022, you’re optimizing for a market that is rapidly evaporating. The premium is moving to protein.
The biological reality of a 24-36 month lag between breeding decisions and production outcomes means some operations may find themselves locked into yesterday’s pricing signals for another full cycle. It’s worth reviewing your current breeding program with this shift in mind—not panic, but awareness and action.
The GLP-1 Factor: A Genuine Shift in Consumer Behavior
Here’s something genuinely interesting from the demand side that I think deserves thoughtful attention.
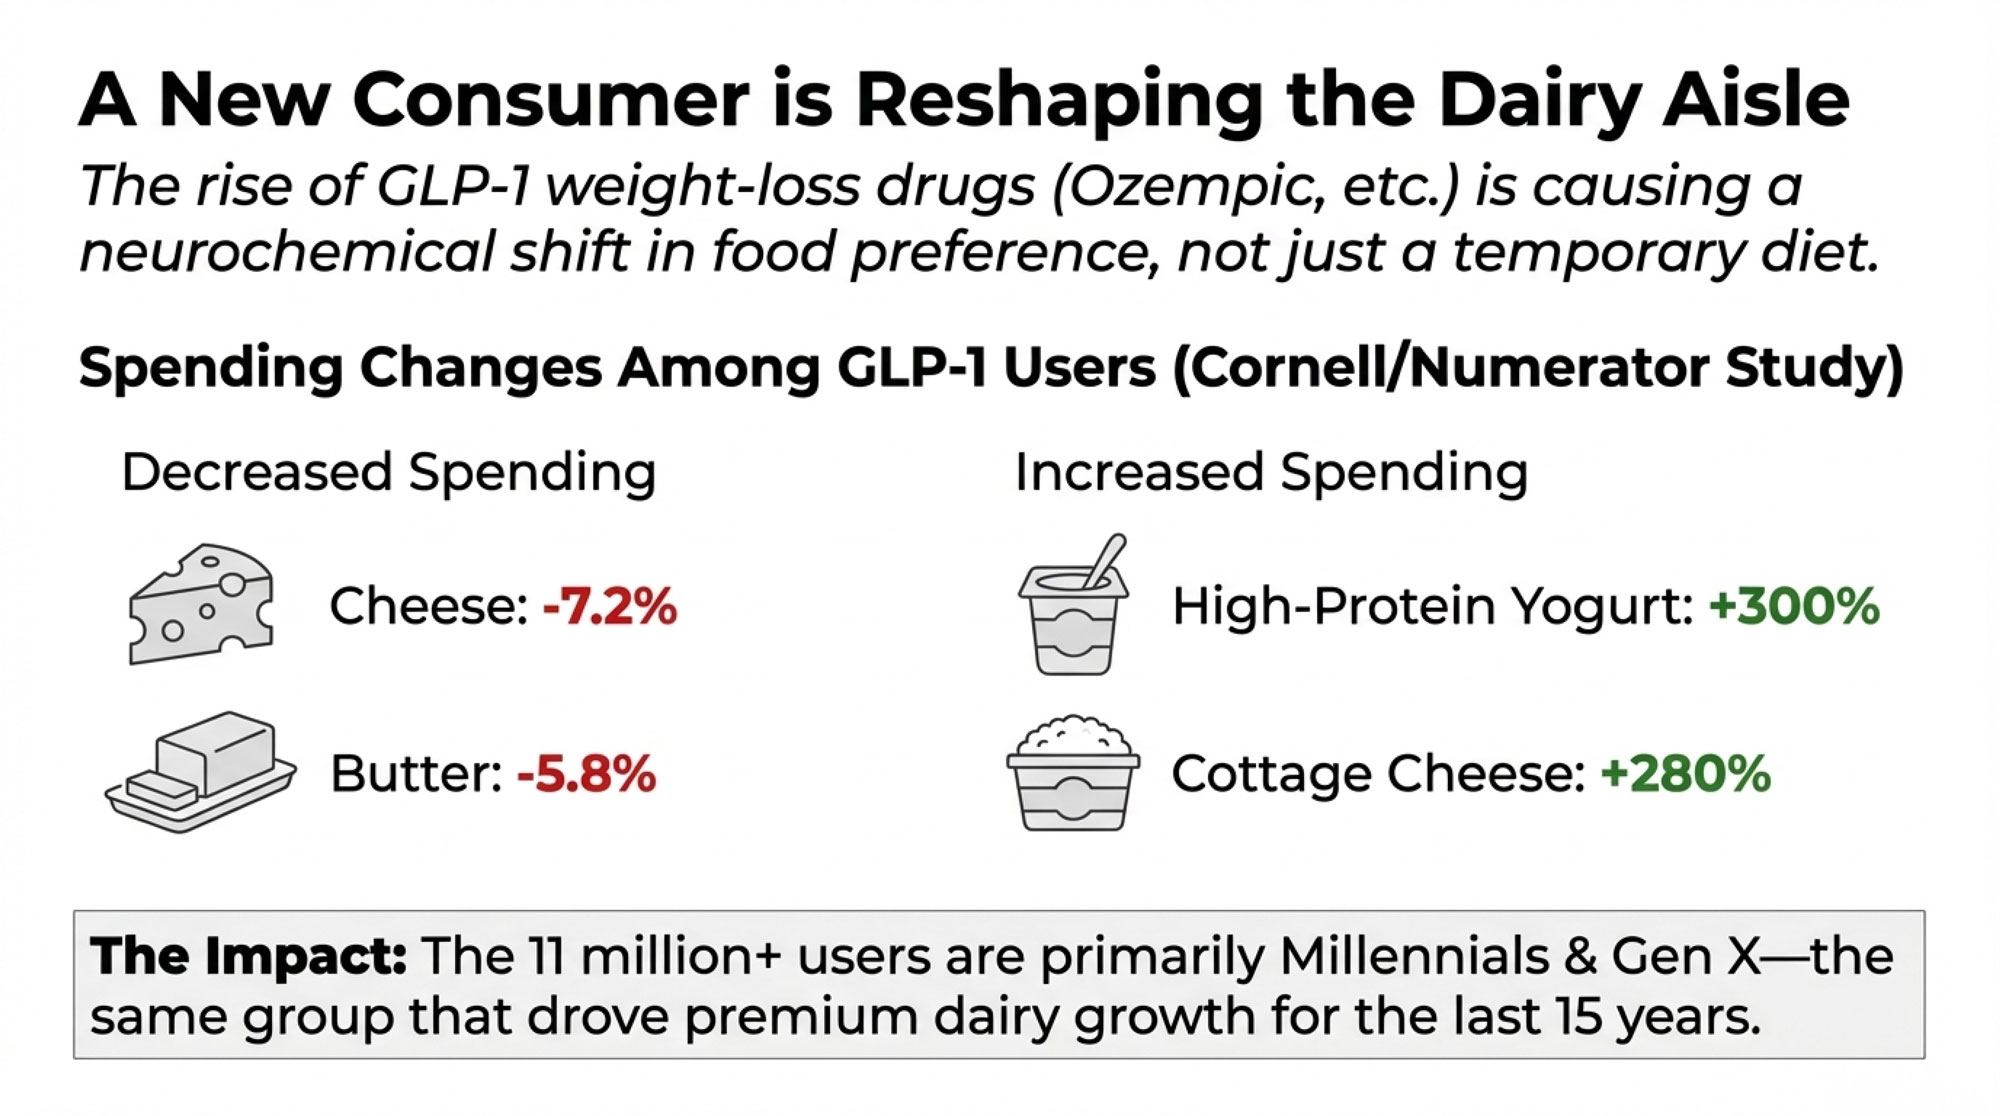
A collaborative research effort between Cornell University and Numerator, which tracks household purchasing data across more than 100,000 households, published findings analyzing how consumers using GLP-1 weight-loss medications are changing their eating habits. The patterns were notable:
- Cheese spending down 7.2%
- Butter down 5.8%
- Ice cream down 5.5%
- High-protein yogurt up nearly triple
- Cottage cheese purchases up 280%
As of mid-2025, IQVIA data shows approximately 11 million Americans are actively using GLP-1 medications, with that number steadily increasing. Now, there’s been confusion about Medicare coverage—let me clarify what actually happened. The Trump administration declined to extend Medicare coverage for weight-loss-only indications back in April 2025. But commercial coverage continues expanding, costs are moderating, and most healthcare analysts expect the user base to keep growing through 2026.
What makes this different from typical diet trends is the underlying mechanism. These medications don’t just suppress appetite temporarily—they appear to shift food preferences by affecting dopamine pathways.
“Users report that high-fat foods simply become less appealing. That’s a different kind of demand pattern.”
We’re not talking about willpower or temporary restriction. We’re talking about neurochemical changes that persist as long as patients remain on medication—and many of these drugs are prescribed long-term.
The demographic profile matters too. According to the Numerator data, 71% of GLP-1 users taking these drugs for weight loss are Millennials or Gen X—the same consumer groups that drove premium dairy category growth over the past fifteen years.
What’s encouraging is the flip side of this data: protein-focused dairy is growing dramatically. Operations positioned to serve that demand—high-protein yogurt, cottage cheese, protein-enhanced products—are seeing real opportunity. The question becomes whether your operation can participate in that shift.

Labor Economics: A Threshold Worth Understanding
Farms have always dealt with labor challenges—that’s nothing new. But the current cost structure warrants careful examination.
The H-2A program restructuring established tiered wage requirements. In Michigan—a reasonable proxy for Midwest dairy regions—the Adverse Effect Wage Rate for experienced agricultural workers is $18.15/hour, according to Department of Labor data. But that base wage significantly understates actual costs.
Once you factor in employer-provided housing (required under H-2A), transportation, insurance, payroll taxes, and turnover replacement costs… many operations I’ve talked with are seeing all-in costs of $19-$21/hour. A 600-cow dairy requiring 2.5 full-time-equivalent milking positions now faces annual labor costs exceeding $140,000 just for parlor staffing.
What’s interesting is how this interacts with scale. Larger operations spread specialized positions across more cows, reducing per-unit labor cost. They can also more readily justify automation investments—which brings me to a topic that deserves nuanced discussion.
The Automation Question at Different Scales
The numbers here tell a more complicated story than equipment marketing materials often suggest.
For a 100-130 cow operation, a two-robot system (Lely, DeLaval, or comparable) plus barn modifications, feed integration, and installation runs somewhere in the $430,000-$740,000 range based on late 2025 dealer quotes. That’s getting fully operational with adequate support infrastructure.
For a 600-cow dairy, you’re looking at 8-10 robots minimum—now we’re talking $1.5-$2.5 million in total investment. The per-cow economics shift dramatically depending on how that fixed cost gets distributed.
Industry research and extension analyses suggest payback periods vary significantly with herd size. Smaller operations often face 15-20+ year payback at current financing rates, while larger operations with 2,000+ cows may achieve returns in under 10 years. These aren’t hard rules—individual circumstances matter enormously—but the pattern is worth understanding.
And there’s the financing dimension. A dairy lender I spoke with (he asked to remain anonymous, given client relationships) put it directly: “We’re looking at debt service coverage ratios very carefully. A producer comes in wanting financing for robotics, but their margins have compressed significantly over the past two years. That’s a challenging loan to structure, even when the long-term investment thesis makes sense.”
This isn’t to say automation is wrong for mid-size operations—some are making it work beautifully. But the economics require an honest assessment of your specific situation.
What Processors Are Building Toward
The processing side of this equation often gets discussed abstractly. Let me make it more concrete.
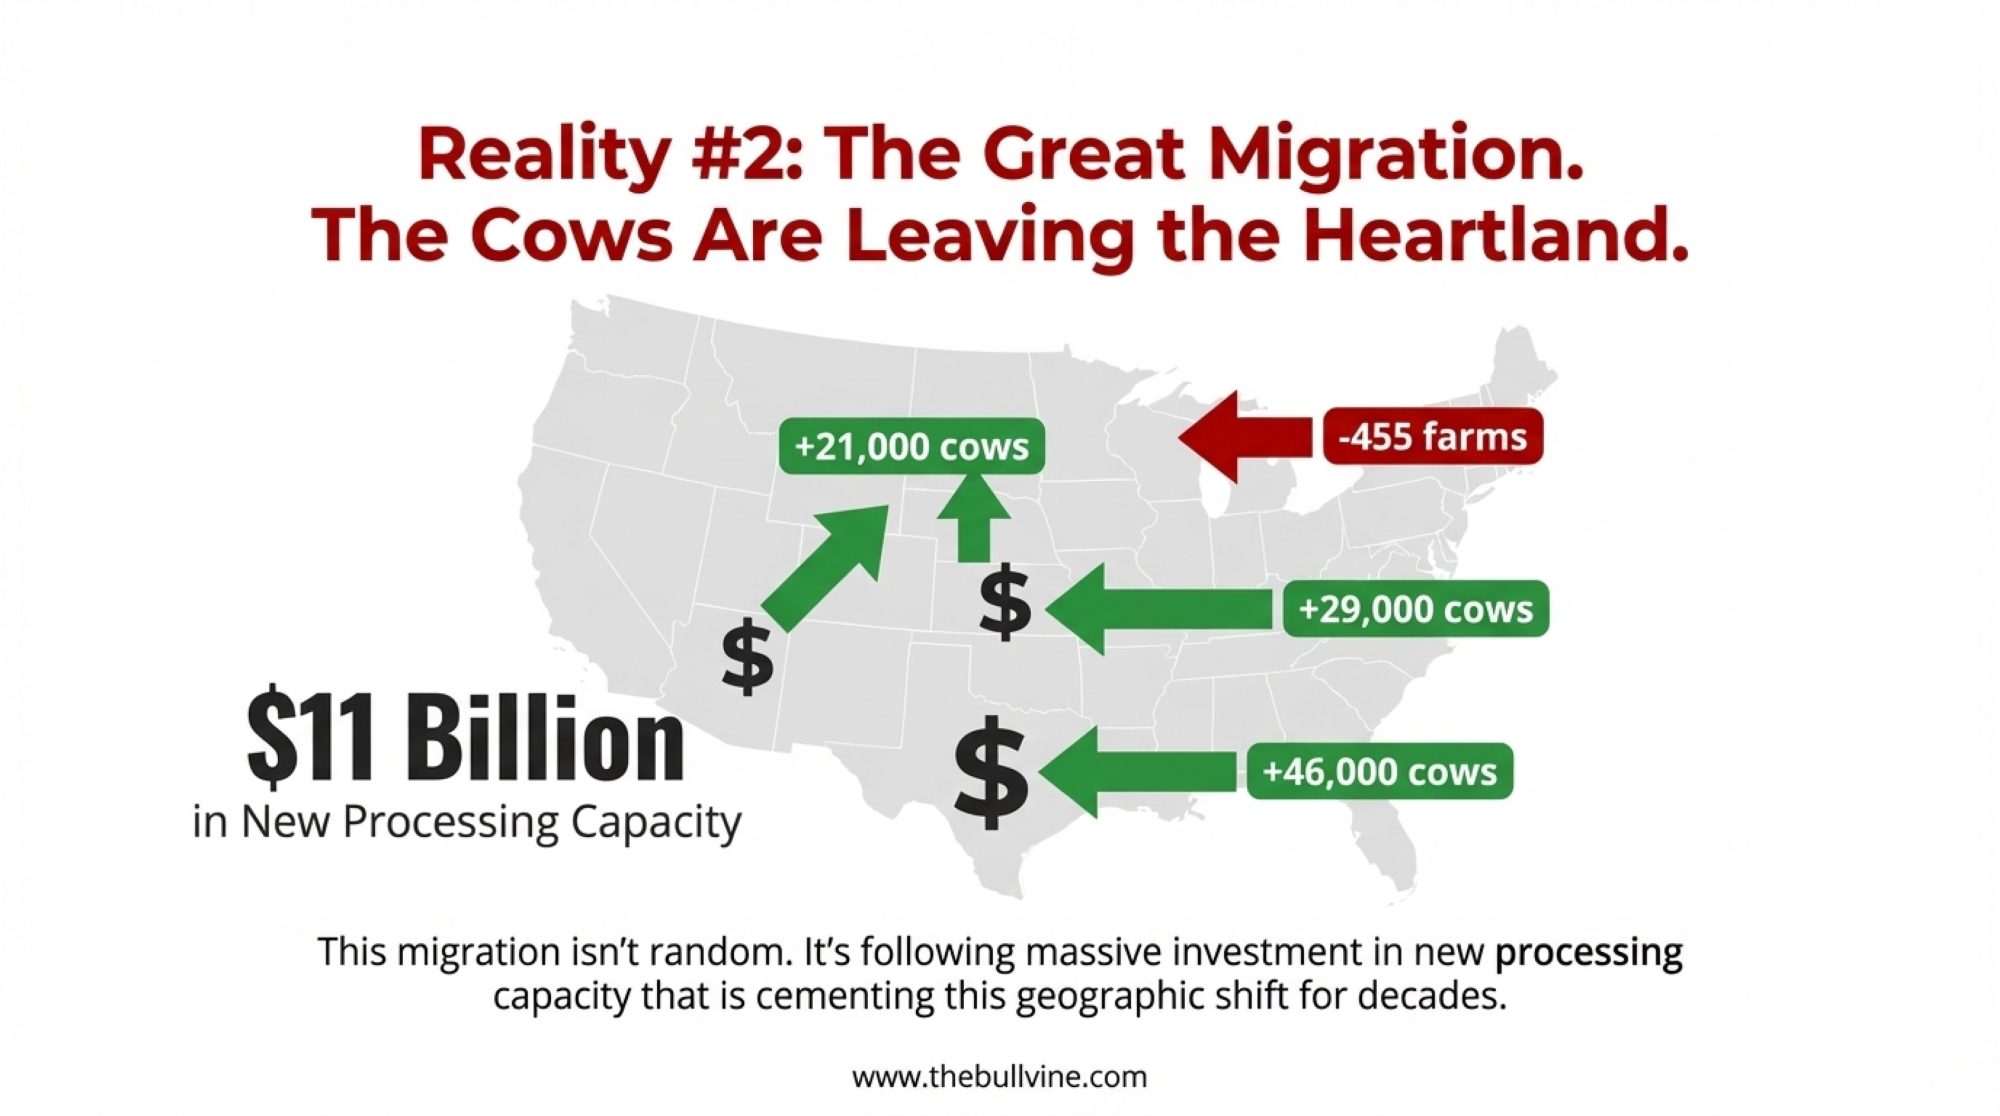
The International Dairy Foods Association released October data showing that between 2024 and 2027, U.S. dairy processing capacity expansion totals more than $11 billion in announced investments across 19 states. New cheese plants, expanded fluid milk processing, protein isolation facilities—substantial infrastructure.
What’s particularly noteworthy isn’t the investment volume alone. It’s the supply relationship structure underlying it. Major facility expansions—Hilmar in Kansas, Valley Queen in South Dakota, Glanbia and Leprino projects—are largely being built around long-term supply agreements with operations milking 2,000 cows or more.
A dairy cooperative field representative in the Upper Midwest explained the underlying economics: “A 600-cow operation represents maybe 60,000 pounds of milk daily. For a plant processing 8 million pounds, that’s less than 1% of the supply. The transaction costs of managing that relationship—quality monitoring, logistics, payment processing—are roughly the same whether it’s 60,000 pounds or 600,000 pounds.”
He was careful to add that cooperatives remain committed to their member base. “But producers need to understand the economics their buyers are navigating. The pressure toward consolidation has structural roots.”
So What Does “Viable” Actually Mean Right Now?
This is where I want to be careful to distinguish between what the data clearly show and what represents my analytical interpretation.
| Operation Size | Per-Cow Labor Cost | Automation ROI Payback | Processor Leverage | Premium Access | 2025 Viability Status |
|---|---|---|---|---|---|
| <100 cows | $520/cow/year | 20+ years (not viable) | Minimal | Direct-to-consumer, organic | Viable if specialty |
| 100-300 cows | $465/cow/year | 15-20 years | Low | Organic, grassfed possible | Transition required |
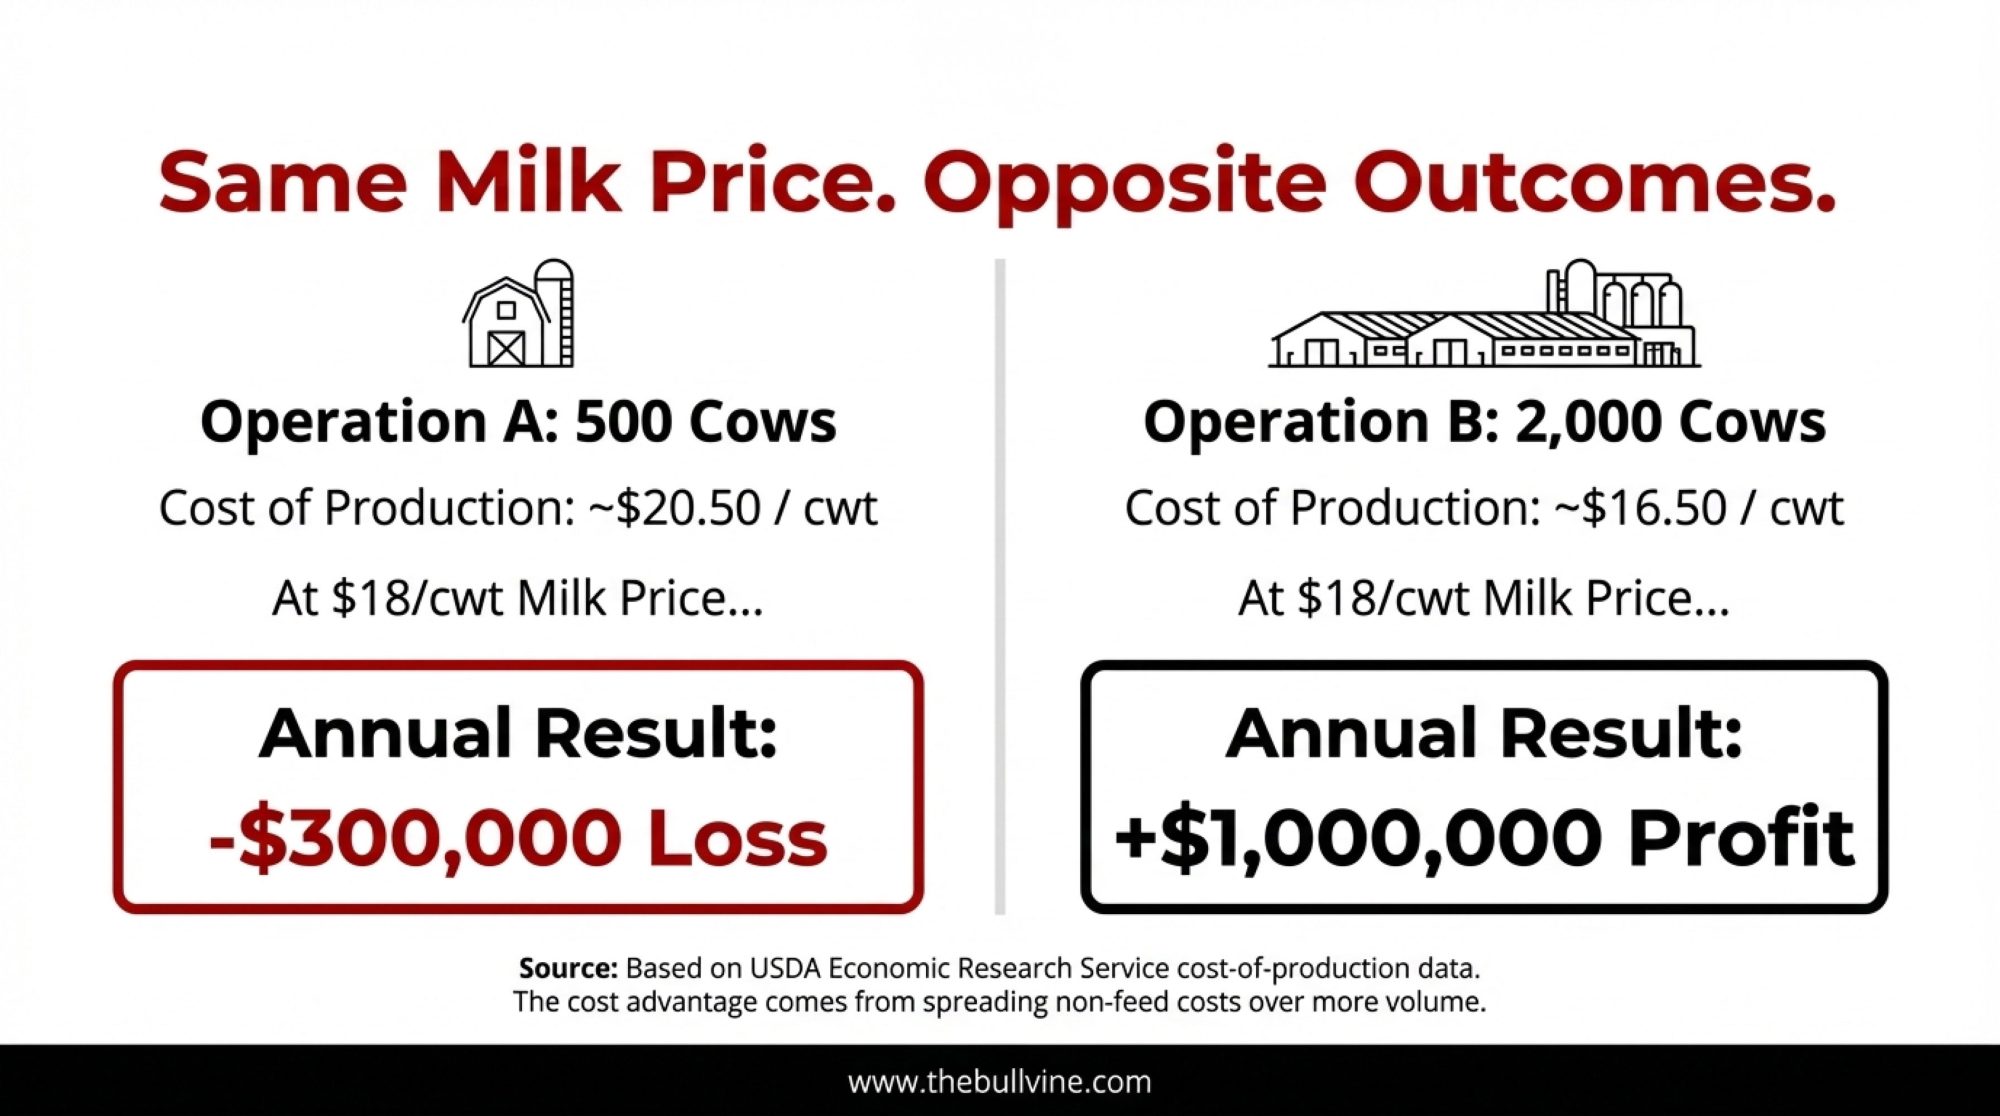
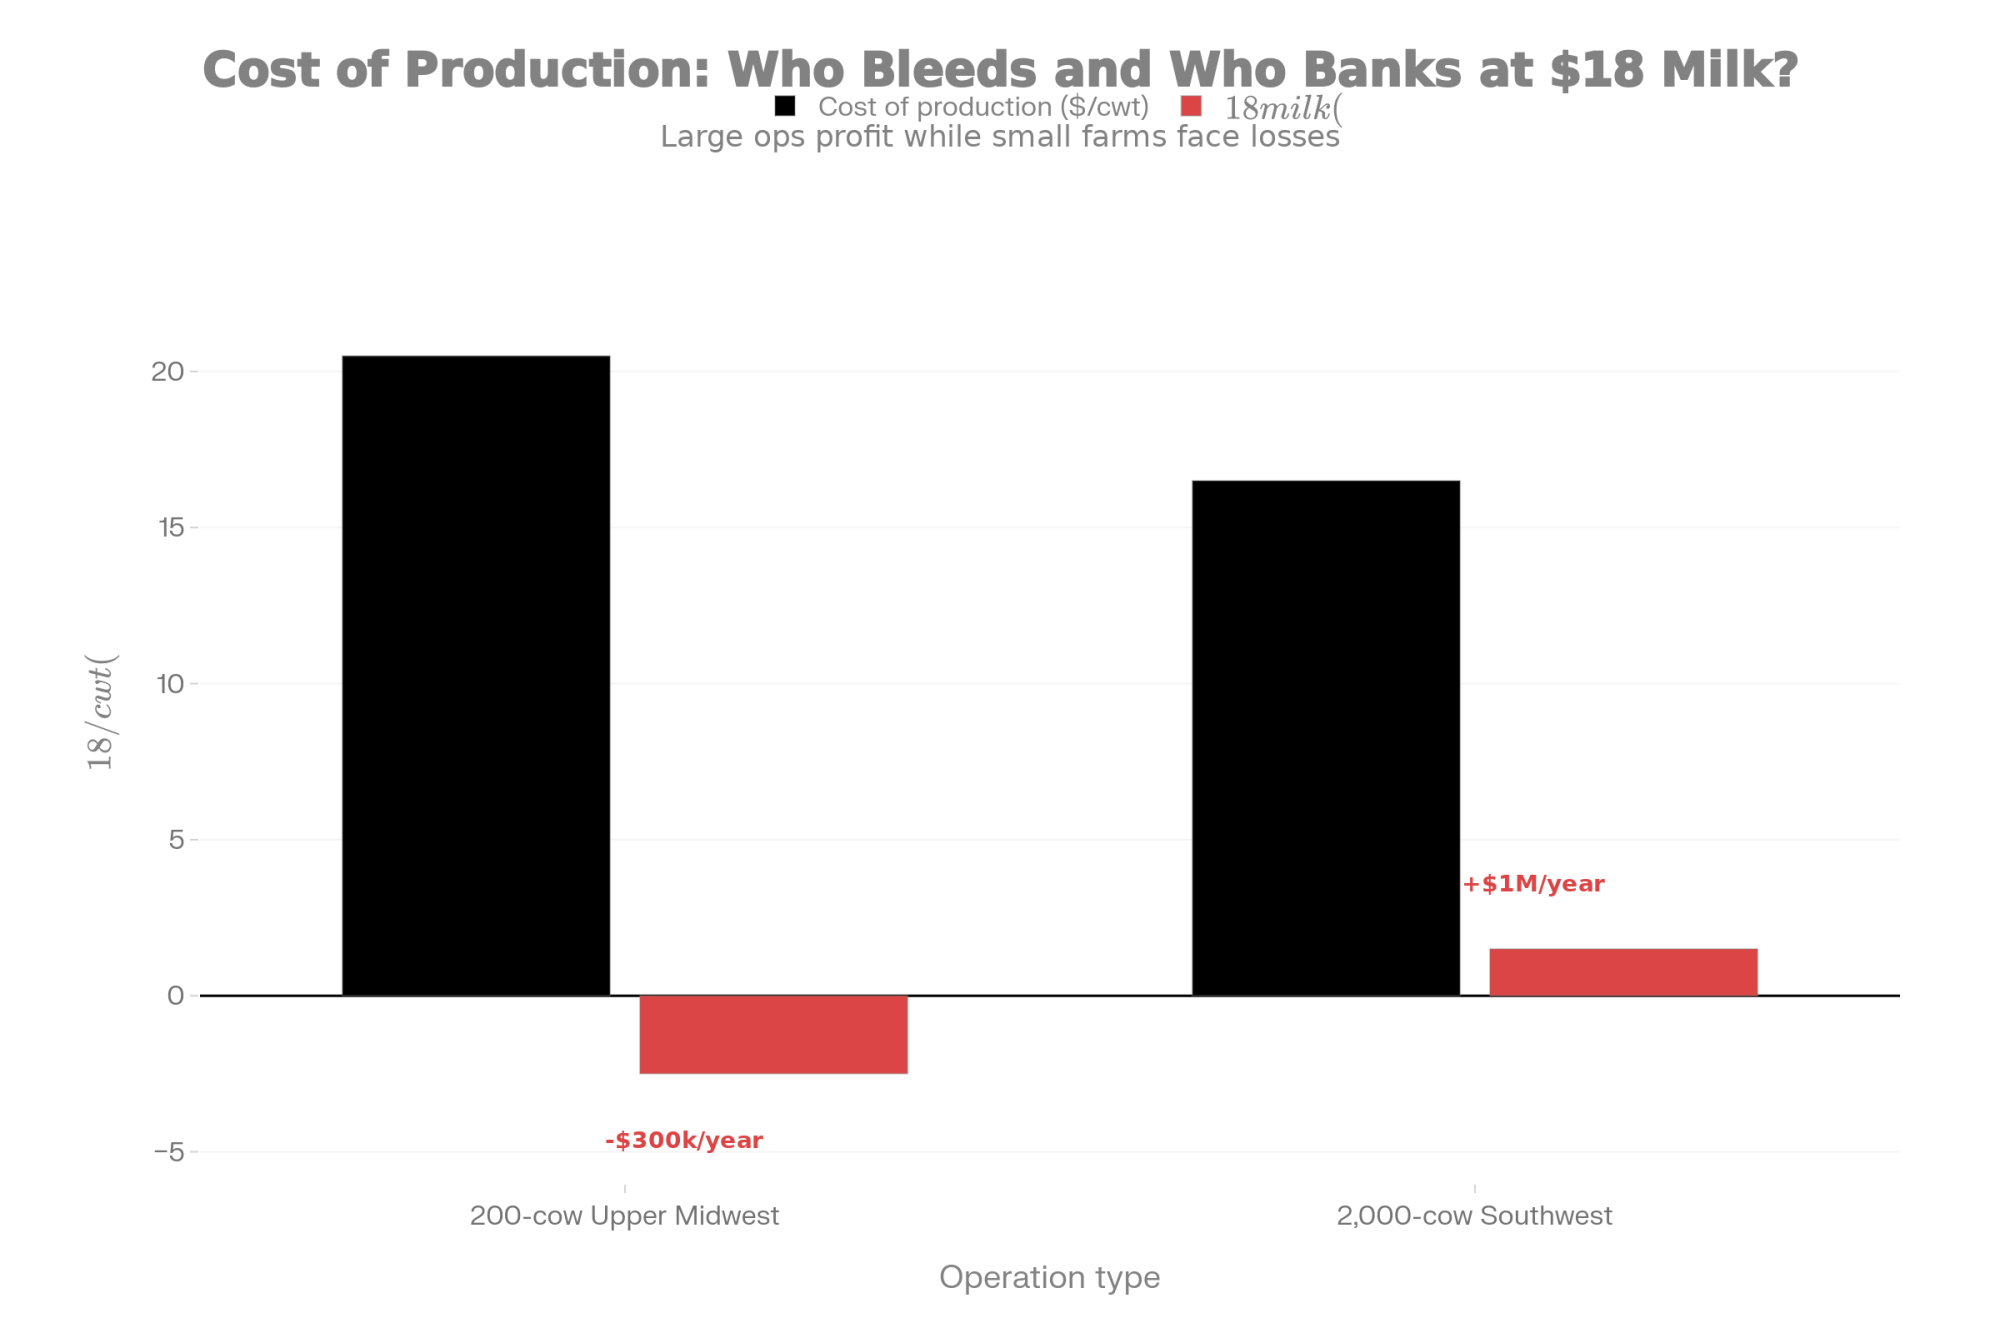
| 300-600 cows | $410/cow/year | 12-18 years | Moderate | Limited at current scale | ⚠️ High pressure zone |
| 600-1,000 cows | $385/cow/year | 10-15 years | Moderate | Scale too large for specialty | ⚠️ Severe structural squeeze |
| 1,000-2,500 cows | $315/cow/year | 8-12 years | Strong | Component optimization focus | Structurally advantaged |
| 2,500+ cows | $245/cow/year | 6-10 years | Preferred supplier | Contract leverage | Dominant position |
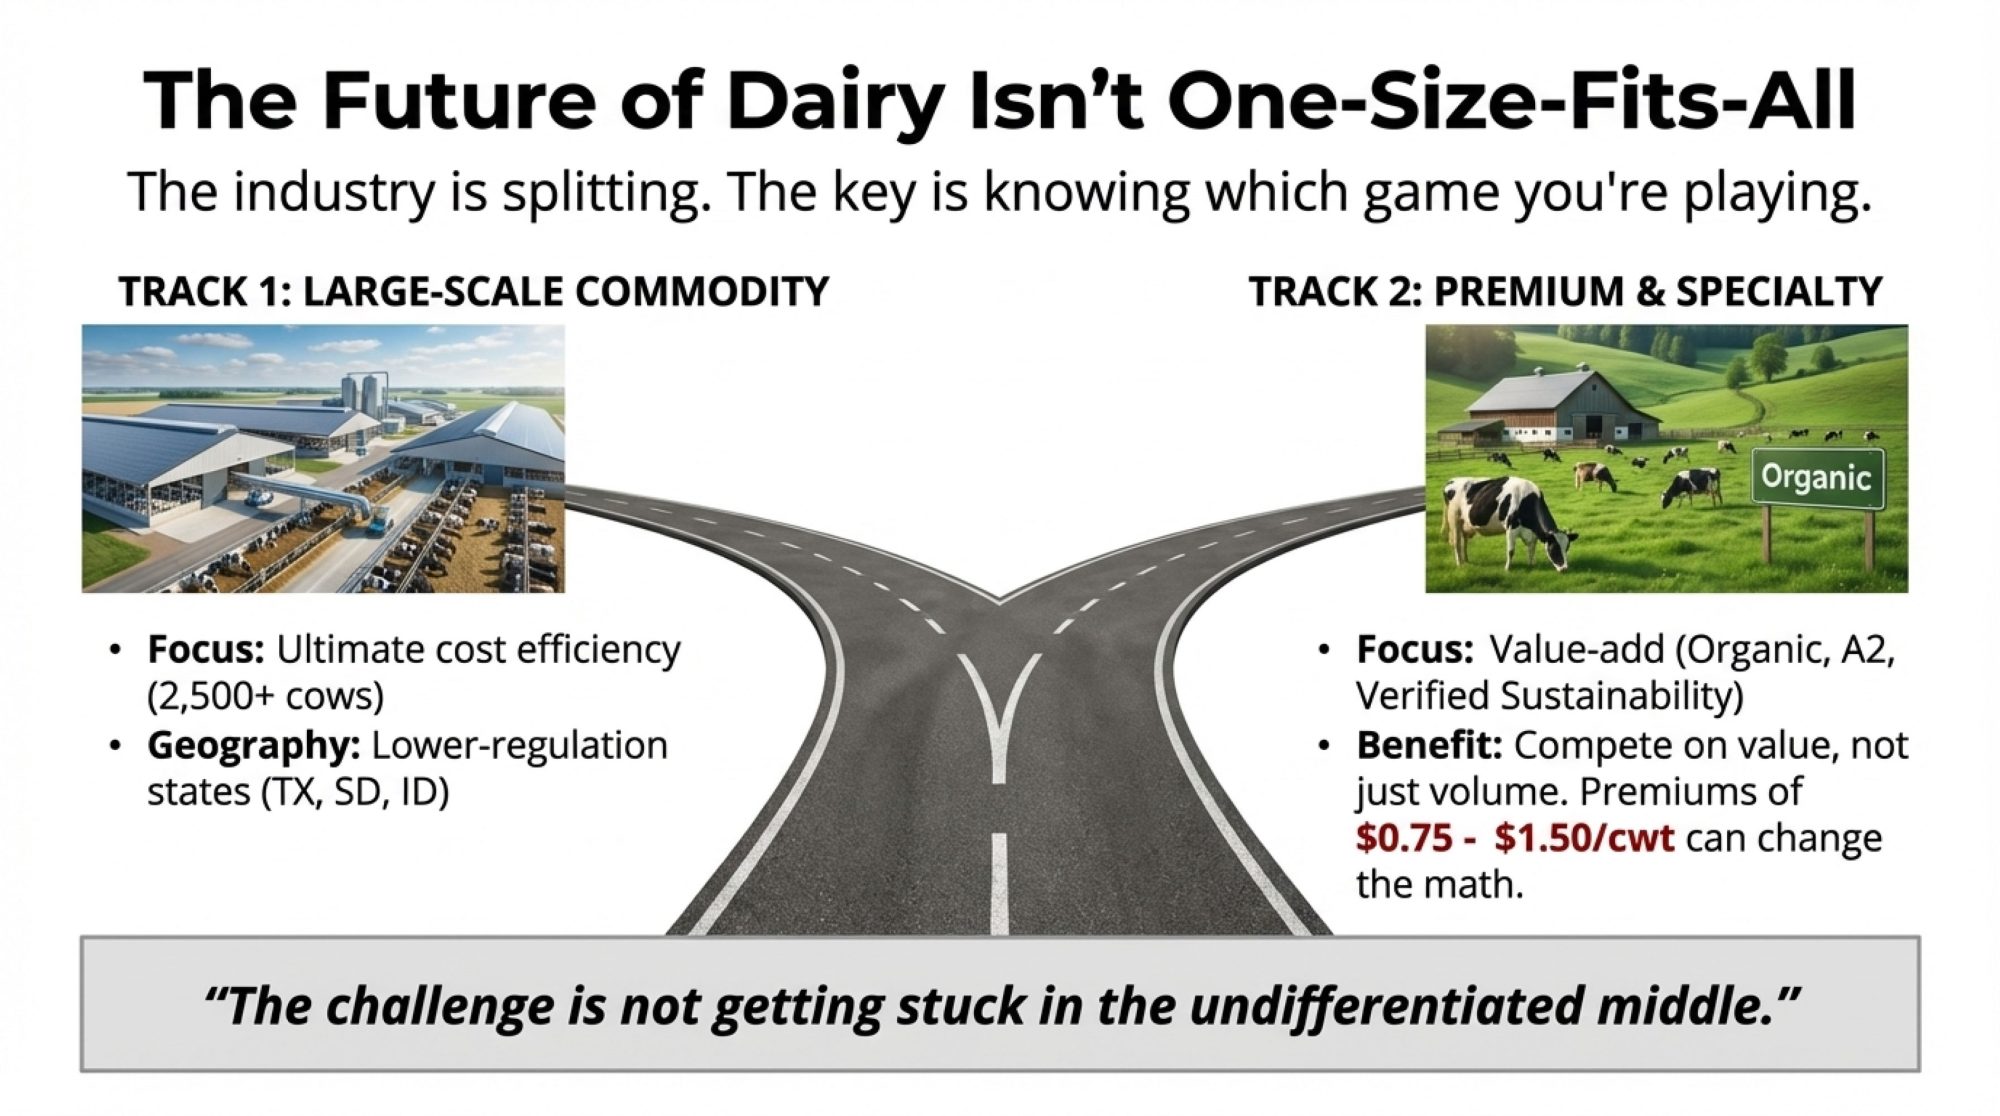
The data shows that operations above 1,000 cows have structural advantages in the current environment—lower per-unit fixed costs, automation ROI that pencils out more readily, processor leverage, and stronger capital access. The data also shows that specialty operations under 300 cows can achieve premium pricing that fundamentally changes the economics—several dollars per hundredweight above conventional for organic, significantly more for direct-to-consumer channels.
What I can’t tell you with precision is exactly how many operations will exit or consolidate, or over what timeline. When I suggest that traditional 400-1,000 cow conventional commodity operations face structural rather than cyclical challenges, that’s my analytical conclusion from watching these forces converge—not an official forecast from USDA or university research.
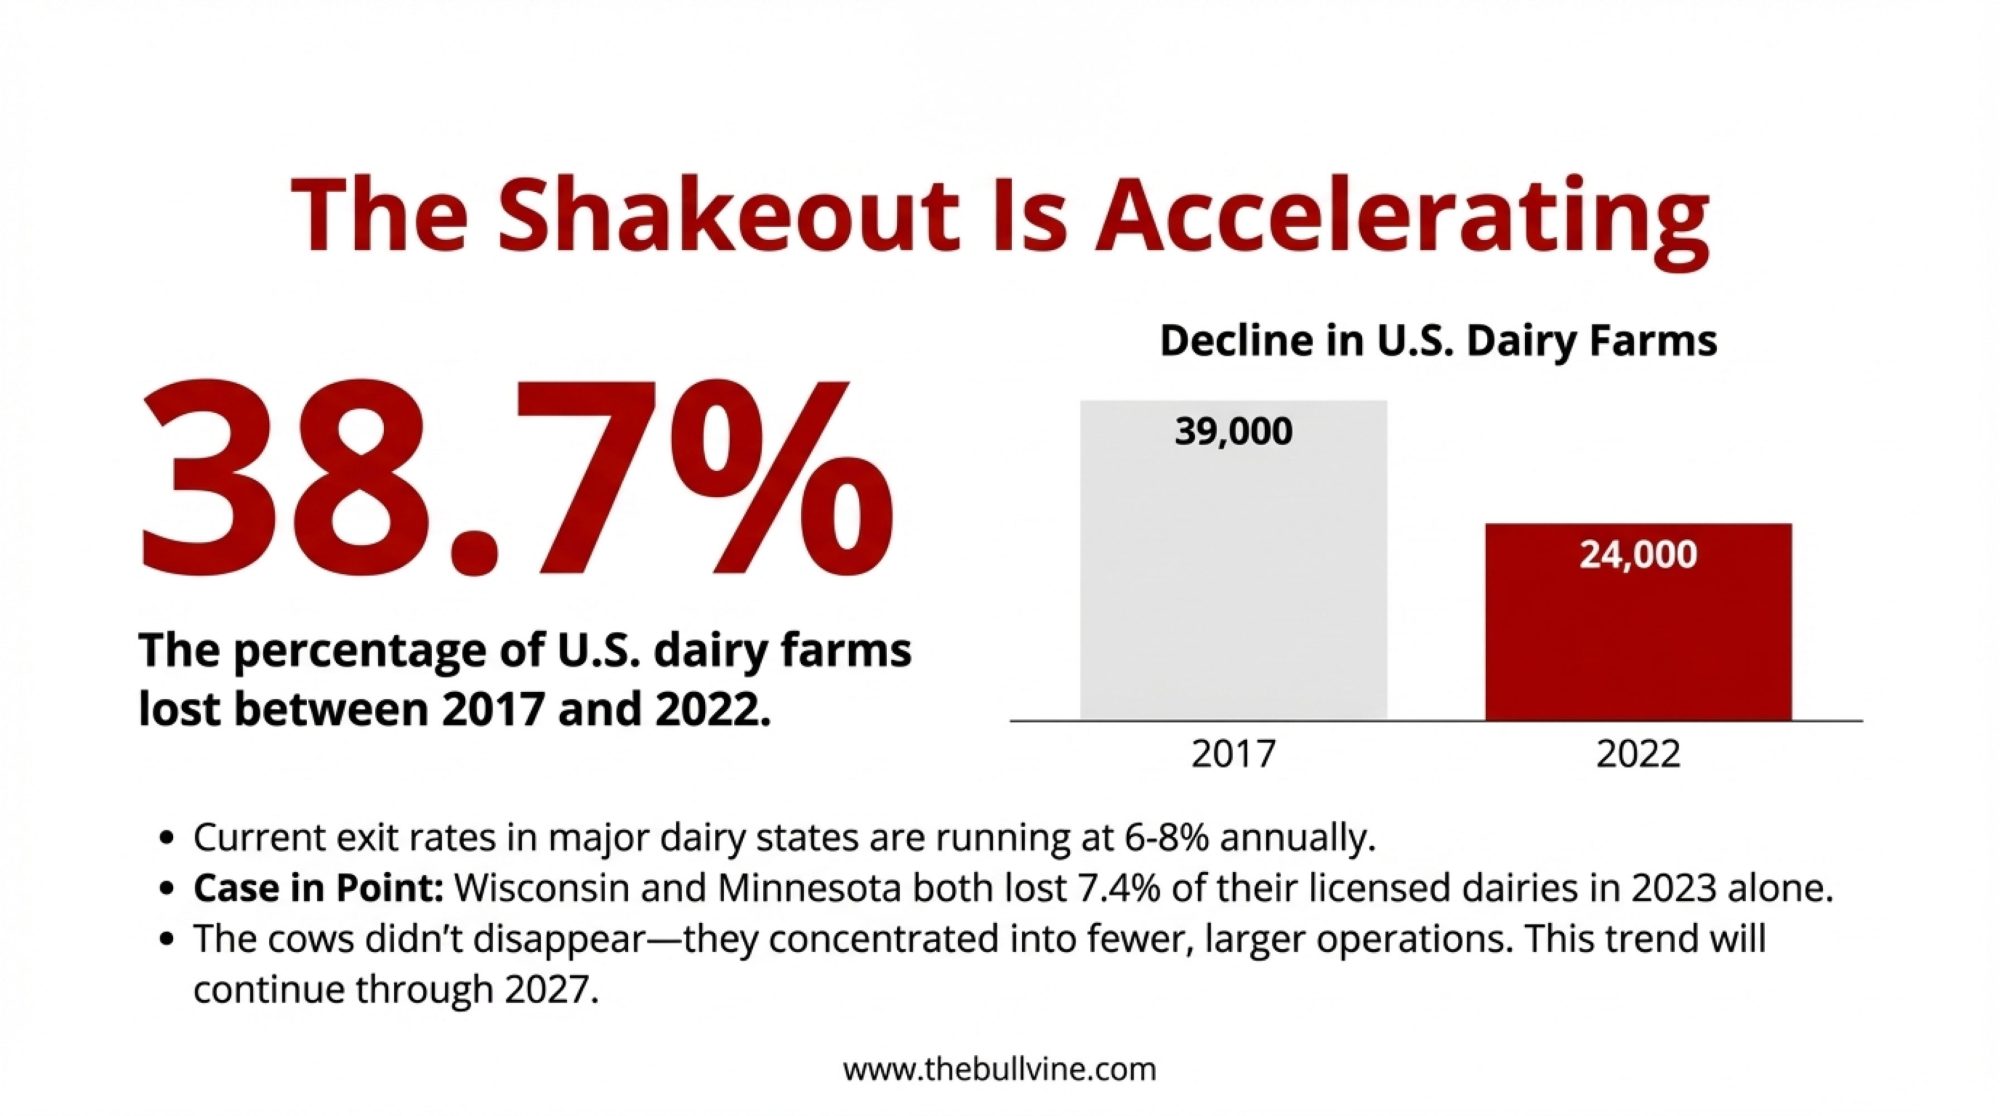
The trajectory raises legitimate questions. Rabobank’s analysis projects that approximately 2,800 dairy operations will close in 2025. If structural factors continue operating as they have—and I don’t see any obvious near-term reversal mechanisms—exit rates could remain elevated.
| Dairy Category | GLP-1 User Consumption Change | Current U.S. GLP-1 Users | Projected Annual Market Impact | Strategic Implication |
|---|---|---|---|---|
| Cheese | -7.2% ⚠️ | 11 million | -$840M category pressure | Declining demand for commodity cheese milk |
| Butter | -5.8% ⚠️ | 11 million | -$320M category pressure | Butterfat premium erosion accelerating |
| Ice Cream | -5.5% ⚠️ | 11 million | -$675M category pressure | High-fat dessert categories vulnerable |
| Fluid Milk (whole) | -3.1% ⚠️ | 11 million | -$180M category pressure | Commodity fluid milk continues secular decline |
| Greek Yogurt | +185% ✓ | 11 million | +$920M category opportunity | Protein-focused growth accelerating |
| Cottage Cheese | +280% ✓ | 11 million | +$450M category opportunity | Dramatic protein-demand spike |
| High-Protein Beverages | +195% ✓ | 11 million | +$615M category opportunity | Emerging premium protein channel |
| Skyr / Icelandic Yogurt | +220% ✓ | 11 million | +$285M category opportunity | Ultra-high protein positioning working |
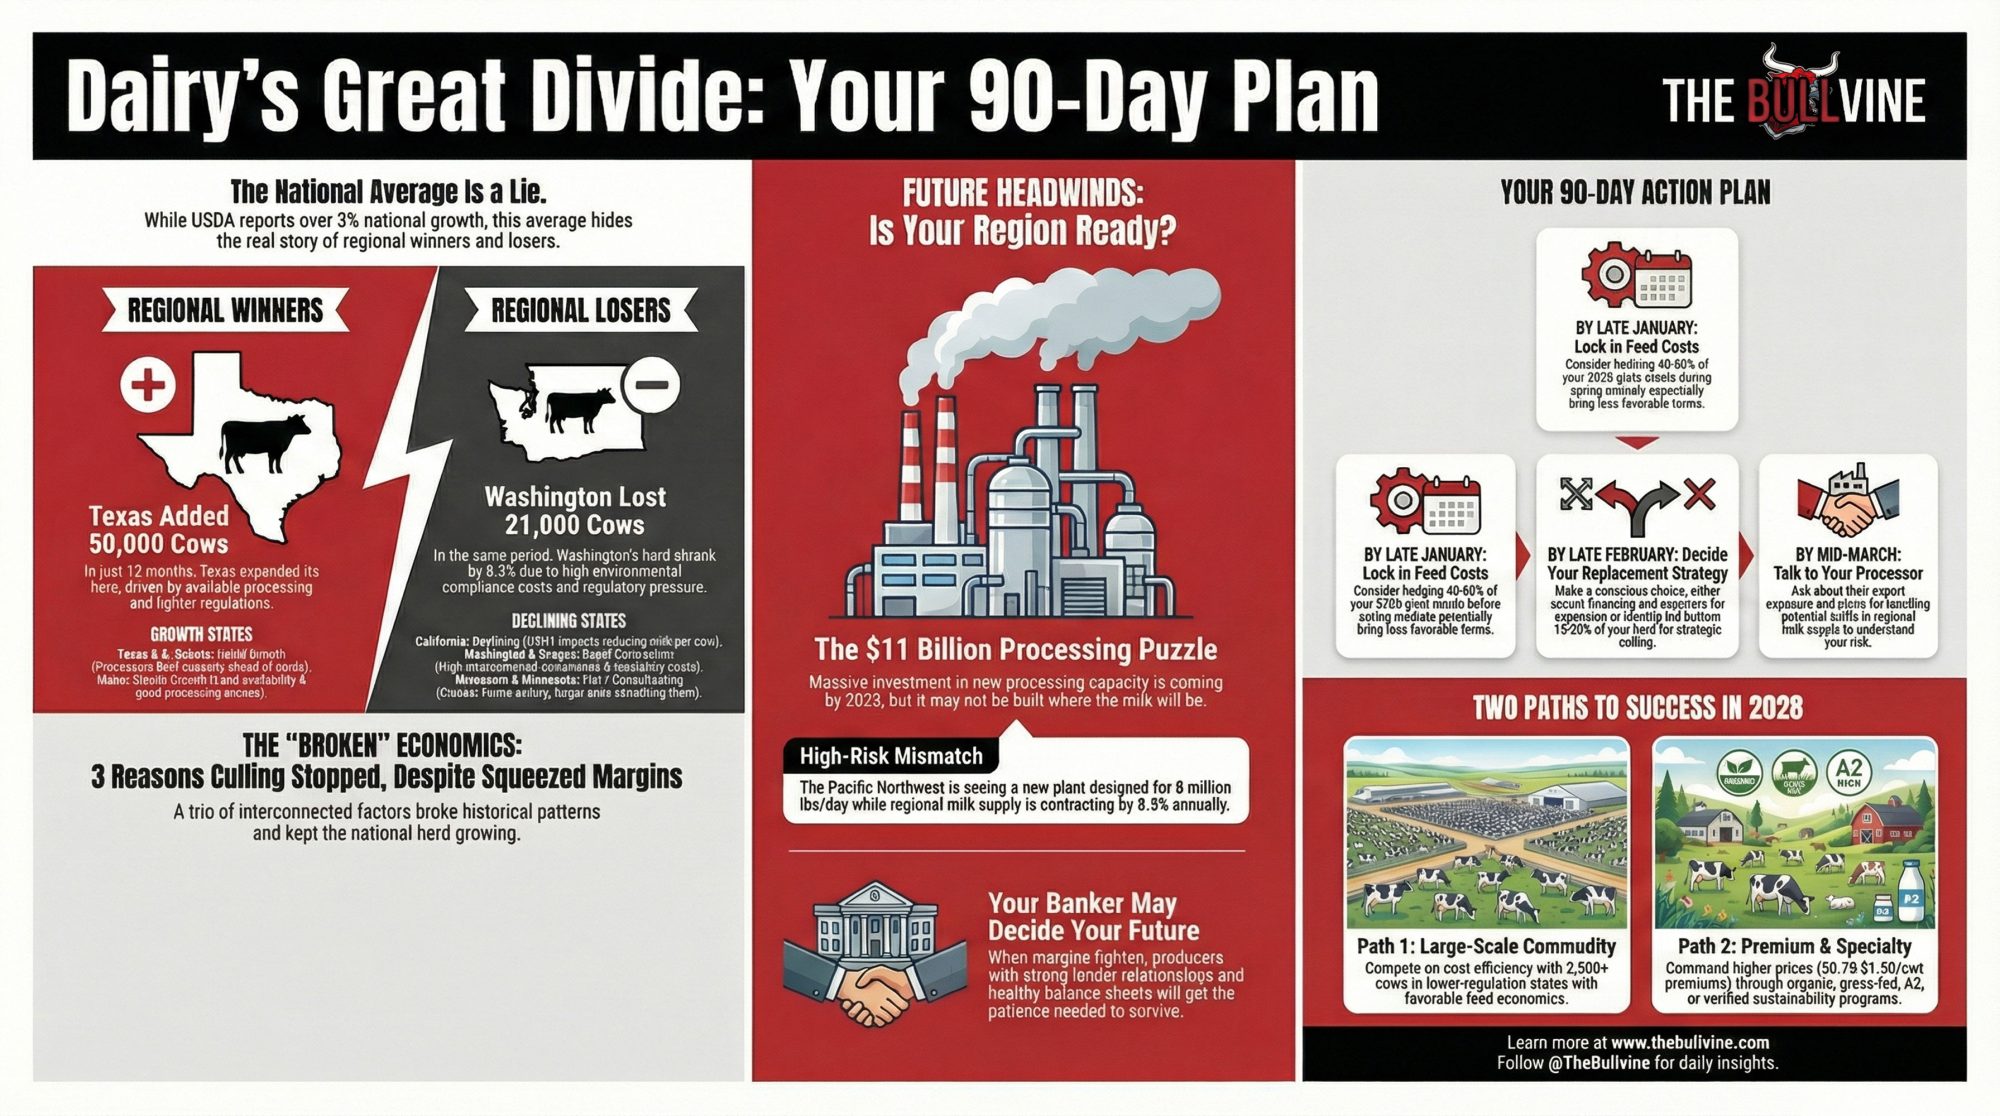
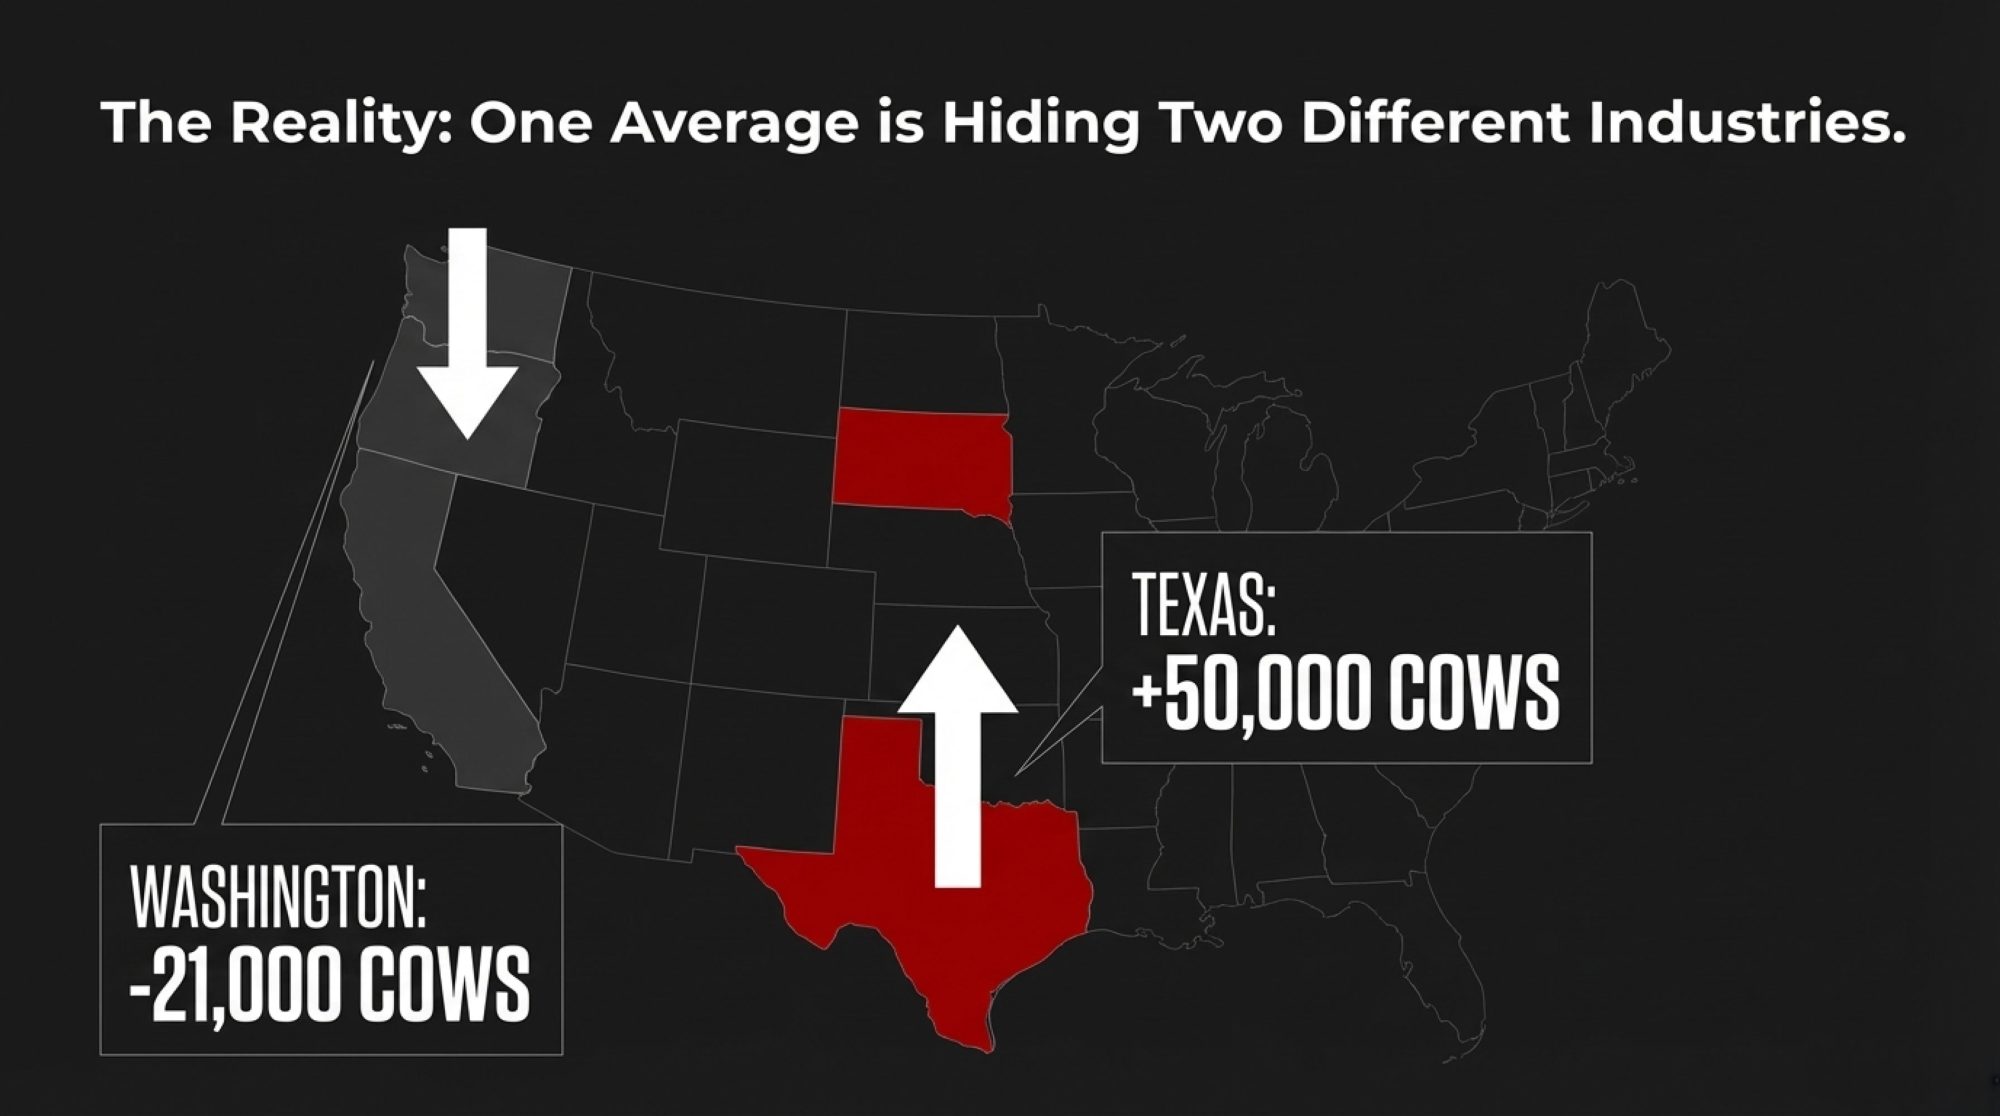
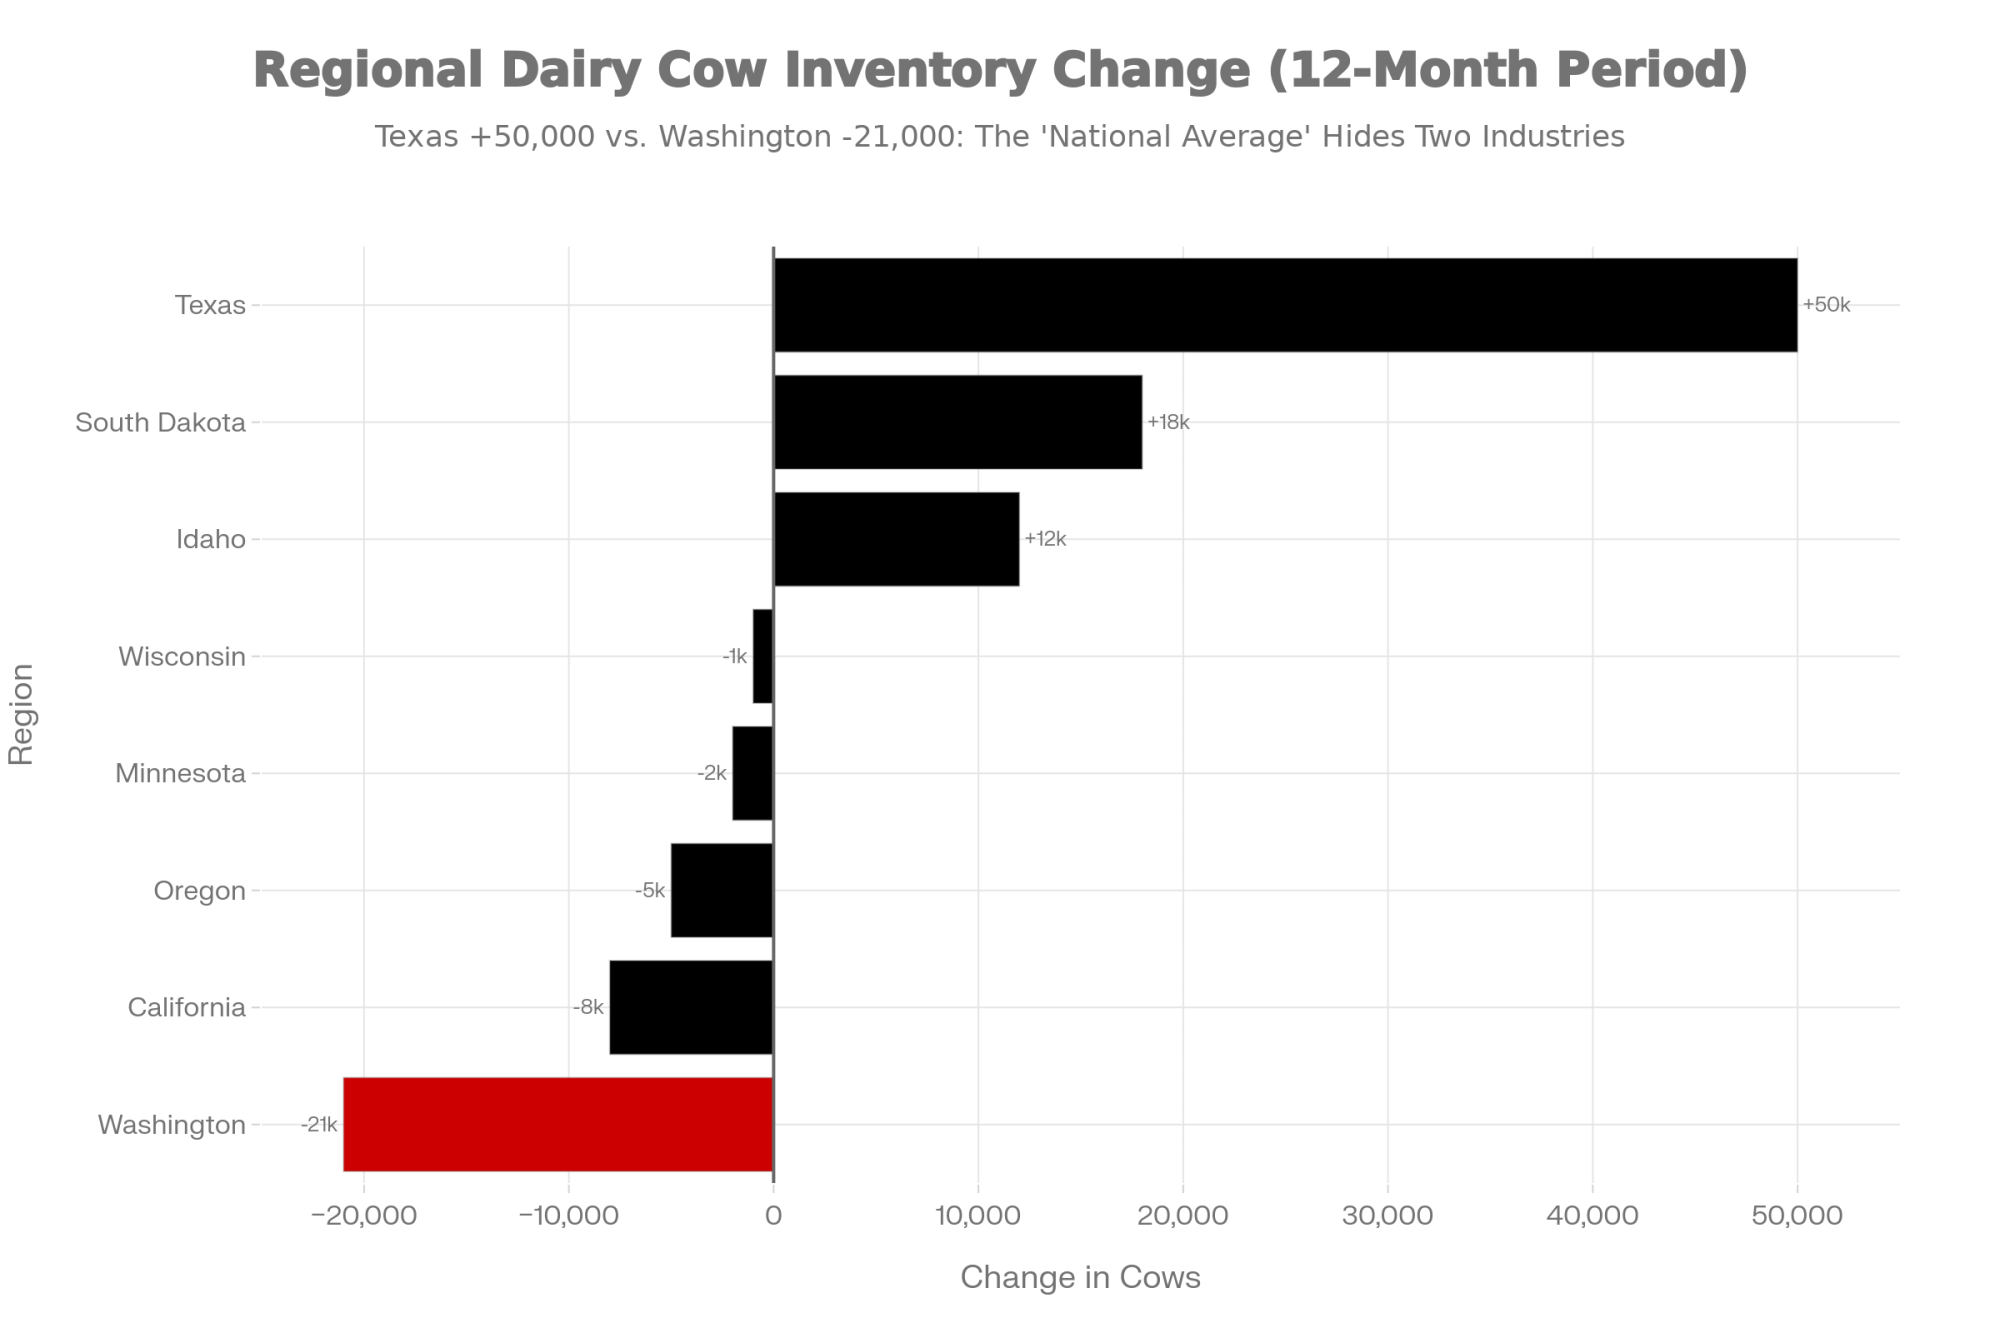
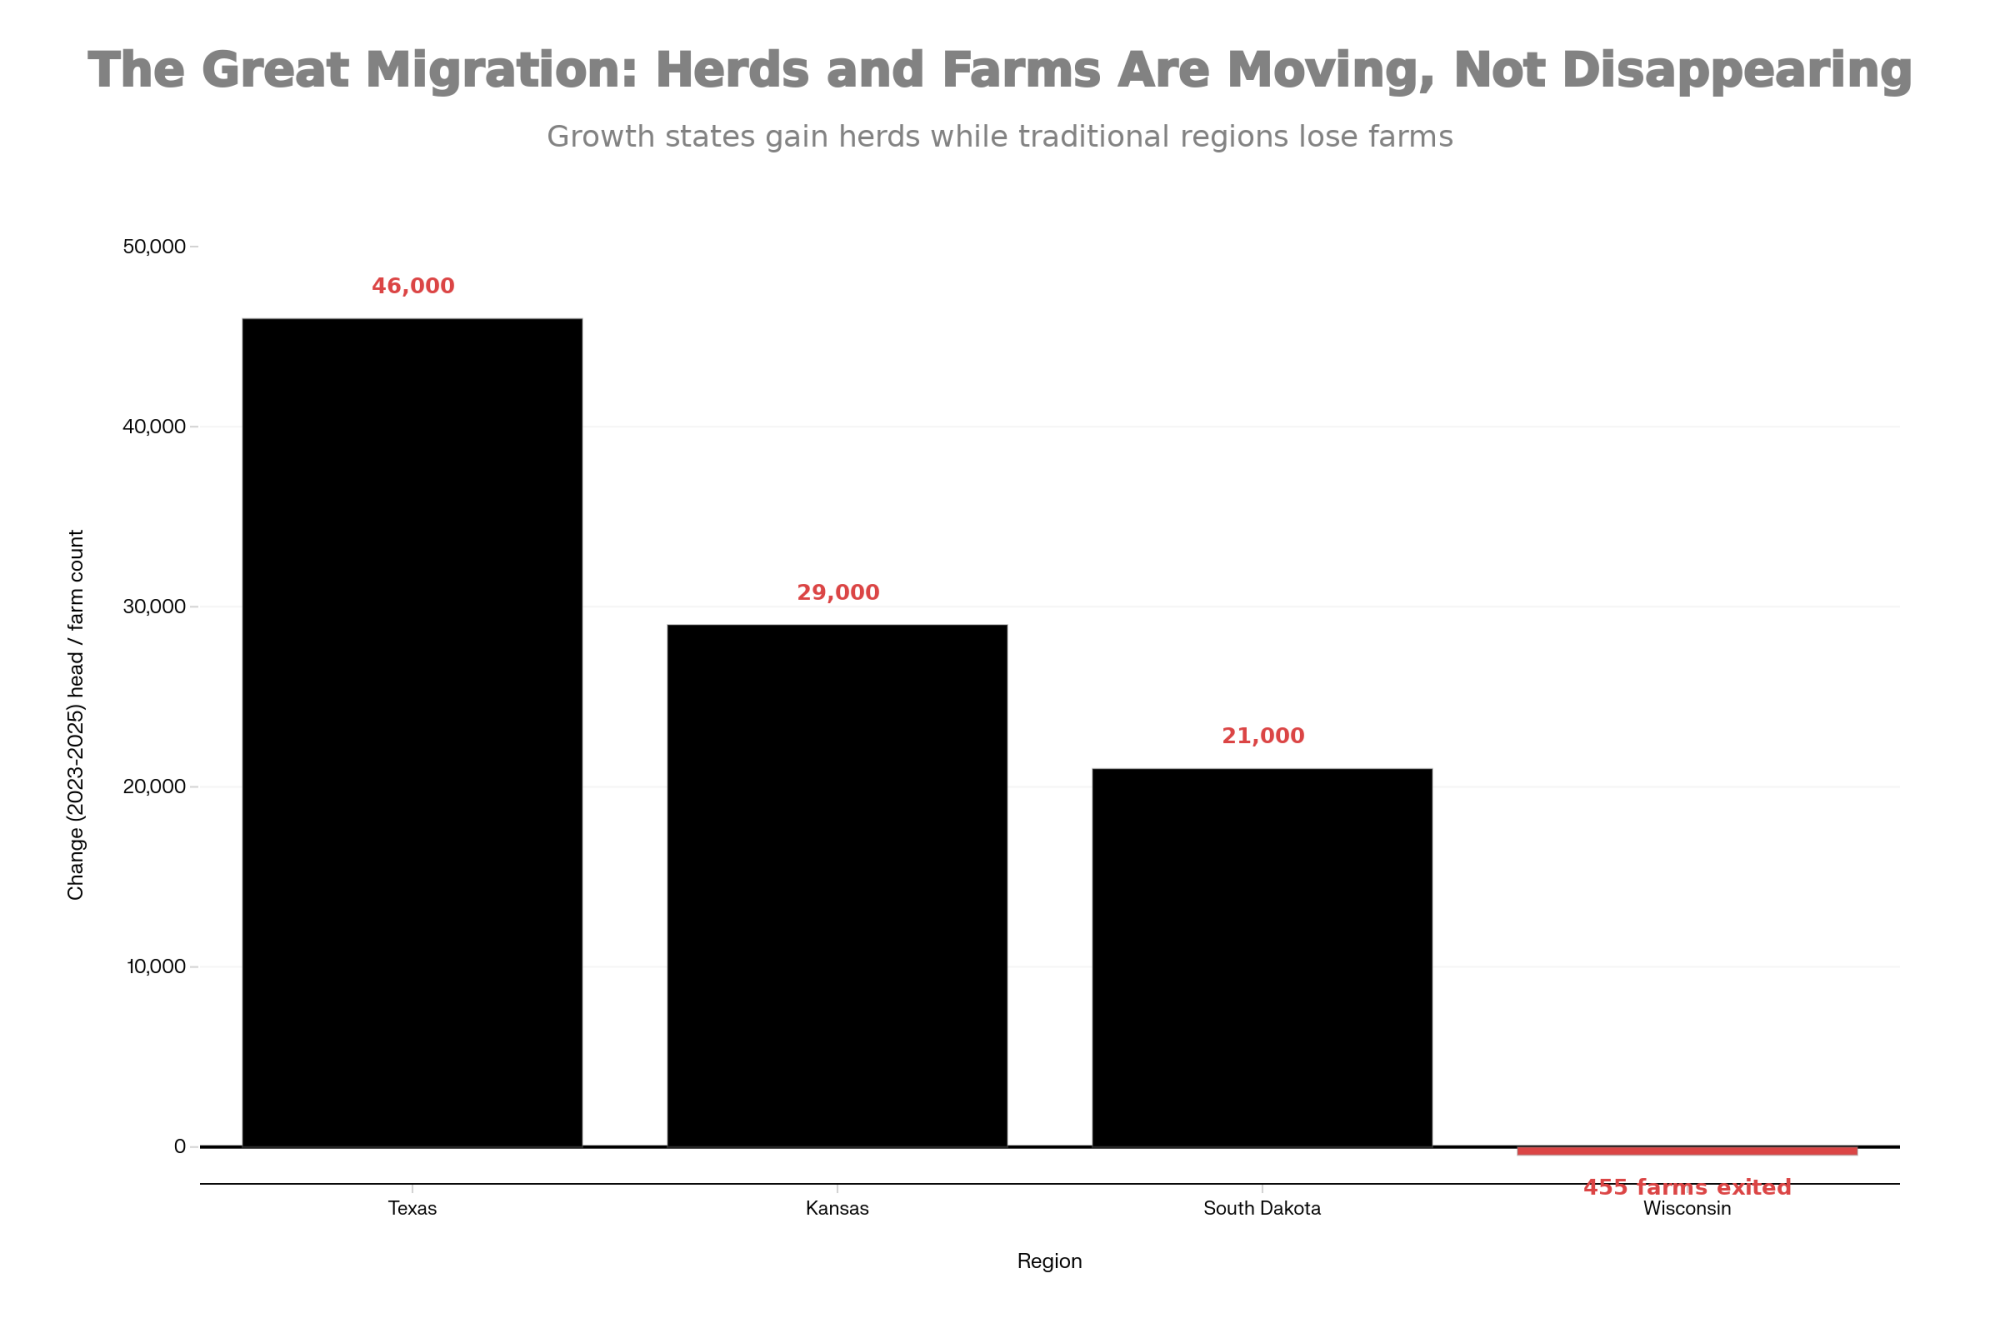
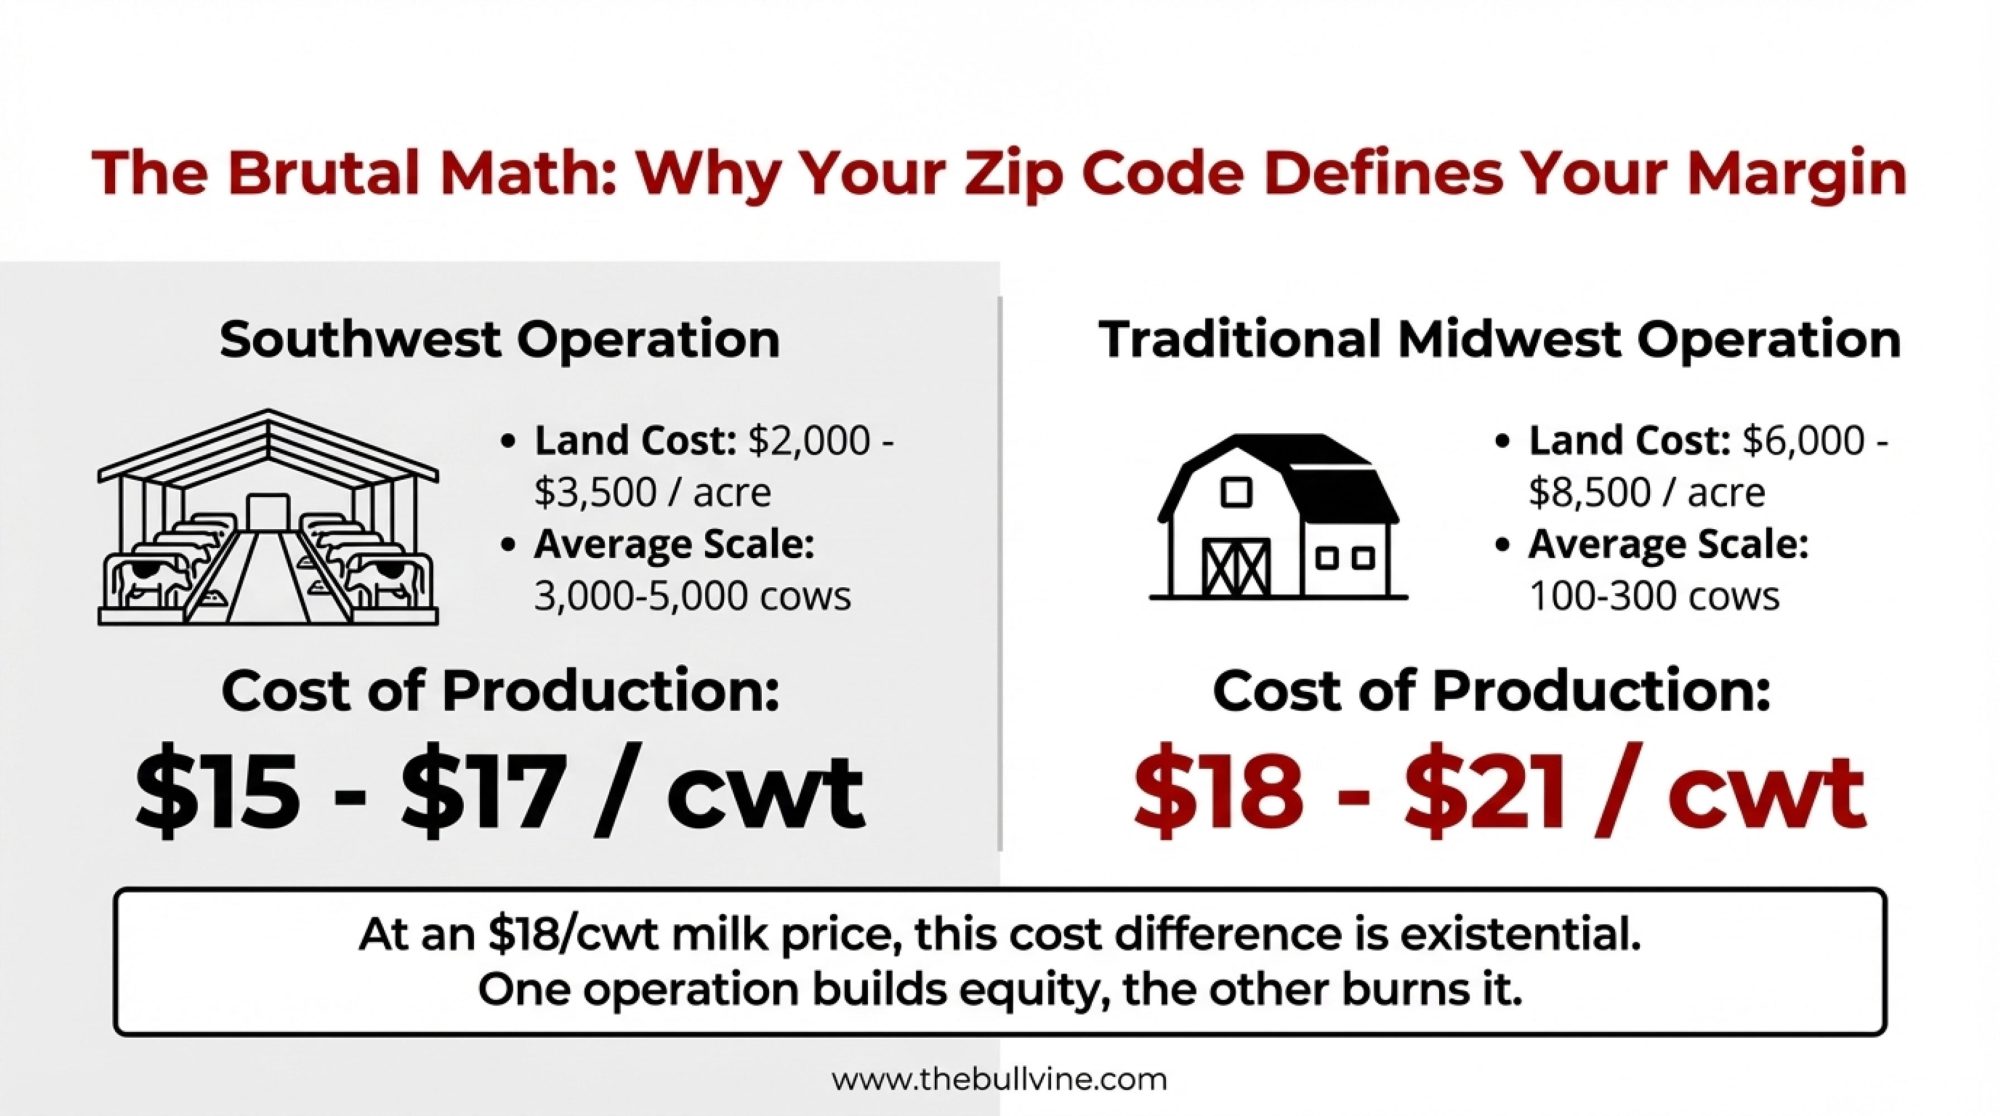
The dynamics play out somewhat differently across regions. California operations face additional water cost and regulatory pressures that compound the structural challenges we’ve discussed. Idaho’s rapid consolidation has created different competitive patterns, with fewer mid-size operations surviving the squeeze. Texas and New Mexico dairies navigate the economic impacts of heat stress, which affect both production and labor. But the underlying forces—hierarchal costs, component shifts, processor consolidation, labor thresholds—are similar across geographies.
Here’s what’s equally important to acknowledge: different producers in different circumstances will navigate this very differently. I’ve talked with 800-cow conventional operations in Wisconsin, genuinely optimistic about their positioning—strong processor relationships, manageable debt, recent automation investment. I’ve talked with 500-cow operations in the same region that see no viable path forward without fundamental restructuring. Context matters enormously.
Paths That Are Working
Let me share what I’m observing in operations as they find viable paths forward, because genuine success stories exist alongside the challenges.

The organic transition continues to offer meaningful premium for operations willing to commit to production system changes. Operating margins for organic dairy typically exceed conventional operations substantially—though specific returns vary considerably by region, market relationships, and transition management. Several producers who converted from larger conventional operations emphasized that they had to reduce herd size significantly to make organic economics work long-term.
One Vermont organic producer—she runs about 200 cows and has been active in regional organic dairy advocacy—described her experience: “We ran 450 conventional cows for fifteen years. When we converted in 2019, we dropped to 200 and actually increased net income. The gross revenue decline was scary initially, but the margin improvement proved real.”
The transition period requires careful planning and an adequate financial runway. It’s not a quick fix, but it’s working for operations that approach it strategically.
Cooperative processing models are emerging in several regions and merit attention. The concept: multiple mid-size operations collectively invest in processing capacity—typically Greek yogurt, high-protein products, or specialty cheese—to capture value-added margins on a portion of their milk.
One Minnesota cooperative involving four farms with a combined 1,800 cows reports routing 25% of collective production through a small processing facility they financed together. That portion generates roughly twice the commodity price. The remaining 75% continues through traditional channels.
“We didn’t have the scale individually to make processing investment work,” one participating farmer explained. “Together we did.”
This model won’t fit every situation, but it represents creative thinking worth exploring.
Strategic positioning toward protein-focused products is another path to gaining traction. Some operations are pivoting toward products that align with GLP-1-influenced consumption patterns—high-protein yogurt, cottage cheese, protein-enhanced beverages. Rather than resisting the demand shift, they’re moving with it.
| Strategic Path | Capital Required | Timeline to Viability | Primary Risk Factor | Ideal Candidate Profile | Action This Week |
|---|---|---|---|---|---|
| Organic Transition | $50,000-$150,000 (certification, transition feed) | 18-24 months (transition period) | ⚠️ Market access / buyer contracts | <300 cows, manageable debt, pasture access, 12-month cash runway | Contact state organic certification agency for feasibility assessment |
| Cooperative Processing | $200,000-$500,000 (shared facility investment) | 24-36 months (facility build-out) | ⚠️ Partner alignment / governance structure | 3-5 operations, 250-600 cows each, geographic proximity, complementary goals | Initiate conversation with neighboring operations about joint feasibility study |
| Strategic Scaling | $2M-$5M+ (automation, expansion, acquisition) | 12-24 months (installation, ramp-up) | ⚠️ Debt service in compressed margin environment | >800 cows, strong processor relationship, expansion capacity, lender support | Request processor meeting on long-term supply agreement; lender pre-qualification |
| Strategic Exit | $25,000-$75,000 (professional planning, legal, transition) | 6-18 months (orderly liquidation) | ⚠️⚠️ Asset value erosion if market floods | 300-1,000 cows, elevated debt, no succession plan, limited specialty pivot options | → Confidential consultation with ag financial advisor and equipment appraiser |
A Necessary Conversation About Timing
I want to address something directly that industry coverage sometimes avoids.
For some operations facing the structural challenges discussed here—compressed margins, elevated replacement costs, processor relationship pressure, automation economics that don’t pencil out, no clear specialty pivot—strategic exit while asset values remain elevated may represent the soundest financial decision available.
Choosing to exit under these circumstances isn’t failure. It’s asset management.
It’s recognition that structural economics have shifted in ways that particular operational configurations can’t accommodate. The industry changing isn’t any individual producer’s fault.
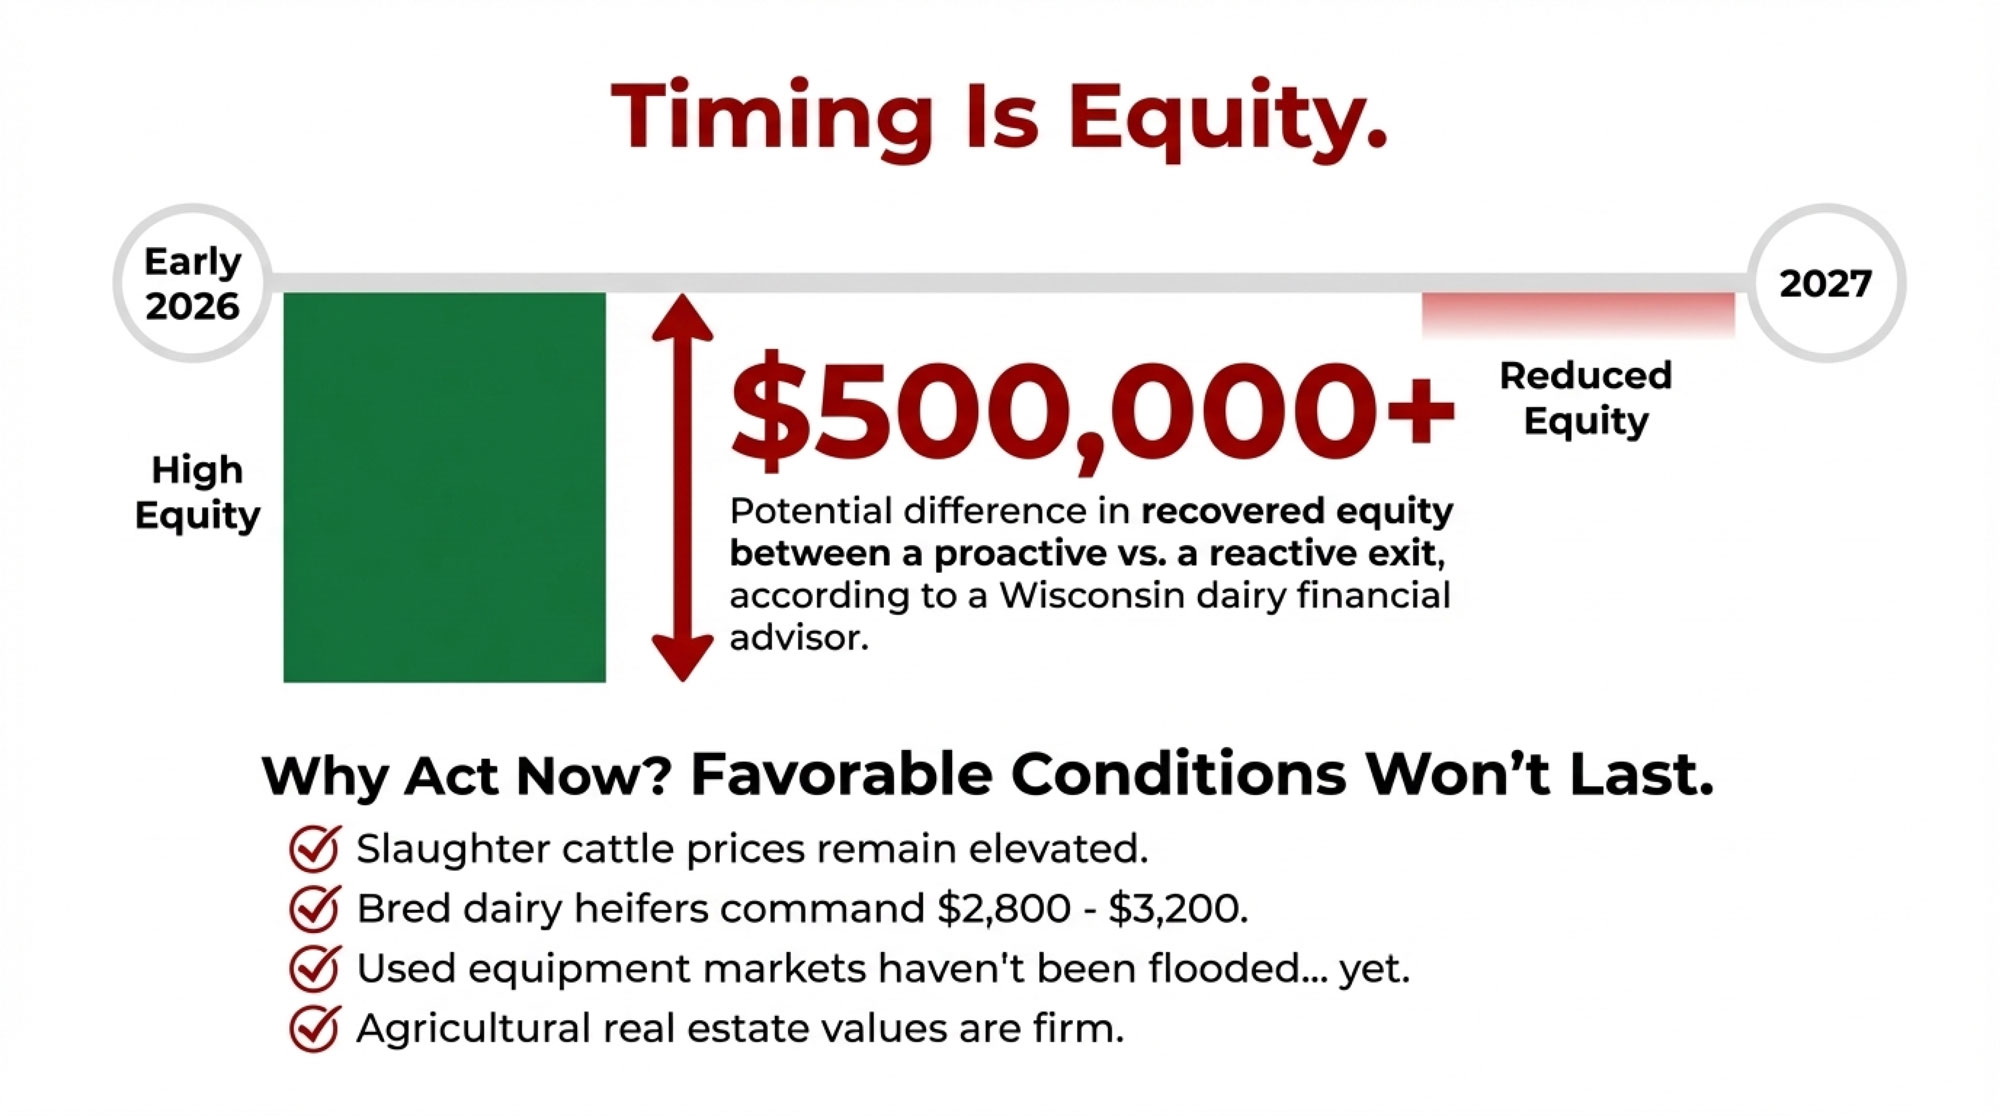
Current asset values remain relatively favorable. USDA market data shows slaughter cattle prices elevated, with bred dairy heifers commanding $2,800-$3,200 at many auctions. Used equipment markets haven’t yet flooded with liquidation inventory. Agricultural real estate values in productive regions remain firm.
These conditions won’t persist indefinitely if exit rates accelerate as structural pressures suggest they might.
A financial advisor working exclusively with Wisconsin dairy operations framed it this way: “The difference between a proactive exit in early 2026 and a reactive exit in 2027 can exceed half a million dollars in recovered equity for a mid-size operation. That’s not about farming ability—it’s about timing.”
What I’d Tell Someone Navigating This
If I were sitting across from you working through these realities—and I’ve had many such conversations this year—here’s what I’d want you to understand:
The structural forces are real, but they’re not uniform. Your specific circumstances—debt levels, processor relationships, facility condition, labor situation, geographic positioning, family involvement, personal goals—matter enormously. There’s no single right answer that applies universally.
The timeline for proactive decision-making appears compressed. Whether you’re considering specialty transition, cooperative participation, strategic investment, or planned exit, the window for making deliberate choices rather than reacting to crisis seems to be the next six to twelve months. Asset values, credit access, and market options tend to deteriorate once financial stress becomes externally visible.
Professional guidance matters more than usual. This isn’t a moment for figuring everything out alone. State agricultural extension services offer transition planning resources—Wisconsin’s Center for Dairy Profitability and Cornell’s PRO-DAIRY program have developed tools specifically for this environment. The Farm Financial Standards Council maintains directories of qualified agricultural financial consultants. USDA’s Farm Service Agency administers loan programs supporting organic transition or operational restructuring.
Consider what you actually want. Beyond financial analysis lies a personal question: What do you want your life to look like in three years? Five years? Sometimes the right answer is to continue farming dairy under restructured circumstances. Sometimes it means preserving the equity you’ve built and redirecting it elsewhere. Both can represent good decisions depending on your situation and values.
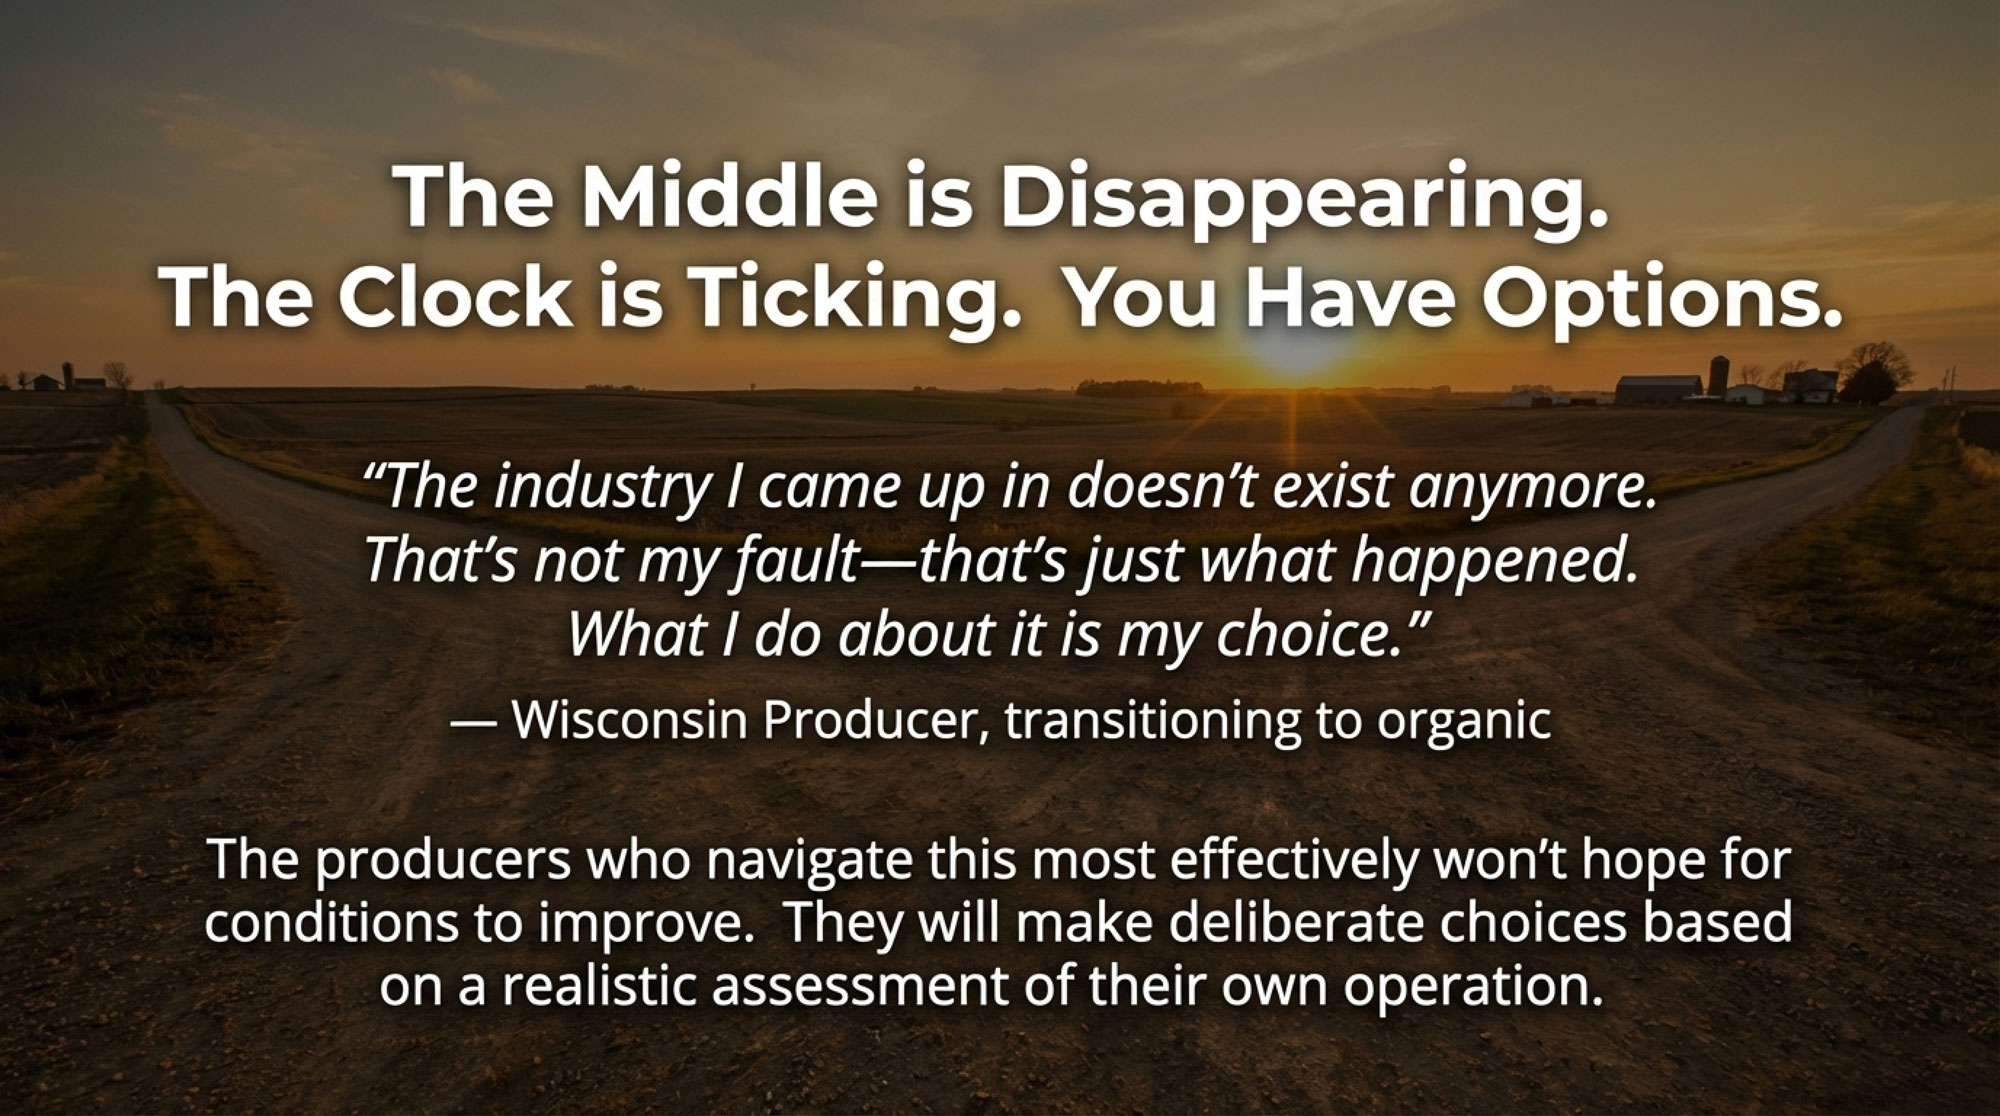
A producer working through organic transition planning after thirty years in conventional dairy offered a perspective that’s stayed with me: “The industry I came up in doesn’t exist anymore. That’s not my fault—that’s just what happened. What I do about it is my choice.”
Practical Considerations by Operation Size
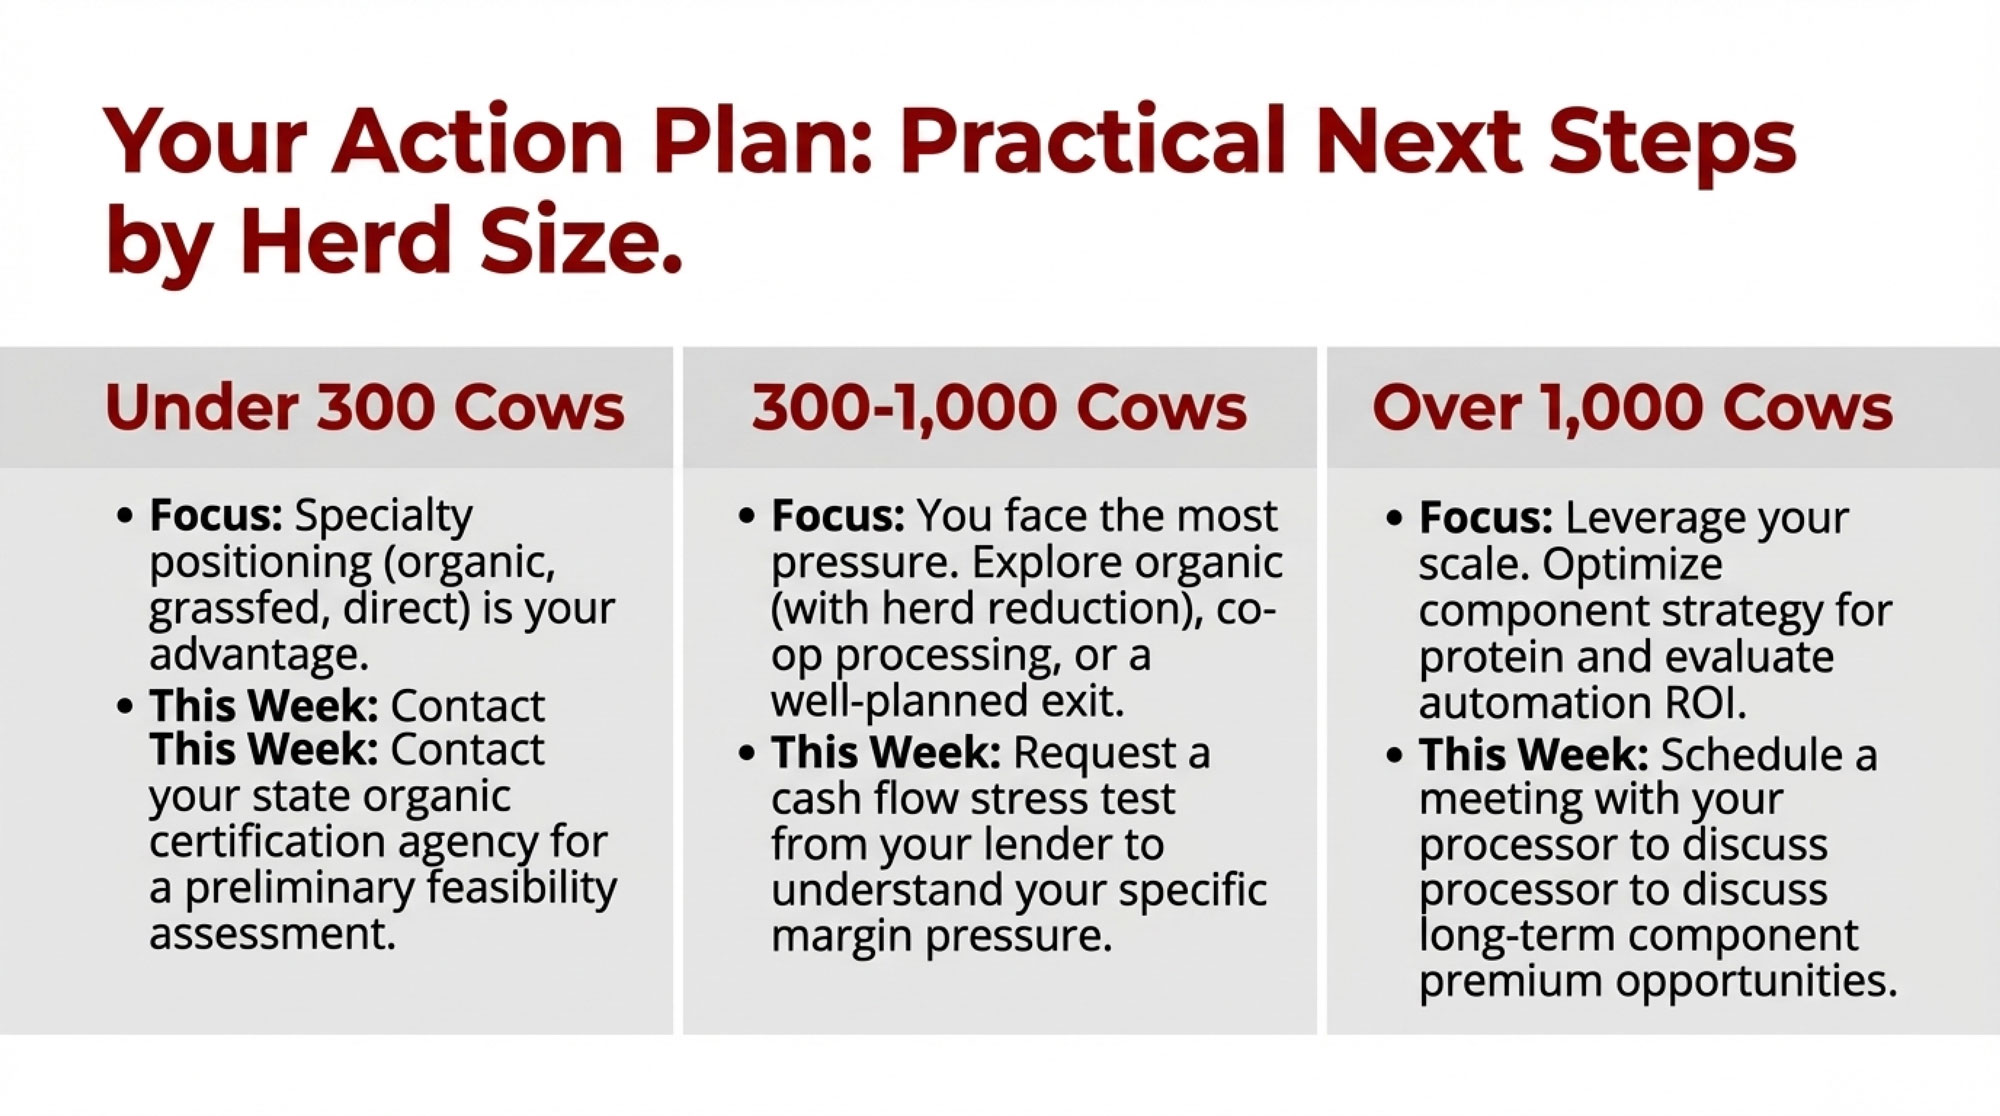
For operations under 300 cows:
- Specialty positioning—organic, grassfed, direct-to-consumer—offers economics that commodity production increasingly struggles to match
- Your scale disadvantage in commodity markets can become an advantage where authenticity and direct relationships matter
- Organic certification typically requires 18-24 months of transition planning; raw milk licensing varies significantly by state
- State organic certification agencies and NODPA offer valuable transition guidance
- This week: Contact your state organic certification agency to request a preliminary feasibility assessment for your operation
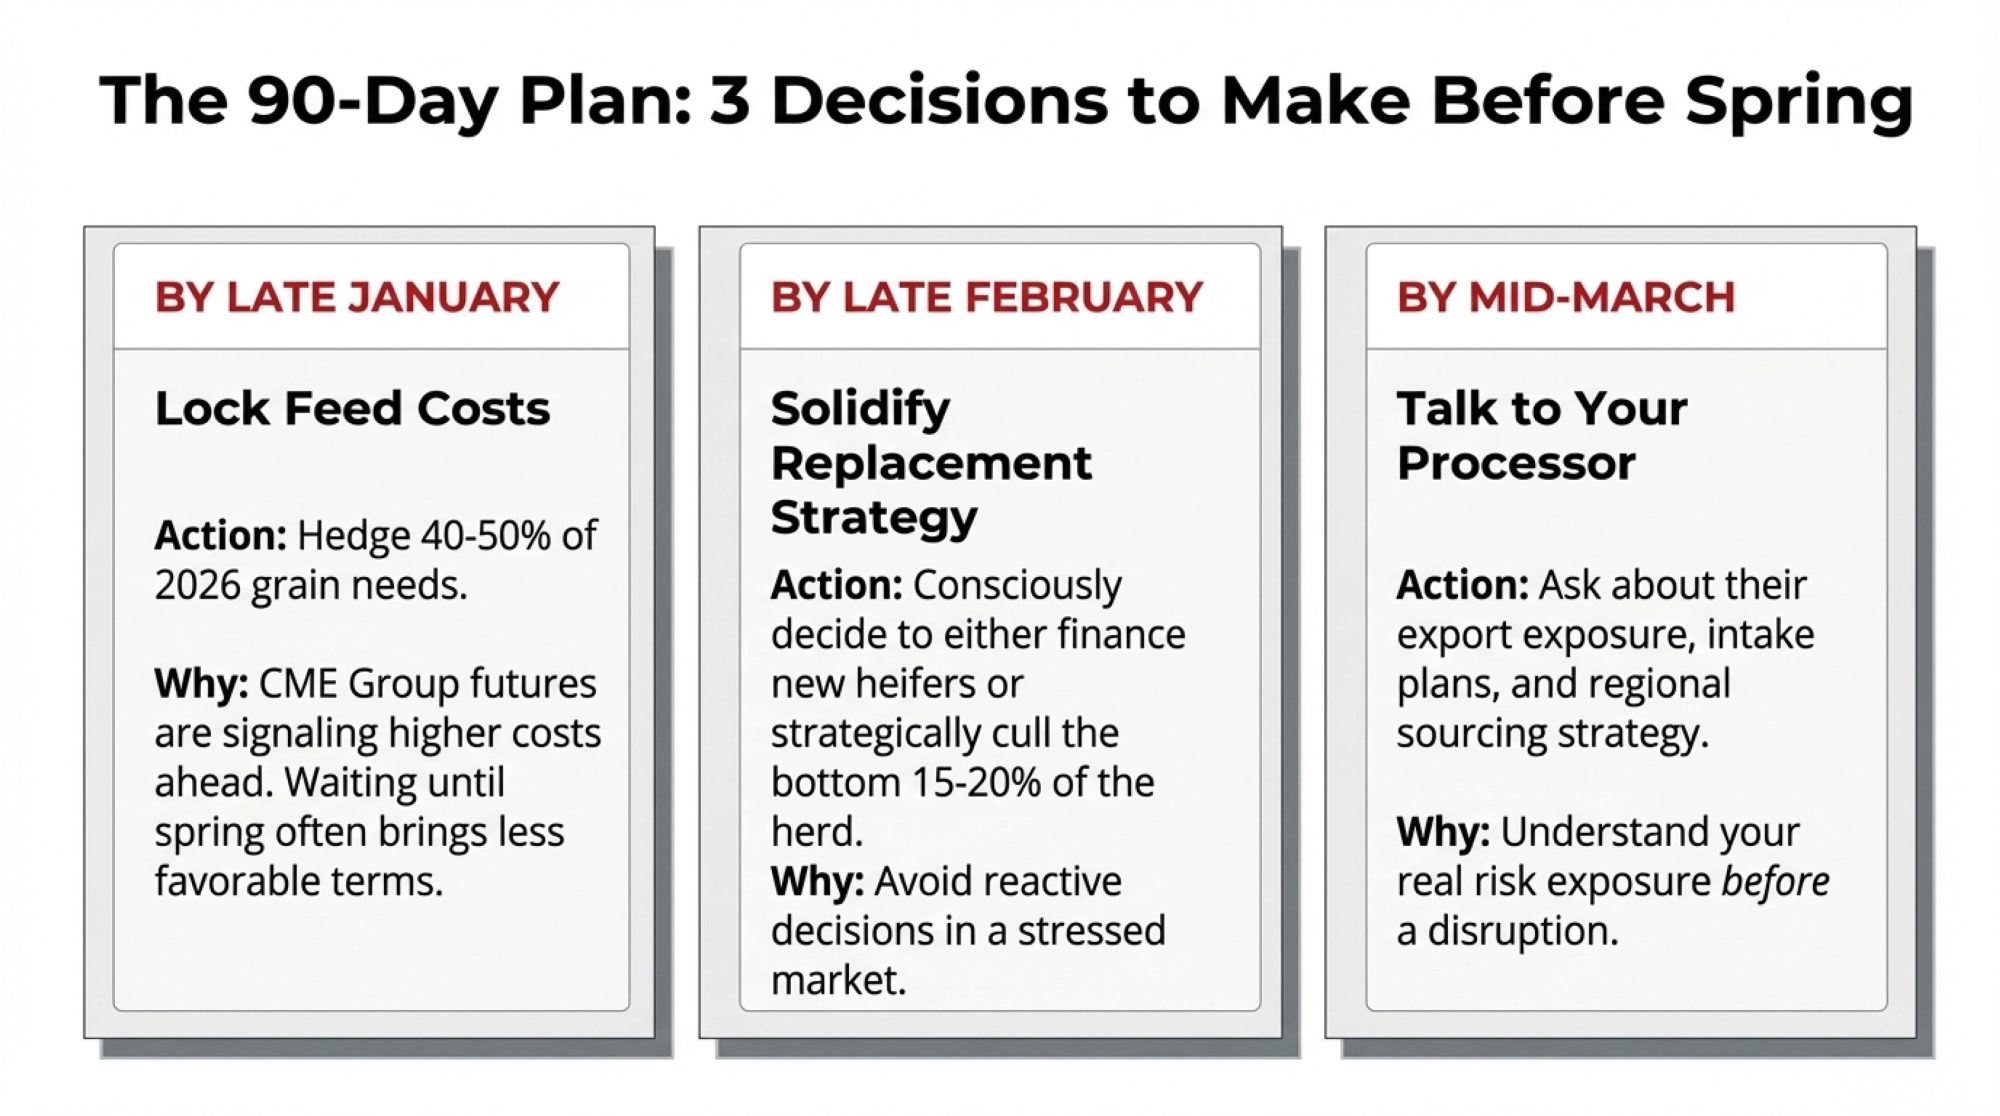
For operations of 300-1,000 cows:
- This scale faces the most significant structural pressure—large enough that specialty positioning at current capacity is difficult, but not large enough for automation economics to work straightforwardly
- Viable paths worth exploring: organic conversion with strategic herd reduction, cooperative processing partnerships, or well-planned exit
- Timeline for decision-making matters; consultation with dairy financial specialists before mid-2026 seems prudent
- Conversations with neighboring operations about cooperative arrangements may reveal unexpected opportunities
- This week: Request a cash flow stress test from your lender or farm financial consultant to understand your specific margin pressure under various price scenarios
For operations above 1,000 cows:
- Automation ROI becomes more favorable at this scale; systematic robotics evaluation is appropriate if not already undertaken
- Processor relationships and component optimization—particularly protein—represent strategic priorities worth attention
- Structural advantages in labor efficiency, purchasing leverage, and capital access provide meaningful flexibility
- Expansion through the acquisition of exiting operations may warrant consideration depending on circumstances
- This week: Schedule a meeting with your processor contact to discuss long-term supply relationship options and component premium opportunities
For all operations regardless of size:
- Breeding program review with attention to emerging component economics favoring protein
- Forward projections incorporating $3,000+ heifer replacement costs
- Recognition that GLP-1 demand impacts appear structural rather than cyclical
- Early lender conversations if refinancing or restructuring might become necessary
The dairy industry has weathered profound changes before and will continue producing the milk, cheese, and products consumers depend on. What’s shifting is who produces them and at what scale—and that transition is happening faster than many anticipated.
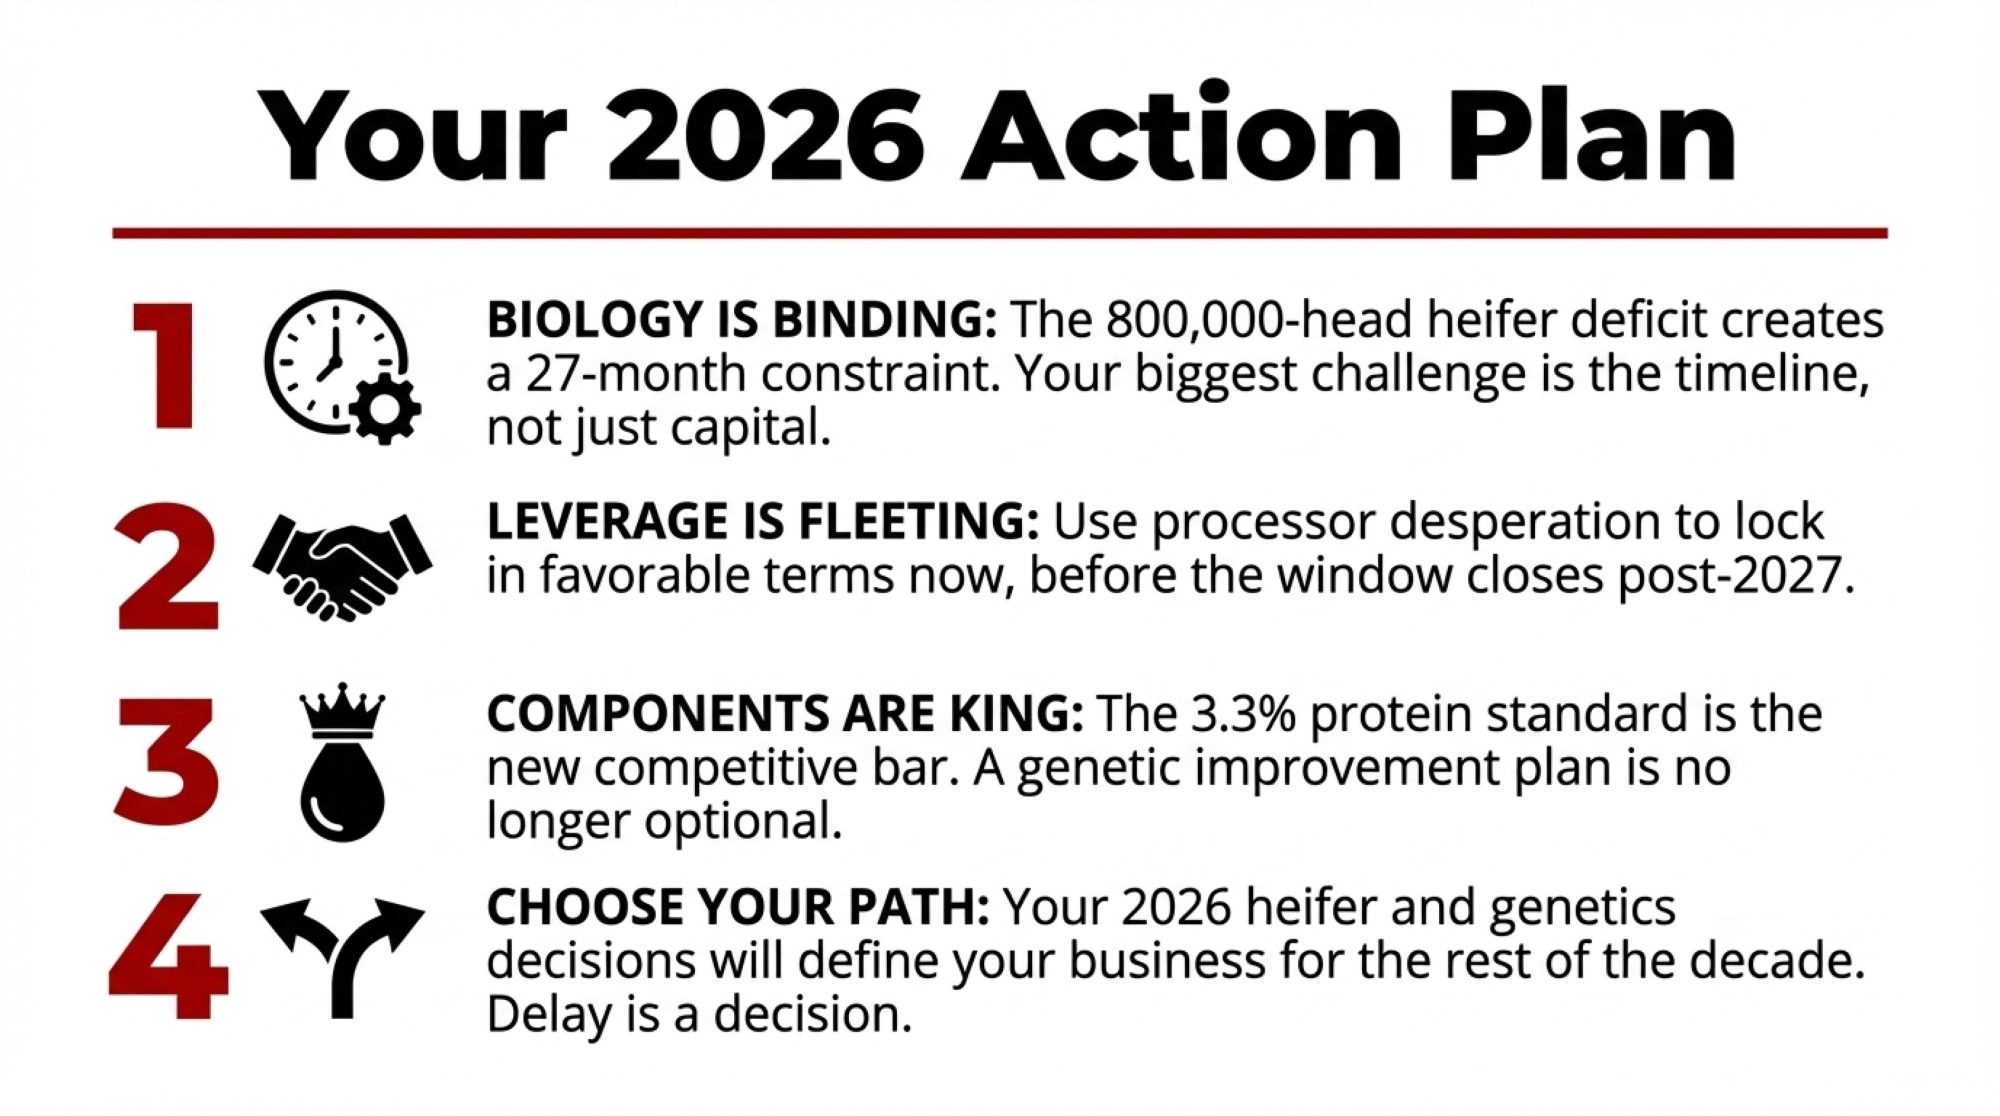
For individual producers, the essential insight is this: the forces reshaping dairy economics appear structural rather than cyclical. Making strategic decisions—whether restructuring toward specialty production, joining cooperative arrangements, investing in scale and automation, or executing an orderly exit—tends to preserve options and equity that waiting erodes.
The producers who navigate this most effectively share a common characteristic: they make deliberate choices based on a realistic assessment of their specific circumstances rather than hoping that general conditions will improve on their own.
The choice belongs to each of you. The information needed to make it wisely is increasingly available.
Key Takeaways:
- Heifer economics have flipped: Prices tripled ($1,140 → $3,500+), and inventory is at its lowest since 1978. Every replacement costs $2,000+ more than it did three years ago.
- Protein is overtaking butterfat: Component premiums are shifting. Review your breeding program now—genetics from 2022 may be optimized for a vanishing market.
- The middle is disappearing: 300-1,000 cow operations face a structural squeeze—too large for specialty pivots, too small for automation ROI to work.
- Four paths, one timeline: Organic transition, cooperative processing, strategic scaling, or planned exit. All require action before mid-2026.
- Timing is equity: Asset values favor decisions made now. The difference between proactive and reactive exit can exceed $500,000 in recovered value.
Complete references and supporting documentation are available upon request by contacting the editorial team at editor@thebullvine.com.
Learn More:
- Beef-on-Dairy’s $6,215 Secret: Why 72% of Herds Are Playing It Wrong – Reveals how to balance calf revenue with replacement needs using a specific tiered breeding framework to maximize profitability without creating a terminal “financial time bomb” for your herd’s future.
- The $16/CWT Reality: Why Mid-Size Dairies Can’t Out-Work Structural Economics – And What Actually Works – Provides an in-depth economic blueprint for navigating the “middle-scale” squeeze, offering actionable strategies for precision feeding and component-driven culling to bridge the efficiency gap between family farms and mega-dairies.
- Robot Revolution: Why Smart Dairy Farmers Are Winning with Automated Milking – Demonstrates how to effectively transition to robotic systems, providing specific benchmarks for labor savings, production increases, and the 2025 ROI math required to justify high-capital automation investments in a tight-margin environment.
 The Sunday Read Dairy Professionals Don’t Skip.
 The Sunday Read Dairy Professionals Don’t Skip.
Every week, thousands of producers, breeders, and industry insiders open Bullvine Weekly for genetics insights, market shifts, and profit strategies they won’t find anywhere else. One email. Five minutes. Smarter decisions all week.