Archive for strategic culling

The Cheap Feed Trap: Why the Wall of Milk Won’t Break and How to Protect Your Margins

Your cows cover their feed. Your banker’s calm. So why are the sharpest producers culling now? Because they see what’s coming.

EXECUTIVE SUMMARY: Dairy farmers worldwide are caught in a trap: record milk production, collapsing wholesale prices, yet on-farm economics that make every cow look like she’s paying her way. AHDB’s December 2025 forecast puts UK output at “uncharted levels”—13.05 billion litres, up 4.9%—while USDA projects US production hitting 229.1 billion pounds in 2026. Three factors are blocking the market’s usual self-correction: milk-to-feed ratios near 20-year highs, strong cull values that encourage waiting, and contract structures that delay price pain for weeks. The 2015-16 EU crisis offers a hard lesson—farms that survived prioritized margin over volume, kept fixed costs lean, and acted early. Those that waited often lost their operations. This feature delivers a three-step culling framework, worked financial examples, and the critical questions to ask your banker and nutritionist before the exit window closes.

Looking at global dairy markets right now, the most striking thing isn’t just that milk is plentiful—it’s how long production is holding up despite softer prices.

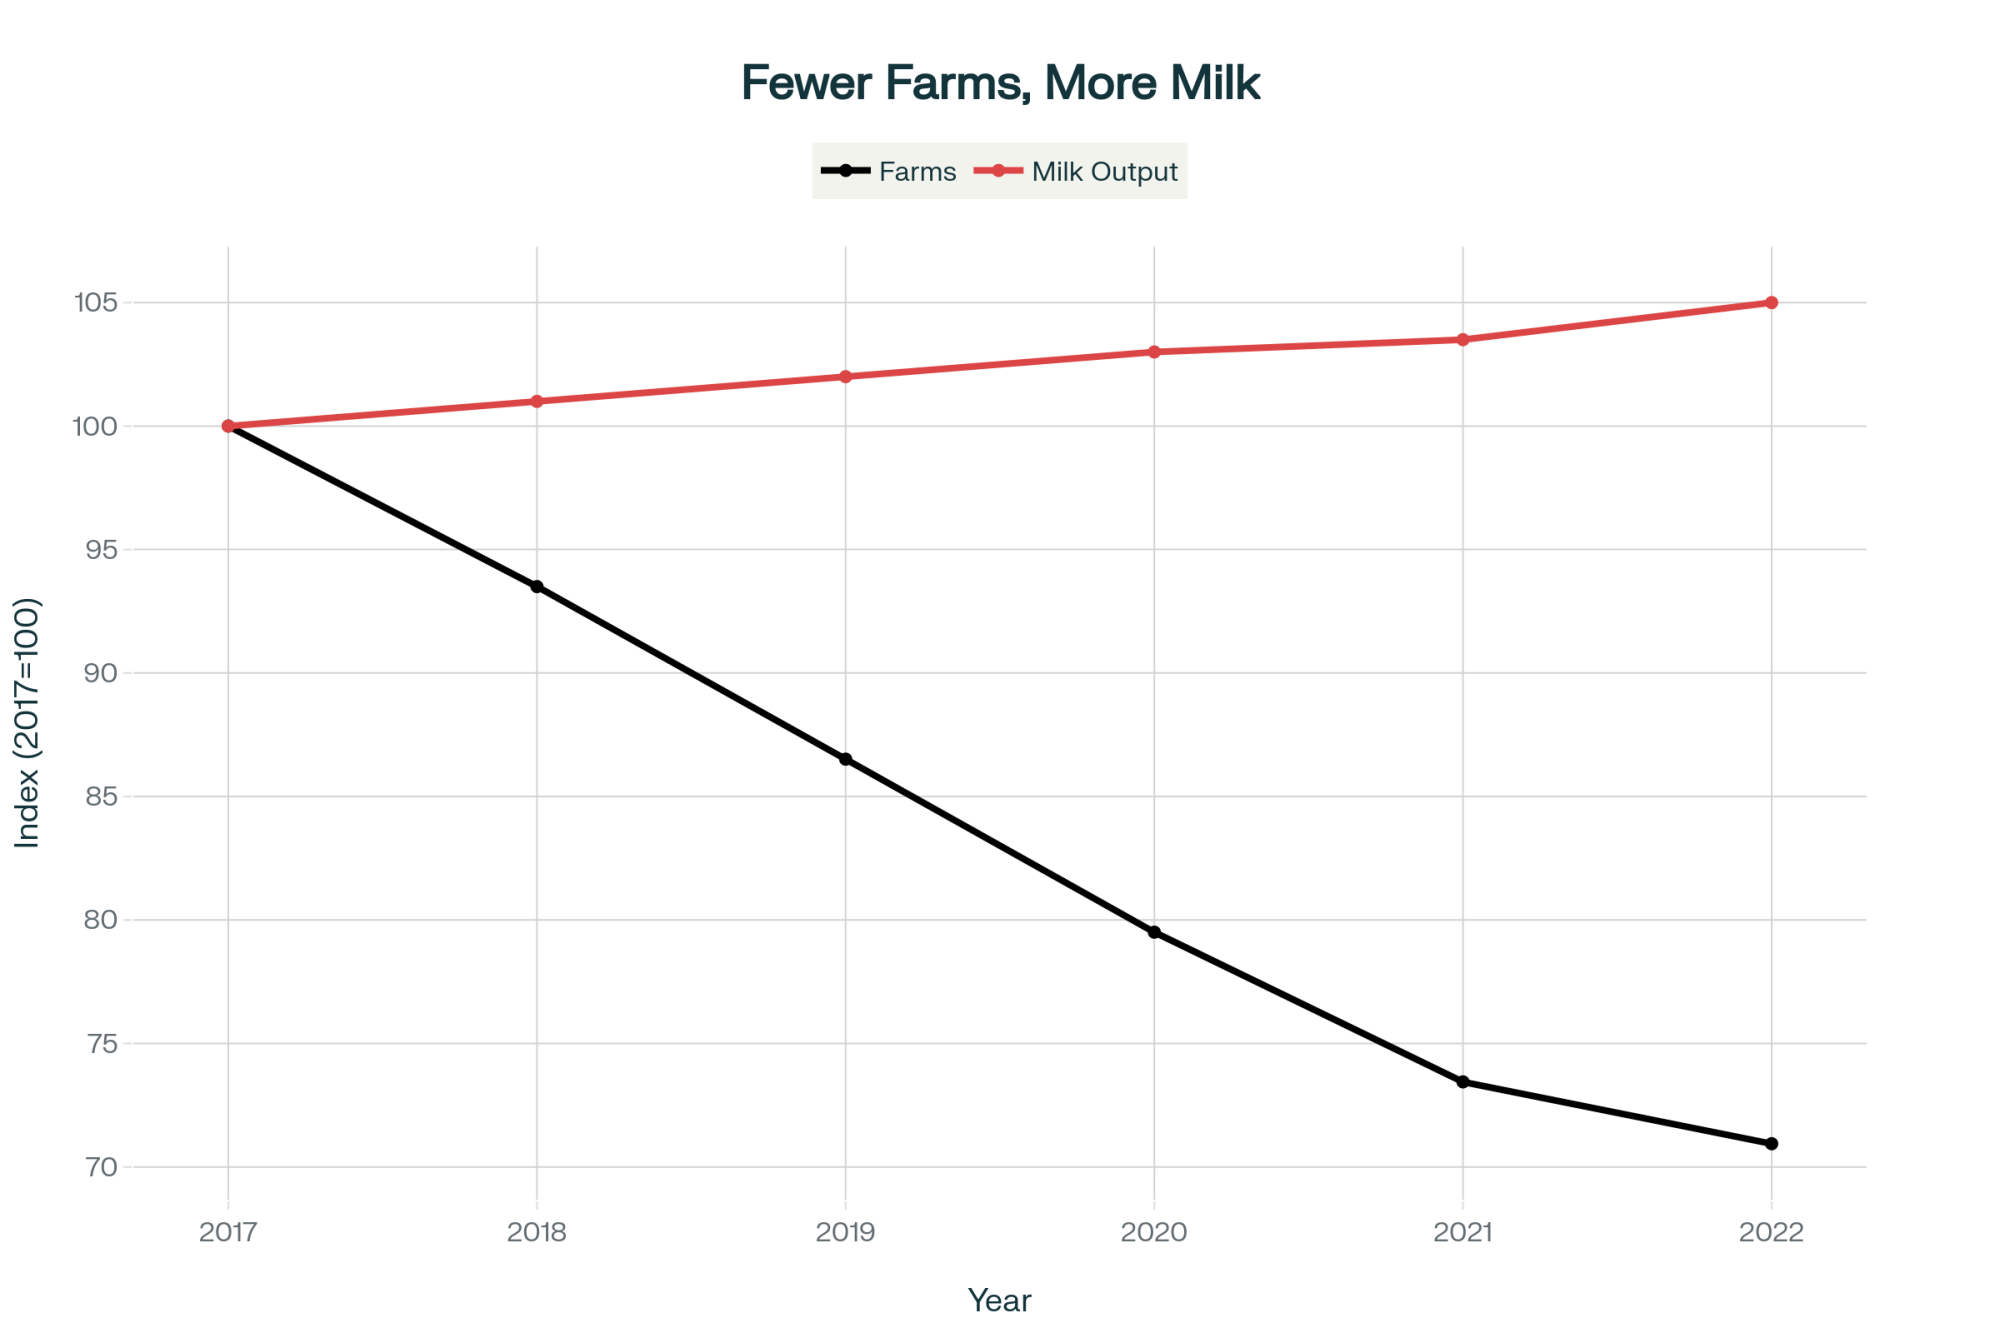
Great Britain’s latest milk forecast tells the story pretty clearly. AHDB’s December update has 2025/26 output reaching a record 13.05 billion litres, up about 4.9% on the previous milk year, with April–November deliveries already running 5.5% ahead of last season. Those are significant numbers for a mature market.

At the same time, AHDB’s November wholesale data paint a sobering picture: UK butter averaging £4,290 per tonne—down nearly £1,870 since June. Bulk cream is now worth almost half what it was in September 2024. And mild Cheddar has broken below £3,000 per tonne for the first time since July 2021.

What farmers are finding—in Britain, across the EU, in the US and down in Oceania—is that this doesn’t feel like a short, sharp price dip that will quietly self-correct. The usual brakes we’re used to seeing (high feed costs, weak cull prices, big government buying programmes) aren’t in the same place they were ten years ago.

Now, weather swings, animal disease, or policy shifts could certainly change the picture faster than any forecast suggests. But the smart bet right now is to plan as if this is a phase, not a quick bounce.

This feature takes a farmer-first look at the data, the history, and the on-farm decisions that matter most over the next 12–18 months.

Global Milk Production: Multiple Exporters Expanding at Once

Here’s what makes this particular cycle different: several major exporters are expanding at once, rather than one region growing while another pulls back.

In Great Britain, AHDB’s December forecast describes the situation as “uncharted levels”—their words, not mine. Strong grass growth and better yields per cow are driving those record volumes. Meanwhile, US data mirrors this saturation: USDA’s July WASDE report raised the 2025 forecast to 228.3 billion pounds and the 2026 forecast to 229.1 billion pounds—that’s 900 million pounds higher than they projected just a month earlier. Modest herd growth and continued gains in milk per cow are doing the work on both sides of the Atlantic.

Record UK and US milk volumes underscore why the ‘wall of milk’ is so slow to crack

Producers across the UK report experiences similar to those of their American counterparts—favorable conditions pushing rolling averages up significantly, with milk flowing whether the market wants it or not.

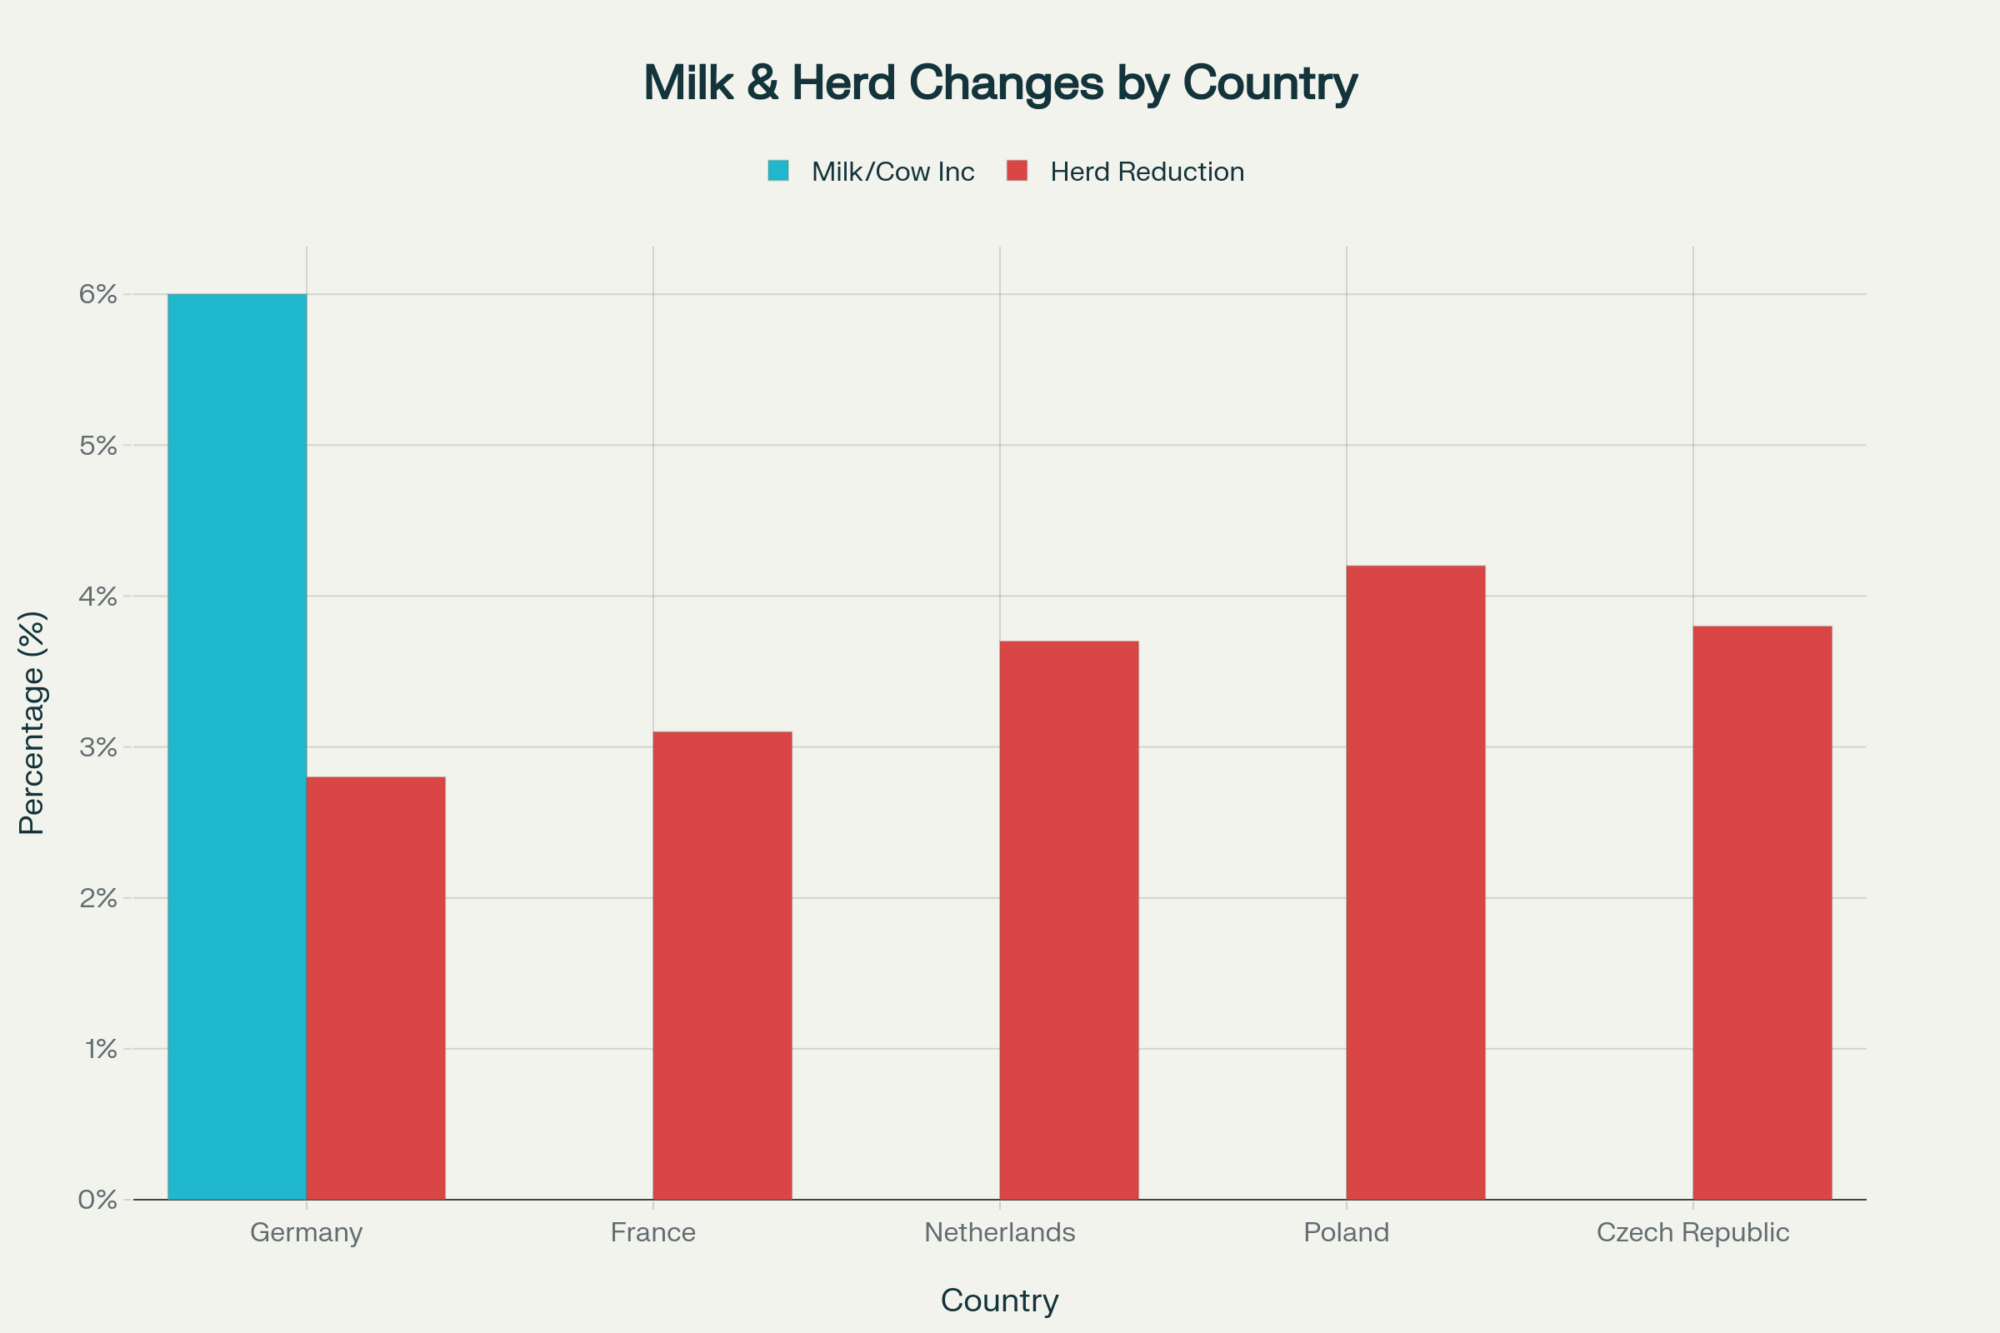
Across the wider EU, the picture is a bit more nuanced. While overall production for 2025 was initially forecast marginally below 2024 levels according to the USDA’s December 2024 outlook, conditions in the second half of the year have supported stronger-than-expected output in several key exporting regions. AHDB’s October review noted European milk production “roaring back to life in Germany and France,” helped by milder weather and those lower feed costs we’re all noticing.

Down in Oceania, New Zealand’s pasture-based sector has recovered from recent weather challenges. USDA and CLAL data show that from January to June 2025, New Zealand milk yields totaled 8.71 million tonnes—a 1.4% increase compared to 2024 —and June’s figures exceeded previous records thanks to favorable weather and early calving.

And then there’s the demand side—this is where it gets particularly interesting. China, which for years acted as the pressure valve for global skim and whole milk powder, is in a very different phase. Domestic raw milk output has increased while per-capita dairy consumption growth has slowed. Multiple industry analyses indicate that China’s stronger domestic production is constraining import demand for Oceania powders compared with earlier years.

Why does this matter? Because we don’t have the classic offset we’ve seen in other cycles. There isn’t a major drought knocking one exporter back, or a sudden demand boom somewhere else to soak up the surplus. From a farm-gate perspective, that’s worth careful consideration.

Three Reasons the Market Isn’t Self-Correcting

In the old pattern many of us remember—and I’ve watched a few of these cycles now—milk prices slid, feed stayed expensive, margins got squeezed, and the response was fairly quick: more culling, fewer fresh heifers, supply eased, prices stabilised in 9–12 months.

This time, three features are slowing that self-correction.

The Three Reasons at a Glance:

  1. Cheap feed is softening the blow—milk-to-feed ratios near 20-year highs
  2. Strong cull values create a false sense of “I can always sell later.”
  3. Contract structures delay price signals by weeks or months

Cheap feed is softening the blow

First up is feed. In many regions, it’s simply cheaper than milk has been for some time.

AHDB market commentary and UK advisory notes for 2025 show the milk-to-feed price ratio near multi-year highs. As AHDB analyst Susie Stannard noted in a June Dairy Reporter piece, feed costs are reasonable enough that the milk-to-feed ratio is at an almost 20-year high. AHDB’s Q2 review confirmed that although the ratio has declined very slightly, it remains near that 20-year peak.

In the US, the Dairy Margin Coverage programme’s income-over-feed margin has often sat just above the main payout triggers—not because milk prices have been spectacular, but because corn, alfalfa, and soybean meal backed off their 2022 peaks. Wisconsin and California producers report the same thing: feed’s cheap, so the cow still pencils out on paper.

Here’s the thing, though. Extension economists at Wisconsin and other land-grant universities have pointed out something worth considering: this can make individual cows look better on paper than the whole business feels. A fresh cow might more than cover her ration and transition costs, but the farm still has to pay labour, power, interest, and machinery from a tighter cheque.

This is the paradox driving today’s oversupply: ration economics scream “keep milking,” while cull cheques whisper “you could exit anytime.” That’s fine in a short dip; it’s lethal in a long, flat market.

On many spreadsheets, the conclusion becomes, “The cow is paying her way, so we’ll keep her.” The risk? That spreadsheet is looking at feed, not the full cost of keeping that stall filled.

Strong cull prices create a false sense of security

The second feature is cull value—and this one cuts both ways.

UK beef and cull reports for 2025 show deadweight cow prices averaging around 420–450p/kg for much of the year. That’s well above long-term norms. North American reports tell a similar story: tight beef supplies and solid cattle prices have supported cull values through 2024 and into 2025.

Penn State Extension educator Michael Lunak made an interesting observation in a Dairy Herd article last autumn: the more a dairy can shift its culling from involuntary (injury, disease, breakdowns) to voluntary (strategic removal of low producers or problem cows), the more likely it is to be successful. As he put it, “Culling cows from the bottom of the herd makes room for more profitable cows.” He noted that typical overall cull rates around 35–37% aren’t inherently bad if more of those are strategic choices rather than forced exits.

From one angle, this environment makes culling a valuable financial tool. Every “passenger” cow you move today can generate more cash for feed bills, repairs, or debt reduction than she would have three or four years ago.

But there’s another side to consider: strong cull values can quietly encourage a mindset of, “If things really get bad, I can always sell a bunch of cows later.” If many producers end up thinking the same thing and time that “later” together, the exit door can get crowded quickly—and cull values can soften faster than anyone expects.

Contract structures delay price signals

The third factor lives in the milk contract—and this is something that’s evolved significantly over the past decade.

We’ve seen more UK and EU buyers move to deals that blend retail-aligned or cost-of-production-style pricing for a base volume, with A/B or similar structures for extra litres (where A is paid at the headline price and B is tied more closely to commodity returns).

Defra’s fair dealing rules and AHDB explainers go into how these contracts are meant to balance risk between buyer and producer while giving processors tools to manage surplus. In principle, that’s reasonable. In practice, it creates some timing challenges.

When markets are tight, B-litres can be a useful outlet. When butter, cream, and powder are under pressure, they can drop well below the cost of production. Farmers in GB and Ireland have reported that, in late 2025, B-milk, particularly powder, has at times been priced far below their overall costings—even while their A-price looked stable on paper.

The twist is timing. You make feeding, breeding, and fresh cow stocking decisions today; the milk cheque that fully reveals the effect of low-priced B-milk arrives weeks later.

A 2023 study on UK dairy price transmission, published in the journal Commodities, found that shocks at the farm level don’t always pass cleanly downstream, and that movements in one part of the chain often lag those in another. This builds on what researchers have observed for years: dairy supply is genuinely difficult to stabilise because of all these small delays and signals that don’t line up neatly.

Putting this all together, cheap feed, strong culls, and delayed contract signals go a long way toward explaining why barns are still full, even as global price indicators are flashing amber.

Lessons from the 2015–16 Dairy Crisis

To get a better handle on what might come next, it helps to look back at the 2015–16 EU milk crisis, when the end of quotas, steady supply growth, and weaker demand combined into a tough 18-month stretch for European producers.

Several independent studies and farm-business reviews have since examined which operations were more likely to come through that period intact. The patterns are fairly consistent—and they offer some useful guidance for today.

More milk from forage, less from the feed wagon

Research in agricultural economics journals found that European herds that got a larger share of their production from home-grown grass and silage tended to have lower and more resilient production costs.

Those farms could trim concentrate levels or push grazing and forage utilisation harder when prices dropped, without their output collapsing. By contrast, high-yield units where an extra 3,000–4,000 litres per cow were driven primarily by bought-in concentrates were more exposed. When milk prices dipped below the marginal value of that extra feed, the economics quickly stopped working.

Here’s what’s encouraging, though—this is something farmers can actually work on. Teagasc’s National Dairy Conference messaging in December 2025 reinforced that the strongest relationship with profitability in Irish grass-based systems isn’t milk per cow. It’s the grass utilised per hectare. About 40% of the variability in margin is explained by how much grass the farm grows and uses well.

That’s a powerful finding, and it applies beyond Ireland. Whether you’re running a grazing operation in the Southwest of England or managing a TMR system in the Midwest, the principle holds: the more of your milk that comes from home-grown feed, the more flexibility you have when prices tighten.

Lower fixed cash commitments

A second pattern was around capital structure—and this one deserves careful thought.

EU and national analysis showed that many farms which struggled the most had loaded up on new parlours, machinery, and buildings during the good years, and went into the downturn with high monthly finance payments. Those payments didn’t shrink when milk did.

Farms running older but paid-off kit (maybe with more workshop time and fewer shiny tractors) often had greater ability to cut back on non-essential spends without breaching covenants temporarily. Advisors who went through that period still talk about “machinery per litre” and “barn cost per stall” as critical resilience metrics.

I’m not suggesting anyone should avoid investment—modern facilities and equipment matter for efficiency and quality of life. But the timing and financing of those investments make a real difference when cycles turn.

Liquidity, timing, and fresh cow management

The third difference was liquidity and timing. Farms that entered the 2015–16 period with some cash on hand (or at least undrawn credit) and acted early tended to have more options.

Many of them did a “strategic shrink” in the first six months: they culled the bottom 10–15% of the herd while cull prices were still decent, used the cash to shore up their balance sheet, and ran the remaining cows harder and smarter.

Those who tried to “wait it out” with a full herd and no buffer were more likely to be forced to sell cows or land later, often at lower prices.

Producers who came through 2015–16 in good shape often note the same pattern: the cows they kept were the ones that freshened well and bred back. That wasn’t a coincidence—it was a strategy. Strong fresh cow management made every remaining stall more valuable, especially when the decision had been made to run fewer cows.

It’s worth saying: quotas and policy tools are different today, and climate rules add another layer. But the core operational lessons—milk from forage, sensible fixed costs, sound transition management, some liquidity, and willingness to adjust sooner rather than later—still apply.

Supply Chain Dynamics: Where Processors and Retailers Fit In

What farmers also notice, quite understandably, is that pain isn’t always evenly distributed along the chain.

Work on UK milk price transmission found that retail prices can be sticky on the way down. Wholesale and farm-gate prices may react more quickly to global markets than the price of a block of cheese or a pint of milk in the supermarket chiller. Similar studies on EU dairy supply chains have flagged that processor and retailer margins may widen for a time when farm-gate prices fall, until contracts and competition pull them back towards normal levels.

That can feel frustrating—and it’s a fair observation.

From a farm-level planning view, though, the practical takeaway is this: the fastest and most controllable levers are on your own side of the bulk tank.

Processors, retailers, and traders will make their adjustments, and there are legitimate pressures on them too (energy costs, labour, and environmental compliance). But those changes take time to filter back into milk prices. That’s why the rest of this piece focuses on what’s inside your control.

Strategic Herd Reduction: A Three-Step Framework

Farmers who came through previous downturns in reasonably good shape rarely talk about “chasing litres at all costs.” More often, they talk about tightening up the margin per cow and protecting cash.

In practice, that often started with a structured look at which cows were genuinely contributing and which were simply filling stalls.

The Three-Step Framework at a Glance:

  1. Pull the right data: DIM, pregnancy status, SCC trends, component yields, contract structure, feed costs
  2. Flag the passengers: Open/late cows, chronic SCC problems, repeatedly lame or problem animals
  3. Rank by value, not volume: Sort by fat+protein kilos, stress-test bottom 10–15% at B-milk prices

Here’s how to work through each step using your own recording data and a bit of quiet time at the kitchen table.

Step 1: Pull the right herd data

From your herd management software and milk recording, pull days in milk and pregnancy status for each cow, recent somatic cell count trends (at least the last three tests), and milk, fat, and protein kilos per cow over a consistent recent period—say the last 30 or 60 days. Also note your current contract structure, including any A/B litres and how B-milk is priced.

From your costings (AHDB’s Promar Milkminder in GB, Teagasc reports in Ireland, or university benchmarks in North America), have your latest feed cost per cow per day and an up-to-date estimate of the total cost of production.

This sounds basic, but you’d be surprised how many operations don’t have all of this in one place.

Step 2: Flag the obvious “passengers”

Next, make a first pass with clear rules that don’t require a calculator.

Look for cows that are open and late—any cow open beyond an agreed DIM threshold (say, greater than 150–200 days) with no clear breeding plan, particularly if she’s in her third or later lactation. Flag chronic SCC or mastitis cases—cows that have repeatedly tested over your bonus threshold and regularly drag the bulk tank toward penalty territory. Losing a quality bonus can be the difference between black and red ink. And note problem cows: repeatedly lame animals, three-quartered cows, dangerous or extremely slow milkers that add stress to every milking.

This ties back to Lunak’s point from Penn State: the more you can shift culling from involuntary to voluntary—strategic removal of low producers or problem cows—the more likely you are to improve herd profitability over time.

Mark these as “review candidates.” Once you see them all on one page, there are usually more than you expect.

Step 3: Rank by milk value, not just milk volume

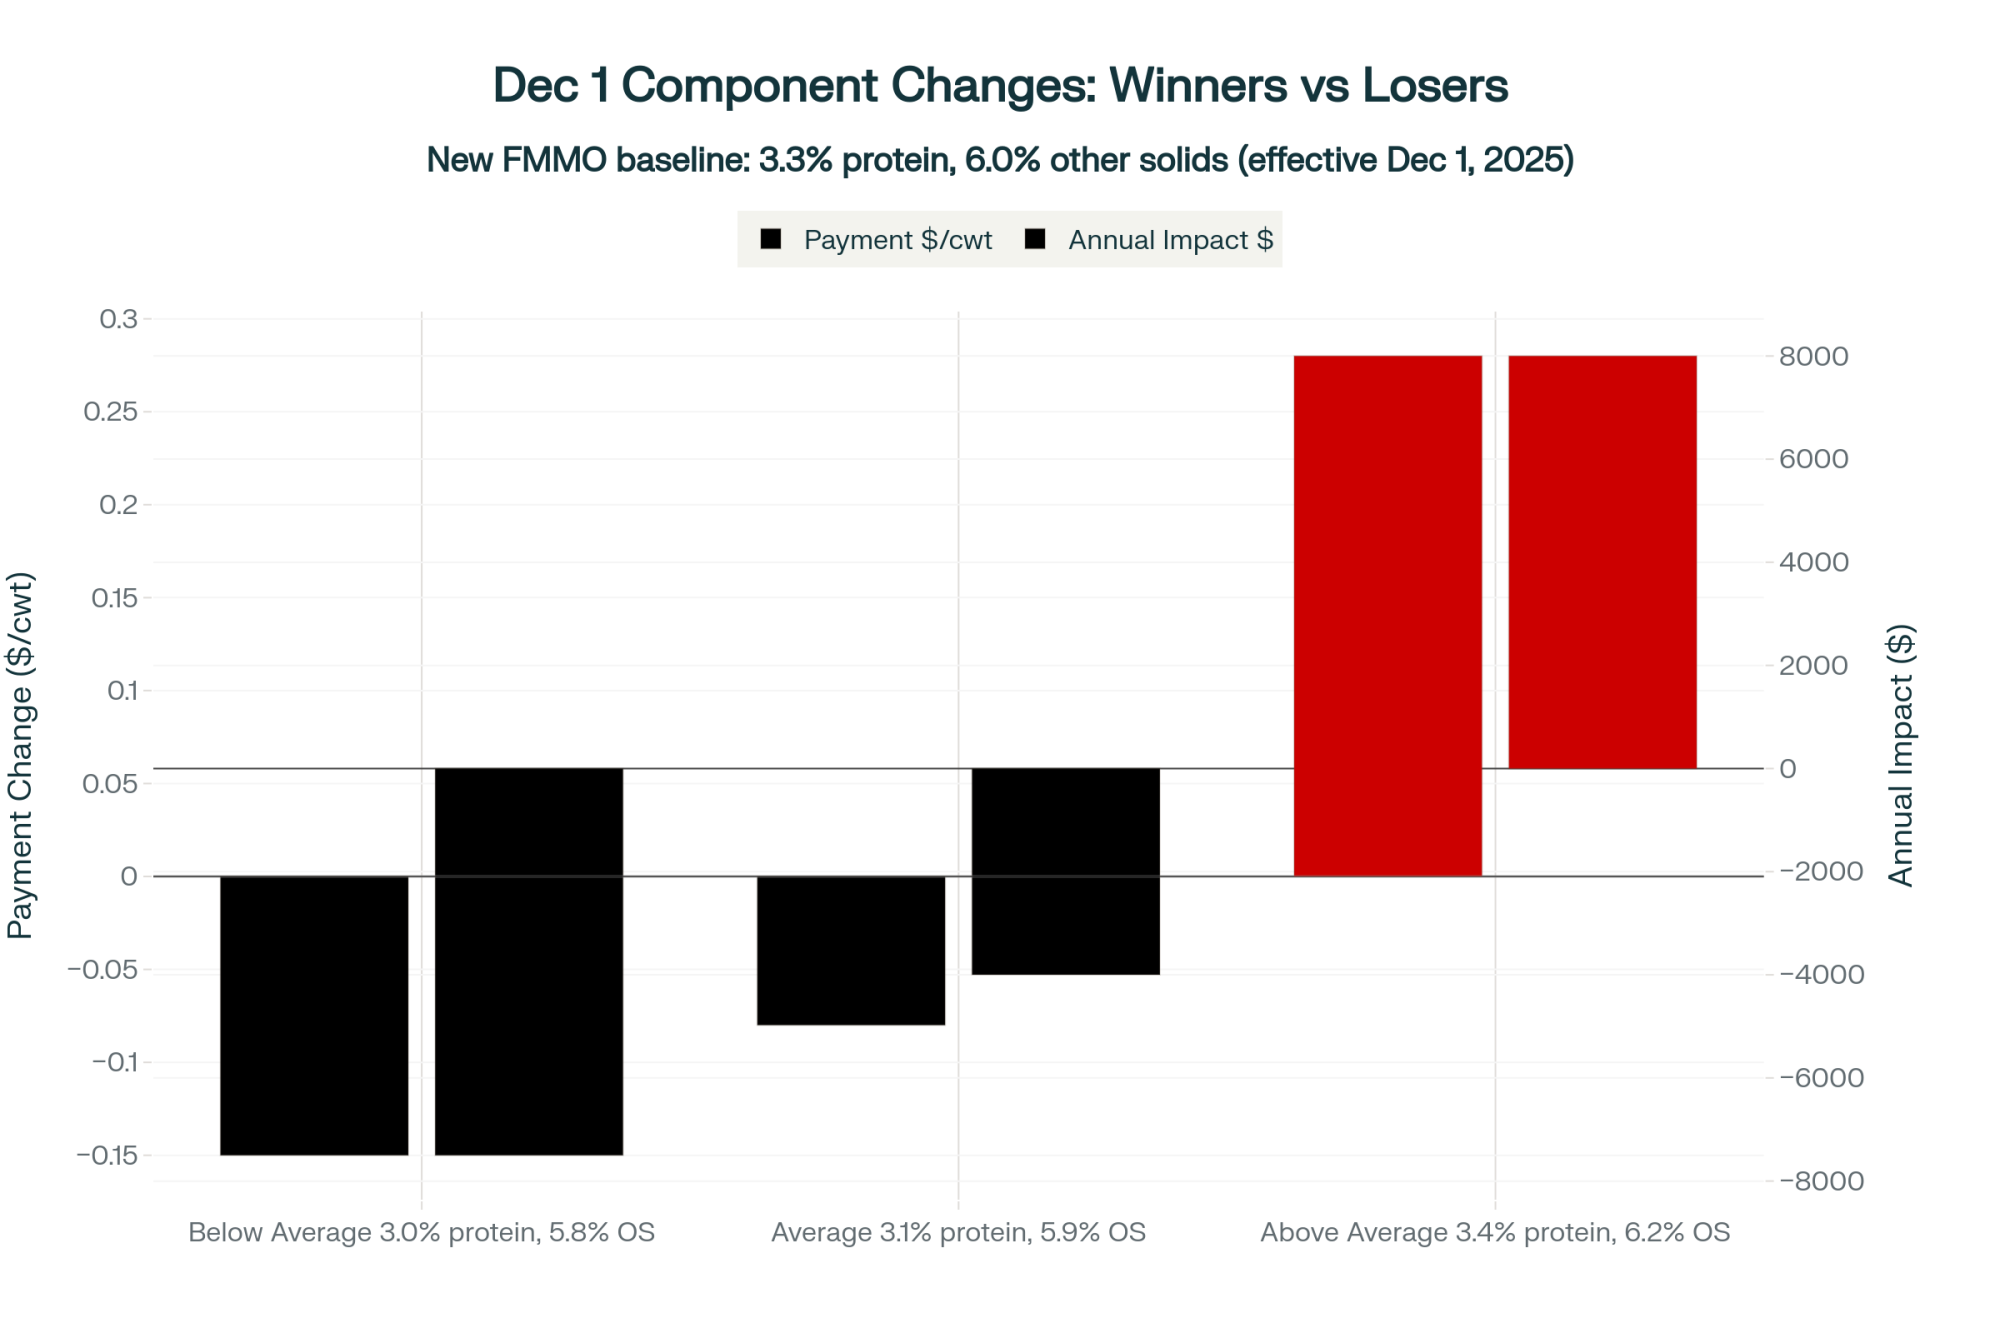
This is where the conversation gets interesting. Instead of just looking at litres, shift to milk solids.

Many buyers in Europe, Oceania, and North America increasingly pay on fat and protein, and even where volume is still primary, higher-solids milk often has more value once it’s into cheese, butter, or powder.

Sort the remaining cows by fat plus protein kilos per day, not just litres. Identify the bottom 10–15% on that solids basis. Often, these are cows that look “good” because of fluid yield, but when you factor in components and feed, they’re not pulling their weight.

Now ask a simple “what if?” question for that bottom slice: if this milk were effectively priced at a lower B-price or spot value, would this cow still cover her feed and variable costs?

To stress-test, some advisers suggest modelling those cows at a conservative milk price consistent with recent B-milk or spot values (especially where powder and cream have come under pressure) and subtracting your current feed cost per cow. If the margin is tiny or negative, that animal is essentially being subsidised by her herdmates.

Industry commentary in Dairy Herd Management and Hoard’s has echoed this approach, noting that when herds go through their books honestly, a bottom 10–15% group almost always emerges that can be culled with surprisingly little impact on total milk revenue—and a meaningful impact on cash and labour load.

Worked Example: What a 10% Cull Actually Looks Like

Let’s put some rough numbers around this, because the concept is easier to grasp with specifics.

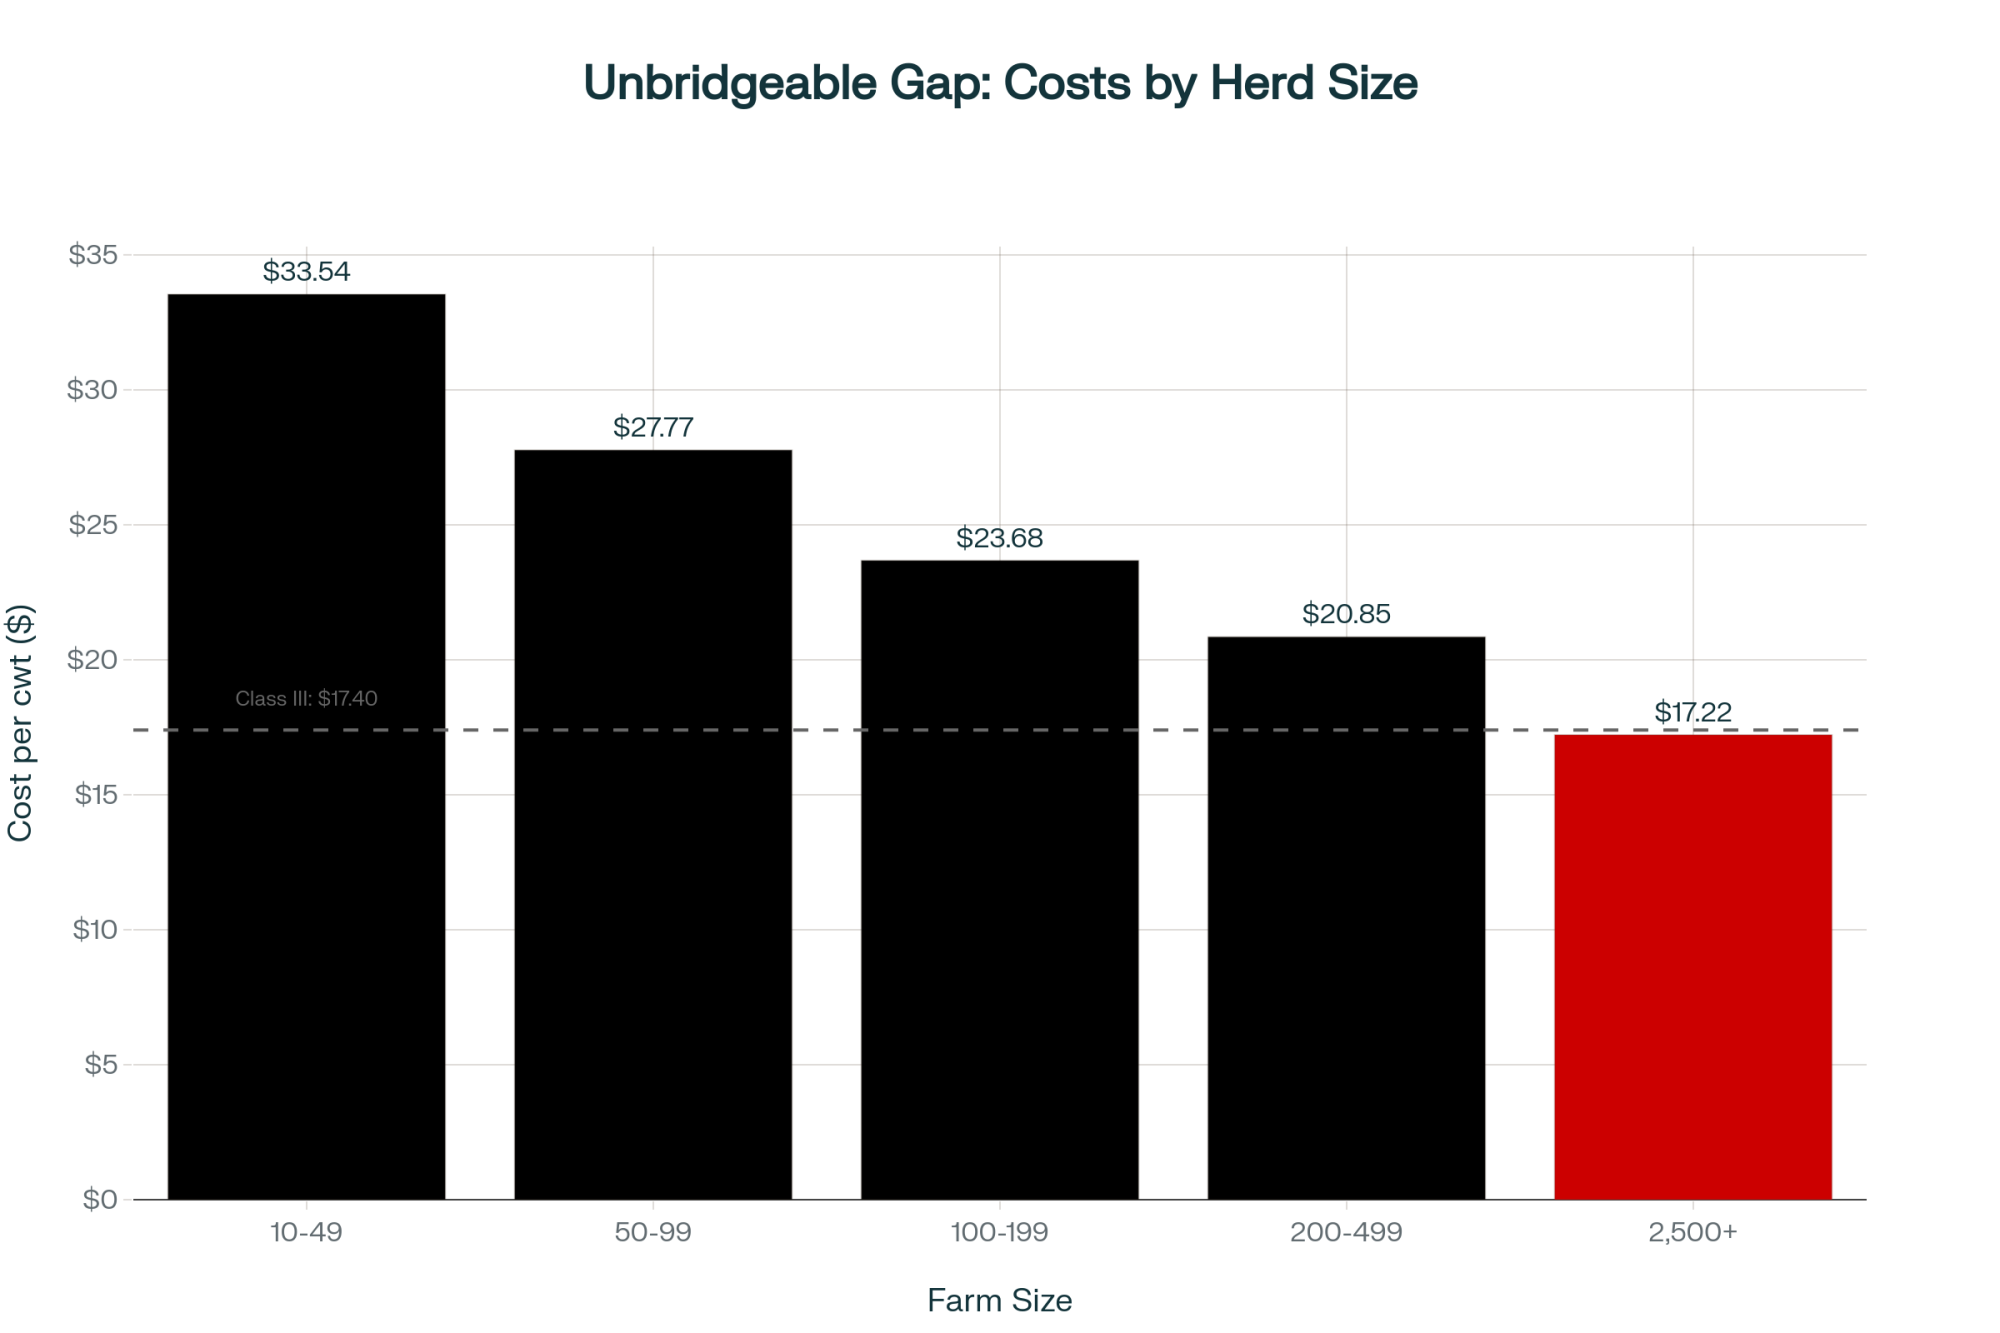
Take a 200-cow, year-round calving herd in GB or the northern US. Average yield: 32 litres per cow per day, 4.0% fat, 3.3% protein. Latest costings show feed cost at about £4.00 (or roughly $5.00) per cow per day, with total cost of production around 35–36p/litre or $18–19/cwt.

Suppose that, using the framework above, the farm identifies 20 cows that are late-open, chronically high in SCC, and at the bottom of the solids ranking. If those animals average 300 kg deadweight at around 430p/kg (consistent with recent UK cull averages from AHDB cattle data), the cull cheque comes to roughly £26,000 before costs.

Daily feed costs drop by about £80, or around £2,400 per month, plus a bit of saved parlour time, bedding, and transition management overhead.

Milk sold might fall by 500–600 litres per day, but if those were mainly low-solids, higher-risk litres that were pushing the farm into B-milk, the hit to revenue can be smaller than expected. In some A/B setups, that reduction in total volume can actually improve the average milk price by keeping more litres in the better-valued A-band.

Obviously, every farm is different. Some will decide to cull more, some less, and some not at all. The point isn’t the exact number. It’s that a small, strategic shrink can unlock both immediate cash and lower monthly outgoings without undermining the core of the herd.

Conversations with Your Banker and Nutritionist

What farmers are finding is that conversations with lenders, nutritionists, and accountants go better when they’re started early and anchored in numbers rather than gut feel.

A few questions that have come up again and again in advisory meetings this season:

“If milk averaged X pence per litre (or $Y/cwt) for the next 12 months, what would that do to our cash-flow and overdraft?”

“How many months of operating costs do we currently have in working capital or undrawn credit?”

“What happens to our covenants if we reduce cow numbers by 10–15% but improve margin per cow?”

“Are there any high-cost debts we can refinance to ease monthly pressure if prices stay only average through 2026?”

These aren’t comfortable conversations. But they’re far better to have now, when you have options, than later when you don’t.

On the nutrition side, advisers are encouraging herds to look at whether they’re still feeding “for the cheque they had last year” or for the one they have now.

That might mean trimming some additives, shifting emphasis slightly from maximum litres to steadier components, or matching rations more tightly to groups (fresh cows versus late-lactation) to squeeze a bit more efficiency out of each tonne of silage and concentrate.

Strong fresh cow management—keeping transition problems, culls, and early deaths down—also shows up in the research as a major driver of both animal welfare and long-run profitability. Healthy, well-transitioned cows are far more likely to make it into that top tier of solids producers that you really want in the barn.

In Canada, supply management and quota systems buffer much of the day-to-day price volatility, but even there, Dairy Farmers of Canada and Farm Credit Canada have noted that tighter returns and changing product mixes are placing greater emphasis on cost control, milk quality, and component yield per kilogram of quota. The efficiency conversation is happening everywhere, even where prices are more stable.

Risk Management: Insurance, Not Speculation

Risk-management tools—such as fixed-price contracts, futures, and options—often spark mixed reactions. Some producers have used them for years; others have had experiences that make them cautious.

Recent guidance from university and industry economists is fairly consistent: treat these tools as insurance against very bad prices, not a way to outguess the market.

In practice, that might look like locking in or insuring a portion of expected milk at a level that, when combined with your costings, at least covers feed, routine bills, and a realistic debt payment. It means accepting that you won’t hit the exact top—the win is not being forced to sell all your milk at the bottom. And it means matching hedge volumes to your realistic production after any planned culling or stocking changes, so you aren’t over-hedged and tied to volumes you might not ship.

In Europe, some processors now offer fixed-price pools or index-linked contracts that can serve a similar purpose for farmers who are uncomfortable with direct futures trading. In New Zealand, Fonterra and others have rolled out fixed milk price schemes and options that are increasingly used as planning tools rather than speculation.

The common thread is using these tools deliberately, as part of a broader risk plan, not on a hunch.

What’s interesting is that when you talk with operations that have come through choppy periods in decent shape, they rarely say “hedging saved us.” They more often say “hedging helped us sleep at night while we did the real work on costs, cows, and grass.”

Wildcards: Weather, Disease, and Policy

It’s also fair to say that models and forecasts only get us so far. Weather, animal disease, and policy can all quickly tilt the board.

Recent years have reminded us how regional droughts, wet harvests, or mild winters can turn forage plans upside down and push more or less milk into the system than expected. Animal health issues—from mastitis pressure in wet housing to broader concerns like avian influenza affecting dairy operations in some regions—can affect both productivity and trade flows. Policy changes related to climate, trade, or support programmes can also alter incentives. The EU’s ongoing environmental targets are one example; Canadian quota policy and US farm bill debates are another.

All of that is a long way of saying: your plan for 2026 doesn’t need to be set in stone. It does, though, help to have a plan—and to revisit it a couple of times a year as new information comes in.

The Bottom Line

Pulling this together, a few practical lessons seem to be emerging from both the current data and the 2015–16 experience.

We’re probably in a longer phase, not a quick dip. Multiple exporters are growing at once while major buyers like China are more cautious, and outlooks from AHDB, USDA, Teagasc, and others still point to comfortable supplies into 2026. Building plans that assume a full, rapid rebound may be optimistic.

Cheap feed and good cull values are helpful but can mask underlying stress. They make it possible to carry marginal cows longer and delay decisive action—which works out fine if prices turn up quickly, but creates risk if they don’t.

Margin per cow is a better guide than litres per cow. Whether you’re on pasture-based grass systems or TMR in a freestall or dry lot, the herds that consistently earn room to reinvest tend to know their milk-from-forage numbers, watch solids, manage fresh cows carefully, and think in terms of margin rather than volume.

Liquidity and flexibility buy options. Cash in the bank, undrawn credit, and manageable fixed payments give breathing space when prices wobble or fresh cow problems crop up. It’s often the lack of liquidity—not a single bad month—that forces hard decisions.

There’s no single “right” answer. For some, the best move is to tighten the belt, trim the bottom of the herd, and ride this out. For others—especially where succession is unclear, or debt is heavy—an orderly, thought-through exit while cow and land values are still decent might be the wiser route. Either way, it’s better to make that choice on your own terms than have it made for you.

What this oversupply episode is really doing is pushing every dairy business—big or small, housed or grazing-based—to ask a simple but important question:

What do we actually want this farm to look like in five years, and what steps today move us towards that rather than away from it?

There’s no template, and there’s no shame in different answers. The common thread is taking a hard, honest look at numbers, cows, and goals—and then making changes while you still have room to manoeuvre.

KEY TAKEAWAYS 

  • The cheap feed trap is real: Milk-to-feed ratios near 20-year highs make every cow look profitable—masking a global oversupply that won’t self-correct
  • Margin per cow beats litres per cow. Every time. Farms that survived 2015-16 knew this and acted early, before options disappeared
  • Find your passengers: Late-open cows, chronic SCC cases, and low-component producers are quietly being subsidized by your best animals
  • Have the hard conversations now: Model cash flow at lower prices. Stress-test your covenants. Your banker would rather hear your plan than your panic
  • The exit window is open—but not for long: Today’s strong cull prices are an opportunity to act, not a reason to wait. If everyone sells later, that door closes fast

Complete references and supporting documentation are available upon request by contacting the editorial team at editor@thebullvine.com.

Learn More:

  • The True Cost of Raising Heifers: Are You Raising Too Many? – Breaks down the hidden impact of heifer inventory on farm liquidity and demonstrates how reducing heifer numbers can free up working capital without sacrificing future production potential—a key tactic for the “Strategic Shrink.”
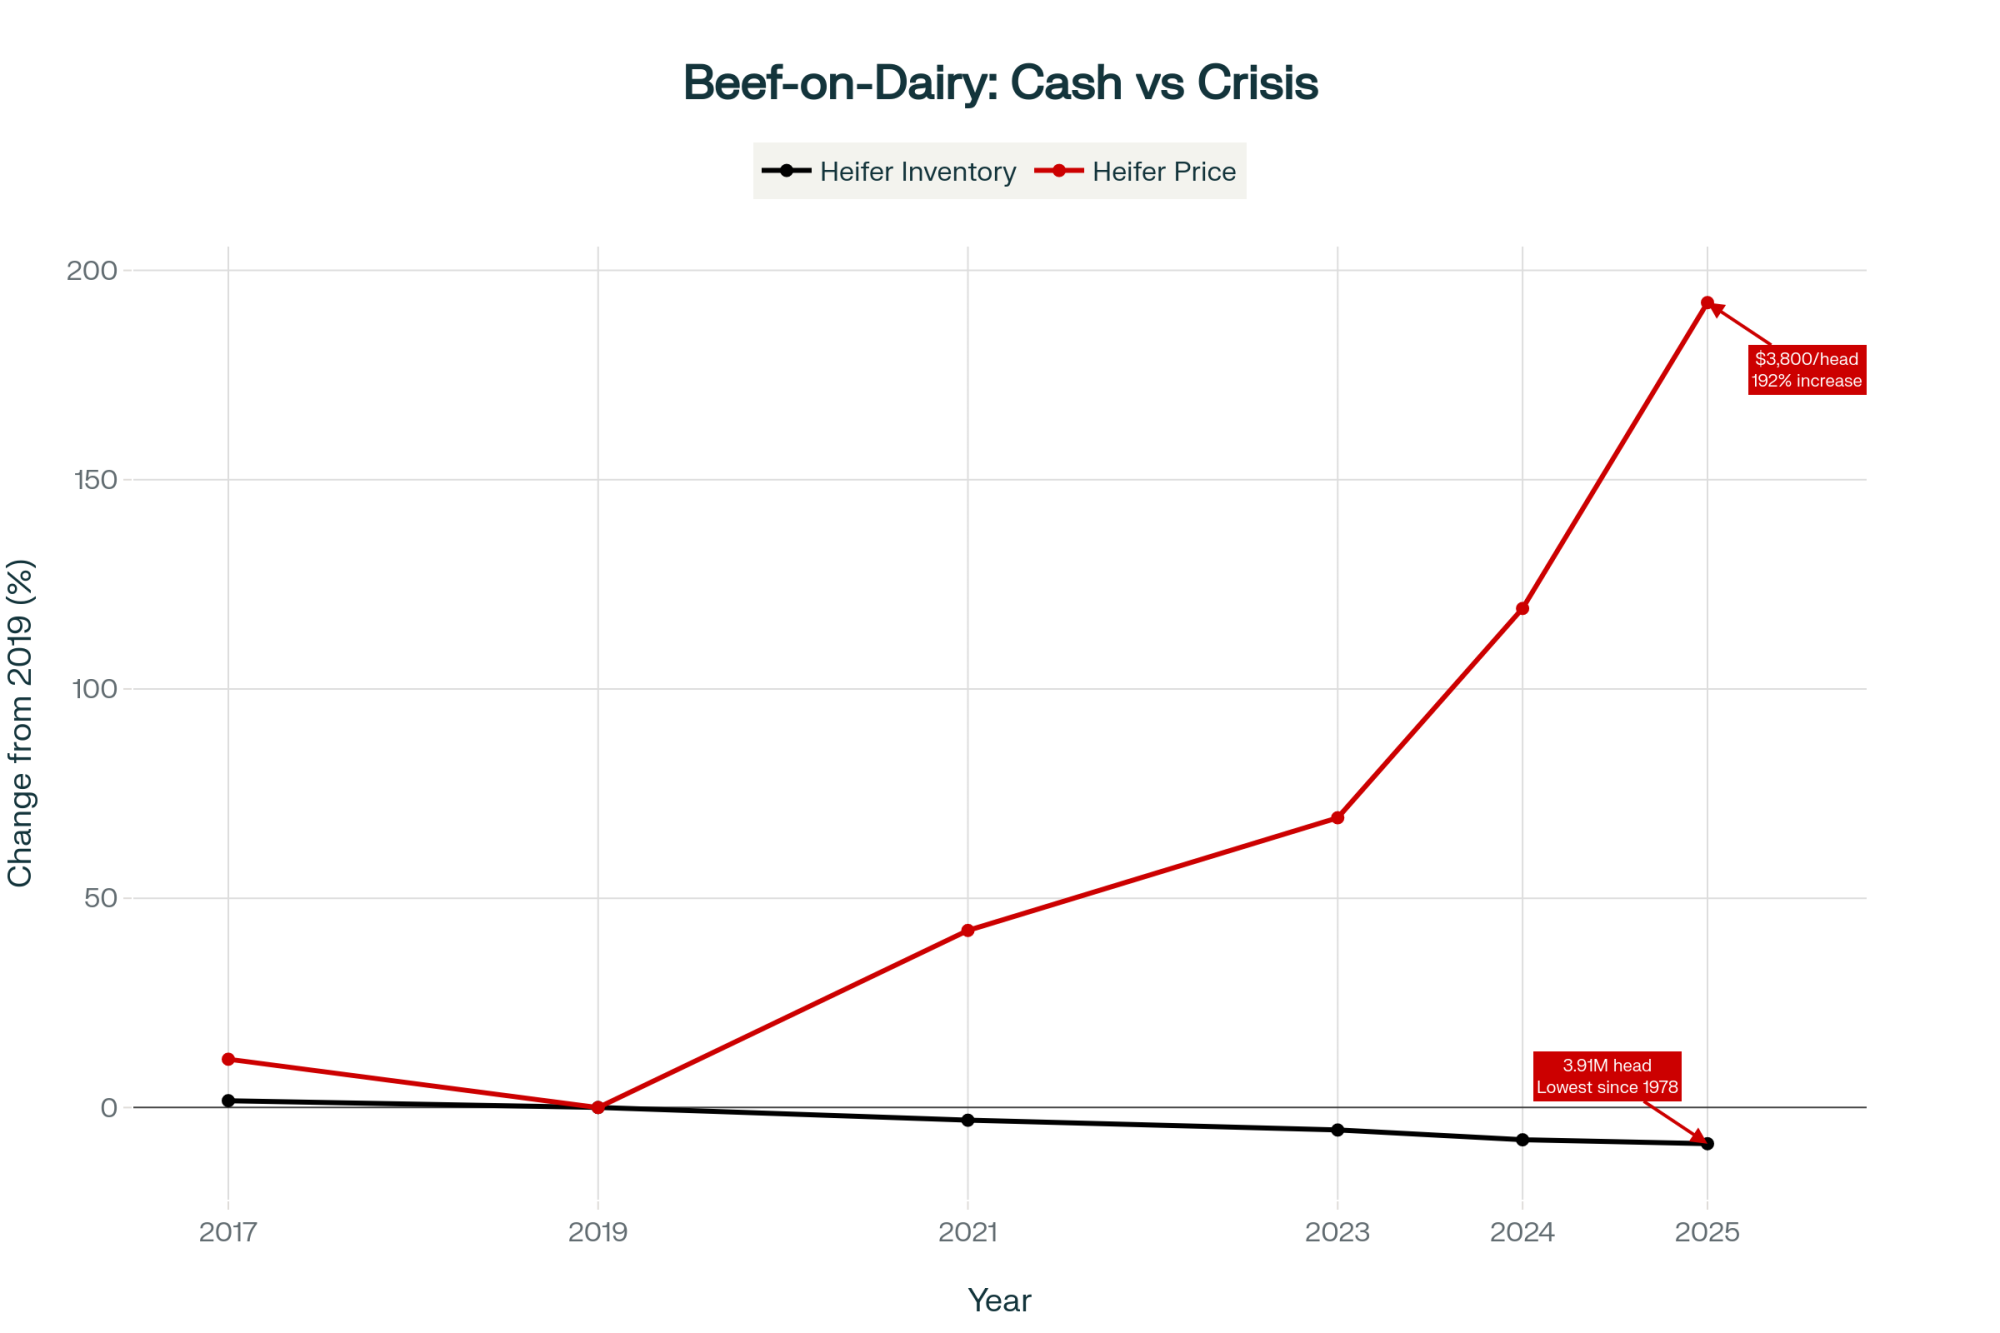
  • Beef on Dairy: The Golden Ticket? – Provides a strategic analysis of the beef-on-dairy market, offering producers methods to maximize the value of their lower-ranking animals and leverage the “strong cull values” mentioned in the main article to create a second, reliable revenue stream.
  • Why Genomics is the Best Investment You Can Make – Delivers the technical “how-to” for the article’s Step 3: Rank by Value, showing how to use genomic data to accurately identify the bottom 15% of the herd that drains profit, ensuring you are culling the right cows for the right reasons.

Join the Revolution!

Join over 30,000 successful dairy professionals who rely on Bullvine Weekly for their competitive edge. Delivered directly to your inbox each week, our exclusive industry insights help you make smarter decisions while saving precious hours every week. Never miss critical updates on milk production trends, breakthrough technologies, and profit-boosting strategies that top producers are already implementing. Subscribe now to transform your dairy operation’s efficiency and profitability—your future success is just one click away.

NewsSubscribe
First
Last
Consent

The $1,350 Replacement Advantage

Why Today’s Best Dairies Cull Healthy Cows That Could Produce for Years

Executive Summary: Wisconsin dairyman Eric Grotegut no longer culls cows in crisis—he replaces them strategically on “Monday afternoons,” capturing a $1,350 per head advantage that’s reshaping dairy economics nationwide. Despite cows being genetically capable of living 13 months longer than they did 20 years ago, the math now favors earlier replacement: while a third-lactation cow generates $234 in annual profit, her $350 genetic lag means a younger replacement creates $2,704 in value over three years. This shift, powered by genomic selection tripling genetic progress to $75 yearly, beef-on-dairy premiums of $370-400 per calf, and IVF technology approaching commercial viability, has created an unexpected crisis—heifer inventory down 18% with prices soaring from $1,720 to over $3,000. The optimization technology driving these decisions requires an annual investment of $26,000-78,000, achieving positive ROI only above 400 cows, accelerating consolidation that may reduce U.S. dairy farms from 26,000 to 15,000-18,000 by 2035. With environmental genomics launching in 2026-2027, producers face three paths: scale up to 600+ cows and embrace technology, develop specialized niches like organic or direct marketing, or exit strategically before 2030 while preserving asset value. The longevity paradox reveals a fundamental truth—in modern dairying, keeping cows longer often means keeping the operation shorter.

You know, there’s something that doesn’t quite add up when you really think about it. Our cows today are genetically capable of living 13.2 months longer than they did twenty years ago—that’s what the folks at CDCB showed us at the October meeting held during World Dairy Expo, saying we’ve gained about 4.7 months of productive life per decadethrough genetic selection. But here’s what’s interesting: many of the most progressive producers I know are actually replacing them earlier, not later.

Eric Grotegut, who runs 1,400 cows up in Wisconsin, said something at that meeting that really stuck with me.

“15 to 25 years ago, it seemed like I was selling cows every day for a lame cow, a mastitis cow, a pneumonia cow—something all the time. Now most cull cows are on Monday afternoon.”

Monday afternoon. That shift—from emergency culling to what Eric calls “Monday afternoon” strategic replacement—well, that tells you everything about how dairy economics have completely flipped in the last decade or so.

The Math That Changes Everything

So I’ve been digging into what the researchers call the Retention Payoff calculation, or RPO for short. Basically, you’re asking: does keeping this cow generate more profit than replacing her with a younger animal? And what I’ve found is…the numbers are surprisingly clear-cut.

Here’s how it breaks down in a real scenario that many of us face. You’ve got a third-lactation cow producing 68 pounds daily—decent production, no major health issues, right? She’s profitable, generating about $234 in annual profit above her direct costs, according to the Wisconsin Extension models. So, naturally, you’d think, why would anyone replace her?

ComponentMature CowReplacement Heifer (3 Years)
Annual Profit Above Costs$234 (with $350 genetic lag at $75/yearprogress)Year 1: $97Year 2: $720Year 3: $1,031
Genetic Opportunity Cost$233/year (USDA analysis)No lag—current genetics
Net Present Value$1,353 (over 3 years)$2,704
Bottom Line Advantage$1,350 more value from replacement

Here’s what’s really happening, though. That cow carries genetics from roughly 4-5 years ago, which means she’s about $350 behind current genetic averages. We’re seeing genetic progress at $75 PTA Net Merit per year now—both CDCB and the Canadian Dairy Network have confirmed this. And that creates what Paul VanRaden at USDA calls a “genetic opportunity cost“—essentially $233 per year in lost value from not having current genetics in that stall.

“We’re not just looking at whether a cow covers her feed costs anymore. We’re evaluating whether she’s the most profitable use of that stall space given all available options.”
— Tom Overton, Cornell’s dairy management professor at the Western Dairy Management Conference

Three Technologies Converging to Change Everything

What’s driving this shift isn’t just one breakthrough—and this is what I think many folks miss—it’s three technologies hitting maturity at the same time, each reinforcing the others in ways nobody really predicted five years ago.

Genomic Selection Has Changed the Game Entirely

Since USDA launched official genomic evaluations for Holsteins and Jerseys back in January 2009, we’ve gone from experimental to essential. Today, 95% of U.S. AI bulls are genomically tested, and about 20% of heifer calves get tested within their first week of life, according to CDCB’s latest data.

The impact on genetic progress? Man, it’s been dramatic. Before genomics, we were seeing gains of about $28 PTA Net Merit per year. Now? We’re hitting $75 per year—nearly triple the rate.

The Canadian Dairy Network’s 2024 report shows even more dramatic shifts in specific traits. Production traits have doubled their rate of improvement, but here’s what’s really impressive: tough traits like daughter pregnancy rate have increased threefold to fourfold. That’s…that’s game-changing for our industry.

Kent Weigel at the University of Wisconsin, who’s been tracking this since the beginning, tells producers that “farmers typically cull the bottom 15 to 20% of calves based on genomic testing, but the exact proportion depends on the number of surplus heifer calves available on a given farm.” And he’s right—it’s all about finding that sweet spot for your operation.

Genomics didn’t just speed up progress—it blasted a hole in the old ceiling. Black bars for ‘then,’ red for ‘now.’ That’s a revolution in every stall.

Sexed Semen: Strategic but Still Limited

Now, sexed semen adoption in the U.S. sits at 25-30% according to NAAB statistics. Compare that to the UK, where they’re at 84% based on AHDB’s 2024 report. Why the gap? Well, the challenges are real, as many of you probably know.

Conception rates with sexed semen still run 15-20% below conventional, based on large-scale field data from Alta Genetics and Select Sires. The stuff costs 2.3 times more—you’re looking at $50-64 versus $18-28 for conventional. And during summer heat stress? Forget about it.

Peter Hansen’s group down at the University of Florida has shown that pregnancy rates can drop to 25-30% with sexed semen when the temperature-humidity index exceeds 72. Those of us dealing with hot summers know exactly what that means for breeding programs. July and August can be brutal.

But here’s what’s working: virgin heifers in fall and winter. You can still hit 60% conception rates with good management. Matt Lauber, working with Paul Fricke at Wisconsin, showed that with proper synchronization protocols, the fertility gap narrows to just 8-12%—making sexed semen far more viable in optimized systems. It’s not about using sexed semen everywhere—it’s about using it where it pencils out.

Beef-on-Dairy: The Revenue Stream Nobody Saw Coming

This might be the biggest shift I’ve seen in twenty years of watching this industry. We’ve gone from 200,000 beef-cross dairy calves in 2008 to 2.9 million in 2025, according to Rabobank’s analysis. These calves now represent 12-15% of the U.S. fed cattle supply. Think about that for a minute.

What’s driving it? Money, plain and simple. Day-old beef-cross calves are bringing $370-400 premiums over straight dairy bull calves based on USDA auction reports from Wisconsin and California. For a 1,000-cow operation breeding 60-70% to beef, that’s $222,000 to $280,000 in annual premium revenue that didn’t exist before 2015.

Glenn Klein, who manages 3,600 cows across multiple sites in Wisconsin, explained their approach at the Industry Meeting: “We’ve been doing beef-on-dairy since I think 2018 or 2019. We do it somewhat strategically based on the cow. We look at her genomics, see her past history, and basically decide whether she gets sexed semen or beef semen.

The Constraint Nobody Planned For

Lowest heifer numbers, record-busting prices. What felt like a quiet trend just crashed into reality, and every buyer’s feeling it.

But here’s where things get complicated—and it’s a perfect example of unintended consequences in our industry. This strategic shift toward beef-on-dairy has created the worst heifer shortage in 20 years.

CoBank’s August 2025 analysis shows national dairy replacement heifer inventory at 3.914 million head. That’s 18% below 2018 levels and the lowest we’ve seen since 2005. They’re projecting inventories will shrink by another 800,000 head before recovering in 2027.

The math is straightforward but painful. With 60-70% of the national herd now bred to beef—that’s per National Association of Animal Breeders data—we’ve essentially cut our replacement pipeline in half.

Heifer prices tell the story: from $1,720 in April 2023 to $3,010 by July 2025, according to USDA market reports. And I’ve seen high-quality Holsteins fetching over $4,000 at auctions in Turlock, California, and New Ulm, Minnesota.

This creates a real paradox, doesn’t it? While the RPO math strongly favors replacement, producers are actually reducing culling rates—down from 32.7% in 2019 to 27.9% in 2024, according to Canadian Dairy Information Centre data, which is the best North American dataset we have. They’re keeping marginal cows they would’ve culled five years ago when heifers cost $1,200.

“We know the economics favor replacement, but you can’t replace what you don’t have. So producers are keeping cows a bit longer than optimal while rebuilding heifer inventory.”
— Mike Overton, DVM, who directs technical services at Elanco

IVF: From Seedstock Tool to Commercial Reality

What’s fascinating to me is watching IVF technology move from the seedstock world into commercial dairies. Current pregnancy rates have climbed above 50-55% based on 2024 data from Trans Ova Genetics and other major providers—matching or even beating conventional AI in some cases.

The cost trajectory is what really matters, though. We’re at $350-450 per pregnancy today, but industry projections show that dropping to an estimated $200-300 by 2027-2029 as volumes scale and protocols improve.

Several technical improvements are converging here:

  • Optimized FSH protocols during the voluntary waiting period increase oocyte yields by 51%—that’s from Wisconsin research
  • Time-lapse embryo selection with continuous monitoring from fertilization through day 8 improves pregnancy rates by 15-25 percentage points, according to Animal Reproduction Science
  • Vitrification technology—that ultra-rapid freezing technique—now allows frozen embryos to match fresh transfer success rates

Sean Nicholson, who runs 1,600 cows in Tulare County, California, shared his experience with the California Dairy Magazine: “IVF pregnancy rates markedly exceed what we see with conventional AI, especially during summer when heat stress hammers traditional breeding.” His operation now uses beef IVF embryos for 7% of pregnancies—producing purebred Angus calves from Jersey recipients that bring even higher premiums than regular beef-crosses.

For operations above 800 cows, IVF is starting to pencil out. You can take your elite donors—that top 3-5%—and produce 10-15 pregnancies annually versus one naturally. This creates what I call a three-tier system: elite cows produce all your replacements via IVF, middle-tier cows just make milk, and bottom-tier cows produce beef calves for cash flow.

Success Story: Minnesota’s IVF Innovation

Take a look at how one Minnesota operation is making this work. They’re running 850 cows, started genomic testing everything three years ago, and now use IVF on their top 25 females. Last year, those 25 cows produced 180 pregnancies—enough to cover all their replacement needs plus some to sell. Meanwhile, they bred the rest of the herd to beef and captured an extra $240,000 in calf revenue. That’s…that’s transformative economics.

What’s interesting is they’re not doing this alone—they’ve partnered with two neighboring farms, each running 400-500 cows, to share IVF technician costs and expertise. It’s the kind of cooperative approach that makes advanced technology accessible at smaller scales.

Environmental Pressure: The Next Wave Coming

Here’s something that hasn’t hit most U.S. producers yet, but it’s definitely coming. John Cole at CDCB revealed in October that methane emissions evaluations will launch in 2026-2027, with disease resistance traits following shortly after. When these environmental traits are integrated into selection indices, genetic progress could accelerate from the current $75 per year to an estimated $110-125 per year, depending on the heritability and economic weightings of these new traits. That’s a 47-67% jump.

The University of Wisconsin’s $3.3 million methane project has found heritability of 0.20-0.28 for residual methane traits. That’s moderately to highly heritable, which means we can effectively select for it. They’re using milk spectral data and even fecal microbiome profiles as proxies for rumen emissions, which would make large-scale phenotyping actually feasible.

What’s particularly interesting is looking at what’s already happening in Europe. UK and Irish producers are getting 2-4 pence per liter premiums for verified emission reductions, according to Arla Foods’ 2024 sustainability report. Every dairy bull calf they raise counts against their farm’s carbon intensity score. When similar pressures reach U.S. markets—and trust me, they will—cows with poor environmental genetics might become economically unjustifiable regardless of their production level.

The Reality Check: Who Can Actually Execute This?

Now, all this sophisticated RPO optimization sounds great in theory. But after talking with producers and consultants across the country, I’ve realized there’s a massive gap between what’s theoretically optimal and what most farms can actually implement.

The industry basically breaks into five distinct tiers based on what I’m seeing:

Elite operations—those running 1,000+ cows and producing about 45% of U.S. milk—they’ve got the whole package. Daily milk weights, genomic testing for every calf, activity monitors —the works. Eric Grotegut’s Wisconsin operation falls squarely into this category. They’re truly optimizing these RPO calculations daily.

Progressive commercial farms running 400-1,000 cows —roughly 30% of our milk supply —have most of the tools but use them monthly rather than daily. They’ll perform genomic testing on 60-80% of calves and run activity monitors on breeding-age animals.

Mainstream operations—150-400 cows, about 20% of milk—they operate on rules of thumb. Kristen Metcalf, running 360 cows in Minnesota, described improving health through “implementing more frequent hoof trimming and rubber mats in the barn.” That’s good management, absolutely, but it’s not sophisticated RPO optimization.

Smaller operations with fewer than 150 cows, which produce about 5% of our milk, simply don’t have access to these tools. At $26,000-78,000 annual investment for full RPO infrastructure—genomic testing, monitors, software, consultants—it only achieves positive ROI above 400 cows.

You know, research from ETH Zurich published in the Journal of Dairy Science found that suboptimal culling decisions cost 1.55 Swiss francs per cow monthly. And here’s the kicker: losses from keeping cows too long were three times greater than premature culling losses. But that analysis required dynamic programming models with detailed farm data—exactly what most mid-size operations lack.

Practical Strategies by Farm Size

What farmers are discovering varies dramatically by scale, and honestly, there’s no one-size-fits-all answer here. Let me break down what’s actually working:

For Large Operations (800+ cows):

Go all-in on the technology. Full genomic testing runs about $40-50 per calf through companies like Zoetis or Neogen—that’s $12,000-20,000 annually for a 1,000-cow herd, but it pays back quickly.

Consider IVF programs for your top 3-5% once you’ve identified them genomically. Keep beef-on-dairy at 60-70% to maximize that revenue stream while beef premiums stay high.

And start preparing for environmental compliance now. Methane measurement infrastructure is projected at $50,000-100,000 based on current equipment costs, though specific U.S. regulatory requirements are still being developed.

For Mid-Size Operations (200-600 cows):

Focus on what I call the 80-20 approach—capture 80% of the value with 20% of the complexity:

  • Definitely genomic test all your heifers and cull the bottom 15-20% before spending $2,900 to raise them
  • Use your monthly DHIA test to identify cows below 75% of herd average production who are also open past 120 days
  • Put beef semen on your bottom 50% by either genomic merit or production
  • The key decision: can you scale to 600+ cows in the next 3-5 years? If not, start developing a niche strategy now
  • Consider cooperative approaches—some 400-cow operations are exploring shared IVF programs with neighbors to access technology at a viable scale

For Smaller Operations (under 200 cows):

Your economics are fundamentally different, and that’s okay. Focus on:

  • Reducing involuntary culling through better fresh cow management and hoof health
  • If you’re in the right location, organic certification can capture $7-12/cwt premiums that offset scale disadvantages
  • Direct marketing through on-farm stores or agritourism might work
  • But let’s be honest here—if you don’t have a clear competitive advantage like paid-off land, unique market access, or family labor, start planning your exit strategy for 2027-2030 before technology requirements intensify

Regional Realities Shape These Economics

It’s worth noting that these dynamics play out differently across regions. California’s massive operations—many running 3,000-5,000 cows—they’re already deep into IVF and sophisticated optimization. Meanwhile, Vermont’s pasture-based systems face entirely different economics where land constraints and organic premiums create alternative value equations.

The Upper Midwest sits somewhere in between, with operations like Grotegut’s finding that sweet spot of scale and technology adoption. Texas and New Mexico operations? They’re dealing with water constraints that trump genetic optimization. Each region has its own version of this story, you know?

And seasonally, everything shifts. Summer heat stress in the Southeast makes sexed semen nearly unusable from June through September. Wisconsin producers might have a solid eight-month breeding window, while Arizona dairies face reproductive challenges year-round. These aren’t minor details—they fundamentally change the economics.

The Consolidation Nobody Wants to Talk About

Here’s the uncomfortable truth: we need to face it directly. Every trend we’re seeing—RPO optimization, IVF scaling, beef-on-dairy, environmental genomics—creates economies of scale that favor large operations.

Based on current trajectories and what we saw from 2000-2020—a 54% decline in farm numbers while production increased 16%—I expect we’ll see U.S. dairy farm numbers drop from today’s roughly 26,000 to somewhere between 15,000 and 18,000 by 2035. That’s a 30-40% reduction.

These aren’t just business decisions—they’re family legacies facing new realities. Farms that have been in families for generations are weighing whether the next generation can make the economics work. And that’s…that’s tough to watch.

Technologies providing 10-20% efficiency improvements only achieve positive ROI at 400-800+ cow scale. Operations below these thresholds aren’t “behind”—they’re structurally excluded from the tools that enable optimization.

What to Watch in 2026

Looking ahead, here’s what I’m keeping an eye on:

  • Methane genomic evaluations launching mid-2026, according to CDCB’s timeline
  • Heifer inventory beginning recovery late 2026 into early 2027, per CoBank’s projections
  • IVF costs potentially hitting that $250-300 sweet spot—watch Trans Ova and other providers
  • Environmental regulations in California are potentially creating templates for other states

The Bottom Line for Your Operation

The longevity paradox—cows that can live longer but shouldn’t economically—it’s just one symptom of a broader transformation. What really matters is understanding where your operation fits in this changing landscape.

If you’re above 400 cows, the math increasingly favors aggressive adoption of advanced technologies and strategic culling based on genomic merit. That $1,350 RPO advantage? It’s real, and it compounds over time.

If you’re between 200-400 cows, you’re at a crossroads. Either develop a clear path to 600+ cows or find a niche that offsets your scale disadvantage. There’s no shame in either choice, but indecision…that’s what’s costly.

If you’re under 200 cows, be realistic about your options. Unless you have structural advantages—debt-free land, unique market access, off-farm income—the economics are working against you. A well-timed exit in 2027-2029 might preserve more value than struggling through 2030-2035.

The dairy industry is experiencing what economist Joseph Schumpeter called “creative destruction“—old systems giving way to new ones that are more efficient but also more capital-intensive. Cows built to last longer are leaving sooner, not because they can’t produce, but because the math increasingly says they shouldn’t.

Understanding and adapting to this reality—rather than fighting it—that’s what’ll determine which operations thrive in the next decade. The genetics exist for cows to live longer. The economics increasingly say they won’t. That’s not a bug in the system—it’s become the system itself.

But you know what? Within these constraints lie opportunities for those willing to adapt, whether through scale, specialization, or strategic partnerships. And there’s innovation happening at every scale—I’m seeing 200-cow operations finding profitable niches, 500-cow farms forming cooperative IVF programs, and yes, larger operations pushing efficiency boundaries we couldn’t imagine five years ago.

The key is making clear-eyed decisions based on your specific circumstances, not industry averages or what your neighbor’s doing. Because at the end of the day, the best strategy is the one that works for your land, your family, and your future.

Key Takeaways: 

  • The $1,350 replacement advantage is real and compounds annually: Even profitable third-lactation cows generate less value than younger replacements due to $75/year genetic progress—making strategic culling more profitable than longevity
  • Your scale determines your future: Operations need 400+ cows for optimization technology ROI, 600+ for sustainable competition, or a clear niche strategy (organic, direct marketing) to survive below these thresholds
  • Maximize beef-on-dairy NOW before 2027: With current $370-400 premiums and 60-70% breeding to beef optimal, this revenue stream won’t last—heifer inventory recovery and beef cycle correction will compress margins within 24 months
  • Technology adoption isn’t optional, it’s existential: Genomic testing ($40-50/calf), IVF (dropping to $200-300), and environmental compliance ($50,000-100,000) will separate survivors from casualties when methane regulations hit in 2026-2027
  • Decision time is 2026, not 2030: Whether scaling up, specializing, or exiting, waiting means competing against operations that have already optimized—make your strategic choice while you still have options

Complete references and supporting documentation are available upon request by contacting the editorial team at editor@thebullvine.com.

Learn More:

Join the Revolution!

Join over 30,000 successful dairy professionals who rely on Bullvine Weekly for their competitive edge. Delivered directly to your inbox each week, our exclusive industry insights help you make smarter decisions while saving precious hours every week. Never miss critical updates on milk production trends, breakthrough technologies, and profit-boosting strategies that top producers are already implementing. Subscribe now to transform your dairy operation’s efficiency and profitability—your future success is just one click away.

NewsSubscribe
First
Last
Consent

December 1 Deadline: How Cutting 15% of Your Herd Could Add $40,000 to Your Bottom Line

Dairy’s best kept secret: The farms shrinking on purpose are the ones making money. Here’s the $165K proof.

Executive Summary: A Wisconsin dairy farmer cut 150 cows and made $165,000 MORE—proving that in today’s market, strategic shrinking beats growing. With mega-dairies producing at $13/cwt versus your $23/cwt, that $10 spread is mathematically insurmountable through volume. December 1’s new protein requirements (3.3% baseline) will either cost you $8,640 in penalties or earn you $40,000+ in premiums—depending on what you do in the next 31 days. The winning formula: cull your bottom 15% to cut costs immediately, then optimize components through amino acid supplementation for premium capture. This article delivers a tested 90-day playbook with specific actions, real costs, and realistic timelines that have already transformed dozens of operations. Your choice is simple but urgent: adapt now, pivot to alternatives, or exit while you still can.

Strategic Culling Dairy

Part One: The Squeeze Is Real—And Getting Worse

You know that feeling when you’re caught between a rock and a hard place? That’s exactly where mid-size dairy operations sit right now. And if you’re running 200 to 600 cows, you’re probably feeling it every time you look at your milk check.

Let me paint you a picture with some hard numbers from the USDA’s latest Census of Agriculture, released in February. Between 2017 and 2022, we lost 15,866 dairy farms. During that same time? Milk production actually went UP five percent.

How’s that math work? Well, you probably know this already, but it’s worth saying—the big got bigger. Much bigger.

The brutal math of consolidation: 15,866 farms disappeared (29% loss) while milk production rose 5%—proof that 834 mega-dairies now control nearly half of America’s milk supply

Year
FarmsChangeProduction IndexMega Share %
201754,59910042%
201851,050-3,54910143%
201947,235-3,81510244%
202043,410-3,82510345%
202140,100-3,310103.545.5%
202238,733-1,36710546%

The Brutal Economics of Scale

So I visited one of these mega-operations in Texas last spring. Twelve thousand cows. Robotic systems everywhere. The whole nine yards.

Here’s what’s interesting—their CFO, who came from the oil industry, actually, showed me their numbers. Thirteen dollars per hundredweight all-in production costs. Thirteen.

Now, I don’t know about your operation, but Cornell’s PRO-DAIRY program has been tracking costs for typical 100-200 cow herds, and they’re seeing around $23 per hundredweight. That’s… that’s a problem.

The brutal economics of scale: Mega-dairies operate at $13-17/cwt while mid-size farms struggle at $23/cwt—a $10 gap that volume alone cannot bridge

Farm Size
Cost/CWTStatus
10-49 cows$33.54Loss
50-99 cows$27.77Loss
100-199 cows$23.68Loss
200-499 cows$20.85Loss
2,500+ cows$17.22Profit

At today’s Class III price—what was it this morning, $17.40 on the CME?—smaller operations are losing close to six bucks per hundredweight. Meanwhile, these mega-dairies? They’re making over four dollars.

That’s a ten-dollar spread, folks. Ten dollars!

“I realized I was trying to compete on volume with operations ten times my size. Can’t win that game. So I changed the game—focused on profit per cow, not gallons in the tank.” — Wisconsin dairy farmer who cut his herd from 1,200 to 1,050 cows

And here’s the thing that keeps me up at night—it’s not that these big operations are doing anything wrong. They’re just playing a different game entirely. Feed costs alone, they’re saving $2-3 per hundredweight through direct commodity purchases. Labor efficiency? Another couple of bucks saved. It adds up fast.

The Geographic Earthquake Nobody’s Talking About

While you’re wrestling with those economics, something else is happening that’s maybe even more important. The entire industry map? It’s being redrawn under our feet.

You’ve probably heard about the new processing capacity—Rabobank’s September report put the investment range at $8 to $11 billion. Biggest buildout since the 1990s. But here’s the kicker that nobody really wants to talk about—these plants aren’t where the milk traditionally has been.

Take Hilmar’s new Dodge City facility out in Kansas. Or Valley Queen’s expansion up in South Dakota. These aren’t small operations, folks. They need milk—lots and lots of milk.

And where’s it coming from? Well, USDA’s latest production report tells the story:

Texas added 50,000 cows this past year. Fifty thousand! Kansas jumped by 29,000 head. South Dakota gained somewhere between 18,000 and 21,000, depending on which report you look at.

Meanwhile—and this is what Mark Stephenson, Director of Dairy Policy Analysis at UW-Madison’s Center for Dairy Profitability, calls it—older plants in Wisconsin, Minnesota, parts of New York? They’re taking “strategic downtime.” That’s a polite way of saying they can’t compete for milk at current prices.

What I’m hearing from processing plant managers and dairy economists familiar with these operations is that new facilities are running at maybe 50-70% capacity right now, varying by plant, of course. They’re still ramping up, learning their systems, building those supply chains.

But when they hit full throttle—and most analysts I talk to figure that’ll be late 2026—we’re looking at an additional billion pounds of cheese-making capacity.

Just to put that in perspective… that’s about what the entire state of Vermont produces in a year.

Now, the strategies that work in Texas, with its minimal environmental regulations, aren’t the same as those that work in California, with its water restrictions. And our friends in the Southeast, dealing with heat stress, face different challenges than folks up in Vermont, where land costs are through the roof. But the pressure? That’s universal.

Part Two: December 1—The Trigger That Changes Everything

As if the squeeze wasn’t tight enough already, here comes December 1 with Federal Milk Marketing Order changes that’ll turn chronic pressure into an acute crisis for a lot of farms.

According to USDA’s final rule that came out in October—and I spent way too much time reading through all 147 pages of it—baseline protein jumps from 3.1% to 3.3% starting December 1. Other solids move from 5.9% to 6.0%.

Now, that might not sound like much when you’re sitting at the kitchen table. But let me show you what this actually means for your milk check.

The New Component Reality

A typical 200-cow operation that’s been hitting that old 3.1% protein baseline? Come December 1, they’re suddenly eight cents under water per hundredweight. Just like that—penalty instead of baseline.

On the flip side, farms hitting 3.4% protein capture about 28 cents per hundredweight in premiums under the new formulas.

Let’s do the math here—on 200 cows averaging 75 pounds daily, that’s the difference between losing money and gaining around $8,640 annually. That’s not pocket change, as many of us have learned the hard way.

Karen Phillips, who’s an Associate Professor of Dairy Science at UW-Madison, explained something fascinating at last month’s extension meeting in Marshfield. She said cheesemakers need a protein-to-fat ratio of 0.80 for optimal yield. Know what the U.S. average is right now? We’re sitting at 0.77 according to the DHIA data from January through September.

That three-hundredths difference—it doesn’t sound like much, but it forces plants to add nonfat dry milk powder to standardize their cheese vats. Cuts right into their margins. Makes them real interested in paying premiums for the right milk.

December 1 creates a $15,500 spread between winners and losers: Farms hitting 3.4% protein gain $8,000 annually while those at 3.0% lose $7,500—all based on new FMMO baselines
ScenarioProtein/OSPayment ΔAnnual Impact (200 cows)
Below Average3.0% / 5.8%-$0.15/cwt-$7,500
Average3.1% / 5.9%-$0.08/cwt-$4,000
Above Average3.4% / 6.2%+$0.28/cwt+$8,000

December 1 Component Changes at a Glance:

  • Protein baseline: 3.1% → 3.3%
  • Other solids: 5.9% → 6.0%
  • Below baseline = penalties
  • Above baseline = premiums
  • 200-cow herd hitting 3.4% protein = ~$8,640 annual gain

Part Three: Why “Just Make More Milk” Is a Losing Game

Your first instinct might be to ramp up production, right? Get more cows. Push for higher yields. Try to compete on volume.

Don’t. Just… don’t.

Here’s why that strategy is basically suicide for mid-size operations.

You Can’t Out-Scale the Giants

Those 834 mega-dairies with 2,500-plus cows that USDA’s Economic Research Service tracked in their March 2025 report? They’re producing 46% of America’s milk now. Nearly half of our milk comes from fewer than 1,000 farms.

Think about that for a second.

They’ve got feed costs that run $2-3 per hundredweight lower than yours through direct commodity purchases—they’re buying trainloads, not truck loads. Labor efficiency through automation saves them another $2-2.50 based on university cost studies. Capital costs spread across massive production volumes? That’s another buck-fifty to two-fifty saved.

You can’t win that game. I mean, you literally cannot win it. So stop trying.

The Processing Capacity Trap

Michael Dykes, President and CEO at the International Dairy Foods Association—I had coffee with him at September’s Dairy Forum in Phoenix—he told me something really revealing. He said everyone in the industry was terrified there wouldn’t be enough milk for these new plants.

“I kept telling them,” he said, “farmers will respond to market signals.”

Well, respond they did. Boy, did they respond.

But here’s what nobody wants to say out loud at these industry meetings: The IDFA estimates we’ll have a billion pounds of new annual cheese capacity by the end of 2026. Meanwhile, domestic demand? It’s growing at about 1-2% annually, based on USDA consumption data from their July report.

You see the problem here? More milk into an oversupplied market just drives prices lower. You’re literally racing to the bottom.

Part Four: The Real Solution—Shrink to Grow

This brings me to something that happened last February that really opened my eyes. I was talking to this Wisconsin dairy farmer—let’s call him Tom to protect his privacy—standing in his freestall barn outside Shawano. And he tells me something that seemed absolutely crazy at the time.

He was cutting his herd from 1,200 to 1,050 cows. On purpose.

“You’re going backwards,” his neighbors told him at the co-op meeting.

Eight months later? His net income—not revenue, but actual net income—had jumped dramatically. The University of Wisconsin Extension has been documenting these kinds of strategic culling success stories in its dairy management programs, and the results are prompting many people to rethink everything.

Here’s the two-step strategy that’s actually working:

Step One: Strategic Culling (The Foundation)

Victor Cabrera, Professor in the Department of Dairy Science at UW-Madison, has data showing something really interesting—the average farm has 10-12% of cows that are net negative on profitability.

They’re eating feed. Taking up stall space. Requiring labor. Getting bred. But when you actually run the numbers? They’re not paying their way.

Culling these underperformers does two things immediately:

  1. Reduces your costs right away—less feed, less labor, fewer health issues
  2. Mechanically raises your herd’s average production and components

What Tom did with his 150-cow reduction was eliminate his worst performers. The 1,050 cows he kept? Higher average production. Better components. Lower costs per hundredweight. It’s not magic—it’s just math.

Step Two: Component Optimization (The Multiplier)

Once you’ve got a leaner, higher-potential herd, now you optimize for components through amino acid balancing.

Jim Paulson, Dairy Extension Educator at University of Minnesota Extension in St. Cloud—he’s been working with dairy nutrition for decades—he explains it really well: “Most farms overfeed crude protein while being deficient in the specific amino acids that actually drive milk protein synthesis.”

The fix? Rumen-protected methionine and lysine in the right ratio. The Journal of Dairy Science has published extensive research on this over the past couple of years, and the 3-to-1 lysine-to-methionine ratio keeps coming up as optimal.

Brian Perkins, Senior Dairy Technical Specialist with Vita Plus Corporation out of Madison—he’s worked with 47 different herds on this in 2025—told me: “Target a 0.15 to 0.20 percentage point protein increase. Budget $0.10–$0.15 per cow daily. Based on our field trials, you’ll see results in 8-12 weeks.”

On a now-optimized 200-cow herd, that’s maybe $7,000 annually for the supplements. But if it gets you to 3.3% protein or higher, you’re capturing those December 1 premiums we talked about.

I don’t have all the answers here, and finding qualified nutritionists who really understand amino acid balancing can be challenging in some regions. Your best bet is contacting your state Extension dairy team—they can usually connect you with someone who knows this stuff inside and out.

The Combined Effect

Simple math that works: Invest $7k in amino acids, execute strategic culling, breed 60% to beef—capture $153k in combined gains on a 200-cow operation within 12 months

Component
AmountType
Amino Acid Supplements-$7,000Cost
Component Premiums (3.3%+ protein)+$40,000Revenue
Beef-on-Dairy (60% × 120 calves)+$100,000Revenue
Cost Reduction (15% culling)+$20,000Savings
NET PROFIT+$153,000Total

* 200-Cow Operation

Here’s where it gets really interesting:

  • Culling raises your baseline—removing the bottom 15% might boost your average protein from 3.0% to 3.1% just from that alone
  • Amino acid optimization adds another 0.15-0.20 percentage points on top
  • Now you’re at 3.25-3.30% protein—above the new FMMO baseline
  • Your costs dropped through culling
  • Your revenue increased through premiums

That’s how you shrink to grow. And it’s working for operations across the country—though individual results will obviously vary based on your specific circumstances.

Part Five: Your 90-Day Survival Playbook


Phase
DaysAction FocusKey Metric
11-7Face the Truth<$19 survive / >$21 exit
28-30Execute Cull15% reduction
331-45Fix Components$0.10-$0.15/cow/day
446-60Diversify Revenue$100K+ annual
561-75Lock Premiums$40K-$140K/year
676-90Hard Decision85-95% vs 50-65%

Alright, so you understand the problem and the solution. But what do you actually DO? Like, starting Monday morning?

Here’s your tactical roadmap—and I mean this is what you actually need to do, not theoretical stuff:

Days 1-7: Face the Brutal Truth

Calculate your true all-in production cost. Brad Mitchell, Extension Agricultural Economist at Iowa State University, has this worksheet on their dairy team website that makes it pretty straightforward. Use it.

And here’s the part nobody wants to hear—include your own labor at $20 an hour minimum. That’s the median wage for dairy workers according to the Bureau of Labor Statistics as of October 2025. If you’re working 60-hour weeks—and who isn’t?—that’s $62,400 annually you’re not paying yourself.

Critical benchmarks to know:

  • Under $19/cwt: You might survive with some adjustments
  • $19-21/cwt: Major changes needed NOW
  • Over $21/cwt: You need to consider all options, including… well, including exit

Days 8-30: Execute the Cull

Time to identify your bottom 10-15% performers. Look for:

  • Chronic high SCC—anything over 400,000 consistently
  • Repeated health issues—if she’s been treated 3+ times in 90 days
  • Production under 60 pounds a day in early to mid-lactation
  • Poor components—under 2.9% protein consistently

Remove them. Yeah, I know it’s hard. Your daily tank volume will drop. But your profitability will improve immediately. Trust me on this.

Days 31-45: Fix Your Components

Call your nutritionist this week. Not next month. This week.

Tell them you need amino acid balancing targeting:

  • 0.15-0.20 percentage point protein increase
  • Rumen-protected methionine and lysine
  • That 3:1 lysine to methionine ratio we talked about

Budget $0.10 to $0.15 per cow daily. Based on what we’re seeing in the field, you’ll see results in 8-12 weeks.

For sourcing quality rumen-protected amino acids, companies like Adisseo, Evonik, and Kemin have good products—your nutritionist will have preferences based on what’s worked in your area.

Days 46-60: Diversify Revenue

If you haven’t started breeding for beef-on-dairy yet, you’re leaving serious money on the table.

Superior Livestock Auction’s video sales from October 28—I was watching them—show beef-cross dairy calves bringing around $1,400 for 400-pound steers. Straight dairy bulls? You’re lucky to get $150 at the local sale barn.

Here’s the optimal strategy:

  • Top 40% of your herd: Use sexed dairy semen for replacements
  • Bottom 60%: Beef semen all the way

Matt Akins, Beef Specialist at UW Extension’s Marshfield Agricultural Research Station, has calculated that this generates an extra $100,000-plus annually for a typical 200-cow herd. That’s real money.

The beef-on-dairy revolution: $150 dairy bulls vs $1,400 beef crosses—a $1,250 premium per calf that adds $150,000 annually to a 200-cow operation breeding 60% to beef
MetricTraditionalBeef-on-DairyDifference
Per Calf Price$150$1,400+$1,250
Annual Revenue (120 calves)$18,000$168,000+$150,000
Feed EfficiencyBaseline8-25% betterAdvantage
Finishing TimeBaseline20% faster5-26 fewer days
Carcass GradingLower15-25% Prime/ChoicePremium

200-Cow Herd (60% bred to beef)

Now, fair warning—Les Hansen, Professor Emeritus at the University of Minnesota’s Department of Animal Science, keeps reminding everyone that beef prices won’t stay this high forever. USDA’s January 2025 cattle inventory showed we’re at a 73-year lows. When rebuilding starts—probably late 2026—these premiums will shrink. So use this 18-24 month window wisely.

Days 61-75: Lock in Component Premiums

If you can hit 3.3% protein with a 0.80 protein-to-fat ratio, those new cheese plants want your milk. They really want it.

I know of several Wisconsin operations working with processors like Grande and Foremost Farms that just locked in multi-year contracts at anywhere from 40 cents to $1.40 per hundredweight above Federal Order minimums. The exact premium depends on volume commitments, location, quality history—you know, all the usual factors.

On 200 cows, even at the low end, that’s $40,000 annually. At the high end? We’re talking $140,000.

But here’s the thing—these deals are happening NOW. By January, that window probably closes.

Days 76-90: Make the Hard Decision

Look, if you’ve done all this analysis and you still can’t hit profitable benchmarks, it’s time for the conversation nobody wants to have.

Tom Peters, Senior Farm Transition Specialist at Farm Credit Services of America—he’s tracked 127 dairy transitions across the Midwest since 2020. A planned exit over 18-24 months typically preserves 85-95% of asset value. A forced liquidation in crisis? You’re lucky to get 50-65%.

On a typical $4 million operation, that’s the difference between walking away with $3.4 million or $2 million. One sets you up for retirement. The other… doesn’t.

I know this is tough to hear. But ignoring reality doesn’t change it.

Success Stories That Prove It Works

This isn’t just theory, folks. Real farms are making this strategy work right now.

I visited an operation down in Georgia that’s similar to what folks like Sarah Martinez are doing—280 cows on pasture, focused intensively on components. She’s hitting 3.45% protein consistently and has locked in premium contracts with a regional cheese maker. Her costs run about $18.50 per hundredweight—actually profitable at current prices.

“We’re not trying to compete with the big boys on volume,” she told me. “We’re competing on quality and consistency.”

Up in Vermont, I know of operations similar to the Johnson family’s that pivoted to organic about five years ago. Yeah, the transition was brutal—they lost money for three years straight. But now? They’re capturing $35 per hundredweight through Organic Valley with production costs around $28. That’s a healthy margin in anybody’s book.

And there are plenty of mid-size operations maintaining profitability through other unique strategies—direct marketing, agritourism, value-added processing. The point is, there’s more than one path forward.

Tom in Wisconsin? His remaining 1,050 cows are now averaging strong protein levels after working on amino acid balancing. He’s breeding 65% to beef. His costs dropped to about $17.80 per hundredweight after culling those 150 underperformers. At current prices, he’s actually making money. Not a fortune, but enough.

The Digital Edge You Need

What’s encouraging is the technology available now that we didn’t have even five years ago:

Penn State’s DairyMetrics offers a free component optimization app that lets you model amino acid changes before implementing them. Wisconsin’s Dairy Management website, through UW-Madison Extension, offers calculators for everything from culling decisions to heifer inventory optimization.

Several folks I know are using FeedWatch or TMR Tracker software to dial in their rations precisely. When you’re spending $7,000 on amino acids, you want to make sure they’re actually getting into the cows, you know?

And of course, USDA’s Agricultural Marketing Service and the CME Group sites let you track real-time market prices from your phone.

The Bottom Line: Choose Your Path

Look, I’ve been covering this industry for thirty years. This isn’t just another cycle. The combination of mega-dairy economics, geographic shifts, component revaluation, and processing overcapacity—it’s creating a fundamental restructuring of how this industry works.

The whey processors figured this out already. They cut commodity production by about 30%, shifted to high-value products, and created scarcity. CME spot dry whey hit 71 cents per pound last week—a nine-month high—while cheese races toward oversupply.

As Tom told me: “I realized I was trying to compete on volume with operations ten times my size. Can’t win that game. So I changed the game—focused on profit per cow, not gallons in the tank.”

He gets it. The question is, do you?

The decisions you make in the next 90 days will determine which side of 2027 you land on. For some, that means strategic culling and component optimization. For others, it means transitioning to organic or direct marketing. And yes, for some, it means a well-planned exit that preserves wealth.

What’s not an option? Not choosing. Because not choosing is still choosing—it’s just choosing to let the market decide for you.

The clock’s ticking, folks. December 1 is 31 days away.

Time to decide: Will you shift with the market, or get shifted by it?

Key Takeaways:

  • The Volume Game Is Over: With mega-dairies producing at $13/cwt versus your $23/cwt, competing on size is mathematical suicide—the $10 spread is unbridgeable
  • December 1 Deadline Creates Winners and Losers: Hit 3.3% protein to capture $40,000+ in premiums, or face $8,640 in penalties—you have 31 days to pick your side
  • Strategic Culling Pays Immediately: Your bottom 15% of cows are profit vampires—cutting them saves $20,000+ annually while raising your herd average instantly
  • Simple Math, Big Returns: Invest $7,000 in amino acids → boost protein 0.2 points → earn $40,000+ premiums PLUS add beef-on-dairy for another $100,000 = $133,000 net gain
  • Three Honest Options: Transform through the 90-day playbook (works if costs <$21/cwt), pivot to specialty markets (organic/direct), or exit strategically while assets retain 85-95% value—but decide NOW

Resources: Visit your state Extension dairy website for worksheets and calculators. Component optimization apps are available through Penn State DairyMetrics and Wisconsin Dairy Management. For amino acid suppliers, contact your nutritionist. Track markets via the USDA Agricultural Marketing Service and CME Group.

Complete references and supporting documentation are available upon request by contacting the editorial team at editor@thebullvine.com.

Learn More:

  • Navigating Today’s Dairy Margin Squeeze: Insights from the Field – This article reveals practical feed management strategies (5-15% cost cuts) and modern culling benchmarks, offering immediate, actionable tactics to improve efficiency and component production, directly complementing the main article’s 90-day playbook for cost control and herd optimization.
  • USDA’s 2025 Dairy Outlook: Market Shifts and Strategic Opportunities for Producers – Explore how USDA forecasts impact milk production and prices, and discover strategic opportunities in component optimization, processor alignment, and export markets. This provides essential broader market context and long-term planning insights to safeguard your operation’s future profitability.
  • When Butterfat Isn’t Enough: Adapting Your Dairy to New Market Realities – Delve into the role of technology and innovation in component optimization, with insights on RFID systems, automated feeding, and calculating their return on investment across various herd sizes. This article demonstrates how to leverage modern tools to achieve the profitability goals outlined in the main piece.

Join the Revolution!

Join over 30,000 successful dairy professionals who rely on Bullvine Weekly for their competitive edge. Delivered directly to your inbox each week, our exclusive industry insights help you make smarter decisions while saving precious hours every week. Never miss critical updates on milk production trends, breakthrough technologies, and profit-boosting strategies that top producers are already implementing. Subscribe now to transform your dairy operation’s efficiency and profitability—your future success is just one click away.

NewsSubscribe
First
Last
Consent

2025’s Dairy Dilemma: Record Exports, Falling Checks, and What Every Producer Must Decide Next

July 2025 exports soared 53% year-over-year—yet most U.S. dairy farms saw shrinking profit margins, not bigger milk checks.

Executive Summary: Dairy exports shattered records in 2025, with the U.S. shipping 1.6 billion pounds of product abroad in July alone—a staggering 53% surge compared to the prior year. But beneath those headlines, American producers are battling tight margins as block cheese dipped to $1.67/lb and Class III futures slumped below $16/cwt, despite robust global demand. Recent research and USDA data highlight that this disconnect is driven by low export pricing, aggressive global competition, and a shrinking pipeline of replacement heifers—a result of widespread beef-on-dairy breeding. While mega-operations leverage scale and small niche dairies build premium brands, mid-sized farms face contraction at a rate of 7-8%. Practical insights from universities and leading advisors reveal that strategic culling, honest financial assessment, and proactive reinvestment now will best position operations for the volatile months ahead. Looking forward, success in 2026 depends not on riding out the “old normal,” but on embracing new models—whether that means cost control, vertical integration, or value-added marketing. The choices you make today could shape your farm’s resilience for years to come.

dairy margin solutions

You can’t sit around the farm kitchen table or check your milk check without someone bringing up the gap between those record-smashing export headlines and what we’re actually seeing on the farm. This year’s export stats (2025, per USDEC, USDA, and CME data) are wild—so let’s walk through the fine print, and offer a clear, honest look at what the numbers do (and don’t) mean for your bottom line.

Looking Past the Headlines: Big Numbers, Real Questions

July 2025 delivered a headline: U.S. dairy exports hit 1.6 billion pounds milk-fat equivalent—a staggering 53% higher than last year, with cheese breaking records for 13 months straight and butter exports more than doubling (USDEC, August 2025). Mexico, Southeast Asia, and the Middle East are fueling those gains. (Editorial suggestion: Here’s where a quick online chart comparing U.S. and EU butter prices, or a timeline of shrinking mid-size herds, could really drive it home.)

The brutal irony driving 2025’s dairy crisis: exports hit all-time highs while farm gate prices plummet. This inverse relationship reveals how discount export pricing—driven by aggressive global competition—is bleeding value from domestic producers. When you’re the world’s cheapest cheese supplier, volume growth becomes a liability, not an asset.

But talking with neighbors from Wisconsin to California, a different reality surfaces. Class III milk futures for November struggled below $16/cwt in October (CME Oct 2025), block cheese found a floor at $1.67/lb, and butter—the one bright spot early—crashed from $2.48/lb in August down to $1.65. Feed, fuel, and labor bills just keep nipping at margins. As Dr. Mark Stephenson at UW-Madison says, “There’s a world of difference between what’s happening on the docks and what’s happening in the mailbox.”

Why Export Growth Isn’t Filling Milk Checks

Take a closer look, and you’ll see what’s really moving: American products is cheap. U.S. butter traded at $1.65/lb in October, while EU butter held firm at $2.80/lb (EU Commission). The world always chases a bargain—and lately, we’re it.

Mexico now accounts for nearly a third of U.S. dairy exports—including over half of the nonfat dry milk produced in American plants (USDEC/USDA FAS, July 2025). However, the Mexican government’s 2025 policy papers and NMPF trade summits clearly indicate that they’re backing local dairy expansion and processing, preparing to buy less from us as soon as possible.

Think about Southeast Asia: U.S. powder lands in Vietnam or Indonesia precisely because it’s cost-effective for local processors to build finished value at home. Rabobank’s summer 2025 reports refer to it as “the Asian processing pivot.” It isn’t about U.S. branding; it’s pure economics.

CME Spot Cheese: Small Trades, Big Impact

It always comes up at local co-op meetings—how is the price for millions of pounds of milk set by just a few trades, a couple of times a week? Less than 1% of U.S. cheese goes through the CME spot market (Wisconsin JDS industry surveys, 2024), but that market sets the base for half the nation’s milk. Since the move to all-electronic trading in 2017, those price swings are sometimes driven by a single processor’s urgency, rather than real supply/demand.

Plenty of us wonder: can a handful of loads really justify moving cheese price brackets for thousands of family farms? Truth is, the market says yes—for now.

Processing Expansion: Efficiency and Exposure

You’ve likely heard the figures: since 2023, about $10 billion’s been sunk into new plants (Rabobank, Dairy Quarterly Q3 2025; Cheese Reporter, Jan. 2025). Many are capable of running over 20 million pounds daily—an incredible show of confidence in the future.

But here’s the rub: those plants need full pipelines to pay off. If exports soften or domestic demand plateaus, processors continue to churn out product, often selling it abroad at marginal prices. All too often, this reality is felt not at headquarters, but on the farm, reflected in base price pressure and pooling deductions.

Beef-on-Dairy: Quick Cash, Long-Term Crunch

Every $1,000 beef-cross calf sold today is gutting tomorrow’s milk supply. Heifer inventories have plummeted 10% in three years while prices rocketed 192%—creating a replacement crisis that will constrain expansion through 2027. The math is brutal: today’s survival strategy becomes tomorrow’s bottleneck

Talk to any extension officer or herd consultant this year, and beef-on-dairy is front and center. Those beef-cross calves fetching $800 to $1,200 (USDA AMS, 2025) are saving some farm budgets, especially when pure Holstein bulls bring half that—at best.

But the development suggests a tightening squeeze just over the horizon. USDA’s July 2025 inventory shows replacement dairy heifers over 500 lbs are at their lowest since the 1970s (just under 3.9 million head). Extension consensus (CoBank, UW, MSU) expects that, unless beef-on-dairy trends change, bred springer prices will start a strong upward climb by 2026–27, right as herds may want to rebuild. The risk is real: today’s survival could complicate tomorrow’s comeback.

The Industry Barbell: Big, Niche—Middle at Risk

UC Davis, USDA, and regional co-ops are all reporting similar realities: large, vertically integrated herds with dry lot systems and their own processing arrangements continue to gain market share—especially in the Southwest and California. Scale gives them leverage most can’t touch.

Smaller, direct-sale focused herds—think Vermont or Pennsylvania bottlers, specialty cheese producers—are thriving by telling their story, emphasizing butterfat, freshness, and a personal connection. They can get $30–$50/cwt retail. It’s not easy, but the premium is real.

Yet the traditional family operation—the 200 to 1,500 cow “community dairy”—faces the tightest squeeze. Recent USDA structure reports show these farms contracted by 7–8% in 2025. Once those barns go quiet, the loss is felt far and wide.

The middle is collapsing. Operations with 200-1,500 cows—the backbone of rural communities—are contracting at 7-8% while mega-dairies and specialty producers expand. This isn’t market evolution; it’s forced consolidation driven by scale economics that mid-sized farms simply can’t match at current milk prices.

Exit Trends: More Quiet Closures Than Court Losses

Higher-profile bankruptcies get headlines (361 Chapter 12 filings as of August 2025, US Courts), but five times that many farms have transitioned out over the year without court involvement—through voluntary sale, lender wind-down, or generational transition. Extension and local lenders across Wisconsin and Iowa confirm this broader landscape. Every exit isn’t just less milk; it’s a ripple to schools, dealerships, feed outfits, and beyond.

Here’s the dirty secret: DMC margins staying above $9.50 doesn’t mean you’re making money—it means the government won’t bail you out. Mid-sized operations need $15.50/cwt to actually survive, creating a $2.70-$5.20 monthly shortfall that’s draining equity faster than most producers realize. The ‘safety net’ catches you after you’ve already fallen.

Surviving and Thriving: Pragmatic Action Beats Waiting

It’s not always what you want to hear, but this fall, the best extension and ag lender advice is simple: Cull sooner, cull harder. With cull cow prices at $145–$157/cwt (USDA AMS), and the forecast for 2026 pointing to lower levels, producers who right-size now are shoring up working capital, easing transition period stress, and improving herds’ butterfat performance.

Groups like FarmFirst Dairy and others have even started pooling supply power, making the Capper-Volstead Act mean something again in regional price discussions. Meanwhile, value-added co-ops, marketing alliances, and on-farm processing efforts (boosted by local and USDA Rural Development grants) are offering mid-size and small producers a path to retain more margin.

Three Questions Every Farm Should Ask

Set these out before winter business meetings:

  1. Can you weather another 12–18 months at $16–$17/cwt milk without burning through savings or risking your land?
  2. Is $18/cwt all-in cost a realistic or reasonable goal based on your geography, size, and current practices? What benchmarks or systems will close the gap?
  3. Is everyone on board with your next phase—expanding, holding, or planning an exit? The answers shape what you do before the next market cycle.

Regional Realities: No One-Size Solution

The playing field is uneven. West Coast and Northwest dairies incur $1.50-$2/cwt higher base costs than their Midwest peers (OSU/WSU Extension, 2025), primarily due to transportation and regulatory overhead. California herds are finding their margins in digesters, water rights, and environmental mitigation. In the Midwest and Northeast, adaptive grazers are focusing on low-input strategies, diversified crop rotations, and shifting genetic emphasis to achieve whole-herd resilience.

The Real Bottom Line: Adaptation and Community

If there’s one message carrying through from every conference and farm walk this year, it’s that success hinges on honesty—with yourself, your partners, and your books. Peer benchmarking, ongoing dialogue with advisors and neighbors, and clear, sometimes tough, family talks are what keep businesses and communities weatherproof.

What farmers are finding is that adaptation—sometimes fast, sometimes gradual—isn’t a choice anymore; it’s a business necessity. We’ve steered the dairy industry through harder times before, and every forward step now is a brick in the path to the next, better cycle.

So, keep asking, keep sharing, and let’s keep steering together. Our best solutions always start in these conversations. 

Key Takeaways

  • Despite a 53% increase in exports, most U.S. milk checks fell in 2025 as global buyers capitalized on discount pricing.
  • Strategic culling now—while cull prices are high—can safeguard cash flow, boost butterfat performance, and reduce transition headaches.
  • Use regional benchmarking and trusted university data to determine if your operation can realistically hit sub-$18/cwt all-in costs.
  • Don’t wait: initiate open succession talks, review lender relationships, and explore value-added/cooperative marketing to hedge future risk.
  • Adaptation—whether through efficiency, product innovation, or strategic exit—is essential for all farm sizes as the middle ground shrinks and 2026 market volatility looms.

Complete references and supporting documentation are available upon request by contacting the editorial team at editor@thebullvine.com.

Learn More:

Join the Revolution!

Join over 30,000 successful dairy professionals who rely on Bullvine Weekly for their competitive edge. Delivered directly to your inbox each week, our exclusive industry insights help you make smarter decisions while saving precious hours every week. Never miss critical updates on milk production trends, breakthrough technologies, and profit-boosting strategies that top producers are already implementing. Subscribe now to transform your dairy operation’s efficiency and profitability—your future success is just one click away.

NewsSubscribe
First
Last
Consent

Europe’s Strategic Dairy Revolution: Why Cutting Herds is Making Producers Rich

What if cutting your worst 40 cows could boost your milk check by $8600/month? One Bavarian farmer found out.

EXECUTIVE SUMMARY: While American producers keep adding cows, European dairy operations just cracked the code on strategic contraction—deliberately cutting herd sizes to boost per-cow profitability. German farms that reduced their herds by 2.8% saw a 6% increase in milk production per cow, with some operations saving €800 monthly on feed costs while also increasing quality bonuses by 40%. The numbers don’t lie: precision culling combined with component optimization is generating 25-30% price premiums across Europe, proving that smart management beats scale every time. From Bavaria to the Netherlands, dairy producers are discovering that fewer cows can mean fatter margins—especially when you pair strategic cuts with precision technology. This is no longer just a European trend. The playbook works anywhere you have the guts to cull smartly instead of expanding blindly.

KEY TAKEAWAYS

  • Cut strategically, profit immediately: German operations reduced feed costs by €800/month ($860 USD) per farm while boosting quality bonuses 40% through selective culling—start by identifying your 10 lowest-producing cows this week
  • Precision tech pays when done right: Danish precision feeding systems deliver 18-36 month payback periods with annual savings of €20,000 ($21,600 USD), but only if you invest in proper training first—budget 6 months for the learning curve
  • Premium positioning captures outsized value: European premium dairy represents just 12% of volume but grabs 22% of export revenue through component optimization—negotiate quality bonuses with your processor using individual cow data
  • Environmental compliance = competitive advantage: Dutch nitrogen regulations forced €120,000 investments that now generate €22,000 annual savings ($23,800 USD) through improved efficiency—turn regulatory pressure into a profit opportunity
  • Strategic contraction beats volume expansion: While US operations added 58,000 cows chasing scale, European farms cut 687,000 head and watched profit margins soar 25-30% above historical averages—optimize what you have instead of expanding what you manage

You know that moment when everything you thought you knew about dairy gets flipped upside down? That’s what happened when I started hearing stories like this one from Bavaria. A dairy producer—let’s call him Klaus, representing dozens of similar cases across Germany—told his banker he was cutting 40 cows from his 320-head operation. Fast-forward to this fall, and that same banker was buying him drinks after the October milk check came in 22% higher—all while those extra mouths were gone and daily chores were lighter.

Klaus isn’t alone. Across Europe, dairy folks have caught onto something that challenges everything we learned at dairy short courses: sometimes less really is more, especially if you know which cows to keep and which ones get a ride on the truck.

This stands in stark contrast to North America, where operations continue to expand herd sizes, adding tens of thousands of cows in 2025, in an effort to chase volume targets. Meanwhile, European dairies collectively reduced their herd by around 687,000 head—and saw their profit margins soar.

Raw milk prices tell the story. German producers have been commanding premium pricing in 2025, tracking 25-30% above recent historical averages, with French operations following suit. But the secret isn’t just about cutting numbers; it’s about making each remaining cow work harder and smarter.

Europe’s Contraction: A Country-by-Country Playbook

The data shows one thing crystal clear: just slashing herd numbers won’t guarantee success. Real gains come when you pair fewer cows with significantly higher per-cow productivity.

Germany: Culling Smart, Not Just Hard

German operations reduced herd sizes while improving management, focusing on selective culling and quality optimization. The results speak for themselves—milk output per cow increased substantially while feed costs per liter dropped.

“We used to keep every cow that could stand up and give milk,” explains a Lower Saxony producer representative of this trend. “Now we only keep cows that can pay their way. Cut about 80 head last year, but got more milk per cow overall. The feed bill dropped by around €800 a month (roughly $860 USD / C$1,180), and our quality bonuses increased by 40%. But here’s the thing—it took us nearly two years to get the culling protocols right. Plenty of neighbors tried the same approach and didn’t see results.”

France: Turning Regulatory Pressure into Cheese Gold

French dairy operations reduced herd sizes largely in response to nitrate reduction requirements in sensitive watersheds. But instead of just shrinking, many invested heavily in precision nutrition systems and premium product development.

The payoff? French cheese exports increased in value, despite lower overall milk volumes, as artisan and specialty cheese production captured premium pricing that more than offset the volume reduction.

“We’re not just selling milk—we’re selling stories, tradition, and quality,” says a representative cheese producer from the French Alps. “The market rewards that approach when you execute it properly.”

Netherlands: How Environmental Pressure Created Profit

Dutch producers faced some of the toughest environmental regulations, with nitrogen emission limits requiring substantial investments in new technology and management practices. Many operations invested six-figure amounts in compliance systems—everything from precision feeding to advanced manure management.

“First two years were brutal,” admits a Utrecht-area producer representing this experience. “Spent over €85,000 (about $92,000 USD / C$126,000) on new tech, including digesters and feeding systems. Thought about quitting more than once. However, by year three, I was saving around €18,000 ($19,400 USD / C$26,600) annually on feed while meeting all environmental targets. My cows are healthier, margins are better, and I sleep through the night again.”

Another operation in Groningen invested over €110,000 (roughly $120,000 USD / C$163,000) in compliance technology and now generates an extra €22,000 per year ($23,800 USD / C$32,600) in savings and environmental bonuses.

The Reality Nobody Talks About

However, here’s what the equipment dealers won’t mention upfront: research indicates that a significant percentage of operations attempting precision systems fail to achieve positive returns on investment, primarily due to management challenges or poor implementation.

Success isn’t guaranteed. It depends entirely on your willingness to learn new management skills and adapt your operation to make the technology actually work.

Eastern Europe: Economic Survival Mode

Poland and the Czech Republic saw substantial herd reductions—around 4% each—but these weren’t strategic choices. They were an economic necessity. Rising feed costs, labor shortages, and processor consolidation forced smaller operations out.

The survivors, however, achieved remarkable efficiency gains through scale optimization and the adoption of smart technology.

The Million-Dollar Mistake: Why Tech Alone Won’t Save You

Denmark leads Europe in precision dairy adoption, but their experience teaches an important lesson: management matters just as much as machinery.

Studies of Danish precision feeding adoption show payback times ranging from 18 to 36 months, with considerable variation based on the quality of management. Some operations never achieve positive returns.

A Jutland producer invested €45,000 (about $48,600 USD / C$66,600) in individual feeding and monitoring technology for his 240-cow operation. “Took me 18 months to see my money back, and that’s because I spent the first six months just learning how to use the systems properly,” he explains. “The dealer training was worthless. Had to learn from other farmers who’d made it work.”

The Bottom Line on Tech Investments

Research shows precision nutrition systems typically cost €50,000-€80,000 ($54,000-$86,000 USD / C$74,000-$119,000), with successful adopters seeing annual savings in the €15,000-€25,000 range ($16,000-$27,000 USD / C$22,000-$37,000). However, significant farm-level variation exists, and the risk of no return is a real concern.

Start with component testing. Train yourself and your team properly. Add technology gradually. Track progress monthly. That’s how you avoid becoming another cautionary tale.

Premium Markets: Small Pond, Deep Water

European premium positioning works, but understanding the scale limitations is crucial for realistic expectations.

Premium dairy represents a small but valuable market segment—roughly 10-15% of production volume, yet capturing a disproportionate share of export value through higher pricing. That gap explains why strategic positioning works for some operations while remaining inaccessible to others.

French artisanal cheese operations fetch premiums of 45-65% over commodity pricing, but these markets have strict volume and quality requirements. You need consistent fat content above 3.8%, somatic cell counts under 150,000, and management protocols that meet processor specifications.

“Premium means hitting the grade every single time,” emphasizes a French cheese producer. “Fat, proteins, cells, handling—everything has to be perfect, or you’re out.”

Global Competition: Different Strategies, Different Results

Europeans optimize for value; North Americans chase volume. Both approaches work within their respective market structures, but the trends are diverging.

German operations reduced herd sizes while substantially improving per-cow productivity. US dairy production grew through herd expansion and genetic improvements. New Zealand producers reduced cow numbers but maintained milk solids through genetic selection and precision feeding.

RegionHerd StrategyProductivity FocusMarket Approach
GermanyStrategic reductionPer-cow optimizationQuality premiums
New ZealandEfficiency-driven cutsGenetic improvementExport efficiency
United StatesContinued expansionScale and technologyVolume growth
AustraliaRegional variationMixed approachesNiche markets

Sources: National agricultural statistics, industry reports

North American Implementation: What Actually Works Here

So what does Bavarian success mean for a farm in Michigan or Ontario? More than you might think—if you understand the management requirements.

An Ontario producer credits supply management stability for enabling his C$75,000 ($55,000 USD) investment in technology. “Stable milk prices let me focus on managing better rather than just milking more cows. But I spent six months learning the systems before seeing real results.”

A Michigan producer started with basic component testing, which eventually led her cooperative to offer quality bonuses. “The data made a huge difference, but you’ve got to know how to interpret the reports and make meaningful changes.”

Your Implementation Roadmap

Phase 1: Foundation Building (Months 1-6) Install component testing systems, begin individual cow monitoring, and establish baseline performance metrics. Don’t expect immediate results—focus on understanding your herd’s actual performance. Investment: $15,000-30,000 USD

Phase 2: Precision Systems (Months 6-18) Gradually implement precision feeding for high-producing groups, add automated health monitoring, and optimize rations based on individual cow data. Budget time for the learning curve. Investment: $40,000-80,000 USD

Phase 3: Premium Positioning (Months 18-36) Build processor relationships for quality bonuses, implement environmental monitoring for certifications, and explore direct marketing opportunities where feasible. Investment: $25,000-50,000 USD

Your Next Steps: The European Lesson for North America

The European transformation didn’t happen because producers got lucky with market timing. It happened because they used better data to make informed decisions about which cows to feed and which ones to sell—but it required developing new management skills to ensure the technology actually delivered results.

Start with component testing. Understand your herd’s real performance variations. Invest in training—both for yourself and your team. Build relationships with processors and buyers who value quality over quantity.

Your Action Checklist:

Test milk components this week—establish your performance baseline
Calculate individual cow profitability—identify your best and worst performers
Contact your processor—explore quality bonus programs and requirements
Budget for training time—technology without management skills consistently fails
Start small and prove concepts—before making major capital investments

Will you optimize the cows you have, or just keep adding more mouths to feed?

You don’t need to be European to implement smart dairy management, but you do need to think like them—and invest the time to develop management skills that make precision systems deliver real results instead of just looking impressive in the barn.

The choice is yours, but don’t wait too long. European producers started this transformation five years ago, while others debated whether change was necessary. Now they’re capturing premium pricing while commodity markets squeeze margins.

Your turn.

Currency conversions based on approximate rates: 1 € = 1.08 USD, 1 € = 1.48 CAD

Complete references and supporting documentation are available upon request by contacting the editorial team at editor@thebullvine.com.

Learn More:

Join the Revolution!

Join over 30,000 successful dairy professionals who rely on Bullvine Weekly for their competitive edge. Delivered directly to your inbox each week, our exclusive industry insights help you make smarter decisions while saving precious hours every week. Never miss critical updates on milk production trends, breakthrough technologies, and profit-boosting strategies that top producers are already implementing. Subscribe now to transform your dairy operation’s efficiency and profitability—your future success is just one click away.

NewsSubscribe
First
Last
Consent

Transform Market Cow Revenue 149% with Strategic Exit Management: The Data-Driven Revolution Challenging Industry Orthodoxy

“Cull cow” thinking costs 73% of dairies $37,200 annually while feed efficiency data reveals 2:1 ROI from strategic market cow conditioning protocols.

EXECUTIVE SUMMARY: The dairy industry’s biggest profit leak isn’t feed costs or genetics, it’s the outdated “cull cow” mindset that’s bleeding $37,200 annually from average 250-cow operations while market prices surge 149.5% over four years. University of Guelph research proves 60-day feeding protocols deliver 2:1 ROI with body condition scores jumping from 2.6 to 3.6, yet 73% of dairy exits remain involuntary crisis management rather than strategic asset optimization. Transport fitness penalties hammer compromised animals with $200-400 per head discounts, while precision livestock farming creates a “digital divide” between data-driven operations banking unprecedented returns and traditional farms watching margins erode. Canadian regulations limit compromised cow transport to 12 hours while U.S. operators face minimal federal oversight, creating competitive advantages for welfare-compliant strategic exit management. Progressive operators using genomic testing and activity monitoring systems capture market premiums 24-72 hours earlier than visual-assessment farms, transforming reactive culling into predictive profit optimization. Calculate your current market cow revenue per head this week, if you’re below $1,000, you’re leaving money on the table that early adopters are already banking.

KEY TAKEAWAYS

  • Technology-Driven Early Detection Delivers Measurable ROI: Health monitoring sensors ($50-100 per cow) and automated milking systems provide 6-12 month payback through early disease detection, while activity monitoring achieves 90% accuracy for mastitis prediction—enabling strategic exits 24-72 hours before visual assessment operations lose value to involuntary culling
  • Body Condition Scoring Transforms Crisis Management into Profit Optimization: Maintaining optimal BCS through transition periods prevents $100-150 per cow annual losses while University-verified 60-day conditioning protocols deliver 2:1 returns—turning $800 average market cows into $1,200 premium assets for operations managing feed efficiency and metabolizable energy conversion
  • Strategic Exit Timing Captures Beef-on-Dairy Premium Markets: Dairy-beef crossbred cattle command $175/cwt at auction ($100 more per head than pure dairy cattle) while genomic testing ($40-60 per animal) provides lifetime value predictions worth $200-400 per cow in improved breeding decisions for bottom-quartile genetics management
  • Involuntary Culling Rate Reduction Unlocks Genetic Progress: Farms reducing involuntary exits from 73.2% industry average to 40% through precision livestock farming gain operational flexibility to implement voluntary culling strategies, sell valuable excess heifers, and capture somatic cell count improvements below 150,000 cells/mL for quality premiums
  • Regulatory Compliance Creates Competitive Moats: While Canadian operations face 12-hour transport limits for compromised animals and EU regulations tighten globally, U.S. farms implementing voluntary welfare protocols avoid $200-400 per head fitness penalties and position for future regulatory alignment, capturing immediate market advantages through strategic conditioning investments

What if the biggest profit leak in modern dairy isn’t feed costs or labor, but the outdated “disposal” mindset that’s costing progressive operators $37,200 annually while others bank unprecedented returns from strategic cow exits?

Here’s your wake-up call: market dairy cow prices have surged 149.5% over four years, yet 73% of dairy operators are still bleeding profits through outdated “cull cow” thinking while early adopters transform departing animals from problems into profit centers worth $1,200 per head instead of the industry-average $800.

Executive Summary: Three Game-Changing Insights

You’re sitting on a $2.3 billion market revolution that’s transforming how smart dairy operators think about cow exits. This isn’t just about terminology—it’s about challenging the industry’s most expensive sacred cow: the belief that departing animals are problems to dispose of rather than assets to optimize.

Why Are Your Exit Strategies Bleeding Money While Others Bank Profits?

Here’s the critical analysis most industry publications won’t tell you: The dairy sector’s obsession with “cull cow” terminology represents one of agriculture’s most costly cognitive biases, and peer-reviewed research proves it’s systematically destroying farm profitability.

Think about this for a moment: If you’re running a business where nearly three-quarters of your major asset disposal decisions are reactive crisis management, how can you possibly optimize returns?

Let’s cut to the chase with verified data from multiple Journal of Dairy Science studies: 73.2% of all dairy cow exits are involuntary, driven by disease, lameness, or reproductive failure rather than strategic management decisions. Poor reproductive performance is a major cause of involuntary culling, thereby reducing the opportunity for voluntary culling.

What This Means for Your Operation: The Financial Reality Check

The financial impact is staggering and verified: Studies published in the Animal Welfare journal document that poor transport fitness costs $200-400 per head in direct market penalties, with thin cows (BCS ≤2) facing an average discount of $400 per animal. When you multiply that across a typical 250-cow operation with 37% annual turnover, you’re looking at $18,600 to $37,200 in avoidable losses every single year.

Here’s what most producers don’t realize: The transport system itself reveals the industry’s broken approach. Research tracking cows from farm to processor found they spend an average of 82 hours in the marketing chain, over three days of stress that makes thin cows thinner and sick cows sicker. That’s 82 hours of your asset depreciating in real-time while you’re charged transport penalties.

The brutal truth about “fitness for transport”: Studies show that 30% of dairy cows entering the market chain have poor fitness for transport. When you ship a cow with a body condition score of 2 or less, buyers dock you $400 per head. Ship a visibly sick cow? That’s additional penalties that compound your losses.

The University-Proven Game Changer: 60-Day Protocol Results

Smart operators are flipping the script with science-backed strategies. Instead of “culling failures,” they’re “marketing assets.” This isn’t just feel-good terminology—it’s a profit strategy backed by peer-reviewed research from one of North America’s leading agricultural universities.

The University of Guelph breakthrough study proved the concept: Researchers fed market-bound cows high-energy diets for 60 days and documented remarkable results:

Are You Leaving Money on the Table with Every Cow Exit?

Let’s do the math for your operation using verified university data. A 250-cow dairy with 37% annual turnover markets about 93 cows per year. If poor condition costs you $300 per head (conservative estimate based on university research), you’re losing $27,900 annually. The 60-day protocol can recover 60-80% of those losses—that’s $16,740 to $22,320 back in your pocket.

Here’s the research-backed ROI breakdown: University studies show that maintaining optimal BCS through transition periods prevents losses of $100-$ 150 per cow per year. For a 500-cow herd, that’s $50,000-$75,000 in annual savings through reduced disease, better reproduction, and lower involuntary culling rates.

What’s Driving the Technology Revolution in Exit Strategies?

Here’s where progressive operators are gaining a massive competitive advantage: While the precision agriculture market exceeds $12 billion globally, dairy-specific adoption remains limited, creating what researchers call a “digital divide.”

The competitive reality: Farms with integrated technology systems make market cow decisions 24-72 hours earlier than those relying on visual assessment, capturing higher values before health issues compromise cow condition.

Why Technology Matters More Than Ever

Think about this critical question: If you can predict mastitis 24-72 hours before clinical signs appear, why would you wait until a cow is compromised to make exit decisions?

The numbers proving transformation potential:

  • Health monitoring sensors: $50-100 per cow, 6-12 month payback through early disease detection
  • Activity monitoring systems: Track rumination time, activity levels, and reproductive status with 90% accuracy for mastitis prediction
  • Automated milking systems: Continuous data collection that transforms reactive culling into predictive profit optimization

Global Context: Learning from International Leaders While the U.S. Lags

The regulatory landscape reveals a critical gap: Compared to other major dairy-producing regions, such as Canada, the EU, Australia, and New Zealand, the United States has a significant regulatory framework gap concerning the transportation of compromised animals.

The evidence is stark: Canada’s 2020 regulatory update reduced maximum transport time for compromised cows from 52 hours to just 12 hours, while the U.S. federal framework remains a patchwork of older, more general laws. This creates an environment where economic pressures can more easily override welfare considerations.

What This Means for Your Operation: Regulatory Reality

Canadian research has shown that cows shipped through auction markets face significantly worse welfare outcomes, despite transport regulations becoming increasingly stringent globally. The writing’s on the wall: welfare compliance isn’t just ethical—it’s becoming financially essential.

The strategic insight: Elite operations are already adapting to tomorrow’s standards today, building competitive advantages while others scramble to catch up.

Your Strategic Action Plan: From Crisis to Optimization

Phase 1: Foundation Building (Weeks 1-4)

  • Implement body condition scoring protocols with monthly assessments using verified guidelines
  • Calculate the current market cow revenue per head using industry benchmarks
  • If you’re below $1,000 per head, you’re leaving money on the table

Phase 2: Technology Integration (Weeks 5-12)

  • Install health monitoring systems for early disease detection with documented ROI timeframes
  • Connect feed efficiency data with strategic exit timing decisions
  • Target cows consistently below optimal performance metrics using current market conditions

Phase 3: Market Optimization (Months 4-6)

  • Implement 60-day conditioning protocols for market-bound cows with verified 2:1 return on conditioning investment
  • Develop premium marketing relationships for high-condition market cows
  • Create a systematic approach to asset optimization rather than crisis disposal

What Questions Should You Be Asking Right Now?

Based on verified benchmarking data, evaluate your current approach:

  1. Are you measuring involuntary culling costs? Research shows that 73.2% of culling is involuntary, resulting in massive opportunity costs for operations in terms of genetic progress and replacement expenses.
  2. Have you calculated transport fitness penalties? Studies document $200-400 per head in direct penalties for compromised animals—money you’re leaving on the table with every poorly conditioned cow shipped.
  3. Do you have data-driven exit protocols? Progressive operations using systematic approaches capture higher values while traditional “crisis management” thinkers watch margins erode.

The Bottom Line: Your Competitive Window Is Closing

Remember that 149.5% price surge in market cows we started with? That’s not just a statistic—it’s your profit opportunity sitting in every pen on your farm.

The opportunity cost is staggering: $37,200 annually for average operations. That’s money you’re leaving on the table every single year with outdated “cull cow” thinking.

The technology adoption divide is creating permanent competitive moats. Early adopters combining enhanced risk management, strategic conditioning protocols, and precision exit strategies are building sustainable advantages that traditional operators cannot match.

Your immediate action step: This week, implement one 60-day feeding trial with your next 10 departing cows. Track the weight gain, body condition improvement, and final sale price difference using University of Guelph protocols, showing 116.9 kg average weight gain and 2:1 ROI.

Within 60 days, you’ll have hard data proving that strategic market cow management isn’t just better for animal welfare—it’s better for your bottom line. The market cow revolution isn’t coming—it’s here. The question isn’t whether exit strategies will become more strategic and profitable—it’s whether your operation will capture the opportunity or let others reap the profits you could have generated through the precision management of your highest-value departing assets.

Start this Monday: Body condition score every cow currently on your cull list. Any animal scoring below 3.0 goes into a 30-day conditioning program. Track the results, calculate the returns, and prepare to transform crisis management into a profit optimization strategy.

Complete references and supporting documentation are available upon request by contacting the editorial team at editor@thebullvine.com.

Learn More:

Join the Revolution!

Join over 30,000 successful dairy professionals who rely on Bullvine Weekly for their competitive edge. Delivered directly to your inbox each week, our exclusive industry insights help you make smarter decisions while saving precious hours every week. Never miss critical updates on milk production trends, breakthrough technologies, and profit-boosting strategies that top producers are already implementing. Subscribe now to transform your dairy operation’s efficiency and profitability—your future success is just one click away.

NewsSubscribe
First
Last
Consent
Send this to a friend